is agricultural productivity growth slowing in western europe?
TRANSCRIPT

1
This paper is a book chapter drawn from the following book
Volume Title: Productivity Growth in Agriculture: An International Perspective
Volume Editors: Keith O. Fuglie, Sun Ling Wang, and V. Eldon Ball
Volume Publisher: CAB International
Volume ISBN: 9781845937973
Volume URL: http://bookshop.cabi.org/?site=191&page=2633&pid=2499
Publication Date: September 2012 Chapter Title: Is Agricultural Productivity Growth Slowing in Western Europe?
Chapter Author: Sun Ling Wang, David Schimmelpfennig, and Keith O. Fuglie
Chapter pages in book: pp.109-125

2
Chapter 5
Is Agricultural Productivity Growth Slowing in Western Europe?
Sun Ling Wang, David Schimmelpfennig, Keith O. Fuglie
Economic Research Service, U.S. Department of Agriculture
5.1 Introduction
Agricultural production in Western Europe1 has been nearly stagnant for the last 25 years.
According to the FAO, agricultural output in Western Europe in 2009 was only about 4% higher
than it was in 1984. World Bank data report agricultural GDP of the region grew by 26% (in
constant US$) over the same period, but this was almost certainly a terms of trade or exchange
rate effect, rather than a change in real production. The stagnation in real output could be due to
rising costs of production (falling productivity) and/or fewer resources being employed in
production. The slow growth of agriculture in Western Europe has meant that its share of global
agricultural output has been falling steadily, from about 20% in the 1960s to less than 10% by
the late 2000s, enough to significantly affect global agricultural markets and trade flows.
In a recent, wide-ranging global assessment of agricultural production and productivity trends,
Alston, Babcock and Pardey (2010) concluded ‘that agricultural productivity growth has slowed,
especially in the world’s richest countries,’ and they point to stagnation in agricultural R&D
spending as the most likely cause. Given that agricultural resources in these countries are also
not growing (and in some cases shrinking), a declining rate of productivity growth implies
slower growth in output. Their conclusion drew on data from the United States, the prairie
provinces of Canada, Australia and the United Kingdom. But apart from the UK, they were not
able to look in detail at Western Europe. This chapter employs the dataset Eldon Ball and his
colleagues developed to measure agricultural total factor productivity (TFP) in 11 EU countries
between 1973 and 2002 (Ball et al, 2010). We apply statistical tests to the individual country
TFP series to see whether any of them experienced a significant slowing of TFP growth over this
period. In addition, we construct aggregate TFP indexes for the 11 countries as a whole, as well
as for the Mediterranean and northern continental sub-regions and examine productivity trends in
these regions. We also look at partial productivity indicators (land and labour productivity,
labour-capital and land-labour ratios) and examine trends in agricultural R&D spending. We
would expect to see stagnant R&D spending to precede stagnant TFP growth by one to two
decades, if this were indeed the case.
1 ‘Western Europe’ refers to the countries that have had market-oriented economies since WWII, thus excluding the
‘transition’ countries that were centrally planned before 1991. These countries make up what is known as the EU15,
plus Norway and Switzerland which are not part of the EU. Our empirical analysis concentrates on 11 countries:
Belgium, Denmark, France, Germany, Greece, Ireland, Italy, the Netherlands, Spain, Sweden and the UK, all
members of the EU or its predecessor, the European Economic Community. According to the FAO, these 11
countries account for about 93% of the agricultural output in Western Europe and 95% of the agricultural output in
the EU15.

3
While the evidence cited by Alston et al (2010) does point to an agricultural productivity
slowdown in some developed countries, previous research on this issue is not unanimous. In
their previous analysis with the EU dataset, Ball et al (2001, 2010) found evidence of
productivity convergence: countries with initial low levels of productivity grew more rapidly,
tending to catch up to productivity leaders over time. Schimmelpfennig and Thirtle (1999, 2000)
partially explained EU country differences in productivity growth in terms of technology
spillovers from public research systems. Thirtle et al (2004) documented a significant decline in
UK agricultural TFP growth since the 1980s and attributed this to a precipitous drop in public
support for productivity-oriented agricultural research. Using a different estimate of agricultural
TFP growth for the United States, Wang (2010) does not find evidence of a slowdown, in
contrast to Alston et al (2010). In this volume, Zhao, Sheng and Gray’s TFP estimates for
Australia do show stagnation since 2000, but Cahill, Phillips and Rich find no significant
divergence from long-run TFP growth trends for Canada through 2006. Fuglie (2008, 2010)
does not find support for a global slowdown in productivity. Given the stagnation of output
growth in Western European agriculture and the mixed evidence on productivity trends for the
region, a reexamination of the data for this region seems worthwhile. Before presenting formal
statistical tests for TFP trends, we describe some salient features of agriculture in the European
Union, where about 98% of the agricultural production in Western Europe occurs.
5.2 Key Features of EU Agriculture
When six countries in Western Europe first established a common market for goods and services
in 1957, they created a Common Agricultural Policy (CAP) to harmonize agricultural policies
among member states. The principal features of CAP included price stabilization and support for
important agricultural commodities, free internal trade, tariff protection against external
competition, and income support for farmers. CAP was initially successful in raising agricultural
production, and eventually supply controls like production quotas, land retirement schemes, and
export subsidies were introduced to reduce production the surpluses that accumulated for some
commodities. As the common market evolved into the European Union and more countries
joined, CAP was extended to new members. Several of the new members had relatively large
agricultural sectors, especially in terms of the number of farms, and their inclusion in CAP put
considerable budgetary pressure on EU resources. The high cost of CAP has provided a stimulus
to reform, and its policies have gradually shifted from commodity price supports to direct
payments to farmers and requiring recipients to comply with environmental, animal welfare, and
food quality standards. Most of these reform measures were introduced after 1992 (ERSa).
The structure of agriculture is highly diverse across EU member states. Compared to the United
States, the EU has only about one-third as much agricultural land but about three times as many
farms (Normile and Letmaa, 2005).2 More than 50% of EU farms, however, were less than 5
hectares as of 1997. The EU has a higher proportion of its agricultural land in crops (about 60%)
than the US (44%), with the remainder in permanent pastures. The preponderance of many small
farms in the EU has meant that more labour has remained active in agriculture. While the US
had about 3.3 million people working in agriculture in the 1990s, Western Europe had over 11
million. As a share of total employment, EU agricultural labour was about 5% in the mid-1990s,
2 The comparative statistics in this paragraph refer to the US and the EU15 in the mid-1990s unless otherwise noted.

4
but this ranged from less than 3% in Belgium and the UK to over 30% in Greece when it joined
the EU in 1981.
The integration of highly industrialized and significantly rural countries in Western Europe into
the EU added to the strains on CAP but also accelerated the processes of structural change.
When the Maastricht Treaty came into force in 1993, establishing the EU, it created a common
labour market among member states. Workers in any member state could move and seek
employment in other member states. This facilitated the exit of labour from agriculture in
regions where labour productivity in agriculture was low. Between 1973 and 2002, the number
of workers economically active in agriculture in Western European countries declined from 18.3
million to 7.4 million (FAO). Another consequence of the Maastricht Treaty was the movement
toward monetary union. In 1994, the European Exchange Rate Mechanism was introduced to
fixed exchange rates among participating countries and, in 1999, the Euro replaced several
national currencies. The UK and Sweden are exceptions, remaining outside the fixed exchange
rate regime and keeping their own currencies. (Denmark has also kept its own currency but is
part of the European Exchange Rate Mechanism.)
Besides differences in farm size and structure, agricultural production in the EU is similarly
diverse. Northern continental Europe (Germany, France, Denmark, the Netherlands and
Belgium) has a relatively high share of agricultural land in annual crops (64%), including 34% of
land in cereal grains. The Mediterranean region (Greece, Italy, Spain and Portugal) has 16% of
land in permanent crops (vineyards, fruit and olive orchards, etc.) and a lower proportion in
annuals (47%) and cereals (21%). The Mediterranean region also has a much higher share of its
cropland under irrigation (27%) compared to other Western Europe countries (less than 10%).
About a third of agricultural land in both the Mediterranean and northern continental states is in
permanent pasture, while more than 55% of the land in the Britain and Scandinavia is in pasture
(FAO).
Over time, the EU has moved toward more coordinated regulatory policies, which have
implications for the adoption of agricultural practices and technologies. The EU recognizes
intellectual property protection over biological life forms, including genetically modified (GM)
crops, but has been more restrictive than the US or Canada in allowing GM crops to be grown
commercially or imported from abroad. The EU also restricts the use of animal antibiotics and
hormones in feed additives. Finally, the EU has introduced an EU-wide organic food label
(enforced by national bodies) to facility regional trade in organic foods. A large and growing
share of the EU’s food production is certified as organic. In 2003, more than 5 million hectares
of agricultural land (about 4% of the total) was certified as organic area (Eurostat, 2006)
compared with less than 1 million hectares in the United States (ERSb).
In agricultural innovation, EU countries maintain separate agricultural research systems. The
organization of these systems and the roles played by the public and private sectors in generating
and disseminating new technologies for agriculture vary widely. Germany maintains a federal
system, with both the federal and state governments funding and operating separate (and joint)
research institutes (von Braun and Qaim, 2000). The Netherlands merged its government and
university agricultural research institutions into one centralized unit, the Wageningen University
and Research Center, with substantial financial support from government, producer groups and

5
other private sources (Roseboom and Rutten, 1999). In the 1980s, the UK redefined
government’s role in supporting agricultural research and reduced funding for public agricultural
research while privatizing some public research centres (Thirtle, Piesse and Smith, 1999; Piesse
and Thirtle, 2010). As in other OECD countries, many public agricultural research systems in
the EU have been undergoing reform. Alston, Pardey and Smith (1999) identified a number of
general features of these changes, namely (1) reduced rate of growth in government funding of
agricultural research with more emphasis on basic science, (2) broadening of the public
agricultural research agenda beyond productivity concerns to include environmental, food
quality and social issues, (3) expanded use of producer levies to fund commodity research, and
(4) greater use of competitive mechanisms instead of institutional block grants in allocating
government funds to research.
According to the OECD, these Western European members of the EU collectively spent about
$4.1 billion per year in agricultural research during 2006-2008, with the public sector accounting
for about 80% of the total (Table 5.1). Agricultural R&D spending was concentrated in large
countries, with Germany and France accounting for over $1 billion each. As a share of
agricultural GDP, research spending in Western Europe averaged 2.0%, but ranged widely - from
over 3% in Germany and Ireland to under 1% in Italy, Greece and Sweden. Over the past twenty
years, from 1986-1990 to 2006-2008, real agricultural R&D expenditures rose in some countries
and fell in others, but for EU countries as a whole R&D spending increased by about one-third,
and R&D as a share of sector GDP doubled. As Alston, Pardey and Smith (1999) noted,
however, a growing share of agricultural research expenditures in the public sector were being
allocated across a wider agenda. We are unable to say from available information what the
trends have been for spending on productivity-oriented agricultural research.
Table 5.1 - Agricultural R&D Spending in Western European Countries
Country 1986-1990 2006-2008 Changes between
Total R&D Public
share of
total
R&D (%)
R&D/GD
P Total R&D Public
share of
total
R&D (%)
R&D/GD
P 1986/90 and 2006/08
(mil. 2005
PPP$/year) (%)
(mil. 2005
PPP$/year) (%)
Total
R&D
R&D/
GDP
Austria 47 91 0.67 73 98 1.45 up up
Denmark 94 91 1.75 65 99 2.97 down up
Finland 91 96 1.30 138 100 2.85 up up
France 725 74 1.31 1,111 67 2.71 up up
Germany 760 95 2.31 938 89 3.81 up up
Greece 71 97 0.40 70 98 0.69 down up
Ireland 61 94 1.12 75 98 3.22 up up
Italy 281 99 0.56 251 99 0.72 down up
Netherlands 271 67 1.73 253 74 2.04 down up
Portugal 67 100 0.41 84 98 1.45 up up
Spain 228 87 0.55 752 83 2.13 up up
Sweden 51 23 0.61 23 34 0.45 down down
UK 276 52 1.16 269 54 1.83 down up
All 3,023 82 1.04 4,103 80 2.04 up up
Source: Public and private agricultural R&D spending is from OECD and authors’ calculation. Agricultural GDP in
constant 2005 PPP$ is from the World Bank.

6
5.3 Data and Methods
5.3.1 Data
To assess agricultural productivity trends in Western Europe, we draw on a data set developed by
Ball et al (2010) for comparing TFP among 11 EU countries and the US from 1973 to 2002.
Provided are estimates of the growth and relative levels of output, inputs and TFP. Agricultural
output is defined as gross production leaving the farm; inputs include labour, capital, land and
intermediate inputs.
We focus on the 11 European countries in the data set and examine productivity trends in
individual countries, as well as for three regions defined as Mediterranean countries (Spain, Italy
and Greece), northern continental countries (Germany, France, Denmark, the Netherlands and
Spain), and others (the UK, Ireland and Sweden). The regional demarcation is based on
geographic proximity, as well as on similarities in the structure of agriculture within the regions.
Mediterranean countries have a larger share of their population employed in agriculture, devote a
significant share of land to permanent crops, and have considerable areas under irrigation.
Northern continental countries have a greater proportion of agricultural land in annual crops and
a lower share of labour and GDP in the agricultural sector. Agriculture in countries in the ‘other’
group also makes a relatively small contribution to employment and GDP, but in addition these
countries devote most of their agricultural land to pasture rather than to crop production.
To construct their multilateral TFP indexes, Ball et al (2010) followed the methods developed by
Caves, Christensen and Diewert (1982). This approach yields transitive, multilateral comparisons
among countries and over time. They first constructed relative output and input prices expressed
in US dollars. Assuming competitive conditions, production technology is represented by price
or unit cost function that is dual to a linearly homogeneous production function. Productivity
growth between two points of time for a given country is calculated as the negative of the rate of
growth of the output price less the rate of growth in input prices. More details concerning
construction of the data can be found in Ball et al (2010).
5.3.2 Productivity Measurement
In addition to Ball et al’s (2010) TFP index, we also construct indexes of land and labour
productivity to characterize the evolution of productivity growth among Western European
countries and regions. Examining both total and partial productivity growth provides different
insights into the nature and direction of productivity and structural change. This study defines
labour productivity as the ratio of the implicit quantity of aggregate output divided by the
implicit quantity of labour input. The output and labour quantities data are from Ball et al
(2010). For land productivity, we divide the implicit quantity of aggregate output by agricultural
land area (square km) from FAO.
For all of the three productivity estimates, we not only measure the indexes at the country level
but also construct an aggregate Western Europe index as well as two regional productivity
indexes, one for the Mediterranean (including Spain, Greece and Italy) and one for northern
continental Europe (Germany, France, Denmark, the Netherlands and Belgium). The regional

7
aggregates are derived by taking the weighted average of country-specific output, input and TFP
indexes, where the weights are the country’s share of total revenue (or cost) for the region. To
examine long-run productivity trends, we compare growth rates over three periods of time: 1973-
1982, 1983-1992 and 1993-2002 as well as over the whole period.
5.3.3 Statistical Tests of a Productivity Growth Slowdown
To examine changes in the long-run rates of productivity growth, we use two tests of statistical
significance: the sample-mean difference test and the trend coefficient test. We apply these tests
to the TFP indexes.
1. For the sample mean difference test we use Cochran and Box’s method (undertaken in SAS
9.2 using Cochran’s t-test). We apply two alternative breakpoints to divide the whole time
period into two sub-periods and test for differences of average growth rates between each
pre- and post-period. If the statistics are significant, we can reject the null hypothesis of no
difference (equal mean) in average growth rates between sub-periods. If the difference is
significant and positive (post-period minus pre-period), it indicates there is faster TFP growth
in the second period, otherwise, there is a productivity slowdown.
2. For the trend coefficient test we first fit two OLS regression models shown as the following
two equations:
LnTFP=α0+β0t+β1tD (5.1)
LnTFP=α0+β0t+α1D+β1tD (5.2)
where LnTFP is the logarithm of TFP, t is a time trend, and D is a dummy variable. D=1 when
the observation is located in the post-break-period. α0, α1 , β0, β1 are parameters to be estimated.
The difference between the two equations is that Equation 5.1 allows for a trend break while
Equation 5.2 allows for structural change in both intercept and trend. Taking a first derivative
with respect to t we get the average TFP growth rate τ0:
0
ln
dt
TFPd (5.3)
If β1 is significant, we can reject the hypothesis of no change in TFP growth between sub-periods.
If β1 is significant and positive, it indicates that productivity grew faster in the post-period. On
the other hand, if β1 is significant and negative, it indicates productivity grew more slowly in the
post-period. The intercept dummy in Equation 5.2 captures short-term shocks, such as sudden
drops or temporary increases that might be caused by weather conditions or other transitory
factors. This allows us to examine the trend dummy for deterministic TFP growth changes.
5.4 Productivity Growth and Structural Change in Western European Agriculture
5.4.1 Changes in Labour Productivity, Land Productivity, and Land-Labour Ratios

8
Table 5.2 presents average labour productivity growth in sub-periods and over the entire 1973-
2002 period for these Western European countries and regions. For the 11 countries as a whole,
labour productivity grew at an average annual rate of 4.14%, with country averages ranging
between 6.16% (Spain) and 2.37% (the Netherlands). Northern continental countries had lower
productivity growth than the Mediterranean countries. Yet among the Mediterranean countries,
only Spain demonstrates extraordinary growth of over 6% compared with an approximately 3.5%
growth rate for Greece and Italy. Spain’s growth in labour productivity was especially high in
the 1973-1982 period.
Table 5.2 – Average Annual Growth in Agricultural Labour Productivity (%)
Countries 1973-1982 1982-1992 1992-2002 1973-2002
Western Europe 4.42 3.26 4.75 4.14
Mediterranean 4.31 3.23 6.16 4.57
Greece 4.46 2.99 3.1 3.48
Italy 1.1 1.77 7.75 3.62
Spain 8.24 5.63 4.83 6.16
Northern continental 4.54 3.12 3.34 3.64
Belgium 3.06 4.91 2.31 3.44
Denmark 7.73 3.68 4.12 5.09
France 4.17 4.49 3.13 3.92
Germany 5.02 -0.04 4.56 3.12
Netherlands 4.05 2.4 0.82 2.37
Others
Ireland 4.38 5.31 5.06 4.94
Sweden 7.38 2.61 4.21 4.64
UK 3.49 2.57 2.75 2.92
Among all figures in Table 5.2, Germany is the only country showing a period with negative
labour productivity growth and that was in the 1982-1992 period. The major reason for this is
the 1990 German reunification. Prior to 1990, ‘Germany’ included agricultural data from only
the former West Germany, while after 1990 its statistics were merged with those of East
Germany. This causes a significant drop in the average labour productivity measure.
Higher labour productivity growth was often associated with capital deepening, or growth in the
capital-labour ratio (Table 5.3). This accounts for much of the labour productivity growth in
Denmark, France, Spain and Ireland. Yet there are exceptions, such as for Sweden, which ranks
fourth in labour productivity growth but tenth in capital-labour ratio growth. This suggests that
changes in partial productivity measures like output per worker may be greatly influenced by
increases in other inputs, as well as by technical advances that economize on inputs.

9
Table 5.3 – Trends in the Agricultural Capital-Labour Ratio (%)
Countries 1973-1982 1982-1992 1992-2002 1973-2002
Western Europe 5.34 2.13 3.91 3.74
Mediterranean 6.03 2.38 4.81 4.35
Greece 4.63 1.79 0.99 2.39
Italy 3.44 1.6 8.08 4.41
Spain 9.3 3.66 0.96 4.48
Northern continental 5.5 1.68 2.67 3.21
Belgium 6.55 1.67 1.35 3.08
Denmark 9.96 2.67 2.69 4.94
France 6.75 4.02 3.04 4.53
Germany 4.18 -2.57 3.25 1.53
Netherlands 7.7 1.86 0.94 3.36
Others
Ireland 7.03 3.22 5.5 5.19
Sweden 3.06 1.92 1.3 2.06
UK 1.59 2.47 2.83 2.32
As for the productivity growth trends among the 11 countries, five showed lower average annual
labour productivity growth in the 1992-2002 period than in either of the previous two decades
(Table 5.2). These include the Netherlands, Belgium, France, Spain and Ireland. However, for
the 11 countries as a whole, the last decade actually showed the most rapid growth, and no
general slowdown is evident in either the Mediterranean or northern continental regions.
Average labour productivity grew 4.75% annually in Western Europe over 1992-2002,
rebounding by 1.5% over the previous decade. These data indicate that if there was any Western
European slowdown in agricultural labour productivity, it appears to have been in the 1980s and
not in the more recent decade (1992-2002).
Compared to labour productivity, land productivity has grown more slowly at 1.60 % per year
for Western Europe as a whole (Table 5.4). While land productivity growth was practically
equal in the Mediterranean and northern Continental regions, it did vary more among countries
from 0.88% annually in the UK to over 2.5% in Ireland and Spain (over 1973-2002). There does
appear to have been a slowdown in land productivity growth for Western Europe as a whole,
from around 2% a year in the first two decades to under 1% in the last decade. This slowdown
affected most countries, with the exceptions of Spain and Sweden and possibly Greece.

10
Table 5.4 – Trends in Agricultural Land Productivity
Countries 1973-1982 1982-1992 1992-2002 1973-2002
Western Europe 2.01 1.9 0.93 1.6
Mediterranean 1.81 1.63 1.47 1.63
Greece 2.46 0.56 1.13 1.35
Italy 1.21 1.64 0.3 1.04
Spain 2.25 2.38 2.89 2.51
Northern continental 2.1 2.18 0.65 1.62
Belgium 0.27 3.06 -0.56 0.94
Denmark 3.39 1.62 1.26 2.05
France 1.88 1.37 0.89 1.36
Germany 2.24 3.1 0.49 1.93
Netherlands 3 2.37 0.3 1.85
Others
Ireland 2.26 5.11 0.2 2.53
Sweden 3.94 0.02 2.46 2.08
UK 2.01 0.71 0.03 0.88
Figure 5.1 plots land and labour productivity trends together for the 11 countries over the 1973-
2002 period using a framework popularized by Hayami and Ruttan (1985). The two indicators
together can also be used to examine the relationship between factor endowments and
agricultural output. By mapping each country’s labour productivity (horizontal axis) against its
land productivity (vertical axis) in logarithmic scale, each 45-degree line represents a constant
land-labour ratio. Each point on the Figure is a combination of labour productivity and land
productivity. The distance from one point to the next on each arrow shows the progress in
productivity. Longer arrows indicate faster progress within the period. If the productivity curve
slopes less than 45 degrees, it implies labour productivity is growing faster than land
productivity and that the land-labour ratio has been increasing over time. Growth in output per
worker is a combined effect of growth in output per area plus growth in area per worker.
The Netherlands, Belgium and Denmark are three countries on the frontier (the highest
combinations of land and labour productivity, or the furthest toward the upper right of the figure).
Spain, with relatively lower productivity in both labour and land shows the greatest progress in
both directions but especially in labour. Ireland and Sweden are the other two countries that
demonstrate faster productivity growth compared to the others, but from a low productivity
starting point. In fact, these three countries (Spain, Ireland and Sweden) have relatively lower
levels of labour and land productivity compared to all the other Western European countries
except for the UK. All the countries except the Netherlands show substantial movement to
higher land-labour ratios, indicating increasing average farm size. Since the arrows in Figure 5.1
all show smaller slopes than the 45 degree lines, it indicates that labour productivity grew faster
than land productivity in all these countries.

11
Figure 5.1 - Labour and Land Productivity in Western Europe, 1973-2002
Source: Output (Y) to Labour (L) and Output to Agricultural Land (A) ratios are estimated from
the data described in Ball et al. (2001, 2010). Output is measured in constant PPP$. Land and
Labour quantities are determined by dividing total expenditures (in constant PPP$) for these
inputs by relative price indexes for these inputs.
5.4.2 Changes in Total Factor Productivity and Input Use
Figure 5.2 shows average output, input and TFP growth for the 11 European countries and for
these countries combined over the 1973-2002 period. While real agricultural output increased in
all countries, the use of inputs declined and TFP growth was the sole driver of output growth in
most countries. The only countries that saw agricultural resources expand were the Netherlands
and Germany (and in Germany’s case this was due to the 1990 reunification). TFP growth rates
by sub-period for countries and regions can be found in Table 5.5. Those countries located close
to the frontier of labour and land productivity (Belgium, Denmark and the Netherlands – see
Figure 5.1) had slower TFP growth especially in the most recent period, 1992-2002. On the
other hand, Spain, with its lower initial TFP level in 1973, experienced the highest TFP growth
within the 1973-2002 period. Ball et al (2010) referred to this phenomenon as the ‘catch up’
effect.
2.00
4.00
8.00
3.00 6.00 12.00
Lan
d P
rod
uct
ivit
y (Y
/A),
log
scal
e
Labor Productivity (Y/L), log scale
Netherlands
Belgium
Denmark
Germany
France
Italy
Sweden
UK
Ireland
Spain
Greece
A/L = 3
A/L = 1.5A/L = 0.67
Netherlands
Belgium
Denmark
Italy
Greece
Germany
France
UK
SwedenSpain
Ireland

12
Figure 5.2 – Growth Rates for Agricultural Outputs, TFP, and Inputs
(Average annual growth rate during1973-2002)
Source: Ball et al (2010).
Table 5.5 – Trends in Agricultural Total Factor Productivity
Countries 1973-1982 1982-1992 1992-2002 1973-2002
Western Europe 1.77 1.36 1.73 1.58
Mediterranean 1.60 1.75 2.87 2.16
Greece 2.78 1.88 1.30 2.08
Italy -0.56 0.99 3.05 1.28
Spain 4.43 2.78 2.99 3.42
Northern continental 1.76 1.19 1.25 1.29
Belgium 0.18 1.87 1.07 0.86
Denmark 1.72 1.87 0.91 1.65
France 1.70 1.44 1.49 1.36
Germany 2.78 0.47 1.39 1.41
Netherlands 0.54 1.43 0.52 0.82
Others
Ireland 1.76 2.60 1.25 1.71
Sweden 4.32 1.29 1.50 2.48
UK 1.96 0.58 0.68 1.02
-2.0
-1.0
0.0
1.0
2.0
3.0
4.0
Ave
rage
ann
ual
gro
wth
(%
)
Outputs
TFP
Inputs
13
As for a possible productivity slowdown, Table 5.5 shows that among the 11 countries, six had
lower average TFP growth during 1992-2002, compared with the mean over the 1973-2002
period. However, regional aggregate TFP growth rates do not show signs of decline.
Agricultural TFP growth in the Mediterranean region accelerated over the three decades, while
TFP growth in the northern continental region and for the 11 countries as a whole declined
somewhat in the middle decade but then recovered in the last decade.
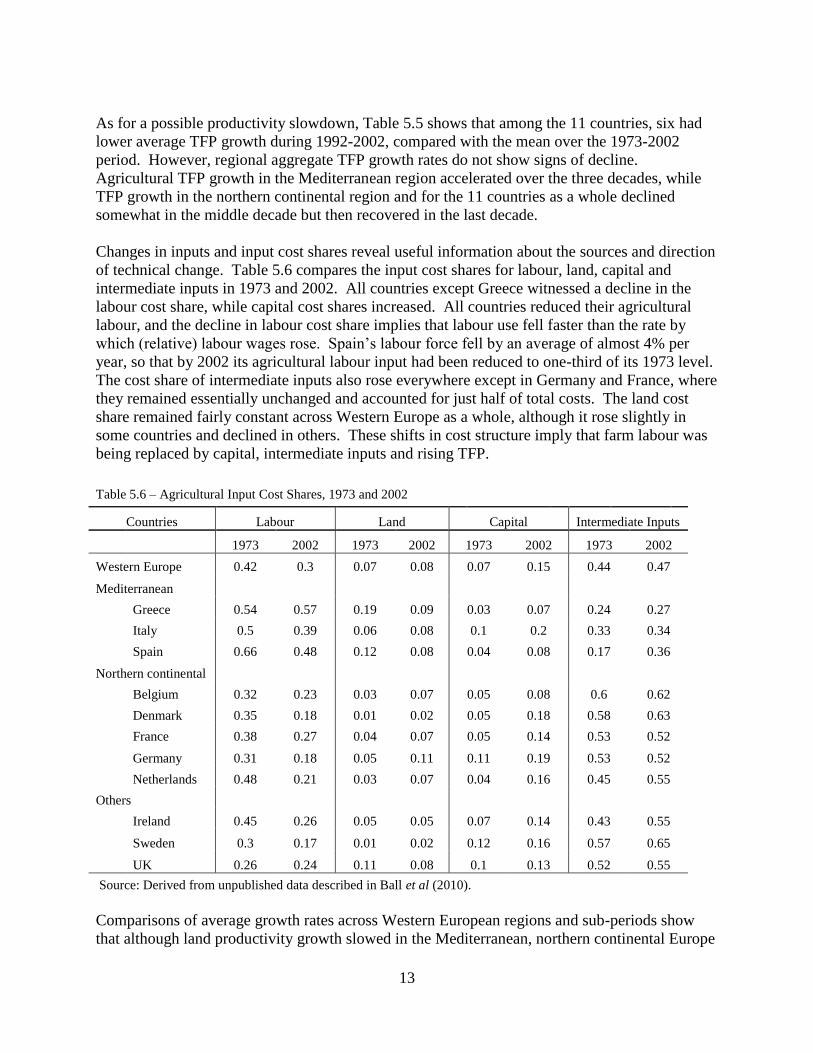
Changes in inputs and input cost shares reveal useful information about the sources and direction
of technical change. Table 5.6 compares the input cost shares for labour, land, capital and
intermediate inputs in 1973 and 2002. All countries except Greece witnessed a decline in the
labour cost share, while capital cost shares increased. All countries reduced their agricultural
labour, and the decline in labour cost share implies that labour use fell faster than the rate by
which (relative) labour wages rose. Spain’s labour force fell by an average of almost 4% per
year, so that by 2002 its agricultural labour input had been reduced to one-third of its 1973 level.
The cost share of intermediate inputs also rose everywhere except in Germany and France, where
they remained essentially unchanged and accounted for just half of total costs. The land cost
share remained fairly constant across Western Europe as a whole, although it rose slightly in
some countries and declined in others. These shifts in cost structure imply that farm labour was
being replaced by capital, intermediate inputs and rising TFP.
Comparisons of average growth rates across Western European regions and sub-periods show
that although land productivity growth slowed in the Mediterranean, northern continental Europe
Table 5.6 – Agricultural Input Cost Shares, 1973 and 2002
Countries Labour Land Capital Intermediate Inputs
1973 2002 1973 2002 1973 2002 1973 2002
Western Europe 0.42 0.3 0.07 0.08 0.07 0.15 0.44 0.47
Mediterranean
Greece 0.54 0.57 0.19 0.09 0.03 0.07 0.24 0.27
Italy 0.5 0.39 0.06 0.08 0.1 0.2 0.33 0.34
Spain 0.66 0.48 0.12 0.08 0.04 0.08 0.17 0.36
Northern continental
Belgium 0.32 0.23 0.03 0.07 0.05 0.08 0.6 0.62
Denmark 0.35 0.18 0.01 0.02 0.05 0.18 0.58 0.63
France 0.38 0.27 0.04 0.07 0.05 0.14 0.53 0.52
Germany 0.31 0.18 0.05 0.11 0.11 0.19 0.53 0.52
Netherlands 0.48 0.21 0.03 0.07 0.04 0.16 0.45 0.55
Others
Ireland 0.45 0.26 0.05 0.05 0.07 0.14 0.43 0.55
Sweden 0.3 0.17 0.01 0.02 0.12 0.16 0.57 0.65
UK 0.26 0.24 0.11 0.08 0.1 0.13 0.52 0.55
Source: Derived from unpublished data described in Ball et al (2010).

14
and Western Europe as a whole, labour productivity growth and TFP growth did not (Figure 5.3,
Panel 1). But there are substantial exceptions to each of these generalities. Labour productivity
growth fell in the most recent decade in Spain, Belgium, France and the Netherlands. Likewise,
TFP growth fell in Greece, Belgium, Denmark and the Netherlands. Labour productivity and
TFP both fell in Ireland in the 1990s. So if we look at the trends for Western Europe over this
thirty-year period, we do not see clear evidence of an overall productivity slowdown. However,
using simple averages or mean productivity growth rates may be misleading, and Panel 2 in
Figure 5.3 clearly shows how much transitory factors like the weather can cause temporary
Figure 5.3 - Agricultural Productivity Growth in Western Europe (11 country aggregate)
Panel 1: Trend of Labour Productivity and TFP
Panel 2: Rate of Change in Agricultural TFP
Source: Derived from data described in Ball et al (2010).
50
100
150
200
250
300
350
1973 1978 1983 1988 1993 1998 2003
Ind
ex, 1973 =
100
Labor productivity
Total factor productivity
-2.0%
-1.0%
0.0%
1.0%
2.0%
3.0%
4.0%
5.0%
6.0%
1973 1978 1983 1988 1993 1998 2003
Annual TFP growth rate
Mean TFP growth rate
1.67%

15
fluctuations in annual growth rates. even across the Western Europe as a whole. A statistical test
is necessary if we want to address this issue more rigorously. The next section examines the
productivity slowdown issue using this approach.
5.4.3 Is There a Slowdown in TFP Growth?
Sample means tests for national and regional agricultural TFP growth rates are reported in Table
5.7. We use 1983 and 1993 as the break points and compare mean growth rates among the
periods demarcated by the break points. When using 1983 as the breakpoint, only three
countries (Belgium, Italy and the Netherlands) exhibit accelerating TFP growth in the post-1983
period, while the other countries all demonstrate lower growth rates. However, none of these
changes in mean growth rates is statistically significant. We cannot reject the hypothesis of no
differences in TFP growth rates between the 1973-1982 and post-1983 periods. When using
1993 as the breakpoint we find that all countries show a decline in TFP growth in the post-1993
period except Italy, and Italy’s acceleration in TFP growth is significant at a 10% significance
level. Again, we cannot reject the hypothesis of no TFP growth slowdown for any of the other
ten countries in the post-1993 period.
Table 5.7 – Testing for a TFP Growth Slowdown Using the Sample Mean Test
Countries Using 1983 as the break point Using 1993 as the break point
mean change significance mean change significance
Belgium + N - N
Denmark - N - N
Germany - N - N
Greece - N - N
Spain - N - N
France - N - N
Ireland - N - N
Italy + N + *
Netherlands + N - N
Sweden - N - N
UK - N - N
Western Europe - N + N
Notes
"+" indicates increase in the second period, "-" indicates decrease in the second period.
"*" indicates significant at 10% level, "**" indicates significant at 5% level, "***" indicates significant at 1% level.
"N" indicates not significant based on the sample mean difference test undertaken using Cochran methods.

16
We then use the time trend coefficient models to see if they show a slowdown in productivity in
Western Europe in recent years. Since LnTFP is a time series, we first conduct the Phillips-
Perron (1988) (PP) unit root test for the series. Table 5.8 presents these results. When we apply
the unit root test without trend, we cannot reject a unit root for any of the series. When we
include a trend in the unit root tests, five countries (Belgium, Denmark, Germany, Greece and
Ireland) and Western Europe as a whole reject the hypothesis of non-stationarity (significance
levels vary and are shown in the table), while the others are still non-stationary. As would be
expected when we take first differences of the non-stationary series δ LnTFP (the TFP growth
rate) for those countries is stationary.3 Since half the series are stationary with a deterministic
trend, we report the results using LnTFP as the dependent variable and include a deterministic
time trend to maintain comparability.4 Since the results for Equations 5.1 and 5.2 are similar, we
only report results based on Equation 5.2 which allows for series drift through the intercept
dummy.
Table 5.8 – Unit Root Tests of Stationarity for the Agricultural TFP Series
Countries PP unit root test (level) PP unit root test (first difference)
without trend with trend without trend with trend
Belgium NS -3.82 ** S S
Denmark NS -3.34 * S S
Germany NS -3.33 * S S
Greece NS -7.73 *** S S
Spain NS -2.62 S S
France NS -3.16 S S
Ireland NS -4.17 ** S S
Italy NS -2.09 S S
Netherlands NS -2.34 S S
Sweden NS -2.19 S S
UK NS -2.55 S S
Western Europe NS -14.32 *** S S
Notes
* indicates significant at 10% level, ** indicates significant at 5% level, *** indicates significant at 1% level.
NS indicates non-stationary, S indicates stationary.
3 We do not pursue first difference versions of Equations 5.1 and 5.2 any further because the tests become similar to
sample mean tests looking at average growth rates as was already done in Table 5.7. We tried regressing the growth
rate (first difference of LnTFP) on a deterministic time trend, implying a nonlinear relationship between LnTFP and
t but these results are all insignificant. 4 It is a well known time-series phenomenon in spurious regressions that the sign and significance of a deterministic
trend are inflated when the underlying series has a stochastic trend (Phillips, 1998), but we are reporting and
discussing the trend break variable that should have no such bias.

17
Table 5.9 – Tests for Agricultural TFP Slowdown Using the Time Trend Regression Model
Using 1983 as the break point Using 1987 as the break point Using 1993 as the break point
Countries TFP growth t-statistics F-statistics TFP growth t-statistics F-statistics TFP growth t-statistics F-statistics
Belgium1 + ** * + -
Denmark1 + * *** - -
Germany1 - *** *** - *** *** -
Greece1 - - +
Spain - *** *** - *** *** - ***
France - ** - ** ** - * *
Ireland1 + * - -
Italy + *** *** + *** *** + *** ***
Netherlands + *** ** + *** ** -
Sweden - *** *** - *** *** - *** ***
UK - *** *** - *** *** - ***
Western
Europe1 - ** - ** +
Notes
1: Belgium, Denmark, Germany, Greece, Ireland, and Western Europe are stationary series.
2: "+" indicates increase in the post- period. "-" indicates decrease in the post- period
3: "*" indicates significant at 10% level, "**" indicates significant at 5% level, "***" indicates significant at 1% level.
4: t-statistics is for the coefficient of the trend dummy. F-statistics is for the joint hypothesis test of the intercept dummy and trend dummy.

18
Table 5.9 shows the time trend regression test results for a TFP slowdown. It uses three
alternative breakpoints to test for a productivity slowdown. When using 1983 as the breakpoint,
the TFP growth rate significantly increased after 1983 for Belgium, Denmark, Italy and the
Netherlands. Yet Germany, Spain, Sweden and the UK exhibit productivity slowdowns in the
post-1983 period. When using 1987 as the breakpoint, only Italy and the Netherlands still
exhibit significantly faster TFP growth in the post-1987 period, while Germany Spain, France,
Sweden and the UK show significant productivity slowdowns. When using 1993 as the
breakpoint, most of the tests show lower productivity growth in the post-period but most of them
are insignificant except in France and Sweden. On the other hand, Italy is the only country
demonstrating significantly higher TFP growth in the post-period as it did in the previous two
break periods.
Taken together, the results in Table 5.9 tell several important stories. As the arbitrarily chosen
break point moves closer to the end of the series, fewer countries have significant results, so we
would not expect a structural break later in the series in formal tests. Our purpose here is to
comment on whether a TFP slowdown might have taken place, and using the 1983 results that
have the largest number of significant results there are as many countries that increased TFP
growth from this point as experienced a slowdown (four countries increased while four slowed
down). Spain slowed down likely because of the phenomenal growth it experienced early in the
sample period, consistent with the previously discussed ‘catch-up’ hypothesis. Italy, on the other
hand, never very high in TFP growth, had significant positive growth over all three ‘post-
periods’ as the ‘catch-up’ worked in its favour. But even the ‘catch-up’ is not ubiquitous, as the
Netherlands, a high TFP-level country, also had increasingly significant TFP growth over the
first two sub-periods. Since the aggregate Western Europe results are not significant, these
country results seem to indicate that, while some European countries are increasing their TFP
growth, others are decreasing, and these trends average out for Western Europe as a whole.
Local factors probably account for what is taking place in each country in the region.
5.5 Conclusions and Discussion
The declining rate of growth in agricultural output in Western Europe over the past several
decades has cut the region’s share of global production in half, to about 10% by 2008-2009
according to FAO. But our analysis of productivity patterns suggests this slowdown in output
growth is entirely due to withdrawals of resources from agriculture, especially labour, and not to
a slowdown in productivity growth. To the extent that increases in TFP reflect the rate of
technical change, trends in agricultural R&D funding are consistent with trends in TFP growth:
neither shows major departures from long-term trends. However, our findings also show
considerable regional and national differences in the rate and direction of productivity growth
and in the organization and support for agricultural research in Western Europe.
The results show that the exit of labour from agriculture, leaving more resources for workers
remaining in the sector, has been an important source of agricultural labour and TFP growth for
many Western European countries. This has been especially true for less industrialized or
urbanized countries with relatively large shares of labour employed in agriculture but with low
output per worker. The EU’s integration of product and labour markets has probably facilitated
the process of structural change in these economies and enabled them to achieve or maintain

19
relatively high rates of agricultural productivity growth. These structural changes are reflected in
the changing cost structure of EU agriculture, with falling cost shares for labour and rising cost
shares for capital and intermediate inputs over time for most countries, while land cost shares
have remained relatively stable.
Agricultural R&D spending by Western European countries does appear to be positively
correlated with their agricultural TFP, although we have not rigorously examined this
relationship here. Several countries with the highest levels of agricultural TFP – the Netherlands,
Denmark, France and Germany in particular - also make large investments (relative to
agricultural GDP) in agricultural research, while several countries with the lowest TFP levels
(Greece and Spain) spend considerably less on research. The UK, Ireland and Italy, however
don’t quite fit this mould – in Italy’s case spending on agricultural research is low, but TFP is
relatively high, while the UK and Ireland both have relatively high R&D-GDP ratios but TFP
levels below the Western European average. In the UK’s case, since the 1980s there was a
significant redirection of public R&D funds away from productivity-oriented research, which
may explain its low level of TFP. Detailed information is lacking on how R&D funds are
allocated in other European countries.
The analysis of productivity trends did not reveal any significant slowing down of TFP or labour
productivity growth rates, although land productivity growth did decline after 1993, especially
for northern continental states and Britain. Regarding TFP, just as many countries in the sample
have had lower TFP growth rates since 1983 as those that have had higher rates. The trend
regression models show that when using either 1983 or 1987 as breakpoints, Germany, Spain,
Sweden and the UK experienced productivity slowdown, while Italy and the Netherlands
exhibited accelerated productivity growth. However, these findings are not statistically robust
using a 1993 break date. The high year-to-year variability in agricultural TFP growth rates,
primarily due to weather-induced fluctuations in output, introduces a serious signal-to-noise
problem in constructing valid statistical tests for growth trends. Future work could explore
factors linking productivity and research in each country’s circumstances, keeping in mind time
lags before research can be expected to help productivity and the potential for cross-country
R&D spillovers.
References
Alston, J. Babcock, B. and Pardey, P. (2010) Shifting Patterns of Global Agricultural
Productivity: Synthesis and Conclusion. In: Alston, J., Babcock, B. and Pardey, P. (eds.)
The Shifting Patterns of Agricultural Production and Productivity Worldwide. The
Midwest Agribusiness Trade Research and Information Center, Iowa State University,
Ames, IA, pp. 449-482.
Alston, J., Pardey, P. and Smith, V. (1999) A Synthesis. In: Alston, J., Pardey, P. and Smith, V.
(eds.) Paying for Agricultural Productivity. Johns Hopkins University Press, Baltimore,
MD, pp. 276-282.
Alston, J., Andersen, M., James, J. and Pardey, P. (2010) Persistence Pays: U.S. Agricultural
Productivity Growth and the Benefits from Public R&D Spending. Springer, New York,
NY.

20
Ball, V.E., Butault, J., Mesonada, C. and Mora, R. (2010) Productivity and International
Competitiveness of Agriculture in the European Union and the United States.
Agricultural Economics 41, 611-627.
Ball, V.E., Bureau, J., Butault, J. and Nehring, R. (2001) Levels of Farm Sector Productivity: An
International Comparison. Journal of Productivity Analysis, 15, 5–29.
Cahill, S., Phillips, B. and Rich (2012, this volume).
Caves, D., Christensen, L. and Diewert, W. (1982) Multilateral Comparison of Output and
Productivity Using Superlative Index Numbers. Economic Journal 92, 73-86.
ERSa. European Union: Common Agricultural Policy Briefing Room. Economic Research
Service, U.S. Department of Agriculture, Washington, DC. Available at:
http://www.ers.usda.gov/Briefing/EuropeanUnion/policy.htm (accessed 15 September
2011).
ERSb. Organic Production Data Sets. Economic Research Service, U.S. Department of
Agriculture, Washington, DC. Available at: http://www.ers.usda.gov/Data/Organic/
(accessed 20 September 2011).
Eurostat (2006) Food: From Farm to Fork Statistics, Statistical Pocketbook. European
Communities, Luxembourg.
Food and Agricultural Organization of the United Nations (FAO). FAOSTAT Database, Rome,
Italy. Available at: http://faostat.fao.org/ (accessed October 2010).
Fuglie, K. (2008) Is a Slowdown in Agricultural Productivity Growth Contributing to the Rise in
Commodity Prices? Agricultural Economics 39, supplement, 431–441.
Fuglie, K. (2010) Total Factor Productivity in the Global Agricultural Economy: Evidence from
FAO Data. In: Alston, J., Babcock, B. and Pardey, P. (eds.) The Shifting Patterns of
Agricultural Production and Productivity Worldwide. Midwest Agribusiness Trade and
Research Information Center, Iowa State University, Ames, IA, pp. 63-95.
Hayami, Y. and Ruttan, V.W. (1985) Agricultural Development: An International Perspective.
Johns Hopkins University Press, Baltimore, MD.
Jorgenson, D.W. and Nishimizu, M. (1981) International Differences in Levels of Technology: A
Comparison Between U.S. and Japanese industries. In: International Roundtable
Congress Proceedings. Institute of Statistical Mathematics, Tokyo, Japan.
Jorgenson, D.W. and Nishimizu, M. (1978) U.S. and Japanese Economic Growth, 1952–1974:
An International Comparison. Economic Journal. 83, 707–726.
Normile, M. and Leetmaa, S. (coordinators) (2004) U.S - EU Food and Agriculture Comparisons.
Agriculture and Trade Report WRS-04-04, Economic Research Service, U.S. Department
of Agriculture, Washington, DC.
OECD. Science, Technology and R&D Statistics. Organization for Economic Cooperation and
Development, Paris, France. Available at: http://www.oecd-
ilibrary.org/content/datacollection/strd-data-en (accessed 12 September 2011).
Phillips, P.C.B. (1998) New Tools for Understanding Spurious Regressions. Econometrica 66, 6,
1299-1325.
Phillips, P.C.B. and Perron, P. (1988) Testing for a Unit Root in Time Series Regression.
Biometrika, 75, 2, 335-346.
Piesse, J. and Thirtle C. (2010) Agricultural R&D, Technology and Productivity. Philosophical
Transactions of the Royal Society B 365, 3035–3047.

21
Roseboom, J. and Rutten, H. (1999) Financing Agricultural R&D in the Netherlands: The
Changing Role of Government. In: Alston, J., Pardey, P. and Smith, V. (eds.) Paying for
Agricultural Productivity. Johns Hopkins University Press, Baltimore, MD, pp. 215-246.
Schimmelpfennig, D. and Thirtle, C. (2000) Significance of International Spillovers from Public
Agricultural Research. In: Fuglie, K. and Schimmelpfennig, D. (eds.) Public-Private
Collaboration in Agricultural Research: New Institutional Arrangements and Economic
Implications. Iowa State University Press, Ames, IA.
Schimmelpfennig, D. and Thirtle, C. (1999) The Internationalization of Agricultural Technology:
Patents, R&D Spillovers and their Effects on Productivity in the European Union and
United States. Contemporary Economic Policy 17, 4, 457-468.
Thirtle, C., Lin, L., Holding, J. and Jenkins, L. (2004) Explaining the Decline in UK Agricultural
Productivity Growth. Journal of Agricultural Economics, 55, 2, 343-366.
Thirtle, C., Piesse, J. and Smith, V. (1999) Agricultural R&D Policy in the United Kingdom. In:
Alston, J., Pardey, P. and Smith, V. (eds.) Paying for Agricultural Productivity. Johns
Hopkins University Press, Baltimore, MD, pp. 172-214.
Von Braun, J. and Qaim, M. (2000) Research and Technology in German Agriculture. In
Tangermann, S. (ed.) Agriculture in Germany, DLG-Verlag, Frankfurt am Main,
Germany, pp. 255-282.
Wang, S.L. (2010) Is US Agricultural Productivity Growth Slowing? Amber Waves, 8, 3.
World Bank. World Development Indicators Databank. World Bank, Washington, DC. Available
at: http://data.worldbank.org/data-catalog/world-development-indicators (accessed 12
September 2011).
Zhao, Sheng and Gray (2012, this volume).