slowing down of water dynamics in disaccharide aqueous solutions
TRANSCRIPT

1
Slowing down of water dynamics in disaccharide aqueous solutions
by
A. Lerbreta) †, F. Affouarda), P. Bordatb),
A. Hédouxa), Y. Guineta), M. Descampsa)
a) Unité Matériaux Et Transformations, UMR CNRS 8207
Université Lille 1, 59655 Villeneuve d’Ascq Cedex, France.
b) Institut Pluridisciplinaire de Recherche sur l’Environnement et les Matériaux,
UMR CNRS 5254, Université de Pau et des Pays de l’Adour,
2 Avenue Pierre Angot, 64053 Pau Cedex 9, France.
† author to whom correspondence should be addressed, [email protected].

2
Abstract
The dynamics of water in aqueous solutions of three homologous disaccharides, namely trehalose,
maltose and sucrose, has been analyzed by means of molecular dynamics simulations in the 0-66 wt %
concentration range. The low-frequency vibrational densities of states (VDOS) of water were
compared with the susceptibilities χ” of 0-40 wt % solutions of trehalose in D2O obtained from
complementary Raman scattering experiments. Both reveal that sugars significantly stiffen the local
environments experienced by water. Accordingly, its translational diffusion coefficient decreases
when the sugar concentration increases, as a result of an increase of water-water hydrogen bonds
lifetimes and of the corresponding activation energies. This induced slowing down of water dynamics,
ascribed to the numerous hydrogen bonds that sugars form with water, is strongly amplified at
concentrations above 40 wt % by the percolation of the hydrogen bond network of sugars, and may
partially explain their well-known stabilizing effect on proteins in aqueous solutions.
Keywords: Bioprotection, Carbohydrates, Water structural relaxation, Hydrogen bonds

3
1 – Introduction
Disaccharides (C12H22O11) such as trehalose and sucrose are well-known for their high efficiencies in
preserving biological molecules against thermal and dehydration stresses [1,2,3,4] and are accordingly
widespreadly used in various industrial processes for the long-term conservation of therapeutic
proteins, food and cosmetics [5,6,7]. However, the detailed molecular mechanisms underlying their
bioprotecting abilities, and in particular the superior efficiency of trehalose, are still poorly understood
[3]. Many hypotheses [4,8,9,10,11,12] (vitrification, replacement of hydration water molecules, etc.)
have been proposed in the literature, but they generally cover only narrow temperature and/or
hydration ranges that prevent a comprehensive description of the whole biopreservation mechanism.
In rather dilute aqueous solutions, various experimental [12] and simulation [13,14] results suggest
that sugars are preferentially excluded from the surface of globular proteins. Therefore, their
bioprotective effect is thought to partially stem from the significant slowing down they induce on the
dynamics of protein hydration water molecules [15,16,17]. Indeed, sugars form numerous hydrogen
bonds (HBs) with water [18,19], whose dynamics is strongly slow down in their hydration shell
[15,20,21,22]. Recently, disaccharides were shown to decrease the flexibility of lysozyme [17,23],
thereby reducing its conformational entropy. This result fully agrees with the stabilization of the
tertiary structure of lysozyme at high temperatures observed in Raman scattering experiments [23] and
would explain why the secondary structure of lysozyme unfolds at higher temperatures in presence of
sugars [23,24]. Furthermore, trehalose exhibited superior protecting capabilities [23,24] that would
partially stem from its higher ability to slow down water dynamics [25], mainly because of its larger
hydration number [18,26,27].
In this paper, the dynamics of water in aqueous solutions of three homologous disaccharides, namely
trehalose, maltose and sucrose, is investigated by means of molecular dynamics (MD) simulations in a
broad range of concentrations (0-66 wt %). The low-frequency vibrational densities of states (VDOS)
of water were calculated and compared with the susceptibilities χ” of 0-40 wt % solutions of trehalose
in D2O obtained from complementary Raman scattering experiments. Moreover, the translational
diffusion coefficient of water and the activation energies of water-water hydrogen bonds were

4
determined to further examine the influence of the percolation of the hydrogen bond network (HBN)
of sugars on the dynamical slowing down of water.
2 – Simulation and Experimental Details
2.1 Molecular Dynamics Simulations
The simulations of disaccharide aqueous solutions have been thoroughly described in ref. [27,28] and
are summarized in the following. MD simulations of 512 water molecules in presence of 0, 1, 5, 13, 26
or 52 sugar molecules (either trehalose, maltose or sucrose) leading to weight concentrations of 0, 4,
16, 33, 49 or 66 %, respectively, have been performed at temperatures ranging from 273 up to 373 K
in steps of 20 K using the DL_POLY software [29]. Water and sugar molecules were represented with
the rigid SPC/E model [30] and with the fully flexible all-atom carbohydrate force field developped by
Ha et al. [31], respectively. Electrostatic interactions were handled by the reaction-field method [32]
(with εRF=72). The cutoff radius for non-bonded interactions was set to 10 Å and cubic periodic
boundary conditions were applied. Simulations were performed in the isobaric-isothermal NPT
ensemble using weak couplings to pressure and heat baths [33], with reference pressure set to 1.0 bar.
Simulation times ranged from 0.2 up to 2.0 ns depending on the temperature and on the sugar
concentration considered. Time steps of 0.5 and 2 fs were used to integrate the equations of motions
for the binary solutions and for pure water, respectively.
2.2 Raman Scattering Experiments
High-purity anhydrous trehalose was supplied from Fluka and Sigma. Measurements were performed
on trehalose in deuterated water at different weight fractions of sugar (0, 10, 20, 30 and 40 wt %) and
T=295 ± 0.1 K. The mixtures were loaded in hermetically closed Hellma quartz Suprasil cells. The
514.5 nm line of a mixed argon-krypton laser was used for Raman excitation. The back-scattering
Raman spectra were recorded in the 10-300 cm-1 spectral window using a Dilor-XY spectrometer
equipped with a liquid nitrogen cooled charge-coupled-device detector. The scattered low-frequency

5
intensity was transformed into Raman susceptibility χ” using a procedure detailed in previous studies
[23]. χ”(ν) is related to the VDOS g(ν) by the relation )(.).()(" 1ννννχ gC −
= , where C(ν) is the
light-vibration coupling coefficient. Assuming a linear frequency dependence of C(ν) [34], χ”(ν) is
roughly representative of the VDOS, provided that the quasielastic contribution arising from
anharmonic motions has been accurately subtracted from the low-frequency spectrum. All spectra
were finally normalized between 10 and 120 cm-1.
3 – Results
3.1 Low-frequency vibrational dynamics
The influence of sugars on the dynamics of water was first probed with the low-frequency VDOS of
water, shown for the different trehalose solutions at 293 K in Fig. 1. For comparison, the low-
frequency Raman susceptibilities χ” of trehalose/D2O solutions in the 0-40 % concentration range are
also displayed. A qualitative agreement is obtained between MD and Raman spectra, in which two
main bands appear near 50-60 and 170-200 cm-1, respectively, though with different positions,
amplitudes and widths. These discrepancies may arise from (i) the limited accuracy of force fields
used in simulations, (ii) the significant contribution of sugars to the Raman spectra, as observed for
frequencies above 250 cm-1 for instance, (iii) the probably nonlinear frequency dependence of the
light-vibration coupling coefficient C(ν) [17] and (iv) the nontrivial subtraction of quasielastic and
fluorescence contributions. The first band, close to 50-60 cm-1 in neat water, has been ascribed to the
intermolecular vibrations that water molecules experience within the cage formed by their neighbors,
and has also been observed both in hydrogen-bonded and nonassociated liquids [35,36]. It broadens
with the addition of sugars, which may reflect the increased heterogeneity of the local environments
sampled by water molecules in mixed solutions. The second band near 170-200 cm-1 has been
previously assigned to collective intermolecular O-H...O stretching vibrations [37]. The decrease of its
amplitude when the sugar concentration increases reflects the destructuring effect of sugars on the
HBN of water [9,19,28,38], which essentially stem from the numerous HBs they form with water [27].
Furthermore, the concomitant increase in the frequency position of the two bands indicates that the

6
local environments experienced by water molecules are stiffer in presence of sugars, in line with the
sterical restriction imposed by their rather rigid skeletons [39]. In particular, the sugar-induced blue
shift of the second band implies that water-water HBs are strengthened, as will be shown more
explicitely in section 3.3.
Fig. 1 Top: Low-frequency vibrational density of states (VDOS) of water in the different
trehalose/water solutions at 293 K. Bottom: Raman susceptibility χ”(ν) of trehalose/D2O
solutions in the 0-40 wt % sugar concentration range at 295 K, normalized in the 10-120 cm-1
range. MD and Raman spectra have been smoothed with the Savitzky-Golay algorithm [40] to
simplify the comparison of results.
A fit of the computed VDOS of water in the different sugar solutions has been arbitrarily performed
with a log-normal and a Gaussian functions, and the dependence on the sugar concentration of the
frequency positions of the two bands is shown in Fig. 2. For comparison, a similar fitting procedure
was performed on the Raman susceptibilities of the trehalose solutions in D2O. It must be pointed out,
however, that a second gaussian function was necessary to represent satisfactorily the second band for
trehalose concentrations greater or equal to 20 %, given the emergence of an additional contribution
near 210 cm-1 that may reveal the formation of particularly strong water-trehalose HBs. As seen in Fig.
1, the frequency positions νcaging and νO-H---O obtained from MD and Raman spectra differ significantly
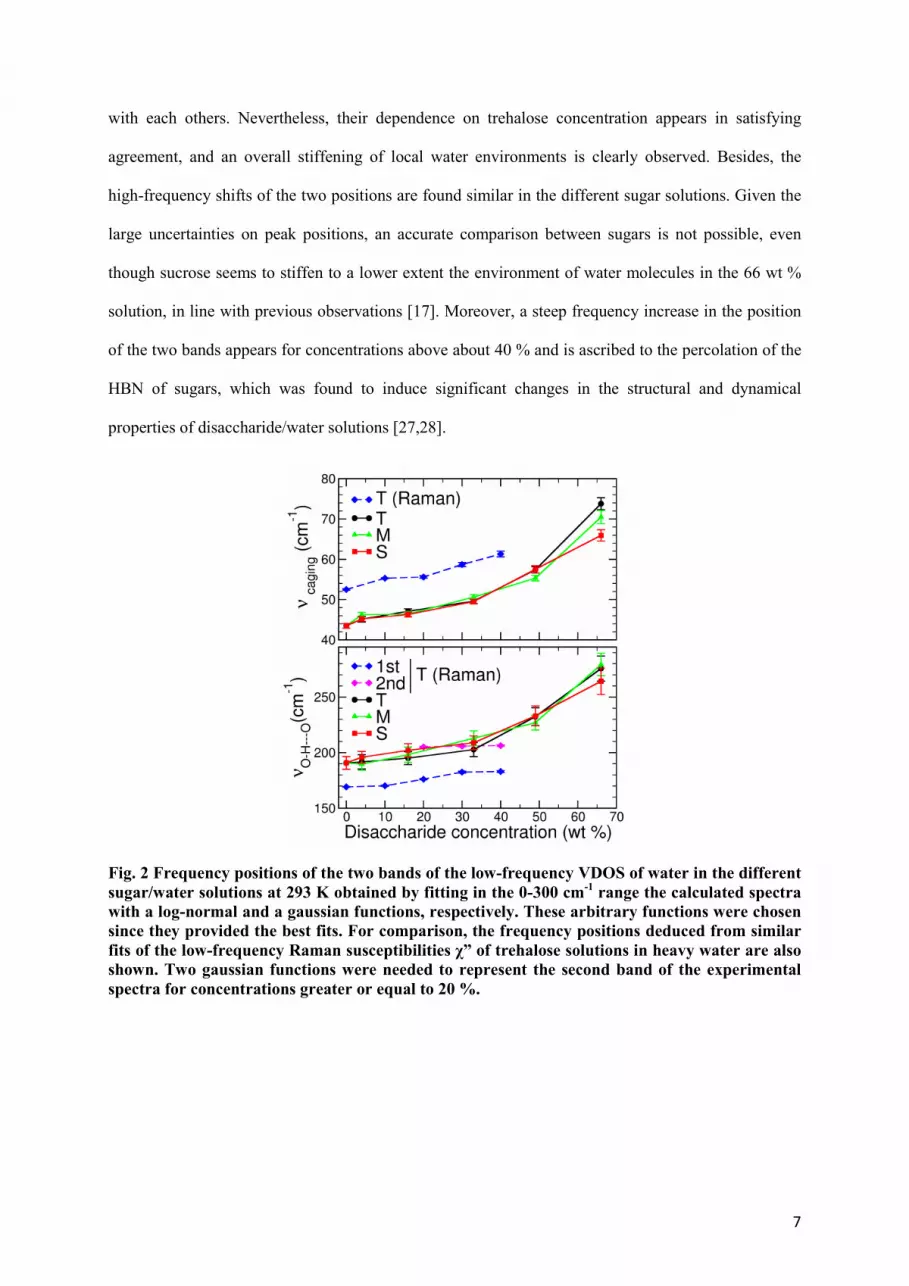
7
with each others. Nevertheless, their dependence on trehalose concentration appears in satisfying
agreement, and an overall stiffening of local water environments is clearly observed. Besides, the
high-frequency shifts of the two positions are found similar in the different sugar solutions. Given the
large uncertainties on peak positions, an accurate comparison between sugars is not possible, even
though sucrose seems to stiffen to a lower extent the environment of water molecules in the 66 wt %
solution, in line with previous observations [17]. Moreover, a steep frequency increase in the position
of the two bands appears for concentrations above about 40 % and is ascribed to the percolation of the
HBN of sugars, which was found to induce significant changes in the structural and dynamical
properties of disaccharide/water solutions [27,28].
Fig. 2 Frequency positions of the two bands of the low-frequency VDOS of water in the different
sugar/water solutions at 293 K obtained by fitting in the 0-300 cm-1 range the calculated spectra
with a log-normal and a gaussian functions, respectively. These arbitrary functions were chosen
since they provided the best fits. For comparison, the frequency positions deduced from similar
fits of the low-frequency Raman susceptibilities χ” of trehalose solutions in heavy water are also
shown. Two gaussian functions were needed to represent the second band of the experimental
spectra for concentrations greater or equal to 20 %.

8
3.2 Water translational diffusion coefficients
The translational diffusion coefficients of water Dw were computed from the long-time limit slope of
the water mean square displacement (MSD) according to the Einstein relation
trtrDt
w 6)0()(lim2
−=∞→
, where r(t) and r(0) are the position vectors of the center of mass of
molecules at times t and 0 respectively, and the brackets means averaging over every time origin and
water molecule. The calculated diffusion coefficients Dw for the different disaccharide solutions at 293
K are displayed in Fig. 3. The computed Dw compare well with the diffusion coefficients interpolated
from the experimental data of Mills [41] for pure water and of Rampp et al. [39] for trehalose
solutions, thereby suggesting that the influence of sugars on water dynamics is rather well reproduced
in the present simulations. Water diffusion is slowed down by more than one order of magnitude when
sugar concentration increases from 4 to 66 wt %. Interestingly, the concentration dependence of Dw
mimicks that of the probability of water HB formation pHB [27] or that of the mean size of water
clusters <nW> [28]. This shows that the slowing down of water dynamics stems from the increasing
number of water-sugar HBs as sugar concentration increases. Indeed, carbohydrates induce a
significant decrease of the translational and rotational diffusion coefficient of water in their hydration
shell [20], as could be expected from their significantly smaller diffusion coefficient with comparison
to water [39]. The steep decrease of Dw when the sugar concentration increases from 49 to 66 wt %
can be ascribed to the percolation of the HBN of sugars in this concentration range [27]. It is also
worth noticing that the differences between the influence of sugars on water dynamics are essentially
observed at 66 wt %, at which differences between the effects of sugars on the HBN of water are
significant [27,28]. At low sugar concentrations, the total number of water molecules involved in HBs
with sugars is too low for the differences between the respective hydration numbers of sugars to be
observed on Dw. These differences emerge on Dw only at 66 wt %, at which the numbers of water-
water and water-sugars HBs are comparable. Then, Dw is found the lowest in the trehalose solution, as
could be expected from its larger hydration number [18,26,27].

9
Fig. 3 Water translational diffusion coefficient Dw as a function of the disaccharide
concentration in the different sugar/water solutions at 293 K. For comparison, the diffusion
coefficients of water obtained from a linear interpolation of experimental data at 288 and 298 K
from Mills [41] for pure water and from Rampp et al. [39] in 10, 30, 50 and 60 wt % trehalose
solutions are also reported as a triangle and stars symbols, respectively.
3.3 Water hydrogen bonds dynamics
The dynamics of water molecules primarily depends on the dynamics of the hydrogen bonds they form
with their neighbors. Here, the structural relaxation times of water-water HBs τHB have been estimated
from the long-time decay of the intermittent correlation function C(t)=<hi(t).hi(0)> [42] where hi(t) is
unity if a given HB i formed at time 0 remains intact at time t - even if it has broken in between - and
is zero otherwise (two water molecules were considered to be hydrogen bonded if the O-O distance is
less than 3.4 Å and if the O-H...O angle is larger than 120° [43]). Following a fast decrease of C(t) at
short times (< 0.2 ps) ascribed to water libration, the long-time decay of C(t) reflects the relative
diffusion of two water molecules initially H bonded. The average lifetime of water-water HBs τHB is
thus directly linked to the diffusion coefficient of water molecules. The τHB strongly increase with the
concentration of sugars (see for example the inset of Fig. 4), in good agreement with the water
diffusion coefficients Dw shown in Fig. 3. This effect stems from the greater stability of carbohydrate-
water HBs compared to water-water HBs [20] and is well in line with the significant high frequency
shift of the second band of the water VDOS induced by sugars (Fig. 1 and Fig. 2), interpreted as a
strengthening of water HBs. To further characterize the strong slowing down of water HBs dynamics
induced by sugars, the corresponding activation energies Ea have been determined, assuming an

10
Arrhenius behavior of τHB in the range of temperatures considered (273-373 K). At low concentrations
(0-33 wt %), the Ea energies range between 3.4 and 3.8 kcal.mol-1, in good agreement with
experimental data for neat water [44,45] and for moderately concentrated carbohydrate solutions
[46,47,48]. At variance, the Ea energies significantly increase for disaccharide concentrations above
about 40 wt %, following the percolation of the sugars HBN [27]. In sharp contrast with the present
results, Di Fonzo et al. [49] found by means of Brillouin scattering experiments an activation energy
seemingly constant in trehalose/water mixtures over a broad concentration range (0-74 wt %).
However, the activation energies for water diffusion in maltose glasses (concentrations above 90 wt
%) were found to be about 15-17 kcal.mol-1 [50,51]. Therefore, the concentration dependence seen in
Fig. 4 seems realistic. Consistent with the calculated DW (Fig. 3), the water-water HBs activation
energy is found the highest in the trehalose solution at 66 wt %, even though the related large error
bars prevent any statistically meaningful comparison between the three sugars.
Fig. 4 Activation energy of water-water hydrogen bonds as a function of disaccharide
concentration in the different sugar/water solutions. The inset shows the temperature
dependence of water-water hydrogen bonds lifetimes ττττHB(w-w) in the different trehalose
solutions.
4 – Discussion
In agreement with other studies [15,20,21,22,25,39,46], the results reported here all reveal that
disaccharides induce a significant slowing down of water dynamics, which depends primarily on the
total number of HBs they form with water [15,22,25]. Indeed, several recent investigations clearly
11
showed a strong retardation of the dynamics of water molecules hydrating sugars [15,20,21,22], up to
distances of 5.5-6.5 Å for disaccharides (trehalose, sucrose, lactose), that is, beyond their first static
solvation layer. In particular, water-water HB lifetimes were found to increase by as much as 40 %
compared to the bulk in the vicinity of trehalose and lactose [15,21], because sugar-water HBs are
more stable than water-water HBs [20]. In line with those results, Paolantoni et al. identified two
relaxation processes for water in trehalose aqueous solutions, one assigned to bulk water, and the other
to sugar hydration water, characterized by relaxation times 5-6 times longer [22]. The present results
further underline the influence of the percolation of the HBN of sugars [27] on the average slowing
down of water dynamics, which steeply increases for concentrations above about 40 wt %. This
concentration corresponds approximately to the concentration threshold for which the mean cluster
size of H-bonded water molecules steeply decreases [28] and for which slight differences between the
respective influence of sugars on water start to appear [27,28]. At a concentration of 66 wt %,
trehalose seems to slow down more efficiently the diffusion of water molecules (Fig. 3) and to
increase to a larger extent the activation energies of water-water HBs (Fig. 4). This could be ascribed
to the ability of trehalose to form large clusters with itself while still interacting with more water
molecules than maltose and sucrose do [27]. This peculiar balance between sugar-sugar and sugar-
water interactions directly stems from the topology of trehalose, whose nearly symmetric
conformation [52] prevents extensive internal H-bonding between the two glucose rings. At variance,
sucrose, and to a lower extent maltose, form more frequently internal HBs that reduce their abilities
for intermolecular H-bonding [27]. Besides, the slowing down of water dynamics induced by sugars
could explain in part their stabilizing effect on proteins at high temperatures [23,24]. Given that they
are preferentially excluded from the surface of proteins in aqueous solutions [12,13,14], sugars may
strongly slow down protein dynamics by forming HBs with the protein hydration water molecules [14]
and then hinder the softening of protein vibrational modes that occurs upon denaturation [17]. In other
words, sugars would reduce the conformational entropy of proteins by making them less flexible [23],
particularly at high temperatures, and thus increase their thermal denaturation temperature Tm [23,24].
This suggested retardation of the dynamics of protein hydration water [15,16] is, however, probably
not the only bioprotective effect that sugars induce on proteins. For example, they may also sterically

12
hinder protein aggregation, a major cause of instability in solutions [53]. Consequently, this hypothesis
explains partially only how proteins may be stabilized by sugars in solution.
5 – Conclusion
The low-frequency VDOS of water and Raman susceptibilities of trehalose/D2O solutions indicate
that the local environments sampled by water molecules are strongly stiffened in presence of the three
studied disaccharides. As a consequence, water diffusion significantly slows down when the sugar
concentration increases, following an increase of water-water hydrogen bonds lifetimes and of the
associated activation energies. This induced retardation of water dynamics stems from the numerous
HBs that sugars form with water and is strongly amplified at concentrations above 40 wt % by the
percolation of the HBN of sugars [27]. Since sugars are known to be preferentially excluded from the
surface of globular proteins [12,13,14], their stabilizing effect at high temperatures may originate from
the dynamical slowing down of the protein hydration water [15,16].
Acknowledgements
The authors wish to acknowledge the use of the facilities of the IDRIS (Orsay, France) and the CRI
(Villeneuve d’Asq, France), where calculations were carried out. This work was supported by the
INTERREG III (FEDER) program (Nord-Pas de Calais/Kent) and by the ANR (Agence Nationale de
la Recherche) through the BIOSTAB project (“Physique-Chimie du Vivant” program). A.L. thanks the
Nord-Pas de Calais region for a postdoctoral fellowship.
References
[1] T. Furuki, K. Oku, M. Sakurai, Frontiers Biosci. 14 (2009) 3523.
[2] M. Sakurai, T. Furuki, K.-I. Akao, D. Tanaka, Y. Nakahara, T. Kikawada, M. Watanabe, T. Okuda, Proc.
Natl. Acad. Sci. U.S.A. 105 (2008) 5093.
[3] N. K. Jain, I. Roy, Prot. Sci. 18 (2009) 24.
[4] J. H. Crowe, J. F. Carpenter, L. M. Crowe, Ann. Rev. Physiol. 60 (1998) 73.
[5] W. Wang, Int. J. Pharm.203 (2000) 1.

13
[6] J. F. Carpenter, M. J. Pikal, B. S. Chang, T. W. Randolph, Pharm. Res. 14 (1997) 969.
[7] T. Arakawa, S. J. Prestrelski, W. C. Kenny, J. F. Carpenter, Adv. Drug Delivery Rev. 46 (2001) 307.
[8] J. L. Green, C. A. Angell, J. Phys. Chem. 93 (1989) 2880.
[9] C. Branca, S. Magazù, G. Maisano, P. Migliardo, J. Chem. Phys. 111 (1999) 281.
[10] P. S. Belton, A. M. Gil, Biopolymers 34 (1994) 957.
[11] F. Sussich, C. Skopec, J. Brady, A. Cesàro, Carbohydr. Res. 334 (2001) 165.
[12] S. N. Timasheff, Biochem. 41 (2002) 13473.
[13] G. Cottone, S. Giuffrida, G. Ciccotti, L. Cordone, Proteins: Struct., Funct., Bioinf. 59 (2005) 291.
[14] A. Lerbret, P. Bordat, F. Affouard, A. Hédoux, Y. Guinet, M. Descamps, J. Phys. Chem. B 111 (2007)
9410.
[15] M. Heyden, E. Bründermann, U. Heugen, G. Niehues, D. M. Leitner, M. Havenith, J. Am. Chem. Soc. 130
(2008) 5773.
[16] A. Lerbret, F. Affouard, P. Bordat, A. Hédoux, Y. Guinet, M. Descamps, Chem. Phys. 345 (2008) 267.
[17] A. Lerbret, F. Affouard, P. Bordat, A. Hédoux, Y. Guinet, M. Descamps, J. Chem. Phys. 131 (2009)
245103.
[18] C. Branca, S. Magazù, G. Maisano, F. Migliardo, P. Migliardo, G. Romeo, J. Phys. Chem. B 105 (2001)
10140.
[19] A. Lerbret, P. Bordat, F. Affouard, Y. Guinet, A. Hédoux, L. Paccou, D. Prévost, M. Descamps, Carbohydr.
Res. 340 (2005) 881.
[20] S. Lee, P. G. Debenedetti, J. R. Errington, J. Chem. Phys. 122 (2005) 204511.
[21] U. Heugen, G. Schwaab, E. Bründermann, M. Heyden, X. Yu, D. M. Leitner, M. Havenith, Proc. Natl.
Acad. Sci. U.S.A. 103 (2006) 12301.
[22] M. Paolantoni, L. Comez, M. E. Gallina, P. Sassi, F. Scarponi, D. Fioretto, A. Morresi, J. Phys. Chem. B
113 (2009) 7874-7878.
[23] A. Hédoux, J.-F. Willart, R. Ionov, F. Affouard, Y. Guinet, L. Paccou, A. Lerbret, M. Descamps, J. Phys.
Chem. B 110 (2006) 22886.
[24] J. K. Kaushik, R. Bhat, J. Biol. Chem. 278 (2003) 26458.
[25] S. Magazù, V. Villari, P. Migliardo, G. Maisano, M. T. F. Telling, J. Phys. Chem. B 105 (2001) 1851.
[26] T. Furuki, Carbohydr. Res. 337 (2002) 441.
[27] A. Lerbret, P. Bordat, F. Affouard, M. Descamps, F. Migliardo, J. Phys. Chem. B 109 (2005) 11046.
[28] P. Bordat, A. Lerbret, J.-P. Demaret, F. Affouard, M. Descamps, Europhys. Lett. 65 (2004) 41.
[29] W. Smith, T. R. Forester, J. Mol. Graph. 14 (1996) 136.

14
[30] H. J. C. Berendsen, J. R. Grigera, T. P. Straatsma, J. Phys. Chem. 91 (1987) 327.
[31] S. N. Ha, A. Giammona, M. Field, J. W. Brady, Carbohydr. Res. 180 (1988) 207.
[32] M. P. Allen, D. J. Tildesley, Computer Simulation of Liquids, Oxford Clarendon Press (1989), Oxford.
[33] H. J. C. Berendsen, J. P. M. Postma, W. F. van Gunsteren, A. DiNola, J. R. Haak, J. Chem. Phys. 81 (1984)
3684.
[34] A. P. Sokolov, A. Kisliuk, D. Quitmann, E. Duval, Phys. Rev. B 48 (1993) 7692.
[35] A. Idrissi, S. Longelin, F. Sokolic, J. Phys. Chem. B 105 (2001) 6004.
[36] J. A. Padró, J. Marti, J. Chem. Phys. 118 (2003) 452.
[37] G. E. Walrafen, M. R. Fisher, M. S. Hokmabadi, W.-H. Yang, J. Chem. Phys. 85 (1986) 6970.
[38] S. Perticaroli, P. Sassi, A. Moressi, M. Paolantoni, J. Raman Spectrosc. 39 (2008) 227.
[39] M. Rampp, C. Buttersack, H.-D. Lüdemann, Carbohydr. Res. 328 (2000) 561.
[40] A. Savitzky, M. J. E. Golay, Anal. Chem. 36 (1964) 1627.
[41] R. Mills, J. Phys. Chem. 77 (1973) 685.
[42] A. Luzar, D. Chandler, Nature 379 (1996) 55.
[43] Q. Liu, R. K. Schmidt, B. Teo, P. A. Karplus, J. W. Brady, J. Am. Chem. Soc. 119 (1997) 7851.
[44] J. Teixeira, M.-C. Bellissent-Funel, S. H. Chen, A. J. Dianoux, Phys. Rev. A 31 (1985) 1913.
[45] G. Monaco, A. Cunsolo, G. Ruocco, F. Sette, Phys. Rev. E 60 (1999) 5505.
[46] M. Paolantoni, P. Sassi, A. Morresi, S. Santini, J. Chem. Phys. 127 (2007) 024504.
[47] G. Lelong, W. S. Howells, J. W. Brady, C. Talón, D. L. Price, M.-L. Saboungi, J. Phys. Chem. B 113
(2009) 13079.
[48] C. Talon, L. J. Smith, J. W. Brady, B. A. Lewis, J. R. D. Copley, D. L. Price, M.-L. Saboungi, J. Phys.
Chem. B 108 (2004) 5120.
[49] S. Di Fonzo, C. Masciovecchio, F. Bencivenga, A. Gessini, D. Fioretto, L. Comez, A. Morresi, M. E.
Gallina, O. De Giacomo, A. Cesàro, J. Phys. Chem. A 111 (2007) 12577.
[50] R. H. Tromp, R. Parker, S. G. Ring, Carbohydr. Res. 303 (1997) 199.
[51] R. Parker, S. G. Ring, Carbohydr. Res. 273 (1995) 147.
[52] T. Taga, M. Senma, K. Osaki, Acta. Crystallograph., sect. B 28 (1972) 3258.
[53] W. Wang, Int. J. Pharm. 185 (1999) 129.