invitro & gcms of mazus (published,2012,molecules)
TRANSCRIPT

Molecules 2012, 17, 14275-14287; doi:10.3390/molecules171214275
molecules ISSN 1420-3049
www.mdpi.com/journal/molecules
Article
In Vitro Antimicrobial, Antioxidant, Cytotoxicity and GC-MS
Analysis of Mazus goodenifolius
Muhammad Riaz 1, Nasir Rasool
1,*, Iftikhar Hussain Bukhari
1, Muhammad Shahid
2,
Muhammad Zubair 1, Komal Rizwan
1 and Umer Rashid
3,*
1 Department of Chemistry, Government College University Faisalabad-38000, Pakistan;
E-Mails: [email protected] (M.R.); [email protected] (I.H.B.);
[email protected] (M.Z.); [email protected] (K.R.) 2 Department of Chemistry and Biochemistry, University of Agriculture, Faisalabad-38040, Pakistan;
E-Mail: [email protected] 3 Institute of Advanced Technology, Universiti Putra Malaysia, Serdang 43400, Selangor, Malaysia
* Authors to whom correspondence should be addressed; E-Mails: [email protected] (N.R.);
[email protected] (U.R.); Tel.: +92-332-749-1790 (N.R.); Fax: +92-41-920-1032 (N.R.);
Tel.: +60-38-946-7393 (U.R.); Fax: +60-38-946-7004 (U.R.).
Received: 15 June 2012; in revised form: 18 October 2012 / Accepted: 29 October 2012 /
Published: 3 December 2012
Abstract: The antimicrobial, antioxidant and cytotoxic properties of Mazus goodenifolius
(Hornem.) Pennell essential oil, methanol extract and some solvent-extracted subfractions
of the latter were appraised. A qualitative, quantitative analysis of the classes of
phytochemicals in the various fractions and GC-MS analysis of the essential oil was
carried out. The activity of the plant extract and various subfractions against selected
bacterial (Pasturella multocida, Escherichia coli, Bacillus subtilis and Staphylococcus
aureus) and fungal strains (Aspergillus niger, Aspergillus flavus, Alternaria alternata and
Rhizopus solani) was evaluated. The antioxidant activity was assayed using the DPPH
radical scavenging and % inhibition of linoleic acid peroxidation tests. In the DPPH radical
scavenging test the IC50 values ranged from 7.21 to 91.79 µg/mL, and in the latter the
range of % peroxidation inhibition was 35.42–93.48%. Protective effects of the absolute
methanol extract, which had the highest content of phenolics and flavonoids, against H2O2
induced oxidative damage in plasmid pBR322 DNA was also evaluated, and it was found
to offer some protection at the highest tested dose (1,000 µg/mL). Finally the cytotoxicity
of the plant extract, fractions and essential oil was analyzed by examining haemolytic
OPEN ACCESS

Molecules 2012, 17 14276
activity against human blood erythrocytes (RBCs), whereby the % lysis of RBCs was found
to be in the range of 1.65 to 4.01%.
Keywords: Mazus goodenifolius; antimicrobial; antioxidant; cytotoxicity; GC-MS
1. Introduction
Foods rich in natural antioxidants such as polyphenols, flavonoids are related to reduced risk of
incidence of cardiovascular and other chronic diseases and certain types of cancer, which has led to a
revival of interest in plant-based foods [1]. Conversely, food-borne diseases are major dilemma in the
third world and developing countries and even in developed nations [2], and the consumption of foods
contaminated with microorganisms represents a serious health risk to humans. Most of the antibiotics
existing today have a natural origin. Plants produce a variety of compounds to defend themselves from
microbial attacks [3], and natural products and related drugs were used to treat 87% of all categorized
human diseases, including bacterial infections, cancer and immunological disorders [4].
About eighty percent of the population in developing countries relies on traditional plant-based
medicines for their primary health care needs [5]. However, the majority of plants have not yet
undergone comprehensive chemical, pharmacological and toxicological studies to investigate their
bioactive compounds [6]. We have now studied the plant Mazus goodenifolius (Hornem.) Pennell
(family Scrophulariaceae) by GC-MS analysis and biological studies. According to our knowledge, to
date no literature has reported the antioxidant, antimicrobial and cytotoxic properties of Mazus
goodenifolius, although as per previous reports plants related to this genus were used as an aperients,
emmenagogue, febrifuge and tonic [7]. The juice of the plant Mazus pumilus is used in the treatment of
typhoid fever [8]. The leaves of some Mazus species plants are also edible.
2. Results and Discussions
2.1. Phytochemical Analysis
In the present study, efforts were made to qualitatively estimate the various medicinally active
constituents such as flavonoids, saponins, tannins, steroids, alkaloids and terpenoids present in
M. goodenifolius extract and its various fractions. These constituents were present in all the extracts
and fractions, with the exception of alkaloids, tannins and saponins which were absent in the n-hexane
fraction, whereas saponins and steroids were absent in the n-butanol fraction. Quantitative estimation
of phytochemicals was also carried out on dried whole plant. The findings showed that the highest
percentage of components corresponded to tannins (9.12 ± 0.07%) and the lowest yield was of
saponins (0.12 ± 0.01%). The percentages of other constituents were 1.44 ± 0.03 for alkaloids, 1.27 ± 0.02
for flavonoids, 0.15 ± 0.01 for terpenoids and 0.33 ± 0.02 for steroids, respectively.

Molecules 2012, 17 14277
2.2. GC-MS Analysis of Essential Oil
The % yield of M. goodenifolius essential oil was found to be 0.32%. The chemical compounds
identified by GC-MS analysis of the essential oil are presented in Table 1. The major compounds
determined in the essential oil were: thymol (15.16%), carveol (10.06%), linalool (9.96%), α-copaene
(9.61%), germacrene D (9.37%), 1,8-cineole (8.41%), β-pinene (6.43%) and γ-terpinene (5.46%),
respectively. Some other compounds found in different concentrations were: β-ocimene (3.82%),
carvacrol (2.73%), verbenone (2.67%), α-fenchone (2.62%), limonene (2.13%), α-pinene (1.79%) and
p-cymene (1.53%). From the activity results it was observed that the antioxidant and antimicrobial
activity of the M. goodenifolius essential oil was greater than that of the methanol extract and fractions.
Some studies have also shown that plant essential oils can have greater antimicrobial activity due to
the synergistic or additive effects of their components [9].
Table 1. Compounds identified in the essential oil of M. goodenifolius and their percentage area.
Compounds Retention Index (RI) Area percentage (%)
α-Thujene 933 0.33
α-Pinene 940 1.79
α-Fenchone 951 2.62
Camphene 953 0.48
β-Pinene 970 6.43
p-Cymene 1025 1.53
Limonene 1028 2.13
1,8-Cineole 1030 8.41
β-Phellandrene 1033 2.02
β-ocimene 1049 3.82
γ-Terpinene 1058 5.46
Linalool 1098 9.61
Carveol 1138 10.06
Verbenone 1204 2.67
Thymol 1291 15.16
2-Undecanone 1293 1.58
Carvacrol 1297 2.73
Geranic acid 1365 1.97
α-Copaene 1411 0.44
β-Caryophyllene 1417 9.96
α-Guaiene 1439 0.7
α-Humulene 1451 0.73
Germacrene D 1483 9.37
Mode of identification = RI and comparison of mass spectra.
2.3. Antimicrobial Activity
The antimicrobial activity of the M. goodenifolius extract, fractions and essential oil was tested
against selected microorganisms. The samples some exhibited antimicrobial activity against most of
the bacterial and fungal strains tested. The inhibition zone (IZ) was measured by the disc diffusion

Molecules 2012, 17 14278
method at 10 mg/mL (Table 2) and 20 mg/mL concentrations (Table 3), followed by measurement of
minimum inhibitory concentrations (MICs, Table 4).
Table 2. Antimicrobial activity in terms of inhibition zone (mm) of M. goodenifolius plant
extract, fractions at 10 mg/mL against selected bacterial and fungal strains.
Extract, fractions and essential oil
Abs. MeOH n-Butanol Chloroform Ethyl acetate n-Hexane Essential oil Standard †
Bacterial strains
E. coli 12.4 ± 0.11 c N.D. *g 9.4 ± 0.08 e 10.2 ± 0.09 d 8.2 ± 0.07 f 16.2 ± 0.15 b 28.3 ± 0.15 a
P. multocida 14.3 ± 0.12 c 8.2 ± 0.07 f 10.2 ± 0.09 e 13.2 ± 0.11 d N.D. g 19.5 ± 0.17 b 27.2 ± 0.21 a
S. aureus 16.7 ± 0.12 c N.D. e N.D. e 12.4 ± 0.09 d N.D. e 22.9 ± 0.17 b 30.1 ± 0.16 a
B. subtilis 13.2 ± 0.12 c 9.2 ± 0.07 e N.D. g 12.3 ± 0.09 d 8.2 ± 0.06 f 17.2 ± 0.14 b 29.2 ± 0.15 a
Fungal strains
A. flavus 10.2 ± 0.09 c 7.8 ± 0.06 f 8.7 ± 0.05 e 9.5 ± 0.11 d N.D. g 14.2 ± 0.12 b 22.5 ± 0.18 a
A. alternata 12.3 ± 0.11 c 8.8 ± 0.07 f N.D. g 11.3 ± 0.12 d 9.4 ± 0.08 e 16.2 ± 0.14 b 24.6 ± 0.23 a
R. solani 15.9 ± 0.12 c N.D. g 11.1 ± 0.13 e 12.2 ± 0.09 d 8.4 ± 0.07 f 18.5 ± 0.13 b 29.7 ± 0.21 a
A. niger 14.3 ± 0.13 c 8.6 ± 0.07 e N.D. g 11.4 ± 0.06 d 7.8 ± 0.05 f 17.9 ± 0.15 b 28.1 ± 0.26 a
* N.D. = Not detected. The values were the average of triplicate samples (n = 3) ± S.D. (p ≤ 0.05). The
superscript letters represent the significant differences as analyzed by ANOVA; † The standard was used at a
concentration of 1 mg/mL.
Table 3. Antimicrobial activity in terms of inhibition zone (mm) of M. goodenifolius plant
extract and fractions at 20 mg/mL against selected bacterial and fungal strains.
Extract, fractions and essential oil
Abs. MeOH n-Butanol Chloroform Ethyl acetate n-Hexane Essential oil Standard †
Bacterial strains
E. coli 25.1 ± 0.21 c 16.3 ± 0.21 f 19.2 ± 0.18 e 20.1 ± 0.15 d 15.2 ± 0.13 g 30.2 ± 0.27 a 28.3 ± 0.15 b
P. multocida 28.1 ± 0.21 c 15.2 ± 0.17 f 19.3 ± 0.14 e 26.2 ± 0.19 d 12.2 ± 0.10 g 32.2 ± 0.26 a 27.2 ± 0.21 b
S. aureus 31.7 ± 0.12 b 10.6 ± 0.08 d 14.1 ± 0.12 d 23.1 ± 0.29 c N.D. d 35.2 ± 0.19 a 30.1 ± 0.16 c
B. subtilis 25.4 ± 0.21 c 17.2 ± 0.16 e 15.7 ± 0.08 f 23.3 ± 0.17 d 11.2 ± 0.14 g 32.2 ± 0.26 a 29.2 ± 0.15 b
Fungal strains
A. flavus 19.0 ± 0.13 c 14.8 ± 0.11 f 17.2 ± 0.13 e 18.6 ± 0.14 d N.D. g 29.2 ± 0.27 a 22.5 ± 0.18 b
A. alternata 23.1 ± 0.21 c 15.6 ± 0.14 e 12.7 ± 0.07 f 20.3 ± 0.22 d 11.4 ± 0.17 g 30.4 ± 0.24 a 24.6 ± 0.23 b
R. solani 30.1 ± 0.23 b N.D. g 19.1 ± 0.21 e 22.3 ± 0.17 d 15.2 ± 0.16 f 32.4 ± 0.31 a 29.7 ± 0.21 c
A. niger 28.6 ± 0.21 b 14.6 ± 0.14 e N.D. g 20.2 ± 0.21 d 13.2 ± 0.12 f 31.8 ± 0.30 a 28.1 ± 0.26 c
* N.D. = Not detected. The values are the average of triplicate samples (n = 3) ± S.D. (p ≤ 0.05). The
superscript letters represent the significant differences as analyzed by ANOVA; † The standard was used at a
concentration of 1 mg/mL.
It was observed that some of the strains were resistant at 10 mg/mL, when the concentration was
increased to 20 mg/mL, inhibition zones also observed. Overall the results indicated that the the
M. goodenifolius essential oil and the absolute methanol extract showed comparatively better
inhibitory activity than the other analyzed fractions. The n-hexane fraction showed less/poor/no
activity against the various tested bacterial and fungal strains. The minimum inhibtory concentration
(MIC) also confirmed that the antimicrobial actibity of the essential oil was better than that of the

Molecules 2012, 17 14279
extract and fractions. The secondary metabolites identified during the phytochemical assay in the plant
are steroids, tannins, saponins, flavonoids, alkaloids and terpenoids. These compounds have been
variously reported to showed antimicrobial activity [10]. The better antimicrobial activity of the
essential oil was attributed to the presence of some of its major components thymol, carveol, linalool,
germacrene D, 1,8-cineole, β-pinene, γ-terpinene, β-ocimene, carvacrol, limonene, α-pinene and
p-cymene. Essential oils containing these major compounds have been reported to show antimicrobial
properties [11–13]. The synergistic or antagonistic activity between some components may affect the
observed antimicrobial activity of the essential oil [14], which exerts its toxic effects against
microorganisms through the disruption of bacterial and fungal membrane integrity [15].
Table 4. Antimicrobial activity in terms of minimum inhibitory concentration (MIC) in
µg/mL by M. goodenifolius plant against selected bacterial and fungal strains.
Extract, fractions and essential oil
Abs. MeOH n-Butanol Chloroform Ethyl acetate n-Hexane Essential oil Standard †
Bacterial strains
E. coli 1175.0 ± 9.2 e 3000.0 ± 15.4 a 2000.0 ± 14.1 c 1250.0 ± 8.5 d 2500.0 ± 16.7 b 187.0 ± 1.49 f 75.0 ± 0.29 g
P. multocida 875.0 ± 6.7 e 1750.0 ± 10.7 b 1500.0 ± 2.8 c 1150.0 ± 11.4 d 2000.0 ± 11.9 a 156.0 ± 1.4 f 125.0 ± 1.2 g
S. aureus 750.0 ± 6.9 d 2500.0 ± 9.2 a 1500.0 ± 7.2 b 1000.0 ± 8.2 c N.D. g 62.0 ± 0.53 e 25 ± 0.13 f
B. subtilis 1000.0 ± 8.4 d 1500.0 ± 10.8 c 2000.0 ± 12.1 a 1250.0 ± 11.4 d 1750.0 ± 18.2 b 78.0 ± 0.62 f 62.5 ± 0.59 g
Fungal strains
A. flavus 1750.0 ± 17.2 d 3000.0 ± 15.2 a 2500.0 ± 16.4 b 2000.0 ± 16.8 c N.D. g 125.0 ± 1.14 e 100.0 ± 1.04 f
A. alternata 1250.0 ± 13.7 e 2500.0 ± 12.4 b 3000.0 ± 16.6 a 1500.0 ± 19.2 d 1750.0 ± 21.4 c 93.5 ± 0.84 f 62.5 ± 0.54 g
R. solani 1150.0 ± 10.4 d N.D. g 1500.0 ± 11.6 b 1250.0 ± 13.7 c 1750.0 ± 14.3 a 25.0 ± 0.22 e 15.5 ± 0.12 f
A. niger 1750.0 ± 12.4 d 2250.0 ± 15.6 b N.D. g 2000.0 ± 14.2 c 3000.0 ± 17.6 a 78.0 ± 0.68 e 50.0 ± 0.48 f
* N.D. = Not detected. The values are the average of triplicate samples (n = 3) ± S.D. (p ≤ 0.05). The
superscript letters represent the significant differences as analyzed by ANOVA; †Ciprofloxacin and fungone
were used as reference standards for bacterial and fungal strains, respectively.
2.4. Antioxidant Activity
The antioxidant activity of plant extract, fractions and essential oil was determined. The plant showed
% inhibition of linoleic acid peroxidation values ranging from 35.44 to 93.48. The % inhibition of
peroxidation for the essential oil, absolute methanol extract, ethyl acetate, n-butanol, chloroform,
n-hexane fractions was 93.48 ± 0.82, 72.35 ± 0.68, 58.21 ± 0.14, 51.62 ± 0.52, 42.81 ± 0.34 and
35.44 ± 0.29%, respectively (Figure 1). The highest % inhibition in linoleic acid peroxidation was thus
observed in the essential oil.
The DPPH radical, which has a deep violet color, reacts with hydrogen donor species such as
phenolics, flavonoids and upon receiving a proton loses its color and becomes yellow. The IC50 values
for essential oil, absolute methanol, ethyl acetate, n-butanol, chloroform and n-hexane extract were:
7.21 ± 0.06, 9.96 ± 0.08, 18.23 ± 0.12, 31.01 ± 0.29, 41.18 ± 0.32, 57.16 ± 0.42 and 91.79 ± 0.89 µg/mL,
respectively. The smaller value of IC50 represents a better antioxidant activity.
Derwich and coworkers previously reported that 1,8-cineole, germacrene, limonene, pulegone
β-pinene and α-pinene are all good antioxidants [16]. Thymol also behaves as an antioxidant [17]. As

Molecules 2012, 17 14280
per earlier reports it was observed that the presence of chemical constituents such as linalool, β-pinene
and α-pinene in essential oil also resulted in antioxidant and antimicrobial properties [11,12].
Figure 1. Antioxidant activity of M. goodenifolius extract, fractions and essential oil by %
inhibition of linoleic acid and IC50 by DPPH scavenging assay.
The reducing power of M. goodenifolius plant extract, fractions and essential oil is shown in Figure 2.
The reducing power of the phytoconstituents is associated with their antioxidant potential [18]. The
reducing power of the extracts increased in a concentration-dependent manner [19]. Therefore reducing
power evaluation might be taken as important parameter for the assessment of antioxidant activity.
Figure 2. Reducing power of extract, fractions and essential oil of M. goodenifolius.
2.5. Antioxidant Activity by DNA Protection Assay
The antioxidant activity of different concentrations of M. goodenifolius absolute methanol extract in
the protection of plasmid pBR322 DNA from H2O2 induced damage is shown in Figure 3. From the
figure it was clear that in the first lane the plasmid pBR322 DNA present without any treatment might
be in super coiled form. When comparing the results of the second lane with the other lanes, which
contain pBR322 DNA that was exposed to H2O2, that caused damage in plasmid pBR322 DNA, in the
second lane the damage to the DNA strand, which occured due to conversion of the super coiled form
of pBR322 DNA into an open linear form, leaving behind the untreated DNA (first lane) can be seen.
In the fourth to sixth lane 10 to 1,000 µg/mL of the plant absolute methanol extract was added in
pBR322 DNA to observe their protective effects. The results in Figure 3, when compared with each
other, show the protective effects of the absolute methanol extract at a concentration of 1,000 µg/mL

Molecules 2012, 17 14281
(sixth lane) which displays a band almost equal to the pure pBR322DNA (first lane). The absolute
methanol extract at a concentration of 10 µg/mL (fourth lane) showed less protective effect on DNA
and the band in this lane was similar to the damaged DNA (second lane treated with H2O2).
Figure 3. DNA protection effect by absolute methanol extract with H2O2 induced oxidative
damage on pBR322 DNA.
Lane 1 = Plasmid pBR322 DNA without treatment (super coiled); Lane 2 = Plasmid pBR322 DNA treated
with H2O2 (open circular or damaged); Lane 3 = 1 kbp DNA ladder; Lane 4 = Plasmid pBR322 DNA treated
with 10 µg/mL absolute methanol extract + H2O2; Lane 5 = Plasmid pBR322 DNA treated with 100 µg/mL
absolute methanol extract + H2O2; Lane 6 = Plasmid pBR322 DNA treated with 1,000 µg/mL absolute methanol
extract + H2O2.
The plant extract at 1,000 µg/mL protected the DNA, perhaps by scavenging the oxidation products
that damage the DNA and this did not allowed the H2O2 to open the coiled DNA so it remained in
protected form. The protective effect by absolute methanol extract could be due to the higher
concentration of phenolics, flavonoids and the antioxidant activity that scavenges the free radicals and
oxidation products.
2.6. Cytotoxicity Studies by Haemolytic Activity
The cytotoxicity was studied by examining haemolytic activity against human red blood cells
(RBCs) using Triton X-100 as positive control. The percentage lysis evaluated by comparing the
absorbance of sample and the Triton X-100. The positive control showed about 100% lysis, whereas
the phosphate buffer saline (PBS) showed no lysis of RBCs.
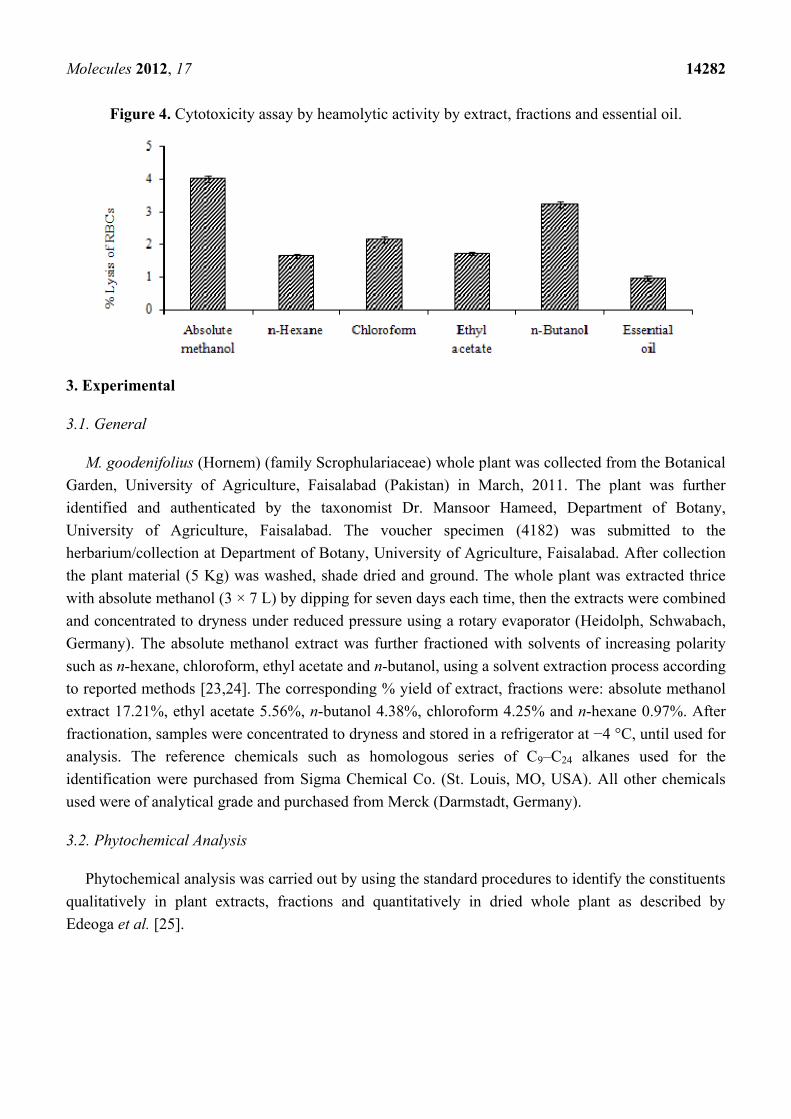
When the effects of extract, fractions and essential oil of the plant were compared with the controls,
different % lysis of RBCs caused by plant samples was observed, such as absolute methanol extract
(4.01 ± 0.03), n-butanol (3.24 ± 0.03), chloroform (2.15 ± 0.02), ethyl acetate (1.73 ± 0.02) and
n-hexane (1.65 ± 0.01) fractions, essential oil (0.96 ± 0.01), respectively (Figure 4). The mechanical
stability of the membrane of red blood cells (RBCs) is a good indicator to evaluate in vitro the effects
of various compounds when screening for cytotoxicity [20,21]. Treating cells with a cytotoxic
compound can cause different problems to human beings. The cells may undergo a loss of membrane
integrity and die rapidly as a result of cell lysis [22].
1 2 3 4 5 6
Molecules 2012, 17 14282
Figure 4. Cytotoxicity assay by heamolytic activity by extract, fractions and essential oil.
3. Experimental
3.1. General
M. goodenifolius (Hornem) (family Scrophulariaceae) whole plant was collected from the Botanical
Garden, University of Agriculture, Faisalabad (Pakistan) in March, 2011. The plant was further
identified and authenticated by the taxonomist Dr. Mansoor Hameed, Department of Botany,
University of Agriculture, Faisalabad. The voucher specimen (4182) was submitted to the
herbarium/collection at Department of Botany, University of Agriculture, Faisalabad. After collection
the plant material (5 Kg) was washed, shade dried and ground. The whole plant was extracted thrice
with absolute methanol (3 × 7 L) by dipping for seven days each time, then the extracts were combined
and concentrated to dryness under reduced pressure using a rotary evaporator (Heidolph, Schwabach,
Germany). The absolute methanol extract was further fractioned with solvents of increasing polarity
such as n-hexane, chloroform, ethyl acetate and n-butanol, using a solvent extraction process according
to reported methods [23,24]. The corresponding % yield of extract, fractions were: absolute methanol
extract 17.21%, ethyl acetate 5.56%, n-butanol 4.38%, chloroform 4.25% and n-hexane 0.97%. After
fractionation, samples were concentrated to dryness and stored in a refrigerator at −4 °C, until used for
analysis. The reference chemicals such as homologous series of C9–C24 alkanes used for the
identification were purchased from Sigma Chemical Co. (St. Louis, MO, USA). All other chemicals
used were of analytical grade and purchased from Merck (Darmstadt, Germany).
3.2. Phytochemical Analysis
Phytochemical analysis was carried out by using the standard procedures to identify the constituents
qualitatively in plant extracts, fractions and quantitatively in dried whole plant as described by
Edeoga et al. [25].

Molecules 2012, 17 14283
3.3. Isolation of Essential Oil
The dried and ground whole plant (500 g) was hydro-distilled for four hours using a Clevenger-type
apparatus as described earlier [11,12]. The percentage yield of essential oil was found to be 0.32%.
The essential oil was collected and dried over anhydrous sodium sulfate, filtered and stored at 4 °C
until analyzed.
3.4. GC-MS Analysis of Essential Oil
The sample was analyzed using a GC 6850 network GC system equipped with a 7683B series auto
injector and 5973 inert mass selective detector (Agilent Technologies, Willmington, DE, USA).
Compounds were separated on an HP-5 MS capillary column with a 5% phenyl polysiloxane
stationary phase (30.0 m × 0.25 mm, film thickness 0.25 μm). Oven temperature was programmed in a
three step gradient: initial temp set at 45 °C (held for 5 min), ramped till 150 °C at 10 °C/min,
followed by a 5 °C/min rise till 280 °C and finally at 15 °C/min to 325 °C where it was held for 5 min.
Helium gas flow rate was 1.1 mL/min (pressure 60 KPa and linear velocity 38.2 cm/sec).
Ions/fragments were monitored in scanning mode through 40–550 m/z.
3.5. Identification of Compounds
The identification of the components was based on comparison of their retention index (RI), relative
to a standard alkane series (C9–C24). The compounds were further indentified and authenticated using
their MS data by comparison with those of the NIST 05 Mass Spectral Library and published mass
spectra [26]. The quantitative data were obtained electronically from the FID area percentage without
the use of any correction factors.
3.6. Antimicrobial Activity
In order to evaluate the antimicrobial activity of plant extract, fractions and essential oil at different
concentrations of 10 and 20 mg/mL against selected bacterial strains such as Pasturella multocida,
Escherichia coli, Bacillus subtilis and Staphylococcus aureus and the fungal strains Aspergillus niger,
Aspergillus flavus, Alternaria alternata and Rhizopus solani the disc diffusion method as described by
the CLSI was used [27]. Minimum inhibitory concentrations (MIC) were calculated by a modification
of the reported method of Sarker et al. [3]. For the evaluation of minimum inhibitory concentrations
(MIC), different concentrations of plant extract, fractions and essential oil were prepared by serial
dilution. The range of dilution was determined by keeping in mind the antimicrobial activity
determined in the inhibition zone assay. For the samples showing better activity in the first assay the
serial dilution for MIC determination was carried out at less concentration and for the samples
showing less activity the higher concentration was used for serial dilution. Ciprofloxacin and fungone
at 1,000 µg/mL were used as reference standards for the bacterial and fungal strains, respectively.

Molecules 2012, 17 14284
3.7. Antioxidant Activity
3.7.1. DPPH free Radical Scavenging Assay
For the determination of IC50 values by the DPPH free radical scavenging assay method described by
Iqbal et al. [28] with some modification was used. The IC50 values were calculated from the plot of the
regression equation against percentage scavenging and concentrations of samples used. Three
replicates were recorded for each sample. The percentage scavenging by DPPH was calculated from
the following equation:
Scavenging (%) = [(Ablank − Asample) / Ablank] × 100
where A is the absorbance.
3.7.2. Percentage Inhibition of Linoleic Acid Oxidation
The antioxidant activity of extract, fractions and essential oil was also calculated in terms of
percentage inhibition of oxidation in the linoleic acid system using a method with some modification
described by Iqbal et al. [28]. A sample that contained no antioxidant component was used as a blank.
Percentage inhibition of linoleic acid oxidation was determined by the following equation:
Inhibition (%) = [100 − (A increase of sample at 360 h/A increase of control at 360 h) × 100]
where A is the absorbance.
3.7.3. Determination of Reducing Power
The reducing power of the extract, fractions and essential oil was determined according to the
procedure described by Yen et al. [29]. Plant extract, fractions and essential oil samples containing
2.5–10.0 mg/mL of dry matter was mixed with sodium phosphate buffer (5.0 mL, 0.2 M, pH 6.6) and
potassium ferricyanide (5.0 mL, 1.0%); the mixture was incubated at 50 °C for 20 min, then 10%
trichloroacetic acid (5 mL) was added, and the mixture was centrifuged at 980 × g for 10 min at 5 °C
in a refrigerated centrifuge. The upper layer of the solution (5.0 mL) was diluted with distilled water
(5.0 mL), 0.1% ferric chloride (1 mL) was added and the absorbance at 700 nm noted.
3.7.4. Antioxidant Activity by DNA Protection Assay
To evaluate the antioxidant activity of the the absolute methanol extract by the DNA protection
assay the method described by Kalpana et al. was used [30]. pBR 322 DNA (0.5 µg/µL) was diluted
up to two-fold (0.5 µg/3 µL) using 50 mM pH 7.4 sodium phosphate buffer. The diluted pBR 322
DNA (3 µL) was treated with test sample (5 µL). After this 30% H2O2 (4 µL) was added in the
presence and absence of different concentrations of M. goodenifolius extracts and its fractions. The
volume was made up to 15 µL with sodium phosphate buffer (pH 7.4). Samples of absolute methanol
extract of different concentrations (1,000, 100 and 10 mg/L) were used. The relative difference in
migration between the native and oxidized DNA was then examined on 1% agarose by horizontal
DNA gel electrophoresis using a Bio-Rad wide mini system (Techview, Singapore). The gels were
documented by a Syngene model Gene Genius unit (Syngene, Cambridge, UK).

Molecules 2012, 17 14285
3.8. Cytotoxicity Studies
The cytotoxicity was determined by testing the haemolytic activity of the plant extract, fractions
and essential oil using the method with some modification described by Powell et al. [20]. Plant
extracts at a concentration of 1 mg/mL in 10% DMSO were prepared. Three mL of freshly obtained
human blood was placed in heparinized tubes to avoid coagulation, gently mixed and poured into a
sterile 15 mL Falcon tube and centrifuged for 5 min at 850 × g. The supernatant was poured off and
RBCs were washed three times with chilled (4 °C) sterile isotonic phosphate buffer saline (PBS)
solution (5 mL), adjusted to pH 7.4. The washed RBCs were suspended in chilled PBS (20 mL).
Erythrocytes were counted on a heamacytometer. The RBCs count was maintained to 7.068 × 10⁸ cell
per mL for each assay. The plant extract, fractions and essential oil (20 µL) were taken in 2 mL
Eppendorf tubes, then diluted blood cell suspension (180 µL) was added. The samples were incubated
for 35 min at 37 °C. After incubation and agitation for 10 min, the tubes were placed on ice for 5 min
and centrifuged for 5 min at 1,310 × g. After centrifugation supernatant (100 µL) was taken from the
tubes, and diluted with chilled PBS (900 µL). All Eppendorfs were maintained on ice after dilution.
After this mixture from each Eppendorf (200 µL) was added into 96 well plates. For each assay, 0.1%
Triton X-100 was taken as a positive control and phosphate buffer saline (PBS) as a negative control.
The absorbance was noted at 576 nm with a BioTek, µ CuantTM
instrument (BioTek, Winooski,
VT, USA).
3.9. Statistical Analysis
All the experiments were conducted in triplicate unless stated otherwise stated and statistical
analysis of the data was performed by analysis of variance, using the STATISTICA 5.5 (Stat Soft Inc,
Tulsa, OK, USA) software. A probability value of difference p ≤ 0.05 was considered to denote a
statistically significance. All data were presented as mean values ± standard deviation (SD).
4. Conclusions
From the results it was concluded that the essential oil of M. goodenifolius has comparatively
greater antioxidant and antimicrobial activity than the absolute methanol extract and fractions. The
GC-MS profiling showed that the essential oil has some phytoconstituents which may be responsible
for the antioxidant and antimicrobial activity. DPPH scavenging and % inhibition linoleic acid
peroxidation assays were performed. The protective effect of the absolute methanol extract against
H2O2 induced oxidative damage in plasmid pBR322 DNA was also evaluated and it was found that it
protected the DNA, probably due to its antioxidant activity. The cytotoxicity of plant extract, fractions
and essential oil were assayed using in vitro haemolytic activity against human blood erythrocytes
(RBCs) and it was observed that the plant shows minor cytotoxicity as compared to the positive control.
Supplementary Materials
Supplementary materials can be accessed at: http://www.mdpi.com/1420-3049/17/12/14275/s1.

Molecules 2012, 17 14286
Acknowledgements
Authors are highly thankfull to the Higher Education Commission Islamabad, Pakistan for
providing funds (HEC Indigenous Scholarship) for the purchase of chemicals and other
research-related materials.
References
1. Choi, Y.; Jeong, H.S.; Lee, J. Antioxidant activity of methanolic extracts from some grains
consumed in Korea. Food Chem. 2007, 103, 130–138.
2. Sokmen, M.; Serkedjieva, J.; Daferera, D.; Gulluce, M.; Polissiou, M.; Tepe, B. In vitro antioxidant,
antimicrobial, and antiviral activities of the essential oil and various extracts from herbal parts and
callus cultures of Origanum acutidens. J. Agric. Food Chem. 2004, 52, 3309–3312.
3. Sarker, S.D.; Nahar, L.; Kumarasamy, Y. Microtitre plate based antibacterial assay incorporating
resazuriun as an indicator of cell growth, and its application in the in vitro antibacterial screening
of phytochemicals. Methods 2007, 42, 321–324.
4. Newman, D.J.; Cragg, G.M. Natural products as sources of new drugs over the last 25 years.
J. Nat. Prod. 2007, 70, 461–77.
5. Food and Agriculture Organization. Trade in Medicinal Plants, 1st ed.; Food and Agriculture
Organization (FAO) United Nations: Rome, Italy, 2004; pp. 1–64.
6. Ghani, A. Medicinal plants of Bangladesh with Chemical Constituents and Uses, 1st ed.;
Asiatic Society of Bangladesh: Dhaka, Bangladesh, 2003; pp. 1–10.
7. Duke, J.A.; Ayensu, E.S. Medicinal Plants of China; Reference Publications, Inc.: Clair River
Aglonac, MI, USA, 1985.
8. Kunkel, G. Plants for Human Consumption; Koeltz Scientific Books: Koenigstein, Germany, 1984.
9. Miraliakbari, H.; Shahidi, F. Antioxidant activity of minor components of tree nut oils.
Food Chem. 2008, 111, 421–427.
10. Field, J.A.; Lettinga, G. Toxicity of tannic compounds to microorganisms. Plants polyphenols:
Synthesis, properties, significance. Basic Life Sci. 1992, 59, 673–692.
11. Hanif, M.A.; Al-maskari, M.Y.; Al-maskari, A.; Al-shukaili, A.; Al-maskari, A.Y.;
Al-sabahi, J.N. Essential oil composition, antimicrobial and antioxidant activities of unexplored
Omani basil. J. Med. Plants Res. 2011, 5, 751–757.
12. Hussain, A.I.; Anwar, F.; Tufail, S.; Sherazi, H.; Przybylski, R. Chemical composition,
antioxidant and antimicrobial activities of basil (Ocimum basilicum) essential oils depends on
seasonal variations. Food Chem. 2008, 108, 986–995.
13. Bakkali, F.; Averbeck, S.; Averbeck, D.; Idaomar, M. Biological effects of essential oils—
A review. Food Chem. Toxicol. 2008, 46, 446–475.
14. Giweli, A.; Dzamic, A.M.; Sokovic, M.; Ristic, M.S.; Marin, P.D. Antimicrobial and antioxidant
activities of essential oils of Satureja thymbra growing wild in Libya. Molecules 2012, 17,
4836–4850.
15. Knoblock, K.; Pauli, A.; Lberl, B.; Weis, N.; Weigand, H. Antibacterial activity and antifungal
properties of essential oil components. J. Essent. Oil Res. 1988, 1, 119–128.

Molecules 2012, 17 14287
16. Derwich, E.; Benziane, Z.; Chabir, R.; Taouil, R. Characterization of volatiles and evaluation of
antioxidant activity of the flower essential oils of Myrtus communis L. from Morocco. Int. J. Curr.
Pharma. Res. 2011, 3, 17–23.
17. Undeger, U.; Basaran, A.; Degen, G.H.S.; Basaran, N. Antioxidant activities of major thyme
ingredients and lack of (oxidative) DNA damage in V79 Chinese hamster lung fibroblast cells at
low levels of carvacrol and thymol. Food Chem. Toxicol. 2009, 47, 2037–2043.
18. Siddhuraju, P.; Becker, K. Antioxidant properties of various extracts of total phenolic constituents
from three different agro climatic origins of drumstick tree (Moringa oleifera Lam.) leaves.
J. Agric. Food Chem. 2003, 51, 2144–2155.
19. Zhang, Y.; Yang, L.; Zu, Y.; Chen, X.; Wang, F.; Liu, F. Oxidative stability of sunflower oil by
carnosic acid compared with synthetic antioxidants during accelerated storage. Food Chem. 2010,
118, 656–662.
20. Powell, W.A.; Catranis, C.M.; Maynard, C.A. Design of self-processing antimicrobial peptides for
plant protection. Lett. Appl. Microbiol. 2000, 31, 163–168.
21. Sharma, P.; Sharma, J.D. In vitro hemolysis of human erythrocytes by plant extracts with
antiplasmodial activity. J. Ethnopharmacol. 2001, 74, 239–243.
22. Baillie, J.K.; Thompson, A.A.R.; Irving, J.B.; Bates, M.G.D.; Sutherland, A.I.; Macnee, W.;
Maxwell, S.R.J.; Webb, D.J. Oral antioxidant supplementation does not prevent acute mountain
sickness: double blind, randomized placebo-controlled trial. QJM-Int. J. Med. 2009, 102, 341–348.
23. Tiwari, P.; Kumar, B.; Kaur, M.; Kaur, G.; Kaur, H. Phytochemical screening and extraction:
A Review. Int. Pharm. Sci. 2011, 1, 98–106.
24. Zubair, M.; Rizwan, K.; Rasool, N.; Afshan, N.; Shahid, M. Antimicrobial potential of various
extract and fractions of leaves of Solanum nigrum. Int. J. Phytomed. 2011, 3, 63–67.
25. Edeoga, H.O.; Okwu, D.E.; Mbaebie, B.O. Phytochemical constituents of some Nigerian
medicinal plants. J. Biotechnol. 2005, 4, 685–688.
26. Adams, R.P. Identification of Essential Oil Components by Gas Chromatography/Mass
Spectroscopy, 3rd ed.; Allured Publishing Corporation: Carol Stream, IL, USA, 2001; pp. 1–804.
27. CLSI, Clinical and Laboratory Standards Institute Performance Standards for Antimicrobial
Susceptibility Testing, M100-S11, 18th ed.; Clinical and Laboratory Standards Institute: Wayne,
PA, USA, 2008; pp. 1–50.
28. Iqbal, S.; Bhanger, M.I.; Anwar, F. Antioxidant properties and components of some commercially
available varieties of rice bran in Pakistan. Food Chem. 2005, 93, 265–272.
29. Yen, G.C.; Duh, P.D.; Chuang, D.Y. Antioxidant activity of anthraquinones and anthrone.
Food Chem. 2000, 70, 437–441.
30. Kalpana, K.B.; Srinivasan, M.; Menon, V.P. Evaluation of antioxidant activity of hesperidin and
its protective effect on H2O2 induced oxidative damage on pBR322 DNA and RBC cellular
membrane. Mol. Cell Biochem. 2009, 314, 95–103.
Sample Availability: Samples of the plant extrat, fractions and essential oil are available from the authors.
© 2012 by the authors; licensee MDPI, Basel, Switzerland. This article is an open access article
distributed under the terms and conditions of the Creative Commons Attribution license
(http://creativecommons.org/licenses/by/3.0/).