published online
TRANSCRIPT

1
ENHANCING THE EFFECTIVENESS OF HYDRO GENERATOR HEAT EXCHANGERS THROUGH THE CONTROL OF MEASUREMENT UNCERTAINTIES
* M.N. Frota1, J.D. Hernández-Vásquez2, E.R. Castro-Pacheco1, S.B. Germano1 and J.T. Barreto Jr3 1 Postgraduate Program in Metrology, Metrology for Quality and Innovation. Pontifical Catholic University of
Rio de Janeiro, Rio de Janeiro, 22541-900, Brazil 2 Faculty of Mechanical, Electronic and Biomedical Engineering (FIMEB). Mechanical Engineering Program.
Research Group GIFOURIER. Universidad Antonio Nariño. Puerto Colombia, Colombia. 3 Light Energia (Coordination of the R&D Regulated Program), Rio de Janeiro, RJ/Brazil
ABSTRACT
The paper proposes a real-time analysis scheme to identify the main sources of measurement uncertainties that impact the calculation of the effectiveness and of the fouling scale level of hydrogenerators heat exchangers, aiming at increasing the productivity of the power plant cooling system as a whole. The traditional off-line cleaning process, still often used to unclog the exchanger tubes, was appraised after 121 days of normal routine operation of the hydroelectric power plant. Real time data, replicated at every 10 minutes along the overall monitoring period, produced a reliable and substantial mass of data used to validate the proposed computational scheme conceived to assess the overall thermal and hydrodynamic performance of the hydrogenerator cooling system. Among the physical quantities monitored through real time measurements, the air outlet temperature (the exchanger hot fluid, measured within the complex flow around the pipe bundles) proved to be the most critical measurement variable, whose associated uncertainty accounts for 92% of the overall expanded uncertainty, calculated from propagation of the individual contribution of each source. The study shows that the classical thermal energy balance across the boundary of the exchanger fails to correlate the mass flow rate of the exchanger working fluids, biased by high uncertainties associated with critical measurements required to assess the exchanger effectiveness. Results of the experimental study case performed confirmed that the off-line cleaning intervention implemented at the 91st day of operation of the hydrogenerator produced an increase of 13.3 % in the exchanger effectiveness and a correspondent decrease of 28% in the fouling factor. *Corresponding author: Prof. Maurício Nogueira Frota, PhD ([email protected])
INTRODUCTION Heat exchangers play an important role in the
cooling process of hydrogenerators. Water pumped from the turbine discharge channel, often used as the
cooling fluid of the heat exchangers, may cause undesirable obstruction of the inner passages of the exchanger as, usually, it carries inorganic/organic materials, yielding the formation of fouling/biofouling. Overall, heat transfer is quite sensitive to biofilm formation. Deposit of scales drastically damage the thermal effectiveness and the hydrodynamic performance of the exchanger, compromising the efficiency of the generator and severely increasing the pumping power required to circulate the exchanger working fluids.
Conventional periodic maintenance shutdowns required for cleaning hydrogenerator heat exchangers reduce power generation productivity, causing severe financial losses due to equipment unavailability. A variety of cleaning techniques to restore heat exchanger efficiency are discussed in the literature [1]. Alternative techniques for cleaning industrial and off-shore heat exchangers use a variety of engineering concepts, techniques and state of the art technologies [2]. The complex phenomenon of fouling and biofouling formation and surface modification is attentively discussed in the literature [3-5]; Chemical cleaning [1, 3]; Magnetic cleaning [6, 7]; Electronic cleaning [8-15]). Exploring new theoretical and practical approaches to address challenges associated with fouling of heat exchangers, a bi-annual conference (Heat exchangers fouling and cleaning conference), organized by the Heat Transfer Research, Inc. (HTRI) became a prominent international forum to facilitate innovative thinking on the complex mechanisms associated with fouling formation, which, so drastically, compromises heat transfer surfaces. Their Conference Proceedings are certainly a valuable source of relevant publications in the field [17-18].
Considering that the conventional off-line cleaning procedure still constitutes the current practice to unclog exchangers, the paper discusses the disadvantages and economic drawbacks inherent to this cleaning approach. Grounded on an uncertainty analysis focused on the measurement data acquainted,
Heat Exchanger Fouling and Cleaning – 2019
ISBN: 978-0-9984188-1-0; Published online www.heatexchanger-fouling.com

2
it became possible to assess the contribution of each individual measurement uncertainty which truthfully impact computation of the exchanger effectiveness.
HEAT EXCHANGERS: BASIC CONCEPTS This section focusses on the theoretical
framework that underlies the heat transfer mechanisms taking place in tubular water-to-air heat exchangers used to cool the head of the hydrogenerator installed in the power plant studied. For the current situation, water (the cold fluid, pumped inside tubes) exchanges heat with the air (hot fluid, forced externally to the tubes, in cross-current flow), integrating the hydrogenerator cooling system.
Exchanger Effectiveness The thermal performance of the exchanger can be
assessed by its effectiveness ε, defined as the ratio of the actual amount of heat exchanged between both working fluids to the maximum possible amount of heat that could be transferred under ideal conditions; i.e.: in a counter flow heat exchanger of infinite heat transfer area [19]. In terms of heat transfer rate, the effectiveness (ε) can be expressed by Equation (1):
𝜀 =𝑞$%&'$(𝑞)$*
0 ≤ 𝜀 < 1 (1)
If the output temperatures of the working fluids are unknown, the effectiveness of the exchanger can, conveniently, be assessed through the 𝑁𝑇𝑈 approach (Number of heat Transfer Units), expressed by Equation (2) proposed by Kays & London [19]:
𝜀 = 𝑓(𝑁𝑇𝑈,𝐶)78𝐶)$*
, 𝑓𝑙𝑜𝑤𝑎𝑟𝑟𝑎𝑛𝑔𝑒𝑚𝑒𝑛𝑡) (2)
The 𝑁𝑇𝑈value —a measure of the “heat transfer size of the exchanger”— is a dimensionless parameter defined in Equation (3) by the ratio between the product 𝐴𝑈$E∗ (the total heat transfer area of the exchanger multiplied by the average overall heat conductance, also known as heat transfer coefficient) and the minimum value of the heat capacity rate C of the working fluids (𝐶)G8 = ��)78𝑐J).
𝑁𝑇𝑈 =𝐴𝑈$E∗
𝐶)78=
1𝐶)78
K 𝑈$E∗ 𝑑𝐴M
N (3)
However, if the inlet (𝑇O,78and𝑇$,78) and outlet (𝑇O,S'&and𝑇$,S'&)temperatures of the working fluids (water and air) and one of their mass flow rate (say, ��O) can be independently measured, then the effectiveness of the exchanger can be directly assessed through Equation (1), where 𝑞$%&'$( can be calculated from the energy balance, either from the cold (water) or the hot (air) side of the exchanger, depending which mass flow rate is measured, as expressed by the following governing equations:
𝑞$%&'$( = 𝑞O = ��O𝑐J,OT𝑇O,S'& −𝑇O,78V = 𝑞$ = ��$𝑐J,$T𝑇$,78 − 𝑇$,S'&V
(4)
Similarly, 𝑞)$* is given by Equation (5), hypothetically considering that the lowest thermal capacity fluid (𝐶)78) would be exposed to the extreme temperatures T𝑇$,78 − 𝑇O,78V present in the flow, i.e.: 𝑞)$* = 𝐶)78T𝑇W,78 − 𝑇%,78V (5)
Algebraic manipulation of equations (4) allows to express the difficult to be measured air mass flow rate (complex flow around the pipe bundles) as a function of the water mass flow rate. In the sequence, replacing Equations (4) and (5) into Equation (1) one obtains Equation (6), hence outlining a convenient alternative for calculating the effectiveness of the exchanger, simply in terms of three working fluid temperatures.
𝜀 =T𝑇$,78 − 𝑇$,S'&VT𝑇$,78 − 𝑇O,78V
(6)
Although expressed in terms of temperatures, one should keep in mind that Equation (6) comes from an energy balance (appraised from temperatures, heat capacity and mass flow measurements), not merely reflecting a “temperature effect”, but rather a “heat transfer effect” that exhibits a physical meaning readily grasped.
Exchanger thermal resistance imposed by fouling The build-up of a layer of fouling on the tube
surfaces of the heat exchanger is accounted as a thermal resistance to heat flow. Physically, it is a measure of the thermal resistance imposed by the presence of undesirable foulant layer, obstructing the tubes passages, imposing an additional resistance that demands higher pump power. Theoretically, it varies from zero (absence of scale) to a positive value (as the solid deposits accumulate on the exchanger surfaces). The heat exchanger literature (Bott, 1997 [1]; Kakaç & Liu, 2002 [20], among others) theorise the exchanger Thermal Resistance 𝑅Y (𝑚Z𝐾 𝑊)⁄ by the classical Equation (7), which instantaneously measures how much the current condition of the inlaid (dirty) exchanger deviates from its original clean condition, the latter taken as a baseline reference value.
𝑅Y =1
𝑈^7_&`∗ −1
𝑈%(a$8∗ (7)
Alternatively, a more practical control criterion for every-day monitoring of the heat exchanger performance by hydroelectric plant operators is proposed. This is the dimensionless Fouling Factor (FF), expressed by Equation (8), as a function of the exchanger effectiveness, therefore assessable from results of 3 temperatures, measured on key flow sections of the exchanger, as defined in Equation (6).
𝑭𝑭 =𝜺𝒄𝒍𝒆𝒂𝒏i𝜺
𝜺𝒄𝒍𝒆𝒂𝒏i𝜺𝒅𝒊𝒓𝒕𝒚0 ≤ 𝑭𝑭 < 1 (8)
Heat Exchanger Fouling and Cleaning – 2019
ISBN: 978-0-9984188-1-0; Published online www.heatexchanger-fouling.com

3
SYSTEM CHARACTERIZATION The performance of heat exchangers used to cool
hydrogenerators was recently studied in a medium-sized reversible power plant in operation in Brazil (Fontes Nova Power Plant, owned by Light Energia S/A, the electricity utility operating in Rio de Janeiro State concession area). The plant is equipped with 3 Francis type turbines, each generating 44.87 MW) [21, 22]. The investigation served the purpose of evaluating the off-line cleaning procedure used to unclog the hydrogenerator exchangers, whose thermal and hydrodynamic performance can be drastically affected by the presence of undesirable fouling, always present in the working fluid (water) circulating through the exchangers. More specifically, a set of experiments was considered to evaluate the proficiency of the cleaning method used, during normal cycles of operation of the energy plant.
Hydrogenerator heat exchangers Figure 1 shows a set of two images to illustrate:
(i) the six exchangers (HE1 to HE6), circumferentially installed inside the hydrogenerator outer casing and (ii) the time consuming procedure used for removing one of these exchangers (right image), with the help of a crane, just before it was removed to the outside courtyard to be submitted to the off-line cleaning process.
Fig. 1. (a) Schematic of the exchangers and (b) removal procedure before undergoing the cleaning process
The exchanger shown is of the tubular type,
multi-path (6), water-to-air heat exchanger. While the water is pumped inside the 75 finned tubes (tube length: 2060 mm, 2.8 mm thick wall, internal diameter: 22.3 mm; 8 fins/inch, 0.25 mm thick), the air is forced, in constant cross-current flow, by the action of a ventilation system. Figure 2 shows the rotor being removed from the generator core during one of its preventative maintenance operations. Figure 2a shows the rotor (usually hidden inside the protective external generator housing) suspended by an overhead crane and Figure 2b a close-up view of the blades of the forced ventilation system, attached to the rotor base.
Fig. 2. Hydrogenerator rotor: (a) removed for maintenance and (b) close up of the ventilation blades
Measurement system The measurement system comprises pressure and
temperature instruments, installed on the inlet and outlet sections of the water and air flows of the exchanger, the latter positioned on the front and rear faces of the exchanger. Due to inherent experimental difficulties associated with the complex external air flow around the tube bundle, only the water flow rate is measured. A Beckhoff data acquisition/control system, connected to a PC terminal (host computer), is responsible for the storage, data processing and real-time transmission of measurement information to the plant supervisor and to the university monitoring laboratory located 110 km away from the power plant. Temperature measurements were performed by means of calibrated Wika Pt100 thermoresistances (±0.3 ℃); pressure measurements by pressure transmitters (wet/wet, Wika, Model S-11, uncertainty: 0.25 % FS, measuring range: 0-10 bar, output: 4-20 mA), and flow rate by an ultrasonic clamp-on type flowmeter (Krohne Optisonic 6300 Ultrasonic Flowmeter, measuring range: 0-50 m3/h; ±0.3 m3/h) [21, 22].
EXCHANGER PERFORMANCE: CASE STUDY This section discusses the off-line heat exchanger cleaning technique, which requires the traditional and undesirable technical shutdown of the turbine (for disassembly and subsequent manual cleaning of the exchanger tubes, after being removed to the outer courtyard). The exchanger HE3 (identified in the left image of Figure 1) was instrumented to support the case study. In close observation of strict internal safety standards that rules the operation of the power plant, the performance (effectiveness and fouling factor) of the monitored exchanger was assessed based on real time data acquainted during its normal operation. The experimental analyses mobilized a reasonable experimental effort since pressure and temperature and flow measurements were continuously acquainted (replicated every 10 minutes) and processed over the entire days of observation, allowing assessment of the exchanger
b a
a b
Heat Exchanger Fouling and Cleaning – 2019
ISBN: 978-0-9984188-1-0; Published online www.heatexchanger-fouling.com

4
performance. Instantaneous values of the Fouling Factor were measured by Equation (8), based on the clean (𝜺𝒄𝒍𝒆𝒂𝒏 = 𝟎. 𝟖𝟑) and dirty (𝜺𝒅𝒊𝒓𝒕𝒚 = 𝟎. 𝟐𝟑) reference values, respectively calculated for the two extreme operational conditions of the exchanger, just after the exchanger was cleaned and at the last monitoring day, before the exchanger was resubmitted to a new cleaning process.
Case study: assessing the off-line cleaning technique The off-line study is based on a history of 121
days of operation of the HE3 heat exchanger (Figure 1), stopped for cleaning on day 91st and put back in operation after their inner tubes have undergone the fully manual cleaning process, therefore allowing an assessment of its efficacy. Figure 3 summarizes results of continuous temperature measurements of both working fluids and Figure 4 plots the correspondent temperature differences DT, over the entire monitoring period [21].
Fig. 3. Measured temperature of both working fluids
Figure 4 also shows data of the electrical power
generated by the hydrogenerator unit.
Fig. 4. Working fluid temperature differences and electrical power generated
Due to operational reasons defined by the plant managers, it practically operated at half (25 MW) of its nominal generation capacity and suffered some
interruptions for various maintenance reasons, unimportant for the present discussion.
Typical of high-performance exchangers, these measurement data confirm that a small temperature difference (say, 4 °C) of the cold (water) working fluid is sufficient to generate a significant temperature decrease (about 15 °C) in the hot (air) working fluid.
As expected, the fouling inside the inner tubes grows with time, explaining the slight decrease in air (exchanger hot fluid) temperature difference before cleaning process occurs, reversing this trend after cleaning has taken place. In contrast, the water (cold fluid) temperature difference remains almost constant as a result of fresh water being pumped in excess to feed the heat exchanger.
Figure 5 shows the history of water flow rate measurements during the entire 121 days of heat exchanger monitoring [21].
Fig. 5. Measured water flow and calculated air flow
While the water flow rate is directly measured by
an accurate, non-invasive, calibrated ultrasonic clamp-on type flow meter, the air flow rate was not measured, but indirectly calculated through the energy balance (Equation 4) around the exchanger control volume. Measurements of the air flow rate were not performed given the experimental difficulties of measuring this complex stream (cross-flow, externally to the exchanger bundle of tubes, exchanging heat with the internal water flow) where the sensitive element of the temperature measurement instrument (Pt100) is positioned in the rear face of the exchanger, within the wake of a very disturbed air flow (the body of the Pt100, somehow, also disturbs the flow at the measurement region).
Contradicting the physics of the expected air flow data over the investigation days, calculated values of the volumetric air flow rate show an unrealistic and unexpected huge variation.
Although calculated on the basis of a robust hypothesis (energy balance across the working fluids of the exchanger), such drastic oscillation in the air flow rate is not physically acceptable, since the air is
Heat Exchanger Fouling and Cleaning – 2019
ISBN: 978-0-9984188-1-0; Published online www.heatexchanger-fouling.com

5
forced by means of blades of the ventilation system attached to the base of the rotor of the hydro generator (Figure 2). Strictly spinning at a constant speed (to prevent variations of the electrical tension generated by the hydrogenerator), there is no doubt that the blades attached to the rotor of the hydrogenerator impose a constant air flow rate through the exchanger. In other words, the classical energy balance somehow fails to properly correlate properties of the exchanger working fluids, certainly biased by inherent high uncertainties associated with critical temperature measurements in the rear face of the exchanger, thereby compromising the accuracy of the air flow rate calculation. Considering, however, that even being unable to produce reliable “local values” of the air flow rate, it seems reasonable to consider that this extensive data mass (obtained over a long period of time, i.e.:121 days), and processed through the correct physics (energy balance), should be able to be interpreted as a probability distribution of the true constant value of the air flow rate through the exchanger. To decode this probability distribution, three statistics were considered, the median value (21368.3 m3/h), the average value (21308.7 m3/h) and the geometric mean (21355.6 m3/h) values of the air flow rate full data, understood as possible statistics candidates to express the calculated constant value of the volumetric air flow rate. Among the 3 statistics, the median value was chosen to correct the mass flow rate data since it is less influenced by outliers. Overlapping the oscillating air flow data, the median value of the air flow rate is also plotted (by a horizontal dashed line) in Figure 6. The located increase in water flow rate on the ninety-first day of exchanger monitoring is explained by the cleaning intervention of the exchanger.
Figure 6 summarizes the values of the exchanger effectiveness (calculated from Equation 6) and values of the fouling factor, calculated from the proposed criterion defined in Equation (8). The upper part of Figure 6 plots the calculated values of the effectiveness. The circle symbols (in solid black colour) denote the effectiveness based on the local value of the air flow rate (not corrected by the median value of the flow rate) while the circle symbols (in red colour) accounts for this correction (effectiveness based on the median value of the data history). As seen, the proposed median approach seems to smooth out the effectiveness curve in a very fashioned way, certainly a conclusive evidence of the efficacy of the proposed correction method. Similarly to the data presented for the effectiveness, the lower part of Figure 6 plots values of the fouling factor (calculated from Equation 8). While the grey open diamond symbols denote values of the fouling factor not corrected by the median of the flow rate, the same symbols in red colour account for the median value correction of the air flow rate. Rather than proposing a corrective equation to overcome the measured mass
flow data, all calculations are conveniently processed by means of an on-line tailored Excel datasheet.
Fig. 6. Calculated and corrected values of the effectiveness and fouling factor (off-line approach)
As proven by the calculated data, the beneficial
results of the off-line cleaning technique introduced in the ninety-first day of operation can be felt immediately, resulting in an increase of 13.3 % in the exchanger effectiveness ε (from 0.56 to 0.64) and a correspondent decrease of 28% (from 0.46 to 0.33) in the fouling factor.
To further explain the apparent contradiction raised ("thermal balance failure”, generated by high uncertainties associated with the calculated value of the outlet air flow rate), a detailed statistical analysis was carried out aiming at assessing the contribution of each individual measurement uncertainty impacting the final calculation of the effectiveness of the heat exchanger, obtained from the energy balance associated with the heat transfer governing equations. This is the purpose of the next section.
ASSESSING MEASUREMENT UNCERTAINTY In accordance with the VIM [23] jargon,
Equations (9) and (10) express the ISO GUM [24] approach to assess the final expanded uncertainty 𝑈u associated with calculated values of the exchanger effectiveness, computed from propagation of individual contributions of the uncertainties associated to intermediate measurement results.
𝑈u = 𝑘. 𝑢u (9)
In Equation (9), the expanded uncer tainty is
obtained from a standard uncertainty𝑢u, considering a normal probability distribution, for a Coverage Factor k = 2.0, associated with a confidence level of 95.45 %, estimated from the Welch–Satterthwaite equation [25]. More specifically, 𝑈u(𝑇) refers to the expanded uncertainty associated with the effectiveness value (calculated from each individual uncertainty associated with temperature measurements of the inflow and outflow of air and of
Heat Exchanger Fouling and Cleaning – 2019
ISBN: 978-0-9984188-1-0; Published online www.heatexchanger-fouling.com

6
the water inflow, as expressed in Equation 10. It reflects the classical GUM [24] approach to propagate the components of the uncertainties associated with temperature measurements.
T𝑈u[𝑇$,S'&, 𝑇$,78, 𝑇O,78]VZ = z {u
{|},~��𝑈|},~���
Z+
z {u{|},��
𝑈|},���Z+ z {u
{|�,��𝑈|�,���
Z (10)
Sources of uncertainties and sensitivity coefficients Figure 7 depicts the classical Ishikawa Cause-
Effect Diagram [25], applied to the case study.
Fig. 7. Identification of critical sources of uncertainties
Schematically, the diagram works as a guide to identify possible sources of uncertainty impacting the assessment of the expanded uncertainty associated with the exchanger effectiveness. Certainly, this is a useful diagram-based technique, which combines brainstorming with a type of mind map, guiding uncertainty computers to consider all possible sources rather than just the most obvious ones.
Appearing in Equation (10), equations (11) to (13) expresses the Sensitive Coefficients of the exchanger effectiveness with respect to each impacting temperature.
𝜕𝜀𝜕𝑇$,S'&
= −1
T𝑇$,78 − 𝑇O,78V (11)
𝜕𝜀𝜕𝑇$,78
=T𝑇$,S'& − 𝑇O,78V
T𝑇$,78 − 𝑇O,78VZ (12)
𝜕𝜀𝜕𝑇O,78
=T𝑇$,78 − 𝑇$,S'&V
T𝑇$,78 − 𝑇O,78VZ (13)
A direct examination of the above sensitivity coefficient equations, immediately reveals that the outlet air temperature is the most impacting physical variable in calculating the uncertainty associated with the exchanger effectiveness. Note that while Equation (11) depends on the inverse of the temperature difference T𝑇$,78 − 𝑇O,78V, Equations (12) and (13) depend on the inverse of the square of the same temperature difference, therefore signalizing that the sensitivity coefficient based on the outlet air temperature is the dominant factor.
Components of the measurement uncertainty Considering that all temperatures were directly
measured by calibrated Platinum resistance thermometers (Pt100), the uncertainty associated with these measurements has two components: Type A and Type B [24]. While the first (stochastic component) is associated to repeated measurements carried out, the latter (deterministic component) is directly associated with the calibration procedure of the Platinum resistance thermometers used.
The Type A component of the uncertainty reflects the stochastic component of the measurement uncertainty, assessed by means of a statistical analysis of all measured values (𝑥7) obtained under a predefined measurement condition, given by Equation (14):
𝑈M =𝑆√𝑛
= �1𝑛�
(𝑥7 − ��)Z8
���
(14)
In this equation, 𝑥7 denotes the measured values; ��, the mean of the measured value; 𝑆, the calculated the standard deviation; 𝑛, the number of experimental points.
The Type B component of the uncertainty reveals uncertainty associated with the measurement device used, therefore obtained from its calibration certificate. The calibration of the temperature Platinum resistance thermometers correlates calibration data (real measurements versus reference value indicated by the standard) through a polynomial of degree m (Equation 15). This procedure gives rise to a new source of uncertainty, usually called uncertainty associated with the polynomial adjustment. More specifically, to the polynomial that best represents the physical nature of the calibration, selected from those that offer the least uncertainty associated with the curve fitting. 𝑦(𝑥7) = 𝑎N + 𝑎� ∙ 𝑥 + 𝑎Z ∙ 𝑥Z + 𝑎� ∙ 𝑥� + ⋯+ 𝑎) ∙ 𝑥) (15)
In the above expression, 𝑥 denotes the measurement result indicated by the instrument, while 𝑦(𝑥7)the value adjusted by the polynomial, therefore correlating the reading of the instrument to the true value given by the standard. The coefficients 𝑎N, 𝑎� ⋯𝑎)are determined by applying the Ordinary Least Squares (OLS) method, i.e.: solving the matrix system given by Equation (16).
⎣⎢⎢⎢⎢⎢⎢⎢⎢⎡�𝑥7N8
7��
�𝑥7�8
7��
… �𝑥788
7��
�𝑥7�8
7��
�𝑥7Z8
7��
… �𝑥78��8
7��⋮
�𝑥788
7��
⋮
�𝑥78��8
7��
⋮
… �𝑥7Z88
7�� ⎦⎥⎥⎥⎥⎥⎥⎥⎥⎤
�
𝑎N𝑎�⋮𝑎8
� =
⎣⎢⎢⎢⎢⎢⎢⎢⎢⎡�𝑥7N ∙ 𝑦7
8
7��
�𝑥7� ∙ 𝑦7
8
7��⋮
�𝑥78 ∙ 𝑦7
8
7�� ⎦⎥⎥⎥⎥⎥⎥⎥⎥⎤
(16)
ε
Heat Exchanger Fouling and Cleaning – 2019
ISBN: 978-0-9984188-1-0; Published online www.heatexchanger-fouling.com

7
The algebraic work of solving Equation 16 may, however, be avoided by making use of the statistical tool available in Excel software. Although a polynomial of degree 1 (m = 1) may constitute a good representation of the physical nature of the calibration of some types of measuring instruments, the choice of higher-order polynomials may result in lower uncertainty of the curve fitting algebraic process. A good calibration practice recommends to test at least three degrees of polynomial to define the one that offers the lowest uncertainty for the curve fitting, therefore yielding the lowest uncertainty associated with the measurement. Thus, once the coefficients for each polynomial are determined, the adjusted values for each polynomial are calculated; i.e., successively considering m=1; m=2 and m=3 in Equations 15 and 16, the latter to calculate the coefficients.
The application of a polynomial (adjustment interpolator polynomial) allows to: (i) correct the experimental results measured by the measuring instrument; (ii) reduce the systematic error inherent to the measurement process and (iii) estimate the adjusted values for any indication of the instrument, provided it is within the range of its calibration.
The uncertainty associated with the curve fitting (𝑢Y) is then calculated through Equation (17).
𝑢Y = �z1
𝑛 − 𝑐� ∙�[𝑦(𝑥7) − 𝑦7]Z
8
7��
(17)
In this equation, 𝑢Y denotes the uncertainty of the curve fitting process; 𝑦(𝑥7), the value adjusted by the polynomial; 𝑦7 the value indicated by the instrument of reference; 𝑛, the number of experimental points (of the calibration); 𝑐, the number of coefficients of the polynomial being evaluated.
RESULTS AND DISCUSSION
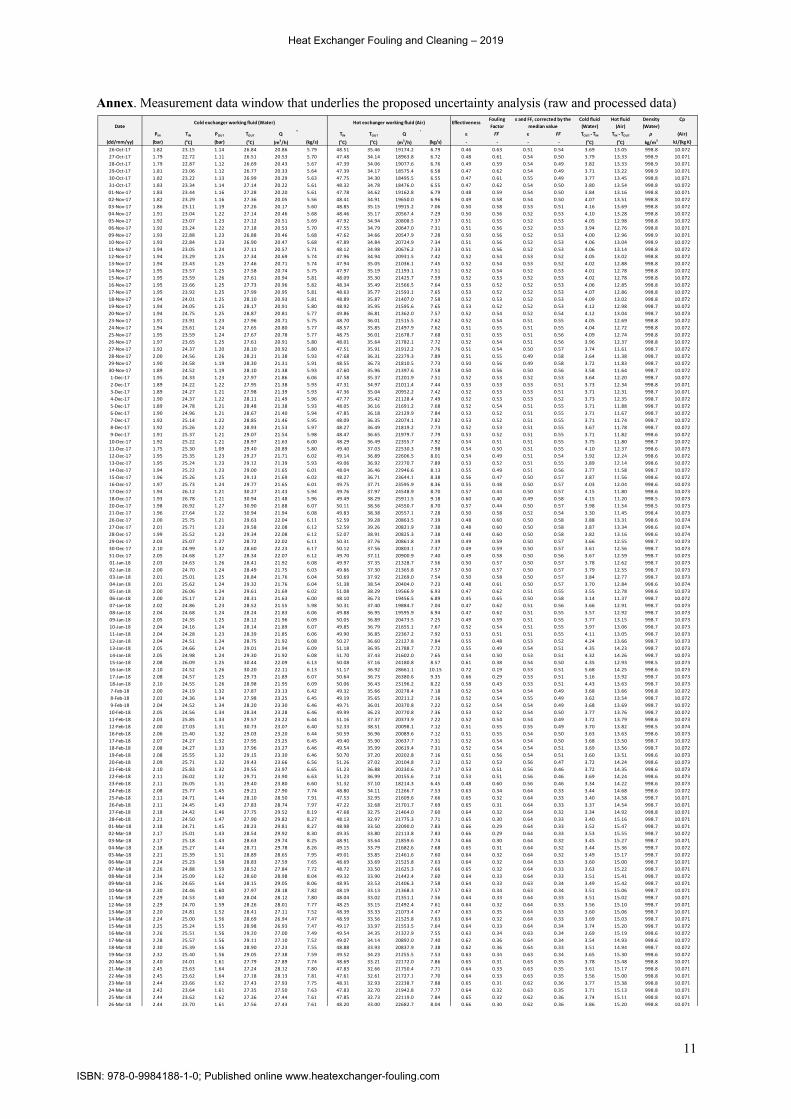
Table 1 summarizes the results of the first stage of the uncertainty analysis performed, supported by the extensive mass of data, built over the 121 days of monitoring measurements. Compactly shown in Figures 3 and 4, the mass of data generated by the study case is transcribed in the Annex, which summarizes not only the measured raw data, the measurement data corrected by personalized calibration polynomials but, also, intermediate results of calculations emanating from the thermal balance and best estimates of physical property values of the working fluids required to assess the exchanger effectiveness and its fouling factor. Moreover, the annex also indicates the calculated values of the air mass flow rate obtained from the energy balance and the correspondent corrected values of the exchanger
effectiveness and fouling factor, corrected by the median value of the air flow rate data.
As shown, Table 1 reports uncertainty analysis results for three distinct conditions of the hydrogenerator cooling system heat exchanger monitoring operation, based on data replicated every 10 minutes. Condition #1: clean exchanger data, denoting the early stage of the monitoring period (along 9 days, between Oct 29 to Nov 06/2017); Condition #2: fouled exchanger, reflecting the uncertainty analysis performed at the late stage of the monitoring period, just before the exchanger was resubmitted to the off-line cleaning process (along 12 days, from Dec 26 to Jan 06/2018) and Condition #3: unclogged exchanger, just after the exchanger was uninstalled from the hydrogenerator enclosure and opened to allow manual scrubbing of its inner passages (along 18 days, from March 02 to 19/2018). These three periods not only reflect the cleaning condition of the exchanger but also the seasonality of the exchanger feed water. The selection of the data window width of each analysis condition took into account the steadiness of the water inlet temperature and information provided by biochemical analysis of the water (discussed elsewhere [21]), understood as sensible parameters to judge seasonality.
Two calculation steps encompasses this scrutiny stage: (i) assessment of the Type A (scattering of measurement results) and Type B component of the uncertainty, where the latter is common to all data conditions, as stated in the calibration certificate of the measuring instrument (Pt100) used to measure temperatures that appear in Equation (6) and (ii) assessment of the expanded uncertainty 𝑈|, for each condition investigated, obtained from the propagation of the correspondent Type A and Type B components of the uncertainties, calculated through Equation 18.
𝑈| =�𝑈|`JaMZ + 𝑈|`Ja Z (18)
Highlighted in bold in Table 1, one can observe that uncertainty values associated with the outlet air temperature is always larger than their counterpart. Moreover, for the Condition #2 (data acquainted when the exchanger was fouled), again, all uncertainty contributions are higher than their counterpart calculated for cleaning conditions #1 and #3. Interesting noticing, that the uncertainty values calculated for conditions #3 seems to (reasonably) recover their original values reported for Condition #1, understood as a consistent result as both conditions represents almost the same (but not exactly the same) state of exchanger cleanness. Undoubtedly, the expanded uncertainty associated with temperature measurements assume its maximum value (𝑈| =0.571℃) when calculated for the fouled condition of the exchanger (Condition #2).
Heat Exchanger Fouling and Cleaning – 2019
ISBN: 978-0-9984188-1-0; Published online www.heatexchanger-fouling.com
8
Table 1. Types A and B components of the uncertainties associated with temperature measurements and expanded uncertainties calculated from their propagation
Type A and Type B components of the uncertainty associated with measurements of the three temperatures required to
calculate the exchanger effectiveness (oC)
Expanded Uncertainty (UT) associated with temperature measurements (oC)
Heat exchanger
working fluid
1 UType A 2 UType B 𝑈| = �𝑈|`JaMZ + 𝑈|`Ja Z
Condition #1 Clean
exchanger
Condition #2 fouled
exchanger
Condition #3 After 2nd cleaning
Applied to all conditions (calibration)
Condition #1 Clean
exchanger
Condition #2 fouled
exchanger
Condition #3 After 2nd cleaning
Air inlet 0.16 0.40 0.09 0.29 0.331 0.494 0.304
outlet 0.12 0.48 0.11 0.31 0.332 0.571 0.329 Water inlet 0.06 0.29 0.08 0.26 0.267 0.389 0.272
1 Type A component of the uncertainty, assessed through measurements. 2 Type B component, stated in the measuring instrument calibration certificate.
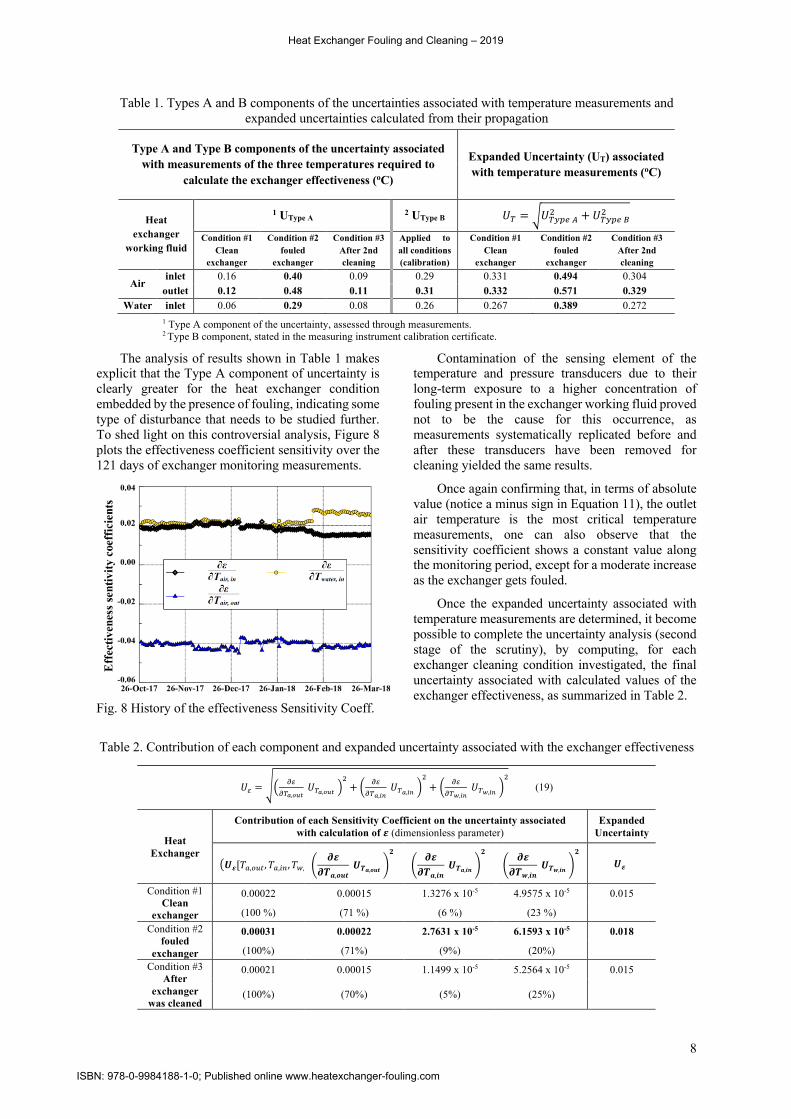
The analysis of results shown in Table 1 makes explicit that the Type A component of uncertainty is clearly greater for the heat exchanger condition embedded by the presence of fouling, indicating some type of disturbance that needs to be studied further. To shed light on this controversial analysis, Figure 8 plots the effectiveness coefficient sensitivity over the 121 days of exchanger monitoring measurements.
Fig. 8 History of the effectiveness Sensitivity Coeff.
Contamination of the sensing element of the temperature and pressure transducers due to their long-term exposure to a higher concentration of fouling present in the exchanger working fluid proved not to be the cause for this occurrence, as measurements systematically replicated before and after these transducers have been removed for cleaning yielded the same results.
Once again confirming that, in terms of absolute value (notice a minus sign in Equation 11), the outlet air temperature is the most critical temperature measurements, one can also observe that the sensitivity coefficient shows a constant value along the monitoring period, except for a moderate increase as the exchanger gets fouled.
Once the expanded uncertainty associated with temperature measurements are determined, it become possible to complete the uncertainty analysis (second stage of the scrutiny), by computing, for each exchanger cleaning condition investigated, the final uncertainty associated with calculated values of the exchanger effectiveness, as summarized in Table 2.
Table 2. Contribution of each component and expanded uncertainty associated with the exchanger effectiveness
𝑈u = £¤ {u{|},~��
𝑈|},~��¥Z+ z {u
{|},��𝑈|},���
Z+ z {u
{|�,��𝑈|�,���
Z (19)
Heat Exchanger
Contribution of each Sensitivity Coefficient on the uncertainty associated with calculation of 𝜺 (dimensionless parameter)
Expanded Uncertainty
T𝑼𝜺[𝑇$,S'&, 𝑇$,78, 𝑇O,78]V𝟐 §𝝏𝜺
𝝏𝑻𝒂,𝒐𝒖𝒕𝑼𝑻𝒂,𝒐𝒖𝒕¬
𝟐
§𝝏𝜺
𝝏𝑻𝒂,𝒊𝒏𝑼𝑻𝒂,𝒊𝒏¬
𝟐
§𝝏𝜺
𝝏𝑻𝒘,𝒊𝒏𝑼𝑻𝒘,𝒊𝒏¬
𝟐
𝑼𝜺
Condition #1 Clean
exchanger
0.00022 0.00015 1.3276 x 10⁻⁵ 4.9575 x 10⁻⁵ 0.015
(100 %) (71 %) (6 %) (23 %) Condition #2
fouled exchanger
0.00031 0.00022 2.7631 x 10⁻⁵ 6.1593 x 10⁻⁵ 0.018
(100%) (71%) (9%) (20%) Condition #3
After exchanger
was cleaned
0.00021 0.00015 1.1499 x 10⁻⁵ 5.2564 x 10⁻⁵ 0.015
(100%) (70%) (5%) (25%)
Heat Exchanger Fouling and Cleaning – 2019
ISBN: 978-0-9984188-1-0; Published online www.heatexchanger-fouling.com

9
It is interesting noticing that even though the value of the effectiveness only depends on three working fluid temperatures (Equation 6), the uncertainties associated with the measured values of the working fluid temperature depend on the Type A and Type B values of the associated uncertainties. Based on the partial results shown in Table 1, and making use of Equation (19), expressed in terms of the sensitivity coefficients given in Equations (11) to (13), it was possible to establish, not only the individual contribution of each working fluid temperature measured but also the final value of the expanded uncertainty 𝑼𝜺 associated with the calculated value of the exchanger efficiency, as summarized in Table 2.
Consistent with results reported in Table 1 (uncertainties associated with temperature measurements), the results reported in Table 2 (uncertainties associated with the exchanger effectiveness) confirm that the air temperature (the dominant component of the uncertainty) is indeed the measuring variable that impact most on the final computation of the expanded uncertainty. As calculation of the overall measurement uncertainty reveals, the fouled condition of the exchanger reflects the most critical condition of the exchanger (the output air temperature contributes with 71 % of the overall uncertainty, yielding the highest expanded uncertainty 𝑼𝜺 = 𝟎, 𝟎𝟏𝟖), confirming the physics of the problem once measurements of the outlet air is performed nearby the outer face of the exchanger after it undergoes a quite complex unstable flow across the bundle of tubes of the heat exchanger.
Even though the tested off-line cleaning technique proved to be capable to unclog the exchanger tubes, there is no doubt that an on-line alternative approach not requiring interruption of the turbine during the cleaning procedure would produce far better economic impact.
CONCLUSION The real-time computation scheme conceived
proved to be a practical and reliable stratagem to assess uncertainties associated with critical measurements needed to calculate the effectiveness (and fouling scale) of heat exchangers.
The uncertainty analysis allowed to rank the sources of contribution of uncertainty associated with effectiveness. As revealed by the analysis, the outlet air temperature was identified as the variable of greatest impact in the calculation of effectiveness (around 70% for all three exchanger cleaning conditions investigated).
The study confirmed that, for the operation condition studied, the off-line cleaning technique produced a positive gain (13.3%) in effectiveness and a correspondent decrease of 28% in the fouling factor of the heat exchangers. An on-line approach now in
process of investigation, and not reported here due to space limitation, would certainly offer an indubitable economic advantage, since it does not require the technical shutdown of the turbine generator group, while drastically reducing maintenance costs. Among other advantages, the on-line alternative also avoids the human interference usually required in traditional off-line cleaning maintenance. The resulting economic benefit of the on-line technique that avoids technical shutdown of the turbine —an unexciting procedure that mobilizes at least 4 maintenance professionals, for about 3 full days of maintenance work— amounts to 0.47 million USD/year, for each manual maintenance avoided. The calculation is simple: 3days × 24hours/day × 44MW×150USD/MWh (average price of the MWh, as quoted by the Brazilian Chamber of Energy).
Regardless the detailed uncertainty analysis carried out, any carefully experimentalist committed to investigate the performance of any equipment, should bear in mind the philosophical precept formulated by the International Metrology Vocabulary (VIM) [25]: “The reliability of any measurement always requires intellectual honesty and absolute metrological control and careful identification of all impacting parameters, regardless of whether or not the measurement refers to the same measurement procedure, same operators, same measuring system, same operating conditions and same location, and replicate measurements on the same or similar objects over any period of time”.
NOMENCLATURE A Total heat transfer area of the exchanger [m2] C Flow-stream capacity rate [W/K] CÁÂà (𝐶)Âà = ��)$*𝑐J). Maximum of CÄ or CÅ[W/K] CÁGÆ (𝐶)G8 = ��)78𝑐J). Minimum of CÄ or CÅ[W/K] cÈ FF
Heat capacity at constant pressure, [J/kgK] Fouling Factor (dimensionless)
HE Heat Exchanger (HE1 to HE6) k Coverage factor m Coefficient of the polynomial fitting m Mass flow rate [kg/s] n Total number of measurement points NTU Number of Transfer Units Q Volumetric flow rate [m�/h] q Heat transfer rate [W] Rf Exchanger Thermal Resistance [𝑚Z𝐾 𝑊]⁄ S Standard deviation of measurement results T Working fluid Temperature [°C] u Standard measurement uncertainty U U∗
Expanded measurement uncertainty Heat Transfer Coefficient [kW/mZ℃]
Greek symbols ε Effectiveness of heat exchanger (dimensionless) ρ Cold stream density, [kg/m�] υ Heat Transfer Coefficient, [kW/mZ℃]
Subscript a air (hot fluid of the exchanger) actual actual value of the Heat Exchanger between fluids av Average value
Heat Exchanger Fouling and Cleaning – 2019
ISBN: 978-0-9984188-1-0; Published online www.heatexchanger-fouling.com

10
c cold side of the exchanger clean clean condition of the exchanger dirty dirty condition of the exchanger f uncertainty associated with the curve fitting h hot side of the exchanger in inlet max maximum value min minimum value out outlet s standard w water (cold fluid of the exchanger)
ACKNOWLEDGEMENT Acknowledgments are due to Light Energia
Electricity Concessionaire —owner and responsible for the management and operation of the Fontes Nova Hydroelectric Power Plant (Piraí, RJ/Brazil)—, for the financial support under the regulated R&D Programme (contract Light/Aneel 5161- 010/2016, R&D Coordination). Thanks is also due to the Coordination for Higher Education Personnel (CAPES, Ministry of Education of Brazil) for sponsoring the Postgraduate Metrology Programme of Catholic University of Rio de Janeiro and the graduate studies of the third author.
REFERENCES [1] T.R. Bott, Fouling of heat exchangers, Chemical
Engineering Monographs Ch.15 (1997) 357–407. [2] Frota M. N.; Ticona E. M. and Valente Jr. G. P. On-
line cleaning technique for mitigation of biofouling in heat exchangers: A case study of a hydroelectric power plant in Brazil. Experimental Thermal and Fluid Science, v. 53, p. 197-206, 2014.
https://doi.org/10.1016/j.expthermflusci.2013.12.006. [3] T.R. Bott, Fouling of heat exchangers and its
mitigation with special reference to biofouling. Proceedings of 2nd European Thermal Science UTI National Heat Transfer Conference, vol 1, 1996, pp115–125.
[4] A.C. William, The biology of microfouling of solid surfaces, in: J.F. Garey, R.M. Jorden, A.H. Aitken, D.T. Burton, R.H. Gray (Eds.), Proceedings of the Symposium on Special Reference to Power Plant Heat Exchangers, Condenser Biofouling Control, Ann Arbor Science Publishers, Inc., 1980, pp. 295–299.
[5] L.F. Melo, T.R. Bott, Biofouling in water systems, Exp. Therm. Fluid Sci. 14 (1997) 375–381. PII S0894-1777(96)00139-2.
[6] J.S. Baker, S.J. Judd, Magnetic amelioration of scale formation, Water Res. 30 (2) (1996) 247–260. PII 0043-1354(95)00184-0.
[7] T. Vemeiren, Magnetic treatment of liquids for scale and corrosion prevention, Corro. Techn. 5 (1958) 215–219.
[8] Y.I. Cho, B.-G. Choi, Experimental validation of electronic anti-fouling technology with a plate heat exchanger, in: Proceedings of 11th IHT, 1998.
[9] Y.I. Cho, B.-G. Choi, B. Drazner, Electronic anti-fouling technology to mitigate precipitation fouling in plate-and-frame heat exchangers, Int. J. Heat Mass Trans. 41 (17) (1998) 2265–2571. PII: soo17-9310(97)00347-5.
[10] Y.I. Cho, C.F. Fan, B.G. Choi, Theory of electronic anti-fouling technology to control precipitation fouling in heat exchangers, Int. Communication. Heat Mass
Trans. 24 (1997) 757–770. PII S0735-1933(97)00063-8.
[11] C.F. Fan, Y.I. Cho, A new electronic anti-fouling method to control fouling, in: 1997 National Heat Transfer conference, Baltimore, HTD-Vol 350, vol 12, 1997, pp. 183–188.
[12] C.F. Fan, A study of electronic descaling technology, Ph.D. Thesis, Departm. of Mech. Engineering, Drexel University, PA. (USA), 1997.
[13] R. Romo, M.M. Pitts, N.B. Handagama, Biofouling control in heat exchangers using high voltage capacitance-based technology, in: Heat Exchanger Fouling and Cleaning VII, ECI Symposium Series, vol. RP5, 2007.
[14] R. Takahashi, S. Inagaki, S. Nakashima, Electrical anti-biofouling system for power plants, Toshiba Rev. 57 (6) (2002) 64–67.
[15] Hydropath Technology, Patent granted in Feb. 3rd, 1999 (European Patent Specification 0 720588 B1), Intern. Publication WO 95/08510 (30.03.1995 Gazette 1995/14). Hydropath Holding Limited, Linpac Gouse, Otterspool Way, Watford, Heartforshire WD2 8HL/GB.
[16] S.L. Braga, M.N. Frota, J.J. Millón, E.M. Ticona, J.R.C.A. Neto, Hydrodynamic and thermal evaluation of fouling mitigation in hydro generators heat exchangers, in: 8th Intern. Heat Transfer Conference, Fluid Mechanics and Thermodynamics, Mauritius Isl, 2011.
[17] Zettler H.U. (Coord.) Proceedings of the Heat exchangers fouling and cleaning conference (HTRI, 2019). Organized by the Heat Transfer Research, Inc. Warsaw/Poland, June 2-7.
[18] Zettler H.U. (Coord.), Proceedings of the Heat exchangers fouling and cleaning conference (HTRI, 2017). Organized by the Heat Transfer Research, Inc. Aranjuez (Madrid), Spain. June 11-16.
[19] W.M. Kays, A.L. London, Compact Heat Exchangers, second ed., McGraw-Hill, New York, 1964.
[20] Sadik Kakaç & Hongtan Liu. Heat Exchangers, Solution, Rating and Thermal Design. ISBN 0-8493-0902-6, 2nd Edition (2002). p.178.
[21] Frota M.N. & Valente Jr. G. P. Final Report of the R&D Project Light/Aneel 5161-010/2016. Prototype of an innovative system for cleaning hydro generator heat exchangers. February 4th, 2019.
[22] Frota M. N.; Hall Barbosa C. R.; S.B. Germano; Hernández-Vásquez J. D. e Valente Jr. G. P. Prototype of an innovative system for cleaning heat exchangers of hydro generators. Main results of the R&D Project Ref. Light/Aneel 5161-010/2016, 2019th edition of the joint CITENEL (Brazilian Congress on Technological Innovation in Electric Energy) & SEENEL (Seminar on Energy Efficiency in the Electric Sector) event, Campinas, SP/Brazil, October/2019.
[23] International Vocabulary of Metrology – Basic and General Concepts and Associated Terms (VIM 3rd edition) JCGM 200:2012.
[24] GUM, I. (2008). Guide to the Expression of Uncertainty in Measurement, (1995), with Supplement 1, Evaluation of measurement data, JCGM 101: 2008. International Organization for Standardization, Geneva, Switzerland.
[25] K. Ishikawa (1986). Guide to Quality Control, 2nd Edition Asia Productivity Organization and Quality Resources, White Plains, New York
Heat Exchanger Fouling and Cleaning – 2019
ISBN: 978-0-9984188-1-0; Published online www.heatexchanger-fouling.com
11
Annex. Measurement data window that underlies the proposed uncertainty analysis (raw and processed data)
Cp
PIN TIN POUT TOUT Q TIN TOUT Q ε FF ε FF TOUT - TIN TIN - TOUT ρ (Air)
(dd/mm/yy) (bar) (oC) (bar) (
oC) (m
3/h) (kg/s) (
oC) (
oC) (m
3/h) (kg/s) - - - - (
oC) (
oC) kg/m
3kJ/(kg K)
26-Oct-17 1.82 23.15 1.14 26.84 20.86 5.79 48.51 35.46 19174.2 6.79 0.46 0.63 0.51 0.54 3.69 13.05 998.8 10.07227-Oct-17 1.79 22.72 1.11 26.51 20.53 5.70 47.48 34.14 18963.8 6.72 0.48 0.61 0.54 0.50 3.79 13.33 998.9 10.07128-Oct-17 1.79 22.87 1.12 26.69 20.43 5.67 47.39 34.06 19077.6 6.76 0.49 0.59 0.54 0.49 3.82 13.33 998.9 10.07129-Oct-17 1.81 23.06 1.12 26.77 20.33 5.64 47.39 34.17 18575.4 6.58 0.47 0.62 0.54 0.49 3.71 13.22 998.9 10.07130-Oct-17 1.82 23.22 1.13 26.99 20.29 5.63 47.75 34.30 18495.5 6.55 0.47 0.61 0.55 0.49 3.77 13.45 998.8 10.07131-Oct-17 1.83 23.34 1.14 27.14 20.22 5.61 48.32 34.78 18476.0 6.55 0.47 0.62 0.54 0.50 3.80 13.54 998.8 10.07201-Nov-17 1.83 23.44 1.16 27.28 20.20 5.61 47.78 34.62 19162.8 6.79 0.48 0.59 0.54 0.50 3.84 13.16 998.8 10.07102-Nov-17 1.82 23.29 1.16 27.36 20.05 5.56 48.41 34.91 19650.0 6.96 0.49 0.58 0.54 0.50 4.07 13.51 998.8 10.07203-Nov-17 1.86 23.11 1.19 27.26 20.17 5.60 48.85 35.15 19915.2 7.06 0.50 0.58 0.53 0.51 4.16 13.69 998.8 10.07204-Nov-17 1.91 23.04 1.22 27.14 20.46 5.68 48.46 35.17 20567.4 7.29 0.50 0.56 0.52 0.53 4.10 13.28 998.8 10.07205-Nov-17 1.92 23.07 1.23 27.12 20.51 5.69 47.92 34.94 20808.5 7.37 0.51 0.55 0.52 0.53 4.05 12.98 998.8 10.07206-Nov-17 1.92 23.24 1.22 27.18 20.53 5.70 47.55 34.79 20647.0 7.31 0.51 0.56 0.52 0.53 3.94 12.76 998.8 10.07109-Nov-17 1.93 22.88 1.23 26.88 20.46 5.68 47.62 34.66 20547.9 7.28 0.50 0.56 0.52 0.53 4.00 12.96 998.9 10.07110-Nov-17 1.93 22.84 1.23 26.90 20.47 5.68 47.89 34.84 20724.9 7.34 0.51 0.56 0.52 0.53 4.06 13.04 998.9 10.07211-Nov-17 1.94 23.05 1.24 27.11 20.57 5.71 48.12 34.98 20676.2 7.33 0.51 0.56 0.52 0.53 4.06 13.14 998.8 10.07212-Nov-17 1.94 23.29 1.25 27.34 20.69 5.74 47.96 34.94 20931.5 7.42 0.52 0.54 0.53 0.52 4.05 13.02 998.8 10.07213-Nov-17 1.94 23.43 1.25 27.46 20.71 5.74 47.94 35.05 21036.1 7.45 0.52 0.54 0.53 0.52 4.02 12.88 998.8 10.07214-Nov-17 1.95 23.57 1.25 27.58 20.74 5.75 47.97 35.19 21193.1 7.51 0.52 0.54 0.52 0.53 4.01 12.78 998.8 10.07215-Nov-17 1.95 23.59 1.26 27.61 20.94 5.81 48.09 35.30 21425.7 7.59 0.52 0.53 0.52 0.53 4.02 12.78 998.8 10.07216-Nov-17 1.95 23.66 1.25 27.73 20.96 5.82 48.34 35.49 21566.5 7.64 0.53 0.52 0.52 0.53 4.06 12.85 998.8 10.07217-Nov-17 1.95 23.92 1.25 27.99 20.95 5.81 48.63 35.77 21593.1 7.65 0.53 0.52 0.52 0.53 4.07 12.86 998.8 10.07218-Nov-17 1.94 24.01 1.25 28.10 20.93 5.81 48.89 35.87 21407.0 7.58 0.52 0.53 0.52 0.53 4.09 13.02 998.8 10.07219-Nov-17 1.94 24.05 1.25 28.17 20.91 5.80 48.92 35.95 21595.6 7.65 0.53 0.52 0.52 0.53 4.12 12.98 998.7 10.07220-Nov-17 1.94 24.75 1.25 28.87 20.81 5.77 49.86 36.81 21362.0 7.57 0.52 0.54 0.52 0.54 4.12 13.04 998.7 10.07323-Nov-17 1.91 23.91 1.23 27.96 20.71 5.75 48.70 36.01 21515.5 7.62 0.52 0.54 0.51 0.55 4.05 12.69 998.8 10.07224-Nov-17 1.94 23.61 1.24 27.65 20.80 5.77 48.57 35.85 21497.9 7.62 0.51 0.55 0.51 0.55 4.04 12.72 998.8 10.07225-Nov-17 1.95 23.59 1.24 27.67 20.78 5.77 48.75 36.01 21678.7 7.68 0.51 0.55 0.51 0.56 4.09 12.74 998.8 10.07226-Nov-17 1.97 23.65 1.25 27.61 20.91 5.80 48.01 35.64 21782.1 7.72 0.52 0.54 0.51 0.56 3.96 12.37 998.8 10.07227-Nov-17 1.92 24.37 1.20 28.10 20.92 5.80 47.51 35.91 21912.2 7.76 0.51 0.54 0.50 0.57 3.74 11.61 998.7 10.07228-Nov-17 2.00 24.56 1.26 28.21 21.38 5.93 47.68 36.31 22279.3 7.89 0.51 0.55 0.49 0.58 3.64 11.38 998.7 10.07229-Nov-17 1.90 24.58 1.19 28.30 21.31 5.91 48.55 36.73 21810.5 7.73 0.50 0.56 0.49 0.58 3.72 11.83 998.7 10.07230-Nov-17 1.89 24.52 1.19 28.10 21.38 5.93 47.60 35.96 21397.6 7.58 0.50 0.56 0.50 0.56 3.58 11.64 998.7 10.0721-Dec-17 1.95 24.33 1.23 27.97 21.86 6.06 47.58 35.37 21201.9 7.51 0.52 0.53 0.52 0.53 3.64 12.20 998.7 10.0722-Dec-17 1.89 24.22 1.22 27.95 21.38 5.93 47.31 34.97 21011.4 7.44 0.53 0.53 0.53 0.51 3.73 12.34 998.8 10.0713-Dec-17 1.89 24.27 1.21 27.98 21.39 5.93 47.36 35.04 20952.2 7.42 0.52 0.53 0.53 0.51 3.71 12.31 998.7 10.0714-Dec-17 1.90 24.37 1.22 28.11 21.49 5.96 47.77 35.42 21128.4 7.49 0.52 0.53 0.53 0.52 3.73 12.35 998.7 10.0725-Dec-17 1.89 24.78 1.21 28.48 21.38 5.93 48.05 36.16 21691.2 7.68 0.52 0.54 0.51 0.55 3.71 11.88 998.7 10.0726-Dec-17 1.90 24.96 1.21 28.67 21.40 5.94 47.85 36.18 22129.9 7.84 0.53 0.52 0.51 0.55 3.71 11.67 998.7 10.0727-Dec-17 1.92 25.14 1.22 28.85 21.46 5.95 48.09 36.35 22074.1 7.82 0.53 0.52 0.51 0.55 3.71 11.74 998.7 10.0728-Dec-17 1.92 25.26 1.22 28.93 21.53 5.97 48.27 36.49 21819.2 7.73 0.52 0.53 0.51 0.55 3.67 11.78 998.7 10.0729-Dec-17 1.91 25.37 1.21 29.07 21.54 5.98 48.47 36.65 21979.7 7.79 0.53 0.52 0.51 0.55 3.71 11.82 998.6 10.07210-Dec-17 1.92 25.22 1.21 28.97 21.63 6.00 48.29 36.49 22355.7 7.92 0.54 0.51 0.51 0.55 3.75 11.80 998.7 10.07211-Dec-17 1.75 25.30 1.09 29.40 20.89 5.80 49.40 37.03 22530.3 7.98 0.54 0.50 0.51 0.55 4.10 12.37 998.6 10.07312-Dec-17 1.95 25.35 1.23 29.27 21.71 6.02 49.14 36.89 22606.5 8.01 0.54 0.49 0.51 0.54 3.92 12.24 998.6 10.07213-Dec-17 1.95 25.24 1.23 29.12 21.39 5.93 49.06 36.92 22270.7 7.89 0.53 0.52 0.51 0.55 3.89 12.14 998.6 10.07214-Dec-17 1.94 25.22 1.23 29.00 21.65 6.01 48.04 36.46 22946.6 8.13 0.55 0.49 0.51 0.56 3.77 11.58 998.7 10.07215-Dec-17 1.96 25.26 1.25 29.13 21.69 6.02 48.27 36.71 23644.1 8.38 0.56 0.47 0.50 0.57 3.87 11.56 998.6 10.07216-Dec-17 1.97 25.73 1.24 29.77 21.65 6.01 49.75 37.71 23595.9 8.36 0.55 0.48 0.50 0.57 4.03 12.04 998.6 10.07317-Dec-17 1.94 26.12 1.21 30.27 21.43 5.94 49.76 37.97 24548.9 8.70 0.57 0.44 0.50 0.57 4.15 11.80 998.6 10.07318-Dec-17 1.93 26.78 1.21 30.94 21.48 5.96 49.49 38.29 25911.5 9.18 0.60 0.40 0.49 0.58 4.15 11.20 998.5 10.07320-Dec-17 1.98 26.92 1.27 30.90 21.88 6.07 50.11 38.56 24550.7 8.70 0.57 0.44 0.50 0.57 3.98 11.54 998.5 10.07321-Dec-17 1.96 27.64 1.22 30.94 21.94 6.08 49.83 38.38 20557.1 7.28 0.50 0.58 0.52 0.54 3.30 11.45 998.4 10.07326-Dec-17 2.00 25.75 1.21 29.63 22.04 6.11 52.59 39.28 20863.5 7.39 0.48 0.60 0.50 0.58 3.88 13.31 998.6 10.07427-Dec-17 2.01 25.71 1.23 29.58 22.08 6.12 52.59 39.26 20821.9 7.38 0.48 0.60 0.50 0.58 3.87 13.34 998.6 10.07428-Dec-17 1.99 25.52 1.23 29.34 22.08 6.12 52.07 38.91 20825.3 7.38 0.48 0.60 0.50 0.58 3.82 13.16 998.6 10.07429-Dec-17 2.03 25.07 1.27 28.72 22.02 6.11 50.31 37.76 20861.8 7.39 0.49 0.59 0.50 0.57 3.66 12.55 998.7 10.07330-Dec-17 2.10 24.99 1.32 28.60 22.23 6.17 50.12 37.56 20803.1 7.37 0.49 0.59 0.50 0.57 3.61 12.56 998.7 10.07331-Dec-17 2.05 24.68 1.27 28.34 22.07 6.12 49.70 37.11 20900.9 7.40 0.49 0.58 0.50 0.56 3.67 12.59 998.7 10.07301-Jan-18 2.03 24.63 1.26 28.41 21.92 6.08 49.97 37.35 21328.7 7.56 0.50 0.57 0.50 0.57 3.78 12.62 998.7 10.07302-Jan-18 2.00 24.70 1.24 28.49 21.75 6.03 49.86 37.30 21365.8 7.57 0.50 0.57 0.50 0.57 3.79 12.55 998.7 10.07303-Jan-18 2.01 25.01 1.25 28.84 21.76 6.04 50.69 37.92 21269.0 7.54 0.50 0.58 0.50 0.57 3.84 12.77 998.7 10.07304-Jan-18 2.01 25.62 1.24 29.32 21.76 6.04 51.38 38.54 20404.0 7.23 0.48 0.61 0.50 0.57 3.70 12.84 998.6 10.07405-Jan-18 2.00 26.06 1.24 29.61 21.69 6.02 51.08 38.29 19566.9 6.93 0.47 0.62 0.51 0.55 3.55 12.78 998.6 10.07306-Jan-18 2.00 25.17 1.23 28.31 21.63 6.00 48.10 36.73 19456.5 6.89 0.45 0.65 0.50 0.58 3.14 11.37 998.7 10.07207-Jan-18 2.02 24.86 1.23 28.52 21.55 5.98 50.31 37.40 19884.7 7.04 0.47 0.62 0.51 0.56 3.66 12.91 998.7 10.07308-Jan-18 2.04 24.68 1.24 28.24 21.83 6.06 49.88 36.95 19595.9 6.94 0.47 0.62 0.51 0.55 3.57 12.92 998.7 10.07309-Jan-18 2.05 24.35 1.25 28.12 21.96 6.09 50.05 36.89 20473.5 7.25 0.49 0.59 0.51 0.55 3.77 13.15 998.7 10.07310-Jan-18 2.04 24.16 1.24 28.14 21.89 6.07 49.85 36.79 21655.1 7.67 0.52 0.54 0.51 0.55 3.97 13.06 998.7 10.07311-Jan-18 2.04 24.28 1.23 28.39 21.85 6.06 49.90 36.85 22367.2 7.92 0.53 0.51 0.51 0.55 4.11 13.05 998.7 10.07312-Jan-18 2.04 24.51 1.24 28.75 21.92 6.08 50.27 36.60 22127.8 7.84 0.55 0.48 0.53 0.52 4.24 13.66 998.7 10.07313-Jan-18 2.05 24.66 1.24 29.01 21.94 6.09 51.18 36.95 21788.7 7.72 0.55 0.49 0.54 0.51 4.35 14.23 998.7 10.07314-Jan-18 2.05 24.98 1.24 29.30 21.92 6.08 51.70 37.43 21602.0 7.65 0.54 0.50 0.53 0.51 4.32 14.26 998.7 10.07315-Jan-18 2.08 26.09 1.25 30.44 22.09 6.13 50.08 37.16 24180.8 8.57 0.61 0.38 0.54 0.50 4.35 12.93 998.5 10.07316-Jan-18 2.10 24.52 1.26 30.20 22.11 6.13 51.17 36.92 28661.1 10.15 0.72 0.19 0.53 0.51 5.68 14.25 998.6 10.07317-Jan-18 2.08 24.57 1.25 29.73 21.89 6.07 50.64 36.73 26380.6 9.35 0.66 0.29 0.53 0.51 5.16 13.92 998.7 10.07318-Jan-18 2.10 24.55 1.26 28.98 21.95 6.09 50.06 36.43 23196.2 8.22 0.58 0.43 0.53 0.51 4.43 13.63 998.7 10.0737-Feb-18 2.00 24.19 1.32 27.87 23.13 6.42 49.32 35.66 20278.4 7.18 0.52 0.54 0.54 0.49 3.68 13.66 998.8 10.0728-Feb-18 2.03 24.36 1.34 27.98 23.25 6.45 49.19 35.65 20211.2 7.16 0.52 0.54 0.55 0.49 3.62 13.54 998.7 10.0729-Feb-18 2.04 24.52 1.34 28.20 23.30 6.46 49.71 36.01 20370.8 7.22 0.52 0.54 0.54 0.49 3.68 13.69 998.7 10.07210-Feb-18 2.05 24.56 1.34 28.34 23.28 6.46 49.99 36.23 20770.8 7.36 0.53 0.52 0.54 0.50 3.77 13.76 998.7 10.07211-Feb-18 2.03 25.85 1.33 29.57 23.22 6.44 51.16 37.37 20373.9 7.22 0.52 0.54 0.54 0.49 3.72 13.79 998.6 10.07312-Feb-18 2.00 27.03 1.31 30.73 23.07 6.40 52.33 38.51 20098.1 7.12 0.51 0.55 0.55 0.49 3.70 13.82 998.5 10.07416-Feb-18 2.06 25.40 1.32 29.03 23.20 6.44 50.59 36.96 20089.6 7.12 0.51 0.55 0.54 0.50 3.63 13.63 998.6 10.07317-Feb-18 2.07 24.27 1.32 27.95 23.25 6.45 49.40 35.90 20637.7 7.31 0.52 0.54 0.54 0.50 3.68 13.50 998.7 10.07218-Feb-18 2.08 24.27 1.33 27.96 23.27 6.46 49.54 35.99 20619.4 7.31 0.52 0.54 0.54 0.51 3.69 13.56 998.7 10.07219-Feb-18 2.08 25.55 1.32 29.15 23.30 6.46 50.70 37.20 20202.8 7.16 0.51 0.56 0.54 0.51 3.60 13.51 998.6 10.07320-Feb-18 2.09 25.71 1.32 29.43 23.66 6.56 51.26 37.02 20104.8 7.12 0.52 0.53 0.56 0.47 3.72 14.24 998.6 10.07321-Feb-18 2.10 25.83 1.32 29.55 23.97 6.65 51.23 36.88 20230.6 7.17 0.53 0.51 0.56 0.46 3.72 14.35 998.6 10.07322-Feb-18 2.11 26.02 1.32 29.71 23.90 6.63 51.23 36.99 20155.6 7.14 0.53 0.51 0.56 0.46 3.69 14.24 998.6 10.07323-Feb-18 2.11 26.05 1.31 29.40 23.80 6.60 51.32 37.10 18214.3 6.45 0.48 0.60 0.56 0.46 3.34 14.22 998.6 10.07324-Feb-18 2.08 25.77 1.45 29.21 27.90 7.74 48.80 34.11 21266.7 7.53 0.63 0.34 0.64 0.33 3.44 14.68 998.6 10.07225-Feb-18 2.11 24.71 1.44 28.10 28.50 7.91 47.53 32.95 21609.6 7.66 0.65 0.32 0.64 0.33 3.40 14.58 998.7 10.07126-Feb-18 2.11 24.45 1.43 27.83 28.74 7.97 47.22 32.68 21701.7 7.69 0.65 0.31 0.64 0.33 3.37 14.54 998.7 10.07127-Feb-18 2.18 24.42 1.46 27.75 29.52 8.19 47.68 32.75 21464.0 7.60 0.64 0.32 0.64 0.32 3.34 14.92 998.8 10.07128-Feb-18 2.21 24.50 1.47 27.90 29.82 8.27 48.13 32.97 21775.3 7.71 0.65 0.30 0.64 0.33 3.40 15.16 998.7 10.07101-Mar-18 2.18 24.71 1.45 28.23 29.81 8.27 48.98 33.50 22090.0 7.83 0.66 0.29 0.64 0.33 3.52 15.47 998.7 10.07102-Mar-18 2.17 25.01 1.43 28.54 29.92 8.30 49.35 33.80 22113.8 7.83 0.66 0.29 0.64 0.33 3.53 15.55 998.7 10.07203-Mar-18 2.17 25.18 1.43 28.63 29.74 8.25 48.91 33.64 21859.6 7.74 0.66 0.30 0.64 0.32 3.45 15.27 998.7 10.07104-Mar-18 2.18 25.27 1.44 28.71 29.78 8.26 49.15 33.79 21682.6 7.68 0.65 0.31 0.64 0.32 3.44 15.36 998.7 10.07205-Mar-18 2.21 25.39 1.51 28.89 28.65 7.95 49.01 33.85 21461.6 7.60 0.64 0.32 0.64 0.32 3.49 15.17 998.7 10.07206-Mar-18 2.24 25.23 1.58 28.83 27.59 7.65 48.69 33.69 21525.8 7.63 0.64 0.32 0.64 0.33 3.60 15.00 998.7 10.07107-Mar-18 2.26 24.88 1.59 28.52 27.84 7.72 48.72 33.50 21625.3 7.66 0.65 0.32 0.64 0.33 3.63 15.22 998.7 10.07108-Mar-18 2.34 25.09 1.62 28.60 28.98 8.04 49.32 33.90 21442.4 7.60 0.64 0.33 0.64 0.33 3.51 15.41 998.7 10.07209-Mar-18 2.36 24.65 1.64 28.15 29.05 8.06 48.95 33.53 21406.3 7.58 0.64 0.33 0.63 0.34 3.49 15.42 998.7 10.07110-Mar-18 2.30 24.46 1.60 27.97 28.18 7.82 48.19 33.13 21368.3 7.57 0.63 0.34 0.63 0.34 3.51 15.06 998.7 10.07111-Mar-18 2.29 24.53 1.60 28.04 28.12 7.80 48.04 33.02 21351.1 7.56 0.64 0.33 0.64 0.33 3.51 15.02 998.7 10.07112-Mar-18 2.29 24.70 1.59 28.26 28.01 7.77 48.25 33.15 21492.4 7.61 0.64 0.32 0.64 0.33 3.56 15.10 998.7 10.07113-Mar-18 2.20 24.81 1.52 28.41 27.11 7.52 48.39 33.33 21073.4 7.47 0.63 0.35 0.64 0.33 3.60 15.06 998.7 10.07114-Mar-18 2.24 25.00 1.56 28.69 26.94 7.47 48.59 33.56 21525.8 7.63 0.64 0.32 0.64 0.33 3.69 15.03 998.7 10.07115-Mar-18 2.25 25.24 1.55 28.98 26.93 7.47 49.17 33.97 21553.5 7.64 0.64 0.33 0.64 0.34 3.74 15.20 998.7 10.07216-Mar-18 2.26 25.51 1.56 29.20 27.00 7.49 49.54 34.35 21322.9 7.55 0.63 0.34 0.63 0.34 3.69 15.19 998.6 10.07217-Mar-18 2.28 25.57 1.56 29.11 27.10 7.52 49.07 34.14 20892.0 7.40 0.62 0.36 0.64 0.34 3.54 14.93 998.6 10.07218-Mar-18 2.30 25.39 1.56 28.90 27.23 7.55 48.88 33.93 20837.9 7.38 0.62 0.36 0.64 0.33 3.51 14.94 998.7 10.07219-Mar-18 2.32 25.40 1.56 29.05 27.38 7.59 49.52 34.23 21255.5 7.53 0.63 0.34 0.63 0.34 3.65 15.30 998.6 10.07220-Mar-18 2.40 24.01 1.61 27.79 27.89 7.74 48.69 33.21 22172.0 7.86 0.65 0.31 0.63 0.35 3.78 15.48 998.8 10.07121-Mar-18 2.45 23.63 1.64 27.24 28.12 7.80 47.83 32.66 21750.4 7.71 0.64 0.33 0.63 0.35 3.61 15.17 998.8 10.07122-Mar-18 2.45 23.62 1.64 27.18 28.13 7.81 47.61 32.61 21727.1 7.70 0.64 0.33 0.63 0.35 3.56 15.00 998.8 10.07123-Mar-18 2.44 23.66 1.62 27.43 27.93 7.75 48.31 32.93 22238.7 7.88 0.65 0.31 0.62 0.36 3.77 15.38 998.8 10.07124-Mar-18 2.42 23.64 1.61 27.35 27.50 7.63 47.83 32.70 21942.8 7.77 0.64 0.32 0.63 0.35 3.71 15.13 998.8 10.07125-Mar-18 2.44 23.62 1.62 27.36 27.44 7.61 47.85 32.73 22119.0 7.84 0.65 0.32 0.62 0.36 3.74 15.11 998.8 10.07126-Mar-18 2.44 23.70 1.61 27.56 27.43 7.61 48.20 33.00 22682.7 8.04 0.66 0.30 0.62 0.36 3.86 15.20 998.8 10.071
Cold fluid
(Water)
Hot fluid
(Air)
Density
(Water)DateCold exchanger working fluid (Water) Hot exchanger working fluid (Air) Effectiveness
Fouling
Factor
ε and FF, corrected by the
median value
Heat Exchanger Fouling and Cleaning – 2019
ISBN: 978-0-9984188-1-0; Published online www.heatexchanger-fouling.com