introduction to hmis - national health systems
TRANSCRIPT
INTRODUCTION TO HMIS
Health Management Information Systems(HMIS)
Definition: ‘Health Management Information Systems (HMIS)’ is a tool which helps in gathering, aggregating, analyzing and using information for taking actions to improve performance of health systems.
The Mandate of HMIS: To ensure that there is a continuous flow of good quality disaggregated data on health of populations and health care services to assist in local planning , programme implementation, management, monitoring and evaluation.
PRINCIPLES OF DATA REPORTING Service delivery Data needs to be recorded in primary recording registers as and
when service is delivered. Then monthly it is aggregated and written onto the reporting format.
Data reported should be the services rendered by the providers in that facility(Exceptions- eg ANMs reports all deaths and births in the community as such reporting is one of her tasks).
Each Data should be entered in one form only.( reduce burden and errors)
No data should be collected which does not contribute to at least one indicator.( a data that is not convertible as an indicator can seldom be used at all)
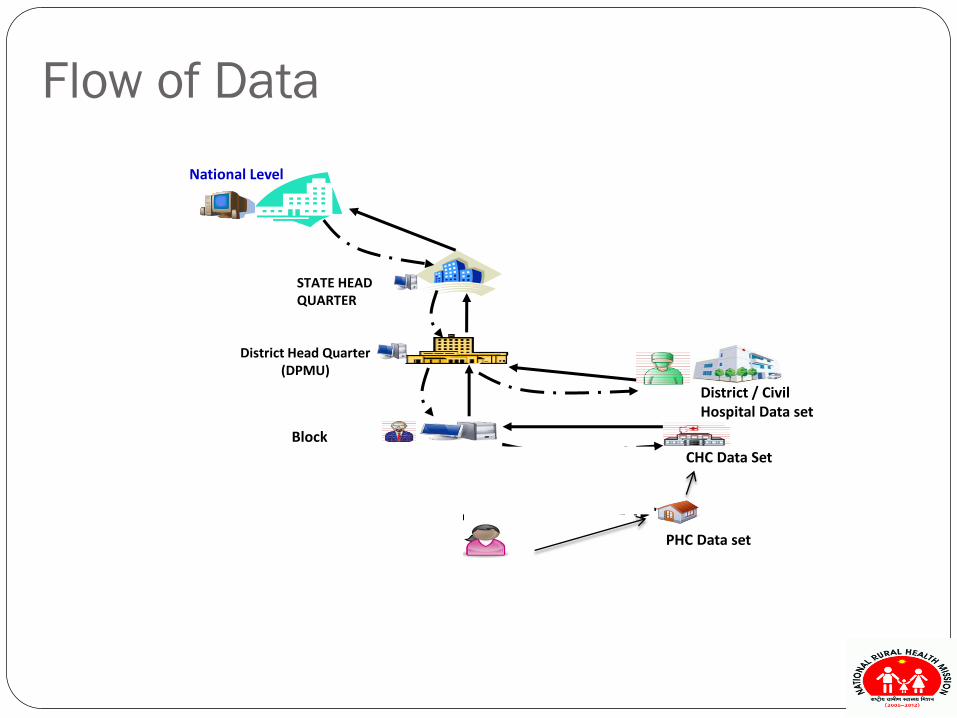
Flow of Data
PHC Data set
Block
CHC Data Set
District Head Quarter
(DPMU)
STATE HEAD
QUARTER
National Level
District / Civil
Hospital Data set
In
di
a
India is my
country
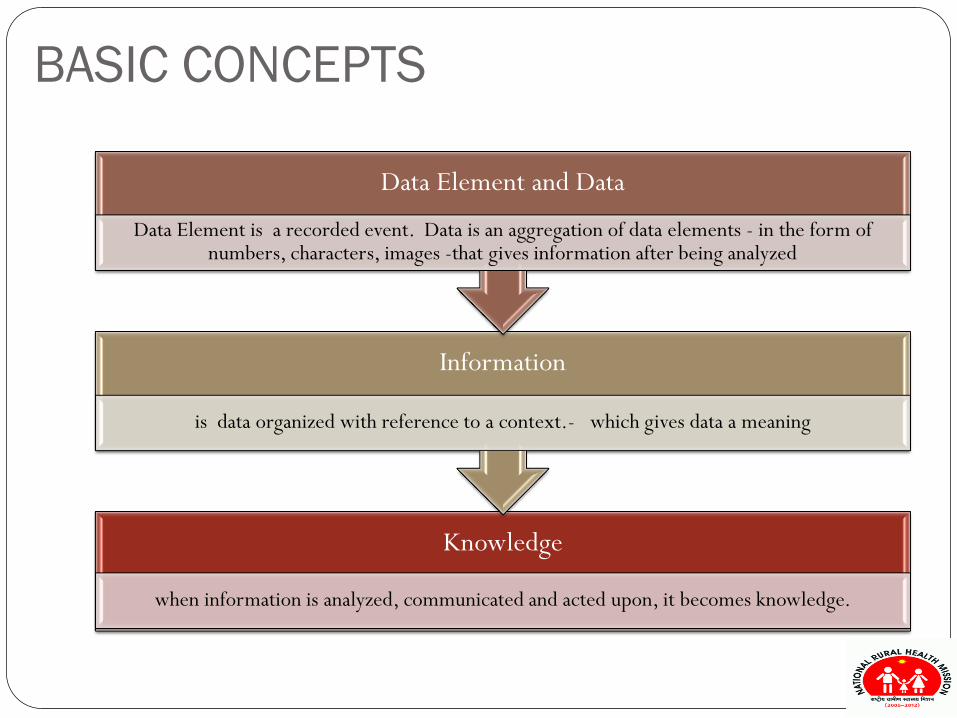
BASIC CONCEPTS
Knowledge
when information is analyzed, communicated and acted upon, it becomes knowledge.
Information
is data organized with reference to a context.- which gives data a meaning
Data Element and Data
Data Element is a recorded event. Data is an aggregation of data elements - in the form of numbers, characters, images -that gives information after being analyzed
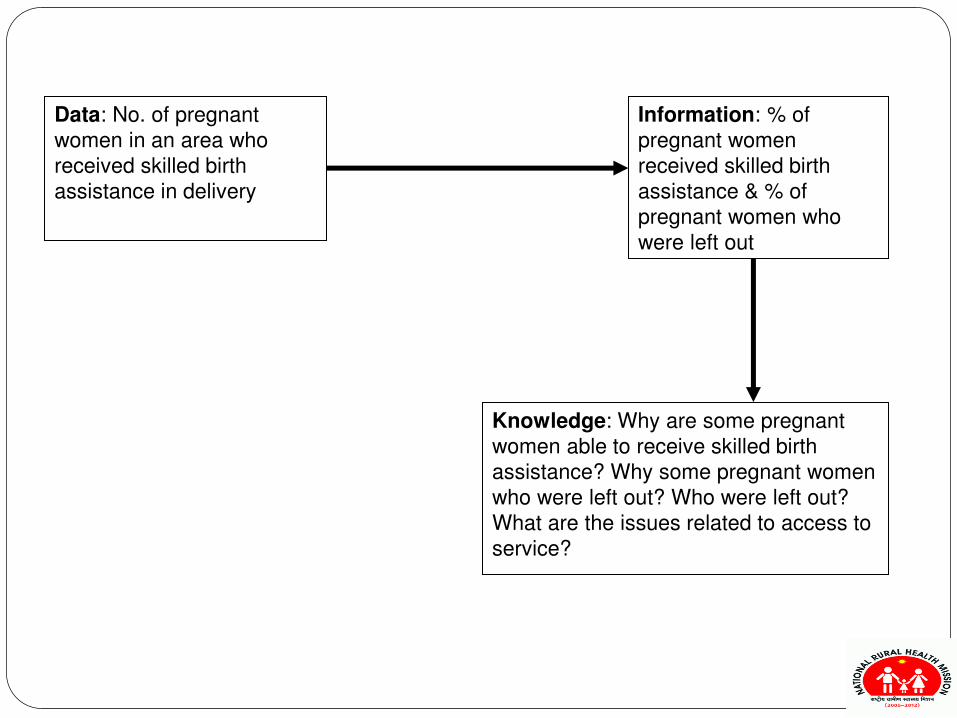
Data: No. of pregnant
women in an area who
received skilled birth
assistance in delivery
Information: % of
pregnant women
received skilled birth
assistance & % of
pregnant women who
were left out
Knowledge: Why are some pregnant
women able to receive skilled birth
assistance? Why some pregnant women
who were left out? Who were left out?
What are the issues related to access to
service?
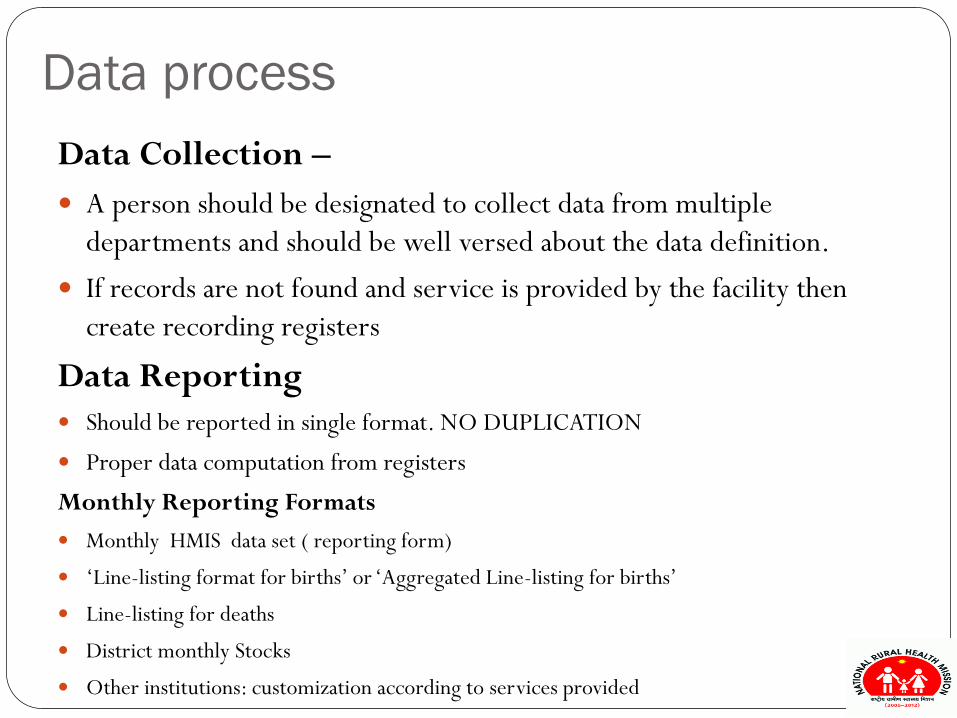
Data process
Data Collection – A person should be designated to collect data from multiple
departments and should be well versed about the data definition.
If records are not found and service is provided by the facility then create recording registers
Data Reporting Should be reported in single format. NO DUPLICATION
Proper data computation from registers
Monthly Reporting Formats
Monthly HMIS data set ( reporting form)
‘Line-listing format for births’ or ‘Aggregated Line-listing for births’
Line-listing for deaths
District monthly Stocks
Other institutions: customization according to services provided
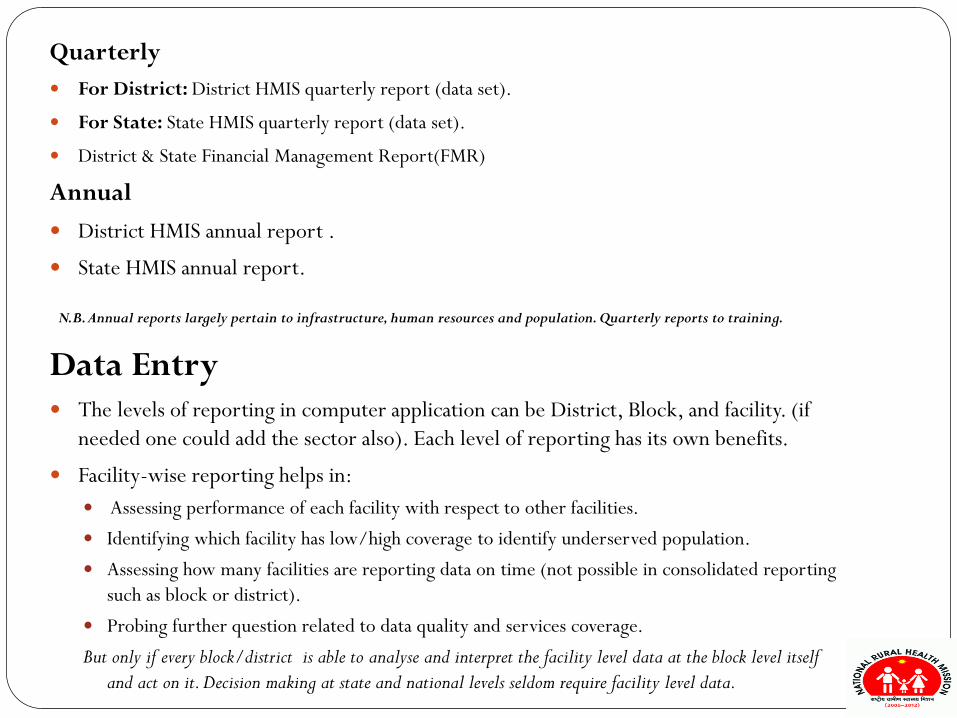
Quarterly
For District: District HMIS quarterly report (data set).
For State: State HMIS quarterly report (data set).
District & State Financial Management Report(FMR)
Annual
District HMIS annual report .
State HMIS annual report.
N.B. Annual reports largely pertain to infrastructure, human resources and population. Quarterly reports to training.
Data Entry The levels of reporting in computer application can be District, Block, and facility. (if
needed one could add the sector also). Each level of reporting has its own benefits.
Facility-wise reporting helps in:
Assessing performance of each facility with respect to other facilities.
Identifying which facility has low/high coverage to identify underserved population.
Assessing how many facilities are reporting data on time (not possible in consolidated reporting such as block or district).
Probing further question related to data quality and services coverage.
But only if every block/district is able to analyse and interpret the facility level data at the block level itself and act on it. Decision making at state and national levels seldom require facility level data.
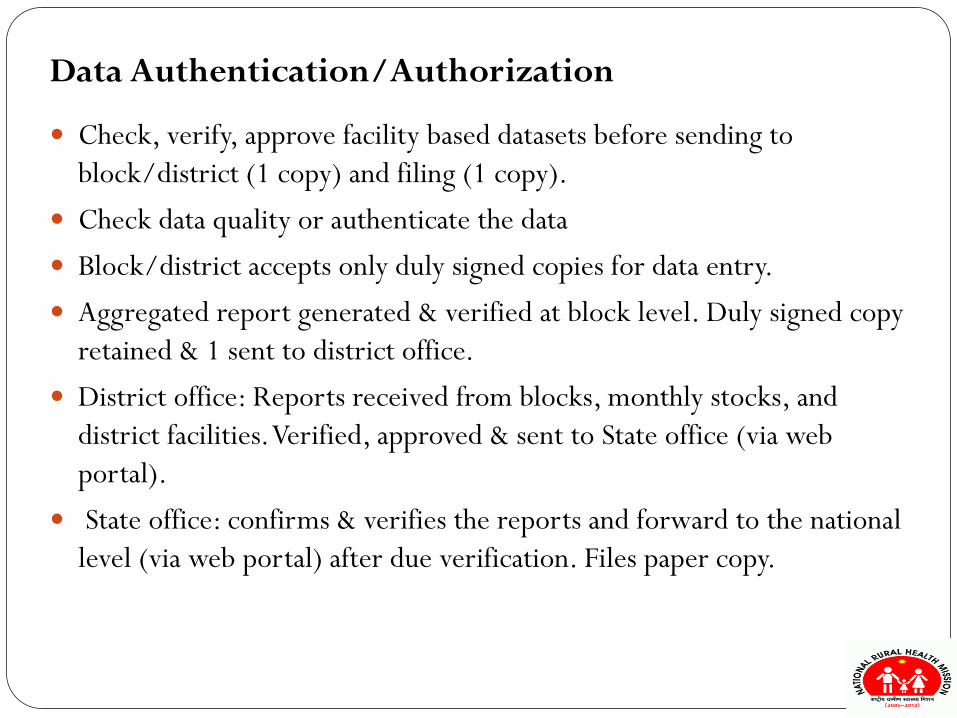
Data Authentication/Authorization
Check, verify, approve facility based datasets before sending to block/district (1 copy) and filing (1 copy).
Check data quality or authenticate the data
Block/district accepts only duly signed copies for data entry.
Aggregated report generated & verified at block level. Duly signed copy retained & 1 sent to district office.
District office: Reports received from blocks, monthly stocks, and district facilities. Verified, approved & sent to State office (via web portal).
State office: confirms & verifies the reports and forward to the national level (via web portal) after due verification. Files paper copy.
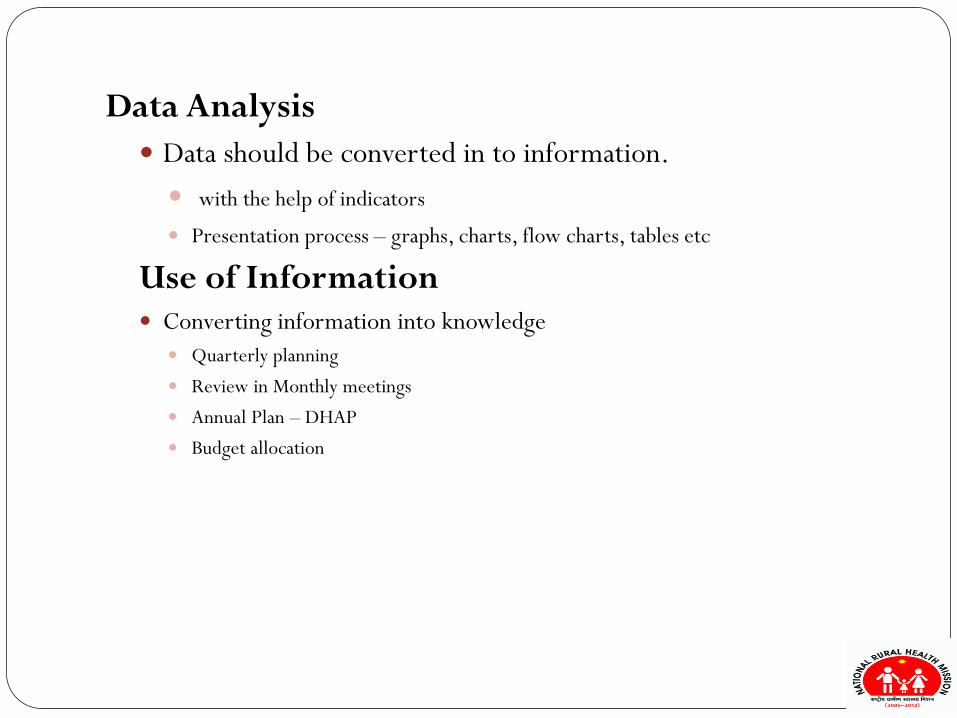
Data Analysis Data should be converted in to information.
with the help of indicators
Presentation process – graphs, charts, flow charts, tables etc
Use of Information Converting information into knowledge
Quarterly planning
Review in Monthly meetings
Annual Plan – DHAP
Budget allocation

THANK YOU!

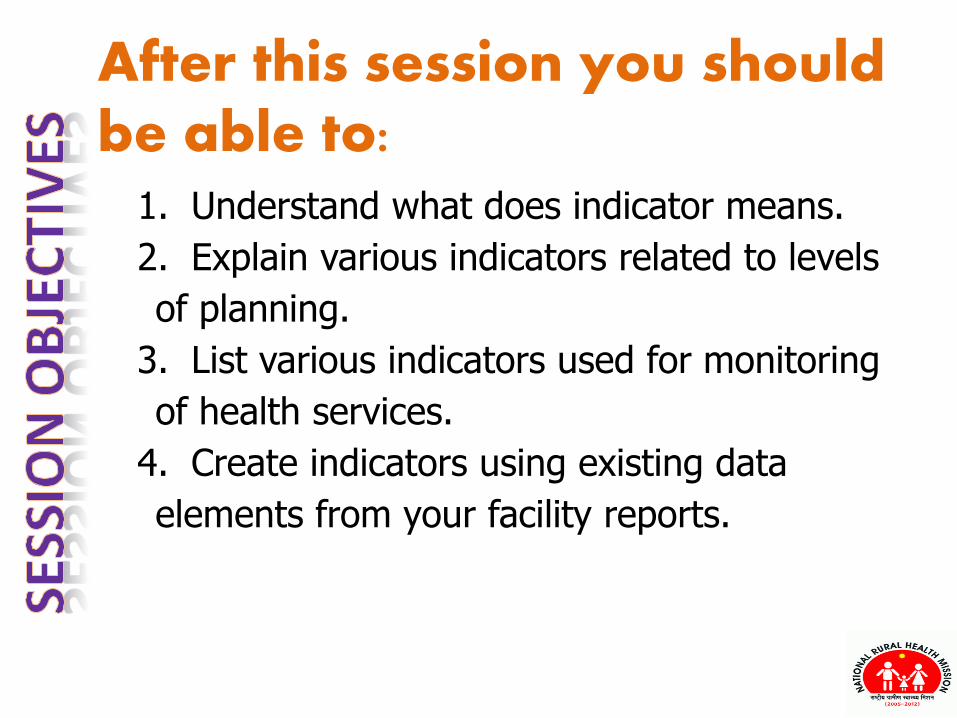
1. Understand what does indicator means.
2. Explain various indicators related to levels
of planning.
3. List various indicators used for monitoring
of health services.
4. Create indicators using existing data
elements from your facility reports.
After this session you should be able to:
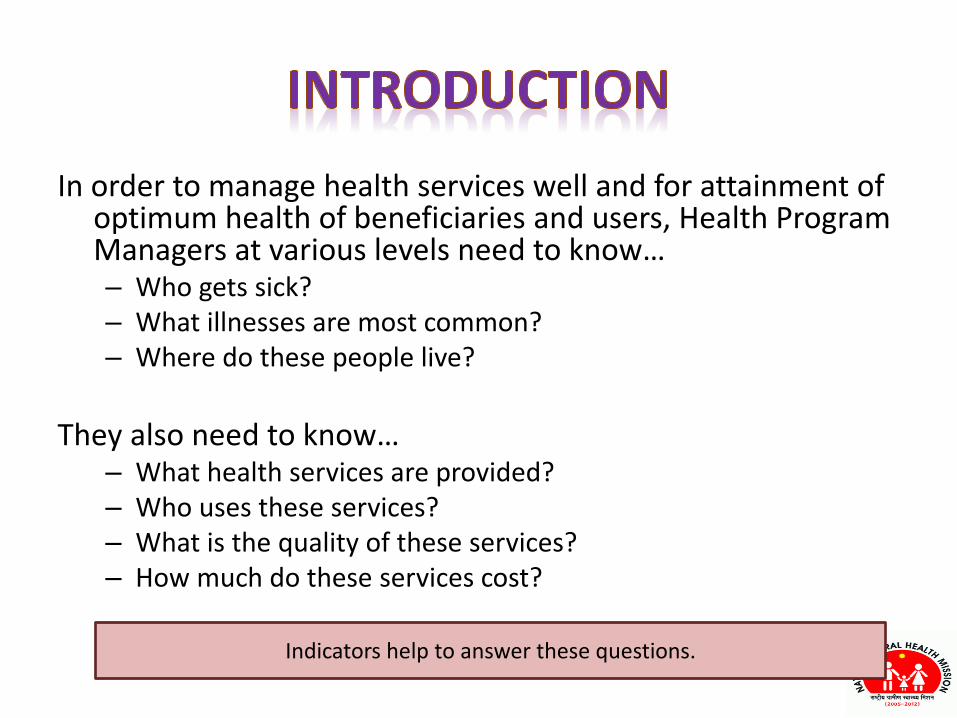
In order to manage health services well and for attainment of optimum health of beneficiaries and users, Health Program Ma agers at arious le els eed to k o … – Who gets sick?
– What illnesses are most common?
– Where do these people live?
They also eed to k o … – What health services are provided?
– Who uses these services?
– What is the quality of these services?
– How much do these services cost?
Indicators help to answer these questions.
• Why do we need indicators?
• We ca ’t use ter s like a lot too a y to describe the status of immunization or any
service delivery.
• We ca ’t co pare the ra data of ser ice deli ery of one facility with other facilities or over time,
because the population served and case loads seen,
and types of illness all vary. But an indicator places
the raw data in context.
• To make data meaningful the use of indicators
is essential.
I di ators are ge erally defi ed as aria les that help to measure changes, directly or
i dire tly . (WHO 1981)
Tools used to o ert ra data i to i for atio

Indicator = Numerator X 100 = .......%
Denominator
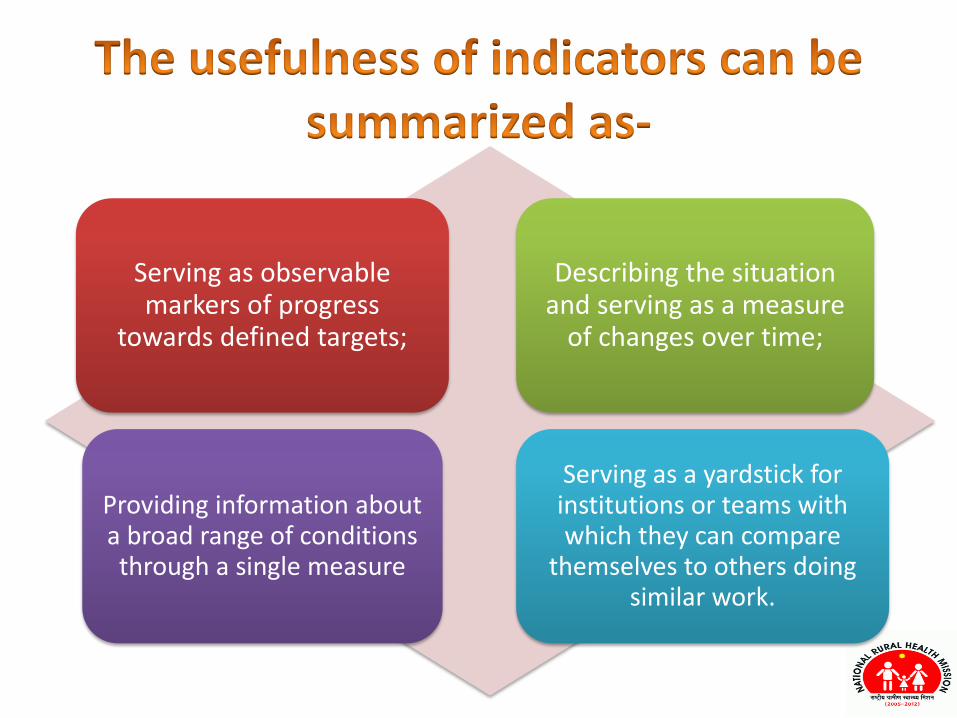
Serving as observable markers of progress
towards defined targets;
Describing the situation and serving as a measure
of changes over time;
Providing information about a broad range of conditions through a single measure
Serving as a yardstick for institutions or teams with which they can compare
themselves to others doing similar work.
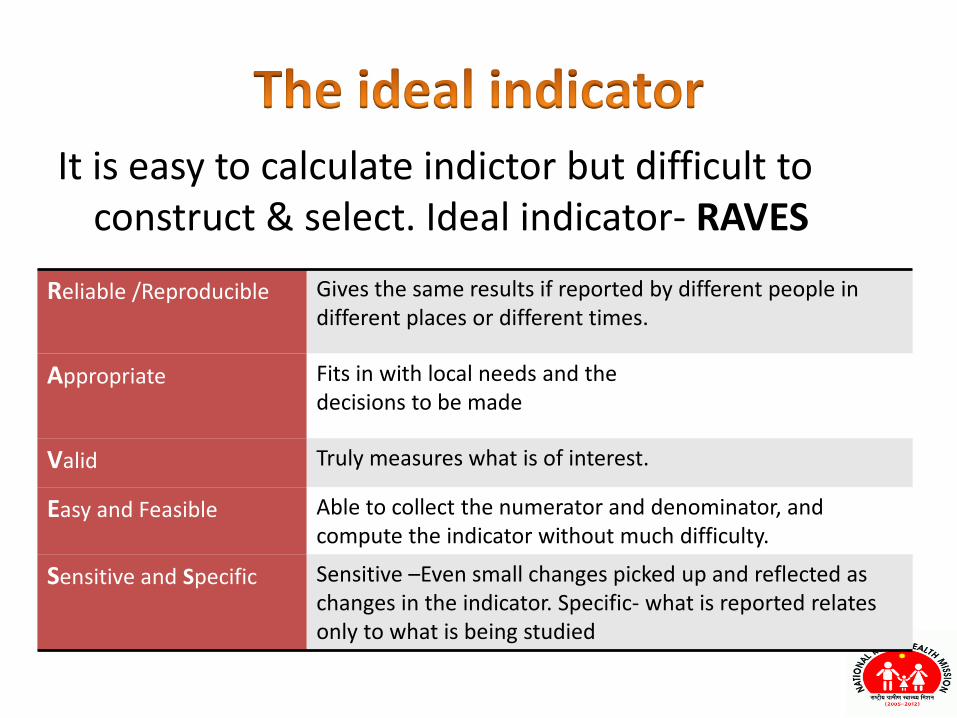
It is easy to calculate indictor but difficult to
construct & select. Ideal indicator- RAVES
Reliable /Reproducible Gives the same results if reported by different people in
different places or different times.
Appropriate Fits in with local needs and the
decisions to be made
Valid Truly measures what is of interest.
Easy and Feasible Able to collect the numerator and denominator, and
compute the indicator without much difficulty.
Sensitive and Specific Sensitive –Even small changes picked up and reflected as
changes in the indicator. Specific- what is reported relates
only to what is being studied
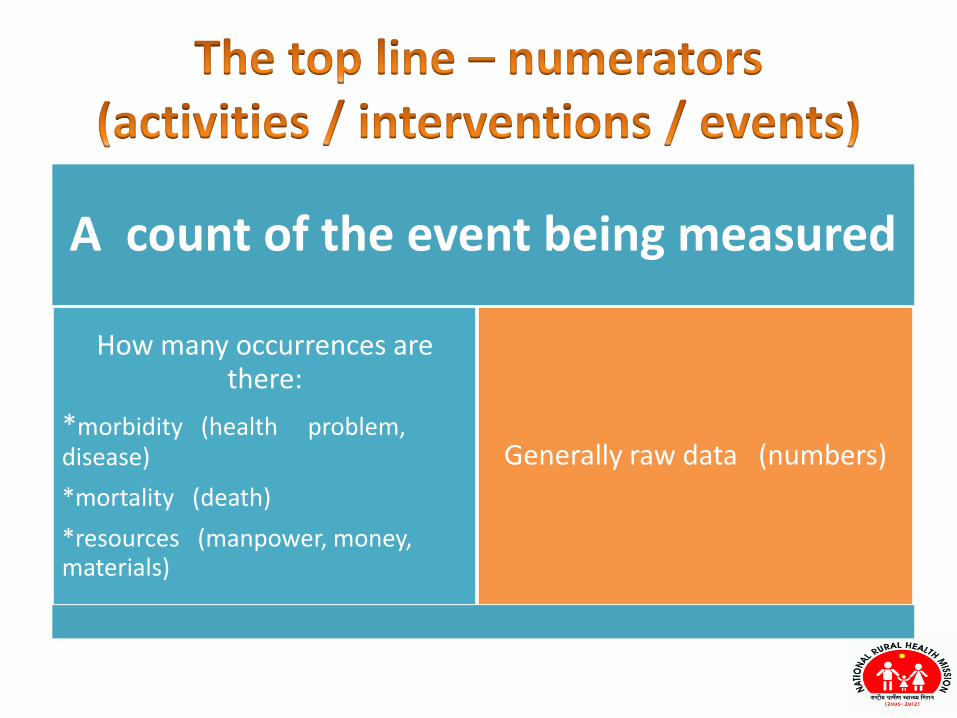
A count of the event being measured
How many occurrences are there:
*morbidity (health problem,
disease)
*mortality (death)
*resources (manpower, money, materials)
Generally raw data (numbers)
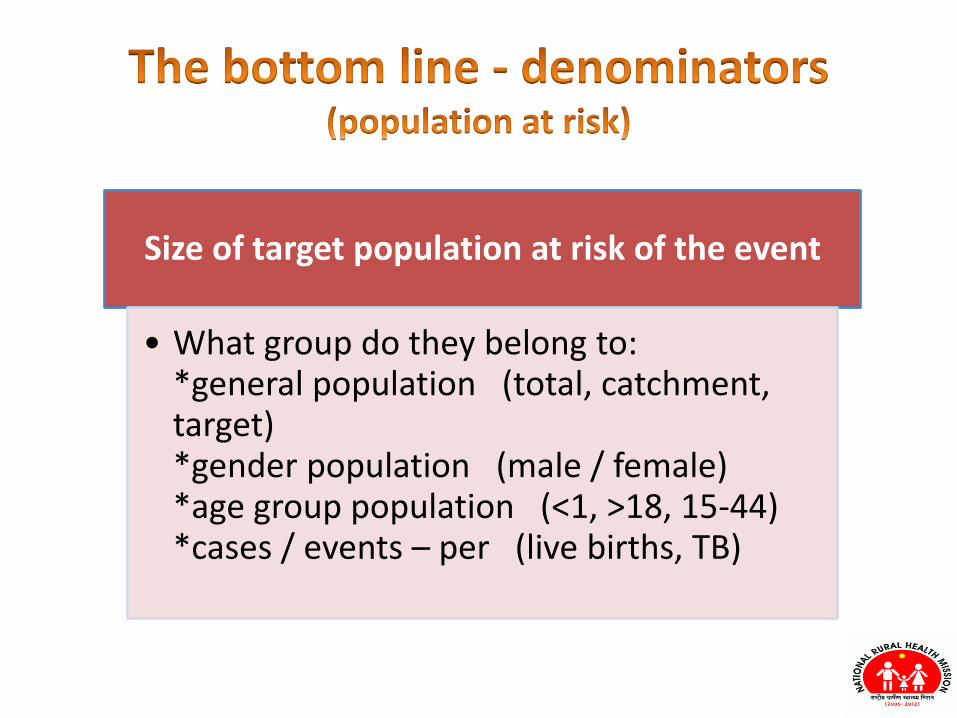
Size of target population at risk of the event
• What group do they belong to: *general population (total, catchment, target) *gender population (male / female) *age group population (<1, >18, 15-44) *cases / events – per (live births, TB)
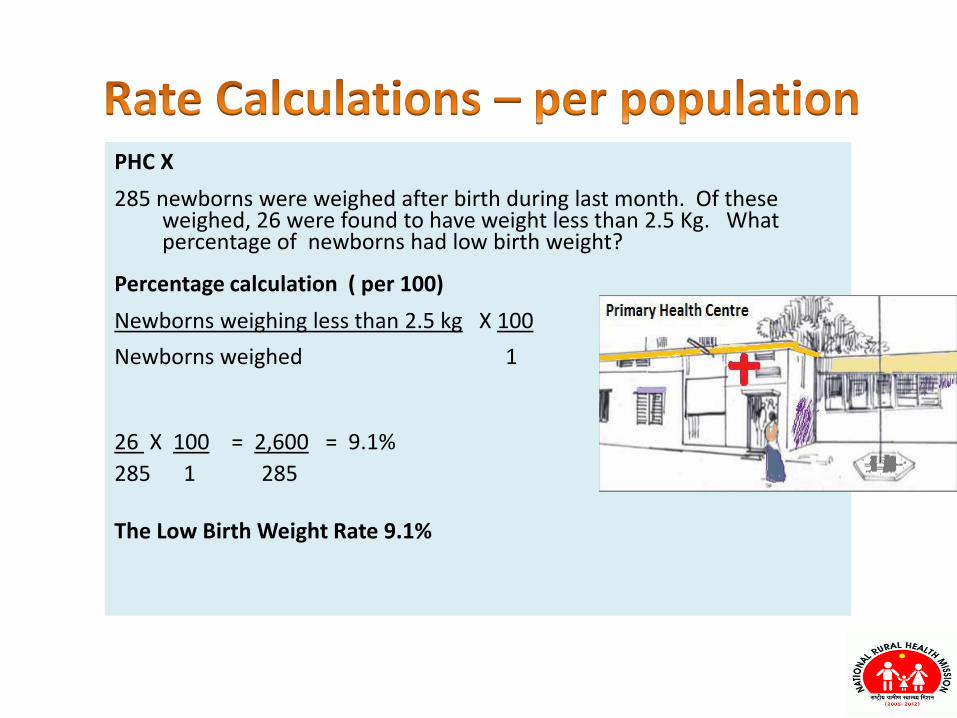
PHC X
285 newborns were weighed after birth during last month. Of these weighed, 26 were found to have weight less than 2.5 Kg. What percentage of newborns had low birth weight?
Percentage calculation ( per 100)
Newborns weighing less than 2.5 kg X 100
Newborns weighed 1
26 X 100 = 2,600 = 9.1%
285 1 285
The Low Birth Weight Rate 9.1%
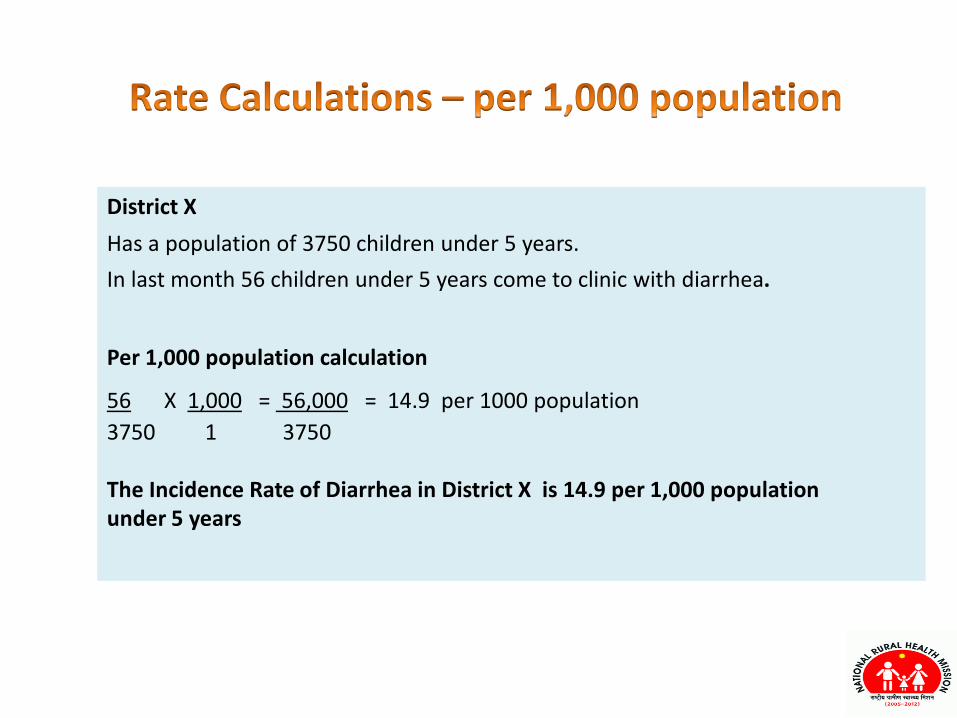
District X
Has a population of 3750 children under 5 years.
In last month 56 children under 5 years come to clinic with diarrhea.
Per 1,000 population calculation
56 X 1,000 = 56,000 = 14.9 per 1000 population
3750 1 3750
The Incidence Rate of Diarrhea in District X is 14.9 per 1,000 population
under 5 years
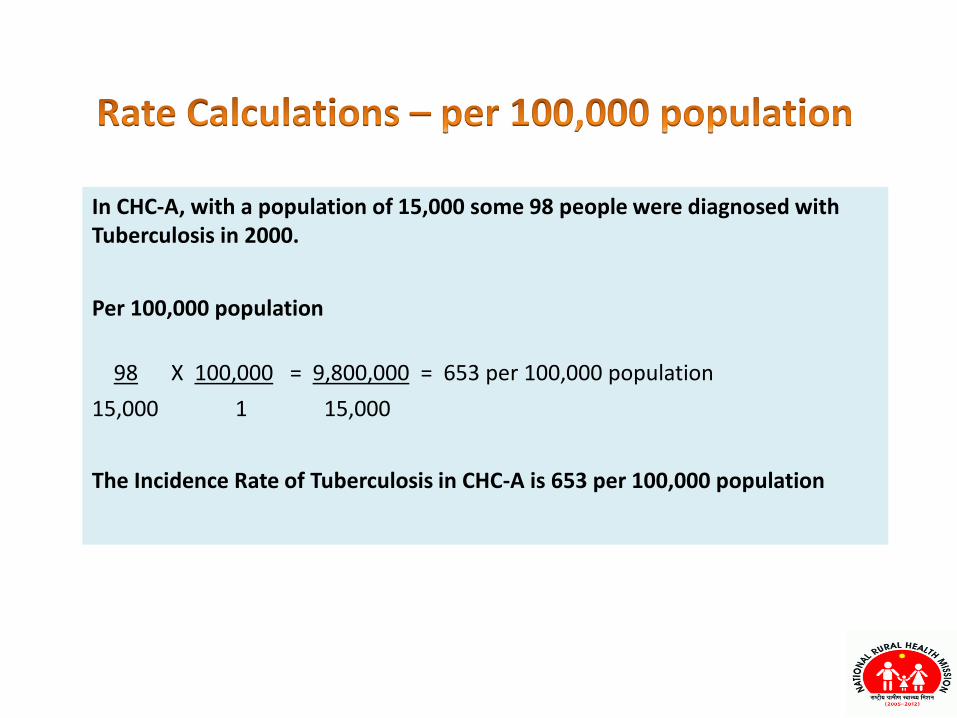
In CHC-A, with a population of 15,000 some 98 people were diagnosed with
Tuberculosis in 2000.
Per 100,000 population
98 X 100,000 = 9,800,000 = 653 per 100,000 population
15,000 1 15,000
The Incidence Rate of Tuberculosis in CHC-A is 653 per 100,000 population
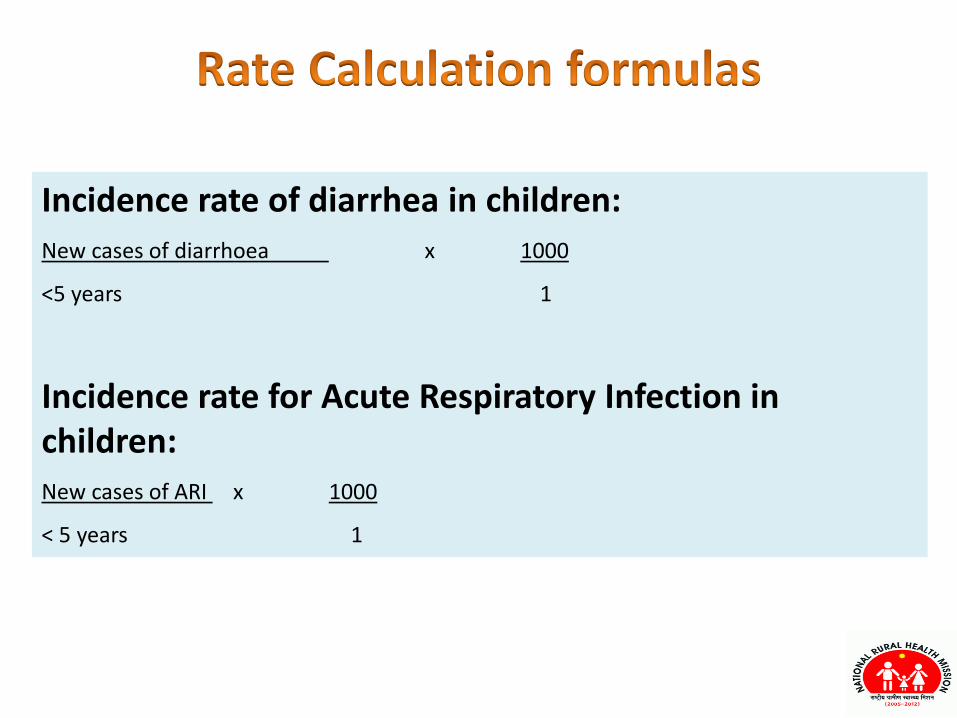
Incidence rate of diarrhea in children:
New cases of diarrhoea x 1000
<5 years 1
Incidence rate for Acute Respiratory Infection in
children:
New cases of ARI x 1000
< 5 years 1
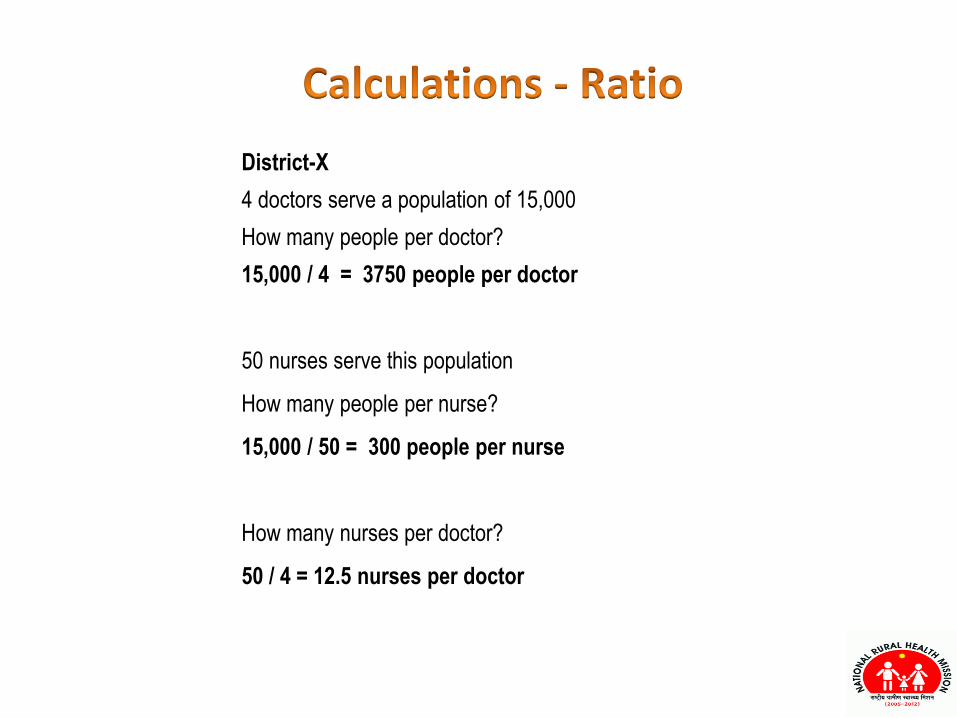
District-X
4 doctors serve a population of 15,000
How many people per doctor?
15,000 / 4 = 3750 people per doctor
50 nurses serve this population
How many people per nurse?
15,000 / 50 = 300 people per nurse
How many nurses per doctor?
50 / 4 = 12.5 nurses per doctor
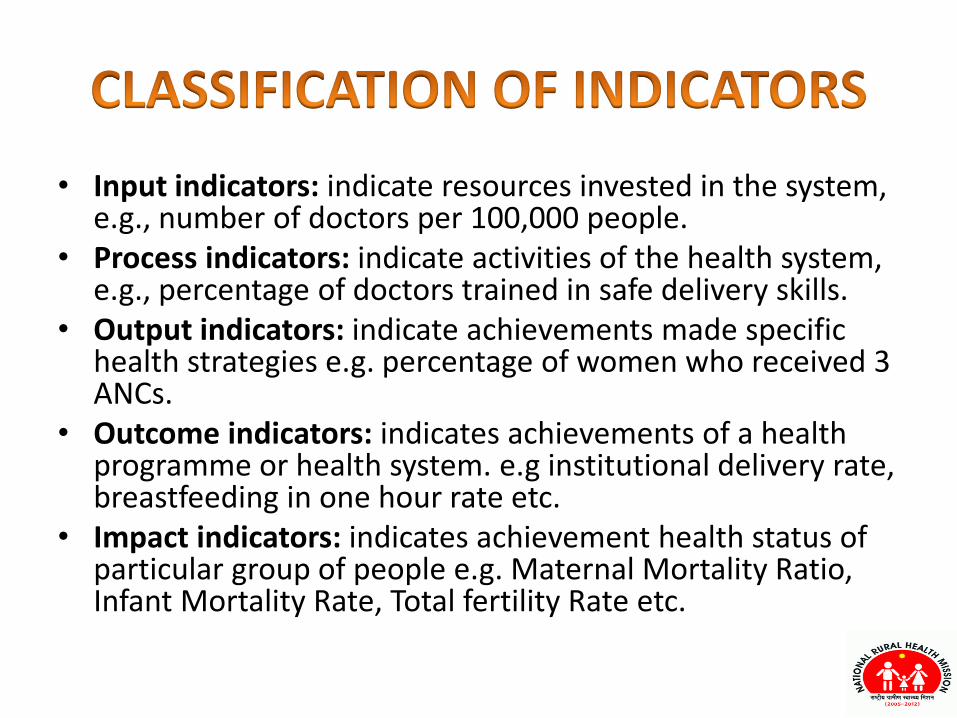
• Input indicators: indicate resources invested in the system, e.g., number of doctors per 100,000 people.
• Process indicators: indicate activities of the health system, e.g., percentage of doctors trained in safe delivery skills.
• Output indicators: indicate achievements made specific health strategies e.g. percentage of women who received 3 ANCs.
• Outcome indicators: indicates achievements of a health programme or health system. e.g institutional delivery rate, breastfeeding in one hour rate etc.
• Impact indicators: indicates achievement health status of particular group of people e.g. Maternal Mortality Ratio, Infant Mortality Rate, Total fertility Rate etc.
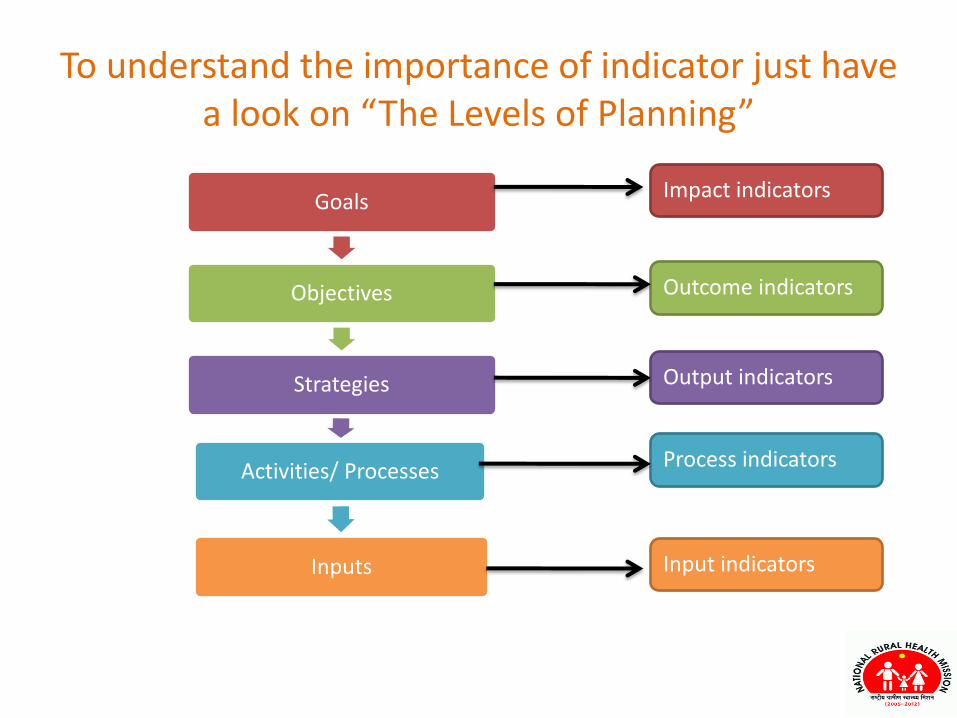
To understand the importance of indicator just have
a look o The Le els of Pla i g
Goals
Objectives
Strategies
Activities/ Processes
Inputs
Impact indicators
Outcome indicators
Process indicators
Input indicators
Output indicators
While indicators are useful tools for measuring
change, they also have some limitations such as:
Indicators are used to alert Managers to potential
problems, possible causes for these problems, and
additional questions that can be asked. Indicators
rarely indicate specific cause of the problem and
possible solution.
– An isolated indicator by itself does not mean much. It
needs comparison over time and across facilities and
Districts to show trends in order to be useful.
• ANTENATAL CARE COVERAGE
• IMMUNISATION COVERAGE INDICATORS
• DELIVERY SERVICES INDICATORS
• POST NATAL CARE INDICATORS
• CHILD & NEONATAL HEALTH INDICATORS
• FAMILY PLANNING COVERAGE INDICATORS
• MORTALITY INDICATORS
• SERVICE DELIVERY INDICATORS
• LABORATORY SERVICES INDICATORS
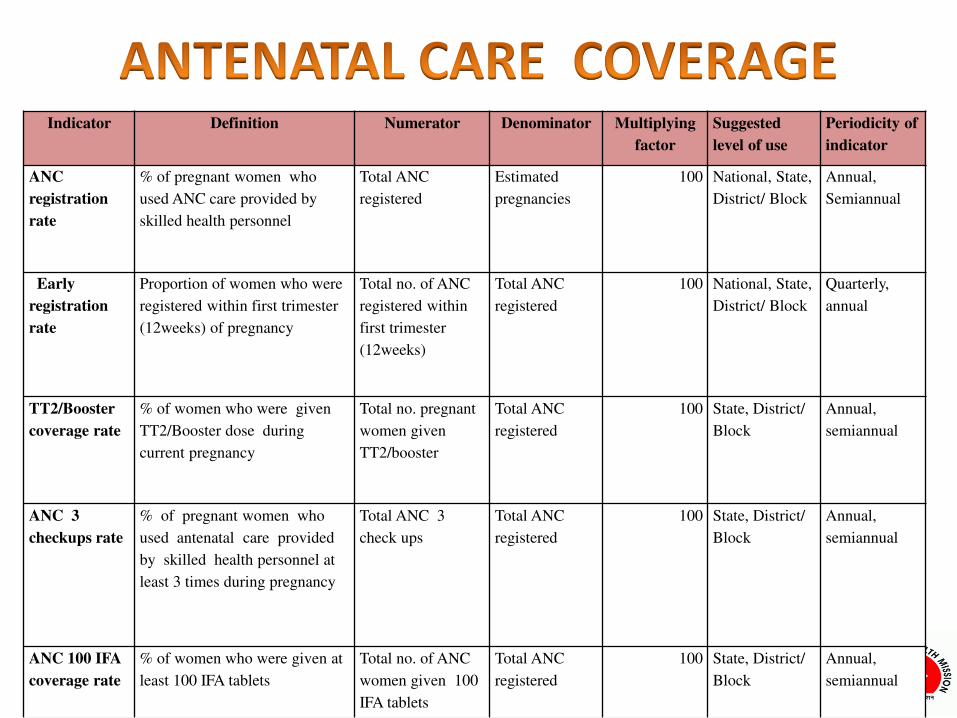
Indicator Definition Numerator Denominator Multiplying
factor
Suggested
level of use
Periodicity of
indicator
ANC
registration
rate
% of pregnant women who
used ANC care provided by
skilled health personnel
Total ANC
registered
Estimated
pregnancies
100 National, State,
District/ Block
Annual,
Semiannual
Early
registration
rate
Proportion of women who were
registered within first trimester
(12weeks) of pregnancy
Total no. of ANC
registered within
first trimester
(12weeks)
Total ANC
registered
100 National, State,
District/ Block
Quarterly,
annual
TT2/Booster
coverage rate
% of women who were given
TT2/Booster dose during
current pregnancy
Total no. pregnant
women given
TT2/booster
Total ANC
registered
100 State, District/
Block
Annual,
semiannual
ANC 3
checkups rate
% of pregnant women who
used antenatal care provided
by skilled health personnel at
least 3 times during pregnancy
Total ANC 3
check ups
Total ANC
registered
100 State, District/
Block
Annual,
semiannual
ANC 100 IFA
coverage rate
% of women who were given at
least 100 IFA tablets
Total no. of ANC
women given 100
IFA tablets
Total ANC
registered
100 State, District/
Block
Annual,
semiannual
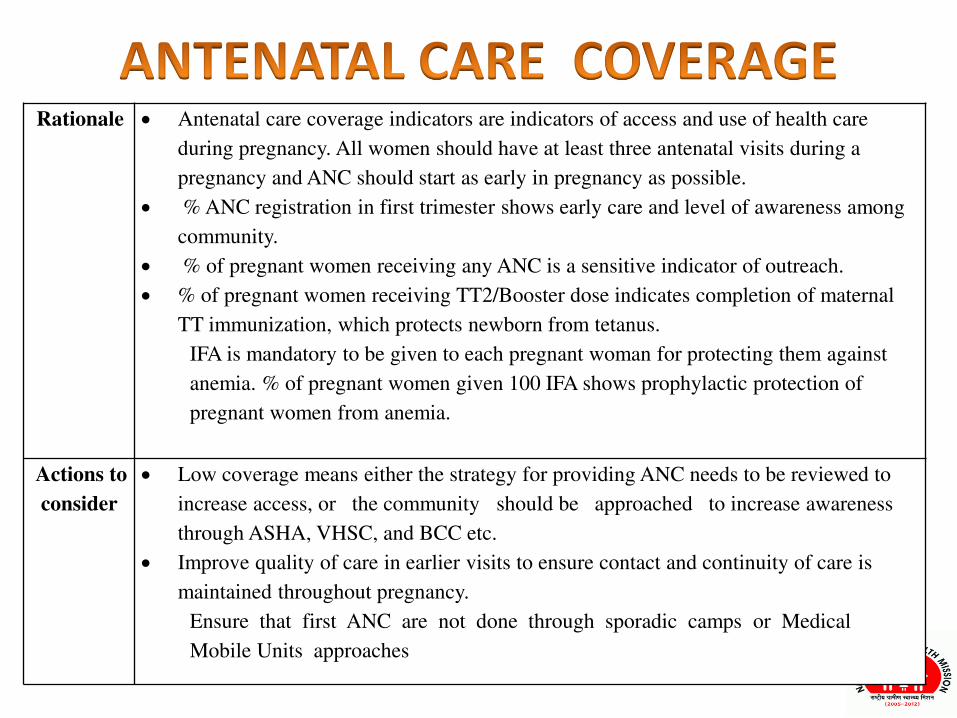
Rationale Antenatal care coverage indicators are indicators of access and use of health care
during pregnancy. All women should have at least three antenatal visits during a
pregnancy and ANC should start as early in pregnancy as possible.
% ANC registration in first trimester shows early care and level of awareness among
community.
% of pregnant women receiving any ANC is a sensitive indicator of outreach.
% of pregnant women receiving TT2/Booster dose indicates completion of maternal
TT immunization, which protects newborn from tetanus.
IFA is mandatory to be given to each pregnant woman for protecting them against
anemia. % of pregnant women given 100 IFA shows prophylactic protection of
pregnant women from anemia.
Actions to
consider
Low coverage means either the strategy for providing ANC needs to be reviewed to
increase access, or the community should be approached to increase awareness
through ASHA, VHSC, and BCC etc.
Improve quality of care in earlier visits to ensure contact and continuity of care is
maintained throughout pregnancy.
Ensure that first ANC are not done through sporadic camps or Medical
Mobile Units approaches
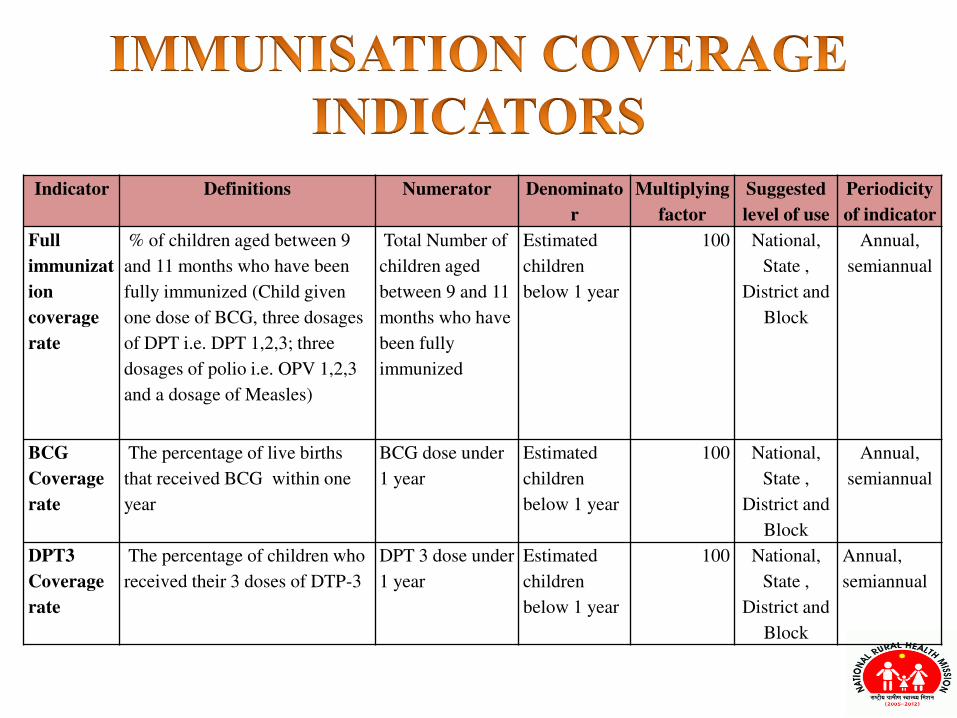
Indicator Definitions Numerator Denominato
r
Multiplying
factor
Suggested
level of use
Periodicity
of indicator
Full
immunizat
ion
coverage
rate
% of children aged between 9
and 11 months who have been
fully immunized (Child given
one dose of BCG, three dosages
of DPT i.e. DPT 1,2,3; three
dosages of polio i.e. OPV 1,2,3
and a dosage of Measles)
Total Number of
children aged
between 9 and 11
months who have
been fully
immunized
Estimated
children
below 1 year
100 National,
State ,
District and
Block
Annual,
semiannual
BCG
Coverage
rate
The percentage of live births
that received BCG within one
year
BCG dose under
1 year
Estimated
children
below 1 year
100 National,
State ,
District and
Block
Annual,
semiannual
DPT3
Coverage
rate
The percentage of children who
received their 3 doses of DTP-3
DPT 3 dose under
1 year
Estimated
children
below 1 year
100 National,
State ,
District and
Block
Annual,
semiannual
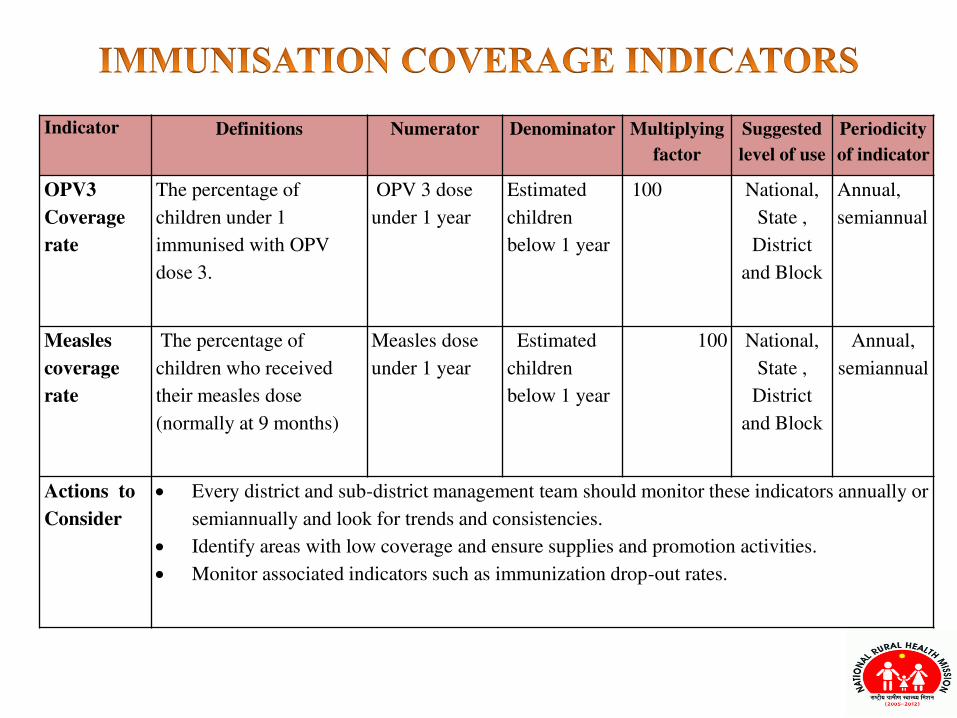
Indicator Definitions Numerator Denominator Multiplying
factor
Suggested
level of use
Periodicity
of indicator
OPV3
Coverage
rate
The percentage of
children under 1
immunised with OPV
dose 3.
OPV 3 dose
under 1 year
Estimated
children
below 1 year
100 National,
State ,
District
and Block
Annual,
semiannual
Measles
coverage
rate
The percentage of
children who received
their measles dose
(normally at 9 months)
Measles dose
under 1 year
Estimated
children
below 1 year
100 National,
State ,
District
and Block
Annual,
semiannual
Actions to
Consider
Every district and sub-district management team should monitor these indicators annually or
semiannually and look for trends and consistencies.
Identify areas with low coverage and ensure supplies and promotion activities.
Monitor associated indicators such as immunization drop-out rates.
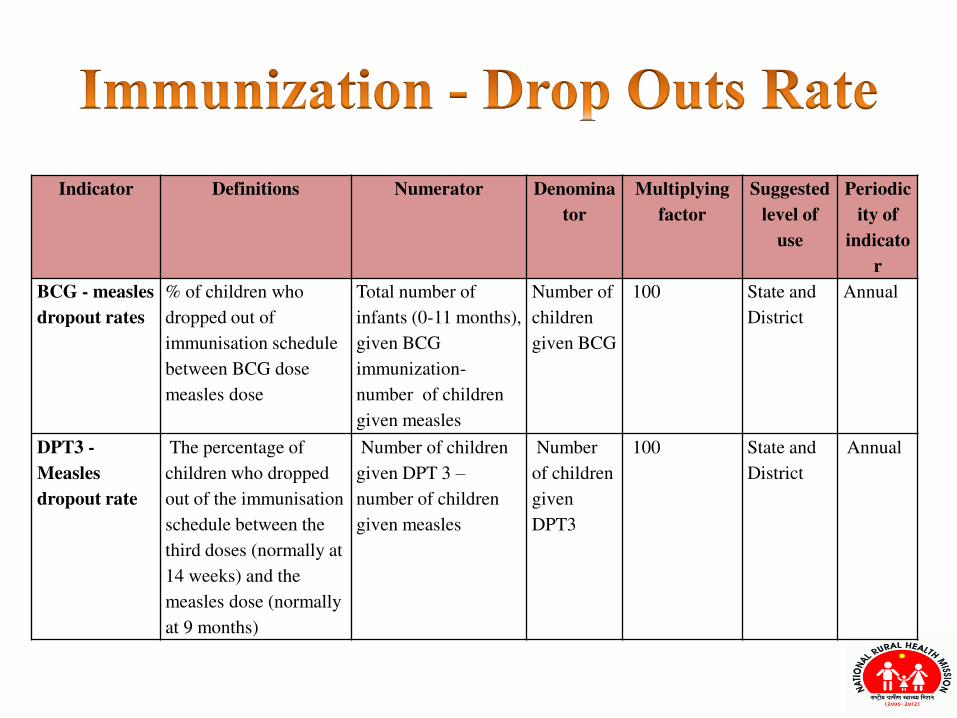
Indicator Definitions Numerator Denomina
tor
Multiplying
factor
Suggested
level of
use
Periodic
ity of
indicato
r
BCG - measles
dropout rates
% of children who
dropped out of
immunisation schedule
between BCG dose
measles dose
Total number of
infants (0-11 months),
given BCG
immunization-
number of children
given measles
Number of
children
given BCG
100 State and
District
Annual
DPT3 -
Measles
dropout rate
The percentage of
children who dropped
out of the immunisation
schedule between the
third doses (normally at
14 weeks) and the
measles dose (normally
at 9 months)
Number of children
given DPT 3 –
number of children
given measles
Number
of children
given
DPT3
100 State and
District
Annual
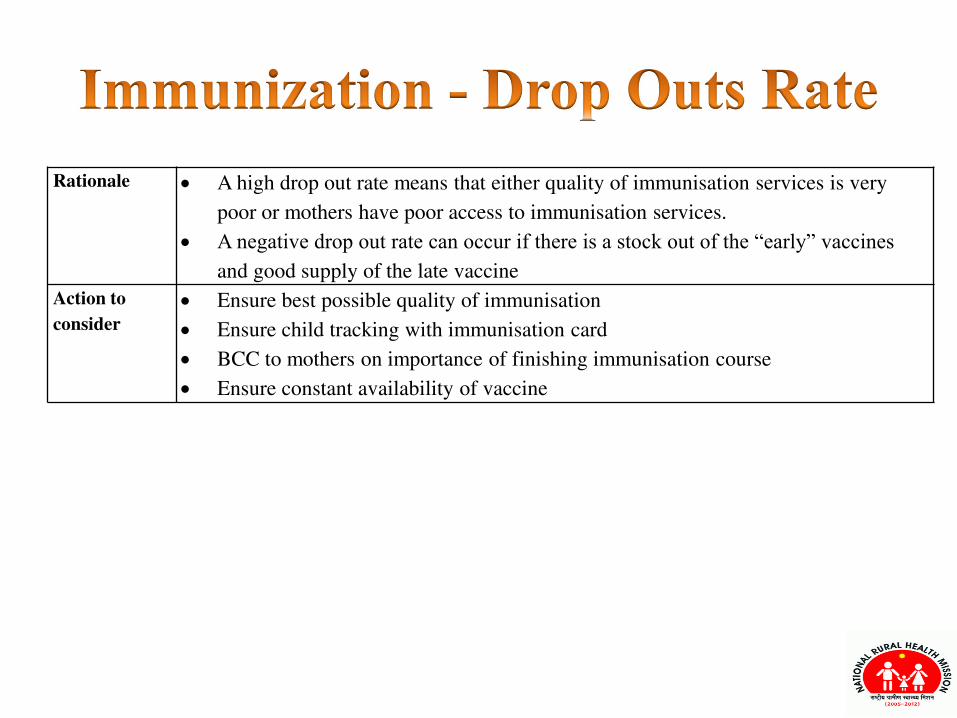
Rationale A high drop out rate means that either quality of immunisation services is very
poor or mothers have poor access to immunisation services.
A negative drop out rate can occur if there is a stock out of the “early” vaccines and good supply of the late vaccine
Action to
consider
Ensure best possible quality of immunisation
Ensure child tracking with immunisation card
BCC to mothers on importance of finishing immunisation course
Ensure constant availability of vaccine
Indicator Definition Numerator Denominator Multiplying
factor
Suggested
level of
use
Periodicity
of indicator
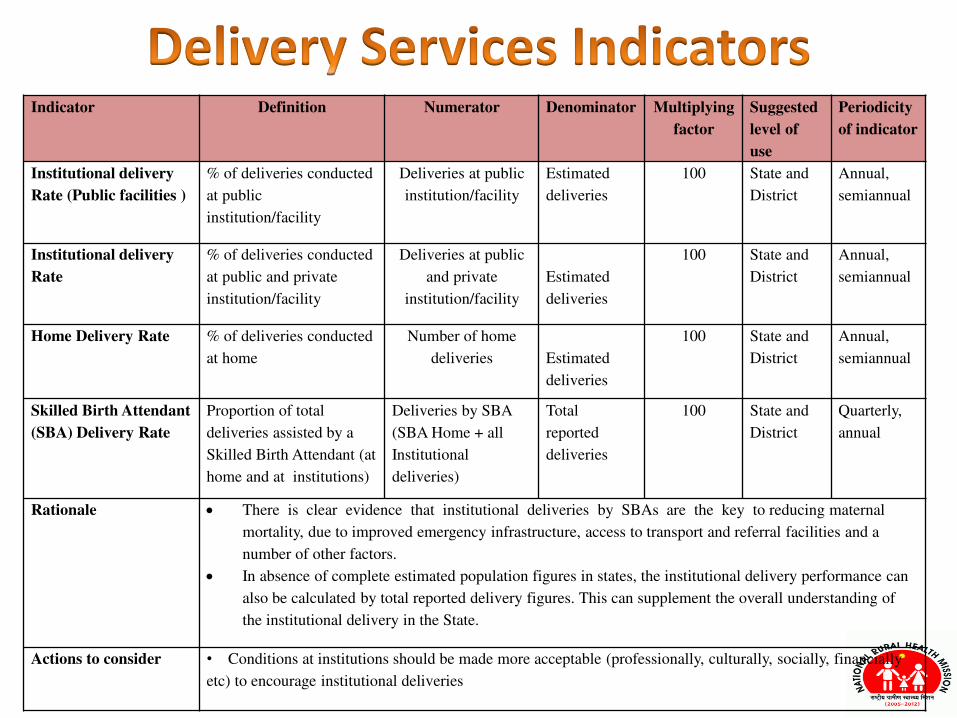
Institutional delivery
Rate (Public facilities )
% of deliveries conducted
at public
institution/facility
Deliveries at public
institution/facility
Estimated
deliveries
100 State and
District
Annual,
semiannual
Institutional delivery
Rate
% of deliveries conducted
at public and private
institution/facility
Deliveries at public
and private
institution/facility
Estimated
deliveries
100 State and
District
Annual,
semiannual
Home Delivery Rate % of deliveries conducted
at home
Number of home
deliveries
Estimated
deliveries
100 State and
District
Annual,
semiannual
Skilled Birth Attendant
(SBA) Delivery Rate
Proportion of total
deliveries assisted by a
Skilled Birth Attendant (at
home and at institutions)
Deliveries by SBA
(SBA Home + all
Institutional
deliveries)
Total
reported
deliveries
100 State and
District
Quarterly,
annual
Rationale There is clear evidence that institutional deliveries by SBAs are the key to reducing maternal
mortality, due to improved emergency infrastructure, access to transport and referral facilities and a
number of other factors.
In absence of complete estimated population figures in states, the institutional delivery performance can
also be calculated by total reported delivery figures. This can supplement the overall understanding of
the institutional delivery in the State.
Actions to consider • Conditions at institutions should be made more acceptable (professionally, culturally, socially, financially
etc) to encourage institutional deliveries
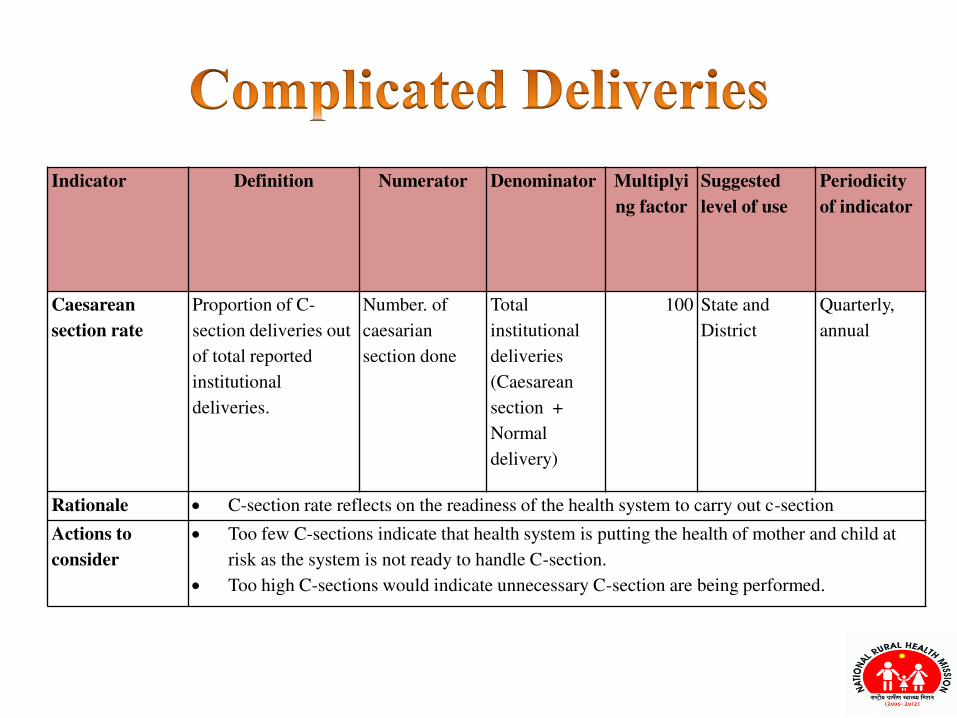
Indicator Definition Numerator Denominator Multiplyi
ng factor
Suggested
level of use
Periodicity
of indicator
Caesarean
section rate
Proportion of C-
section deliveries out
of total reported
institutional
deliveries.
Number. of
caesarian
section done
Total
institutional
deliveries
(Caesarean
section +
Normal
delivery)
100 State and
District
Quarterly,
annual
Rationale C-section rate reflects on the readiness of the health system to carry out c-section
Actions to
consider
Too few C-sections indicate that health system is putting the health of mother and child at
risk as the system is not ready to handle C-section.
Too high C-sections would indicate unnecessary C-section are being performed.
Indicator Definition Numerator Denominato
r
Multiplyi
ng factor
Suggested
level of use
Periodicity
of indicator
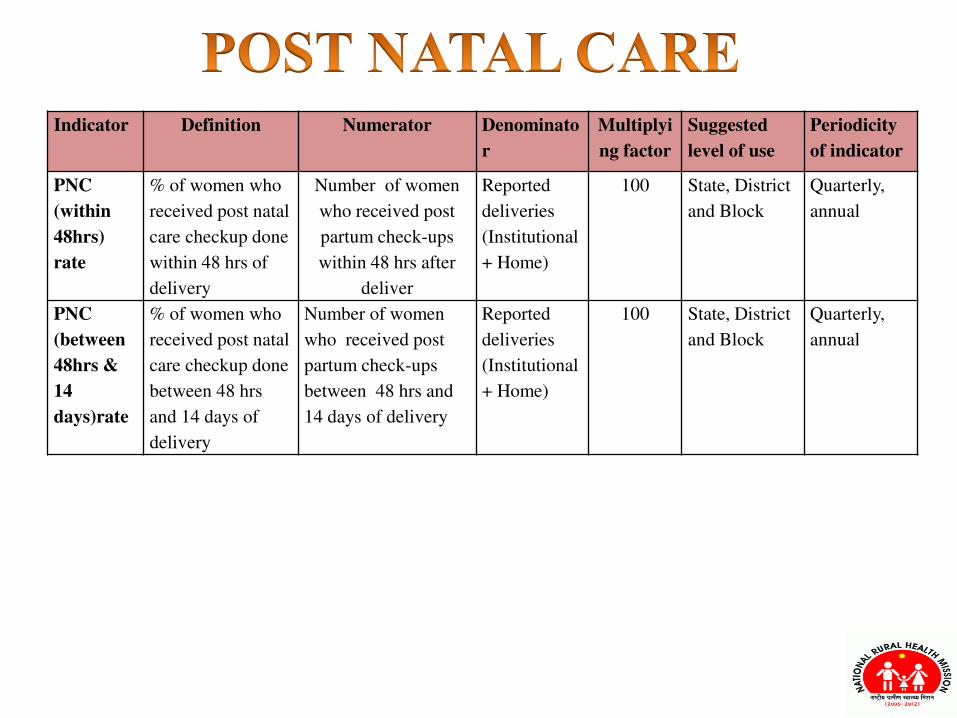
PNC
(within
48hrs)
rate
% of women who
received post natal
care checkup done
within 48 hrs of
delivery
Number of women
who received post
partum check-ups
within 48 hrs after
deliver
Reported
deliveries
(Institutional
+ Home)
100 State, District
and Block
Quarterly,
annual
PNC
(between
48hrs &
14
days)rate
% of women who
received post natal
care checkup done
between 48 hrs
and 14 days of
delivery
Number of women
who received post
partum check-ups
between 48 hrs and
14 days of delivery
Reported
deliveries
(Institutional
+ Home)
100 State, District
and Block
Quarterly,
annual

Rationale Postnatal care (PNC) is an essential component of both maternal and neonatal care, to detect
complications so that they can be treated early. The postnatal check-up should follow national
protocols.
PNC coverage is an indicator of access and use of health care after delivery.
The numerator should include mothers of babies born at home and coming to health services
within 48 hours.
Women should receive at least 2 postnatal care check-ups, to avoid and treat any complication.
Ideally 3 PNC check-ups are required, 3rd after 42 days
Actions to
consider
BCC to mothers to undertake PNC.
Improve reporting of home deliveries.
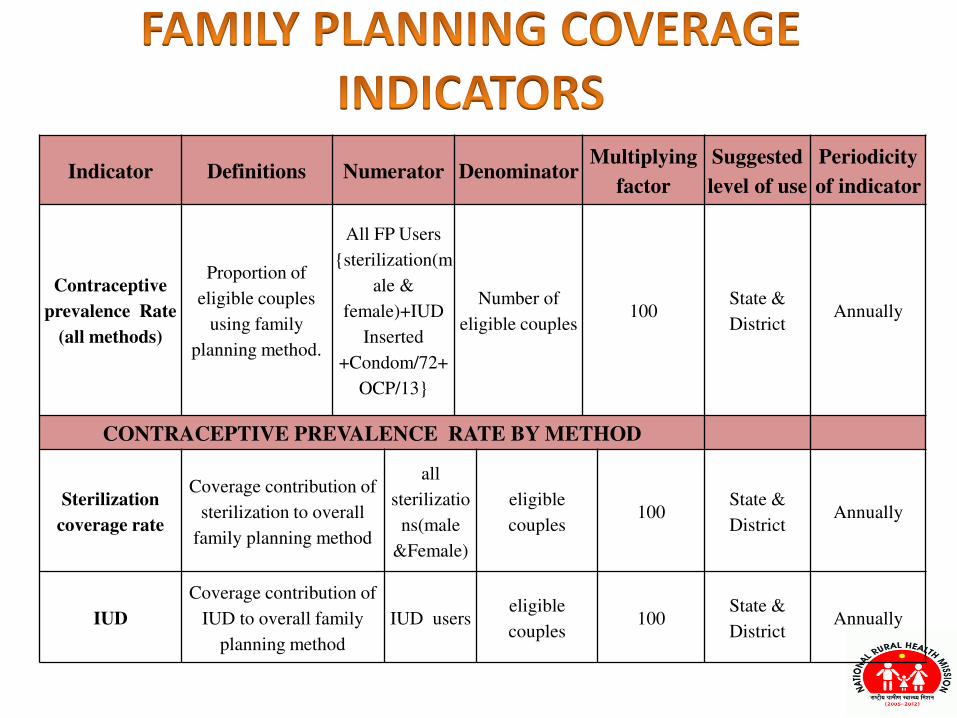
Indicator Definitions Numerator Denominator Multiplying
factor
Suggested
level of use
Periodicity
of indicator
Contraceptive
prevalence Rate
(all methods)
Proportion of
eligible couples
using family
planning method.
All FP Users
{sterilization(m
ale &
female)+IUD
Inserted
+Condom/72+
OCP/13}
Number of
eligible couples 100
State &
District Annually
CONTRACEPTIVE PREVALENCE RATE BY METHOD
Sterilization
coverage rate
Coverage contribution of
sterilization to overall
family planning method
all
sterilizatio
ns(male
&Female)
eligible
couples 100
State &
District Annually
IUD
Coverage contribution of
IUD to overall family
planning method
IUD users eligible
couples 100
State &
District Annually
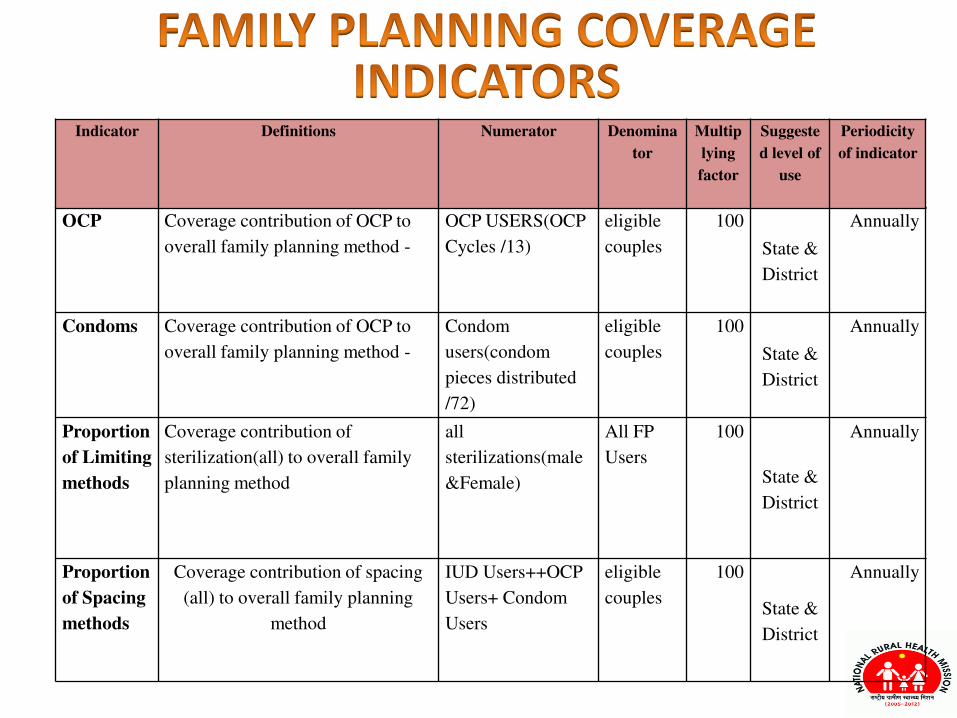
OCP Coverage contribution of OCP to
overall family planning method -
OCP USERS(OCP
Cycles /13)
eligible
couples
100
State &
District
Annually
Condoms Coverage contribution of OCP to
overall family planning method -
Condom
users(condom
pieces distributed
/72)
eligible
couples
100
State &
District
Annually
Proportion
of Limiting
methods
Coverage contribution of
sterilization(all) to overall family
planning method
all
sterilizations(male
&Female)
All FP
Users
100
State &
District
Annually
Proportion
of Spacing
methods
Coverage contribution of spacing
(all) to overall family planning
method
IUD Users++OCP
Users+ Condom
Users
eligible
couples
100
State &
District
Annually
Indicator Definitions Numerator Denomina
tor
Multip
lying
factor
Suggeste
d level of
use
Periodicity
of indicator
Indicator Definition Numerator Denominator Multiplyi
ng factor
Suggested
level of
use
Periodicity
of
indicator
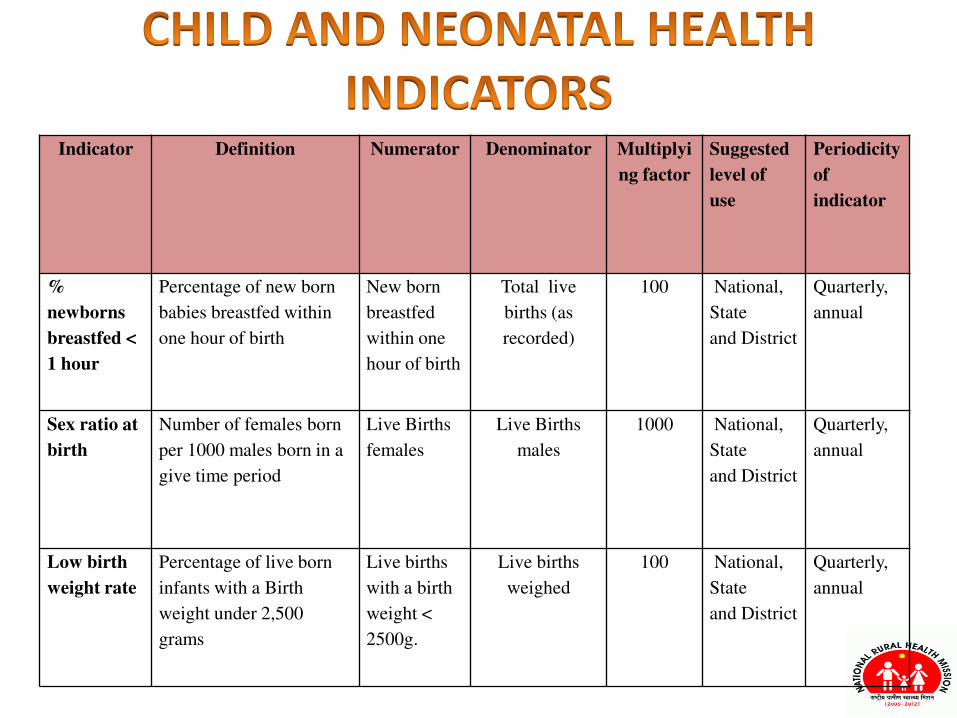
%
newborns
breastfed <
1 hour
Percentage of new born
babies breastfed within
one hour of birth
New born
breastfed
within one
hour of birth
Total live
births (as
recorded)
100 National,
State
and District
Quarterly,
annual
Sex ratio at
birth
Number of females born
per 1000 males born in a
give time period
Live Births
females
Live Births
males
1000 National,
State
and District
Quarterly,
annual
Low birth
weight rate
Percentage of live born
infants with a Birth
weight under 2,500
grams
Live births
with a birth
weight <
2500g.
Live births
weighed
100 National,
State
and District
Quarterly,
annual
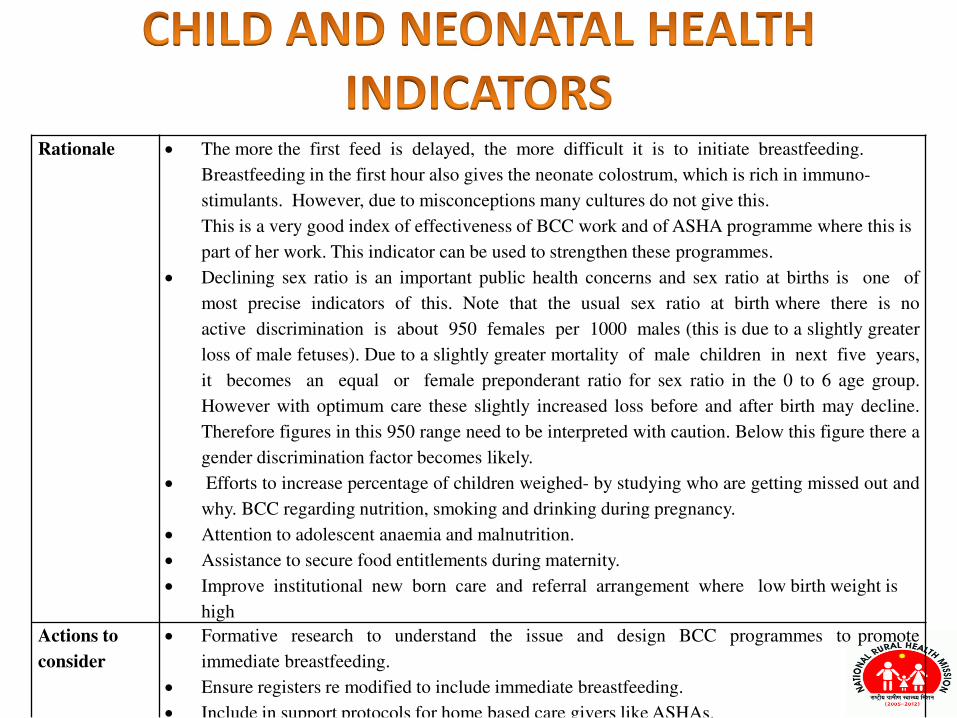
Rationale The more the first feed is delayed, the more difficult it is to initiate breastfeeding.
Breastfeeding in the first hour also gives the neonate colostrum, which is rich in immuno-
stimulants. However, due to misconceptions many cultures do not give this.
This is a very good index of effectiveness of BCC work and of ASHA programme where this is
part of her work. This indicator can be used to strengthen these programmes.
Declining sex ratio is an important public health concerns and sex ratio at births is one of
most precise indicators of this. Note that the usual sex ratio at birth where there is no
active discrimination is about 950 females per 1000 males (this is due to a slightly greater
loss of male fetuses). Due to a slightly greater mortality of male children in next five years,
it becomes an equal or female preponderant ratio for sex ratio in the 0 to 6 age group.
However with optimum care these slightly increased loss before and after birth may decline.
Therefore figures in this 950 range need to be interpreted with caution. Below this figure there a
gender discrimination factor becomes likely.
Efforts to increase percentage of children weighed- by studying who are getting missed out and
why. BCC regarding nutrition, smoking and drinking during pregnancy.
Attention to adolescent anaemia and malnutrition.
Assistance to secure food entitlements during maternity.
Improve institutional new born care and referral arrangement where low birth weight is
high
Actions to
consider
Formative research to understand the issue and design BCC programmes to promote
immediate breastfeeding.
Ensure registers re modified to include immediate breastfeeding.
Include in support protocols for home based care givers like ASHAs.
“son preference”
Indicator Definition Numerator Denominator Multiplying
factor
Periodicity
of indicator
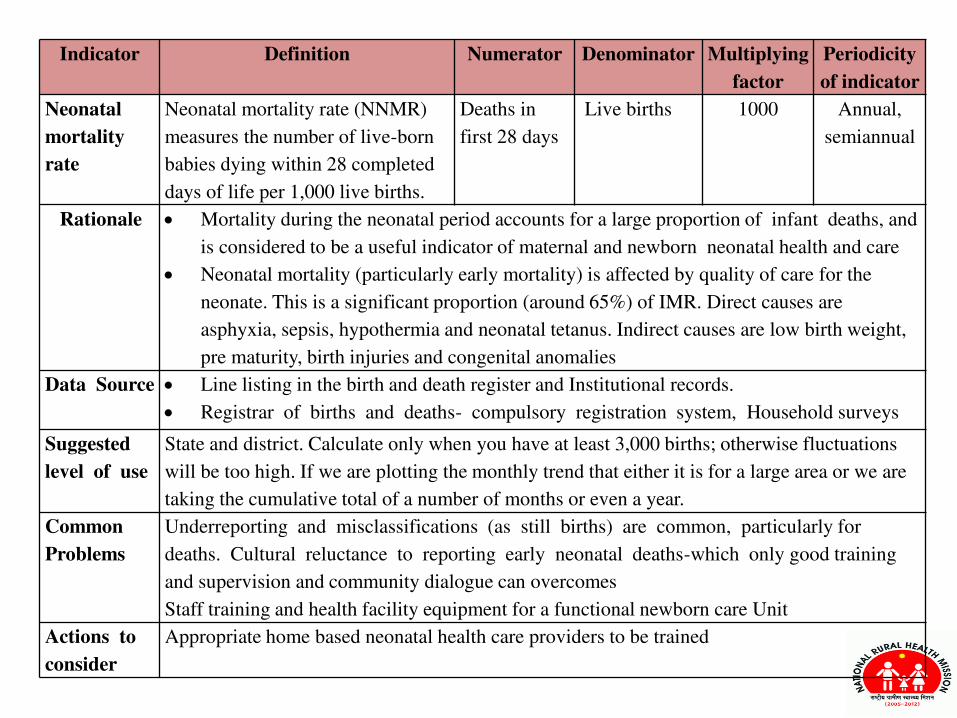
Neonatal
mortality
rate
Neonatal mortality rate (NNMR)
measures the number of live-born
babies dying within 28 completed
days of life per 1,000 live births.
Deaths in
first 28 days
Live births 1000 Annual,
semiannual
Rationale Mortality during the neonatal period accounts for a large proportion of infant deaths, and
is considered to be a useful indicator of maternal and newborn neonatal health and care
Neonatal mortality (particularly early mortality) is affected by quality of care for the
neonate. This is a significant proportion (around 65%) of IMR. Direct causes are
asphyxia, sepsis, hypothermia and neonatal tetanus. Indirect causes are low birth weight,
pre maturity, birth injuries and congenital anomalies
Data Source Line listing in the birth and death register and Institutional records.
Registrar of births and deaths- compulsory registration system, Household surveys
Suggested
level of use
State and district. Calculate only when you have at least 3,000 births; otherwise fluctuations
will be too high. If we are plotting the monthly trend that either it is for a large area or we are
taking the cumulative total of a number of months or even a year.
Common
Problems
Underreporting and misclassifications (as still births) are common, particularly for
deaths. Cultural reluctance to reporting early neonatal deaths-which only good training
and supervision and community dialogue can overcomes
Staff training and health facility equipment for a functional newborn care Unit
Actions to
consider
Appropriate home based neonatal health care providers to be trained
Indicator Definition Numerator Denominator Multiplyin
g factor
Suggested level
of use
Periodicity of
indicator
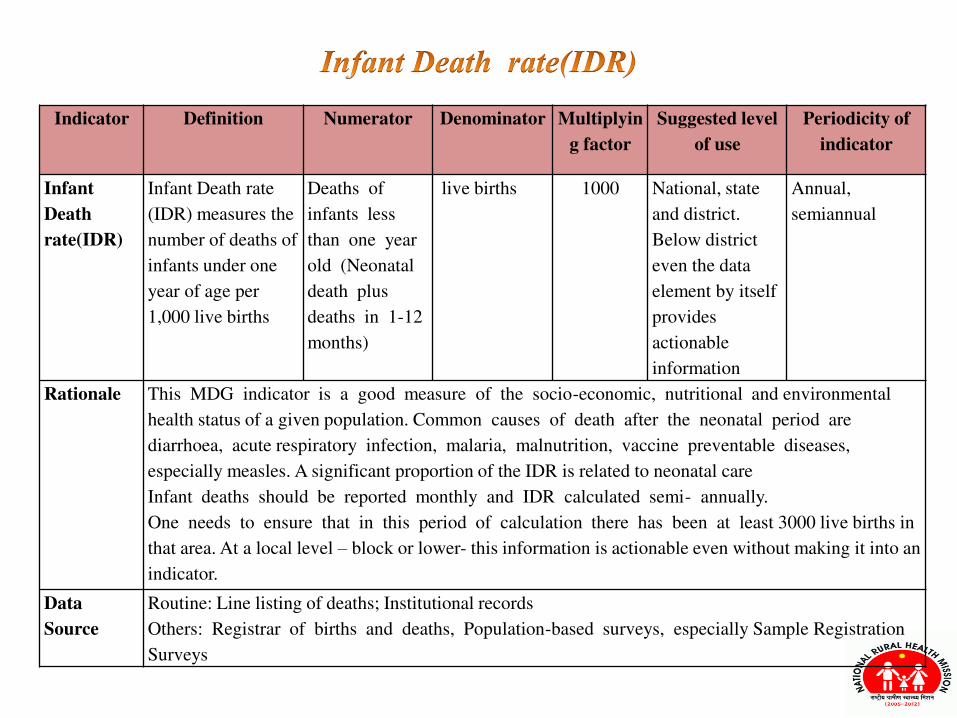
Infant
Death
rate(IDR)
Infant Death rate
(IDR) measures the
number of deaths of
infants under one
year of age per
1,000 live births
Deaths of
infants less
than one year
old (Neonatal
death plus
deaths in 1-12
months)
live births 1000 National, state
and district.
Below district
even the data
element by itself
provides
actionable
information
Annual,
semiannual
Rationale This MDG indicator is a good measure of the socio-economic, nutritional and environmental
health status of a given population. Common causes of death after the neonatal period are
diarrhoea, acute respiratory infection, malaria, malnutrition, vaccine preventable diseases,
especially measles. A significant proportion of the IDR is related to neonatal care
Infant deaths should be reported monthly and IDR calculated semi- annually.
One needs to ensure that in this period of calculation there has been at least 3000 live births in
that area. At a local level – block or lower- this information is actionable even without making it into an
indicator.
Data
Source
Routine: Line listing of deaths; Institutional records
Others: Registrar of births and deaths, Population-based surveys, especially Sample Registration
Surveys
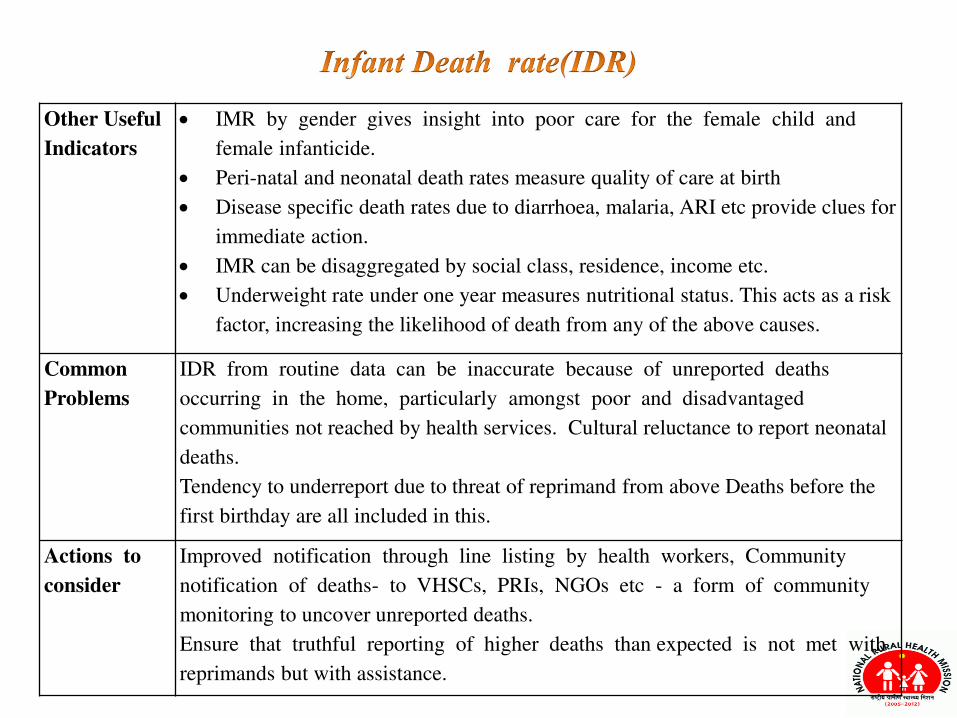
Other Useful
Indicators
IMR by gender gives insight into poor care for the female child and
female infanticide.
Peri-natal and neonatal death rates measure quality of care at birth
Disease specific death rates due to diarrhoea, malaria, ARI etc provide clues for
immediate action.
IMR can be disaggregated by social class, residence, income etc.
Underweight rate under one year measures nutritional status. This acts as a risk
factor, increasing the likelihood of death from any of the above causes.
Common
Problems
IDR from routine data can be inaccurate because of unreported deaths
occurring in the home, particularly amongst poor and disadvantaged
communities not reached by health services. Cultural reluctance to report neonatal
deaths.
Tendency to underreport due to threat of reprimand from above Deaths before the
first birthday are all included in this.
Actions to
consider
Improved notification through line listing by health workers, Community
notification of deaths- to VHSCs, PRIs, NGOs etc - a form of community
monitoring to uncover unreported deaths.
Ensure that truthful reporting of higher deaths than expected is not met with
reprimands but with assistance.
Indicator Definition Numerato
r
Denomina
tor
Multiplyi
ng factor
Suggested level of
use
Periodicity of
indicator
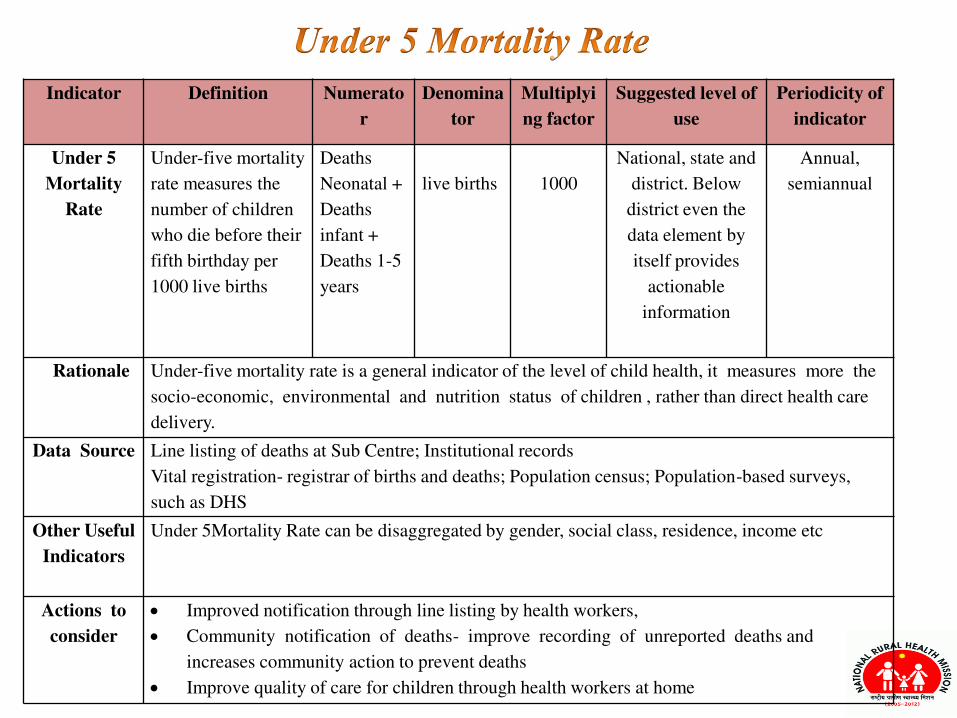
Under 5
Mortality
Rate
Under-five mortality
rate measures the
number of children
who die before their
fifth birthday per
1000 live births
Deaths
Neonatal +
Deaths
infant +
Deaths 1-5
years
live births
1000
National, state and
district. Below
district even the
data element by
itself provides
actionable
information
Annual,
semiannual
Rationale Under-five mortality rate is a general indicator of the level of child health, it measures more the
socio-economic, environmental and nutrition status of children , rather than direct health care
delivery.
Data Source Line listing of deaths at Sub Centre; Institutional records
Vital registration- registrar of births and deaths; Population census; Population-based surveys,
such as DHS
Other Useful
Indicators
Under 5Mortality Rate can be disaggregated by gender, social class, residence, income etc
Actions to
consider
Improved notification through line listing by health workers,
Community notification of deaths- improve recording of unreported deaths and
increases community action to prevent deaths
Improve quality of care for children through health workers at home
Indicator
Definition Numerator Denominator Multiplyin
g factor
Suggested level of
use
Periodicity of
indicator
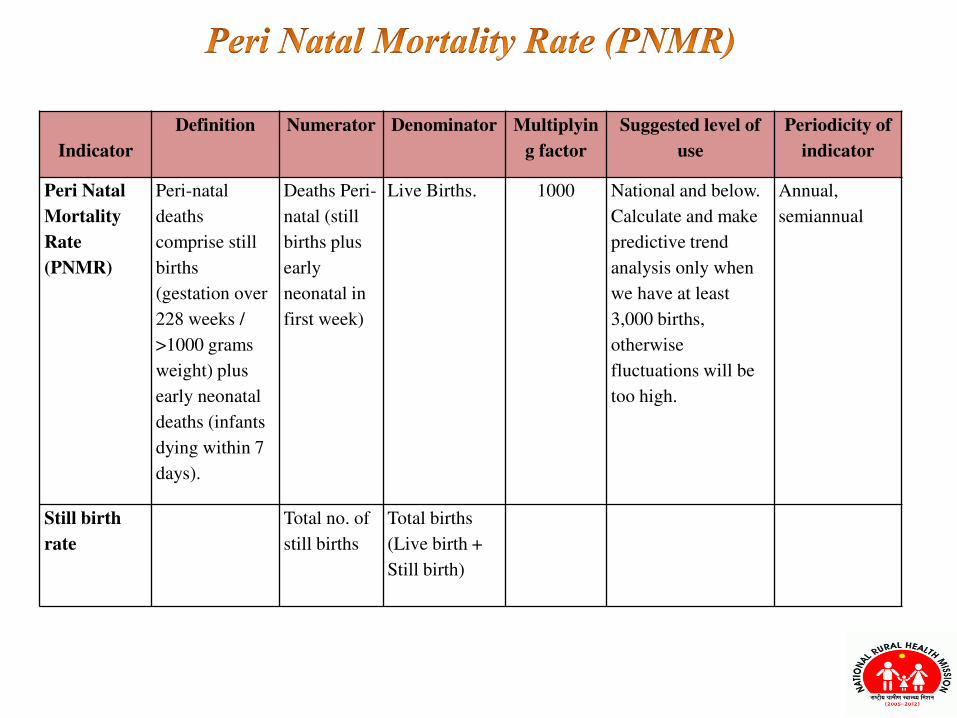
Peri Natal
Mortality
Rate
(PNMR)
Peri-natal
deaths
comprise still
births
(gestation over
228 weeks /
>1000 grams
weight) plus
early neonatal
deaths (infants
dying within 7
days).
Deaths Peri-
natal (still
births plus
early
neonatal in
first week)
Live Births. 1000 National and below.
Calculate and make
predictive trend
analysis only when
we have at least
3,000 births,
otherwise
fluctuations will be
too high.
Annual,
semiannual
Still birth
rate
Total no. of
still births
Total births
(Live birth +
Still birth)
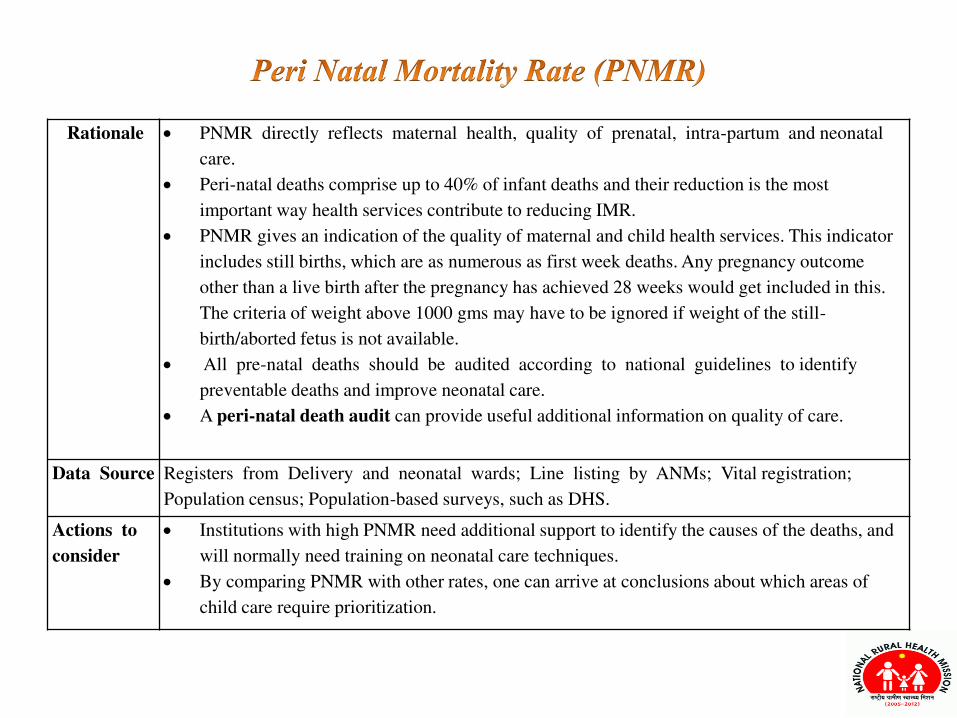
Rationale PNMR directly reflects maternal health, quality of prenatal, intra-partum and neonatal
care.
Peri-natal deaths comprise up to 40% of infant deaths and their reduction is the most
important way health services contribute to reducing IMR.
PNMR gives an indication of the quality of maternal and child health services. This indicator
includes still births, which are as numerous as first week deaths. Any pregnancy outcome
other than a live birth after the pregnancy has achieved 28 weeks would get included in this.
The criteria of weight above 1000 gms may have to be ignored if weight of the still-
birth/aborted fetus is not available.
All pre-natal deaths should be audited according to national guidelines to identify
preventable deaths and improve neonatal care.
A peri-natal death audit can provide useful additional information on quality of care.
Data Source Registers from Delivery and neonatal wards; Line listing by ANMs; Vital registration;
Population census; Population-based surveys, such as DHS.
Actions to
consider
Institutions with high PNMR need additional support to identify the causes of the deaths, and
will normally need training on neonatal care techniques.
By comparing PNMR with other rates, one can arrive at conclusions about which areas of
child care require prioritization.
Indicator Definition Numerator Denominator Multiplyi
ng factor
Suggested level
of use
Periodici
ty of
indicator
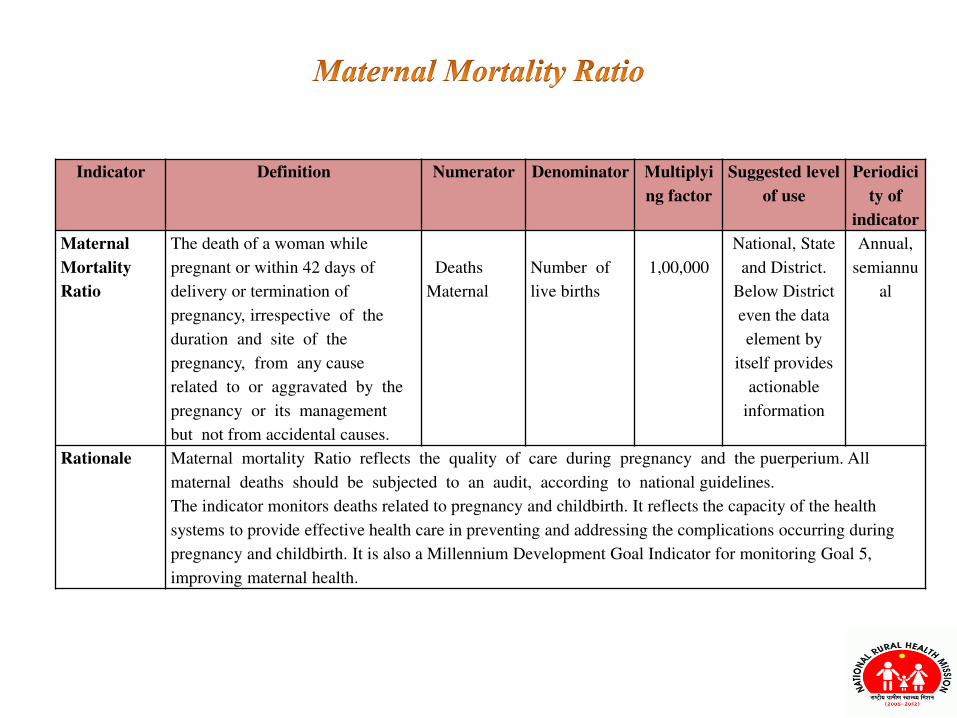
Maternal
Mortality
Ratio
The death of a woman while
pregnant or within 42 days of
delivery or termination of
pregnancy, irrespective of the
duration and site of the
pregnancy, from any cause
related to or aggravated by the
pregnancy or its management
but not from accidental causes.
Deaths
Maternal
Number of
live births
1,00,000
National, State
and District.
Below District
even the data
element by
itself provides
actionable
information
Annual,
semiannu
al
Rationale Maternal mortality Ratio reflects the quality of care during pregnancy and the puerperium. All
maternal deaths should be subjected to an audit, according to national guidelines.
The indicator monitors deaths related to pregnancy and childbirth. It reflects the capacity of the health
systems to provide effective health care in preventing and addressing the complications occurring during
pregnancy and childbirth. It is also a Millennium Development Goal Indicator for monitoring Goal 5,
improving maternal health.
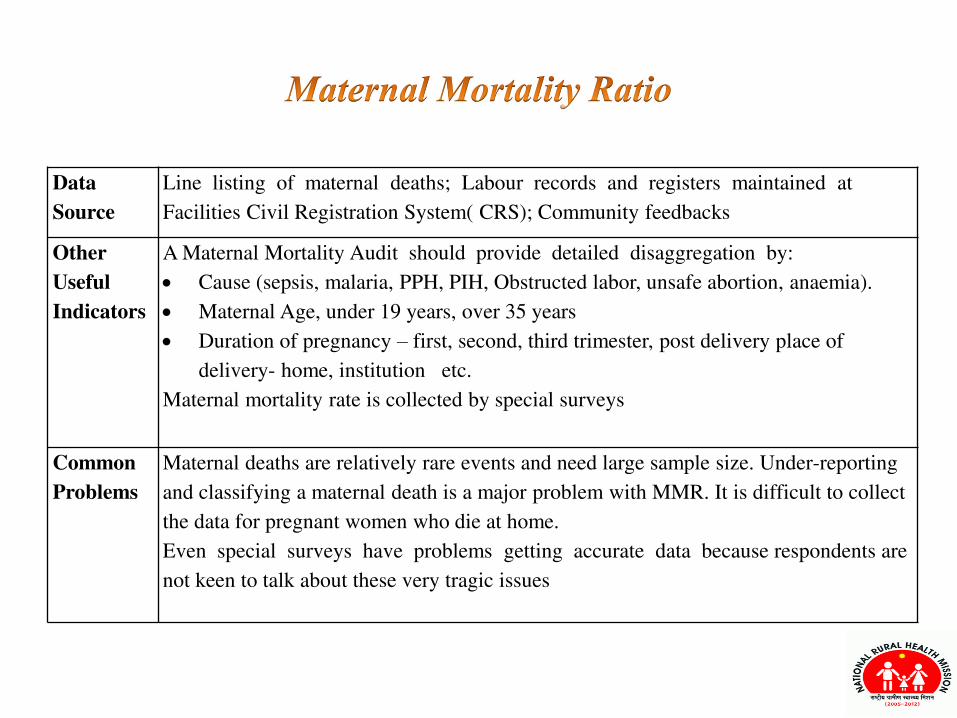
Data
Source
Line listing of maternal deaths; Labour records and registers maintained at
Facilities Civil Registration System( CRS); Community feedbacks
Other
Useful
Indicators
A Maternal Mortality Audit should provide detailed disaggregation by:
Cause (sepsis, malaria, PPH, PIH, Obstructed labor, unsafe abortion, anaemia).
Maternal Age, under 19 years, over 35 years
Duration of pregnancy – first, second, third trimester, post delivery place of
delivery- home, institution etc.
Maternal mortality rate is collected by special surveys
Common
Problems
Maternal deaths are relatively rare events and need large sample size. Under-reporting
and classifying a maternal death is a major problem with MMR. It is difficult to collect
the data for pregnant women who die at home.
Even special surveys have problems getting accurate data because respondents are
not keen to talk about these very tragic issues
Indicator
Name
Definition Numerator Denominat
or
Multiply
ing
factor
Suggested
level of
use
Periodicit
y of use
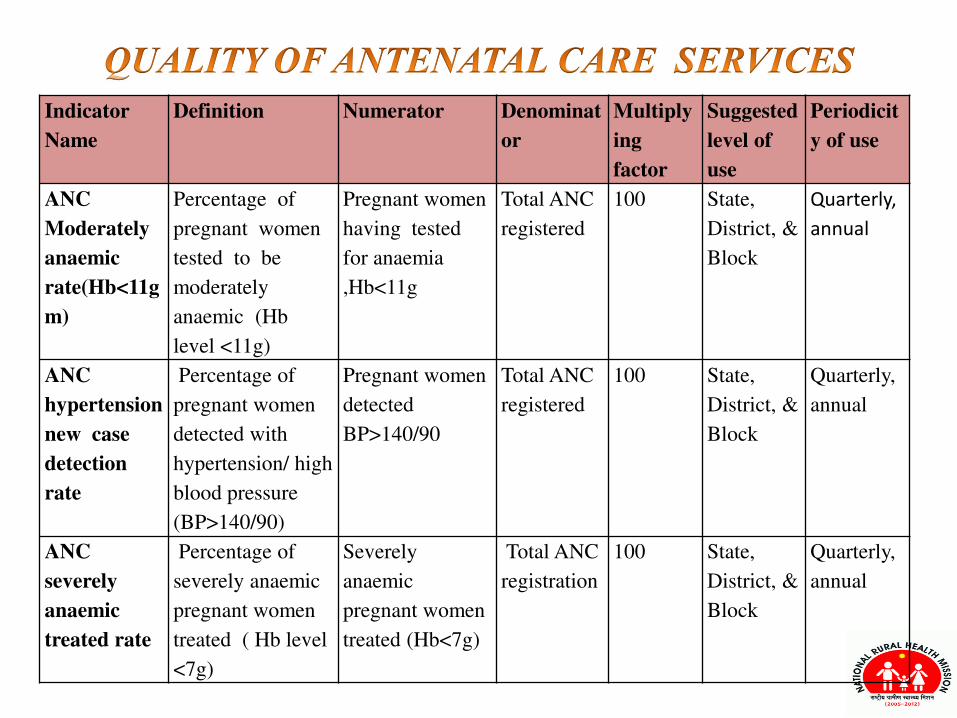
ANC
Moderately
anaemic
rate(Hb<11g
m)
Percentage of
pregnant women
tested to be
moderately
anaemic (Hb
level <11g)
Pregnant women
having tested
for anaemia
,Hb<11g
Total ANC
registered
100 State,
District, &
Block
Quarterly,
annual
ANC
hypertension
new case
detection
rate
Percentage of
pregnant women
detected with
hypertension/ high
blood pressure
(BP>140/90)
Pregnant women
detected
BP>140/90
Total ANC
registered
100 State,
District, &
Block
Quarterly,
annual
ANC
severely
anaemic
treated rate
Percentage of
severely anaemic
pregnant women
treated ( Hb level
<7g)
Severely
anaemic
pregnant women
treated (Hb<7g)
Total ANC
registration
100 State,
District, &
Block
Quarterly,
annual
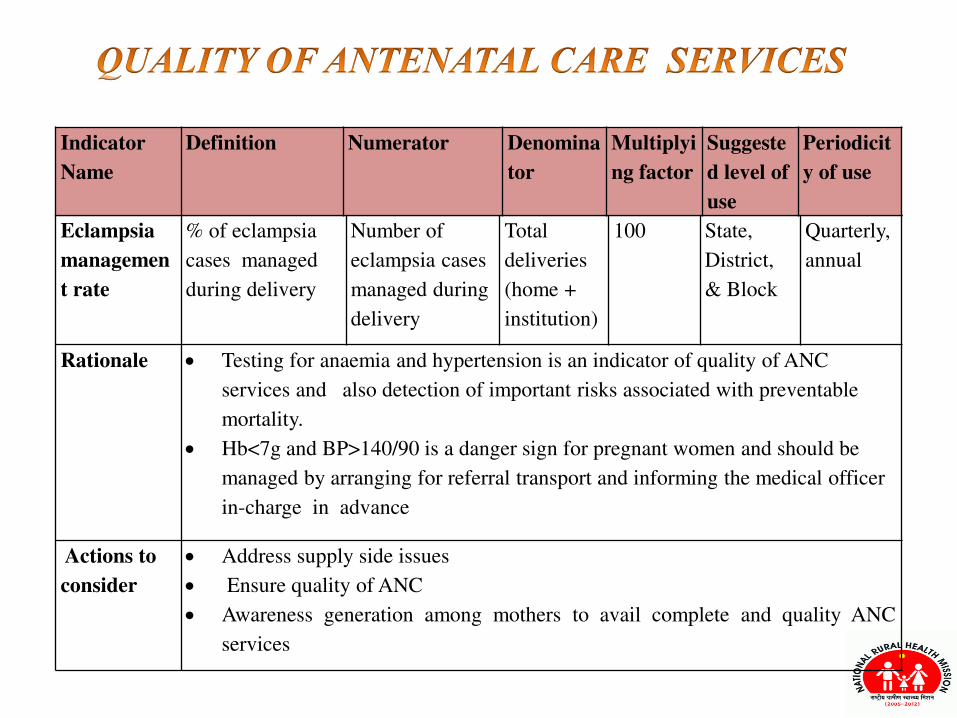
Eclampsia
managemen
t rate
% of eclampsia
cases managed
during delivery
Number of
eclampsia cases
managed during
delivery
Total
deliveries
(home +
institution)
100 State,
District,
& Block
Quarterly,
annual
Rationale Testing for anaemia and hypertension is an indicator of quality of ANC
services and also detection of important risks associated with preventable
mortality.
Hb<7g and BP>140/90 is a danger sign for pregnant women and should be
managed by arranging for referral transport and informing the medical officer
in-charge in advance
Actions to
consider
Address supply side issues
Ensure quality of ANC
Awareness generation among mothers to avail complete and quality ANC
services
Indicator
Name
Definition Numerator Denomina
tor
Multiplyi
ng factor
Suggeste
d level of
use
Periodicit
y of use
Indicator
Name
Definition Numerator Denominator Multiply
ing
factor
Suggested
level of use
Periodicit
y of use
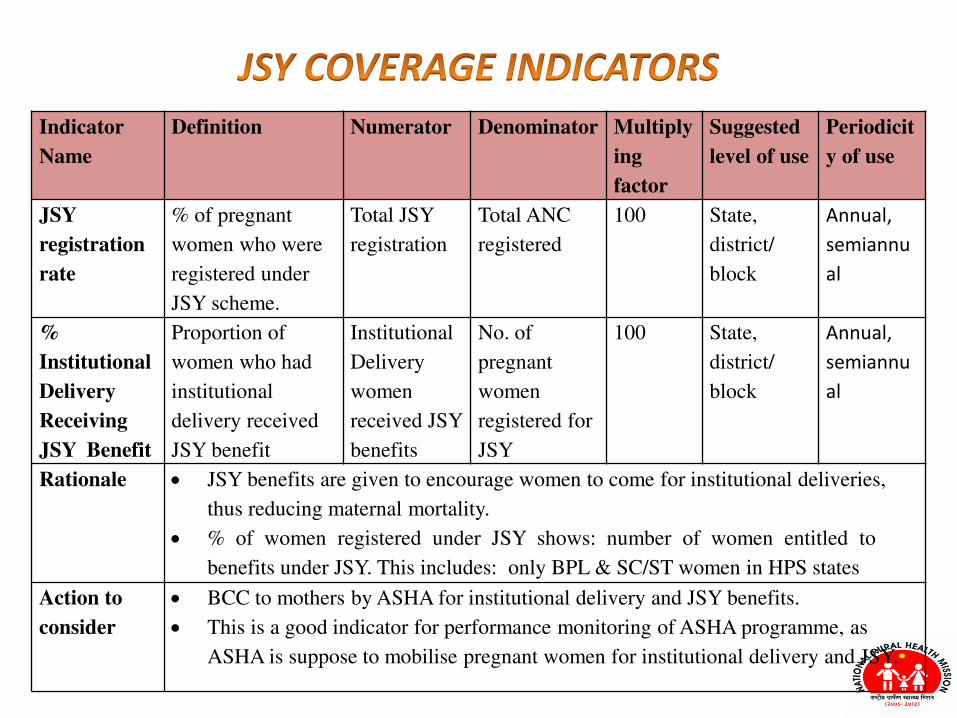
JSY
registration
rate
% of pregnant
women who were
registered under
JSY scheme.
Total JSY
registration
Total ANC
registered
100 State,
district/
block
Annual,
semiannu
al
%
Institutional
Delivery
Receiving
JSY Benefit
Proportion of
women who had
institutional
delivery received
JSY benefit
Institutional
Delivery
women
received JSY
benefits
No. of
pregnant
women
registered for
JSY
100 State,
district/
block
Annual,
semiannu
al
Rationale JSY benefits are given to encourage women to come for institutional deliveries,
thus reducing maternal mortality.
% of women registered under JSY shows: number of women entitled to
benefits under JSY. This includes: only BPL & SC/ST women in HPS states
Action to
consider
BCC to mothers by ASHA for institutional delivery and JSY benefits.
This is a good indicator for performance monitoring of ASHA programme, as
ASHA is suppose to mobilise pregnant women for institutional delivery and JSY.
Indicator
Name
Definition Numerator Denominator Multiplyin
g factor
Suggested
level of
use
Periodicit
y of use
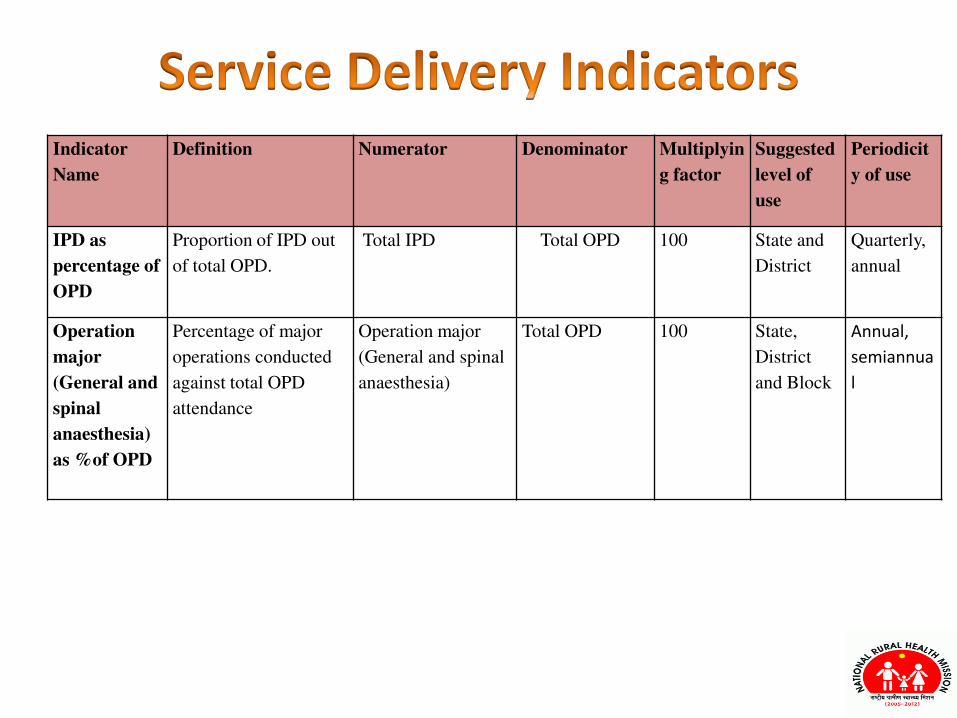
IPD as
percentage of
OPD
Proportion of IPD out
of total OPD.
Total IPD Total OPD 100 State and
District
Quarterly,
annual
Operation
major
(General and
spinal
anaesthesia)
as %of OPD
Percentage of major
operations conducted
against total OPD
attendance
Operation major
(General and spinal
anaesthesia)
Total OPD 100 State,
District
and Block
Annual,
semiannua
l
Indicator
Name
Definition Numerator Denominator Multiplying
factor
Suggested
level of
use
Periodicity
of use
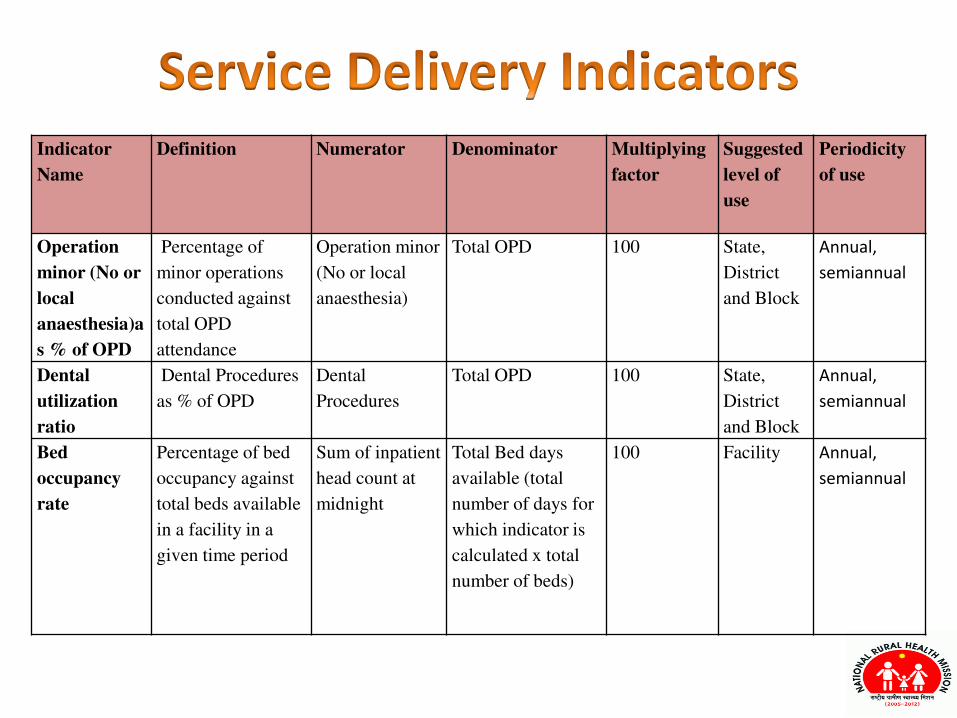
Operation
minor (No or
local
anaesthesia)a
s % of OPD
Percentage of
minor operations
conducted against
total OPD
attendance
Operation minor
(No or local
anaesthesia)
Total OPD 100 State,
District
and Block
Annual,
semiannual
Dental
utilization
ratio
Dental Procedures
as % of OPD
Dental
Procedures
Total OPD 100 State,
District
and Block
Annual,
semiannual
Bed
occupancy
rate
Percentage of bed
occupancy against
total beds available
in a facility in a
given time period
Sum of inpatient
head count at
midnight
Total Bed days
available (total
number of days for
which indicator is
calculated x total
number of beds)
100 Facility Annual,
semiannual
Indicator Definition Numerator Denominator Multipl
ying
factor
Suggested
level of
use
Periodicit
y of use
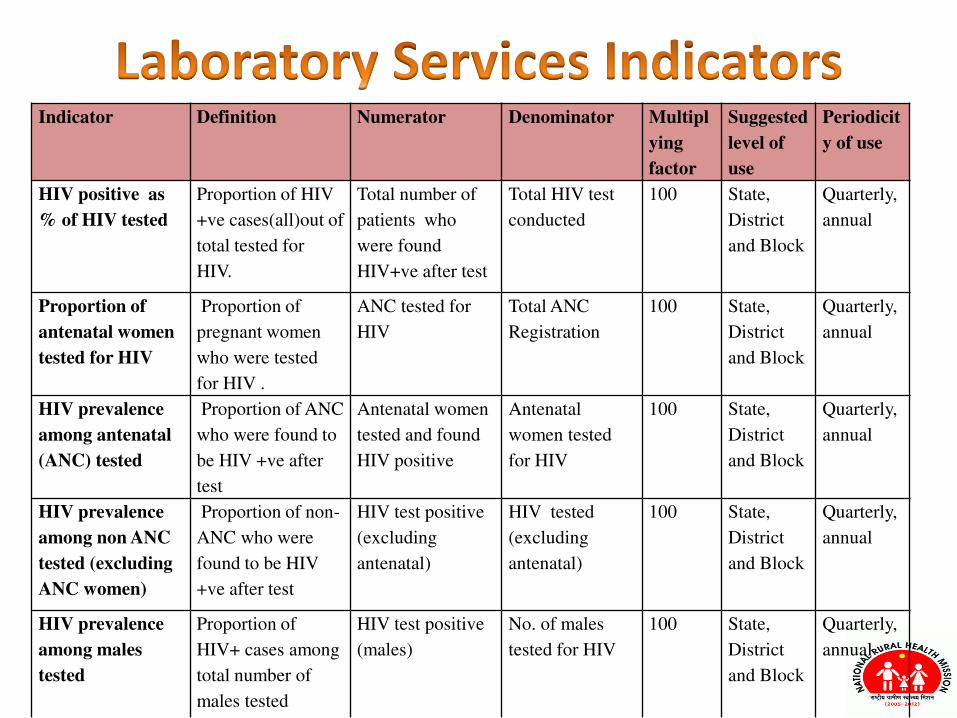
HIV positive as
% of HIV tested
Proportion of HIV
+ve cases(all)out of
total tested for
HIV.
Total number of
patients who
were found
HIV+ve after test
Total HIV test
conducted
100 State,
District
and Block
Quarterly,
annual
Proportion of
antenatal women
tested for HIV
Proportion of
pregnant women
who were tested
for HIV .
ANC tested for
HIV
Total ANC
Registration
100 State,
District
and Block
Quarterly,
annual
HIV prevalence
among antenatal
(ANC) tested
Proportion of ANC
who were found to
be HIV +ve after
test
Antenatal women
tested and found
HIV positive
Antenatal
women tested
for HIV
100 State,
District
and Block
Quarterly,
annual
HIV prevalence
among non ANC
tested (excluding
ANC women)
Proportion of non-
ANC who were
found to be HIV
+ve after test
HIV test positive
(excluding
antenatal)
HIV tested
(excluding
antenatal)
100 State,
District
and Block
Quarterly,
annual
HIV prevalence
among males
tested
Proportion of
HIV+ cases among
total number of
males tested
HIV test positive
(males)
No. of males
tested for HIV
100 State,
District
and Block
Quarterly,
annual
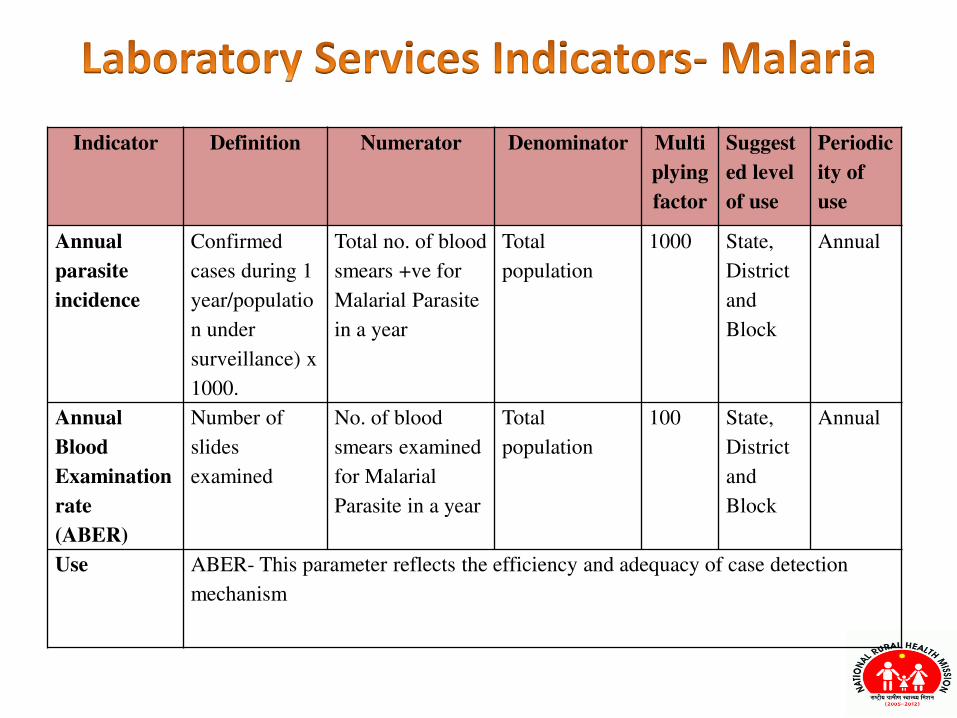
Indicator Definition Numerator Denominator Multi
plying
factor
Suggest
ed level
of use
Periodic
ity of
use
Annual
parasite
incidence
Confirmed
cases during 1
year/populatio
n under
surveillance) x
1000.
Total no. of blood
smears +ve for
Malarial Parasite
in a year
Total
population
1000 State,
District
and
Block
Annual
Annual
Blood
Examination
rate
(ABER)
Number of
slides
examined
No. of blood
smears examined
for Malarial
Parasite in a year
Total
population
100 State,
District
and
Block
Annual
Use ABER- This parameter reflects the efficiency and adequacy of case detection
mechanism
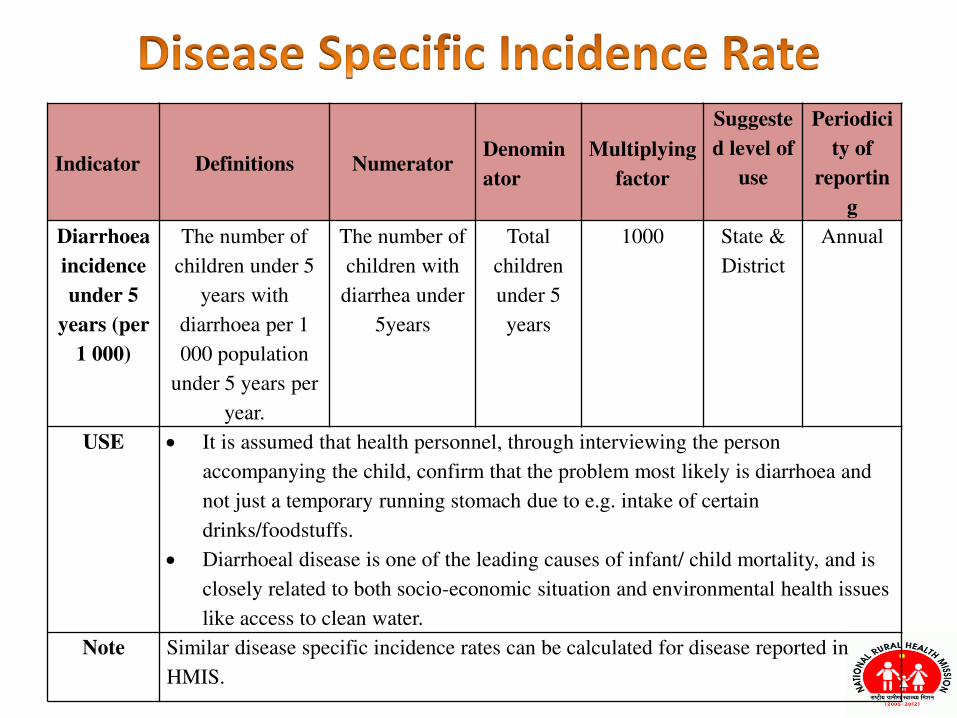
Indicator Definitions Numerator Denomin
ator
Multiplying
factor
Suggeste
d level of
use
Periodici
ty of
reportin
g
Diarrhoea
incidence
under 5
years (per
1 000)
The number of
children under 5
years with
diarrhoea per 1
000 population
under 5 years per
year.
The number of
children with
diarrhea under
5years
Total
children
under 5
years
1000 State &
District
Annual
USE It is assumed that health personnel, through interviewing the person
accompanying the child, confirm that the problem most likely is diarrhoea and
not just a temporary running stomach due to e.g. intake of certain
drinks/foodstuffs.
Diarrhoeal disease is one of the leading causes of infant/ child mortality, and is
closely related to both socio-economic situation and environmental health issues
like access to clean water.
Note Similar disease specific incidence rates can be calculated for disease reported in
HMIS.