integrative analysis of cell crosstalk within follicular
TRANSCRIPT

HAL Id: hal-02978621https://hal.archives-ouvertes.fr/hal-02978621
Submitted on 26 Oct 2020
HAL is a multi-disciplinary open accessarchive for the deposit and dissemination of sci-entific research documents, whether they are pub-lished or not. The documents may come fromteaching and research institutions in France orabroad, or from public or private research centers.
L’archive ouverte pluridisciplinaire HAL, estdestinée au dépôt et à la diffusion de documentsscientifiques de niveau recherche, publiés ou non,émanant des établissements d’enseignement et derecherche français ou étrangers, des laboratoirespublics ou privés.
Distributed under a Creative Commons Attribution| 4.0 International License
Integrative Analysis of Cell Crosstalk within FollicularLymphoma Cell Niche: Towards a Definition of the FL
Supportive SynapseCéline Pangault, Patricia Amé-Thomas, Delphine Rossille, Joelle Dulong,
Gersende Caron, Céline Nonn, Fabrice Chatonnet, Fabienne Desmots, VincentLaunay, Thierry Lamy, et al.
To cite this version:Céline Pangault, Patricia Amé-Thomas, Delphine Rossille, Joelle Dulong, Gersende Caron, et al..Integrative Analysis of Cell Crosstalk within Follicular Lymphoma Cell Niche: Towards a Definitionof the FL Supportive Synapse. Cancers, MDPI, 2020, 12 (10), pp.2865. �10.3390/cancers12102865�.�hal-02978621�

cancers
Article
Integrative Analysis of Cell Crosstalk withinFollicular Lymphoma Cell Niche: Towards aDefinition of the FL Supportive Synapse
Céline Pangault 1,2,† , Patricia Amé-Thomas 1,3,† , Delphine Rossille 1,4, Joëlle Dulong 1,4,Gersende Caron 1,2, Céline Nonn 1,2, Fabrice Chatonnet 1,2 , Fabienne Desmots 1,2,Vincent Launay 5, Thierry Lamy 1,6, Thierry Fest 1,2,* and Karin Tarte 1,3,4,*
1 UMR_S 1236, Univ Rennes, INSERM, Établissement Français du Sang (EFS) Bretagne, LabEx IGO,F-35000 Rennes, France; [email protected] (C.P.); [email protected] (P.A.-T.);[email protected] (D.R.); [email protected] (J.D.);[email protected] (G.C.); [email protected] (C.N.);[email protected] (F.C.); [email protected] (F.D.);[email protected] (T.L.)
2 Laboratoire Hématologie, Centre Hospitalier Universitaire de Rennes, F-35000 Rennes, France3 Laboratoire Immunologie, Centre Hospitalier Universitaire de Rennes, F-35000 Rennes, France4 Laboratoire Suivi Immunologique des Thérapeutiques Innovantes (SITI), Centre Hospitalier Universitaire de
Rennes, F-35000 Rennes, France5 Service Hématologie Clinique, Centre Hospitalier Yves Le Fol, F-22000 Saint Brieuc, France;
[email protected] Service Hématologie Clinique, Centre Hospitalier Universitaire de Rennes, F-35000 Rennes, France* Correspondence: [email protected] (T.F.); [email protected] (K.T.);
Tel.: +33-(0)-223-234-512 (K.T.)† Co-authors.
Received: 1 September 2020; Accepted: 30 September 2020; Published: 5 October 2020�����������������
Simple Summary: Follicular lymphoma, the most frequent indolent non-Hodgkin’s B cell lymphoma,arises from a germinal center B cell proliferation supported by a multidirectional crosstalk with thetumor microenvironment, in particular with follicular helper T cells and mesenchymal stromal cells.Here, we explored this complex network, starting from a comparative analysis of the molecularsignatures of B cells, T cells, and stromal cells obtained from normal versus lymphoma tissues,and focusing on deregulated genes reflecting the crosstalk between these three cell subsets organizingthe lymphoma cell niche. This helps us to point out new lymphoma-specific pathways, related totranscriptomic and functional specific features of T and stromal cells, and contributing to tumor B cellsupport directly or through the recruitment and/or activation of other pro-tumoral cell components.In the future, targeting these cell interactions with specific drugs in the FL niche could represent anattractive option for novel therapeutic strategies.
Abstract: Follicular lymphoma (FL), the most frequent indolent non-Hodgkin’s B cell lymphoma,is considered as a prototypical centrocyte-derived lymphoma, dependent on a specificmicroenvironment mimicking the normal germinal center (GC). In agreement, several FL geneticalterations affect the crosstalk between malignant B cells and surrounding cells, including stromal cellsand follicular helper T cells (Tfh). In our study, we sought to deconvolute this complex FL supportivesynapse by comparing the transcriptomic profiles of GC B cells, Tfh, and stromal cells, isolated fromnormal versus FL tissues, in order to identify tumor-specific pathways. In particular, we highlighteda high expression of IL-6 and IL-7 in FL B cells that could favor the activation of FL Tfh overexpressingIFNG, able in turn to stimulate FL B cells without triggering MHC (major histocompatibility) classII expression. Moreover, the glycoprotein clusterin was found up-regulated in FL stromal cellsand could promote FL B cell adhesion. Finally, besides its expression on Tfh, CD200 was found
Cancers 2020, 12, 2865; doi:10.3390/cancers12102865 www.mdpi.com/journal/cancers

Cancers 2020, 12, 2865 2 of 21
overexpressed on tumor B cells and could contribute to the induction of the immunosuppressiveenzyme indoleamine-2,3 dioxygenase by CD200R-expressing dendritic cells. Altogether our findingsled us to outline the contribution of major signals provided by the FL microenvironment and theirinteractions with malignant FL B cells.
Keywords: follicular lymphoma; B cells; Tfh; mesenchymal stromal cells
1. Introduction
Germinal centers (GC) are transient and dynamic specific structures within lymph nodes (LN)that are dedicated to B cell selection and differentiation into high-affinity antibody-secreting cells [1,2].Physiological GC reaction is initiated after a cognate interaction between an antigen-specific B celland a pre-activated CD4pos T cell at the T/B border. After undergoing rapid cell proliferation andsomatic hypermutations of immunoglobulin (Ig)-variable regions in the GC dark zone, GC B cells (BGC)migrate to the light zone, and are named centrocytes. Non-proliferative centrocytes are then subjectedto affinity-based selection driven by antigen-presenting follicular dendritic cells (FDC) and T follicularhelper cells (Tfh), allowing them to either undergo additional rounds of somatic hypermutations andselection, or to terminally differentiate into memory B cells or Ig-secreting plasma cells. The GC Bcell reaction relies on a finely-balanced gene network involving two groups of transcription factors:(i) genes maintaining the B cell fate, including PAX5, BCL6 and BACH2, and (ii) genes required forantibody-secreting cell differentiation, including IRF4, BLIMP1, and XBP1. B cell maturation within GCdepends on dynamic interactions between B cells, Tfh, and FDC, and leads to genome modificationsfavoring unwanted alterations. In agreement, whereas up to 50% of GC B cells undergo programmedcell death every 6 h due to low-affinity Ig expression and/or genome alterations [3], the GC reaction isprone to be hijacked by oncogenic processes leading to malignant B cell transformation.
Follicular lymphoma (FL) is the most frequent indolent non-Hodgkin’s B cell lymphoma (NHL-B)and is considered as a prototypical centrocyte-derived lymphoma. The largest majority of FL casesharbor a BCL2/IGH translocation arising during the VDJ rearrangement process in the bone marrow(BM). Nevertheless, this translocation, which allows the overexpression of the anti-apoptotic moleculeBCL2, could be detected at low frequency within recirculating post-GC memory B cells of most healthyindividuals, indicating that it is not sufficient to trigger overt FL [4]. Advances in high-throughputgenetic analyses have revealed the complex landscape of additional molecular events that supportFL development [5–7]. Of note, beyond the well-accepted identification of FL B cells as centrocytesthat fail to differentiate [8], recent single-cell transcriptomic analyses revealed a desynchronizationof the GC-specific gene expression program in FL malignant cells that might adopt new dynamicmodes of functional diversity [9]. Moreover, studies interrogating sequential FL biopsies revealedthat FL does not arise through a linear evolutionary pattern and that an underestimated degreeof spatial or intra-tumor heterogeneity exists [10]. Interestingly, some recurrent genetic eventsact through the modulation of the crosstalk between FL B cells and surrounding cells of theirmicroenvironment. As an example, we demonstrated that the introduction of n-glycosylation acceptorsites harboring unusual high-mannose oligosaccharides in FL BCR triggers the interaction of malignantB cells with DC-SIGN-expressing tumor-infiltrating macrophages resulting in BCR-dependent FLB cell activation [11]. In addition, malignant FL B cells display a substantial dependency on theirmicroenvironment organized as specific supportive cell niches providing survival and proliferationsignals (reviewed in [12,13]). Composition and spatial organization of the FL niches have a huge impacton patient prognosis, as initially described by Dave et al. [14]. FL neoplastic nodules typically retain themain features of non-malignant GC, and ectopic lymphoid structures are induced within FL-invadedBM, displaying lymphoid-like stromal cells and CD4pos T cells [15,16]. These two cell types arerequired in FL cell niches and both display phenotypic, transcriptomic and functional specific features

Cancers 2020, 12, 2865 3 of 21
contributing to tumor B cell growth and disease progression either directly or through the recruitmentand/or activation of other pro-tumoral cell components [16–18]. Overall, the network of interactionsbetween FL B cells, stromal cells, and Tfh, referred herein as FL supportive synapse, mediates theeducation of the FL tumor microenvironment. Although recently published data provide new insightsinto the biology of these three partners in the FL context, their crosstalk remains poorly explored.
In this study, we sought to deconvolute the crosstalk between FL B cells, Tfh, and stromal cells.To this end, we compared the transcriptome of cell populations isolated from non-malignant tissuesversus FL biopsies, and identified tumor-related pathways involving cytokines, adhesion molecules,and their receptors. Concerning FL Tfh, we found an up-regulation of IL-4, IFNG, TNFA, and IL-2,associated with a cell activation signature, which paralleled the concomitant high expression levelsof IL-6 and IL-7 in FL B cells. In addition, we demonstrated that FL B cells, although possessinga functional IFN-γ pathway, were not able to positively regulate HLA-DR expression. We alsodescribed an elevated expression of CD200 in FL supportive synapse, triggering the expression of theimmunosuppressive indoleamine-2,3 dioxygenase (IDO) enzyme by CD200R-expressing dendritic cells(DC). Finally, our data highlighted an elevated expression of CLU by FL stromal cells, and highlightedthat clusterin could mediate FL B cell adhesion, thus potentially contributing to FL dissemination.
2. Results
2.1. Global Analysis of Molecular Connections at FL Synapse
The central aim of our study was to establish a comprehensive characterization, based on thetranscriptome exploration, of the interactions between the three main actors of the FL tumor, namelytumor B cells, Tfh, and stromal cells. Based on our previous works, we focused our analyses on cellsisolated from FL biopsies and non-malignant samples, which together represented six (3 nonmalignantand 3 FL-derived) different populations and forty-seven samples (Table 1). B and Tfh cells werepurified using fluorescent-activated cell sorting, while stromal cells were isolated after culture of BMsamples issued from healthy donors and FL patients with invaded BM. The BM-derived mesenchymalstromal cells (MSC) obtained from FL patients have been previously shown as a valuable model forstudying FL-stromal reprogramming [19]. A quick data analysis of the gene expression profiles (GEP)confirmed the high expression of the expected cell-specific markers, including CD19 and CD40 for Bcells, CD3, CD4, CD40L for Tfh, and CD90/THY1, CD105/ENDOG, CD106/VCAM1 for MSC, withoutdetectable cross-contamination.
Table 1. Characteristics of cohort for transcriptomic analysis.
Non-Malignant Patient Derived Cells FL-Derived Cells
B lymphocytes 7 tonsils from children 10 FL lymph nodesTfh lymphocytes 7 tonsils from children 7 FL lymph nodes
Mesenchymal stromal cells 8 HD bone marrow 8 FL bone marrow
We selected a multistep process for our dataset analysis (Figure 1A). In the first step, we reduced ourdataset to the 25,882 expressed probesets (PS), corresponding to 13,918 annotated genes. This large-scaleapproach allowed us to draw the global landscape of the GEP in normal and FL contexts. PCA analysisconfirmed tight clustering of each cell type, with the first two axes sustaining nearly 60% of thestatistical variance, separating B cells, Tfh, and MSC regardless of their origin (Figure 1B). The thirdaxis (8.6% of the variance) allowed us to segregate FL B cells from their normal GC B cell counterparts,confirming a distinct molecular FL-B signature, while Tfh and MSC were not separated dependingon the normal or FL contexts. These data were confirmed by unsupervised hierarchical clusteringperformed on the 5000 PS with the highest intensities for each population (Figure S1).

Cancers 2020, 12, 2865 4 of 21Cancers 2020, 12, x 4 of 21
Figure 1. (A) Microarray data analysis strategy. (B) Principal component analysis (PCA) shows tight clustering of the mesenchymal stromal cell (MSC) compartment, B (B) and T follicular helper (Tfh) lymphocytes from normal and tumoral contexts. The first three axes total 68.3% of the total inertia of the dataset. (C) Scatterplots of pairwise global gene expression comparison between FL (follicular lymphoma) and non-tumoral samples, in B lymphocytes (left panel), Tfh (middle panel) or stromal cells (right panel). Gene expression values are plotted on a log scale. Genes that were differentially expressed (FDR (false discovery rate) ≤ 5%) with a fold change ≥2 (logFC ≥ 1) are indicated in red and blue. Top panel: representation of all annotated genes (21,319 PS (probesets) in B lymphocytes, 19,859 PS in Tfh and 20,142 PS in stromal cells). Bottom panel: highlight of genes (in green) differentially expressed (FDR ≤ 5%) with a fold change ≥2 (logFC ≥ 1).
Figure 1. (A) Microarray data analysis strategy. (B) Principal component analysis (PCA) shows tightclustering of the mesenchymal stromal cell (MSC) compartment, B (B) and T follicular helper (Tfh)lymphocytes from normal and tumoral contexts. The first three axes total 68.3% of the total inertiaof the dataset. (C) Scatterplots of pairwise global gene expression comparison between FL (follicularlymphoma) and non-tumoral samples, in B lymphocytes (left panel), Tfh (middle panel) or stromalcells (right panel). Gene expression values are plotted on a log scale. Genes that were differentiallyexpressed (FDR (false discovery rate) ≤ 5%) with a fold change ≥2 (logFC ≥ 1) are indicated in redand blue. Top panel: representation of all annotated genes (21,319 PS (probesets) in B lymphocytes,19,859 PS in Tfh and 20,142 PS in stromal cells). Bottom panel: highlight of genes (in green) differentiallyexpressed (FDR ≤ 5%) with a fold change ≥2 (logFC ≥ 1).

Cancers 2020, 12, 2865 5 of 21
The next step was to explore the differentially expressed genes (DEG) between normal and FLsettings. By performing moderated t-tests with FDR correction (FDR < 5%), we identified, respectively,616 (281 up and 355 down) and 1193 (383 up and 887 down) DEG in FL-Tfh and FL-BM-MSC, comparedto their normal counterparts. As expected, the number of DEG was higher for B cells with 2998 up- and3342 down-regulated genes in FL-B cells compared to normal GC B cells (Figure 1C). Based on theseresults, we established a gene list corresponding to the non-redundant overexpressed genes in the FLcontext whatever the considered cell population. These 3405 up-regulated genes were postulated to berepresentative and specific of the FL supportive niche (Table S1). Metabolic and cell signaling pathwaysimplicated in this FL niche were analyzed using gene-set enrichment analysis (GSEA). We selectedthe top 25 pathways according to the EnrichR combined scores and NCI Nature or Panther databases(Figure 2A,B, respectively). Interestingly, we could identify pathways related to the inflammation andthe lymphocyte (and especially T cell) activation (Figure 2). T cell activation could also be evoked byhighlighting the IL-6, IL-12, and IFN-γ pathways, and FoxO family signaling. Furthermore, besideslymphocyte-mediated signals, several strongly represented networks could be linked to stromalsupportive niches and extracellular matrix, including integrin signals, Notch pathway, n-cadherin,or VEGF/VEGFR-mediated events, as well as TGF receptor, FGF, and EGF receptor signaling pathways.
Cancers 2020, 12, x 5 of 21
The next step was to explore the differentially expressed genes (DEG) between normal and FL settings. By performing moderated t-tests with FDR correction (FDR < 5%), we identified, respectively, 616 (281 up and 355 down) and 1193 (383 up and 887 down) DEG in FL-Tfh and FL-BM-MSC, compared to their normal counterparts. As expected, the number of DEG was higher for B cells with 2998 up- and 3342 down-regulated genes in FL-B cells compared to normal GC B cells (Figure 1C). Based on these results, we established a gene list corresponding to the non-redundant overexpressed genes in the FL context whatever the considered cell population. These 3405 up-regulated genes were postulated to be representative and specific of the FL supportive niche (Table S1). Metabolic and cell signaling pathways implicated in this FL niche were analyzed using gene-set enrichment analysis (GSEA). We selected the top 25 pathways according to the EnrichR combined scores and NCI Nature or Panther databases (Figure 2A,B, respectively). Interestingly, we could identify pathways related to the inflammation and the lymphocyte (and especially T cell) activation (Figure 2). T cell activation could also be evoked by highlighting the IL-6, IL-12, and IFN-γ pathways, and FoxO family signaling. Furthermore, besides lymphocyte-mediated signals, several strongly represented networks could be linked to stromal supportive niches and extracellular matrix, including integrin signals, Notch pathway, n-cadherin, or VEGF/VEGFR-mediated events, as well as TGF receptor, FGF, and EGF receptor signaling pathways.
Figure 2. EnrichR analysis of differentially expressed transcriptome of FL niche players using NCI Nature library (A) or Panther library (B). The top 25 pathways were sorted according to the EnrichR combined scores.
(B)
(A)
Figure 2. EnrichR analysis of differentially expressed transcriptome of FL niche players using NCINature library (A) or Panther library (B). The top 25 pathways were sorted according to the EnrichRcombined scores.

Cancers 2020, 12, 2865 6 of 21
We next questioned whether we could identify receptor–ligand pairs that could reflect the crosstalkbetween cell populations in the FL synapse (Figure 1A). To this end, we compiled information fromRefseq, NCBI, and Genecard datasets, and we established a dataset of 258 genes encoding cytokines,chemokines, TNF family members, immune checkpoint molecules, growth factors, and their respectivereceptors, as well as a large list of adhesion molecules. We analyzed the three cell populations,and comparisons were drawn between nonmalignant and FL-derived populations (Figure 3 andFigure S2 for detailed expression of FL and HD B cell populations). This representation allowed usto finely identify and visualize potential cell communications at the FL synapse compared to thenormal context. The analysis of the Ig superfamily members found an extinction of ICAM1 andICAM4 expressions in FL-derived cell populations compared to normal counterparts, whereas ICAM3was clearly up-regulated (Figure 3A). Similarly, ITGA5, ITGA10, and ITGAE were overexpressed inFL B cells and FL-BM-MSC, whereas FL-Tfh up-regulated ITGAE. The expression of VCAM1 wassimilarly up-regulated in FL-derived B and stromal cells, while the expression of clusterin (CLU),in addition to its production by MSC, was up-regulated in tumor B cells. Taken as a whole, thesefindings suggest that the FL microenvironment is sustained by modifications of adhesion moleculeexpression, which could impact cell migration and cellular interactions. Interestingly, while themajority of the cytokine ligands/receptors were similarly expressed in FL and normal contexts, somecytokines were up-regulated in BFL cells, including IL-6 and IL-2, or FL-Tfh, including IL4 and IL-7,whereas their respective receptors were unmodified. Interestingly, FL-Tfh also overexpressed IFNG.Lastly, we noticed in FL that both B cells and Tfh up-regulated the expression of CD200, creating,together with its moderate expression by stromal cells, a CD200-rich milieu in the FL tissues. CD200is known as a regulator of myeloid cell activity [20], opening a new gateway to other players in theFL niche.

Cancers 2020, 12, 2865 7 of 21Cancers 2020, 12, x 7 of 21
Figure 3. Heat map analysis of the expression of molecules and their relevant receptors by FL B cells, Tfh and mesenchymal stromal cells (MSC) in FL context compared to healthy donors (HD): adhesion molecules (A), cytokines and chemokines (B), TNF superfamily factors (C), immune checkpoints and co-stimulatory or inhibitory molecules (D) and TGF superfamily and other growth factors (E). Selected molecules correspond to non-redundant set of genes compiled from Refseq, NCBI and Genecard datasets. Data are means of normalized Affymetrix intensities for each molecule in each group.
2.2. Activation of Tfh Cells in FL Tumor
We previously demonstrated that the FL microenvironment is enriched in Tfh cells [17] supporting malignant B cell growth [18,21]. As discussed previously, our current gene-expression analysis suggested an activation of FL-Tfh (Figure 2) and confirmed overexpression of IL-4, IFNG,
Figure 3. Heat map analysis of the expression of molecules and their relevant receptors by FL B cells,Tfh and mesenchymal stromal cells (MSC) in FL context compared to healthy donors (HD): adhesionmolecules (A), cytokines and chemokines (B), TNF superfamily factors (C), immune checkpoints andco-stimulatory or inhibitory molecules (D) and TGF superfamily and other growth factors (E). Selectedmolecules correspond to non-redundant set of genes compiled from Refseq, NCBI and Genecarddatasets. Data are means of normalized Affymetrix intensities for each molecule in each group.
2.2. Activation of Tfh Cells in FL Tumor
We previously demonstrated that the FL microenvironment is enriched in Tfh cells [17] supportingmalignant B cell growth [18,21]. As discussed previously, our current gene-expression analysissuggested an activation of FL-Tfh (Figure 2) and confirmed overexpression of IL-4, IFNG, TNFA,and IL-2 (Figure 3B,C). To further characterize FL-Tfh features, we tested the immunological signaturesof MSigDB collections using GSEA and identified in FL-Tfh a significant enrichment for transcription

Cancers 2020, 12, 2865 8 of 21
factors belonging to a 193-gene signature specific to activated CD4+ T cells (M3319 geneset [22])(Figure 4A, left panel).
Cancers 2020, 12, x 8 of 21
TNFA, and IL-2 (Figure 3B,C). To further characterize FL-Tfh features, we tested the immunological signatures of MSigDB collections using GSEA and identified in FL-Tfh a significant enrichment for transcription factors belonging to a 193-gene signature specific to activated CD4+ T cells (M3319 geneset [22]) (Figure 4A, left panel).
Figure 4. Tfh activation in FL tumor. (A) Plots from GSEA (gene-set enrichment analysis) analyses comparing Tfh from FL (FL Tfh) or TONS (non-malignant tonsils; TONS Tfh) based on an activated T signature (M3319 MSigDB geneset in left panel and activated Tfh signature obtained by Tfh stimulation with anti-CD3/CD28 mAbs (see method) in right panel). Nominal p-value (p), and FDR (q) are given on the plot. FL Tfh are given on the left (red) of the plot and normal TONS_Tfh on the right (blue). (B) HLA-DR and LAG-3 mRNA expression on FL_Tfh or TONS_Tfh. (C) IL-6 (left panel) and IL-7 (right panel) mRNA expression by qRT-PCR in B lymphocytes isolated from reactive tonsils (TONS_BGC) (n = 5) or FL tumors (FL_B) (n = 6). The arbitrary value of 1 was assigned to a pool of five whole tonsil cells. (D) Gene expression of IL-6R and IL-7 subunits in normal Tfh (TONS_Tfh) or derived from FL (FL_Tfh). Bars: mean. * p < 0.05, ** p < 0.01, *** p < 0.001.
We then built our own activated-Tfh signature by comparing the transcriptome of tonsil-purified Tfh (n = 7) previously stimulated or not by anti-CD3/CD28 monoclonal antibodies. We found 2824
Figure 4. Tfh activation in FL tumor. (A) Plots from GSEA (gene-set enrichment analysis) analysescomparing Tfh from FL (FL Tfh) or TONS (non-malignant tonsils; TONS Tfh) based on an activated Tsignature (M3319 MSigDB geneset in left panel and activated Tfh signature obtained by Tfh stimulationwith anti-CD3/CD28 mAbs (see method) in right panel). Nominal p-value (p), and FDR (q) are givenon the plot. FL Tfh are given on the left (red) of the plot and normal TONS_Tfh on the right (blue).(B) HLA-DR and LAG-3 mRNA expression on FL_Tfh or TONS_Tfh. (C) IL-6 (left panel) and IL-7 (rightpanel) mRNA expression by qRT-PCR in B lymphocytes isolated from reactive tonsils (TONS_BGC)(n = 5) or FL tumors (FL_B) (n = 6). The arbitrary value of 1 was assigned to a pool of five whole tonsilcells. (D) Gene expression of IL-6R and IL-7 subunits in normal Tfh (TONS_Tfh) or derived from FL(FL_Tfh). Bars: mean. ns non-significant, * p < 0.05, ** p < 0.01, *** p < 0.001.

Cancers 2020, 12, 2865 9 of 21
We then built our own activated-Tfh signature by comparing the transcriptome of tonsil-purifiedTfh (n = 7) previously stimulated or not by anti-CD3/CD28 monoclonal antibodies. We found 2824differently expressed genes (p < 0.05, FC < 2) corresponding to 3665 PS and constituting a Tfh-specificactivated signature. Through GSEA analysis, we showed that FL-Tfh were significantly enrichedfor this signature (p < 0.001) compared to their normal counterpart (Figure 4A). In agreement withthis activated status, FL-Tfh expressed higher levels of HLA-DR (p < 0.001) and lower levels of theexhaustion marker LAG3 (p < 0.001) than tonsil-derived Tfh (Figure 4B). The differentiation andactivation of Tfh follow a complex process, in which IL-6 and IL-7 are mandatory [23], IL-6 by inducingTfh generation and differentiation in the GC [24,25] and IL-7 by fostering their differentiation andinitiating memory program [26]. Our analysis showed that FL B cells overexpressed these two cytokines(Figure 4C). Both IL6R and IL6ST/gp130, the two IL-6 receptor subunits, were highly expressed byboth normal and FL-Tfh, whereas IL7R expression was slightly down-regulated in FL-Tfh (Figure 4D).Among genes encoding costimulatory molecules, CD70 and CD80 were similarly expressed by FL andnormal GC B cells, while CD86 was significantly overexpressed in tumor cells (p = 0.004) (Figure S3),and could contribute to the activation of Tfh after binding to CD28. In addition, FL B cells increased theirexpression of ICOSL compared to normal GC B cells (p = 0.025) (Figure S3), and could thus participate inthe recruitment and the activation of ICOSpos Tfh [23,27]. Molecular data were furthermore confirmedin FL B cells using RNA sequencing on an independent cohort of FL patients and healthy donors(Supplementary Materials Figure S4, unpublished data). Taken as a whole, our study found at leastthree pathways, i.e., IL-6, CD86, and ICOSL, by which tumor B cells can contribute to Tfh activationand induce a potent microenvironment sustaining, in turn, FL cell growth.
2.3. Impaired Response of FL B Cells to IFN-γ
We next evaluated the functional effects on FL B cells of molecules produced by Tfh. We previouslydemonstrated the supportive role of Tfh on FL B cells survival through CD40L expression and IL-4secretion [18,21]. Herein, the above transcriptome analysis identified IFN-γ in the top five pathwaysinvolved in the FL synapse with an increased expression of IFNG by FL-Tfh, and this finding wasconfirmed on an independent series of FL (Figures 3D and 5A left). Interestingly, IFNGRI, a geneencoding the ligand-binding alpha chain of IFN receptor, was also increased in FL-B cells compared totonsil counterparts (Figure 5A, right, and Figure S4). We tested functionally purified FL B cells in vitroand left them overnight in culture in the presence or not of recombinant IFN-γ. At a first glance, we didnot detect any differences between these two conditions in terms of cell proliferation and viability,even when CD40L and IL-4 were added to the culture (n = 4). Quantitative RT-PCR assays showed adose-dependent increase of IFN-γ-regulated CIITA, SOCS1, TBX21, and STAT1 (Figure 5B). IFN-γ iswell known to induce molecules of the class II major histocompatibility complex (MHC) and couldthus contribute to the immune response, a potentially deleterious process for the development oflymphoma. Unlike normal GC B cells, FL B cells were unable to increase their cell-surface expressionof HLA-DR in response to IFN-γ, whereas enhanced HLA-DR expression was observed after CpGand/or CD40L exposure (Figure 5C). We thus demonstrated a specific defect on the IFN-γ-drivenHLA-DR expression in FL B cells. The previous report of Green et al. connected the down-regulation ofHLA-DR gene expression in FL B cells to a gene-silencing mechanism due to loss-of-function mutationsof CREBBP [28]. In our study, all explored FL cases presented an altered IFN-γ-response in term ofHLA-DR expression whatever the genotypic status of CREEBP (Figure 5D,E).

Cancers 2020, 12, 2865 10 of 21Cancers 2020, 12, x 10 of 21
Figure 5. IFN-γ pathway in malignant B cells: (A) Up-regulation of IFNG (left panel) and IFNGR (right panel) mRNA expression on normal and FL subpopulations. (B) mRNA expression by qRT-PCR of IFN-γ-target genes (CIITA, SOCS1, TBX21 and STAT1) in purified FL B cells stimulated or not (Ǿ) by IFN-γ 100 UI/mL (IFN100) for 24 h. (C) HLA-DR cell-surface expression on normal GC B cells (left panel) or FL B cells (right panel) cultivated for 24 h with CPG or IFN-γ , with or without CD40L stimulation, and according to CREBBP mutation. (D and E) rMFI: ratio of mean fluorescence intensity, wt: wild type, mut: mutation; Bars: mean. ns non-significant, * p < 0.05, ** p < 0.01, *** p < 0.001 compared to normal (A) or non-stimulated conditions (B to E).
2.4. The FL Microenvironment Improves the Adhesion of B Cells to Stromal Cells
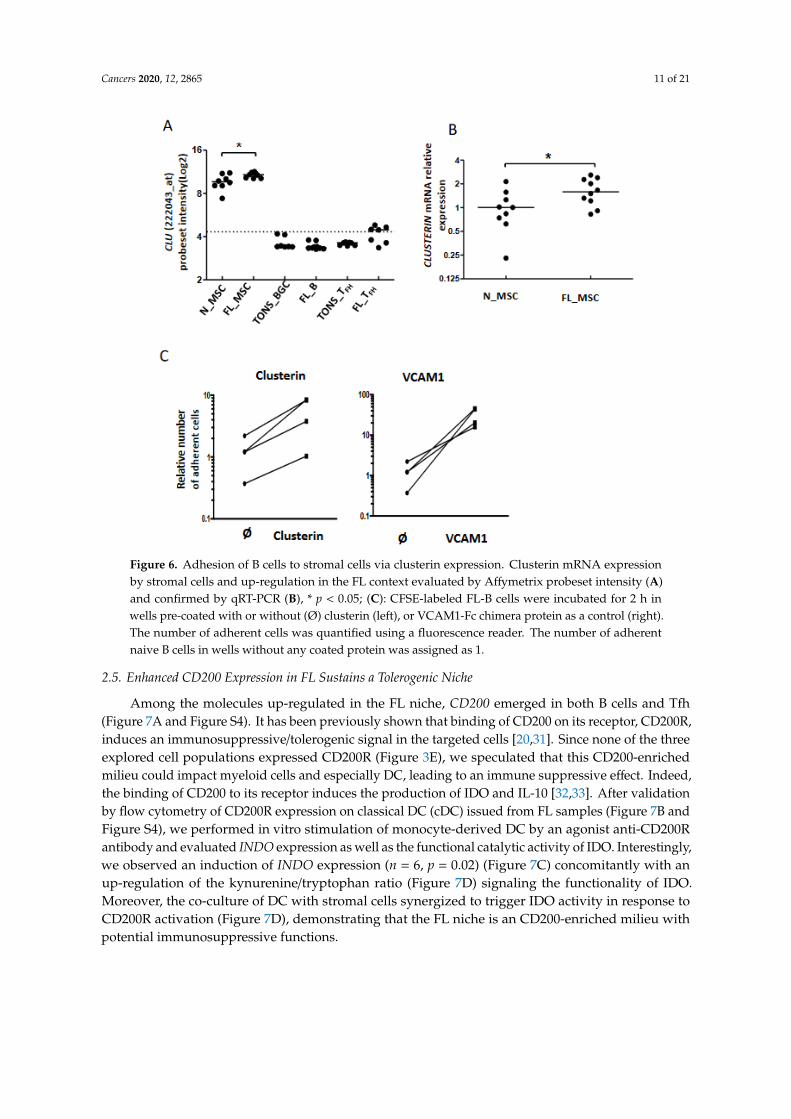
As described above, our data highlighted modifications among cell adhesion molecules, including CLU, at the interface between FL B cells and stromal cells (Figure 3A). Clusterin (also known as apolipoprotein J or ApoJ) is a molecule secreted following the stress response with a wide variety of effects depending on the cellular context [29] and which accumulates in lymphoid stromal cells [30]. Interestingly, MSC from FL-invaded BM showed a weak but significant increase of CLU gene expression (Figure 6A,B). This could be related to the commitment of FL BM stromal cells towards a lymphoid stromal cell differentiation [19]. Stimulation of FL B cells with clusterin for 4 days did not affect their viability or proliferation (data not shown). We next evaluated cell adhesion of FL B cells on clusterin, using VCAM1 as a positive control. We observed an increase of B cell adhesion in the presence of clusterin (Figure 6C). This result suggests that the production of clusterin by FL stromal cells improves the cell interactions within the microenvironment and contributes to creating a supportive stromal cell niche.
Figure 5. IFN-γ pathway in malignant B cells: (A) Up-regulation of IFNG (left panel) and IFNGR(right panel) mRNA expression on normal and FL subpopulations. (B) mRNA expression by qRT-PCRof IFN-γ-target genes (CIITA, SOCS1, TBX21 and STAT1) in purified FL B cells stimulated or not (Ø)by IFN-γ 100 UI/mL (IFN100) for 24 h. (C) HLA-DR cell-surface expression on normal GC B cells(left panel) or FL B cells (right panel) cultivated for 24 h with CPG or IFN-γ, with or without CD40Lstimulation, and according to CREBBP mutation. (D and E) rMFI: ratio of mean fluorescence intensity,wt: wild type, mut: mutation; Bars: mean. ns non-significant, * p < 0.05, ** p < 0.01, *** p < 0.001compared to normal (A) or non-stimulated conditions (B to E).
2.4. The FL Microenvironment Improves the Adhesion of B Cells to Stromal Cells
As described above, our data highlighted modifications among cell adhesion molecules, includingCLU, at the interface between FL B cells and stromal cells (Figure 3A). Clusterin (also known asapolipoprotein J or ApoJ) is a molecule secreted following the stress response with a wide variety ofeffects depending on the cellular context [29] and which accumulates in lymphoid stromal cells [30].Interestingly, MSC from FL-invaded BM showed a weak but significant increase of CLU gene expression(Figure 6A,B). This could be related to the commitment of FL BM stromal cells towards a lymphoidstromal cell differentiation [19]. Stimulation of FL B cells with clusterin for 4 days did not affect theirviability or proliferation (data not shown). We next evaluated cell adhesion of FL B cells on clusterin,using VCAM1 as a positive control. We observed an increase of B cell adhesion in the presence ofclusterin (Figure 6C). This result suggests that the production of clusterin by FL stromal cells improvesthe cell interactions within the microenvironment and contributes to creating a supportive stromalcell niche.
Cancers 2020, 12, 2865 11 of 21Cancers 2020, 12, x 11 of 21
Figure 6. Adhesion of B cells to stromal cells via clusterin expression. Clusterin mRNA expression by stromal cells and up-regulation in the FL context evaluated by Affymetrix probeset intensity (A) and confirmed by qRT-PCR (B), *p < 0.05; (C): CFSE-labeled FL-B cells were incubated for 2 h in wells pre-coated with or without (Ø) clusterin (left), or VCAM1-Fc chimera protein as a control (right). The number of adherent cells was quantified using a fluorescence reader. The number of adherent naive B cells in wells without any coated protein was assigned as 1.
2.5. Enhanced CD200 Expression in FL Sustains a Tolerogenic Niche
Among the molecules up-regulated in the FL niche, CD200 emerged in both B cells and Tfh (Figures 7A and S4). It has been previously shown that binding of CD200 on its receptor, CD200R, induces an immunosuppressive/tolerogenic signal in the targeted cells [20,31]. Since none of the three explored cell populations expressed CD200R (Figure 3E), we speculated that this CD200-enriched milieu could impact myeloid cells and especially DC, leading to an immune suppressive effect. Indeed, the binding of CD200 to its receptor induces the production of IDO and IL-10 [32,33]. After validation by flow cytometry of CD200R expression on classical DC (cDC) issued from FL samples (Figures 7B and S4), we performed in vitro stimulation of monocyte-derived DC by an agonist anti-CD200R antibody and evaluated INDO expression as well as the functional catalytic activity of IDO. Interestingly, we observed an induction of INDO expression (n = 6, p = 0.02) (Figure 7C) concomitantly with an up-regulation of the kynurenine/tryptophan ratio (Figure 7D) signaling the functionality of IDO. Moreover, the co-culture of DC with stromal cells synergized to trigger IDO activity in response to CD200R activation (Figure 7D), demonstrating that the FL niche is an CD200-enriched milieu with potential immunosuppressive functions.
Figure 6. Adhesion of B cells to stromal cells via clusterin expression. Clusterin mRNA expressionby stromal cells and up-regulation in the FL context evaluated by Affymetrix probeset intensity (A)and confirmed by qRT-PCR (B), * p < 0.05; (C): CFSE-labeled FL-B cells were incubated for 2 h inwells pre-coated with or without (Ø) clusterin (left), or VCAM1-Fc chimera protein as a control (right).The number of adherent cells was quantified using a fluorescence reader. The number of adherentnaive B cells in wells without any coated protein was assigned as 1.
2.5. Enhanced CD200 Expression in FL Sustains a Tolerogenic Niche
Among the molecules up-regulated in the FL niche, CD200 emerged in both B cells and Tfh(Figure 7A and Figure S4). It has been previously shown that binding of CD200 on its receptor, CD200R,induces an immunosuppressive/tolerogenic signal in the targeted cells [20,31]. Since none of the threeexplored cell populations expressed CD200R (Figure 3E), we speculated that this CD200-enrichedmilieu could impact myeloid cells and especially DC, leading to an immune suppressive effect. Indeed,the binding of CD200 to its receptor induces the production of IDO and IL-10 [32,33]. After validationby flow cytometry of CD200R expression on classical DC (cDC) issued from FL samples (Figure 7B andFigure S4), we performed in vitro stimulation of monocyte-derived DC by an agonist anti-CD200Rantibody and evaluated INDO expression as well as the functional catalytic activity of IDO. Interestingly,we observed an induction of INDO expression (n = 6, p = 0.02) (Figure 7C) concomitantly with anup-regulation of the kynurenine/tryptophan ratio (Figure 7D) signaling the functionality of IDO.Moreover, the co-culture of DC with stromal cells synergized to trigger IDO activity in response toCD200R activation (Figure 7D), demonstrating that the FL niche is an CD200-enriched milieu withpotential immunosuppressive functions.

Cancers 2020, 12, 2865 12 of 21Cancers 2020, 12, x 12 of 21
Figure 7. CD200 in FL tolerogenic niche. (A) CD200 mRNA expression analyzed by Affymetrix probeset intensity in stromal cells from non-tumoral (n_STRO) or FL (FL_STRO) contexts, B lymphocytes from tonsil (TONS_BGC) or FL lymph node (FL_B) and Tfh lymphocytes from tonsil (TONS_Tfh) or FL lymph node (FL Tfh). ns: non-significant, ** p < 0.01; (B) Flow cytometry expression of CD200R on dendritic cells (DC) from FL lymph nodes (black histogram) compared to isotype control (white histogram). DC were phenotypically defined as CD3negCD19negCD335negCD11cposHLA-DRposCD14neg viable cells. One representative graph out of three experiments is shown; (C) INDO mRNA expression by qRT-PCR of immature DC with or without CD200R in vitro stimulation (20 µg/mL) for 2 days (n = 6), * p < 0.05; (D) IDO activity evaluated by kynurenine/tryptophan ratio on DC cultured or not with MSC and stimulated or not with anti-CD200R antibody (20 µg/mL) for 2 days.
3. Discussion
FL B cells need the support of immune and stromal cells, organizing together a protumoral microenvironment that sustains tumor B cell survival and growth. The FL microenvironment displays a preeminent amplification of CD4pos T cells characterized by Tfh features but with a modified expression profile compared to their counterparts issued from reactive non-malignant LN [17,18]. The stromal compartment of the tumor is also modified, creating a permissive niche directly and indirectly supporting lymphoma cell growth [16,19].
In the present work, we addressed a description of the molecular pathways associated with the FL niche by exploring the GEP of the three major cell players, namely Tfh, MSC, and FL B cells, giving a global picture of the cell crosstalk between these compartments (Figure 8). In FL, Tfh present an
Figure 7. CD200 in FL tolerogenic niche. (A) CD200 mRNA expression analyzed by Affymetrix probesetintensity in stromal cells from non-tumoral (n_STRO) or FL (FL_STRO) contexts, B lymphocytes fromtonsil (TONS_BGC) or FL lymph node (FL_B) and Tfh lymphocytes from tonsil (TONS_Tfh) or FL lymphnode (FL Tfh). ns: non-significant, ** p < 0.01; (B) Flow cytometry expression of CD200R on dendriticcells (DC) from FL lymph nodes (black histogram) compared to isotype control (white histogram). DCwere phenotypically defined as CD3negCD19negCD335negCD11cposHLA-DRposCD14neg viable cells.One representative graph out of three experiments is shown; (C) INDO mRNA expression by qRT-PCRof immature DC with or without CD200R in vitro stimulation (20 µg/mL) for 2 days (n = 6), * p < 0.05;(D) IDO activity evaluated by kynurenine/tryptophan ratio on DC cultured or not with MSC andstimulated or not with anti-CD200R antibody (20 µg/mL) for 2 days.
3. Discussion
FL B cells need the support of immune and stromal cells, organizing together a protumoralmicroenvironment that sustains tumor B cell survival and growth. The FL microenvironment displaysa preeminent amplification of CD4pos T cells characterized by Tfh features but with a modifiedexpression profile compared to their counterparts issued from reactive non-malignant LN [17,18].The stromal compartment of the tumor is also modified, creating a permissive niche directly andindirectly supporting lymphoma cell growth [16,19].
In the present work, we addressed a description of the molecular pathways associated with theFL niche by exploring the GEP of the three major cell players, namely Tfh, MSC, and FL B cells, givinga global picture of the cell crosstalk between these compartments (Figure 8). In FL, Tfh present an

Cancers 2020, 12, 2865 13 of 21
activated signature which could enhance their capacity to promote lymphomagenesis through anincreased expression of TNFα, LTA, IL-4 and CD40LG, associated with a maintained high productionof CXCL13, ICOS, CTLA4, and CD200. These modifications of a Tfh-functional phenotype in FL couldbe in turn fostered by tumor cells through their increased expression of IL-6 and IL-7, both implicated inT cell homeostasis, memory T cell generation [34–36], and Tfh activation [24,37]. Indeed, IL-6 triggersTfh commitment through induction of the transcriptional repressor Bcl-6 [24], while IL-7 signalingrepresses Tfh-associated genes, including BCL6 and CXCR5, and induces anti-apoptotic BCL2 geneand glycerol channel aquaporin Aqp9, both of which are known to promote the long-term survivalof memory cells [26]. Mc Donald et al. demonstrated that Tfh and central memory T (Tcm) cellsshare developmental pathways and can be co-initiated from a population of Th1 cells resulting ina Tfh/Tcm-like population. The IL-6 treatment of these IL6-R+ IL7-R+ Th1 cells results in a furtherincrease of Tfh, whereas IL-7 treatment favors the initiation of the Tcm gene program. In our study,unlike the IL6R gene which maintained its expression in FL-derived Tfh, IL7R expression decreased,suggesting a potentially higher exposure of these cells to IL-6 which could promote a Tfh-memory celldifferentiation [38].
Cancers 2020, 12, x 13 of 21
activated signature which could enhance their capacity to promote lymphomagenesis through an increased expression of TNFα, LTA, IL-4 and CD40LG, associated with a maintained high production of CXCL13, ICOS, CTLA4, and CD200. These modifications of a Tfh-functional phenotype in FL could be in turn fostered by tumor cells through their increased expression of IL-6 and IL-7, both implicated in T cell homeostasis, memory T cell generation [34–36], and Tfh activation [24,37]. Indeed, IL-6 triggers Tfh commitment through induction of the transcriptional repressor Bcl-6 [24], while IL-7 signaling represses Tfh-associated genes, including BCL6 and CXCR5, and induces anti-apoptotic BCL2 gene and glycerol channel aquaporin Aqp9, both of which are known to promote the long-term survival of memory cells [26]. Mc Donald et al. demonstrated that Tfh and central memory T (Tcm) cells share developmental pathways and can be co-initiated from a population of Th1 cells resulting in a Tfh/Tcm-like population. The IL-6 treatment of these IL6-R+ IL7-R+ Th1 cells results in a further increase of Tfh, whereas IL-7 treatment favors the initiation of the Tcm gene program. In our study, unlike the IL6R gene which maintained its expression in FL-derived Tfh, IL7R expression decreased, suggesting a potentially higher exposure of these cells to IL-6 which could promote a Tfh-memory cell differentiation [38].
Figure 8. Schematic representation of interactions in FL niche.
Of interest, it has been shown in the inflammatory non-tumoral context that IL-6 supports the expansion of IFN-γ-secreting CD4+ T cells [39]. In FL, Tfh increase their expression of IFN-γ whereas FL B cells up-regulate IFNGR. However, FL B cells lost their ability to induce the expression of HLA-DR on the cell surface in response to IFN-γ, whatever the mutational status of CREBBP, whereas this induction is maintained in response to TLR9 and CD40L. Because HLA-DR functions in antigen presentation, it is likely that disabling cellular components of the immune system associated with tumor recognition and rejection could thwart immune-mediated death. Thus, impaired HLA-DR
Figure 8. Schematic representation of interactions in FL niche.
Of interest, it has been shown in the inflammatory non-tumoral context that IL-6 supports theexpansion of IFN-γ-secreting CD4+ T cells [39]. In FL, Tfh increase their expression of IFN-γ whereasFL B cells up-regulate IFNGR. However, FL B cells lost their ability to induce the expression of HLA-DRon the cell surface in response to IFN-γ, whatever the mutational status of CREBBP, whereas thisinduction is maintained in response to TLR9 and CD40L. Because HLA-DR functions in antigenpresentation, it is likely that disabling cellular components of the immune system associated withtumor recognition and rejection could thwart immune-mediated death. Thus, impaired HLA-DR

Cancers 2020, 12, 2865 14 of 21
expression on FL B cells affects the antigen-presenting capability of these cells and thus participates inthe control of immune surveillance.
Immune suppression occurs naturally via multiple mechanisms and tumors employ variousmechanisms to evade immune surveillance. An immune inhibitory ligand/receptor pair thatmaintains immune quiescence is CD200/CD200R. The CD200 (OX-2 antigen) molecule is a typeI immunoglobulin superfamily membrane glycoprotein, expressed in multiple cell types [20], whereasCD200 receptor (CD200R) is restricted to hematopoietic cells, mainly on the myeloid/monocytelineage cells. CD200-CD200R engagement imparts an immunoregulatory signal leading to thesuppression of a T-cell-mediated immune response [40,41], possibly with the induction of regulatoryT cells and post-transplant tolerance [42,43]. CD200 expression was found up-regulated in severalmature hematopoietic-related cancers [31,44] with a potential prognostic impact such as in multiplemyeloma [45]. Interestingly, in our study, we pointed out the presence of CD200-enriched milieu in FL,and other partners such as monocytes [46] or DC [47] have already been described as contributors tothe FL microenvironment by promoting tumor growth through the recruitment of accessory immunecells. Previous studies showed that a pro-inflammatory environment and IFN-γ were able to increaseCD200 expression by BM-MSC [48]. Thus, the highlight of an increased IFN-γ expression by FLTfh could explain the enhanced production of CD200 in the FL microenvironment, which provokesa CD200/CD200R engagement on myeloid cells initiating the expression of IDO activity leading totryptophan catabolism in the FL microenvironment and T cell suppression. IDO activity might thusplay an important role in regulating immune responses as a potent tool to help escape assault by theimmune system, as described in DLBCL, where IDO expression was correlated with worse outcomeafter R-CHOP treatment [49].
Normal lymphocytes at different stages of maturation show different capacities to recirculateand to adhere to stromal cells. Cellular adhesion molecules are necessarily critical in these processes.Since malignant cells may retain some of the attributes of their normal counterparts, it is oftenpostulated that they use the same molecules to achieve the same functional outcome as normal cells.However, studies usually focusing only on malignant cells neglect to explore other partners in thetumor microenvironment. In the present work, we jointly analyzed FL B cells, Tfh, and MSC in normaland tumor contexts, and this allowed us to highlight the remodeling of the Ig superfamily and integrinfamily molecules in the FL supportive niche, as we described extinction of some ICAM or integrinmolecules, whereas others were up-regulated in the different partners. In accordance with an enhancedinteraction between FL B cells and stromal cells, the up-regulation of the clusterin expression bystromal cells fits perfectly by promoting intense B cell adhesion. In addition, clusterin, which hasbeen found to be induced by IFN-γ in Hodgkin’s lymphoma [50], is considered as an oxidative stressregulatory molecule preventing cell apoptosis [51], another potential role contributing to the FL nichedevelopment. Of note, the CD44 molecule is described to strongly interact with hyaluronan, a majorcomponent of the extracellular matrix and which plays a pivotal role in inflammation and cancer [52] aswell as in locomotion and B cell migration on stromal cells and reticular fibers [53]. Interestingly, bothIFN-γ and IL-4 have been shown to induce a reduction in CD44 cell-surface expression [54]. We hereconfirmed a weaker CD44 gene expression in FL B cells compared to GC B cells [55], which could bethereby due to the IFN-γ- and IL-4-enriched microenvironment in FL, thus limiting the recirculationand migration of tumor cells by controlling their rolling adhesion on stromal cells, and favoring theiraccumulation in GC.
4. Materials and Methods
4.1. Patient Samples
Tissues and BM aspirates used for this study came from subjects recruited under writteninformed consent recovery according to the Principles of the Declaration of Helsinki and the FrenchNational Cancer Institute (INCa) ethic committee recommendations. They were collected, anonymized,

Cancers 2020, 12, 2865 15 of 21
and cryopreserved as viable cells in the local hematology biobank (CRB-Santé, CHU Rennes - FrenchMinister Authorization DC-2016-2565) before diagnosis and/or staging evaluation. LN samples (n = 33)and BM aspirations (n = 8) were obtained from primarily diagnosed or non-treated FL patients.Normal B and T cells were obtained from non-malignant tonsils (TONS) (n = 14) collected fromchildren undergoing routine tonsillectomy and normal BM aspirates (n = 8) were issued from patientsundergoing cardiac surgery. All FL clones showed a predominantly CD10pos follicular growth patternclassified into grade 1–2 (70%) or 3a (30%), according to the World Health Organization diagnosticcriteria. Patients with grade 3b FL or with disease in relapse after treatment and transformed FL wereexcluded from this study.
4.2. Preparation of Highly Purified Cells
Fresh tissues of lymph nodes or tonsils were mechanically dissociated and flushed with syringeand needle. Cell suspensions were filtered, washed and subsequently sorted using combinationsof monoclonal antibodies (mAbs) (Table S2A). Briefly, FL B cells and non-malignant tonsil GCB cells were sorted using FACSARIA (BD Biosciences) as CD20hiCD44loCD38posIgDnegCD138neg
cells for gene-expression profiling (FL LN, n = 17 and tonsils n = 14), and/or by magnetic sortusing B cell isolation kit II (Miltenyi Biotech)) for culture experiments (n = 15). Tfh cells wereobtained from CD4pos T-cell-enriched fraction of FL LN (n = 7) or tonsils (n = 7) using theCD3posCD4posCXCR5hiICOShiCD25neg definition as previously described [56]. Stromal cells wereobtained after in vitro culture of adherent cells from healthy (n = 8) or FL (n = 8) BM samples,as previously reported [19].
4.3. Gene Expression Profiling
Total RNAs were extracted using AllPrep™ DNA/RNA Mini kit (Qiagen, Valencia, CA, USA)or with Qiazol (Qiagen) reagent, including DNAse treatment, as recommended by the manufacturer.RNA quality was evaluated by capillary electrophoresis using the Bioanalyzer 2100 (Agilent, SantaClara, CA, USA). The gene expression profiles (GEP) were determined on Affymetrix Human GenomeU133 Plus 2.0 microarrays containing 54,675 probe sets (PS). Hybridization and raw data of expressionsignal intensities extraction were processed by the CIT platform (www.cit.ligue-cancer.net). Data areavailable via the NCBI Gene Expression Omnibus (GSE85233 for B lymphocytes, GSE85229 for BM-MSCfractions and GSE66384 for Tfh populations). Raw data of all samples were first normalized togetherby the Robust Multichip Averaging algorithm using GC content (GC-RMA) and Log2 transformationwith Partek® Genomics SuiteTM software (Partek, St. Louis, MO, USA). Filtering was performed byexclusion of all PS with an intensity below the background threshold (assumed to log2 (20) in allsamples) and/or without a gene symbol assignment. Principal component analysis and hierarchicalclustering analyses (HCA) were achieved with R software. In parallel, pooled raw data of normaland tumor cell sample compartments (i.e., Tfh cells, B cells, and MSCs) were normalized and filteredas described above. Pairwise global gene expression comparison was performed using R. Probesetsdifferentially expressed were then identified using the Limma moderated t-test [57] with false discoveryrate (FDR) correction of p-values (FDR < 5%).
4.4. Tools for Affymetrix Dataset Analysis
Gene-set enrichment analysis (GSEA) [58] was performed through EnrichR method [59] and NCINature [60] or Panther [61] metabolic and cell signaling pathway databases. This approach combinesgene function, ontology, pathways, and statistical analysis tools to rank enriched terms. Genes wereexplored through functional pathways ordered by statistical overrepresentation using combined scores(cScore) corresponding to the multiplication of the p-value (Fisher exact test, p < 0.05) and the z-scoreof the deviation from the expected rank.

Cancers 2020, 12, 2865 16 of 21
4.5. Supplementary Method for GEP Analysis
Lists of known receptor–ligand pairs were elaborated using the NCBI database and Genecarddatasets. Each selected molecule was associated with its ascension number, HGNC gene symbol andsynonyms, and then linked to the Affymetrix database (Netaffx) in order to identify all correspondingPS. The PS intensities were selected in our normalized microarray dataset, and only one was retainedaccording to successive filters: (1) expression by at least one sample in the dataset, (2) highest intensityin the dataset, and (3) highest standard deviation within compartments. The selected data were thenadjusted by mean centering and intensity plots were visualized separately for FL and normal subsetsusing d3Heatmap R package.
4.6. Quantitative RT-PCR
RNAs were reverse transcribed into cDNAs using Superscript II and random hexamers (Invitrogen,Carlsbad, CA, USA). Quantitative RT-PCRs (qRT-PCR) were performed using the TaqMan UniversalMaster Mix and specific Taqman Gene Expression Assays from Applied Biosystems (Foster City, CA,USA) (Table S2B). ABL or GAPDH were determined as appropriate internal standard genes. Geneexpression was measured using the ∆CT calculation method.
4.7. Flow Cytometry Analysis
Antibodies used for phenotyping are listed in Table S2A and appropriate isotype-matched mAbswere used as negative controls. Analyses were performed using a Gallios (Beckman Coulter) flowcytometer and data were analyzed using Kaluza software (Beckman Coulter). Cell death was checkedusing DAPI (Life Technologies) staining.
4.8. Primary B or T Lymphocyte Culture
Cultures were performed in complete medium consisting of RPMI 1640 (Invitrogen, Carlsbad,CA, USA) supplemented with FCS (Biowest, Nuaillé, France), antibiotics (Invitrogen). Tonsil-Tfhwere cultured in vitro for 14 h with anti-CD3 and anti-CD28 antibodies (Sanquin, Amsterdam,The Nederlands) before RNA extraction for activated Tfh cell signature obtention. FL B cells werestimulated with or without gamma interferon (IFN-γ) (20 or 100 UI/mL, R&D Systems).
4.9. Dendritic Cell Production and Culture
Peripheral blood monocytes were obtained using CD14pos Microbeads kit (Miltenyi Biotech) orby elutriation and were cultured for 5 days with GM-CSF (800 UI/mL, Cellgenix, Breisgau, Germany)and IL-4 (250 UI/mL, R&D Systems). Immature DC were then washed and put again in culture for2 days with or without agonist anti-CD200R antibodies (20 µg/mL, R&D Systems) or isotype control.Co-cultures were performed in parallel with stromal cells (40,000 cells/cm2) and/or immature DC(1 × 10⁶ cells/mL) that were cultured for 5 days with GM-CSF (800 UI/mL) and IL-4 (250 UI/mL).CD200R stimulation was then added for 2 supplemental days of culture. Culture supernatants werecollected by centrifugation, whereas cells were used for RNA extraction. In co-culture conditions, DCwere separated from stromal cells using CD45posCD105neg gating strategy and FACSARIA cell sorting.
4.10. Indoleamine 2,3-Dioxygenase (IDO) Activity Analysis
IDO activity was evaluated on stromal cells and DC co-culture supernatants by measuringkynurenine concentration in culture supernatants by high performance liquid chromatography using3-nitro-L-tyrosine as an internal standard. Kynurenine and 3-nitro-L-tyrosine were detected by UVabsorption at 360 nm.

Cancers 2020, 12, 2865 17 of 21
4.11. Adhesion Assay
Naïve B cells or primary FL B cells were isolated as previously described [18] with a purity greaterthan 95% of CD19pos B cells expressing the appropriate malignant isotype light chain. Subsequently,FL B cells (n = 4) were labeled with 2 µM CFSE (Life Technologies) and 105 FL B cells were seeded ineach well of a pre-washed 96-well plate pre-coated with 5ug/mL of recombinant human VCAM1 Fcchimera protein (RD Systems) or 1.25ug/mL of recombinant human clusterin (RD Systems). Plates werethen incubated 2 h at 37 ◦C. Thereafter, each well was washed once with PBS before quantificationof residual fluorescence (excitation: 495nm; emission: 519 nm) using a Varioskan Flash Multimodereader (Thermo Scientific), which was directly correlated with the number of adherent cells. In order toquantify the number of adherent cells in each well, a titration curve was drawn using a standard rangefrom 1.6 × 10⁵ to 781 cells per well by two-fold serial dilution, and by measuring the fluorescence ineach well.
4.12. Statistical and Bioinformatic Analyses
Statistical analyses were performed with Prism software (GraphPad Software, La Jolla, CA, USA)using the Student’s t test or the Mann–Whitney nonparametric U test as appropriate.
5. Conclusions
Our study uncovers a global picture of the cell interactions within the FL microenvironmentthat contribute to the maintenance and development of a FL-specific tumor niche. In recent years,the application of genome-wide techniques has allowed identification of numerous genetic alterationsin FL, which may impact interactions between the malignant B cells and the tumor microenvironment.It is therefore highly plausible that the FL niche includes the notion of tumor heterogeneity withmolecular modifications depending on B cell genetic alterations, a hypothesis not addressed in thecurrent study due to low number of cell samples
Our findings highlight the crucial role of bidirectional cell crosstalk to set up a supportivemicroenvironment for malignant FL cells that accumulate and escape immune surveillance beforeaccumulating high genetic alterations leading to an aggressive lymphoma transformation. Targetingthese cell interactions with specific drugs in the FL niche could represent an attractive option for futuretherapeutic strategies.
Supplementary Materials: The following are available online at http://www.mdpi.com/2072-6694/12/10/2865/s1,Figure S1: Hierarchical clustering the 7760 Affymetrix probesets (PS) with the higher intensities in each dataset;Figure S2: Heat map analysis of the expression of molecules and their relevant receptors by FL B cells compared tohealthy donors (HD; Figure S3: CD70, CD80, CD86 and ICOSL Affymetrix probeset intensities in FL tumor cells(FL_B) compared to tonsil germinal center B cells (TONS-BGC).; Figure S4: IL6, IL-7, CD86, ICOSL, IFNGR andCD200 expression in sorted FL tumor B cells compared to tonsil germinal center B cells as assessed by RNA-seq(unpublished independent cohorts); Table S1: 3405 up-regulated genes in FL niche; Table S2: Antibodies used forflow cytometry and cell sorting, and Taqman gene expression assays used for RQ-PCR experiments
Author Contributions: C.P. and P.A.-T. designed, performed experiments, analyzed data and wrote the paper;D.R. performed statistical analyses; G.C. contributed to experiment design and performed sub-populationspurifications; C.N., J.D., F.C. and F.D. performed experiments; V.L. and T.L. contributed to patient selection andclinical annotations; T.F. and K.T. supervised research and wrote the paper. All authors have read and agreed tothe published version of the manuscript.
Funding: This work was supported by the Fondation ARC pour la Recherche sur le Cancer (Grant PGA1RF20170205386), by the Infrastructure Program eCellFrance (ANR-11-INSB-005), and by the Institut National ducancer (INCA AAP PLBIO-18-060).
Acknowledgments: This work is part of the “Carte d’Identité des Tumeurs (CIT)” program developed by the“Ligue contre le Cancer”, we thank the personnel of its platforms for RNA qualification (Saint-Louis Hospital,Paris) and Affymetrix expression array (Institut de Génétique et de Biologie Moléculaire et Cellulaire, Strasbourg).We thank all technicians for their valued work and especially Pauline Migaud and Céline Nonn. The authorsare indebted to the pathologists, biologists and clinicians, especially from the BREHAT group, who participatedto the collection of sample and clinical data annotations. The “Centre de Ressources Biologiques (CRB)-Santé”(BB-0033-00056) of Rennes hospital is gratefully acknowledged for its support in the processing of biological

Cancers 2020, 12, 2865 18 of 21
samples. Cell sorting was performed at the Biosit Flow Cytometry and Cell Sorting Facility (University of Rennes 1,France). We thank INRA for technical assistance in evaluation of IDO activity.
Conflicts of Interest: The authors declare no conflict of interest.
References
1. Mesin, L.; Ersching, J.; Victora, G.D. Germinal Center B Cell Dynamics. Immunity 2016, 45, 471–482. [CrossRef][PubMed]
2. Cyster, J.G.; Allen, C.D.C. B Cell Responses: Cell Interaction Dynamics and Decisions. Cell 2019, 177, 524–540.[CrossRef] [PubMed]
3. Mayer, C.T.; Gazumyan, A.; Kara, E.E.; Gitlin, A.D.; Golijanin, J.; Viant, C.; Pai, J.; Oliveira, T.Y.; Wang, Q.;Escolano, A.; et al. The microanatomic segregation of selection by apoptosis in the germinal center. Science2017, 358, eaao2602. [CrossRef] [PubMed]
4. Roulland, S.; Faroudi, M.; Mamessier, E.; Sungalee, S.; Salles, G.; Nadel, B. Early Steps of Follicular LymphomaPathogenesis. In Advances in Immunology; Elsevier: Amsterdam, The Netherlands, 2011; Volume 111, pp. 1–46,ISBN 978-0-12-385991-4.
5. Green, M.R. Chromatin modifying gene mutations in follicular lymphoma. Blood 2018, 131, 595–604.[CrossRef]
6. Pasqualucci, L. Molecular pathogenesis of germinal center-derived B cell lymphomas. Immunol. Rev. 2019,288, 240–261. [CrossRef]
7. Okosun, J.; Bödör, C.; Wang, J.; Araf, S.; Yang, C.-Y.; Pan, C.; Boller, S.; Cittaro, D.; Bozek, M.; Iqbal, S.; et al.Integrated genomic analysis identifies recurrent mutations and evolution patterns driving the initiation andprogression of follicular lymphoma. Nat. Genet. 2014, 46, 176–181. [CrossRef]
8. Desmots, F.; Roussel, M.; Pangault, C.; Llamas-Gutierrez, F.; Pastoret, C.; Guiheneuf, E.; Le Priol, J.;Camara-Clayette, V.; Caron, G.; Henry, C.; et al. Pan-HDAC Inhibitors Restore PRDM1 Response to IL21 inCREBBP-Mutated Follicular Lymphoma. Clin. Cancer Res. Off. J. Am. Assoc. Cancer Res. 2019, 25, 735–746.[CrossRef]
9. Milpied, P.; Cervera-Marzal, I.; Mollichella, M.-L.; Tesson, B.; Brisou, G.; Traverse-Glehen, A.; Salles, G.;Spinelli, L.; Nadel, B. Human germinal center transcriptional programs are de-synchronized in B celllymphoma. Nat. Immunol. 2018, 19, 1013. [CrossRef]
10. Araf, S.; Wang, J.; Korfi, K.; Pangault, C.; Kotsiou, E.; Rio-Machin, A.; Rahim, T.; Heward, J.; Clear, A.;Iqbal, S.; et al. Genomic profiling reveals spatial intra-tumor heterogeneity in follicular lymphoma. Leukemia2018, 32, 1261–1265. [CrossRef]
11. Amin, R.; Mourcin, F.; Uhel, F.; Pangault, C.; Ruminy, P.; Dupré, L.; Guirriec, M.; Marchand, T.; Fest, T.;Lamy, T.; et al. DC-SIGN-expressing macrophages trigger activation of mannosylated IgM B-cell receptor infollicular lymphoma. Blood 2015, 126, 1911–1920. [CrossRef]
12. Amé-Thomas, P.; Tarte, K. The yin and the yang of follicular lymphoma cell niches: Role of microenvironmentheterogeneity and plasticity. Semin. Cancer Biol. 2014, 24, 23–32. [CrossRef] [PubMed]
13. Lamaison, C.; Tarte, K. Impact of B cell/lymphoid stromal cell crosstalk in B-cell physiology and malignancy.Immunol. Lett. 2019, 215, 12–18. [CrossRef] [PubMed]
14. Dave, S.S.; Wright, G.; Tan, B.; Rosenwald, A.; Gascoyne, R.D.; Chan, W.C.; Fisher, R.I.; Braziel, R.M.;Rimsza, L.M.; Grogan, T.M.; et al. Prediction of Survival in Follicular Lymphoma Based on MolecularFeatures of Tumor-Infiltrating Immune Cells. N. Engl. J. Med. 2004, 351, 2159–2169. [CrossRef] [PubMed]
15. Wahlin, B.E.; Sander, B.; Christensson, B.; Ostenstad, B.; Holte, H.; Brown, P.D.; Sundström, C.; Kimby, E.Entourage: The immune microenvironment following follicular lymphoma. Blood Cancer J. 2012, 2, e52.[CrossRef] [PubMed]
16. Pandey, S.; Mourcin, F.; Marchand, T.; Nayar, S.; Guirriec, M.; Pangault, C.; Monvoisin, C.; Amé-Thomas, P.;Guilloton, F.; Dulong, J.; et al. IL-4/CXCL12 loop is a key regulator of lymphoid stroma function in follicularlymphoma. Blood 2017, 129, 2507–2518. [CrossRef]
17. Pangault, C.; Amé-Thomas, P.; Ruminy, P.; Rossille, D.; Caron, G.; Baia, M.; De Vos, J.; Roussel, M.;Monvoisin, C.; Lamy, T.; et al. Follicular lymphoma cell niche: Identification of a preeminent IL-4-dependentT(FH)-B cell axis. Leukemia 2010, 24, 2080–2089. [CrossRef]

Cancers 2020, 12, 2865 19 of 21
18. Amé-Thomas, P.; Le Priol, J.; Yssel, H.; Caron, G.; Pangault, C.; Jean, R.; Martin, N.; Marafioti, T.; Gaulard, P.;Lamy, T.; et al. Characterization of intratumoral follicular helper T cells in follicular lymphoma: Role in thesurvival of malignant B cells. Leukemia 2012, 26, 1053–1063. [CrossRef]
19. Guilloton, F.; Caron, G.; Ménard, C.; Pangault, C.; Amé-Thomas, P.; Dulong, J.; De Vos, J.; Rossille, D.;Henry, C.; Lamy, T.; et al. Mesenchymal stromal cells orchestrate follicular lymphoma cell niche through theCCL2-dependent recruitment and polarization of monocytes. Blood 2012, 119, 2556–2567. [CrossRef]
20. Barclay, A.N.; Wright, G.J.; Brooke, G.; Brown, M.H. CD200 and membrane protein interactions in the controlof myeloid cells. Trends Immunol. 2002, 23, 285–290. [CrossRef]
21. Amé-Thomas, P.; Hoeller, S.; Artchounin, C.; Misiak, J.; Braza, M.S.; Jean, R.; Le Priol, J.; Monvoisin, C.;Martin, N.; Gaulard, P.; et al. CD10 delineates a subset of human IL-4 producing follicular helper T cellsinvolved in the survival of follicular lymphoma B cells. Blood 2015, 125, 2381–2385. [CrossRef]
22. Bangs, S.C.; Baban, D.; Cattan, H.J.; Li, C.K.-F.; McMichael, A.J.; Xu, X.-N. Human CD4+ memory T cells arepreferential targets for bystander activation and apoptosis. J. Immunol. Baltim. Md 1950 2009, 182, 1962–1971.[CrossRef] [PubMed]
23. Crotty, S. T Follicular Helper Cell Biology: A Decade of Discovery and Diseases. Immunity 2019, 50, 1132–1148.[CrossRef] [PubMed]
24. Chavele, K.-M.; Merry, E.; Ehrenstein, M.R. Cutting edge: Circulating plasmablasts induce the differentiationof human T follicular helper cells via IL-6 production. J. Immunol. Baltim. Md 1950 2015, 194, 2482–2485.[CrossRef] [PubMed]
25. Papillion, A.; Powell, M.D.; Chisolm, D.A.; Bachus, H.; Fuller, M.J.; Weinmann, A.S.; Villarino, A.; O’Shea, J.J.;León, B.; Oestreich, K.J.; et al. Inhibition of IL-2 responsiveness by IL-6 is required for the generation ofGC-TFH cells. Sci. Immunol. 2019, 4, eaaw7636. [CrossRef] [PubMed]
26. McDonald, P.W.; Read, K.A.; Baker, C.E.; Anderson, A.E.; Powell, M.D.; Ballesteros-Tato, A.; Oestreich, K.J.IL-7 signalling represses Bcl-6 and the TFH gene program. Nat. Commun. 2016, 7. [CrossRef]
27. Xu, H.; Li, X.; Liu, D.; Li, J.; Zhang, X.; Chen, X.; Hou, S.; Peng, L.; Xu, C.; Liu, W.; et al. Follicular T-helper cellrecruitment governed by bystander B cells and ICOS-driven motility. Nature 2013, 496, 523–527. [CrossRef]
28. Green, M.R.; Kihira, S.; Liu, C.L.; Nair, R.V.; Salari, R.; Gentles, A.J.; Irish, J.; Stehr, H.; Vicente-Dueñas, C.;Romero-Camarero, I.; et al. Mutations in early follicular lymphoma progenitors are associated withsuppressed antigen presentation. Proc. Natl. Acad. Sci. USA 2015, 112, E1116–E1125. [CrossRef]
29. Wilson, M.R.; Zoubeidi, A. Clusterin as a therapeutic target. Expert Opin. Ther. Targets 2017, 21, 201–213.[CrossRef]
30. Afanasyeva, M.A.; Britanova, L.V.; Korneev, K.V.; Mitkin, N.A.; Kuchmiy, A.A.; Kuprash, D.V. Clusterin Is aPotential Lymphotoxin Beta Receptor Target That Is Upregulated and Accumulates in Germinal Centers ofMouse Spleen during Immune Response. PLoS ONE 2014, 9, e98349. [CrossRef]
31. Moreaux, J.; Veyrune, J.L.; Reme, T.; De Vos, J.; Klein, B. CD200: A putative therapeutic target in cancer.Biochem. Biophys. Res. Commun. 2008, 366, 117–122. [CrossRef]
32. Munn, D.H.; Mellor, A.L. Indoleamine 2,3-dioxygenase and tumor-induced tolerance. J. Clin. Investig. 2007,117, 1147–1154. [CrossRef] [PubMed]
33. Schmidt, S.V.; Nino-Castro, A.C.; Schultze, J.L. Regulatory dendritic cells: There is more than just immuneactivation. Front. Immunol. 2012, 3. [CrossRef] [PubMed]
34. Schluns, K.S.; Kieper, W.C.; Jameson, S.C.; Lefrançois, L. Interleukin-7 mediates the homeostasis of naïve andmemory CD8 T cells in vivo. Nat. Immunol. 2000, 1, 426–432. [CrossRef] [PubMed]
35. Carrette, F.; Surh, C.D. IL-7 signaling and CD127 receptor regulation in the control of T cell homeostasis.Semin. Immunol. 2012, 24, 209–217. [CrossRef]
36. Horn, F.; Henze, C.; Heidrich, K. Interleukin-6 signal transduction and lymphocyte function. Immunobiology2000, 202, 151–167. [CrossRef]
37. Seo, Y.B.; Im, S.J.; Namkoong, H.; Kim, S.W.; Choi, Y.W.; Kang, M.C.; Lim, H.S.; Jin, H.T.; Yang, S.H.; Cho, M.L.;et al. Crucial roles of interleukin-7 in the development of T follicular helper cells and in the induction ofhumoral immunity. J. Virol. 2014, 88, 8998–9009. [CrossRef]
38. Hale, J.S.; Ahmed, R. Memory T Follicular Helper CD4 T Cells. Front. Immunol. 2015, 6. [CrossRef]39. Fielding, C.A.; Jones, G.W.; McLoughlin, R.M.; McLeod, L.; Hammond, V.J.; Uceda, J.; Williams, A.S.;
Lambie, M.; Foster, T.L.; Liao, C.-T.; et al. Interleukin-6 Signaling Drives Fibrosis in Unresolved Inflammation.Immunity 2014, 40, 40–50. [CrossRef]

Cancers 2020, 12, 2865 20 of 21
40. Hoek, R.M. Down-Regulation of the Macrophage Lineage Through Interaction with OX2 (CD200). Science2000, 290, 1768–1771. [CrossRef]
41. Jenmalm, M.C.; Cherwinski, H.; Bowman, E.P.; Phillips, J.H.; Sedgwick, J.D. Regulation of Myeloid CellFunction through the CD200 Receptor. J. Immunol. 2006, 176, 191–199. [CrossRef]
42. Yu, K.; Chen, Z.; Gorczynski, R. Effect of CD200 and CD200R1 expression within tissue grafts on increasedgraft survival in allogeneic recipients. Immunol. Lett. 2013, 149, 1–8. [CrossRef] [PubMed]
43. Wang, L.; Liu, J.-Q.; Talebian, F.; El-Omrani, H.Y.; Khattabi, M.; Yu, L.; Bai, X.-F. Tumor expression of CD200inhibits IL-10 production by tumor-associated myeloid cells and prevents tumor immune evasion of CTLtherapy. Eur. J. Immunol. 2010, 40, 2569–2579. [CrossRef] [PubMed]
44. Dorfman, D.M.; Shahsafaei, A. CD200 (OX-2 membrane glycoprotein) is expressed by follicular T helpercells and in angioimmunoblastic T-cell lymphoma. Am. J. Surg. Pathol. 2011, 35, 76–83. [CrossRef] [PubMed]
45. Douds, J.J.; Long, D.J.; Kim, A.S.; Li, S. Diagnostic and prognostic significance of CD200 expression and itsstability in plasma cell myeloma. J. Clin. Pathol. 2014, 67, 792–796. [CrossRef]
46. Epron, G.; Ame-Thomas, P.; Le Priol, J.; Pangault, C.; Dulong, J.; Lamy, T.; Fest, T.; Tarte, K. Monocytes and Tcells cooperate to favor normal and follicular lymphoma B-cell growth: Role of IL-15 and CD40L signaling.Leukemia 2012, 26, 139–148. [CrossRef]
47. Chevalier, N.; Mueller, M.; Mougiakakos, D.; Ihorst, G.; Marks, R.; Schmitt-Graeff, A.; Veelken, H. Analysis ofdendritic cell subpopulations in follicular lymphoma with respect to the tumor immune microenvironment.Leuk. Lymphoma 2016, 57, 2150–2160. [CrossRef]
48. Najar, M.; Raicevic, G.; Jebbawi, F.; De Bruyn, C.; Meuleman, N.; Bron, D.; Toungouz, M.; Lagneaux, L.Characterization and functionality of the CD200–CD200R system during mesenchymal stromal cellinteractions with T-lymphocytes. Immunol. Lett. 2012, 146, 50–56. [CrossRef]
49. Ninomiya, S.; Hara, T.; Tsurumi, H.; Hoshi, M.; Kanemura, N.; Goto, N.; Kasahara, S.; Shimizu, M.; Ito, H.;Saito, K.; et al. Indoleamine 2,3-dioxygenase in tumor tissue indicates prognosis in patients with diffuselarge B-cell lymphoma treated with R-CHOP. Ann. Hematol. 2011, 90, 409–416. [CrossRef]
50. Frazzi, R.; Casali, B.; Iori, M.; Nicoli, D.; Mammi, C.; Merli, F. Increase in clusterin forms part of the stressresponse in Hodgkin’s lymphoma. Int. J. Oncol. 2011, 38, 677–684. [CrossRef]
51. Yu, B.; Yang, Y.; Liu, H.; Gong, M.; Millard, R.W.; Wang, Y.-G.; Ashraf, M.; Xu, M. Clusterin/Akt Up-RegulationIs Critical for GATA-4 Mediated Cytoprotection of Mesenchymal Stem Cells against Ischemia Injury. PLoS ONE2016, 11, e0151542. [CrossRef]
52. Murai, T. Lipid Raft-Mediated Regulation of Hyaluronan–CD44 Interactions in Inflammation and Cancer.Front. Immunol. 2015, 6. [CrossRef] [PubMed]
53. Clark, R.A.; Alon, R.; Springer, T.A. CD44 and hyaluronan-dependent rolling interactions of lymphocytes ontonsillar stroma. J. Cell Biol. 1996, 134, 1075–1087. [CrossRef] [PubMed]
54. Kryworuchko, M.; Diaz-Mitoma, F.; Kumar, A. Interferon-γ Inhibits CD44–Hyaluronan Interactions inNormal Human B Lymphocytes. Exp. Cell Res. 1999, 250, 241–252. [CrossRef] [PubMed]
55. Detry, G.; Drénou, B.; Ferrant, A.; Theate, I.; Michaux, L.; Scheiff, J.M.; Latinne, D.; Leveugle, P.; Mazzon, A.M.;Deneys, V. Tracking the follicular lymphoma cells in flow cytometry: Characterisation of a new usefulantibody combination. Eur. J. Haematol. 2004, 73, 325–331. [CrossRef]
56. Misiak, J.; Tarte, K.; Amé-Thomas, P. Flow Cytometric Detection and Isolation of Human Tonsil or LymphNode T Follicular Helper Cells. In T Follicular Helper Cells; Espéli, M., Linterman, M., Eds.; Springer:New York, NY, USA, 2015; Volume 1291, pp. 163–173, ISBN 978-1-4939-2497-4.
57. Irizarry, R.A. From CEL Files to Annotated Lists of Interesting Genes. In Bioinformatics and ComputationalBiology Solutions Using R and Bioconductor; Gentleman, R., Carey, V.J., Huber, W., Irizarry, R.A., Dudoit, S.,Eds.; Springer: New York, NY, USA, 2005; pp. 431–442, ISBN 978-0-387-25146-2.
58. Subramanian, A.; Tamayo, P.; Mootha, V.K.; Mukherjee, S.; Ebert, B.L.; Gillette, M.A.; Paulovich, A.;Pomeroy, S.L.; Golub, T.R.; Lander, E.S.; et al. Gene set enrichment analysis: A knowledge-based approach forinterpreting genome-wide expression profiles. Proc. Natl. Acad. Sci. USA 2005, 102, 15545–15550. [CrossRef]
59. Kuleshov, M.V.; Jones, M.R.; Rouillard, A.D.; Fernandez, N.F.; Duan, Q.; Wang, Z.; Koplev, S.; Jenkins, S.L.;Jagodnik, K.M.; Lachmann, A.; et al. Enrichr: A comprehensive gene set enrichment analysis web server2016 update. Nucleic Acids Res. 2016, 44, W90–W97. [CrossRef]

Cancers 2020, 12, 2865 21 of 21
60. Schaefer, C.F.; Anthony, K.; Krupa, S.; Buchoff, J.; Day, M.; Hannay, T.; Buetow, K.H. PID: The PathwayInteraction Database. Nucleic Acids Res. 2009, 37, D674–D679. [CrossRef]
61. Mi, H.; Muruganujan, A.; Thomas, P.D. PANTHER in 2013: Modeling the evolution of gene function,and other gene attributes, in the context of phylogenetic trees. Nucleic Acids Res. 2012, 41, D377–D386.[CrossRef]
© 2020 by the authors. Licensee MDPI, Basel, Switzerland. This article is an open accessarticle distributed under the terms and conditions of the Creative Commons Attribution(CC BY) license (http://creativecommons.org/licenses/by/4.0/).