initial development of prototype performance model for
TRANSCRIPT
Initial Development of Prototype
Performance Model for Highway Design PUBLICATION NO. FHWA-RD-96-134
u.s. Deportment of Transportalion
Federal HIghway Admillishatlon
Research and Development Turner-Fairbank Highway Research Center 6300 Georgetown Pike McLean, VA 22101-2296
DECEMBER 1997
FOREWORD
The Federal Highway Administration (FHW A) is developing an integrated set of five software tools to analyze highway design to identifY safety issues and tradeoft's. These tools or modules will address five areas: policy review, design consistency, accident analysis, traffic analysis, and driver/vehicle analysis. These analytic tools are to be integrated into the Interactive Highway Safety Design Model (rnSDM). This rnSDM will then be integrated with the designers' Computer Aided Design and Drafting based highway design tools to provide an interactive design and review package.
This report summarizes the work performed to develop the requirements for the IHSDM as a whole and to develop detailed specifications for the DriverNehicle Module (DVM) and for one of the major components of the DVM the Driver Performance Module (DPM). Among the topics covered are descriptions of the rnSDM and the initial driving environments to be addressed; a review of design applications that might serve as integral elements; detailed design specifications for the DVM and the DPM; IHSDM user interface issues; and research requirements to provide the data needed to calibrate and validate the DPM. The appendices provide summaries of the literature review pertaining to the five analytic tools or modules of the rnSDM.
Copies of this report can be obtained through the National Technical Information Service, 5285 Port Royal Road, Springfield, Virginia 22161, telephone (703) 487-4650, fax (703) 321-8547.
NOTICE
~~ ? Ostense~ Director
e f Safety and Traffic Operations rch and Development
This document is disseminated under the sponsorship of the Department of Transportation in the interest of information exchange. The United States Government assumes no liability for its contents or use thereof. This report does not constitute a standard, specification, or regulation.
The United States Government does not endorse products or manufacturers. Trade and manufacturers' names appear in this report only because they are considered essential to the object of the document.

1. Report No. 2. Government Accession No.
FHWA-RD-96-134
4. Title and Subtitle
INITIAL DEVELOPMENT OF PROTOTYPE PERFORMANCE MODEL FOR HIGHWAY DESIGN
Technical Report Documentation Page
3. Recipient's Catalog No.
5. Report Date
6. Performing Organization Code
f-=--:-.,.,--,-,---------------------------1 8. Performing Organization Report No. 7. Author(s)
William H. Levison et al. 9. Performing Organization Name and Address
BBN Systems and Technologies 10 Moulton Street Cambridge, Massachusetts 02138
12. Sponsoring Agency Name and Address
Office of Safety and Traffic Operations R&D Federal Highway Administration 6300 Georgetown Pike McLean, Virginia 22101-2296
15. Supplementary Notes
BBN report 8135 10. Work Unit No. (TRAIS)
3A6b-1092 11. Contract or Grant No.
DTFH61-95-C-00043 13. Type of Report and Period Covered
Final Report March 1995-1996
14. Sponsoring Agency Code
(COTR): Joseph Moyer, HSR-30, Mark Robinson, SAIC
16. Abstract
The Federal Highway Administration (FHWA) has undertaken a multiyear project to develop the Interactive Highway Safety Design Model (IHSDM), which is a CADD-based integrated set of software tools to analyze a highway design to identify safety issues and tradeoffs. The IHSDM is envisioned to incorporate five analysis modules: policy review, design consistency, accidents analysis, traffic analysis, and driverlvehicle analysis. Top level requirements for the IHSDM as a whole and for each of the five analyses modules are presented. Detailed design speCifications are given for the driver/vehicle module, a time-based simulation model, and for one of the major component of this module- the driver performance module.
Data requirements for model development are defined, and a suggested program of research is outlined. Existing models that could serve as a basis for implementing some of the required functionality are reviewed. Data sources for the various IHSDM modules, with concentration on the driver performance module, are also reviewed.
A prototype interface for IHSDM, focusing primarily on the driverlvehicle module, is described. Commercial CADD systems and design application software elements that serve as integral elements of IHSDM are reviewed.
17. Key Words
driver performance driver model IHSDM
19. Security Classif. (ofthis report)
Unclassified
Form DOT F 1700.7 (8-72)
highway design highway factors highway safety
18. Distribution Statement
No restrictions. This document is available to the public through the National Technical Information Service, Springfield, VA 22161
20. Security Classif. (of this page) 21. No. of Pages 22. Price
Unclassified 213
Reproduction of completed page authorized
This fonn was elactronically produced by Elije Federal Forms, Inc.
TABLE OF CONTENTS
Chapter
1. INTRODUCTION........................................................................................ 1
2. OVERVIEW OF THE IHSDM.................................................................... 5
CONCEPT OF OPERA TION.................................................................... 5
CURRENT STATUS OF IHSDM DEVELOPMENT............................... 8
Vehicle Dynamics Module................................................................... 8
Design Consistency Module............................................................... 9
Accident Analysis Module.................................................................. 9
Driver Performance' Module (DPM).................................................. 9
SUMMi\RY................................................................................................. 9
3. COMPARABLE SYSTEMS: CADD-BASED SYSTEMS FOR HIGHWA Y l<\NAL YSIS..................................................................................................... 11
PURPOSE................................................................................................... 11
ARCHITECTURE OVERVIE\V............................................................... 11
SOFTWARE SySTEMS............................................................................ 11
GEOPACK Civil Design Software..................................................... 11
Intergraph InRoads Civil Design Software....................................... 12
Eagle Point Software.......................................................................... 13
Softdesk Civil Design Software.......................................................... 13
MOSS Highway Design Software...................................................... 14
GDS CADD Software......................................................................... 14
SOFTWARE DESIGN PROCESS............................................................. 15
DA T A STRlT CTlTRE.................................................................................. 16
Graphics Data..................................................................................... 16
External Project Data Files................................................................ 16
SIMULATION, MODELING AND ANIl"1A TION................................... 17
SlTMMAR'T................................................................................................ 18
4. SCENARIOS FOR IHSDM DEVELOPMENT AND TESTING................ 18
OVERVIEW ............................................................................................... 19
IMPORTANT CHARACTERISTICS OF THE HIGHWAY ENViRONMENT....................................................................................... 20
SCENARIO DESCRIPTIONS................................................................... 21
Scenario A........................................................................................... 21
Scenario B........................................................................................... 22
III

TABLE OF CONTENTS (continued)
Scenario C........................................................................................... 22 SlJMMARY................................................................................................. 22
5. SYSTEM FUNCTIONAL REQUIREMENTS FOR THE IHSDM............... 25 INTERFACE REQUIREMENTS.............................................................. 25 HIGHW A Y DESIGN SySTEM................................................................. 27 DESIGN POLICY MODlTLE.................................................................... 28
Purpose............................................................................................... 28 Process i n g........................ ................................................................... 28 Inputs.................................................................................................. 29
Reference Data................................................................................... 29 Outputs............................................................................................... 30
DESIGN CONSISTENCY MODULE....................................................... 30 Purpose............................................................................................... 30 Processing........................................................................................... 31 Inputs.................................................................................................. 31 Reference Data.................................................................................... 32 Outputs............................................................................................... 32
ACCIDENT ANALYSIS MODULE (AAM)............................................. 32 Purpose............................................................................................... 32 Processing........................................................................................... 33 Inputs.................................................................................................. 33 Reference Data.................................................................................... 36 Outputs............................................................................................... 36 Discussion........................................................................................... 37
TRAFFIC ANALYSIS MODULE............................................................. 39 Purpose................................................................................................ 39 Processing........................................................................................... 39 Inputs.................................................................................................. 39 Reference Data.................................................................................... 39 Outputs................................................................................................ 39
SUMMARy................................................................................................ 39
6. DESIGN SPECIFICATIONS FOR THE DRIVERIVEHICLE MODULE (DV-M)......................................................................................................... 41
FOCUS OF THE DESIGN EFFORT AND MODELING PHILOSOPHy............................................................................................ 41
IV
TABLE OF CONTENTS (continued) OVERVIEW OF THE DVM...................................................................... 44 TOP-LEVEL REQIJIREMENTS............................................................... 46
Purpose............................................................................................... 46 Processin g....... .......................................................... .......................... 46 Static Inputs....................................................................................... 47 Reference Data................................................................................... 49 Dynamic Inputs.................................................................................. 52 Outputs............................................................................................... 52
GEOMETRICS MODULE........................................................................ 53 Purpose............................................................................................... 53 Processing........................................................................................... 53 Static Inputs....................................................................................... 53 Reference Data................................................................................... 56 Dynamic Inputs.................................................................................. 56 Outputs............................................................................................... 56
RANDOM PROCESSES MODULE.......................................................... 57 Purpose............................................................................................... 57 Processing........................................................................................... 57 Static Inputs....................................................................................... 58 Reference Data................................................................................... 58 Dynamic Inputs.................................................................................. 58 Outputs............................................................................................... 58
VEHICLE DYNAMICS MODULE........................................................... 59 Purpose............................................................................................... 59 Processing........................................................................................... 59 Static Inputs....................................................................................... 59 Reference Data................................................................................... 60 Dynamic Inputs.................................................................................. 60 Outputs............................................................................................... 60
RUN-TIME DATA PROCESSING MODULE......................................... 61 Purpose............................................................................................... 61 Processing........................................................................................... 61 Static Inputs....................................................................................... 61 Reference Data................................................................................... 62 Outputs............................................................................................... 62
v
TABLE OF CONTENTS (continued) Dynamic Inputs.................................................................................. 64
POST PROCESSING MODULE.............................................................. 64 Purpose............................................................................................... 64
Processing........................................................................................... 64 Static Inputs....................................................................................... 64 Reference Data................................................................................... 64 Outputs............................................................................................... 64 Dynamic Inputs.................................................................................. 65
MONTE-CARLO ANAL ySIS................................................................... 65 SUMMARy................................................................................................. 65
7. DESIGN SPECIFICA nONS FOR THE DRIVER PERFORMANCE MODlJLE (DPM)........................................................................................ 67 TOP-LEVEL REQUiREMENTS............................................................... 67
Purpose................................................................................................ 66 Processing............................................................................................ 69 Relevant Static Inputs........................................................................ 69 Relevant Reference Data.................................................................... 69 Dynamic Inputs.................................................................................. 70 Outputs................................................................................................ 71
PERCEPTION MODULE.......................................................................... 71 Purpose............................................................................................... 71 Processing........................................................................................... 71 Relevant Static Inputs........................................................................ 74 Relevant Reference Data.................................................................... 74 Dynamic Inputs.................................................................................. 74 Outputs............................................................................................... 74
SPEED AND PATH DECISION MODULE.............................................. 75 Purpose............................................................................................... 75 Processing........................................................................................... 75
Relevant Static Inputs........................................................................ 76 Relevant Reference Data.................................................................... 77 Dynamic Inputs.................................................................................. 77 Outputs................................................................................................ 77
SPEED CONTROL MODlTLE.................................................................. 78 Purpose............................................................................................... 78
VI
TABLE OF CONTENTS (continued)
Processing........................................................................................... 78
Relevant Static Inputs........................................................................ 79
Relevant Reference Data.................................................................... 79
Dynamic Inputs.................................................................................. 79
Outputs............................................................................................... 79
PATH CONTROL MODULE.................................................................... 80
Purpose............................................................................................... 80
Processing........................................................................................... 80
Relevant Static Inputs........................................................................ 81
Reference Data................................................................................... 81
Dynamic Inputs.................................................................................. 81
Outputs............................................................................................... 81
OPERATION AT LOWER LEVELS OF MODEL AUTHORITy......... 81
Levell: User-Specified Speed and Idealized ControL.................... 82
Level 2: Model-Determined Speed and Idealized ControL............. 83
SUMMARy................................................................................................. 83
8. PRELIMINARY lJSER INTERFACE DESIGN............................................ 85
SllMMARy................................................................................................ 121
9. CANDIDATE ALGORITHMS..................................................................... 123
STEERING MODELS................................................................................ 123
Crossover Model................................................................................. 123
Optimal Control l\1odel...................................................................... 124
Preview Control l\'lodel...................................................................... 125
Treatment of Driver Factors.............................................................. 125
MODELS FOR STATE ESTIMATION.................................................... 128
Fixed Distributions............................................................................. 128
Dynamic Distributions....................................................................... 128
SPEED DECISION MAKING................................................................... 129
Regression Analysis............................................................................ 129
Psychologically Based Models............................................................ 130
SUMMARy................................................................................................. 130
10. RESEARCH REQUIREMENTS.................................................................. 131
FOCUS OF THE RESEARCH EFFORT.................................................. 131
INFORMATION REQUIREMENTS........................................................ 132
VII

TABLE OF CONTENTS (continued)
Speed Selection for Negotiating Horizontal Curves.......................... 133
Speed Control. ..................................................... ~.............................. 136
Path Control....................................................................................... 139
Attention Sharing............................................................................... 141
Review of Information Requirements................................................ 143
PROPOSED RESEARCH PROGRAM..................................................... 145
Study 1: Speed Selection for Curve Negotiation.............................. 147
Study 2: Speed Control..................................................................... 148
Study 3: Path Control....................................................................... 150
ApPENDIX A: DATA SOURCES FOR IHSDM MODULES............................. 153
POLICY REVIEW lVIODl:LE................................................................... 153
Background........................................................................................ 153
Existing Sources................................................................................. 153
DESIGN CONSISTENCYMODULE........................................................ 154
Background........................................................................................ 154
ACCIDENT ANALYSIS MODlTLE.......................................................... 158
Overview of Accident Analysis Module............................................. 158
Description of Accident Submodel..................................................... 159
Potential Data Sources for Accident Analysis Module...................... 159
Current Status and Future Plans........................................................ 162
VEHICLE DYNAMICS MODULE........................................................... 163
ApPENDIX B: DATA SOURCES FOR THE DRIVER PERFORMANCE
MODULE............................................................................................................. 165
PERCEPTION, DETECTION, AND SITUATION AWARENESS......... 166
Vehicle Speed...................................................................................... 166
Headway............................................................................................. 167
Curvature of Road.............................................................................. 167
Collision.............................................................................................. 167
Traffic Signs....................................................................................... 167
Obstacles............................................................................................. 170
DECISION MAKING................................................................................. 172
Path..................................................................................................... 172
Speed................................................................................................... 172
Headway............................................................................................. 176
VlJI
TABLE OF CONTENTS (continued)
Gap for Turns..................................................................................... 178
Stop/Proceed....................................................................................... 179
VEHICLE CONTROL............................................................................... 180
Steering............................................................................................... 180
Braking and Accelerating.................................................................. 182
DRIVER STA TE........................................................................................ 184
Age...................................................................................................... 184
Experience.......................................................................................... 187
Fatigue................................................................................................ 188
DRIVING STyLES.................................................................................... 188
INTEGRATED MATH 1\10DELS........................................................... 189
Classical Control Model..................................................................... 190
Integrated Driver Model.................................................................... 190
Optimal Control Model...................................................................... 191
Driver Vehicle Effectiveness Model (DRIVEM)............................... 191
DATA SOURCES FROM A V AILABLE TRAFFIC SIMULATION MODELS.................................................................................................... 192
TRAF-NETSIM.......................................................................................... 192
TRARR....................................................................................................... 193
TWOPAS.................................................................................................... 194
REFERENCES..................................................................................................... 198
IX
LIST OF FIGURES
Figure
1 Interactive Design and Analysis................................................................. 2
2 Application of the mSDM to Highway Design......................................... 6
3 Data File Example....................................................................................... 26
4 Information Flow in the Driver/Vehicle Module....................................... 45
5 Information Flow in the Driver Performance Module.............................. 68
6 IHSDM Top Level Menu............................................................................ 87
7 Driver Performance Menu.......................................................................... 89
8 New Analysis Dialog Box............................................................................ 92
9 Scenario Parameters Dialog Box................................................................ 97
10 Variable Speed Setting Dialog Box............................................................. 99
11 Traffic Light Cycle Time Setting Dialog Box............................................. 10 1
12 Results Display Format Dialog Box............................................................ 104
13 Open Dialog Box......................................................................................... 106
14 IHSDM Progress Bar Dialog Box............................................................... 108
15 Model Parameters - Drive Aggressiveness Tab.......................................... 112
16 Model Parameters - Driver Responsiveness Tab....................................... 113
17 Model Parameters - Driver's Perceptual Capabilities Tab........................ 114
18 Model Parameters - Simulation Parameters Tab...................................... 116
19 Model Parameters - Driving Environment Tab......................................... 118
20 Model Parameters - Others Tab................................................................. 120
x
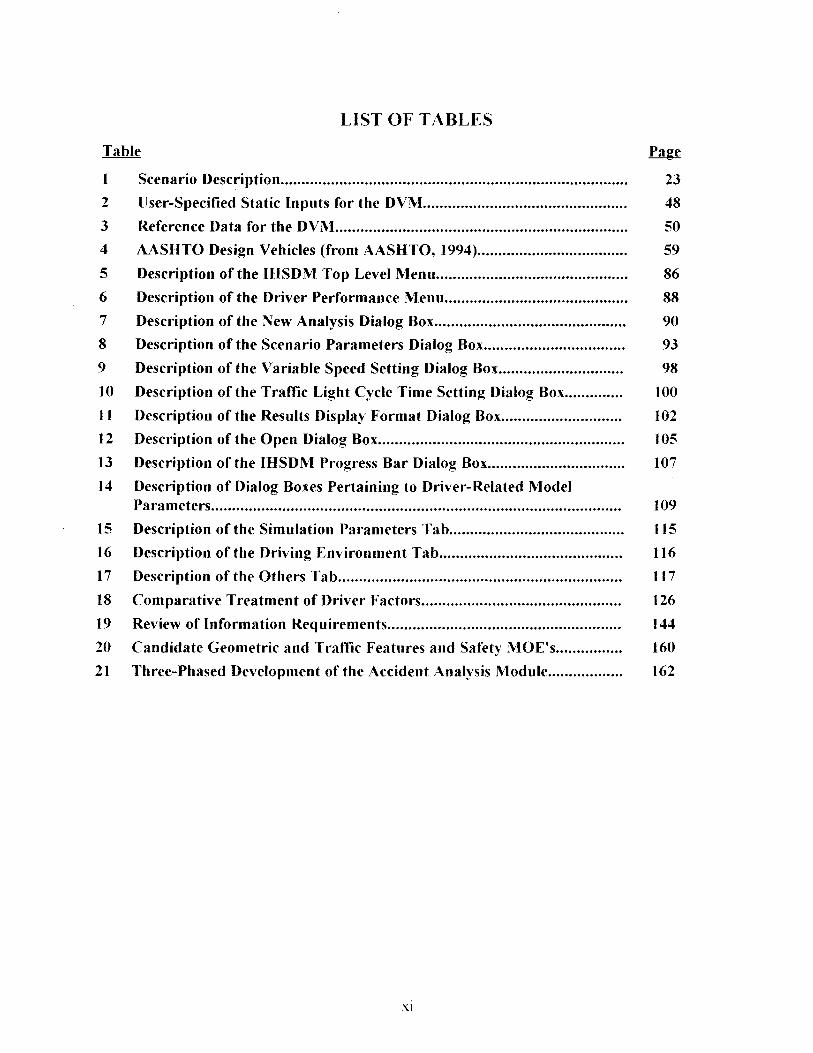
LIST OF TABLES
1 Scenario Description................................................................................... 23
2 User-Specified Static Inputs for the DVM................................................. 48
3 Reference Data for the DVM...................................................................... 50
4 AASHTO Design Vehicles (from AASHTO, 1994).................................... 59
5 Description of the IHSDM Top Level Menu.............................................. 86
6 Description of the Driver Performance Menu............................................ 88
7 Description of the New Analysis Dialog Box.............................................. 90
8 Description of the Scenario Parameters Dialog Box.................................. 93
9 Description of the Variable Speed Setting Dialog Box.............................. 98
10 Description of the Traffic Light Cycle Time Setting Dialog Box.............. 100
11 Description of the Results Display Format Dialog Box............................. 102
12 Description of the Open Dialog Box........................................................... 105
13 Description of the IHSD M Progress Bar Dialog Box................................. 107
14 Description of Dialog Boxes Pertaining to Driver-Related Model Parameters.................................................................................................. 109
15 Description of the Simulation Parameters Tab.......................................... 115
16 Description of the Driving Environment Tab............................................ 116
17 Description of the Others Tab.................................................................... 117
18 Comparative Treatment of Driver Factors................................................ 126
19 Review of Information Requirements........................................................ 144
20 Candidate Geometric and Traffic Features and Safety MOE's................ 160
21 Three-Phased Development of the Accident Analysis Module.................. 162
Xl
AAM
AASHTO
ADT
CADD
DPM
DVM
FHWA
IHSDM
MUTCD
OCM
VDM
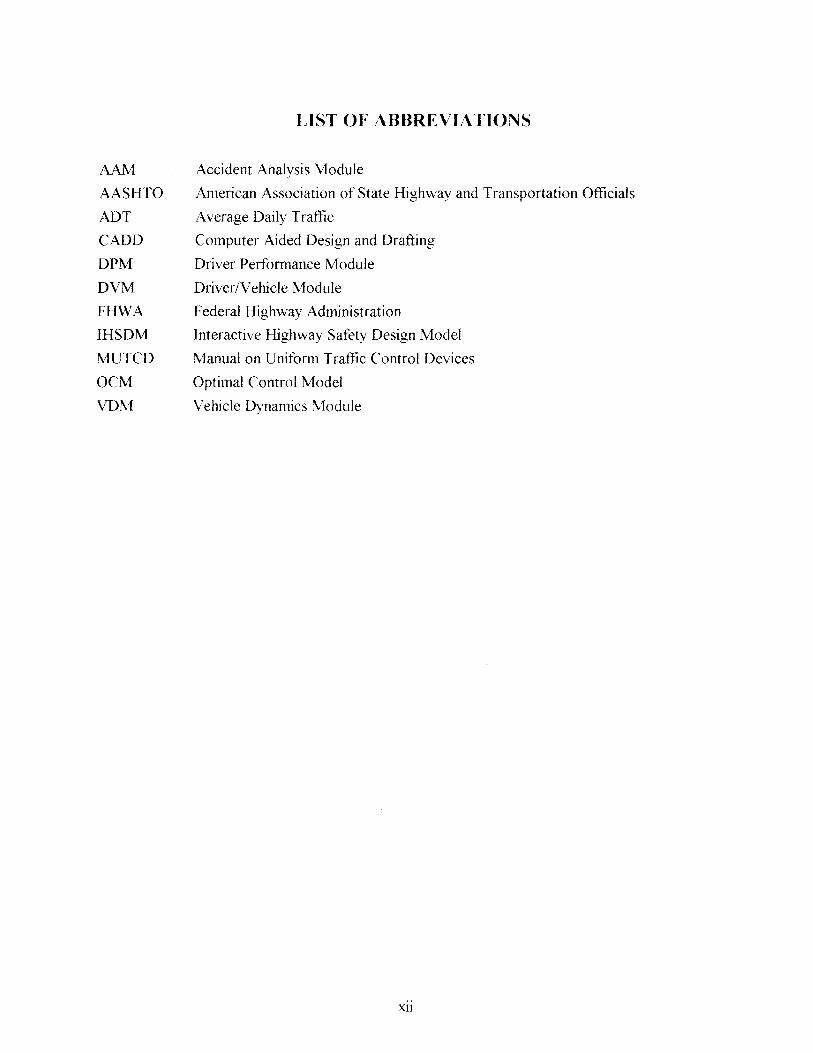
LIST OF ABBREVIATIONS
Accident Analysis Module
American Association of State Highway and Transportation Officials
A verage Daily Traffic
Computer Aided Design and Drafting
Driver Performance Module
Driver/Vehicle Module
Federal Highway Administration
Interactive Highway Safety Design Model
Manual on Uniform Traffic Control Devices
Optimal Control Model
Vehicle Dynamics :'v10dule
XJI

1. INTRODUCTIOl\
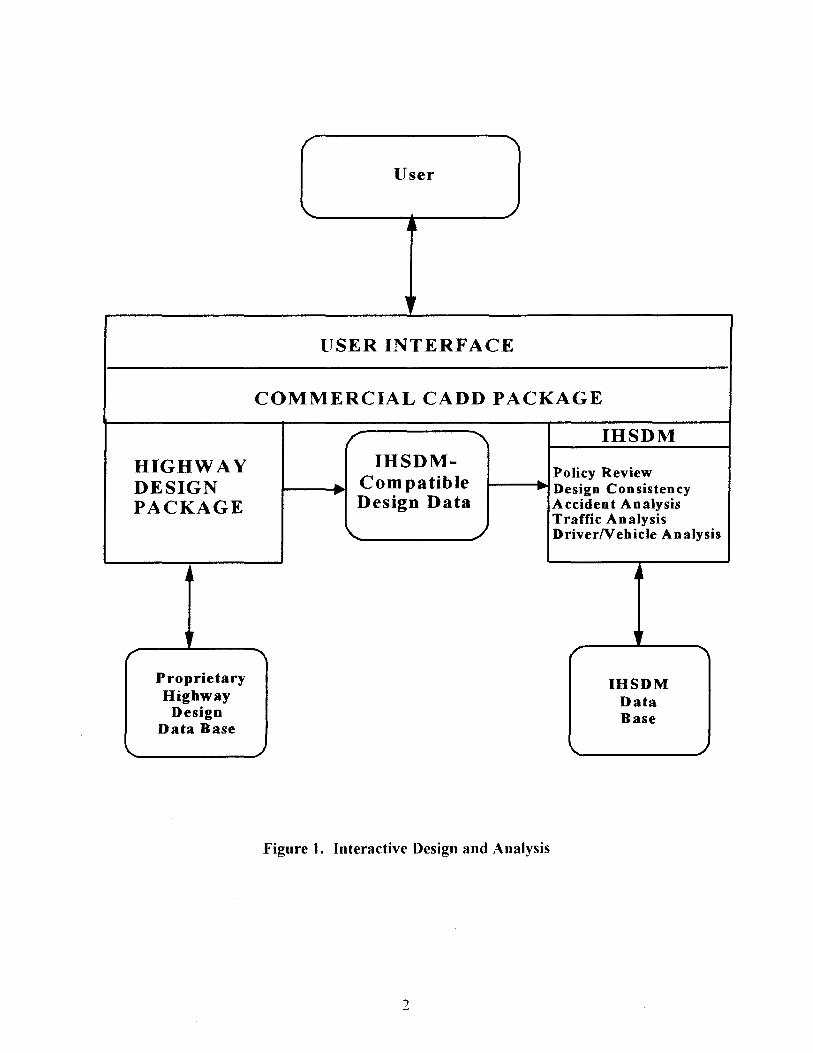
The Federal Highway Administration (FHW A) has undertaken a multiyear project to develop the Interactive Highway Safety Design Model (IHSDM), which is an integrated set of software tools to analyze a highway design to identifY safety issues and tradeoffs. These analysis tools are to be integrated with Computer Aided Design and Drafting (CADD) based highway design tools to provide an interactive design and review package as diagrammed in figure 1. The IHSDM is envisioned to include the following assessment capabilities:
• Policy Review Module
• Design Consistency Module
• Accident Analysis Module
• Traffic Analysis Module
• Driver/Vehicle Module
The first three of these modules involve checking the highway design parameters against established criteria and statistical data bases. The latter two modules will involve time-based simulations of traffic flow and single-vehicle behavior.
The CADD package serves as the host for both the highway design application and the IHSDM. In addition to the proprietary highway design data base generated by the highway design package, a second data base of design parameters is generated for use by the IHSDM analysis tooL Results generated by the various analysis tools are stored in the IHSDM data base for further analysis and to allow communication of results among the analysis modules.
This report summarizes the work performed to develop requirements for the IHSDM as a whole and to develop detailed specifications for the Driver/Vehicle Module (DVM) and for one of the major components of that module - the Driver Performance Module (DPM).
The material in this report is organized as follows:
• Chapter 2 provides an overview of the IHSDM, including a concept of operation and a brief review of work in progress.
• Chapter 3 reviews existing commercial CADD systems and design application software that might serve as integral elements of the IHSDM.
• Chapter 4 identifies three driving environments ("scenarios") intended to provide guidance to the development of requirements for the IHSDM modules and for use in subsequent studies to validate the Driver/Vehicle Module.
1
HIGHWAY DESIGN PACKAGE
r
Proprietary Highway
Design Data Base
"-
User
"
USER INTERFACE
COMMERCIAL CADD PACKAGE
"
~
IHSDM-1-----1 ... ., Compatible
~ Design Data
" ./
IHSDM
Policy Review ~---1 .... ~ Design Con sis ten cy
Accident Analysis Traffic Analysis DriverNehicie Analysis
1
/
IHSDM Data Base
~
Figure 1. Interactive Design and Analysis
2
• Chapter 5 delineates the overall requirements of the IHSDM as well as the requirements for four of the analysis modules: design policy, design consistency, accident analysis, and traffic analysis.
• Chapter 6 presents detailed design specifications for the Driver/Vehicle Module. Included in this chapter are a discussion of the focus and approach relevant to the design of the DVM and DPM, a definition of overall requirements for the DVM, and design specifications for the major components of the DVM other than the Driver Performance Module.
• Chapter 7 contains specifications for the Driver Performance Module. Top-level requirements are specified, and design specifications are provided for the major DPM subcomponents.
• Chapter 8 describes a preliminary user interface for the IHSDM, focusing primarily on operation of the Driver/Vehicle Module.
• Chapter 9 provides a brief review of existing models for speed selection and steering - major functions of the DPM.
• Chapter 10 outlines research requirements. A prioritized list of information needs is discussed, followed by an outline of a prioritized research program designed to provide the data needed to calibrate and validate the DPM.
• Appendix A summarizes the literature review performed early in this project with respect to the policy review, design consistency, accident predictive modules, as well as the vehicle dynamics component of the driver/vehicle module.
• Appendix B summarizes the literature review pertaining to driver performance.
• References appear in the final section of this report.

2. OVERVIEW OF THE IHSDM
CONCEPT OF OPERATION
This chapter outlines a concept of operation for the IHSDM and reviews the current status of IHSDM development.
The IHSDM will have two closely related modes of operation, an interactive design mode and a design review mode. Although there will be no constraints on the sequence or mode of use of the tools in the IHSDM system, the system requirements are based on use in these two modes. In the interactive design mode a typical application will start when the user uses the CADD based package to develop a high level design for a highway or section of a highway. In early design stages this may only consist of a plan view. The designer will, then, run high level design review modules such as the design consistency module and the design policy module on the design to identify where the design deviates from accepted design practice as represented by the selected reference data base [this may be American Association of State Highway and Transportation Officials (AASHTO) standards, State standards, or other design practice].
As the design proceeds through later stages, the designer will iteratively test the design with the full complement of analysis tools and will run the traffic and driver/vehicle simulation models over parts or all of the highway.
In the early part of this process the IHSDM will probably be used for an aggregate assessment. As the design nears completion, the system may be used to test design alternatives, and the analysis modules will be used for relative comparison of design features.
As a final step the designer is likely to execute all IHSDM modules over the entire highway design to identify unresolved issues where deviations in design policy or accepted practice exists
During the design process, the designers may want to access reference files associated with specific modules. For example they may want to review the design policy relative to a specific design feature.
In the detailed design review mode, the IHSDM system would be used by a review consultant or the reviewing agency to perform a safety analysis of a proposed design or to evaluate competing designs. In this mode, the evaluator will start with the completed design data base and will run the analysis modules over the entire design, probably using several scenarios involving different driver/vehicle combinations, weather conditions, and traffic incidents to create conflicts that cause the driver to modify speed and/or path.
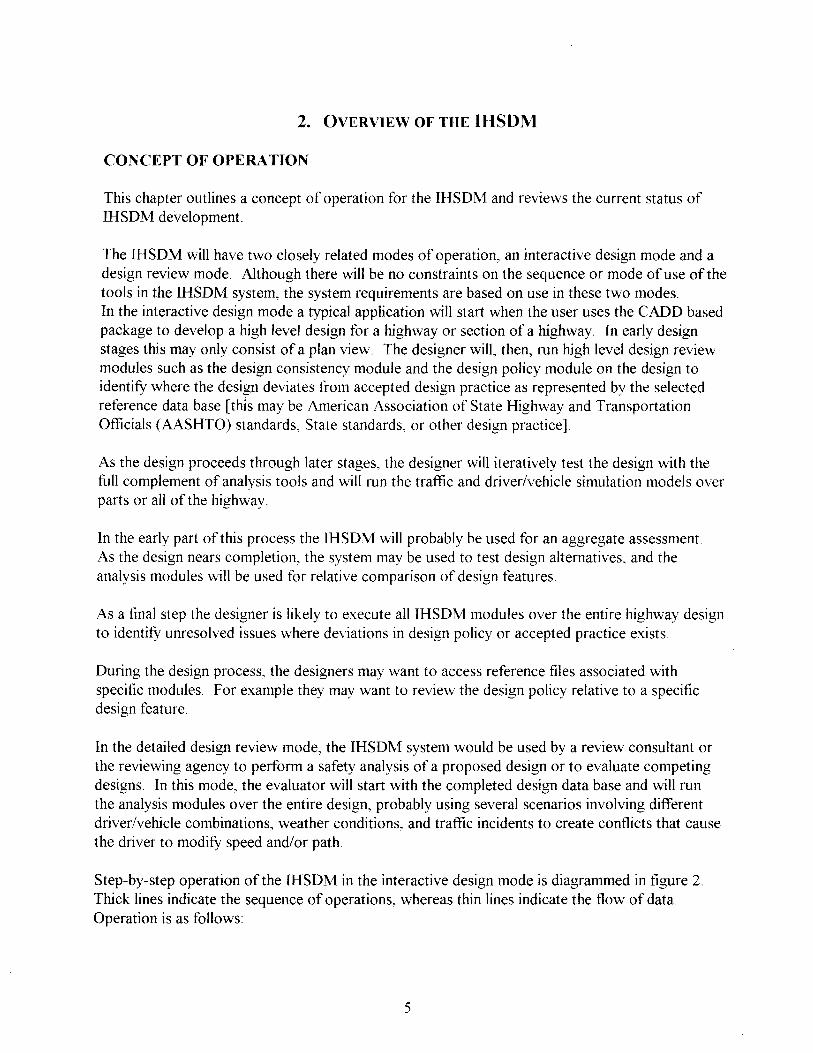
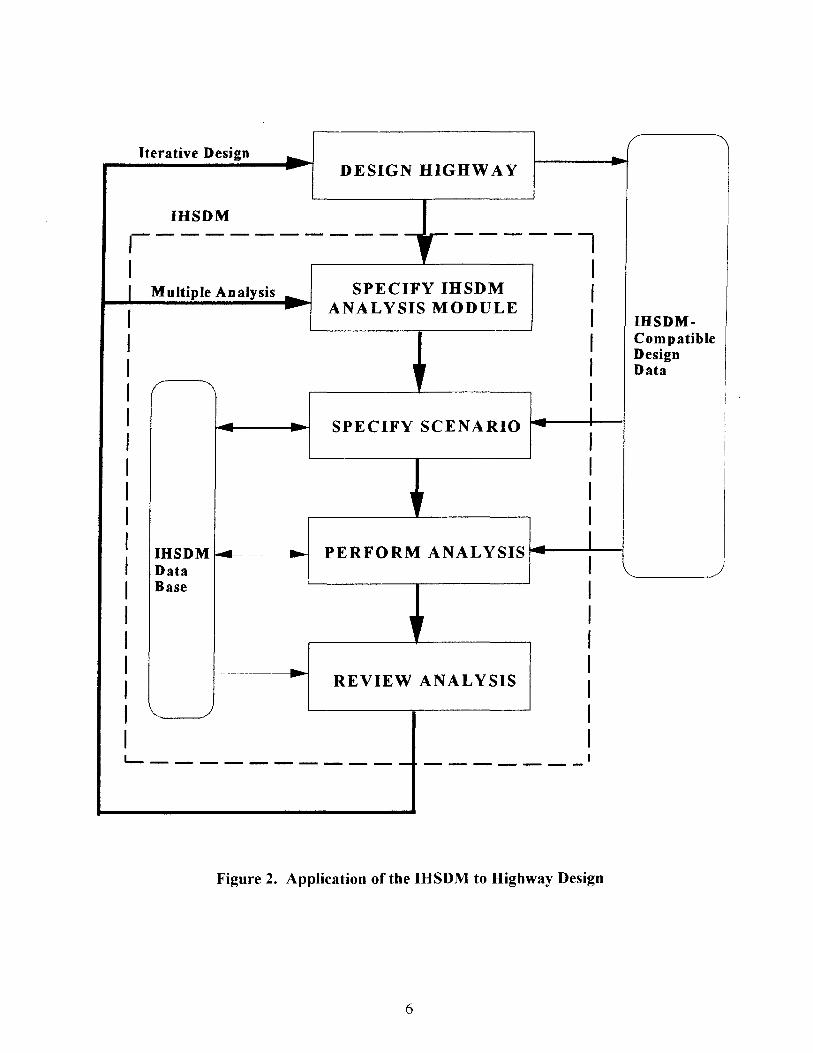
Step-by-step operation of the IHSDM in the interactive design mode is diagrammed in figure 2. Thick lines indicate the sequence of operations, whereas thin lines indicate the flow of data. Operation is as follows:
5
Iterative Design --. DESIGN HIGHWAY
IHSDM
,---------- u -----l I I Multiple Analysis _
I I I I /
--
- -
SPECIFY IHSDM ANALYSIS MODULE
l' SPECIFY SCENARIO -
I I I I I I I
I I I I
-
PERFORM ANALYSIS~-..L.:-I IHSDM~-· -Data Base
, r
REVIEW ANALYSIS
L- __________ _
-------
I I I I I I I I
Figure 2. Application of the IHSDM to Highway Design
6
IHSDMCompatible Design Data
'-----_---/'

1. Operating within the CADD environment, the user creates or modifies the design of a roadway segment using the highway design application and requests that the design be stored in an IHSDM-compatible data base.
2. The IHSDM is launched from within the same CADD environment. The user selects one of the IHSDM analysis modules. The current highway design data base serves as the default input data base to this module.
3. Upon initiating an analysis module, the user is provided with one or more dialog boxes to facilitate the specification of a scenario (i.e., a full description of the problem to be analyzed). If relevant scenarios have been previously created or stored in the IHSDM data base, the user may load a scenario from the data base, accept it as is, or modify it. Alternatively, a new scenario may be created. Depending on the requirements of the specific IHSDM module, factors defining a "scenario" may include:
• Aspects of the roadway environment not embedded in the highway design data base (e.g., weather, road surface, timing of traffic signals, traffic patterns and incidents, etc.).
• Vehicle type in terms of one of the 15 categories of" design vehicles'"
• Driver type in terms of three broad categories relating to preferences and capabilities.
• Additional module-specific parameters.
(Examples of dialog boxes for scenario definition are provided in chapter 8.)
4. Analysis is then performed. If the analysis consists of a simulation consuming significant time (as would likely the case for the Driver/Vehicle Module), the user has the option to observe selected outputs on-screen while the simulation is in progress. Summary results will generally be displayed at the conclusion of the analysis. All results are accumulated in the IHSDM data base.
5. Finally, the user has the option to further examine the results of the IHSDM analysis (e.g., playback the results of a simulation run to provide an animation showing the driver's-eye view of the scene.)
6. The user selects the next IHSDM analysis module to be applied to the current highway design. If one or more IHSDM modules having scenario-defining parameters in common with the current module have been applied to the current highway design, a warning will be given if the user selects parameter values inconsistent with previous analysis. The user has the option of conforming or not conforming to previous scenario definitions.
If potential problem areas are identified through the IHSDM analysis, the user may wish to modify the design and perform IHSDM analysis on the revised design.
7

A user operating the IHSDM in the design review mode (as opposed to the interactive design mode) should not be required to employ a particular CADD-based design package to perform this evaluation and should have the capability to analyze designs produced by different CADD systems. (CADD-specific independence will be achieved via the requirement that all CADDbased design packages store highway design data in the same IHSDM-compatible format.) In this case, the user will initialize the IHSDM package from a previously generated and stored highway design data base. Analysis otherwise proceeds as described above, except that iteration with the design is not immediately possible.
The IHSDM will contain one or more "post-processing" modules to facilitate further "off-line" examination of the results of the IHSDM analysis. A limited amount of additional analysis can thus be performed in the absence of both the highway design system and the highway design data base, where the IHSDM is initialized from the existing IHSDM data base.
CURRENT STATUS OF IHSDM DEVELOPMENT
Considerable work has been done in the technical areas relevant to the development of the IHSDM, such as vehicle modeling, driver performance, accident analysis and prediction, etc., only a very small part of which has been directed specifically toward development of the IHSDM as described above. This section reviews the work that has been done to develop IHSDM functionality conforming to the general concept shown in figure 1; namely, where a functional analysis concept or implemented software package is designed to interact with highway geometric design variables through a CADD-compatible data base. This review is based on published information plus conversations with FHW A personnel.
IHSDM development has proceeded on an "outside-in" basis. That is, development has not started with the definition of a generalized C ADD-compatible data base to serve as the core of the IHSDM. Instead, work has begun on developing individual modules as largely stand-alone software packages. Each package may interact with a CADD-generated description of the highway geometry and provide output data for further analysis (e.g., visualization), but the modules have not explicitly been designed to interact with other major IHSDM modules through a common data base structure.
IHSDM development has proceeded to date on the vehicle dynamics, design consistency, and accident analysis modules. With this and one other contract, work has started on development of the driver module.
Vehicle Dynamics Module
Development of the Vehicle Dynamics Module (YOM) is the furthest along in terms of developing software packages designed specifically to use CADD-generated geometric data and otherwise interact with a CADD-compatible data base. Two YOM development efforts are nearing completion: one, performed under contract no. DTFH61-93 -C-00209 (Allen, Rosenthal, and Klyde, 1995), and the other, performed under contract no. DTFH61-93-C-OOI42 (Sayers and Mink, 1995).
8
Both of these efforts involve the use of sophisticated simulation models of vehicles primarily to predict rollover and skid potential for a vehicle following a specified speed profile. In principle, driver models can be tightly coupled with the vehicle models to predict steering and speed performance. Integrative applications ofVDM to date have involved extracting horizontal alignment data from the geometric design package and outputting vehicle performance data to be used by a visualization package.
Design Consistency Module
Krammes et al. (1995) have developed a computerized model for performing operator speed and driver workload consistency evaluations of rural two-lane highway horizontal alignments. The input to this model is alignment data that specifY degree of curvature and the locations of the beginning and end of horizontal curves. Work is in progress to extend this model and develop it into the Design Consistency Module (Contract No. DTFH61-95-C-00084).
Accident Analysis Module
Various efforts are underway with regard to the accident analysis module. Two efforts are currently underway to provide data that can be used in one or more accident predictive models. Other efforts have been devoted to developing computer-based models to perform the accident analysis, with the goal oflinking these models to a CADD-data base.
Driver Performance Module (DPM)
Two contracts are in progress to develop the DPM: this contract, and Contract No DTFH61-95-C-00082. The major goal of these contracts is to develop a functional design (but not an implementation) of the driver performance model. Software and hardware requirements will be specified, and a detailed design will specifY the inputs, outputs, functional elements, and data bases needed for DPM. Information deficiencies and research needed to remedy them will be defined. Computerized implementation of the DPM is expected to'be performed under subsequent contracts.
SUMMARY
The IHSDM will have two closely related modes of operation. In the interactive design mode, the user will typically iterate between highway design with a CADD-based design package, and evaluation of the design using the CADD-based evaluation tool. In the design review mode, the IHSDM will be applied to a completed design data base.
The design data base used as input to the IHSDM will meet strict formatting requirements to allow the IHSDM to interact with a variety of CADD-based design packages. The IHSDM will, in addition, create its own output data base.
Work is in progress on four IHSDM analysis modules: design consistency, accident analysis, vehicle dynamics, and driver performance. The latter two modules are expected to be integrated into a single analysis tool which is referred to later in this report as the "DriverN ehic1e Module. "
9

The following chapter summarizes some of the integrated CADD-based highway design packages currently in use by government agencies and private highway design firms.
10
3. COMPARABLE SYSTEMS: CADD-BASED SYSTEMS FOR HIGHWAY ANALYSIS
PURPOSE
As noted earlier, the IHSDM will be integrated with a commercial CADD package, both as a data source for the proposed roadway geometric characteristics, and potentially as user interface and operational environment. This section presents a summary of some of the popular integrated highway design CADD software solutions that are currently being utilized by many State departments of transportation (DOT), Federal agencies, local government, and private Engineering News Record (ENR) 500 consultants.
ARCHITECTURE OVERVIEW
A common feature of all CADD packages is the ability to create, plot and store vector based graphics with true geometric properties and coordinate level accuracies. The successful vendors of CADD products became dominant market forces to some degree by including within their software the ability to customize their product for specific uses. This ability to customize extends to the point of offering an "application development" programming environment, and encouraging independent vendors to program and market specific products. The general term for these types of products is "vertical applications." Thus for any given industry that may require the use of CADD, there is usually a layered product solution that includes a general purpose CADD package and an industry-specific vertical application.
Integrated highway design products are primarily this layered type of environment. Third party software vendors have developed and now market their specific civil engineering product applications independently of the CADD vendor. Most are sold through resellers that help the end user by packaging the variety of products and hardware required. Most of the third-party CADD civil design software mentioned below are integrated with either Bentley Systems' Microstation or Autodesk's AutoCAD software. AutoCAD and Microstation are considered to be the two major CADD platforms in the architect engineering community industry today.
SOFTW ARE SYSTEMS
The following will briefly outline some of the civil design systems available today: GEOP AK, Intergraph InRoads, Eagle Point, Softdesk , GDS and MOSS. The list of software tools covered here is by no means comprehensive, but was intended to be representative of what is available in the marketplace. There are many fine products available that were not included in the discussion.
GEOPACK Civil Design Software
GEOP ACK is a comprehensive, and flexible civil design software package utilized in the design and the production of plans for civil engineering projects. GEOP ACK has been developed to work with Bentley Systems' Microstation CADD software. The GEOP ACK software consists of three modules called Road, Site, and Survey which all operate on DOS, Windows and Windows NT based personal computers, various UNIX platforms, and Intergraph Clipper Workstations.
11

The software operation is identical across each platform and all GEOPACK data bases are binary compatible across all platforms.
GEOP ACK is developed to fully exploit the Microstation's interactive, flexible and easy to use graphic interface. The GEOP ACK software is developed utilizing the "C" programming language, and Microstation's MDL language. Since GEOPACK is developed to run on the Microstation platform the graphical files generated from the software are in the native Microstation DGN format. The external project data that GEOP ACK utilizes is saved in its own proprietary format.
GEOP AK can be customized utilizing MDL, and for hard-core developers GEOPACK offers a GEOP ACK Library of Application Programming Interfaces.
GEOP ACK has been designed to utilize the Microstation platform as both a graphical display engine for external data and as a front-end tool for the end-user, in which they can change the geometry of the graphics and update or produce the external data.
GEOP ACK indicates the following 10 State departments of transportation utilize their software.
North Carolina
Florida
Montana
Minnesota
Wyoming
South Carolina
Kansas
Illinois
Mississippi
Texas
Intergraph InRoads Civil Design Software
Intergraph InRoads has long been a leader in the civil design software industry, particularly at the State and Federal level. This product is an exception to the third party trend in that it is an Intergraph product developed and sold by the CADD vendor directly. InRoads has been in the market for at least 10 years, starting originally on the VMS platform, ported to Unix, and now developed to work with Intergraph's Microstation CADD software. The InRoads software will operate on DOS, Windows, Windows NT based personal computers, and Intergraph Clipper Workstations. The software operation is identical across each platform and all InRoads data bases are binary compatible across all platforms. InRoads is currently being ported to support the AutoCAD environment and is slated for release in December of 1995.
InRoads is developed to fully exploit the Microstation' s interactive, flexible and easy to use graphic interface. The InRoads software is developed utilizing the Microstation's MDL language. Since InRoads is developed to run on the Microstation platform the graphical files generated from the software are in the native Microstation DGN format. The external project data that InRoads utilizes is saved in its own proprietary binary format.
InRoads can be customized utilizing a Software Developers Kit that can be purchased for an additional fee.
12
InRoads has been designed to utilize the Microstation platform as both a graphical display engine for external data and as a front-end tool for the end-user, in which they can change the geometry of the graphics and update or produce the external data.
Intergraph indicates that more than 20 State departments of transportation utilize the Intergraph InRoads software.
Eagle Point Software
Eagle Point Software is a developer of integrated software for the architectural, landscaping, civil engineering and GIS marketplace. Eagle Point Software is available to run in both the Bentley Systems' Microstation CADD platform and Autodesk's AutoCAD platform.
In regards to Civil design Eagle Point offers a variety of software modules to support Site Planning and Roadway design. These modules include: Surface Modeling, Site Design, RoadCalc, and Profiles.
The Eagle Point Software operates on DOS, Windows and Windows NT based personal computers, various UNIX platforms, and Intergraph Clipper Workstations. The Eagle Point Software that operates on Microstation is developed in MDL and the AutoCAD version that runs on AutoCAD release 12 was written in ADS (AutoCAD Development System) and AutoLISP and for Release 13 includes ARX (AutoCAD Runtime Extension). In Microstation the graphic file format is DGN and in AutoCAD it is .DWG. The External data file format is a proprietary binary format that is compatible with both Microstation and AutoCAD for input.
Eagle Point has been designed to utilize both the Microstation and AutoCAD platforms as both a graphical display engine for external data and as a front-end tool for the end-user, in which they can change the geometry of the graphics and update or produce the external data.
Eagle Point indicates that the following six State departments of transportation utilize the Eagle Point software:
Colorado
Ohio
New Mexico
Softdesk Civil Design Software
Connecticut
Utah
Alaska
Softdesk is a developer of integrated software for the architectural, landscaping, civil engineering and GIS marketplace. Softdesk offers an integrated solution that runs on the Autodesk's AutoCAD platform. In the civil design market, Softdesk is the largest vendor of AutoCAD applications, offering a variety of software modules to support Site Planning and Roadway design. These modules include: Digital Terrain Modeling, Earthworks, Design, and Advanced Design.
13

The Softdesk software operates on DOS, Windows and Windows NT based personal computers and various UNIX platforms. The Softdesk software that operates on AutoCAD Release 12 and 13 was written in ADS and AutoLISP. The graphic file format is AutoCAD's DWG and the external data file format is saved in a proprietary binary format.
Softdesk has been designed to utilize the AutoCAD platform as both a graphical display engine for external data and as a front-end tool for the end-user, in which they can change the geometry of the graphics and update or produce the external data.
Although widely used in the consultant community and private sector, Softdesk has not, until very recently, played a big role at the State and Federal level, due to the slow acceptance of PC based CADD and AutoCAD in general in the public sector.
MOSS Highway Design Software
Moss in an internationally recognized civil engineering design software. It is somewhat different than the other products discussed in this section in that is not exactly integrated internally with one of the popular CADD packages. Moss has its own graphical interface used for manipulating the design, but not necessarily suited for full plan production. Historically, Moss was sold in the US packaged within a turnkey system with GDS or AutoTrol, with software interfaces between the Moss design components and the graphics environments of the CADD packages. Today, Moss is marketed as a stand-alone package, providing DXF level compatibility with AutoCAD. It is available on Unix, VMS and more recently, the DOSlWindows platforms, with plans for migration to Windows NT
One of the interesting features of Moss is its conceptually unique methodology of representing design surfaces. Moss uses 3D data "strings" to model surface features as opposed to the traditional cross section template method used by other products.
Moss is used by several State agencies, including Colorado, Massachusetts, New Hampshire, and Maine.
GDS CADD Software
GDS is a powerful, internationally recognized CADD package. By itself, it does not provide traditional civil design capabilities, but it was sold for a number of years under the McDonnell Douglas banner packaged with Moss. As an outgrowth of the Mcauto timeshare system popular in the 70's, it was widely recognized at the State Agency level GDS runs primarily on Unix and VMS platforms. GDS is noted for its object oriented data structure and its tight links to back end data bases. As a result, today GDS markets their product as an infrastructure/facilities management system.
GDS is used by several States, including Massachusetts, New Hampshire and Maine. It is the standard system being used on Boston's Central Artery/Third Harbor Tunnel project, probably the largest single CADD effort ever attempted in the civil engineering industry.
14
SOFTWARE DESIGN PROCESS
Despite all of the variety of software tools available for the highway designer, there are similar approaches to the design procedure. Within each software, there is a process to create a digital, three dimensional model of an existing ground surface. Most include several methods of inputting the data required to do this, such as automated field data collectors, capturing data from aerial photogrammetry or images and manually digitizing. Some also allow the modeling of multiple existing surfaces to represent different soil strata, water tables or ledge. Three dimensional surface models are referred to as Digital Terrain Models (DTM) or sometimes Triangulated Irregular Networks (TIN). This data set is usually stored as a proprietary binary file separate from the CADD graphics.
Next, the software tools provide methods of creating a proposed alignment, and again there are a variety of methods to accomplish this. Typically a proposed centerline or baseline is established. The fully integrated packages allow this to be done by simply drawing the intended centerline as a CADD entity, and the design application converts the standard Cartesian geometry into baseline geometry. The baseline version of the geometrics are stored separately from the graphics.
Each software is capable of cutting and displaying an existing ground vertical profile along the centerline at exaggerated scales. Tools are provided that allow the design of proposed vertical geometry.
The "template" based software packages provide methods of describing the roadway cross section under a variety of situations, such as different lane configurations, tapers, superelevation and transitions, as well as the edge matching criteria to use. For example, 3: I slopes might be called for in fill sections, unless the fill is a certain height when 2: 1 would be appropriate. Software applications then "process" the data, determining exactly how the design fits into the existing terrain. Template software evaluates each cross section at specified intervals and applies the correct design based on the given design criteria. The result is a three dimensional model of the proposed surface merged with the existing surface.
There are several benefits of this process:
• Multiple designs can be evaluated quickly.
• The tedious chores of drawing roadway cross sections and calculated earthwork quantities is automated.
• The three dimensional model can be manipulated further to view it from different perspectives, or rendered to provide a visualization image.
15
DATA STRUCTURE
Graphics Data
A distinguishing characteristic of CADD systems is that the graphics displayed are vector-based as opposed to raster-based, such as many of the "drawing" packages. Thus CADD graphics are made up of a collection of simple geometric shapes such as lines, arcs, circles that are described by coordinates in a Cartesian space. The graphic files are typically stored in a native binary file format unique to the CADD platform.
Depending on the capabilities of the CADD product, the graphic elements may have the ability to have a certain amount of "intelligence" attached to them in some fashion. This "intelligence" mechanism varies from full object oriented naming scheme tied directly to a back end data base, to simply attaching a unique identifier to an element. The degree to which third party software packages take advantage of these capabilities of attaching data to graphics also varies from product to product.
Due to the proliferation of different brands of software, most CADD platforms can also save their drawing files in a variety of different file formats to allow for the exchange of information. Typically this is done with the use of a "neutral" format that is published and accepted by different vendors. The most popular neutral format is DXF, which is AutoCAD's ASCII file format. Most vendors of software that produces any sort of graphic can read or write the DXF file format.
The trend recently is towards tighter integration of file formats between competing software, with direct translators built right into products. Microstation for instance, can both read and write the AutoCAD native DWG format. Successful translation of C ADD files from one product to another, however, remains a tricky undertaking. A considerable amount of up front planning is generally required to accomplish smooth translations. In addition, the term "translation" is sometimes liberally applied with respect to moving information from one product to another. In most cases it simply means that the graphics elements are moved across a translation, not associated data attributes.
External Project Data Files
All the third party design packages mentioned above store the external data in proprietary files structures that only their highway design software can interpret and utilize as input. Examples of external data are baseline geometry, vertical geometry, template design criteria, and 3D terrain models. The software applications include procedures to display these features as graphical elements in various views, as well as the ability to update the data by manipulating the graphics elements.
Although the graphics can be translated between CADD file formats, the exchange of the actual external data files is not so easy. Because these file formats are proprietary to each software they cannot be utilized interchangeably across different highway design packages to generate graphics or drawing files. Currently all the integrated products mentioned above will also allow the data to be extracted into ASCII report files.
16

SIMULATION, MODELING, AND ANIMATION
The biggest trend in highway design applications today is the increasing use of visualization tools to display a proposed design. Hardly a week goes by without a cover feature in one of the industry magazines such as ENR or Civil Engineering about the use of multimedia. Within the arena of computer generated multimedia, the terms simulation, modeling, and animation are used interchangeably, but there are significant differences among them. The following will define these concepts:
Simulation is simply the use of a computer model to "mimic" the behavior of a complicated system and thereby gain insight into the performance of that system under a variety of circumstances. Simulations are often used to determine how some aspect of a system should be set up or operated. For example, you might want to understand how the number of operators working at a phone bank affects the percent of callers getting a busy signal. To arrive at this understanding, we first build a computer model that replicates the arrival and handling of calls.
The process of building this computer model to store characteristics and capture the dynamics of the system is referred to as modeling. In the scenario mentioned above a model could be created by using random variables to replicate variability in quantities such as the time between successive calls, the time spent speaking with an operator, and the time between getting a busy signal and calling again. At this point a simulation can be run based on the model of the phone bank system. The simulation would create the necessary data that could be used as a basis for determining how many operators needed to be staffed. Animation is the process of representing the components and transaction in a model graphically with pictures and images to serve as a visual aid. For example a modeler might create a model representing automatic guided vehicles moving pallets of materials on a factory floor. When the model is developed, the modeler might simply draw a static background depicting the layout of the factory floor and use graphical icons to depict the vehicles and pallets. When the simulation is run using the model, the animation package displays the static background on the computer screen and moves the vehicle and pallets thought this background as dictated by the model. It should be noted that animation does not change the nature of the underlying simulation, it is simply a tool that aids in the presentation of the simulated run.
Today, with the availability of computer processing power and the ever improving technology, multimedia-based simulation has evolved into a viable forensic and analytical tool that is being utilized from tasks ranging from plane flight simulation assisting in pilot training, to the animation of construction and vehicle accident or murder reenactments for admission as legal evidence in many court trials. This technology is also being utilized increasingly in the private business sector as a tool to assist in the testing or presentation of design concept without having to either costly manufacture the product or prove functionality with conventional methods.
All of the integrated CADD highway design packages mentioned above can utilize the graphic drawing files created in constructing the highway design as part of the computer model that graphically represent the road in a simulation or animation. For example, a Softdesk generated 3D model of a highway design can be animated for presentation with a rendering and animation
17

package such as Autodesk 3D Studio to simulate a vehicle driving over the constructed design. lntegraph's Model View software provides similar capabilities to visualize and animate a potential design. Software tools such as these could potentially play an important role in the development of the IHSDM.
SUMMARY
The following CADD-based software systems for highway design were reviewed: GEOP AK, InRoads, Eagle Point, Softdesk, GDS, and MOSS. The first four of these system are integrated with either Bentley Systems' Microstation or Autodesk's AutoCAD - the two major CADD platforms used by the architect engineering community. The remaining two are stand-alone design systems.
Each software package supports a process for creating a digital, three-dimensional model of an existing ground surface, generally referred to as Digital Terrain Models. Methods are provided for creating proposed alignments, typically via a proposed centerline. Using "templates" for describing the roadway cross section under a variety of conditions, the design package produces a three-dimensional model of the proposed roadway. This model can be manipulated to allow viewing for different perspectives, or rendered to provide a visualization image.
CADD packages tend to store graphics and design data in proprietary file formats. Translators exist for exchanging graphical data among CAD systems, but not for converting design data. All integrated products reviewed in this chapter allow for data to be extracted into ASCII report files. All of these integrated C ADD highway design packages can utilize the graphic drawing files as part of a computer model that graphically represents the road in a simulation or animation.
The following chapter describe three scenarios for use in developing and testing IHSDM analysis modules.
18

4. SCENARIOS FOR IHSDM DEVELOPMENT AND TESTING
OVERVIEW
The development of requirements and specifications for the IHSDM includes the identification of at least three scenarios that depict situations which emphasize elements of the roadway environment having a significant impact on safety. The scenarios were used to develop the requirements for the IHSDM modules and the design specifications for the Driver Performance ModeL
Scenario development was an ongoing iterative process during the course of this contractual effort. The generic scenarios presented here provide initial guidance as to the critical aspects of the highway design that must be evaluated. As the concepts of the analysis modules are further developed, these scenarios are likely to be modified, both qualitatively and quantitatively, to allow thorough testing of the proposed IHSDM modules. Additional scenarios may be required to cover the range of geometric and situational factors determined to be critical to evaluation of safety. Once the IHSDM has been implemented in software, these scenarios will provide a basis for exploring the effects of important environmental and highway design variables on the predictions of the analysis modules.
A complete scenario consists of five components: geometry, traffic control, conflicts, vehicles, and drivers. The scenario design discussed here focuses on the first three components. Driver/vehicle behavior will be considered as a separate parameter of the analysis rather than as a component of scenario description. This section presents descriptions for three scenarios, each of which is intended to focus on a different set of safety-related issues.
The scenario descriptions were submitted to transportation agencies of the following States for review and comment:
Alaska
Florida
Kansas
Maine
Michigan
Minnesota
North Carolina
New Hampshire
Pennsylvania
Tennessee
Texas
Vermont
Washington
West Virginia
19
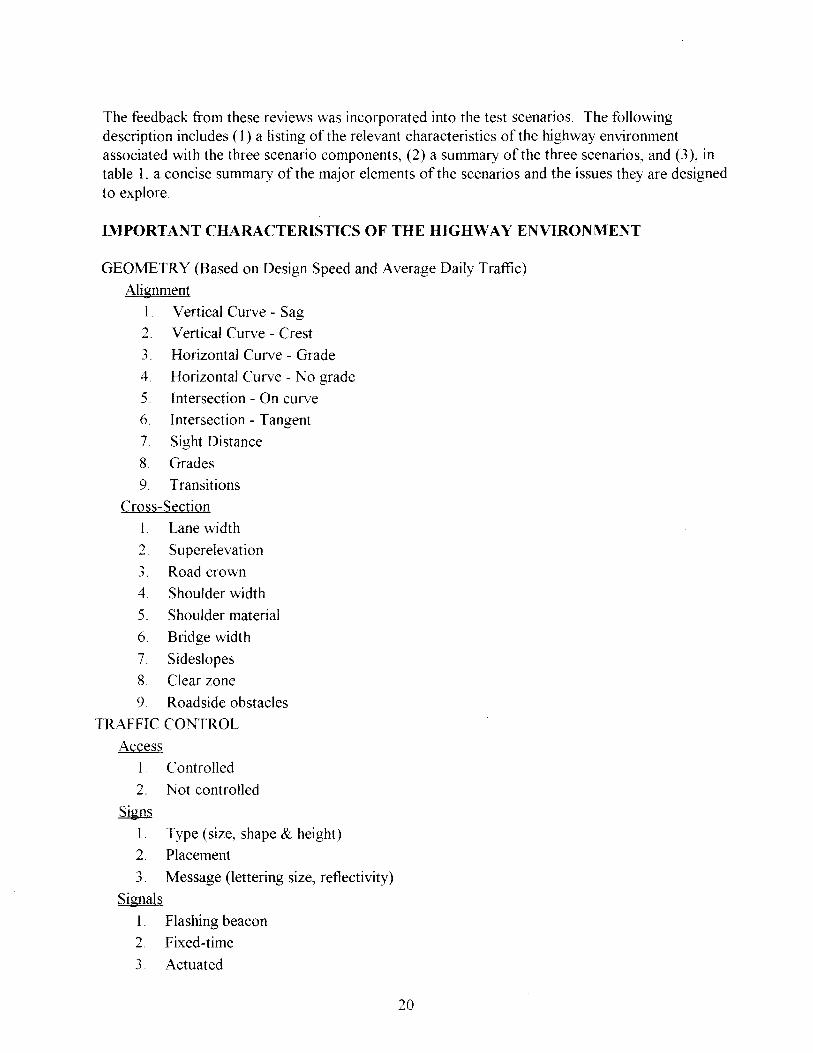
The feedback from these reviews was incorporated into the test scenarios. The following description includes (1) a listing of the relevant characteristics of the highway environment associated with the three scenario components, (2) a summary of the three scenarios, and (3), in table 1, a concise summary of the major elements of the scenarios and the issues they are designed to explore.
IMPORTANT CHARACTERISTICS OF THE HIGHWAY ENVIRONMENT
GEOMETRY (Based on Design Speed and Average Daily Traffic)
Alignment
1. Vertical Curve - Sag
2. Vertical Curve - Crest
3. Horizontal Curve - Grade
4. Horizontal Curve - No grade
5. Intersection - On curve
6. Intersection - Tangent
7. Sight Distance
8. Grades
9. Transitions
Cross-Section
1. Lane width
2. Superelevation
3. Road crown
4. Shoulder width
5. Shoulder material
6. Bridge width
7. Sideslopes
8. Clear zone
9. Roadside obstacles
TRAFFIC CONTROL
Access
1. Controlled
2. Not controlled
Signs
1. Type (size, shape & height)
2. Placement
3. Message (lettering size, reflectivity)
Signals
1. Flashing beacon
2. Fixed-time
3. Actuated
20
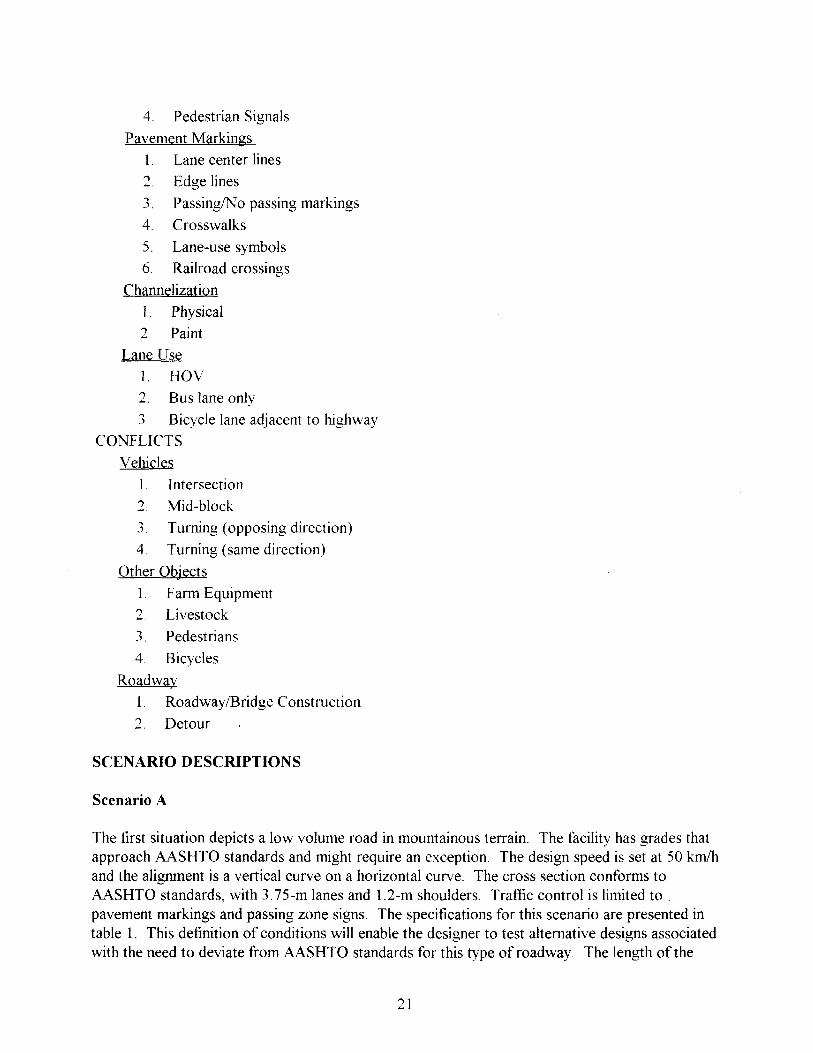
4. Pedestrian Signals
Pavement Markings
1. Lane center lines 2. Edge lines
3. Passing/No passing markings
4. Crosswalks
5. Lane-use symbols 6. Railroad crossings
Channelization 1. Physical
2. Paint
Lane Use 1. HOV 2. Bus lane only
3. Bicycle lane adjacent to highway CONFLICTS
Vehicles
1. Intersection
2. Mid-block 3. Turning (opposing direction)
4. Turning (same direction)
Other Obiects . 1. Farm Equipment 2. Livestock
3. Pedestrians
4. Bicycles
Roadway 1. Roadway/Bridge Construction
2. Detour
SCENARIO DESCRIPTIONS
Scenario A
The first situation depicts a low volume road in mountainous terrain. The facility has grades that approach AASHTO standards and might require an exception. The design speed is set at 50 kmlh and the alignment is a vertical curve on a horizontal curve. The cross section conforms to AASHTO standards, with 3.7 5-m lanes and 1. 2-m shoulders. Traffic control is limited to pavement markings and passing zone signs. The specifications for this scenario are presented in table 1. This definition of conditions will enable the designer to test alternative designs associated with the need to deviate from AASHTO standards for this type of roadway. The length of the
21
uphill grade can be evaluated in terms of passing conditions, particularly for passenger vehicles, recreation vehicles, and trucks. There is a potential for evaluating climbing lanes for slow-moving vehicles. Sight distance is another design element that can be assessed. Because of the mountainous terrain and the attendant sideslopes, the benefits associated with guardrails can be quantified in addition to the economics of the design features.
Scenario B
The second scenario depicts a medium volume road with a grade of 3 percent. The rolling terrain roadway passes through a commercial area typically found in smaller villages An approach speed of 65 kmlh is reduced to 50 kmlh as the design vehicle nears the village. The roadway has both horizontal and vertical (crest and sag) alignments with relatively flat sideslopes. The cross-section has 3.7 5-m lanes and 1. 8-m shoulders. Distance to roadside obstacles is minimal. Traffic control consists of pavement markings and signing. Potential incidents exist in the form of vehicles entering and exiting the non-access controlled facility. Because of the commercial nature of adjacent land use, an ADT of 4,000 is assumed. The IHSDM user will have the option to evaluate speed transition under various geometric conditions and signage effectiveness Table 1 presents the characteristics of this scenario in detail
Scenario C
The third scenario describes a roadway in level terrain with adjacent land use characterized as agricultural and residential. The rural setting is expected to experience volumes of up to 2,000 ADT. The minimal 2 percent grade is present on a horizontal alignment based on a design speed of 80 kmlh. The cross-section has 3. 75-m lanes, 2.5-m shoulders, and standard clearance to roadside obstacles. Traffic controls are present as stop signs on the intersecting road. Incidents are represented by vehicles crossing the intersection and turning movements at the intersection, both in the same and opposing directions. There are also pavement markings and speed control signs on the facility. The user will have an option to test a basic roadway system by varying the characteristics associated with the geometry, traffic control, and incidents. Table 1 presents the details of the scenario conditions.
SUMMARY
Three scenarios were defined for use in developing and testing the IHSDM modules. They were defined in terms of parameters related to geometry, traffic controls, and conflicts. These scenarios were shaped, in part, by feedback obtained from 14 State transportation agencies. Important factors varied across scenarios include: (1) horizontal alignment (2) vertical alignment, (3) cross section, (4) signage, (5) pavement markings, and (6) conflicts with vehicular traffic and other objects in the road.
The following chapter discusses system functional requirements for the IHSDM.
22

Table 1. Scenario Description
BASE CONDITION SCENARIO A SCENARIO B SCENARIOC
Topography Mountainous Rolling Level
Adjacent Land Use Recreational CommerciallVillage AgriculturallResidential
Functional Class Rural Arterial Rural Arterial Rural Arterial
Traffic Volume Low - 1000 ADT High - 4.000 ADT Medium - 2.000 ADT
Design Speed 50 knllh 65kn11h SOknllh
GEOMETRY
Horizontal Alignment Horizontal R= 135 m Horizontal R= 250 m Horizontal Curve R=340 m
Vertical Alignment Crest Vertical ClUTe Crest Vertical Curve 2% Grade L = 250 m - 4% Grade L = 430 m - 3% Grade
Sag Vertical Curve L =250 m
Cross-Section 3.75-m Lanes 3.75-m Lanes 3.75-m Lanes 1.2-m Shoulders I.S-m Shoulders 2.5-m Shoulders
2: I Sideslope w/guardrail 4: 1 Sideslope 6: I Sideslope
0.5m Clear Zone
TRAFFIC CONTROL
Intersection N/A Reduce Speed Sign Stop Signs - Crossroad
Segment Passing Zone Sign No Passing Zone Sign No Passing Zone Sign
Lane Center Line - Broken Lane Center Line - Solid Lane Center Line - Solid
Lane Edge Line Lane Edge Line Lane Edge Line
CONFLICTS Slow traffic - passing Entering-exiting vehicles Crossing & turning traffic limitations BicyclelPedestrian F arm Equipment
EVALUATIONS
Design Consistency Cross-section expectations Alignment transitions Sight distances
Design Policy AASHTO Roadside Design AASHTO Greenbook: MUTCD: Guide:
Grades Supereievation Intersection geometrY
Lane and shoulder widths Horizontal ClIITature
Accident and Narrower lanes and shoulders Sharper curves Traffic controls
DriverN ehicle Passing opportunities Transition Vehicle conflicts
Analvsis Slope treatment Sight distance
Roadside activities
Graphics Geometric design teatures Geometric design tea hIres Geometric design teatures display: display: display:
Typical section Typical section Typical section
Plan Plan Plan
Profrle Profile Profile
Driver's perspective Driver's perspective Driver's perspective
23


5. SYSTEM FUNCTIONAL REQUIREMENTS FOR THE IHSDM
This chapter provides specifications for IHSDM interface requirements, for the highway design system, and for the following IHSDM analysis modules: (1) design policy, (2) design consistency, (3) accident analysis, and (4) traffic analysis. Specifications for the Driver/Vehicle Module and Driver Performance Module are given in chapters 6 and 7, respectively.
INTERFACE REQUIREMENTS
To facilitate the interactive use of the IHSDM the system shall present a top level display that allows the user to call any of the system modules. When the user enters a module, the interface screen for that module shall appear on the user display. Each module shall have its own set of interactive functions supported by its displays, but all modules shall use standard conventions for the user interaction.
Each module screen shall include a standard method of returning to the top level display and shall assure that the system is left in a consistent state (e.g., module output files either closed or deleted depending on whether the user wants to save the results from the module) even if the user aborts the module.
Different versions of the IHSDM system may use different Highway Design Systems (consisting ofa CADD and a highway design package). To facilitate exchange of designs and data between organizations, and particularly to support the evaluation mode (the design may come from a different IHSDM system), a standard format shall be defined and published for the data used by the IHSDM analysis modules. Each CADD and design package that is incorporated in a version of the IHSDM system shall be capable of translating the IHSDM applicable data from the internal CADD format to the standard IHSDM format. The IHSDM data base will include project specific information (e.g., the highway design files) and reference data used by IHSDM modules (e.g., design guidelines used by the Design Policy Module) The project specific part of the data base will be selected from the top level display and will be used by all modules the user calls until he changes the project. Use of the standard IHSDM file is illustrated in figure 3.
In the early iterations of the design process much of the detail design information will be incomplete or at an insufficient level of accuracy. Each module shall be designed to recognize the information available and only exercise guidelines or analysis procedures applicable to the available information. If there is insufficient information for meaningful analysis, the module will inform the user and return to the root display.
The Highway Design System shall be capable of displaying IHSDM outputs as overlays on the highway design views. When a module has outputs that require unique graphic presentations, such as a driver's eye view of the highway, that graphic will be part of the module.
25
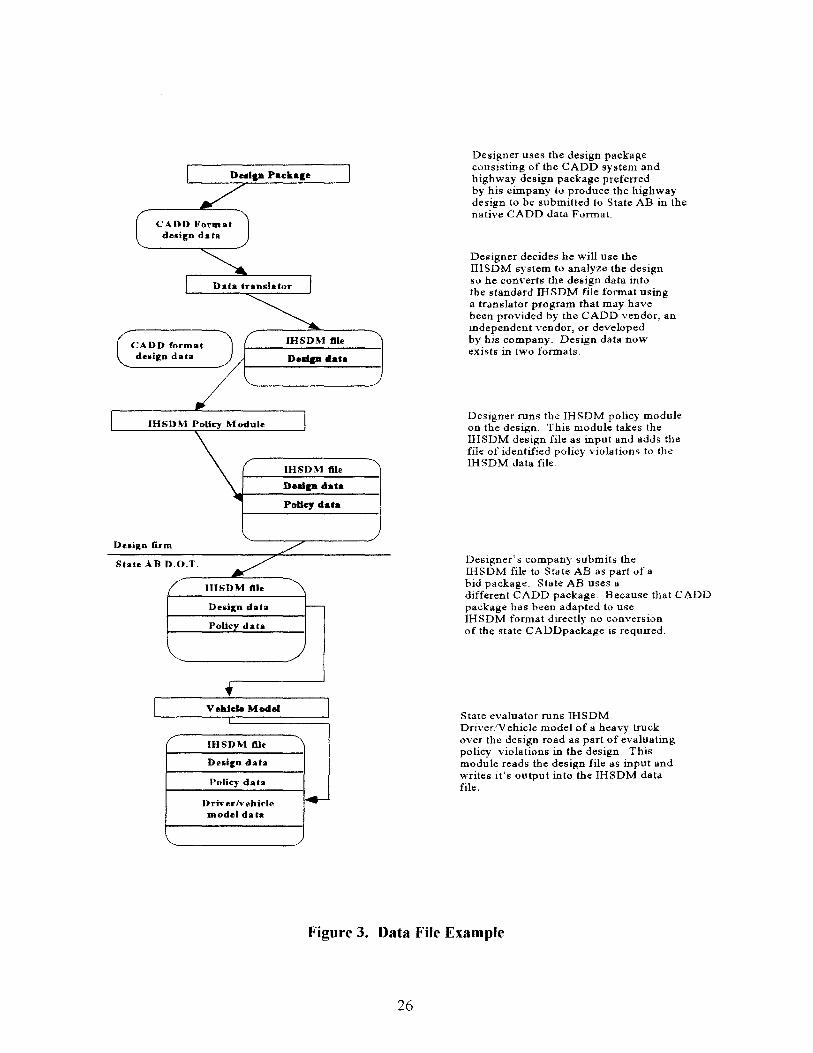
I
I Dea111l Packale
/ CADD Format
design data
~ I Data trandator I
~ ( ( IHSDM file CADD Cormat
d""'d"'~ De ..... data
IHSDM Policy Module
\ IHSDM file
Dedp data ...
Policy data
Duign firm / State AB D.O.T. /
IHSDM IIle
De"ip data r--Policy data
~ I VeMde Model
IHSDM file
Deslen data
Policy data
Driverlvehlcle .-model data
I Designer uses the design package consisting of the CADD system and highway design package preferred by his cimpany to produce the highway design to be submitted to State AB in the native CADD data Format.
Designer decides he will use the rnSDM system to analyze the design so he converts the design data into the standard IHSDM file format using a translator program that may have been provided by the CADD vendor, an independent vendor, or developed by his company. Design data now exists in two formats.
Designer runs the lHSDM policy module on the design. This module takes the lHSDM design file as input and adds the file of identified policy violations to the rnSDM data file
Designer's company submits the lHSDM file to State AB as part of a bid package. State AB uses a different CADD package. Because that CADD package has been adapted to use rnSDM format directly no conversion of the state CADDpackage is required.
State evaluator runs IHSDM Driver/Vehicle model of a heavy truck over the design road as part of evaluating policy violations in the design. This module reads the design file as input and writes it's output into the lHSDM data file .
Figure 3. Data File Example
26
HIGHW A Y DESIGN SYSTEM
The IHSDM has been described as being a tool that allows safety. to be a factor considered in the highway design process. Integrating the IHSDM into commercial CADD-based highway design systems used by DOT's and consultants is seen as the most appropriate environment for achieving this goal. The core design system typically consists of several components:
• Hardware.
• Operating System.
• A CADD System.
• A Third Party Design Application.
• IHSDM Core Data Base.
The purpose of the CADD system is to provide the overall operational platform. In essence, the CADD system acts as a layer above the computer's operating system, providing a user interface, graphics engine, and application development environment.
The CADD system must provide the capability to create, modify and view three dimensional drawing elements. In addition, there must be some method of attaching some kind of intelligence in the form of data base attributes to drawing elements, and tools for using these data base attributes in external applications. These are standard features of most major C ADD systems in use today.
The CADD system shall allow users to develop programs in the C language and compile executable applications. These applications can perform any typical function normally expected with this language such as input screens, data processing, and output screens and files. What makes this application development attractive is the additional ability to obtain data input directly from the drawing environment and provide output that adds to or affects the CADD drawing. Third party design applications such as InRoads, Geopack, and Softdesk operate in this fashion. The IHSDM will be developed and operated in the same fashion as the third party design applications.
Output from any of the IHSDM modules must be displayed wherever required in graphical form in the CADD system. For example, an IHSDM module might highlight or change the color of non-compliant curves, or it could provide feedback to the designer by drawing the actual vehicle tire paths through a proposed design in a particular scenario. IHSDM applications must also include hooks into other standard applications for text, charts, and graphs.
27
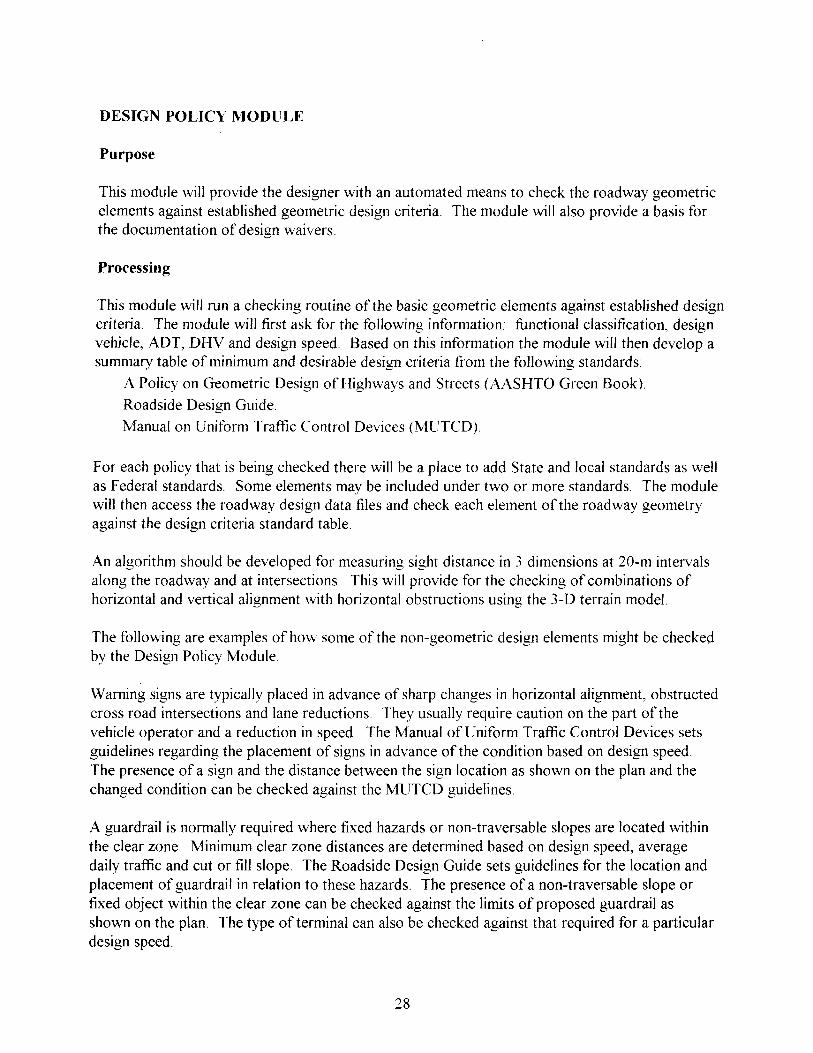
DESIGN POLICY MODULE
Purpose
This module will provide the designer with an automated means to check the roadway geometric elements against established geometric design criteria. The module will also provide a basis for the documentation of design waivers.
Processing
This module will run a checking routine of the basic geometric elements against established design criteria. The module will first ask for the following information functional classification, design vehicle, ADT, DHV and design speed. Based on this information the module will then develop a summary table of minimum and desirable design criteria from the following standards:
A Policy on Geometric Design of Highways and Streets (AASHTO Green Book).
Roadside Design Guide.
Manual on Uniform Traffic Control Devices (MUTCD).
For each policy that is being checked there will be a place to add State and local standards as well as Federal standards. Some elements may be included under two or more standards. The module will then access the roadway design data files and check each element of the roadway geometry against the design criteria standard table.
An algorithm should be developed for measuring sight distance in 3 dimensions at 20-m intervals along the roadway and at intersections. This will provide for the checking of combinations of horizontal and vertical alignment with horizontal obstructions using the 3-D terrain modeL
'- '-
The following are examples of how some of the non-geometric design elements might be checked by the Design Policy Module.
Warning signs are typically placed in advance of sharp changes in horizontal alignment, obstructed cross road intersections and lane reductions. They usually require caution on the part of the vehicle operator and a reduction in speed. The Manual of Uniform Traffic Control Devices sets guidelines regarding the placement of signs in advance of the condition based on design speed. The presence of a sign and the distance between the sign location as shown on the plan and the changed condition can be checked against the MUTCD guidelines.
A guardrail is normally required where fixed hazards or non-traversable slopes are located within the clear zone. Minimum clear zone distances are determined based on design speed, average daily traffic and cut or fill slope. The Roadside Design Guide sets guidelines for the location and placement of guardrail in relation to these hazards. The presence of a non-traversable slope or fixed object within the clear zone can be checked against the limits of proposed guardrail as shown on the plan. The type of terminal can also be checked against that required for a particular design speed.
28
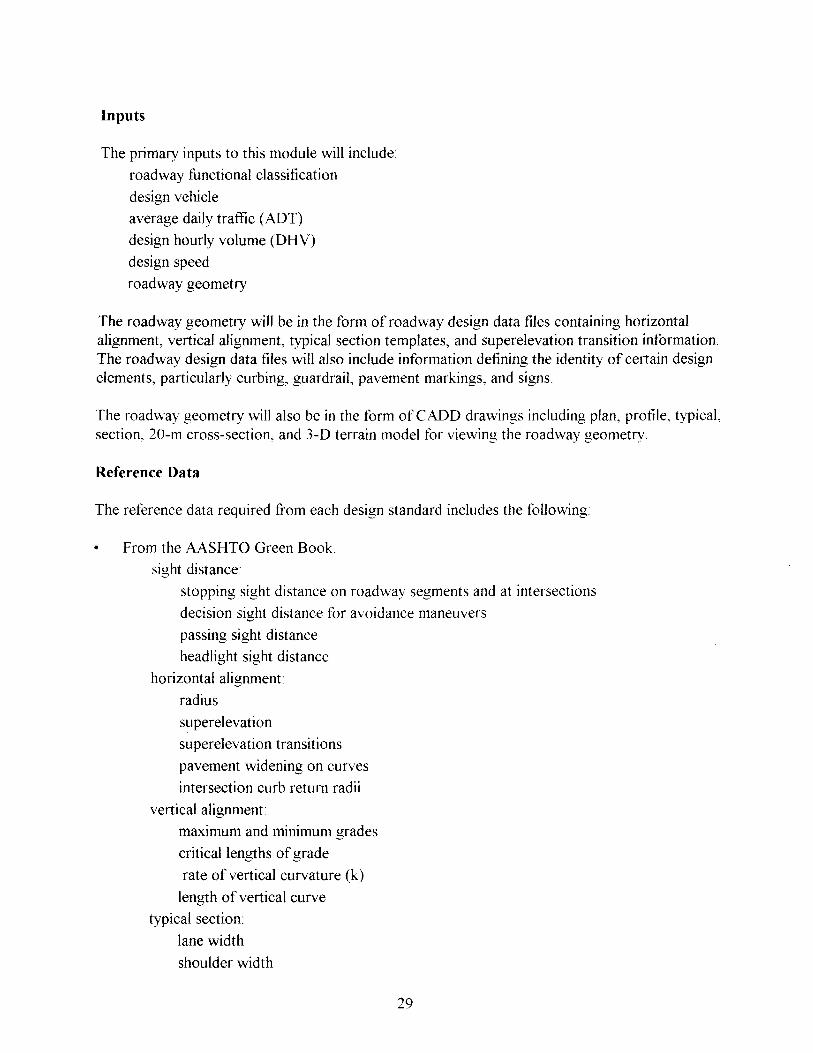
Inputs
The primary inputs to this module will include:
roadway functional classification
design vehicle
average daily traffic (ADT)
design hourly volume (DHV)
design speed
roadway geometry
The roadway geometry will be in the form of roadway design data files containing horizontal alignment, vertical alignment, typical section templates, and superelevation transition information. The roadway design data files will also include information defining the identity of certain design elements, particularly curbing, guardrail, pavement markings, and signs.
The roadway geometry will also be in the form ofCADD drawings including plan, profile, typical, section, 20-m cross-section, and 3-D terrain model for viewing the roadway geometry.
Reference Data
The reference data required from each design standard includes the following:
• From the AASHTO Green Book. sight distance:
stopping sight distance on roadway segments and at intersections
decision sight distance for avoidance maneuvers
passing sight distance
headlight sight distance
horizontal alignment:
radius
superelevation
superelevation transitions
pavement widening on curves
intersection curb return radii
vertical alignment:
maximum and minimum grades
critical lengths of grade
rate of vertical curvature (k)
length of vertical curve
typical section:
lane width
shoulder width
29

lane cross-slope
shoulder cross-slope
curb type and height
clearance to obstructions
clear zone
traffic barriers
• From the Roadside Design Guide clear zone
front slope
barrier warrant
barrier type
end treatment
• From the Manual of Uniform Traffic Control Devices
regulatory sign type and location
warning sign type and location
passing zone pavement markings
The reference data will be in the form of equations or algorithms wherever possible to allow for future developments in standard design criteria. The rest of the reference data will be in tabular format
Outputs
Outputs will include both summary and detailed review information in both graphic and tabular form. The module will locate geometric elements that do not meet minimum standards and flag them by creating a detailed review table as well as placing a graphical tag on the appropriate plan, profile or typical section CADD drawing. A summary table will be created that lists the standard for each geometric element and the minimum provided by the roadway geometry.
DESIGN CONSISTENCY MODULE
Purpose
The design consistency module will serve as a tool to assess the consistency of the design in terms of vehicle travel speed, driver work load, and driver expectation. Initially, this module may functionally perform some of the tasks proposed for the driver/vehicle module. As development of the driver module progresses, its functions will likely include many of the functions of the consistency module.
The purpose of the consistency module is to evaluate the design as a whole by reviewing the interaction of design features. The consistency module requires access to many of the design
30
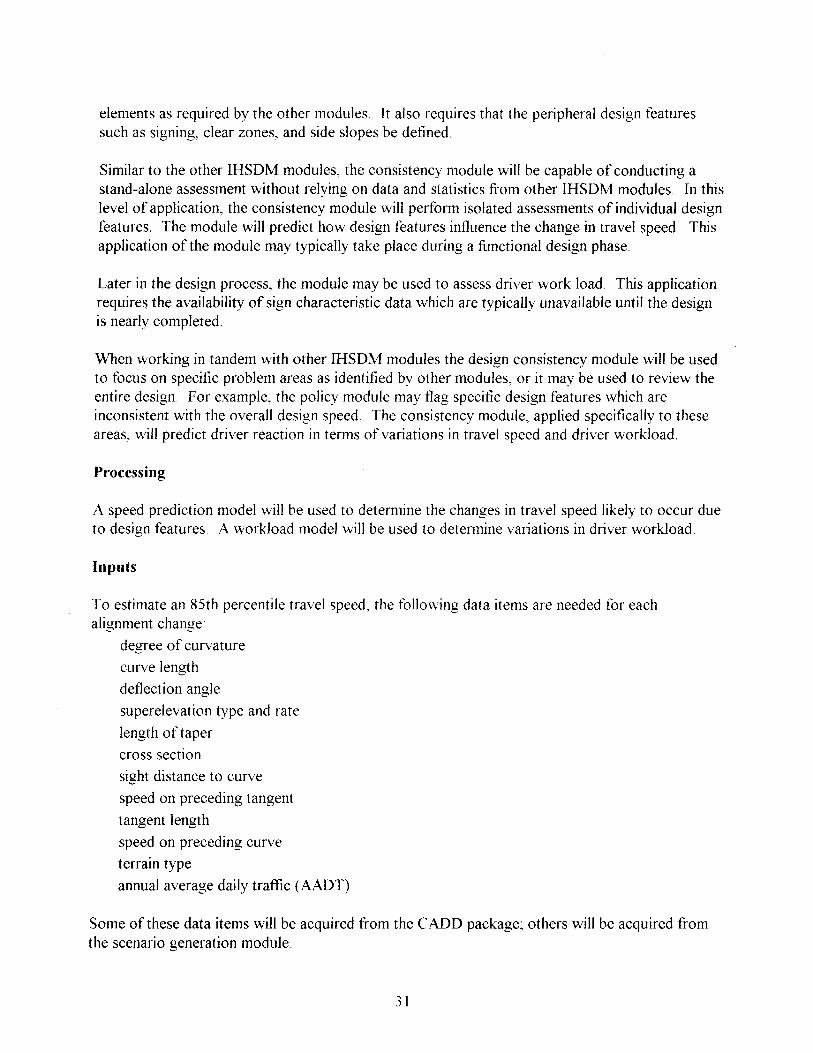
elements as required by the other modules. It also requires that the peripheral design features such as signing, clear zones, and side slopes be defined.
Similar to the other IHSDM modules, the consistency module will be capable of conducting a stand-alone assessment without relying on data and statistics from other IHSDM modules. In this level of application, the consistency module will perform isolated assessments of individual design features. The module will predict how design features influence the change in travel speed. This application of the module may typically take place during a functional design phase.
Later in the design process, the module may be used to assess driver work load. This application require~ the availability of sign characteristic data which are typically unavailable until the design is nearly completed.
When working in tandem with other IHSDM modules the design consistency module will be used to focus on specific problem areas as identified by other modules, or it may be used to review the entire design. For example, the policy module may flag specific design features which are inconsistent with the overall design speed. The consistency module, applied specifically to these areas, will predict driver reaction in terms of variations in travel speed and driver workload.
Processing
A speed prediction model will be used to determine the changes in travel speed likely to occur due to design features. A workload model will be used to determine variations in driver workload.
Inputs
To estimate an 85th percentile travel speed, the following data items are needed for each alignment change:
degree of curvature
curve length
deflection angle
superelevation type and rate
length of taper
cross section
sight distance to curve
speed on preceding tangent
tangent length
speed on preceding curve
terrain type
annual average daily traffic (AADT)
Some of these data items will be acquired from the CADD package; others will be acquired from the scenario generation module.
31
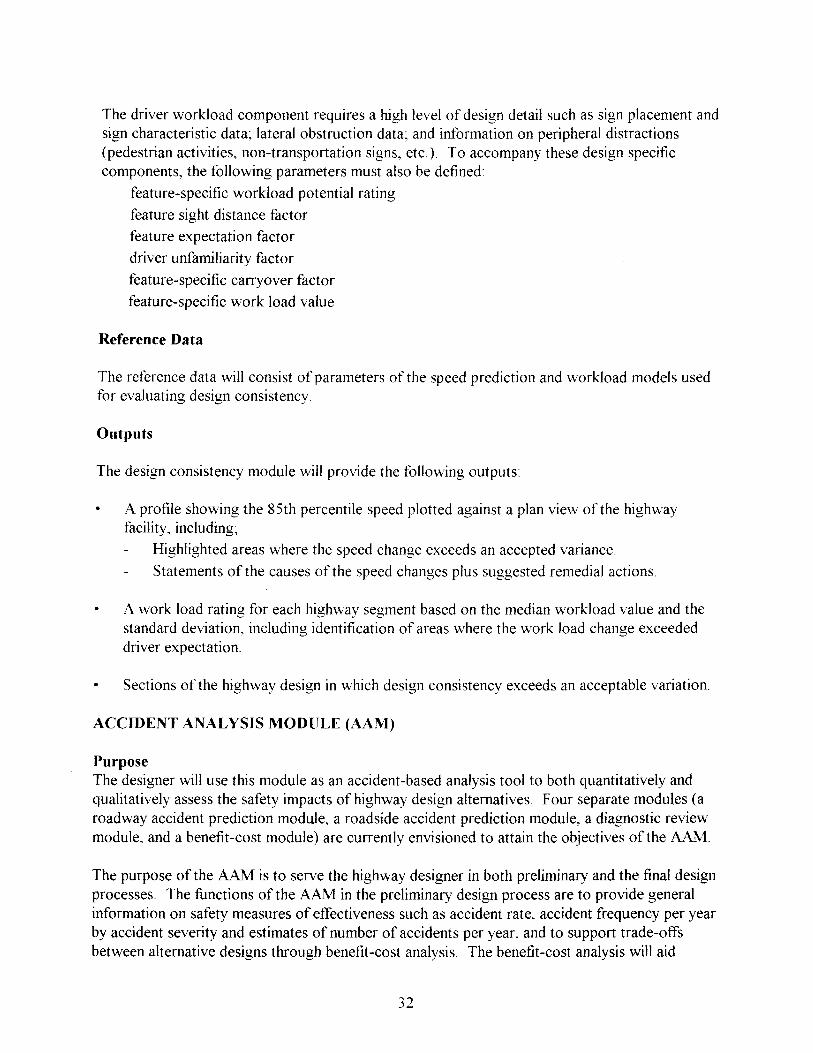
The driver workload component requires a high level of design detail such as sign placement and sign characteristic data; lateral obstruction data; and information on peripheral distractions (pedestrian activities, non-transportation signs, etc.). To accompany these design specific components, the following parameters must also be defined:
feature-specific workload potential rating
feature sight distance factor feature expectation factor
driver unfamiliarity factor
feature-specific carryover factor feature-specific work load value
Reference Data
The reference data will consist of parameters of the speed prediction and workload models used for evaluating design consistency
Outputs
The design consistency module will provide the following outputs:
• A profile showing the 85th percentile speed plotted against a plan view of the highway facility, including;
Highlighted areas where the speed change exceeds an accepted variance.
Statements of the causes of the speed changes plus suggested remedial actions.
A work load rating for each highway segment based on the median workload value and the standard deviation, including identification of areas where the work load change exceeded driver expectation.
• Sections of the highway design in which design consistency exceeds an acceptable variation.
ACCIDENT ANALYSIS MODULE (AAM)
Purpose The designer will use this module as an accident-based analysis tool to both quantitatively and qualitatively assess the safety impacts of highway design alternatives. Four separate modules (a roadway accident prediction module, a roadside accident prediction module, a diagnostic review module, and a benefit -cost module) are currently envisioned to attain the objectives of the AAM.
The purpose of the AAM is to serve the highway designer in both preliminary and the final design processes. The functions of the AAM in the preliminary design process are to provide general information on safety measures of effectiveness such as accident rate, accident frequency per year by accident severity and estimates of number of accidents per year, and to support trade-offs between alternative designs through benefit-cost analysis. The benefit-cost analysis will aid
32

designers in determining between alternative designs and flag areas having high impact on accidents based on associated costs and societal benefits.
In the final design stage, both accident predictive and diagnostic review modules will be used to perform a detailed investigation of the design identified in the preliminary design phase. The roadway accident prediction module will provide data on safety measures of effectiveness for a given set of design characteristics. The purpose of the roadside accident prediction module is to evaluate the roadside safety related to different decision options such as the placement of guardrails, embankment slopes, continuous obstacles, and luminaire supports. With the information on roadway design and the type and location of roadside obstacles, this module will use a series of conditional probabilities to estimate the run-off-road crash costs related to a given design. The benefit-cost analysis will be conducted following techniques defined in AASHTO's Roadside Design Guide. The purpose of the diagnostic module is to provide an information base that cannot be obtained through the predictive modules. The diagnostic review module would provide a knowledge base that will allow potential safety problems to be identified.
Processing
In the preliminary design phase, the basic design characteristics defined by the designer will be processed through statistical analysis to compute expected number of accidents. Costs will be computed for basic design characteristics and accidents. Accident costs for local conditions will be computed through local cost adjustment factors.
Later in the design process, a combination of statistical analysis results and diagnostic approaches will be used to assess the safety consequences of the design. The diagnostic review module will identifY potential safety problems associated with a particular aspect of an alternative highway design such as an intersection. Geometric elements or combinations related to particular design that have been identified from available knowledge as contributing factors for accidents will serve as a basis for flagging or alerting the highway designers of potential inherent design deficiencies/ flaws during the final design process.
Inputs
The discussion of inputs for the AAM is stratified as follows.
User Inputs for Preliminary Design AAM
User Inputs for Final Design AAM
• Roadway.
• Roadside.
• Diagnostic review.
33

User Inputs for Preliminary Design AAM
• Basic geometric design data: design speed
generalized anticipated clear zone width
• Geometric design plans created with the CADD environment including:
centerline vertical profile
centerline horizontal alignment
basic cross-section( s)
number of lanes and lane width
median type and width
shoulder type and width (open section)
curb and gutter (closed section)
location and types of cross-section changes
tapers/transitions for auxiliary lanes, include turn lanes, deceleratio
lanes, and acceleration lanes
changes in median width, lane width, etc
location and type of interchanges
location and type of intersections
• Anticipated traffic control at intersections
(e.g., None, Yield on Side Street, Stop on Side Street Stop on All Approaches, Signal Controlled).
• Projected traffic for opening day and opening day plus 20 Years:
average daily percent heavy vehicles (i.e., vehicle mix)
projected k-factor (percent of AADT traveling during design peak hour on the mainline)
projected d-factor (percent of design peak hour traffic traveling in the peak direction on the mainline)
projected (for the future design year) a.m. and p.rn. peak hour directional
volumes and turn movements at all major intersections
projected vehicle mix (i.e., percentage trucks/heavy vehicles) during projected future a.m. and p.m. peak hours
• Local cost adjustmenfactors.
• Project life.
• Local construction costs per lane mile.
34
Installation costs.
• Life cycle costs.
• Annual maintenance cost.
• Inflation rates.
For benefit-cost analysis, construction and maintenance costs will be based on simplified unit cost pricing techniques. The AAM will allow construction costs to be externally computed and input directly.
User Inputs for Final Design AAM
• Basic geometric design data:
design speed
• Geometric design plans created with the C ADD environment including:
fully specified vertical alignment
fully specified horizontal alignment
available stopping sight distance (determined)
available passing sight distance (determined)
fully specified cross-sections (median, travelway( s) and roadsides)
side slopes including back slope and width, foreslope and width
whether "in cut" or "on fill"
"clear" zone
location and type of roadside obstacles
culverts
bridges
walls
guard rails
bridge abutments
retaining walls
utility/light/signal poles
right-of-way
• Projected traffic - same as for preliminary design AAM.
• Traffic control - finalized decision on.
35
Reference Data
In the preliminary design process, accident predictive relationships that relate basic design characteristics such as design speed, alignment, and cross sections with the number of accidents will be used to evaluate the probability of an accident. Benefit-cost analysis will require data on global values for different injury levels (fatal, critical, severe, serious, moderate, minor and property damage only) that will later be processed for local conditions using cost adjustment factors. The roadway accident prediction module will use statistical models relating different geometric elements, and physical features, traffic characteristics, and traffic control features with accident occurrence.
Due to the quality of data used in many previous accident prediction models, there is a need for credible prediction models. The Highway Safety Information System (HSIS) data base is envisioned as an excellent source for developing new accident predictive relationships. Under the National Cooperative Highway Research Program Project 22-9, the encroachment model under development will likely be utilized within the roadside prediction model. The diagnostic review module will be used as a source of information that cannot be developed in a modeling framework. The AAM will access the diagnostic review module for the knowledge base that combines a variety of detailed information developed from the following sources:
• Expert Knowledge from Experienced Designers.
• Utilization of Existing Research Results.
• Synthesis of indepth accident investigations. Sources include the following:
automated collision diagrams
causal analysis of police reports
accident reconstructions
review of common problems identified by the highway safety improvement programs
conduct of well designed before-after studies
safety audit or critical assessment of accident reports
Outputs
The following outputs will be produced by processing the accident predictive modules of the AAM:
•
•
"Average" accident rate per million vehicle-mile by number and type of vehicle involved and by severity:
fatal accidents
personal injury accidents
property damage only accidents
Accident frequency per mile per year by accident severity
36

• Estimates of the numbers (i.e., mean, upper and lower percentiles) of accidents per year for the overall project.
Following outputs will be produced for benefit-cost analysis:
• Annualized accident costs for the life of the project.
• Annualized construction and maintenance costs for the life of the project.
The user will develop benefit-cost assessments of design features by comparing successive runs of this module, with and without certain safety features in the design. The output should flag areas having a high impact on accident costs and make recommendations for remedial safety treatments as well as show the predicted annualized benefits of the design feature changes.
The diagnostic review module will highlight potential safety problems associated with a particular aspect of an alternative highway design.
Discussion
Two issues are discussed here: (l) the consideration of the accident histories for specific roadways that are candidates for upgrading, and (2) the scope of the benefit-cost analysis that is treated within the IHSDM.
Use of Specific Accident History
When an accident history is available for an existing roadway, that history should be included in the input to the accident analysis module if the project involves improvements to existing roads on existing alignments and the road is not significantly upgraded in functional class (e.g., from an arterial to a freeway). The accident analysis module should have the capability to "overwrite" the estimated baseline (i.e., existing condition prior to improvement) accident rates and frequencies that would be generated as "default" values. Consequently, reduction factors (because some design changes may in fact lead to accident increase, the more appropriate term would be "change" or "difference" factors) will need to be resident within the general data base, or the mechanism must exist to "create" these change factors from the general data base (Zegeer, Reinfurt et al.; 1991; Zegeer, Stewart, et aI., 1991). Thus, the resulting data base would consist of both resident data and data entered by the user for his project. Ideally, the accident analysis module should have the capability (or future capacity) to accept and maintain this project history. Then, when data has been entered for a sufficient number of projects, the flexibility should exist to allow the refinement and/or update of general accident data base.
Scope of Benefit-Cost Analysis
Benefit-cost analyses have been and are currently performed by highway agencies to perform trade off analyses for roadside design. The AASHTO Roadside Design Guide presents a detailed procedure to conduct benefit-cost analyses for roadside design. The Roadside computer program has been a valuable tool to perform benefit-cost analyses. Moreover, research under the National
37
Cooperative Highway Research Program is currently underway to improve upon current roadside design benefit-cost methodologies.
In addition, there have been several other computer-based tools, which were developed as part of FHW A research studies, that perform benefit-cost analysis for the evaluation of alternative highway designs. Procedures for evaluating two-lane rural road cross-sections, horizontal curves on two-lane rural roads, and utility pole placement have been documented in several FHW A research reports.
In keeping with the current FHW A view of IHSDM, benefit-cost analysis is not suggested for a separate IHSDM module, but rather as an element of the accident analysis module. Given the safety emphasis of the IHSDM, the authors feel that the benefits to be estimated from the accident analysis module should relate to safety; specifically, accidents. Thus, the more appropriate term for this should be accident benefit-cost analysis. .
Many other measures can be used to assess safety, including observed vehicle-conflicts, speed variances, compliance rates for traffic control devices, etc. However, there are no nationally accepted values to translate these measures directly into benefits expressed in terms of costs.
It is also appropriate to consider operational benefits when making design decisions, and that economic analyses are very valuable for evaluating highway design projects, especially those related to major investment studies. These studies are best performed outside the IHSDM environment. The IHSDM cannot and should not become an all-encompassing "black box" that performs all types of analyses and considers all factors related directly or indirectly to highway design decisions.
It is possible that operational benefits could be included in the traffic analysis module, especially if microscopic simulation tools are components of the traffic analysis module. The operational costs could include the following:
• Fuel consumption cost.
• Vehicle operating costs (e.g., engine wear, tires, oil, etc)
running costs
idling costs
• Driver and Occupant's Values of Time.
It is recognized that there are other costs related to roadways including pavement and shoulder maintenance costs, lighting/traffic control device operations costs, and roadway/roadside maintenance costs. In many cases, these other costs should be considered in economic analysis.
In conclusion, the authors believe that operational cost should be considered in economic analyses outside the IHSDM and not included as outputs from the benefit-cost analysis component of the accident analysis module.
38

TRAFFIC ANALYSIS MODULE
Purpose
This module will assist the designer or evaluator to assess the interactions between vehicles in the traffic stream moving over the highway. The module will likely use extensions of the "microscopic" traffic simulators such as TRARR and TWOP AS.
Processing
This module will model the traffic stream defined in the inputs moving over the highway. Specific models to be used will be determined as a result of ongoing research. Models may be dependent on the class of road being analyzed.
Inputs
The inputs to this module will include:
• The geometric highway design produced by the C ADD-based highway design module.
• Characteristics of the vehicles in the traffic stream such as vehicle category and driver characteristics.
• Other inputs could include traftlc control restrictions and entering traftlc parameters such as those now included in TWOPAS.
Reference Data
Specific reference data requirements will be determined as part of the ongoing research.
Outputs
The module will produce a time history of the positions and velocities of the vehicles in the traftlc stream. Summary statistics potentially related to highway safety will be produced, including:
speed distributions for sections of the highway
headway distributions for sections of the highway
location and length of backups and queues
characteristics of passing activity including aborted attempts to pass
SUMMARY
The CADD-based Highway Design System shall present a top-level display that allows the user to call any of the system modules. Each module shall have its own set of interactive functions supported by its displays, but all modules shall use standard conventions for the user interaction. The Highway Design system shall be capable of displaying IHSDM outputs as overlays on the
39

highway design views. The IHSDM data base will include project-specific information, reference data used by IHSDM modules, and output generated by the analysis modules.
A CADD system shall provide the overall operational platform and will support a user interface, graphics engine, and applications development environment. The CADD system shall allow users to develop programs in the C language and to compile executable applications. It shall support the display, in graphical form, of output from any IHSDM analysis module.
The Design Policy Module will provide the designer with an automated means to check the roadway geometric elements against established geometric design criteria. This module will provide a basis for the documentation of design waivers. The Design Consistency Module will be used to assess consistency of design in terms of vehicle travel speed, driver work load, and driver expectation.
The Accident Analysis Module will provide qualitative and quantitative assessment of the safety impacts of highway design alternatives. This module is expected to include four major components: (1) roadway accident prediction, (2) roadside accident prediction, (3) diagnostic review, and (4) benefit-cost analysis as it pertains to the tradeoff between accident reduction and construction and maintenance costs.
The Traffic Analysis Module will allow the user to assess the interactions between vehicles in the traffic stream moving over the highway. This module is expected to include "microscopic" traffic simulations in which movements of individual vehicles are modeled.
Design specifications for the Driver/Vehicle Module are presented in the following chapter.
40

6. DESIGN SPECIFICATIONS FOR THE DRIVERIVEHICLE MODULE (DVM)
In this chapter, processing and data requirements are specified for the Driver/Vehicle Module. Before discussing the functional details of this module, we first review the general guidelines that have been followed in formulating design specifications for this module and for the DPM.
FOCUS OF THE DESIGN EFFORT AND MODELING PHILOSOPHY
The design of the prototype DPM presented in this report is intended to accommodate what is expected to be the initial application of the IHSDM. Accordingly, the design produced at this stage will be focused as follows:
1. The model will focus on the task of driving on a particular roadway. Aspects of driver behavior such as deciding whether or not to travel by car, or which road to take, will not be treated. That is, the DPM will treat guidance and control, but not navigation.
2. The driving environment initially modeled will be restricted to a single vehicle traveling on a two-lane rural highway. The initial DPM design, therefore, will not be required to deal with headway maintenance, passing, or multiple-vehicle collisions.
3. Application is intended for problems related to highway design factors such as geometry, signage, sight distance, etc. Incidents such as mechanical failure of the vehicle or an animal suddenly darting across the road will not be considered.
4. The model will be required to handle only standard, relatively low-bandwidth highway driving tasks. The DPM will not be required to treat rapid-response driving tasks such as might be devised to test the limits of vehicle handling capabilities.
5. Behavior at intersections will be limited to slowing, stopping, and proceeding straight ahead.
6. Attention sharing will be treated in a limited fashion in the initial IHSDM implementation. Specifically, we propose to model diversion of attention from the primary driving task only for the purpose of interpreting traffic control signs and signals, for which models of attentional demand are available.
As IHSDM development proceeds, the DPM is expected to be expanded to treat many of the situations listed above. The following orderly expansion of model capabilities is anticipated:
1. Additional lanes of traffic so that situations such as lane drop can be considered.
2. Addition of other roadways and turning from one roadway onto another at intersections.
3. Addition of a car in front to occasionally require the driver to perform headway maintenance and plan and execute passing maneuvers.
41

4. Addition of significant traffic to impact on lane-change and passing behavior (and the accident potential related to these behaviors).
5. Expansion of the attention-sharing submodel to include additional "diversionary" tasks and. sophisticated models for attention (task) allocation.
The DPM and VDM are envisioned as tightly-coupled elements residing in a DriverN ehicle Module (DVM). The software design effort must therefore include design of the DVM as well as the DPM.
To facilitate model development, and to accommodate different model structures for different facets of driver behavior, decision-making and regulation will be treated as separable (and thus separately modeled) tasks, as will speed and path control. "Decision making" in this context refers to the driver's formulation of a desired speed profile (e. g., maintain constant speed or change speeds to accommodate a curve ahead) and a desired path profile (e.g., maintain lanecenter position or perform a double lane-change to avoid an obstacle) "Regulation" refers to the task of controlling speed and path to accommodate the desired profiles.
The current state of model development does not support restricting the DPM design to specific algorithms or model implementations In some cases - primarily path control - competing model forms exist, none of which have been validated to the extent that selection of one algorithm to the exclusion of others is justified at this time. In other cases, such as speed selection, validated human-centered (as opposed to regression) models are not available. To the extent feasible, the design specifications will be formulated to apply to a variety of candidate model forms and algorithms, but it is expected that the design (especially the user interface) will require some modification to apply to the particular set of models that are selected for IHSDM implementation.
Initial implementation of the DPM may include regression models in which predicted behavior is based on observed correlation between roadway characteristics and driver behavior (e.g., speed in curves). The design specifications developed in this effort will accommodate such models. Nevertheless, it is strongly recommended that all algorithms implemented in the IHSDM ultimately be human-centered in the sense of predicting behavior in terms of the driver's goals, perceptions, and response strategies. It is especially important to consider perceptual, cognitive, and motor capabilities and limitations so that the DPM can account for factors such as (1) imperfect estimate of distance to a curve and the degree of curvature when deciding when and how much to slow down for a curve, (2) within-driver response variability, and (3) differences in driving styles (e.g., aggressiveness) among different classes of drivers.
The model is expected to include representations of various random processes, such as (1) driver perceptual errors, (2) road roughness inputs to the vehicle, and (3) wind gusts. Underlying these submodels will be a random number generator which is initialized by a "seed" (an integer or real number, depending on the particular implementation). The user will be allowed to modifY or retain the random number seed to provide proper control over the simulation. This enables the user to test the integrity of the model by re-running a previous problem under the exact same conditions. More important, the user can perform a "Monte Carlo" analysis by repeating the simulation with different random number seeds, thereby simulating within-driver run-to-run
42
variability. By applying the same sequence of repeated conditions to different candidate highway designs, the effects of run-to-run variability can be controlled for, allowing a more sensitive test of design differences.
The DPM specifications will allow for treatment of different driver types. The preliminary user interface has been designed to allow the user to define different driver types along the behavioral dimensions of "aggressiveness," "responsiveness," and "perceptual capabilities." We feel this approach is preferable to limiting the developers and distributors of the IHSDM to "canned" definitions of driver populations such as "old," "young," "impaired," and so on. The primary reason for suggesting this method of defining driver types is that there are no agreed-upon definitions of the various demographic driver types. For example, young drivers may differ from non-young drivers by simply being less experienced, or (as is assumed to be typical of young males) more aggressive as well as less experienced than non-young drivers. Likewise, older drivers may in general tend to be less aggressive, less responsive, and less perceptually capable than non-old drivers, but the user may wish to consider older drivers who tend to drive aggressively. Rather than have a multiplicity of canned user types, it seems more efficient to allow the user to define the driver type from the three behavior dimensions. A second argument for this approach is that the distributors of the IHSDM might wish to avoid potentially adverse public relations associated with stigmatizing demographic groups as having certain non-ideal characteristi cs.
Although not shown in the interface design of chapter 8, it might be useful to allow the user to construct additional driver types from among the three behavioral characteristics proposed here, assign a name to these combinations of characteristics, and save the definitions for easy recall in future applications. In any case, distribution of the IHSDM should be accompanied by guidelines for the definition of various demographic types, including commentary on the degree to which the guidelines are supported by research.
Various levels of model analysis will be accommodated to provide the option to select the type of analysis deemed most appropriate at the time. At the lowest level, the user specifies the speed profile, and the vehicle is assumed to move along the center of the lane as dictated by this speed profile. The second level employs the DPM to predict the speed profile, but idealized vehicle control is assumed in that the vehicle travels along the center of the lane at the predicted speed(s). The third level employs the driver model to perform all decision and control actions.
The user interface will be designed for two categories ofIHSDM operator: "designer" and "developer." A "designer" will typically use the IHSDM to evaluate the safety aspects of candidate highway designs. This type of user need not (and generally does not desire to) modify the underlying parameters. Accordingly, the designer will interact only with the top-level dialogs that define the problem to be analyzed (e.g., roadway design file, additional aspects of the roadside environment, vehicle type, and driver type).
The term "designer" is intended here and elsewhere in this report to encompass both the highway designer operating the IHSDM in the design mode and the design reviewer, who may be a highway designer or a non-designer charged with reviewing the design, operating in the design review mode.
43
The "developer" may be one who is participating in the development of the IHSDM, or a user who is knowledgeable about the detailed workings of the underlying model and has a need to modify the numerical values associated with model parameters. This type of user will access additional dialogs that facilitate the re-definition of default parameters for the various modules.
OVERVIEW OF THE DVM
A top-level diagram of the information flow in the DVM is shown in figure 4. This module has six major functional elements or modules: (1) Geometrics, (2) Random Processes, (3) Vehicle Dynamics Module, (4) Driver Performance Module, (5) Runtime Data Processing, and (6) Post Processing. (In this and the following diagrams, processes are denoted by rectangles and uppercase, and data bases are denoted by ellipses and initial capitals.) Except for the highway design data base and the post-processing activities, the arrows show the flow of dynamic information (i.e., variables that may change every simulation update).
The Geometrics module serves as a data conditioner for the remaining modules. Primary functions include:
1. Deriving instantaneous values for roadway-related variables from the (static) roadway data files produced by the Highway Design System.
2. Computing "error" terms by relating the vehicle location and orientation (computed by the Vehicle Dynamics Module) to the highway location and orientation (computed within the Geometrics Module).
3. Computing other geometric constructions to serve as perceptual inputs to the DPM.
The Random Processes Module generates disturbances to the vehicle that can be modeled as random processes, Two such processes are identified road roughness and wind inputs. Road roughness accounts for lateral forces acting on the vehicle due to unevenness in the road surface, and might be extended to include vehicle-induced sources of random side force such as play in the front wheel steering angle. (Grade and superelevation rate - which are elements of the road design data base - are accounted for in the Geometrics module), Wind inputs include steady winds and wind gusts that apply lateral force to the vehicle.
The Vehicle module envisioned in this diagram accepts driver, wind, and road inputs to generate the movement of the vehicle, and the DPM generates the driver's steering, braking, and acceleration inputs.
The Runtime Data Processing Module performs three major functions: (1) long-term storage of simulation results for potential post-processing and/or use by another IHSDM module, (2) calculation of summary performance metrics to be displayed at the conclusion of the simulation, and (3) visualization of model results while the simulation is in progress. The Post Processor allows the user to compute additional summary performance metrics after the conclusion of the simulation and to playback the data for visualization.
44
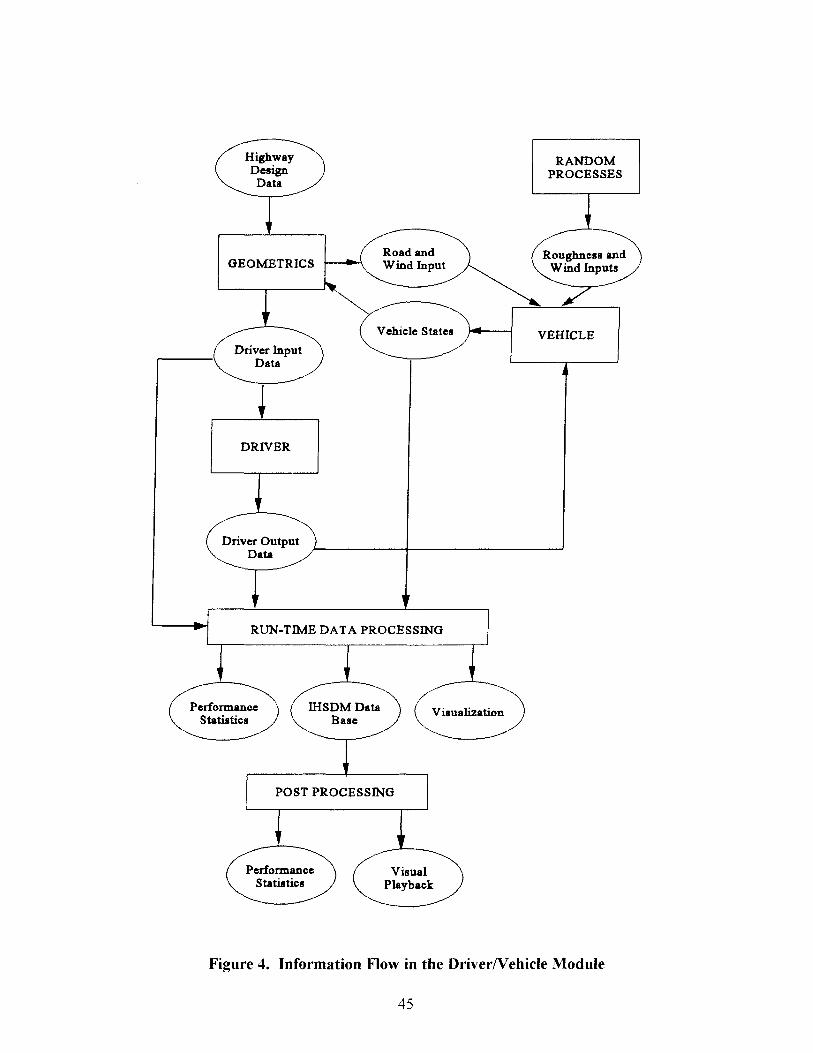
Highway Design Data
GEOMETRICS Road and Wind Input
Vehicle States
Driver Input Data
DRIVER
Driver Output Data
RUN-TIME DATA PROCESSING
Performance Statistics
IHSDMData Base
Visualization
POST PROCESSING
Performance Statistics
Visual Playback:
RANDOM PROCESSES
Roughness and Wind Inputs
VEHICLE
Figure 4. Information Flow in the DriverNehicie Module
45
Requirments are specified for all of the modules shown in figure 4, except for the Driver Performance Module, for which detailed specifications are presented in chapter 7.
Three types of input data are considered in these design specifications.
• Dynamic inputs. Input variables whose values are potentially modified at every simulation update interval. Dynamic inputs for the DVM component modules are not provided by the user but by other DVM modules. Vehicle speed, path error, and driver attention are examples of dynamic inputs.
• Static inputs. Problem-dependent variables that are specified by the user prior to the simulation run to describe one or more aspects of the conditions to be simulated. These variables do not change once a simulation run has begun. Vehicle type, level of driver responsiveness, and weather conditions are examples of static inputs.
• Reference data. Typically specified by a user operating as a "developer", these data quantifY the underlying model parameters and are generally valid across all projects. Numerical values assigned to cognitive delay, braking reaction time, and allowable path error are examples of reference data underlying the general category of driver responsiveness.
Static and reference data for the entire Driver/Vehicle Module (Including the Driver Performance Module) are defined in the following specifications of top-level requirements. Dynamic inputs, which are internal to the operation of the DVM, are specified for the constituent modules.
TOP-LEVEL REQUIREMENTS
Purpose
The Driver/Vehicle Module of the IHSDM is intended to provide single-vehicle simulation modeling for safety analysis of highway designs, initially for two-lane rural roads.
Processing
Using the description of the roadway environment developed by the Highway Design System and the further description of the driving problem defined by the user, the DVM will process these data so as to yield the desired performance metrics of the driver/vehicle system. Detailed processing requirements are specified below for the constituent modules.
Unless the vehicle encounters a rollover condition, the simulation will run from an initial starting point (station) to a stopping point as specified by the user. If a rollover occurs, the simulation halts at the point of rollover. In either case, the user has the option at the end of the simulation to perform analysis on the simulation data and save the results. The simulation does not halt for a skid condition; the Driver Performance Model attempts to put the vehicle back on the highway and continue toward the stopping point.
46
Static Inputs
Static inputs will be provided by three sources: (1) the Highway Design System through the IHSDM-compatible highway design data base, (2) the user via the user interface, and (3) the IHSDM data base, which provides long-term storage of data created by the IHSDM - including previously-specified user inputs. Inputs needed from the highway design data base are specified in the description of the Geometrics module. Static inputs provided by the user are specified below.
Table 2 summarizes the user-specified static inputs, organized into seven categories: (1) analysis methods, (2) roadside environment, (3) driving environment, (4) vehicle, (5) driver, (6) data processing, and (7) simulation control. (Inputs provided by the Highway Design System are specified in the discussion of the Geometrics module.
In all cases, default values will be displayed at the start of a model run. The user may accept all defaults, or selectively change settings before commencing the model run.
As discussed above, three levels of analysis (or "analysis methods") are provided to allow the user to determine the extent to which driver behavior is pre-determined or model-generated.
Three options are available:
I . The user selects the speed profile, and the models used for speed and path control are idealized in that human performance limitations such as response delay and perceptual limitations are ignored. The vehicle thus follows the desired speed profile very closely and remains near the center of the lane (barring skid or rollover). The user may specifY a constant speed in kmlh, or a piecewise-linear variable speed may be defined by specifYing a sequence of breakpoints (by station) and the speed (kmlh) at each station.
2. The driver performance model determines the speed profile, but speed and path control are idealized.
3. The driver performance model determines speed and path selection and performs speed and path control in a psychologically-valid manner that accounts for human performance limitations.
The "roadside environment" category consists of highway design features and elements in the vicinity of the highway relevant to driver behavior that are not included in the highway design data base. This category contains one parameter - the cycle time for traffic signals. The user either specifies a single cycle to be applied to all signals, or individual cycles for each signal. Cycle is defined as the durations, in seconds, for red, amber, and green states. (The placement of signals is defined in the highway design data base; the cycle time is part of the scenario specified by the user. The placement and content of highway signs such as speed advisories are also assumed to be defined in the highway design data base.)
47
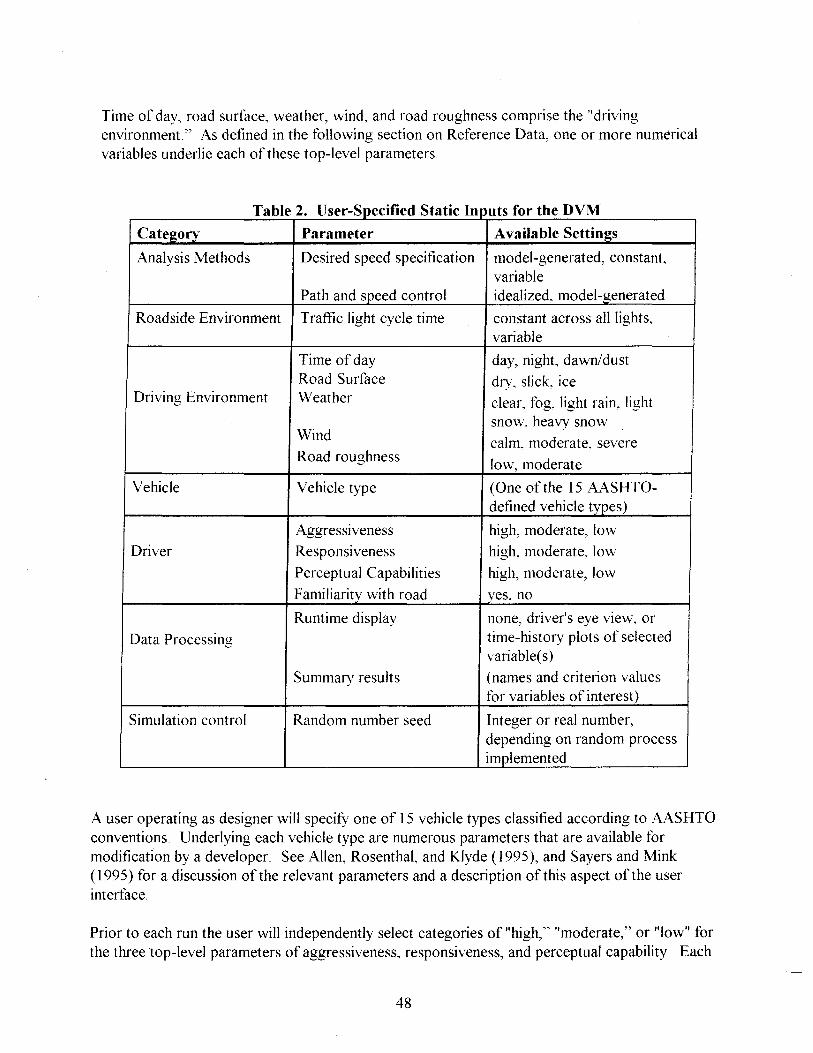
Time of day, road surface, weather, wind, and road roughness comprise the "driving environment." As defined in the following section on Reference Data, one or more numerical variables underlie each of these top-level parameters.
a e . T bl 2 U ser- ,peCI Ie tatlc S °fi d SOl f, h DVM nputs or t e
Category Parameter Available Settings
Analysis Methods Desired speed specification model-generated, constant, variable
Path and speed control idealized, model-generated
Roadside Environment Traffic light cycle time constant across all lights, variable
Time of day day, night, dawn/dust Road Surface dry, slick, ice
Driving Environment Weather clear, fog, light rain, light
Wind snow, heavy snow
calm, moderate, severe Road roughness low, moderate
Vehicle Vehicle type (One of the 15 AASHTO-defined vehicle types)
Aggressiveness high, moderate, low
Driver Responsiveness high, moderate, low
Perceptual Capabilities high, moderate, low
Familiarity with road yes, no
Runtime display none, driver's eye view, or
Data Processing time-history plots of selected variable( s)
Summary results (names and criterion values for variables of interest)
Simulation control Random number seed Integer or real number, depending on random process implemented
A user operating as designer will specifY one of 15 vehicle types classified according to AASHTO conventions. Underlying each vehicle type are numerous parameters that are available for modification by a developer. See Allen, Rosenthal, and Klyde (1995), and Sayers and Mink (1995) for a discussion of the relevant parameters and a description of this aspect of the user interface.
Prior to each run the user will independently select categories of "high," "moderate," or "low" for the three top-level parameters of aggressiveness, responsiveness, and perceptual capability. Each
48
of these parameters contains a number of numerical parameters quantitatively defining driver preferences and capabilities. The numerical parameters, which would be modified only by a user operating as a developer, are defined in the Reference Data.
The user also specifies whether or not the driver is familiar with the road. Iffamiliar, the driver is assumed to estimate the curvature as if sight distance were not limited. Otherwise, an alternative strategy is adopted as determined by the "strategy for sight-distance limitation" parameter defined below.
The user indicates the type of dynamic output displayed on the terminal as the simulation unfolds: (1) none, (2) a view of the scene from the driver's viewpoint, or (3) time history plots. If the latter, the variable(s) to be plotted are designated. The user also selects the variables for which summary statistics are to be displayed at the end of the trial, along with criterion values associated with each variable as described in the discussion of the Run-time Data Processing Module.
Reference Data
Reference data, which are quantified by a user acting as a "developer", are defined in table 3 for the static parameters described above. An additional category,"simulation control," is intended for access by the developer only. The user will not likely want to record data for long-term storage every update interval (which may be as frequent as every 0.05 s). Therefore, two parameters are proposed: a "simulation update interval" to govern operation of the Geometries, Vehicle, and Driver modules; and a "data recording interval," which applies to the Run-Time Processing module, to determine the interval at which time histories generated during simulation are deposited to the IHSDM data base for long-term storage. (Additional flexibility may be
. desired if, for example, numerical accuracy of the integration scheme requires that the vehicle dynamics run at a faster rate than the other modules.) To maintain synchronous operation, the recording interval should be an integral multiple of the simulation update interval.
F or the numerical parameters associated with the top-level driver parameters of aggressiveness, responsiveness, and perceptual capability, the expression "(increases)" or "(decreases)" immediately following the parameter name indicates how the value changes as the category proceeds from "low" to "high."
The parameters shown in table 3 that are not self-explanatory are discussed here.
Compliance with Speed Advisories on Curves
This parameter is treated independently from compliance with posted speed limits on long tangents. If the driver does not adhere to speed advisories, or if none are available, speed is determined according to road geometry and other factors as determined by the Speed and Path Decision Module. Non-compliance is associated with the highest level of aggression. An exception to this rule occurs if there is an obstacle or event that requires a full stop (modeled as a speed advisory of 0 kmIh), in which case all drivers are assumed to want to stop.
49
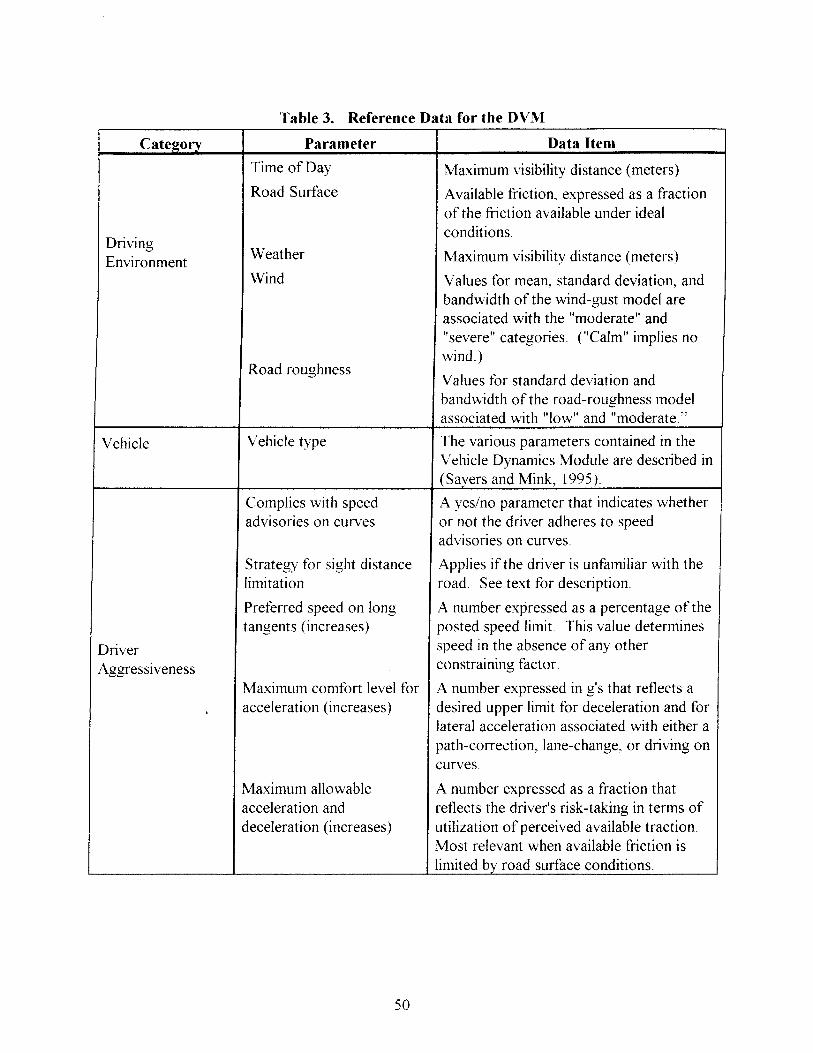
Table 3. Reference Data for the DVl\rI
Category Parameter Data Item
Time of Day Maximum visibility distance (meters)
Road Surface Available friction, expressed as a fraction of the friction available under ideal
Driving conditions.
Weather Maximum visibility distance (meters) Environment Wind Values for mean, standard deviation, and
bandwidth of the wind-gust model are associated with the "moderate" and "severe" categories. ("Calm" implies no
Road roughness wind.)
Values for standard deviation and bandwidth of the road-roughness model associated with "low" and "moderate."
Vehicle Vehicle type The various parameters contained in the Vehicle Dynamics Module are described in (Sayers and Mink, 1995).
Complies with speed A yes/no parameter that indicates whether advisories on curves or not the driver adheres to speed
advisories on curves.
Strategy for sight distance Applies if the driver is unfamiliar with the limitation road. See text for description.
Preferred speed on long A number expressed as a percentage of the tangents (increases) posted speed limit This value determines
Driver speed in the absence of any other
Aggressiveness constraining factor.
Maximum comfort level for A number expressed in g's that reflects a acceleration (increases) desired upper limit for deceleration and for
lateral acceleration associated with either a path-correction, lane-change, or driving on curves.
Maximum allowable A number expressed as a fraction that acceleration and reflects the driver's risk-taking in terms of deceleration (increases) utilization of perceived available traction.
Most relevant when available friction is limited by road surface conditions.
50
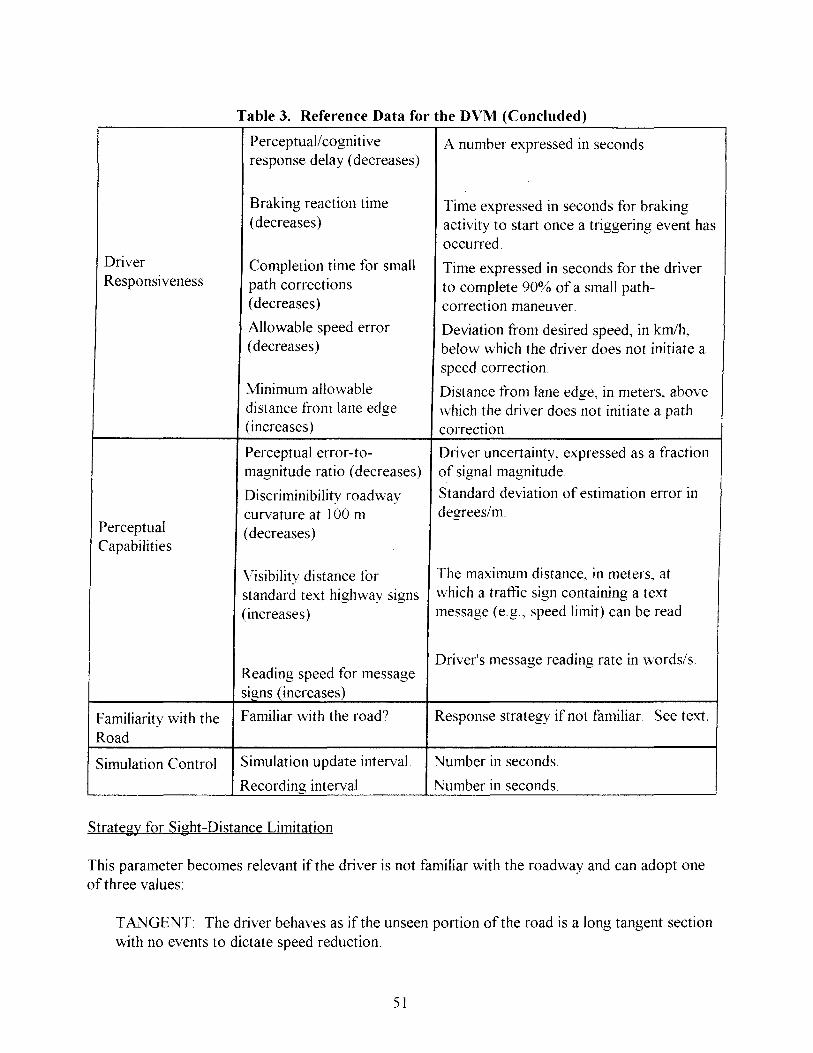
Table 3. Reference Data for the DVM (Concluded)
Perceptual! cognitive A number expressed in seconds. response delay (decreases)
Braking reaction time Time expressed in seconds for braking ( decreases) activity to start once a triggering event has
occurred. Driver Completion time for small Time expressed in seconds for the driver Responsiveness path corrections to complete 90% of a small path-
(decreases) correction maneuver.
Allowable speed error Deviation from desired speed, in kmlh, ( decreases) below which the driver does not initiate a
speed correction.
Minimum allowable Distance from lane edge, in meters, above distance from lane edge which the driver does not initiate a path (increases) correction.
Perceptual error-to- Driver uncertainty, expressed as a fraction magnitude ratio (decreases) of signal magnitude.
Discriminibility roadway Standard deviation of estimation error in
curvature at 100 m degrees/m. Perceptual ( decreases) Capabilities
Visibility distance for The maximum distance, in meters, at
standard text highway signs which a tramc sign containing a text
(increases) message (e.g., speed limit) can be read.
Reading speed for message Driver's message reading rate in words/so
signs (increases)
Familiarity with the Familiar with the road? Response strategy if not familiar. See text.
Road
Simulation Control Simulation update interval. Number in seconds.
Recording interval Number in seconds.
Strategy for Sight-Distance Limitation
This parameter becomes relevant if the driver is not familiar with the roadway and can adopt one of three values:
TANGENT: The driver behaves as if the unseen portion of the road is a long tangent section with no events to dictate speed reduction.
51

CONSISTENCY: The driver assumes that the nature and frequency of curved sections is the same as on the road sections just traveled.
OBSTRUCTION: The driver assumes that an event requiring a full stop is located just beyond visual range.
Completion Time for Small Path Corrections
This parameter reflects limitations or preferences on the dynamic responsiveness of the driver/vehicle system and will be translated into the appropriate model parameter depending on the specific model adopted for path controL
Perceptual Error-to-Magnitude Ratio
This parameter, which specifies the operator's uncertainty of a variable's value, reflects the experimentally-supported assumption that the statistical error in estimating the magnitude of an above-threshold stimulus scales with the magnitude of the stimulus (Rachlin, 1966; Levison, Baron, & Kleinman, 1969). If perceptual errors are assumed to vary in a manner not linearly correlated with the perceptual input or other system variables, this parameter will account for the portion of a driver's response variability not due to external sources (such as wind gusts and road roughness inputs) that are modeled as random processes.
Discriminibility of Roadway Curvature at 100 Meters
This parameter, expressed as an estimation error in degrees/meter, reflects a visual resolution limit ("perceptual threshold"), operating in addition to the error-to-magnitude ratio, that is presumed to characterize the driver's ability to estimate road curvature at significant distances ahead. The Perceptual module of the DPM will determine how this value changes as a function of distance ahead.
Dynamic Inputs
The DVM as an entity has no dynamic inputs (i.e., no external inputs that change during the course of a simulation); dynamic inputs are associated with the constituent modules.
Outputs
The DVM stores time histories of continuous variables, discrete events, and summary results in the IHSDM data base. These data may be viewed immediately after the run or upon playback at a later time. In addition, the user has the option to view visualizations of simulation results while a model run is in progress. Specific DVM outputs are indicated in the discussion of the Run-Time Data Processing and Post Processing modules.
52

GEOMETRIeS MODULE
Purpose
The Geometrics module serves as a general data conditioner and performs three major functions: (1) transform the roadway description provided by the CADD-based Highway Design system into a format suitable for driver/vehicle simulation, (2) compute error terms, and (3) compute relevant perceptual cues as required by the driver model elements.
Processing
The highway design data base generated by the Highway Design System is a "static" data base in that the contents are defined prior to IHSDM analysis and do not change until a design change has been implemented through subsequent operation of the Highway Design System. The data contained in the associated files are, of necessity, location based. At each simulation update interval, the Geometrics module will need to produce from these files and from other simulation data the set of relevant time-based data needed as inputs to other DVM modules. As specified below, variables so derived will consist of instantaneous values of relevant state variables and error quantities (e.g., speed and lateral lane position) as well as a variety of "preview" data (e.g., sight distance, distance to the next curved segment and segment curvature and length).
Additional geometric computations may be required, depending on the details of the specific driver models implemented. Driver models that have been implemented to date generally assume that the driver operates directly on relevant state variables. Thus, driver models accept variables such as lane error and heading as inputs. A more psychologically-based model might use visual scene cues such as the position of the right lane edge with respect to the right front corner of the hood as the principal variable for estimating lane error. For this type of model, the Geometrics module will perform the trigonometric computations necessary to derive the relevant visual scene cues from the state variables.
Static Inputs
The IHSDM-compatible highway design data base produced by the Highway Design System will, for each highway design project, contain a number of computer files that provide the data needed to conduct the driver/vehicle simulation. The set of files associated with a specific project will depend on the state of design development. Projects in the preliminary design stage may have only the files associated with horizontal and vertical alignment; additional files containing detailed cross section and terrain data will become available as the design nears completion.
The Highway Design Data base will contain the following information.
Horizontal Alignment
The horizontal roadway alignment is assumed to be composed of straight segments ("tangents"), segments of constant curvature, and, where appropriate, spiral segments to transition smoothly between tangent and constant-curvature segments.
53

• Data provided for each tangent segment will consist of:
segment type ("T" for tangent)
beginning location north (meters)
beginning location east (meters)
beginning station (meters)
heading (degrees)
length (meters)
• Data provided for each curved segment will consist of:
segment type ("C" for curve)
beginning location north (meters)
beginning location east (meters)
beginning station (meters)
station at which initial and final tangents intersect (meters)
ending station (meters)
beginning heading (degrees)
radius of curvature (meters, positive for right curve)
Vertical Profile
The vertical roadway profile is assumed to consist of segments of constant grade joined by parabolic segments.
• Data for segments of constant grade will consist of:
segment type ("G" for constant grade)
beginning elevation (meters)
beginning station (meters)
grade (percent)
ending station (meters)
ending elevation (meters)
• Data for parabolic transition sections will consist of:
segment type ("P" for parabolic)
beginning elevation (meters)
beginning grade (percent)
beginning station (meters)
ending elevation (meters)
ending grade (percent)
ending station (meters)
54

Cross Section
The content of this file will be built up as the roadway design proceeds. During the initial design phase, this file may simply indicate lane width. As the design proceeds, the file will be expanded to include the following additional cross-sectional descriptors:
superelevation (percent)
sideslope (ratio)
crown high point (distance from center of pavement, meters)
crown slope (ratio)
Lane width, shoulder width, and sideslope change in a piecewise-constant manner. Sideslope is defined as positive for a downward slope and negative for a upward slope (the latter commonly referred to as "backslope"). Superelevation rate transitions in a piecewise-linear manner in that it changes at a constant rate from the station at which the transition begins to the station at which the transition ends.
• Files for lane width, shoulder width, and sideslope will contain, for each change in value:
station at which change occurs (meters) new value
• The file of superelevation changes will contain, for each change in value:
station at which change begins (meters)
beginning superelevation rate (m/m)
station at which change terminates (meters)
ending superelevation rate (m/m)
Terrain
Sufficient terrain information will be provided to facilitate computation of horizontal sight distance.
Traffic Controls
Expected to be available during the latter design phases, this file will indicate the placement of traffic signals and the placement and content of speed advisories (signs). Stop signs will be represented as advisories indicating a recommended speed of O. Segments having pavement markings will also be identified by noting the places where markings change.
• The traffic signal file will contain, for each signal:
station (meters)
offset (L for left, R for right)
• The speed advisory file will contain, for each advisory:
station (meters)
offset (L, R)
55
recommended speed (km/h)
• The pavement marking file will contain, for each change of state
station (m)
status of the edge lines ("A" for absent, "S" for solid line)
status of the centerline ("A" for absent, "B" for broken single line implying passing allowed, "SS" for double solid line implying passing not allowed in either direction, "SB" for solidlbroken combination implying passing allowed only in the direction of increasing station, and "BS" for broken/solid combination implying passing allowed only in the direction of decreasing station)
Avoidable Obstacles
The file of avoidable obstacles (i.e., obstacles blocking own lane but not opposing lane) will contain the following information for each obstacle: station where obstacle commences (meters) and length of obstacle along path of travel (meters).
Reference Data
None
Dynamic Inputs
The outputs of the Vehicle Dynamics Module (described later in this chapter) will serve as dynamic inputs to the Geometrics Module.
Outputs Current (local) values of the following variables will be provided
grade (m/m)
superelevation rate (m/m)
roadway curvature (rad/m)
sight distance (m)
station (m)
speed (m/s)
lateral path displacement from lane center (m)
heading relative to road tangent (radians)
effective vehicle path curvature relative to road curvature (rad/m)
longitudinal acceleration (m/s:)
lateral acceleration (m/s2)
The following profile information will be made available between current location and sight distance:
56
• F or each horizontal tangent segment:
lane width (m)
shoulder width (m)
status of edge lines ("A", "S")
status of centerline ("A" "B" "ss" "SB" "BS") , , , ,
• F or each horizontal curve segment:
lane width (m)
shoulder width (m)
status of edge lines ("A", "S")
status of centerline ("A" "B" "ss" "SB" "BS") , , , , distance from the current vehicle location to the beginning of the next curve (m).
degree of curvature (rad/m)
length of curve (m)
• For each event requiring a full stop:
distance ahead (m)
• For each non-zero speed advisory:
distance ahead (m)
speed advised (m/s)
• For each traffic signal: distance ahead (m)
state ("R", "A", "G")
• F or each obstacle: distance ahead (m)
length along travel path (m)
RANDOM PROCESSES MODULE
Purpose
The Random Processes Module generates disturbances to the vehicle that can be modeled as random processes. One or more processes of this type is necessary to induce realistic (presumably small) lateral path deviations on long, flat, tangent sections. To the extent that desired speed is influenced by the driver's comfort level in terms of path errors induced by highspeed driving, these process will have a bearing on the speed selection component of the Driver Performance Module.
Processing
Two kinds of disturbance inputs are suggested: road roughness and wind. Road roughness accounts for lateral forces acting on the vehicle due to unevenness in the road surface. As noted above, The Geometries Module provides road inputs that influence vehicle motion and are part of
57
the highway design data base (ie, grade and superelevation rate). Other sources of randomness that operate in a similar manner, such as play in the steering angle, can be modeled in a manner similar to road roughness or incorporated along with road roughness into a single model. Such models might be represented as simple linear systems driven by Gaussian noise sequences. The independent parameters on these models, which may be speed-dependent, are bandwidth and standard deviation of the resulting lateral force.
Wind inputs include steady winds and wind gusts that apply lateral force to the vehicle. In general, wind represents a small influence on lane keeping and might well be omitted from early implementations of the DVM. Nevertheless, wind is recommended for consideration as an element of the eventual full-scale DVM to account for the occasional situations (e.g., mountain passes) where tunnel-like effects can result in significant wind amplitudes. In the most general case, wind should be considered as the summation of a steady component and a zero-mean variable ("gust") component. If the gust component is modeled as a noise-driven linear system, independent parameters are mean wind, standard deviation of the gust amplitude, and gust bandwidth Most likely, non-zero wind will be defined for selected short segments of the highway project.
Inclusion of these disturbances in the DVM may require modification of the existing vehicle dynamics models to account properly for their effects of vehicle motion.
Static Inputs road roughness (low, moderate)
wind (calm, moderate, severe)
Reference Data road roughness
Standard deviation of amplitude (newtons)
bandwidth (hertz)
wind
mean velocity (m/s)
gust bandwidth (hertz)
Dynamic Inputs none
Outputs wind velocity (m/s)
side force due to roughness (newtons)
58
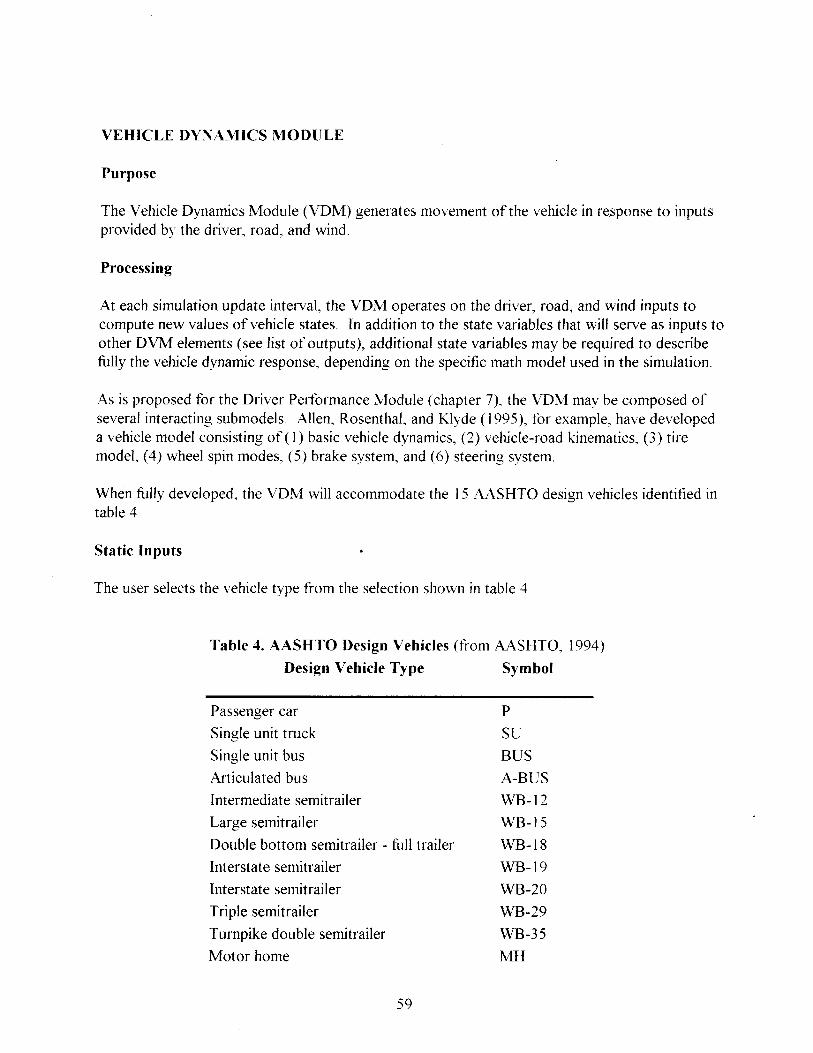
VEHICLE DYNAMICS MODULE
Purpose
The Vehicle Dynamics Module (VDM) generates movement of the vehicle in response to inputs provided by the driver, road, and wind.
Processing
At each simulation update interval, the VDM operates on the driver, road, and wind inputs to compute new values of vehicle states. In addition to the state variables that will serve as inputs to other DVM elements (see list of outputs), additional state variables may be required to describe fully the vehicle dynamic response, depending on the specific math model used in the simulation.
As is proposed for the Driver Performance Module (chapter 7), the VDM may be composed of several interacting submodels. Allen, Rosenthal, and Klyde (1995), for example, have developed a vehicle model consisting of(1) basic vehicle dynamics, (2) vehicle-road kinematics, (3) tire model, (4) wheel spin modes, (5) brake system, and (6) steering system.
When fully developed, the VDM will accommodate the 15 AASHTO design vehicles identified in table 4.
Static Inputs
The user selects the vehicle type from the selection shown in table 4.
Table 4. AASHTO Design Vehicles (from AASHTO, 1994)
Design Vehicle Type Symbol
Passenger car
Single unit truck
Single unit bus
Articulated bus
Intermediate semitrailer
Large semitrailer
Double bottom semitrailer - full trailer
Interstate semitrailer
Interstate semitrailer
Triple semitrailer
Turnpike double semitrailer
Motor home
59
P
SU
BUS
A-BUS
WB-12
WB-15
WB-18
WB-19
WB-20
WB-29
WB-35
MH
Car and camper trailer
Car and boat trailer
Motor home and boat trailer
PIT
P/B
MHIB
In addition, we suggest that a user acting as "developer" be provided the capability to "customize" one or more vehicles through modification of the underlying vehicle parameters, and that such customized vehicles appear in the menu of vehicle types.
Reference Data
Values for the independent parameters corresponding to the AASHTO vehicle types must be specified. The parameter set will vary somewhat according to the specific model forms that are implemented for the various design vehicles. Examples of the independent vehicle model parameters are provided by Allen, Rosenthal, and Klyde (1995) and Sayers and Mink (1995).
Dynamic Inputs
The dynamic inputs required by the VDM, organized by source module, are:
Geometrics Module:
grade (rn/m)
superelevation rate (rn/m)
Random Process Module:
road roughness disturbance (newtons)
cross-wind amplitude (meters/sec)
Driver Performance Module
steering wheel deflection (radians)
brake pedal force or displacement (newtons or meters)
accelerator pedal displacement (meters)
Outputs station (meters)
speed (meters/sec)
location north (meters)
location east (meters)
heading (radians)
tum rate (rad/sec)
longitudinal acceleration (meters/sec')
normal force at each wheel (newtons)
60
RUN-TIME DATA PROCESSING MODULE
Purpose
This module stores data generated by the simulation in the IHSDM data base, displays summary statistics to the user at the end of the simulation run and, at the user's option, provides visualization of selected variables while the simulation is in progress.
Processing
Data are automatically recorded in the IHSDM data base as the simulation unfolds. Three types of files will be created. One or more "periodic" files will store, at the recording interval specified by the user, samples of time histories of important system variables such as vehicle states and driver control inputs. One or more "event" files will store non-periodically occurring events such as changes in the states of traffic lights and times of initiation of skidding. One or more "results" files will store summary statistics.
This module will automatically compute indices of skid and rollover potential. The user will specifY criterion values for these variables. At the end of the run, the fraction of time that these criteria are exceeded will be displayed on the user's terminal and stored in a results file. The user may also specifY additional variables and their associated criteria for computation and display of summary results.
The user will have the option to obtain an animation or other dynamic display while the simulation is in progress, or to have no dynamic display. A single animation is suggested for the initial implementation: a driver's-eye view of a simplified rendition of the scene ahead. Subsequent implementations may be expanded to include cultural features in the visual scene and to allow a choice of viewpoints. (See Allen, Rosenthal, and Klyde (1995) for some of the ramifications involved in providing sophisticated animation capabilities.)
If the user elects to view an X -Y plot, the user must select one or more pairs of X and Y variables and the scale factors for plotting.
Static Inputs
The user selects one the of following options for runtime display:
none
driver's eye view
X-Y plot
If X -Y plot is selected, the user specifies:
names of the X and Y variables for each plot
minimum and maximum X values plotted
minimum and maximum Y values plotted
61
Criterion values are specified for the following variables
rollover index
skid index
other variables specified by the user
Reference Data recording interval
Outputs
At each recording update interval, continuous system variables of interest will be stored in one or more "periodic files" residing in the IHSDM Data Base. The variables so recorded will be sufficient to facilitate post-processing visualization and analysis of the simulation data.
Some experience with an operating DVM will be needed to determine the optimal data set The following variables are recommended for the initial implementation:
Baseline
time since initiation (s)
station (m)
Highway:
location north (m)
location east (m) elevation (m)
curvature (radians/m)
grade (rnlm)
superelevation rate (rnlm)
sight distance (m)
Vehicle:
speed (rnls)
longitudinal acceleration (rnI s:)
lateral acceleration (rnls:)
vertical forces applied to each of the wheels (newtons)
Error terms:
displacement from lane center (m)
heading relative to road tangent (radians)
drift rate (rnls)
curvature error (radians/m)
62
Driver:
desired speed (m/s)
desired acceleration (m/s1)
steering wheel deflection (radians)
brake force or deflection (newtons or m)
accelerator deflection (m)
attention to driving task (logical)
Should the Perceptual element of the Driver Performance Module account for perceptual errors, the driver's instantaneous estimates (and possibly I-sigma confidence bounds) of key variables might be included in this output data stream.
The following non-periodic events will be recorded in one or more "event files." Each file record will indicate the information needed to describe the event and its time of occurrence:
decision to regulate speed
decision to regulate acceleration
lane-change decision
change in state of traffic signal
passage of speed advisory
arrival at beginning of obstacle
passage of an obstacle
change in status of pavement markings . change in lane width
change in shoulder width
Summary statistics will be displayed to the user at the end of the run and saved in one or more "results files" for the rollover index and the skid index. Data recorded for these variables are:
criterion values
fraction of time in exceedance of criterion value
Summary statistics will be displayed and saved for additional variables, if any, specified by the user. Data recorded for each variable are:
variable name
criterion value
fraction of time in exceedance of criterion value
mean
standard deviation
a list of locations (stations) where criterion was exceeded
At the user's option, dynamic results will be displayed during the course of the simulation as described above.
63
Dynamic Inputs
In principle, all of the outputs generated by the Geometrics Module, the Vehicle Dynamics Module, and the Driver Performance Module are available as dynamic inputs to this module. As experience with using the DVM is gained, the set of inputs may be paired down to those that are relevant to the outputs of interest.
POST PROCESSING MODULE
Purpose
This module allows the user to review and analyze the results of previous simulations.
Processing
This module is effectively a "stand-alone" module in that its input is obtained entirely from the IHSDM data base and from the user. Its functionality is similar to that of the Run-Time Data Processing Module, except that no continuous data or events are recorded. Newly-computed performance statistics, however, may be saved in the IHSDM data base.
Because the data have all been previously recorded, the user has control over the speed at which animation results are displayed (subject to the computational limitations of the graphics system).
Static Inputs
User-provided inputs are as described for the Run-Time Data Processing Module, with the following additions:
name of the project (highway) to be examined
station at which analysis begins (meters)
station at which analysis ends (meters)
playback speed (fraction of real time)
Reference Data
None
Outputs
This module will be capable of computing, displaying, and saving summary results as described for the Run-Time Data Processing Module.
The capability to display X-Y plots will be as described above. Animation playback will also be available as described above, except the playback speed will be as dictated by the user.
64
Dynamic Inputs
None
MONTE-CARLO ANALYSIS
The user will have the capability to perform "Monte Carlo" analysis by repeating the simulation with different random number seeds to simulate within-driver run-to-run variability. The results of multiple runs would then be analyzed by the Post-Processing Module to compute across-trial performance statistics.
There are a number of ways Monte Carlo analysis can be mechanized:
1. To perform a short series of trials, the user manually selects a new random number seed and repeats the simulation.
2. To perform a long series of trials, the user specifies the initial random number seed and the number of trials to be performed. The DVM then automatically performs the set of trials, incrementing the seed by I on each successive interval.
3. Alternatively, if the user does not want automatic selection of the random number seed, the DVM obtains the sequence of random number seeds from a file previously prepared by the user.
Modifications will be needed to the DVM design as described in this report to accommodate the second and third options, including automatic naming of output data files
SUMMARY
Specifications were provided for a Driver/Vehicle Module (DVM) that consists of six major functional elements: (I) Geometrics, (2) Random Processes, (3) Vehicle Dynamics Module, (4) Driver Performance Module, (5) Runtime Data Processing, and (6) Post Processing. Specifications are also provided for the Highway Design Data Base - the IHSDM-compatible design data base to be produced by the CADD-based Highway Design System.
The Geometrics Module converts location-based highway design data into time-based inputs, computes "error" terms, and otherwise serves as a data conditioner for the remaining modules. The Random Processes Module provides wind- and road-related inputs that are best modeled as random processes. The Vehicle Dynamics Module computes vehicle location and orientation, and the Driver Performance Module computes steering, braking, and accelerator inputs. The Runtime Data Processing Module provides long-term storage of simulation results, a display of end-of-trial performance measures, and an on-screen visualization of simulation progress. The PostProcessing Module allows playback and further analysis of simulation results.
65
Three categories of input information were defined: (1) dynamic inputs. which are internal to the DVM and are potentially modified every simulation update interval; (2) static inputs, which are project-dependent and are specified by the user or provided by the highway design data base prior to the start of a simulation run and remain constant during a run; and (3) reference data, which quantify the underlying independent model parameters and are generally project-independent. Purpose, processing requirements, static inputs, reference data, dynamic inputs, and outputs were also specified for the DVM as a whole and for each of the major subcomponents, except for the Driver Performance Module, which is reviewed separately in the following chapter.
66
7. DESIGN SPECIFICATIONS FOR THE DRIVER PERFORMANCE l\cl0DULE
(DPM)
In this chapter processing and data requirements are specified for the Driver Performance Module. The flow of information among the major functional elements of DPM is shown in figure 5 This module has four major functional elements: (I) Perception, (2) Speed and Path Decision, (3) Speed Control, and (4) Path Control. The arrows indicate the flow of dynamic information. The types of processing performed by these modules will depend on the level of analysis selected by the user. Discussed here are the methods of operation for the highest level of analysis where the DPM performs all decision and control activities.
When fully developed, the Perception module will translate the physical description of the situation contained in the driver input data base into estimates of vehicle states, roadway characteristics, and other relevant variables needed by the decision and control modules. These estimates will be suitably degraded as a result of driver information-processing limitations. Should a perceptual processor of this sophistication not be available for the initial implementation of the DVM, a degenerate Perception module can be defined in which all cues derived by the Geometries module are made directly available to other DPM modules.
The Decision module is responsible for computing the driver's desired speed and path profiles. The desired speed profile will typically be ( I ) maintain a constant speed, (2) generate a deceleration or acceleration profile appropriate to entering or exiting a curve, (3) decelerate because of a condition such as an obstacle or traffic signal that requires reducing speed or coming to a full stop, or (4) accelerate to resume speed after the slow or stop requirement is no longer relevant. The desired path profile is envisioned to be limited to ( I) maintain center lane position, or (2) perform a double lane change to avoid an obstacle and return to original lane. ("Low level" decisions associated with vehicle control - such as deciding whether the current lane position error is sufficiently large to warrant a corrective maneuver - will be handled by the control modules.)
The speed and path control modules perform the closed-loop tracking tasks of regulating speed and path about the profiles produced by the high-level decision module. Because lateral deviation generally requires substantially tighter control than speed deviation in the absence of traffic, separate modules for the two regulation tasks are proposed to facilitate different modeling approaches and to otherwise allow independent development for speed and path control models. The two models will be partially coupled in the sense that speed will serve as a (time-varying) parameter of the path regulation model.
TOP-LEVEL REQUIREMENTS
Top-level requirements and design specifications for the component elements of the DPM are relevant to "level 3" operation in which the DPM simulates all relevant decision and control activity by the driver. Operation of the DPM and DVM at lower levels of model authority are described later in this chapter.
67
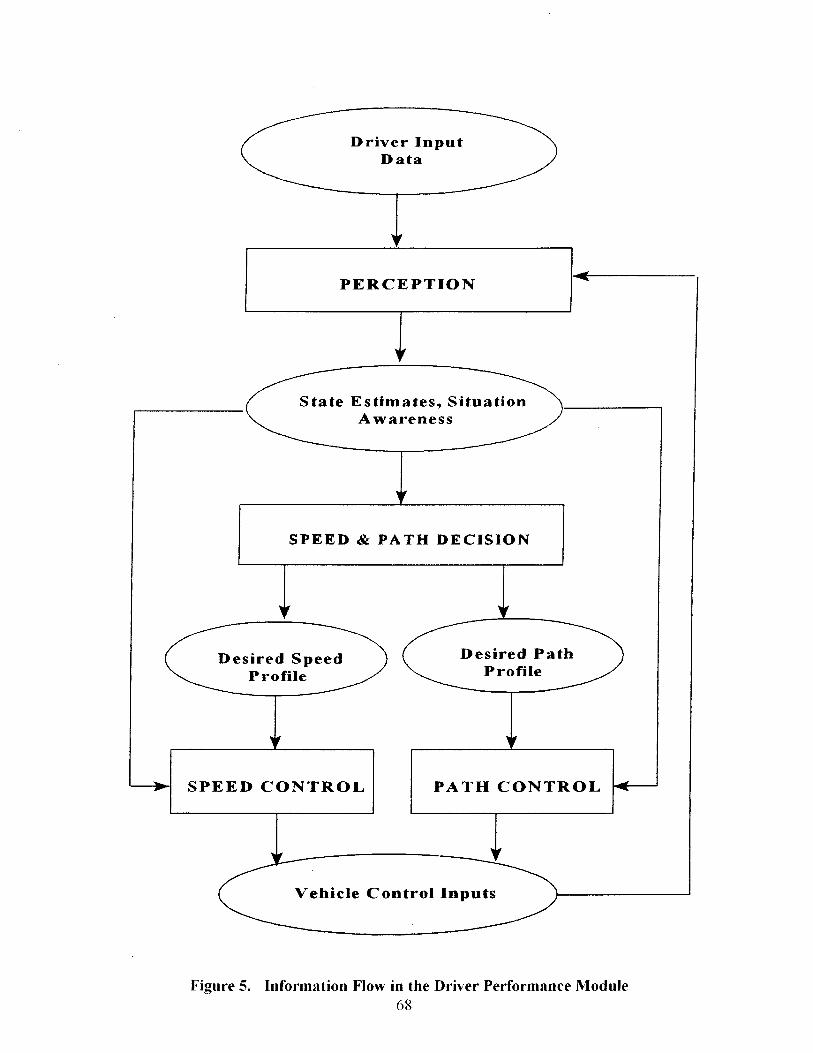
Driver Input Data
PERCEPTION
State Estimates, Situation Awareness
SPEED & PA TH DECISION
Desired Speed Profile
SPEED CONTROL
Desired Path Profile
PATH CONTROL
Vehicle Control Inputs
Figure 5. Information Flow in the Driver Performance Module 68
Static inputs and reference data pertaining to the Driver/Vehicle Module as a whole (including the DPM) have been defined in chapter 6. The following specifications indicate which categories of static and reference data are relevant to the module being discussed. Requirements for dynamic inputs and for outputs are specified in detail for each module.
Purpose
The DPM simulates the driver's perceptual, cognitive, and control processes to generate steering, braking, and acceleration inputs.
Processing
At each simulation update interval, the Perception module operates on the Driver Input Data to yield estimates of state variables and other informational quantities needed by the decision and control modules. Operating on these estimates, the Speed and Path Decision module generates a desired speed (or acceleration) profile and a desired path profile. The Speed Control and Path Control modules operate on the relevant information provided by the Perception module to best achieve the profiles generated by the Decision module.
The driver - even the novice driver -is assumed to understand the objective of the driving task and to know how to steer, brake, and accelerate the vehicle. Accordingly, whether or not the formalisms of optimal control and estimation theory are employed, all model elements are to reflect the philosophy of optimal performance in the sense of using appropriate methods to achieve reasonable goals in the presence of human information-processing limitations. For example, the model should not attempt to compute a speed profile that is "known" to exceed available friction on a curve or generate a control strategy that is dynamically unstable. All modules will employ methods that are ( I ) known to be appropriate to good decision-making and to the control of dynamic systems, and (2) consistent with human psychomotor behavior in general and driving behavior in particular
Relevant Static Inputs analysis methods
driving environment
vehicle
driver
simulation control
Relevant Reference Data driving environment
vehicle
all driver parameters
simulation control
69

Dynamic Inputs
All dynamic inputs to the DPM are obtained from the Driver Input Data created by the Geometries Module of the DVM and are thus identical to the outputs of the Geometries Module. Two types of data are needed: "current" values of variables applicable to the current time (e.g., speed, heading) or the vehicle's current location along the roadway (e.g., station, curvature), and "profile" data which typically contain multiple values relevant to different distances ahead of the present location. Required input data are:
Current (local) values:
grade (m/m)
superelevation rate (m/m)
roadway curvature (rad/m)
Sight distance (meters)
station (meters)
speed (m/s)
lateral path displacement from lane center (meters)
heading relative to road tangent (radians)
effective vehicle path curvature relative to road curvature (rad/m)
longitudinal acceleration (m/s')
lateral acceleration (m/ s')
Profile information between current location and sight distance
F or each horizontal tangent segment:
lane width (meters)
shoulder width (meters)
presence oflane markings (logical)
F or each horizontal curve segment:
lane width (meters)
shoulder width (meters)
presence oflane markings (logical)
distance ahead where curve commences (meters)
degree of curvature (rad/m)
length of curve (meters)
status of edge lines ("A", "S")
status of centerline ("A", "B", "SS", "SB", "BS")
For each event requiring a full stop:
distance ahead (meters)
For each non-zero speed advisory:
distance ahead (meters)
speed advised (m/s)
70

For each traffic signal:
distance ahead (meters)
state ("R", "A", "G")
F or each obstacle:
distance ahead (meters)
length along travel path (meters)
Outputs
The DPM will, at a minimum, provide the following outputs:
desired speed (mJs)
desired acceleration (mJs')
steering wheel deflection (radians)
brake force or deflection (ne\\tons or meters)
accelerator deflection (meters)
attention to driving task (logical)
Should the Perceptual element of the Driver Performance Module account for perceptual errors, the driver's instantaneous estimates (and possibly I-sigma estimation errors) of key variables might be provided as additional outputs
PERCEPTION MODULE
Purpose
The Perception module translates the physical description of the situation contained in the driver input data base into estimates of vehicle states, roadway characteristics, and other relevant variables needed by the decision and control modules.
Processing
Because development, validation, and implementation of this module are expected to require more time than implementation of decision and control algorithms (which are currently available for initial implementation), a degraded implementation may be desired for an initial implementation of the DVM in which all relevant variables generated by the Geometrics Module of the DVM are simply passed along uncorrupted to the other modules. This approach will facilitate initial test and development of the proposed model structure, and further development and validation of the decision and control modules.
Before the IHSDM is deployed for field use, however, a psychologically-based Perception module must be implemented so that the effects of the driving environment (other than geometry) and the driver's own limitations can be explored. Such a capability is needed to evaluate effects such as:
71
Misjudgment of safe speeds in curves due to errors in estimating vehicle speed, distance of the curve ahead, degree of curvature, etc.
• Limited visibility ahead due to weather and nighttime conditions.
• Influence of lane markings in judging position of the lane edge and estimating the behavior of the road ahead.
Degradation in visual, cognitive, and control capabilities due to age.
• Errors in judgment resulting from substance abuse.
• Familiarity with the roadway.
The Perception module will, for each simulation interval, generate estimates of the current values of system variables needed by the other DP~1 modules and, if supported by the algorithms implemented. a measure of the uncertainty or reliability - such as a I -sigma confidence bounds -for each such estimate. For variables where a "profile" is needed (e.g., parameters of all curved segments within the sight distance), estimates as a function of distance ahead will be generated. Candidate algorithms for the estimation process are discussed in chapter 9.
To the extent that driver/vehicle response is significantly influenced, the following factors should be accounted for in the Perception module
Processing Delay. All psychologically-based models of human performance include some form of processing delay, often referred to as "reaction time" or "time delay." Delays of this sort are presumably associated with all of the human's mental and physical processes associated with perceiving, interpreting, and responding to stimuli. When modeling human behavior, one is generally interested only in the total delay, and the total delay can usually be considered as arising entirely at anyone point in the information-processing stream without loss of modeling accuracy. Because the proposed model structure treats some of the decision making separately from regulatory control actions, we suggest that delays due to perceptual and cognitive activities be lumped together as a perceptual delay. Delays clearly associated with limb movement (e.g., time to move the right foot from the accelerator pedal to the brake pedal) might more properly be included in the control modules.
• Perceptual Resolution Limits. Often referred to as a visual "threshold," there is a lower limit to which any perceptual stimulus can be resolved. For example, the ability to judge the curvature of a highway segment well ahead of the driver may be limited in this manner.
• Magnitude-Dependent Estimation Errors. As noted in chapter 6 (Top-Level Requirements, Reference Data), there is evidence that the error in estimating the magnitude of an abovethreshold stimulus scales statistically with the magnitude of the stimulus. A model for the human controller incorporating this philosophy has yielded results consistent with this hypothesis (Levison, 1971). In effect, we assume here that the driver processes data with a
72
consistent relative or percentage error. A parameter to this effect - the "perceptual error-tomagnitude ratio" is included in the set of proposed driver limitations.
• Weather. Reduce the visibility (sight distance) according to the severity of the weather.
• Time of day. Reduce visibility for non-daytime conditions.
• Lane Markings. Absence of clearly-distinguishable lane markings, especially in conditions of weather or night, may degrade the driver's ability to judge the placement of the lane edge. Such effects are modeled as adjustments to the resolution errors associated with relevant perceptual variables.
Generation of estimation errors will involve sampling from some assumed probability distribution such as a unit-normal distribution. This sampled error is added to the value of the simulated variable to produce a corrupted estimate. Alternatives for computation of estimation errors are discussed in chapter 9.
The estimation process may be mechanized by including a random number generator in the Perception module. Such generators typically provide a real number between two values (e.g., 0.0 and 1.0), drawn from a uniform probability distribution. Each time a variable is to be estimated, one or more random numbers are obtained and processed to yield the equivalent of sampling from a unit normal distribution, and the result is scaled by the theoretical (or empirical) standard deviation of the estimation error to yield the particular sampling error. As noted in chapter 1, if a different "seed" is used to initialize the random number generator from one simulation run to the next. the effects of within-driver run-to-run variability can be explored.
Implied so far is the assumption that response variability can be accounted for entirely within the Perception module. Models for the human controller adopting this philosophy (specifically, accounting for response randomness via an "observation noise" process) have been able to match results from a variety of laboratory-type manual control tasks. Should experience with the DVM prove this assumption to be too restrictive, a similar "random noise" process may be included in the control modules to apply directly to control execution.
A model for attention is needed to account for the time the driver spends reading speed advisory signs. For the initial DVM implementation, the attention model may be treated as a function residing within the Perception module. Should complex models for attention be desired in subsequent implementations, a separate DPM module specifically devoted to the attention process may be advisable.
At the start of each simulation update interval, the attention function will determine whether the driver is attending to roadway scene cues for the purpose of exercising speed and path decision and control, or reading a sign. If attending to the roadway scene, new estimates of relevant system variables are obtained; otherwise, estimates are either held fixed, "forgotten," or continue to be updated via a "mental model" of the driving situation, depending on the specific algorithms used for obtaining estimates.
73
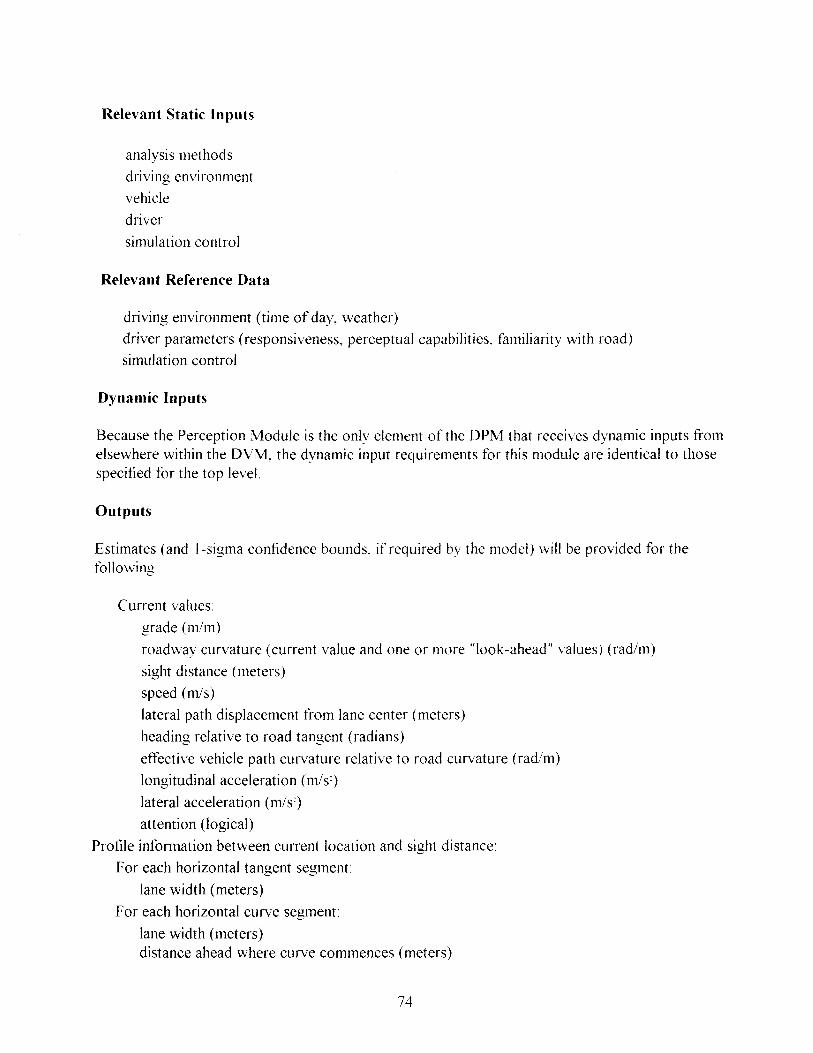
Relevant Static Inputs
analysis methods
driving environment
vehicle
driver
simulation control
Relevant Reference Data
driving environment (time of day, weather)
driver parameters (responsiveness, perceptual capabilities, familiarity with road)
simulation control
Dynamic Inputs
Because the Perception Module is the only element of the DPM that receives dynamic inputs from elsewhere within the DVM, the dynamic input requirements for this module are identical to those specified for the top level.
Outputs
Estimates (and I-sigma confidence bounds, if required by the model) will be provided for the following
Current values
grade (mlm)
roadway curvature (current value and one or more "look-ahead" values) (rad/m)
sight distance (meters)
speed (mls)
lateral path displacement from lane center (meters)
heading relative to road tangent (radians)
effective vehicle path curvature relative to road curvature (rad/m)
longitudinal acceleration (mls')
lateral acceleration (m/s')
attention (logical)
Profile information between current location and sight distance:
F or each horizontal tangent segment:
lane width (meters)
F or each horizontal curve segment:
lane width (meters) distance ahead where curve commences (meters)
74

degree of curvature (rad/m)
length of curve (meters)
F or each event requiring a full stop
distance ahead (meters)
For each non-zero speed advisory:
distance ahead (meters)
speed advised (m/s)
For each traffic signal:
distance ahead (meters)
For each obstacle:
length along travel path (meters)
SPEED AND PATH DECISION MODULE
Purpose
The primary function of this module is to compute the driver's desired speed, acceleration, and path profiles. These speed and path requirements will be transmitted to the speed and path control modules for appropriate regulatory action
Processing
Requirements are given here for a "human-centered" model in which desired speed and path profiles are determined by the driver based on his/her perceptions of key environmental variables. An alternative existing regression model based on observed driving behavior is reviewed in chapter 9.
At each simulation update interval defined for this module, the driver is assumed to assess the situation to determine desired speed and path. The two mutually-exclusive generic speed decisions are (1) decelerate so that a specific lesser speed is attained when the vehicle reaches a specific station ahead, and (2) achieve and maintain a steady-state speed appropriate to travel on long tangents. The allowable path decisions are (J ) achieve and maintain center position in own lane, and (2) achieve and maintain center position in opposing lane when avoiding an obstacle in own lane.
The following behavior is assumed:
1. The road ahead is examined to identity and qua:1tity events that dictate a speed reduction. These events include curved roadway segments, stop signs, red traffic lights, and speed advisories.
2. If the allowable speed determined by events ahead is less than the current speed, the driver decides whether it is necessary to implement a speed reduction now or later. If now, an appropriate deceleration profile is determined and passed to the speed control module.
75
3. If the sight distance is limited to the extent that events beyond that distance, if seen, could influence the choice of speed, the driver adopts one of the following strategies, depending on the driver type:
a. Assume that there are no such events beyond the sight distance (equivalent to assuming a long tangent section beyond visual range.)
b. Assume that the statistics of the road geometry beyond visual range are the same as the road just traveled and within view
c. Assume that a requirement to stop exists just beyond visual range.
4. If there is no need to slow down, the driver determines a desired speed based on preferences (e.g., stay within the speed limit, travel 15 km/h faster than the speed limit) and/or some measure of comfort level determined by the steering task (e.g., keep lateral path errors and/or steering workload within desired limits) The desired (steady-state) speed is passed to the speed control module.
5. The road ahead is examined to determine the location of the nearest avoidable obstacle, if any. (An avoidable obstacle blocks only the travel lane and may be safely passed by traveling temporarily in the adjacent oncoming lane. An obstacle that blocks both lanes is treated as though it were a stop sign.)
6. If there is no obstacle, or if the obstacle is too far away to warrant an avoidance maneuver (ie. lane-change), indicate to the path-control model to maintain center position in own lane.
7. If the obstacle is close enough to initiate or continue an obstacle-avoidance maneuver. or if the obstacle has signitlcant length along the direction of travel and is alongside the vehicle, indicate to the path control model to maintain center position in opposing lane.
A decision model will be implemented to reflect the above assumptions. "Examination" of the road ahead will be accomplished by sequencing through lists of relevant events such as curved segments, stop signs, etc. as discussed above. In order to account for the driver's informationprocessing limitations, variables contained in these lists, along with all other estimated variables, should include corrupted estimates (and contldence bounds ifused by the model) determined by the perception module.
No new decisions are reached during periods of inattention to roadway cues.
Relevant Static Inputs analysis methods
driving environment (road surface)
vehicle
driver (aggressiveness, familiarity)
76
Relevant Reference Data driving environment (aggressiveness)
vehicle (available mction)
driver parameters (aggressiveness, familiarity)
simulation control
Dynamic Inputs
The dynamic inputs required by this module are provided by the Perception module and consist of estimates of the following variables:
Current values:
speed
acceleration
sight distance
attention
For each horizontal curve segment:
lane width distance ahead where curve commences (meters)
degree of curvature (rad/m)
length of curve (meters)
For each event requiring a full stop
distance ahead (meters)
For each non-zero speed advisory
distance ahead (meters)
speed advised (m/s)
For each traffic signal:
distance ahead (meters)
state ("R," "A," "G")
For each obstacle:
distance ahead (meters)
length along travel path (meters)
Outputs indication as to whether speed or deceleration is to be regulated
desired speed or deceleration
desired lane (own or opposing)
77
SPEED CONTROL MODULE
Purpose
The Speed Control module generates appropriate accelerator and braking responses in an attempt to follow the desired speed or deceleration profile.
Processing
Speed control is based on the following assumptions:
I . At any given time, the driver is either attempting to maintain constant speed, brake with constant deceleration in order to stop or meet a requirement for reduced speed, or accelerate in an appropriate manner to achieve a desired speed once the requirements for reduced speed no longer exists.
2. Because initial implementation of the DVM is intended for exploring single-vehicle behavior in the absence of all other traffic, the accuracy and precision requirements for braking for a curve or other speed-reduction requirements are more stringent than for maintaining or increasing speed.
3. When attempting to maintain constant speed, the driver operates with respect to a minimum allowable speed error. Control action is taken only when the perceived speed deviates from the desired speed by more than the allowable speed error.
4. When attempting to maintain constant deceleration. the driver changes the braking force only when the perceived deceleration deviates from the desired deceleration by more than the allowable deceleration error.
The speed-control model will therefore include decision rules and control algorithms. The decision rules will determine whether or not a control action is required according to the above assumptions. Piecewise-constant control strategies or linear-response strategies (i.e., control laws described by linear differential equations) are recommended
For example, regulation about the desired acceleration can be modeled by an algorithm that adjusts brake pedal force in a manner proportional to the perceived acceleration error (taking account of longitudinal vehicle response dynamics), or by adopting a "move and wait" strategy in which the pedal force is changed, the vehicle attains a new deceleration, and the cycle is repeated until the desired acceleration is attained.
When regulating about a constant desired speed, given that a decision has been made to execute a control action, a decision must be made as to which control to activate. This decision is determined by the sign of the required speed change, the effect of engine braking forces, wind resistance, and the effect of gravity if the vehicle is on a grade. Once the control device has been selected, control algorithms similar to those suggested above can be employed, with regulation now being about desired speed rather than about desired deceleration.
78

When approaching a vertical curve (change in grade), the driver will anticipate the change in influence of gravity on speed by initiating a control action a short time before the curve is reached.
Once the requirement for reduced speed no longer exists (e.g., when exiting a curve), the driver will accelerate to the new desired speed at a constant acceleration as determined by driver preferences. Because the acquisition of a new, higher, speed is generally less critical than
. decelerating to meet a reduced speed requirement, the precision at which acceleration to a new speed is regulated will generally be less than the control of deceleration during braking.
Brake or acceleration pedal force and displacement remain tlxed during periods of inattention to the roadway cues.
Relevant Static Inputs vehicle
driver (responsiveness, perceptual capabilities)
Relevant Reference Data vehicle (longitudinal-axis response characteristics)
driver parameters (responsiveness, perceptual capabilities)
simulation control
Dynamic Inputs
The dynamic inputs required by the Speed Control Module, organized by source module, are
Decision Module
indication as to whether speed or deceleration is to be regulated
desired speed or deceleration
Perception Module (estimates)
speed
acceleration
roadway grade
attention
Outputs brake pedal force or displacement
accelerator pedal displacement
79
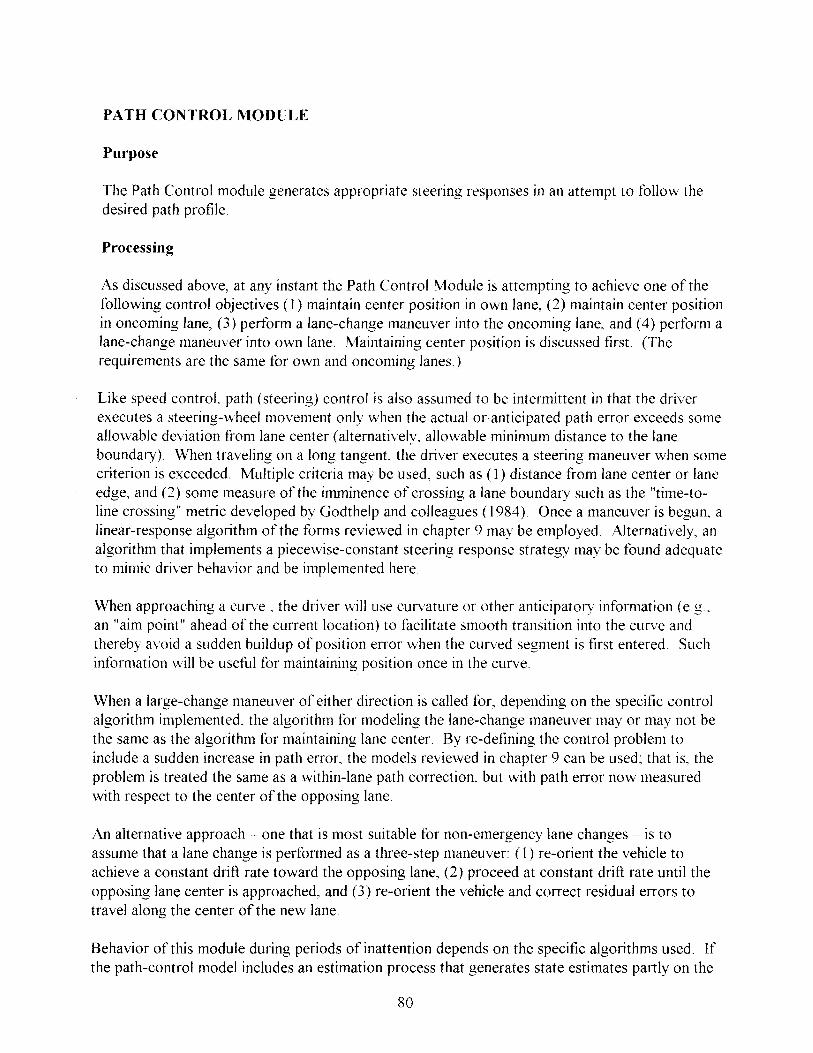
PATH CONTROL MODULE
Purpose
The Path Control module generates appropriate steering responses in an attempt to follow the desired path profile.
Processing
As discussed above, at any instant the Path Control Module is attempting to achieve one of the following control objectives (1) maintain center position in own lane, (2) maintain center position in oncoming lane, (3) perform a lane-change maneuver into the oncoming lane, and (4) perform a lane-change maneuver into own lane. Maintaining center position is discussed first. (The requirements are the same for own and oncoming lanes.)
Like speed control. path (steering) control is also assumed to be intermittent in that the driver executes a steering-wheel movement only when the actual or anticipated path error exceeds some allowable deviation from lane center (alternatively. allowable minimum distance to the lane boundary). When traveling on a long tangent, the driver executes a steering maneuver when some criterion is exceeded. Multiple criteria may be used, such as (1) distance from lane center or lane edge, and (2) some measure of the imminence of crossing a lane boundary such as the "time-toline crossing" metric developed by Godthelp and colleagues (1984) Once a maneuver is begun, a linear-response algorithm of the forms reviewed in chapter 9 may be employed. Alternatively, an algorithm that implements a piecewise-constant steering response strategy may be found adequate to mimic driver behavior and be implemented here.
When approaching a curve, the driver will use curvature or other anticipatory information (e.g .. an "aim point" ahead of the current location) to facilitate smooth transition into the curve and thereby avoid a sudden buildup of position error when the curved segment is first entered. Such information will be useful for maintaining position once in the curve.
When a large-change maneuver of either direction is called for, depending on the specific control algorithm implemented, the algorithm for modeling the lane-change maneuver mayor may not be the same as the algorithm for maintaining lane center. By re-defining the control problem to include a sudden increase in path error, the models reviewed in chapter 9 can be used; that is, the problem is treated the same as a within-lane path correction, but with path error now measured with respect to the center of the opposing lane.
An alternative approach - one that is most suitable for non-emergency lane changes - is to assume that a lane change is performed as a three-step maneuver: (1) re-orient the vehicle to achieve a constant drift rate toward the opposing lane, (2) proceed at constant drift rate until the opposing lane center is approached, and (3) re-orient the vehicle and correct residual errors to travel along the center of the new lane.
Behavior of this module during periods of inattention depends on the specific algorithms used. If the path-control model includes an estimation process that generates state estimates partly on the
80
basis of an internal model (Levison and Cramer, 1995), the model may continue to generate steering wheel movements on this basis during periods of inattention. Otherwise, steering wheel movement should cease unless a pre-programmed maneuver has been initiated, in which case the pre-programmed maneuver is completed, but residual errors are not corrected until attention is resumed.
Relevant Static Inputs driving environment (road surface)
vehicle
driver (responsiveness)
Reference Data driving environment (road surface)
vehicle (lateral-axis response characteristics)
driver parameters (responsiveness)
Dynamic Inputs
The dynamic input requirements for this module will depend to some extent on the specifics of the algorithm(s) adopted for path control. The following set should fulfill most of the requirements for whichever algorithm is selected for implementation
Decision Module
desired lane
Perception Module (estimates)
lane position
speed
heading relative to the road
turn rate relative to the road
drift rate (lateral velocity relative to road)
road curvature profile trom current location to a distance ahead corresponding to the driver/vehicle response time
lateral acceleration attention
Outputs steering wheel detlection
OPERA TION AT LOWER LEVELS OF MODEL AUTHORITY
The foregoing specifications pertain to "level 3" operation of the 0 PM in which all driver decision and control processes are simulated by the modeL Levels 1 and 2 operation, in which the model
81
does not exercise full authority, require modifications to the OPM and possibly to the Vehicle Dynamics Module (VOM) as well.
Levell: User-Specified Speed and Idealized Control
This mode is intended to allow the designer to obtain a quick look at skid and rollover potential under idealized conditions that minimize or eliminate the effects of driver limitations. The user specifies the desired speed profile (either constant speed or piecewise-linear profile), and the vehicle executes idealized control behavior. The intent is to have the vehicle follow the specified speed profile and maintain center lane position. When used in this mode, there should be no sources of external disturbance inputs such as wind and road surface active in the OVM.
If modification of the VDM is permissible, idealized speed control is realized by transmitting the desired speed profile directly to the VDM, bypassing the speed control module, and constraining the actual vehicle speed to be that specified by the user. In this case. the Speed and Path Decision module and the Speed Control module of the DPM are bypassed.
Ifmodification of the VDM is not desirable. the DPM would be modified as follows to accommodate idealized speed control
I. Treat the Perception module as a simple "pass through" in which the outputs are uncorrupted replicas of relevant inputs.
2. Enable the Speed and Path Decision module to translate the user-specified speed profile (which is defined at the beginning of the run for the entire simulation) into a currently-desired speed or acceleration/deceleration.
3. Bypass all driver-related limitations in the Speed Control model to effect a linear. continuous control strategy.
Modification of the VOM to directly generate idealized path control is more complicated than the generation of idealized speed control, because directly constraining the vehicle to track the center of the lane may require overriding the effects of lateral-axis dynamics to the point of seriously corrupting the predictions of skid and rollover potential An alternative is to operate the DPM as follows:
I. Treat the Perception module as a simple pass through as described above.
2. Constrain the Decision module to specifY that own lane is to be tracked at all times.
3. Bypass all driver-related limitations in the Path Control model to effect a linear, continuous control strategy.
82
Level 2: Model-Determined Speed and Idealized Control
This mode allows the designer to explore speed and rollover potential when the driver determines the desired speed profile, but where vehicle control is idealized. The DPM operates as follows:
1. The Perception module generates potentially error-prone estimates of the dynamic input variables used by the Speed and Path Decision module, but acts as an error-free pass through for dynamic inputs used by the two control modules.
2. The Decision module generates desired speed as in Level 3 operation, and defines the desired path to be own lane.
3. The Speed Control module operates in an idealized manner as described above for Level I operation.
4. The Path Control module operates in an idealized manner as described above for Levell operation.
SUMMARY
Specifications were provided for a Driver Performance "'1odule (DPM) that consist of four major functional elements: (1) Perception, (2) Speed and Path Decision, (3) Speed Control, and (4) Path Control. The Perception Module translates the physical description of the perceptual worlds into estimates of vehicle states, roadway characteristics, and other relevant variables needed by the decision and control modules. The Decision Module computes the driver's desired speed and path profiles, and the speed and path control modules compute the steering, braking, and accelerator responses necessary to regulate speed and path about their desired profiles.
Purpose, processing requirements, static inputs, reference data, dynamic inputs, and outputs were specified for the DPM as a whole and for each of the major sub components.
The specifications provided in this chapter pertain primarily to full-scale operation in which all driver decision and control processes are simulated by the model in a psychologically valid manner. Specifications were also provided for operation of the DPM in modes where the speed profile is provided by the user, and path and speed regulation are performed in an idealized manner.
Implementation of a valid driver model of the type specified here will require research to provide data for calibrating independent driver-related model parameters and for validating the model in terms of its ability to replicate and predict driver/vehicle performance. An initial program of research aimed at obtaining these data is discussed in chapter 10.
The following chapter describes a preliminary user interface design that supports both the DriverN ehicle Module and the Driver Performance Module as specified in this and the preceding chapters.
83

8. PRELIMINARY USER INTERFACE DESIGN
A preliminary design for the user interface to the IHSDM and the Driver/Vehicle Module is described. Illustrations of dialog boxes are provided for the top-level user interaction with the IHSDM and for subsequent interactions with the Driver/Vehicle Module (DVM). Preceding each illustration is a table describing the type, purpose, and operation of the dialog box.
To the extent possible, the presentation in this chapter parallels the concept of operation described in the preceding chapters. A user intending to perform a driver/vehicle simulation interacts with the main menu to select an IHSDM module - in this case, the DVM. A number of dialogs then occur to describe the scenario in terms of the "project" (the specific highway design data of interest); additional roadside parameters; weather, wind, and road surface conditions; driver type; vehicle type; and details on how the simulation is to be performed. The user also requests the type of results to be computed and displayed during and immediately after the simulation. The simulation is then performed, after which the user has the opportunity to have additional results computed and displayed.
A user who has the need and authority will obtain access to additional dialog boxes to facilitate modification of the underlying model parameters. Descriptions and preliminary designs of these dialog boxes are also provided. Most of these objects relate to the underlying parameters of the Driver Performance Module, and most of the associated tables contain sample numerical default values for these parameters. The specific numbers should be considered as "place holders" at this time whose main purpose is to show how the underlying numerical parameters change with changes in the qualitative top-level parameters. As development of the DVM proceeds, it is anticipated (in fact, necessary) that these default values be based on solid human performance data.
85
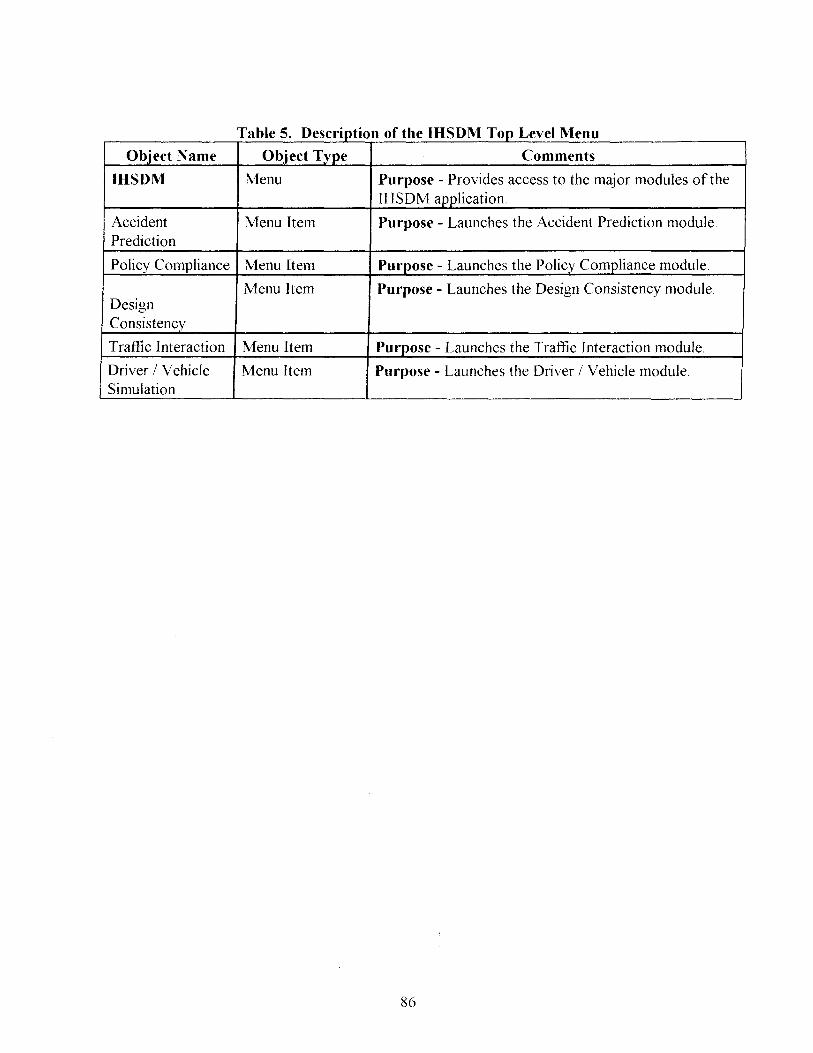
a e . T bl 5 D escnpl IOn 0 t e op eve Of f h IHSDM T LIM enu
Object Name Object Type Comments
IHSDM Menu Purpose - Provides access to the major modules of the IHSDM application.
Accident Menu Item Purpose - Launches the Accident Prediction module. Prediction
Policy Compliance Menu Item Purpose - Launches the Policy Compliance module.
Menu Item Purpose - Launches the Design Consistency module Design Consistency
Traffic Interaction Menu Item Purpose - Launches the Traffic Interaction module.
Driver / Vehicle Menu Item Purpose - Launches the Driver / Vehicle module. Simulation
86
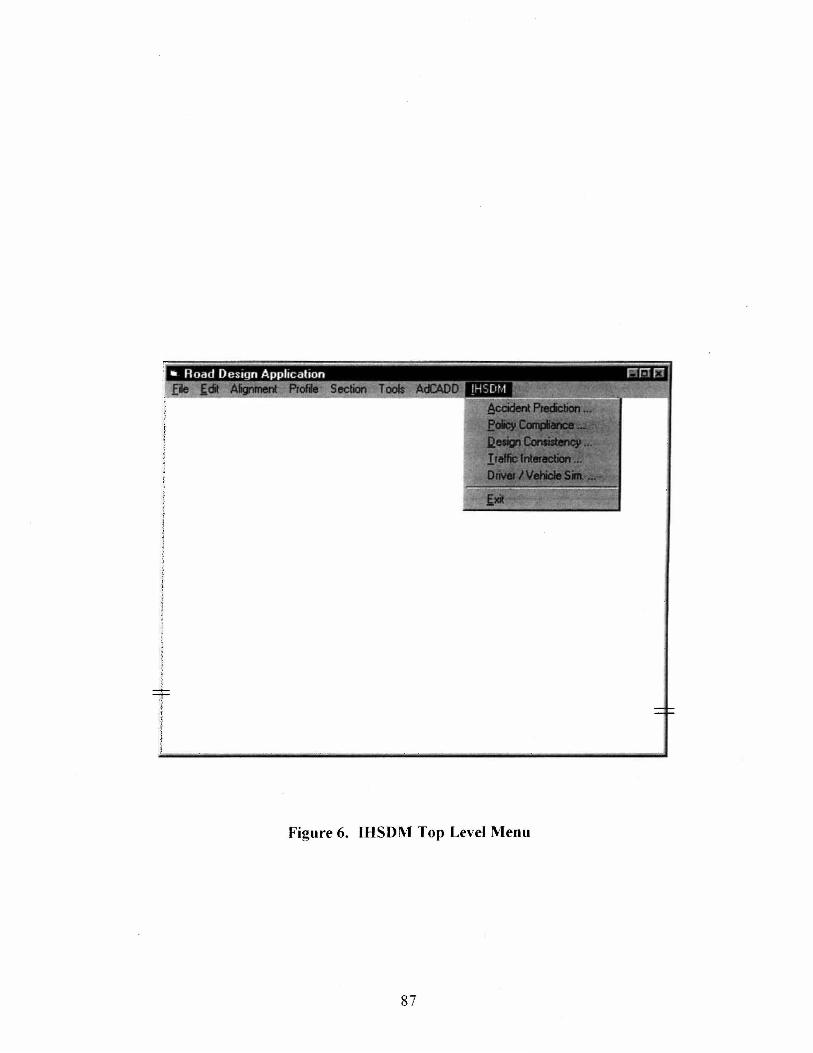
Figure 6. IHSDM Top Level Menu
87
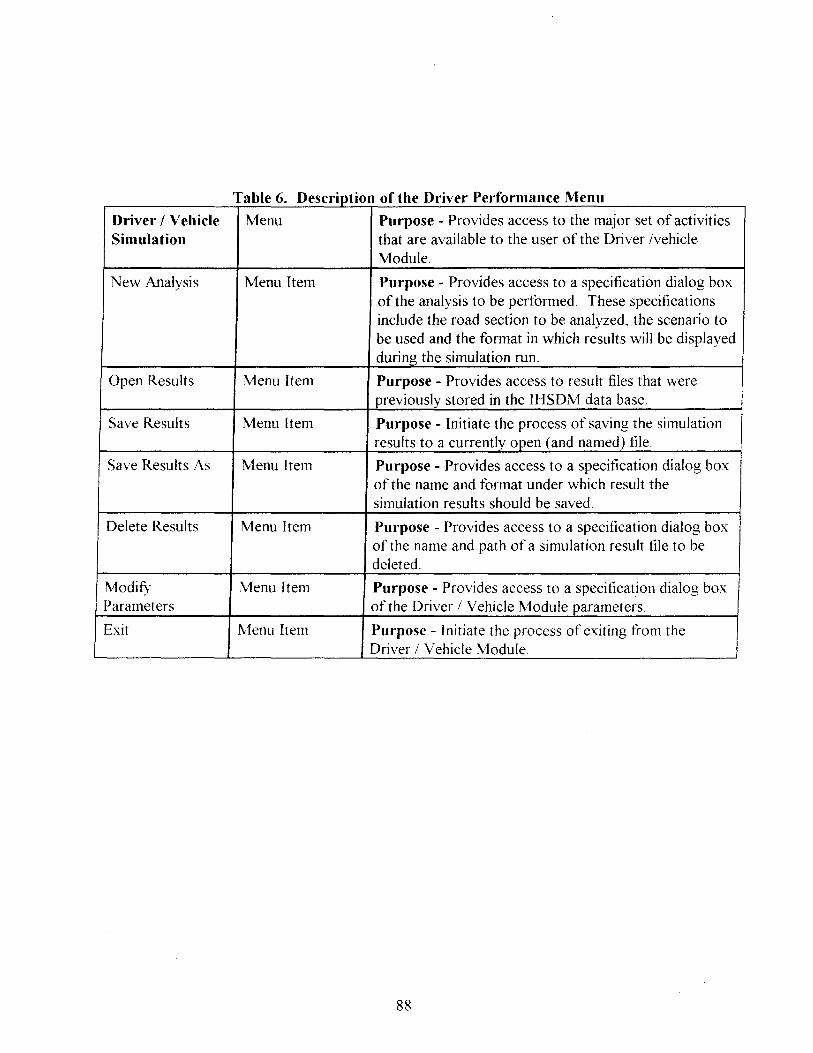
a e 0 T hi 6 D Of eSCrIpllOn 0 e rIver fth D' e ormance Prf M enu
Driver / Vehicle Menu Purpose - Provides access to the major set of activities Simulation that are available to the user of the Driver Ivehicle
Module.
New Analysis Menu Item Purpose - Provides access to a specification dialog box of the analysis to be performed. These specifications include the road section to be analyzed, the scenario to be used and the format in which results will be displayed during the simulation run.
Open Results Menu Item Purpose - Provides access to result files that were previously stored in the IHSDM data base.
Save Results Menu Item Purpose - Initiate the process of saving the simulation results to a currently open (and named) file.
Save Results As Menu Item Purpose - Provides access to a specification dialog box of the name and format under which result the simulation results should be saved
Delete Results Menu Item Purpose - Provides access to a specitication dialog box of the name and path of a simulation result file to be deleted.
ModifY Menu Item Purpose - Provides access to a specification dialog box Parameters of the Driver / Vehicle Module parameters.
Exit Menu Item Purpose - Initiate the process of exiting from the Driver / Vehicle Module.
88
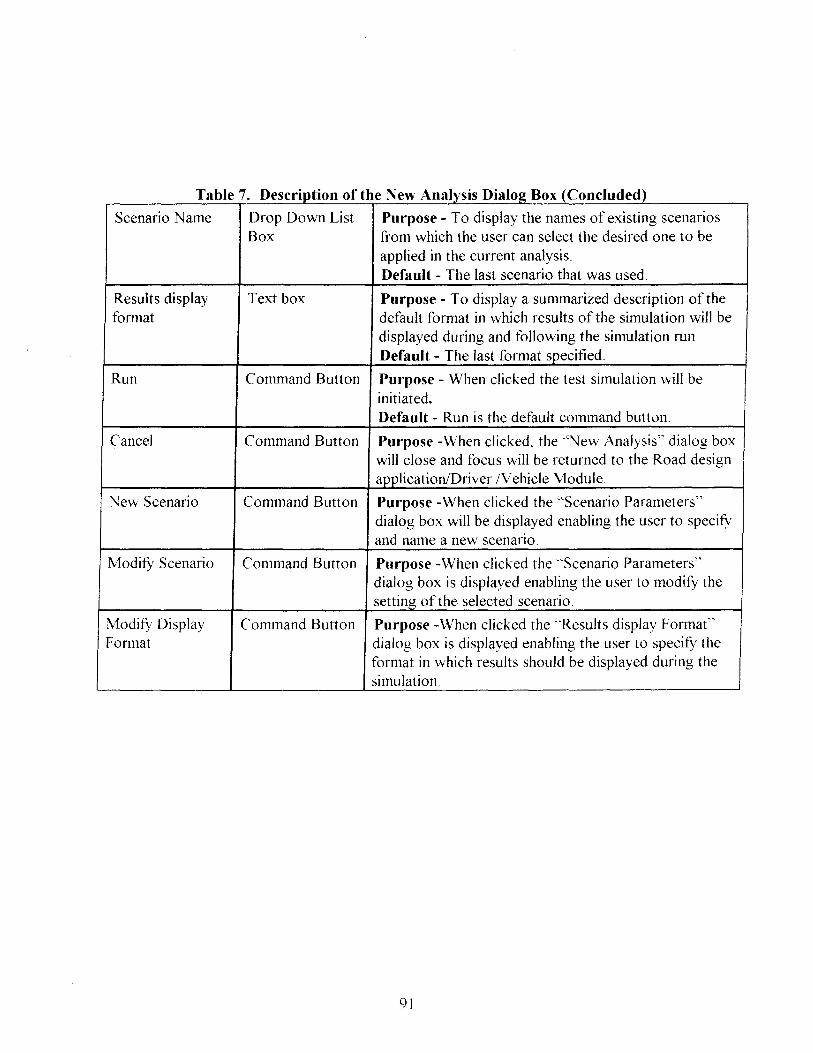
Table 7. Description of the New Analysis Dialog Box (Concluded)
Scenario Name Drop Down List Purpose - To display the names of existing scenarios Box from which the user can select the desired one to be
applied in the current analysis. Default - The last scenario that was used.
Results display Text box Purpose - To display a summarized description of the format default format in which results of the simulation will be
displayed during and following the simulation run. Default - The last format specified.
Run Command Button Purpose - When clicked the test simulation will be initiated. Default - Run is the default command button.
Cancel Command Button Purpose -When clicked, the "New Analysis" dialog box will close and focus will be returned to the Road design applicationlDriver IVehicle Module.
New Scenario Command Button Purpose -When clicked the "Scenario Parameters" dialog box will be displayed enabling the user to specifY and name a new scenario.
Modity Scenario Command Button Purpose -When clicked the "Scenario Parameters" dialog box is displayed enabling the user to modifY the setting of the selected scenario.
Modity Display Command Button Purpose -When clicked the "Results display Format" Format dialog box is displayed enabling the user to specifY the
format in which results should be displayed during the simulation
91
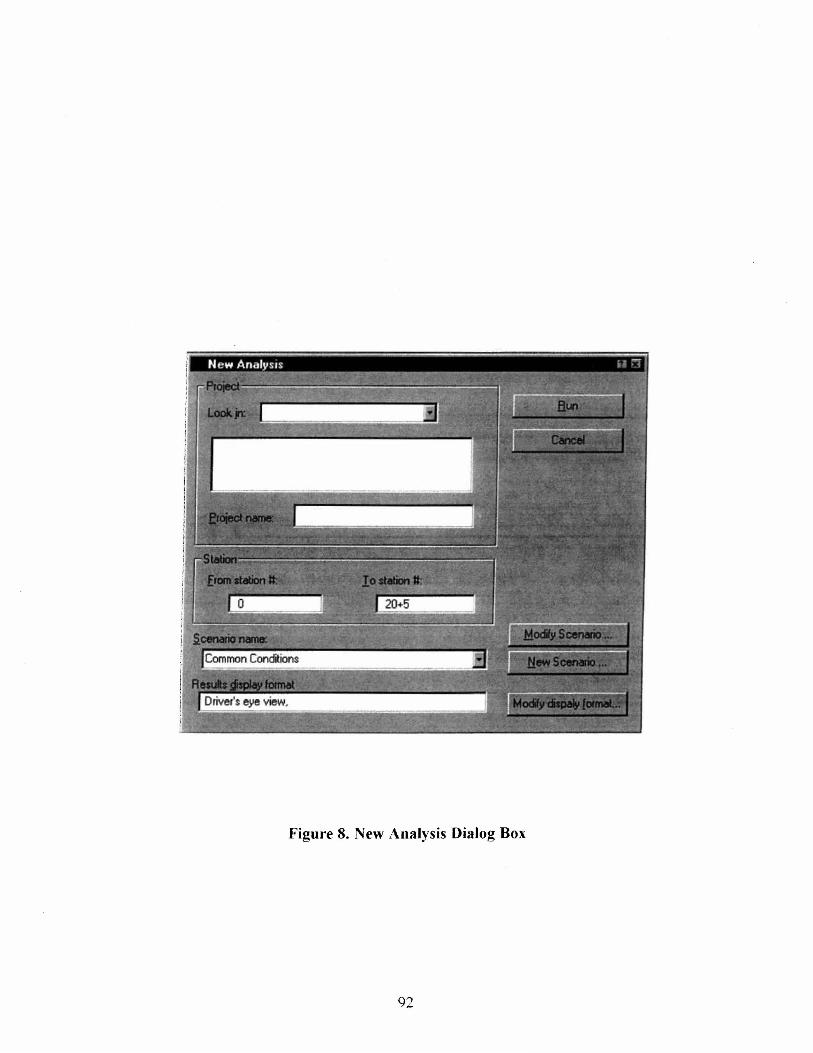
Figure 8. New Analysis Dialog Box
92
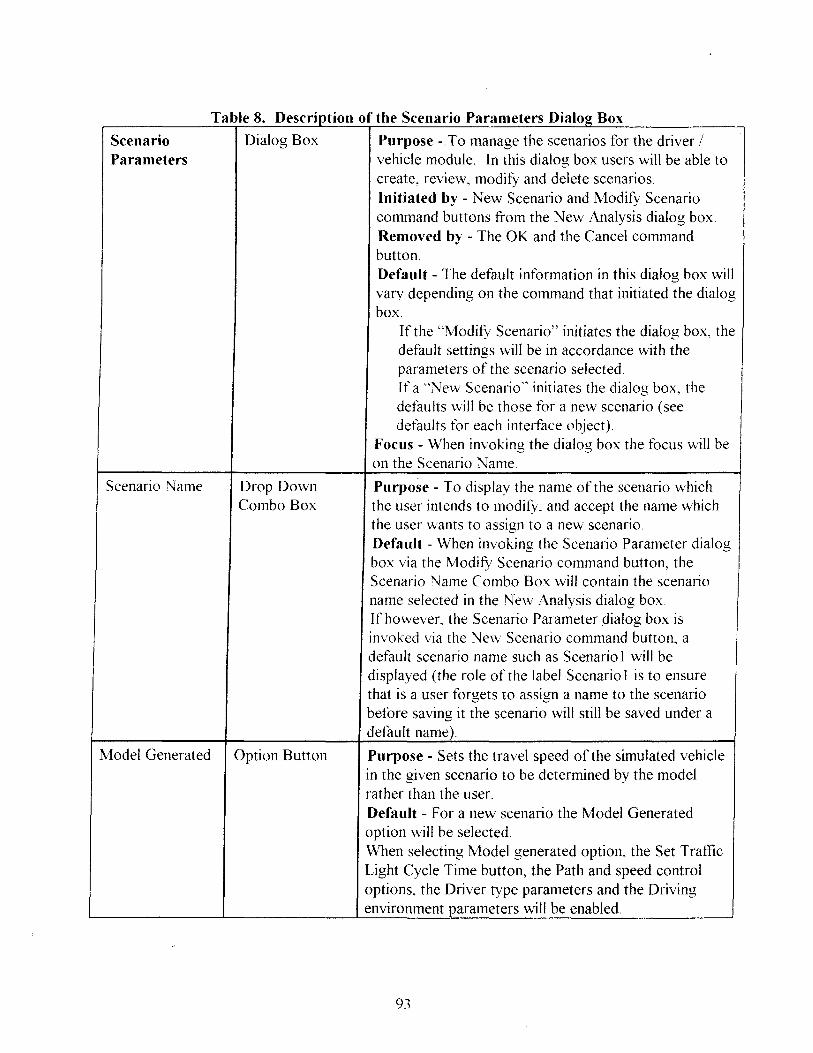
Table 8. DescrIptIOn of the Scenario Parameters Dialog Box
Scenario Dialog Box Purpose -. To manage the scenarios for the driver / Parameters vehicle module. In this dialog box users will be able to
create, review, modify and delete scenarios.
Scenario Name Drop Down Combo Box
Model Generated Option Button
Initiated by - New Scenario and Modify Scenario command buttons from the New Analysis dialog box. Removed by - The OK and the Cancel command button. Default - The default information in this dialog box will vary depending on the command that initiated the dialog box.
If the "Modify Scenario" initiates the dialog box, the default settings will be in accordance with the parameters of the scenario selected. If a "New Scenario" initiates the dialog box, the defaults will be those for a new scenario (see defaults for each interface object).
Focus - When invoking the dialog box the focus will be on the Scenario Name.
Purpose - To display the name of the scenario which the user intends to modify, and accept the name which the user wants to assign to a new scenario. Default - When invoking the Scenario Parameter dialog box via the Modify Scenario command button, the Scenario Name Combo Box will contain the scenario name selected in the New Analysis dialog box. If however, the Scenario Parameter dialog box is invoked via the New Scenario command button, a default scenario name such as Scenario I will be displayed (the role of the label Scenario I is to ensure that is a user forgets to assign a name to the scenario before saving it the scenario will still be saved under a default name).
Purpose - Sets the travel speed of the simulated vehicle in the given scenario to be determined by the model rather than the user. Default - For a new scenario the Model Generated option will be selected. When selecting Model generated option, the Set Traffic Light Cycle Time button, the Path and speed control options, the Driver type parameters and the Driving environment parameters will be enabled.
93
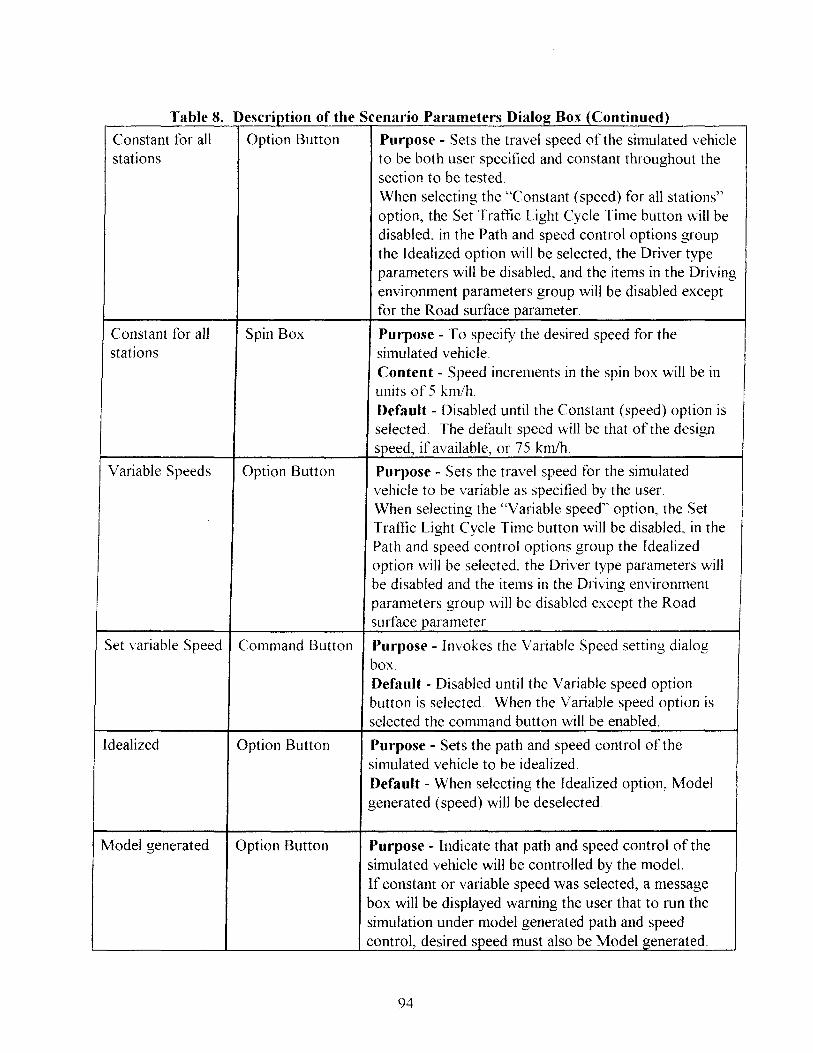
Table 8. Description of the Scenario Parameters Dialog Box (Continued)
Constant for all Option Button Purpose - Sets the travel speed of the simulated vehicle stations to be both user specified and constant throughout the
section to be tested. When selecting the "Constant (speed) for all stations" option, the Set Traffic Light Cycle Time button will be disabled, in the Path and speed control options group the Idealized option will be selected, the Driver type parameters will be disabled, and the items in the Driving environment parameters group will be disabled except for the Road surface parameter.
Constant for all Spin Box Purpose - To specifY the desired speed for the stations simulated vehicle.
Content - Speed increments in the spin box will be in units of 5 km/h. Default - Disabled until the Constant (speed) option is selected. The default speed will be that of the design speed, if available, or 75 krnlh.
Variable Speeds Option Button Purpose - Sets the travel speed for the simulated vehicle to be variable as specified by the user. When selecting the "Variable speed" option, the Set Traffic Light Cycle Time button will be disabled, in the Path and speed control options group the Idealized option will be selected, the Driver type parameters will be disabled and the items in the Driving environment parameters group will be disabled except the Road surface parameter.
Set variable Speed Command Button Purpose - Invokes the Variable Speed setting dialog box. Default - Disabled until the Variable speed option button is selected. When the Variable speed option is selected the command button will be enabled.
Idealized Option Button Purpose - Sets the path and speed control of the simulated vehicle to be idealized. Default - When selecting the Idealized option, Model generated (speed) will be deselected.
Model generated Option Button Purpose - Indicate that path and speed control of the simulated vehicle will be controlled by the model. If constant or variable speed was selected, a message box will be displayed warning the user that to run the simulation under model generated path and speed control, desired speed must also be Model ~enerated.
94
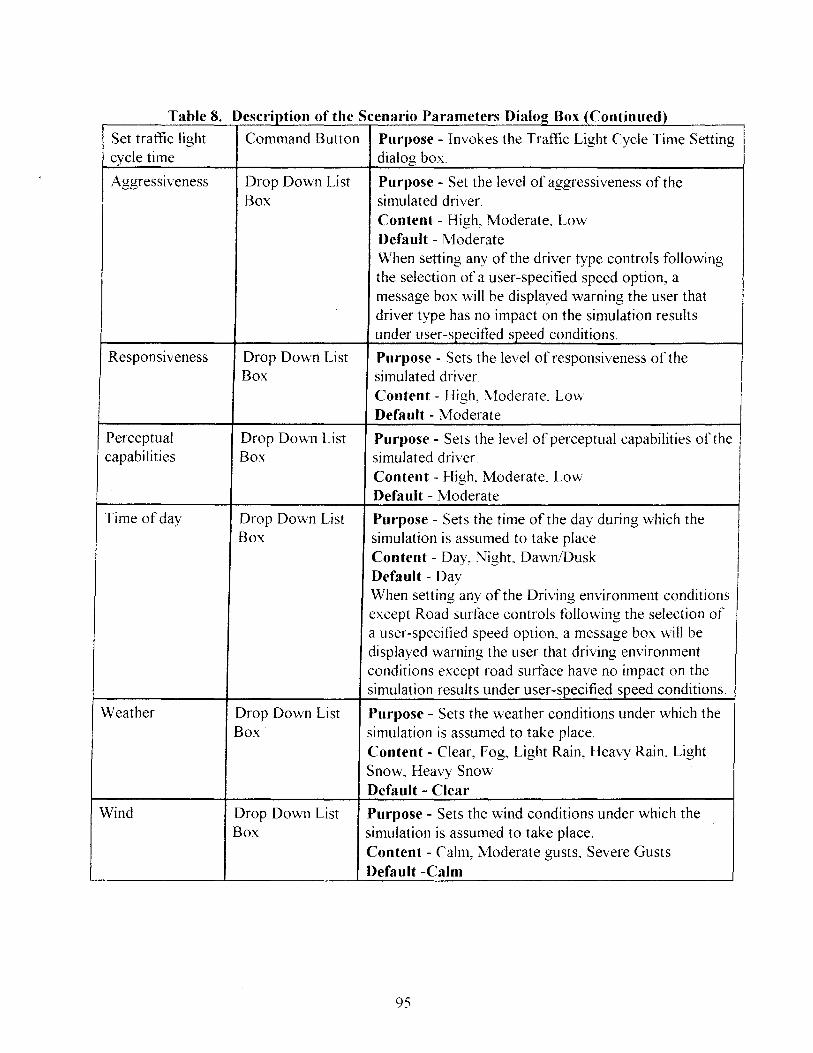
Table 8. Description of the Scenario Parameters Dialog; Box (Continued) Set traffic light Command Button Purpose - Invokes the Traffic Light Cycle Time Setting cycle time dialog box.
Aggressiveness Drop Down List Purpose - Set the level of aggressiveness of the Box simulated driver.
Content - High, Moderate. Low Default - Moderate When setting any of the driver type controls following the selection of a user-specified speed option, a message box will be displayed warning the user that driver type has no impact on the simulation results under user-specified speed conditions.
Responsiveness Drop Down List Purpose - Sets the level of responsiveness of the Box simulated driver.
Content - High, Moderate, Low Default - Moderate
Perceptual Drop Down List Purpose - Sets the level of perceptual capabilities of the capabilities Box simulated driver.
Content - High, Moderate. Low Default - Moderate
Time of day Drop Down List Purpose - Sets the time of the day during which the Box simulation is assumed to take place.
Content - Day, Night, DawnlDusk Default - Day When setting any of the Driving environment conditions except Road surface controls following the selection of a user-specified speed option. a message box will be displayed warning the user that driving environment conditions except road surface have no impact on the simulation results under user-specified speed conditions.
Weather Drop Down List Purpose - Sets the weather conditions under which the Box simulation is assumed to take place.
Content - Clear, Fog, Light Rain, Heavy Rain, Light Snow. Heavy Snow Default - Clear
Wind Drop Down List Purpose - Sets the wind conditions under which the Box simulation is assumed to take place.
Content - Calm, Moderate gusts, Severe Gusts Default -Calm
95
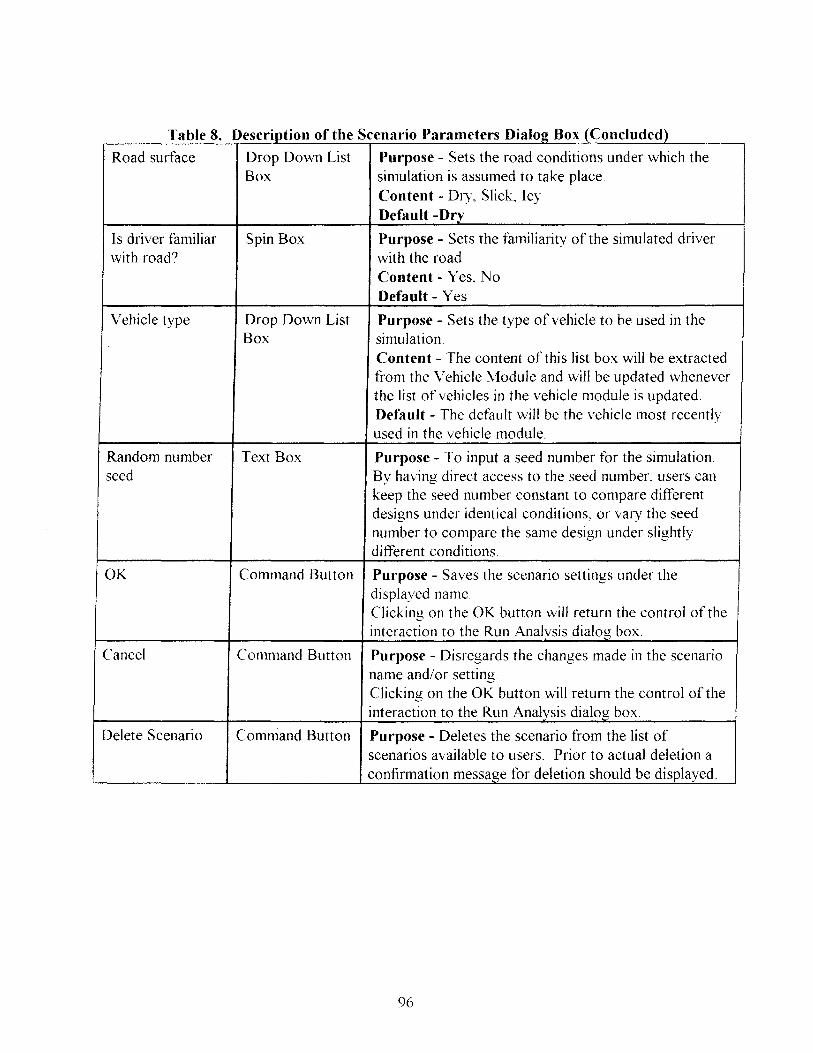
Table 8. Description of the Scenario Parameters Dialog Box iConciuded)
Road surface Drop Down List Purpose - Sets the road conditions under which the Box simulation is assumed to take place.
Content - Dry, Slick, Icy Default -Dry
Is driver familiar Spin Box Purpose - Sets the familiarity of the simulated driver with road? with the road.
Content - Yes, No Default - Yes
Vehicle type Drop Down List Purpose - Sets the type of vehicle to be used in the Box simulation.
Content - The content of this list box will be extracted from the Vehicle Module and will be updated whenever the list of vehicles in the vehicle module is updated. Default - The default will be the vehicle most recently used in the vehicle module.
Random number Text Box Purpose - To input a seed number for the simulation. seed By having direct access to the seed number, users can
keep the seed number constant to compare different designs under identical conditions, or vary the seed number to compare the same design under slightly different conditions.
OK Command Button Purpose - Saves the scenario settings under the displayed name. Clicking on the OK button will return the control of the interaction to the Run Analysis dialog box.
Cancel Command Button Purpose - Disregards the changes made in the scenario name and/or setting. Clicking on the OK button will return the control of the interaction to the Run Analysis dialog box.
Delete Scenario Command Button Purpose - Deletes the scenario from the list of scenarios available to users. Prior to actual deletion a confirmation message for deletion should be displayed.
96

Figure 9. Scenario Parameters Dialog Box
97
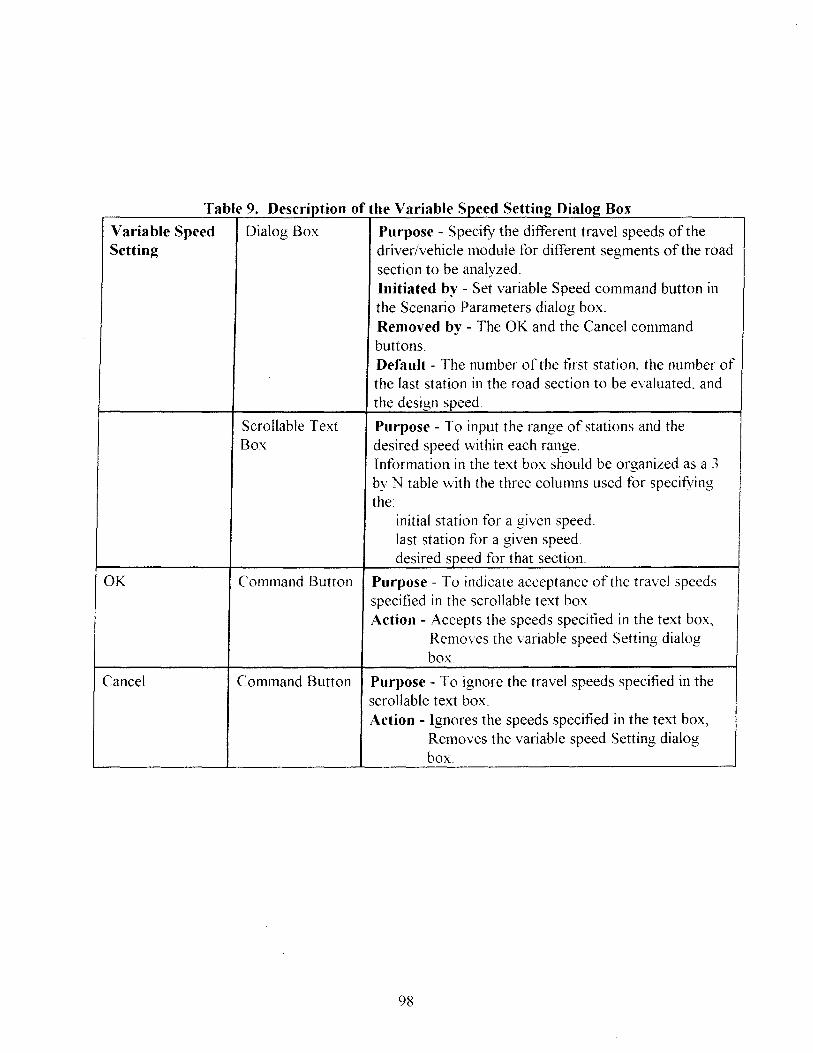
Table 9. DescriptIOn of the Variable Speed Setting Dialog Box
Variable Speed Dialog Box Purpose - Specify the different travel speeds of the Setting driver/vehicle module for different segments of the road
section to be analyzed.
OK
Cancel
Scrollable Text Box
Initiated by - Set variable Speed command button in the Scenario Parameters dialog box. Removed by - The OK and the Cancel command buttons. Default - The number of the fIrst station, the number of the last station in the road section to be evaluated, and the design speed.
Purpose - To input the range of stations and the desired speed within each range. Information in the text box should be organized as a 3 by N table with the three columns used for specifying the
initial station for a given speed. last station for a given speed. desired speed for that section.
Command Button Purpose - To indicate acceptance of the travel speeds specified in the scrollable text box. Action - Accepts the speeds specified in the text box,
Removes the variable speed Setting dialog box.
Command Button Purpose - To ignore the travel speeds specified in the scroll able text box. Action - Ignores the speeds specified in the text box,
Removes the variable speed Setting dialog box.
98
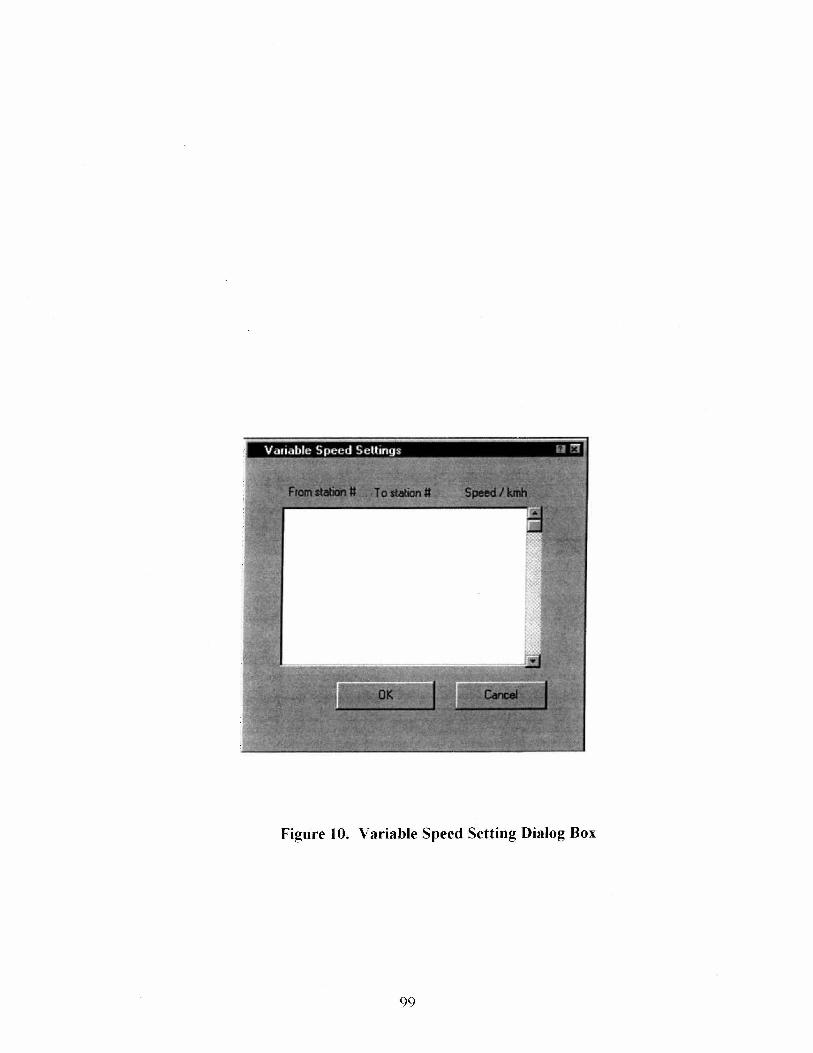
Figure 10. Variable Speed Setting Dialog Box
99
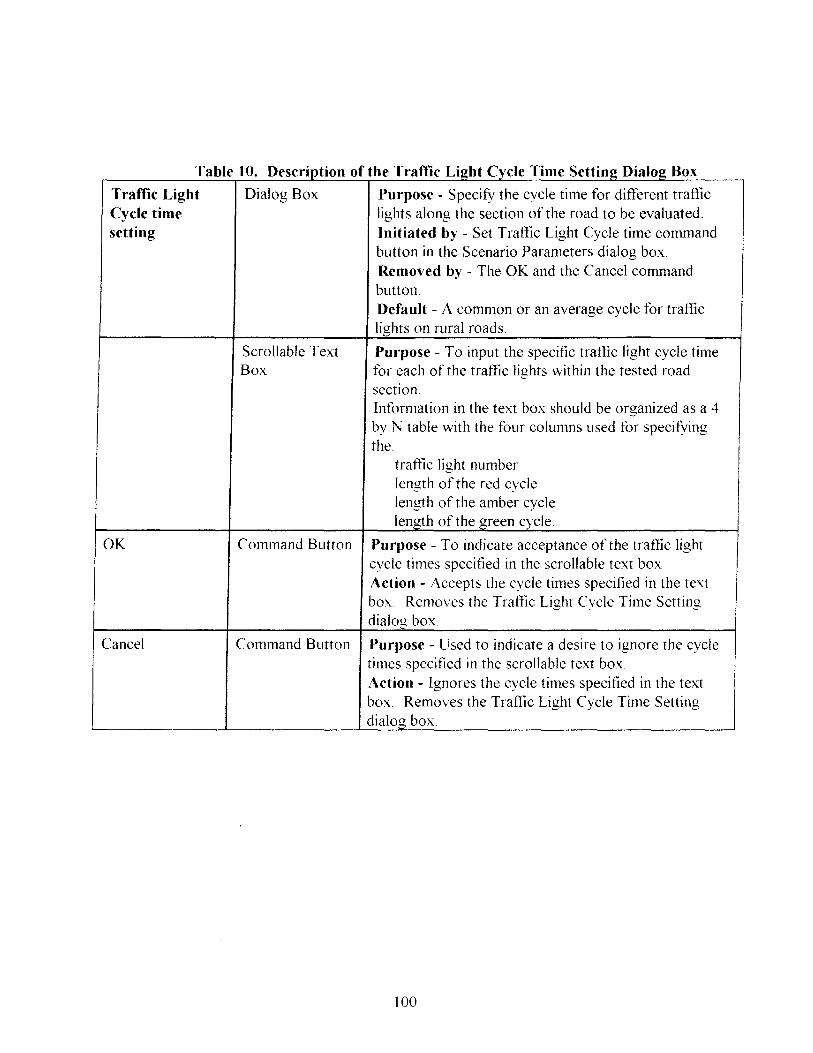
Table 10. Description of the Traffic Light Cycle Time Setting Dialog Box
Traffic Light Dialog Box Purpose - Specify the cycle time for different traffic Cycle time lights along the section of the road to be evaluated. setting Initiated by - Set Traffic Light Cycle time command
button in the Scenario Parameters dialog box. Removed by - The OK and the Cancel command button.
OK
Cancel
Scrollable Text Box
Default - A common or an average cycle for traffic lights on rural roads.
Purpose - To input the specific traffic light cycle time for each of the traflic lights within the tested road section. Information in the text box should be organized as a 4 by N table with the four columns used for specifying the
traffic light number length of the red cycle length of the amber cycle leng!h of the green cycle
Command Button Purpose - To indicate acceptance of the traffic light cycle times specified in the scrollable text box. Action - Accepts the cycle times specified in the text box. Removes the Traffic Light Cycle Time Setting dialog box.
Command Button Purpose - Used to indicate a desire to ignore the cycle times specified in the scrollable text box. Action - Ignores the cycle times specified in the text box. Removes the Traffic Light Cycle Time Setting dialog box
100
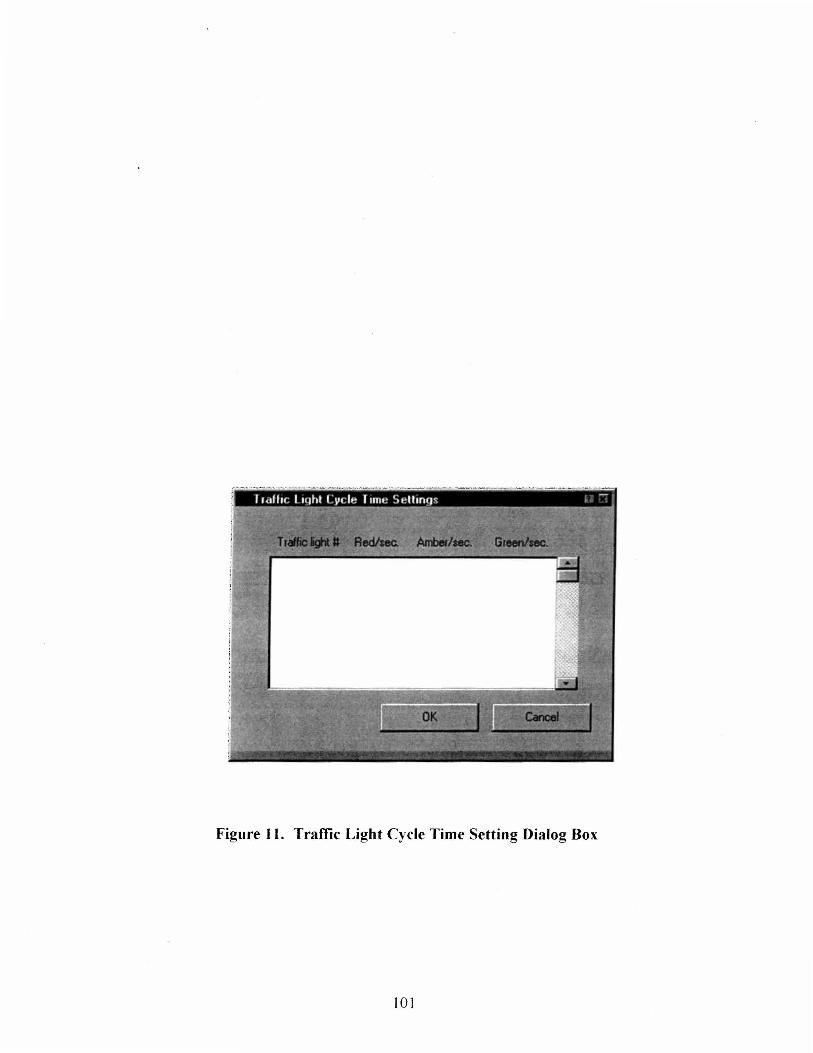
Figure II. Traffic Light Cycle Time Setting Dialog Box
101
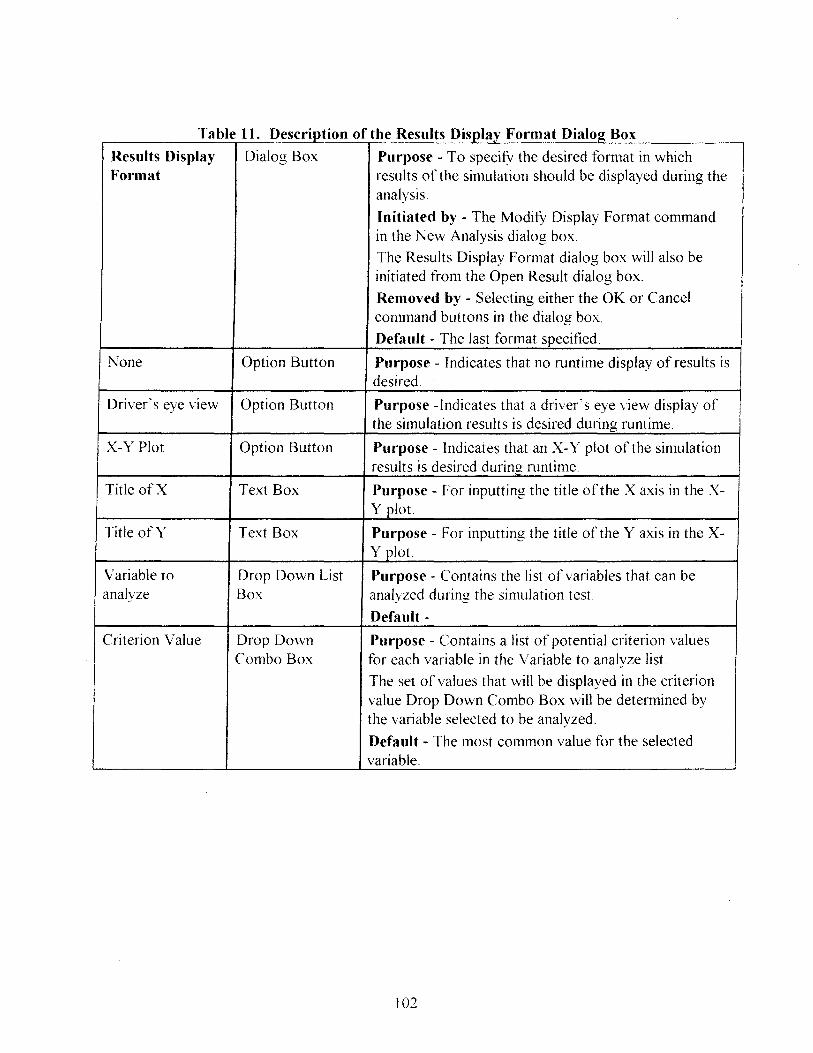
a e . T bill D escrIptIon 0 f h R t e esu ts D· I F Isplay ormat D· I B la og ox
Results Display Dialog Box Purpose - To specifY the desired format in which Format results of the simulation should be displayed during the
analysis.
Initiated by - The ModifY Display Format command in the New Analysis dialog box.
The Results Display Format dialog box will also be initiated from the Open Result dialog box.
Removed by - Selecting either the OK or Cancel command buttons in the dialog box.
Default - The last fonnat specified.
None Option Button Purpose - Indicates that no runtime display of results is desired.
Driver's eye view Option Button Purpose -Indicates that a driver's eye view display of the simulation results is desired during runtime.
X-V Plot Option Button Pm"pose - Indicates that an X-Y plot of the simulation results is desired during runtime.
Title of X Text Box Purpose - For inputting the title of the X axis in the X-Y plot.
Title ofY Text Box Purpose - For inputting the title of the Y axis in the X-Y plot.
Variable to Drop Down List Purpose - Contains the list of variables that can be analyze Box analyzed during the simulation test.
Default -
Criterion Value Drop Down Purpose - Contains a list of potential criterion values Combo Box for each variable in the Variable to analyze list.
The set of values that will be displayed in the criterion value Drop Down Combo Box will be determined by the variable selected to be analyzed.
Default - The most common value for the selected variable.
102
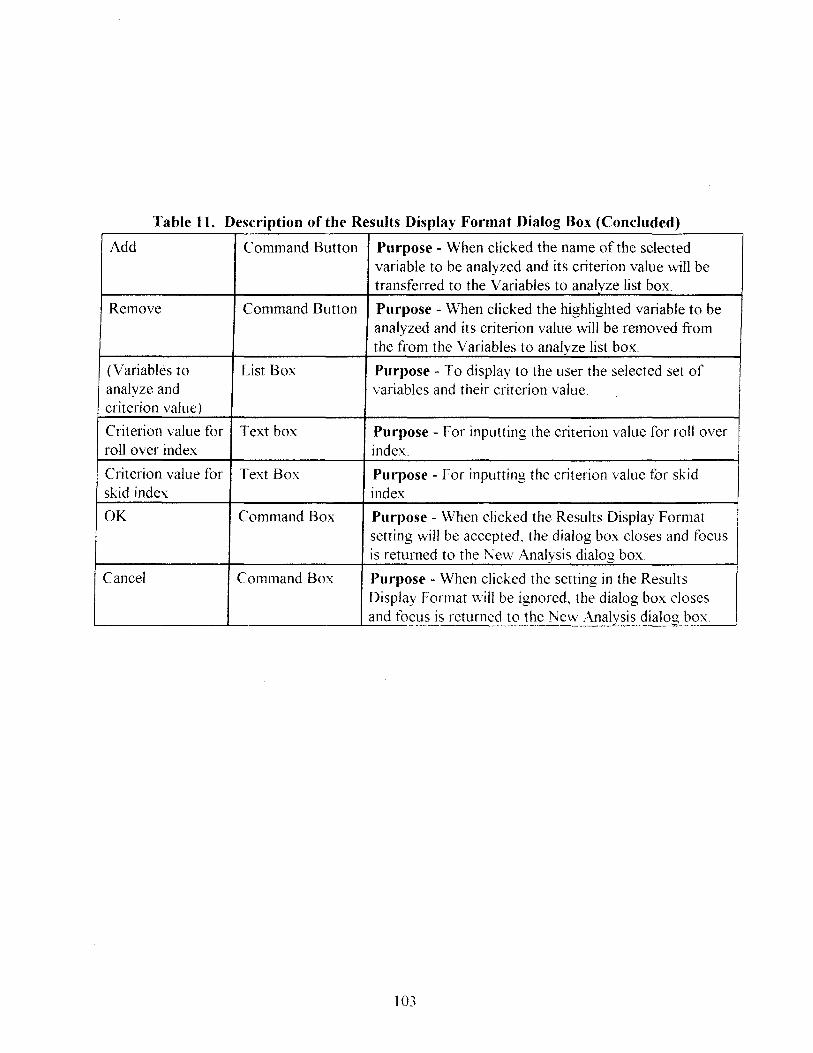
Table 11. Description of the Results Display Format Dialog Box (Concluded)
Add Command Button Purpose - When clicked the name of the selected variable to be analyzed and its criterion value will be transferred to the Variables to analyze list box.
Remove Command Button Purpose - When clicked the highlighted variable to be analyzed and its criterion value will be removed from the from the Variables to analyze list box.
(Variables to List Box Purpose - To display to the user the selected set of analyze and variables and their criterion value. criterion value)
Criterion value for Text box Purpose - For inputting the criterion value for roll over roll over index index.
Criterion value for Text Box Purpose - For inputting the criterion value tor skid skid index index.
OK Command Box Purpose - When clicked the Results Display Format setting will be accepted, the dialog box closes and focus is returned to the New Analysis dialog box.
Cancel Command Box Purpose - When clicked the setting in the Results Display Format will be ignored, the dialog box closes and focus is returned to the New Analysis dialog box.
103

Figure 12. Results Display Format Dialog Box
104
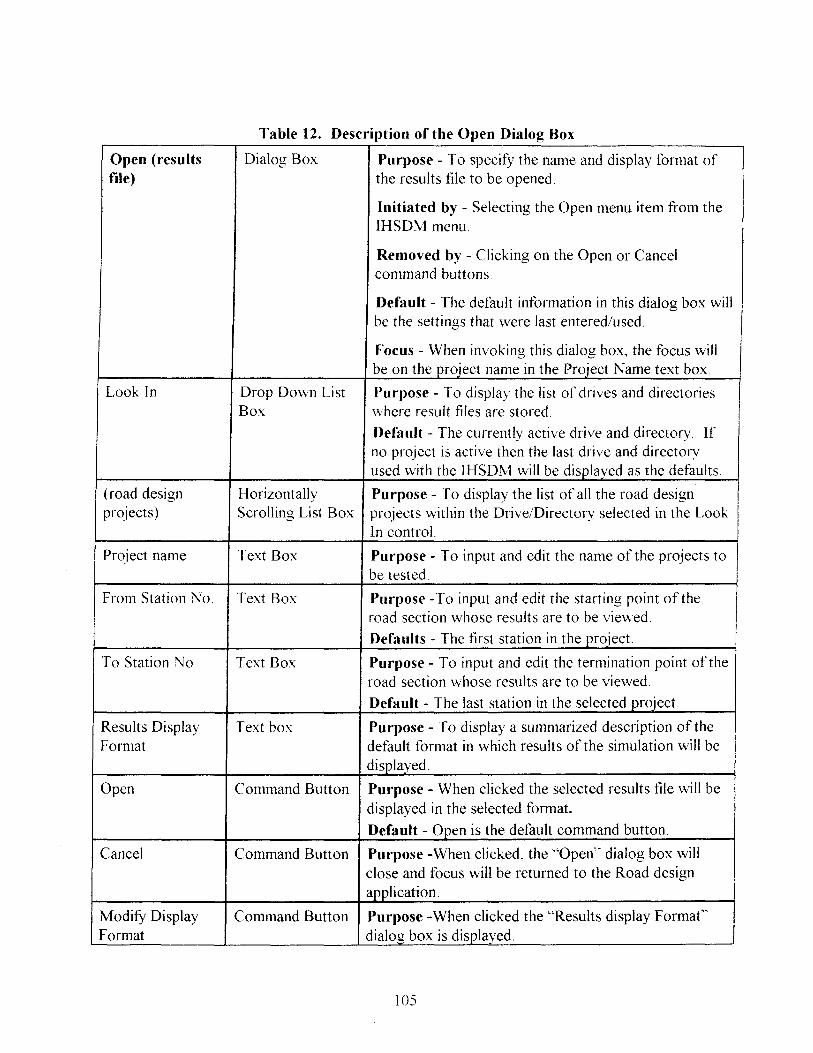
Table 12. Description of the Open Dialog Box
Open (results Dialog Box Purpose - To specity the name and display format of file) the results file to be opened
Initiated by - Selecting the Open menu item from the IHSDM menu.
Removed by - Clicking on the Open or Cancel command buttons.
Default - The default information in this dialog box will be the settings that were last entered/used.
Focus - When invoking this dialog box, the focus will be on the project name in the Proiect Name text box.
Look In Drop Down List Purpose - To display the list of drives and directories Box where result files are stored.
Default - The currently active drive and directory. If no project is active then the last drive and directory used with the IHSDM will be displayed as the defaults.
(road design Horizontally Purpose - To display the list of all the road design projects) Scrolling List Box projects within the DrivelDirectory selected in the Look
In control
Project name Text Box Purpose - To input and edit the name of the projects to be tested.
From Station No Text Box Purpose -To input and edit the starting point of the road section whose results are to be viewed.
Defaults - The first station in the project.
To Station No Text Box Purpose - To input and edit the termination point of the road section whose results are to be viewed.
Default - The last station in the selected project.
Results Display Text box Purpose - To display a summarized description of the Format default format in which results of the simulation will be
displayed.
Open Command Button Purpose - When clicked the selected results file will be displayed in the selected format.
Default - Open is the default command button.
Cancel Command Button Purpose -When clicked, the "Open" dialog box will close and focus will be returned to the Road design application.
Modity Display Command Button Purpose -When clicked the "Results display Format" Format dialog box is displayed.
105

Figure 13. Open Dialog Box
106
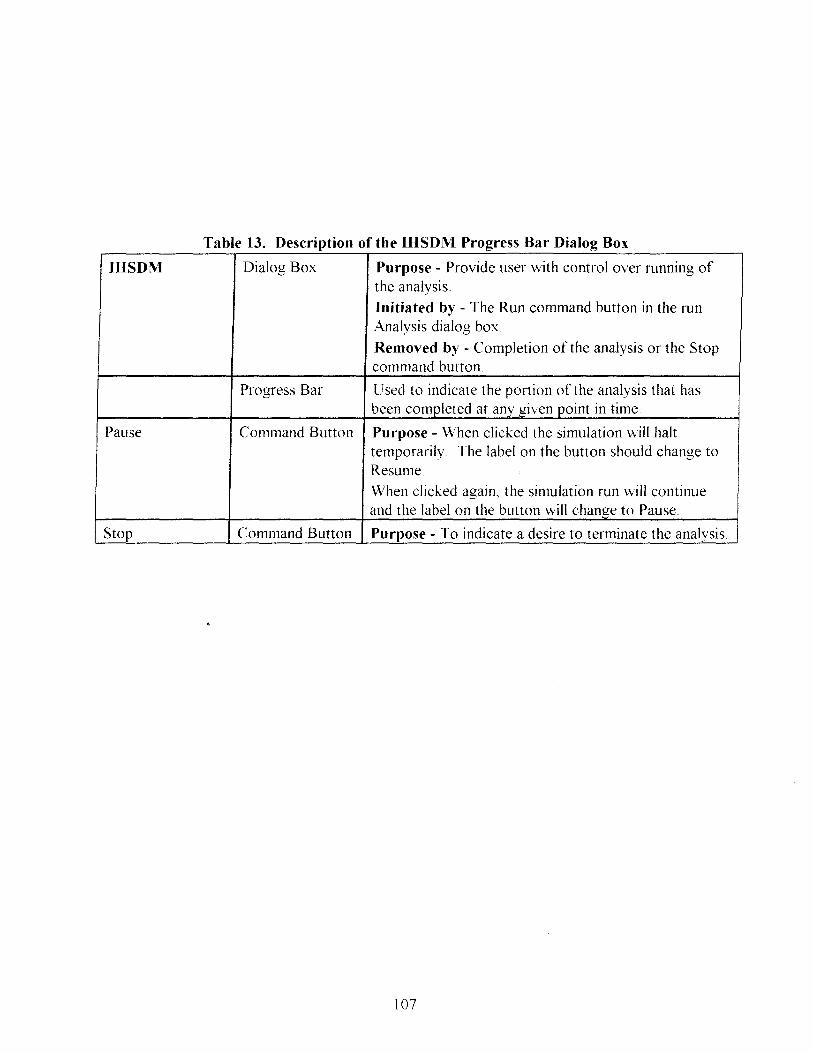
Table 13. Description of the IHSDM Progress Bar Dialog Box
IHSDM Dialog Box Purpose - Provide user with control over running of the analysis.
Initiated by - The Run command button in the run Analysis dialog box.
Removed by - Completion of the analysis or the Stop command button.
Progress Bar Used to indicate the portion of the analysis that has been completed at any given point in time.
Pause Command Button Purpose - When clicked the simulation will halt temporarily. The label on the button should change to Resume
When clicked again, the simulation run will continue and the label on the button will change to Pause.
Stop Command Button Purpose - To indicate a desire to terminate the analysis.
107
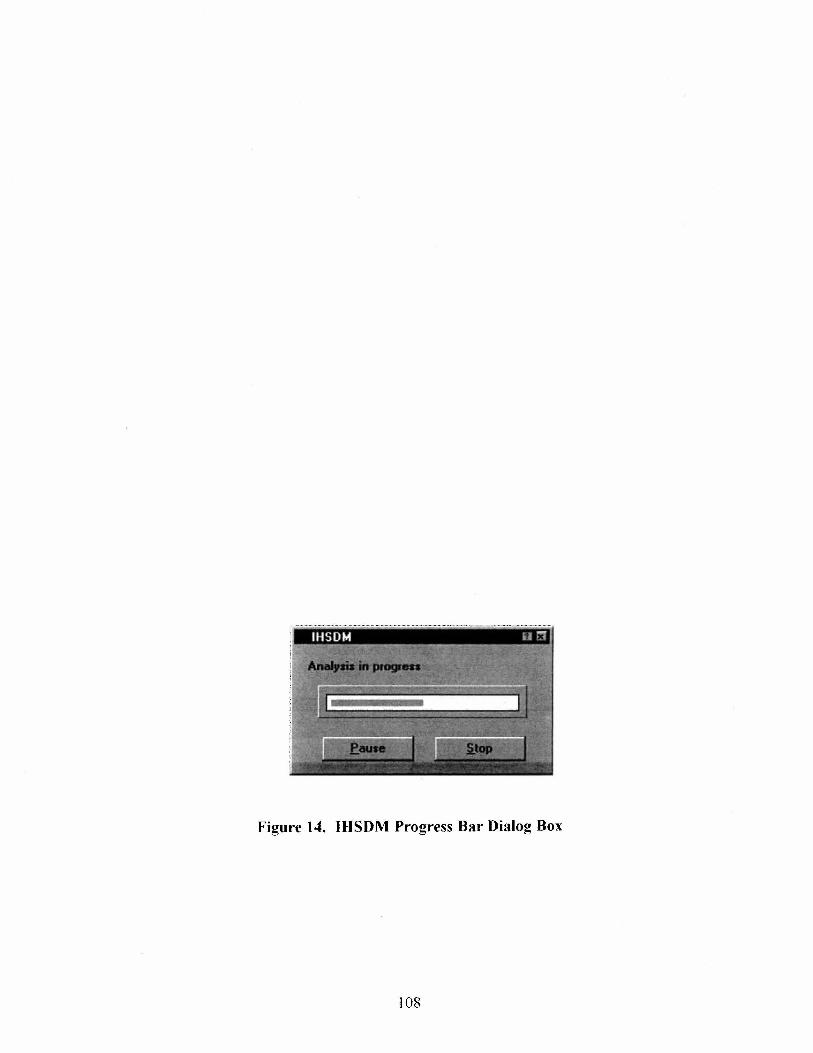
Figure 14. IHSDM Progress Bar Dialog Box
108
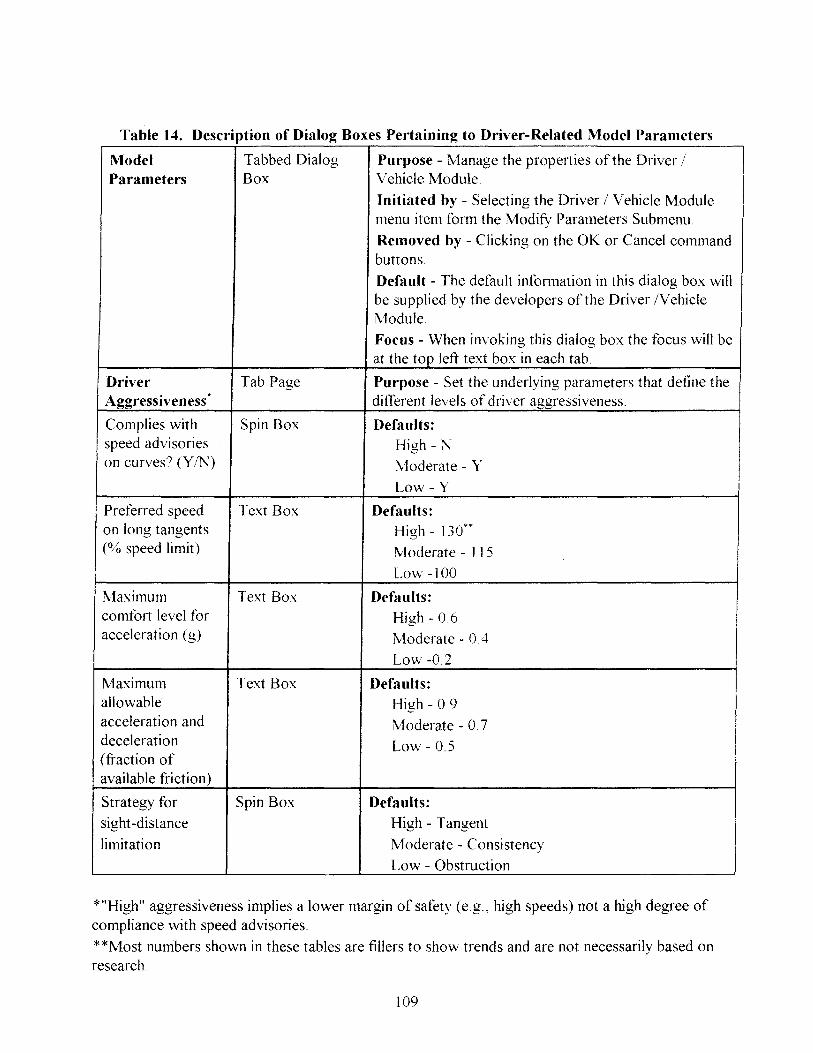
Table 14. Description of Dialog Boxes Pertaining to Driver-Related Model Parameters
Model Tabbed Dialog Purpose - Manage the properties of the Driver / Parameters Box Vehicle Module.
Initiated by - Selecting the Driver / Vehicle Module menu item form the ModifY Parameters Submenu.
Removed by - Clicking on the OK or Cancel command buttons.
Default - The default infonnation in this dialog box will be supplied by the developers of the Driver IVehicle Module.
Focus - When invoking this dialog box the focus will be at the top left text box in each tab.
Driver Tab Page Purpose - Set the underlying parameters that define the Aggressiveness
. different levels of driver ag!lressiveness.
Complies with Spin Box Defaults: speed advisories High - N on curves') (YIN) Moderate - Y
Low- Y
Preferred speed Text Box Defaults: on long tangents High - 130** (% speed limit) Moderate - 115
Low -100
Maximum Text Box Defaults: comfort level for High - 0.6 acceleration (g) Moderate - 0.4
Low -0.2
Maximum Text Box Defaults: allowable High-0.9 acceleration and Moderate - 0.7 deceleration Low - 0.5 (fraction of available friction)
Strategy for Spin Box Defaults: sight -distance High - Tangent
limitation Moderate - Consistency
Low - Obstruction
*"High" aggressiveness implies a lower margin of safety (e.g., high speeds) not a high degree of compliance with speed advisories.
* *Most numbers shown in these tables are fillers to show trends and are not necessarily based on research.
109

Table 14. Description of Dialog Boxes Pertaining to Driver-Related Model Parameters (Continued)
Driver Tab Page Purpose - Set the underlying parameters that define the Responsiveness different levels of driver responsiveness.
Perceptuall cogni- Text Box Defaults: tive response High - 015 delay (second) Moderate - 0.20
Low - 0.25
Braking reaction Text Box Defaults: time (seconds) High - 1.5
Moderate - 2.5
Low - 3.5
Completion time Text Box Defaults: for small path High - 1.0 (seconds) Moderate - 2.0
Low - 3.0
Allowable speed Text Box Defaults: error (kmJh) High - 3
Moderate - 5 Low - 10
Minimum Text Box Defaults: allowable distance High - 09 from lane edge :\1oderate - 0.6 (meters) Low - 03
Driver's Tab Page Purpose - Set the underlying parameters that define the Perceptual different levels of driver's perceptual capabilities. Capabilities
Perceptual error - Text Box Defaults: to-magnitude ratio High - 0.05 (fraction) Moderate - 0.1
Low - 0.2
Discriminability of Text Box Defaults: roadway High -curvature at 100 Moderate -meters Low-(degrees/meter)
110
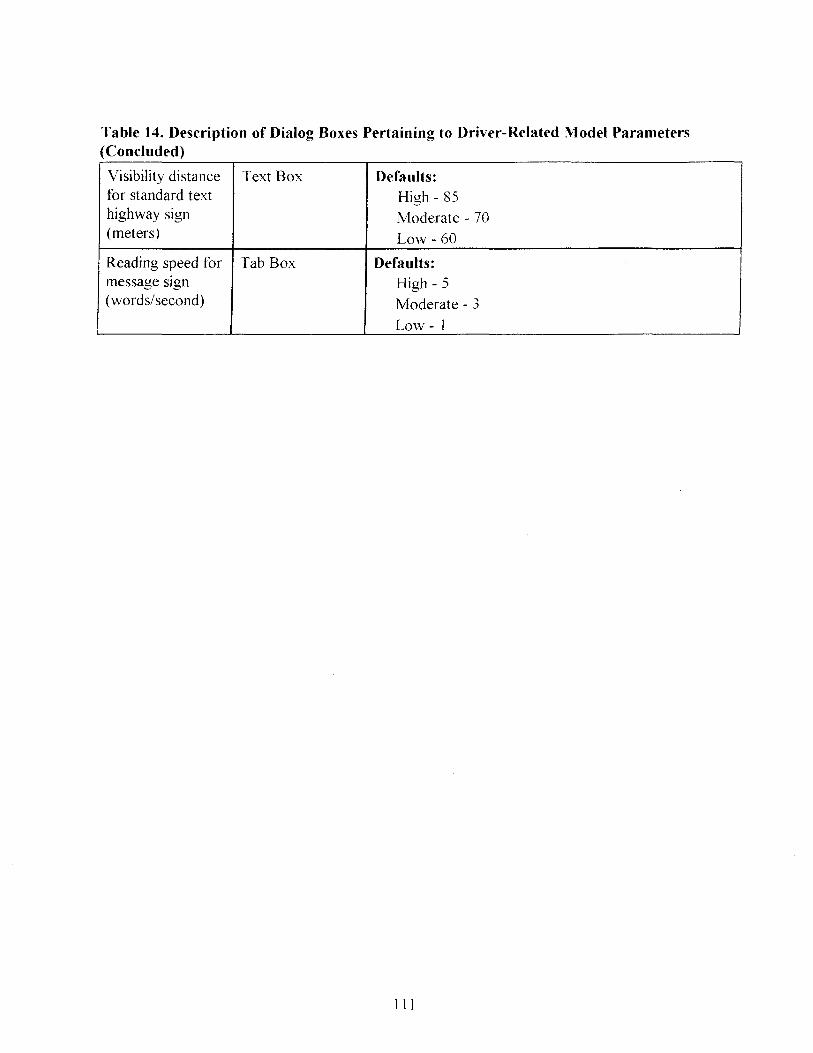
Table 14. Description of Dialog Boxes Pertaining to Driver-Related Model Parameters (Concluded)
Visibility distance Text Box Defaults: for standard text High - 85 highway sign Moderate - 70 (meters) Low - 60
Reading speed for Tab Box Defaults: message sign High - 5 (words/ second) Moderate - 3
Low- I
1 11
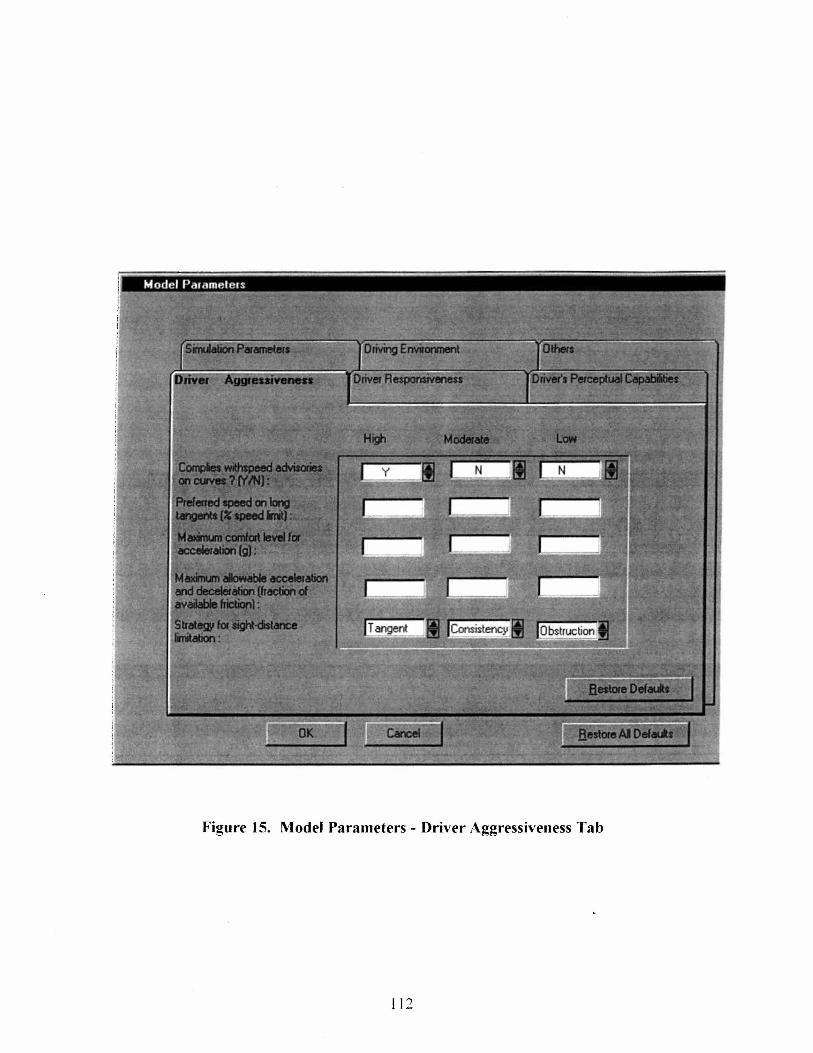
Figure 15. Model Parameters - Driver Aggressiveness Tab
112
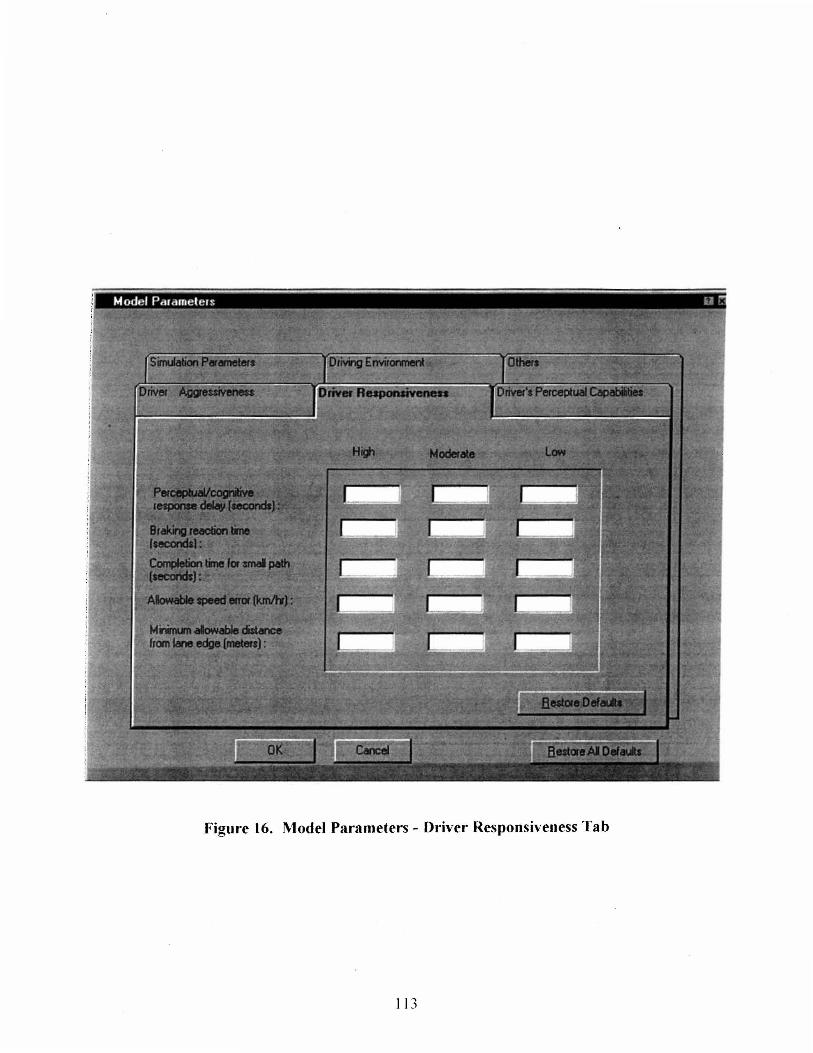
Figure 16. Model Parameters - Driver Responsiveness Tab
113

Figure 17. Model Parameters - Driver's Perceptual Capabilities Tab
114

Table 15. Description of the Simulation Parameters Tab
Simulation Tab Page Purpose - Set the underlying parameters of the Parameters simulation.
Simulation update Text Box Purpose - Input the interval at which the simulation will interval be updated.
Recording update Text Box Purpose - Input the interval at which the results will be interval recorded.
115

Figure 18. Model Parameters - Simulation Parameters Tab
116
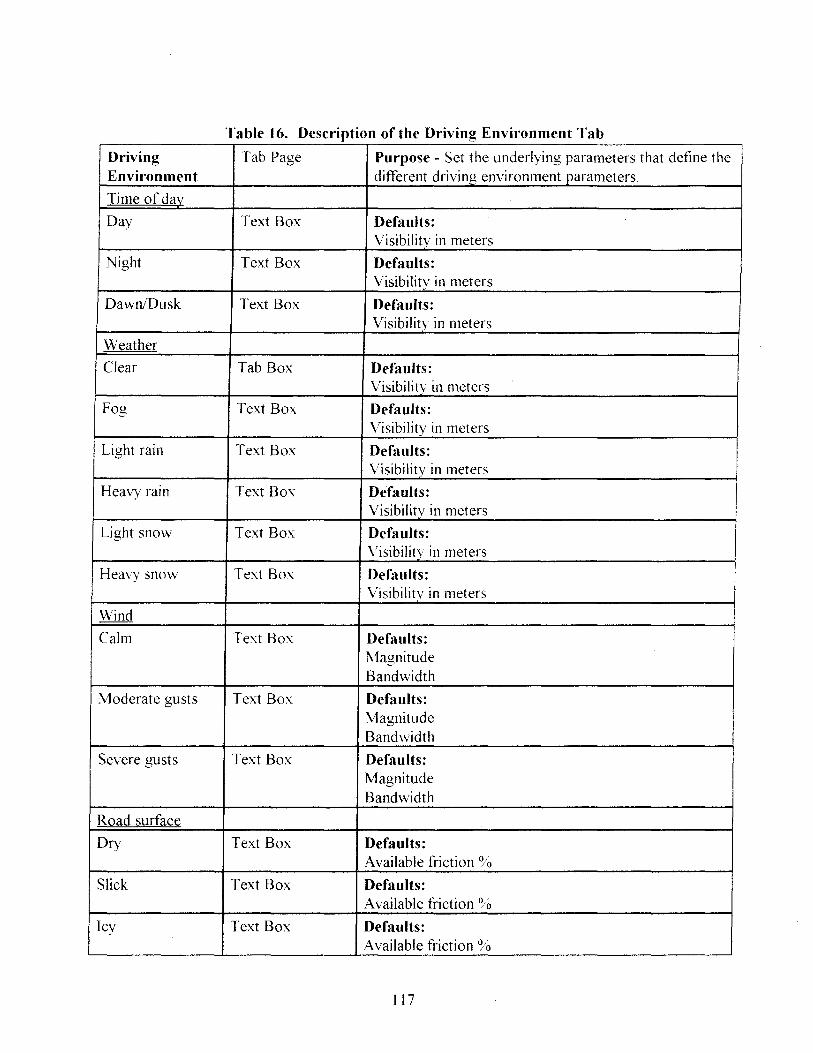
Table 16. Description of the Driving Environment Tab
Driving Tab Page Purpose - Set the underlying parameters that define the Environment different driving environment j)arameters
Time ofdav
Day Text Box Defaults: Visibility in meters
Night Text Box Defaults: Visibility in meters
Dawn/Dusk Text Box Defaults: Visibilitv in meters
W~ather
Clear Tab Box Defaults: Visibility in meters
Fog Text Box Defaults: Visibility in meters
Light rain Text Box Defaults: Visibility in meters
Heavy rain Text Box Defaults: Visibility in meters
Light snow Text Box Defaults: Visibility in meters
Heavy snow Text Box Defaults: Visibilitv in meters
Wind
Calm Text Box Defaults: Magnitude Bandwidth
Moderate gusts Text Box Defaults: Magnitude Bandwidth
Severe gusts Text Box Defaults: Magnitude Bandwidth
Road ~urfac~
Dry Text Box Defaults: Available friction %
Slick Text Box Defaults: Available friction %
Icy Text Box Defaults: Available friction %
117
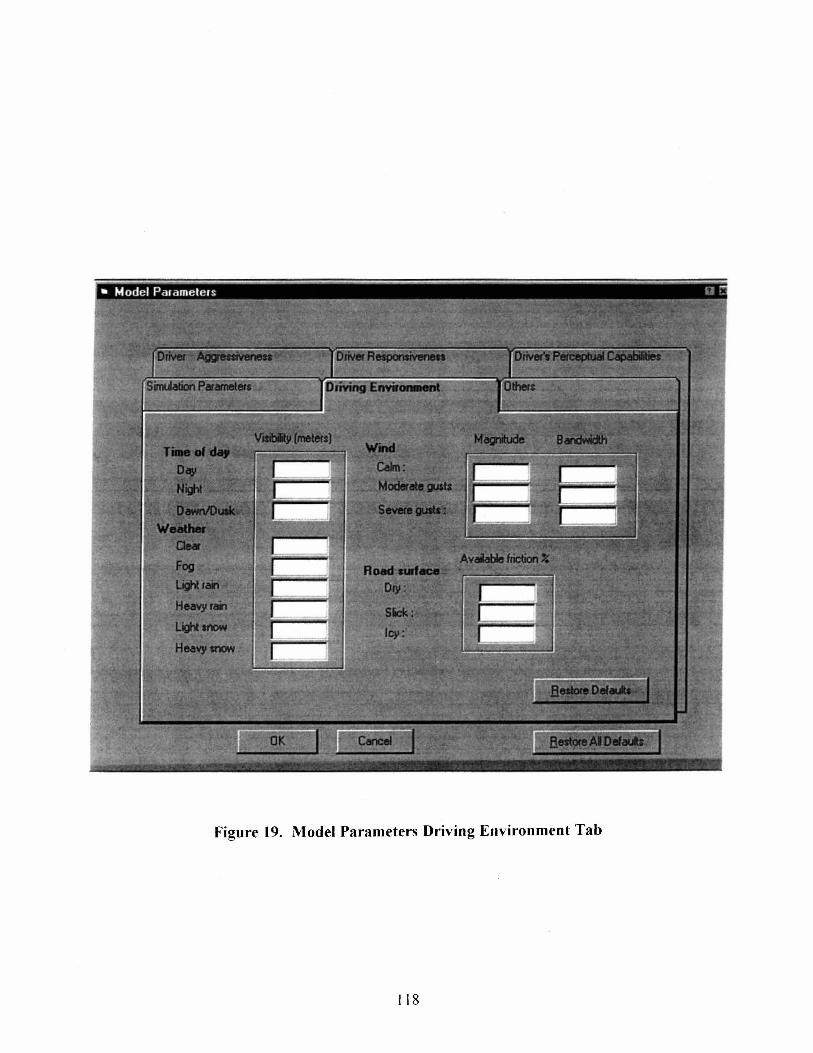
Figure 19. Model Parameters Driving Environment Tab
118
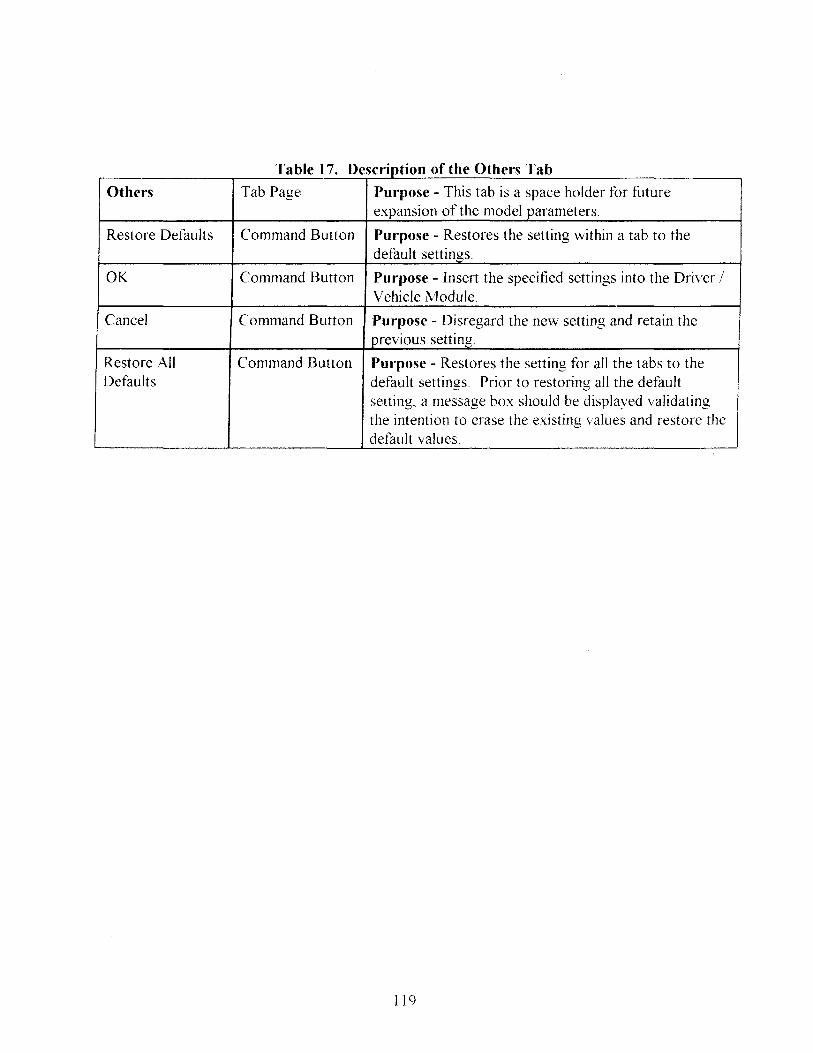
a e . T bl 17 D Of escnpl IOn 0 fth Oth e ers T b a
Others Tab Page Purpose - This tab is a space holder for future expansion of the model parameters.
Restore Defaults Command Button Purpose - Restores the setting within a tab to the default settings.
OK Command Button Purpose - Insert the specified settings into the Driver I Vehicle Module.
Cancel Command Button Purpose - Disregard the new setting and retain the previous setting.
Restore All Command Button Purpose - Restores the setting for all the tabs to the Defaults default settings. Prior to restoring all the default
setting, a message box should be displayed validating the intention to erase the existing values and restore the default values.
119

Figure 20. Model Parameters - Others Tab
120
SUMMARY
A preliminary design for the user interface to the IHSDM and Driver/Vehicle Module was described. Illustrations are provided for all proposed dialog boxes, as are tabular descriptions of the type. purpose. and operation of each dialog box. These dialog boxes allow the user to select the type of analysis to be performed and, for the Driver Vehicle Module, information relating to (I ) the specific highway project to be analyzed. (2) additional roadside parameters. (3) environmental conditions, (4) driver type and driver-related model parameters, (5) vehicle type, (6) simulation parameters. and (7) storage and display of simulation results.
Existing algorithms that are potentially applicable to the Driver Performance Module are reviewed in the next chapter.
121

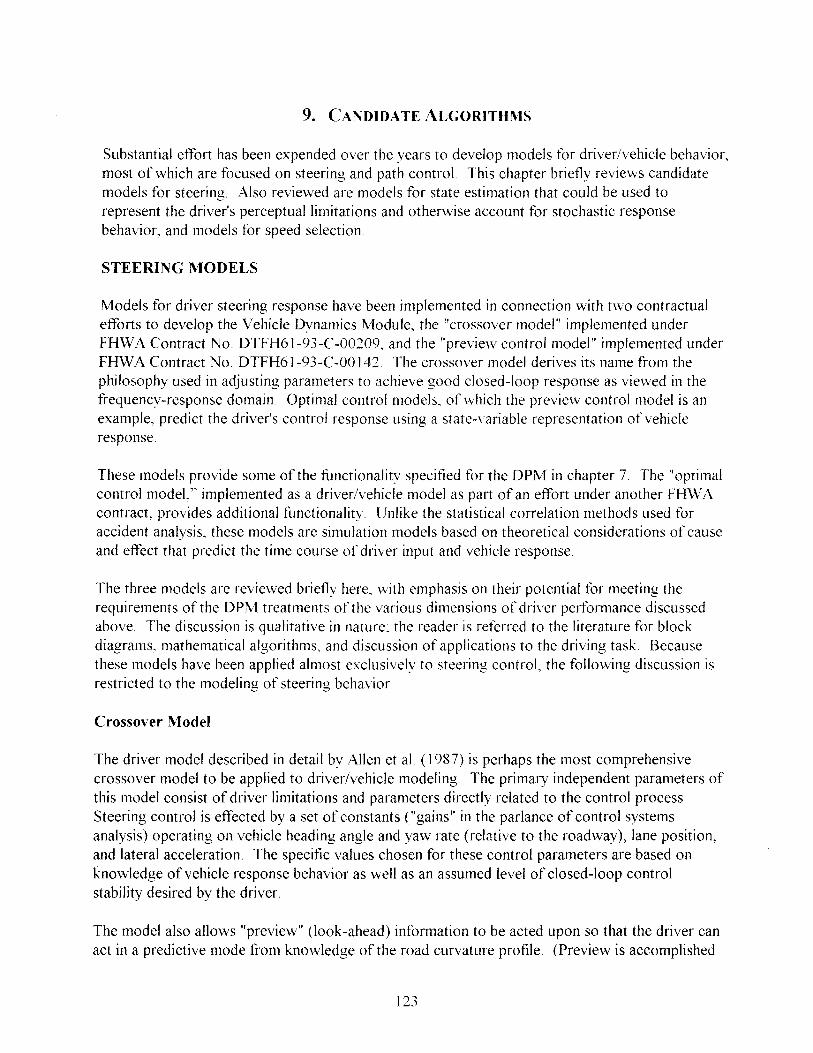
9. CANDIDATE ALGORITHMS
Substantial effort has been expended over the years to develop models for driver/vehicle behavior, most of which are focused on steering and path control This chapter briefly reviews candidate models for steering. Also reviewed are models for state estimation that could be used to represent the driver's perceptual limitations and otherwise account tor stochastic response behavior, and models for speed selection.
STEERING MODELS
Models for driver steering response have been implemented in connection with two contractual efforts to develop the Vehicle Dynamics Module, the "crossover model" implemented under FHWA Contract No. DTFH61-93-C-00209, and the "preview control model" implemented under FHWA Contract No. DTFH61-93-C-00142. The crossover model derives its name from the philosophy used in adjusting parameters to achieve good closed-loop response as viewed in the frequency-response domain. Optimal control models, of which the preview control model is an example, predict the driver's control response using a state-variable representation of vehicle response.
These models provide some of the functionality specitled tor the DPM in chapter 7. The "optimal control model," implemented as a driver/vehicle model as part of an effort under another FHWA contract, provides additional functionality. Unlike the statistical correlation methods used for accident analysis. these models are simulation models based on theoretical considerations of cause and effect that predict the time course of driver input and vehicle response.
The three models are reviewed brietly here, with emphasis on their potential for meeting the requirements of the DPM treatments of the various dimensions of driver performance discussed above. The discussion is qualitative in nature: the reader is referred to the literature for block diagrams, mathematical algorithms, and discussion of applications to the driving task. Because these models have been applied almost exclusively to steering control, the following discussion is restricted to the modeling of steering behavior.
Crossover Model
The driver model described in detail by Allen et al. (1987) is perhaps the most comprehensive crossover model to be applied to driver/vehicle modeling The primary independent parameters of this model consist of driver limitations and parameters directly related to the control process. Steering control is effected by a set of constants ("gains" in the parlance of control systems analysis) operating on vehicle heading angle and yaw rate (relative to the roadway), lane position, and lateral acceleration. The specific values chosen for these control parameters are based on knowledge of vehicle response behavior as well as an assumed level of closed-loop control stability desired by the driver.
The model also allows "preview" (look-ahead) information to be acted upon so that the driver can act in a predictive mode from knowledge of the road curvature profile. (Preview is accomplished
123
in part by computing an "aim point" associated with a point a located ahead by a "look ahead time."
Explicit driver information-processing limitations include driver response delay and a representation of "neuromuscular" dynamics An earlier version of this model shows a "noise" input to represent the stochastic portion of the driver's response behavior (Reid, 1983), but this term is absent in the presentation by Allen et aL
Optimal Control Model
Application of the optimal control model (OCM) to the driving task is described in Levison (1993) and Levison and Cramer (1995). As is the case with the crossover model, the optimal control model includes parameters related to driver information processing limitations. Unlike the crossover model, control-related parameters are not treated as independent parameters. Instead, the user specifies parameters related more closely to the task description. Control parameters (such as the feedback gains) are computed automatically. using algorithms derived from optimal control theory, on the basis of the task description and driver limitations (Kleinman, Baron, and Levison, 1970, 1971)
Optimal control parameters related to driver information-processing limitations consist of (a) driver response delay, (b) an effective signal-to-noise ratio to account in part for cognitive information-processing limitations, and (c) indifference and perceptual "thresholds," currently approximated by statistically equivalent random noise processes.
The driver's knovvledge base includes estimates of instantaneous values of state variables, descriptions of the driving environment, and a representation of task requirements. Descriptors of the driving environment include knmvledge of vehicle response dynamics, statistical properties of external disturbances (road-surface and wind inputs), and properties of command inputs (e.g, road curvature, lead-vehicle behavior) Because the driver does not necessarily have perfect knowledge of the task environment the representations of system elements included within the driver submodel may differ in some respects from the details of the driving task implemented elsewhere (e.g., the actual vehicle model) in the driver/vehicle model.
Also included in the knowledge base is the driver's view of the task requirements. For example, in the case of simple lane tracking, the user must specifY a "performance index" to reflect the relative criticalities of errors and deviations in important vehicle-state and control variables. For a lanechange maneuver, additional performance requirements may be specified in terms of a desired path profile.
The structure of the OCM is based on the assumption that estimation and control are separable problems, thereby allowing estimation and control to be computed sequentially. The optimal estimator element of the OCM first operates on the (delayed, noisy) perceptual inputs to compute a best estimate (expected value), and an uncertainty (estimation error variance) associated with this estimate, for each system state variable. The optimal control laws then operate on this best estimate to generate steering behavior. (The estimator is discussed later in this chapter.)
124

Preview Control Model
The preview control model is similar to the optimal control model reviewed above in that an optimal steering response is generated based on a state-variable representation of vehicle dynamics, a statement of task requirements in terms of a suitable performance index, and the current values of state variables. Both models include the effects of information-processing delay.
The preview control model differs from the OCM in a number of respects, however:
]. As implemented by Levison and Cramer, the OCM computes the estimation and control strategies by deriving a statistically steady-state representation of the driving environment and applying these strategies to instantaneous values of the relevant state variables. The preview control model. on the other hand, views the roadway as a sequence of X, Y points to be traversed, and the optimal control solution generates a desired steering using the X, Y trajectory up to some preview time ahead.
2. The preview control model considers a single output variable - lateral displacement - plus the road trajectory a short distance ahead.
3. External disturbances such as wind gust and road crown are not accounted for in the previev. control mode1.
4. All needed variables are assumed to be estimated perfectly; estimation error and uncertainty are not treated.
5 Within-driver run-to-run variabilitv is not accounted for.
Treatment of Driver Factors
Table] 8 summarizes the ways in which these models handle some of the driver factors discussed in chapter 6. Further discussion follows.
Driver's Knowledge Base
Although not explicitly stated, the crossover and preview models assume that the driver has perfect knowledge of the vehicle response dynamics (including the driver's own delay). That is, the control response strategy is computed, in part, on the basis of the vehicle response.
Knowledge relevant to the task of closed-loop vehicle control is handled in the optimal control model by an explicit "mental model" that contains a state-variable representation of all external dynamic processes (vehicle response plus linear-system approximations, where appropriate, to external disturbance and command inputs). Also included is knowledge of the magnitude of random noise processes associated with external inputs and knowledge of the driver's own response limitations. At the user's option, the driver's mental model of the task environment may differ from the "true" model of the task environment to reflect assumed driver errors.
125

a e . T bl 18 C ompara lVe rea men f T t 0 river t fD' F t ac ors
Driver Factors Crossover Model Preview Control Optimal Control Model Model
Driver's Knowledge of vehicle State-variable State-variable knowledge response and driver representation of representation of all base delay vehicle response. system response
dynamics and input processes. Knowledge of driver limitations.
Perceptual Selected state Lateral displacement; Selected state inputs variables. Look- road trajectory. variables; other
ahead aim point. perceptual cues linearly related to state variables.
Estimate of Critical system states Critical system states Explicit least-system state assumed to be known assumed to be known squared-error
perfectly. perfectly. estimation of all system states.
Vehicle control "Gains" operating on Optimal control law Optimal control law key system variables. to generate control to generate control Generally does not inputs Does not inputs. Random account for response account for response nOise processes variability. variability. provide within- and
across-trial response variability.
Perceptual None in the VDM None Random noise limitations implementation processes associated
with perceptual inputs.
Cognitive Time delay. Time delay. Time delay; limitations information-
processing "noise."
Aggressiveness Not represented. Not represented. Not represented.
Responsive- Crossover frequency. Relative penalties on Relative penalties on ness path error and path error and
steering ac(ivity. steering activity.
126
Perceptual Inputs
The optimal control model allows a flexible set of perceptual inputs, where each input is linearly related to a system state variable. Typically, the input set consists of individual state variables (e.g., lateral acceleration) plus error terms derived as the difference between vehicle and roadway states (e.g., path and heading errors). Alternatively, elements of the roadway perspective view, such as the visual angle between a straight-ahead gaze and a point on the road ahead, may also be considered as the primary perceptual inputs. Preview of the road curvature can be handled by appropriate augmentation of the state variable representation of the roadway.
As noted above, the crossover model uses selected state variables as inputs; specifically, lane position error, relative heading, lateral acceleration, and, if desired, look-ahead aim point In principle, one could include other perceptual cues linearly related to system state, but the user would have the burden of generating a new algorithm for determining control gains. The preview control model is formulated to treat a single output variable - lateral displacement - plus the nearterm road trajectory.
Estimate of System State
As noted above, the OCM contains an explicit state estimator which operates on noisy, delayed perceptual variables to yield a least-squared-error estimate, and a one-sigma confidence bound, for each system state variable. The estimation process - hence, the driver's predicted control action - is influenced by the uncertainty Because the crossover and preview models assume perfect knowledge of variables that are assumed to be used for control, they have no need for a state estimator, and driver uncertainty does not playa role in control generation.
Perceptual Limitations
The user of the OCM has the option to associate a random noise process with any perceptual input in order to account for perceptual resolution limitations and "indifference thresholds." The intent is to provide a statistical representation of threshold-like nonlinearities (Baron and Levison, 1975,1977) The implementation of the crossover model as reported by Allen et aL (1987) does not include such limitations although, as noted above, some attempts have been made to account for perceptual and indifference thresholds in that modeling environment. Perceptual limitations are not accounted for in the preview control model.
Cognitive Limitations
All three models include a time delay, which may be categorized as a cognitive limitation to the extent that informa,tion-processing delay is associated with cognition. The OeM also contains a noise-to-signal ratio to account for within-driver response variability, which might also be categorized as a cognitive limitation.
Aggressiveness
The model design presented in chapters 6 and 7 have considered "aggressiveness" in terms of how
127
speed is selected. By this definition, aggressiveness is not relevant to the steering models.
Responsiveness
In the design specifications presented in chapters 6 and 7, time delay has been considered as an aspect of responsiveness. Since it is also treated as a cognitive limitation, it reflects an involuntary aspect of responsiveness. The crossover and optimal control models also account for the voluntary aspect of responsiveness through parameters that relate indirectly to closed-loop response time (or the inverse, closed-loop bandwidth). Within limits, one can adjust the control law generated by the crossover model to achieve a certain "crossover frequency." The greater this frequency, the greater the closed-loop response bandwidth (equivalently, the shorter the response time) at the cost of a reduced stability margin.
Responsiveness can be manipulated in the optimal control models through the weightings assigned to variables in the quadratic "cost function" The greater the penalty assigned to path errors. relative to the penalty assigned to steering activity, the more responsive the driver/vehicle system. Again, the penalty for increased responsiveness is a less robust system in that the system becomes more sensitive to driver imperfections such as perceptual "noise" or errors in the mental model
MODELS FOR STATE ESTIMATION
Two algorithms tor generating state estimates and confIdence bounds are reviewed (1) a method that draws on assumed stationary probability distributions for estimation error, and (2) a dynamic process in which the error distributions vary during the course of the simulation.
Fixed Distributions
A common and computationally effIcient method to produce an imperfect estimate is to draw randomly from some probability distribution of errors associated with the variable to be estimated, and add this estimation error to the predicted value of that variable to yield a corrupted estimate. For example, let us assume that threshold-like phenomena can be safely ignored, and that estimation errors scale with the magnitude of the quantity being estimated. Assume further that this error process is zero mean Gaussian process with a standard deviation of O. 05. The instantaneous estimate of lane deviation would be computed as
yl = y * (1.0 + 005*n) (1)
where "y 1 " is the estimate of the path error, "y" is the current predicted value of path error, and "n" is a sample drawn at random from a normal distribution. The I-sigma confidence bound on "yI" would be 0.05 • yl (i.e., 5 percent of the estimated value).
Dynamic Distributions
The Kalman filtering approach used in the OCM predicts the error distributions during the course of the simulation. Algorithms for the Kalman filter as applied to the driving task are given in Levison and Cramer (1995).
128
This method distinguishes between observations and state estimates, even when the vector of observational variables and the vector of state variables contain some of the same items. To update the (vector) state estimate, the driver is assumed to perform the following operations:
1. Compute the "estimator gains" relating perceived variables to state variables. (In general. there will be more state variables than observational variables.)
2. Make an initial prediction on the basis of the current state estimate and the known behavior of the system.
3. "Correct" this new estimate by factoring in the data provided by the new perceptual inputs.
In addition, a concurrent calculation is performed to update the estimation error covariance, which is a matrix that accounts not only for the uncertainty associated with each state estimate, but how these uncertainties co-vary with one another.
SPEED DECISION MAKING
Two model forms are considered: regression analysis of the type currently being explored as part of the IHSDM development program, and a "psychologically-based" model that would be more consistent with the approach likely to be taken for the other elements of the DPM.
Regression Analysis
An effort has been initiated to develop the Design Consistency Module of the IHSDIVI (FHW A 1995). This effort is expected to include refinement of a regression model developed by Krammes et al (1995) to predict the speed at which a driver will negotiate a curve, given hislher initial speed on the approach tangent and the characteristics of the curve.
The model described here was based on speed data collected in various states. Free-flowing speeds were measured at midpoints of tangents and midpoints of curves. For modeling and extrapolation purposes, a the driver was assumed to accelerate (decelerate) at [.854m(2.8 fils')] when approaching (leaving) a curve
Krammes et al concluded that the speed in curves was significantly influenced by degree of curvature [degree change per 30.5m(l00 fi)]
length of curve
deflection angle ( [degree of curvature] x [length of curve]/1 00)
but not significantly affected by superelevation rate, travel-way or pavement width, sight distance to curve, tangent length, or speed on preceding tangent.
Various model forms were explored, and a linear model fit the data as well as any. The following regression equation was derived for predicting speed in a curve:
V85 = 102.45 -1.57D + 0.0037L - 0 101
129
where
V85 = 85th percentile speed on curve (km/h)
D = degree of curvature (deg)
L = length of curve (m)
I = deflection angle (deg)
The current contracting effort is expected to refine this model, including the gathering of data that will explore acceleration behavior in curves
A model of this form may serve as the Decision module in the DPM until a psychologically-based mode is developed that can account for variability and error in the speed decision.
Psychologically Based Models
Unlike the regression analysis described above that relies totally on previously observed behavior, a psychologically-based approach uses a theoretical model to determine how the driver would likely formulate a speed profile, given the task goals and the driver's preferences and limitations. One such approach is to assume that the driver desires to transit a curve with some maximum comfortable lateral acceleration and, on the basis of the desired lateral acceleration, perceived distance to curve, and perceived properties of the curve, formulates a speed or deceleration profile accordingly.
SUMMARY
Three algorithms for driver steering response were reviewed the "crossover" model, the "optimal control" model, and the "preview control" model Collectively, these models appear to contain much of the capability specified for the Driver Performance Module.
Two models for state estimation were reviewed. A model of this type will likely be needed to provide a mechanisms for accounting for the driver's perceptual limitations and to account for the stochastic component of driver response
An existing regression model for speed selection was reviewed. A model of this type is currently being refined for inclusion in the Design Consistency Module of the IHSDM. While such a model might serve as an initial "place holder" in the Driver Performance Module, a psychologically-valid model that is based on theoretical notions of cause-and-effect and that more closely reflects human information processing is strongly recommended for this element of the DPM.
130
10. RESEARCH REQlJIREMENTS
Considerable research has been conducted over the years to collect human performance data and develop models for driver behavior. Most of this research, as it relates to driver/vehicle simulation modeling, has been concerned with steering behavior. Substantial additional research will be required to support development and implementation of a valid driver performance model of the type specified in chapter 7. Theoretical work is needed to develop psychologically valid mathematical models for various aspects of driver decision making and control. Experimental studies, most likely involving simulator and on-road activity, are required to calibrate independent model parameters and to validate the capability of the driver performance model to predict driver/vehicle behavior.
Information deficiencies relevant to the driver performance model are defined and prioritized in this chapter, and an initial program of theoretical and experimental research is suggested to address the most critical of these deficiencies so that a usable first implementation of the Driver Performance Module can be accomplished. Additional research programs will likely be necessary to refine and validate the model. Model development and data collection are expected to proceed in an iterative fashion, where the results of one program lead to refinement of the model structure or parameterization, suggesting additional experimentation to calibrate and validate the revised model.
To the extent that information deficiencies relate to the quantification of driver-related independent model parameters, these deficiencies cannot be entirely detlned outside the context of a specitlc model. Different ways of modeling a given operator task will usually result in different parameters to be quantitled and thus to alternative detlnitions of information detlciencies for that task. The following discussion of information detlciencies, and the subsequent outline of a research program to address these detlciencies, must in part be based on assumed model structures. For this reason, the specific issues and approaches discussed here are best considered as representative of the nature and scope of the work that would be conducted if these recommendations were to be implemented
FOCUS OF THE RESEARCH EFFORT
The initial research effort should focus on the needs of the IHSDM, which is to provide safety analysis relevant to highway design. Models for human behavior and driver/vehicle performance not related to highway design factors are not relevant to this program.
To place some bounds on the required scope of the research effort, the constraining factors discussed previously in chapter 6 are repeated here.
1. The research is directed to the task of driving a particular highway. Driver behavior in terms of transportation mode selection or route selection is not relevant to this program.
2. The driving environment of interest is restricted to a single vehicle traveling on a two-lane rural highway. Issues relating to headway maintenance and passing are therefore not
131
addressed.
3. The research is directed to driver behavior and driver/vehicle performance that is influenced by highway design factors such as geometry, terrain, sight distance, signage, pavement markings, etc. Incidents such as mechanical failure, an animal suddenly darting across the road, or lane departure because of inattention due to drowsiness or substance abuse are not relevant to this discussion. On the other hand, colliding with an animal standing in the road, or lane departure because of difficulty discerning the lane boundary, are relevant issues because they may reflect deficiencies in design parameters such as sight distance and roadway delineation.
4. For the initial IHSDM implementation of the Driver Performance Model, attention-sharing is restricted to cues related to the primary driving task and to speed advisory signs and signals. Attentional demands of car telephones and advanced in-vehicle displays, for example, are beyond the scope of this discussion.
5. Driving tasks are limited to low-bandwidth tasks typical of normal vehicle operation. Emergency maneuvering or rapid-response tasks as might be devised for testing vehicle handling qualities are not relevant.
INFORMATION REQUIREMENTS
Information deticiencies exist in all areas relevant to development of the DPM: development of the major submodels in terms of algorithms and parameterization, quantification of independent model parameters, and validation of the model in terms of reproducing and predicting driver/vehicle behavior. Information requirements are listed below, organized at the top level by driving task being addressed, and at the second level by the following categories
• Conceptual Model: understanding of driver behavior to the point of being able to formulate a conceptual model structure, specity mathematical algorithms, and define independent model parameters
• Driver Limitations data needed to quantity independent model parameters (typically, perceptual limitations or reaction times) that represent inherent limitations to driver performance.
• Driver Preferences: data needed to quantity independent model parameters related to driver behavior presumed to be generally under driver control or choice (e.g., tolerance for lateral acceleration when negotiating curves)
Model validation, which will be needed for all aspects of the DPM, is discussed along with other aspects of the proposed research program later in this chapter.
Driver limitations and driver preferences are distinguished because their quantification may require different kinds of experimentation. For example, in-simulator psychophysical studies may be appropriate in some cases for quantitying perceptual limitations, whereas simulated or on-road
132

driving tasks may be needed to ascertain driver preferences.
Driver tasks, and information categories within each task, are presented in decreasing order of priority, where high-priority items are those most critical to implementation of a valid Driver Performance Module. The resulting list reflects a subjective overall priority based on the following considerations:
• The importance of the behavioral aspect to highway safety given the context of the situations to be addressed by the initial implementation as delineated above.
• The assumed sensitivity of safety-related performance to the function or parameter at issue.
• The degree to which knowledge is lacking
The relevant driver tasks, in decreasing order of priority. are ( I ) speed selection for negotiating horizontal curves. (2) speed control, (3) lane-keeping, and (4) attention sharing Because development of psychologically-valid models of how drivers approach and negotiate curves ranks highest along all three dimensions. information needs associated with this task are of highest priority
The importance assigned to researching issues of speed and path control ranks well below the importance of understanding speed selection. The sensitivity of the overall safety analysis to the details of the related model elements is substantially less, and existing model structures and data provide a good start toward model development in the context of the DPM
A relatively simple model of attention-sharing should suffice for the initial IHSDM implementation of the DPM. and data and models exist as well for this aspect of driver behavior. Attention-sharing thus ranks fourth in priority for research efforts at this stage.
Speed Selection for Negotiating Horizontal Curves
Conceptual Model
Because of the lack of accepted psychologically-valid models for negotiating horizontal curves. conceptual model development is required before the data requirements can be fully defined Hence, model development is given highest priority for this task. Of particular criticality is the need to develop models for speed selection; i.e., for predicting the driver's desired speed and acceleration profiles. The assumption here is that deficiencies in highway design that facilitate accidents on curves are more likely related to the driver's misjudgments in how fast he/she ought to be going, rather than in an inability to control the vehicle about the desired speed and path.
A tentative conceptual model for speed selection is offered here to provide a framework for defining data requirements. This model is based on the assumption that the driver will adopt a strategy similar to what one would propose if designing an automatic control system, subject to driver preferences and information-processing limitations. Note that this model is for speed selection: i.e., the driver's desired speed and acceleration profiles. Models for speed control are
133
discussed later.
Assume the following simplified conceptual model for speed and acceleration selection when approaching, transiting, and leaving a curve, where the curve is located between two tangents that are sufficiently long for the driver to attain a speed that is not influenced by the curve ahead or the curve most recently exited.
1. Braking is accomplished primarily on the approach tangent, speed through the curve is relatively constant, and acceleration to resume speed is accomplished on the exit tangent.
2. The driver will brake in the tangent to achieve some maximum comfortable deceleration.
3. The driver will adopt a desired speed in the curve such that the lateral acceleration is at some maximum allowable value.
4. While on the approach tangent, the driver estimates (l) the distance ahead to the start of the curve, (2) the amount of curvature, (3) the current speed, (4) the speed in the curve that will yield the preferred lateral acceleration, (5) the travel distance required to attain the desired speed reduction when braking at the preferred deceleration, and (6) the distance ahead at which braking should commence.
5. Before the initial braking point is reached, the driver desires to proceed at some relatively high constant speed.
6. Once the initial braking point has been passed, and before the curve is entered, the driver intends to brake at a constant rate of deceleration.
7. The driver plans to transit the curve at constant speed
8. After exiting the curve, the driver intends to accelerate at a constant rate until desired tangent speed is resumed.
This strategy for speed selection assumes that the sight distance to the curve is such that the curve is detected before the point where the driver commences braking at his/her comfortable level of deceleration. Otherwise, the driver brakes as hard as necessary to achieve the desired speed reduction.
In this discussion, the term "braking" is used generically to imply actions taken by the driver to cause the vehicle to slow down, which, in some cases, may he accomplished by simply letting up on the accelerator pedal.
Driver Limitations
QuantifYing the driver's ability to estimate the required speed reduction, and the amount of travel or time needed for the speed reduction, is central to the development of a model for predicting the driver's intended speed profile. In terms of the model offered above, the relevant driver
134
limitations to be quantified are accuracy and precision associated with estimating (1) distance to the curve, (2) degree of curvature, and (3) current speed. Because the driver has the option to look at the speedometer, understanding how the driver estimates speed is less critical than understanding the process involved in estimating curvature and distance.
Information needs with respect to cognitive and response reaction times are not considered important in this context because (1) a substantial data base exists, and (2) if we assume that there will generally be sufficient sight distance to plan and execute the speed profile, the task of negotiating a horizontal curve is largely self-paced, and the driver can largely compensate for reaction time. Reaction time will therefore not be discussed further.
The driver's ability to estimate curvature and the distance to the curvature will likely depend on a number of factors related to highway design, environmental conditions, driver population, and other specifics of the driving situation. Factors of this type influencing driver perceptual, cognitive, and response capabilities will henceforth be referred to as "moderating factors."
Potential moderating factors include:
driver population
familiarity with the road
speed
distance to the start of the curve
degree of curvature length or deflection angle of the curve
superelevation in the curve
the portion of the curve visible to the driver
preview time (time from detection of curve to initiation of braking)
lane and shoulder widths
roadside adjuncts such as pavement markings, reflectors, and guard rails
visibility as affected by time of day, weather, and roadside lighting
feature density of the visual scene
"Driver population" refers here to well-defined demographic groupings that can serve as independent parameters to an experiment: e.g., "old," "young males," "alcohol impaired," etc. "Driver type," on the other hand, refers to behavioral characteristics and is determined on the basis of experimental measurements. For example, if an experiment can be conducted to determine the distribution among the driver population of a parameter such as the standard deviation of the error in estimating curvature, the values of this parameter associated with "high," "moderate," and "low" perceptual capabilities would be taken from appropriate regions of the distribution.
Driver Preferences
This category is ranked third in priority because of the availability of data regarding the following
135

driver preferences:
cruising speed on the approach tangent, prior to braking for curve
deceleration on the approach tangent
lateral acceleration when negotiating the curve
acceleration to resume speed upon exiting the curve
Potential moderating factors for these parameters include:
driver population
vertical profile
vehicle and tire characteristics
road surface conditions
lane and shoulder width
posted speed
Speed Control
For the initial application of the Driver/Vehicle Module as delimited in above, vehicle control is less of an issue than speed selection. The control task is that of following one's own desired speed profile and maintaining proper lane position on a roadway where the horizontal alignment presents a relatively low-bandwidth input. (High roadway bandwidth, or loss of control through skid or rollover, are assumed to be a result of improper speed selection rather than an inherent inability to regulate the vehicle about the desired speed and path.) Because development of driver/vehicle models has been concentrated more toward models for path regulation than for speed regulation, satisfying the information needs relevant to modeling the speed control task takes priority over addressing the path control task.
In the context of the task of negotiating horizontal curves, "speed control" encompasses the task of regulating acceleration or deceleration when approaching or leaving a curve, as well as regulating about a (presumably constant) speed when traveling at the desired speed on long tangents or negotiating the curve. (Recall that headway maintenance is not an issue at this time, as we are assuming operation in the absence of traffic). For the purposes of this discussion, the term "acceleration" is meant to encompass decreasing speed (deceleration) as well as increasing speed.
The prioritization of information deficiencies by category (theoretical model, driver limitations, and driver preferences) depends in part on how the driver regulates speed. To the extent that drivers regulate speed by trying to keep the speedometer needle at a certain point, perceptual limitations are not an issue, and understanding and quantifying driver preferences takes precedence over developing and quantifying a model of relevant perceptual limitations. On the other hand, if drivers tend to regulate speed entirely on the basis of sensory cues, then information deficiencies relating to model structure and parameter calibration dominate. For the purposes of discussion, we consider the more challenging task of modeling the regulation of speed via sensory cues (which might include auditory and motion cues as well as visual scene cues).
136
Conceptual Model
Theoretical model development needs to proceed on along two complementary paths: (1) development of the "front end" perceptual component that specifies the perceptual variables and mechanisms the driver uses to estimate speed and acceleration, and (2) the control strategies for speed and acceleration regulation.
Formulation of the perceptual component of the model requires answers to the following questions:
What cues are likely to be used in estimating speed and acceleration?
What specific model parameters are needed to quantifY accuracy and precision of estimating these cues"~
What algorithm is to be used for representing the estimation process')
For example, if we assume that the driver estimates partly on the retinal size expansion of a stationary object located along side the road, the set of independent model parameters would include parameters related to the driver's variability (ie., precision) in judging size expansion and bias error (accuracy), if any. The perceptual model would include a mathematical expression relating vehicle speed to retinal size expansion.
The possibility that the driver will use a multiplicity of sensory cues requires the development of algorithms for combining these (error-prone) cues into a best estimate of vehicle speed.
A better understanding of the intermittent nature of speed control is required in order to formulate a relevant model for speed controL Driver/vehicle models to date have generally assumed continuous linear control behavior, where the control strategy is modeled by linear differentialdelay equations. Because the requirement to regulate speed is less stringent (in the absence of car-following) than regulating path, the assumption of continuous linear control of speed is less likely to be valid. and data are needed to characterize the presumed intermittence.
We expect that the models for control strategy described in chapter 9, which have been applied to the steering task, can, with adjustments for intermittent behavior, be applied to the speed regulation task as well. The crossover and optimal control models, in particular. are general models for human control of linear systems. If the response of the vehicle to brake and accelerator inputs can be adequately modeled as a low-order linear system for the kinds of driving tasks relevant to the initiallHSDM application, these models should be applicable. As is the case with path regulation, some form of effective "preview" may be needed to account for the driver's anticipatory brake or accelerator adjustments as a change in grade is imminent.
One approach to accounting for intermittent behavior is to adopt a piecewise-continuous model in which intervals of continuous linear control are sandwiched between intervals of no control (i.e, no change in brake or accelerator input) when speed or acceleration error is within an acceptable range. This conceptual model implies "driver preference" model parameters to reflect the speed
137

or acceleration error below which the driver does not initiate a corrective action.
Driver Limitations
Until a conceptual model for speed and acceleration estimation has been formulated in which independent parameters are defined, it is difficult at this stage to be precise about the information requirements concerning driver limitations. In general, such a model will include a number of perceptual cues, and parameters will be defined relating to the precision and accuracy with which these cues are perceived. Data will be needed to quantify these parameters.
Potential moderating factors for visual capabilities include
driver population
roadside adjuncts such as pavement markings, reflectors, and guard rails
visibility as affected by time of day, weather, and roadside lighting
feature density of the visual scene
Likely moderating factors for auditory and motion cues include:
driver population
vehicle characteristics
road surface characteristics
Driver Preferences
If the driver's speed control strategy can be characterized as a succession of intervals of continuous linear control and no control changes, the model will contain "indifference threshold" parameters; i.e .. the difference between estimated and desired speed or acceleration below which the driver takes no corrective control action. Threshold might be best represented as a constant (e.g., hold speed to within 5 kmlh of the desired speed) or as a fraction (e.g., hold speed to within 5% of the desired value). The magnitude of the desired speed should therefore be considered a possible moderating factor for this parameter. Local highway geometry may also be a moderating factor in that the driver may wish to regulate speed more tightly when transiting a curve or when going uphill or downhill.
To understand and model speed control behavior, we also need to know how rapidly the driver corrects speed and acceleration errors. Depending on the specific model algorithm, this aspect of driver response might be represented as a closed-loop driver/vehicle response time (as distinct from driver reaction time), a bandwidth parameter, or some other parameter (e.g., stability margin, relative penalties on error and control) that has the same effect. For the purposes of this discussion, assume the parameter of interest is the time to complete 90~/o of the desired correction.
Whether response time should be considered an aspect of "driver preference" or "driver limitation" depends on the specific circumstances. For operation on long tangents in the absence of traffic, response time can be expected to reflect preference (i.e., driving style) because there is
138
no pressure to make rapid corrections. If a driver enters a curve too fast for comfort or safety, however, the driver may wish to make a rapid speed adjustment, in which case response time may now be limited by the driver's inherent response capabilities.
In summary, the following driver-preference parameters are suggested for quantification:
speed error below which the driver takes no corrective action
acceleration error below which the driver takes no corrective action
response time for speed corrections
response time for acceleration corrections
These parameters are likely to vary with driver population.
Path Control
Path errors are expected to be generally small for the kinds of low-bandwidth driving tasks relevant to this program, and safety decrements arising from inadequate control (eg., due to drowsiness) are generally not related to issues of highway design. Nevertheless, there are a number of reasons for developing and calibrating a model for path control beyond the minimum necessary to construct a diver/vehicle model
• Poor delineation oflane and pavement edges under poor visibility conditions( e.g. night), which is properly considered within the framework of highway design, may lead to nonnegligible errors.
To the extent that path errors increase with speed, and drivers adjust speeds on long tangents to just keep these errors at a comfortable level, path control becomes potentially relevant to models for speed selection and control when negotiating curves.
• Sources of randomness in path regulation are needed for model credibility.
To understand the issue of credibility, consider the behavior of a model that has no source of external or driver-induced variability If the simulation is initiated with the vehicle centered at the beginning of a long, flat tangent section with no explicit disturbance inputs, the model will predict that the vehicle proceeds perfectly along lane center even when no attention is devoted to the visual scene cues relevant to vehicle control. Repeated trials will replicate the same behavior. This behavior is unrealistic, because ( I ) there are always small external forces or inadvertent driver inputs acting on the vehicle that would eventually cause the vehicle to leave a straight road if the driver did not at least occasionally attend to the task and make corrective inputs, and (2) repeated trials will always show some variability in the path generated by the vehicle.
Iffor no other reason than to provide the user with confidence that the driver/vehicle model produces reasonable results, randomness should be included in the model for path control. To accommodate randomness, information is required for two kinds of conceptual models - the driver model, and one or more models for external disturbance inputs.
139
Conceptual Model for Disturbance Inputs
As noted in previous discussion, wind and road roughness are potential sources of randomappearing disturbances. Some model development and calibration data are therefore required. A significant model development effort does not appear to be warranted, however. Models found in the literature, such as the model for road-roughness inputs utilized in the study by Levison and Cramer (1995), should suffice for the initial IHSDM implementation.
Conceptual Model for Driver Behavior
As noted above, development and application of models for path control (i.e., lane-keeping) have been in progress for some time. Nevertheless, more information is needed to extend existing models to meet fully the needs of the Driver Performance Module.
Existing steering models, which are based on control theory, work best for high-workload situations in which there are significant command inputs (e.g, follow a winding road), significant disturbance inputs (e.g., wind gust and/or road roughness), or a combination of the two. In this situation, the driver's strategy for achieving good performance is relatively constrained, and control-theory models that are based explicitly or implicitly on notions of optimal performance, properly augmented to account for human information-processing limitations, stand a good chance of replicating driver/vehicle behavior.
Modeling of driver steering behavior on a straight tangent in calm weather is more difficult in the sense that the low "input demand" allows the driver considerable leeway in maintaining good performance (where "good performance" might be defined simply as staying in the lane) The same considerations should apply for maintaining lane position when transiting a long curve of constant curvature at a constant speed: the only "input" is the constant curvature which, in theory, can be accommodated by a fixed steering wheel displacement. (The rate of change of curvature associated with transition from tangent to curved segments, on the other hand, may impose a substantial input demand.)
Modeling lane-keeping behavior on long tangents can therefore be expected to differ qualitatively from modeling lane-keeping behavior in high-workload situations in that (1) lane-keeping errors will be more dependent on driver preferences - e.g., how close to lane center the driver wishes to maintain the vehicle, and (2) driver behavior is more likely to be discontinuous in nature. In this respect, information requirements for the lane-keeping model are similar to those for the speed control mode, and the following questions need to be addressed with regard to formulating the appropriate conceptual model:
• To what extent can lane-keeping in low-workload situations be represented as a piecewisecontinuous control process?
• What is the condition that triggers a corrective response?
• What specific model parameters are needed to quantify accuracy and precision of estimating the visual cues used for maintaining lane position?
140
• What algorithm is to be used for representing the estimation process')
Driver Preferences
Because lane-keeping is expected to be a low-workload task for the kinds of driving environments addressed in this report, performance is more likely to be limited by how tightly the driver desires to control path, rather than by inherent performance limitations. (Driver capabilities may be a significant determinant of performance, however, if rapid steering action is needed to correct a significant off-center position resulting from taking a curve too fast.)
As is the case with speed control, the model for path control is expected to include at least one parameter retlective of an indifference threshold, and a parameter relating to response time. Information is required to quantifY these parameters. Potential moderating factors include
driver population
speed
curvature and imminent change of curvature
lane and shoulder widths
vehicle characteristics
Driver Limitations
Information is needed to quanti(v the model parameters related to the driver's ability to estimate path deviation and other cues that might be used for regulating path (such as heading error, yawrate, time to reach lane edge in the absence of corrective actions, etc.) Potential moderating factors include
driver population
lane width
pavement markings
lighting
visibility related to time of day and weather
Attention Sharing
We have recommended that the first implementation of the Driver/Vehicle Module in the IHSDM be restricted to driving environments where the necessity to detect and interpret speed advisories provides the only explicit requirement to divert attention from cues directly relevant to vehicle control. This restriction greatly simplifies the model for attention-sharing needed at this time. Development of a model to account for the full range of attentional demands in the modem driving environment would require a substantially larger effort that is tangential to the evaluation of highway design. (If we assume that the driver refers frequently to the speedometer when executing a desired speed profile, the attention sharing model will need to be expanded accordingly. )
In principle, the DPM should include algorithms for all secondary tasks performed by the driver as
141

well as for the primary vehicle control task. For simple tasks, these tasks are characterized in terms of time required for their performance (and perhaps in terms of their criticality), but not in terms of task performance. That is, the driver is assumed to perform the secondary task long enough to satisfy task requirements. Such tasks can therefore be modeled as determinants of the driver's scanning behavior and are thus considered as part of the model for attention sharing.
Conceptual Model
An algorithm needs to be developed (or taken from the literature) to embody a rule or set of rules for the shifting of attention among the driving and visual monitoring task(s). Such a model will most likely contain parameters related to glance durations, relative criticalities, and so forth. To the extent that attention behavior reflects driving style, these parameters will be categorized as driver preference. Other parameters reflecting information processing limitations (e.g., time to interpret a message) are considered as driver limitations.
A model for attention-sharing based on the notion of minimizing the penalty for inattention to various information sources has been proposed for driving environments with a multiplicity of competing visual and auditory tasks. (Levison, 1993; Levison and Cramer, 1995) A simplified version of this model might serve as a starting point for an attention sharing model based on notions of cause-and-effect. An alternative approach, which may be adequate for the initial IHSDM application, is to assume fixed scanning patterns
Because of the limited sophistication required for the attention sharing model for the contemplated IHSDM application, and the considerable literature on scanning behavior, relatively little in the way of original development should be required to satisfy information needs for the attention-sharing aspect of the DPM
Driver Limitations
As with the previous component models, information requirements will depend on the specific model adopted for attention sharing. Information to quantify parameters of the following type will be needed:
distance at which traffic advisories become readable
time required to interpret the advisory
minimum dwell time for driving-related cues
Both reading distance and reading time will be a function of visibility conditions as determined by weather and roadside lighting, size of the text, driver population, and other factors affecting contrast.
Driyer Preference
Data will be required (or assumptions made) to specify one or more parameters that determine the scan pattern. One approach is to assume a fixed scan pattern, in which case the dwell time on and off road must be specified. Another approach is to assume some form of cause-and-effect model
142
based on the instantaneous state of the world, with a parameter reflecting the relative importance of searching for a traffic advisory versus attending to driving cues.
Review of Information Requirements
Information requirements are summarized in table 19, organized in terms of criticality and level of effort (LOE) to provide guidance for formulating a research program. Criticality relates to the necessity of obtaining the information, and LOE relates to the amount of new research that would be needed to obtain the data. Requirements are organized within each criticality level in order of decreasing priority as based on the same considerations stated earlier:
• The importance of the behavioral aspect to highway safety given the context of the situations to be addressed by the initial implementation.
• The assumed sensitivity of safety-related performance to the function or parameter at issue.
• The degree to which knowledge is lacking
Three levels of criticality are defined. Level I includes infonnation requirements that must be satisfied in order to be able to implement the DPM. Level 2 requirements are those that ought to be satisfied in order to have a truly credible model. Level 3 requirements may be deferred without serious consequence if necessary to meet resource constraints.
Three levels of effort are also identified. Level I implies substantial research either in tenns of conceptual model development or data collection. Level:2 implies that a lesser LOE is appropriate, because existing models and data are available to provide much of the needed information, and/or the need for additional theoretical and experimental work to satisfy the goals of the initial IHSDM implementation is relatively modest Level 3 implies that the required information can largely be extracted from the literature.
Criticality I requirements include information relevant to development and calibration of a model for speed selection plus selection of algorithms for speed and path control, all of which are necessary to construct the driver/vehicle model. A substantial research effort is anticipated to develop algorithms and acquire data on driver limitations for the speed selection model. Models and data found in the literature reduce the effort to quantify driver preferences with respect to speed selection in and approaching curves and to develop usable models for speed and path control.
Information requirements categorized as Criticality 2 are oriented to expanding and generally improving the accuracy and psychological validity of the speed and path control models. Because the data base regarding path control and steering behavior is more extensive than that relating to speed control, we assume that a substantially greater level of effort would be required to develop speed control models to the same level of sophistication and validity as path control models.
143
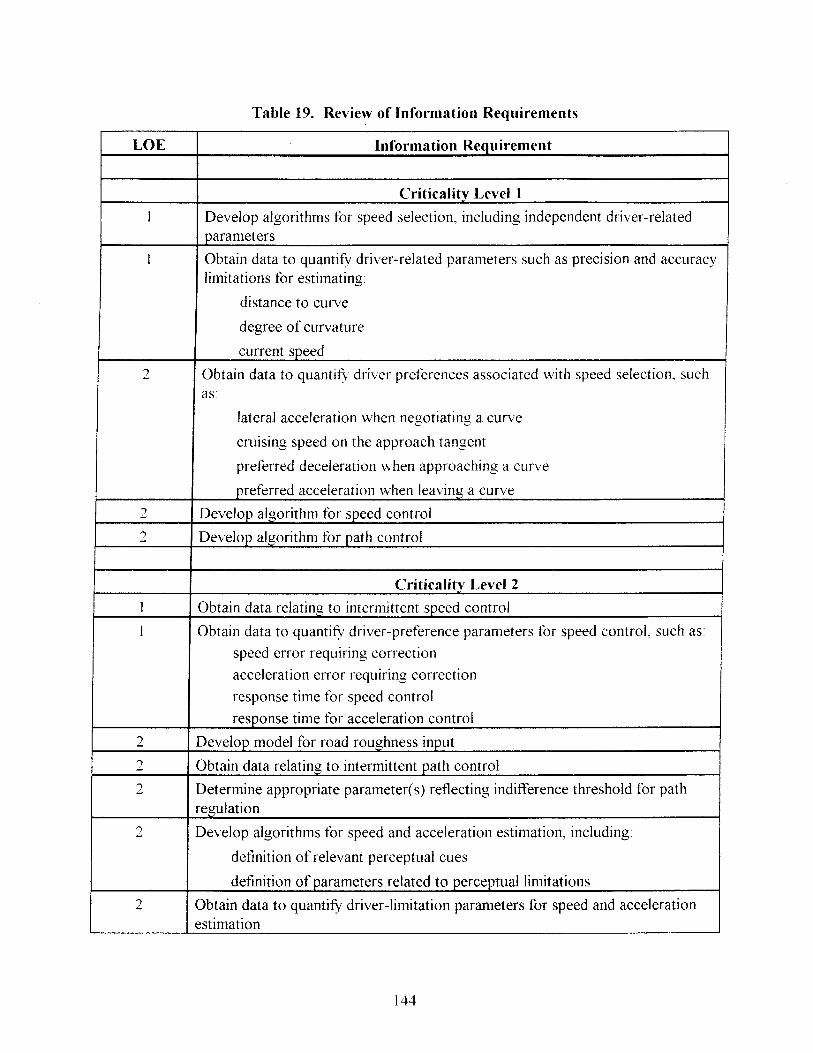
Table 19. Review of Information Requirements
LOE Information Requirement
Criticality Level 1
1 Develop algorithms for speed selection, including independent driver-related parameters
1 Obtain data to quantify driver-related parameters such as precision and accuracy limitations for estimating:
distance to curve
degree of curvature
current speed
2 Obtain data to quantify driver preferences associated with speed selection, such as:
lateral acceleration when negotiating a curve
cruising speed on the approach tangent
preferred deceleration when approaching a curve
preferred acceleration when leaving a curve
2 Develop algorithm for speed control
2 Develop algorithm for path control
Criticality Level 2
1 Obtain data relating to intermittent speed control
1 Obtain data to quantify driver-preference parameters for speed control. such as:
speed error requiring correction
acceleration error requiring correction
response time for speed control
response time for acceleration control
2 Develop model for road roughness input
2 Obtain data relating to intermittent path control
2 Determine appropriate parameter( s) reflecting indifference threshold for path regulation
2 Develop algorithms for speed and acceleration estimation, including:
definition of relevant perceptual cues
definition of parameters related to perceptual limitations
2 Obtain data to quantify driver-limitation parameters for speed and acceleration estimation
144

Table 19. Review of Information Requirements (Continued)
LOE Information Requirements
2 Obtain data to quantifY driver preferences relevant to path control:
indifference threshold or equivalent
response time or equivalent
2 Develop algorithm for path estimation, including definition of parameters related to perceptual limitations
2 Obtain data to quantifY perceptual limitations relevant to path control
Criticality Level 3
" Develop or select algorithm for attention sharing -'
" Obtain data quantifYing parameters of the monitoring tasks, including -'
distance at which speed advisories become readable
time required to acquire information from speed advisories
time required to read speedometer (if relevant)
minimum glance time for driving-related visual scene cues
" Obtain data to quantifY driver-preference parameters relating to scan pattern -'
2 Develop model for wind and effect of wind on vehicle
Information requirements related to development of models for attention are considered Criticality 3 because the safety analysis anticipated from the initial Driver/Vehicle Module is expected to be relatively insensitive to attention sharing behavior because of the nature of the tasks under consideration (ie, minimal attention-sharing requirements). Workload is expected to be relatively low on the approach tangent. in which case performance (particularly, speed selection and control) should be little affected by whether or not the driver shares attention. If the workload increases appreciably during entry and transit of the curve, the attention model would presumably direct full attention to the driving task.
Development of a wind model - both the characterization of the wind and the modeling of the effects of the wind on the vehicle - is best deferred. Except in unusual circumstances (certain mountain passes), wind is not a highway design factor.
PROPOSED RESEARCH PROGRAM
The overall objective of the research program outlined here is to obtain data that will satisfY some or all of the information requirements described above in order to facilitate development, calibration, and validation of the Driver Performance Module. In this context, "data" includes development of conceptual models as well as acquisition of human performance data.
145

Three studies are suggested to provide information relevant to the following driver tasks ( I) speed selection, (2) speed control, and (3) path control Each of these studies involves conceptual model development and data collection involving simulator and/or on-road experiments.
Because the goal of the proposed program is to support model development, it is important that a tentative model be formulated prior to experimentation so that the experimental program can be properly focused. Fortunately, the availability of a considerable body of experimental data and model development relevant to driver/vehicle behavior provides a solid basis for initiating each study with conceptual model development.
Studies conducted in fixed-base driving simulators are appropriate for calibrating model parameters in situations where the useful perceptual cues are primarily visual and where precise control over the task environment is required In-simulator studies may involve interactive simulation in which the subjects performs simple driving tasks, or passive simulation in which the subject makes judgments based on observations of visual scenes. To study driving tasks in which multisensory cuing is important (e.g., whole-body acceleration), or where the visual cues may be particularly subtle, data should be obtained on road or in a moving-base driving simulator capable of high-quality visual and motion cuing
For each of the model-formulation activities suggested below, a literature search should be performed to identifY potentially relevant model structures, mathematical algorithms, driver/vehicle and other human performance data. The literature summarized in the appendix of this report and other references cited herein should provide a useful start on this task. Existing models and data should be used where applicable, and new or revised model structures derived as needed to define algorithms and independent parameters for the components of the DPM.
Conceptual modeling should be undertaken with the goal of developing models that are psychologically valid in the sense that (1) the mathematical operations performed by the algorithms reflect perceptual, cognitive, and motor activities that the human can be reasonably expected to perform, and (2) the independent model parameters can be directly related to driver preferences or to psychophysical limitations.
The experimental studies suggested below should be designed to provide data sufficient to define within-subject and across-subject statistics (e.g. mean and standard deviation, or probability distribution) of the primary measurements, and these statistics should provide the basis for quantifYing the relevant driver model parameters. Wherever feasible, test subjects should be drawn from at least two age-defined populations: the broad middle range (e.g., 25 to 65 years), and an older population. Male and female drivers should be represented in roughly equal proportions.
To determine how much data to collect, goals should be set as to the desired confidence limits for the various tests to be made. (For example, if investigating differences in the speed with which older and younger drivers negotiate a given curve, and if ( 1) a 10 km/h difference is considered to be operationally important and (2) if such a difference exists we want to be confident at the 0.05 level that there is a performance difference, then obtain enough data to generate this amount of statistical power.) Given these requirements, use a best initial estimate of response variability to
146
determine the number of subjects, and the number of trials per subject. If the initial estimate proves to be incorrect, the amount of data collection may need to be revised during the course of the experiment.
The research program outlined here is expected to provide information sufficient for an initial implementation of the Driver Performance Module in the IHSDM. As noted earlier, however, the implementation of a high-fidelity driver model applicable to a wide variety of driving environments is expected to require a long-term iterative procedure in which new observations of driver behavior lead to revisions of the modeL which, in turn, may suggest additional experiments for model calibration and validation.
Study 1: Speed Selection for Curve Negotiation
Research Obiectives
The objectives of this study are to develop algorithms and to define and calibrate independent model parameters with respect to the task of selecting speed and acceleration profiles when approaching, negotiating, and leaving horizontal curves. Specific objectives are:
develop algorithms for speed selection
develop algorithms for the estimation of critical variables used for speed selection
quantifY parameters of the speed decision model element related to the estimation of relevant variables
Outline of Research
The preceding discussion of speed selection provides a start for formulating a conceptual model for speed and acceleration selection. Other model forms should be explored as well before a particular algorithm is selected as the basis for the subsequent experimental study. Psychologically-valid algorithms must be developed for the driver's estimation of critical variables relevant to speed selection.
An experimental study involving passive simulation is suggested in which the subject observes visual scenes as might be seen from a vehicle traveling on a tangent approaching a curve. A fixedbase driving simulator capable of generating high-quality visual scenes is recommended for this study. A series of psychophysical studies is conducted to quantifY the subject's ability to estimate variables relevant to speed selection
The specific variables of interest depend on the conceptual model developed tor this aspect of the DPM. If the tentative model described above were to be adopted, tests might be performed to quantifY the driver's ability to estimate:
distance from the vehicle to the upcoming curve
amount of curvature
current speed
Environmental variables expected to have a signiticant impact on the subjects' response should
147

serve as independent variables of this study Potential variables include
driver population
parameters of the curved road segment
distance ahead to the curve
lane and shoulder widths
roadside and other variables influencing visibility
complexity of the visual scene
Level of Effort
Approximately 9 person-months of personnel reflecting different labor categories (e.g., principal investigator, scientist, data analyst, technician) are anticipated. Total cost will depend on the number and size of the driver populations to be tested. Assuming two populations of 20 to 30 subjects each, a rough estimate of the cost of this effort, including labor plus use of a high-quality visual simulator and test subjects is around $250 to 350 thousand
Study 2: Speed Control
Research Objectives
The objectives of this study are to develop algorithms and obtain data relevant to the speed selection and speed control elements of the Driver Performance Module. Specific objectives are
develop algorithms for speed and acceleration control
develop algorithms for estimation of critical variables used for speed and acceleration control
obtain data relating to intermittent speed control
quantifY parameters of the speed decision model classified as "driver preferences"
quantifY parameters of the speed control model classified as "driver preferences"
quantifY parameters of the path control model classified as "driver limitations"
perform on-road or in-simulator studies to validate the speed selection and speed control models
Outline of Research
Models for manual control that have been reported in the literature provide a basis for the development of a conceptual model for speed and acceleration controL Application of existing algorithms may require modification to account for intermittent control behavior.
Psychologically-valid algorithms for the driver's estimation of critical variables relevant to speed and acceleration control should be developed. Algorithms for estimation reported in the literature and reviewed briefly in chapter 9 may provide guidance for initial development.
A series of experimental studies is suggested for model calibration and validation. The driving tasks to be explored are such that the driver is likely to make use of subtle visual cues, and to make use of non-visual cues - primarily whole-body motion cues (longitudinal and lateral
148
acceleration, and "tilt" cues when on grades), and possibly auditory cues as welL Accordingly, these studies should be performed on-road and/or in driving simulators capable of high-quality visual and motion cuing.
Two classes of studies are suggested. "Part-task" studies employing psychophysical and/or realistic driving tasks are intended primarily to calibrate parameters of the speed decision and speed control models. "Whole-task" studies involving complex driving tasks will provide data for additional model calibrations and for model validation.
Part-task Studies for Model Calibration
The part -task studies will provide data for (l) testing certain assumptions concerning speed and acceleration control, (2) exploring the driver's use of the speedometer, and (3) calibrating model parameters associated with driver preference and driver limitations.
If the conceptual model for speed control incorporates the assumptions expressed earlier, the experimental data should be analyzed to determine the extent to which speed and acceleration regulation can be considered a,s continuous linear processes, or as piecewise-continuous (i.e, intermittent) processes. To the extent that these assumptions are violated, the conceptual model should be adjusted to account for observed driver behavior.
At least one experiment should be conducted, involving the measurement of eye point of regard, to determine the extent to which the driver uses the speedometer as a speed reference when maintaining constant speed and when implementing a specific speed change
One or more experiments should be conducted to provide data sufficient to calibrate model parameters of the following type:
minimum speed and acceleration errors that elicit corrective responses, where "error" is the difference between actual and desired values
response time associated with a corrective response
preferred acceleration/deceleration levels when changing speeds on tangents
perceptual "thresholds" associated with estimating speed and acceleration errors
Environmental variables expected to have a significant impact on driver/vehicle behavior should serve as independent variables to these part-task studies. Potential variables include:
driver population
grade
vehicle characteristics
initial and terminal speeds
lane and shoulder widths
\Vhole-Task Studies for Further Calibration and for Model Validation
The whole-task studies will provide the opportunity to test additional aspects of speed and
149
acceleration regulation and to obtain data to test the model's capability to replicate/predict drivervehicle behavior for realistic driving tasks. The driving tasks should be based on the scenarios described in chapter 4 and should include a variety of horizontal and vertical curves, singly and in combination.
Specific behaviors to be tested include:
1. The extent to which the driver employs constant decelerations and accelerations when approachjng or leaving curves, and constant speeds when negotiating the curves.
2. The extent to which the driver negotiates a curve with a path reflecting a degree of curvature different from that of the curved highway section.
3. Effects of familiarity with the road.
4. Strategies for approaching curves \vhen sight distance is limited.
5. Degree of compliance with speed advisories on curves.
6. Preferred lateral accelerations when transiting curves.
Model parameters relating to these behaviors should be quantitled on the basis of the results of this study. Deviations of measured behavior from those assumed when formulating the conceptual model will require appropriate model revisions.
The driving scenarios used in the whole-task study will of necessity manipulate independent variables relating to curve geometry and vehicle speed. Potential additional independent variables include:
driver type
vehicle characteristics
environmental factors influencing visibility
Level of Effort
Approximately 13 person-months of personnel reflecting different labor categories (e.g." principal investigator, scientist, data analyst, technician) are anticipated. Again the cost of the effort depends in part on the number of subjects, as well as the mix of in-simulator and on-road investigation. A rough estimate, including labor, test subjects, and equipment use is around $350 to 500 thousand.
Study 3: Path Control
Research Objectives
The objectives of this study are to develop algorithms and to define and calibrate independent
150
parameters of the path control model Specitic objectives are
develop algorithms for path control
develop algorithms for the estimation of critical variables used for path control
develop algorithms for modeling road roughness inputs
develop algorithms for attention sharing
obtain data relevant to intermittent path control
quantifY parameters of the path control model classified as "driver preferences"
quantifY parameters of the path control model classified as "driver limitations"
Outline of Research
The existing models for path control reviewed in chapter 9 provide a basis tor the development of a conceptual model for path control Application of an existing algorithm may require modification to account for intermittent control behavior
Psychologically-valid algorithms for the driver's estimation of critical variables relevant to path control should be developed. Algorithms developed in the earlier phases of this research program should be largely applicable.
Development of algorithms tor road roughness inputs and for attention-sharing may be based on work reported in the literature. These algorithms should be sufficient to result in realisticappearing driver and vehicle behavior when simulating travel on long tangents.
Data obtained in the experiments conducted in Study 2 will be useful for initial calibration and testing the path control model To provide a more precise calibration, a series of data collection studies is recommended involving both passive and active simulation conducted in a fixed-base driving simulator capable of provide high-quality visual scene cues. A psychophysical study is suggested to quantifY the subject's ability to estimate critical parameters used for regulating vehicle path when traveling on a long tangent. The primary variable to be tested is the subject's estimate of path error Ability to estimate other cues such as heading and curvature (yaw-rate) errors may be tested as well.
A study in which the driver actively controls the simulated vehicle is then performed to determine the extent to which path control may be considered an intermittent -continuous control process, and to determine the driver's preferences in terms of how tightly, and how rapidly, the driver regulates path errors when traveling on a long tangent or in a curved segment with low-level disturbance inputs as might be imparted by road roughness or by the driver Steering wheel deflection and distance from center lane position are the primary measurement variables. Other related variables such as heading and yaw-rate errors may be measured as well. If necessary, the conceptual model for path control should be revised to replicate behavior inferred from the data.
Model parameters of the following type are expected to be calibrated in this simulation study:
minimum path error eliciting a corrective response
response time associated with a corrective response
151
perceptual "threshold" associated with estimating path error
Environmental variables expected to have a significant impact on the subjects' response should serve as independent variables of this study. Potential variables include:
driver population
speed
vehicle characteristics
curvature
lane and shoulder widths
roadside and other variables influencing visibility
Level of Effort
The level of effort will depend not only on the number of test subjects but also on the extent to which data from the second study satisfY the needs of this study. On the assumption that there is significant carry over trom the previous study (or that this study is partially integrated into the previous study). additional costs of this effort should be on the order of$200 to $300 thousand.
152
ApPEl'iDIX A: DATA SOlJRCES FOR IHSDM lVloDllLES
POLICY REVIEW MODULE
Background
The purpose of the design policy review module is to provide a means to measure the geometric elements of the roadway design and compare them against established geometric criteria. This is an important part of the IHSDM because all safety issues will not be able to be addressed by the . .
accident prediction module and to provide a bridge to established methods of addressing safety in the design of roadways. The design policy review module will also provide a formal mechanism for documenting the need for design waivers on a project.
There are three major sources of design criteria currently utilized in road\vay design
•
•
•
AASHTO (J 994) A Policy on Geometric Design of Highways and Streets. American Association of State Highway and Transportation Officials (The "Green Book")
FHW A (1988). Manual on Uniform Traffic Control Devices for Streets and Highwavs US Department of Transportation, Federal Highway Administration.
AASHTO (J 988) Roadside Design Guide American Association of State Highway and Transportation Officials
The AASHTO Green Book includes the major geometric design criteria relative to the design of horizontal and vertical alignment roadway cross-section. intersections. and interchanges. The MUTeD provides design criteria for tranic control devices including pavement markings, signs and traffic signals. The Roadside Design Guide provides design criteria for roadside slopes and barriers. All three of these design policies are based on roadway functional classification. design speed and average daily traffic (ADT) Additional traffic information relative to vehicle type and volume distribution may also be necessary in establishing project design criteria.
Existing Sources
A review of the literature relative to the design policy review module focused on the model itself and current research regarding proposed changes to establish design policy.
Research regarding AASHTO's current design policy reveals that speed and sight distance are basic elements addressed in the design criteria for roadway and intersection geometry. Evaluation of design criteria is for stopping sight distance, passing sight distance, and intersection sight distance suggests that some method for incorporating future changes to the AASHTO Green Book should be provided in the design policy review module of the IHSDM (Reagan, 1994.)
As noted in the conceptual model for the IHSDM. the design policy review module will include
153

AASHTO and FHW A design policy and also a method for supplementing these with State or local design criteria (Harwood & Glennon, 1989.)
Some of the problems identified with stopping sight distance methodology include variability in driver vision requirements and vehicle characteristics, the low probability of an accident with a 152.4mm(6-in) high object and overly conservative frictional coefficients (Hall & Turner, 1989.)
There is currently a clear incompatibility between the AASHTO Green Book and MUTCD on passing sight distance criteria. This raises the distinct possibility that the design policy review module may show a design meeting one standard while violating the other. An alternate methodology based on the opoint of no returno or critical position concept has been recommended as well as the suggestion that other vehicles other than passenger cars be incorporated into the methodology (Harwood & Glennon) This suggests that the design policy review module shall probably be based on equation based design criteria rather than tabular data whenever possible to facilitate future changes in design criteria methodology.
Recent articles have looked at the influence of newer longer trucks on existing design criteria specifically intersection sight distance. An alternative methodology based on the gaps a driver safely accepts during intersection operations has been recommended (Fitzpatrick, et ai, 1993.)
A review of the literature suggests that the design policy review module of the IHSDM will need to be
• Flexible enough to incorporate AASHTO and future design criteria and also be able to be modified to reflect state and local criteria.
• Equation based to the maximum extent feasible rather than data table based to allow for future changes in methodology.
• Prepared to allow for conflicting design criteria evaluation results of the same roadway design element.
DESIGN CONSISTENCY MODULE
Background
The Design Consistency Module (DCM) of the IHSDM will focus on the reaction of drivers to expected and unexpected geometric design and speed conditions. This research concentrates on the development of an IHSDM for two-lane rural bighways. The DCM will interface with the driver/vehicle module to determine speed profiles and with the CAD Package to establish geometric design elements. The DCM, in its role within the overall IHSDM, will check for roadway characteristics that could violate driver expectancy.
A geometric design inconsistency has been defined by the FHW A (Krammes, et ai., 1995) as "a change of such magnitude and unexpected nature in the physical dimensions and appearance in the roadway between adjacent sections that unfamiliar or moderately inattentive drivers may be
154
surprised, confused, and misled into making potentially unsafe driving maneuvers."
The state of the practice in highway geometric design consistency was determined through a review of US. and foreign geometric design policy, and research (Krammes, et ai, 1995.) Models, and a menu-driven microcomputer procedure for their use, were developed for operating-speed and driver-workload consistency evaluations of rural two-lane highway horizontal alignments. The operating-speed model was calibrated based upon speed and geometry data for 138 horizontal curves and 78 of their approach tangents in five States. The driver workload model was calibrated based upon two occluded vision test studies on a total of 55 subjects. The operating-speed data suggest that 85th percentile speeds generally exceed the design speed of horizontal curves whose design speed is less than driver's desired speed (i.e, 85th percentile speed on long tangents). A preliminary evaluation comparing model-estimated operating-speed reductions versus degree of curvature as predictors of accident experience was conducted using a data base of 1,126 curve sites in three States. The evaluation suggests that accident experience increases as the required speed reduction from an approach tangent to a horizontal curve increases.
Research by Ellis (1972) focuses on the driver expectancy component of the traffic system of driver, vehicle, and the situational context of the roadway, all closely related to design consistency. Objectives were to: define driver expectancy operationally; delineate factors which influence driver expectancy; and. propose a design philosophy accompanied by an analytical technique for implementing driver expectancy criteria. An operational definition was developed which defines driver expectancy in terms of the conditions it caused rather than the conditions that caused it. This definition is stated as "an observable, measurable change in the driving environment which increases a driver's readiness to perform a driving task in a particular manner and. in addition, causes him to persist in this behavior until it is completed or interrupted by other environmental circumstances or changes"
Following are key elements that establish design consistency and the associated driver expectancy
speed
geometry
sight distance
Speed
The basic requirements for the DCM are consistent with the American Association of State Highway and Transportation Officials policies on geometric design (AASHTO, 1990) These policies focus on the concept of design speed, which is "the maximum safe speed that can be maintained over a specific section of highway when conditions are so favorable that design features of the highway govern."
The desirable situation is to have design speeds and operating speeds as similar as possible. Likewise, speed on contiguous sections of roadways with different geometric design characteristics should not differ greatly. Significant variations from these concepts can violate driver expectancy and diminish safety factors Reasons for inconsistency in geometric design can
155

be attributed to changes in design standards over the years as vehicle pertormance and equipment have improved. differences in interpretation and implementation of standards, and less than desirable transitions between improved and unimproved sections of roadway Recent research by Ottesen and Krammes ( 1994) confirms the importance of the relationships between operating speeds and driver consistency.
Krammes (1994) also reviewed current definitions of design speed, operating speed. and design consistency as well as the origins of the design speed concept Recent empirical data demonstrate a disparity between design speed and operating speeds in the U.s.
Geometry
The FHW A sponsored a study (FHW A. 1981) which describes the development of a procedure that can be used to determine the hazardous effects of highway geometric design features which are not consistent with a driver's expectations The study team used a collection of information
. sources, subjective evaluations. and personal experiences to prepare a list of 12 rural. non-freeway troublesome design elements and element combinations. Laboratory and field evaluations were conducted containing these 12 element and feature combinations.
These 12 element and feature combinations. identified in priority ranking, were
horizontal and vertical alignment in combination
vertical alignment in combination with an intersection
horizontal alignment in combination with an intersection
intersections
lane drop and an alignment change in combination
divided highway transition and an alignment change in combination
horizontal alignment change
lane drops
divided highway transitions
lane width reductions
vertical alignment change
shoulder width reductions
Special Report 214 of the Transportation Research Board (TRB, 1987) suggests that horizontal and vertical curvature be based upon the disparity between a curve's design speed and the 85th percentile operating speed. The study found that some states modifY guidelines to emphasize proven accident experience. If the feature is deficient but does not have an accident. an improvement is not mandated.
For horizontal curvature, Special Report 214 recommends:
"Highway agencies should increase the superelevation of horizontal curves when the design speed of an existing curve is below the running speeds of approaching vehicles and the existing superelevation is below the allowable maximum specified by AASHTO new
156
construction policies. Highway agencies should evaluate reconstruction of horizontal curves when the design speed of the existing curve is more than 15 mph [24.15 kph] below the running speeds of approaching vehicles (assuming the improved superelevation cannot reduce this difference below 15 mph [24.15 kph D and the average daily traffic volume is greater than 750 vehicles per day."
F or vertical curvature, Special Report 214 recommends
"Highway agencies should evaluate the reconstruction of hill crests when (a) the hill crest hides from view major hazards such as intersections, sharp horizontal curves, or narrow bridges; (b) the average daily traffic is greater than 1,500 vehicles per day; and (c) the design speed of the hill crest (based on the minimum stopping sight distance provided) is more than 20 mph [32.2 kph] below the running speeds of vehicles on the crest"
Sight Distance
Properly designed roadways should provide the driver \vith an adequate sight distance, in accordance with reasonable expectancy and, particularly, a safe-stopping sight distance. A study by Gattis and Duncan (] 995) addresses minimum geometric conditions that must exist to provide an ample amount of"preview sight distance" (PVSD) for comfortable and safe traffic operations The PVSD concept is based on the assumption that the driver views or opreviewso the roadway surface ahead, as well as other cues that may lie ahead. to obtain the information needed for vehicular control and guidance. The driver needs a minimum PVSD in order to perceive and respond to upcoming alignment cues. The roadway geometry affects how much PVSD is adequate for the design speed, but a roadway with constrained design features may have inadequate PVSD. The study includes a derivation of equations to calculate the available preview sight distance on a crest vertical curve, and discusses two applications of the PVSD concept to sharp horizontal curves. When a geometric analysis tlnds that inadequate PVSD exists, upgraded signing or pavement marking to provide the driver with extra positive guidance may be considered as a means of compensating for inadequate PVSD.
A Transportation Research Board technical session on highway sight distance issues generated a number of papers and presentations. Glennon (] 989) prepared an overview of the session in which he critiques AASHTO policy and its shortcomings regarding sight distance criteria. The author suggests that the "Green Book" does not adequately reflect the views of the highway community as a whole and that it does not retlect the technology available at the time of preparation. Stopping sight distance, passing sight distance, intersection sight distance, and railroad-highway grade crossing sight distance criteria in the Green Book are each critiqued.
Hall and Turner (1989) further examine the development of stopping sight distance (SSD) methodology over the past 75 years. Publications between 1914 and 1940 show that sight distance became increasingly important, but that it was not thoroughly understood. The emphasis during this period was on letting drivers see other vehicles in sufficient time to take evasive action. This concept changed drastically with the 1940 publication of AASHTO' s classic methodology, which made specific reference to objects, eye heights, and driver perception and reaction times. Evidence shows that the new procedures were gradually assimilated into the
157
design process. Since 1940, emphasis has been on tine tuning the methodology by moditying its parameters. Characteristics and weaknesses of the methodology are discussed through a review of the recent technical literature. Five potential problems with the current AASHTO policies are discussed.
Passing sight distance design for passenger cars and trucks has been studied by Harwood and Glennon (1989). Two major aspects of passing and no-passing zone marking criteria determine the safety and operational effectiveness of the passing and no-passing zones marked on two-lane highways: passing sight distance and passing zone length. Safe passing maneuvers require both adequate passing sight distance and adequate passing zone length. Recent debate over passing zone design and marking criteria has tended to focus only on passing sight distance and to ignore passing zone length. The authors give thorough consideration to the important roles of both factors based on recent advances in modeling the kinematic relationships among the passing, passed, and opposing vehicles.
Current passing and no-passing zone marking criteria use the passenger car as the design vehicle. The authors consider the effect on passing sight distance and passing zone length requirements if the passed vehicle, the passing vehicle, or both are large trucks.
ACCIDENT ANALYSIS MODllLE
Oven'iew of Accident Analysis Module
Several studies have been conducted in the past to develop models that predict accidents. The accident analysis module is envisioned to be an interactive program within the IHSDM. It will be developed from past accident experience for specitlc geometric contigurations. Its primary purpose is to estimate safety effects of specific geometric design or improvement alternatives. Data from the Highway Safety Information System is the primary source of developing these estimates. Following guidelines will be followed in developing accident analysis module (Hardwood, Mason, & Graham, 1994)
• The accident analysis module is intended to estimate safety performance of a design alternative.
The IHSDM should be developed in a modular way that will allow future improvements in the accident analysis modules to be added to the IHSDM as they are made. . .
Safety relationships in the accident analysis module should include traffic characteristics along with geometric features.
• The analysis model should be validated using a dataset that is independent of the dataset used to develop the model and an approach that is completely different from the approach that is used in developing the model
158
Description of Accident Submodel
The following four submodels, each comprised of a distinct section of the highway, constitute the IHSDM accident analysis module
roadway accident submodel
intersection accident submodel
interchange ramp accident submodel
roadside accident sub model
Separate accident rate and/or severity estimates will be calculated for each distinct section of the highway system and then summed together for the overall estimate. Table 20 shows the most appropriate geometric features, traffic characteristics and traffic control data, and safety measures of effectiveness of each submodeL
Potential Data Sources for Accident Analysis Module
Mathematical models are to be used in the accident analysis module. Numerous accident models have been reported in the literature. In the IHSDM accident prediction module, the estimated number of accidents is obtained by summing up the estimates of the four submodels.
Several statistical models have been developed in the past to generate accident predictive model for roadway segment (Miaou, Hu, Wright Davis. & Rathi (1991): Luyanda. Smith, Padron, Resto, Gutierrez, & Fernandez, 1983) The Poisson regression models were used in many of these studies as vehicle accidents are non-negative, rare. and discrete events. The variables associated with roadwav accidents are shown in table 20.
Past researchers have modeled accident occurrence at intersections. Hauer (Hauer. Ng, & LovelL 1988) developed accident prediction models for signalized intersection by maneuver patterns before the occurrence of accidents, (Garber & Srinivasan, 1991) developed accident prediction models for peak hour conditions at intersections. The variables associated with intersections are shown in table 20
Large vehicle accidents are most prevalent on highway ramps because ofloss of control. High curvature change are more prevalent on highway ramps than on any other highway segments, indicating that the curvature change rate will significantly influence the involvement of trucks in accidents on highway ramps. There are only a few studies done recently to identifY significant characteristics of accidents involving large trucks on highway ramps (Garber, Chowdhury, & Kalaputapu, 1992.)
Several sources (Glennon, 1974; Hutchinson & Kennedy, 1966) are available today relevant to roadside hazard models. Currently, under the FHW A initiative, two studies are in progress to provide inputs to the roadside submodel of the accident predictive module (NCHRP, 1995a, b).
159

0\ o
Type of Accident
Geometric and Physical Features
Table 20. Candidate Geometric and Traffic FeatUl'es and Safety MOE's
Roadwav h;cidents Intersection Ramp (Non-In'tersection) i\ccidents Ac(idents
Number of Lanes Numher of Approaches Ramp hpe DividedflJndivided Approach Alignment • hee\\uy/l- reewav Access Control (Ske\\ e(VOllscl) • Freewayl On~Rull1p \ JrbanJS II bllrban/R ufal N umher of Lanes Per • hee\\ay/On-Ramp Ilorizontal Curves !\pproach • Arterial! Arterial Percent Grade Special Lanes (Right Tum/ Ramp Contlg.uration: Vertical Curves/SSD I.en ·1'um/SharedJl·::-.:clusive) • DianHmd Lane Width ~ Irhan/SuburhunlRural • l'arrln l.oop Pfesence of Shouldef Approach Widths • lull I \lOp Shoulder Type I )I\ided/~ 111d1\ided • I )ireetlOllal Shoulder Width Approaches • Hultoll I look Presence or Curbs Comer SIg.ht Distance/Sak • Slip Curb Offset l\pproilCh Speed • Sing.k-l'\lil1t-~ Irhan Presence or Median Intcrchanj!e Median Tvpe Ramp [,cllgth Median Width Ilori/ontal ( 'lIfVeS Driveway DenSIty I.cngth and 'I \ pc of Speed ])ri ve\\ a\ I· calmes Change I alles I )ri \'e\\ a\ I-cat ures
(Median Openings, iUln I.ancs)
Bridges Bridge Width Auxiliarv Lancs
(TWLTL, Passing. or Climbmg Lanes)
Special Feature:': (e.g .. TUlllouls)
Taper I,cngths
Roadside Accidents
BatTiers: • Guardrail
· Bridge Rail
· Concrete Barriers Embarkment Slopes
· rill Slope
· Cut Slop Ditch Design Continllous Obstacles • Rdaining Wall, renee,
Etc.
· Classify h\ Side of Road. Distance from Road. and Severity
Point Obstacles: • Trees. Signs. Mailhmcs,
Cuherts, etc.
· Classify hv Side or Road, Distance from Road. and Severity
Roadway Curvaturc

Table 20. Candidate Geometric and Traffic Features and S~lfety MOE's (Continued)
Road\\<1\ An:idenls Inkrsection Ramp Roadside Type of Accident \ Non-Intersection) AccIdents ACCIdents Accidents
Tramc Characteristics and Traftie Volume hlkring Tr<Jllic Volumes Trallic Volumes Tratlic Volul11e Trunk Control Features Percent Trud:s Percent I,di Tums Percent Trucks Percent Trucks
Design or l'w;ted Speed I'<:n:ent Right Tums AdVlSOI\ Speed Encroachment Rate Operating Speed I 'ercentlrucks I)esign Speed I 'assing/No-I 'assing Innes Approach Speed ()peratlllg Speed
Trame ContInI (Slgnali/,ed/ h\o-Wa\ Stop/h)ur-Wm Stop/Yield/No Control
Sigmil Phaslllg Signal Timing Ckarance Intervals
0\ Sakty MOE's Accident Rate Per MillIOn I\ccldent Rate I'er MIllinn i\ccidellis I<ale Per Million Accident Rate 1\:[ Million
Vehicles per Mile l'llkrillg Vehieks Vehicks Vehicles per Mile Accidents Per Mile Per Yell! Ace Idents I 'er Year i\ccldcnls I 'CI Year Accidents Pcr Mile Per Year Severity I )islrihuti()IJ Sen:rit\ I )Istributlon Severity I )lstributioll Severity Distribution ACCIdent/Collision Tvpes, elc l\ccidenl/CollIsioll Types, etc ;\ccilkntlColllsinn Types. etc. AccidentiCollislOn tvpes, etc
L- --
Adapted from Harwood, Mason, & Graham (1994)

Table 21. Three phases of the accident predictive module by phase, highway type. accident, predictive relationships, IHSDM format, expected results and status.
Source of Accident
Predictive Phase Highway Type Relationship IHSDM Format Expected Results Status
L Two-lane. FHWA Compukrized Insight for future Ongoing rural roads (1991 a. 1991 b) regression safety applications of safety
rdationships into a relationships into CAD CADfonnat x. Y. z ionnat
2. Roadway Currently being Computerized Detennination of the Ongoing Intersection Ramp deyeloped regression safety oyerall accident rate Road"ide relationships into a b;. sUllllning the iour
CAD submodels x. \. 1 tonna!
~ All road segments. NiA Computeri.lcd Dc\c1op relationship Programmcd for -' . including linking b..::l\\~n g..::omdric futurc intersections and design ekments. application. interchanges accidents. and driver
perfonl1anc..::
Current Status and Future Plans
The accident predictive module will be developed through three major phases (Lum & Regan, 1995) Table 21 presents these three phases by road type, accident predictive relationships. IHSDM format, expected results and status. Phase I is a short-term objective that deals with only two-lane roads and will use the results generated from an FHWA study (FHW A 1991 a, b)
Phase 2 is defined as a medium-term objective that addresses all four components of the accident predictive module, i.e., roadway, intersection, roadside and interchange ramps. Currently. the experimental plan for the intersection accident predictive module is progressing under the FHW A directives. Under National Cooperative Highway Research Program (NCHRP) Project 22-9, the roadside submodel is currently being revised and updated. This will be an encroachment-based methodology involving chain of conditional probabilities.
Phase 3 is set as a long-term objective by the FHW A Its goal is to establish a relationship between geometric design elements, accidents, and driver performance. The scenario that is envisioned in this phase can link the driver performance to geometric design features. The driver performance model may predict the frequency of accidents through an interchange ramp. The accident rate can be used in the accident predictive module to revise the radius of curvature and speed limit at ramps.
FHW A is currently developing accident analysis models for three roadway configurations: two-lane rural road segments. rural 4-legged intersections, and rural three legged intersections. These models predict the total number of accidents and the probability of different accident
162

severity level. An experimental plan is underway in other areas of the accident prediction model, such as the signalized intersection, roadside and interchange ramp sub model. HSIS is currently working on the accident prediction model for multilane highways (personal communication)
VEHICLE DYNAMICS MODULE
As noted earlier, two contracts awarded specifically for the development of the vehicle dynamics module (VDM) are nearing completion Interim results are described in Allen, Rosenthal, and Klyde (1995), and Sayers and Mink (1995)
The Allen et al. paper describes the development of a vehicle dynamics model (VDM) and the integration of roadway design, VDM, and visualization software. The Vehicle Dynamic Analysis Non-Linear (VDANL) vehicle dynamics simulation program is described. Subcomponents of the VDANL include vehicle dynamics, tire model, wheel-spin modes, power train, steering system, brake system, vehicle-road kinematics, and a driver model for steering controL The model is applied to predict path and rollover response to constant-speed traversing of candidate highway designs. Hardware and software requirements are discussed, and issues relating to the generation of visual imagery from files of simulation results are reviewed in some detail.
Background information relating to the VDANL has appeared in numerous publications, three of which are Allen and Rosenthal ( 1994), Allen et al. (1991), and AJlen, Rosenthal, and Szostak (1988). .Allen and Rosenthal review the requirements for vehicle simulation dynamics models in considerable detail. The discussion here is largely qualitative, focusing on the various dynamical components that need to be considered. Through comparisons oflinear and non-linear simulations, the authors show that linear vehicle dynamics simulation should be adequate for applications not involving extreme maneuvering. Quantitative descriptions of low-order vehicle dynamics models is provided by Alien, Rosenthal, and Szostak. The 1991 paper by Allen et al. focuses on lateral stability and rollover potential and compares simulation results for five vehicle classes.
Sayers and Mink (1995) describe a graphical interface for integrating vehicle dynamics simulation tools, input data, and graphical visualization of results. Vehicle performance signatures are defined which, when combined with road geometrics and assumptions of vehicle speed, allow predictions of rollover propensity. The paper focuses almost exclusively on the graphical interface. Attention is also given to model architecture and to integration with road design data. Vehicle dynamics are not described in this paper.
163

ApPENDIX B: DATA SOURCES FOR THE DRIVER PERFORMANCE
MODULE
Potential sources of data useful for the development of the Driver Performance Module are reviewed in this chapter. Most of the articles reviewed describe the results of experiments designed to quantifY human performance capabilities relevant to the task of highway driving. Mathematical models of driver behavior are also reviewed
The reviews are organized into seven categories
•
•
Perception, Defection, and Sitllation Awareness. Measures of driver capabilities in studies where the emphasis was on perceptual capabilities rather than vehicle control.
Decision Making Data and models on how the driver selects desired path, speed, headway, and acceptable gaps for turning
1 ehicle Control. Literature relating to driving performance in terms of lateral (steering) and longitudinal (braking) control.
• Driver Stale. Influence of age, driving experience, and fatigue on driving performance and capabilities.
• Driving ,)'lyles. Articles pertaining to the relationship between accident involvement and factors relating to driving "style" such as risk-assessment and aggressiveness
• Integrated ]",Iath A4odels. Selected models for closed-loop vehicle control that include tightlycoupled vehicle and driver models.
• h(411c 5.,'imlllation lvlodel\·. Selected microscopic tratIic simulation models are reviewed with respect to driver performance parameters that might be relevant to DPM development.
This chapter concludes with a preliminary concept of how the Driver Performance Model might interact with the DPM.
A starting point in the search for relevant data for the first six categories was the 1987 Driver Performance Data Book, and the 1994 Driver Performance Data Book Update, both available through the Transportation Research Board. These books, which contain data tables, graphs, and brief descriptions of the procedure from a wide set of articles on driving performance, were extremely useful.
Additional articles were found by searching electronically for the appearance of the word "driving" (or any variants, such as "driver" and "drive") in either the title or the descriptor field for the years 1988 through 1995, or in some cases, for 1990 through 1995. The journals that were searched and yielded matches were the following:
Applied Ergonomics
165
Ergonomics
Human Factors
lEE International Conference on Systems, Man & Cybernetics
International Journal of Man-Machine Studies
Journal of Applied Psychology
Perception
Proceedings of the Human Factors and Ergonomics Society
Transportation Research Record
Vehicle Navigation and Information Systems Proceedings
Two additional journals, the Journal of Experimental Psychology and Human Computer Interaction, were searched but yielded no matches. The searches were carried out by using the Knight-Ridder (formerly Dialog) retrieval system. The Knight-Ridder system, available in most research libraries, interfaces with a number of separate data bases. The data bases that were relevant to the present search were Compendex. TRIS. ERIC. and Pascal. The search yielded reference information for each match as well as the author's abstract.
All the relevant articles that were uncovered through either the data books or the electronic search are listed below. under the appropriate category For articles located electronically. the complete reference is listed, along with a shortened version of the author's abstract. For articles that are summarized in the two data books, a reference to the appropriate page in the data book is provided. (The original data book is referred to as Henderson (1987) and the update as TRB [ 1994])
The following additional intormation is provided For each article. the topic of the article. as relevant to designing the driver performance modeL is indicated in a short sentence or phrase. In addition. for many of the articles. a particularly usetul tinding is noted. Articles that apply to more than one category are summarized under one category and cross-referenced in the others.
PERCEPTION, DETECTION, AND SITUATION AWARENESS
Vehicle Speed
Wood and Troutbeck (1 994a) (see Decision Making Speed)
Wood and Troutbeck (1994b) (see Decision Making: Speed)
Henderson (1987) p.7(4)
Topic: Estimation of Own Vehicle Speed Changes
Useful Finding: Changes in velocity less than 6.44km (4 mi/h) were generally not detectable. Accelerations and decelerations less than. 01 g were not detectable.
166

Henderson (1987) p. 7 (5 )
Topic: Estimation of Own Vehicle Velocity
Headway
Henderson (1987) p.7(6)
Topic: Headway Estimation
Henderson (1987) p.7(8)
Topic: Detection of Changes in Headway
Curvature of Road
Zwahlen (1994)
Topic: Detection of Curvature at Night
Abstract: This exploratory study investigated the monocular (4 subjects and binocular (7
subjects) curvature perception accuracy of young drivers under curve approach and nighttime conditions in a 150 scaled laboratory set up. The overall averages for the percentage of the number of correct responses were calculated for different experimental conditions and plotted against the number of chevrons The results indicate that the overall average number of correct responses increases from 2 to 3 chevrons and then remains about the same for 4 and 8 chevrons. Further. the values for binocular viewing are higher for 4 and 8 chevrons It was tentatively concluded that for the same conditions as the experiment. 4 equally spaced chevrons within a total visual field of about 6 degrees provide adequate curvature estimation cues tor unfamiliar drivers approaching a curve at night.
Collision
Berthelon and Mester (1993)
Topic Detection of Collision Potential at Intersections and on a Curve
Abstract: Studies have shown that the pattern of optical flow resulting from the observer's self-motion through a stable environment is used by the observer to accurately control his or her movements. However, little is known about the perception of another vehicle during selfmotion (e.g., when a car driver approaches an intersection with traffic). In a series of experiments using visual simulations of car driving, 12 driving observers were able to detect the presence of a moving object during self-motion. However, the perception of the other car's trajectory appeared to be strongly dependent on environmental factors, such as the presence of a road sign near the intersection or the shape of the road.
Ranney and Pulling (1990) (see Decision Making: Speed)
167
Traffic Signs
Kline and Fuchs (1993)
Topic: Sign Visibility in Young and Old.
Abstract: Compared visibility and comprehension of standard text, standard symbolic, and improved symbolic highway signs among 16 young (aged 19 to 35 yrs), 16 middle-aged (aged 37 to 59 yrs), and 16 elderly (aged 61 to 76 yrs) observers. The average distance at which standard symbolic signs (SMS's) could be identified was about two times that of text signs for all three age groups. The visibility distances of the improved SMSs, which were designed using an optical blur (i.e, low-pass) approach to avoid higher spatial frequencies, exceeded those of both text and standard SMS' s. Visibility distance was decreased significantly among older drivers on some signs but not others.
Greene, Koppa, Zellner, and Congleton 0994)
Topic: Sign Visibility in Young and Old
Abstract: Using a group of old and young drivers, six symbol signs were investigated. With six trials per sign, legibility distances, defined as the distance at which the sign is correctly identified from a menu, were collected.
Allen, Parseghian, and Rosenthal (1994)
Topic Sign Visibility in Young and Old
Abstract: Two research examples are reviewed One study involved the use of an interactive driving simulator that included the presentation of high resolution signs over the apparent viewing range from 152.5m to 15.25m (500 to 50 ft) Drivers had to control vehicle speed and lane position while identifYing the meaning of symbol signs as rapidly as possible. Subjects were scored in terms of correctness and the distance at which signs were identified. A second study involved a computer controlled presentation of static signaled intersection scenes, including supplemental signs, to subjects who were required to make decisions about permissive movements. Results in both studies showed that both response speed and correctness degrade with the complexity of signal and sign treatments.
Alicandri and Walker (1993)
Topic: Awareness of Flagman
Abstract: An interactive driving simulator was used to compare two versions of a construction and maintenance advanced flagger sign, designed to alert motorists to the presence of a flagger in a work zone ahead.
MacDonald and Hoffinann (1991 )
Topic: Awareness of Sign Information
Abstract: Field and laboratory experiments were carried out to investigate drivers' levels of awareness of traffic sign information under normal driving conditions and to validate the
168

laboratory technique. The reliability and sensitivity of the experimental measure (RSI-the level of reported sign information) were sufficient to show significant effects of factors such as sign "action potential," traffic density, type of sign, sign background complexity and sign conspicuity: the dominant factor was sign action potential Inexperienced drivers exhibited a significantly higher level ofRSr (mean of 0 to 39) than experienced drivers (mean of 0 to 26)
Taoka (1991)
Topic: Model for Glance Duration to Signs
Abstract: The statistical distributions of driver off-roadway spare glance durations for six invehicle and one out-of-vehicle viewing tasks are generated An analytical model is fitted to experimental data from several sources to yield these distributions.
Zwahlen, Yu, and Rice (1990)
Topic: Sign Visibility at Night with One Headlight
Abstract: A study was performed with a !Vlacintosh microcomputer to analytically assess the effects of driving with only one headlamp working and the effects of misaim of the one headlamp working on the conspicuity of retroreflectorized warning signs and devices of different brightnesses at night on a straight and a left-curved section of a highway. The computer model used computes all the geometric distances and angles necessary for a selected situation involving driver, vehicle, and reflectorized target. Results show that driving with only one headlamp working can have a significant detrimental effect on the visual detection distances for reflectorized targets. especially under certain headlamp misaim conditions.
Henderson (1987) p3( 53)
Topic Model for Sign Visibility at Night
TRB (1994) p.23
Useful finding Young discriminated signs at 50 m, old at 40 m.
TRB (1994) p.49
Useful fInding In general, text signs were readable at 75 m, icons signs at 200 ill. Old persons had trouble reading icon signs.
TRB (I 994) p. 5 5
Useful finding: Icon signs were visible at 45.75m (150 ft) for young and 22.88m (75 ft) for old.
TRB (I 994) p. 83
Useful finding: The median glance duration for signs was 1.5 s.
169
Obstacles
Sojourner and Antin (1990)
Topic: Detection of Salient Driving Cues
Abstract: Compared the effects of simulated head-up display (HUD) and dashboard-mounted digital speedometers on perceptual driving tasks in a simulated driving environment. A videotape, taken from the driver's perspective, of a car traveling along a memorized route served as the test scene. While viewing the test scene, 20 subjects (aged 19 to S] yrs) performed navigation, speed morutoring, and salient cue detection tasks. The HUD speedometer produced generally superior performance on the experimental tasks and enabled subjects to respond significantly more quickly to the salient cues.
Kloeppel, Peters, James, Fox, and Alicandri (1994) (see Vehicle Control Steering)
Hale and Ye ( 1994 )
Topic Fuzzy Model of Obstacle Detection
Abstract: As more people populate the roadways, vehicle safety advancements are needed A fuzzy model of vehicular guidance is proposed to investigate this issue. Three main tasks associated with vehicular guidance include maintaining path, regulating velocity, and reacting to signs and obstacles. This poster demonstration introduces the initial efforts to identity the factors that describe a driver's reaction to obstacles.
Nieminen and Summala ( 1994) (see Vehicle Control Steering)
Triggs and Drummond (1993)
Topic Obstacle Detection in New Drivers
Abstract: The Monash University Accident Research Centre is conducting a comprehensive research program with a focus on young driver performance issues. This paper suggests that an expansion of this effort to include the investigation of driving performance issues is warranted. To this end, the simulator-based research effort is described, the cornerstone of which is an attempt to identifY the important differences in driving performance as a function of driving experience In addition, an overview of specific investigations in the areas of attention switching time and the provision of decision aiding information is given.
Lerner (1993) (see Vehicle Control Braking)
Henderson (1987) p.2(l06) (see Vehicle Control Braking)
TRB (1994) p.1S (see Vehicle Control: Braking)
Pant, Huang, and Krishnamurthy (] 992)
Topic: Detection of Construction
170
Abstract: Examined in this paper is the effect of steady-burn lights on driver behavior in divided and undivided highways with horizontal and vertical curves; and with and without external lighting, entrance and exit ramps, tapered sections of lane closures, and median crossovers. The study was based on an examination of the driving behavior of a sample of driver subjects who were asked to drive an instrumented automobile in several highway work zones during the day, during the night when steady-burn lights were placed on drums, and during the night when steady-burn lights were removed. It is concluded that steady-burn lights are not required for traffic control when drums with high intensity sheeting and flashing arrow panel are used as channelizing devices in these highway facilities.
Stewart, Cudworth, and Lishman (l993)
Topic: Estimation of Distance from Pedestrian
Abstract: It is proposed that when drivers of road vehicles are in potential collision with pedestrians their perception of distance is based primarily on familiar size, resulting in overestimation of size and therefore of time-to-collision with child pedestrians. This is supported by further computer simulations and is corroborated by predicting the effect of that overestimation on certain types of accidents, then testing from national accident statistics.
Agent and Pigman ( 1990) ~ ~
Topic Detection of Vehicles on Shoulder
Abstract: Accident data for a 3-year period, 1985 through 1987, were collected along with a survey of vehicles stopped on the shoulder on Interstates and parkways. Although the percentage of all accidents on Interstates and parkways involving a vehicle on the shoulder is small (l 8 persent), the percentage of fatal accidents involving a vehicle on the shoulder is significant (11.1 percent). The survey indicated that a driver would pass (in his direction of travel) an average of about one vehicle on the shoulder every 12.88km (8 mi) on an Interstate and every 27.37km (17 mi) on a parkway
Rumar (1990)
Topic: Late Detection Problem
Abstract: When drivers are asked \vhy an accident occurred very often they claim that they saw the other road user too late to avoid collision. This paper discusses the basic road user error of failing to see another road user in time, when such errors happen, and how they can be reduced.
TRB (1994) p.61 (see Vehicle Control: Braking)
TRB (1994) p. 69 (see Vehicle Control: Braking)
171

DECISION MAKING
Path
Fazio, Michaels, Reilly, Schoen, and Poulis (1990)
Topic: Decision to Exit from Freeway; includes Braking Behavior
Abstract A general model of diverging from a freeway to an exiting area was developed on the basis of purely behavioral considerations. The model proposes three sequential response elements that together define speed-change lane length. The first element is a criterion for a driver to diverge from the freeway on the basis of the angular velocity of the exit ramp gore (relative to the driver while approaching the exit in the right lane of the freeway). The second element is the distance required for drivers to complete a steering-control maneuver onto the speed-change lane. The third element is the distance at which drivers begin to brake in order to move from tracking the speed-change lane to tracking the curve of the exit ramp A mathematical definition of each element was developed. These definitions allowed the prediction of each of the critical distances. The predicted distances were compared to
observed exiting behavior on both curved and tangent exit ramps. The diverge, steeringcontrol, and begin-braking distances observed on curved ramps were not statistically different from those predicted by the model.
Pant, Huang, and Krishnamurthy (1992) (see Perception Obstacles)
TRB (1994) pA 7
Topic: Decision Time for a Merge
Useful finding Decision time before a merge was 1.5 s for young and 2.5 s for old.
Speed
Fisher (1992)
Topic: Effect of Speed Limit Signs on Average Speed, Includes Compliance Probability.
Abstract This paper reports a study designed to assess the links among memory for road signs (e.g., pedestrian crossing, hidden junction), driver behavior, and control adjustment action. Ninety-six drivers were assigned to 1 of 2 conditions and responded to verbal questions about road signs. In both conditions fifty-six percent correctly recalled the signs. Fifty-six and seventy-two percent, respectively, in the 2 conditions failed to make any control adjustments to the advised situation.
Nieminen and Summala (1994)
Topic: Speed Changes While Changing Cassette and in Response to Oncoming Traffic.
Abstract This study is addressed to time-sharing and primary task control during a secondary task as a function of driving experience. After about 1.5 h of test driving, when well-adapted to the experimental car, 23 novices (less than 5,000 km of driving) and 26 experienced drivers
172
[more than 150000 km (93150mi)] were asked to change a cassette in a cassette player on an ordinary two-lane road. The results showed no difference between novice and experienced drivers in time-sharing (glance length at the in-car task and at road), lateral position-keeping (lateral displacement as a function of time at in-car task) or control in relation to oncoming traffic. The only difference occurred in speed control, experienced drivers keeping their speed level constant while novices slowed down somewhat during the secondary tasks. These data showed, in a supervised experimental setting, a similar linear relationship between time spent on an in-car task and lateral displacement both for novice and experienced drivers, and a similar median time gap of about 2 s to an oncoming vehicle at the moment when both novice and experienced drivers shifted their gaze from the in-car task to the road.
Benekohal and Wang (1994)
Topic: Speed in Construction Zones
Abstract Drivers' speeds in the advanced warning area may influence the speeds that they maintain throughout the work zone. The correlations between the speed at the end of the advance warning area and the speed in the work activity area are examined. Vehicles with higher initial speeds, in generaL reduced their speeds more than the vehicles with lower initial speeds; however, vehicles in the higher initial speed groups kept higher speeds in the work zone than the vehicles in the lower initial speed groups, even though the former group had larger speed reductions than the latter group. The data showed that the great majority of the drivers who did not reduce their speeds in work zones belonged to the Faster and Very Fast groups About one-third of the drivers who were "extremely" speeding (Very fast and Fastest groups) reduced their speeds and kept reducing them as they traveled in the work activity area. However, about one-third of those who \vere "excessively" speeding (Fast and Faster groups) reduced their speeds initially, but increased them in the work activity area and then reduced them when they reached the work space.
Benekohal, Wang, Orloski, and Kastel (1992)
Topic: Speed in Construction Zones
Abstract: Speeds of vehicles at different locations with a work zone were determined in this study in order to plot their speed-reduction profiles. Vehicles were followed from the time they entered a 25 km (1.5 mi)-long study section until they exited from it. Automobiles and trucks showed similar speed-reduction patterns. Four categories of drivers were identified on the basis of these patterns. About sixty-three percent of drivers reduced their speeds considerably after passing the first work zone speed-limit signs (Category 1). Nearly eleven percent of drivers reduced their speeds when they neared the location of construction activities (Category 2). About one percent of all drivers did not reduce their high speeds (Category 3). The remaining drivers did not indicate a distinct pattern (Category 4). Even at the work space, about 2/3 of automobile drivers and more than half of truck drivers exceeded the speed limit.
Wood and Troutbeck (1994a)
Topic: Age Differences in Speed, also Effect of Cataracts on Speed
173
Abstract: Driving performance was assessed on a closed-road circuit for a series of driving tasks including peripheral awareness, maneuvering, reversing, reaction times, speed estimation, road position, and time to complete the course. These findings indicate that elderly subjects have poorer driving performance than young subjects and those with cataracts have still more difficulties, even though the cataract subjects had visual acuity greater than or equal to 6/12 and were therefore eligible to drive.
Kallberg (1993)
Topic: Speed at Night With and Without Reflective Posts
Abstract: An experimental study on the effects of reflector posts was carried out on two-lane rural highways in Finland. On roads with 80-krnlh speed limits and relatively low geometric standards, the reflector posts increased driving speeds in darkness. The largest detected increases were 5 to 10 krnlh. The number of injury accidents in darkness increased by 40 to sixty percent. On roads with better geometric standards and 100-krnlh speed limits, the effects on driving behavior and accidents were small. The results indicate that reflector posts on narrow, curvy, and hilly roads can significantly increase driving speeds and accidents in darkness.
Ranney and Pulling ( 1990)
Topic: Age Differences in Speed Through Narrow Gaps
Abstract: A battery of closed-course driving and laboratory tests was developed for evaluating the skills required in routine suburban driving. Twenty-three younger (aged 30 to 51 years) and 21 older (aged 74 to 83 years) adults participated. Driving tests included responding to traffic signals, selecting routes, avoiding moving hazards, and judging narrow gaps. Older drivers were generally slower and less consistent in their driving The groups did not differ from each other on measures of caution.
Wood and Troutbeck (1994b)
Topic: Speed of Young Drivers With and Without Goggles that Impair Vision to the SameDegree as Cataracts.
Abstract: Examined the effect of restricting vision on driving by comparing the driving performance (DP) of 14 young, normal subjects (aged 19-37 yrs) under conditions of simulated visual impairment with a baseline condition. DP was assessed on a closed-road circuit for a series of driving tasks including peripheral awareness, maneuvering, reversing, reaction time (R T), speed estimation, road position, and time to complete the course. Simulated cataract resulted in the greatest detriment to DP, followed by binocular visual field restriction.
Jackson and Blackman (1994)
Topic: Effect of Speed Limit Signs and Fines on Average Speed
Abstract: Previous experimental tests of risk homeostasis theory (RHT) have failed to manipulate both motivational and nonmotivational variables in an ecologically valid within-
174
subject design. In this study, 24 subjects operated an interactive driving simulator under varying levels of a within-subject motivational factor (monetary accident cost), a withinsubject nonmotivational factor (speed limit), and a between-subjects nonmotivational factor (speeding fine). Consistent with RHT, increased speed limit and reduced speeding fine significantly increased driving speed but had no effect on accident frequency.
Parker, Manstead, Stradling and Reason (1992)
Topic: Age and Gender Differences in Self-reported Willingness to Speed
Abstract: Assessed the ability of the theory of planned behavior (TPB) to account for drivers' intentions to commit four specific driving violations: drinking and driving, speeding, close following, and overtaking in risky circumstances. Results showed that the addition of perceived behavioral control led to significant increments in the amount of explained variance in intentions, thereby supporting the theory. Analyses of variance (ANOVA's) differentiated demographic subgroups of drivers in terms of behavioral beliefs. outcome evaluations. normative beliefs. motivation to comply. and control beliefs
Walker. Alicandri, Sedney, and Roberts (1991)
Topic: Age Differences in Speed in Easy and Hard Driving Conditions
Abstract: Seven navigational devices \V'ere tested in the Federal Highway Administration Highway Driving Simulator (HYSIM) for their effects on safe driving performance. The difficulty of the driving task (workload) was increased in three successive sections by adding crosswinds, another vehicle, gauge-monitoring, and mental arithmetic problems. and by narrowing the lanes. Measures included speed. average and variance of lateral placement, heart rate, and reaction time to gauge changes. Results indicate an interaction of age group and level of diffIculty, such that higher levels of difficulty affected older drivers to a greater extent.
SerafIn ( 1994)
Topic: Slowing for Curves
Abstract: This report describes an investigation of driver eye patterns on straight and curved rural roads. Eight participants (four under 30 years, four over 60 years) drove on a 8.5 km (4.6 mi), two-lane road while wearing an eye mark camera to record eye fixations. While data was collected for the entire route, only four road sections were of interest (one straight section and three left curves (3, 13, and 21 degrees». In addition to eye fixation data, driving performance measures (speed and lane deviation) were recorded. From the driving data, there were no indications of excessive lane deviation or speed. The data from this study will be entered into a simulation model that will describe driver eye fixation patterns, and the model will be validated.
175

Headway
Korteling (1990)
Topic: Age Differences in Headway in Platoon Task, includes Steering Behavior
Abstract: Examined, among 10 brain-injured male patients and 10 controls (aged 21 to 43 yrs) and 10 older men (aged 61 to 73 yrs), (I) variables that may be sensitive to the effects of brain damage or aging and (2) ways in which reaction time (RT) tasks relate to driving performance. In Exp 1, mean RTs of brain-damaged and older subjects disproportionately increased relative to controls. In Exp 2, response accuracy of brain-damaged subjects deteriorated more than that of controls when the similarity of a tasks to actual driving increased. In Exp 3, brain-damaged subjects were slower and less accurate than controls on all measures of a platoon car-following task, while older subjects were only less accurate.
Korteling (1994)
Topic Age Differences in Head\vay in Platoon Task. includes Steering Behavior
Abstract: Examined effects of skill modification and emergent attentional processes in an experiment in which experienced subjects performed two perceptual-motor tasks. a vehicle steering task and a car-following task, in a driving simulator. Two age groups of 12 subjects each participated in the experiment: an older group (aged 65 to 74 yr) and a younger group (aged 21 to 34 yr). The older subjects' performance did not differ from that of their younger counterparts. except when the single or dual tasks involved routine modification in carfollowing.
McGehee. Dingus. and Horowitz (1994)
Topic Headway With and Without a Warning Display
Abstract lVlotor vehicle crashes resulting from one vehicle striking the rear-end of another are one of the most common types of crashes involving two or more vehicles. To address the rear-end crash problem. a color LCD display designed to indicate safe following distances was mounted in the instrument pane of an 1990 Olds T oronado T rofeo. One hundred and eight drivers from three age groups participated in this field experiment in I of 3 display symbology conditions. Data analyses indicated that (1) the drivers easily understood the displays, (2) those drivers who initially maintained unsafe headways increased their following distance when one of the display symbologies was used, (3) during events where changes in relative velocity (braking) took place, all three symbologies increased the overall headways.
Nirschl and Eck (1994)
Topic: Headway in Different Traffic Situations
Abstract: AICC (Autonomous Intelligent Cruise Control) systems, as investigated in the European PRO-METHEUS and DRIVE projects, should support the driver in longitudinal vehicle control. The presented study analyzed driver- and situation-specific effects, which have to be considered when developing or evaluating AICC's. The investigations focused on assistance systems. which inform or warn a driver in case of inadequate speed or distance.
176
Driving experiments were performed, whereby subjects' distance keeping behavior was monitored. As a tlrst step before experimental evaluation, relevant traffic situations for AICC application were identitled and c1assitled. Typical effects are found in frequency and duration of various AlCC situations, in distance distribution when following, and in minimum distance when approaching a proceeding vehicle.
Kikuchi and Chakroborty (1992)
Topic: Model for Headway in Platoon Task
Abstract: Car-following theory has been receiving renewed attention for its use in the analysis of traffic flow characteristics and vehicle separation control under the IVHS. A car-following model that uses the fuzzy inference system, which consists of many straightforward natural language-based driving rules, is proposed. It predicts the reaction of the driver of the following vehicle (acceleration-deceleration rates) given the action of the leading vehicle.
Brookhuis, Dewaard, and Mulder ( 1994)
Topic: Headway in a Platoon Task
Abstract The measurement of impairing effects on driving performance by such external factors as alcohol, medicinal drugs, or mobile telephoning, etc .. is extended with a new test. Since in accident causation. attention and perception errors predominate over response errors, on-road studies should examine specifically deterioration in attention and perception. The ability to follow a car in front. as measured by coherence and reaction time to speed variations, offers such a measure of attention and perception performance.
Useful finding Reaction time to changes in speed of the lead car was 265 ms.
Brookhuis and Del,.vaard ( 1993 )
Topic: Headway in a Platoon Task
Abstract: Twenty subjects completed an on-the-road driving experiment. consisting of two different tests conducted on two separate days. A two-part test was administered while subjects were under the influence of alcohol (BAC <=005%); a four-part test was administered without alcohol consisting of a 2.5 h driving test under vigilance conditions on a quiet highway. Impairment of driving performance was measured in a standard driving test (SO lateral position and SO steering wheel movements) and in a recently developed carfollowing test (reaction to speed changes of a leading car).
Parker, Manstead. Stradling and Reason (1992) (see Decision Making Speed)
Henderson (1987) p.2( 101)
Topic: Headway in a Platoon Task
Useful tlnding: Reaction time to decelerations of the lead car was 3 to 4 s, depending on headway
177
Noy (\989)
Topic Headway with/out Secondary Task, Includes Steering Data
Abstract: The experiment was designed to examine the relationship between drivers' visual attention and performance under concurrent multitask conditions. Subjects drove in a moving-base simulator and performed cognitive tasks on a CRT display which was located on the instrument panel to the right of the driver. The two display tasks, a spatial perception task and a verbal memory task, were designed to place differential demands on cognitive resources. Eleven dependent variables, provided measures of driving performance, attentional behaviour, display task performance and workload.
McKnight and Shinar (1992)
Topic: Headway with/out Center High Insulated Stop Lamps
Abstract Center high-mounted stop lamps (CHMSL's) have been standard equipment on passenger cars in the United States since September L 1985. This study investigated the potential benefit of extending the CHMSL to heavier vehicles by measuring the savings in brake reaction time. In an experimental tleld study of over 1000 trials, CHMSL's were installed on a pickup truck, a full truck, a cargo van, and a minivan. The brake reaction times of drivers following these vehicles with and without CHMSL' s were measured Activation of the CHMSL in tandem with the standard brake lights had a small but statistically significant effect on the brake response time of the drivers in following vehicles
Useful finding As speed increased headway increased, but not enough to compensate. As a result, headway time got shorter as speed increased. Also the mean brake reaction time. with a 2 s headway, was 1.5 s.
TRB (1994) p.67
Topic Headway in a Platoon Task, while Sober and Intoxicated
Useful finding: Reaction time to a speed change in the lead car was 800 ms when sober and I s when intoxicated at a OA-percent blood alcoholleve!.
Gap for Turns
Fitzpatrick (1991 )
Topic: Decision to Turn into a Stream of Cars as a Function of Gap
Abstract: A field study was performed to determine the gap-acceptance values of truck and passenger car drivers at six intersections. Passenger car drivers had a 50 percent probability of accepting a gap of 6. 5 s for both left and right turns and an 85 percent probability of accepting a gap of 8.25 s at a moderate- to high-volume intersection. A 1O.5-s gap represented the 85 percent probability of accepting a gap at an intersection where accepted gaps were influenced by low volume and the intersection's geometry.
Useful finding: Subjects waited for an 8 to lOs gap in traffic before turning.
178

Hunter-Zaworski (1990)
Topic: Decision Time for Turning, with/out Neck Impairment
Abstract: The effect of restricted head and neck movement on driving performance was measured by decision time at simulated T -intersections. The 72 test subjects were either between the ages of 30 and 50 or between 60 and 80, and half in each group had a restricted range of neck movement. The subjects' task was to depress the brake pedal, watch the video presentations of the T -intersections on three screens, and release the brake pedal when it was safe to make a left turn. The following hypotheses were contirmed: (a) decision time increases with age, and age effects dominated the other factors studied; (b) decision time increases with age and level of impairment, indicating that younger drivers are able to compensate for their impairments.
Stop/Proceed
Kikuchi. Perincherry, Chakroborty, and Takahashi ( 1993)
Topic: Model for Decision to Brake for Yellow Light
Abstract The anxiety that a driver experiences at the onset of the yellow signal during the driver's approach to a signalized intersection is analyzed. The driver's decision is modeled as a reasoning process that consists of a set of fuzzv inference rules for stopping or continuing through the intersection.
Bonneson (1992)
Topic Model of Behavior at Traffic Lights, Includes Aggressiveness Factor
Abstract: Some of the findings from a recent study of the queue discharge headway process are summarized. One outcome of the study \vas the development of a model of discharge headway at signalized junctions. The model is based on vehicle and driver capabilities, including driver reaction time, driver acceleration, and vehicle speed. To calibrate the model. data were collected at five signalized junctions
Kikuchi and Riegner ( 1992)
Topic: Model for Decision to Brake for Yellow Light
Abstract During a signal change interval, most drivers must decide whether to stop or go based on uncertain information on speed, the remaining yellow time, and distance from the intersection. The decision process under fuzzy information, such as this case, is suited for analysis by fuzzy set theory. Possibility and necessity measures of" safe stopping" and" safe clearing" were defined, and they were assumed to represent the decision criteria of aggressive and conservative drivers, respectively.
179

VEHICLE CONTROL
Steering
Gawron and Ranney (1990)
Topic: Steering in Curves
Abstract: A study was conducted to investigate driver perfonnance on curves. The betweentrial factors were Blood Alcohol Content and type of driving scenario (eventful versus uneventful). The within-session factors were edgeline width, type of curve-warning sign, and curve type. Twelve male drivers drove continuously for 2 h on each of 3 nights. Each subject negotiated 150 curves during each 2-hour drive. The results showed that curve-entry speed increased as radius of curvature increased. Lateral position error was greatest on the curve with the smallest radius and least on the curve with the shortest length. Heading error first increased then decreased as curve radius increased.
Godthelp (1988)
Topic: Path Error in Driving
Abstract: Time-to-line-crossing (TLC) is used as a measure to quantity the potential role of visual open-loop and path-error-neglecting strategies. Basically, TLC represents the time available for a driver to neglect path errors until the moment at which any part of the vehicle reaches one of the lane boundaries. The strategy adopted by drivers during error-neglecting should be represented in terms of decision rules, describing how drivers switch from errorneglecting to error-correcting when approaching the edge of a lane. The experiment to be presented in this paper was designed to provide these rules for a straight lane-keeping task. Drivers were instructed to neglect the vehicle path error and to switch to error-correcting only at that moment when the vehicle heading could still comfortably be corrected to prevent a crossing of the lane boundary. The results show that the lateral distance from the lane boundary at which drivers switch to error-correction increases about linearly with the lateral approach speed. This mechanism results in an approximately constant TLC (time) distance at the moment of decision: this result being consistent over a broad range of speeds.
Gawron and Ranney ( 1988)
Topic: Effects of Alcohol on Vehicle Control
Abstract: The effect of alcohol consumption on driving performance was examined in two studies. Multiple measures of vehicle control, tracking and information processing were recorded. In general, the standard deviations of these measures increased as BAC increased.
Levison (1993) (see Section 5.6)
Wood and Troutbeck (1994a) (see Decision Making: Speed)
180
Zegeer, Hummer, and Hanscom (J 990)
Topic: Steering Deviations to Oncoming Trucks
Abstract: Ability of various truck configurations to negotiate rural roads with restrictive geometry was examined in addition to effects of such trucks on traffic operations and safety. Test sites consisted of approximately 96.6 km(60 mi) of rural, two-lane roads in New Jersey and California with a variety of lane widths, shoulder widths, and horizontal and vertical alignment. Field testing involved following control trucks of each truck type along the selected routes. Photographic and radar equipment were used in a data collection caravan to measure the effects of the trucks on oncoming vehicles in terms of speed changes and lateral placement changes. Results showed that semi-48 and twins caused some changes in operation of oncoming vehicles, particularly on narrow roadways.
Kloeppel, Peters, James, Fox, and Alicandri (1994)
Topic: Steering deviations at intersections and for obstacles, includes age differences and aggressiveness factor.
Abstract: The responses of older and younger drivers during performance of emergency maneuvers in an interactive driving simulator were studied in this paper. As a result, older drivers were not different from younger or middle-aged drivers in avoidance, response time, speed, deviation from speed limit, brake pedal force, and overall avoidance. Age difference were found in lateral placement at intersections. Older drivers drove further to the right of lane center than younger and middle age drivers. It is believed that his is a result of a general conservatism of older drivers.
Nieminen and Summala (1994) (see Decision Making Speed)
Nilsson (1993)
Topic: Steering Accuracy With Mpbile Phone Use
Abstract: The VTI driving simulator is described briefly, and aspects such as controllability, realism, validity, and motion sickness are discussed. The experience of using a simulator is accounted for. As an example, a study of mobile phone effects on driver behavior is reported, focusing on methodological aspects. The paper ends with an extensive literature list containing behavioral studies performed in the simulator.
Serafin, Wen, Paelke, and Green (1993)
Topic: Steering Accuracy With Mobile Phone Use
Abstract: This paper describes an experiment that examined the effect of car phone design on simulated driving and dialing performance. The results were used to help develop an easy to use car phone interface and to provie task times as input for a human performance model. Twelve drivers (6 under 35 years, 6 over 60 years) participated in a laboratory experiment in which they operated a simple driving simulator and used a car phone. In terms of driving performance, dialing while driving resulted in greater lane deviation ( 16.8 cm) than performing a task while driving (13.2 cm). In addition, the voice-operated phone resulted in
18]
better driving performance (14.5 cm) than the manual phone (ISS cm) using either the IP display or HUD.
Godthelp and Kappler (1988)
Topic: Steering Accuracy with Different Car-Handling Characteristics.
Abstract: Analyzed whether the time-to-line crossing (TLC) concept might enhance understanding of the relation between vehicle handling characteristics and a driver's looking and lateral control strategy in a straight-lane-keeping task, using 6 male adults. Earlier results obtained by the 1st author and colleagues indicate that in the case of a normally understeering car, drivers accepted occlusion periods that correlated highly with TLC. Present findings show that drivers were able to maintain this strategy with a more heavily understeering vehicle. However, the adaptation to the characteristics of an oversteering vehicle was less accurate. Although drivers devoted considerable steering and looking effort to control such a vehicle, this compensation process was insufficient, resulting in low TLC levels at high speeds.
Henderson (1987) p.2 (l08)
Topic: Steering Deviations in Response to a Parked car with Open Door
Noy (1989) (see Decision Making: Headway)
Walker, Alicandri, Sedney, and Roberts (1991) (see Decision Making Speed)
TRB (1994) p. 69 (see Vehicle Control: Braking)
Reidel ( I 990)
Abstract lPG-DRIVER is a software package that is intended to either be integrated with a vehicle model to predict closed-loop driving behavior. or installed in an actual vehicle to serve as an on-line course and speed controller (Riedel, 1990). Details of the underlying driver model are lacking in the reference, but the claims made for this package are sufficiently intriguing to merit pursuit of further details. Features of the model include ( 1) choice of speed as well as steering control, (2) adaptation to vehicle response dynamics and learning ability, and (3) perceptual thresholds. Independent inputs include road profile, perceptual thresholds, and driver preferences such as maximum desired accelerations.
Braking and Accelerating
Zeitlin (1993)
Topic: Rate of Brake Adjustments as a Function of Workload.
Abstract: Two auditory subsidiary task measures of driver mental workload, delayed digit recall and random digit generation, were evaluated in a 4-year field trial. Vanpool members performed the tasks for 2-min periods while traversing a mix of rural secondary roads, limited access expressways, high-density limited-access urban drives, and downtown city streets on a daily commute from upstate New York to New York City Data collected included the
182
roadway being traversed, time of day, traffic conditions including density and estimated speed, weather, brake applications, and drivers' subjective difficulty ratings. Subsidiary task degradation was a conjoint function of traffic density, average speed, and uncertainty (estimated by the number of brake depressions). The digit recall task correlated (r = .834) with a calculated driver workload index based on brake actuations divided by the square root of speed.
Kikuchi, Perincherry, Chakroborty, and Takahashi (1993) (see Decision Making: Stop/Proceed)
Pant, Huang, and Krishnamurthy (1992) (see Decision Making: Path)
Bonneson (1992) (see Decision Making: StopfProceed)
Kikuchi and Riegner (1992) (see Decision Making: StopfProceed)
Fazio, Michaels, Reilly, Schoen, and Poulis (1990) (see Decision Making Path)
Lerner (1993)
Topic Braking Behavior for Obstacles
Abstract There is concern whether the perception-reaction time (PRT) values used in current practice adequately meet the requirements of many older drivers. This study compared onthe-road brake PRT's for unsuspecting drivers in three age groups: 20 to 40,65 to 69, and 70-plus years old. Subjects drove an extended route, under the guise that they were making periodic judgments about road quality. At one point a large crash barrel was remotely released from behind brush on a berm and rolled toward the driver's path. Although most of the fastest observed PRT's were from the young group, there were no differences in central tendency (mean equals 1.5 s) or upper percentile values (85th percentile equals 1.9 s) among the age groups. Furthermore, the current highway design value of2.5 s for brake PRT appears adequate to cover the full range of drivers.
Henderson (1987) p.2(l 06); p.2(l09)
Topic: Braking Behavior for Obstacles
Useful finding: The brake reaction time for obstacles was 1-2 s.
TRB (1994) p.15
Topic: Braking Behavior for Obstacles
Henderson (1987) p.2(l 0) - 2(13); 2(38) - 2(39); 2( 106)
Topic: Pure Braking Reaction Time (not in real driving context)
Useful finding: Braking RT was 600 ms.
183

Henderson (1987) p.2(35); 2(37) - 2(38)
Topic: Braking Behavior in Response to Lead Car Lights
Useful finding: Reaction time was approximately 900 ms.
Henderson (1987) p.2( 101) (see Decision Making: Headway)
Henderson (1987) p.2( 111)
Topic: Math Model for Reaction Time Components in Braking for Obstacles
Henderson (1987) p. 7( 12)
Topic: Braking Behavior in Response to Traffic Lights
Useful finding: The average deceleration rate at traffic lights was 10 ft/s/s
Walker. Alicandri, Sedney, and Roberts (1991) (see Decision Making Speed)
McKnight and Shinar (1992) (see Decision Making: Headway)
TRB (1994) p.69
Topic Braking Behavior at Night
Useful finding: Brake time from detection to wheel lockup was 1.6 s at night on a familiar road.
TRB (1994) p.61
Topic Age Differences in Braking Behavior. fncludes Steering Data
Useful finding Braking reaction time was 9 s for young and 1.3 s for old Steering reaction time to an obstacle was I s tor young and old.
Brookhuis, Dewaard, and Mulder (1994) (see Decision Making Headway)
Brookhuis and Dewaard (1993) (see Decision Making: Headway)
DRIVER STA TE
Age
Brouwer, Waterink, Wolffelaar and Rothengatter (1991)
Topic: Age Differences in Divided Attention
Abstract: Compared the divided attention performance of 12 young (mean age 26.1 yr) vs 12 older drivers (mean age 644 yr) in a simulated driving task that required simultaneous execution of 2 continuous visual tasks. The 1st task was a compensatory lane-tracking task involving a 3-dimensional road display. The 2nd task was a timed, self-paced visual analysis
184
task involving either a vocal or manual binary response to dot patterns projected within the road display. Compared with young subjects, older subjects showed a significantly decreased ability to divide attention. This effect was apparent in lane tracking and in the accuracy of visual analysis. The impainnent of divided attention was less pronounced in the vocal condition than in the manual one. This suggests that difficulty in integrating responses may be an important determinant of poor dual-task performance in old age.
Korteling (1990; 1994) (see Decision Making: Headway)
Sturr, Kline and Taub (1990)
Topic: Age Differences in Visual Acuity Under Low Luminance
Abstract: Tested 60 young (I8 to 25 yrs) and 91 older volunteers (60 to 87) for static visual acuity (VA) under 6 different luminance levels. When using VA measures, as is done for driver licensing, 65 yr seems to be the critical age after which VA becomes significantly poorer under conditions of degraded illumination.
Kline and Fuchs (1993) (see Perception: Signs)
Walker, Sedney, Wochinger, Boehm-Davis, and Perez (1993)
Topic: Age Differences in Useful Field of View.
Abstract: This study investigated age-related differences in the useful field of view (UFOV) using a part-task driving simulator. Thirty-six licensed drivers, aged 20 to 25, 40 to 45, and 65 to 70, participated. Dynamic roadway images were projected on screens to the front and sides of the driver. Target stimuli consisted of full-size simplified images of a van moving forward on the side screens at a speed below the motion threshold. Subjects performed forward view tracking and cognitive tasks while responding to the van stimuli on the side screens. Increased levels of the forward view task load adversely affected response times to the vans for the older group only, but performance of the tracking task declined for all age 1
Ball, Owsley, Roenker, and Sloane (1993)
Topic: Age Differences in Useful Field of View
Abstract: Using a comprehensive approach to assess several aspects of visual processing in a large sample of older drivers, this study has identified a measure of visual attention that had high sensitivity (89 percent) and specificity (85 percent) in predicting which older drivers had a history of crash problems, a level of predictability unprecedented in research on crash risk in older drivers. The useful field of view, as it is calh~d, measures the spatial area within which an individual can be rapidly alerted to visual stimuli. Older adults with substantial shrinkage in the useful field of view were six times more likely to have incurred one or more crashes in the previous 5 year period.
Duncan, Williams, and Brown (1991)
Topic: Age Differences in Components of Driving Skill
185
Abstract: U sing an instrumented car driven in normal tratftc, we assessed the driving skills of trained experts, of normal, experienced drivers, and of novices. Previous research suggests a fairly simple picture of improvement in driving skills with experience, and for aspects of car control (e.g., steering path, speed of maneuvers). Our results confirm this: normals largely resembled experts, while novices performed more poorly. There are reasons to suspect, however, that experience may not always be so beneficial. Where feedback is good, simple experience may bring expertise, but where feedback is poor, skills may fail to improve or even deteriorate once explicit tuition is removed. Correspondingly, our findings showed that for scanning patterns (e.g., mirror checking), anticipating (e.g., braking into an intersection), and safety margin (e.g., close following on the motorway), it was often the normal, experienced drivers who performed worst, novices sometimes even resembling experts. The data make it clear that for many aspects of driving skill experience is no guarantee of expertise.
Wood and Troutbeck (l994a) (see Decision Making: Speed)
Kloeppel, Peters, James, Fox, and Alicandri (1994) (see Vehicle Control: Steering)
McCoy, Tarawneh, Bishu, Ashman, and Foster (1993)
Topic: Remediation for the Problems of Older Drivers
Abstract: A 2-year study of the problems of older drivers was conducted by a team of researchers from the disciplines of traffic engineering, gerontology, physical therapy, occupational therapy, and driver education. The objective of the research was to develop and evaluate countermeasures for improving the safety of older drivers. During the fIrst year, the problems of older drivers were examined and countermeasures were designed to address these problems. A total of 105 older drivers between the ages of 65 and 88 were used to evaluate the effects of the countermeasures on the driving performance of older drivers. The subjects were randomly assigned to six experimental groups that received different countermeasures. The on-road performance of the subjects was measured using the driver performance measurement technique developed at Michigan State University. All of the countermeasures significantly improved the driving performance of the older drivers by an average of 7.9 percent.
Ranney and Pulling (1990) (see Decision Making: Speed)
Holland and Rabbitt (1994)
Topic: Instructors' Views of the Problems of Older Drivers
Abstract: Driving instructors' observations of older drivers were compared with the experiences of older drivers themselves using two questionnaires. Instructors were asked to compare the ease or ditftculty of teaching different skills to old and young pupils, and were asked what skills they would expect to have deteriorated in an experienced driver aged 70. Some skills seem to be intrinsically ditftcult for older people, in that instructors suggested them for both older pupils and experienced drivers: for example, vigilance, speed and distance judgements and coordination. There were also skills that instructors noted learners found difficult that experienced older drivers did not, namely vehicle control skills, and there were
186
problems older drivers had that older learners did not namely complacency and poor attitude towards safety. Older drivers were unaware of many of the problems suggested by driving instructors and by previous research. Finally, the effect of greater experience on older people's insight and willingness to make sensible adjustments to their driving was examined.
Sixsmith and Sixsmith (1993)
Topic: Review of Aging Research Relevant to Driving
Abstract: This paper examines the particular problems that older people experience as drivers and evaluates the role of road transport informatics (R TI) as a means for enhancing driver capabilities and improving road safety
Walker, AJicandri, Sedney, and Roberts (1991) (see Decision Making Speed)
TRB (1994) p.49 (see Perception: Traffic Signs)
TRB (1994) p.47 (see Decision Making Path)
TRB (1994) p.55 (see Perception: Traffic Signs)
TRB (1994) P61 (see Vehicle ControL Braking)
Experience
Nieminen and Summala (1994) (see Decision Making Speed)
Triggs and Drummond (1993) (see Perception Obstacles)
Brown and Groeger (1988)
Topic: Effects of Experience on Risk-Taking Behavior
Abstract: Young drivers are statistically overrepresented in road accidents. Their elevated risk is a complex function of chronological age and driving experience, both of which are associated with acceptance and misperception of risk on the road. This paper considers evidence that young drivers underestimate certain traffic hazards and overestimate their own driving abilities. The potential contribution of these misperceptions to their faulty decision making during skills acquisition is discussed in the light of recent findings from relevant research. Some implications for future research and the development of accident countermeasures are indicated.
Henderson (1987) p.5(59)
Topic: Differences in Driving Behavior as a Function of Experience
Useful finding: New drivers had a smaller preview distance.
187

Fatigue
Hartley, Arnold, Smythe, and Hansen (1994)
Topic: Effects of Fatigue on Reaction Time
Abstract: This study examined physiological and psychological changes in one solo truck driver and both drivers in a two-up truck crew during several 5 to 6 day round-trips to the north west of Western Australia. The solo driver showed greater changes on most measures than the two-up crew and compared with control measures obtained from research assistants accompanying the drivers. The results suggest that solo drivers may experience more fatigue, impaired capacity for controlled mental effort and slowed reactions than a two-up crew.
Henderson (1987) p.2(n)
Topic: Effects of Fatigue on ReactionTime
Henderson (1987) p.5(45)
Topic: Effects of Fatigue on Driver Behavior.
Useful finding: Preview distance was reduced when tired.
Wierwille and Ellsworth (1994)
Topic Effects of Fatigue on Driving Behavior
Abstract: Drowsiness of vehicle operators is a major hazard in transportation systems, and methods need to be developed for practical evaluation of drowsiness level. One suggested approach is observer rating. Accordingly, an experiment was carried out using trained observer-raters to evaluate the levels of drowsiness of drivers The drivers' faces were recorded on videotape. Results indicate that such ratings are reliable and consistent. A subsequent experiment shows that ratings covary with other known indicators of drowsiness.
Brookhuis, Dewaard, and Mulder (1994) (see Decision Making; Headway)
Useful finding: Coherence measure decreased after 2 hrs from. 97 -95.
Brookhuis and Dewaard (1993) (see Decision Making; Headway)
Useful finding: SD oflateral position, measured in centimeters increased from 22 to 28 after 3 h of driving.
DRIVING STYLES
Kloeppel, Peters, James, Fox, and Alicandri (1994) (see Vehicle Control: Steering)
French, West, Elander, Wilding (1993)
Topic: Driver Decision Making Style as a Predictor of Accidents
188
Abstract In an exploratory postal survey of 71 I drivers stratified by age, sex, annual mileage. and accident involvement. decision-making style was measured using a Decision-Making Questionnaire (DMQ) and driving style was assessed using a Driving Style Questionnaire (DSQ) Responses to 21 items of the DMQ formed 7 independent and internally coherent dimensions according to a principal components (PC) analysis. These were labeled: control. thoroughness, instinctiveness, social resistance, hesitancy, perfectionism, and idealism. PC analysis also revealed that responses to 15 items of the DSQ formed 6 independent dimensions of driving style. These were labeled: speed, calmness, social resistance, focus, planning, and deviance. Multiple regression analysis indicated that drivers of 60 years and under who scored lower on thoroughness were at greater risk of a traffic accident and that this relationship was mediated by faster driving. This relationship was independent of age, sex. annual mileage, and all other factors measured. In the drivers over 60 years, lower thoroughness, greater hesitancy, and taster driving were independently associated with higher accident rates independent of all other tactors measured.
West, French. Kemp, and Elander ( 1993)
Topic: Relationship of Self-reported and Observed Driving Style to Accident Involvement
Abstract: Forty-eight drivers answered a set of written questions about their driving style and drove a pre-defined, mixed urban and motorway route under observation Relationships were examined between self-reports of driver behavior and observers' reports. and between both of these and the number of accidents in which the drivers had been involved in the past 3 years. The results indicated that there was good inter-observer agreement on a number of important variables including speed, calmness, and attentiveness. Observers also showed good agreement on overall ratings of driver skill and safety Observed speed on the motorway correlated well with drivers' self reports of normal driving speed. Observed speed on the motorway showed a clear positive correlation with self-reported accident involvement.
Bonnenson (1992) (see Vehicle Control Braking)
Kikuchi and Riegner (1992) (see Vehicle Control Braking)
Brown and Groeger ( 1988) (see Driver State Experience)
Parker, Manstead, Stradling, and Reason (1992) (see Decision Making: Speed)
INTEGRA TED MATH MODELS
The term "integrated models" in this report refers to models that include math models of both vehicle response and driver behavior and are used for predicting closed-loop driving response. All such models reviewed so far are restricted to predicting steering behavior. These models do not include submodels for speed selection by the driver. The speed profile (usually constant speed) is an independent model input. Although non-linear models for vehicle response (particularly tire response characteristics) exist, the integrated models tend to be restricted to linear vehicle modeling so as to be compatible with existing linear models for driver steering response behavior.
189
Classical Control Model
The classical control driver model described in detail by Allen et al. (1987) is perhaps the most comprehensive model of this type to be applied to driver/vehicle modeling. The primary independent parameters of the this model consist of driver limitations and parameters directly related to the control process. Steering control is effected by a set of constants ("gains" in the parlance of control systems) operating on vehicle heading angle (relative to the roadway), lane position, and lateral acceleration. The specific values chosen for these control parameters are based on knowledge of vehicle response behavior as well as an assumed level of closed-loop control stability desired by the driver. The model also allows "preview" (look-ahead) information to be acted upon so that the driver can act in a predictive mode from knowledge of the road curvature profile.
Explicit driver information-processing limitations include driver response delay and a representation of "neuromuscular" dynamics. An earlier version of this model shows a "noise" input to represent the stochastic portion of the driver's response behavior (Reid, 1983), but this term is absent in the presentation by Allen et al (1987)
Models similar in structure to the model developed at STI include the University of Toronto" lane tracker" (Reid, 1983), which incorporates previewed road curvature and input noise processes; the "indifference threshold" model of Carson and Wierwille (1978), which include indifference thresholds associated with the driver's perception and use of heading and lane deviations, and the model proposed by Donges (1978), which includes previewed road curvature as an input
Integrated Driver Model
The Integrated Driver Model (10M) is a simulation model for predicting driver behavior and system performance when the automobile driver performs concurrent steering and auxiliary invehicle tasks (Levison, 1993; Levison & Cramer, 1993.) The IDM is an integration of two previously existing computerized models referred to as the "procedural model" and the "driver/vehicle model" The procedural model deals primarily with in-vehicle tasks and with the task-selection and attentional-allocation procedures, whereas the driver/vehicle model predicts continuous control (steering) behavior. Given descriptions of the driving environment and of driver information-processing limitations, the IDM allows one to predict continuous manual control performance as visual attention is intermittently diverted from the forward scene to one or more monitoring locations associated with the auxiliary in-vehicle tasks. The model also allows
~ . the operator to attend visually to the forward scene while simultaneously processing auditory information. Attention-switching and task selection are made on the basis of time-varying priorities that consider, at each decision point, the penalties for tasks not performed. Presentation of auxiliary tasks is controlled in part through dependencies on the state of the driving environment as predicted by the model and in part through "scripting" (i.e., state-independent time-based occurrence of events defined prior to the model run.) Model outputs include time histories for vehicle state variables such as lane position and steering wheel deflection as well as for allocation of visual and cognitive attention.
190

Optimal Control Model
The "driver/vehicle" element of the Integrated Driver Model is the so-called "optimal control model." As with the classical control model, the optimal control model includes parameters related to driver information processing limitations. Unlike the classical control model, controlrelated parameters are not treated as independent parameters. Instead, the user specifies parameters related more closely to the task description. Control parameters (such as the feedback gains) are computed automatically, using algorithms derived from optimal control theory, on the basis of the task description and driver limitations. (Kleinman, Baron, and Levison, 1970, 1971).
Model parameters related to driver information-processing limitations consist of (a) driver response delay, (b) an effective signal-to-noise ratio to account for limitation on overall (cognitive) information-processing limitations, and (c) indifference and perceptual "thresholds," currently approximated by statistically equivalent random noise processes.
The driver's knowledge base includes estimates of instantaneous values of state variables, descriptions of the driving environment, and a representation of task requirements. Both the best estimate (expected value) and the uncertainty associated with this estimate (estimation error variance) are generated for each system state variable.
Descriptors of the driving environment include knowledge of vehicle response dynamics, statistical properties of external disturbances (road-surface and wind inputs), and properties of command inputs (e.g., road curvature, lead-vehicle behavior) Because the driver does not necessarily have perfect knowledge of the task environment, the representations of system elements included within the driver submodel may differ in some respects from the details of the driving task implemented elsewhere (e.g., the actual vehicle model) in the driver/vehicle model.
Also included in the knowledge base is the driver's view of the task requirements. For example, in the case of simple lane tracking, the user must specifY a "performance index" to reflect the relative criticalities of errors and deviations in important vehicle-state and control variables. For a lanechange maneuver, additional performance requirements may be specified in terms of a desired path profile.
Other models for driver/vehicle systems have been proposed based on optimal control theory. For example, MacAdam (1981) describes a model in which the driver's strategy for path following is modeled as a time-lagged optimal preview control process.
Driver Vehicle Effectiveness Model (DRIVEM)
The Driver Vehicle Effectiveness Model (DRlVEM) was designed to explore three types of collision-avoidance maneuvers: (1) brake to a full stop, (2) steer around an obstacle, and (3) combined brake and steer around an obstacle (Reid, 1983; Lieberman & Goldblatt, 1981 ; Wolf & Barrett, 1978a, b.) Driver model consists of a deterministic feed-forward portion that effects the evasive maneuver plus a closed-loop model based on the "crossover model" used by Allen and colleagues to provide stabilizing behavior at the termination of the maneuver. This model does not appear to be suitable, however, for exploring a more general range of driving environments.
191

DRIVEM is perhaps the most comprehensive model that has been offered for treating task selection in the driving domain. DRlVEM uses a statistical model of task selection. Ten areas are specified as potential fixation points, and statistical distributions are provided to determine where the driver will look next and for how long. Given that the driver is fixating on a location containing a potentially collision-producing event (e.g., a vehicle in the lane ahead), a number is drawn from another distribution to determine whether or not the event has been detected. If the event is detected, the vehicle control model included in DRIVEM is exercised to simulate appropriate evasive maneuvering.
DA TA SOURCES FROM A V AILABLE TRAFFIC SIMULATION MODELS The literature review has identified several traffic simulation models that consider a variety of driver related parameters. We have not, however, been able to identity to date the sources of experimental data upon which the driver parameters have been based.
TRAF-NETSIM
TRAF-NETSIM (FHWA, 1989) is a microscopic traffic simulation model. It adopts an intemalscanning simulation to describe traffic operations. It models traffic streams where each vehicle is identified by category such as auto, car pool, bus, truck. One of the 10 different driver behavioral characteristics ranging from very passive to very aggressive is assigned. The following driver related parameters are included in the TRAF-NETSIM model.
• Statistical distribution for the queue discharge characteristics .
•
•
•
•
•
•
•
•
Mean value (and distributions) of start up lost time experienced by all lead vehicles in queue when the signal changes from red to green.
Probability of a left-tum jumper (ie, vehicle turns left at start of green before opposing vehicles enter intersection.
Turning speed.
Lane switching acceptable lag (ie, the minimum time gap in traffic in the adjacent lane for a vehicle to change lanes)
Probability of a vehicle joining or causing a spillback.
Probability of a left-tum lagger (ie., a left-turning vehicle that enter the signalized intersection and executes a tum following an amber signal indication).
Minimum acceptable gap for a vehicle waiting at a stop to cross the road. Values are specified for near side and far side traffic.
Driver response time in terms of deceleration to an amber signal indication.
Distribution of acceptable gaps for left-turning vehicles.
192
FRESIM (FHW A, 1990) is another extensively used microscopic traffic simulation model that is applicable to freeways, whereas NETSIM is applicable to urban networks. Examples of other microscopic simulation models include ROADSIM and CORSIM. The ROADSIM model is a microscopic, time-stepping stochastic model that was developed to simulate the flow of traffic on a two-lane highway system (Mekemson, Herlihy, & Wong, 1993.) CORSIM, which is a model integrator combining the NETSIM and FRESIM models, is underdevelopment and has not been released to the traffic engineering community. These microscopic models simulate the movement of individual vehicles in l-s intervals through a network oflinks.
These models are part of the TRAF family of traffic simulation models and thus include driverrelated parameters as itemized above for TRAF-NETSIM.
The following two microsimulation models, TRARR and TWOPAS, are not of the NETSIM family and have different sets of driver parameters
TRARR
TRARR is a microscopic computer simulation model that tracks the progress of individual vehicles along a section of two-lane rural roads (Hoban. F awerty, & Robinson, 1985.) These rural roads are two-lane, two-way without intersections or significant roadside activities, where vehicles enter and leave only at the ends of the road. Climbing lanes. overtaking lanes, and three or four lane roads may be modeled by adding auxiliary lanes on one or both sides of the road. In addition, this model permits user-defined overtaking prohibitions, horizontal and vertical curves, and variable sight distance. The section of the road considered in the model is typically 4.83 km to 30.59 km (3 to 19 mi) in length.
This model is used to examine the effects of changes in either the road or traffic characteristics on traffic operations. Using this modeC the user can examine alternative road designs and improvements including realignment, improved sight distance, adding overtaking lanes and through lanes, and alternative traffic characteristics including traffic growth, vehicle composition (e.g. % truck), and vehicle size and power. This model allows vehicles to vary in performance and drivers to vary in behavior under the following driving circumstances unimpeded, following other vehicles, overtaking, or merging The following driver related parameters are included in the TRARR model:
desired speed
overtaking speed
happy speed
maximum deceleration
maximum acceleration
maximum power to be used
time spacing
distance spacing
following distance
fixed distance component of minimum desired following distance
193
time component of following space when hassled
aggressiveness (Aggression number)
whether to overtake when beyond second in a platoon
whether to obey overtaking restrictions
whether to do risky overtaking
whether to use opposing auxiliary lane to advantage
change lane time
distance component of end-of-auxiliary lane merging distance allowed
time until settled after merging
TWOPAS
TWOP AS is a microscopic computer simulation model for two-lane, two-way highways. The TWOP AS model simulates traffic operations on highways by reviewing the position of each vehicle on a simulated roadway at J -s intervals and advancing those vehicles along the highways in a real world situation (St. John & Harwood, 1986.) This model examines the effects of the foHowing factors on traffic operations:
driver characteristics and preferences
road geometric
traffic control
vehicle size and performance characteristics, and
entering traffic
Under the above major categories, the program includes the following features
driver characteristics and preferences
desired speeds
preferred acceleration levels
limitations on sustained use of maximum power
passing and pass-abort decisions
realistic behavior in passing and climbing lanes
Road Geometric:
grades
horizontal curves
lane width, shoulder width, and pavement quality
passing sight distance
passing and climbing lanes
Traffic Control:
passing and no-passing zones
speed limits
194
Vehicle Characteristics
vehicle acceleration and speed capabilities
vehicle lengths
Entering Traffic
flow rates
vehicle mix
platooning
immediate upstream alignment
195


REFERENCES
AASHTO. (1994). Policy on Geometric Design of Highways and Streets. American Association of State Highway and Transportation Officials. Allen, R.W., RosenthaL T.l, and Klyde, D.H. (1995). Application a/vehicle dynamic modeling to interactive highway safety design. TRB Paper No. 951050.
AASHTO. (1988). Road~'ide Design Guide. American Association of State Highway and Transportation Officials.
AASHTO. (1977). Guide for ,Selecting. Locating. and Designing Traffic Barriers. Washington, DC: American Association of State Highway and Transportation Officials.
Agent, K.R, and Pigman, lG. (1990) Accidents involving vehicles parked on shoulders of limited access highways. Tramportatioll Research Record, hme Number 1270, 3011.
Alicandri, E.. and Walker, 1 (1993) Simulator evaluation of advance flagger signs. Tn Proceedings (?!Ihe 37th Annual Aleeting the Human Factors and Ergonomics Society. l'oll/me 1. 602-606.
Allen, RW, Parseghian, Z, Rosenthal, TT (1994) Simulator evaluation of road signs and signals. Tn Proceedings (?! the 38th Annllal Jvleeting ql the Human FaCTors and ErgonomiCS Socie(v Part 2 (l?! 2), 903-906.
Allen, R.W, and RosenthaL TJ. (1994) Requirements!or Fehicle d.vnamics simulalion models. SAE Paper No. 940175.
Allen, R.W., Rosenthal, TJ., and Klyde, D.H. (1995) Application (?l ,'ehicle Dynamic Modeling to Interactive Hig}m'ay S't-?/ety Design Paper No. 951050. Washington, DC: The University of Michigan Transportation Research Institute.
Allen, RW, Rosenthal, T.l, and Szostak, H.T. (1988) Analytical modeling of driver response in crash avoidance maneuvering, Volume I: Technical Background. Final Report. Washington, DC: US. Department of Transportation
Allen, RW., Szostak, H.T., and Rosenthal, TJ (1987) Analysis and Computer Simulation of Driver/Vehicle Interaction, SAE Paper No. 871086.
Allen, R.W., Szostak, H.T., RosenthaL TJ., Klyde, D.H., and Owens, KJ. (1991). Characteristics il?f/uencing ground vehicle lateral directional dynamic stability. SAE Paper No. 910234.
Ball, K., Owsley, c., Roenker, D, and Sloane, M. (1993). Isolating risk factors for crash frequency among older drivers. In Proceedings of the 37th Annual A1eeting the Human Factors and Ergonomics Socie(v. Volume J, 211-214.
197

Baron, S, and Levison, W.H. (1977). Display analysis with the optimal control model of the human operatoe Human Factors, 19, 437-457.
Baron, S., and Levison, W.H. (1975). An optimal control methodology for analyzing the effects of display parameters on performance and workload in manual flight control. IEEE Trans. on .SYstems, Man and (ybernetics, .SlvlC-5, 423-430.
Benekohal, RF, and Wang, L. (1994). Relationship between initial speed and speed inside a highway work zone journal: Transportation Research Record, Issue Numher I .. N2, 41-48.
Benekohal, RF., Wang, L., Orloski, R., and Kastel, L.M. (1992). Speed-reduction patterns of vehicles in a highway construction zone. Transportatioll Research Recor(/, h5'lle Number 1352, 35-45.
Berthelon, c., and Mester, D. (1993). Curvilinear approach to an intersection and visual detection ofa collision. Human Factors, 35, 521-534.
Bonneson, 1. A. (1992) Modeling queued driver behavior at signalized junctions. Tramportatiofl Research Record, Issue Number 1365. 99-107.
Briscoe. H., Levison, W.H., Bromage, E., Cartee P, Dubinsky, R, Chowdhury, M.A., and Hughes, W.E. (1995). Initial Development t!f a Proto1)pe Driver Pe!/ormance Modelfor Highway Design. Task 2: S)'Stem Functional Reqllirementsfor the IHSDIv/ (BBN Report No. 8086). Cambridge. MA: BBN Systems and Technologies.
Brookhuis, K. A, and Dewaard, D (1993) The use of psychophysiology to assess driver status. Ergonomics, 36, 1099-1110.
Brookhuis, K.A, Dewaard, D, and Muldec B (1994) Measuring driving performance by carfollowing in traffic. Ergonomics, 3 7 ,427-434.
Brouwer, WH, Waterink, W, Van Wolffelaar, PC, and Rothengattee T. (1991) Divided attention in experienced young and older drivers: lane tracking and visual analysis in a dynamic driving simulator. ,,,"peciallssue: S£?fety and mohili(v (ielderly drivers: Part f, Human Factors, 33, 573-582.
Brown, JD., and Groeger, 1.A. (1988) Risk perception and decision taking during the transition between novice and experienced driver status. Ergonomics, 31, 585-597.
Calcote, L.R. (1977). Developmem qf a cost-effectiveness modelfor guardrail selectioll. Final Report. Washington, DC: U.S. Department of Transportation.
Carson, 1.M., and Wierwille, WW. (1978). Development of a strategy model of the driver in lane-keeping. Vehicle S)'Stems l~ynamics, 7. 223-253.
Donges, E. (1978). A two-level model of driver steering behavior. Human Factors, 20, 691-707.
Duncan, 1., Williams, P., and Brown, L (1991). Components of driving skill experience does not mean expertise. ErgonomiC,}', 3-1, 919-937.
Ellis, N.C. (1972). Driver Expectancy: Definitionfor Design (Research Report 606-5). Texas Transportation Institute.
198
Fazio, J, Michaels, R.M., Reilly, W.R., Schoen, J, and Poulis, A. (1990) Behavioral model of freeway exiting. Transportation Research Record. Issue Numher 1281, 16-27.
FHWA. (\995). Contract DTFH-61-93-C-00142.
FHW A. (1991a). Design Risk Ana~ysis, Volume 1, (Publication No. FHW A-FLP-OIO). Washington, DC: Federal Highway Administration, .
FHW A. (1991 b). Design Risk Ana~Wiis, Volume 2, (Publication No. FHW A-FLP-O 11). Washington, DC: Federal Highway Administration.
FHW A. (1990). Freeway Simulation !tv/ode! Enhancement and Integration, FREES1M Technical Report (Contract No. DTFH61-85-C-00094). Washington, DC: Federal Highway Administration.
FHW A. (1989). TRAF-NETSIM Use's Manual. Washington, DC: Federal Highway Administration.
FHW A. (1988). Manual on Uniform Traffic Control Devices for Streets and Highways. Washington, DC: Federal Highway Administration.
FHW A. (1981). HiRhway Geometric DesiRIl COllsisten()' Related to Driver E¥pectancy (Report No. FHW NRD-811035). Washington, DC: Federal Highway Administration.
Fisher, J. (1992) Testing the effect of road traffic signs' informational value on driver behavior Human Factors, 3.J, 2311-237.
Fitzpatrick, K. (1991). Gaps accepted at stop-controlled intersections. Tramportafion Research Record. Issue Number, 103-112.
Fitzpatrick, K., et al. (1993) Comparison of sight distance procedures for turning vehicles from a stop-controlled approach. Transportation Research Record 1385
French, DJ., West, RJ, Elander, l, and Wilding, 1 M. (1993) Decision-making style, driving style, and self-reported involvement in road traffic accidents. Ergonomics, 36,627-644.
Galley, N. (1993). The evaluation of the electrooculogram as a psychophysiological measuring instrument in the study of driver behavior. Ergonomics, 36, 1063-1070.
Garber, NJ., and Srinivasan, R. (1991). Risk Assessment of ederly drivers at intersections: statistical modeling. TRB, Trall5portation Research Record, 1325.
Garber, N.J, Chowdhury, M.A., and Kalaputapu, R. (1992) Accident Characteristics ~f Large Trucks on Highway Ramps. Washington, DC: AAA Foundation for Traffic Safety.
Gattis, JL., and Duncan, J (1995). Geometric DesiRnfor an Adequate Previelv (?f the Road Ahead, (74th Annual Meeting). Washington, DC: Transportation Research Board.
Gawron, V.l, and Ranney, T.A. (1990). Curve negotiation performance in a driving simulator as a function of curve geometry. Journal ~f Applied ErgonomiCS, 21, 33-38.
Gawron, VJ., and Ranney, T.A. (1988). The effects of alcohol dosing on driving performance on a closed course and in a driving simulator ErgonomiCS, 31, 1219-1244.
Glennon, lC. (1989). Highway sight distance issues: an overview. Transportation Research
199

Record /20B.
Glennon, 1 C (1974). Roads'ide S{~fezv Improl'emellf Proc\.frams on Freeways: A Cos/Effectiveness Approach. (National Cooperative Highway Research Program Report 148) Washington, DC: TRB, National Research CounciL
Godthelp, H. (1988). The limits of path error-neglecting in straight lane driving. Elxonomics. 31, P609-619.
Godthelp, H.K, and Kappler, W.D. (1988) Effects of vehicle handling characteristics on driving strategy. Human Factors, 30, 219-229.
Godthelp, H.K, Milgram, P, and Blaauw, 0.1 (1984) The development of a time-related measure to describe driving strategy. Human Factors 26(3 ):257-268
Granda, T.M., Moyer, M.J, and Wochinger, K (1995) The Conceptual Development ofa Driver Performance Module. In Compendium <?f Technical Papersfor the 651h Annual Afeeting of the instilllte (?f' T,'amporratioll Engineers Washington, DC: Institute of Transportation Engineers
Greene, FA, Koppa, Rl, Zellner, RD .. and Congleton, lJ (1994) Determining legibility distance for highway signs: is the within subject variability being overlooked') In Proceedings of the 381h Annual Afeeling qf lhe Humall Factors and L'rgoflomics Socie(r. Parr :: (qf' 2), 907-911.
Hale, AR., Quist, B.W, and Stoop, l (1988) Errors in routine drivingtasks: a model and proposed analysis technique. Eixonomics. 31, 631-641.
Hale, RC, and Ye, N. (1994). Fuzzy model ofvehjcular guidance. In Proceedings qf the 3Rfh Allnual Afeering of rhe HlIman FaClors ({lid Li'gollomics Socie(r. Par! 2 ((~f 2)
Hall. lW., and D.S. Turner. (1989) Stopping sight distance can we see where we now stand') Tramportalioll Research Record. / :J08
Hartley, LR, Arnold, P.K., Smythe, 0., and Hansen, l (1994) Indicators of fatigue in truck drivers. Journal (?f' Applied Ergonomics, 25, 143-156.
Harwood, OW, and Glennon, lC (1989) Passing sight distance for passenger cars and trucks. Tral7.<,portalioll Research Recof'(1, 1 :J08.
Harwood, D.W., Mason, lM, and Graham, lL (1994) Conceplllal Planfor an Interacfh'e Highway Sc~fefy Desif(ll lv/ode! (Report No. FHW A-RD-93-122). McLean, V A Federal Highway Administration.
Hauer, E, Ng, lC N, and Lovell, 1 (1988) Estimation of safety at signalized intersections. Transportalion Research Record. 1185.
Henderson, RL (1987). Driver Performance Data Book Washington, DC: National Highway Traffic Safety Administration.
Hoban, C.J., Fawcett, GC, and Robinson, GK (1985) A model for simulating traffic on twolane rural roads: user guide and manual for TRARR Version 3.0. Australian Road Research, Technical Manual.
Holland, CA, and Rabbitt, PMA (1994) The problems of being an older driver - comparing
200
the perceptions of an expert group and older drivers Journal (!f Applied F-'rgonomics, 25, 17-27.
Hunter-Zaworski, KM. (1990). T -intersection simulator performance of drivers with physical limitations. Transportation Research Record, Issue Numher 1281, 11-15.
Hutchinson, JW., and Kennedy, T.W. (1966). Medians qlDil'ided Highways, Frequency and Natllre (?l Vehicle Encroachments, (Bulletin 487), Engineering Experiment Station, Urbana, IL: University of Illinois.
Imbeau, D., Wierwille, WW, Wol( LD, and Chun, G.A. (1989) Effects of instrument panel luminance and chromaticity on reading performance and preference in simulated driving. Human Factors, 31, 147-160.
Jackson, J S.H., and Blackman, R (1994) A driving-simulator test of Wilde's risk homeostasis theory. Journal (?l Applied P~ychology, 79. 950-958.
Kallberg, VP (1993) Reflector posts-signs of danger') TrallSporlation Research Record, Issue Numha 1-103, 57-66
Kikuchi, S, Riegner, JR (1992) Methodology to analyze driver decision environment during signal change intervals: application of fuzzy set theory Tramportatioll Research Record, hwe Number, 1368,49-57.
Kikuchi, S, and Chakroborty, P (1992) Car-following model based on fuzzy inference system. Transportation Research Record, Issue Numha, 1365, 82-91.
Kikuchi, S, Perincherry, V., Chakroborty, p, and Takahashi, H. (1993) Modeling of driver anxiety during signal change intervals Tramportalioll Research Record, Issue Numher 1399, 27-35.
Kleinman, DL, Baron, S, and Levison, W.H. (1971) A control-theoretic approach to mannedvehicle systems analysis, IJ:FJ,' Tralls. 011 Automatic COI7lI"OI. AC-16(6) 824-833
Kleinman, D. L, Baron, S, and Levison, W H. (1971). A control theoretic approach to mannedvehicle systems analysis, IL~'E hailS. 011 A 1110. Control. AC-16, 824-833.
Kleinman, D.L, Baron, S., and Levison, WHo (1970) An optimal control model of human response, Part I: theory and validation. Automatica, 6, 257-369.
Kleinman, DL, Baron, S, and Levison, W.H. (1970) An optimal-control model of human response, Part I: Theory and Validation, Au/omatica, 6, 357-369.
Kline, OW, and Fuchs, P (1993). The visibility of symbolic highway signs can be increased among drivers of all ages. Human Factm's, 35, 25-34.
Kline, T.J Ghali, LM., Kline, OW, and Brown, S. (1990) Visibility distance of highway signs among young, middle-aged, and older observers: icons are better than text. Special Issue: Aging, Human Factors, 32, 609-619.
Kloeppel, E., Peters, RD., James, C, Fox, J,E., and AJicandri, E. (1994). Comparison of older and younger driver responses to emergency driving events. In Proceedings (?l the 38th Annual Meeting (if the Human Factors and Ergonomics Society Part 2 (l?f 2)
Korteling, JE. (1990). Perception-response speed and driving capabilities of brain-damaged and
201
older drivers. Human Factors, 32, 95-108.
Korteling, lE. (1994) Effects of aging, skill modification, and demand alternation on multipletask performance. Human Factors, 36, 27-43.
Krammes, R.A (1994). Design Speed and Operating Speed ill Rllral Highway Alignment Design. Paper No. 940996, presented at the 73rd Annual Meeting, Washington, DC: Transportation Research Board.
Krammes, R.A, et aL (1995). Horbmtal Alignment Design C'ollsistenc..vfor Rural Two-Lalle Highways (Report No. FHW A-RD-94-034), Washington, DC: Federal Highway Administration.
Lerner, N.D. (1994). Age and driver are requirements at intersections. In Proceedings C?f the 38th Annual lv1eeting qf Ihe Humall Factors and ErgonomiC5i Socie(v. Part 2 (qf 2), 842-846
Lerner, N. D (1993). Brake perception-reaction times of older and younger drivers. In Proceedings (?f fhe 37th Annual lv1eefing the Human FaCfon., and EI;;:onomics Socie(r, Volume L 206-210.
Levison, W. H. (1993) A simulation model for the driver's use of in-vehicle information systems. Transportation Research Reconi, No. J -t03, 7-13.
Levison, W.H. (1971) The F,ffecfs (?f[)(\play (Jain and Sif.,rnal Bandwidth 011 Human COllfroller Remnant (Technical Report AMRL-TR-70-93). Wright Patterson Air Force Base, Ohio Aerospace Medical Research Lab
Levison, WH., Baron, S, and Kleinman. DL (1969) A model for human controller remnant. J£'£E' Trails. Oil Afan-.Machme 5:vsfems, AIA1S-JO, 10 I-I 08.
Levison. W.H., and Cramer. N.L (1995) Description (?lthe fmegrated Dril'er A1odel. (Report No FHWA-RD-94-092) McLean, VA Federal Highway Administration.
Levison. W.H., and Cramer. N.L (1993) DeSCription of the JmeK1-ated Dm'Cl" Afode! (Report No. 7840) Cambridge, MA Bolt. Beranek and Newman Inc.
Lieberman, fE, and Goldblatt. R. (1981) A Rel'iew qf the [)ril'er-I'ehicle Effectiveness (DRfT-Elvf) l'v/odel (Report No. DOT-HS-806-110 (PBB2-218553) Washington, DC: National Highway Traffic Safety Administration.
Lings, S (1991) Assessing driving capability: a method for individual testing -the significance of paraparesis inferior studied in a controlled experiment. Journal qf Applied Ergonomics 22,75-84.
Lum, H., and Reagan, JA (1995) Interactive highway design model Accident predictive module, PII blic Roads, Wi Ilter, 14-1 7.
Luyanda, F., Smith, RW, Padron, M, Resto, p, Gutierrez, J, and Fernandez, L (1983) Multivariate statistical ana(vsis (~f highway accidelll and highwa.v conditions. Mayaguez School of Engineering Research Center (Report No. DOT-RSPA-DMA-50/84/9). Puerto Rico: University of Puerto Rico.
MacAdam, CC (1981) Application of an optimal preview control for simulation of closed-loop automobile driving. fFEE Trans SAIC-J J, 393-399
202

Macdonald, W A., and Hoffmann, E R. (1991) Drivers awareness of traffic sign infomration. Etgonomics, 3-1, 585-612.
Mak, K. (1995). Methods for analyzing the cost-effectiveness of roadside safety feautures. In Roadside SqfeZr Issues (IRB Circular No. 435) Washington, DC Transportation Research Board.
McCoy, P.T, Hsueh, RT, and Post, ER (1981) Methodology for evaluation of safety improvement alternatives for utility poles. Transportation Research Record 796, 25-31.
McCoy, P.T, Tarawneh, M.S, Bishu, RR, Ashman, RD" and Foster, B.G. (1993). Evaluation of countermeasures for improving driving performance of older drivers. Transportation Research Record, Issue Number: J -105, 72-80.
McGehee, D. V., Dingus, TA., and Horowitz, AD. (1994). Experimental field test of automotive headway maintenance/collision warning visual displays. In Proceedings (~f the 38th Annual Factors and ['.,rgonomics Society. Pari :: (qf ::), 1099-1103.
McKnight, AL and Shinar, D. (1992) Brake reaction time to center high-mounted stop lamps on vans and trucks. Human Factors, 3-1,205-213.
Mekemson, JR., Herlihy, ET, and Wong, SY (1993) Trqffic lvfodels Overview Handbook (Report No. FHWA-SA-93-050) Washington, DC Federal Highway Administration.
Miaou, SP, Hu, PS, Wright, T, Davis, SC, and Rathi, A.K. (1991) Developmentq( Relationship Between Truck AccidellIs and Geometric Design: Phase J (Report No. FH\VARD-91-124). Washington, DC Federal Highway Administration.
NCHRP. (1995a). Improved Featllresfor Cost-e.!fectiveness AnaZvsis (4Roads'ide S(?(ety Features. NCHRP Project No. 22-9, Texas College Station, Texas: Texas Transportation Institute. (In progress.)
NCHRP. (1995b). ErpenmellIal Flallsfor Acctdem Stlldies o( HighH'(~l' Design Elements, Contract No. DTFH61-92-C -00172 (in progress.)
NCHRP. (1969) Developmelll (!/Design ('riteria for 5,'q(er LlImiflaire Supports (NCHRP Report 77), HRB, Washington, DC National Research Council.
Nieminen, T, and Summala, H. (1994) Novice and experienced drivers' looking behavior and primary task control while doing a secondary task. In Proceedings qf the 38th Annual Meeting qf the Human Factors and Ergonomic.'> ,)'ociezv. Part 2 (?f 2), 852-856.
Nilsson, L. (1993) Behavioural research in an advanced driving simulator experiences of the VTI system. In Proceedings qf the 37th Anllual Afeeting the Human Factors and Ergonomics ,SOCiety, Volume J, 612-616.
Nirschl, G., and Eck, R. (1994) Driver-and situation-specific effects on assistance systems for speed and distance controL In Proceedings (~f the 38th Annual Meeting £?f the Human Factors and £!gonomics 5/ociezv. Part 2 ((?( 2), 857-861.
Noy, YI. (1989). Intelligent route guidance: will the new horse be as good as the old. In Proceedings o(the IEEE Vehicle Navigation & !J?(ormation Systems C01?ference, 49-55.
203
Ottesen, J.L., and Krammes, RA (1994) SIJeed prqflle modelfor a U.S. operating-.\peedbased design consistenc)' evaluation procedure. Paper No. 940995, presented at the 73rd Annual Transportation Research Board Meeting, Washington, DC.
Pant, P.O., Huang, X.H., and Krishnamurthy, S.A (1992). Steady-burn lights in highway work zones: further results of study in Ohio. Trall.'portation Research Record, Issue Number 1352, 60-66.
Parker, D., Manstead, AS., Stradling, S.G., and Reason, IT (1992) Intention to commit driving violations: an application of the theory of planned behavior. Journal qf Applied Psychology, 77, 94-101.
Rachlin, H.C (1966). Scaling subjective velocity, distance and duration. Perception and Psychophys, Volume 1.
Rahimi, M., Briggs, RP., and Thorn, D.R. (1990). A Field-evaluation of driver eye and head movement strategies toward environmental targets and distractors. Journal qf Applied Ai-gonomics, 21,267-274.
Ranney, TA, and Pulling, N.H. (1990) Pertormance differences on driving and laboratory tasks between drivers of different ages. Trall5portatiol1 Research Record Isslle Number 1281, 3-10.
Reagan, 1 A. (1994). The interactive highway safety design model designing for safety by analyzing road geometries, Public Road'i. c",'lImmer. 3 7-43
Reid, L.D. (1983) A survey of recent driver steering behavior models suited to accident studies. Accident analysis and prevention 15. 23-40
Riedel, A (1990) A model of the real driver for use in vehicle dynamics simulation models. Technical Papers, Volume 1 Presented at the XXIII FISITA Congress, Torino, Italy, May 7-11
Roadside Design Guide AASHTO. (XXX) American Association of State Highway and Transportation Officials.
Ross, HE., Jr, and Sicking, D.L. (1984) Gll/delillesfor U~e (l Temporal), Barriers in f;Vork Zones. Final Report. US Department of Transportation.
Rumar, K. (1990). The basic driver error-late detection. I,,'rgonomics, 33, 1281-1290.
Sayers, M.W., and Mink, C (1995) Integration qf road design with vehicle dynamics models through a simulation graphicalllser interface (S(;UI) Paper No. 95 1084. Washington,OC The University of Michigan Transportation Research Institute.
Serafin, C. (1994) Driver Eye Fixations on Rural Ro(uh: Insight Into Safe Driving. (Report No: UMTRI-94-21). Ann Arbor, MI: University of Michigan Transportation Research Institute.
Serafin, c., Wen, c., Paelke, G., and Green, P (1993) Car phone usability: a human factors laboratory test. In Proceedings o.fthe 37th Annual Nfeeting the Human Factors and Ergonomics Socie(v, Volume 1,220-224.
Shaw, IS (1993). Fuzzy model of a human control operator in a compensatory tracking loop. International Journal of Man-Machine Studies, 39, 305-32.
Shehab, R L, and Schlegel, R.E. (1993). Test of Fitts' Law in a dual-task paradigm. In
204

Proceedings qf the 37th Annual fvfeet;'lg the Human ~Factors and Ergonomics S'ociety, Volume 1, 559-563,
Sicking, D,L, and Ross, RE (1986). Benefit-cost analysis of roadside safety alternatives, Transportation Research Record, 1065,
Sixsmith, 1., and Sixsmith, A (1993), Older-people, driving and new technology, Journal of Applied Ergonomics, 2-1,40-43,
Sojourner, R1., and Antin, J F. (1990), The effects of a simulated head-up display speedometer on perceptual task performance, Human Factors, 32, 329-339,
St John, AD" and Harwood, D,W, (1986), TWOPAS User's Guide, A User's Guide to TWOPAS - A Microscopic Computer Simulation Model of Traffic on Two-Lane, Two-Way Highways (Performing Organization Report No, 7533-S(6», Washington, DC: Federal Highway Administration,
Stewart, D, Cudworth, CJ, and Lishman, lR. (1993) Misperception of time-to-collision by drivers in pedestrianaccidents, Perception, 22, 1227-1244,
Sturr, 1.F" Kline, GE, and Taub, RA (1990) Performance of young and older drivers on a static acuity test under photopic and mesopic luminance conditions, Human Factors, 32, 1-8,
Summala, R (1988), Risk control is not risk adjustment the zero-risk theory of driver behavior and its implications, Ergonomics, 31, 491-506,
Taoka, G T, (1991) Distribution of driver spare glance durations, Tramportatiofl Research Record, Iss'ue Number 1318,142-146,
TRB, (1994) Dril'er Pe!jormance Data Book Update: Older Dril'ers and IVHS. (Transportation Research Circular, Issue Number 419) Washington, DC: Transportation Research Board,
TRB. (1987), Designing S(?fer Road\', (Special Report No, 214) Washington, DC: Transportation Research Board,
Triggs, T 1., and Drummond, A E (1993) Young driver research program based on simulation, In Proceedings (?f the 37th Annual Meeting the Human Factors and ~rgonomics Socie(v, 1 'olume 1,617-621.
Walker, 1., Alicandri, E, Sedney, C, and Roberts, K (1991), In-vehicle navigation devices: effects on the safety of driver performance, In Proceedings (?f the 11~1~' T 'ehicle Navigation & h?!ormation Systems COliference, Part 1, 499-526
Walker, 1., Sedney, C, Wochinger, K, Boehm-Davis, D, A, and Perez, W A (1993), Age differences in the useful field of view in a park-task driving simulator. In Proceedings C?! the 37th Anllual Meeting of the Human Factors and Ergonomics Society, Volume 2, 960-963,
West, R, French, D" Kemp, R, and Elander, J (1993), Direct observation of driving, selfreports of driver behavior, and accident involvement Ergonomics, 36, 557-567,
Wierwille, W,W" and Ellsworth, LA (1994), Evaluation of driver drowsiness by trained raters, Accident Ana~vsis and Prevention, 26, 571-58 L
205
Wolf, J.D., and Barrett, M.F. (197Sa). Driver-Vehicle Effectiveness Model, Volume L Final Report (Report No. DOT HS S04 337) Washington, DC: National Highway Traffic Safety Administration.
Wolf, lD., and Barrett, M.F. (l97Sb) Driver-Vehicle Effectiveness Model, Volume II, Appendices (Report No. DOT HS S04 338) Washington. DC: National Highway Traffic Safety Administration.
Wood, J.M, and Troutbeck, R. (1994b). Effect of visual impairment on driving. Human Factors, ~476-487.
Wood, lM., and Troutbeck, R.J. (1994a). Effect of age and visual impairment on driving and vision performance. Transportation Research Record. IYslle Number 1-138.
Zegeer, C, Reinfurt D., Neuman, T., Stewart, R., Council, F. (199 I). Safety Improvements on Horizontal Curbs for Two-Lane Rural Roads - Informational Guide. (Report No. FHWA-RD-90-074) McLean, VA: Federal Highway Administration.
Zegeer, C, Stewart, R., Reinfurt, 0, Council, F, Neuman. T., Hamilton, E, Miller, T, and Hunter, W. (1991) Cost-Effective Geometric Improvements for Safety Upgrading of Horizontal Curves. (Report No. FHWA-RD-90-021). McLean, V A: Federal Highway Administration.
Zegeer, C V, Hummer, l, and Hanscom, F (1990). Operational effects oflarger trucks on rural roadways. Transportation Research Record. h·sue Number: 12Rl, 28-39.
Zeitlin, L. R. (1993). Subsidiary task measures of driver mental workload: a long-term Held study. Tran.sportation Research Record. Issue Number: 1-103, 23-27.
Zeller. M, and Mock-Hecker, R. (1993) Modeling autonomous agents in a knowledge based simulation environment. In Proceedings ol the 5th Internarional COI?lerence on Tools with Art~ficial Intelligence TAJ'93, 412-4 15.
Zwahlen, H. T (1994) Nighttime curvature perception of drivers as a function of the number of curve delineation devices. In Proceeding\· ql the 3Rth Anlluall\4eeting qf the Human Factors and £1'gol1omics Society. Part 2 (ql2).
Zwahlen, H. T (1993). Eye scanning rules for drivers: how do they compare with actual observed eye scanning behavior') Tramportation Research Record, Issue Numher: 1-103. 14-22.
Zwahlen, H. T., Yu, l, and Rice, l W (1990). Conspicuity ofretroreflective signs and devices at night when driving with only one head\amp working Tran.,portation Research Record. Issue Number 1287, 230-243.
206