influence of sampling strategy on the distinction between tropical pioneer and non pioneer forest...
TRANSCRIPT
INTRODUCTION
Recent years have seen increasing interest in the func-tioning of tropical trees and forests, which are en-croached and converted at an unprecedented rate(Achard et al. 2002). With an estimated 50 000 or sotree species, the tropical rainforests of Asia, Africa andthe Americas harbor a highly diverse flora of woodyplants and, most likely, a great wealth of different treefunctional types which may differ in growth rate,water and nutrient economy, and stress tolerance(Turner 2001). It is convenient to distinguish twoprincipal groups of trees in tropical moist forests basedon morphological and functional attributes, i.e. light-demanding, fast growing and relatively short-livedpioneer trees which often form early-successional for-est communities, and more or less shade-tolerant,
slower growing, medium to long-lived non-pioneertrees which dominate old-growth, late-successionalforests (Swaine & Whitmore 1988, Bazzaz 1991,Strauss-Debenedetti & Bazzaz 1996). Although thisassumed functional dichotomy is not undisputed(e.g., Turner 2001) it can be helpful in formulatingtestable hypotheses on trade-offs between tree phy-siological and morphological traits.
When intending to study leaf functional traits inspecies-rich tropical forests, there are some decisionsteps to take. First, the study parameters have to beselected. In many cases, they should be reliable pre-dictors of leaf and tree physiology because they shouldallow inferences from leaf attributes on processes atthe tree or stand level (Garnier et al. 2001, Cornelis-sen et al. 2003). Leaf and seed properties have beenused much more frequently than attributes of stemsor roots or whole-tree growth patterns because theyare easier to measure. Second, one has to select an ap-
151
ECOTROPICA 12: 151–160, 2006© Society for Tropical Ecology
INFLUENCE OF SAMPLING STRATEGY ON THE DISTINCTION BETWEEN TROPICAL PIONEER
AND NON-PIONEER FOREST SPECIES
Christoph Leuschner1*, Kerstin Bohman1, Paul J. A. Kessler 2 & Ramadhanil Pitopang 3
1Plant Ecology, University of Göttingen, 37073 Göttingen, Germany2 Nationaal Herbarium Nederland, Universiteit Leiden branch, 2300 RA Leiden, The Netherlands
3 Universitas Tadulako, Faculty of Agriculture, Palu, Sulawesi, Indonesia.
Abstract. It is widely accepted that tree species from tropical old-growth late-successional forests (natural forests) differ mar-kedly in their leaf morphological and physiological attributes from tropical pioneer (early-successional) trees, which oftenform secondary forests in clear-cut areas. For example, higher foliar nitrogen contents, higher photosynthetic activities,and a larger leaf size have frequently been reported for pioneer tree species. Since most tropical forests are rich in tree spe-cies, we hypothesize that the results of a morphological and functional comparison between natural forest (NF) and se-condary forest (SF) species may largely depend on the sampling design, i.e. the number of tree species sampled and howthese are selected in the stands. To test this hypothesis we compared three different leaf-sampling strategies (SA: speciesaverage based on a large random sample; NSA: species average based on a small random sample; WSA: species average SAweighted by tree species frequency) with the results of a nearly complete stand inventory. The study was conducted in NFand SF stands in the lower montane rainforest of Central Sulawesi, Indonesia. As expected, the SA, NSA and WSA sam-pling strategies gave different results with respect to the assumed functional dichotomy between NF and SF trees. Our da-ta indicate that, for many leaf attributes, more than 20 or 25 species per forest type are required for detecting significantdifferences between NF and SF trees. Leaf size was the only parameter that was significantly affected by a sampling effect,resulting from the absence of very large-leaved species in small samples. If the focus of interest is on the leaf traits of the‘average tree’ of a forest type, as in biogeochemical studies, the weighted species average (WSA) approach, which also con-siders species abundances, should be given preference over simple species averages (SA and NSA). Accepted 29 June 2006.
Key words : Foliar nutrient content, leaf size, random sampling, sampling effect, species average, δ13C.
*e-mail: [email protected]
Umbruch 10.01.2007 10:18 Uhr Seite 151

propriate sampling design that meets the purpose ofthe study and allows statistical analysis when com-paring different samples.
In species-rich tropical moist forests, leaf samplingin the sun canopy of mature trees is often a difficultand labor-intensive task. Thus any reduction in laboreffort during fieldwork is highly appreciated; howeverthe sample must remain large enough to be represen-tative of the stands. Most investigations of leaf traitsin tropical trees that compared different forest typessampled a few, more or less arbitrarily selected treespecies per stand, and calculated averages at the standor forest type level. This procedure may be severelybiased, not only by the subjective selection of tree spe-cies, but also by the sampling effect because typicallynot more than 10 or 20% of the tree species of thestand are included in a sample. As far as we know,there is no systematic investigation which comparesthe results of different leaf sampling strategies intropical forests with leaf trait data obtained in com-plete stand inventories, i.e. studies on the floristiccomposition of the forest.
In this paper we present the results of a joint studyby tree ecophysiologists and taxonomists conductedin several species-rich, lower montane forests of Cen-tral Sulawesi, Indonesia. We sampled old-growth for-ests with very low anthropogenic disturbance (here-after termed ‘natural forest’) and young secondaryforests which had established after clear-cut of thenatural forest. The study objective was to compare theresults of three different random sampling strategiesthat differed considerably in the number of tree spe-cies and specimens collected, and thus contrasted interms of labor effort. In all sampling strategies, a broadrange of leaf traits (14) was investigated. The resultsfrom the three random sampling strategies were com-pared with the data of a near-complete leaf samplingof all trees in the stands, which was conducted in the context of a floristic analysis in collaboration withthe herbaria in Bogor (Indonesia) and Leiden (theNetherlands).
METHODS
Study area. The study was conducted inside and alongthe borders of Lore Lindu National Park in CentralSulawesi, Indonesia (districts of Donggala and Poso,01°25’S, 120°20’E). With an area of 217 000 ha, theNational Park is one of the last larger blocks of trop-ical montane rain forest in the area (Whitten et al.2002). It was declared a Man and Biosphere Reservedue to its outstanding importance for biodiversity
conservation in Wallacea. However the park is sub-ject to rapid encroachment from the surroundingcommunities (van Rheenen et al. 2004). The studyplots were selected in the Napu and Palolo valleysclose to the village of Wuasa at an elevation of about1100 m a.s.l.
This study was conducted as part of the interdis-ciplinary, long-term research program “STORMA –Stability of Rain Forest Margins in Indonesia” whichaims at identifying the socio-economic and ecologi-cal key factors and processes that lead to destabiliza-tion and forest degradation in the rainforest marginzone of Central Sulawesi.
Climate and soils. The study region is influenced bythe Australian-Asian monsoon system throughout theyear. Mean air temperature in Wuasa (Napu valley)was 21°C, mean air humidity was 82.6 %. Yearly rain-fall from December 2001 to December 2002 was1596 mm, without a pronounced dry season (dataprovided by H. Kreilein & G. Gravenhorst, Univer-sity of Göttingen). A characteristic feature of the localclimate is thunderstorms with heavy precipitation inthe afternoon.
The soils of the study plots are predominantlyfertile Cambisols, with the majority of investigatedprofiles having pH(KCl)-values above 5 and basesaturations > 80%. Carbon and nitrogen stocks in thesecondary forests were significantly lower than in thenatural forests. However, burning of logs after clear-cut resulted in enrichment of calcium, potassium, andmagnesium in the topsoil ash of the secondary forests.
Forest types. We studied two types of forest that differgreatly with respect to species composition, foreststructure, and human impact. Lower montane, old-growth late-successional forests with only minor hu-man influence were termed ‘natural forest’ (NF). Therespective stands had a closed canopy of about 35 min height with single emergent trees (mainly of Ficusbenjaminii or Polyalthia canangoides) reaching 45 mor more. The canopy consisted of 2–3 strata whichwere not very conspicuous. In the sparse shrub andherb layers, seedlings and regrowth of the canopy spe-cies prevailed. According to Whitmore’s (1984) clas-sification, the forests are humid submontane tropicalrainforests. In general, the disturbance intensity in thenatural forest plots was low. However, rattan collec-tion and, very locally, logging of single trees was ob-served. To exclude these influences as far as possiblewe chose all study sites at a minimum distance of 1km from the forest border.
LEUSCHNER ET AL.
152
Umbruch 10.01.2007 10:18 Uhr Seite 152

Secondary forests (SF) occupy a substantial areain the Napu and Palolo valleys. They develop on for-mer slash-and-burn fields at distances of a few up to2000 m from the recent forest border. The dense 3to 5-yr-old stands had a closed canopy and were 4–7m high. This is a typical age for secondary forests inthe area because many stands are re-cut for wood pro-duction before they reach 10 years. After clear-cut ofthe natural forest, annual crops (mainly maize) arecultivated for a few years, with the fields left for se-condary succession thereafter. Pioneer trees establishrapidly on these fallows, forming dense thickets al-ready in the first year of colonization. In most stands,the understory was dominated by a more or less closedgrass layer with scattered shrubs and forbs of Urtica-ceae, Zingiberaceae, and other families. The secon-dary forest stands typically had a size of 4–10 ha andwere located in the middle of fields with annual cropsand agroforestry plantations, mostly cocoa. The se-condary forests studied were all similar in stem den-sity and canopy structure. To avoid edge effects, allplots were situated at least 50 m from the forestmargin.
Other land-use types in the study area includepaddy rice fields and forest gardens, i.e. planted cropsunder a remaining sparse forest canopy. The size ofthe study region’s local tree species pools for naturalforest and secondary forest can be only estimated.With about 150 species ha-1 (Kessler et al. 2005), thenatural forest is undoubtedly much richer in treespecies than the secondary forest, where an estimated50–60 species are found per hectare.
Plot selection. Defining plot size was complicated bythe fact that secondary forests represented small stands< 5 ha in size, with a large part of the forest beingclose to the forest margin. To exclude edge effects andto avoid very high stem numbers in the samples, wedecided to choose different plot sizes for natural fo-rest (2500 m2) and secondary forest (400 m2), fol-lowing the recommendation of Mueller-Dombois &Ellenberg (1974). As a consequence, stem numberswere similar in the NF and SF samples. However,plot-size-related diversity measures could not be com-pared between the two forest types with this proce-dure.
Prior to plot selection, we inspected a number ofsuitable forest patches in the study region for locali-ties that would meet the following criteria: (1) suf-ficient homogeneity in overall stand structure, (2)absence of larger gaps (larger than 2–3 fallen trees),(3) absence of obvious signs of major anthropogenic
disturbance, and (4) structural comparability to theother plots of the forest type. A further selection cri-terion was elevation: all plots were chosen at 900 to1100 m a.s.l.
Based on this procedure, three natural forest stands(Gunung Potong, Napu I, Napu II) and four second-ary forest stands (Watumaeta, Alitupu I, Alitupu II,Kaduaa) were selected for study. In these seven stands,we demarcated six rectangular plots of 2500 m2 (50m x 50 m) in the natural forest stands, and four plotsof 400 m2 (20 m x 20 m) in the secondary foreststands, in most cases one plot per stand. The exactlocation of the plots was chosen by a two-step proce-dure: first, forest patches fulfilling the above-men-tioned criteria (1) to (4) were identified, and second,a conspicuous thick stem was selected in the plot asthe north-eastern plot corner in an attempt to demar-cate the 10 study plots by a quasi-random procedurein the seven forest patches. In the Gunung Potongnatural forest only, we placed four plots each of 2500m2 side by side because we also aimed at sampling acomplete 1 ha (100 m x 100 m) plot. Only this plotwas large enough to analyze the species/area rela-tionship in the natural forest. Thus, four of the six2500 m2 plots in natural forests were spatially inde-pendent of each other; they can be treated as repli-cations. In contrast, the Gunung Potong plots mustbe viewed as pseudo-replications. In total, we inves-tigated 1600 m2 of secondary forest and 15 000 m2
of natural forest, and sampled more than 1000 treeswith a dbh >10 cm.
Using compass, ropes, and wooden sticks, we es-tablished rectangular grids of 5m mesh-width on allplots with the x-axis in a north-south direction. Thisprocedure resulted in grids with 121 nodes in the2500 m2 plots, and grids with 25 nodes in the 400 m2
plots. These grids formed the basis for a random selec-tion of trees by identifying the mature or pre-maturetree with fully sunlit leaves being closest to a node.
Leaf sampling. For obtaining data on various leaf mor-phological and chemical traits, fully sunlit, mature andvigorous leaves were collected from the trees. In thesecondary forests, leaves could be accessed at heightsof 3–6 m with a branch cutter on an extendable stick.For sampling the natural forest trees at 15–25 mheight, local tree climbers and the staff of the Herba-rium Celebense in Palu were employed, using climb-ing equipment with ropes and iron hooks or by freelyclimbing the trunks. Depending on leaf size, 4 to 30leaves per tree were collected with their petiole, putin paper bags and transported to the laboratory at
SAMPLING STRATEGIES IN FORESTS
153
Umbruch 10.01.2007 10:18 Uhr Seite 153

Tadulako University in Palu where further analysistook place. Sampling was conducted from Februaryto October 2001 on the natural forest plots, and fromMarch to July 2001 on the secondary forest plots.
Analysis of leaf morphological traits. Leaf size, leaf shape,and specific leaf area were investigated in four to tenleaves per individual tree. The leaves were scanneddirectly after sampling with a flat-bed graphics scan-ner (CanoScan N340P, Canon, Japan), and thereaf-ter dried at 70°C for 48 h. The dried leaves wereweighed for calculating specific leaf area (SLA). Leafarea, and length and width of the leaves were deter-mined from the digital images with the program Win-Folia (Régent Instruments Inc., Quebec, Canada). Inthe case of compound leaves, only one leaflet was ana-lyzed. These data were treated as equivalent to thosefrom simple leaves throughout the study.
Analysis of leaf chemical traits. For chemical analysis,the petioles were cut off and the leaves dried at 70°Cfor 48 h, and thereafter ground to fine powder. Onesample per tree, consisting of 4–30 fully sunlit leaves,was analyzed according to the following protocol.
The total concentrations of Ca, K, Mg, and P in the leaf dry mass were detected through HNO3-pressure digestion and subsequent atomic emissionspectrometry (Optima 2000 DV, Perkin Elmer). Thetotal carbon and nitrogen concentrations were de-termined using gas chromatography in an elementalanalyzer (Vario EL, Elementar). The 12C/13C and14N/15N isotope signatures were analyzed in groundleaf material with a gas isotope mass spectrometer(Finnigan, MAT 251) at the KOSI facility of the Uni-versity of Göttingen.
Four different sampling approaches. We applied fourdifferent sampling approaches on the natural and se-condary forest plots which differed in terms of samplesize, labour effort and selection criteria. The approachesSA, NSA, and WSA (see below) considered all treesreaching the upper canopy and randomly selected asubsample of it. The three approaches differed withrespect to sample size and data averaging procedure.In the fourth sampling approach (INV), we attemptedto investigate all trees >10 cm dbh in the stands byconducting a more or less complete floristic and eco-logical forest inventory. These data were used as a re-ference in the analysis.
(1) – Species average (based on a large random sample;SA)Since both forest types had a characteristic tree spe-cies density of 35 to 50 species per 1600 m2, we aimedat investigating about 30 species per forest type. The
tree individuals were selected at random in the plotsof a forest type until about 30 tree species were in-cluded in the sample. Due to the very different abun-dances of the species in the plots, one to ten indi-viduals per species were sampled. In a first step, aver-ages for each species were calculated from these cons-pecific samples. In a second step, a species average wasobtained for each forest type by averaging over the ca.30 species. Since the diversity-frequency relationshipswere quite different in the two forest types, our selec-tion procedure resulted in160 tree individuals of 35species in the secondary forest, but only 119 indivi-duals of 28 species in the natural forest.
(2) – Species average (based on a small, normalizedrandom sample; NSA)For investigating the influence of the sampling effecton our leaf trait analysis, we created small subsam-ples from the larger random samples SA. This wasdone by randomly selecting n = 18 tree species perforest type from the SA sample. Thus, the NSA sam-ples were obtained from the SA samples after nor-malizing them to 18 species in both forest types. Asin the SA sampling approach, the data were first aver-aged over one to 10 different individuals per speciesfor obtaining species means and thereafter used forcalculating the 18-species-mean for each forest type.
(3) – Weighted species average (based on a large ran-dom sample; WSA)Based on the SA random sample (1) with 160 or 119trees of ca. 30 species, we also calculated leaf trait aver-ages for the two forest types by simply averaging overall individuals in the sample irrespective of species.This mean value can be taken as the ‘average tree’ ofthe random sample, or the species average of the SAapproach weighted by the species abundance in thesample. Clearly, this approach assumes that the sam-ple is large enough to reflect differences in speciesabundance in the stands.
(4) – Stand average (forest inventory data; INV)A complete inventory with respect to species identity,stem diameter, phenological status (presence of fruitsand flowers), and leaf morphological and chemicaltraits was conducted in several of the study plotscovering all stems >10 cm in dbh. The fieldwork wasconducted in a period of about 5 months by a teamof 4–5 persons, including one taxonomist with pro-found South-East Asian expertise, and two additionalbotanists from Germany and Indonesia. Leaf, flower,and fruit samples (if available) were mostly collectedin the sun crown by engaging local tree climbers (seeabove). All specimens were taken in triplicate num-
LEUSCHNER ET AL.
154
Umbruch 10.01.2007 10:18 Uhr Seite 154
ber and transferred to the Tadulako University in Palu(Herbarium Celebense), to Bogor (Herbarium Bogo-rense), and to the National Herbarium of the Nether-lands in Leiden for identification and deposition. Be-cause of the large number of specimens, tree speciesidentification was very time-consuming and tookmore than one year. Of the 1171 trees sampled intotal, 1152 specimen could be identified to genus le-vel, 7 only to family level, while the remaining 12 re-mained unidentified. For the large majority of the1152 specimens, the species was also identified; theothers were recognized as morphospecies. The scien-tific names follow the recent checklist of woody plantsof Sulawesi compiled by Kessler et al. (2002).
Due to the very labor-intensive process of samp-ling and species identification, we were only able toconduct the inventory in a total plot area of 5000 m2
in the natural forest, and in an area of 1600 m2 inthe secondary forest. These plots were thought to berepresentative of the 10 plots of the study. Further,we were not able to sample all mature trees in theseplots completely because we failed to climb the can-opy in 10 to 20% of the stems present. This happenedin cases where either the stems were too smooth forclimbing, or a dense liana cover made the trees in-accessible. Because several specimens remained un-identified, the number of species given for the naturalforest plots is a slight underestimation of the realdiversity. Thus the inventory data cover the bulk oftrees and individuals, but still contain data gaps. Thetrees included in this inventory differ from thosecovered by the random sample because (i) the num-ber of species and individuals are different, and (ii)all strata were included in the INV sample whereasthe latter only referred to the canopy-layer trees.
Stem diameter was measured with a fabric dia-meter tape (+ 1 mm resolution) at 130 cm height. Se-veral trees had large buttresses that reached 1.3 m inheight. In these cases, D was measured 0.2 to 0.7 mhigher on the stem.
Statistical analysis. The statistical analyses were con-ducted with the program SAS release 8.1 (SAS Insti-tute Inc., Cary, NC, USA). All data were tested fornormal distribution using Shapiro & Wilk’s test; thedata showed non-Gaussian distribution throughout.A non-parametric, univariate Wilcoxon test was usedto detect significant differences between natural for-est and secondary forest samples for all 13 measuredparameters (p < 0.05). This was done separately forthe four sampling strategies.
RESULTS
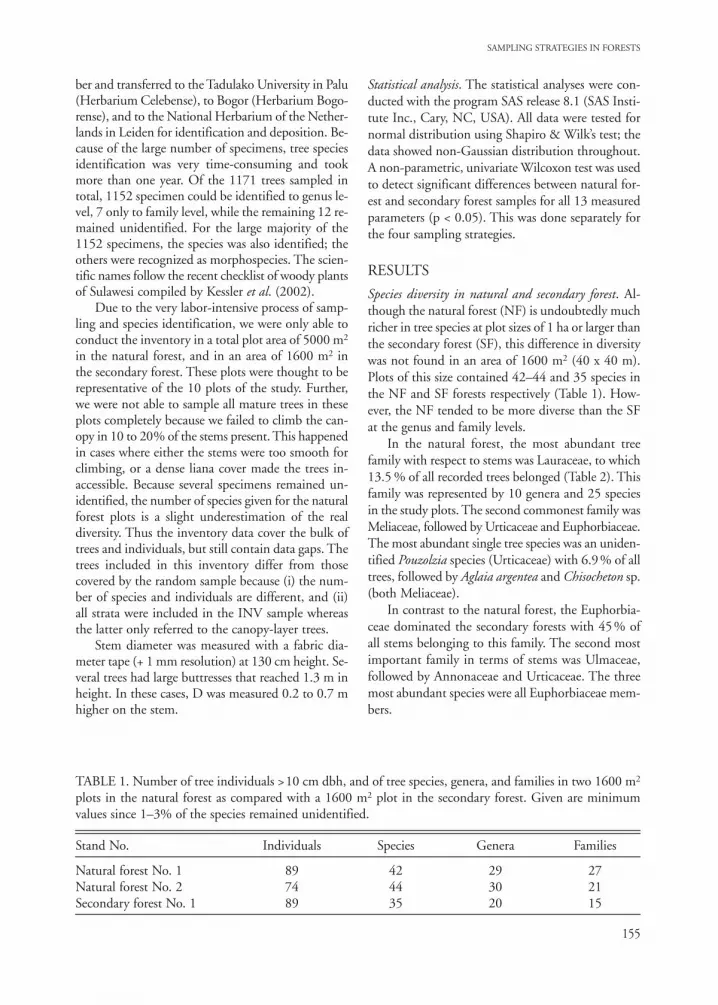
Species diversity in natural and secondary forest. Al-though the natural forest (NF) is undoubtedly muchricher in tree species at plot sizes of 1 ha or larger thanthe secondary forest (SF), this difference in diversitywas not found in an area of 1600 m2 (40 x 40 m).Plots of this size contained 42–44 and 35 species inthe NF and SF forests respectively (Table 1). How-ever, the NF tended to be more diverse than the SFat the genus and family levels.
In the natural forest, the most abundant treefamily with respect to stems was Lauraceae, to which13.5 % of all recorded trees belonged (Table 2). Thisfamily was represented by 10 genera and 25 speciesin the study plots. The second commonest family wasMeliaceae, followed by Urticaceae and Euphorbiaceae.The most abundant single tree species was an uniden-tified Pouzolzia species (Urticaceae) with 6.9% of alltrees, followed by Aglaia argentea and Chisocheton sp.(both Meliaceae).
In contrast to the natural forest, the Euphorbia-ceae dominated the secondary forests with 45% ofall stems belonging to this family. The second mostimportant family in terms of stems was Ulmaceae,followed by Annonaceae and Urticaceae. The threemost abundant species were all Euphorbiaceae mem-bers.
SAMPLING STRATEGIES IN FORESTS
155
TABLE 1. Number of tree individuals >10 cm dbh, and of tree species, genera, and families in two 1600 m2
plots in the natural forest as compared with a 1600 m2 plot in the secondary forest. Given are minimumvalues since 1–3% of the species remained unidentified.
Stand No. Individuals Species Genera Families
Natural forest No. 1 89 42 29 27Natural forest No. 2 74 44 30 21Secondary forest No. 1 89 35 20 15
Umbruch 10.01.2007 10:18 Uhr Seite 155

As is characteristic for species-rich communities,a diversity-abundance graph for the natural forestyielded an extremely left-skewed distribution, with thelarge majority of species being present only as one or two individuals per plot (data not shown). In thesecondary forest, the most abundant species achieveda higher dominance whereas fewer rare species werepresent than in the NF.
Leaf traits of natural and secondary forest tree species.Interspecific variation among the species within a for-est type was very different for the 13 morphologicaland chemical leaf traits investigated (trait no. 14, theabundance of compound leaves was not subject tostatistical analysis). The variation among the specieswas very large for leaf size (coefficient of variation CV:80–130%), intermediate for the leaf length/widthratio, the δ15N signature, and for foliar Ca, K and Mgcontent (CV typically 40–80%), rather small for spe-cific leaf area (SLA), foliar P content, and for C/Nand N/P ratios (CV typically 5–40%), and very small(CV typically <5%) for the δ13C signature and foliarN content (natural forest only). Comparing the twoforest types with respect to interspecific variation ofleaf traits showed no systematic difference. An ex-ception was foliar N content, which was ten timesmore variable in the SF than in the NF sample (seeTable 3).
In the large random sample of trees (SA: 119 or160 trees per forest type in NF and SF respectively),we found highly significant differences (p < 0.01 or0.02) between NF and SF trees in 10 of 13 leaf traits(Table 3). Only foliar Ca and Mg content and δ15Nsignature showed no significant differences between
natural forest and secondary forest. Thus sun leavesof SF species were most different from the NF spe-cies in being, on average, narrower and thinner (seeFig. 1), and by having higher N and P contents, lowerC/P and N/P ratios, and higher δ13C values.
Influence of sampling strategy. Reducing the numberof sampled tree species from 28 (or 35) to 18, andthe number of sampled tree individuals from 119(160) to 77/82, as done when shifting from the SAto the NSA sampling approach, resulted in a lowersignificance of leaf trait differences between naturaland secondary forest in a number of leaf attributes(leaf size, SLA, foliar N and K content, C/N ratio;Table 3). The absolute difference between the meansof NF and SF also decreased in five leaf traits whenapplying the NSA approach. For three parameters (Caand K contents and δ15N) we observed a change inthe ratio between the NF and SF means, i.e. oppositetrends according to the two sampling strategies. How-ever, neither the SA nor the NSA sampling approachyielded significant differences between the two foresttypes for these three traits. The size of the sample(28/35 species in SA vs. 18 species in NSA) had onlya minor or no effect on the interspecific variation ofthe leaf traits within a forest type. However, severalleaf traits tended to have larger absolute means in thesecondary forest when sampled with the more com-prehensive SA sampling strategy as compared with theNSA approach; this was valid in particular for leaf size,SLA, and foliar N and P.
In the WSA approach (weighted species average),the results of the SA approach were related to tree spe-
LEUSCHNER ET AL.
156
TABLE 2. Most abundant families and tree species in the natural forest and secondary forest of the studyregion. Data refer to the forest inventory samples.
Natural Forest Percent Secondary Forest Percentof stems of stems
FamiliesLauraceae 13.5 Euphorbiaceae 45.0Meliaceae 12.7 Ulmaceae 9.3Urticaceae 10.1 Annonaceae 5.4Euphorbiaceae 8.8 Urticaceae 5.0
SpeciesPouzolzia sp. (Urticac.) 6.9 Homolanthus populneus (Euphorbiac.) 18.6Aglaia argentea (Meliac.) 4.3 Acalypha caturus (Euphorbiac.) 12.4Chisocheton sp. (Meliac.) 4.0 Glochidium rubrum (Euphorbiac.) 6.2
Umbruch 10.01.2007 10:18 Uhr Seite 156

SAMPLING STRATEGIES IN FORESTS
157
TA
BLE
3. M
eans
and
stan
dard
dev
iatio
n (i
n pa
rent
hese
s) o
f 14
leaf
trai
ts in
nat
ural
fore
st (N
F) a
nd se
cond
ary
fore
st (S
F) tr
ee sp
ecie
s acc
ordi
ng to
four
diff
eren
tsa
mpl
ing
and
calc
ulat
ion
appr
oach
es w
ith a
var
iabl
e nu
mbe
r of
tre
e sp
ecie
s an
d in
divi
dual
s sa
mpl
ed. S
= s
igni
fican
ce o
f di
ffer
ence
s be
twee
n N
F an
d SF
(p
>0.
05).
No
stat
istic
al a
naly
sis
was
pos
sibl
e in
the
cas
e of
the
com
poun
d le
aves
.
Spec
ies
aver
age
Nor
mal
ized
spe
cies
ave
rage
Wei
ghte
d sp
ecie
s av
erag
eSt
and
aver
age
(SA
)(N
SA)
(WSA
)(T
otal
inve
ntor
y IN
V)
Nat
ural
Seco
nd.
SN
atur
alSe
cond
.S
Nat
ural
Seco
nd.
SN
atur
alSe
cond
.S
fore
stfo
rest
fore
stfo
rest
fore
stfo
rest
fore
stfo
rest
Spec
ies
2835
1818
2835
5323
Tree
indi
vidu
als
119
160
7782
119
160
198
78
Leaf
siz
e15
9.7
222.
70.
0214
2.7
161.
6–
156.
118
8.9
–16
7.6
113.
5<
0.00
1(c
m2 )
(215
.2)
(243
.5)
(139
.6)
(146
.5)
(155
.0)
(222
.9)
(166
.9)
(117
.2)
Leng
th-w
idth
2.4
1.5
< 0.
001
3.0
1.7
0.00
32.
31.
90.
032.
42.
0<
0.00
1ra
tio(0
.6)
(0.5
)(3
.0)
(0.5
)(0
.6)
(0.6
)(2
.0)
(2.4
)SL
A (
cm2
g-1)
116.
213
7.6
< 0.
001
105.
612
8.1
–12
2.8
122.
0–
103.
214
5.6
< 0.
001
(36.
5)(3
3.0)
(30.
4)(3
5.5)
(36.
7)(3
3.4)
(22.
6)(3
8.2)
N (
g kg
-1)
20.9
25.0
0.00
219
.322
.9–
21.9
22.5
–19
.023
.7<
0.00
1(0
.7)
(7.8
)(0
.6)
(8.6
)(0
.7)
(8.6
)(0
.5)
(7.4
)P
(g k
g-1)
1.7
3.4
< 0.
001
1.6
2.8
< 0.
001
2.0
2.8
0.00
91.
82.
8<
0.00
1(0
.7)
(1.0
)(0
.6)
(0.8
)(0
.9)
(1.3
)(0
.8)
(1.0
)C
/N21
.819
.20.
0224
.122
.0–
21.6
21.5
–23
.621
.0<
0.00
1(6
.4)
(6.3
)(7
.4)
(7.1
)(5
.9)
(6.7
)(5
.6)
(6.1
)C
/P28
014
0<
0.00
131
117
4<
0.00
127
819
00.
0228
119
2<
0.00
1(1
40)
(54)
(96)
(57)
(148
)(7
5)(1
10)
(107
)N
/P12
.77.
6<
0.00
113
.58.
2<
0.00
112
.78.
9<
0.00
112
.09.
1<
0.00
1(4
.6)
(2.2
)(4
.7)
(1.6
)(5
.1)
(2.4
)(3
.1)
(2.7
)C
a (g
kg-1
)22
.624
.1–
23.1
22.8
–22
.723
.5–
19.5
18.5
–(1
3.9)
(11.
8)(1
4.4)
(13.
9)(1
1.1)
(15.
8)(1
0.7)
(7.8
)K
(g
kg-1
)10
.812
.80.
0113
.412
.5–
11.9
14.1
–12
.411
.10.
04(4
.7)
(4.9
)(7
.0)
(4.5
)(4
.9)
(5.3
)(4
.7)
(4.4
)M
g (g
kg-1
)3.
73.
4–
5.6
3.4
–3.
94.
3–
4.5
3.5
< 0.
001
(1.7
)(1
.3)
(3.1
)(1
.8)
(1.3
)(2
.2)
(2.5
)(2
.0)
δ13C
(‰
)–
29.7
–27
.8<
0.00
1–
29.9
–28
.1<
0.00
1–
29.3
–28
.40.
03–
29.3
–28
.4<
0.00
1(1
.4)
(1.0
)(1
.3)
(0.6
)(1
.5)
(1.1
)(1
.2)
(1.2
)δ15
N (
‰)
1.9
2.7
–3.
02.
4–
2.5
2.5
–2.
42.
6–
(1.9
)(2
.2)
(1.2
)(2
.3)
(1.6
)(2
.0)
(1.2
)(2
.1)
Com
poun
d le
aves
(%
)23
56
1714
2026
8
Umbruch 10.01.2007 10:18 Uhr Seite 157

cies abundance in the stand to reflect the propertiesof the ‘average tree’ of the stand. Compared to the re-sults of the SA approach, most traits showed smallerabsolute differences in their NF and SF means whencalculated according to the WSA approach. Moreover,in 9 of the 13 parameters, the significance of diffe-rences between the two forest types decreased or evendisappeared when shifting from the SA to the WSAapproach. The average leaf of the SF trees appearedto be smaller, thicker and less N- and P-rich whensampled with the WSA approach than according tothe SA approach.
In contrast to the SA, NSA and WSA approaches,which consider randomly selected subsamples of can-opy trees in a plot, the total inventory (INV) datacovered nearly all trees of a stand (canopy trees andsubdominate individuals) and thus approaches thetrue stand averages of the tree populations for the leaftraits investigated. For most leaf attributes except forfoliar K content, the inventory yielded equally highor higher significances for natural forest/secondaryforest differences compared with the SA approach.The absolute means of leaf traits in the NF and SFobtained by the INV and SA approaches were similar
for most attributes. However, leaf size was a markedexception: the average secondary forest leaf was muchsmaller, thinner and narrower in the inventory datathan it appeared from the SA data (Table 3).
DISCUSSION
Leaf sampling in tropical primary and secondary for-ests may serve different purposes. Tree ecophysiolo-gists and foresters are mainly interested in leaf traitsthat characterize a tree species’ carbon gain or growthcapacity, its nutrient demand and economy, or leafwater regime and drought tolerance. Consequently,the focus is on tree species that evolved in the con-trasting environments of primary (late-successional)or secondary (early-successional) forests. On the otherhand, scientists working on regional or global biogeo-chemical cycles may be more interested in the ‘ave-rage’ tree of a forest in order to upscale from the treeto the stand and landscape levels (e.g., Schulze et al.1994, Körner 1995). Different sampling strategiesmay be necessary to reach these two goals.
By comparing three different leaf sampling strat-egies with the results of a nearly complete stand in-
LEUSCHNER ET AL.
158
FIG. 1. Leaf silhouettes of 28 selected natural forest and secondary forest species from the study region.

ventory, we were able to show that the outcome of afunctional comparison of two forest types is, to a con-siderable extent, dependent on the chosen samplingapproach.
Four major conclusions can be drawn from ouranalysis:
(1) As expected, a significant sampling effect mayexist when analyzing tree functional traits because, incertain variables, specific properties of individual spe-cies will have a large effect on the stand mean. Thiseffect was most evident when comparing average leafsize of NF and SF trees as derived either from 18(NSA) or from 28–35 species per stand (SA): the ab-solute means of the two forest types and also the dif-ference between NF and SF were larger in the SA thanin the NSA sample because additional large-leavedspecies were included in the SA sample which weremissing in the more restricted NSA sample. Since leafsize typically showed a left-skewed frequency distrib-ution in the secondary forest samples, this explainswhy a reduced sample size should be associated withsmaller leaf size averages.
(2) In many leaf traits, rather large samples ofmore than 20 or 25 species are required for detectingsignificant differences between SF and NF tree speciesmeans, because interspecific variation within a foresttype was substantial in our forests. This is crucialbecause the majority of studies investigating the put-ative functional dichotomy between NF and SF spe-cies did not analyze more than 3 or 5 species per for-est type and thus may have missed important diffe-rences (e.g., Oberbauer & Strain 1984, Fetcher et al.1987, Strauss-Debenedetti & Bazzaz 1991).
(3) It matters whether only those trees are sam-pled that form the upper canopy layer, or whethersamples are taken from trees of all canopy strata. Inthe total inventory (INV) a few subdominate treeswith dbh >10 cm were covered which thrived in thesecond or third stratum, among them Homolanthuspopulneus (Euphorbiaceae), Grewia glabra (Tiliaceae)and Trema orientalis (Ulmaceae), all with compara-tively small leaves. In fact, only the fast growing treesin the upper canopy of the secondary forest had verylarge leaves, as one would expect for this forest type,whereas a number of mesophyllous and notophylloustrees (leaf size 20–182 cm2) were also present in thelower strata. This explains why the SF had a smalleraverage leaf size (only 114 cm2) than the NF (168cm2) in the total inventory data, which contrasts withthe SA, WSA, and NSA data.
(4) A weighted species average (WSA), which con-siders the contrasting frequencies of the species in the
stand, led to smaller differences between NF and SFtrees than did a simple species average (SA), althoughboth approaches used the same data basis. Thus the‘average trees’ of natural and secondary forests arefunctionally less distinct than it would appear if thespecies averages (SA and NSA) of the two forest typeshad been compared.
Our analysis indicates that natural forest and sec-ondary forest are functionally different primarily withrespect to leaf conductance and P acquisition patterns:the average SF tree had a higher mean leaf conduct-ance (as inferred from a smaller 13C discrimination)and profited from a better phosphorus availability (orP acquisition) than the average NF tree (as indicatedby a higher leaf P content and lower N/P and C/Pratios). Other functional attributes were not signifi-cantly different between NF and SF when comparingthe average tree of the stand.
More recent work has raised doubts as to whethertropical trees can be clustered into two or more di-screte functional groups. There is evidence that thephysiological constitution of tropical trees may changemore or less continuously along the pioneer-climaxaxis if growth rate, size at maturity, regeneration re-quirements and longevity are analyzed (Turner 2001).On the other hand, other functional attributes suchas photosynthetic capacity and maximum leaf con-ductance seem to be clearly different between pioneerand non-pioneer tree species with minor or no over-lap between the two groups, although considerableinterspecific variation exists (Bohman 2004). This isalso true for the foliar δ13C signature as analyzed inthis study (see Table 3). Apparently, these three var-iables are physiological character traits for pioneer andnon-pioneer trees which are rather uniform in eachgroup because the specific environmental constraintsin secondary and late-successional tropical forests onlyallow rather limited variation among the species withrespect to water loss and carbon gain regulation, call-ing for functional convergence (Meinzer 2003).
Other variables were much more flexible amongthe species of a forest type and consequently showeda clear overlap between the trees of secondary and nat-ural forest; examples are leaf size and SLA. Indeed,many pioneer species possess relatively small leaves;on the other hand, there are also late-successionalspecies with very large leaves in the upper canopy(Turner 2001). The same is true for shade tolerance,and for the often reported association of pioneers withr-selection, and of non-pioneer species with K-selec-tion. This is because the light environment and theregeneration niches in secondary forest and natural
SAMPLING STRATEGIES IN FORESTS
159
Umbruch 10.01.2007 10:18 Uhr Seite 159

forest are sufficiently heterogeneous in space and timeto allow for the coexistence of tree species with alter-native traits in the same stand. We conclude that thenotation of a character continuum, or alternatively adichotomy between pioneer and non-pioneer trees,depends on the trait investigated. At least for leaf size,we found evidence against the existence of a contin-uum along the pioneer-climax axis despite consider-able overlap of the values between the two forest types.In our data, the significance of the NF – SF differencein leaf size increased with the size of the sample, in-dicating that the two leaf morphological groups be-came indeed clearer, and not less clear, by includingadditional species. Thus a sufficiently large sample isneeded to detect the difference.
ACKNOWLEDGMENTS
The study was conducted in the framework of theGerman-Indonesian project STORMA, Stability ofRain Forest Margins in Indonesia, funded by the Ger-man Research Council (DFG, Sonderforschungsbe-reich 552: subproject C2). The financial support isgratefully acknowledged. Many thanks to the skillfultree climbers from the Palolo and Napu valleys fortheir valuable support with the leaf sampling.
REFERENCES
Achard, F., Eva, H.D., Stibig, H.-J., Mayaux., P., Gallego, J., Richards, T., & J.-P. Malingreau. 2002. Determination
of deforestation rates of the world’s humid tropical for-ests. Science 297: 999–1002.
Bazzaz, F.A. 1991. Regeneration of tropical forests: physi-ological responses of pioneer and secondary species. Pp.91–118 in Gómez-Pompa, A., Whitmore, T.C., & M.Hadley (eds.). Rain forest regeneration and manage-ment. UNESCO, Paris.
Bohman, K. 2004. Functional and morphological diversityof trees in different land use types along a rainforest mar-gin in Sulawesi, Indonesia. PhD thesis, University ofGöttingen. 127 p.
Cornelissen, J.H.C., Cerabolini, B., Castro-Díez, P., Villar-Salvador, P., Montserrat-Martí, G., Puyravaud, J.P., Maestro,M., Werger, M.J.A., & R. Aerts. 2003. Functional traits of
woody plants: correspondence of species rankings be-tween field adults and laboratory-grown seedlings? Jour-nal of Vegetation Science 14: 311–322.
Fetcher, N., Oberbauer, S.F., Rojas, G., & B.R. Strain. 1987.Efectos del régimen de luz sobre la fotosíntesis y el cre-cimiento en plántulas de árboles de un bosque lluviosotropical de Costa Rica. Revista de Biologia Tropical 35(suppl.): 97–110.
Garnier, E., Laurent, G., Bellmann, A., Debain, S., Berthe-lier, P., Ducout, B., Roumet, C., & M.-L. Navas. 2001. Con-
sistency of species ranking based on functional leaf traits.New Phytologist 152: 69–83.
Kessler, M., Keßler, P.J.A., Gradstein, S.R., Bach, K., Schmull,M., & R. Pitopang. 2005. Tree diversity in primary forest
and different land use systems in Central Sulawesi, In-donesia. Biodiversity and Conservation 14: 547–560.
Kessler, P., Bos, M.M., Sierra Daza, S.E.C., Kop, A., Wil-lemse, L.P.M., Pitopang, R., & S.R. Gradstein. 2002: Check-
list of woody plants of Sulawesi, Indonesia. Blumea,Suppl. 14: 1–160.
Körner, Ch. 1995. Leaf diffusive conductances in the majorvegetation types of the globe. Pp. 463–490 in Schulze,E.-D., & M.M. Caldwell (eds.). Ecophysiology of pho-tosynthesis. Springer, Berlin.
Meinzer, F.C. 2003. Functional convergence in plant re-sponses to the environment. Oecologia 134: 1–11.
Mueller-Dombois, D., & H. Ellenberg. 1974. Aims andmethods of vegetation ecology. J. Wiley & Sons, NewYork. 547 p.
Oberbauer, S.F., & B.R. Strain. 1984. Photosynthesis andsuccessional status of Costa Rican rain forest trees. Pho-tosynthesis Research 5: 227–232.
Schulze, E.-D., Kelliher, F.M., Körner, Ch., Lloyd, J., & R. Leuning. 1994. Relationships among maximum stomatal
conductance, ecosystems surface conductance, carbonassimilation rate, and plant nitrogen nutrition: a globalecology scaling experiment. Annual Review of Ecologyand Systematics 25: 629–660.
Strauss-Debenedetti, S., & F.A. Bazzaz. 1991. Plasticity andacclimation in tropical Moraceae of different succes-sional positions. Oecologia 87: 377–387.
Strauss-Debenedetti, S., & F.A. Bazzaz. 1996. Photosyn-thetic characteristics of tropical trees along successionalgradients. Pp. 162–186 in Mulkey, S.S., Chazdon, R.L.,& A.P. Smith (eds.) Tropical forest plant ecophysiology.Chapman & Hall, New York.
Swaine, M.D., & T.C. Whitmore. 1988. On the definitionof ecological species groups in tropical rain forests. Vege-tatio 75: 81–86.
Turner, I.M. 2001. The ecology of trees in the tropical rainforest. Cambridge University Press, Cambridge.
Whitmore, T.C. 1984. Tropical rain forests of the Far East.2nd ed. Clarendon Press, Oxford.
Van Rheenen, T., Elbel, C., Schwarze, S., Nuryartono, N., Zeller, M., &, B. Sanim. 2004. Encroachments on primary
forests: are they really driven by despair? Pp. 199–213in Gerold, G., Fremerey, M., & E. Guhardja. (Eds.)Land use, nature conservation and the stability of rain-forest margins in Southeast Asia. Springer, Berlin.
Whitten, T., Henderson, G.S., & M. Mustafa. 2002. Theecology of Sulawesi. Periplus, Singapore.
LEUSCHNER ET AL.
160
Umbruch 10.01.2007 10:18 Uhr Seite 160