influence of pressure variations on the formation and development of mesophase in a petroleum...
TRANSCRIPT

Carbon 37 (1999) 445–455
Influence of pressure variations on the formation anddevelopment of mesophase in a petroleum residue
1 ,a b b´ ´ ´ ´R. Santamarıa-Ramırez , E. Romero-Palazon , C. Gomez-de-Salazar ,a , a a a*´ ´ ´F. Rodrıguez-Reinoso , S. Martınez-Saez , M. Martınez-Escandell , H. Marsh
a ´ ´Departamento de Quımica Inorganica, Universidad de Alicante, Apartado 99, E-03080 Alicante, SpainbRepsol Petroleo, S.A., Cartagena, Spain
Received 17 April 1998; accepted 21 July 1998
Abstract
The objective of this study is to search for a method, involving control over the pressures within a pyrolyzing system, toproduce non-coalesced mesophase spheres of required sizes. Semicokes were studied from pyrolyses of a petroleum residue,R1, carried out in a tube reactor, 440–4458C, 1.0 MPa pressure, and soak times 1.0–2.0 h. In some pyrolyses, pressures werereduced from 1.0 to 0.1 MPa and the pyrolysis continued at the same reaction temperature at 0.1 MPa. These experiments aretermed depressurizations. Semicokes were examined by optical microscopy to measure mesophase content as well as
22distributions of size of mesophase spherules and sphere concentration (number of spheres mm ). High-pressure (1.0 MPa)pyrolyses favour the coalescence of mesophase spheres to form bulk mesophase. Initially formed spheres do not growbeyond a certain size indicating that rates of coalescence exceed rates of growth of the spheres. Depressurization causes aloss of volatile matter with a proposed resultant increase in viscosity of the remaining isotropic phase. Some volatile materialmay also be removed from the mesophase spheres themselves, again promoting a viscosity increase. As a result of this, thespheres increase their diameter and there is less production of bulk mesophase. With depressurization, coalescence is notstopped entirely but is reduced considerably in extent. 1999 Elsevier Science Ltd. All rights reserved.
Keywords: A. Mesophase; Petroleum pitch; Semicoke; B. Pyrolysis; C. Optical microscopy
1. Introduction reaction temperature, (d) pressure within the system and (e)pyrolysis capacity (size and shape of reactor) are of
In recent years the understanding of graphitizability in importance [4,5]. It was Brooks and Taylor [3] whocarbons, in terms of the concept of mesophase, its origins, proposed the concept of mesophase, as a nematic liquidproperties and applications, have advanced significantly crystal, as the cause of graphitizability. Later reviews[1,2]. It is now appreciated that the chemical composition include those of Marsh and Walker [6], Greinke [7],
´of the graphitizable parent feedstock, in terms of its Mochida et al. [8], Marsh and Diez [9] and Menendez etaromaticity, transferable hydrogen content, heteroatom al. [10]. The stages of mesophase formation within, e.g.content and catalytic mineral content, dominantly control pyrolyzing coals and pitches are as follows.the growth and crystallinity of resultant mesophase. Theseaspects ultimately control the physical and mechanicalproperties of manufactured artifacts, and hence applica- 1. The increase in average molecular weight of thetions [3]. Further, resultant properties of mesophase can be constituent molecules of the system, to sizes in theadjusted somewhat by control over the physical conditions order of about 2000 amu, i.e. the so-called mesogenof the pyrolyses. Such physical parameters of the pyrolyz- molecule.ing system as (a) heating rate, (b) soak time, (c) final 2. The self-assembly of mesogens to form nematic liquid
crystals known as the mesophase spheres.* 3. Growth in size of these mesophase spheres.Corresponding author. Fax: 134-6-590-3454; E-mail:
4. Coalescence of mesophase spheres, on contact, to [email protected] ´Present address: Instituto Nacional del Carbon, Oviedo, Spain. bulk mesophase.
0008-6223/99/$ – see front matter 1999 Elsevier Science Ltd. All rights reserved.PI I : S0008-6223( 98 )00211-5

´ ´446 R. Santamarıa-Ramırez et al. / Carbon 37 (1999) 445 –455
Table 15. Solidification of mesophase to form coke.Compositional analyses of petroleum residue feedstock R1
Aspects of the kinetics of growth of the mesogens and R1of the growth of mesophase have been studied by Greinke
Elemental analyses C (wt.%) 90.2et al. [11–13]. However, the influence of the physicalH (wt.%) 7.0
conditions of pyrolysis as well as differences in the N (wt.%) 0.1chemistry of feedstocks, on the chemical kinetics is S (wt.%) 0.2outstanding and needs to be studied further, systematically. Solubility Heptane insolubles (wt.%) 13This paper is the first of a series concerned with this aspect Toluene insolubles (wt.%) 0
1of mesophase chemistry. H-NMR H (%) 51ar
Ha (%) 31This study describes the results related to stages (3) andHb (%) 16(4) above. Growth and coalescence of mesophase spheresHg (%) 2are physical processes, being controlled by such physical
parameters as viscosity of the isotropic and mesophasephases. Hence to prevent coalescence of mesophasespheres requires control over viscosities within thepyrolysis systems. Control over the structures of mesoph- ((H )551%), rich in carbon, with a low content ofar
ase is vital to the many industrial applications of mesoph- heteroatoms (0.3 wt.%). There is a majority of hydrogen,ase. For instance, it is necessary to produce mesophase of as methyl hydrogen, attached to the aromatic rings. It isspherical shape with a precise size range for the production totally soluble in toluene and has a certain insolubility inof mesocarbon microbeads. To this end, mesophase of heptane (13 wt.%).spherical shape, with little coalescence, has already been Pyrolysis of the feedstock was carried out in a labora-reported: tory pilot plant, a simplified flow diagram of which is
given in Fig. 1. Special features of this system include a3maximum sample capacity of 1000 cm and an ability to
• using a sedimentation procedure incorporating a special work in the pressure range of 0.1 to 4.5 MPa (the rangedesign of reactor [14], used in this work is 0.1–1.0 MPa). Heating of the reaction
• separated by centrifugation at high temperature [15], tube occurred in a preheated fluidised sand-bath furnace,• by an emulsion method [16], with a temperature control of 618C at 508C and of 628C
21• by the use of an iron catalyst [17], and at 6008C. Heating rates were constant at |208C min . The• by filtration of mesophase pitch at high temperature volatile material, distilled from the feedstock sample (the
[18]. reactor tube is not sealed), was separated into gases(principally hydrogen and hydrocarbons with 1–5 carbon
The structure and the size of mesophase spheres can becontrolled by selecting experimental conditions. Use ofheat treatment at high pressures results in an increase inthe pyrolysis yield because it avoids distillation of volatilematerials out of the closed system. The use of highpressures (1.0 MPa) is thought to decrease the viscositywithin the pyrolysis system causing an increase in extentof mesophase coalescence. A novel heat treatment processis described below which combines initially high and thenlow pressure treatments in the same pyrolyzing system, inorder to reduce extent of coalescence to bulk mesophase sofacilitating control over the size of the individual spheresof mesophase within the system. Many combinations ofpressure, temperature and soak time were explored. Theresults below are representative of a more comprehensiveset of data.
2. Experimental
A single petroleum residue, R1, was used as the startingmaterial for the study. Table 1 contains some analytical Fig. 1. Flow diagram of the laboratory pilot plant used for thedata for R1. It is a feedstock of relatively high aromaticity pyrolysis experiments.
´ ´R. Santamarıa-Ramırez et al. / Carbon 37 (1999) 445 –455 447
atoms), and liquids (naphthas and linear paraffins principal- selected to show the size and amount of the mesophasely). Pyrex glass tubes of 12-mm diameter, 220-mm height, spheres contained within the isotropic phase.containing 10 g of feedstock were placed in the reactor.
The tubes were placed within the reactor which waswithin the sand bath (to ensure a maximum uniformity of 3. Results and discussiontemperature). All pyrolyses were carried out under anatmosphere of nitrogen (99.999 vol.%), the nitrogen also This paper describes the results of seven experimentsbeing used to establish pressures .0.1 MPa in the system. which are representative of a broader matrix of data.When operating at the one pressure of 1.0 MPa, the system Samples 1 to 3 are prepared at the higher pressure of 1.0was depressurised at the reaction temperature (after MPa, whilst samples 4 to 7 are prepared with depressuriza-pyrolyses of 1, 1.5, 2 h) at the end of each experiment and tions. The effects of depressurization can therefore bethen cooled down to room temperature. In other experi- assessed directly. Results are summarised in Table 1. Sizements a combination of high and low pressure treatments distribution curves are plotted in Fig. 2. Maps of coalesced(depressurisation) was carried out. These treatments consist and representative optical micrographs are in Figs. 3–9.of an initial pyrolysis at higher pressure (1.0 MPa) and,after a given time (1 or 1.5 h), continuing at the same 3.1. Pyrolysis at 1.0 MPatemperature at the lower pressure (0.1 MPa) for differentsoak times (0.25, 0.5 or 1 h). Below, each of the samples is described grouping them
The nomenclature used to describe resultant samples of according to the experimental variable that was modified.semicoke is as follows; for samples with heat treatment at The first sample to discuss is the 440-1 /1. During the first1.0 MPa: T2P/t, where T is the pyrolysis temperature hour of pyrolysis the chemical reactions that form discotic(8C), P51.0 MPa, and t is the soak time (h). For samples molecules have occurred, and they begin to nucleate aswith a second heat treatment after depressurisation: T2P / mesophase spheres.1
t 2P /t , where P 51.0 MPa, P 50.1 MPa, t is the soak1 2 2 1 2 1
time at P (h) and t is the soak time at P (h). 3.1.1. Sample 1 (440-1 /1)1 2 2
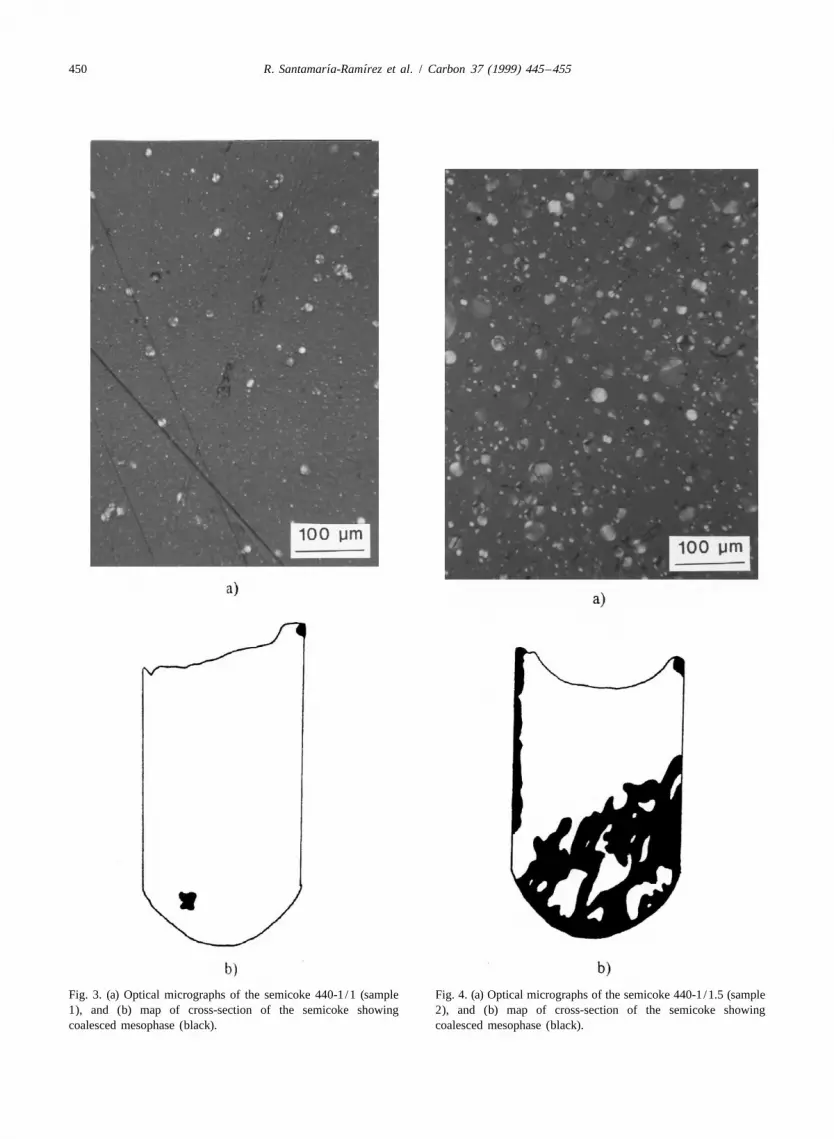
Samples of the semicoke in the glass containers were This sample (Fig. 3, Table 2) is the least pyrolyzed ofremoved from the furnace and sectioned vertically. These the samples of the series. The mesophase can just becross-sections were polished and the surfaces analyzed by detected at the level of resolution of the optical micro-optical microscopy using reflected polarised light with a scope. The amount of this anisotropic mesophase is aboutpoint-counting facility [5] and photographic facilities. 3% of the area studied.
The following measurements were made on each cross- Amounts of bulk coalesced mesophase are extremelysection. small. The number of spheres, between 10–20 mm diam-
eter, is small (Fig. 2). For this sample the sphere con-22centration is 129 spheres mm , being a low value.
1. A map of the complete surface of the sample, from topto bottom, was constructed from optical micrographs. 3.1.2. Sample 2 (440-1 /1.5)This map includes the limits of the sample and the Comparing this sample with the previous sample showsseparation of the isotropic (white) and the coalesced that significant changes have occurred. The total amount of(black) phases. All the maps use the same scale and mesophase in the semicoke is increased to 53% (Fig. 4,give an overall view of the distribution of non- Table 2), being only 3.1% some 30 min earlier. Thiscoalesced and coalesced phases in the sample. The suggests that there appears to be an induction period forpercentage of mesophase spheres, coalesced mesophase mesophase sphere appearance. Once created, the growth ofand non-coalesced phase were determined. Non- the mesophase seems to be disproportionately fast. Thecoalesced phase includes the isotropic phase and the sphere concentration in sample 2 has grown by a factor of
22immersed mesophase spheres. 10, being 1192 spheres mm . Fig. 3 and Fig. 4 clearly2. Each map was analyzed in terms of the number of show these major differences between the two samples.
spheres and their sizes. Size distributions were obtained However, there is another aspect which is of major(10 to .100 mm) of the spheres within each sample. importance, which is that both samples possess veryFurther, size distribution diagrams include a column of similar size distributions. In both samples there is a‘coalesced spheres’ showing the amount of groups of dominance of small spheres, of size 10–20 mm, indicatingtwo or three coalesced spheres. These groups of that in the 30 min the spheres do not grow significantly incoalesced spheres are not counted as coalesced mesoph- size, and that there is a rapid growth in new spheres, Fig.ase, but as individual spheres. Sphere concentration as a 2.
2measure of the number of spheres per mm has been Another factor to take into account is that more than halfdetermined. of all the mesophase formed is coalesced, being 28.7% of
3. A representative micrograph of each sample has been the total analyzed area. Analysis of these two samples
´ ´448 R. Santamarıa-Ramırez et al. / Carbon 37 (1999) 445 –455
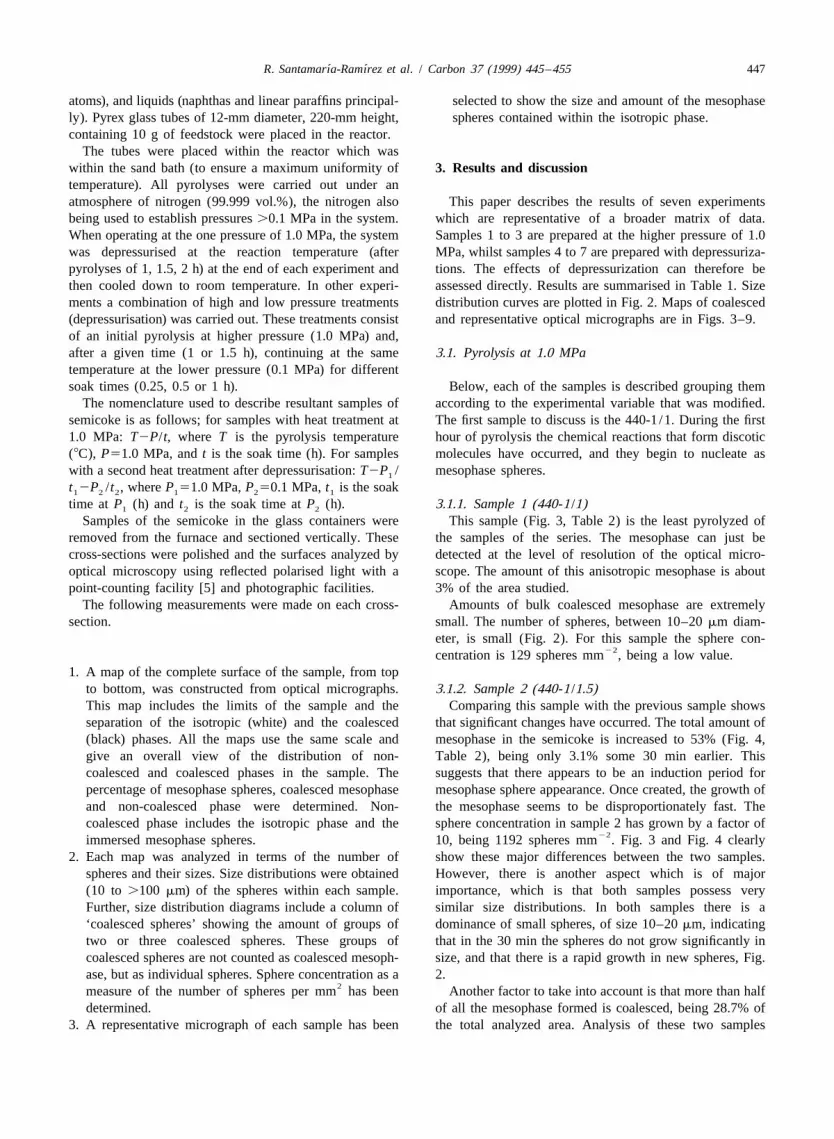
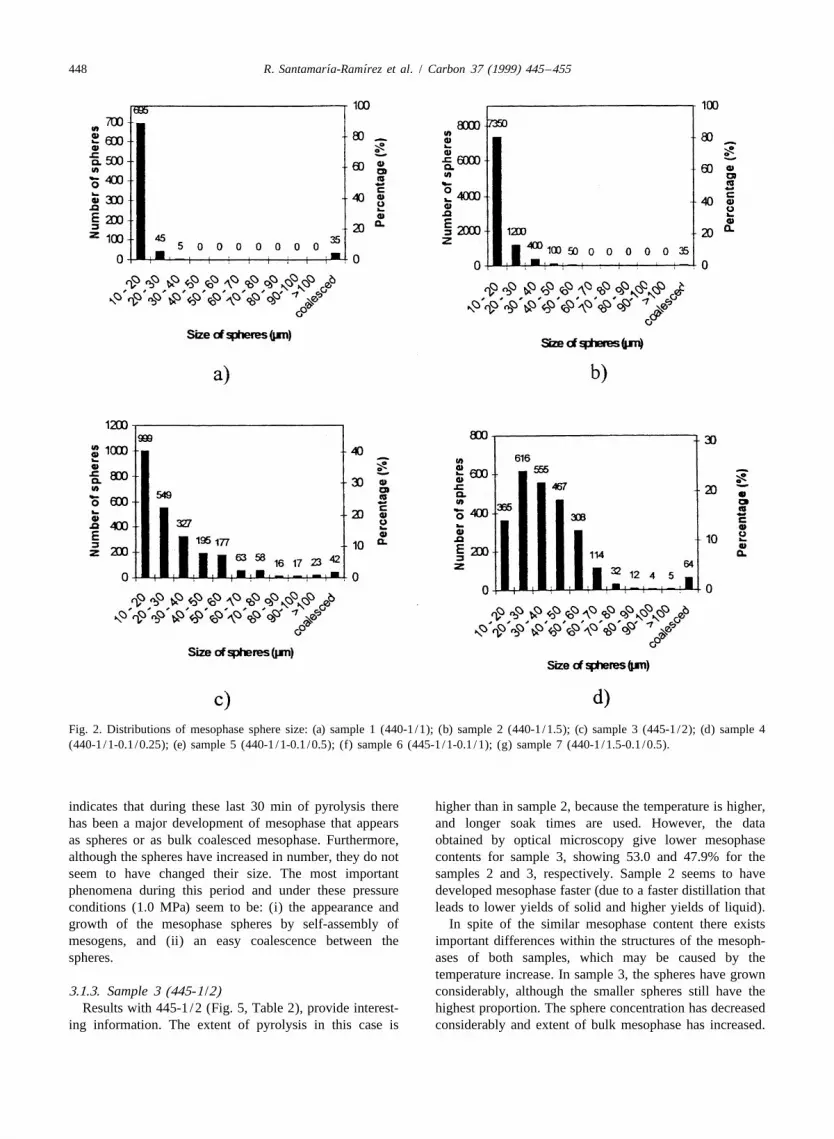
Fig. 2. Distributions of mesophase sphere size: (a) sample 1 (440-1 /1); (b) sample 2 (440-1 /1.5); (c) sample 3 (445-1 /2); (d) sample 4(440-1 /1-0.1 /0.25); (e) sample 5 (440-1 /1-0.1 /0.5); (f) sample 6 (445-1 /1-0.1 /1); (g) sample 7 (440-1 /1.5-0.1 /0.5).
indicates that during these last 30 min of pyrolysis there higher than in sample 2, because the temperature is higher,has been a major development of mesophase that appears and longer soak times are used. However, the dataas spheres or as bulk coalesced mesophase. Furthermore, obtained by optical microscopy give lower mesophasealthough the spheres have increased in number, they do not contents for sample 3, showing 53.0 and 47.9% for theseem to have changed their size. The most important samples 2 and 3, respectively. Sample 2 seems to havephenomena during this period and under these pressure developed mesophase faster (due to a faster distillation thatconditions (1.0 MPa) seem to be: (i) the appearance and leads to lower yields of solid and higher yields of liquid).growth of the mesophase spheres by self-assembly of In spite of the similar mesophase content there existsmesogens, and (ii) an easy coalescence between the important differences within the structures of the mesoph-spheres. ases of both samples, which may be caused by the
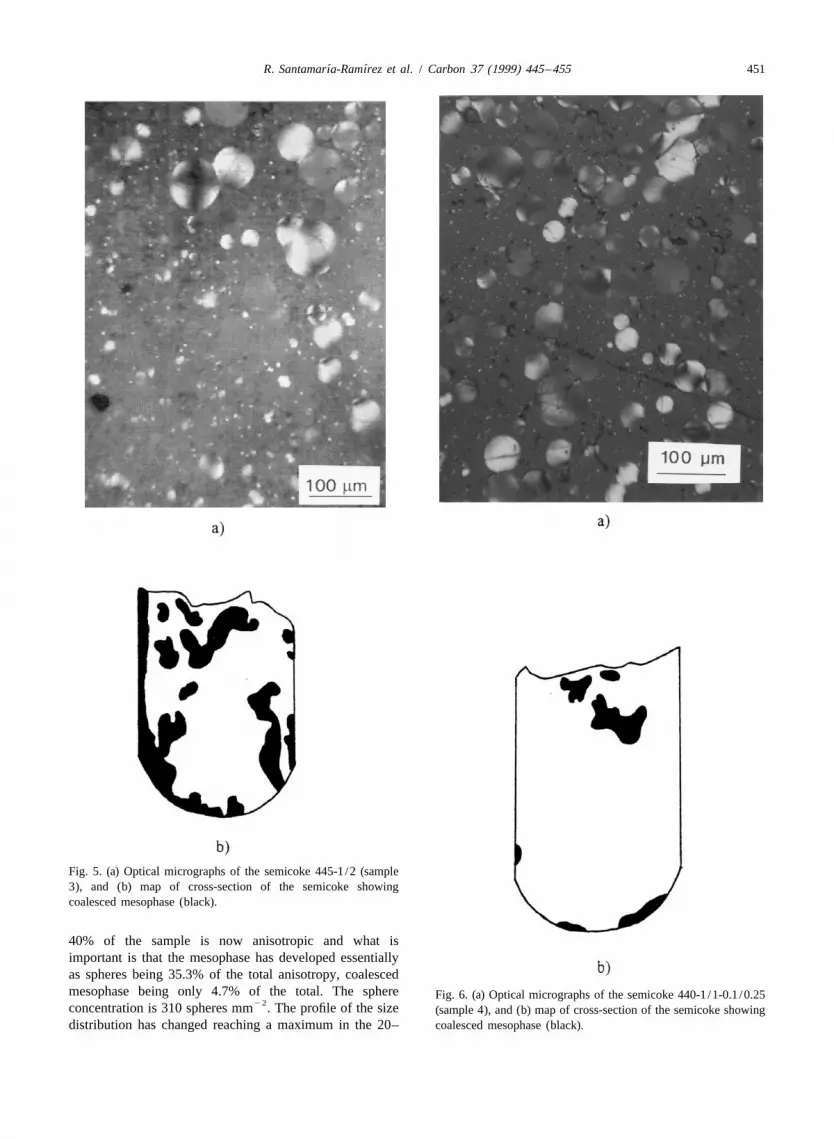
temperature increase. In sample 3, the spheres have grown3.1.3. Sample 3 (445-1 /2) considerably, although the smaller spheres still have the
Results with 445-1 /2 (Fig. 5, Table 2), provide interest- highest proportion. The sphere concentration has decreaseding information. The extent of pyrolysis in this case is considerably and extent of bulk mesophase has increased.
´ ´R. Santamarıa-Ramırez et al. / Carbon 37 (1999) 445 –455 449
Fig. 2. (continued)
3.2. Pyrolyses with depressurisation of reactive compounds and of hydrogen donors, the lattermoderating chemical reactivity [9].
In the following samples the pressure is released after a According to these arguments, it is interesting to com-known time and the pyrolysis continued at atmospheric pare how pyrolyses continue at low pressure after thepressure (0.1 MPa), at the same temperature for a further initial treatments at higher pressure. For discussion pur-period of time, 0.25, 0.5 or 1 h. This depressurisation poses the pyrolysis system of R1, 440-1 /1 is taken as thetechnique, for 440-1 /1 causes major changes to the reference system (where spheres are just beginning tosystem. These changes are no doubt due to the rapid form) for comparison with semicokes prepared with de-decrease in pressure that permits volatilisation of the pressurization.lightest molecules, so leading to a possible increase of theviscosity and the bulk density of the reaction system. 3.2.1. Sample 4 (440-1 /1-0.1 /0.25)Although these changes to the system are essentially This sample (Fig. 6, Table 2) with continuing pyrolysisphysical in nature, the loss of volatile material can also at the low pressure of 0.1 MPa possesses more mesophaseaffect the chemical reactivity of the system, because of loss than sample 1, which has occurred in only 0.25 h. Some
´ ´450 R. Santamarıa-Ramırez et al. / Carbon 37 (1999) 445 –455
Fig. 3. (a) Optical micrographs of the semicoke 440-1 /1 (sample Fig. 4. (a) Optical micrographs of the semicoke 440-1 /1.5 (sample1), and (b) map of cross-section of the semicoke showing 2), and (b) map of cross-section of the semicoke showingcoalesced mesophase (black). coalesced mesophase (black).
´ ´R. Santamarıa-Ramırez et al. / Carbon 37 (1999) 445 –455 451
Fig. 5. (a) Optical micrographs of the semicoke 445-1 /2 (sample3), and (b) map of cross-section of the semicoke showingcoalesced mesophase (black).
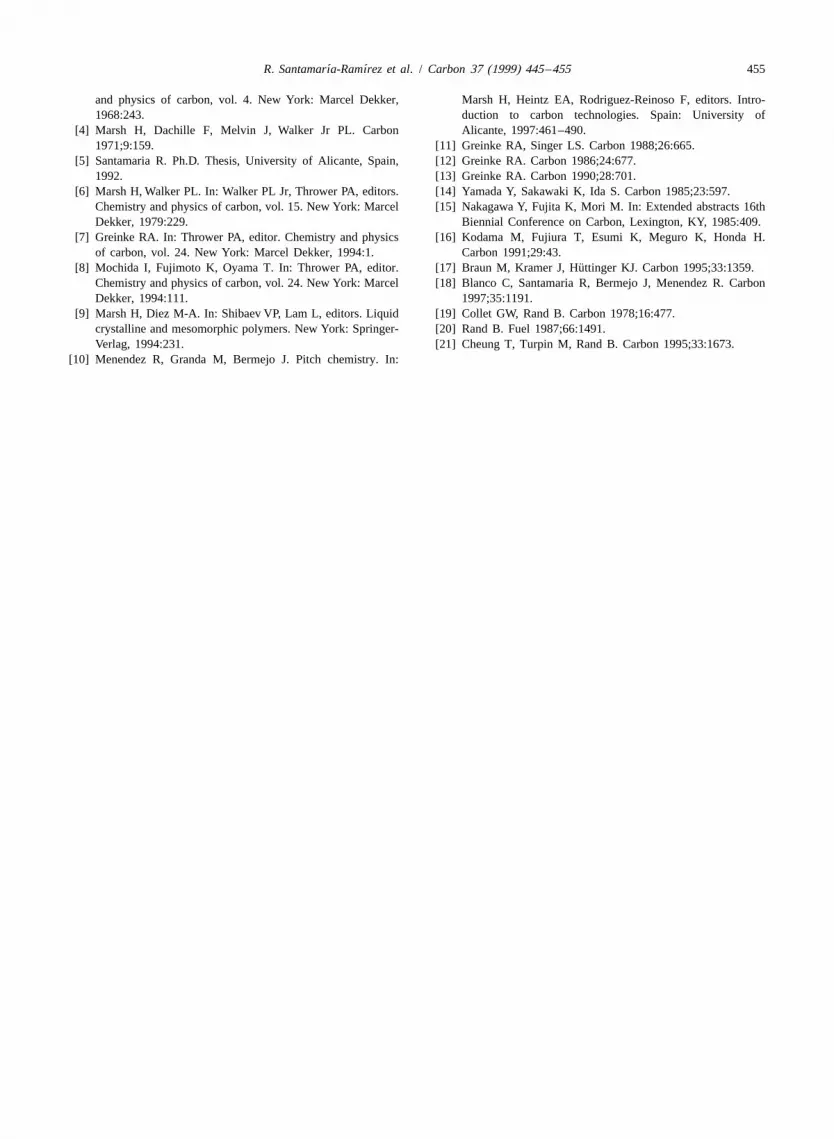
40% of the sample is now anisotropic and what isimportant is that the mesophase has developed essentiallyas spheres being 35.3% of the total anisotropy, coalescedmesophase being only 4.7% of the total. The sphere Fig. 6. (a) Optical micrographs of the semicoke 440-1 /1-0.1 /0.25
22concentration is 310 spheres mm . The profile of the size (sample 4), and (b) map of cross-section of the semicoke showingdistribution has changed reaching a maximum in the 20– coalesced mesophase (black).

´ ´452 R. Santamarıa-Ramırez et al. / Carbon 37 (1999) 445 –455
Fig. 7. (a) Optical micrographs of the semicoke 440-1 /1-0.1 /0.5 Fig. 8. (a) Optical micrographs of the semicoke 445-1 /1-0.1 /1(sample 5), and (b) map of cross-section of the semicoke showing (sample 6), and (b) map of cross-section of the semicoke showingcoalesced mesophase (black). coalesced mesophase (black).

´ ´R. Santamarıa-Ramırez et al. / Carbon 37 (1999) 445 –455 453
30 mm size with higher values in the ranges 30–40 and40–50 mm (Fig. 2). These facts indicate that the effect ofdepressurization is to cause spheres to grow to larger sizesmaintaining their spherical form instead of coalescing toform bulk mesophase.
3.2.2. Sample 5 (440-1 /1-0.1 /0.5)Sample 5 (Fig. 7, Table 2) follows on after sample 4,
the difference being a soak time of 0.5 h instead of theprevious 0.25 h. The duration of the pyrolysis experimentto produce sample 5 is 1.5 h, as is the duration of sample2, which, of course, has no heat treatment after depres-surization. In sample 2 (440-1 /1.5) the total amount ofmesophase is 53.0%, while in sample 5 (440-1 /1-0.1 /0.5)it is 51.4%, being only slighter smaller. However, thedepressurisation has introduced changes to the pyrolysiswhich have modified the development of the mesophase.In the case of high pressure pyrolysis (only one treatment)the coalescence of mesophase spheres to bulk mesophaseis favoured, sample 2 having 28.7% of coalesced mesoph-ase, while sample 5 possesses only 10.4%. The anisotropy,as spheres, after the depressurisation amounts to 41.0% insample 5, with a sphere concentration of 195 spheres
22mm , the spheres being of larger size than those ofsample 2. The use of a single high pressure pyrolysisfavours small mesophase sphere sizes, but yields may besmaller. Samples 4 and 5 show the development of spheregrowth, noting that the maximum in the size distribution ofspheres is between 50–60 mm (Fig. 2). It would appearthat additional mesophase development takes place in thefirst minutes after depressurisation, the rate decreasingwith time. This decrease of rate may be caused by a criticalincrease in the viscosity of the system.
3.2.3. Sample 6 (445-1 /1-0.1 /1)This sample (Fig. 8, Table 2) can be compared with
sample 3, both samples having a pyrolysis soak time of 2h. The effect of depressurization again is to increase thearea of mesophase spheres, from 24.6 to 41.2%. Also, thesphere concentration decreases from 331 to 182 spheres
22mm . Mesophase forms larger spheres, the maximum inthe size distribution being 50–60 mm size (Fig. 2). Thisindicates that small spheres have coalesced with theneighbouring spheres, giving larger spheres and reducingthe sphere concentration.
3.2.4. Sample 7 (440-1 /1.5-0.1 /0.5)This sample 7 (Fig. 9, Table 2) is to be compared with
sample 5, having a longer soak time of 1.5 h at 4408C, 1.0MPa. The effect of this extended soak time is to increasethe amounts of coalesced mesophase from 10.4 to 20.8%.At the same time there occurs a decrease in mesophasespheres from 41.0 to 31.1%. The sphere concentration hasFig. 9. (a) Optical micrographs of the semicoke 440-1 /1.5-0.1 /0.5
22decreased from 195 to 167 spheres mm . Comparing(sample 7), and (b) map of cross-section of the semicoke showingcoalesced mesophase (black). sample 7 with sample 2 (without heat treatment after

´ ´454 R. Santamarıa-Ramırez et al. / Carbon 37 (1999) 445 –455
Table 2Data of semicoke yield and percentage of mesophase
Sample Description Noncoalesced phase Coalesced Mesophase Mesophase Concentration(isotropic phase mesophase spheres (total) of spheres
221mesophase spheres) (area%) (area%) (area%) (area%) (spheres mm )
Sample 1 (440-1 /1) 99.3 0.7 2.4 3.1 129Sample 2 (440-1 /1.5) 71.3 28.7 24.3 53.0 1192Sample 3 (445-1 /2) 76.7 23.3 24.6 47.9 331Sample 4 (440-1 /1-0.1 /0.25) 95.3 4.7 35.3 40.0 310Sample 5 (440-1 /1-0.1 /0.5) 89.6 10.4 41.0 51.4 195Sample 6 (445-1 /1-0.1 /1) 93.6 6.4 41.2 47.6 182Sample 7 (440-1 /1.5-0.1 /0.5) 79.2 20.8 31.1 51.9 167
depressurisation), there exist differences in the shape of the 4. Conclusionssize distributions of the spheres, Fig. 2. The effect ofdepressurization is to produce an entirely different pathway A comparative study of seven samples of semicokesfor mesophase development. For example in sample 7, the from a petroleum residue provides further insight into thespheres are of larger size than those of sample 2. More processes of growth and coalescence of mesophase spheresmesophase exists as spheres. Alternatively, further heat during the pyrolysis of a petroleum residue feedstock.treatment under the conditions of sample 2 would haveresulted in more coalesced mesophase being formed, not asspheres of larger size, as seen in sample 7. 1. High-pressure (1.0 MPa) pyrolyses favour the coalesc-
This group of seven samples shows that control over ence of mesophase spheres to form bulk mesophase.such experimental parameters as pyrolysis pressure, tem- Furthermore, the spheres do not grow beyond a certainperature and soak time permits a predeterminable control size indicating that the rate of coalescence exceeds theover the structure of mesophase in terms of mesophase rate of growth of the spheres.content, percentage of mesophase as spheres, and the 2. Depressurization, during the course of a pyrolysis,
22sphere concentration (spheres mm ) which relates to the causes a rapid loss of volatile matter with a proposedsize distributions of the spheres. It is suggested, as the resultant increase in viscosity of the remaining isotropicmost reasonable explanation for these phenomena, that the phase. Some volatile material may also be removeddetermining factor here is the viscosity of the reaction from the mesophase spheres themselves, again promot-system, which could be increased by depressurising the ing a viscosity increase. These factors promote asystem. decrease in the mobility of mesophase spheres. As a
Viscosity measurements are most difficult to determine, result of this, the spheres increase their diameter andeven in specially designed systems [19–21], and hence there is less production of bulk mesophase. Coalescencelittle likelihood exists for such determinations in the is not stopped entirely but is reduced in extent. It isdepressurization experiments of this study. It is suggested, suggested that the viscosity of the pyrolysis system istherefore, that the most probable causes of these effects are the critical parameter controlling the process.that the controlled reduction of pyrolysis pressure bringsabout a second distillation whereby the lightest moleculesleave the isotropic phase of the system. This leaves behind Acknowledgementsmaterial of higher molecular weight (boiling point) withinthe isotropic phase and, at the same time, of higher Support for this project by Repsol Petroleo S.A., Spain,viscosity. When operating at the higher pressures mesoph- is appreciated. H.M. thanks the Spanish DGICYT (SAB95-ase coalesces relatively easily into bulk mesophase (lower 0086).viscosity in the isotropic phase). On the other hand, withcontinuing heat treatment after depressurisation, viscosityhas been increased by depressurisation and movement of Referencesthe spheres is more restricted (relatively). Coalescence isnow much more restricted and this results in a growth of [1] Taylor GH. Fuel 1961;40:465.mesophase spheres of increased size distribution, but of [2] Brooks JD, Taylor GH. Carbon 1965;3:185.fewer number, instead of bulk mesophase. [3] Brooks JD, Taylor GH. In: Walker PL Jr, editor. Chemistry
´ ´R. Santamarıa-Ramırez et al. / Carbon 37 (1999) 445 –455 455
and physics of carbon, vol. 4. New York: Marcel Dekker, Marsh H, Heintz EA, Rodriguez-Reinoso F, editors. Intro-1968:243. duction to carbon technologies. Spain: University of
[4] Marsh H, Dachille F, Melvin J, Walker Jr PL. Carbon Alicante, 1997:461–490.1971;9:159. [11] Greinke RA, Singer LS. Carbon 1988;26:665.
[5] Santamaria R. Ph.D. Thesis, University of Alicante, Spain, [12] Greinke RA. Carbon 1986;24:677.1992. [13] Greinke RA. Carbon 1990;28:701.
[6] Marsh H, Walker PL. In: Walker PL Jr, Thrower PA, editors. [14] Yamada Y, Sakawaki K, Ida S. Carbon 1985;23:597.Chemistry and physics of carbon, vol. 15. New York: Marcel [15] Nakagawa Y, Fujita K, Mori M. In: Extended abstracts 16thDekker, 1979:229. Biennial Conference on Carbon, Lexington, KY, 1985:409.
[7] Greinke RA. In: Thrower PA, editor. Chemistry and physics [16] Kodama M, Fujiura T, Esumi K, Meguro K, Honda H.of carbon, vol. 24. New York: Marcel Dekker, 1994:1. Carbon 1991;29:43.
¨[8] Mochida I, Fujimoto K, Oyama T. In: Thrower PA, editor. [17] Braun M, Kramer J, Huttinger KJ. Carbon 1995;33:1359.Chemistry and physics of carbon, vol. 24. New York: Marcel [18] Blanco C, Santamaria R, Bermejo J, Menendez R. CarbonDekker, 1994:111. 1997;35:1191.
[9] Marsh H, Diez M-A. In: Shibaev VP, Lam L, editors. Liquid [19] Collet GW, Rand B. Carbon 1978;16:477.crystalline and mesomorphic polymers. New York: Springer- [20] Rand B. Fuel 1987;66:1491.Verlag, 1994:231. [21] Cheung T, Turpin M, Rand B. Carbon 1995;33:1673.
[10] Menendez R, Granda M, Bermejo J. Pitch chemistry. In: