influence of extractant on quality and trace elements content of peat humic acids
TRANSCRIPT
A
(e0ci
caoe©
K
1
emrfoous
tpr
0d
Available online at www.sciencedirect.com
Talanta 73 (2007) 820–830
Influence of extractant on quality and trace elementscontent of peat humic acids
C. Zaccone a,∗, C. Cocozza a, V. D’Orazio a, C. Plaza b, A. Cheburkin c, T.M. Miano a
a Dipartimento di Biologia e Chimica Agro-Forestale ed Ambientale, Universita degli Studi di Bari, Via Amendola 165/A, 70126 Bari, Italyb Centro de Ciencias Medioambientales, Consejo Superior de Investigaciones Cientificas, Serrano 115 dpdo., 28006 Madrid, Spain
c Institute of Environmental Geochemistry, University of Heidelberg, Im Neuenheimer Feld 236, 69120 Heidelberg, Germany
Received 21 February 2007; received in revised form 26 April 2007; accepted 30 April 2007Available online 10 May 2007
bstract
Among several extractants used to isolate humic acids (HA) from terrestrial environments, sodium hydroxide (NaOH) and sodium pyrophosphateNa4P2O7) are the most utilized. In order to evaluate the influence of these different extractant solutions on the HA quality and on their tracelements content, HA were isolated from five Sphagnum-peat samples using three different solutions: (a) 0.5 M NaOH; (b) 0.1 M Na4P2O7; (c).5 M NaOH + 0.1 M Na4P2O7. The obtained HA have been analyzed with respect to ash content, elemental composition, main atomic ratios andharacterized by FT-IR and total luminescence (TL) spectroscopies. In addition, both raw peat and HA have been analyzed using X-ray fluorescencen order to determine the Br, Cu, Fe, Ni, Pb and Zn contents.
Results showed that HA extracted with NaOH and NaOH + Na4P2O7 are quite similar with respect to ash, elemental contents and spectroscopic
haracteristics, while Na4P2O7 solution, which in general reduces the extraction yield, seems to affect the nature of HA, featuring a more complexnd aromatic character. With respect to the contents in the corresponding raw peat samples, the HA fractions were richer in Br, Cu and Ni, regardlessf the extractant used, and poorer in Fe, Pb and Zn. Further, Br, Cu, Ni and Zn were more concentrated in HA extracted with Na4P2O7 than in thosextracted with NaOH and NaOH + Na4P2O7, probably because of the greater affinity of these elements for these more aromatic humic molecules.2007 Elsevier B.V. All rights reserved.
copy
orci
tmtibsm
eywords: Humic acids; Sphagnum-peat; Extractant; Trace elements; Spectros
. Introduction
Humic substances (HS) are refractory, dark coloured, het-rogeneous organic compounds produced as by-products oficrobial metabolism. These materials, widespread in all ter-
estrial and aquatic environment, can be isolated according to aractionation scheme based on their water solubility under acidicr alkaline conditions. Briefly, humin is the insoluble fractionf humic substances; humic acids (HA) are the fraction solublender alkaline conditions; and fulvic acids (FA) are the fractionoluble in all pH range [1].
Different models have been proposed for HA structure in
he literature. Commonly, HA are believed to consist of largeolymers presenting newly formed molecular structures scarcelyesembling those of the original precursor [1]. A more recent the-∗ Corresponding author. Fax: +39 080 5442850.E-mail address: [email protected] (C. Zaccone).
on
(au
039-9140/$ – see front matter © 2007 Elsevier B.V. All rights reserved.oi:10.1016/j.talanta.2007.04.052
ry views HS as supra-molecular associations in which severalelatively small and chemically diverse organic molecules formlusters linked by hydrogen bonds (H-bonds) and hydrophobicnteractions [2,3].
More renowned isolation methods should take into accounthat soil organic matter (OM) occurs as: (a) insoluble macro-
olecular complex; (b) macromolecular complexes boundogether by di- and trivalent cations (i.e. Ca2+, Fe3+ and Al3+); (c)n combination with clay minerals, through polyvalent cationsridges (clay-metal-humus) and H-bonding; (d) organic sub-tances held within the inter-layers of expanding-type clayinerals [1].Numerous extractants (e.g. NaOH, Na2CO3, Na4P2O7, NaF,
rganic acid salts) have been employed, depending upon theature of the material to be examined [4].
Sodium hydroxide (NaOH) and sodium pyrophosphateNa4P2O7) have been widely used in HA extraction. Severaluthors [1,5,6] showed that, in general, the HA extraction yieldsing NaOH (from 0.1 to 0.5 M) is greater than the Na4P2O7
lanta
ortpss
3i[
tflaooaee
2
i(d1ls0Npw
tttswQfba(dHpl
ws
wpMO
Bdca
awlmS4a
eo1aus(Eamoifm(
pFalm
3
gl((1of(
Ec0
3
C. Zaccone et al. / Ta
ne, even though the use of Na4P2O7 (at 0.1–0.15 M) produceseduced chemical alterations. Neutral salts, in fact, are thoughto extract OM by forming insoluble precipitates or soluble com-lexes with Ca, Fe and Al and other polyvalent cations to whichoil OM is linked. As a result, soil OM is converted to water-oluble Na-salts [7].
In general, a solution of 0.1 M Na4P2O7 extracts less than0% of the OM removed by a solution of 0.1 M NaOH [1], evenf the latter seems to extract more high-molecular weight OM8,9].
Previous investigations on the influence of various extrac-ants on the yields and structural properties of HA have beenocused mainly on soil HA [1,5,6,8,9]. In contrast, relativelyittle attention has been devoted to HA isolated from peat. Inddition, no data are available in the literature on the effectsf the extractants on trace elements contents in HA. Thus, thebjective of this work was to investigate the structural featuresnd trace element contents of HA extracted from different lay-rs of an ombrotrophic bog profile as affected by three differentxtractants including NaOH, Na4P2O7 and NaOH + Na4P2O7.
. Materials and methods
Etang de la Gruere is a small ombrotrophic peat bog locatedn the Jura Mountains, NW Switzerland. A peat core, 2T13 cm × 13 cm × 105 cm), was collected in 2005 using a War-enaar peat profile sampler [10]. The core was sliced into± 0.15 cm sections using a stainless steel band saw with stain-
ess steel blades. Humic acids were extracted from five peatamples from this core using three different solutions, i.e. (i).5 M NaOH; (ii) 0.1 M Na4P2O7; (iii) 0.5 M NaOH + 0.1 Ma4P2O7. The sampling site and procedure as well as the mainroperties of the peat profile are described more in detail else-here [11].After stirring for 12 h under N2 atmosphere at room tempera-
ure, centrifugation, and filtration through Whatman GF/C filter,he alkaline extract was acidified with HCl to pH 1 and allowedo precipitate for 24 h. The sediment was separated from theupernatant by centrifugation, washed with a solution of Milli-Qater + HCl (pH = 3), manually shaken, and centrifuged. Milli-water was added to the sediment and stirring was carried out
or 3 h. Finally, the HA were transferred to a dialysis mem-rane (Spectra/Por membrane, MWCO 6-8000) and dialyzedgainst Milli-Q water, successively replaced at frequent intervals6–7 h) in order to remove Cl− until the EC of discharged waterecreased below 10−2 dS m−1. Following these treatments, theA were freeze-dried. All solutions were prepared with highurity water (18.2 M� cm) from a Milli-Q Element system (Mil-ipore, Molsheim, France) and high purity grade reagents.
The ash content, expressed as a percentage of the initial dryeight, was determined by combustion at 550 ◦C for 12 h; all
amples were analyzed in triplicate.Carbon, hydrogen, nitrogen, and sulphur concentrations
ere determined using a combustion-gas chromatogra-hy technique (Fisons EA 1108 Elemental Analyzer,ilan, Italy). Oxygen content was calculated by difference:% = 100−(C + H + N + S)%. The instrument was calibrated by
oiH
73 (2007) 820–830 821
BOT [2,5-bis-(5-tert-butyl-benzoxazol-2-yl)-thiophen] stan-ard (ThermoQuest Italia s.p.a.). The obtained data wereorrected for moisture and ash contents. All HA samples werenalyzed in triplicate.
The FT-IR spectra were acquired in transmittance mode usingThermo Nicolet Nexus FT-IR Spectrophotometer equippedith a Nicolet Omnic 6.0 software. Potassium bromide pel-
ets were obtained by pressing, under vacuum, a homogenizedixture of 400 mg of infrared-grade KBr and 1 mg of sample.pectra were recorded under a N2 atmosphere in the range of000–400 cm−1, with 2 cm−1 resolution and 64 scans per eachcquisition.
Total luminescence spectra (TL) in the form ofxcitation–emission matrix (EEM, contour maps) werebtained on aqueous solutions of HA at a concentration of00 mg L−1 equilibrated overnight at room temperature, anddjusted to pH 8 with 0.05 M NaOH. All spectra were recordedsing a Perkin-Elmer (Norwalk, CT) LS 55 luminescencepectrophotometer equipped with the WinLab 4.00.02 softwarePerkin-Elmer Inc., 2001, Norwalk, CT) for data processing.mission and excitation slits were set at a 5 nm band width,nd a scan speed of 500 nm min−1 was selected for bothonochromators. The fluorescence EEM spectra were recorded
ver the emission wavelength range from 350 to 550 nm,ncreasing sequentially by 5 mm step the excitation wavelengthrom 300 to 500 nm. The EEM plots were generated as contouraps from fluorescence data by using the Surfer 8.01 software
Golden Software Inc., 2002, Golden, CO).The EMMA-XRF analyses were carried out on powered sam-
les with no further preparation. Selected trace elements (Br, Cu,e, Ni, Pb, and Zn) were measured directly on dried, milled peatnd related humic acids with a 600 s analysis time. Calibration,ower limits of detection (LLD), accuracy and precision of this
ethod are given elsewhere [12,13].
. Results and discussion
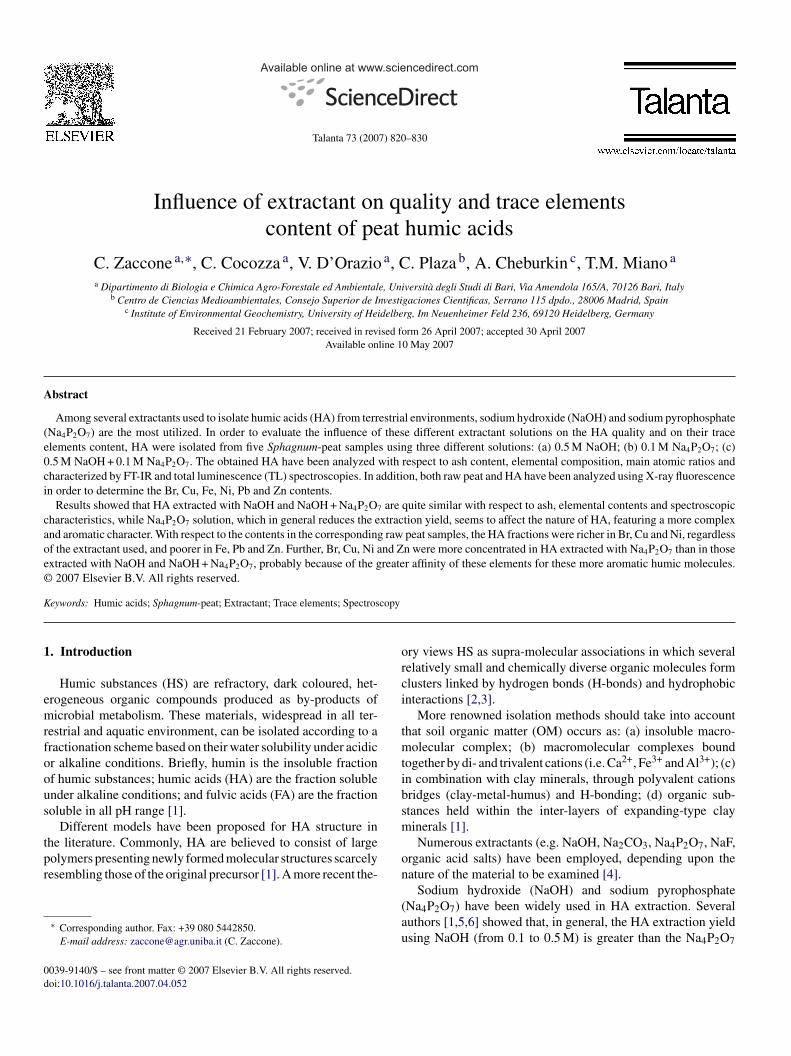
Obtained data show that the extraction yield (EY = gHA/dry peat × 100) is affected by the extractant used for HA iso-ation. In particular, it ranges between 7.6% (2T 13) and 22.8%2T 41) with 0.5 M NaOH, between 0.3% (2T 21) and 2.0%2T 41) with 0.1 M Na4P2O7, and between 8.0% (2T 21) and8.0% (2T 41) with the mixture of both solutions. Regardlessf the extractant utilized, the EYs generally increase with depthollowing homogeneous and highly correlated trends (R2 > 0.9)Fig. 1).
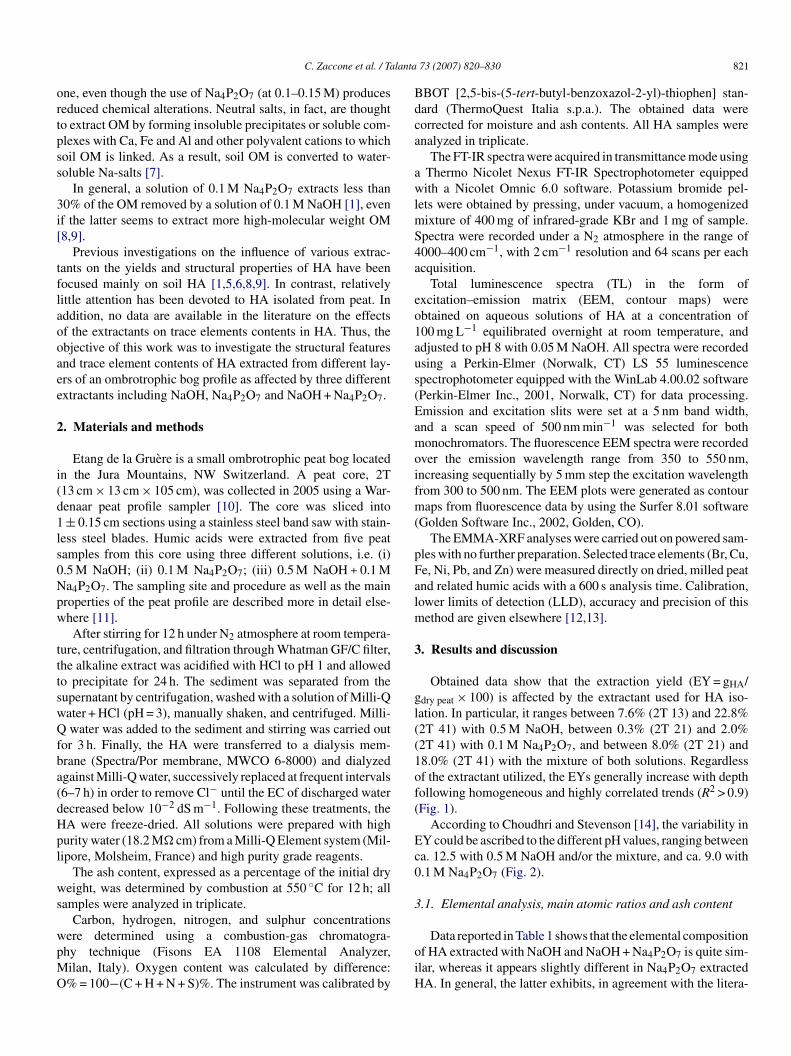
According to Choudhri and Stevenson [14], the variability inY could be ascribed to the different pH values, ranging betweena. 12.5 with 0.5 M NaOH and/or the mixture, and ca. 9.0 with.1 M Na4P2O7 (Fig. 2).
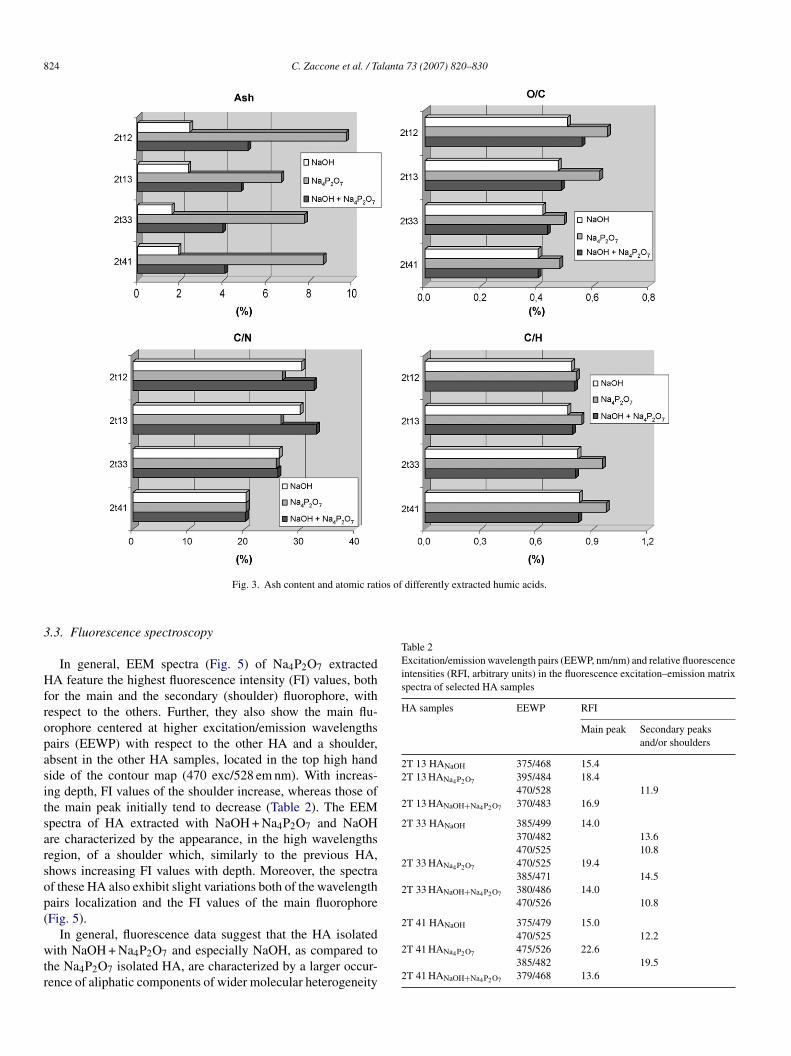
.1. Elemental analysis, main atomic ratios and ash content
Data reported in Table 1 shows that the elemental compositionf HA extracted with NaOH and NaOH + Na4P2O7 is quite sim-lar, whereas it appears slightly different in Na4P2O7 extractedA. In general, the latter exhibits, in agreement with the litera-
822 C. Zaccone et al. / Talanta 73 (2007) 820–830
F mongE
tre
tresm
ouo[t
ig. 1. Humic acids extraction yields (EYs) along the profile and correlations aY; C2: NaOH EY correlated to NaOH + Na4P2O7 EY.
ure [7], lower C and H contents and greater S and O ones withespect to the others. Similar N content is measured for all HAxtracted.
Humic acids extracted with Na4P2O7 show, with respecto those extracted with the other extractants, an higher C/H
atio suggesting the occurrence of humic macromolecules withxtended molecular complexity and aromatic character. Theseamples present simultaneously also highest O/C ratios, com-only inversely related to the C/H ratio and due to the degreesur
EYs obtained with different solutions. C1: NaOH EY correlated to Na4P2O7
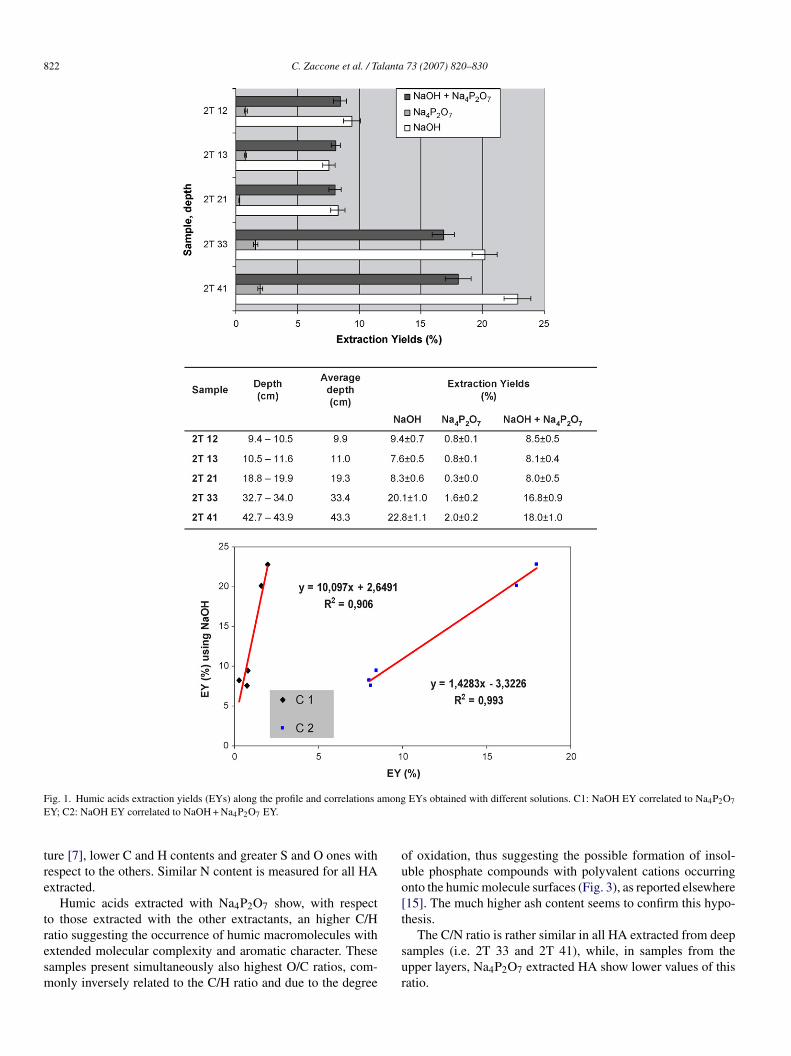
f oxidation, thus suggesting the possible formation of insol-ble phosphate compounds with polyvalent cations occurringnto the humic molecule surfaces (Fig. 3), as reported elsewhere15]. The much higher ash content seems to confirm this hypo-hesis.
The C/N ratio is rather similar in all HA extracted from deepamples (i.e. 2T 33 and 2T 41), while, in samples from thepper layers, Na4P2O7 extracted HA show lower values of thisatio.
C. Zaccone et al. / Talanta 73 (2007) 820–830 823
F colleco
ttp[
3
w
th3h2o1bgtd
aaaaC(i1(g1r
NtHpdc
TE
222
222
222
222
ig. 2. Comparison between the flocculated amounts and between the materialn the left was extracted with Na4P2O7, while the one on the right with NaOH.
Anyway, regardless of the extractant used, the C/N ratio andhe O/C one decrease with depth, whereas C/H shows an oppositerend. According to Stevenson [1], data suggest an increasingeat decomposition with depth, as well as reported elsewhere11].
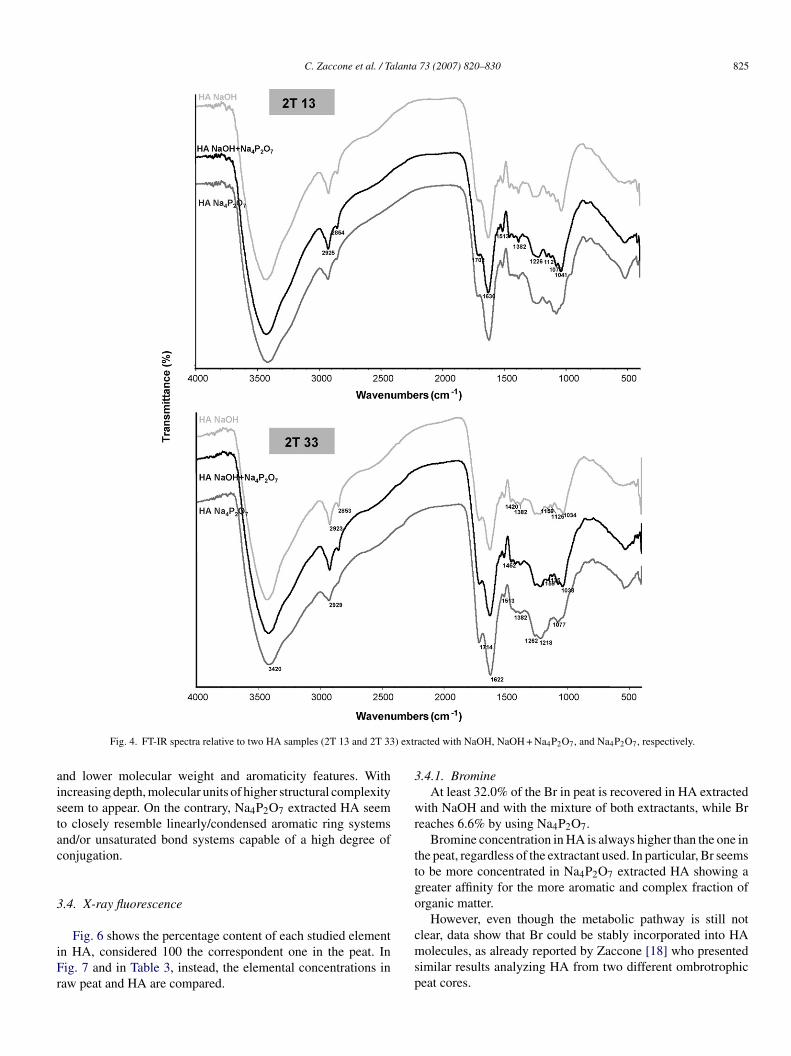
.2. FT-IR spectroscopy
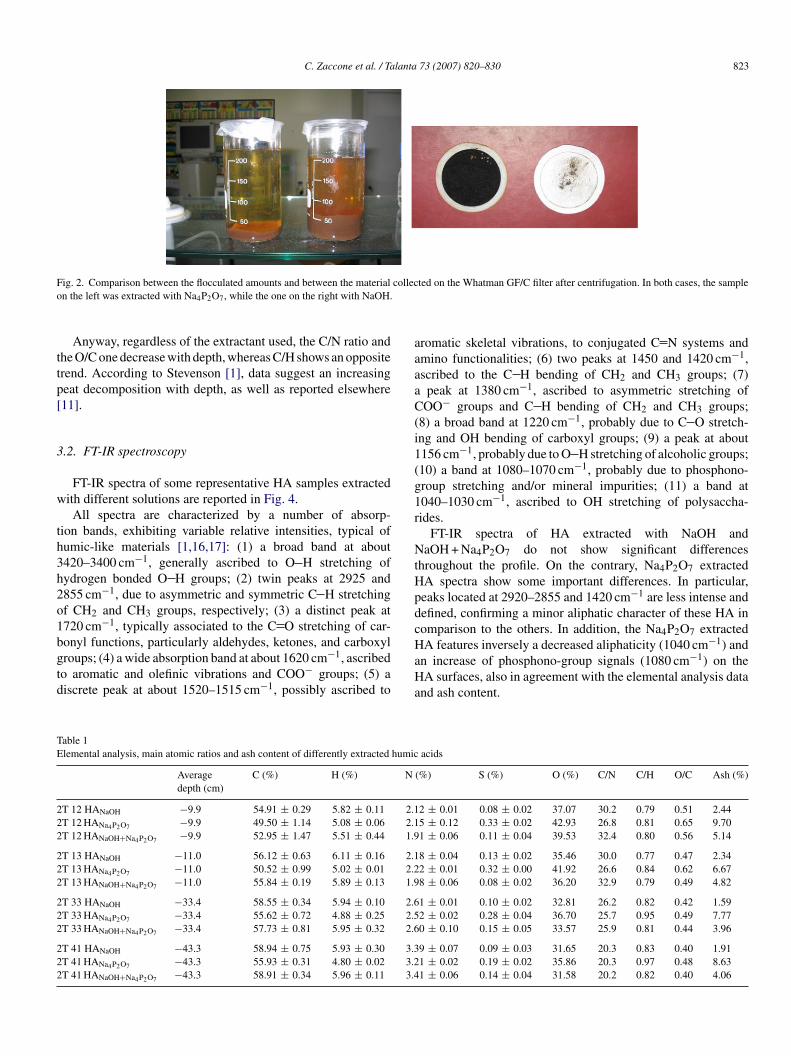
FT-IR spectra of some representative HA samples extractedith different solutions are reported in Fig. 4.All spectra are characterized by a number of absorp-
ion bands, exhibiting variable relative intensities, typical ofumic-like materials [1,16,17]: (1) a broad band at about420–3400 cm−1, generally ascribed to O H stretching ofydrogen bonded O H groups; (2) twin peaks at 2925 and855 cm−1, due to asymmetric and symmetric C H stretchingf CH2 and CH3 groups, respectively; (3) a distinct peak at720 cm−1, typically associated to the C O stretching of car-
onyl functions, particularly aldehydes, ketones, and carboxylroups; (4) a wide absorption band at about 1620 cm−1, ascribedo aromatic and olefinic vibrations and COO− groups; (5) aiscrete peak at about 1520–1515 cm−1, possibly ascribed toHaHa
able 1lemental analysis, main atomic ratios and ash content of differently extracted humic
Averagedepth (cm)
C (%) H (%) N
T 12 HANaOH −9.9 54.91 ± 0.29 5.82 ± 0.11 2.1T 12 HANa4P2O7 −9.9 49.50 ± 1.14 5.08 ± 0.06 2.1T 12 HANaOH+Na4P2O7 −9.9 52.95 ± 1.47 5.51 ± 0.44 1.9
T 13 HANaOH −11.0 56.12 ± 0.63 6.11 ± 0.16 2.1T 13 HANa4P2O7 −11.0 50.52 ± 0.99 5.02 ± 0.01 2.2T 13 HANaOH+Na4P2O7 −11.0 55.84 ± 0.19 5.89 ± 0.13 1.9
T 33 HANaOH −33.4 58.55 ± 0.34 5.94 ± 0.10 2.6T 33 HANa4P2O7 −33.4 55.62 ± 0.72 4.88 ± 0.25 2.5T 33 HANaOH+Na4P2O7 −33.4 57.73 ± 0.81 5.95 ± 0.32 2.6
T 41 HANaOH −43.3 58.94 ± 0.75 5.93 ± 0.30 3.3T 41 HANa4P2O7 −43.3 55.93 ± 0.31 4.80 ± 0.02 3.2T 41 HANaOH+Na4P2O7 −43.3 58.91 ± 0.34 5.96 ± 0.11 3.4
ted on the Whatman GF/C filter after centrifugation. In both cases, the sample
romatic skeletal vibrations, to conjugated C N systems andmino functionalities; (6) two peaks at 1450 and 1420 cm−1,scribed to the C H bending of CH2 and CH3 groups; (7)peak at 1380 cm−1, ascribed to asymmetric stretching of
OO− groups and C H bending of CH2 and CH3 groups;8) a broad band at 1220 cm−1, probably due to C O stretch-ng and OH bending of carboxyl groups; (9) a peak at about156 cm−1, probably due to O H stretching of alcoholic groups;10) a band at 1080–1070 cm−1, probably due to phosphono-roup stretching and/or mineral impurities; (11) a band at040–1030 cm−1, ascribed to OH stretching of polysaccha-ides.
FT-IR spectra of HA extracted with NaOH andaOH + Na4P2O7 do not show significant differences
hroughout the profile. On the contrary, Na4P2O7 extractedA spectra show some important differences. In particular,eaks located at 2920–2855 and 1420 cm−1 are less intense andefined, confirming a minor aliphatic character of these HA inomparison to the others. In addition, the Na4P2O7 extractedA features inversely a decreased aliphaticity (1040 cm−1) and
n increase of phosphono-group signals (1080 cm−1) on the
A surfaces, also in agreement with the elemental analysis datand ash content.
acids
(%) S (%) O (%) C/N C/H O/C Ash (%)
2 ± 0.01 0.08 ± 0.02 37.07 30.2 0.79 0.51 2.445 ± 0.12 0.33 ± 0.02 42.93 26.8 0.81 0.65 9.701 ± 0.06 0.11 ± 0.04 39.53 32.4 0.80 0.56 5.14
8 ± 0.04 0.13 ± 0.02 35.46 30.0 0.77 0.47 2.342 ± 0.01 0.32 ± 0.00 41.92 26.6 0.84 0.62 6.678 ± 0.06 0.08 ± 0.02 36.20 32.9 0.79 0.49 4.82
1 ± 0.01 0.10 ± 0.02 32.81 26.2 0.82 0.42 1.592 ± 0.02 0.28 ± 0.04 36.70 25.7 0.95 0.49 7.770 ± 0.10 0.15 ± 0.05 33.57 25.9 0.81 0.44 3.96
9 ± 0.07 0.09 ± 0.03 31.65 20.3 0.83 0.40 1.911 ± 0.02 0.19 ± 0.02 35.86 20.3 0.97 0.48 8.631 ± 0.06 0.14 ± 0.04 31.58 20.2 0.82 0.40 4.06
824 C. Zaccone et al. / Talanta 73 (2007) 820–830
ios of differently extracted humic acids.
3
Hfropasitsarsop(
wtr
Table 2Excitation/emission wavelength pairs (EEWP, nm/nm) and relative fluorescenceintensities (RFI, arbitrary units) in the fluorescence excitation–emission matrixspectra of selected HA samples
HA samples EEWP RFI
Main peak Secondary peaksand/or shoulders
2T 13 HANaOH 375/468 15.42T 13 HANa4P2O7 395/484 18.4
470/528 11.92T 13 HANaOH+Na4P2O7 370/483 16.9
2T 33 HANaOH 385/499 14.0370/482 13.6470/525 10.8
2T 33 HANa4P2O7 470/525 19.4385/471 14.5
2T 33 HANaOH+Na4P2O7 380/486 14.0470/526 10.8
2T 41 HANaOH 375/479 15.0
Fig. 3. Ash content and atomic rat
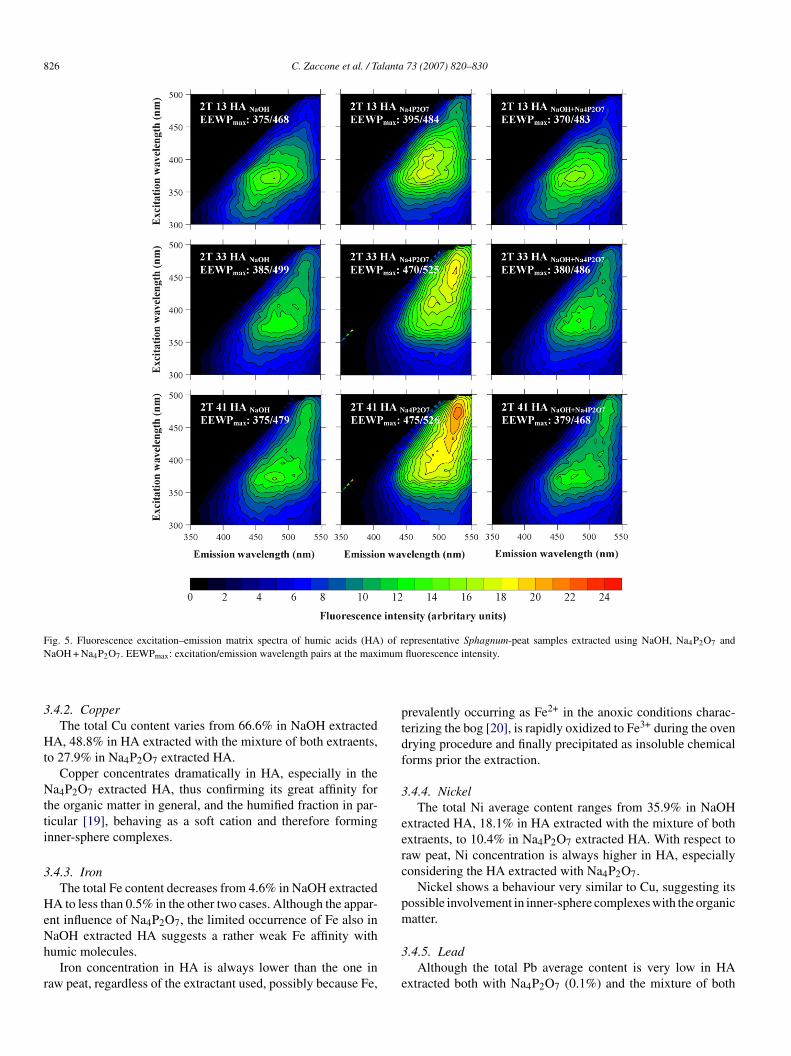
.3. Fluorescence spectroscopy
In general, EEM spectra (Fig. 5) of Na4P2O7 extractedA feature the highest fluorescence intensity (FI) values, both
or the main and the secondary (shoulder) fluorophore, withespect to the others. Further, they also show the main flu-rophore centered at higher excitation/emission wavelengthsairs (EEWP) with respect to the other HA and a shoulder,bsent in the other HA samples, located in the top high handide of the contour map (470 exc/528 em nm). With increas-ng depth, FI values of the shoulder increase, whereas those ofhe main peak initially tend to decrease (Table 2). The EEMpectra of HA extracted with NaOH + Na4P2O7 and NaOHre characterized by the appearance, in the high wavelengthsegion, of a shoulder which, similarly to the previous HA,hows increasing FI values with depth. Moreover, the spectraf these HA also exhibit slight variations both of the wavelengthairs localization and the FI values of the main fluorophoreFig. 5).
In general, fluorescence data suggest that the HA isolatedith NaOH + Na4P2O7 and especially NaOH, as compared to
he Na4P2O7 isolated HA, are characterized by a larger occur-ence of aliphatic components of wider molecular heterogeneity
470/525 12.22T 41 HANa4P2O7 475/526 22.6
385/482 19.52T 41 HANaOH+Na4P2O7 379/468 13.6
C. Zaccone et al. / Talanta 73 (2007) 820–830 825
) extr
aistac
3
iFr
3
wr
ttgo
Fig. 4. FT-IR spectra relative to two HA samples (2T 13 and 2T 33
nd lower molecular weight and aromaticity features. Withncreasing depth, molecular units of higher structural complexityeem to appear. On the contrary, Na4P2O7 extracted HA seemo closely resemble linearly/condensed aromatic ring systemsnd/or unsaturated bond systems capable of a high degree ofonjugation.
.4. X-ray fluorescence
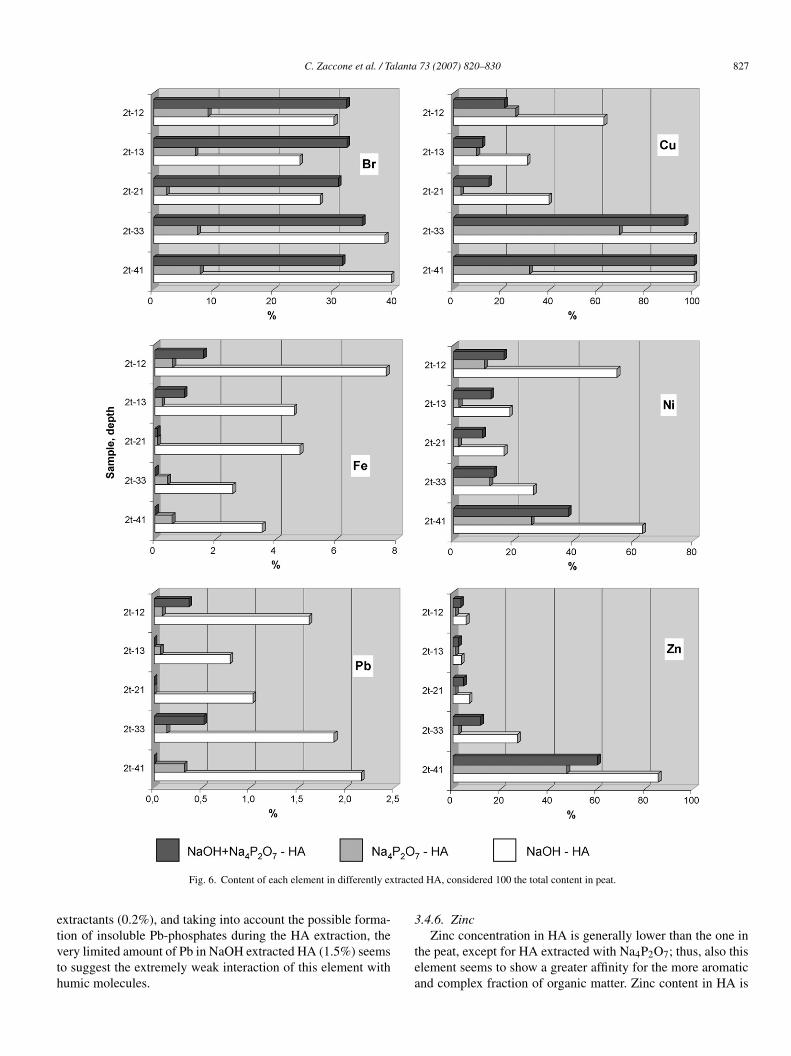
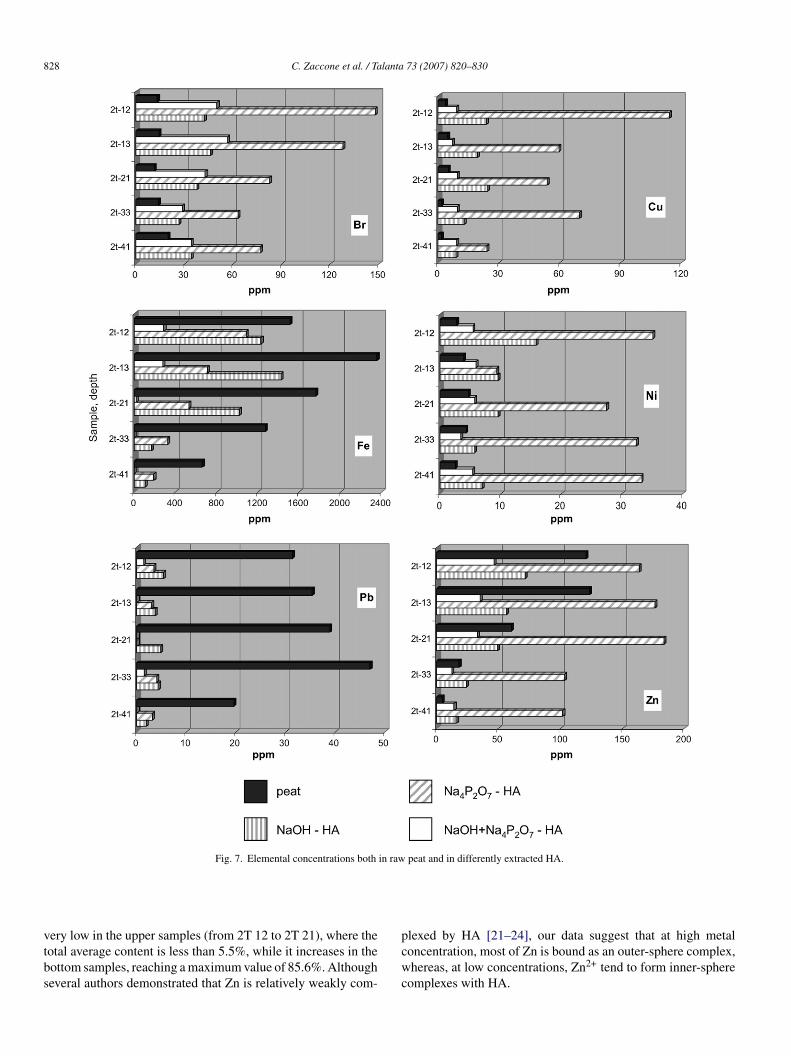
Fig. 6 shows the percentage content of each studied elementn HA, considered 100 the correspondent one in the peat. Inig. 7 and in Table 3, instead, the elemental concentrations inaw peat and HA are compared.
cmsp
acted with NaOH, NaOH + Na4P2O7, and Na4P2O7, respectively.
.4.1. BromineAt least 32.0% of the Br in peat is recovered in HA extracted
ith NaOH and with the mixture of both extractants, while Breaches 6.6% by using Na4P2O7.
Bromine concentration in HA is always higher than the one inhe peat, regardless of the extractant used. In particular, Br seemso be more concentrated in Na4P2O7 extracted HA showing areater affinity for the more aromatic and complex fraction ofrganic matter.
However, even though the metabolic pathway is still not
lear, data show that Br could be stably incorporated into HAolecules, as already reported by Zaccone [18] who presentedimilar results analyzing HA from two different ombrotrophiceat cores.
826 C. Zaccone et al. / Talanta 73 (2007) 820–830
Fig. 5. Fluorescence excitation–emission matrix spectra of humic acids (HA) of representative Sphagnum-peat samples extracted using NaOH, Na P O andN imum
3
Ht
Ntti
3
HeNh
r
ptdf
3
eerc
pm
aOH + Na4P2O7. EEWPmax: excitation/emission wavelength pairs at the max
.4.2. CopperThe total Cu content varies from 66.6% in NaOH extracted
A, 48.8% in HA extracted with the mixture of both extraents,o 27.9% in Na4P2O7 extracted HA.
Copper concentrates dramatically in HA, especially in thea4P2O7 extracted HA, thus confirming its great affinity for
he organic matter in general, and the humified fraction in par-icular [19], behaving as a soft cation and therefore formingnner-sphere complexes.
.4.3. IronThe total Fe content decreases from 4.6% in NaOH extracted
A to less than 0.5% in the other two cases. Although the appar-nt influence of Na4P2O7, the limited occurrence of Fe also in
aOH extracted HA suggests a rather weak Fe affinity withumic molecules.Iron concentration in HA is always lower than the one inaw peat, regardless of the extractant used, possibly because Fe,
3
e
4 2 7
fluorescence intensity.
revalently occurring as Fe2+ in the anoxic conditions charac-erizing the bog [20], is rapidly oxidized to Fe3+ during the ovenrying procedure and finally precipitated as insoluble chemicalorms prior the extraction.
.4.4. NickelThe total Ni average content ranges from 35.9% in NaOH
xtracted HA, 18.1% in HA extracted with the mixture of bothxtraents, to 10.4% in Na4P2O7 extracted HA. With respect toaw peat, Ni concentration is always higher in HA, especiallyonsidering the HA extracted with Na4P2O7.
Nickel shows a behaviour very similar to Cu, suggesting itsossible involvement in inner-sphere complexes with the organicatter.
.4.5. LeadAlthough the total Pb average content is very low in HA
xtracted both with Na4P2O7 (0.1%) and the mixture of both
C. Zaccone et al. / Talanta 73 (2007) 820–830 827
tracte
etvth
3
Fig. 6. Content of each element in differently ex
xtractants (0.2%), and taking into account the possible forma-
ion of insoluble Pb-phosphates during the HA extraction, theery limited amount of Pb in NaOH extracted HA (1.5%) seemso suggest the extremely weak interaction of this element withumic molecules.tea
d HA, considered 100 the total content in peat.
.4.6. Zinc
Zinc concentration in HA is generally lower than the one inhe peat, except for HA extracted with Na4P2O7; thus, also thislement seems to show a greater affinity for the more aromaticnd complex fraction of organic matter. Zinc content in HA is
828 C. Zaccone et al. / Talanta 73 (2007) 820–830
Fig. 7. Elemental concentrations both in raw peat and in differently extracted HA.
vtbs
ery low in the upper samples (from 2T 12 to 2T 21), where theotal average content is less than 5.5%, while it increases in theottom samples, reaching a maximum value of 85.6%. Althougheveral authors demonstrated that Zn is relatively weakly com-
pcwc
lexed by HA [21–24], our data suggest that at high metaloncentration, most of Zn is bound as an outer-sphere complex,hereas, at low concentrations, Zn2+ tend to form inner-sphere
omplexes with HA.
C. Zaccone et al. / Talanta 73 (2007) 820–830 829
Table 3Trace element contents (�g g−1) in raw peat and related HA differently extracted
Trace elements
Br (�g g−1) Cu (�g g−1) Fe (�g g−1) Ni (�g g−1) Pb (�g g−1) Zn (�g g−1)
LDD 0.6 1.5 10.0 2.0 0.6 2.0
2T 12 raw peat 13.2 ± 1.3 3.6 ± 0.7 1509.6 ± 75.5 2.5 ± 1.0 31.3 ± 3.1 120.4 ± 6.02T 12 HANaOH 42.1 ± 4.2 23.7 ± 2.4 1226.4 ± 61.3 15.8 ± 1.6 5.4 ± 1.1 71.5 ± 7.12T 12 HANa4P2O7 147.6 ± 44.3 114.1 ± 34.2 1084.2 ± 325.3 35.1 ± 10.5 3.4 ± 1.2 163.2 ± 48.92T 12 HANaOH+Na4P2O7 50.0 ± 5.0 9.0 ± 0.9 286.2 ± 14.3 5.4 ± 1.1 1.3 ± 0.3 46.2 ± 4.6
2T 13 raw peat 14.3 ± 1.4 4.8 ± 1.0 2351.5 ± 117.6 3.9 ± 1.2 35.3 ± 3.5 123.3 ± 6.22T 13 HANaOH 45.9 ± 4.6 19.4 ± 1.9 1423.7 ± 71.2 9.6 ± 1.4 3.7 ± 0.7 56.4 ± 5.62T 13 HANa4P2O7 127.6 ± 38.3 59.5 ± 17.9 705.9 ± 211.8 9.4 ± 2.8 2.9 ± 1.0 176.1 ± 52.82T 13 HANaOH+Na4P2O7 56.7 ± 5.7 7.0 ± 0.7 278.7 ± 13.9 6.0 ± 0.9 <LLD 35.2 ± 3.5
2T 21 raw peat 11.2 ± 1.1 5.1 ± 0.8 1759.5 ± 88.0 4.7 ± 1.4 38.9 ± 3.9 60.2 ± 6.02T 21 HANaOH 37.5 ± 3.7 24.5 ± 2.4 1019.1 ± 51.0 9.6 ± 1.4 4.8 ± 1.0 49.2 ± 4.92T 21 HANa4P2O7 82.5 ± 24.8 53.7 ± 16.1 528.2 ± 158.5 27.5 ± 8.2 <LLD 183.4 ± 55.02T 21 HANaOH+Na4P2O7 42.8 ± 4.3 9.3 ± 0.9 17.8 ± 3.6 5.7 ± 1.1 <LLD 32.9 ± 3.3
2T 33 raw peat 13.8 ± 1.4 1.6 ± 0.6 1271.8 ± 63.6 4.3 ± 1.3 47.0 ± 4.7 18.0 ± 1.82T 33 HANaOH 26.3 ± 2.6 13.0 ± 1.3 161.8 ± 8.1 5.7 ± 1.1 4.4 ± 0.9 23.9 ± 2.42T 33 HANa4P2O7 62.8 ± 18.8 69.6 ± 20.9 323.9 ± 97.2 32.4 ± 9.7 3.9 ± 1.4 102.9 ± 30.92T 33 HANaOH+Na4P2O7 28.5 ± 2.8 9.3 ± 0.9 <LLD 3.4 ± 1.0 1.4 ± 0.3 12.3 ± 1.2
2T 41 raw peat 19.6 ± 2.0 1.5 ± 0.5 658.0 ± 32.9 2.5 ± 0.9 19.5 ± 2.0 4.2 ± 0.82T 41 HANaOH 34.0 ± 3.4 8.8 ± 0.9 102.2 ± 10.2 7.0 ± 1.0 1.8 ± 0.4 15.8 ± 1.62 187.2 <LL
L
4
pto
oNt
tipttiteui
oeocgrHa
cfutt
A
oa
R
T 41 HANa4P2O7 77.0 ± 23.1 24.2 ± 7.2T 41 HANaOH+Na4P2O7 34.2 ± 3.4 8.9 ± 0.9
ower detection limits (LDD) and standard deviations are also reported.
. Conclusions
In the present paper, authors isolated HA from several sam-les along a peat profile using three different extractants in ordero verify their influence both on HA quality and on the contentf selected trace elements (Br, Cu, Fe, Ni, Pb and Zn).
Elemental composition, main atomic ratios, FT-IR and flu-rescence data indicate that HA extracted with NaOH andaOH + Na4P2O7 are quite similar and differ markedly from
he Na4P2O7 extracted ones.All analytical results confirm the role of Na4P2O7 in selec-
ively extracting high molecular weight organic materials, richn aromatic features but poor in aliphatic compounds. Inarticular, FT-IR spectra and atomic ratios strongly supporthe dominant role of pyrophosphate in solubilizing preferen-ially more aromatic compounds from the raw material andn adding phosphono-groups on the HA surface. At the sameime, total luminescence spectra indicate the occurrence of lin-arly/condensed aromatic ring systems and a high degree ofnsaturated bond systems in these HA with respect to the onessolated with NaOH.
Furthermore, the EMMA X-ray fluorescence underlines onne hand that HA get rich in Br, Cu and Ni, regardless of thextraent used, while a depletion of Fe, Pb and, partially, Zn isbserved; on the other hand, that Br, Cu, Ni and Zn are more con-entrated in Na4P2O7 extracted HA probably because of their
reater affinity for this more aromatic and complex humic mate-ial. The higher elemental concentration in Na4P2O7 extractedA is consistent with a higher ash content compared to NaOHnd NaOH + Na4P2O7 extracted HA.
[[[[
2 ± 56.2 33.2 ± 10.0 3.1 ± 1.1 101.7 ± 30.5D 5.4 ± 0.8 <LLD 14.1 ± 1.4
Further studies are needed to investigate more closely thehemical mechanisms and the complexation behaviour of dif-erent trace elements in natural organic soils in order to betternderstand the environmental fate of this chemical species ando provide more clear indications on the practical application ofhese organic materials in the agriculture and industrial field.
cknowledgement
A special thank goes to Prof. William Shotyk, Universityf Heidelberg, for providing peat samples and allowing XRFnalysis in his institute.
eferences
[1] F.J. Stevenson, Humus Chemistry. Genesis, Composition, Reactions, 2nded., Wiley & Sons, New York, 1994.
[2] A. Piccolo, Soil Sci. 166 (2001) 810–832.[3] R. Sutton, G. Sposito, Environ. Sci. Technol. 39 (2005) 9009–9015.[4] N. Senesi, E. Loffredo, in: D.L. Sparks (Ed.), Soil Physical Chemistry,
CRC Press LLC, 1999, pp. 239–370.[5] M.M. Kononova, Soil Organic Matter, Pergamon, Elmsford, NY, 1966.[6] M. Schnitzer, S.U. Khan, Soil Organic Matter, Elsevier Science Publishers,
New York, 1978.[7] M. Schnitzer, P. Schuppli, Can. J. Soil Sci. 69 (1989) 253–262.[8] R.S. Cameron, B.K. Thornton, R.S. Swift, A.M. Posner, J. Soil Sci. 23
(1972) 394–408.[9] A. Piccolo, A. Mirabella, Sci. Total Environ. 62 (1987) 39–46.
10] E.C.P. Wardenaar, Can. J. Bot. 65 (1987) 1772–1773.11] C. Zaccone, T.M. Miano, W. Shotyk, Org. Geochem. 38 (2007) 151–160.12] A.K. Cheburkin, W. Shotyk, Fresen. J. Anal. Chem. 354 (1996) 688–691.13] W. Shotyk, P. Blaser, A. Grunig, A.K. Cheburkin, Sci. Total Environ. 249(2000) 281–295.

8 lanta
[[
[
[
[
[
[
[
30 C. Zaccone et al. / Ta
14] M.B. Choudhri, F.J. Stevenson, Soil Sci. Soc. Am. Proc. 21 (1957) 508–513.15] O. Francioso, C. Ciavatta, V. Tugnoli, S. Sanchez-Cortes, G. Gessa, Soil
Sci. Soc. Am. J. 1 (1998) 181–187.16] N. Senesi, T.M. Miano, M.R. Provenzano, G. Brunetti, Sci. Total Environ.
81/82 (1989) 143–156.
17] N. Senesi, T.M. Miano, G. Sposito, Proceedings of the InternationalConference on Peat Production and Use-Peat 90, Jyvaskyla, 11–15 June1990, The Association of Finnish Peat Industries, Jyvaskyla, 1990, pp.412–421.
18] C. Zaccone, PhD Thesis, University of Bari, Italy, 2007, pp. 135.
[
[[
73 (2007) 820–830
19] N. Senesi, E. Loffredo, Chemical Processes in Soils, Soil Science Societyof America Inc., Madison, Wisconsin, 2005, pp. 564–617.
20] P. Steinmann, W. Shotyk, Geochim. Cosmochim. Acta 61 (1997)1143–1163.
21] F.J. Stevenson, Soil Sci. 123 (1977) 10–17.
22] H. Kerndorff, M. Schnitzer, Geochim. Cosmochim. Acta 44 (1980)1701–1708.23] X.-H. Chen, T. Gossett, D.R. Thevenot, Water Res. 24 (1990) 1463–1471.24] E.J. Smith, C. Rey-Castro, H. Longworth, S. Lofts, A.J. Lawlor, E. Tipping,
Eur. J. Soil Sci. 55 (2004) 433–447.