analytical study of humic acid from various
TRANSCRIPT
N.N. Rupiasih & P.B. Vidyasagar, Int. J. of Design & Nature and Ecodynamics. Vol. 4, No. 1 (2009) 32–46
© 2009 WIT Press, www.witpress.comISSN: 1755-7437 (paper format), ISSN: 1755-7445 (online), http://journals.witpress.comDOI: 10.2495/DNE-V4-N1-32-46
ANALYTICAL STUDY OF HUMIC ACID FROM VARIOUS SOURCES COMMONLY USED AS FERTILIZER: EMPHASIS ON
HEAVY METAL CONTENT
N.N. RUPIASIH1,2 & P.B. VIDYASAGAR2
1Department of Physics, Faculty of Mathematics and Natural Sciences, Udayana University, Kampus Bukit Jimbaran, Badung, Bali, Indonesia.
2Biophysics Laboratory, Department of Physics, University of Pune, Ganeshkhind, Pune, India
ABSTRACTIn recent years, new varieties of organic fertilizers such as vermi compost, sludge and sediment have been added as new sources of fertilizers, which have humic acid (HA) present in it. However, a systematic char-acterization of these substances and their comparison with cow dung has not been reported. This is essential to decide the relative merits and demerits of these substances as a fertilizer. The objective of this work was to extract and characterize the chemical compositions of various HA using various techniques such as UV-Vis, Fourier transform infrared spectroscopy, proton nuclear magnetic resonance (1H-NMR), scanning electron microscopy (SEM), energy dispersive spectrometer (EDS), atomic absorption spectrophotometer (AAS) and X-ray diffractometer (XRD). Cow dung manure, vermi compost, sludge and lake sediment were used for this purpose. 1H-NMR show that all HA samples were rich in aliphatic groups. EDS analysis found HA rich in carbon and oxygen and poor in nitrogen and presence of elements such as Na, Ca, K, Mg, Al, S, P, Cu, Fe, Cr, Co and Pb in various proportions. It was supported by AAS analysis where elements such as Na, K, Ca, Mg, Fe, Cu and Co were found in all HA samples in various concentrations. SEM images and XRD analysis showed some crystal forms found in all HA samples. These results elucidate that the chemical composition and the molecular structure of HA samples varies as per the origin and environment where decomposition has occurred. Present study also documented that the spectroscopic and imaging techniques can be successfully used to bring out the fi ner differences among HA extracted from different sources. It brings out the relative mer-its and demerits of vermi compost, sludge and lake sediment as compared to cow dung manure. This analysis showed that out of the four HA samples extracted from different sources except HA-SD can be used as fertilizer with caution to Al, Co and Cr content.Keywords: alkaline extraction, fertilizer, humic acid, metal-crystal form, spectroscopic and imaging techniques.
INTRODUCTION1 Manure and solid disposal have been used as a fertilizer, which have humic acid (HA) present in it. To use cow dung manure as a fertilizer is an age old practice in agriculture in many countries. In recent years, new varieties such as vermi compost, sludge and sediment have been added as new sources of fertilizers. It is obligatory to know the chemical composition of each for further use as fertilizer.
Organic compost is an end product of degraded organic matter (OM) that consists of transformed degradable compounds and dead microorganism tissues that are classifi ed as humic substances (HS) [1, 2]. The extension of organic farming and sustainable agriculture has led to increasing applica-tions of organic fertilizers such as HA, which is a fraction of HS. Increase in the organic content of soils improve aeration, soil structure, increase the water holding capacity of the soil [3] and has been found to reduce plant diseases more effi ciently than commercial fertilizers and herbicides [4, 5]. OM must be characterized in order to predict and understand its behaviour and chemistry. Numerous studies have been attempted to make out its structure and chemical composition; however, due to heterogeneity of samples, there is no defi nitive structure for OM although many structural models have been proposed [6–8].
N.N. Rupiasih & P.B. Vidyasagar, Int. J. of Design & Nature and Ecodynamics. Vol. 4, No. 1 (2006) 33
Various studies about the characterization of HA extracted from manure, vermi compost, waste disposal and sediment have been carried out. Most of the work reported is about the content of organic elements (C, O, N, H) and E4/E6 (degree of aromaticity) of HA from particular source. Few of them have also reported some inorganic elements such as S and P present in HA [1, 8–16].
On this background, an objective study was planned to characterize HA from various sources in the same region using spectroscopy and imaging techniques. These included UV-Vis spectroscopy, Fourier transform infrared spectroscopy (FTIR), proton nuclear magnetic resonance (1H-NMR), atomic absorption spectrophotometer (AAS), X-ray diffractometer (XRD), energy dispersive spec-trometer (EDS) and scanning electron microscopy (SEM). For this purpose, HA from four different sources was extracted using alkaline solution. These samples were selected to represent origin from the region in and around Pune city, India. These are cow dung manure (HA-CD), vermi compost (HA-VE), solid waste from ‘domestic wastewater treatment plant’ (sludge, HA-SL) and lake sedi-ment (HA-SD).
The spectroscopic and imaging analysis show that HA from different sources have different chemical compositions and granular structure. Data such as E280, E2/E3, inorganic content (heavy metals) and the crystal phases of it are also discussed, which have not been part of the most of the studies reported so far. The observation provides a systematic method to compare the constituents of different HA substances and their merits and demerits as compared to the HA obtained from cow dung manure.
MATERIALS AND METHODS2
Sample collection2.1
Cow dung manure was collected from organic manure manufacturing unit at Chinchward, Pune, India. After being air dried at room temperature, it was stored in a plastic bag for extraction. Vermi compost was supplied by Mangal-Raj Bio Tech, Sona Industries, Pune, India. It was used for HA extraction without any further treatment. Sludge was collected from ‘Wastewater Treatment Plant’, Kasarwadi, Pune, India. It was used for HA extraction without any further treatment. Sediment (0–5 cm depth) collected from banks of Pasan lake, Pune, India, was air dried at room temperature and stored before extraction.
Extraction and purifi cation of HA2.2
The HA was extracted with alkaline solution according to the protocol described elsewhere [9]. Briefl y, the procedure consisted of (i) 10 g of cow dung manure continuously stirred with glass rod manually for 10 min in 100 mL of 0.1 N KOH at room temperature and then kept for 2 h; (ii) super-natant was fi ltered using Whatman No.1 fi lter paper and then centrifuged at 12,000 r.p.m. for 30 min, at 20°C; (iii) acidifi ed with 6 N HCl to pH 1.0 and allowed to precipitate for 24 h at 4°C; supernatant was FA and the residue was HA; (iv) precipitated HA was recovered by centrifugation at 5000 r.p.m. for 30 min at 20°C, then dissolved in a small volume of 0.1 N KOH and again precipitated at pH 1.0 for 24 h at 4°C. This precipitation–dissolution procedure was repeated four times to eliminate FA; (v) after purifi cation, the precipitated HA was dried at temperature 32–35°C in an oven for 14 days. Dried HA was kept in a sealed tube for characterization.
The HA extraction from vermi compost, sludge and sediment was carried out using the same procedure used for the cow dung manure.
34 N.N. Rupiasih & P.B. Vidyasagar, Int. J. of Design & Nature and Ecodynamics. Vol. 4, No. 1 (2006)
Spectroscopic and imaging techniques2.3
The UV-Vis absorption spectra of HA samples were recorded using a UV-Vis spectrophotometer, Perkin-Elmer, model-330. Around 2 mg of each HA sample was dissolved in 25 mL 0.05 N NaHCO3 and spectra were recorded at wavelengths 240–700 nm range.
The infrared spectra of HA samples were recorded with a FTIR-8400 spectrophotometer (Shi-madzu) using a pellet (pressed disk) technique. Around 0.5 mg of dried HA was grinded with 100 mg KBr (FTIR grade) till it became homogenous. After grinding, it was placed in a micro-disk. For the reference, a micro-disk of KBr was prepared. The spectra were recorded in the range 400–4000 cm–1.
1H-NMR was used to estimate the relative proton content from aromatic and aliphatic groups present in each sample. The spectra were recorded with a Fourier transform nuclear magnetic reso-nance spectroscopy, Varian Mercury YH-300, Germany. Around 5 mg of each sample was dissolved in 0.5 mL DMSO-d6 and spectra were recorded in δ range 0–10 ppm.
Granular structure and elemental analysis of samples were obtained using SEM/EDS (JEOL JSM-6360A, Japan) techniques. Each sample was prepared on the glass substrate and was coated with platinum for 45 s (about 20 nm thicknesses) under vacuum condition by auto fi ne coater machine (JEOL JFC-1600) and then examined with SEM/EDS.
Based on the EDS results, Na, K, Ca, Mg, Fe, Cu, Cr, Co and Pb analysis has been carried out using an AAS, Varian Spectra AA 220, Australia. All samples were prepared in 100 mL volumetric fl asks. For each HA sample, around 3 mg of dried HA was dissolved in 10 mL of 0.05 N NaHCO3 and then diluted with distilled water (DW) to make total volume of 50 mL. Each HA solution was treated with concentrated HNO3:HCl, 3:1 and covered with a glass lid [1]. The samples were placed on a hot plate and heated to 85 ± 5°C for 10–15 min. They were then allowed to cool and 1 mL of concentrated HNO3 was added. The lid was removed and then samples were heated again for 30 min. After cooling, the volume of the sample was adjusted to 100 mL by adding DW. The digested samples were then fi ltered by Whatman No. 41 fi lter paper and were kept in a glass bottle with lid for taking the required readings. The metal analysis for each sample has been repeated three times with the calibration of the system (p < 0.05) and the average values were taken.
X-ray diffraction of HA samples was recorded in powder form using a D8 Advance XRD Bruker AXS GmbH, Germany. Around 23 mg of each sample was exposed to X-rays (l = 1.54060 Å; anode Cu) with 2q angle varying within 5° and 80°. The applied voltage and current were 40 kV and 40 mA, respectively.
All the studies have been repeated three times independently with at least three observations each time.
RESULTS3
The ratios, E3.1 2/E3 and E4/E6, and elemental analysis
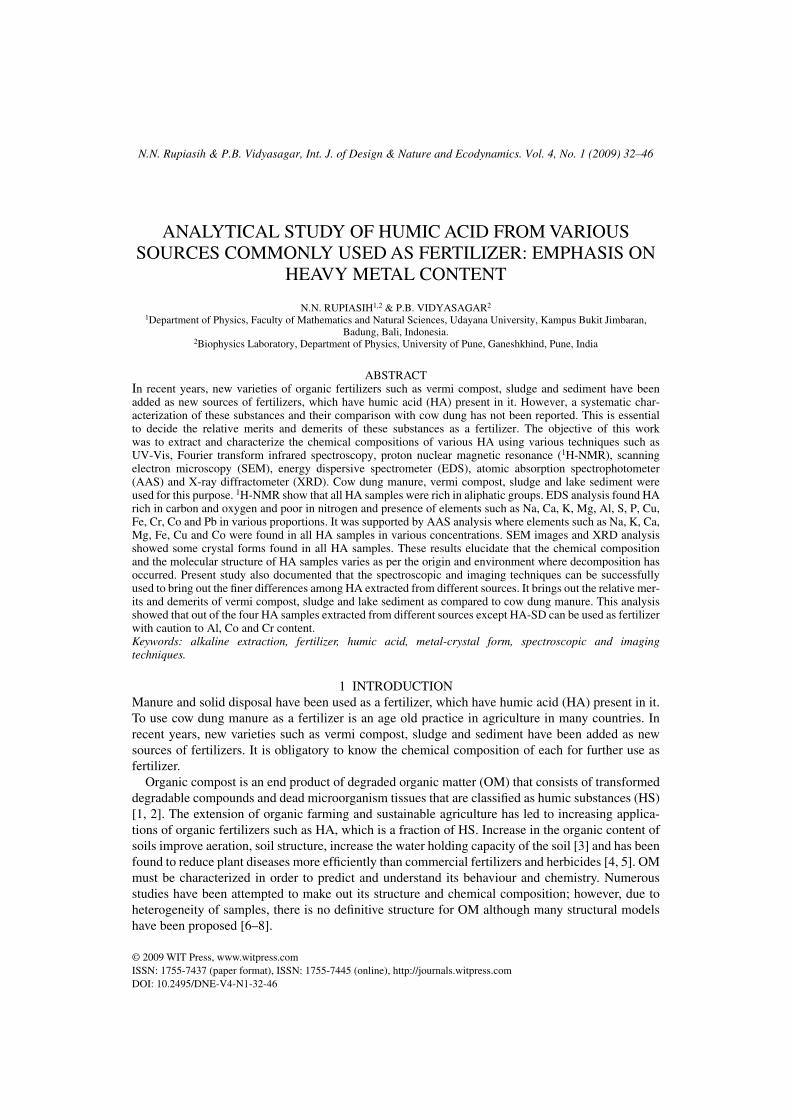
The UV-Vis spectra of HA extracted in this study were relatively featureless, with the absorbance decreasing with increasing wavelength, Fig. 1. The spectra obtained were consistent with the HA spectra that have been reported by other investigators [2, 10, 17].
All the absorption spectra show similar pattern. A slight maximum could be indicated at approxi-mately 275 nm, which is probably due to presence of quinone structure [2]. The absorbance of HA-SD is low compared to other samples. It indicates that less number of chromophore molecules, capable of absorbing electromagnetic radiation in the UV-Vis (240–700 nm) range, is present in HA-SD.
N.N. Rupiasih & P.B. Vidyasagar, Int. J. of Design & Nature and Ecodynamics. Vol. 4, No. 1 (2006) 35
Table 1 shows comparison of analytical data of HA studied in this work and data reported by other investigators [1, 8, 9, 18]. The data of HA extracted in the present study were compared with data reported earlier and are given in Table 1. It shows that all extracted samples are lower in percentage content of carbon as compared to the reported values and the difference is statistically signifi cant (p < 0.04). However, difference in percentage content of oxygen is not signifi cant as compared to the reported values. The nitrogen content was not detectable. The difference in the ratio of the percent-age content of oxygen and carbon (O/C) and the ratios E4/E6 is not statistically signifi cant.
As far as the comparison of each HA samples studied is concerned, the results from present study reported in Table 1 show that the difference of the ratio, E4/E6, is statistically signifi cant (p < 0.05) compared to HA-CD value. It decreases in the order HA-CD > HA-VE > HA-SL > HA-SD. Decre-ment in this order is attributed to the lesser oxygen content in the samples [19]. These observations were confi rmed by oxygen data obtained from EDS analysis. The ratio of oxygen decreases in the same order. Similar trend was obtained in the ratio, E2/E3. However, difference in the ratio, E2/E3, is not signifi cant as compared to HA-CD.
The absorbance at 280 nm (E280) has been used as an indicator of carbohydrate presence in the sample. The E280 values decrease in the order HA-CD > HA-VE > HA-SL > HA-SD and elucidate the increasing presence of carbohydrate in the samples [10, 20]. However, difference in E280 values, is not signifi cant as compared to HA-CD value.
The EDS analysis in Table 1 shows that carbon decreases in the order HA-SD > HA-SL > HA-VE > HA-CD. The content of sulphur was found same in all samples, in the range of standard deviation. The content of oxygen and the ratio, O/C decreases in the order HA-CD > HA-VE > HA-SL ≈ HA-SD. The difference in the ratios, O/C are statistically signifi cant (p < 0.03) as compared to HA-CD value. Whereas difference in the percentage content of carbon, oxygen and sulphur is not signifi cant as compared to HA-CD value.
240
5.0
4.0
3.0
2.0
1.0
a
b
c
d0.0
280 320 360 400 440 480
Wavelength (nm)
Abs
orba
nce
(a.u
.)
520 560 600 640 680
Figure 1: The UV-Vis spectra of HA extracted from four different sources: (a) HA-CD: HA extracted from cow dung manure; (b) HA-VE: HA extracted from vermi compost; (c) HA-SL: HA extracted from sludge and (d) HA-SD: HA extracted from sediment. Three independent studies were performed with similar outcome and the results from one representative experiment are shown.

36 N.N. Rupiasih & P.B. Vidyasagar, Int. J. of Design & Nature and Ecodynamics. Vol. 4, No. 1 (2006)
Tabl
e 1:
Ele
men
tal a
naly
ses,
ato
mic
rat
io a
nd a
bsor
banc
e va
lues
of
HA
ext
ract
ed in
the
pres
ent s
tudy
and
dat
a re
port
ed b
y ot
her
wor
kers
.
Sam
ples
Perc
enta
ge a
tom
ic c
onte
nt, A
t (%
)
O/C
E28
0E
2/E
3E
4/E
6C
ON
S
HA
-CD
20.0
8 ±
1.02
850
.41
± 3.
076
nd0.
88 ±
0.0
572.
51 ±
0.0
394.
31 ±
0.1
203.
68 ±
0.0
624.
34 ±
0.0
73H
A-V
E30
.68
± 1.
393
46.8
9 ±
3.77
1nd
0.98
± 0
.062
1.3
± 0.
087
2.36
± 0
.064
3.24
± 0
.097
3.54
± 0
.114
HA
-SL
43.1
4 ±
1.13
139
.59
± 1.
994
nd0.
96 ±
0.0
140.
92 ±
0.0
492.
05 ±
0.0
782.
88 ±
0.0
272.
96 ±
0.0
51H
A-S
D45
.29
± 1.
442
37.8
1 ±
1.32
9nd
1.06
± 0
.092
0.84
± 0
.085
0.28
± 0
.035
2.43
± 0
.101
2.54
± 0
.083
HA
152
.63
37.3
945.
8237
.392
0.52
nana
1.92
IHSS
HA
357
.50
33.8
04.
10na
0.40
nana
3.70
HA
456
.20
36.3
043.
2036
.304
0.50
nana
4.80
E28
0: a
bsor
banc
e at
280
nm
in a
.u.;
E2/
E3
and
E4/
E6:
rat
ios
of a
bsor
banc
e at
250
, 365
, 465
and
665
nm
, res
pect
ivel
y; n
d: n
ot d
etec
tabl
e be
caus
e th
e nu
mbe
r w
as v
ery
smal
l; na
: not
ava
ilabl
e.1 A
vera
ge v
alue
of
HA
was
ext
ract
ed f
rom
var
ious
man
ure
with
the
eart
hwor
m [
1].
2 %(O
+ S
).3 H
A f
rom
IH
SS [
8].
4 Ave
rage
val
ues
of s
ever
al s
oil H
A [
18].
N.N. Rupiasih & P.B. Vidyasagar, Int. J. of Design & Nature and Ecodynamics. Vol. 4, No. 1 (2006) 37
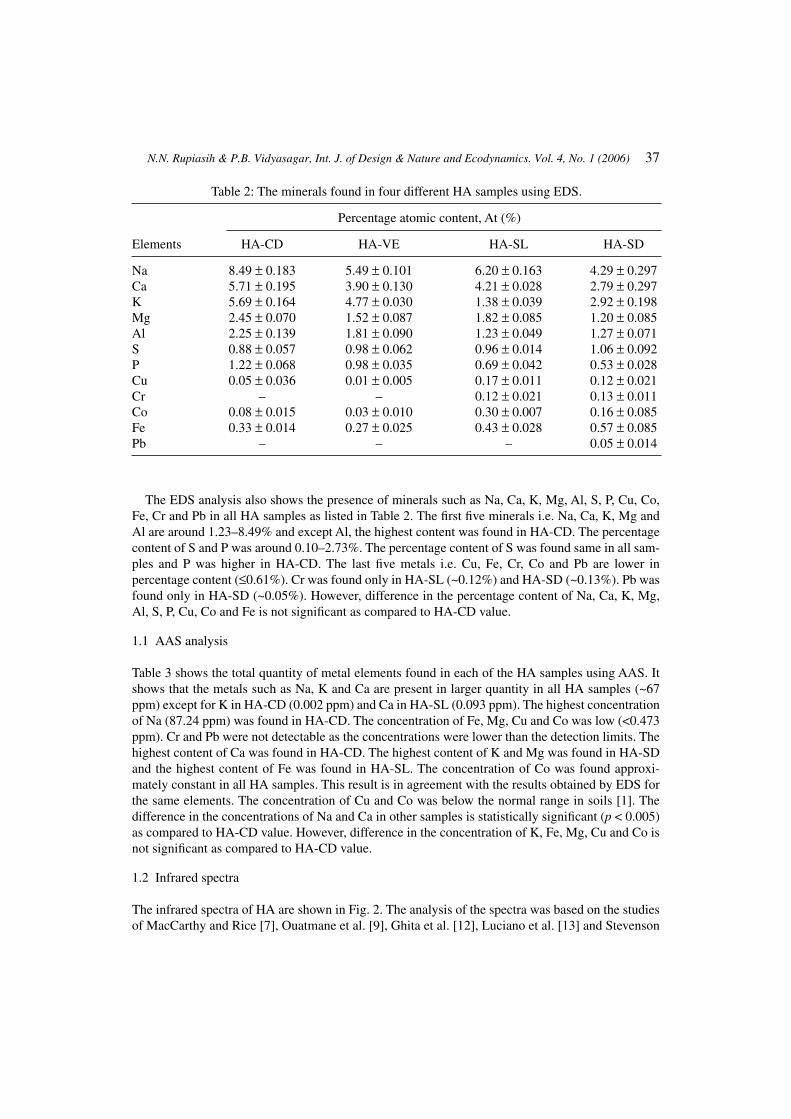
The EDS analysis also shows the presence of minerals such as Na, Ca, K, Mg, Al, S, P, Cu, Co, Fe, Cr and Pb in all HA samples as listed in Table 2. The fi rst fi ve minerals i.e. Na, Ca, K, Mg and Al are around 1.23–8.49% and except Al, the highest content was found in HA-CD. The percentage content of S and P was around 0.10–2.73%. The percentage content of S was found same in all sam-ples and P was higher in HA-CD. The last fi ve metals i.e. Cu, Fe, Cr, Co and Pb are lower in percentage content (≤0.61%). Cr was found only in HA-SL (~0.12%) and HA-SD (~0.13%). Pb was found only in HA-SD (~0.05%). However, difference in the percentage content of Na, Ca, K, Mg, Al, S, P, Cu, Co and Fe is not signifi cant as compared to HA-CD value.
AAS analysis1.1
Table 3 shows the total quantity of metal elements found in each of the HA samples using AAS. It shows that the metals such as Na, K and Ca are present in larger quantity in all HA samples (~67 ppm) except for K in HA-CD (0.002 ppm) and Ca in HA-SL (0.093 ppm). The highest concentration of Na (87.24 ppm) was found in HA-CD. The concentration of Fe, Mg, Cu and Co was low (<0.473 ppm). Cr and Pb were not detectable as the concentrations were lower than the detection limits. The highest content of Ca was found in HA-CD. The highest content of K and Mg was found in HA-SD and the highest content of Fe was found in HA-SL. The concentration of Co was found approxi-mately constant in all HA samples. This result is in agreement with the results obtained by EDS for the same elements. The concentration of Cu and Co was below the normal range in soils [1]. The difference in the concentrations of Na and Ca in other samples is statistically signifi cant (p < 0.005) as compared to HA-CD value. However, difference in the concentration of K, Fe, Mg, Cu and Co is not signifi cant as compared to HA-CD value.
Infrared spectra1.2
The infrared spectra of HA are shown in Fig. 2. The analysis of the spectra was based on the studies of MacCarthy and Rice [7], Ouatmane et al. [9], Ghita et al. [12], Luciano et al. [13] and Stevenson
Table 2: The minerals found in four different HA samples using EDS.
Elements
Percentage atomic content, At (%)
HA-CD HA-VE HA-SL HA-SD
Na 8.49 ± 0.183 5.49 ± 0.101 6.20 ± 0.163 4.29 ± 0.297Ca 5.71 ± 0.195 3.90 ± 0.130 4.21 ± 0.028 2.79 ± 0.297K 5.69 ± 0.164 4.77 ± 0.030 1.38 ± 0.039 2.92 ± 0.198Mg 2.45 ± 0.070 1.52 ± 0.087 1.82 ± 0.085 1.20 ± 0.085Al 2.25 ± 0.139 1.81 ± 0.090 1.23 ± 0.049 1.27 ± 0.071S 0.88 ± 0.057 0.98 ± 0.062 0.96 ± 0.014 1.06 ± 0.092P 1.22 ± 0.068 0.98 ± 0.035 0.69 ± 0.042 0.53 ± 0.028Cu 0.05 ± 0.036 0.01 ± 0.005 0.17 ± 0.011 0.12 ± 0.021Cr – – 0.12 ± 0.021 0.13 ± 0.011Co 0.08 ± 0.015 0.03 ± 0.010 0.30 ± 0.007 0.16 ± 0.085Fe 0.33 ± 0.014 0.27 ± 0.025 0.43 ± 0.028 0.57 ± 0.085Pb – – – 0.05 ± 0.014

38 N.N. Rupiasih & P.B. Vidyasagar, Int. J. of Design & Nature and Ecodynamics. Vol. 4, No. 1 (2006)
[21] relating to HA extracted from various sources. This gives the attribution of the main absorption bands presented in Table 4.
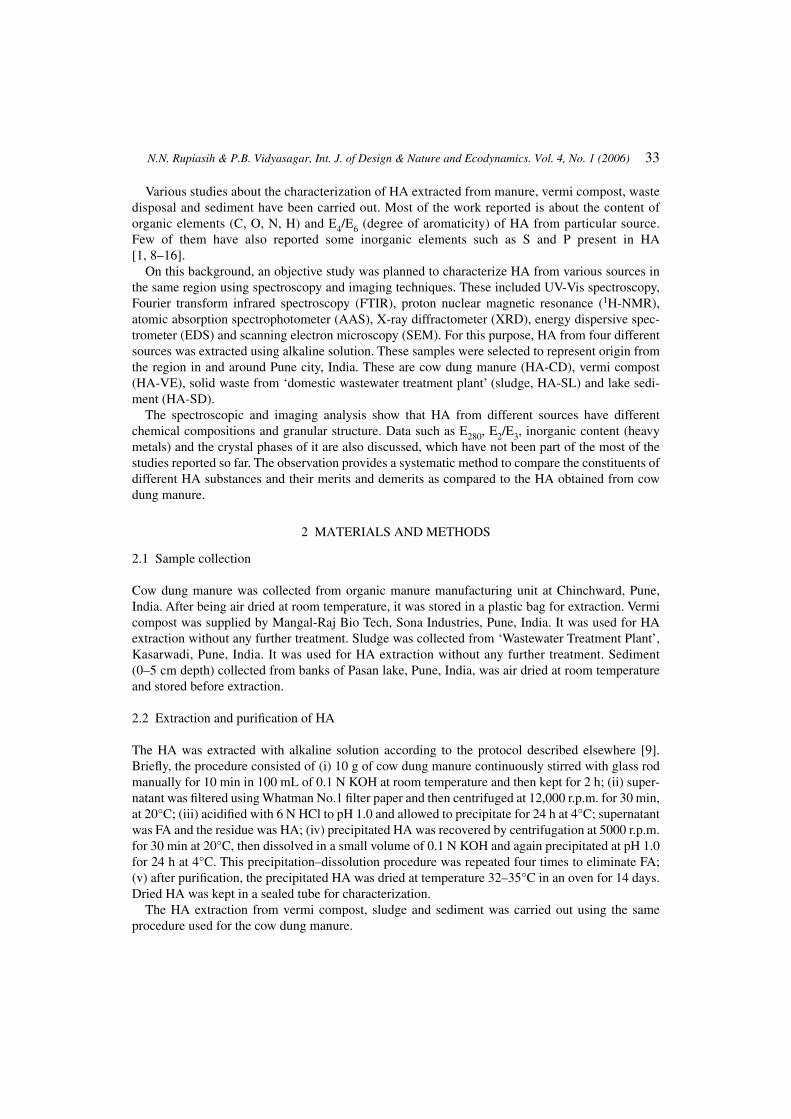
McDonnell et al. [14] have reported that a peak at around 2300 cm–1 was due to atmospheric CO2 which was not adequately compensated for by the blank. In samples investigated in this study, simi-lar peak has been detected.
A comparison of infrared spectra of HA (Fig. 2) shows that the spectra are qualitatively similar except one additional peak present at around 2095 cm–1 in HA-SL and two broad peaks at around 1990 and 2630 cm–1 in HA-CD and HA-VE, respectively. This indicates the presence of Si-H and S-H groups in HA-SL and HA-CD and HA-VE, respectively [22]. The observed differences in the intensity and the shape of the bands indicate that the chemical modifi cations have occurred, dur-ing the humifi cation process of each sample [1, 9, 12, 23]. The shape of the band at around
Table 3: Total quantity (ppm) of Na, K, Ca, Mg, Fe, Cu, Cr, Co and Pb in HA samples.
Samples
Total quantity (ppm)
Na K Ca Fe Mg Cu Co Cr Pb
HA-CD 87.238 0.002 16.921 0.163 0.034 0.018 0.023 nd ndHA-VE 60.426 0.871 0.445 0.323 0.003 0.005 0.032 nd ndHA-SL 61.170 1.783 0.093 0.473 0.002 0.199 0.028 nd ndHA-SD 63.405 2.262 1.261 0.146 0.119 0.031 0.029 nd ndSoila – – – – – 2–250 0.5–65 – –
aNormal range for metals in soils [1]; nd: not detectable.
10.0
30.0
50.0
70.0
90.0
400 800 1200 1600 2000 2400 2800 3200 3600 4000
Wavenumber (1/cm)
T (
%)
a
b
c
d
Figure 2: The infrared spectra of HA extracted from four different sources: (a) HA-CD: HA extracted from cow dung manure; (b) HA-VE: HA extracted from vermi compost; (c) HA-SL: HA extracted from sludge and (d) HA-SD: HA extracted from sediment. Three independent studies were performed with similar outcome and the results from one representative experiment are shown.
N.N. Rupiasih & P.B. Vidyasagar, Int. J. of Design & Nature and Ecodynamics. Vol. 4, No. 1 (2006) 39
3300–3500 cm–1 in HA-CD, HA-VE and HA-SD is broader compared to that in HA-SL with the intensity decreasing in the order HA-CD > HA-VE > HA-SL > HA-SD. It elucidates that different types and number of hydroxyl groups (phenols, alcohols and carboxyl) are present in HA samples. The intensity of the bands at around 2925, 2868–2850, 1460–1440 and 1400–1380 cm–1 decreases in the order HA-CD > HA-VE > HA-SL > HA-SD. It elucidates that the presence of aliphatic group is more in HA-CD compared to other samples [7, 9, 12]. Similar observation was obtained for the aromatic groups around 1550–1510 and 1260–1200 cm–1 [12, 13].
The pattern of the bands in the 1740–1600 cm–1 is analogous to that found in the infrared spectra of various HA extracted from different types of vermi compost [1, 23, 24], which is characteristic of fresh HA. All spectra show two partially overlapped bands at around 1730 and 1645 cm–1 of moder-ate and strong intensity; these have been assigned to the presence of the functional groups such as O–C=O of ester and carboxylic acids or C=O of ketones, respectively. These functional groups as well as alcoholic and phenolic hydroxyls and carboxylic acids groups are considered as potential sites for binding with metallic species [1, 24].
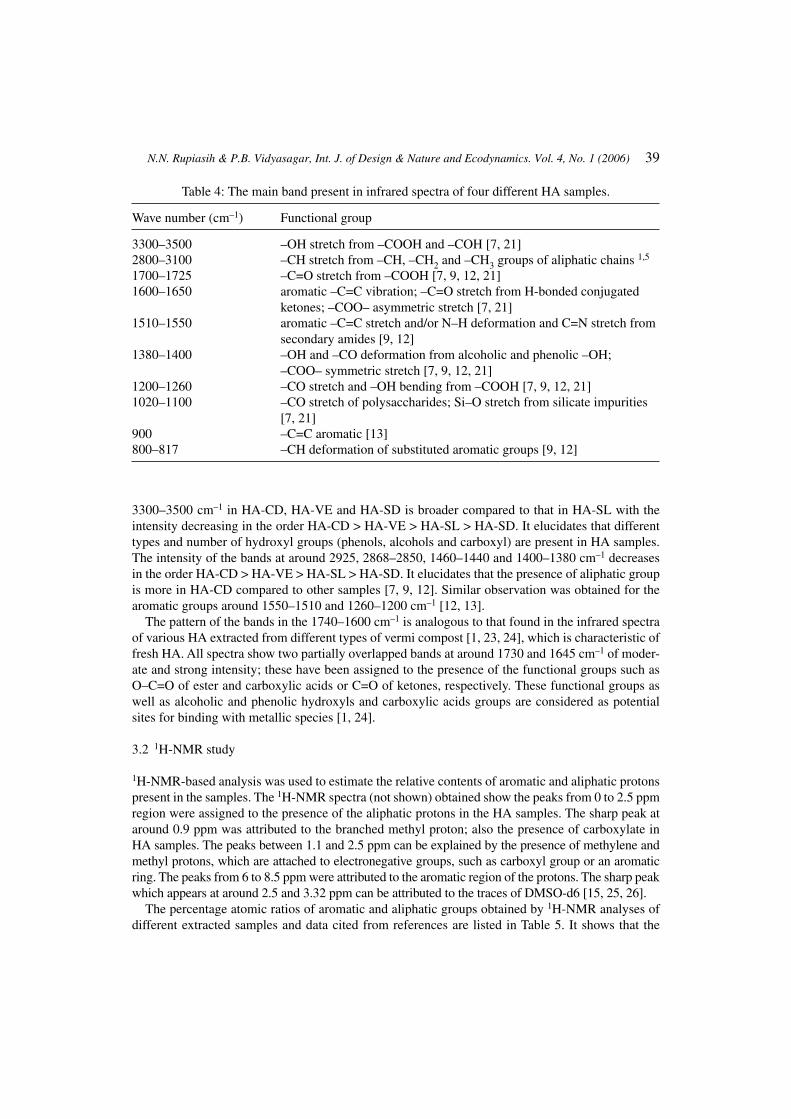
3.2 1H-NMR study
1H-NMR-based analysis was used to estimate the relative contents of aromatic and aliphatic protons present in the samples. The 1H-NMR spectra (not shown) obtained show the peaks from 0 to 2.5 ppm region were assigned to the presence of the aliphatic protons in the HA samples. The sharp peak at around 0.9 ppm was attributed to the branched methyl proton; also the presence of carboxylate in HA samples. The peaks between 1.1 and 2.5 ppm can be explained by the presence of methylene and methyl protons, which are attached to electronegative groups, such as carboxyl group or an aromatic ring. The peaks from 6 to 8.5 ppm were attributed to the aromatic region of the protons. The sharp peak which appears at around 2.5 and 3.32 ppm can be attributed to the traces of DMSO-d6 [15, 25, 26].
The percentage atomic ratios of aromatic and aliphatic groups obtained by 1H-NMR analyses of different extracted samples and data cited from references are listed in Table 5. It shows that the
Table 4: The main band present in infrared spectra of four different HA samples.
Wave number (cm–1) Functional group
3300–3500 –OH stretch from –COOH and –COH [7, 21]2800–3100 –CH stretch from –CH, –CH2 and –CH3 groups of aliphatic chains 1,5
1700–1725 –C=O stretch from –COOH [7, 9, 12, 21]1600–1650 aromatic –C=C vibration; –C=O stretch from H-bonded conjugated
ketones; –COO– asymmetric stretch [7, 21]1510–1550 aromatic –C=C stretch and/or N–H deformation and C=N stretch from
secondary amides [9, 12]1380–1400 –OH and –CO deformation from alcoholic and phenolic –OH;
–COO– symmetric stretch [7, 9, 12, 21]1200–1260 –CO stretch and –OH bending from –COOH [7, 9, 12, 21]1020–1100 –CO stretch of polysaccharides; Si–O stretch from silicate impurities
[7, 21]900 –C=C aromatic [13]800–817 –CH deformation of substituted aromatic groups [9, 12]
40 N.N. Rupiasih & P.B. Vidyasagar, Int. J. of Design & Nature and Ecodynamics. Vol. 4, No. 1 (2006)
values of aromatic and aliphatic group for the samples studied are lower than the reported values (p < 0.05). The percentage content of aromatic groups is low (<6.5%). However, within the sample values for aromatic are more in HA-CD and HA-VE compared to HA-SL and HA-SD. The percent-age content of aliphatic groups was found to be around 16–25%. It is slightly higher in HA-SL and HA-VE as compared to HA-CD and HA-SD.
XRDanalysis3.3
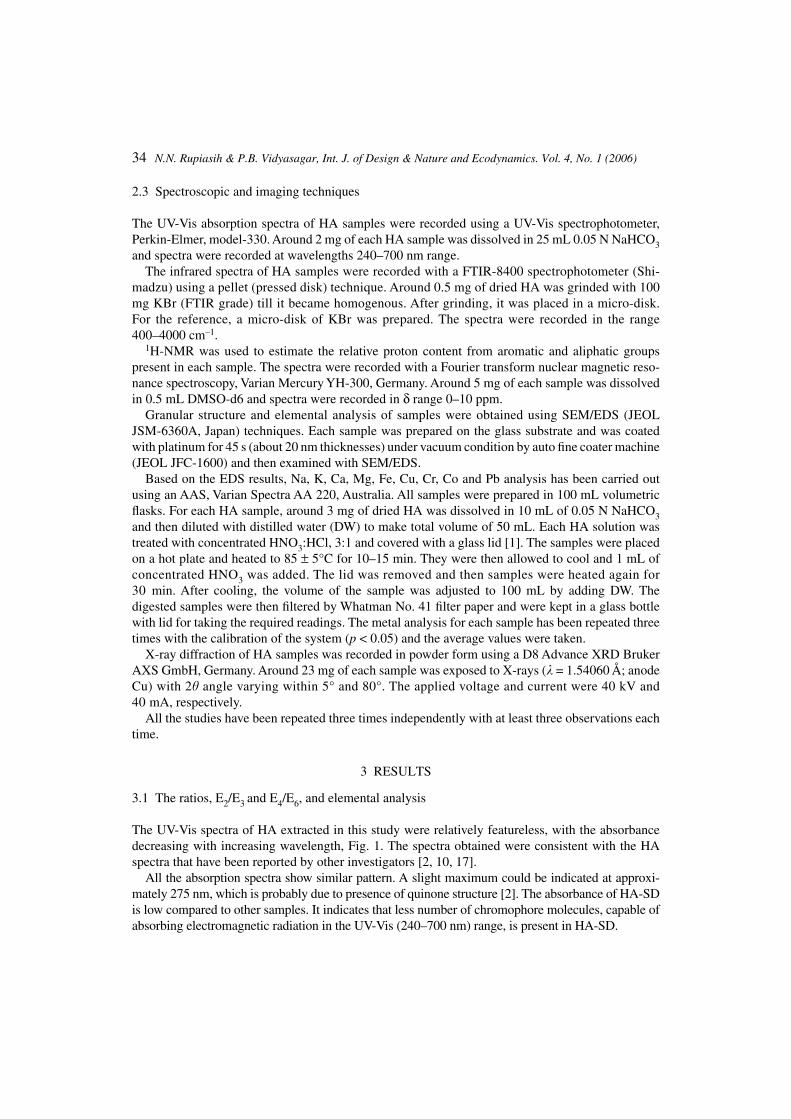
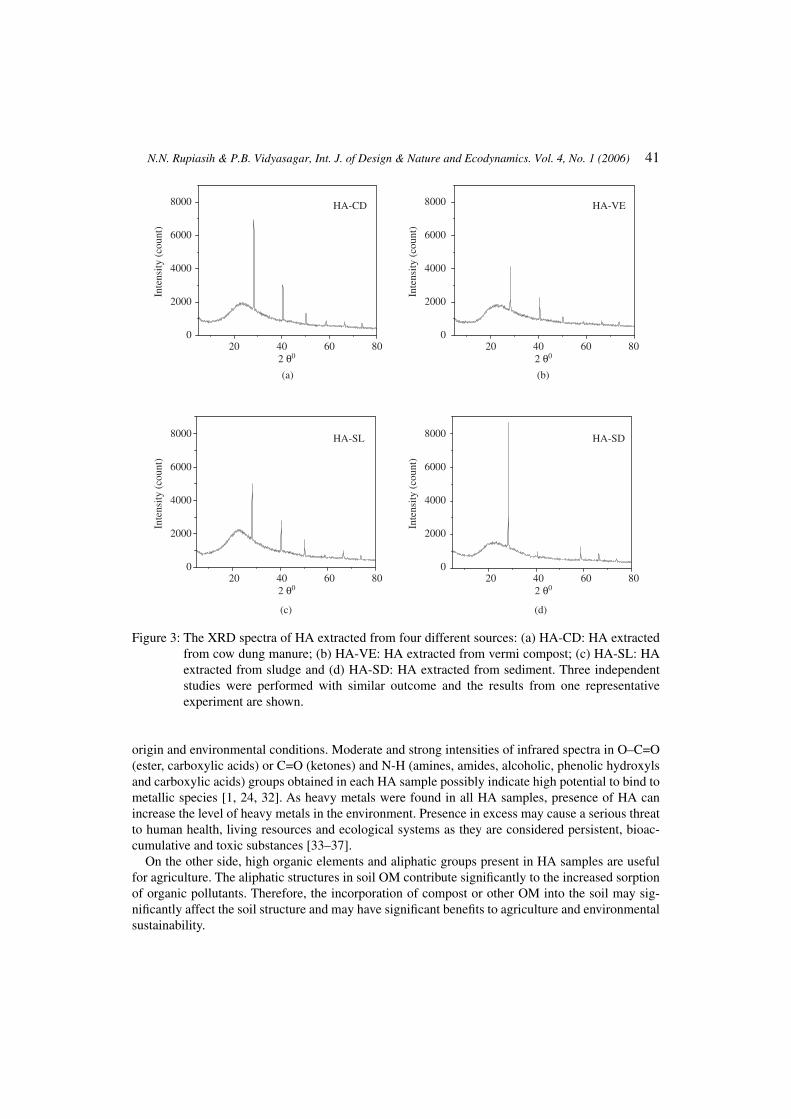
The XRD analysis shows that in all HA samples, a broad peak at around 22.35–22.70° and some sharp peaks which can be attributed to the crystal forms were obtained as shown in Fig. 3a–d. The peaks revealed the presence of crystal forms in the HA samples (Table 6). Na2SiO3.5H2O was iden-tifi ed in all samples; CaAl8Fe4O19 was identifi ed in HA-CD, HA-SL and HA-SD; Al-Si-O-OH-H2O was identifi ed in HA-VE, HA-SL and HA-SD and KAlCO4.H2O was identifi ed in HA-VE and HA-SD. Also different crystal forms are found in each sample as shown in Table 6. Some crystal forms found are similar with the crystal forms of soil, sediment and clay (i.e. quartz, alumino-silicate, kaolinite, hematite and anhydrate) [11, 27–31].
A small variation in the crystal types present in each sample may be due to difference in physico-chemical environment and the concentration of each element present during the time when humifi cation has occurred.
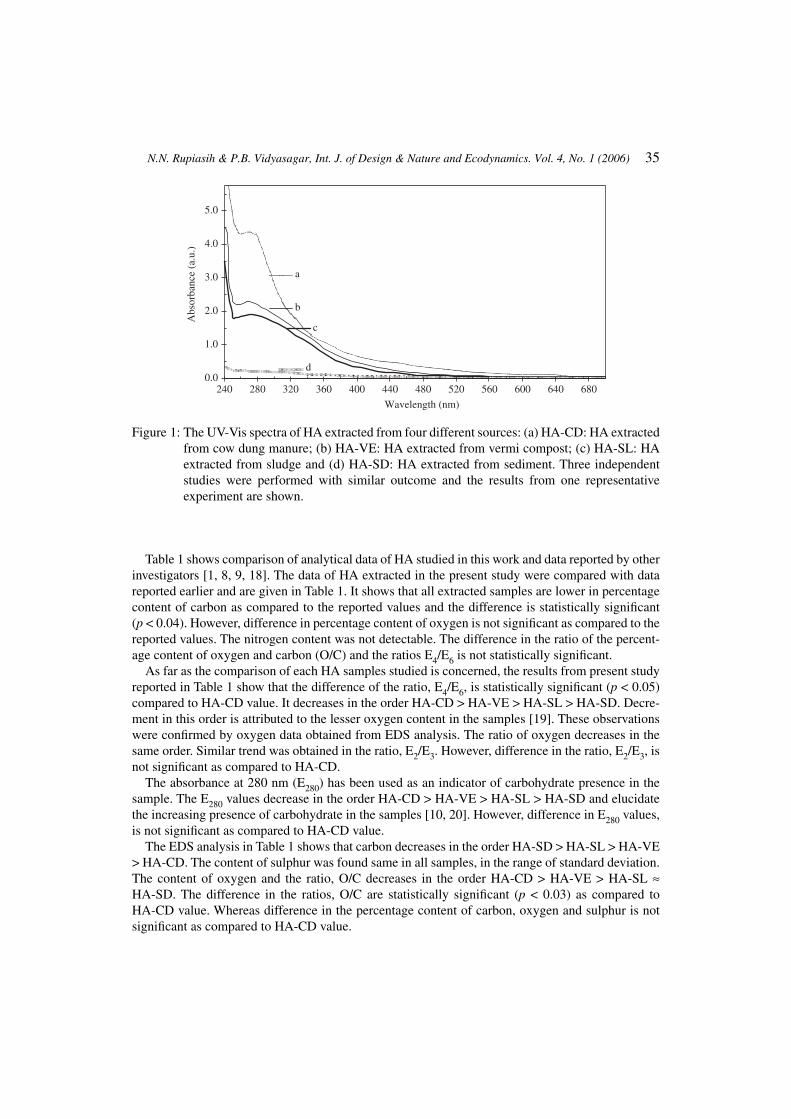
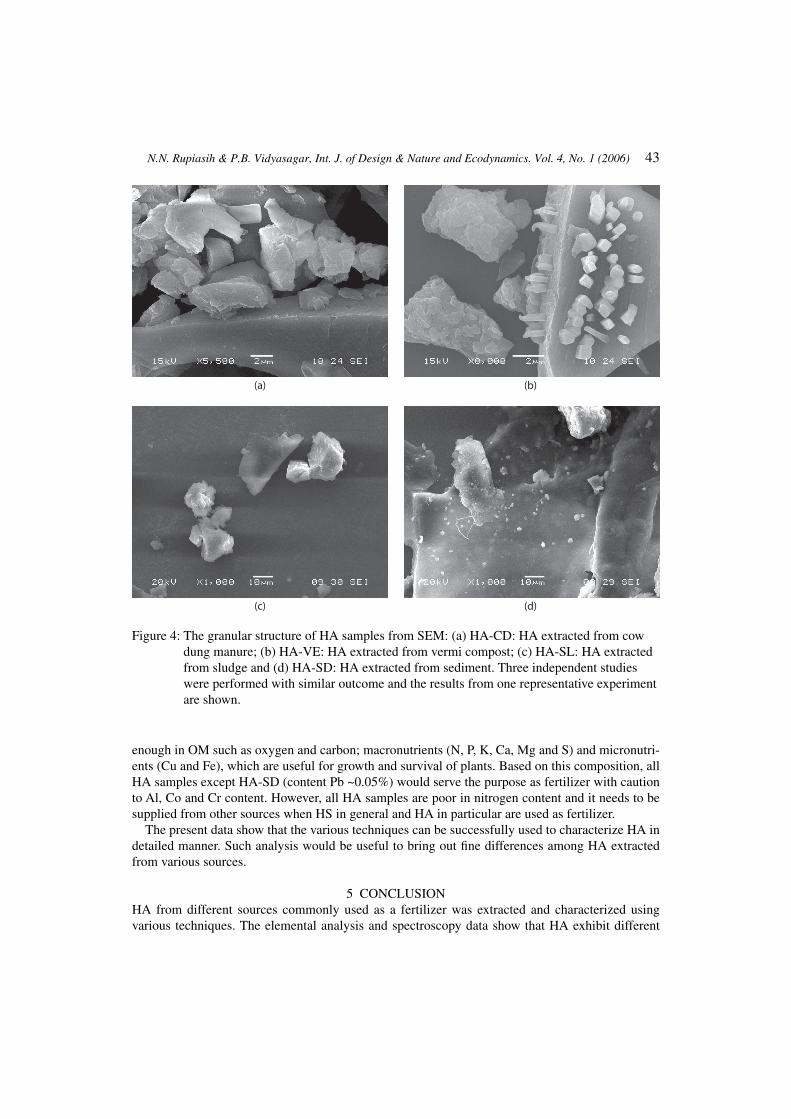
SEM observations3.4
Figure 4 shows the granular structure of various HA that have been extracted from four different sources. In general, they show crystal-like forms aggregate along with various shapes. This result is in agreement with varies crystal forms that have been found in XRD analysis for each sample.
DISCUSSION4 Percentage content of element, UV-Vis absorption spectra, infrared spectra, 1H-NMR analyses, AAS and XRD analysis elucidate that the physical and chemical compositions of HA varies as per the
Table 5: Distribution of hydrogen in different groups for four different samples was determined by 1H-NMR.
Samples Aromatic region Aliphatic region
HA-CD 6.05 ± 0.251 16.40 ± 0.267HA-VE 4.20 ± 0.025 22.80 ± 2.485HA-SL 1.70 ± 0.141 24.96 ± 1.053HA-SD 1.12 ± 0.113 17.55 ± 0.665Dando1 9.90 43.80Aldrich (purifi ed)2 24.80 40.40
Integrated regions were settled as follows: aliphatic region (0.5–2.3 ppm) and aromatic region (6–8.5 ppm).1Dando (soil HA standard of Japan brown forest soil).2Aldrich HA in sodium salt form [15].
N.N. Rupiasih & P.B. Vidyasagar, Int. J. of Design & Nature and Ecodynamics. Vol. 4, No. 1 (2006) 41
origin and environmental conditions. Moderate and strong intensities of infrared spectra in O–C=O (ester, carboxylic acids) or C=O (ketones) and N-H (amines, amides, alcoholic, phenolic hydroxyls and carboxylic acids) groups obtained in each HA sample possibly indicate high potential to bind to metallic species [1, 24, 32]. As heavy metals were found in all HA samples, presence of HA can increase the level of heavy metals in the environment. Presence in excess may cause a serious threat to human health, living resources and ecological systems as they are considered persistent, bioac-cumulative and toxic substances [33–37].
On the other side, high organic elements and aliphatic groups present in HA samples are useful for agriculture. The aliphatic structures in soil OM contribute signifi cantly to the increased sorption of organic pollutants. Therefore, the incorporation of compost or other OM into the soil may sig-nifi cantly affect the soil structure and may have signifi cant benefi ts to agriculture and environmental sustainability.
(c) (d)
(a) (b)
8000
6000
4000
2000
020 40
2 θ0
Inte
nsity
(co
unt)
HA-CD HA-VE
HA-SL HA-SD
60 80
8000
6000
4000
2000
020 40
2 θ0
Inte
nsity
(co
unt)
60 80
8000
6000
4000
2000
020 40
2 θ0
Inte
nsity
(co
unt)
60 80
8000
6000
4000
2000
020 40
2 θ0
Inte
nsity
(co
unt)
60 80
Figure 3: The XRD spectra of HA extracted from four different sources: (a) HA-CD: HA extracted from cow dung manure; (b) HA-VE: HA extracted from vermi compost; (c) HA-SL: HA extracted from sludge and (d) HA-SD: HA extracted from sediment. Three independent studies were performed with similar outcome and the results from one representative experiment are shown.
42 N.N. Rupiasih & P.B. Vidyasagar, Int. J. of Design & Nature and Ecodynamics. Vol. 4, No. 1 (2006)
Many studies have been carried out to see the effect of HA on plant growth in general and its constituents in particular. It has been shown that the HS affect the activity of chlorophyllase [38]. The effect of foliar application of fulvic acid on water use, nutrient uptake and wheat yield has been reported [39]. Increase in stem height, diameter, leaf chlorophyll, size and production in tomato plants has also been studied [40, 41]. The effect of fulvic acid on green bean plants is to increase plant growth and bean weight at harvest [42]. HAs isolated from earthworm compost enhanced root elongation, lateral root emergence, and plasma membrane H+-ATPase activity in maize roots [13]. Polyamines in HA affect radical growth of lettuce seedlings [43]. Anticlastogenic, antitoxic and sorption effects of HS on the mutagen maleic hydrazide are tested in leguminous plants [4]. There-fore, it becomes essential to characterize and evaluate HA when used as fertilizer.
The present work provides a detailed analytical information about the HA obtained from different sources commonly used as fertilizer. This scientifi c data may help to decide the suitability of HS, of which HA is one of the constituent, as fertilizer. Elements such as Al, Co and Pb (found only in HA-SD) are found in HA samples, which are not required by the plant. All HA samples are rich
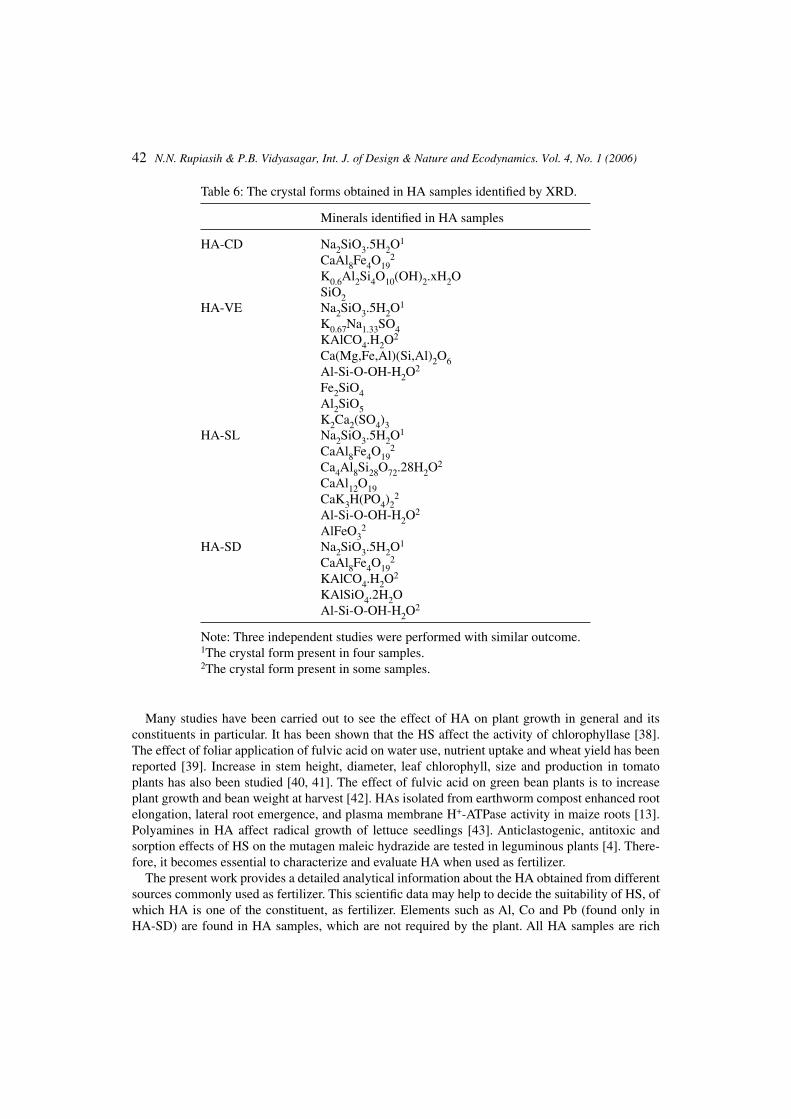
Table 6: The crystal forms obtained in HA samples identifi ed by XRD.
Minerals identifi ed in HA samples
HA-CD Na2SiO3.5H2O1
CaAl8Fe4O192
K0.6Al2Si4O10(OH)2.xH2OSiO2
HA-VE Na2SiO3.5H2O1
K0.67Na1.33SO4KAlCO4.H2O
2
Ca(Mg,Fe,Al)(Si,Al)2O6Al-Si-O-OH-H2O
2
Fe2SiO4Al2SiO5K2Ca2(SO4)3
HA-SL Na2SiO3.5H2O1
CaAl8Fe4O192
Ca4Al8Si28O72.28H2O2
CaAl12O19CaK3H(PO4)2
2
Al-Si-O-OH-H2O2
AlFeO32
HA-SD Na2SiO3.5H2O1
CaAl8Fe4O192
KAlCO4.H2O2
KAlSiO4.2H2OAl-Si-O-OH-H2O
2
Note: Three independent studies were performed with similar outcome.1The crystal form present in four samples.2The crystal form present in some samples.
N.N. Rupiasih & P.B. Vidyasagar, Int. J. of Design & Nature and Ecodynamics. Vol. 4, No. 1 (2006) 43
enough in OM such as oxygen and carbon; macronutrients (N, P, K, Ca, Mg and S) and micronutri-ents (Cu and Fe), which are useful for growth and survival of plants. Based on this composition, all HA samples except HA-SD (content Pb ~0.05%) would serve the purpose as fertilizer with caution to Al, Co and Cr content. However, all HA samples are poor in nitrogen content and it needs to be supplied from other sources when HS in general and HA in particular are used as fertilizer.
The present data show that the various techniques can be successfully used to characterize HA in detailed manner. Such analysis would be useful to bring out fi ne differences among HA extracted from various sources.
CONCLUSION5 HA from different sources commonly used as a fertilizer was extracted and characterized using various techniques. The elemental analysis and spectroscopy data show that HA exhibit different
(a) (b)
(c) (d)
Figure 4: The granular structure of HA samples from SEM: (a) HA-CD: HA extracted from cow dung manure; (b) HA-VE: HA extracted from vermi compost; (c) HA-SL: HA extracted from sludge and (d) HA-SD: HA extracted from sediment. Three independent studies were performed with similar outcome and the results from one representative experiment are shown.
44 N.N. Rupiasih & P.B. Vidyasagar, Int. J. of Design & Nature and Ecodynamics. Vol. 4, No. 1 (2006)
elemental compositions and spectroscopic characteristics. In general, all HA samples analysed are rich in carbon and oxygen and poor in nitrogen. EDS analysis showed the presence of elements such as Na, Ca, K, Mg, Al, S, P, Cu, Fe, Cr, Co and Pb. It was supported by AAS analysis where Na, K, Ca, Mg, Fe, Cu and Co were found in all HA samples in various concentrations. XRD analysis showed some crystal forms found similar to the crystal forms found in soil, sediment and clay. These results elucidate that the chemical composition and the molecular structure of HA samples varies as per the origin and environment where decomposition has occurred. Present study also documented that the spectroscopic and imaging techniques can be successfully used to bring out the fi ner differ-ences among HA extracted from different sources. This analysis showed that out of the four HA samples extracted from different sources except HA-SD can be used as fertilizer with caution to Al, Co and Cr content. The used methods can be adopted to fi nd out the suitability of sources as fertilizer and for further larger environmental studies.
ACKNOWLEDGEMENTSMs Ni Nyoman Rupiasih is grateful to Government of India for the ICCR funding, Department of Physics, University of Pune, and Department of Science and Technology, Government of India, for providing the facilities.
REFERENCESMangrich, A.S., Lobo, M.A., Tanck., C.B., Wypych, F., Toledo, E.B.S. & Guimaraes, E., [3] Criterious preparation and characterization of earthworm-composts in view of animal waste recycling. Part I. correlation between chemical, thermal and FTIR spectroscopic analyses of four humic acids from Earthworm-composted animal manure. J. Braz. Chem. Soc, 11(2), pp. 164–169, 2000.Andelkovic, T., Andelkovic, D., Perovic, J., Purenovic, M. & Polic, P., Decrease of oxygen [4] interference on humic acid structure alteration during isolation. Facta Universitatis, series: Physics, Chemistry and Technology, 2(3), pp. 163–171, 2001.Russo, R.O. & Berlyn, G.P., The use of organic biostimulants to help low input sustainable [5] agriculture. Journal of Sustainable Agriculture, 1(2), pp. 19–42, 1990.Ferrara, G., Loffredo, E. & Senesi, N., Anticlastogenic, antitoxic and sorption effects of humic [6] substances on the mutagen maleic hydrazide tested in leguminous plants. European Journal of Soil Science, 55, pp. 449–458, 2004.Meinelt, T., Schreckenbach, K., Knopf, K., Wienke, A., Stüber, A. & Steinberg, C.E.W., [7] Humic substances affect physiological condition and sex ratio of swordtail (Xiphophorus hel-leri Heckel). Aquat. Sci, 66, pp. 239–245, 2004.Schnitzer, M., Humic substances: chemistry and reactions. [8] Soil Organic Matter, eds M. Schnitzer & S.U. Khan, Elsevier: Amsterdam, pp. 1–64, 1978.MacCarthy, P. & Rice, J.A., Spectroscopic methods (other than NMR) for determining func- [9] tionality in humic substances. Humic Substances in Soil, Sediment, and Water: Geochemis-try, Isolation, and Characterization, eds G.R. Aiken, D.M. McKnight, R.L. Wershaw & P. Maccarthy, John Wiley & Sons: New York, pp. 527–559, 1985.Davis, W.M., Erickson, C.L., Johnston, C.T., Delfi no, J.J. & Porter, J.E., Quantitative Fourier [10] transform infrared spectroscopic investigation of humic substance functional group composi-tion. Chemosphere, 38(12), pp. 2913–2928, 1999.Ouatmane, A., Dorazio, V., Hafi di, M., Revel, J.C. & Senesi, N., Elemental and spectroscopic [11] characterization of humic acids fractionated by gel permeation chromatography. Agronomie, 20, pp. 491–504, 2000.
N.N. Rupiasih & P.B. Vidyasagar, Int. J. of Design & Nature and Ecodynamics. Vol. 4, No. 1 (2006) 45
Mendonca, A., Duarte, A.C. & Santos, E.B.H., Spectroscopic properties of sedimentary [12] humic acids from a salt marsh (Ria de Aveiro, Portugal): comparison of sediments colonized by Halimione portulacoides (L.) Aellen and non-vegetated sediments. Biogeochemistry, 69, pp. 159–174, 2004.Guest, C.A., Johnston, C.T., King, J.J., Alleman, J.E., Tishmack,J.K. & Norton, L.D., Chemi-[13] cal characterization of synthetic soil from composting coal combustion and pharmaceutical by-products. J. Environ. Qual., 30, pp. 246–253, 2001.Baddi, G.A., Hafi di, M., Gilard, V. & Revel, J.C., Characterization of humic acids produced [14] during composting of olive mill waste: elemental and spectroscopic analyses (FTIR and 13C-NMR). Agronomie, 23, pp. 661–666, 2003.Canellas, L.P, Velloso, A.C.X., Rumjanek, V.M., Guridi, F., Olivares, F.L. & Raimundo [15] Braz-Filho, S.Y., Distribution of the humifi ed fractions and characteristics of the humic acids of an ultisol under cultivation of eucalyptus and sugar cane. Terra, 20(4), pp. 371–381, 2002.McDonnell, R., Holden, N.M., Ward, S.M., Collins, J.F., Farrell, E.P. & Hayes, M.H.B., Char-[16] acteristics of humic substances in heathland and forested peat soils of the Wicklow Mountains. Biology and Environment: Proceedings of the Royal Irish Academy, 101B(3), pp. 187–197, 2001.Yamauchi, N., Toyodome, W., Umeda, K., Nishida, N. & Murae, T., Structural features of humic [17] acid of the coastal sediment in Ariake Sea Tidelands: use of humic acid as an environmental indi-cator for river basin and coastal regions. Analytical Sciences, 20, pp. 1453–1457, 2004.Rocha J.C., Sargentini Jr, E., Toscano, I.A.S., Rosa, A.H. & Burba, P., Multi-method study on [18] aquatic humic substances from the ‘Rio Negro’-Amazonas State/Brazil. Emphasis on molecular-size classifi cation on their metal contents. J. Braz. Chem. Soc., 10(3), pp. 169–175, 1999.Uyguner, C.S. & Bekbolet, M., Evaluation of humic acid photocatalitic degradation by UV-vis [19] and fl uorescence spectroscopy. Catalysis Today, 101, pp. 267–274, 2005.Naidja, A., Huang, P.M., Anderson, D.W., C. & Kessel, V., Fourier transform infrared, [20] UV-visible, and X-ray diffraction analyses of organic matter in humin, humic acid, and fulvic acid fractions in soil exposed to elevated CO2 and N fertilization. Applied Spectroscopy, 56(3), pp. 318–327, 2002.Chen Y., Senesi N. & Schnitzer M. Information provided on humic substances by E[21] 4/E6 ratios. Soil Sci. Soc. Am. J., 41, pp. 352–358, 1977.Sierra Giovanela, M., Parlanti, E., Esteves, V.I., Duarte, A.C., Fransozo, A. & Soriano-Sierra, E.J., [22] Structural description of humic substances from subtropical coastal environments using elemen-tal analysis, FT-IR and 13C-solid state NMR data. M.M.D. Journal of Coastal Research, 42, pp. 219–231, 2004.Stevenson, F.J., [23] Humus Chemistry Genesis, Composition, Reactions, J. Wiley & Sons: NY, 1982.Skoog, D.A., [24] Principles of Instrumental Analysis, Saunders College Publishing: USA, pp. 344–347, 1985.Heymann, K., Mashayekhi, H. & Xing, B., Spectroscopy analysis of sequentially extracted [25] Humic Acid from compost. Spectroscopy Letters, 38, pp. 293–302, 2005.Pereira, M.G. & Arruda, M.A.Z., Vermi compost as a natural adsorbent material: characteriza-[26] tion and potentialities for cadmium adsorption. J. Braz. Chem. Soc., 14(1), pp. 39–47, 2003.Silverstein, R.M. & Webster, F.X., [27] Spectrometric Identifi cation of Organic Compounds, John Wiley & Sons: Canada, 2004.Hertkorn, N., Permin, A., Perminova, I., et al., Comparative analysis of partial structures of a [28] peat humic and fulvic acid using one- and two-dimensional nuclear magnetic resonance spec-troscopy. J. Environ. Qual., 31, pp. 375–387, 2002.
46 N.N. Rupiasih & P.B. Vidyasagar, Int. J. of Design & Nature and Ecodynamics. Vol. 4, No. 1 (2006)
Lima, H.N., Schaefer, C.E.R., Mello, J.W.V., Gilkes, R.J. & Ker, J.C., Pedogenesis and pre-[29] Colombian land use of ‘Terra Preta Anthrosols’ (‘Indian black earth’) of Western Amazonia. Geoderma, 110, pp. 1–17, 2002.Flogeac, K., Guillon, E., Aplincourt, M., Marceau, E., Stievano, L., Beaunier, P. & Frapart, Y.M., [30] Characterization of soil particles by X-ray diffraction (XRD), X-ray photoelectron spectros-copy (XPS), electron paramagnetic resonance (EPR) and transmission electron microscopy (TEM). Agron. Sustain. Dev., 25, pp. 345–353, 2005.Arroyo, L.J., Li, H., Teppen, B.J., Johnston, C.T. & Boyd, S.A., Hydrolysis of carbaryl by car-[31] bonate impurities in reference clay SWy-2. J. Agric. Food Chem., 52, pp. 8066–8073, 2004.Laird, D.A., Martens, D.A. & Kingery, W.L., Nature of clay-humic complexes in an agricul-[32] tural soil: I. Chemical, biochemical, and spectroscopic analyses. Soil Sci. Soc. Am. J., 65, pp. 1413–1418, 2001.Rooklidge, S.J., Ketchum Jr, L.H. & Burns, P.C., Clay removal in basaltic and limestone hori-[33] zontal roughing fi lters. Advances in Environmental Research, 7, pp. 231–237, 2002.Pandey, A.K., Pandey, S.D., & Misra, V., Stability constants of metal-humic acid complexes [34] and its role in environmental detoxifi cation. Ecotoxicology and Environmental Safety, 47(2), pp. 195–200, 2000.Ho, K.-J., Liu, T.-K., Huang, T.-S. & Lu, F.-J., Humic acid mediates iron release from ferritin [35] and promotes lipid peroxidation in vitro: a possible mechanism for humic acid-induced cyto-toxicity. Arch. Toxicol., 77, pp. 100–109, 2003.Cheng, M.-L., Ho, H.-Y., Huang, Y.-W., Lu, F.-J. & Tsun-Yee Chiu, D., Humic acid induces [36] oxidative DNA damage, growth retardation, and apoptosis in human primary fi broblasts. The Society for Exp. Biol. Med., 228, pp. 413–423, 2003.Cookesy, R.C., Gaitan, E., Lindsay, R.J., Hill, J.R. & Keely, K., Humic substances, a possible [37] source of environmental goitrogens. Org. Geochem., 8, pp. 77–80, 1985.Lu, F.J. & Liu, T.M., Fluorescent compounds in drinking water of Blackfoot disease endemic [38] areas: animal experimental model. J. Formos Med. Assoc., 85, pp. 352–358, 1986.Lu, F.J., Fluorescent humic substances and blackfoot disease in Taiwan. [39] Appl. Organometal Chem, 4, pp. 191–195, 1990.Yang, C.-M., Wang, M.-C., Lu, Y.-F., Chang, I.-F. & Chou, C.-H., Humic substances affect the [40] activity of chlorophyllase. Journal of Chemical Ecology, 30(5), pp. 1057–1065, 2004.Xudan, X., The effect of foliar application of fulvic acid on water use, nutrient uptake and [41] wheat yield. Aust. J. Agric. Res., 37, pp. 343–350, 1986.Sladky, Z., The effect of extracted humus substances on growth of tomato plants. [42] Biol. Plant, 1, pp. 142–150, 1959.Bohme, M., Effects of lactate, humate, and Bacillus subtilis on the growth of tomato plants in [43] hydroponic systems. International Symposium on Growing Media and Hydroponics, 1999.Pouneva, I., Effect of humic substances on the growth of microalgal cultures. [44] Russian Journal of Plant Physiology, 52(3), pp. 410–413, 2005.Young, C.C. & Chen, L.F., Polyamines in humic acid and their effect on radical growth of let-[45] tuce seedlings. Plant and Soil, 195, pp. 143–149, 1997.