peat characterization and uptake of ni and co in a saprist peat column
TRANSCRIPT
369
Peat Characterization and Uptake of Nickel (II) and Cobalt (II) in a SapristPeat Column
E.S. Asapo1,2* and C.A. Coles1 (1) Faculty of Engineering and Applied Science, Memorial University of
Newfoundland, St. John’s, Newfoundland A1B-3X5, Canada. (2) Department of Chemical and Polymer Engineering,
Faculty of Engineering, Lagos State University, Epe Campus, P.M.B 1081, Lagos State, Nigeria.
(Received 18 January 2012; revised form accepted 18 June 2012)
ABSTRACT: In this study, fibrist and saprist sphagnum peat soils taken from abog in Torbay, Newfoundland (Canada) were characterized. The saprist andfibrist peat soils had wet bulk densities of 0.65 and 0.60 g/cm3, respectively, andcation-exchange capacities of 70 and 45 meq/100 g, respectively. The pH of bothpeat soils was 4.2 and the soils were amorphous for the most part; however, thefibrist peat was more porous than the saprist peat. Results of Fourier transforminfrared spectroscopy and 13carbon nuclear magnetic resonance suggested thepresence of carboxylic acid, alcoholic hydroxyl, phenolic hydroxyl, amine andamide functional groups in both peats. The less reported amine and amide groupsmay have been observed because non-destructive characterization techniqueswere employed. The saprist peat was studied as an Ni2+ and Co2+ adsorbent in avertical downflow fixed-bed column and at the end of each column experiment,metal ions in the upper layer of the peat were desorbed with HCl. The metalsorption capacity of the saprist peat increased with decreasing flow rate andoverall the sorption capacity of Ni2+ was two times greater than the sorptioncapacity of Co2+. Ni2+ may have been retained by a combination of ion exchangeand complexation, while Co2+ may have been retained only by complexation.
1. INTRODUCTION
The treatment of wastewaters containing toxic metals continues to be a persistent environmentalproblem and none of the methods employed thus far has provided the much needed lasting solution.Elevated concentrations of Ni2+ and Co2+ as well as their complexes are toxic and possible humancarcinogens (IARC 1990). Therefore, efficient removal of such compounds during metal refiningis desirable, especially because of the lack of an effluent limit for Co2+ discharge.
Horticultural or fibrist peat soils have emerged as strong adsorbents for heavy metals [e.g., Pb,Cu and Ni (Ho et al. 2000; Ho et al. 2002), Pb, Cu, Zn, Ni and Cd (Ringqvist et al. 2002), Cu andNi (Gupta et al. 2009), Pb, Ni and Co (Bulgarlu et al. 2011)] and peat is one of the least expensiveadsorbents [Babel and Kurniawan 2003; USGS 2006a, b, c]. It is easily harvested but the metalretention chemistry, which has limited large-scale application, has so far remained unclear. Peat iscommonly found in the northern hemisphere but large deposits have been reported in Brazil,Indonesia and South Africa (Twardowska et al. 1999).
Compared with the fibrist peat, the highly humified or saprist peat has hardly been studied as ametal adsorbent and previous studies have emphasized the extracted humic and fulvic acidfractions (Niemeyer et al. 1992; Baran 2002; Li et al. 2004; Gondar et al. 2005; Fong and
*Author to whom all correspondence should be addressed. E-mail: [email protected].
Mohamed 2007), which requires breaking down the original material and altering the functionalgroups, although studying peat with minimal break down of the original material is more realistic(Burba et al. 2001). Therefore, the main objectives of this study included focusing on non-destructive techniques to characterize fibrist and saprist peats obtained from the same bog innearly their natural state, and using the saprist peat as an Ni2+ and Co2+ adsorbent in a verticaldownflow column to better understand the metal retention mechanisms.
Column experiments are excellent options to study the removal of metallic impurities fromwastewater (Naumova et al. 1995) and are explored in large-scale treatment techniques as well asin the evaluation of adsorbent potentials. The commonly used continuous downflow method iseasy to operate and adsorbs contaminants in a single step while the solution flows through thecolumn bed (Zhou et al. 2004). Over time, the equilibrium adsorption zone moves down thecolumn and the concentration of the effluent contaminant increases. In geo-environmentalengineering the adsorption breakthrough point is considered to occur when 50% of the influentconcentration is detected in the effluent (Yong et al. 1992), because at that point the adsorbent isusually completely saturated and there is steady flow (Schackelford 1993).
Breakthrough curves describe the increasing exhaustion of the adsorbent bed (Cooney 1999)and the rate of adsorbent exhaustion can be represented by the ratio of the outlet to inletcontaminant concentrations, plotted on the y axis, against time on the x axis. The modified beddepth service time (BDST) model (Sharma and Forster 1995; Sze et al. 2008), which wasoriginally developed by Bohart and Adams (1920) and assumes that the rate of sorption isproportional to the sorption capacity remaining at any time (known as the surface reaction theory),was used in this study.
2. MATERIALS AND METHODS
The peat soils were obtained through the Traverse Nursery from a natural peat bog in Torbay,Newfoundland (NL), Canada. They were harvested at depths of 0.4 m (fibrist) and 1.6 m (saprist)and transported to the laboratory in flexi-bags. Portions of the peat soils were weighed and spreadon a plastic tray to air dry at room temperature (23 °C), which removed about 70% of the moisture.Pebbles and woody materials were removed and the peats were homogenized by manual mixing.The physico-chemical properties that could influence metal adsorption of the peat soils weredetermined by standard methods (Table 1) and the grain size of the air-dried peats was determinedby sieving triplicate samples over a series of mechanically stacked sieves (Table 2).
To determine the initial metallic contents, the air-dried homogenized peat soils were crushed ina mortar, acidified with HF and 8 N HNO3 and left on a hot plate for several days until completelydigested (releasing all organic components). Then 6 N HCl and 8 N HNO3 were added to dissolvethe samples (and release inorganic components). Finally, 8 N HNO3 was added and diluted withnanopure water according to the rock dissolution procedure in the Earth Science Department atMemorial University of Newfoundland (MUN) (modified EPA 3052 method). The samples wereanalyzed using inductively coupled plasma mass spectrometry (ICP-MS), specifically the ELANDRC-II (Earth Sciences Department, MUN).
During peat characterization each of the 12 size fractions for the two peat types shown in Table 2was analyzed separately by X-ray diffraction (XRD), scanning electron microscopy (SEM) andFourier transform infrared (FT-IR) spectroscopy. Mineral content in the fractions was obtained byXRD and the samples were packed on a vertically placed stud of the Rigaku Rotaflex D/Max
370 E.S. Asapo et al./Adsorption Science & Technology Vol. 30 No. 5 2012
1400. This equipment has a rotating anode-powdered X-ray diffractometer with Cu-Kα radiationsource (Rigaku/MSC, Japan) operated at 40 kV and 100 mA equipped with an X-ray stream 2000low temperature system (Earth Sciences Department, MUN). The diffractograms obtained werematched using the JADE data software.
Peat pore orientation and surface morphology micrographs were obtained by SEM using an HitachiS-570 microscope. In order to prepare the soil samples, each fraction from the dry granulometry wasspread over a carbon-taped stud and coated with 550X gold sputter coater operated at 20 mA in avacuum of 0.2 mbar for 2.5 min, resulting in a 15-nm thick coating on the peat.
Functional groups in the two peat soils were identified using (i) a Bruker TENSOR 27 FT-IRspectroscope equipped with a MIRacle ATR accessory coated with crystallized ZnSe with anabsorbance range of 4000–650 cm–1 and (ii) a solid-state 13C nuclear magnetic resonance (NMR)Bruker Avance II 600 spectrometer equipped with an SB Bruker 3.2-mm MAS triple-tuned probeoperating at 600.33 MHz for 1 h and 150.97 MHz for 13C (obtained from Department ofChemistry, MUN). The 13C NMR analysis was conducted on only one peat sample ≤ 425 µm in
Peat Characterization and Uptake of Nickel (II) and Cobalt (II) in a Saprist Peat Column 371
TABLE 1. Physico-Chemical Parameters of the Highly and Poorly Humified Peat Soils
Parameter Method used Values
Saprist peat Fibrist peat
Degree of decomposition von Posta 8H 3HpH (in de-ionized water) ASTM D2976-71 (2004) 4.2 4.2Moisture content (%) ASTM D2974-71 (2008) 86 82Fibre content (%) ASTM D1997-91 (2008) 68.8 75Ash content (%) ASTM D2974-71 (2008) 9 16Organic matter (%) ASTM D2974-71 (2008) 91 84Fresh bulk density ASTM D4531-86 (2008) 0.65 0.60
(wet, g/cm3 )Dry bulk density (g/cm3) ASTM D4531-86 (2008) 0.28 0.21CEC at 7.0 pH (meq/100 g) Calcium acetate/chlorideb 70 45
avon Post scale (Bozkhurt et al. 2001).bCalcium acetate/chloride method from Sheldrick (1984).Abbreviation: CEC, cation-exchange chromatography.
TABLE 2. Dry Granulometry Results for the Two Peat Types
Sieve No. Sieve size (µm) Average % retained by weight
7H–8Ha 3Hb
4 4750 13 158 2000 – 1920 850 52 –40 425 15 4550 300 5 –60 250 – 9100 150 6 4200 75 3 6
aSaprist peat.bFibrist peat.
size of the two peats. With the 13C NMR, chemical shifts were referenced to tetramethylsilaneusing adamantane as an intermediate standard for 13C and samples were spun at 20 kHz. Cross-polarization spectra were collected with a Hartmann–Hahn match at 62.5 and 100 kHz with adecoupling time of 1 h. The recycle delay was 2 s and the contact time was 2000 ms.
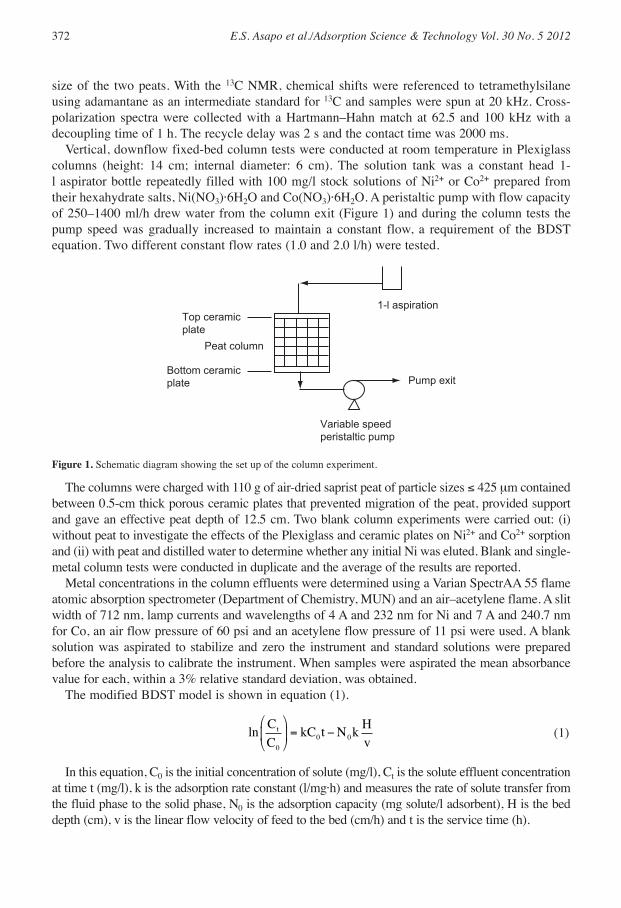
Vertical, downflow fixed-bed column tests were conducted at room temperature in Plexiglasscolumns (height: 14 cm; internal diameter: 6 cm). The solution tank was a constant head 1-l aspirator bottle repeatedly filled with 100 mg/l stock solutions of Ni2+ or Co2+ prepared fromtheir hexahydrate salts, Ni(NO3)·6H2O and Co(NO3)·6H2O. A peristaltic pump with flow capacityof 250–1400 ml/h drew water from the column exit (Figure 1) and during the column tests thepump speed was gradually increased to maintain a constant flow, a requirement of the BDSTequation. Two different constant flow rates (1.0 and 2.0 l/h) were tested.
372 E.S. Asapo et al./Adsorption Science & Technology Vol. 30 No. 5 2012
Top ceramicplate
Peat column
Bottom ceramicplate
Variable speedperistaltic pump
Pump exit
1-l aspiration
Figure 1. Schematic diagram showing the set up of the column experiment.
The columns were charged with 110 g of air-dried saprist peat of particle sizes ≤ 425 µm containedbetween 0.5-cm thick porous ceramic plates that prevented migration of the peat, provided supportand gave an effective peat depth of 12.5 cm. Two blank column experiments were carried out: (i)without peat to investigate the effects of the Plexiglass and ceramic plates on Ni2+ and Co2+ sorptionand (ii) with peat and distilled water to determine whether any initial Ni was eluted. Blank and single-metal column tests were conducted in duplicate and the average of the results are reported.
Metal concentrations in the column effluents were determined using a Varian SpectrAA 55 flameatomic absorption spectrometer (Department of Chemistry, MUN) and an air–acetylene flame. A slitwidth of 712 nm, lamp currents and wavelengths of 4 A and 232 nm for Ni and 7 A and 240.7 nmfor Co, an air flow pressure of 60 psi and an acetylene flow pressure of 11 psi were used. A blanksolution was aspirated to stabilize and zero the instrument and standard solutions were preparedbefore the analysis to calibrate the instrument. When samples were aspirated the mean absorbancevalue for each, within a 3% relative standard deviation, was obtained.
The modified BDST model is shown in equation (1).
(1)
In this equation, C0 is the initial concentration of solute (mg/l), Ct is the solute effluent concentrationat time t (mg/l), k is the adsorption rate constant (l/mg·h) and measures the rate of solute transfer fromthe fluid phase to the solid phase, N0 is the adsorption capacity (mg solute/l adsorbent), H is the beddepth (cm), v is the linear flow velocity of feed to the bed (cm/h) and t is the service time (h).
= −ln
C
CkC t N k
H
vt
0
0 0
The bed volume (BV in l) or volume of metal solution consumed at breakthrough and the bed time(BT in h) or time until breakthrough were also obtained from the column tests. In addition, theadsorbent exhaustion rate (AER), which is defined as the mass of adsorbent (g) per BV (l), for the twoflow rates and for Ni2+ and Co2+ were determined.
After breakthroughs, samples were taken from the top of the columns and analyzed by ICP-MS todetermine the quantities of metals sorbed. About 100 ml of water at approximately 85 °C was added tothe samples. In addition, 0.1 and 1.0 M HCl concentrations were added to the samples (40 ml to 1.6 g),agitated for 2 h on a 5900 Eberbach reciprocal shaker and filtered using quantitative filter paper with45-µm openings (Anachemia Chemicals, Canada). The filtrates were analyzed using flame atomicabsorption spectrometry to determine the amounts of metals desorbed.
3. RESULTS AND DISCUSSION
3.1. Peat Characterization and Physico-Chemical Properties
Determination of the physico-chemical properties (Table 2) showed that both peat types wereacidic, had high fibre contents and high moisture-holding capacities. The saprist peat had a greatercation-exchange capacity and its smaller ash content might be attributed to its zone of formationwithin the bog (Spedding 1988) and its greater degree of decomposition (Malterer et al. 1992).The more decomposed the peat is, the greater the proportion of fulvic acid and hydroxyl groupscompared with humic acid and carboxyl groups (Kalmykova et al. 2008).
Particle-size distributions (Table 3) showed that the saprist peat was more dominated byfractions with smaller particle sizes. Fractions > 850 µm were mostly fibre or unidentifiabledecomposing materials while fractions > 2 mm were usually woody undecomposed materialspresent only in the fibrist peat. The elements detected (Table 3) suggest that both peat soils had anatural metal affinity and calcium and iron were the predominant metals.
Peat Characterization and Uptake of Nickel (II) and Cobalt (II) in a Saprist Peat Column 373
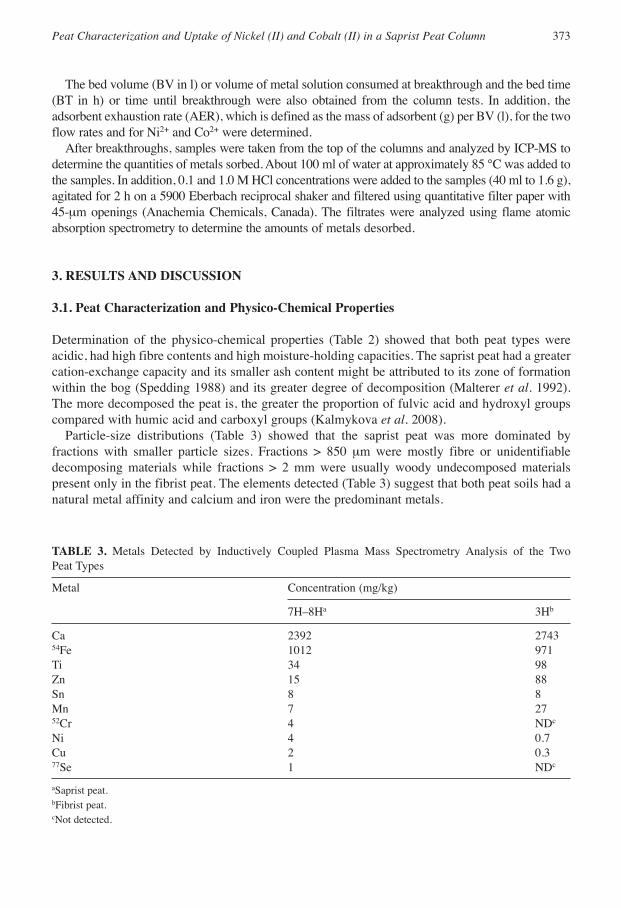
TABLE 3. Metals Detected by Inductively Coupled Plasma Mass Spectrometry Analysis of the Two Peat Types
Metal Concentration (mg/kg)
7H–8Ha 3Hb
Ca 2392 274354Fe 1012 971Ti 34 98Zn 15 88Sn 8 8Mn 7 2752Cr 4 NDc
Ni 4 0.7Cu 2 0.377Se 1 NDc
aSaprist peat.bFibrist peat.cNot detected.
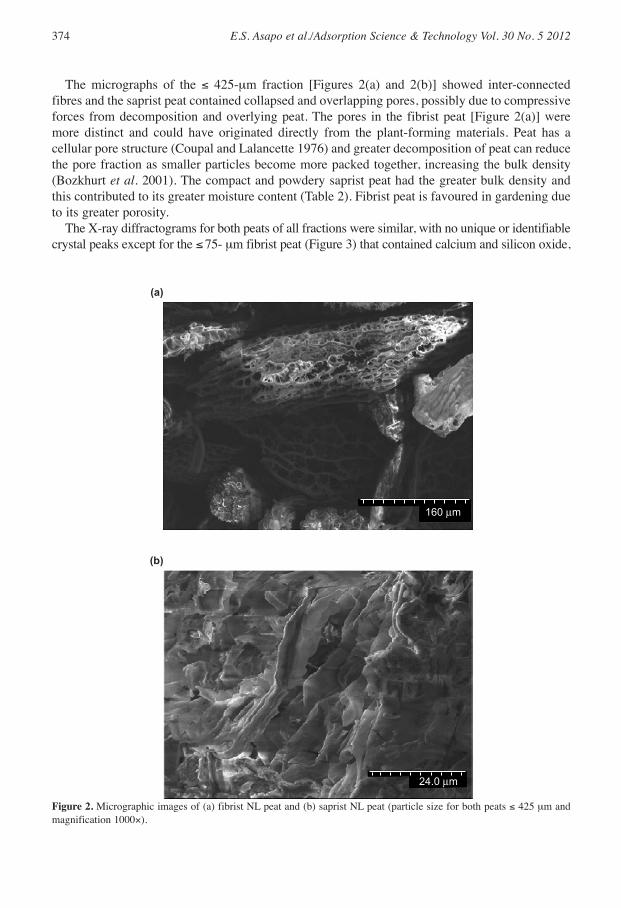
The micrographs of the ≤ 425-µm fraction [Figures 2(a) and 2(b)] showed inter-connectedfibres and the saprist peat contained collapsed and overlapping pores, possibly due to compressiveforces from decomposition and overlying peat. The pores in the fibrist peat [Figure 2(a)] weremore distinct and could have originated directly from the plant-forming materials. Peat has acellular pore structure (Coupal and Lalancette 1976) and greater decomposition of peat can reducethe pore fraction as smaller particles become more packed together, increasing the bulk density(Bozkhurt et al. 2001). The compact and powdery saprist peat had the greater bulk density andthis contributed to its greater moisture content (Table 2). Fibrist peat is favoured in gardening dueto its greater porosity.
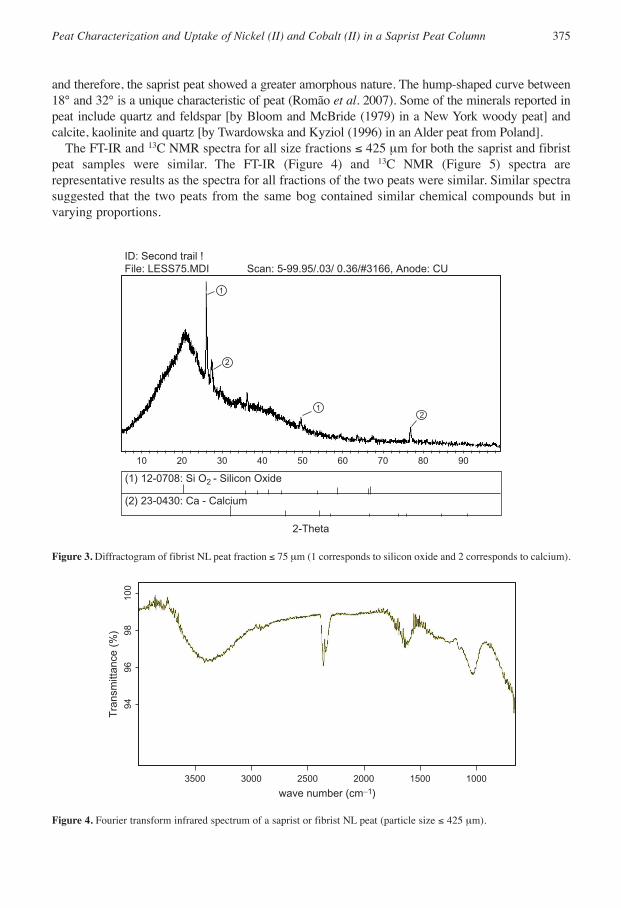
The X-ray diffractograms for both peats of all fractions were similar, with no unique or identifiablecrystal peaks except for the ≤75- µm fibrist peat (Figure 3) that contained calcium and silicon oxide,
374 E.S. Asapo et al./Adsorption Science & Technology Vol. 30 No. 5 2012
160 µm
(a)
(b)
24.0 µm
Figure 2. Micrographic images of (a) fibrist NL peat and (b) saprist NL peat (particle size for both peats ≤ 425 µm andmagnification 1000×).
Peat Characterization and Uptake of Nickel (II) and Cobalt (II) in a Saprist Peat Column 375
and therefore, the saprist peat showed a greater amorphous nature. The hump-shaped curve between18° and 32° is a unique characteristic of peat (Romão et al. 2007). Some of the minerals reported inpeat include quartz and feldspar [by Bloom and McBride (1979) in a New York woody peat] andcalcite, kaolinite and quartz [by Twardowska and Kyziol (1996) in an Alder peat from Poland].
The FT-IR and 13C NMR spectra for all size fractions ≤ 425 µm for both the saprist and fibristpeat samples were similar. The FT-IR (Figure 4) and 13C NMR (Figure 5) spectra arerepresentative results as the spectra for all fractions of the two peats were similar. Similar spectrasuggested that the two peats from the same bog contained similar chemical compounds but invarying proportions.
1
2
21
10 20 30 40 50 60 70 80 90
(1) 12-0708: Si O2 - Silicon Oxide
2-Theta
ID: Second trail !File: LESS75.MDI Scan: 5-99.95/.03/ 0.36/#3166, Anode: CU
(2) 23-0430: Ca - Calcium
Figure 3. Diffractogram of fibrist NL peat fraction ≤ 75 µm (1 corresponds to silicon oxide and 2 corresponds to calcium).
3500 3000 2500 2000 1500 1000
wave number (cm−1)
Tra
nsm
ittan
ce (
%)
9496
9810
0
Figure 4. Fourier transform infrared spectrum of a saprist or fibrist NL peat (particle size ≤ 425 µm).
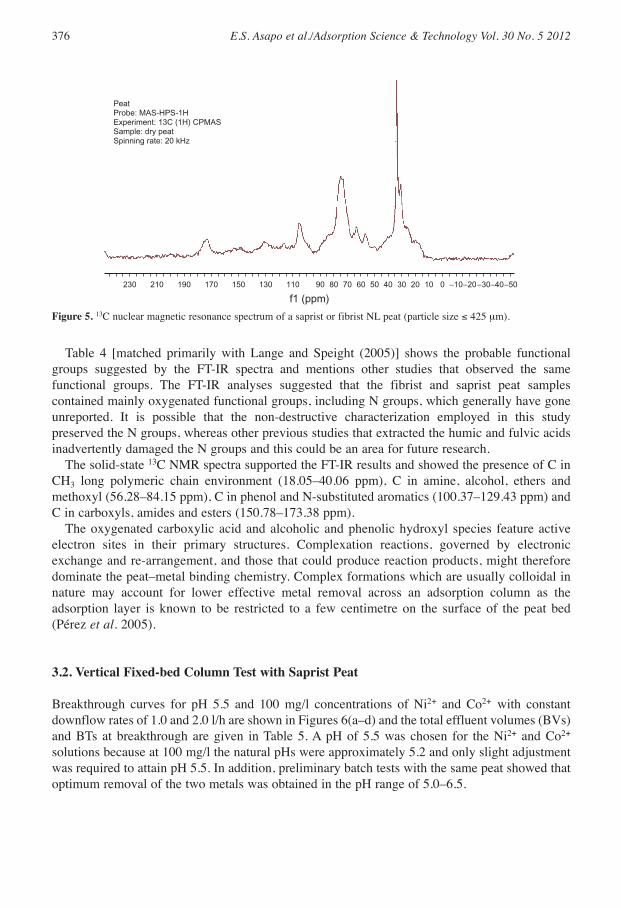
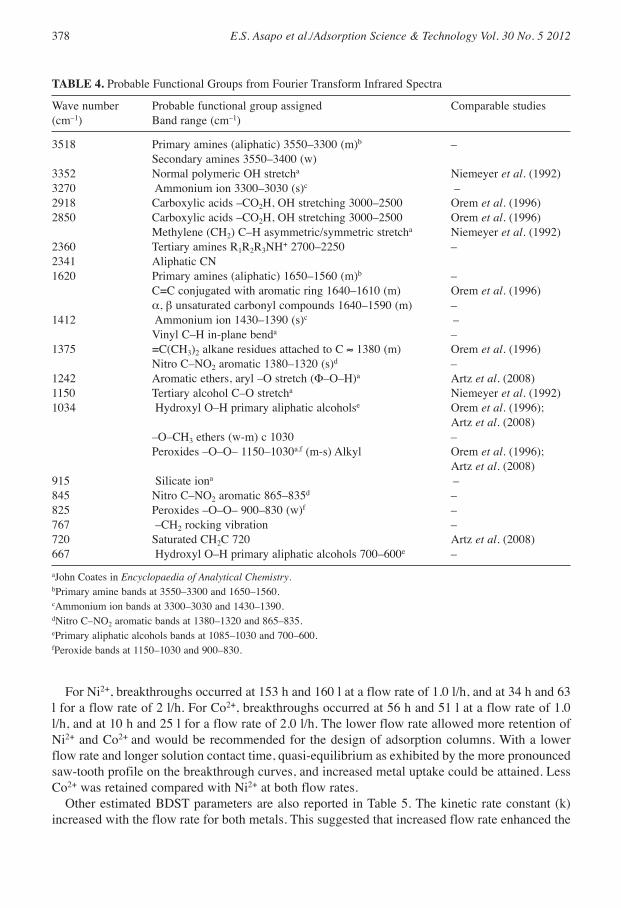
Table 4 [matched primarily with Lange and Speight (2005)] shows the probable functionalgroups suggested by the FT-IR spectra and mentions other studies that observed the samefunctional groups. The FT-IR analyses suggested that the fibrist and saprist peat samplescontained mainly oxygenated functional groups, including N groups, which generally have goneunreported. It is possible that the non-destructive characterization employed in this studypreserved the N groups, whereas other previous studies that extracted the humic and fulvic acidsinadvertently damaged the N groups and this could be an area for future research.
The solid-state 13C NMR spectra supported the FT-IR results and showed the presence of C inCH3 long polymeric chain environment (18.05–40.06 ppm), C in amine, alcohol, ethers andmethoxyl (56.28–84.15 ppm), C in phenol and N-substituted aromatics (100.37–129.43 ppm) andC in carboxyls, amides and esters (150.78–173.38 ppm).
The oxygenated carboxylic acid and alcoholic and phenolic hydroxyl species feature activeelectron sites in their primary structures. Complexation reactions, governed by electronicexchange and re-arrangement, and those that could produce reaction products, might thereforedominate the peat–metal binding chemistry. Complex formations which are usually colloidal innature may account for lower effective metal removal across an adsorption column as theadsorption layer is known to be restricted to a few centimetre on the surface of the peat bed(Pérez et al. 2005).
3.2. Vertical Fixed-bed Column Test with Saprist Peat
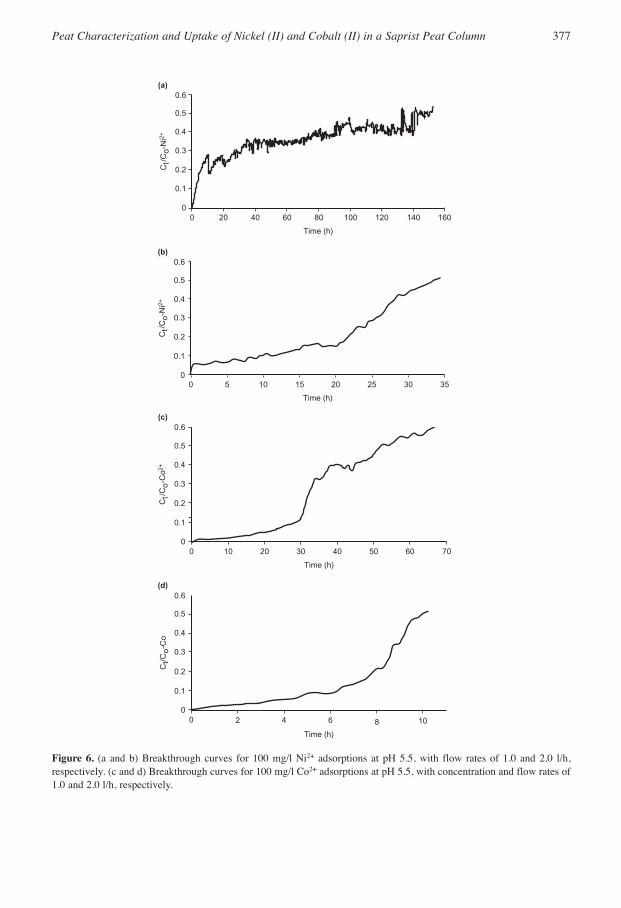
Breakthrough curves for pH 5.5 and 100 mg/l concentrations of Ni2+ and Co2+ with constantdownflow rates of 1.0 and 2.0 l/h are shown in Figures 6(a–d) and the total effluent volumes (BVs)and BTs at breakthrough are given in Table 5. A pH of 5.5 was chosen for the Ni2+ and Co2+
solutions because at 100 mg/l the natural pHs were approximately 5.2 and only slight adjustmentwas required to attain pH 5.5. In addition, preliminary batch tests with the same peat showed thatoptimum removal of the two metals was obtained in the pH range of 5.0–6.5.
376 E.S. Asapo et al./Adsorption Science & Technology Vol. 30 No. 5 2012
230 210 190 170 150 130 110 90 80 70 60 50 40 30 20 10 0 −10−20−30−40−50
PeatProbe: MAS-HPS-1HExperiment: 13C (1H) CPMASSample: dry peatSpinning rate: 20 kHz
f1 (ppm)
Figure 5. 13C nuclear magnetic resonance spectrum of a saprist or fibrist NL peat (particle size ≤ 425 µm).
Peat Characterization and Uptake of Nickel (II) and Cobalt (II) in a Saprist Peat Column 377
0.6
0.5
0.4
0.3
0.2
0.1
00
20 40 60 80
Time (h)
(a)
(b)
(c)
(d)
Ct/
Co-
Ni2+
100 120 140 160
0.6
0.5
0.4
0.3
0.2
0.1
00
5 10 15 20
Time (h)
Ct/
Co-
Ni2+
25 30 35
0.6
0.5
0.4
0.3
0.2
0.1
00
10 20 30 40
Time (h)
Ct/
Co-
Co2+
50 60 70
0.6
0.5
0.4
0.3
0.2
0.1
00
2 4 6 8
Time (h)
Ct/C
o-C
o
10
Figure 6. (a and b) Breakthrough curves for 100 mg/l Ni2+ adsorptions at pH 5.5, with flow rates of 1.0 and 2.0 l/h,respectively. (c and d) Breakthrough curves for 100 mg/l Co2+ adsorptions at pH 5.5, with concentration and flow rates of1.0 and 2.0 l/h, respectively.
378 E.S. Asapo et al./Adsorption Science & Technology Vol. 30 No. 5 2012
TABLE 4. Probable Functional Groups from Fourier Transform Infrared Spectra
Wave number Probable functional group assigned Comparable studies(cm–1) Band range (cm–1)
3518 Primary amines (aliphatic) 3550–3300 (m)b –Secondary amines 3550–3400 (w)
3352 Normal polymeric OH stretcha Niemeyer et al. (1992)3270 Ammonium ion 3300–3030 (s)c –2918 Carboxylic acids –CO2H, OH stretching 3000–2500 Orem et al. (1996)2850 Carboxylic acids –CO2H, OH stretching 3000–2500 Orem et al. (1996)
Methylene (CH2) C–H asymmetric/symmetric stretcha Niemeyer et al. (1992)2360 Tertiary amines R1R2R3NH+ 2700–2250 –2341 Aliphatic CN1620 Primary amines (aliphatic) 1650–1560 (m)b –
C=C conjugated with aromatic ring 1640–1610 (m) Orem et al. (1996)α, β unsaturated carbonyl compounds 1640–1590 (m) –
1412 Ammonium ion 1430–1390 (s)c –Vinyl C–H in-plane benda –
1375 =C(CH3)2 alkane residues attached to C ≈ 1380 (m) Orem et al. (1996)Nitro C–NO2 aromatic 1380–1320 (s)d –
1242 Aromatic ethers, aryl –O stretch (Φ–O–H)a Artz et al. (2008)1150 Tertiary alcohol C–O stretcha Niemeyer et al. (1992)1034 Hydroxyl O–H primary aliphatic alcoholse Orem et al. (1996);
Artz et al. (2008)–O–CH3 ethers (w-m) c 1030 –Peroxides –O–O– 1150–1030a,f (m-s) Alkyl Orem et al. (1996);
Artz et al. (2008)915 Silicate iona –845 Nitro C–NO2 aromatic 865–835d –825 Peroxides –O–O– 900–830 (w)f –767 –CH2 rocking vibration –720 Saturated CH2C 720 Artz et al. (2008)667 Hydroxyl O–H primary aliphatic alcohols 700–600e –
aJohn Coates in Encyclopaedia of Analytical Chemistry.bPrimary amine bands at 3550–3300 and 1650–1560.cAmmonium ion bands at 3300–3030 and 1430–1390.dNitro C–NO2 aromatic bands at 1380–1320 and 865–835.ePrimary aliphatic alcohols bands at 1085–1030 and 700–600.fPeroxide bands at 1150–1030 and 900–830.
For Ni2+, breakthroughs occurred at 153 h and 160 l at a flow rate of 1.0 l/h, and at 34 h and 63l for a flow rate of 2 l/h. For Co2+, breakthroughs occurred at 56 h and 51 l at a flow rate of 1.0l/h, and at 10 h and 25 l for a flow rate of 2.0 l/h. The lower flow rate allowed more retention ofNi2+ and Co2+ and would be recommended for the design of adsorption columns. With a lowerflow rate and longer solution contact time, quasi-equilibrium as exhibited by the more pronouncedsaw-tooth profile on the breakthrough curves, and increased metal uptake could be attained. LessCo2+ was retained compared with Ni2+ at both flow rates.
Other estimated BDST parameters are also reported in Table 5. The kinetic rate constant (k)increased with the flow rate for both metals. This suggested that increased flow rate enhanced the
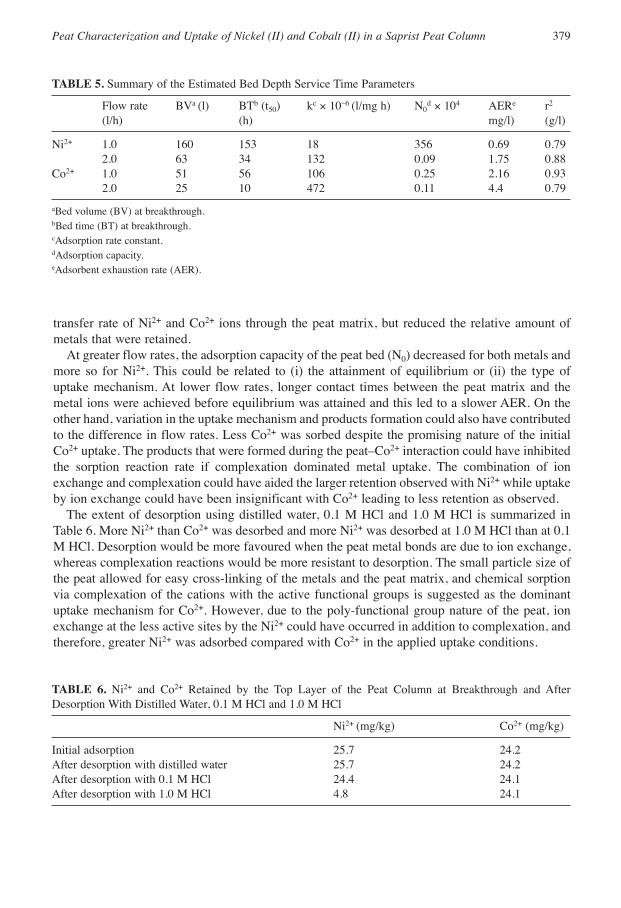
transfer rate of Ni2+ and Co2+ ions through the peat matrix, but reduced the relative amount ofmetals that were retained.
At greater flow rates, the adsorption capacity of the peat bed (N0) decreased for both metals andmore so for Ni2+. This could be related to (i) the attainment of equilibrium or (ii) the type ofuptake mechanism. At lower flow rates, longer contact times between the peat matrix and themetal ions were achieved before equilibrium was attained and this led to a slower AER. On theother hand, variation in the uptake mechanism and products formation could also have contributedto the difference in flow rates. Less Co2+ was sorbed despite the promising nature of the initialCo2+ uptake. The products that were formed during the peat–Co2+ interaction could have inhibitedthe sorption reaction rate if complexation dominated metal uptake. The combination of ionexchange and complexation could have aided the larger retention observed with Ni2+ while uptakeby ion exchange could have been insignificant with Co2+ leading to less retention as observed.
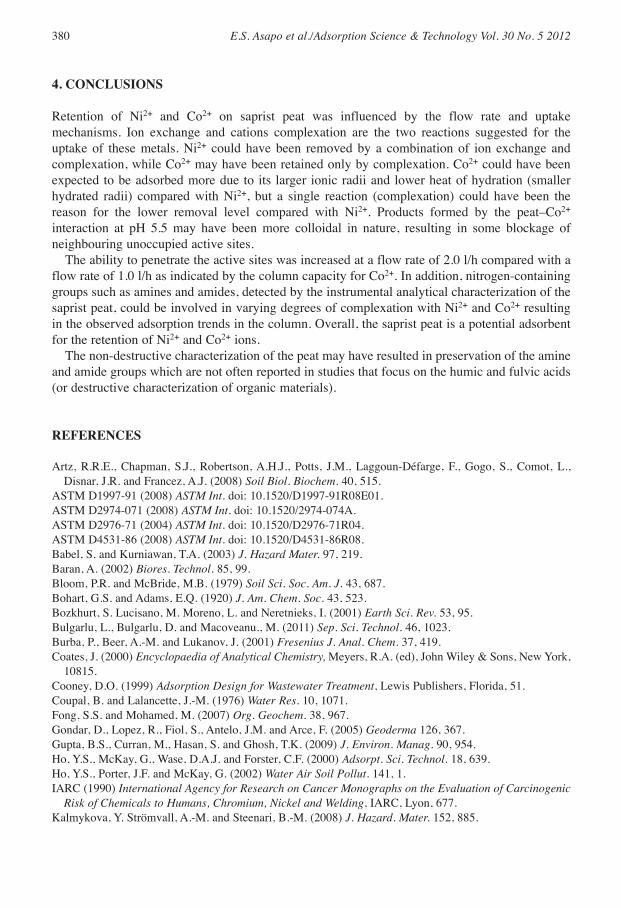
The extent of desorption using distilled water, 0.1 M HCl and 1.0 M HCl is summarized inTable 6. More Ni2+ than Co2+ was desorbed and more Ni2+ was desorbed at 1.0 M HCl than at 0.1M HCl. Desorption would be more favoured when the peat metal bonds are due to ion exchange,whereas complexation reactions would be more resistant to desorption. The small particle size ofthe peat allowed for easy cross-linking of the metals and the peat matrix, and chemical sorptionvia complexation of the cations with the active functional groups is suggested as the dominantuptake mechanism for Co2+. However, due to the poly-functional group nature of the peat, ionexchange at the less active sites by the Ni2+ could have occurred in addition to complexation, andtherefore, greater Ni2+ was adsorbed compared with Co2+ in the applied uptake conditions.
Peat Characterization and Uptake of Nickel (II) and Cobalt (II) in a Saprist Peat Column 379
TABLE 5. Summary of the Estimated Bed Depth Service Time Parameters
Flow rate BVa (l) BTb (t50) kc × 10–6 (l/mg h) N0d × 104 AERe r2
(l/h) (h) mg/l) (g/l)
Ni2+ 1.0 160 153 18 356 0.69 0.792.0 63 34 132 0.09 1.75 0.88
Co2+ 1.0 51 56 106 0.25 2.16 0.932.0 25 10 472 0.11 4.4 0.79
aBed volume (BV) at breakthrough.bBed time (BT) at breakthrough.cAdsorption rate constant.dAdsorption capacity.eAdsorbent exhaustion rate (AER).
TABLE 6. Ni2+ and Co2+ Retained by the Top Layer of the Peat Column at Breakthrough and AfterDesorption With Distilled Water, 0.1 M HCl and 1.0 M HCl
Ni2+ (mg/kg) Co2+ (mg/kg)
Initial adsorption 25.7 24.2After desorption with distilled water 25.7 24.2After desorption with 0.1 M HCl 24.4 24.1After desorption with 1.0 M HCl 4.8 24.1
4. CONCLUSIONS
Retention of Ni2+ and Co2+ on saprist peat was influenced by the flow rate and uptakemechanisms. Ion exchange and cations complexation are the two reactions suggested for theuptake of these metals. Ni2+ could have been removed by a combination of ion exchange andcomplexation, while Co2+ may have been retained only by complexation. Co2+ could have beenexpected to be adsorbed more due to its larger ionic radii and lower heat of hydration (smallerhydrated radii) compared with Ni2+, but a single reaction (complexation) could have been thereason for the lower removal level compared with Ni2+. Products formed by the peat–Co2+
interaction at pH 5.5 may have been more colloidal in nature, resulting in some blockage ofneighbouring unoccupied active sites.
The ability to penetrate the active sites was increased at a flow rate of 2.0 l/h compared with aflow rate of 1.0 l/h as indicated by the column capacity for Co2+. In addition, nitrogen-containinggroups such as amines and amides, detected by the instrumental analytical characterization of thesaprist peat, could be involved in varying degrees of complexation with Ni2+ and Co2+ resultingin the observed adsorption trends in the column. Overall, the saprist peat is a potential adsorbentfor the retention of Ni2+ and Co2+ ions.
The non-destructive characterization of the peat may have resulted in preservation of the amineand amide groups which are not often reported in studies that focus on the humic and fulvic acids(or destructive characterization of organic materials).
REFERENCES
Artz, R.R.E., Chapman, S.J., Robertson, A.H.J., Potts, J.M., Laggoun-Défarge, F., Gogo, S., Comot, L.,Disnar, J.R. and Francez, A.J. (2008) Soil Biol. Biochem. 40, 515.
ASTM D1997-91 (2008) ASTM Int. doi: 10.1520/D1997-91R08E01.ASTM D2974-071 (2008) ASTM Int. doi: 10.1520/2974-074A.ASTM D2976-71 (2004) ASTM Int. doi: 10.1520/D2976-71R04.ASTM D4531-86 (2008) ASTM Int. doi: 10.1520/D4531-86R08.Babel, S. and Kurniawan, T.A. (2003) J. Hazard Mater. 97, 219.Baran, A. (2002) Biores. Technol. 85, 99.Bloom, P.R. and McBride, M.B. (1979) Soil Sci. Soc. Am. J. 43, 687.Bohart, G.S. and Adams, E.Q. (1920) J. Am. Chem. Soc. 43, 523.Bozkhurt, S. Lucisano, M. Moreno, L. and Neretnieks, I. (2001) Earth Sci. Rev. 53, 95.Bulgarlu, L., Bulgarlu, D. and Macoveanu., M. (2011) Sep. Sci. Technol. 46, 1023.Burba, P., Beer, A.-M. and Lukanov, J. (2001) Fresenius J. Anal. Chem. 37, 419.Coates, J. (2000) Encyclopaedia of Analytical Chemistry, Meyers, R.A. (ed), John Wiley & Sons, New York,
10815.Cooney, D.O. (1999) Adsorption Design for Wastewater Treatment, Lewis Publishers, Florida, 51.Coupal, B. and Lalancette, J.-M. (1976) Water Res. 10, 1071.Fong, S.S. and Mohamed, M. (2007) Org. Geochem. 38, 967.Gondar, D., Lopez, R., Fiol, S., Antelo, J.M. and Arce, F. (2005) Geoderma 126, 367.Gupta, B.S., Curran, M., Hasan, S. and Ghosh, T.K. (2009) J. Environ. Manag. 90, 954.Ho, Y.S., McKay, G., Wase, D.A.J. and Forster, C.F. (2000) Adsorpt. Sci. Technol. 18, 639.Ho, Y.S., Porter, J.F. and McKay, G. (2002) Water Air Soil Pollut. 141, 1.IARC (1990) International Agency for Research on Cancer Monographs on the Evaluation of Carcinogenic
Risk of Chemicals to Humans, Chromium, Nickel and Welding, IARC, Lyon, 677.Kalmykova, Y. Strömvall, A.-M. and Steenari, B.-M. (2008) J. Hazard. Mater. 152, 885.
380 E.S. Asapo et al./Adsorption Science & Technology Vol. 30 No. 5 2012
Lange, N.A. and Speight, J.G. (2005) Lange’s Handbook of Chemistry, 16th edition, McGraw Hill, New York.Li, H., Parent, L.E., Karam, A. and Tremblay, C.J. (2004) Plant Soil 265, 355.Malterer, T.J., Verry, E.S. and Erjavec, J. (1992) Soil Sci. Soc. Am. J. 56, 1200.Naumova, L., Gorlenko, N. and Otmakhova, Z. (1995) Russ. J. Appl. Chem. 68, 1273.Niemeyer, J., Chen, Y. and Bollag J.-M. (1992) Soil Sci. Soc. Am. J. 56, 135.Orem, W.H., Neuzil, S.G., Lerch, H.E. and Cecil, C.B. (1996) Org. Geochem. 24, 111.Pérez, J.I., Hontoria, E., Zamorano, M. and Gómez, M.A. (2005) J. Environ. Sci. Health A 40, 1021.Ringqvist, L., Holmgren, A. and Oborn, J. (2002) Water Res. 36, 2233.Romão, L.P.C., Lead, J.R., Rocha, J.C., de Oliveira, L.C., Rosa, A.H., Mendonça, A.G.R. and Ribeiro, A. de
Souza (2007) J. Braz. Chem. Soc. 18, 714.Schackelford, C.D. (1993) Geotechnical Practice for Waste and Disposal, Daniel, E.D. (ed.), Chapman and
Hall, London, 49.Sharma, D.C. and Forster, C.F. (1995) Biores. Technol. 52, 261.Sheldrick, B.H. (1984) Analytical Methods Manual, Research Branch, Agriculture Canada, LRRA
Contribution, 30, 1.Spedding, P.J. (1988) Fuel 67, 883.Sze, M.F.F., Lee, V.K.C. and McKay, G. (2008) Desalination, 218, 323.Twardowska, I., Kyziol, J., Goldrath, T. and Avnimelech, Y. (1999) J. Geochem. Explor. 66, 387.Twardowska, I. and Kyziol, J. (1996) Fresenius J. Anal. Chem. 354, 580.USGS (2006a), US Geological Survey, 2006 Minerals Yearbook, Zeolites, 83.1.USGS (2006b), US Geological Survey, 2006 Minerals Yearbook, Clay and Shale, 18.4.USGS (2006c), US Geological Survey, 2006 Minerals Yearbook, Peat, 54.1.Yong, R.N. Mohamed, A.M.O. and Warkentin, B.P. (1992) Principles of Contaminant Transport in Soils.
Development in Geotechnical Engineering Series, Vol. 73, Elsevier, Amsterdam, 207.Zhou, D., Zhang, L., Zhou, J. and Guo, S. (2004) Water Res. 38, 2643.
Peat Characterization and Uptake of Nickel (II) and Cobalt (II) in a Saprist Peat Column 381
