in vivo epr spectroscopy: biomedical and potential diagnostic applications
TRANSCRIPT
In vivo EPR spectroscopy: biomedical and potential diagnostic
applications
Simon K. Jackson,*a Matthew P. Thomas,b Sam Smith,a Melanie Madhani,a
Stephen C. Rogersb and Philip E. Jamesb
a Department of Medical Microbiology, University of Wales College of Medicine,
Heath Park, Cardiff, Wales, UK CF14 4XNb Department of Cardiology, University of Wales College of Medicine, Heath Park,
Cardiff, Wales, UK CF14 4XN
Received 23rd June 2003, Accepted 16th July 2003First published as an Advance Article on the web 25th September 2003
EPR spectroscopic techniques have been developed for the measurement of oxygen andnitric oxide in vivo. Specifically, the methods for in vivomeasurement of these molecules hasbeen applied to the study of septic shock, utilising an experimental murine model developedin our laboratory. Oxygen was measured as pO2 by the particlulate probes Gloxy and LiPc,which were surgically implanted at specific sites in tissues, and the soluble probe Trityl,which was administered intravenously. Nitric oxide was measured as the NO-Fe-(DETC)2complex after administration of Fe2+ and DETC. LPS was seen to significantly decreaseliver oxygen measured across the lobule and at the sinusoids by the Gloxy probe; there wasa corresponding increase in nitric oxide both in the liver and systemically. The nitric oxidemost likely originated from increased iNOS enzyme in the liver as demonstrated byWestern blotting and the localisation of nitric oxide to the liver was confirmed with EPRimaging. LPS also caused a decrease in cerebral blood and tissue oxygenation, the rateof which was found to be dependent on the blood oxygenation. The development andapplications of these in vivo EPR techniques for biomedical research and diagnosticsis discussed.
Introduction
In-vivo EPR spectroscopy
Electron paramagnetic resonance (EPR) spectroscopy (equivalently known as electron spin reso-nance (ESR) and electron magnetic resonance (EMR) spectroscopy) is the most direct and pow-erful method for the detection and identification of free radicals and other species with unpairedelectrons. The technique has therefore found many useful and unique applications in the fields ofbiology and medicine in addition to its role in organic and physical chemistry.1 The EPR phe-nomenon arises from the interaction between electron magnetic moments in paramagnetic samplesand an applied external magnetic field. Absorption of radiation energy between the resultantelectron energy levels (‘ spin states ’) is measured in the EPR experiment. Historically, EPR spec-trometers have been developed to operate at radiation energies at microwave frequencies of around9 GHz (X-band). However, the presence of water (which has a high dielectric constant) and the size
DOI: 10.1039/b307162f Faraday Discuss., 2004, 126, 103–117 103
This journal is # The Royal Society of Chemistry 2003
of many biomedical samples have hampered the development of biomedical applications of EPR atsuch frequencies; the magnet pole gaps and dielectric loss limit the size of aqueous samples studiedin such spectrometers to about 2 mm in diameter. Recent developments in low frequency EPRinstrumentation has allowed much larger ‘ lossy ’ samples to be studied and imaged.2,3 Most of theinstrumental development has been at L-band (�1 GHz) or radio frequencies (�300 MHz).Various detection techniques can be used for low frequency EPR. In addition to the conventionalcontinuous wave (CW) experiment, low frequency pulsed EPR, longitudinal detection and indirectdetection via the Overhauser enhancement in NMR have been developed for biomedical samples.The EPR signals are detected in the microwave resonator and several designs including the ‘ loop-gap’ and ‘birdcage ’ resonators have been developed.
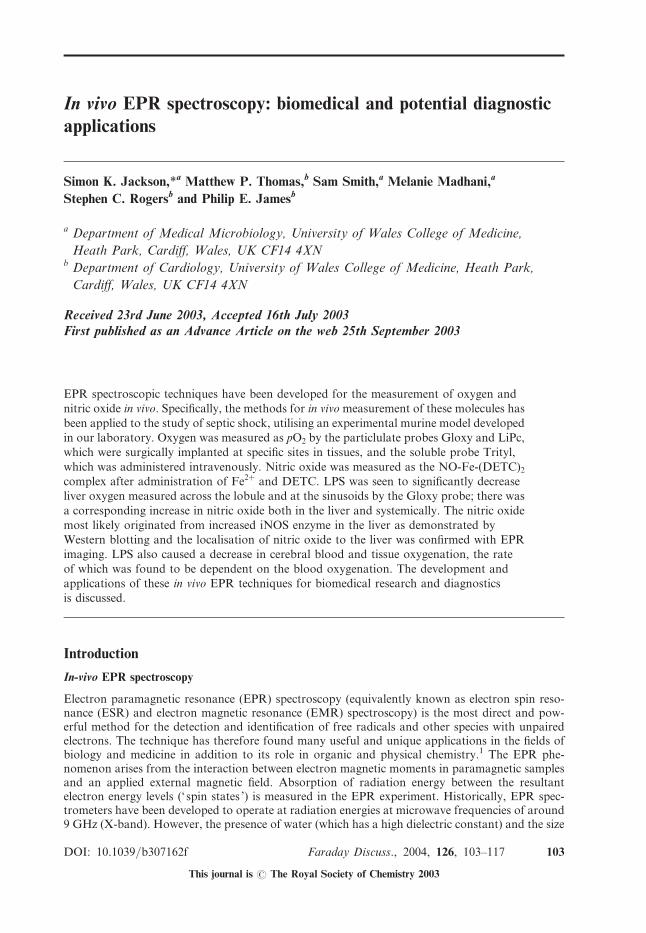
Our laboratory has been developing in vivo EPR spectroscopy and EPR imaging using a BrukerL-band EPR spectrometer with a 3.4 cm birdcage resonator and imaging coils. The magnet systemand microwave generator of this instrument are shown in Fig. 1A. The resonator will accommodatea mouse or small rat and contains a sealed insert into which anaesthetic gases may be piped in andremoved via a co-axial tube (Fig. 1B). This paper will describe the in vivo EPR applications we havebeen developing using this instrument.
Methods – application techniques
Spin trapping
Many free radicals of biological interest are short-lived and decay at rates too fast to be detecteddirectly by EPR spectroscopy. Examples include the hydroxyl radical which reacts at near diffu-sion-controlled rates. To overcome this problem of detection of reactive, short-lived species, thetechnique of spin trapping can be applied. Spin trapping employs a chemical compound whichreacts with the free radical to produce a stable paramagnetic species – the ‘spin adduct ’. Para-meters obtained from the EPR spectra of the spin adducts, such as the coupling constants, allowthe identification of the original free radical species being trapped.
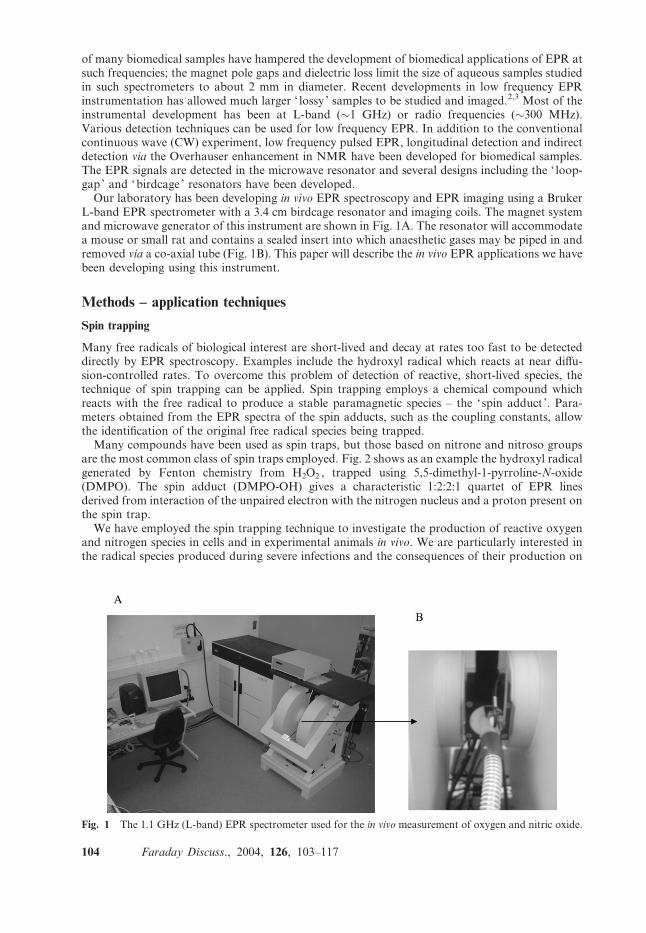
Many compounds have been used as spin traps, but those based on nitrone and nitroso groupsare the most common class of spin traps employed. Fig. 2 shows as an example the hydroxyl radicalgenerated by Fenton chemistry from H2O2 , trapped using 5,5-dimethyl-1-pyrroline-N-oxide(DMPO). The spin adduct (DMPO-OH) gives a characteristic 1:2:2:1 quartet of EPR linesderived from interaction of the unpaired electron with the nitrogen nucleus and a proton present onthe spin trap.
We have employed the spin trapping technique to investigate the production of reactive oxygenand nitrogen species in cells and in experimental animals in vivo. We are particularly interested inthe radical species produced during severe infections and the consequences of their production on
Fig. 1 The 1.1 GHz (L-band) EPR spectrometer used for the in vivo measurement of oxygen and nitric oxide.
104 Faraday Discuss., 2004, 126, 103–117
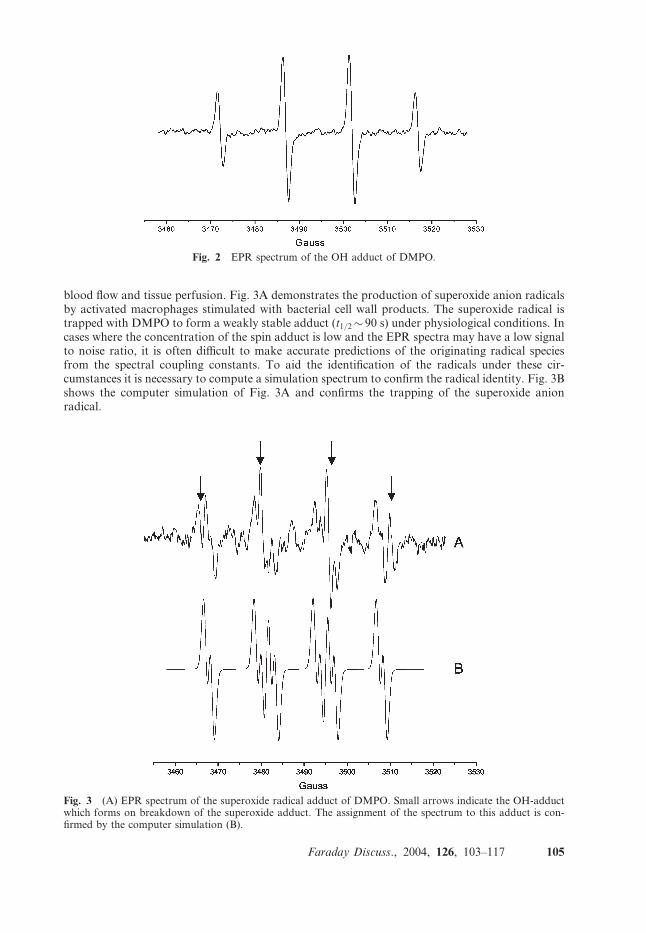
blood flow and tissue perfusion. Fig. 3A demonstrates the production of superoxide anion radicalsby activated macrophages stimulated with bacterial cell wall products. The superoxide radical istrapped with DMPO to form a weakly stable adduct (t1/2� 90 s) under physiological conditions. Incases where the concentration of the spin adduct is low and the EPR spectra may have a low signalto noise ratio, it is often difficult to make accurate predictions of the originating radical speciesfrom the spectral coupling constants. To aid the identification of the radicals under these cir-cumstances it is necessary to compute a simulation spectrum to confirm the radical identity. Fig. 3Bshows the computer simulation of Fig. 3A and confirms the trapping of the superoxide anionradical.
Fig. 2 EPR spectrum of the OH adduct of DMPO.
Fig. 3 (A) EPR spectrum of the superoxide radical adduct of DMPO. Small arrows indicate the OH-adductwhich forms on breakdown of the superoxide adduct. The assignment of the spectrum to this adduct is con-firmed by the computer simulation (B).
Faraday Discuss., 2004, 126, 103–117 105
Measurement of nitric oxide
Our laboratory has been particularly interested in the production and subsequent reactions andbioavailability of nitric oxide during inflammation and infection. Nitric oxide (NO�) has manyimportant biological functions including its role as the endothelium-derived relaxing factor(EDRF) by which it controls vascular tone and blood pressure.4 In addition, NO� has anti-microbial properties in the immune system and through its interaction with superoxide, functionsas an antioxidant in the vascular system. The detection and quantitation of NO� in biologicalsystems is problematic because NO� rapidly oxidises to products such as nitrite and nitrate inaqueous media. Measurement of nitrite and nitrate by the Griess method is subject to false posi-tives and cannot distinguish between the various sources of these species. It also only provideslimited time resolution because the half-life of some metabolites is long and there is accumulationin the system being studied. Measurement of NO� directly via an electrode is very sensitive (< 0.2mM) and provides real-time measurements and is a useful method for determining NO� in vitro.However, in vivo, NO�-electrodes are less useful and limited by the fact that the method is invasive,the electrodes are brittle and prone to breakage and the measurements are temperature-dependent.EPR spectroscopy has emerged as a sensitive and reliable method for the measurement of NO�
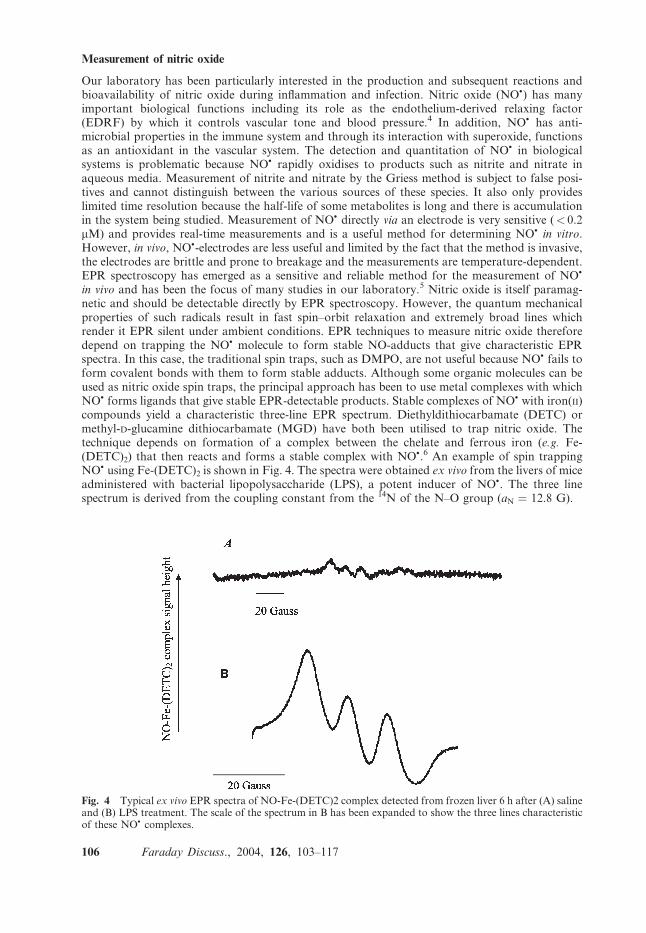
in vivo and has been the focus of many studies in our laboratory.5 Nitric oxide is itself paramag-netic and should be detectable directly by EPR spectroscopy. However, the quantum mechanicalproperties of such radicals result in fast spin–orbit relaxation and extremely broad lines whichrender it EPR silent under ambient conditions. EPR techniques to measure nitric oxide thereforedepend on trapping the NO� molecule to form stable NO-adducts that give characteristic EPRspectra. In this case, the traditional spin traps, such as DMPO, are not useful because NO� fails toform covalent bonds with them to form stable adducts. Although some organic molecules can beused as nitric oxide spin traps, the principal approach has been to use metal complexes with whichNO� forms ligands that give stable EPR-detectable products. Stable complexes of NO� with iron(II)compounds yield a characteristic three-line EPR spectrum. Diethyldithiocarbamate (DETC) ormethyl-D-glucamine dithiocarbamate (MGD) have both been utilised to trap nitric oxide. Thetechnique depends on formation of a complex between the chelate and ferrous iron (e.g. Fe-(DETC)2) that then reacts and forms a stable complex with NO�.6 An example of spin trappingNO� using Fe-(DETC)2 is shown in Fig. 4. The spectra were obtained ex vivo from the livers of miceadministered with bacterial lipopolysaccharide (LPS), a potent inducer of NO�. The three linespectrum is derived from the coupling constant from the 14N of the N–O group (aN ¼ 12.8 G).
Fig. 4 Typical ex vivo EPR spectra of NO-Fe-(DETC)2 complex detected from frozen liver 6 h after (A) salineand (B) LPS treatment. The scale of the spectrum in B has been expanded to show the three lines characteristicof these NO� complexes.
106 Faraday Discuss., 2004, 126, 103–117
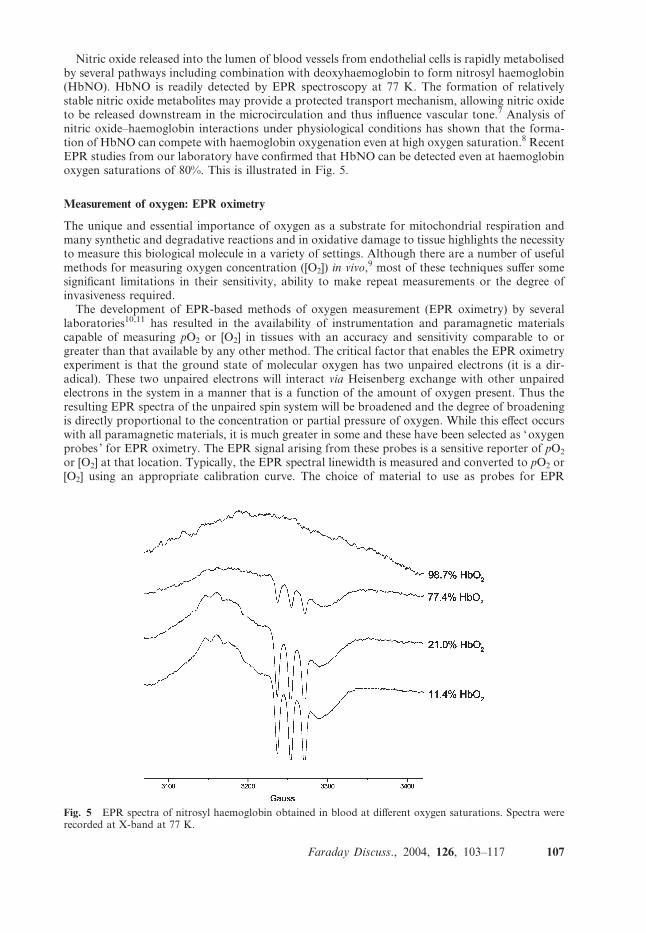
Nitric oxide released into the lumen of blood vessels from endothelial cells is rapidly metabolisedby several pathways including combination with deoxyhaemoglobin to form nitrosyl haemoglobin(HbNO). HbNO is readily detected by EPR spectroscopy at 77 K. The formation of relativelystable nitric oxide metabolites may provide a protected transport mechanism, allowing nitric oxideto be released downstream in the microcirculation and thus influence vascular tone.7 Analysis ofnitric oxide–haemoglobin interactions under physiological conditions has shown that the forma-tion of HbNO can compete with haemoglobin oxygenation even at high oxygen saturation.8 RecentEPR studies from our laboratory have confirmed that HbNO can be detected even at haemoglobinoxygen saturations of 80%. This is illustrated in Fig. 5.
Measurement of oxygen: EPR oximetry
The unique and essential importance of oxygen as a substrate for mitochondrial respiration andmany synthetic and degradative reactions and in oxidative damage to tissue highlights the necessityto measure this biological molecule in a variety of settings. Although there are a number of usefulmethods for measuring oxygen concentration ([O2]) in vivo,9 most of these techniques suffer somesignificant limitations in their sensitivity, ability to make repeat measurements or the degree ofinvasiveness required.The development of EPR-based methods of oxygen measurement (EPR oximetry) by several
laboratories10,11 has resulted in the availability of instrumentation and paramagnetic materialscapable of measuring pO2 or [O2] in tissues with an accuracy and sensitivity comparable to orgreater than that available by any other method. The critical factor that enables the EPR oximetryexperiment is that the ground state of molecular oxygen has two unpaired electrons (it is a dir-adical). These two unpaired electrons will interact via Heisenberg exchange with other unpairedelectrons in the system in a manner that is a function of the amount of oxygen present. Thus theresulting EPR spectra of the unpaired spin system will be broadened and the degree of broadeningis directly proportional to the concentration or partial pressure of oxygen. While this effect occurswith all paramagnetic materials, it is much greater in some and these have been selected as ‘oxygenprobes ’ for EPR oximetry. The EPR signal arising from these probes is a sensitive reporter of pO2
or [O2] at that location. Typically, the EPR spectral linewidth is measured and converted to pO2 or[O2] using an appropriate calibration curve. The choice of material to use as probes for EPR
Fig. 5 EPR spectra of nitrosyl haemoglobin obtained in blood at different oxygen saturations. Spectra wererecorded at X-band at 77 K.
Faraday Discuss., 2004, 126, 103–117 107
oximetry depends on the system and parameter to be measured. We have used both soluble andparticulate oxygen-sensitive EPR probes for the measurement of oxygen. Both types of probe relyon a physical interaction with oxygen that does not affect the local oxygen concentration. This is adistinct advantage over many other methods which consume oxygen in the process used to measureits concentration.
Soluble EPR oximetry probes include nitroxides and a triphenyl derivative, Trityl. Trityl pro-duces narrow EPR lines in the absence of oxygen and broaden by about 100 mG over the range0–20% O2 . Soluble probes such as Trityl, report on [O2] because their linewidths reflect collisionswith dissolved oxygen and the rate of collision is dependent on the solubility and diffusion in themedium. Particulate probes include coals and chars and lithium phthalocyanine (LiPc) crystals andoften exhibit a sharp single EPR line. They respond to pO2 rather than [O2]. These materials arevery inert in biological systems and therefore lend themselves for implantation into tissues to allowrepeated measurement of pO2 over time from a particular site. The pO2 measured is the average pO2
in the tissues, which is in immediate equilibrium with the surface of the particle probe.12 Studies inour laboratory have made use of an oxygen-sensitive coal blend termed ‘Gloxy’ (after ‘glo’ theWelsh for coal). Gloxy was found to have useful features for EPR oximetry including a narrowlinewidth in nitrogen, a sensitive linewidth dependence on pO2 and high signal intensity.13 More-over, Gloxy can be prepared as a ‘ slurry ’ of microscopic particles in saline which can report on pO2
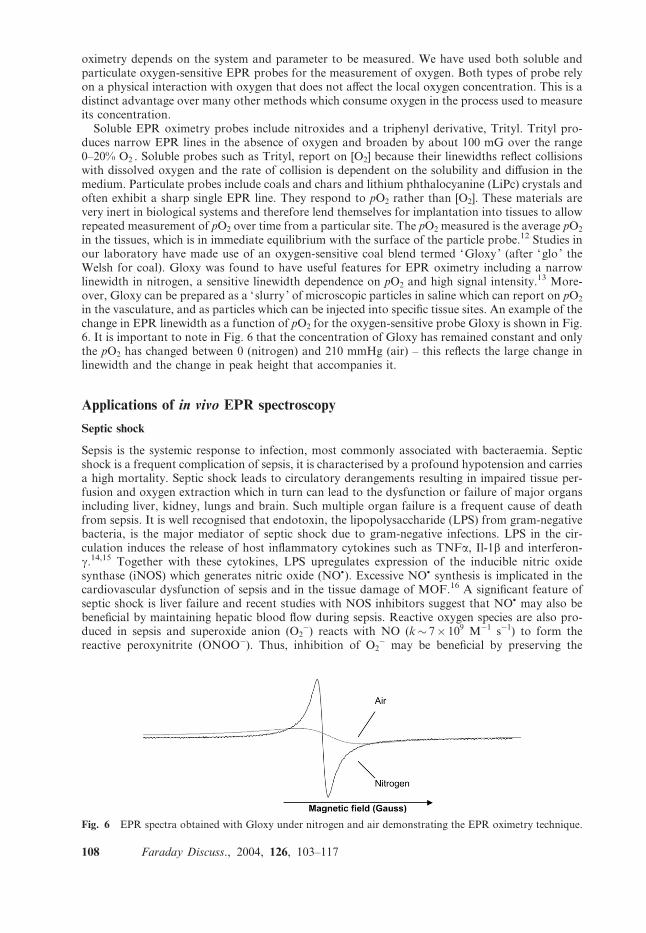
in the vasculature, and as particles which can be injected into specific tissue sites. An example of thechange in EPR linewidth as a function of pO2 for the oxygen-sensitive probe Gloxy is shown in Fig.6. It is important to note in Fig. 6 that the concentration of Gloxy has remained constant and onlythe pO2 has changed between 0 (nitrogen) and 210 mmHg (air) – this reflects the large change inlinewidth and the change in peak height that accompanies it.
Applications of in vivo EPR spectroscopy
Septic shock
Sepsis is the systemic response to infection, most commonly associated with bacteraemia. Septicshock is a frequent complication of sepsis, it is characterised by a profound hypotension and carriesa high mortality. Septic shock leads to circulatory derangements resulting in impaired tissue per-fusion and oxygen extraction which in turn can lead to the dysfunction or failure of major organsincluding liver, kidney, lungs and brain. Such multiple organ failure is a frequent cause of deathfrom sepsis. It is well recognised that endotoxin, the lipopolysaccharide (LPS) from gram-negativebacteria, is the major mediator of septic shock due to gram-negative infections. LPS in the cir-culation induces the release of host inflammatory cytokines such as TNFa, Il-1b and interferon-g.14,15 Together with these cytokines, LPS upregulates expression of the inducible nitric oxidesynthase (iNOS) which generates nitric oxide (NO�). Excessive NO� synthesis is implicated in thecardiovascular dysfunction of sepsis and in the tissue damage of MOF.16 A significant feature ofseptic shock is liver failure and recent studies with NOS inhibitors suggest that NO� may also bebeneficial by maintaining hepatic blood flow during sepsis. Reactive oxygen species are also pro-duced in sepsis and superoxide anion (O2
�) reacts with NO (k� 7� 109 M�1 s�1) to form thereactive peroxynitrite (ONOO�). Thus, inhibition of O2
� may be beneficial by preserving the
Fig. 6 EPR spectra obtained with Gloxy under nitrogen and air demonstrating the EPR oximetry technique.
108 Faraday Discuss., 2004, 126, 103–117
constitutive release of NO� and hence preserving tissue perfusion. However, whether NO� isharmful in some locations and beneficial at others remains unclear. Furthermore, it is uncertain towhat extent defects in tissue oxygenation result from an inadequate blood supply (and henceoxygen) or impaired oxygen utilisation.Clearly, due to the interplay between oxygen, nitric oxide and superoxide in severe infectious and
other conditions affecting the vasculature, it would be advantageous to be able to measure theseparameters in situ, in experimental models in vivo. As outlined above, EPR spectroscopy representsthe best method to accurately measure these parameters repeatably, relatively non-invasively andeven simultaneously at specific sites in vivo. Our laboratory has utilised low frequency (L-band)EPR spectroscopy and a murine model of septic shock to develop methods to measure theseimportant biological molecules in real time in vivo.17 We present here our recent findings on the roleof nitric oxide and tissue oxygenation in an experimental model of LPS-induced septic shockmeasured by in vivo EPR spectroscopy and EPR imaging methods.
1. Measurement of liver oxygenation and nitric oxide in endotoxic shock
Materials and methods
Male Balb/C mice (18–20 g), were purchased from Charles River Laboratories. Lipopoly-saccharide (LPS, isolated from Escherichia coli, serotype O111:B4), diethyldithiocarbamic acid(DETC), ferrous sulfate (FeSO4) and sodium citrate were all obtained from Sigma Chemical Co.Gloxy, coal blend was obtained from Filter Anthracite Ltd, Ammanford, South Wales, UK.Oxygen-sensitive material was selected as previously described.13
In order to measure average liver lobule pO2 and also measure pO2 selectively from the sinusoid,Gloxy was administered by two different techniques; Gloxy particles were implanted directly intothe liver. Mice were anaesthetized with 1.4% isoflurane, and a laparotomy was performed. Gloxyparticles (50 to 200 mm, chosen manually using a microscope and cell haemocytometer scale) wereinjected using a 22 gauge needle. This contained a length of wire, which was used to displace theGloxy from the needle directly into the liver tissue. Gloxy slurry (100 ml) was administeredintravenously via the lateral tail vein. Slurry was produced by grinding Gloxy using a pestle andmortar, suspending it in sterile saline, and filtering it through a 20 mm mesh. Histological exam-ination of tissue slices revealed that the slurry of fine particles injected intravenously distributedmainly to the liver, and was confined within the hepatic sinusoidal capillaries. In contrast, Gloxyparticles injected directly in the liver localised across a large area of the liver lobule tissue bed.Thus, selective measurements of pO2 were possible at two different anatomical locations withinhepatic tissue. Measurement of pO2 by the ‘slurry ’ method was therefore used to reflect supply ofoxygen to the sinusoid, whereas ‘‘particle ’’ measurements reflected average pO2 across the liverlobule. The difference in pO2 between these sites was taken to reflect oxygen utilisation across theliver lobule. Oxygen tensions were calculated from the linewidths of the Gloxy spectra withreference to a calibration of either Gloxy slurry or particle linewidth against known O2 tensions.
Results (i) – LPS decreases liver oxygenation
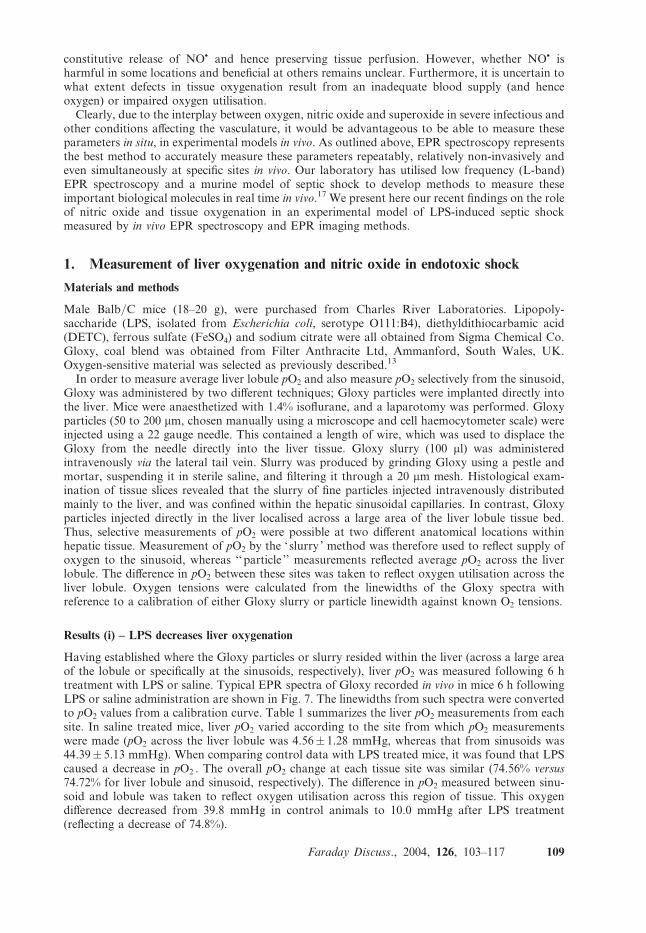
Having established where the Gloxy particles or slurry resided within the liver (across a large areaof the lobule or specifically at the sinusoids, respectively), liver pO2 was measured following 6 htreatment with LPS or saline. Typical EPR spectra of Gloxy recorded in vivo in mice 6 h followingLPS or saline administration are shown in Fig. 7. The linewidths from such spectra were convertedto pO2 values from a calibration curve. Table 1 summarizes the liver pO2 measurements from eachsite. In saline treated mice, liver pO2 varied according to the site from which pO2 measurementswere made (pO2 across the liver lobule was 4.56� 1.28 mmHg, whereas that from sinusoids was44.39� 5.13 mmHg). When comparing control data with LPS treated mice, it was found that LPScaused a decrease in pO2 . The overall pO2 change at each tissue site was similar (74.56% versus74.72% for liver lobule and sinusoid, respectively). The difference in pO2 measured between sinu-soid and lobule was taken to reflect oxygen utilisation across this region of tissue. This oxygendifference decreased from 39.8 mmHg in control animals to 10.0 mmHg after LPS treatment(reflecting a decrease of 74.8%).
Faraday Discuss., 2004, 126, 103–117 109
Results (ii) – LPS induces increases in liver nitric oxide
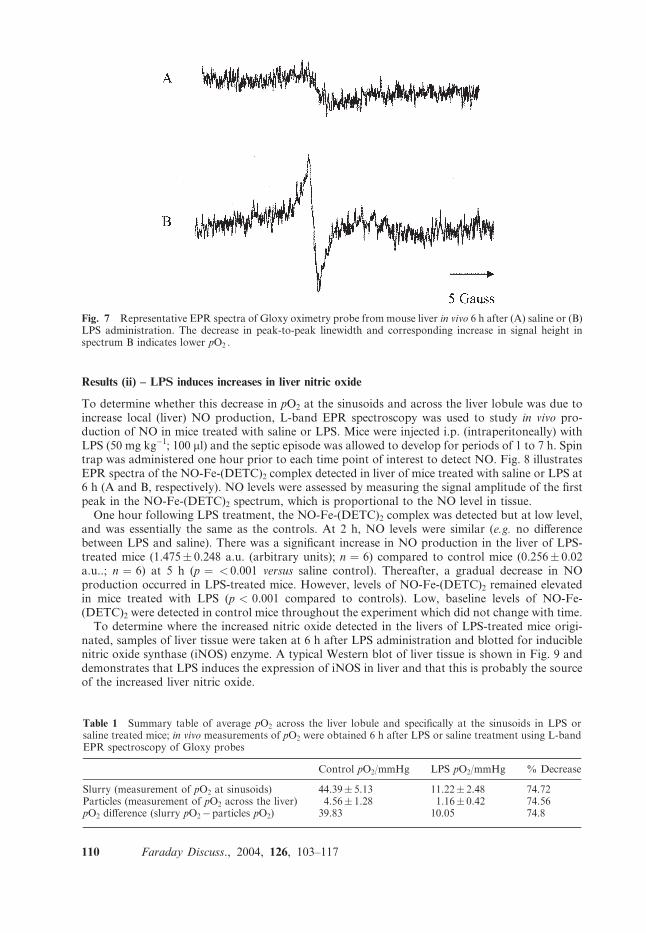
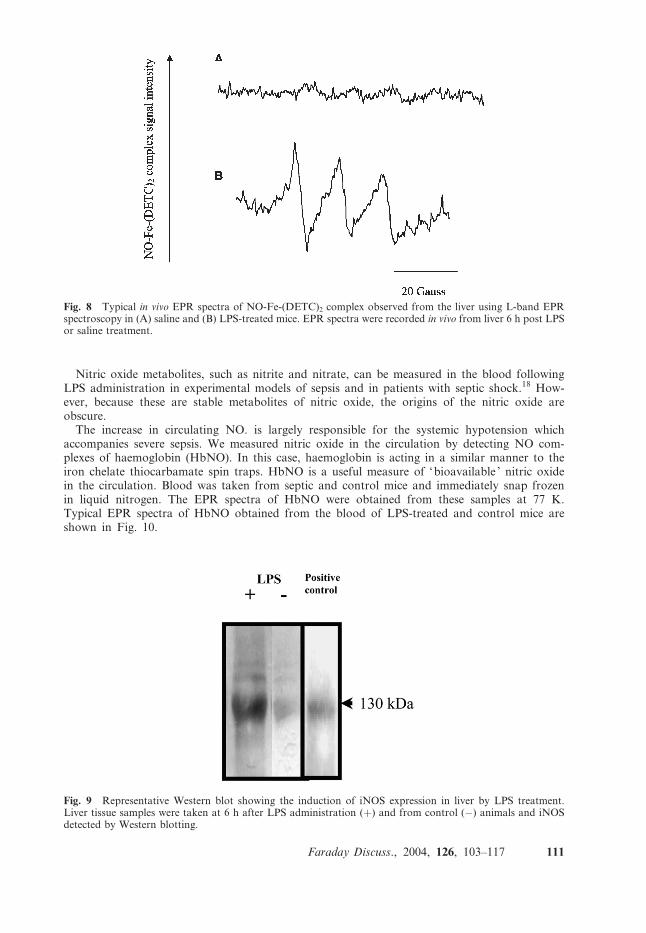
To determine whether this decrease in pO2 at the sinusoids and across the liver lobule was due toincrease local (liver) NO production, L-band EPR spectroscopy was used to study in vivo pro-duction of NO in mice treated with saline or LPS. Mice were injected i.p. (intraperitoneally) withLPS (50 mg kg�1; 100 ml) and the septic episode was allowed to develop for periods of 1 to 7 h. Spintrap was administered one hour prior to each time point of interest to detect NO. Fig. 8 illustratesEPR spectra of the NO-Fe-(DETC)2 complex detected in liver of mice treated with saline or LPS at6 h (A and B, respectively). NO levels were assessed by measuring the signal amplitude of the firstpeak in the NO-Fe-(DETC)2 spectrum, which is proportional to the NO level in tissue.
One hour following LPS treatment, the NO-Fe-(DETC)2 complex was detected but at low level,and was essentially the same as the controls. At 2 h, NO levels were similar (e.g. no differencebetween LPS and saline). There was a significant increase in NO production in the liver of LPS-treated mice (1.475� 0.248 a.u. (arbitrary units); n ¼ 6) compared to control mice (0.256� 0.02a.u..; n ¼ 6) at 5 h (p ¼ < 0.001 versus saline control). Thereafter, a gradual decrease in NOproduction occurred in LPS-treated mice. However, levels of NO-Fe-(DETC)2 remained elevatedin mice treated with LPS (p < 0.001 compared to controls). Low, baseline levels of NO-Fe-(DETC)2 were detected in control mice throughout the experiment which did not change with time.
To determine where the increased nitric oxide detected in the livers of LPS-treated mice origi-nated, samples of liver tissue were taken at 6 h after LPS administration and blotted for induciblenitric oxide synthase (iNOS) enzyme. A typical Western blot of liver tissue is shown in Fig. 9 anddemonstrates that LPS induces the expression of iNOS in liver and that this is probably the sourceof the increased liver nitric oxide.
Table 1 Summary table of average pO2 across the liver lobule and specifically at the sinusoids in LPS orsaline treated mice; in vivo measurements of pO2 were obtained 6 h after LPS or saline treatment using L-bandEPR spectroscopy of Gloxy probes
Control pO2/mmHg LPS pO2/mmHg % Decrease
Slurry (measurement of pO2 at sinusoids) 44.39� 5.13 11.22� 2.48 74.72Particles (measurement of pO2 across the liver) 4.56� 1.28 1.16� 0.42 74.56pO2 difference (slurry pO2�particles pO2) 39.83 10.05 74.8
Fig. 7 Representative EPR spectra of Gloxy oximetry probe from mouse liver in vivo 6 h after (A) saline or (B)LPS administration. The decrease in peak-to-peak linewidth and corresponding increase in signal height inspectrum B indicates lower pO2 .
110 Faraday Discuss., 2004, 126, 103–117
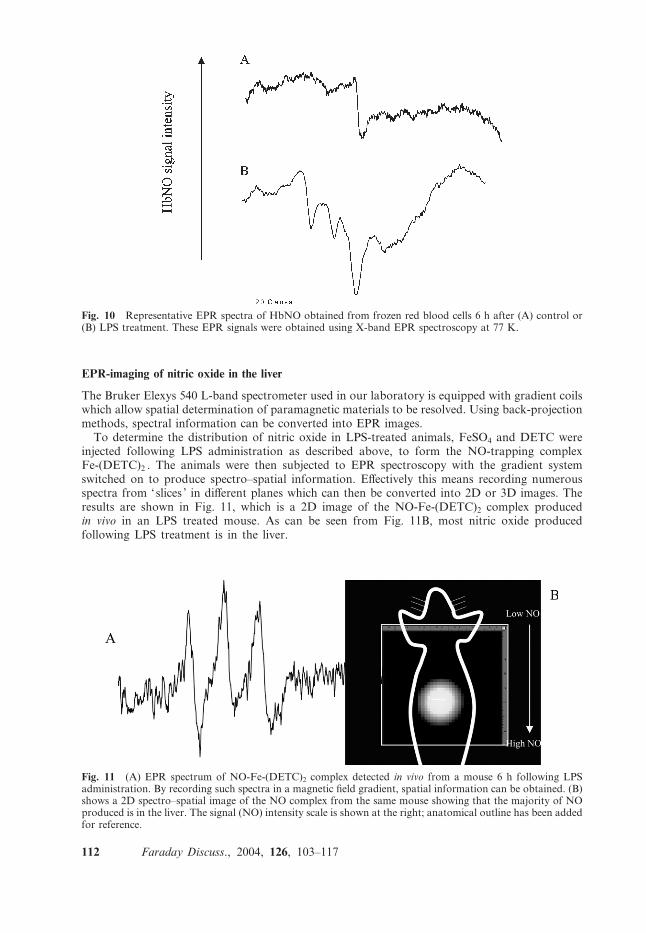
Nitric oxide metabolites, such as nitrite and nitrate, can be measured in the blood followingLPS administration in experimental models of sepsis and in patients with septic shock.18 How-ever, because these are stable metabolites of nitric oxide, the origins of the nitric oxide areobscure.The increase in circulating NO. is largely responsible for the systemic hypotension which
accompanies severe sepsis. We measured nitric oxide in the circulation by detecting NO com-plexes of haemoglobin (HbNO). In this case, haemoglobin is acting in a similar manner to theiron chelate thiocarbamate spin traps. HbNO is a useful measure of ‘bioavailable ’ nitric oxidein the circulation. Blood was taken from septic and control mice and immediately snap frozenin liquid nitrogen. The EPR spectra of HbNO were obtained from these samples at 77 K.Typical EPR spectra of HbNO obtained from the blood of LPS-treated and control mice areshown in Fig. 10.
Fig. 8 Typical in vivo EPR spectra of NO-Fe-(DETC)2 complex observed from the liver using L-band EPRspectroscopy in (A) saline and (B) LPS-treated mice. EPR spectra were recorded in vivo from liver 6 h post LPSor saline treatment.
Fig. 9 Representative Western blot showing the induction of iNOS expression in liver by LPS treatment.Liver tissue samples were taken at 6 h after LPS administration (+) and from control (�) animals and iNOSdetected by Western blotting.
Faraday Discuss., 2004, 126, 103–117 111
EPR-imaging of nitric oxide in the liver
The Bruker Elexys 540 L-band spectrometer used in our laboratory is equipped with gradient coilswhich allow spatial determination of paramagnetic materials to be resolved. Using back-projectionmethods, spectral information can be converted into EPR images.
To determine the distribution of nitric oxide in LPS-treated animals, FeSO4 and DETC wereinjected following LPS administration as described above, to form the NO-trapping complexFe-(DETC)2 . The animals were then subjected to EPR spectroscopy with the gradient systemswitched on to produce spectro–spatial information. Effectively this means recording numerousspectra from ‘slices ’ in different planes which can then be converted into 2D or 3D images. Theresults are shown in Fig. 11, which is a 2D image of the NO-Fe-(DETC)2 complex producedin vivo in an LPS treated mouse. As can be seen from Fig. 11B, most nitric oxide producedfollowing LPS treatment is in the liver.
Fig. 10 Representative EPR spectra of HbNO obtained from frozen red blood cells 6 h after (A) control or(B) LPS treatment. These EPR signals were obtained using X-band EPR spectroscopy at 77 K.
Fig. 11 (A) EPR spectrum of NO-Fe-(DETC)2 complex detected in vivo from a mouse 6 h following LPSadministration. By recording such spectra in a magnetic field gradient, spatial information can be obtained. (B)shows a 2D spectro–spatial image of the NO complex from the same mouse showing that the majority of NOproduced is in the liver. The signal (NO) intensity scale is shown at the right; anatomical outline has been addedfor reference.
112 Faraday Discuss., 2004, 126, 103–117
2. LPS-induced changes in brain pO2
We developed protocols utilising different EPR oximetry probes to investigate the relationshipbetween blood oxygenation and cerebral tissue pO2 . These methods were then applied to the studyof brain oxygenation in our model of LPS-induced septic shock. LiPc was the probe of choice toreport on cerebral tissue pO2 as it has a high spin density providing excellent signal:noise ratios. Italso has good sensitivity to oxygen in terms of the magnitude of changes of linewidths per unit ofoxygen across a wide range of pO2 .
10 In addition, it remains at the site where implanted, andreports directly on tissue pO2 .
10,19 Measurements of blood pO2 were made using the soluble freeradical Trityl. As a soluble material it has the advantage of not requiring any surgery for itsadministration to the site of interest. Trityl diffuses freely into the blood providing a uniformsampling environment (measuring the average of both arterial and venous pO2). It provides verystrong Lorentzian line shapes that broaden modestly, but reproducibly in the presence of oxygen.The aim of this study was to utilise these probes in our experimental model of septic shock to
measure cerebral blood and tissue oxygen to investigate if these are altered in a similar manner tothe decreases in oxygenation induced by LPS in other organs.Mice were administered with LPS as described previously at 50 mg kg�1 and cerebral tissue and
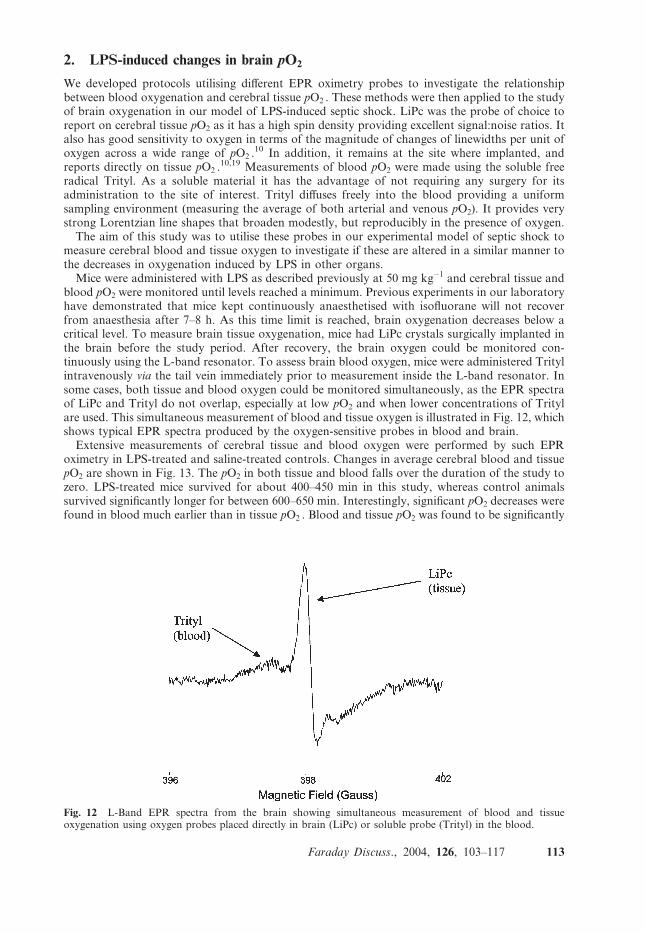
blood pO2 were monitored until levels reached a minimum. Previous experiments in our laboratoryhave demonstrated that mice kept continuously anaesthetised with isofluorane will not recoverfrom anaesthesia after 7–8 h. As this time limit is reached, brain oxygenation decreases below acritical level. To measure brain tissue oxygenation, mice had LiPc crystals surgically implanted inthe brain before the study period. After recovery, the brain oxygen could be monitored con-tinuously using the L-band resonator. To assess brain blood oxygen, mice were administered Tritylintravenously via the tail vein immediately prior to measurement inside the L-band resonator. Insome cases, both tissue and blood oxygen could be monitored simultaneously, as the EPR spectraof LiPc and Trityl do not overlap, especially at low pO2 and when lower concentrations of Tritylare used. This simultaneous measurement of blood and tissue oxygen is illustrated in Fig. 12, whichshows typical EPR spectra produced by the oxygen-sensitive probes in blood and brain.Extensive measurements of cerebral tissue and blood oxygen were performed by such EPR
oximetry in LPS-treated and saline-treated controls. Changes in average cerebral blood and tissuepO2 are shown in Fig. 13. The pO2 in both tissue and blood falls over the duration of the study tozero. LPS-treated mice survived for about 400–450 min in this study, whereas control animalssurvived significantly longer for between 600–650 min. Interestingly, significant pO2 decreases werefound in blood much earlier than in tissue pO2 . Blood and tissue pO2 was found to be significantly
Fig. 12 L-Band EPR spectra from the brain showing simultaneous measurement of blood and tissueoxygenation using oxygen probes placed directly in brain (LiPc) or soluble probe (Trityl) in the blood.
Faraday Discuss., 2004, 126, 103–117 113
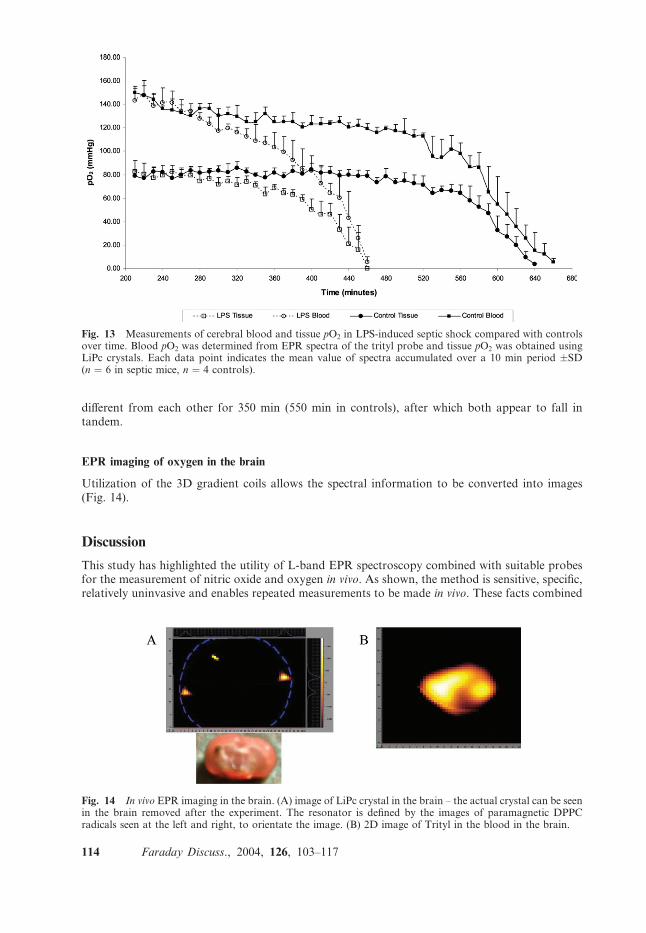
different from each other for 350 min (550 min in controls), after which both appear to fall intandem.
EPR imaging of oxygen in the brain
Utilization of the 3D gradient coils allows the spectral information to be converted into images(Fig. 14).
Discussion
This study has highlighted the utility of L-band EPR spectroscopy combined with suitable probesfor the measurement of nitric oxide and oxygen in vivo. As shown, the method is sensitive, specific,relatively uninvasive and enables repeated measurements to be made in vivo. These facts combined
Fig. 13 Measurements of cerebral blood and tissue pO2 in LPS-induced septic shock compared with controlsover time. Blood pO2 was determined from EPR spectra of the trityl probe and tissue pO2 was obtained usingLiPc crystals. Each data point indicates the mean value of spectra accumulated over a 10 min period �SD(n ¼ 6 in septic mice, n ¼ 4 controls).
Fig. 14 In vivo EPR imaging in the brain. (A) image of LiPc crystal in the brain – the actual crystal can be seenin the brain removed after the experiment. The resonator is defined by the images of paramagnetic DPPCradicals seen at the left and right, to orientate the image. (B) 2D image of Trityl in the blood in the brain.
114 Faraday Discuss., 2004, 126, 103–117
make L-band EPR spectroscopy the most suitable and applicable method for the detection andmeasurement of these paramagnetic species in real time in vivo.The paper has illustrated the utility of the method by reference to its application to the study of
severe sepsis in a model developed in our laboratory.Sepsis is a serious and often fatal condition which can arise from serious infections or trauma.
Severe sepsis is accompanied by an overwhelming inflammatory response and dysregulation of thecardiovascular system.20,21 A hallmark of severe sepsis is the dysfunction or failure of one or moreorgans and this is assumed to be due to tissue hypoxia. However, the interplay between inflam-matory mediators and tissue oxygen has not been clearly shown. Nitric oxide (NO) is known to beincreased in severe sepsis and this contributes to the profound hypotension of septic shock. Nitricoxide, and its product from superoxide reactions, peroxynitrite are toxic and may directly impairmitochondrial function22 leading to decreased oxygen utilisation in the tissue. Oxygen is a criticalcofactor for NO biosynthesis and is required at concentrations above 9 mM for normal NO pro-duction.23 The interplay between oxygen and NO is therefore complex and an understanding of theconcentrations of these critical molecules is paramount to improve our knowledge of septic shock.However, research into these parameters has been hampered by the lack of a reliable technique tomeasure them in vivo. Our group has been developing EPR methods to study oxygen and NOin vivo in sepsis and other conditions of the cardiovascular system.23–25 We have developed a mousemodel of LPS-induced septic shock in which we can measure oxygen and NO in vivo at selectedsites in tissues and in the blood. Studies with this model, and data presented in this paper, showthat LPS induces NO in the liver and systemically and that this is most likely due to upregulation ofiNOS in the liver. EPR imaging experiments confirm that the liver is the major site of NO pro-duction in this experimental model of septic shock. Measurements of liver oxygen by EPR oximetryreveal that LPS induces a profound decrease in oxygen. Selective placement of the oxygen-sensitiveprobe Gloxy in the liver lobule and at the sinusoids have shown that this decrease is of the samemagnitude at all sites in the liver and suggests that the decrease in pO2 is due to altered perfusion ofthe organ and shunting of blood rather than defects in oxygen extraction. Indeed, the production ofa certain amount of nitric oxide may be necessary to maintain correct liver perfusion and removingnitric oxide at these sites may have detrimental effects. Our recently published work utilising anNADPH inhibitor, indicates that preserving NO at the liver increases blood flow and tissue oxy-genation.26 This indicates that excessive activation of the NADPH oxidase, and hence suoperoxideradical, may remove nitric oxide by forming peroxynitrite which inhibits liver perfusion and causestissue damage.The brain as an organ in severe sepsis has received little attention. It is not clear how the blood
and brain tissue oxygenation are affected in severe sepsis. Investigators have suggested thatinadequate blood flow to individual organs may produce organ failure despite normal or increasedsystemic flow. The question of flow mal-distribution in sepsis appears to be central to an under-standing of the syndrome. As cardiac output and oxygen delivery are initially increased in clinicalsepsis, the choice of supportive measures becomes critically dependent upon knowledge of whetherregional or systemic flow is adequate or should be further augmented in an effort to prevent tissueinjury.27 In some animal models, cerebral blood flow is significantly reduced,28 whilst others showno significant alteration. However, it is known that septic patients commonly demonstrate changesin mental status that can range from mild confusion to coma. This ‘ septic encephalopathy’probably arises from the action of inflammatory mediators in the brain, or a cytotoxic response bybrain cells to these mediators.29
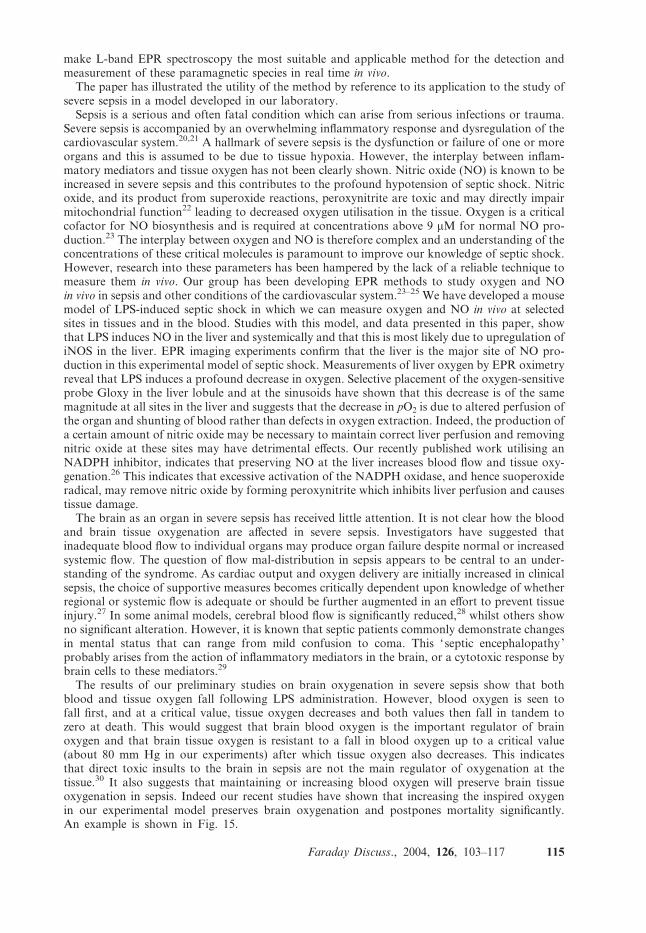
The results of our preliminary studies on brain oxygenation in severe sepsis show that bothblood and tissue oxygen fall following LPS administration. However, blood oxygen is seen tofall first, and at a critical value, tissue oxygen decreases and both values then fall in tandem tozero at death. This would suggest that brain blood oxygen is the important regulator of brainoxygen and that brain tissue oxygen is resistant to a fall in blood oxygen up to a critical value(about 80 mm Hg in our experiments) after which tissue oxygen also decreases. This indicatesthat direct toxic insults to the brain in sepsis are not the main regulator of oxygenation at thetissue.30 It also suggests that maintaining or increasing blood oxygen will preserve brain tissueoxygenation in sepsis. Indeed our recent studies have shown that increasing the inspired oxygenin our experimental model preserves brain oxygenation and postpones mortality significantly.An example is shown in Fig. 15.
Faraday Discuss., 2004, 126, 103–117 115
Potential diagnostic applications
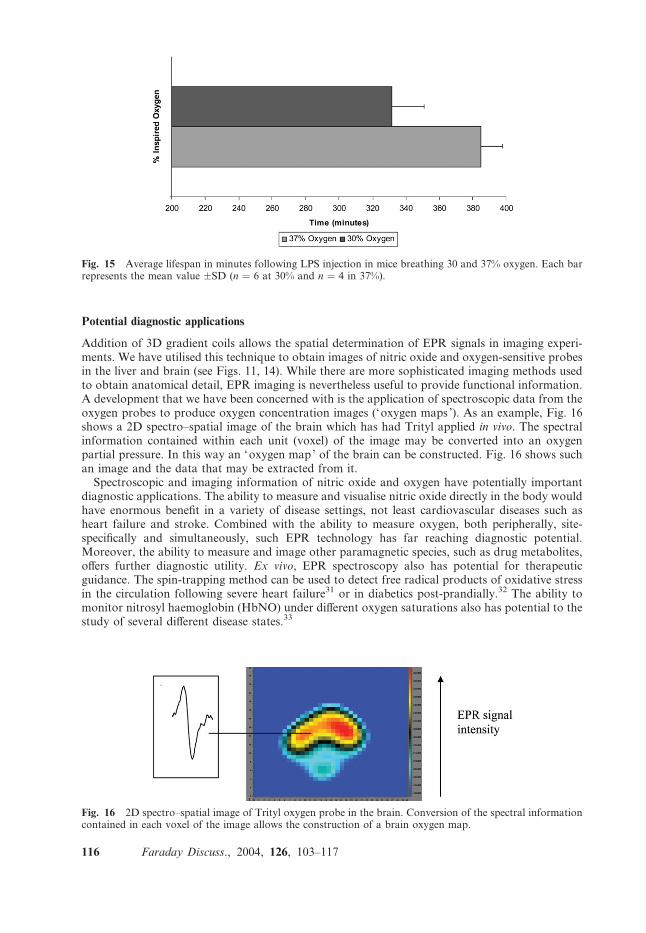
Addition of 3D gradient coils allows the spatial determination of EPR signals in imaging experi-ments. We have utilised this technique to obtain images of nitric oxide and oxygen-sensitive probesin the liver and brain (see Figs. 11, 14). While there are more sophisticated imaging methods usedto obtain anatomical detail, EPR imaging is nevertheless useful to provide functional information.A development that we have been concerned with is the application of spectroscopic data from theoxygen probes to produce oxygen concentration images (‘oxygen maps ’). As an example, Fig. 16shows a 2D spectro–spatial image of the brain which has had Trityl applied in vivo. The spectralinformation contained within each unit (voxel) of the image may be converted into an oxygenpartial pressure. In this way an ‘oxygen map’ of the brain can be constructed. Fig. 16 shows suchan image and the data that may be extracted from it.
Spectroscopic and imaging information of nitric oxide and oxygen have potentially importantdiagnostic applications. The ability to measure and visualise nitric oxide directly in the body wouldhave enormous benefit in a variety of disease settings, not least cardiovascular diseases such asheart failure and stroke. Combined with the ability to measure oxygen, both peripherally, site-specifically and simultaneously, such EPR technology has far reaching diagnostic potential.Moreover, the ability to measure and image other paramagnetic species, such as drug metabolites,offers further diagnostic utility. Ex vivo, EPR spectroscopy also has potential for therapeuticguidance. The spin-trapping method can be used to detect free radical products of oxidative stressin the circulation following severe heart failure31 or in diabetics post-prandially.32 The ability tomonitor nitrosyl haemoglobin (HbNO) under different oxygen saturations also has potential to thestudy of several different disease states.33
Fig. 15 Average lifespan in minutes following LPS injection in mice breathing 30 and 37% oxygen. Each barrepresents the mean value �SD (n ¼ 6 at 30% and n ¼ 4 in 37%).
Fig. 16 2D spectro–spatial image of Trityl oxygen probe in the brain. Conversion of the spectral informationcontained in each voxel of the image allows the construction of a brain oxygen map.
116 Faraday Discuss., 2004, 126, 103–117
References
1 J. C. Evans and S. K. Jackson, Anal. Proc., 1990, 27, 215.2 Biological magnetic resonance, ed. L. J. Berliner, Plenum, New York 2000 vol. 18.3 EPR imaging and in-vivo EPR, ed. G. R. Eaton, S. S. Eaton and K. Ohno, CRC Press, Boca Raton,
Florida. 1991.4 S. Moncada and Higgs, New Engl. J. Med., 1993, 329, 2002.5 P. E. James, M. Miyake and H. M. Swartz, Nitric Oxide, 1999, 3, 292.6 H. Fujii, J. Koscielniak and L. J. Berliner, Magn. Reson. Med., 1997, 38, 565.7 M. T. Gladwin, Proc. Natl. Acad. Sci. USA., 2000, 97, 9943.8 A. J. Gow, B. P. Luchsinger, J. R. Pawloski, D. J. Singel and J. S. Stamler, Proc. Natl. Acad. Sci. USA,
1999, 96, 9027.9 J. A. Raleigh, M. W. Dewhirst and D. E. Thrall, Semin. Radiat. Oncol., 1996, 6, 37.10 H. M. Swartz and R. B. Clarkson, Phys. Med. Biol., 1998, 43, 1957.11 H. M. Swartz, in Biological Magnetic Resonance ed. L. J. Berliner, Plenum, New York, 2002, p. 20.12 P. E. James, K. J. Liu and H. M. Swartz, in Oxygen Transport to Tissue XX, ed. A. Hudetz and D. Bruley,
Plenum, New York, 1997, p. 181.13 P. E. James, O. Y. Grinberg, F. Goda, J. A. O’hara and H. M. Swartz, Magn. Reson. Med., 1997, 38, 48.14 S. K. Jackson, Br. J. Intensive Care, 1994, Oct suppl. 17.15 S. K. Jackson, Prog. Lipid Res., 1997, 36, 227.16 C. Thiemermann, Gen. Pharmacol., 1997, 29, 159.17 S. K. Jackson, M. Madhani, M. Thomas, G. S. Timmins and P. E. James, Toxicol. Lett., 2001, 120, 253.18 M. A. Titherage, Biochim. Biophys. Acta., 1999, 1411, 437.19 J. F. Glockner and H. M. Swartz, in Oxygen Transport to Tissue XIV, ed. W. Erdmann and D. F. Bruley,
Plenum, New York, 1992, p. 221.20 M. P. Glauser, G. Zanetti, J. D. Baumgartner and J. Cohen, Lancet, 1991, 338, 732.21 H. Darmani, J. Harwood and S. K. Jackson, Cellular Immunol., 1993, 152, 59.22 J. S. Beckman, Nitric Oxide, Principles and Actions, Academic Press, San Diego, 1996.23 P. E. James, J. Parton, S. K. Jackson and M. P. Frenneaux, Adv. Exp. Med. Biol., 2003, 510, 139–143.24 P. E. James, M. Madhani, W. Roebuck, S. K. Jackson and H. M. Swartz, Nitric Oxide., 2002, 6, 18.25 P. E. James, G. Bacic, O. Grinberg, F. Goda, J. F. Dunn, S. K. Jackson and H. Swartz, Free Rad. Biol.
Med., 1996, 21, 25.26 M. Madhani, A. Barchowsky, L. Klei, C. R. Ross, S. K. Jackson, H. M. Swartz and P. E. James, Biochim.
Biophys. Acta., 2002, 1588, 232.27 D. L. Bowton, Crit. Care Clin., 1989, 5, 785.28 D. L. Bowton, N. H. Bertels, D. S. Prough and D. A. Stump, Crit. Care Med., 1989, 17, 399.29 M. C. Papadopoulos, D. C. Davies, R. F. Moss, D. Tighe and E. D. Bennett, Crit. Care Med., 2000, 28,
3019.30 M. P. Thomas, S. K. Jackson and P. E. James, Adv. Exp. Med. Biol., 2003, 510, 205.31 G. R. Ellis, A. K. Nightingale, D. J. Blackman, R. A. Anderson, C. Mumford, G. Timmins, D. Lang, S. K.
Jackson, M. D. Penney, M. J. Lewis, M. P. Frenneaux, J. Morris-Thurgood and M. J. Lewis, Eur. J. HeartFailure, 2002, 4, 193.
32 L. M. Evans, R. Anderson, G. Ellis, R. H. K. Morris, S. K. Jackson, M. J. Lewis, M. P. Frenneauxc andA. Rees, Circulation, 2000, 101, 1773.
33 A. B. Milsom, C. J. H. Jones, J. Goodfellow, M. P. Frenneaux, J. R. Peters and P. E. James, Diabetologia,2002, 45, 1515.
Faraday Discuss., 2004, 126, 103–117 117