improving alertness and performance in emergency department physicians and nurses: the use of...
TRANSCRIPT
PHYSICIAN WELLNESS/ORIGINAL RESEARCH
Improving Alertness and Performance in Emergency DepartmentPhysicians and Nurses: The Use of Planned Naps
Rebecca Smith-Coggins, MDSteven K. Howard, MDDat T. Mac, MSCynthia Wang, MDSharon Kwan, MDMark R. Rosekind, PhDYasser Sowb, PhDRaymond Balise, PhDJoel Levis, MD, PhDDavid M. Gaba, MD
From Stanford University, Palo Alto, CA (Smith-Coggins, Howard, Wang, Kwan, Balise, Levis, Gaba);the Department of Anesthesia, VA Palo Alto Health Care System, Palo Alto, CA (Howard, Mac,Sowb, Gaba); Alertness Solutions, Inc., Cupertino, CA (Rosekind); and Kaiser Permanente, SantaClara, CA (Levis).
Study objective: We examine whether a 40-minute nap opportunity at 3 AM can improve cognitive andpsychomotor performance in physicians and nurses working 12-hour night shifts.
Methods: This is a randomized controlled trial of 49 physicians and nurses working 3 consecutivenight shifts in an academic emergency department. Subjects were randomized to a control group (no-nap condition�NONE) or nap intervention group (40-minute nap opportunity at 3 AM�NAP). The mainoutcome measures were Psychomotor Vigilance Task, Probe Recall Memory Task, CathSimintravenous insertion virtual reality simulation, and Profile of Mood States, which were administeredbefore (6:30 PM), during (4 AM), and after (7:30 AM) night shifts. A 40-minute driving simulation wasadministered at 8 AM and videotaped for behavioral signs of sleepiness and driving accuracy. Duringthe nap period, standard polysomnographic data were recorded.
Results: Polysomnographic data revealed that 90% of nap subjects were able to sleep for an averageof 24.8 minutes (SD 11.1). At 7:30 AM, the nap group had fewer performance lapses (NAP 3.13,NONE 4.12; p�0.03; mean difference 0.99; 95% CI: �0.1-2.08), reported more vigor (NAP 4.44,NONE 2.39; p�0.03; mean difference 2.05; 95% CI: 0.63-3.47), less fatigue (NAP 7.4, NONE10.43; p�0.05; mean difference 3.03; 95% CI: 1.11-4.95), and less sleepiness (NAP 5.36, NONE6.48; p�0.03; mean difference 1.12; 95% CI: 0.41-1.83). They tended to more quickly complete theintravenous insertion (NAP 66.40 sec, NONE 86.48 sec; p�0.10; mean difference 20.08; 95% CI:4.64-35.52), exhibit less dangerous driving and display fewer behavioral signs of sleepiness duringthe driving simulation. Immediately after the nap (4 AM), the subjects scored more poorly on ProbedRecall Memory (NAP 2.76, NONE 3.7; p�0.05; mean difference 0.94; 95% CI: 0.20-1.68).
Conclusion: A nap at 3 AM improved performance and subjective report in physicians and nurses at7:30 AM compared to a no-nap condition. Immediately after the nap, memory temporarily worsened.The nap group did not perform any better than the no-nap group during a simulated drive home afterthe night shift. [Ann Emerg Med. 2006;48:596-604.]
0196-0644/$-see front matterCopyright © 2006 by the American College of Emergency Physicians.doi:10.1016/j.annemergmed.2006.02.005
INTRODUCTIONBackground
Health care professionals perform rotating shift work to
provide patient care 24 hours a day. Not only does this present a596 Annals of Emergency Medicine
serious concern for patient safety but also it places the workersthemselves at risk for problems associated with circadiandisruption and sleep deprivation.1–6 It has been well
documented that shift workers sleep less, perform less effectivelyVolume , . : November
Smith-Coggins et al Planned Naps for Emergency Physicians
on psychomotor and cognitive tests, make more errors duringnight shifts, and are at higher risk for driving crashes because ofpostnight shift drowsiness.7–12
Adequate sleep before a night shift addresses a corephysiological mechanism that underlies performance andalertness, though circadian factors typically reduce thequantity and quality of this day sleep.13 Therefore, plannednaps in the workplace might be effective for health careprofessionals to promote a high level of alertness, attentionto detail, and decisionmaking proficiency. Studies havedemonstrated that under conditions of prolongedwakefulness, naps can improve performance and alertness.14 –
17 Field studies in pilots and truckers have shown that napsmitigate drowsiness and improve performance andalertness.18 –20 In a randomized, prospective study of plannednaps as an operational countermeasure in a high-riskindustry, long-haul flight crew members who napped hadsignificantly improved performance and alertness, includingfewer microsleeps in the last 90 minutes of flight.21 Based onthese findings, a proposed Federal Aviation Administrationadvisory circular outlined the use of planned naps for flightcrews. Several international airlines, including BritishAirways, Air New Zealand, Lufthansa, Quantas, Swissair,and Finnair, have implemented planned cockpit napprocedures, whereas the Federal Aviation Administrationcontinues its consideration for use in the United States.22
However, planned naps have not been adequately tested as a
Editor’s Capsule Summary
What is already known on this topicNight shifts interfere with circadian rhythms and canimpair workers’ motor functioning and mental alertness.There have been reports of increased motor vehiclecollisions after night shifts.
What question this study addressedThis randomized controlled trial addresses whether abrief nap during a 12-hour night shift improves cognitiveand psychomotor performance as measured by cognitivetests and driving simulation.
What this study adds to our knowledgePhysicians and nurses felt better after the nap. The napimproved performance on end-of-shift cognition tests butnot on driving simulation. The nap group performed lesswell on memory tests performed immediately after thenap.
How this might change clinical practiceThis study provides some support for the value of a shortnap during longer night shifts.
fatigue countermeasure for physicians and nurses.
Volume , . : November
Goals of This InvestigationThe goal of this study was to conduct a randomized
controlled trial of napping as an intervention in the middle of anight shift for a physician and nurse population to see if there isimprovement in their cognitive and psychomotor performance,ability to drive home, and subjective report.
MATERIALS AND METHODSStudy Design and Setting
The study design was a randomized, controlled interventiontrial conducted at a university emergency department (ED). TheED had 38,802 patient visits during the recruitment period,with 38.2% of visits occurring between 7:30 PM and 7:30 AM.The study was approved by the university’s human subjectscommittee, and written informed consent was obtained for allsubjects.
Selection of ParticipantsInclusion criteria were resident physicians and nurses
working at least 3 consecutive 12-hour night shifts in the ED.Attending physicians were not selected because they do notwork 12-hour night shifts at this institution. Fifty-three subjectswere recruited for this study between June 2001 and June 2002.Four subjects withdrew from the study, 2 because of dizzinessduring driving simulation practice and 2 because of scheduleconflicts. Data are presented from the remaining 49 subjects inAppendix E1, Figure E1 (available online athttp://www.annemergmed.com).
Data Collection and ProcessingSubjects completed a background questionnaire and 3
additional instruments: Sleep Disorders Questionnaire, Shift-work Experiences Questionnaire, and Owl and LarkQuestionnaire. Each subject practiced all the performance teststwice, except the catheter simulation, which was practiced 3times.
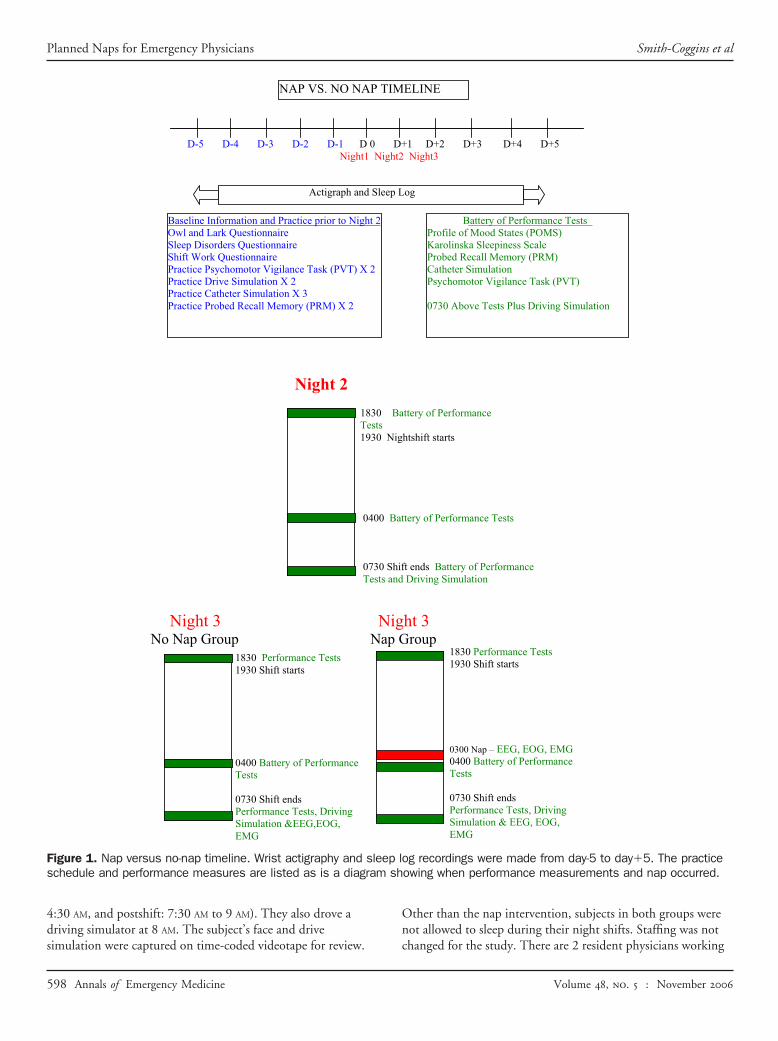
An actigraph wrist activity monitor was worn by each subject4 days before night 2 and removed 5 days after night 3. Sleeplogs also were completed during this time. Subjects wereinstructed to refrain from drinking caffeine during each nightshift. After the first night shift of the 3-block sequence, eachsubject was studied during the next 2 consecutive 12-hour nightshifts (Figure 1). During the first of these study night shifts(night 2), all subjects worked their shift in their usual fashion.On the third night shift (night 3), subjects were randomizedinto “nap” or “no-nap” groups at 11 PM. Subjects randomized tothe nap group (NAP) had a 40-minute, midshift napopportunity between 3 AM and 4 AM. The nap opportunityoccurred in a dark quiet room away from clinical sites; a bedand linens were provided. During the nap, polysomnographicdata were recorded. The group randomized to no nap (NONE)continued to work from 3 AM to 4 AM as usual.
Both groups completed performance tests 3 times during
each study shift (preshift: 6:30 PM to 7:30 PM; midshift: 4 AM toAnnals of Emergency Medicine 597
sh
Planned Naps for Emergency Physicians Smith-Coggins et al
4:30 AM, and postshift: 7:30 AM to 9 AM). They also drove adriving simulator at 8 AM. The subject’s face and drive
NAP VS. NO NAP
D-5 D-4 D-3 D-2 D-1 D 0 Night1 N
Actigraph and S
Baseline Information and Practice prior to Night 2Owl and Lark Questionnaire Sleep Disorders Questionnaire Shift Work Questionnaire Practice Psychomotor Vigilance Task (PVT) X 2 Practice Drive Simulation X 2 Practice Catheter Simulation X 3 Practice Probed Recall Memory (PRM) X 2
Night 2
1830Test1930
040
073Tes
0400 Battery of Performance Tests
0730 Shift ends Performance Tests, Driving Simulation &EEG,EOG, EMG
Night 3 No Nap Group N
1830 Performance Tests1930 Shift starts
Figure 1. Nap versus no-nap timeline. Wrist actigraphy and sleschedule and performance measures are listed as is a diagram
simulation were captured on time-coded videotape for review.
598 Annals of Emergency Medicine
Other than the nap intervention, subjects in both groups werenot allowed to sleep during their night shifts. Staffing was not
ELINE
1 D+2 D+3 D+4 D+5 Night3
og
Battery of Performance TestsProfile of Mood States (POMS) Karolinska Sleepiness Scale Probed Recall Memory (PRM) Catheter Simulation Psychomotor Vigilance Task (PVT)
0730 Above Tests Plus Driving Simulation
ttery of Performance
htshift starts
tery of Performance Tests
t ends Battery of Performance Driving Simulation
ht 3 roup
1830 Performance Tests1930 Shift starts
0300 Nap – EEG, EOG, EMG0400 Battery of Performance Tests
0730 Shift ends Performance Tests, Driving Simulation & EEG, EOG, EMG
og recordings were made from day-5 to day�5. The practiceowing when performance measurements and nap occurred.
TIM
D+ight2
leep L
Bas Nig
0 Bat
0 Shifts and
Nigap G
ep l
changed for the study. There are 2 resident physicians working
Volume , . : November
//
Smith-Coggins et al Planned Naps for Emergency Physicians
all night. There are a decreasing number of nurses throughoutthe night, but never fewer than 3. Patient care was continued bycross-coverage.
Using a 50:50 randomization allocation ratio, investigatorscreated sealed envelopes containing concealed assignment codesgiven sequentially to eligible subjects by a research associate.Thus, subjects and researchers were blinded as to groupassignment until 11 PM of night 3.
Methods of MeasurementSubjects completed a daily sleep/wake diary for a total of 11
days, including the 2 testing days.To obtain an objective measure of sleep quantity, subjects
wore a wrist activity monitor (Actiwatch 64, 198-0100-00;Mini Mitter Company, Inc., Bend, OR) for 11 days.23
Actiwatch-Score software (Mini Mitter Company, Inc.) wasused to score actigraph data.
Polysomnographic data were collected during the napopportunity with the TEMEC 8 Channel Universal Vitaport3 Recorder (TEMEC Instruments B.V., Kerkrade, TheNetherlands). Standard polysomnographic variables wereobtained (see technical Appendix E1, available online at http:www.annemergmed.com).24,25 These measures allowedphysiologic differentiation of the states and stages of sleep,including analysis of sleep latency (time from lights out to sleeponset), total sleep time, and sleep efficiency. Data were analyzedby an experienced technologist blinded to the protocol. For amore in-depth discussion of the measures, see Appendix E1(available online at http://www.annemergmed.com).
The Psychomotor Vigilance Task (Ambulatory Monitoring,Inc., Ardsley, NY) is a well-validated, 10-minute test of simplevisual reaction time and has been used extensively to evaluatesustained attention.26 It has been shown to be a sensitivemeasure of sleep loss and circadian variation.27,28 During thetask, stimuli occur at random between 2 and 10 seconds afterthe previous response, with usually 90 to 100 separate reactiontimes in a 10-minute Psychomotor Vigilance Task.27,29
In the validated Probed Recall Memory task, subjects have30 seconds to memorize 6 word pairs. The Probed RecallMemory score is the number of words correctly recalled.30
The CathSim intravenous insertion virtual reality simulationis a computer-based intravenous insertion simulation (HTMedical Systems, Inc., Gaithersburg, MD). The construct andcontent validity of CathSim intravenous insertion virtual realitysimulation have been established.31 Measures to evaluate asubject’s performance included the elapsed time fromtourniquet placement to successful completion of procedure,number of attempts, and hematomas.
The StiSim Drive Simulation System (Systems Technology,Inc., Hawthorne, CA) is a computerized, interactive drivingsimulator that mimics psychomotor, divided-attention, andcognitive tasks involved during a drive. Subjects completed a36.7-mile drive (40 minutes if going the speed limit). Anobserver blinded to condition rated tapes for car position
relative to the road. Dangerous driving is defined as the carVolume , . : November
leaving the road or colliding with an oncoming vehicle. For eachsimulated drive, these ratings were obtained with a 1-secondresolution using MacShapa video annotating software(CSERIAC, Wright-Patterson Air Force Base, Dayton, OH).
To assess drowsy driving during the simulated drive home,the videotapes of the subjects’ faces during the simulated drivewere rated by an observer blinded to condition for signs ofbehavioral alertness. These ratings were obtained with a 1-second resolution using MacShapa video annotating software.This method was used in a fatigue study of anesthesia residents,where it was determined to have adequate interrater reliability.32
The percentage of time with eyes closed is reported.Profile of Mood States is a questionnaire with 6 scales of
mood and emotion (POMS EdiTS/Educational and IndustrialTesting Service, San Diego, CA). Results are categorized into 6mood states: anger, confusion, depression, fatigue, tension, andvigor.
The Karolinska Sleepiness Scale is a 9-point ordinal ratingscale of self-perceived sleepiness that has been validated againstperformance measures in sleep deprivation.33
Primary Data AnalysisData and statistical analyses were conducted using a variety
of software, including Microsoft Excel 98 (Microsoft,Redmond, WA), GraphPad PRISM Version 4 (GraphPadSoftware, Inc., San Diego, CA) and SuperANOVA (AbacusConcepts, Berkeley, CA). The Mann-Whitney nonparametrictest was used to analyze the difference in performance betweenNAP and NONE because the distributions were non-Gaussian.For shift/period effects (with or without napping), repeated-measures ANOVA was used despite the non-Gaussiandistributions because there is no multi–time pointnonparametric analog test available. We also compared the facialevidence of alertness during driving for the same individuals onnight 3 versus night 2 by plotting a scattergram of night 2alertness versus night 3 alertness. Aggregate data in tables andgraphs are shown as mean (SD) unless otherwise specified.Statistical significance was considered at P�.05.
For each driving simulation, the varying alertness scoresconstituted a time series. The fraction of driving time spent by asubject at each alertness score was determined from the video.Because alertness scores of 2 or lower represented unequivocalsleepy behavior, the fraction of time spent at or below this levelalso was determined and labeled percentage of time with eyesclosed.
RESULTSTable 1 shows demographic characteristics of the 2 groups of
subjects. There were no differences between NAP and NONE.There were no differences between the 2 groups with
reference to the Sleep Disorders Questionnaire, Shift-workExperiences Questionnaire, or Owl and Lark Questionnaire. Allsubjects scored within normal limits on the Sleep Disorders
Questionnaire and reported no evidence of clinical sleepAnnals of Emergency Medicine 599
Planned Naps for Emergency Physicians Smith-Coggins et al
disorders. As a whole, the groups reported that their optimalsleep would be mean 9.0 (SD 1.4) hours for the nap group and9.1 (SD 1.3) hours for the no-nap group. Subjects showed nopreference for morning or evening work on the Owl and LarkQuestionnaire.
There were no differences in total sleep time for the NAPversus NONE (Table 1). There was no difference between totalsleep time for physicians (7 hours 25 minutes) versus registerednurses (7 hours 22 minutes) or for men (7 hours 10 minutes)versus women (7 hours 23 minutes).
Twenty-six subjects were randomized to NAP. Two of theelectroencephalogram (EEG) data files were lost, and 3 wereunreadable. Of the remaining 21, 19 (90%) of the nap subjectsslept during the 40-minute napping opportunity; those whonapped accrued an average total sleep time of 24.8 (SD 11.1)minutes (Table 2). Sleep latency (time from lights out notedreal time by the research assistant on the TEMEC recorder tosleep onset noted on EEG files) for nap subjects was 8.9 (SD5.5) minutes. Eight of 19 subjects had sleep latency of 0 to 5minutes, and 7 subjects had sleep latency greater than 11minutes.
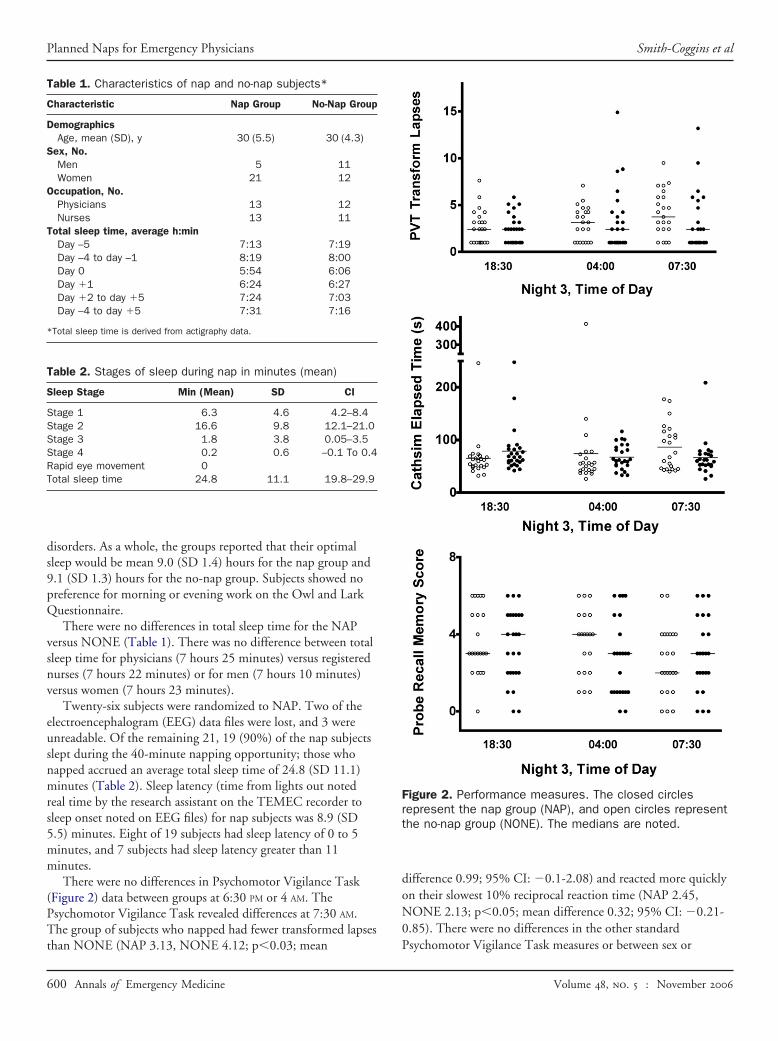
There were no differences in Psychomotor Vigilance Task(Figure 2) data between groups at 6:30 PM or 4 AM. ThePsychomotor Vigilance Task revealed differences at 7:30 AM.The group of subjects who napped had fewer transformed lapses
Table 1. Characteristics of nap and no-nap subjects*
Characteristic Nap Group No-Nap Group
DemographicsAge, mean (SD), y 30 (5.5) 30 (4.3)
Sex, No.Men 5 11Women 21 12
Occupation, No.Physicians 13 12Nurses 13 11
Total sleep time, average h:minDay –5 7:13 7:19Day –4 to day –1 8:19 8:00Day 0 5:54 6:06Day �1 6:24 6:27Day �2 to day �5 7:24 7:03Day –4 to day �5 7:31 7:16
*Total sleep time is derived from actigraphy data.
Table 2. Stages of sleep during nap in minutes (mean)
Sleep Stage Min (Mean) SD CI
Stage 1 6.3 4.6 4.2–8.4Stage 2 16.6 9.8 12.1–21.0Stage 3 1.8 3.8 0.05–3.5Stage 4 0.2 0.6 –0.1 To 0.4Rapid eye movement 0Total sleep time 24.8 11.1 19.8–29.9
than NONE (NAP 3.13, NONE 4.12; p�0.03; mean
600 Annals of Emergency Medicine
difference 0.99; 95% CI: �0.1-2.08) and reacted more quicklyon their slowest 10% reciprocal reaction time (NAP 2.45,NONE 2.13; p�0.05; mean difference 0.32; 95% CI: �0.21-0.85). There were no differences in the other standard
Figure 2. Performance measures. The closed circlesrepresent the nap group (NAP), and open circles representthe no-nap group (NONE). The medians are noted.
Psychomotor Vigilance Task measures or between sex or
Volume , . : November
Smith-Coggins et al Planned Naps for Emergency Physicians
occupation. There was no correlation between individual sleeplatency and performance on the Psychomotor Vigilance Task.
There were no differences between groups for Probed RecallMemory (Figure 2) at 6:30 PM or 7:30 AM. At 4 AM, the groupthat napped scored fewer correct answers than the group thatremained awake and working (NAP 2.76, NONE 3.7; p�0.05;mean difference 0.94; 95% CI: 0.20-1.68).
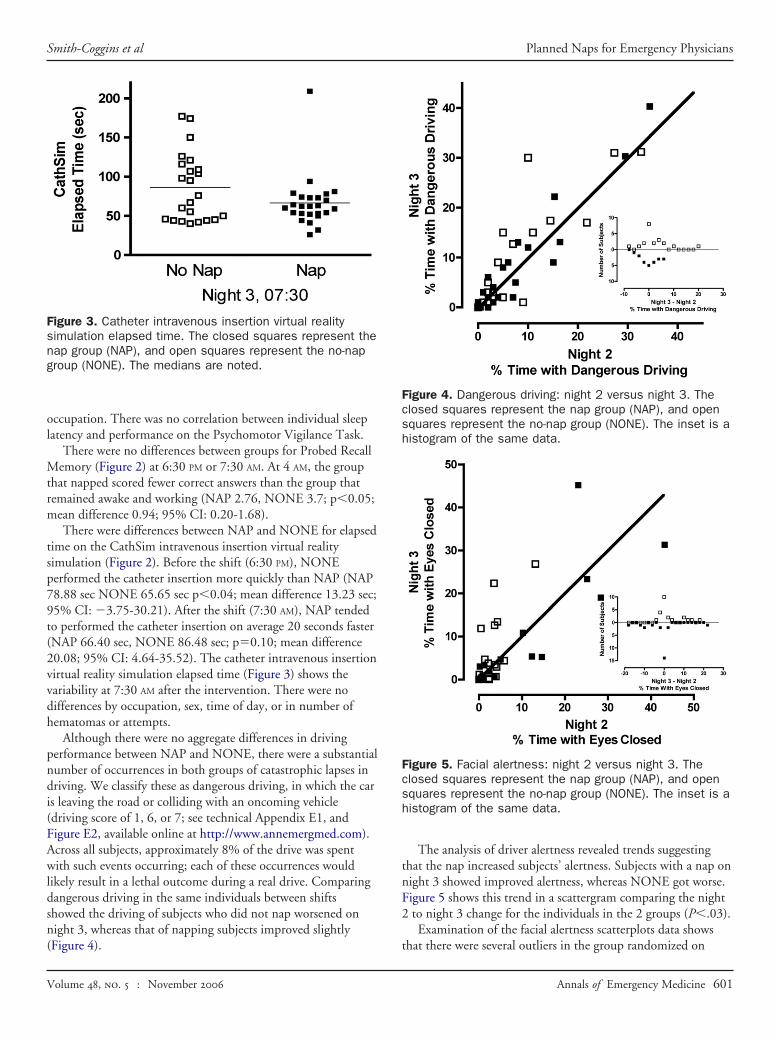
There were differences between NAP and NONE for elapsedtime on the CathSim intravenous insertion virtual realitysimulation (Figure 2). Before the shift (6:30 PM), NONEperformed the catheter insertion more quickly than NAP (NAP78.88 sec NONE 65.65 sec p�0.04; mean difference 13.23 sec;95% CI: �3.75-30.21). After the shift (7:30 AM), NAP tendedto performed the catheter insertion on average 20 seconds faster(NAP 66.40 sec, NONE 86.48 sec; p�0.10; mean difference20.08; 95% CI: 4.64-35.52). The catheter intravenous insertionvirtual reality simulation elapsed time (Figure 3) shows thevariability at 7:30 AM after the intervention. There were nodifferences by occupation, sex, time of day, or in number ofhematomas or attempts.
Although there were no aggregate differences in drivingperformance between NAP and NONE, there were a substantialnumber of occurrences in both groups of catastrophic lapses indriving. We classify these as dangerous driving, in which the caris leaving the road or colliding with an oncoming vehicle(driving score of 1, 6, or 7; see technical Appendix E1, andFigure E2, available online at http://www.annemergmed.com).Across all subjects, approximately 8% of the drive was spentwith such events occurring; each of these occurrences wouldlikely result in a lethal outcome during a real drive. Comparingdangerous driving in the same individuals between shiftsshowed the driving of subjects who did not nap worsened onnight 3, whereas that of napping subjects improved slightly
Figure 3. Catheter intravenous insertion virtual realitysimulation elapsed time. The closed squares represent thenap group (NAP), and open squares represent the no-napgroup (NONE). The medians are noted.
(Figure 4).
Volume , . : November
The analysis of driver alertness revealed trends suggestingthat the nap increased subjects’ alertness. Subjects with a nap onnight 3 showed improved alertness, whereas NONE got worse.Figure 5 shows this trend in a scattergram comparing the night2 to night 3 change for the individuals in the 2 groups (P�.03).
Examination of the facial alertness scatterplots data shows
Figure 4. Dangerous driving: night 2 versus night 3. Theclosed squares represent the nap group (NAP), and opensquares represent the no-nap group (NONE). The inset is ahistogram of the same data.
Figure 5. Facial alertness: night 2 versus night 3. Theclosed squares represent the nap group (NAP), and opensquares represent the no-nap group (NONE). The inset is ahistogram of the same data.
that there were several outliers in the group randomized on
Annals of Emergency Medicine 601
Planned Naps for Emergency Physicians Smith-Coggins et al
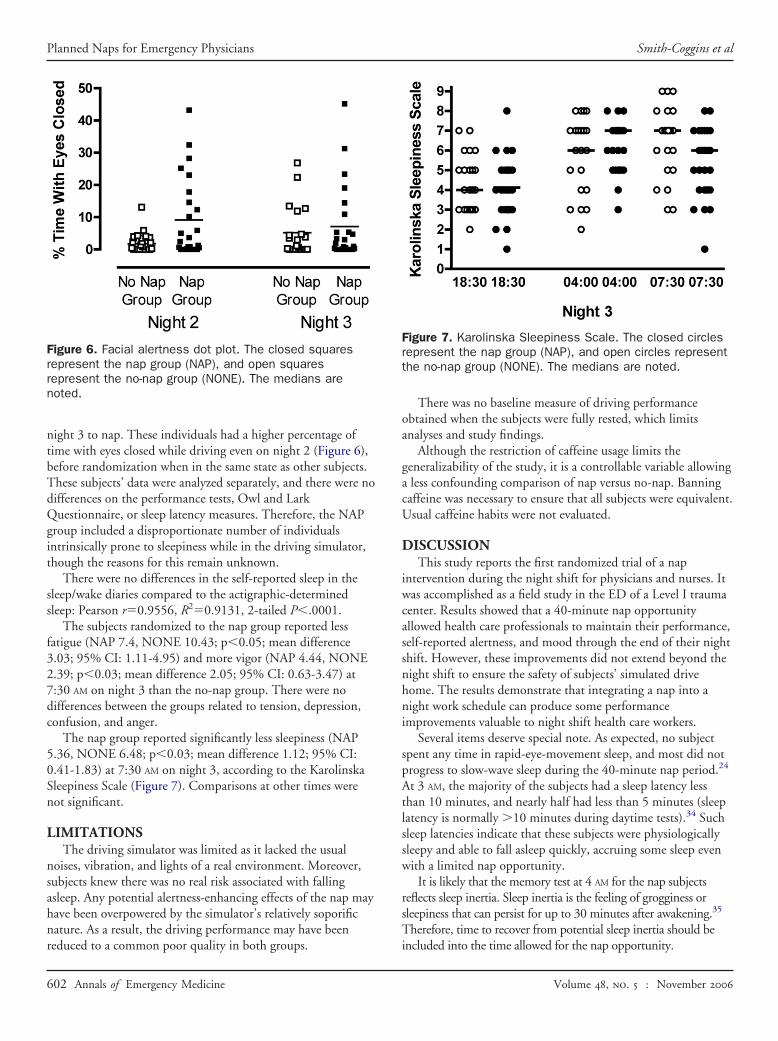
night 3 to nap. These individuals had a higher percentage oftime with eyes closed while driving even on night 2 (Figure 6),before randomization when in the same state as other subjects.These subjects’ data were analyzed separately, and there were nodifferences on the performance tests, Owl and LarkQuestionnaire, or sleep latency measures. Therefore, the NAPgroup included a disproportionate number of individualsintrinsically prone to sleepiness while in the driving simulator,though the reasons for this remain unknown.
There were no differences in the self-reported sleep in thesleep/wake diaries compared to the actigraphic-determinedsleep: Pearson r�0.9556, R2�0.9131, 2-tailed P�.0001.
The subjects randomized to the nap group reported lessfatigue (NAP 7.4, NONE 10.43; p�0.05; mean difference3.03; 95% CI: 1.11-4.95) and more vigor (NAP 4.44, NONE2.39; p�0.03; mean difference 2.05; 95% CI: 0.63-3.47) at7:30 AM on night 3 than the no-nap group. There were nodifferences between the groups related to tension, depression,confusion, and anger.
The nap group reported significantly less sleepiness (NAP5.36, NONE 6.48; p�0.03; mean difference 1.12; 95% CI:0.41-1.83) at 7:30 AM on night 3, according to the KarolinskaSleepiness Scale (Figure 7). Comparisons at other times werenot significant.
LIMITATIONSThe driving simulator was limited as it lacked the usual
noises, vibration, and lights of a real environment. Moreover,subjects knew there was no real risk associated with fallingasleep. Any potential alertness-enhancing effects of the nap mayhave been overpowered by the simulator’s relatively soporificnature. As a result, the driving performance may have been
Figure 6. Facial alertness dot plot. The closed squaresrepresent the nap group (NAP), and open squaresrepresent the no-nap group (NONE). The medians arenoted.
reduced to a common poor quality in both groups.
602 Annals of Emergency Medicine
There was no baseline measure of driving performanceobtained when the subjects were fully rested, which limitsanalyses and study findings.
Although the restriction of caffeine usage limits thegeneralizability of the study, it is a controllable variable allowinga less confounding comparison of nap versus no-nap. Banningcaffeine was necessary to ensure that all subjects were equivalent.Usual caffeine habits were not evaluated.
DISCUSSIONThis study reports the first randomized trial of a nap
intervention during the night shift for physicians and nurses. Itwas accomplished as a field study in the ED of a Level I traumacenter. Results showed that a 40-minute nap opportunityallowed health care professionals to maintain their performance,self-reported alertness, and mood through the end of their nightshift. However, these improvements did not extend beyond thenight shift to ensure the safety of subjects’ simulated drivehome. The results demonstrate that integrating a nap into anight work schedule can produce some performanceimprovements valuable to night shift health care workers.
Several items deserve special note. As expected, no subjectspent any time in rapid-eye-movement sleep, and most did notprogress to slow-wave sleep during the 40-minute nap period.24
At 3 AM, the majority of the subjects had a sleep latency lessthan 10 minutes, and nearly half had less than 5 minutes (sleeplatency is normally �10 minutes during daytime tests).34 Suchsleep latencies indicate that these subjects were physiologicallysleepy and able to fall asleep quickly, accruing some sleep evenwith a limited nap opportunity.
It is likely that the memory test at 4 AM for the nap subjectsreflects sleep inertia. Sleep inertia is the feeling of grogginess orsleepiness that can persist for up to 30 minutes after awakening.35
Therefore, time to recover from potential sleep inertia should be
Figure 7. Karolinska Sleepiness Scale. The closed circlesrepresent the nap group (NAP), and open circles representthe no-nap group (NONE). The medians are noted.
included into the time allowed for the nap opportunity.
Volume , . : November
Smith-Coggins et al Planned Naps for Emergency Physicians
The feasibility of having nap periods at work is importantbecause it is the only strategy to address physiologic sleep need.We were able to implement this tactic by using existingpersonnel to cross-cover. In other cases, it might be necessary toadd 1 or more individuals on the night shift to provide rotatingcoverage for napping individuals. Evaluating the costs and safetyof napping will be difficult and will depend on the work andstaffing demands of each clinical setting. There may besubstantial and sometimes hidden costs to individuals andsociety from inefficient care provided by fatigued physicians.36
Though there were no significant differences between the 2groups before the intervention, the NAP group contained acluster of individuals who showed profound sleepy behaviorsduring the drive after night 2. Although these individualsimproved their sleepiness (and driving) after the intervention (at7:30 AM on night 3), their increased level of baseline sleepinessadversely affected the potential power of these outcomevariables. Moreover, this cluster of subjects supports currentconsiderations that individual “traits” might be as important asgroup state or interventions because they affect sleepiness andfatigue-related performance.37
The results from the CathSim intravenous insertion virtualreality simulation test reflect an ongoing challenge of empiricallybased studies using face-valid clinical measures. Although theNAP group was 20 seconds faster at 7:30 AM, this represents anonsignificant finding empirically. However, clinically, a patientmay find an extra 20-second experience of intravenousplacement quite significant.
This study is important and timely in light of recentliterature on health care professionals’ long work hours, sleep,and performance. The impact of operational interventions suchas work-hours reduction and schedule changes on attentionalfailures, medical errors, and intern sleep have gained wideattention.38–40 Long work hours and sleep deprivation havebeen linked to poor driving.12,41 Public awareness about theseissues is bringing change such as Maggie’s Law, a drowsy drivinglaw passed in New Jersey in 2003 (“a sleep deprived driver is areckless driver and can be convicted of vehicular homicide”).42
This study of napping in the workplace is a critical addition tothe body of recently published literature.
It is worth noting that this study compares a nap to thecurrent practice. If the subjects had not been randomized to anap, they would have been awake and working as the controlgroup did. It would be interesting to design a study to comparenap versus break in the future.
In summary, this was the first successfully conductedrigorous randomized trial of a nap intervention in a group ofphysicians and nurses during actual night shifts in the ED. Thestudy showed that subjects who napped had faster reactiontimes and fewer vigilance lapses at 7:30 AM and rated themselvesas less fatigued, more vigorous, and less sleepy at the end of theirnight shift. At 4 AM, the nap-group subjects showed reducedmemory recall on awakening compared with those who
remained awake, though this finding was reversed by the end ofVolume , . : November
the night shift. Finally, subjects who napped started a simulatedintravenous catheter more quickly than controls. Generally, thisnap intervention provided beneficial effects on physician andnurse performance. It reinforces the importance of a “wakeup”period after the nap to address potential sleep inertia. Relevantissues related to procedural implementation of a napintervention in health care settings require further exploration,though models exist in other work settings.
Supervising editor: Debra E. Houry, MD, MPH
Author contributions: RS-C, SKH, MRR, and DMG conceivedthe study and designed the trial. RS-C, SKH, DTM, CW, SK,and JL supervised the conduct of the trial and data collection.RS-C, SKH, DTM, CW, SK, and JL undertook recruitment ofparticipating subjects and managed the data, including qualitycontrol. YS, RB, and DMG provided statistical advice on studydesign and analyzed the data. RSC drafted the manuscript,and all authors contributed substantially to its revision. RSCtakes responsibility for the paper as a whole.
Funding and support: The authors report this study did notreceive any outside funding or support.
Publication dates: Received for publication September 12,2005. Revision received January 31, 2006. Accepted February7, 2006. Available online May 2, 2006.
Presented at the Society for Academic Emergency Medicine2002 annual meeting, October 2002, St. Louis, MO; and theAssociation for Professional Sleep Societies 16th annualmeeting, June 2002, Seattle, WA.
Address for reprints: Rebecca Smith-Coggins, MD, Departmentof Surgery/Emergency Medicine, Stanford University, 701Welch Rd, Suite C, Palo Alto, CA 94304-1713; 650-725-5066,fax 650-723-0121; E-mail [email protected].
REFERENCES1. Rogers A, Holmes S, Spencer M. The effect of shiftwork on
driving to and from work. J Hum Ergol (Tokyo). 2001;30:131-136.2. van der Hulst M. Long workhours and health. Scand J Work
Environ Health. 2003;29:171-188.3. Stutts JC, Wilkins JW, Osberg SJ, et al. Driver risk factors for
sleep-related crashes. Accid Anal Prev. 2003;35:321-331.4. Ayas NT, White DP, Manson JE, et al. A prospective study of
sleep duration and coronary heart disease in women. Arch InternMed. 2003;163:205-209.
5. Liu Y, Tanaka H. Overtime work, insufficient sleep, and risk ofnon-fatal acute myocardial infarction in Japanese men. OccupEnviron Med. 2002;59:447-451.
6. Richardson GS, Miner JD, Czeisler CA. Impaired drivingperformance in shiftworkers: the role of the circadian system in amultifactorial model. Alcohol Drugs Driving. 1989;5-6:265-273.
7. Smith-Coggins R, Rosekind MR, Hurd S, et al. Relationship of dayversus night sleep to physician performance and mood. AnnEmerg Med. 1994;24:928-934.
8. Smith-Coggins R, Rosekind MR, Buccino KR, et al. Rotatingshiftwork schedules: can we enhance physician adaptation tonight shifts? Acad Emerg Med. 1997;4:951-961.
9. Connor J, Whitlock G, Norton R, et al. The role of driversleepiness in car crashes: a systematic review of epidemiological
studies. Accid Anal Prev. 2001;33:31-41.Annals of Emergency Medicine 603
Planned Naps for Emergency Physicians Smith-Coggins et al
10. Gold DR, Rogacz S, Bock N, et al. Rotating shift work, sleep, andaccidents related to sleepiness in hospital nurses. Am J PublicHealth. 1992;82:1011-1014.
11. Holbrook MI, White MH, Hutt MJ. Increasing awareness of sleephygiene in rotating shift workers: arming law-enforcement officersagainst impaired performance. Percept Mot Skills. 1994;79:520-522.
12. Barger LK, Cade BE, Ayas NT, et al. Extended work shifts and therisk of motor vehicle crashes among interns. N Engl J Med.2005;352:125-134.
13. Gander PH, Gregory KB, Connell LJ, et al. Crew Factors in FlightOperations VII: Psychophysiological Responses to OvernightCargo Operations. Moffett Field, CA: National Aeronautics andSpace Administration, Ames Research Center; 1996.
14. Naitoh P. Minimal sleep to maintain performance. In: Stampi B,ed. Why We Nap. Boston, MA: Birkhauser; 1992:199-210.
15. Batejat DM, Lagarde DP. Naps and modafinil as countermeasuresfor the effects of sleep deprivation on cognitive performance.Aviat Space Environ Med. 1999;70:493-498.
16. Lagarde D, Batejat D. Some measures to reduce effects ofprolonged sleep deprivation. Neurophysiol Clin. 1995;25:376-385.
17. Gillberg M. The effects of two alternative timings of a one-hournap on early morning performance. Biol Psychol. 1984;19:45-54.
18. Rosekind MR. Crew Factors in Flight Operations IX: Effects ofPlanned Cockpit Rest on Crew Performance and Alertness inLong-Haul Operations. Moffett Field, CA: National Aeronautics andSpace Administration; 1994.
19. Morrow PC, Crum MR. Antecedents of fatigue, close calls, andcrashes among commercial motor-vehicle drivers. J Safety Res.2004;35:59-69.
20. Adams-Guppy J, Guppy A. Truck driver fatigue risk assessmentand management: a multinational survey. Ergonomics. 2003;46:763-779.
21. Rosekind MR, Smith RM, Miller DL, et al. Alertness management:strategic naps in operational settings. J Sleep Res. 1995;4:62-66.
22. Dement WC, Vaughan C. The Promise of Sleep. New York, NY:Random House; 1999.
23. Sadeh A, Hauri P, Kripke D, et al. Role of actigraphy in theevaluation of sleep disorders. Sleep. 1995;18:288-302.
24. Carskadon MA, Dement WC. Normal human sleep: an overview.In: Kryger MH, Roth T, Dement WC, eds. Principles and Practiceof Sleep Medicine. Philadelphia, PA: WB Saunders; 2000:15-25.
25. Rechtschaffen A, Kales A. A Manual of Standardized Terminology:Techniques and Scoring System for Sleep Stages of HumanSubjects. Los Angeles, CA: UCLA Brain Information Service/Brain
Research Institute; 1968.604 Annals of Emergency Medicine
26. Dinges DF, Powell J. Microcomputer analyses of performance ona portable, simple visual RT task during sustained operations.Behav Res Methods Instr Comp. 1985;17:652-655.
27. Dinges DF. Probing the Limits of Functional Capability: TheEffects of Sleep Loss on Short-Duration Tasks. Boston, MA:Birkhouser; 1992.
28. Dinges DF, Pack F, Williams K, et al. Cumulative sleepiness,mood disturbance, and psychomotor vigilance performancedecrements during a week of sleep restricted to 4-5 hours pernight. Sleep. 1997;20:267-277.
29. Dinges DF, Kribbs NB. Performing While Sleepy: Effects ofExperimentally-Induced Sleepiness: Chichester: Wiley; 1991.
30. Dinges DF, Kribbs NB, Bates B, et al. A very brief probed recallmemory task: sensitivity to sleep loss. Sleep Res. 1993;22:330.
31. Reznek MA, Rawn CL, Krummel TM. Evaluation of the educationaleffectiveness of a virtual reality intravenous insertion simulator.Acad Emerg Med. 2002;9:1319-1325.
32. Howard SK, Gaba DM, Smith BE, et al. Simulation study of restedversus sleep-deprived anesthesiologists. Anesthesiology. 2003;98:1345-1355.
33. Akerstedt T, Gillberg M. Subjective and objective sleepiness inthe active individual. Int J Neurosci. 1990;52:29-37.
34. Kryger MH, Roth T, Dement WC. Principles and Practice of SleepMedicine. 3rd ed. Philadelphia, PA: W. B. Saunders Company;2000.
35. Dinges DF. Adult napping and its effect on ability to function. In:Stampi B, ed. Why We Nap. Boston, MA: Birkhauser; 1992:118-134.
36. Gaba DM. Costs of clinician fatigue and its prevention. AnesthPatient Safety Found Newsletter. 2005;20:15-16.
37. Van Dongen HP, Baynard MD, Maislin G, et al. Systematicinterindividual differences in neurobehavioral impairment fromsleep loss: evidence of trait-like differential vulnerability. Sleep.2004;27:423-433.
38. Landrigan CP, Rothschild J, Cronin JW, et al. Effect of reducinginterns’ work hours on serious medical errors in intensive careunits. N Engl J Med. 2004;351:1838-1848.
39. Lockley SW, Cronin J, Evans EE, et al. Effect of reducing interns’weekly work hours on sleep and attentional failures. N EnglJ Med. 2004;351:1829-1837.
40. Fessler HE. Interns’ work hours. N Engl J Med. 2005;352:726-728.
41. Powell NB, Schechtman KB, Riley RW, et al. The road to danger:the comparative risks of driving while sleepy. Laryngoscope.2001;111:887-893.
42. Maggie’s Law. Geist GF MR, Altamuro S, trans. 210th Legislature
ed; 2003.Volume , . : November
APPENDIX E1.Measures
Polysomnographic recordings: Standard polysomnographicvariables were obtained, using the conventional 10-20 electroen-cephalographic placement system (C3, C4, O1, O2), electro-ocu-lography from both outer canthi, and chin electromyography.
Psychomotor Vigilance Task: An average Psychomotor Vigi-lance Task reaction time is 250 ms, and a reaction time of greaterthan 500 ms is scored as a “lapse.” There are 5 standard Psy-chomotor Vigilance Task parameters routinely reported: meanreaction time, median reaction time, mean 1/reaction time for theslowest 10% of reaction times, mean reaction time for the fastest10% of reaction times, and “transformed lapses”(��lapses��(lapses�1) to account for the disproportionateinfluence from long duration lapses and remove the proportion-ality between the mean and variance.
Probed Recall Memory: In this validated task, subjects have 30seconds to memorize 6 word pairs. After 10 minutes, the recallstimulus is presented, consisting of the first word of each originalpair followed by a blank line. The subject has 30 seconds to writein the 6 missing words. The Probed Recall Memory score is thenumber of words correctly recalled.
StiSim driving simulation: The StiSim Drive Simulation Sys-tem (Systems Technology, Inc., Hawthorne, CA) is a computer-ized, interactive driving simulator that mimics psychomotor, di-vided attention, and cognitive tasks involved during a drive.Subjects completed a 36.7-mile drive (40 minutes if going thespeed limit). This StiSim vehicle dynamics model has visual andsteering feedback. Because of limitations of the StiSim’s perfor-mance measuring system, objective assessment of driving perfor-mance was obtained by analyzing videotapes of the simulateddrives. An observer blinded to condition rated tapes for car posi-tion relative to the road, using a 7-point scale that was based on theperspective-derived position of the driver within the vehicle rela-tive to the road (see Figure E2).This scale is based on objectivegeometry, with no subjective element to the driving assessment.
1) Car completely off road to the right and snapped back
on the road by the computer.Volume 48, . : November
2) Driver’s position in the car off the road to the right.3) Car in correct lane.4) Driver’s position across center line into left lane.5) Driver’s position in the car off the left side of the road.6) Car completely off road to the left and snapped back on
to the road by the computer.7) Collision with another vehicle in the left lane.
Dangerous driving is defined as the car leaving the road orcolliding with an oncoming vehicle: driving score of 1, 6, and 7(see Figure E1). For each simulated drive, these ratings wereobtained with a 1-second resolution using MacShapa videoannotating software (CSERIAC, Wright-Patterson Air ForceBase, OH).
Assessment of facial alertness: To assess drowsy driving duringthe simulated drive home, the videotapes of the subjects’ facesduring the simulated drive were rated by an observer blinded tocondition for signs of behavioral alertness using a 4-point ordinalscale, the Facial Alertness Score (4�awake, eyes open; 3�slow eyeblinking; 2�eyes closed/head nodding; 1�eyes closed, no move-ment). These ratings were obtained with a 1-second resolutionusing MacShapa video annotating software. This scoring wasadapted from a similar scale used in a fatigue study of anesthesiaresidents, in which it was determined to have adequate interraterreliability.32 The percentage of time with eyes closed is theamount of time on the video in which the subject has a FacialAlertness Score of 1 or 2.
The facial videos were essentially analyzed as described in theMaterials and Methods section of the text, using visual inspectionof the facial tapes and a 4-point scale (4�awake, eyes open;3�slow eyes blinking; 2�eyes closed/head nodding; 1�eyesclosed, no movement). The driving and facial videotapes wereanalyzed from beginning to end by a research assistant blinded tothe subject group. A rating was made for each second of videotapeusing the MacShapa video annotating software. It was very timeintensive. Every moment that the subject changed from one cat-egory of the Facial Alertness Score to another was noted. If asubjects kept dozing off while driving, there were in some cases
several hundred data points recorded for a subject.Annals of Emergency Medicine 604.e1
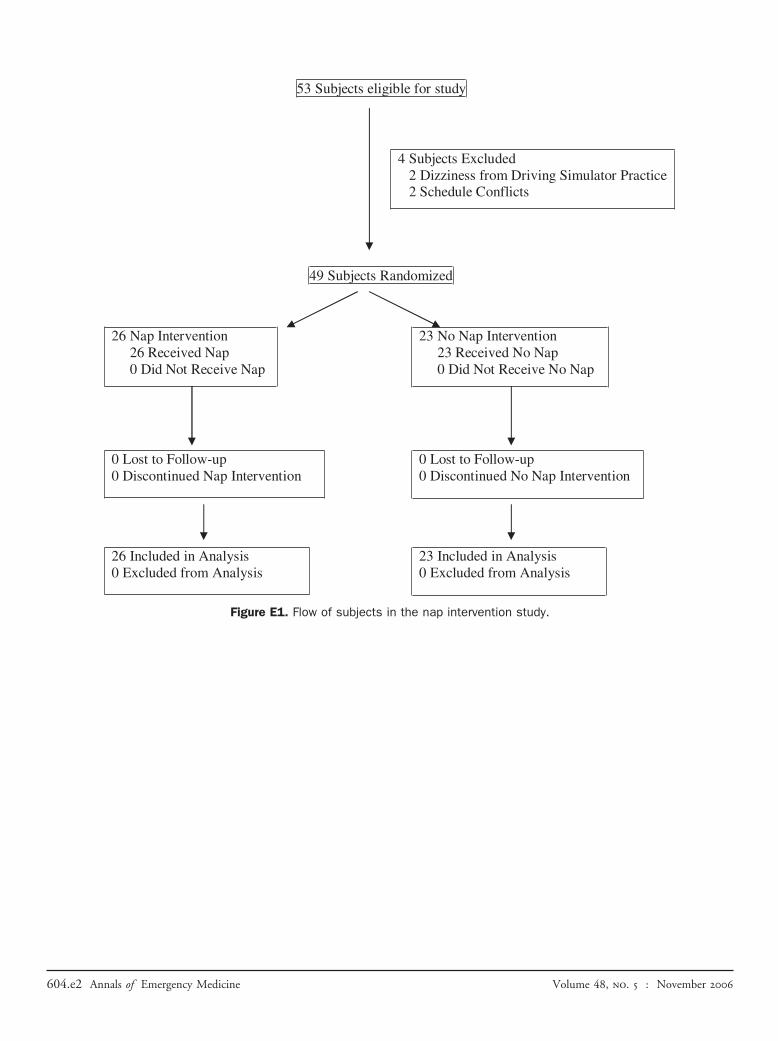
Figure E1. Flow of subjects in the nap intervention study.
604.e2 Annals of Emergency Medicine Volume 48, . : November
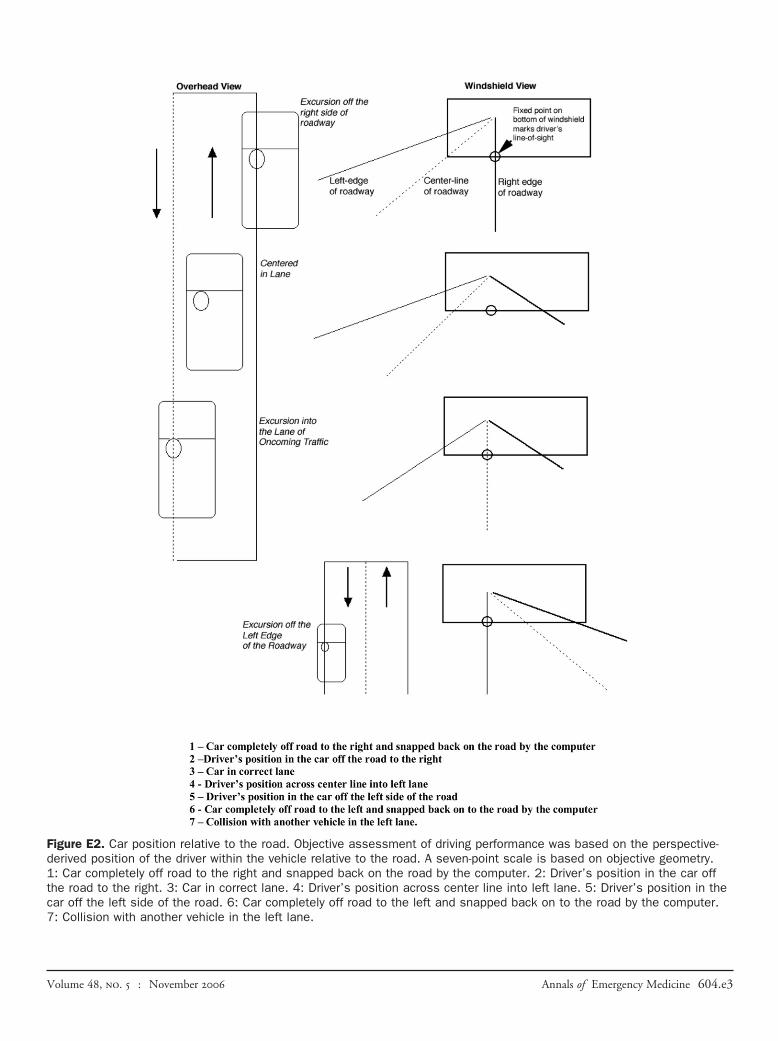
Figure E2. Car position relative to the road. Objective assessment of driving performance was based on the perspective-derived position of the driver within the vehicle relative to the road. A seven-point scale is based on objective geometry.1: Car completely off road to the right and snapped back on the road by the computer. 2: Driver’s position in the car offthe road to the right. 3: Car in correct lane. 4: Driver’s position across center line into left lane. 5: Driver’s position in thecar off the left side of the road. 6: Car completely off road to the left and snapped back on to the road by the computer.7: Collision with another vehicle in the left lane.
Volume 48, . : November Annals of Emergency Medicine 604.e3