application of stockwell coherence to prediction of alertness under anaesthesia
TRANSCRIPT
BIOSIGNAL 2010
Application of Stockwell Coherence To Prediction Of Alertness Under Anaesthesia
Güray GÜRKAN 1, Aydın AKAN2, Tamer DEMİRALP3, 1 Department of Electronic Engineering, Istanbul Kültür University, Ataköy,
Istanbul, Turkey 2 Department of Electrical and Electronics Engineering, Istanbul University, Avcılar,
Istanbul, Turkey, 3 Department of Physiology, Faculty of Medicine, Istanbul University, Çapa
Istanbul, Turkey, [email protected]
In this paper, we represent an application of Stockwell Coherence to scalp EEG signals under anesthesia. By the analysis of overlapping, stationary data segments, we obtained the time-varying Stockwell coherence, which reveals the time evolution of coherence changes between any selected channel pair. After the injection and release of the anesthetic agent, time-varying Stockwell coherence analyses demonstrate similar characteristics for different patients.
1 Introduction General anaesthesia is the state of being unconscious in its basic description. But there
exist states reported during operations that the patient may have alertness to painful stimuli with or without memorizing it. This happens due to inadequate anesthetic agent which in turn is fatal for the patient given in high alveolar concentrations. Commercially available depth of anaesthesia monitors mostly record EEG from forehead and give a score between 0-100 which is said to describe the alertness of the patient. These devices are not still exactly accurate and cases of alertness are reported even with low index values [1, 2, 3].
In our studies, we tried to predict the depth of anaesthesia by post-processing of scalp EEG signals taken during surgery. The recordings include spontaneous segments (resting segments) and 40 Hz Auditory Steady-State Response segments which are separately analysed. In this paper, we are only presenting results dealing with spontaneous part. We applied Stockwell coherence (SC) to spontaneous segments as a predictor of alertness which showed common changes in the lightening stages of anaesthesia.
In section 2, we present the recording and analysis methods. Results are presented in section 3.
2 Methods 2.1 EEG Recordings
In our studies, we used EEG signals that were recorded from female patients undergoing gynecological surgery as in our previous study [6]. The montage included 15 channels in the 10/20 standard (Fp1, Fp2, F7, F3, Fz, F4, F8, T7, C3, Cz, C4, T8, P3, Pz, P4) with the electrodes referenced to mastoids. Before digitization at 1kHz, an RC bandpass filter with 0.01 – 250 Hz passband is applied to analog signals. Propofol was the main anesthetic and was induced to all patients.
Parallel to EEG recordings, we used commercially available anesthesia monitor (BIS®, Aspect Medical Systems) to be a reference to our study. The device generates an index between 0 – 100, where 0 is the full cortical silence and 100 is the awake states, respectively. The level between 40-60 is the said to be the suitable state for adequate anesthesia [2]. BIS®
ISSN 1211-412X 81 Analysis of Biomedical Signals and Images; 20: 81-86
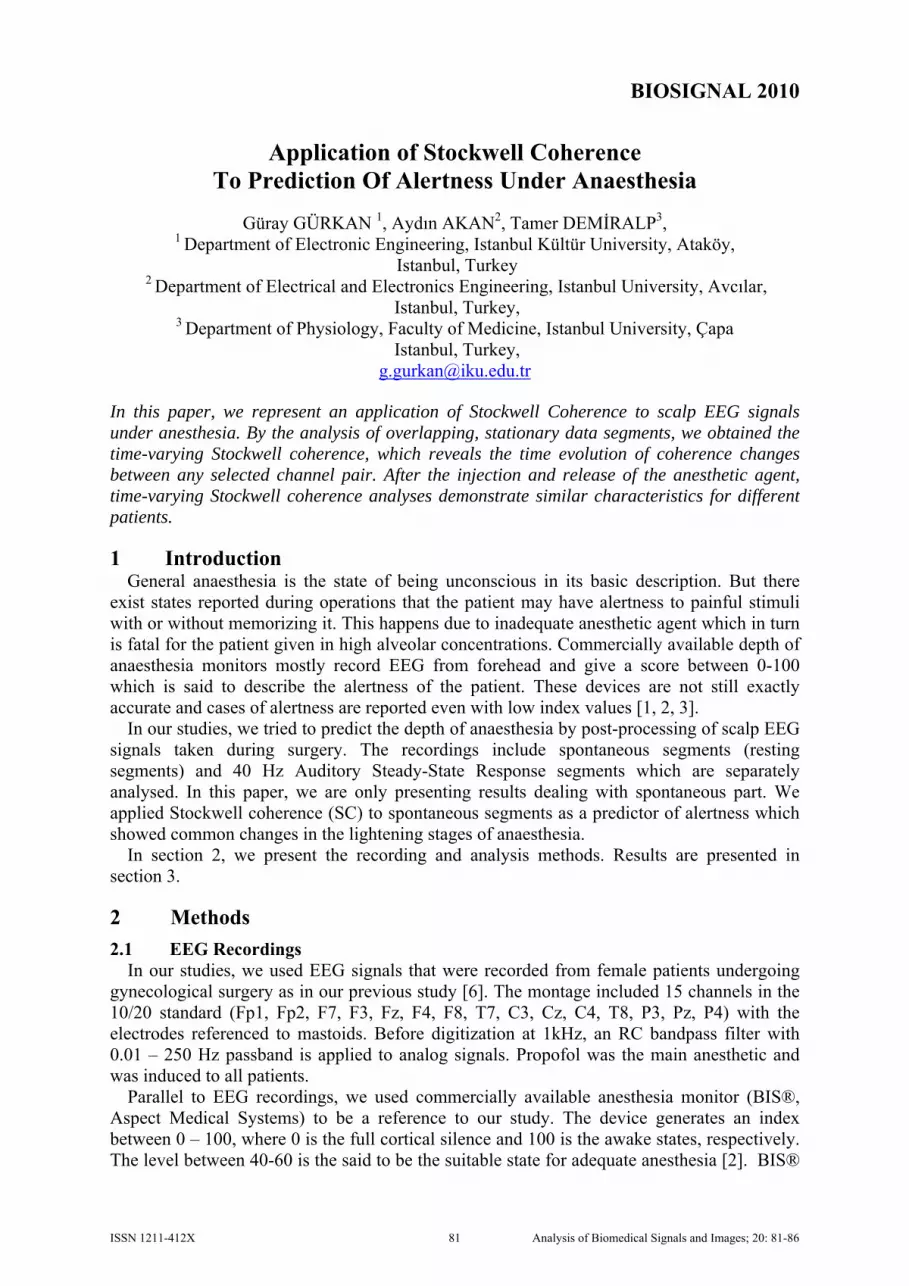
BIOSIGNAL 2010 uses forehead electrodes as shown in Fig.1.a.
(a) (b)
Fig.1. Reference monitoring device BIS®, a: Connection of electrodes, b: Display of BIS®
2.2 Data Preprocessing
Acquired EEG data involves 50 Hz line noise and artifacts of electrode trembling by operational movements. To omit DC drifts and eliminate intolerable low-frequency artifact levels, digitized data was further digitally filtered with a bandpass filter of 0.5 – 47 Hz.
2.3 Analysis Methods
2.3.1. Spectral Edge Frequency
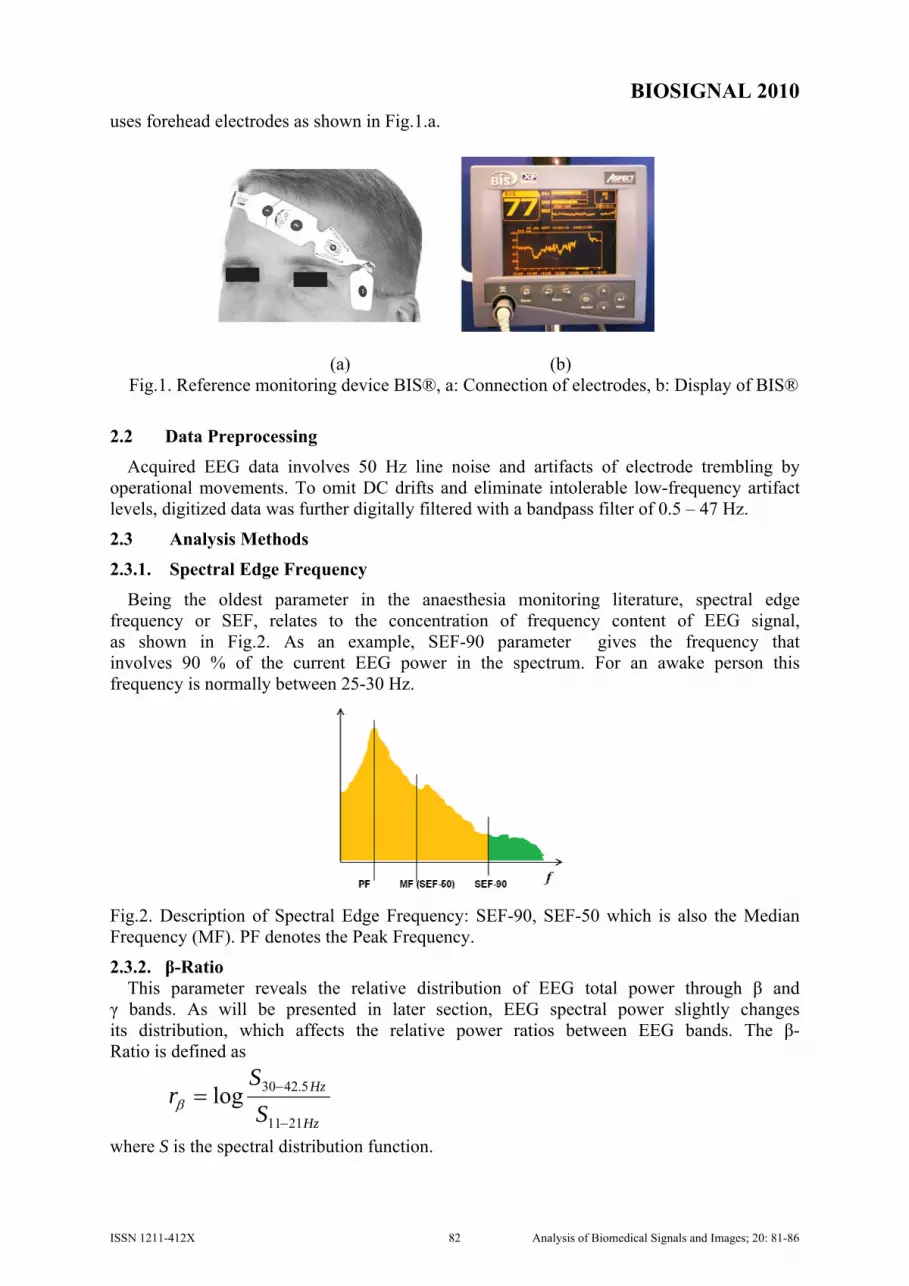
Being the oldest parameter in the anaesthesia monitoring literature, spectral edge frequency or SEF, relates to the concentration of frequency content of EEG signal, as shown in Fig.2. As an example, SEF-90 parameter gives the frequency that involves 90 % of the current EEG power in the spectrum. For an awake person this frequency is normally between 25-30 Hz.
Fig.2. Description of Spectral Edge Frequency: SEF-90, SEF-50 which is also the Median Frequency (MF). PF denotes the Peak Frequency.
2.3.2. β-Ratio This parameter reveals the relative distribution of EEG total power through β and
γ bands. As will be presented in later section, EEG spectral power slightly changes its distribution, which affects the relative power ratios between EEG bands. The β-Ratio is defined as
Hz
Hz
SS
r2111
5.4230log−
−=β
where S is the spectral distribution function.
ISSN 1211-412X 82 Analysis of Biomedical Signals and Images; 20: 81-86
BIOSIGNAL 2010 2.3.3. Spectral Entropy
The entropy measure was firstly proposed by Shannon dealing about information theory and communication. This quantity represents the information content of a random variable x with the probability density function p(x) as
)log()()( ii xxpxH ∑−= The formula gives values between 0 and 1, each representing “exactness” and “full randomness”, respectively.
Each of the spectral estimates S(f) of EEG signals derived from any small time duration is a frequency distribution. By normalizing the spectral estimates S(f) for any frequency range,
∑=
jj
iiN fS
fSfS)(
)()( ,
one can write
))(log()()( iNi
iN fSfSfH ∑ ⋅−=
which is the spectral entropy. The peaks appearing in the spectral estimates cause an entropy decrease, whereas a more flat spectrum yields a higher spectral entropy value.
2.3.4. Stockwell Coherence The Stockwell coherence (SC) function is defined as [5]
),(),(
),(),(
2
ftSPftSP
ftSPftSC
yyxx
xyxy ⋅
= ,
where the auto and cross-spectrums { } { }),(),(),(),(),(),( ** ftSftSEftSPftSftSEftSP xxxxyxxy ⋅=⋅= ,
are calculated from Stockwell Transforms of input vectors x and y, respectively, as [4]
dteef
txfS ftft
xπ
τ
πτ 22
)( 22
2)(),( −
−−
⋅⋅= ∫ .
Stockwell coherence is the phase corrected form of wavelet transform. This property makes the method be more suitable for instantaneous frequency estimation and a reliable coherence value estimator [4].
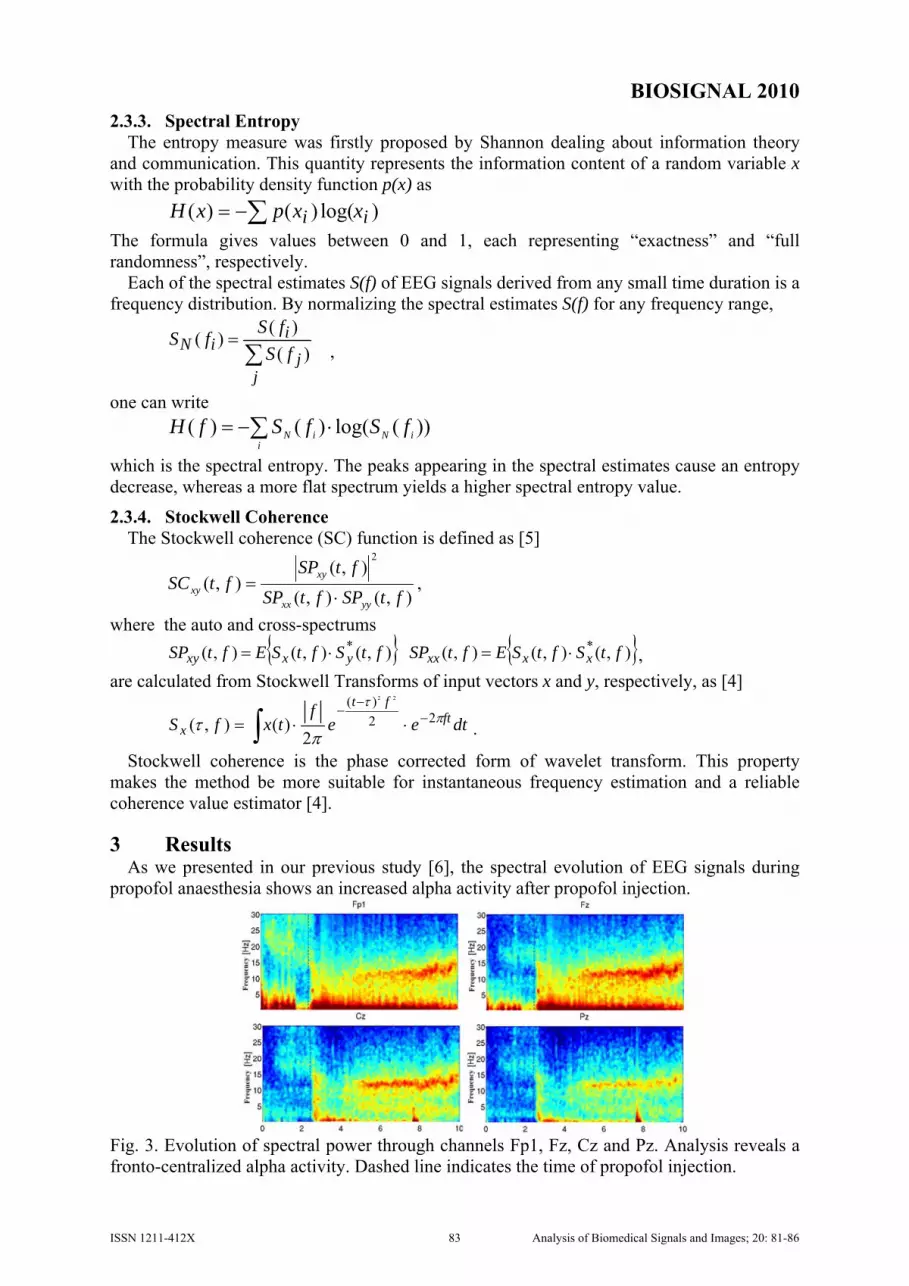
3 Results As we presented in our previous study [6], the spectral evolution of EEG signals during
propofol anaesthesia shows an increased alpha activity after propofol injection.
Fig. 3. Evolution of spectral power through channels Fp1, Fz, Cz and Pz. Analysis reveals a fronto-centralized alpha activity. Dashed line indicates the time of propofol injection.
ISSN 1211-412X 83 Analysis of Biomedical Signals and Images; 20: 81-86

BIOSIGNAL 2010 For this reason, all the parameters (SEF90, β-ratio and Spectral Entropy) were calculated
through channel Fz. Stockwell coherence values were also calculated between Fz and the other channels through window length of 5 seconds with 1 second shifts.
After the injection of propofol, Stockwell coherence slightly decreased whereas BIS® index was also below 30. This sharp decrease occurs because of over-dosed propofol and causes the brain to go under burst-suppression which is the state of electrical silence and not desired for normal anaesthesia. By lighter alveolar levels of propofol, brain starts its frontal alpha activity which is monitored as a BIS® index value between 40-60 and is the desired state for anaesthesia.
Fig.4. BIS® values and derived parameters for the injection segment.
Fig.5. Stockwell coherences between Fz and Fp1, C3, Cz, C4. Dashed lines show the
propofol injection. The awakening stages showed reversed changes as shown in Figs.6-7.
ISSN 1211-412X 84 Analysis of Biomedical Signals and Images; 20: 81-86
BIOSIGNAL 2010
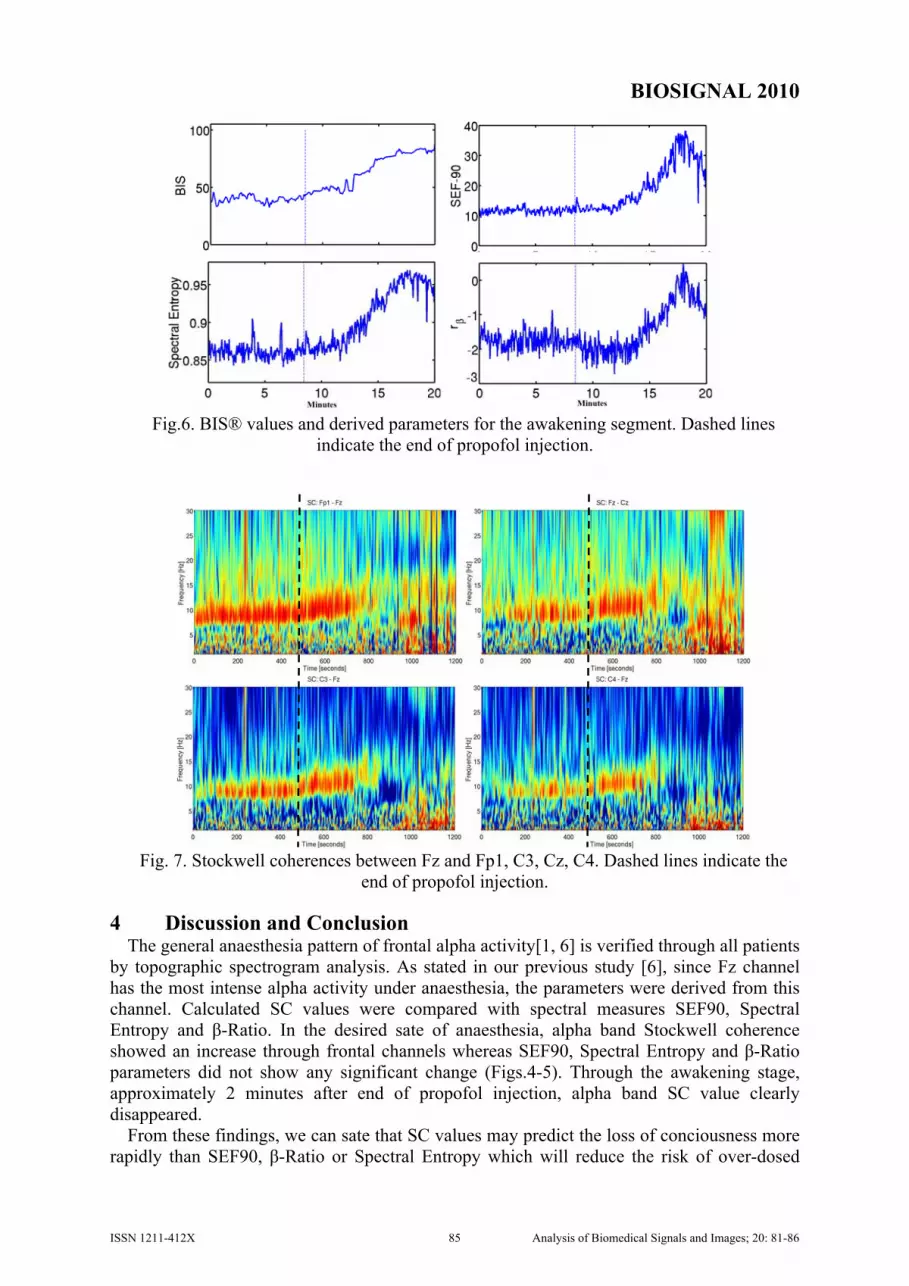
Fig.6. BIS® values and derived parameters for the awakening segment. Dashed lines indicate the end of propofol injection.
Fig. 7. Stockwell coherences between Fz and Fp1, C3, Cz, C4. Dashed lines indicate the
end of propofol injection.
4 Discussion and Conclusion The general anaesthesia pattern of frontal alpha activity[1, 6] is verified through all patients
by topographic spectrogram analysis. As stated in our previous study [6], since Fz channel has the most intense alpha activity under anaesthesia, the parameters were derived from this channel. Calculated SC values were compared with spectral measures SEF90, Spectral Entropy and β-Ratio. In the desired sate of anaesthesia, alpha band Stockwell coherence showed an increase through frontal channels whereas SEF90, Spectral Entropy and β-Ratio parameters did not show any significant change (Figs.4-5). Through the awakening stage, approximately 2 minutes after end of propofol injection, alpha band SC value clearly disappeared.
From these findings, we can sate that SC values may predict the loss of conciousness more rapidly than SEF90, β-Ratio or Spectral Entropy which will reduce the risk of over-dosed
ISSN 1211-412X 85 Analysis of Biomedical Signals and Images; 20: 81-86
BIOSIGNAL 2010 propofol injection. In addition, the tracking of alpha band SC values through operation will surely increase the possibility of patient awareness detection and prevent during and post-operative disturbance.
5 References [1] J.Bruhn, Depth of anaesthesia monitoring: what’s available, what’s validated and
what’s next?, British Journal of Anaesthesia 97: 85-94, 2006. [2] Jameson, L., Using EEG to monitor anaesthesia drug effects during surgery, Journal
of Clinical Monitoring and Computing 20:445-472, 2006. [3] Ye, S., Kim J., Development for the evaluation Index of an Anaesthesia Depth Using
the Bispectrum Analysis, International Journal of Biological and Medical Sciences, Vol. 1, No. 2, 2008.
[4] Stockwell, R.G., Localization of the Complex Spectrum: The S Transform. IEEE Transactions on Signal Processing, Vol:44,No:4, 998-1001, April 1996.
[5] Liu, C., Stockwell Coherence and its Application in Studying Motor Cortices under the Multi-Source Interference Task, IEEE, 2009.
[6] Gürkan, G., Uslu, A., Akan, A., Demiralp, T., Topographic and Temporal Spectral Analysis of EEG Signals During Anaesthesia, 15th National Biomedical Conference, Antalya, Turkey, 21-24 April 2010.
ISSN 1211-412X 86 Analysis of Biomedical Signals and Images; 20: 81-86