improve performance and efficiency of the steam power plant
TRANSCRIPT
First Scientific Conference on Petroleum Resources and Manufacturing27-28 October 2010 Brega, Libya
1
Improve Performance and Efficiency of the Steam Power Plant
Hesham G. Ibrahim1, Aly Y. Okasha2 and Ahmed G. Elkhalidy3
1Chemical Engineering Department, Faculty of Engineering, Misurata University, Al-Khoms City, Libya.
Tel.: ++218-338-9965, e-mail: [email protected]
2Environmental Department, Faculty of Science, Misurata University, Al-Khoms City, LibyaTel.:++218-91-344-6102, e-mail: [email protected]
3Life Tech. Company, Manchester City, UK
ABSTRACT
Power plants generate electrical power by using fuels like coal, oil or natural gas. Fuel burned in the boiler to heats water to generate steam. The steam is then heated to a superheated state in the superheater. This superheated steam is used to rotate the turbine which powers the generator. Electrical energy is generated when the generator windings rotate in a strong magnetic field. After the steam leaves the turbine it is cooled to its liquid state in the condenser. The liquid is pressurized by the pump prior to going back to the boiler. This simple power plant is called (steam power plant). This cycle has a problem represent through a steam leaves the turbine, it is typically wet. The presence of water causes erosion of the turbine blades at high speed, gradually decreasing the life of turbine blades and efficiency of the turbine. That's leading to damage of turbine then shut-off plant. So, a simulation process of steam power plant done using (Hysys v.3.2) to improve the performance of plant also increasing efficiency through prevent erosion occurs and decreasing heat loses by condenser. Good results obtained by simulation process, in which overall efficiency of the plant increased from 24.57% to 28.1%, thermal efficiency increase from 24.59% to 28.1% that leads to decrease a heat loses from cycle, also increase the output rate of electrical power produced to about 15%. The results obtained from study can be applied in field where it can improve the performance of steam power plant especially in the oil industry by increasing the rate of electric power can also take advantage of waste heat in the production of distilled water.
1. INTRODUCTION
1.1 Power Station Definition
A power station also referred to as generating station or (power plant) is an industrial facility for the generation of electric power. Some prefer to use the term energy center because it more accurately describes what the plants do, which is the conversion of other forms of energy, like chemical energy, gravitational potential energy or heat energy into electrical energy. However, power plant is the most common term in the U.S., while elsewhere power station and power plant are both widely used [1-3].
In thermal stations, mechanical power is produced by a heat engine, which transforms thermal energy, often from combustion of a fuel into rotational energy. Most thermal power stations produce steam, and these are sometimes called steam power stations. About 80% of all electric power is generated by use of steam turbine. In which working fluid (steam) is separated from the heat source and heat is transferred across a physical boundary. Not all thermal energy can be
First Scientific Conference on Petroleum Resources and Manufacturing27-28 October 2010 Brega, Libya
2
transformed to mechanical power, according to the second law of thermodynamics. Therefore, there is always heat lost to the environment. In countries where district heating is common, there are dedicated heat plants called only boiler stations. An important class of power stations in the Middle East uses byproduct heat for desalination of water [4].Electricity is the most commonly used form of energy. It is most often generated a power station by electrochemical generators, primarily driven by heat engines fueled by chemical combustion or nuclear fission but also by other means such as the kinetic energy of flowing water and wind. There are many other technologies that can be and are used to generate electricity such as solar photovoltaic's [4]. Most of fuels and other forms of energy are transformed into electric power which is then easily distributed and utilized. When using fossil fuels, the most common power generators that are used are [5]:
Steam power plants
Gas turbine power plants Diesel generators
Combined Heat and Power plants (CHP)
In Great Jamahiriya (General Electricity Company Of Libya) GECOL is the Libyan national company responsible for electricity generation as well as transmission and distribution gave data about actual power generated in Libya based on the individual type of generator used and its contribution percent in the total power generation for year 2008 is given below in Table (1).
Table 1: Power generated in Libya based on types of generators (2008), [6]
Type of GeneratorPower Generated
(GW/Year)Steam Turbines 7,264,304
Gas Turbines 9,882,786
CHP 11,519,051
Total 28,666,141
To cover the demand, GECOL is preparing for a significant capacity building program. It estimates that between 2009 and 2020 it will have to install 13,000MW of new generating capacity, double the amount currently installed.
1.2 Energy Demand and Production
In 2007, USA continued to remain as the top producer of electricity with a global share of at least 25% followed by China, Japan and Russia. Energy is used by nations all over the globe at varying rates. The rate of energy consumption is about 0.5 kW per person in the underdeveloped world compared to 5 to 10 kW in the developed world. Energy demand arises mostly from the domestic, commercial, industrial and transport uses.
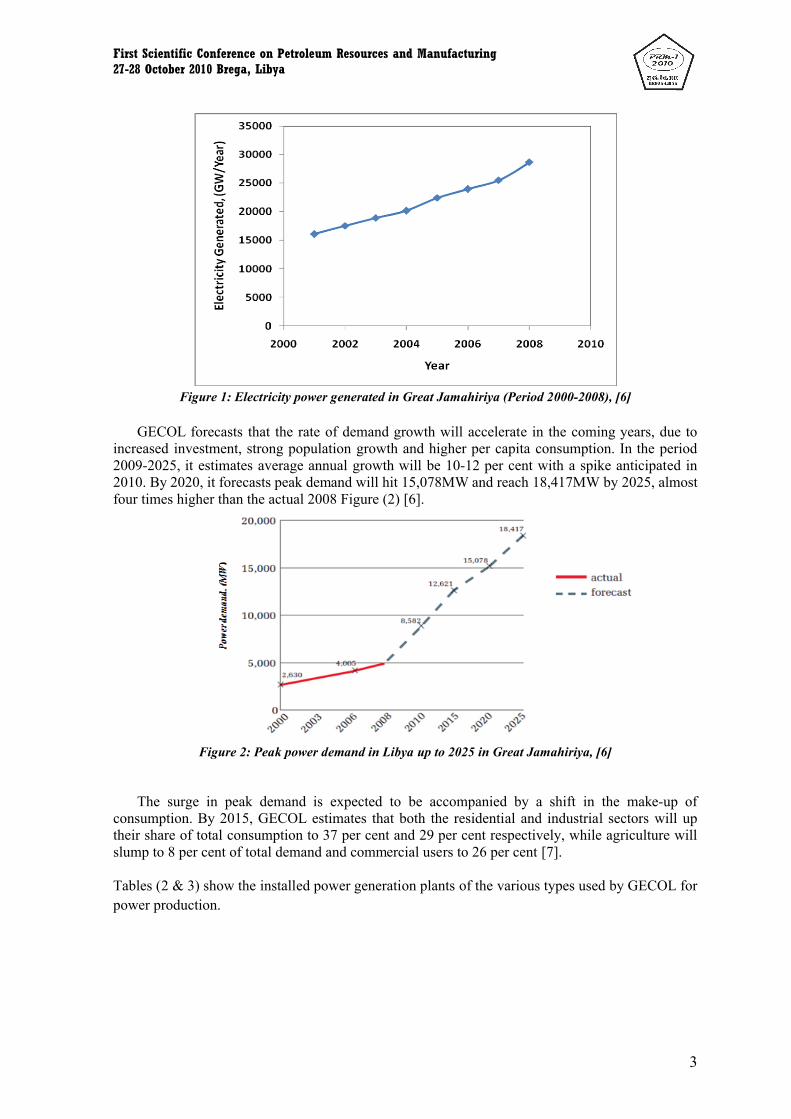
Power generation by GECOL is mainly through thermal power stations and gas turbine stations where fuel oil and gas are being used as fuels. Figure (1) show increase of power generated in during (2001-2008) this due to the development projects occur in this period. In recent years, GECOL has projects to face high rates of growth in demand for electricity, as a result of a population rising on average by 2.2 per cent a year and an economy expanding by 4 per cent a year in real terms. In the period 2000-2008, peak power demand growth averaged 8-10 per cent a year reaching 4,756MW in 2008, up from 2,630MW in 2000 as shown in Figure (2).
First Scientific Conference on Petroleum Resources and Manufacturing27-28 October 2010 Brega, Libya
3
Figure 1: Electricity power generated in Great Jamahiriya (Period 2000-2008), [6]
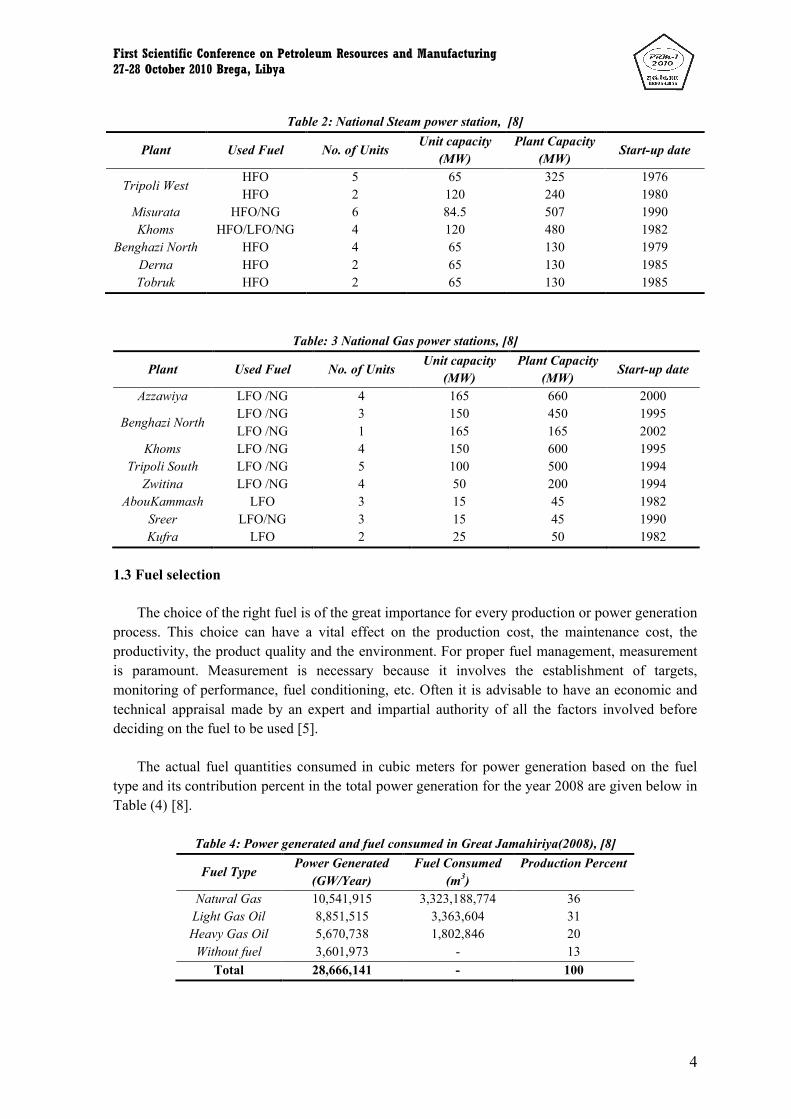
GECOL forecasts that the rate of demand growth will accelerate in the coming years, due to increased investment, strong population growth and higher per capita consumption. In the period2009-2025, it estimates average annual growth will be 10-12 per cent with a spike anticipated in 2010. By 2020, it forecasts peak demand will hit 15,078MW and reach 18,417MW by 2025, almost four times higher than the actual 2008 Figure (2) [6].
Figure 2: Peak power demand in Libya up to 2025 in Great Jamahiriya, [6]
The surge in peak demand is expected to be accompanied by a shift in the make-up of consumption. By 2015, GECOL estimates that both the residential and industrial sectors will up their share of total consumption to 37 per cent and 29 per cent respectively, while agriculture will slump to 8 per cent of total demand and commercial users to 26 per cent [7].
Tables (2 & 3) show the installed power generation plants of the various types used by GECOL for power production.
First Scientific Conference on Petroleum Resources and Manufacturing27-28 October 2010 Brega, Libya
4
Table 2: National Steam power station, [8]
Plant Used Fuel No. of UnitsUnit capacity
(MW)Plant Capacity
(MW)Start-up date
Tripoli WestHFO 5 65 325 1976HFO 2 120 240 1980
Misurata HFO/NG 6 84.5 507 1990Khoms HFO/LFO/NG 4 120 480 1982
Benghazi North HFO 4 65 130 1979Derna HFO 2 65 130 1985Tobruk HFO 2 65 130 1985
Table: 3 National Gas power stations, [8]
Plant Used Fuel No. of UnitsUnit capacity
(MW)Plant Capacity
(MW)Start-up date
Azzawiya LFO /NG 4 165 660 2000
Benghazi NorthLFO /NG 3 150 450 1995LFO /NG 1 165 165 2002
Khoms LFO /NG 4 150 600 1995Tripoli South LFO /NG 5 100 500 1994
Zwitina LFO /NG 4 50 200 1994AbouKammash LFO 3 15 45 1982
Sreer LFO/NG 3 15 45 1990Kufra LFO 2 25 50 1982
1.3 Fuel selection
The choice of the right fuel is of the great importance for every production or power generation process. This choice can have a vital effect on the production cost, the maintenance cost, the productivity, the product quality and the environment. For proper fuel management, measurement is paramount. Measurement is necessary because it involves the establishment of targets, monitoring of performance, fuel conditioning, etc. Often it is advisable to have an economic and technical appraisal made by an expert and impartial authority of all the factors involved before deciding on the fuel to be used [5].
The actual fuel quantities consumed in cubic meters for power generation based on the fuel type and its contribution percent in the total power generation for the year 2008 are given below in Table (4) [8].
Table 4: Power generated and fuel consumed in Great Jamahiriya(2008), [8]
Fuel TypePower Generated
(GW/Year)Fuel Consumed
(m3)Production Percent
Natural Gas 10,541,915 3,323,188,774 36Light Gas Oil 8,851,515 3,363,604 31Heavy Gas Oil 5,670,738 1,802,846 20
Without fuel 3,601,973 - 13
Total 28,666,141 - 100

First Scientific Conference on Petroleum Resources and Manufacturing27-28 October 2010 Brega, Libya
5
From another point of view despite the modest size of its desalination sector, Libya has drawn up a program to massively increase desalination capacity to meet rising demand in coastal, urban centers. By 2015, GDC (General Desalination Company) is planning to hike desalination capacity to 515 million g/d, a 10-fold increase on mid-2009 capacity. Cost of the program is estimated at $2.2bn. The GMR delivered some 210 million g/d in 2008, Table (5) show that is set to rise to 352 million g/d in the period 2009-2011. The increase, along with a near doubling in desalination capacity, will result in total water production surging by an estimated 60 per cent to 590 million g/d[7].
Table 5: Source of Water in Great Jamahiriya (2008-2011), (Million g/d), [8]
Source 2008 2009-2011Great Manmade river (GMR) 210 352
Groundwater 132 163Desalination 31 75
Total 373 590
GECOL & GDC have taken most units built before 1990 out of service. As a result, its main desalination plants are located at Abutaraba, the Gulf of Bomba, Soussa, Tobruk, Zliten and Zwara as shown in Table (6).
Table 6: Installed desalination capacity (up to mid-2009), [8]
LocationCapacity
(million g/d)Operation date
Gulf of Bomba 6.6 1990Zliten 6.6 1992Soussa 2.2 2000Tobruk 8.8 2002
Abutaraba 8.8 2006Zwara 8.8 2006Total 41.9 --
By mid-2010, four new desalination plants will be brought on stream providing additional capacity of 44.1 million g/d. Located at Derna, Soussa, Zawia and Zwara [8].
Depending on all these facts improve the performance of plant especially the oldest types of them (steam power plant) also to increasing efficiency of cycles is necessary and inevitable to cover the development in infrastructure and industrial sectors. So; the main purpose of this study is simulating a process of steam power plant using (HYSYS v.3.2) to study how may be improve the performance of plant and increasing efficiency.
2. STEAM POWER PLANT CYCLE2.1. Process Description
Fuel, burned in the boiler and superheater, heats the water to generate steam. The steam is then heated to a superheated state in the superheater. This steam is used to rotate the turbine which powers the generator. Electrical energy is generated when the generator windings rotate in a strong magnetic field. After the steam leaves the turbine it is cooled to its liquid state in the condenser. The liquid is pressurized by the pump prior to going back to the boiler. A simple steam power plant cycle (SPPC) consists of a boiler, turbine, condenser and a pump as shown in Figure (3) [9].
First Scientific Conference on Petroleum Resources and Manufacturing27-28 October 2010 Brega, Libya
6
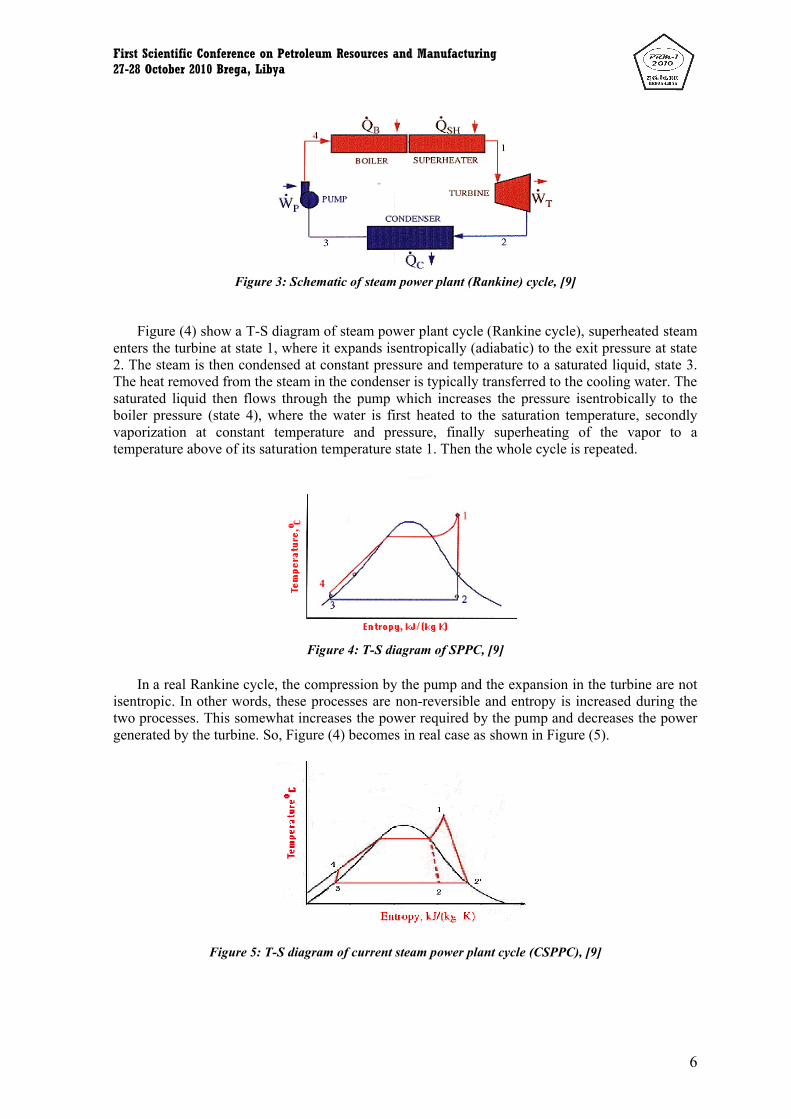
Figure 3: Schematic of steam power plant (Rankine) cycle, [9]
Figure (4) show a T-S diagram of steam power plant cycle (Rankine cycle), superheated steam enters the turbine at state 1, where it expands isentropically (adiabatic) to the exit pressure at state 2. The steam is then condensed at constant pressure and temperature to a saturated liquid, state 3. The heat removed from the steam in the condenser is typically transferred to the cooling water. The saturated liquid then flows through the pump which increases the pressure isentrobically to the boiler pressure (state 4), where the water is first heated to the saturation temperature, secondly vaporization at constant temperature and pressure, finally superheating of the vapor to a temperature above of its saturation temperature state 1. Then the whole cycle is repeated.
Figure 4: T-S diagram of SPPC, [9]
In a real Rankine cycle, the compression by the pump and the expansion in the turbine are notisentropic. In other words, these processes are non-reversible and entropy is increased during the two processes. This somewhat increases the power required by the pump and decreases the power generated by the turbine. So, Figure (4) becomes in real case as shown in Figure (5).
Figure 5: T-S diagram of current steam power plant cycle (CSPPC), [9]
First Scientific Conference on Petroleum Resources and Manufacturing27-28 October 2010 Brega, Libya
7
2.2. Problems of CSPPC and Typical Modifications
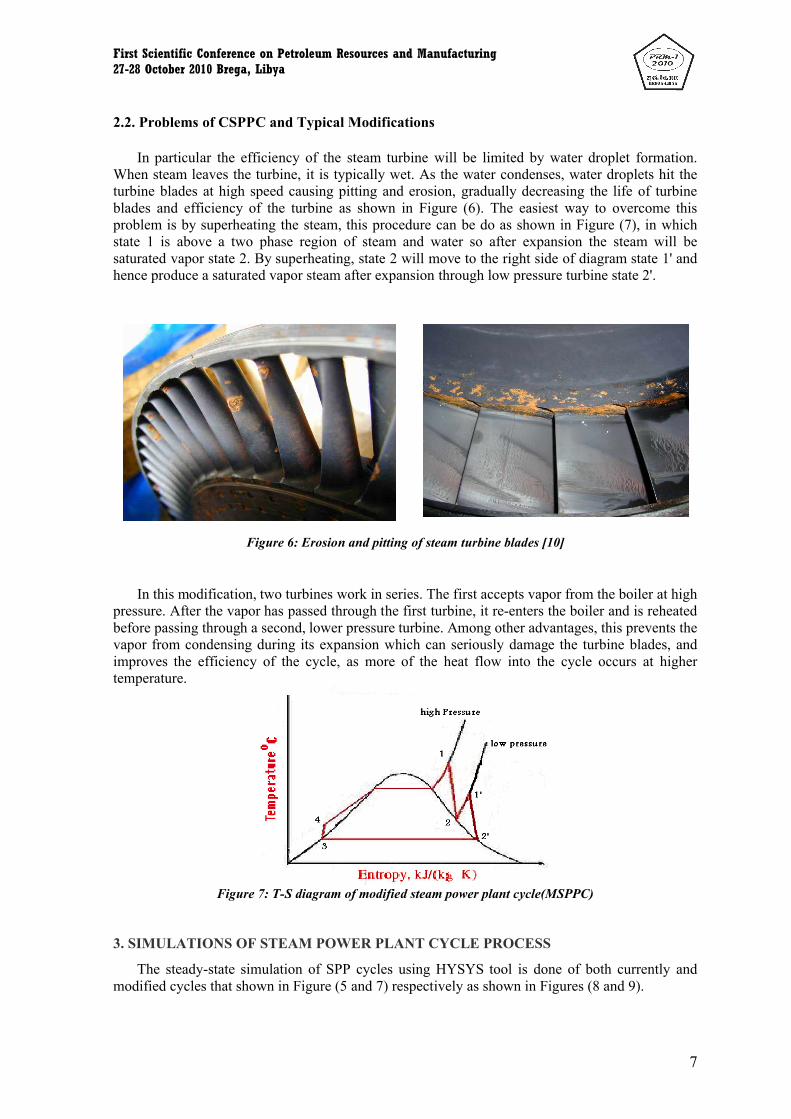
In particular the efficiency of the steam turbine will be limited by water droplet formation.When steam leaves the turbine, it is typically wet. As the water condenses, water droplets hit the turbine blades at high speed causing pitting and erosion, gradually decreasing the life of turbine blades and efficiency of the turbine as shown in Figure (6). The easiest way to overcome this problem is by superheating the steam, this procedure can be do as shown in Figure (7), in which state 1 is above a two phase region of steam and water so after expansion the steam will be saturated vapor state 2. By superheating, state 2 will move to the right side of diagram state 1' and hence produce a saturated vapor steam after expansion through low pressure turbine state 2'.
Figure 6: Erosion and pitting of steam turbine blades [10]
In this modification, two turbines work in series. The first accepts vapor from the boiler at high pressure. After the vapor has passed through the first turbine, it re-enters the boiler and is reheated before passing through a second, lower pressure turbine. Among other advantages, this prevents the vapor from condensing during its expansion which can seriously damage the turbine blades, and improves the efficiency of the cycle, as more of the heat flow into the cycle occurs at higher temperature.
Figure 7: T-S diagram of modified steam power plant cycle(MSPPC)
3. SIMULATIONS OF STEAM POWER PLANT CYCLE PROCESS
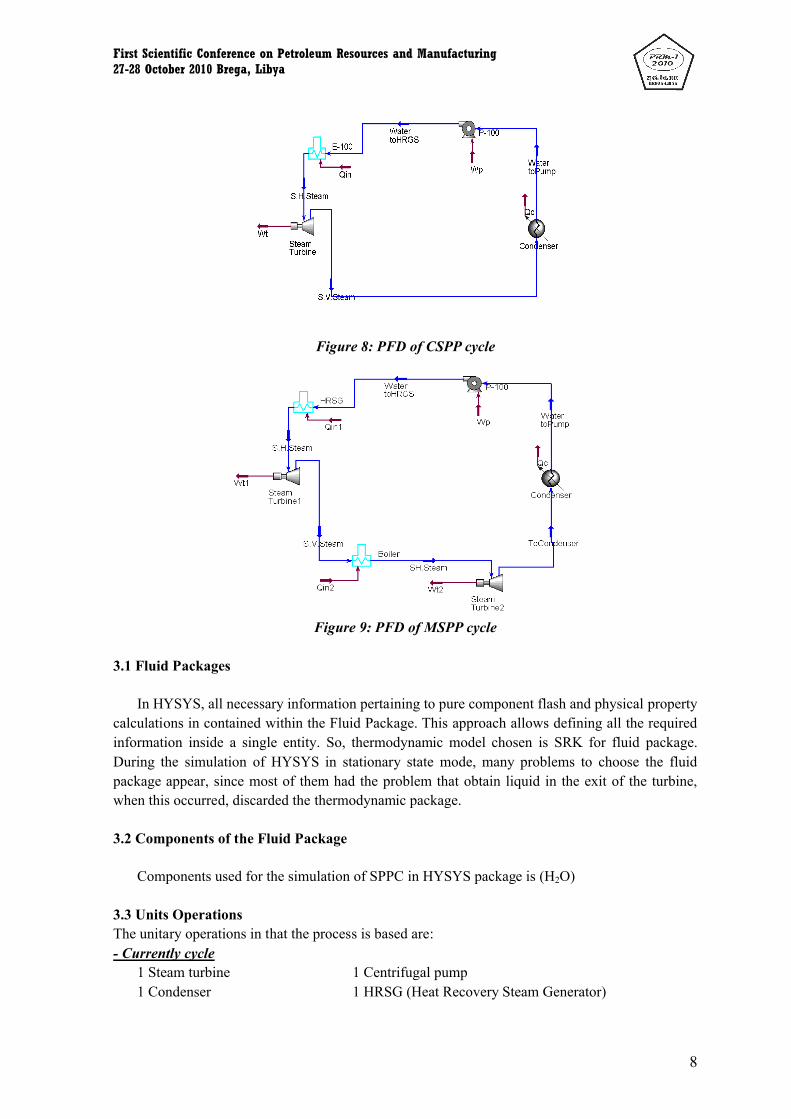
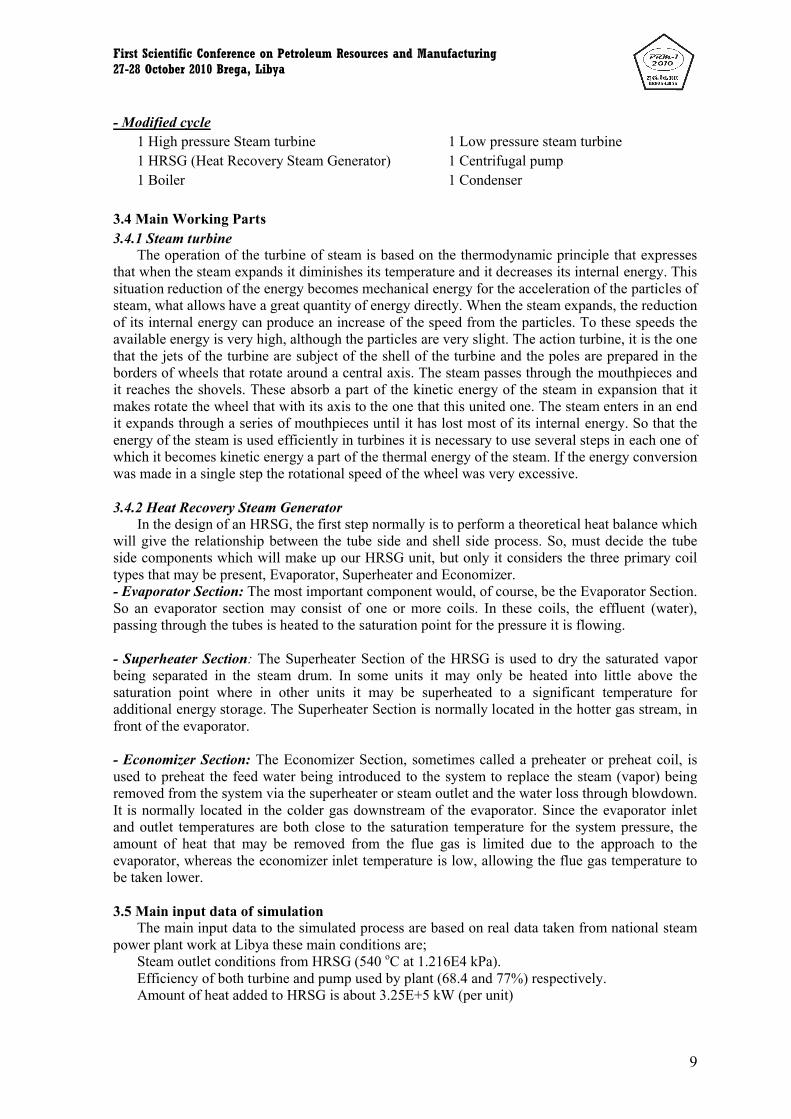
The steady-state simulation of SPP cycles using HYSYS tool is done of both currently and modified cycles that shown in Figure (5 and 7) respectively as shown in Figures (8 and 9).
First Scientific Conference on Petroleum Resources and Manufacturing27-28 October 2010 Brega, Libya
8
Figure 8: PFD of CSPP cycle
Figure 9: PFD of MSPP cycle
3.1 Fluid Packages
In HYSYS, all necessary information pertaining to pure component flash and physical property calculations in contained within the Fluid Package. This approach allows defining all the required information inside a single entity. So, thermodynamic model chosen is SRK for fluid package.During the simulation of HYSYS in stationary state mode, many problems to choose the fluid package appear, since most of them had the problem that obtain liquid in the exit of the turbine, when this occurred, discarded the thermodynamic package.
3.2 Components of the Fluid Package
Components used for the simulation of SPPC in HYSYS package is (H2O)
3.3 Units OperationsThe unitary operations in that the process is based are:- Currently cycle
1 Steam turbine 1 Centrifugal pump1 Condenser 1 HRSG (Heat Recovery Steam Generator)
First Scientific Conference on Petroleum Resources and Manufacturing27-28 October 2010 Brega, Libya
9
- Modified cycle1 High pressure Steam turbine 1 Low pressure steam turbine1 HRSG (Heat Recovery Steam Generator) 1 Centrifugal pump1 Boiler 1 Condenser
3.4 Main Working Parts3.4.1 Steam turbine
The operation of the turbine of steam is based on the thermodynamic principle that expresses that when the steam expands it diminishes its temperature and it decreases its internal energy. This situation reduction of the energy becomes mechanical energy for the acceleration of the particles of steam, what allows have a great quantity of energy directly. When the steam expands, the reduction of its internal energy can produce an increase of the speed from the particles. To these speeds the available energy is very high, although the particles are very slight. The action turbine, it is the one that the jets of the turbine are subject of the shell of the turbine and the poles are prepared in the borders of wheels that rotate around a central axis. The steam passes through the mouthpieces and it reaches the shovels. These absorb a part of the kinetic energy of the steam in expansion that it makes rotate the wheel that with its axis to the one that this united one. The steam enters in an end it expands through a series of mouthpieces until it has lost most of its internal energy. So that the energy of the steam is used efficiently in turbines it is necessary to use several steps in each one of which it becomes kinetic energy a part of the thermal energy of the steam. If the energy conversion was made in a single step the rotational speed of the wheel was very excessive.
3.4.2 Heat Recovery Steam GeneratorIn the design of an HRSG, the first step normally is to perform a theoretical heat balance which
will give the relationship between the tube side and shell side process. So, must decide the tube side components which will make up our HRSG unit, but only it considers the three primary coil types that may be present, Evaporator, Superheater and Economizer.- Evaporator Section: The most important component would, of course, be the Evaporator Section. So an evaporator section may consist of one or more coils. In these coils, the effluent (water), passing through the tubes is heated to the saturation point for the pressure it is flowing.
- Superheater Section: The Superheater Section of the HRSG is used to dry the saturated vapor being separated in the steam drum. In some units it may only be heated into little above the saturation point where in other units it may be superheated to a significant temperature for additional energy storage. The Superheater Section is normally located in the hotter gas stream, in front of the evaporator.
- Economizer Section: The Economizer Section, sometimes called a preheater or preheat coil, is used to preheat the feed water being introduced to the system to replace the steam (vapor) being removed from the system via the superheater or steam outlet and the water loss through blowdown. It is normally located in the colder gas downstream of the evaporator. Since the evaporator inlet and outlet temperatures are both close to the saturation temperature for the system pressure, the amount of heat that may be removed from the flue gas is limited due to the approach to the evaporator, whereas the economizer inlet temperature is low, allowing the flue gas temperature to be taken lower.
3.5 Main input data of simulationThe main input data to the simulated process are based on real data taken from national steam
power plant work at Libya these main conditions are;Steam outlet conditions from HRSG (540 oC at 1.216E4 kPa).Efficiency of both turbine and pump used by plant (68.4 and 77%) respectively.Amount of heat added to HRSG is about 3.25E+5 kW (per unit)
First Scientific Conference on Petroleum Resources and Manufacturing27-28 October 2010 Brega, Libya
10
Other values of data are simulated by HYSYS depending on basic information of Figures (5 & 7) for both cycles respectively.
3.6 Efficiency of SPPCThis type of power station has very high energy losses due to great heat loss in the boiler and
condenser. The overall efficiency of steam power station is much lower and that is about 29%, it is mainly due to two reasons. Firstly a large amount of heat is wasted in condensers and secondly the heat wastage in other parts of the plant. The heat loss in the condenser is unavoidable since heat energy cannot be converted into mechanical energy without temperature difference. The greater oftemperature difference greater is the heat energy converted into mechanical energy. This necessitates keeping the temperature of condenser to a minimum value. But the greater temperature difference, greater the amount of heat lost. This explains the low efficiency of steam plants.
The following equation is used to calculate SPPC efficiency [11]:
- Thermal EfficiencyThermal efficiency of a steam power station is calculated as follow;
%100*in
outinThermal Q
QQ ………………………….. (1)
Qout : Heat out of the cycle by condenser, (kW)Qin : Heat into the cycle of combustion of fuel, (kW).
The thermal efficiency of a steam power station is about 30%±2, i.e. if 100 calories is produced only 30 calories of mechanical equivalent is available at the turbine shaft and it may be also noted that 50% of combustion heat is lost in condenser.
- Overall efficiencyThe overall efficiency of steam power station is;
%100*in
PTOverall Q
WW ………………………….. (2)
WT : Power out of turbine, (kW)WP : Power into the pump, (kW)
The overall efficiency of steam power station is about 29%. It is seen that overall efficiency is less than thermal efficiency. A loss of about 1% occurs in the alternator.
There is relation between efficiencies as shown below;
lElectericaThermalOverall * ………………………….. (3)
4. RESULTS AND DISCUSSION4.1 Current Steam Power Plant Cycle (CSPPC)
A simulation process of current SPPC gave the data shown in Table (7).
Table (7): Results of simulation process of CSPPC
Stream S.H. Steam S.V. Steam Water to Pump Water to HRGSState Super heated steam Saturated Vapor Saturated liquid Cooled liquid
Temp. (oC) 540 99.99 99.99 101.2Pressure, (kPa) 1.216E4 101.3 101.3 1.216E4
First Scientific Conference on Petroleum Resources and Manufacturing27-28 October 2010 Brega, Libya
11
According calculations done by Hysys, note that obtained results are satisfied with assumed in Figure (5). In which outlet stream from turbine in saturated vapor containing drops of water, these water droplets hit the turbine blades at high speed causing pitting and erosion, gradually decreasing the life of turbine blades and efficiency of the turbine as shown in Figure (6).
4.2 Modified Steam Power Plant Cycle (MSPPC)
A simulation process of modified SPPC gave the data shown in Table (8).
Table (8): Results of simulation process of MSPPC
Stream S.H. SteamS.V.
SteamSH. Steam To Condenser
Water to Pump
Water to HRGS
StateSuper heated
steamSaturated
VaporSuper heated
steamSaturated
VaporSaturated
liquidCooled liquid
Temp. (oC) 540 138.1 145 99.9 99.9 101.2Pressure, (kPa) 1.216E4 341.4 341.4 101.3 101.3 1.216E4
According calculations done by HYSYS, note that obtained results are satisfied with assumed in Figure (7). In which outlet stream from turbine in saturated vapor containing drops of water this stream is heating again using boiler up to superheated state at low pressure, then pass to a low pressure steam turbine, to give a saturated vapor at atmospheric pressure, before entering to condenser.
4.3. Comparison between both cyclesAs shown in Table (9), note that, amount of heat loses in condenser in modified cycle is lesser
than that in current cycle. Also, quantity of output power from turbines of MSPPC is greater than that of CSPPS. So, that leads to increase overall and electrical efficiencies of MSPPC more than CSPPC. Values of calculated efficiencies of both cycles are shown in Table (9)
Table (9): Comparisons between efficiencies of both Cycles
Values CSPPC MSPPC
Per one unit QC, (kW) 2.45E+05 2.35E+05
Qin, (kW) 3.25E+05 3.26E+05 ηThermal, (%) 24.59 28.1 ηOverall, (%) 24.57 28.1 ηElecterical, (%) 99.9 100 WT, (kW) 8.17E+04 9.36E+04 WP, (kW) 1.78E+03 1.78E+03For Plant (consist of 4 Units) WT (plant), (kW) 3.27E+05 3.74E+05 WP (plant), (kW) 7.12E+03 7.12E+03 Work to Electrical, (WT-WP) 3.19E+05 3.67E+05
As a result of increasing efficiency of MSPPC more than CSPPC, amount of output power from cycle will be increase. In which overall efficiency of the plant increased from 24.57% to 28.1%, thermal efficiency increase from 24.59% to 28.1% that leads to decrease a heat loses from
First Scientific Conference on Petroleum Resources and Manufacturing27-28 October 2010 Brega, Libya
12
cycle by condenser and loss to environment, also increase the output rate of electrical power produced to about 15% greater than current case.5. CONCLUSION
A results of simulation process of steam power plant done using (HYSYS v.3.2) to improve the performance of plant also increasing efficiency through prevent erosion occurs and decreasing heat loses by condenser. In which a modification of current steam power plant leading to an overall efficiency of the plant increased from 24.57% to 28.1%, thermal efficiency increase from 24.59% to 28.1% also increase the output rate of electrical power produced to about 15%. Application of this modification on a current steam power plant especially in the oil industry leads to increasing the rate of electric power can also take advantage of waste heat in the production of distilled water.
REFERENCES[1] British Electricity International (1991). "Modern Power Station Practice: incorporating
modern power system practice", 3rd edition, Pergamon press. [2] Babcok & Wilcox Co. (2005). Steam: Is Generation and Use, 41st edition. [3] Elliot T.C., Chen K. and Swanekamp R. (1997). "Standard Handbook of power plant
Engineering", 2nd edition, McGraw-Hill Professional. [4] Net generation by Energy Source by Type of Producer (2006). Accessed 28-03-2008,
Washington: Dep. of Energy, Energy Information Administration USA (http://www.eia.doe.gov/cneaf/elcericty/epa/epatp1.html).
[5] Shibani M. and Najah N. (2006). "Studying the effect of fuel type and cost on the economics of power generation", TOG 3 Congress, Tripoli/Libya.
[6] GECOL database (2008), www.Gecol.ly[7] Middle East business Intelligence, (2010). www.meed.com.[8] GECOL database, (2010). www.Gecol.ly[9] Jones J.B.and Dugan R.E., (1995). "Engineering Thermodynamics", Prentice Hall; 1st ed.[10] National steam power station, (2010).[11] Arjun M., (2008). "Efficiency of Steam Power Plant",
http://electricalandelectronics.org /2008/09/20/efficiency-of-steam-power-station/.