identification of active release planes using ground-based differential insar at the randa rock...
TRANSCRIPT
Nat. Hazards Earth Syst. Sci., 9, 2027–2038, 2009www.nat-hazards-earth-syst-sci.net/9/2027/2009/© Author(s) 2009. This work is distributed underthe Creative Commons Attribution 3.0 License.
Natural Hazardsand Earth
System Sciences
Identification of active release planes using ground-baseddifferential InSAR at the Randa rock slope instability, Switzerland
V. Gischig1, S. Loew1, A. Kos1, J. R. Moore1, H. Raetzo2, and F. Lemy1,*
1Geological Institute, Swiss Federal Institute of Technology (ETH), Zurich, Switzerland2Federal Office for the Environment (FEON), Bern, Switzerland* now at: Federal Agency for Nuclear Control (FANC), Brussels, Belgium
Received: 10 September 2009 – Accepted: 10 November 2009 – Published: 4 December 2009
Abstract. Five ground-based differential interferometricsynthetic aperture radar (GB-DInSAR) surveys were con-ducted between 2005 and 2007 at the rock slope instability atRanda, Switzerland. Resultant displacement maps revealed,for the first time, the presence of an active basal rupture zoneand a lateral release surface daylighting on the exposed 1991failure scarp. Structures correlated with the boundaries of in-terferometric displacement domains were confirmed using ahelicopter-based LiDAR DTM and oblique aerial photogra-phy. Former investigations at the site failed to conclusivelydetect these active release surfaces essential for kinematicand hazard analysis of the instability, although their existencehad been hypothesized. The determination of the basal andlateral release planes also allowed a more accurate estimateof the currently unstable volume of 5.7±1.5 million m3. Thedisplacement patterns reveal that two different kinematic be-haviors dominate the instability, i.e. toppling above 2200 mand translational failure below. In the toppling part of theinstability the areas with the highest GB-DInSAR displace-ments correspond to areas of enhanced micro-seismic activ-ity. The observation of only few strongly active disconti-nuities daylighting on the 1991 failure surface points to arather uniform movement in the lower portion of the insta-bility, while most of the slip occurs along the basal rup-ture plane. Comparison of GB-DInSAR displacements withmapped discontinuities revealed correlations between dis-placement patterns and active structures, although spatialoffsets occur as a result of the effective resolution of GB-DInSAR. Similarly, comparisons with measurements fromtotal station surveys generally showed good agreement. Dis-crepancies arose in several cases due to local movement ofblocks, the size of which could not be resolved using GB-DInSAR.
Correspondence to:V. Gischig([email protected])
1 The Randa rockslope instability
In the spring of 1991 two large rockslides occurred above thevillage of Randa in the Matter Valley (southern Swiss Alps).Within a three week period, a total volume of 30 million m3
of rock was released. The resulting talus cone dammed theriver and formed a lake, which flooded the nearby village(Schindler et al., 1993). The kinematics and mechanismsof the 1991 events were studied by Sartori et al. (2003) andEberhardt et al. (2004). One legacy of these failures was theformation of an 800 m high scarp, behind which an estimated3–9 million m3 (Ischi et al., 1991) of rock remains unstable.In 1995, a geodetic network, consisting of seven 3-D reflec-tors and eighteen 1-D reflectors located in the crown andalong the edge of the scarp, was setup to monitor rock massdisplacements (Jaboyedoff et al., 2004). The kinematics ofthe current instability was investigated in a research projectbegun in 2001, which included field mapping and boreholelogging (Willenberg et al., 2008a), geophysical imaging ofthe 3-D extent of discontinuities (Heincke et al., 2005 and2006; Spillmann et al., 2007a), monitoring of micro-seismicactivity associated with rock mass deformation (Spillmannet al., 2007b), as well as surface crack and borehole mon-itoring (Willenberg et al., 2008b). Displacements resolvedfrom total station measurements were used to approximatethe extents of the moving mass. However, due to their sparsedistribution, large uncertainties remained. The deformationpattern was interpreted as block toppling in the upper part ofthe instability (Loew et al., 2007). A basal rupture surfacewas postulated by Jaboyedoff et al. (2004) by interpretinggeodetic data and later by Willenberg et al. (2008b). How-ever, it could not be detected with geophysical imaging orwithin a 120 m deep borehole. All previous investigationswere limited to the accessible area at the top of the instability,whereas large portions of the currently unstable rock masscould not be studied due to the inaccessibility of the nearly800 m high cliff face. Inspection of photographs of the 1991
Published by Copernicus Publications on behalf of the European Geosciences Union.
2028 V. Gischig et al.: Identification of active release planes
failure surface could not conclusively prove the existence ofa basal rupture plane or other active structures that may out-crop on the scarp, since the pattern of faults and joints is toocomplex and no in-situ monitoring is available to confirmmovements.
In this manuscript we present data from five ground-baseddifferential InSAR (GB-DInSAR) surveys carried out be-tween September 2005 and September 2007. We first de-scribe relevant technical details about the technique, the sur-veys at Randa and the processing of the data. Displace-ment maps obtained from these surveys are then interpretedtowards the observation of active large-scale release struc-tures bounding the instability, which have remained unde-tected by previous investigations. The datasets are also com-pared to the structural map by Willenberg et al. (2008a) andto results from complementary geodetic surveys and micro-seismic monitoring. Observations are discussed in terms oftheir implications for kinematics of the rock slope instability,as well as with regards to the spatial and temporal resolutionlimitations of the technique.
2 Ground-based differential radar interferometry
2.1 The GB-DInSAR technique
Ground-based synthetic aperture radar interferometry is anestablished, reliable method for spatial displacement mon-itoring of rock slopes (e.g. Tarchi et al. 2003a, b; Linguaet al., 2008), and is especially valuable when inaccessibil-ity prohibits the application of other traditional monitoringtechniques. For ground-based systems, the synthetic aper-ture radar (SAR) method relies on linear translation of anantenna-transmitter pair to create a synthetic aperture (i.e. anantenna length in the range of 2.0–2.7 m). A series of ob-servations are combined in post-processing as if they hadbeen made simultaneously using a large antenna, providingthe resolution in azimuth (Tarchi et al., 2003a, b). The re-sulting SAR image is a map of complex numbers containingboth the amplitude and the phase of the radar signals reflectedby the target. The range resolution cell size of such imagesis inversely proportional to the frequency bandwidth of thesystem, whereas the azimuthal resolution is inversely propor-tional to the synthetic aperture length. Two subsequent SARimages can be combined to create an interferogram (i.e. aGB-DInSAR image) by extracting the phase difference1ϕ
between the two acquisitions from the complex values ofeach resolution cell. The corresponding displacement (1s)is then obtained as:
1s =1ϕ
4πλ (1)
whereλ is the wavelength of the signals. An important prop-erty of the GB-DInSAR method is the ambiguity of the phasedifferences, which can only vary between±π . Thus, dis-placements smaller or larger than±λ/4 result in apparent val-
ues between±λ/4 differing from the real value by a multipleof the full wavelength. This effect is called phase wrappingand is important for interpretation of GB-DInSAR displace-ment maps. The reliability of GB-DInSAR data is controlledby both the reflectivity of the ground and temporal decor-relation between acquisitions. Reflectivity of a surface de-termines the strength of the signal reflected back to the re-ceiver by the target, i.e. the reflected power. It is generallylow for densely vegetated areas and smooth targets not per-pendicular to the line-of-sight (LOS). Decorrelation resultsfrom strong movements within a resolution cell between twoacquisitions, e.g. due to unstable debris cover or differentialdisplacements. A measure of the strength of decorrelationis the signal coherence from two subsequent acquisitions,which is defined as:
γ =E
[ms∗
]√E [m]2E [s]2
(2)
wherem ands are the complex numbers of two acquisitionsfor one particular resolution cell, (*) denotes complex con-jugate, andE signifies the expectation value. The signal co-herence is a number between 0 and 1 and is a measure ofthe similarity of the transmitted and the received signal. Inan interferogram, unreliable data can be masked by settinga threshold for both reflected power and coherence. Furtherprocessing steps are commonly performed on GB-DInSARimages, e.g. multi-look filtering (Lee et al., 1994) and otherfilters, which often lower the theoretical spatial resolution ofthe system since neighboring cells are no longer independent.
2.2 GB-DInSAR data acquisition and processing at theRanda instability
The 1991 failure surface of the Randa rock slope instabil-ity is well suited for application of GB-DInSAR due to theabsence of vegetation and the possibility to align the radarsuch that the LOS is sub-parallel to the rock mass displace-ments. Between 2005 and 2007, five GB-DInSAR measure-ments were conducted by Ellegi Srl (Milano, Italy) usingtheir GB-DInSAR system called LiSA. The LiSA base sta-tion was located at 1560 m a.s.l. on the valley wall oppositethe 1991 failure scarp. System specifications and acquisi-tion parameters for these radar surveys are summarized inTable 1, while campaign dates and time intervals are shownin Table 2. Methods employed in processing radar imagesare described by Fortuny and Sieber (1994) and Tarchi etal. (2003a, b), while some relevant points concerning theRanda datasets are described here. Since Ellegi Srl also pro-cessed the Randa data using their proprietary methods, wecan only give a basic description of the processing steps.
To exclude unreliable phase measurements, the thresholdsfor coherence and reflected power given in Table 1 were used.The radar data were gridded on a regular 2×2 m Cartesiangrid (Leva et al., 2003), which is smaller than the theoret-ical resolution of the system (1.9×4–6.5 m, Table 1). This
Nat. Hazards Earth Syst. Sci., 9, 2027–2038, 2009 www.nat-hazards-earth-syst-sci.net/9/2027/2009/
V. Gischig et al.: Identification of active release planes 2029
Table 1. Acquisition parameters for the GB-DInSAR surveys.
Target distance 1.3–2 kmRange resolution 1.9 mMinimal azimuthal resolution 4 mMaximum azimuthal resolution 6.5 mSynthetic aperture length 2 mFrequency range 17.10–17.18 GHzCoherence and power (reflectivity) threshold 0.65 and−50 dB
Table 2. Dates of the GB-DInSAR surveys and time intervals to theprevious survey.
Survey Date Time to previoussurvey
Reference 22 September 20051st repeat (image B) 20 November 2005 59 days2nd repeat (image C) 3 October 2006 316 days3rd repeat (Fig. 8) 7 June 2007 248 days4th repeat 26 September 2007 111 days
interpolation is used to prevent aliasing during later process-ing, but also means that the images cannot be interpreted onthe level of single pixels. A proprietary multi-look filter wasused to help reduce phase noise due to the speckle effect(Lee et al., 1994), i.e. a number of independent views of thescene were averaged to smooth the grainy character of non-averaged views. Other proprietary post-processing steps, thedetails of which are not available to the authors, involve fil-ters running over 7×7 pixels in the case of the Randa acqui-sitions. Thus, the resulting images have an effective resolu-tion of 14×14 m. Values of single pixels are therefore notindependent of their neighboring pixels, and thus differentialdisplacement patterns can only be interpreted if they are con-sistent over a distance greater than the effective resolution.Finally, the images were overlain on a hill-shaded DTM withresolution of 0.5 m, which was derived from helicopter-basedLiDAR data (acquired by Helimap Systems SA).
3 Results
3.1 Displacement maps
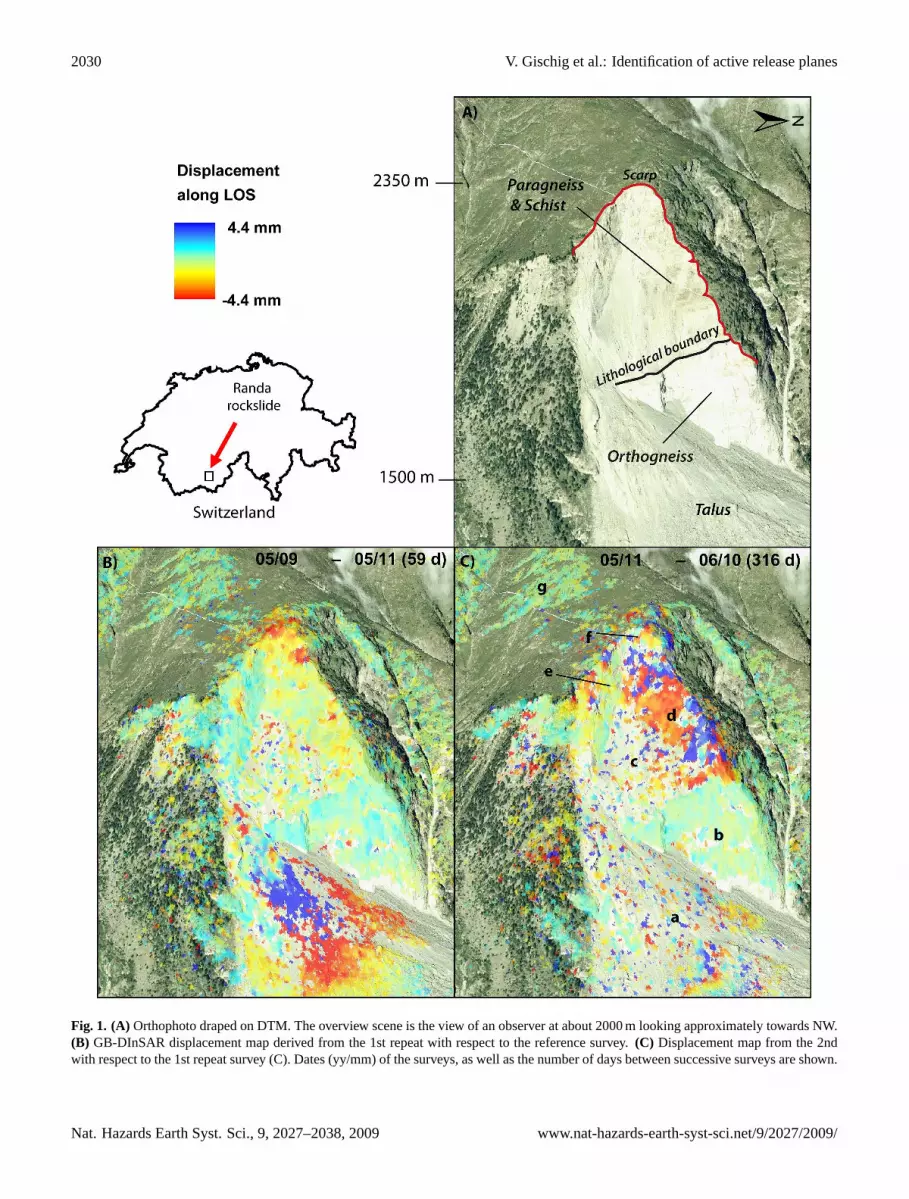
GB-DInSAR image maps showing displacements betweenSeptember and November 2005 (59 days), as well as betweenNovember 2005 and October 2006 (316 days) are presentedin Fig. 1. The color scale shows displacements from−4.4 to+4.4 mm corresponding to±λ/4 of the radar. Negative values(red to yellow) show displacement along the LOS towards theobserver, positive values (light blue to blue) away from theobserver, and turquoise values represent zero displacement.
An overview of the GB-DInSAR scene including the basestation position, the line-of-sight, as well as the locationsof detail figures described later is given in Fig. 2 (displace-ment image between October 2006 and June 2007; 248 days).All displacement maps reveal a similar overall pattern. Inthe talus at the bottom of the images (region (a) in Fig. 1),measured displacements suffer from decorrelation and phasewrapping (displacements> λ/4). Displacements on imageB (59 days interval), however, show a consistent pattern in-terpreted as consolidation of the debris cone (Fig. 3). Onthe same image, an elongated decorrelation pattern close tothe steep orthogneiss cliff on the debris cone correlates withactive debris flow channels. The steep orthogneiss cliff justabove the talus (region b) is stable throughout all measure-ments. Above this stable cliff is a sharp transition to unstablerock (region d), which is best observed on image C (316 daysinterval). In region (d), displacements are relatively uniformover a large area. Slightly higher displacements in this regionresult in phase wrapping on image C, i.e. sudden transitionsbetween negative (red) and positive (blue) displacements. Tothe south of region (d), a large portion of the 1991 scarp iscovered with debris (region c). Decorrelation due to debrismovement limits interpretation in this area. Region (e) de-lineates a portion of the scarp which is primarily stable, al-though some blocks moving towards the scarp edge can beseen. Above region (d) and to the north of the stable re-gion (e), displacements increase towards the top of the scarp(region f). Here, the greatest displacements were measured.The transition from the uniformly moving region (d) to re-gion (f) occurs at about 2200 m. This transition is clearly vis-ible on image B, whereas image C suffers from phase wrap-ping. Above region (f), some data gaps occur in grassy areasdue to decorrelation and shadowing. In the upper part of theimages (region g) extended stable areas are found.
3.2 Release planes identified on GB-DInSARdisplacement maps
The lower boundary of the unstable rock mass can be identi-fied by a sharp transition from 0 mm displacement (region b)to 4 mm displacement (region d) on image C in Fig. 1 (en-larged in Fig. 4). The magnitude of the displacement rateand the location of the transition are consistent across all im-ages. The location of this transition corresponds to the traceof the boundary between the two primary lithologies on therock slope: strongly fractured paragneiss and schist overlay-ing more competent orthogneiss. However, the lithologicalboundary is sub-parallel to foliation and dips into the slopeat roughly 20◦. Water discharge is often observed along thisboundary after snow melt and heavy rainfall. This structurecan also be identified on high resolution aerial photographs(Fig. 4). The transition between the stable cliff and the insta-bility above is characterized by a sharp increase in displace-ment over one pixel, or by decorrelation across 2–3 pixels.Bearing in mind that the original range resolution before
www.nat-hazards-earth-syst-sci.net/9/2027/2009/ Nat. Hazards Earth Syst. Sci., 9, 2027–2038, 2009
2030 V. Gischig et al.: Identification of active release planes
Fig. 1. (A) Orthophoto draped on DTM. The overview scene is the view of an observer at about 2000 m looking approximately towards NW.(B) GB-DInSAR displacement map derived from the 1st repeat with respect to the reference survey.(C) Displacement map from the 2ndwith respect to the 1st repeat survey (C). Dates (yy/mm) of the surveys, as well as the number of days between successive surveys are shown.
Nat. Hazards Earth Syst. Sci., 9, 2027–2038, 2009 www.nat-hazards-earth-syst-sci.net/9/2027/2009/
V. Gischig et al.: Identification of active release planes 2031
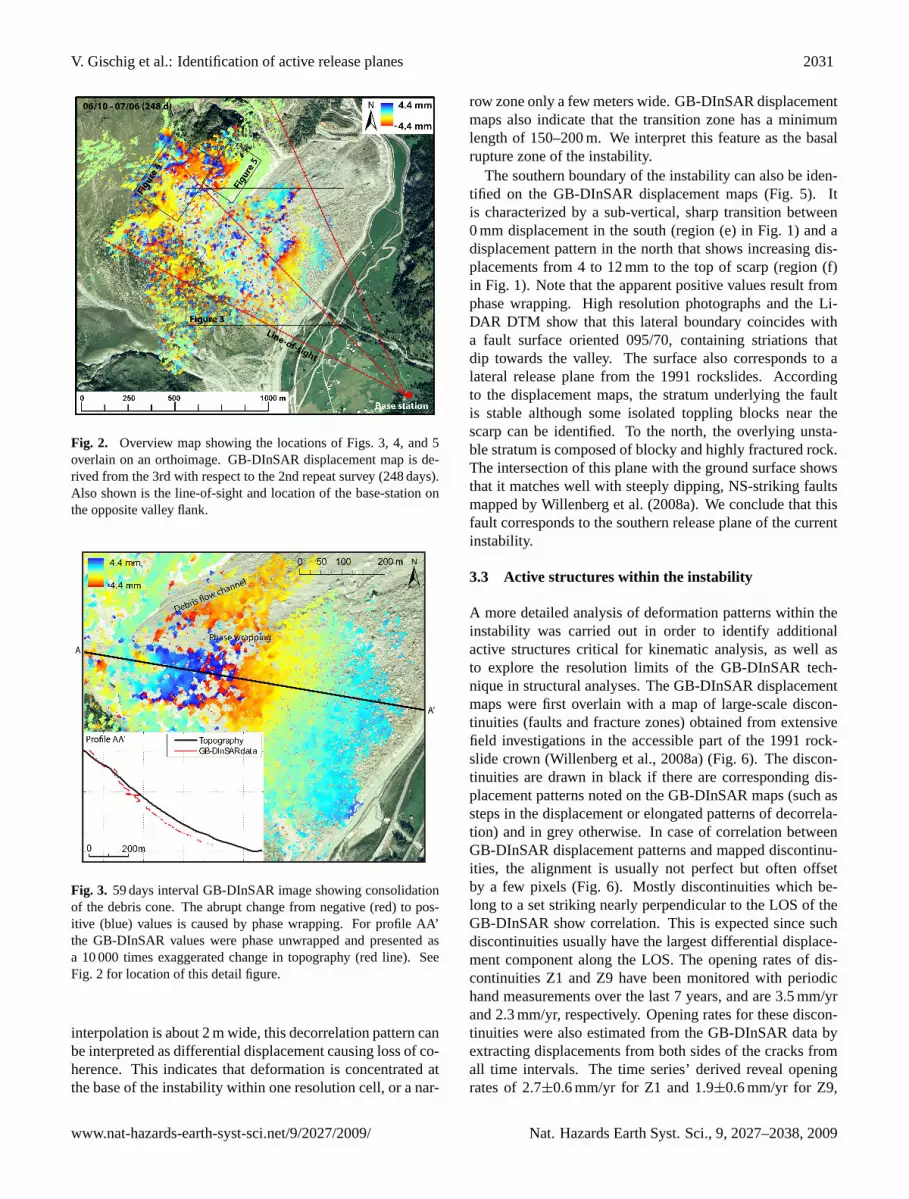
Fig. 2. Overview map showing the locations of Figs. 3, 4, and 5overlain on an orthoimage. GB-DInSAR displacement map is de-rived from the 3rd with respect to the 2nd repeat survey (248 days).Also shown is the line-of-sight and location of the base-station onthe opposite valley flank.
Fig. 3. 59 days interval GB-DInSAR image showing consolidationof the debris cone. The abrupt change from negative (red) to pos-itive (blue) values is caused by phase wrapping. For profile AA’the GB-DInSAR values were phase unwrapped and presented asa 10 000 times exaggerated change in topography (red line). SeeFig. 2 for location of this detail figure.
interpolation is about 2 m wide, this decorrelation pattern canbe interpreted as differential displacement causing loss of co-herence. This indicates that deformation is concentrated atthe base of the instability within one resolution cell, or a nar-
row zone only a few meters wide. GB-DInSAR displacementmaps also indicate that the transition zone has a minimumlength of 150–200 m. We interpret this feature as the basalrupture zone of the instability.
The southern boundary of the instability can also be iden-tified on the GB-DInSAR displacement maps (Fig. 5). Itis characterized by a sub-vertical, sharp transition between0 mm displacement in the south (region (e) in Fig. 1) and adisplacement pattern in the north that shows increasing dis-placements from 4 to 12 mm to the top of scarp (region (f)in Fig. 1). Note that the apparent positive values result fromphase wrapping. High resolution photographs and the Li-DAR DTM show that this lateral boundary coincides witha fault surface oriented 095/70, containing striations thatdip towards the valley. The surface also corresponds to alateral release plane from the 1991 rockslides. Accordingto the displacement maps, the stratum underlying the faultis stable although some isolated toppling blocks near thescarp can be identified. To the north, the overlying unsta-ble stratum is composed of blocky and highly fractured rock.The intersection of this plane with the ground surface showsthat it matches well with steeply dipping, NS-striking faultsmapped by Willenberg et al. (2008a). We conclude that thisfault corresponds to the southern release plane of the currentinstability.
3.3 Active structures within the instability
A more detailed analysis of deformation patterns within theinstability was carried out in order to identify additionalactive structures critical for kinematic analysis, as well asto explore the resolution limits of the GB-DInSAR tech-nique in structural analyses. The GB-DInSAR displacementmaps were first overlain with a map of large-scale discon-tinuities (faults and fracture zones) obtained from extensivefield investigations in the accessible part of the 1991 rock-slide crown (Willenberg et al., 2008a) (Fig. 6). The discon-tinuities are drawn in black if there are corresponding dis-placement patterns noted on the GB-DInSAR maps (such assteps in the displacement or elongated patterns of decorrela-tion) and in grey otherwise. In case of correlation betweenGB-DInSAR displacement patterns and mapped discontinu-ities, the alignment is usually not perfect but often offsetby a few pixels (Fig. 6). Mostly discontinuities which be-long to a set striking nearly perpendicular to the LOS of theGB-DInSAR show correlation. This is expected since suchdiscontinuities usually have the largest differential displace-ment component along the LOS. The opening rates of dis-continuities Z1 and Z9 have been monitored with periodichand measurements over the last 7 years, and are 3.5 mm/yrand 2.3 mm/yr, respectively. Opening rates for these discon-tinuities were also estimated from the GB-DInSAR data byextracting displacements from both sides of the cracks fromall time intervals. The time series’ derived reveal openingrates of 2.7±0.6 mm/yr for Z1 and 1.9±0.6 mm/yr for Z9,
www.nat-hazards-earth-syst-sci.net/9/2027/2009/ Nat. Hazards Earth Syst. Sci., 9, 2027–2038, 2009
2032 V. Gischig et al.: Identification of active release planes
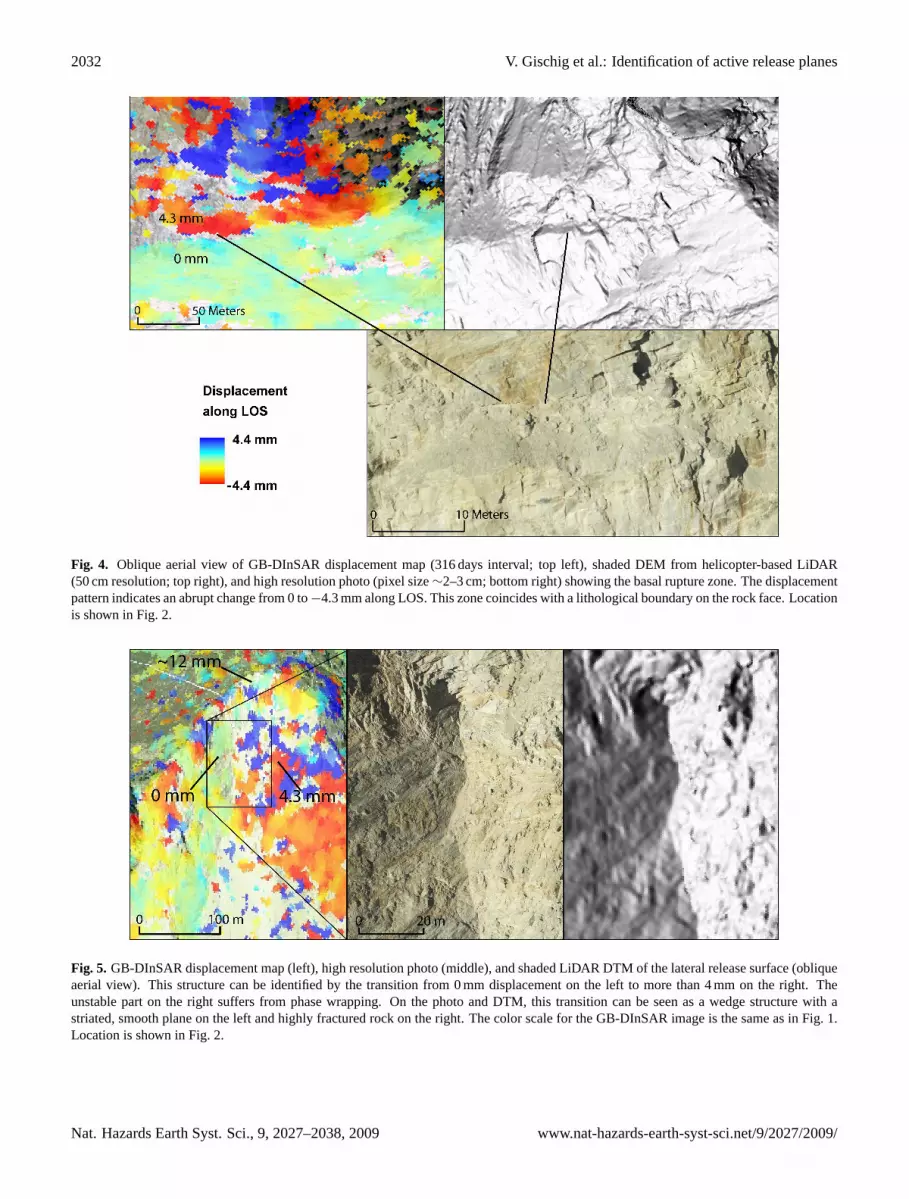
Fig. 4. Oblique aerial view of GB-DInSAR displacement map (316 days interval; top left), shaded DEM from helicopter-based LiDAR(50 cm resolution; top right), and high resolution photo (pixel size∼2–3 cm; bottom right) showing the basal rupture zone. The displacementpattern indicates an abrupt change from 0 to−4.3 mm along LOS. This zone coincides with a lithological boundary on the rock face. Locationis shown in Fig. 2.
Fig. 5. GB-DInSAR displacement map (left), high resolution photo (middle), and shaded LiDAR DTM of the lateral release surface (obliqueaerial view). This structure can be identified by the transition from 0 mm displacement on the left to more than 4 mm on the right. Theunstable part on the right suffers from phase wrapping. On the photo and DTM, this transition can be seen as a wedge structure with astriated, smooth plane on the left and highly fractured rock on the right. The color scale for the GB-DInSAR image is the same as in Fig. 1.Location is shown in Fig. 2.
Nat. Hazards Earth Syst. Sci., 9, 2027–2038, 2009 www.nat-hazards-earth-syst-sci.net/9/2027/2009/

V. Gischig et al.: Identification of active release planes 2033
Fig. 6. Discontinuities mapped by Willenberg et al. (2008a) over-lain on the GB-DInSAR displacement map representing 248 days ofdisplacement. Although the displacement map is strongly affectedby phase wrapping, some patterns clearly correlate with mappeddiscontinuities. For the discontinuities Z1 and Z9 opening rateswere estimated using the GB-DInSAR displacements and comparedto opening rates measured by hand. The GB-DInSAR derived open-ing rates gave similar but slightly lower values.
which are slightly lower than the opening rates from fieldmeasurements. Such discrepancies can be expected since thedirection of relative displacement across these discontinuitiesdeviates from the LOS of GB-DInSAR.
The GB-DInSAR displacement maps were also overlainwith structures mapped on the 0.5 m LiDAR DTM from theinaccessible 1991 scarp surfaces in order to identify previ-ously unmapped active discontinuities within the unstablerock mass. Figure 7 shows structures within the 1991 fail-ure surface that correlate with GB-DInSAR displacementpatterns in black, while structures not correlating with dis-placement patterns are shown in grey. Two local topplinginstabilities superimposed on the large-scale unstable rockmass could be identified in photographs (inset in Fig. 7). Inaddition to the lateral release surface and the basal ruptureplane, only a few structures within the unstable portion ofthe 1991 failure surface were found to correlate with GB-DInSAR displacement patterns. Furthermore, the differentialdisplacement along these structures is small with the excep-tion of the local toppling instabilities. Thus, the large-scalemovement of the rock mass is mainly controlled by the basaland the lateral release planes. Especially in the lower portionof the instability only little internal deformation/shearing oc-curs along large-scale discontinuities.
Fig. 7. The 248 days GB-DInSAR displacement map overlain bydiscontinuities mapped on the LiDAR DTM. Areas covered by de-bris are shaded in grey. Two local toppling instabilities could beidentified and are highlighted in the inset photographs.
3.4 Comparison of GB-DInSAR displacements withgeodetic displacement measurements
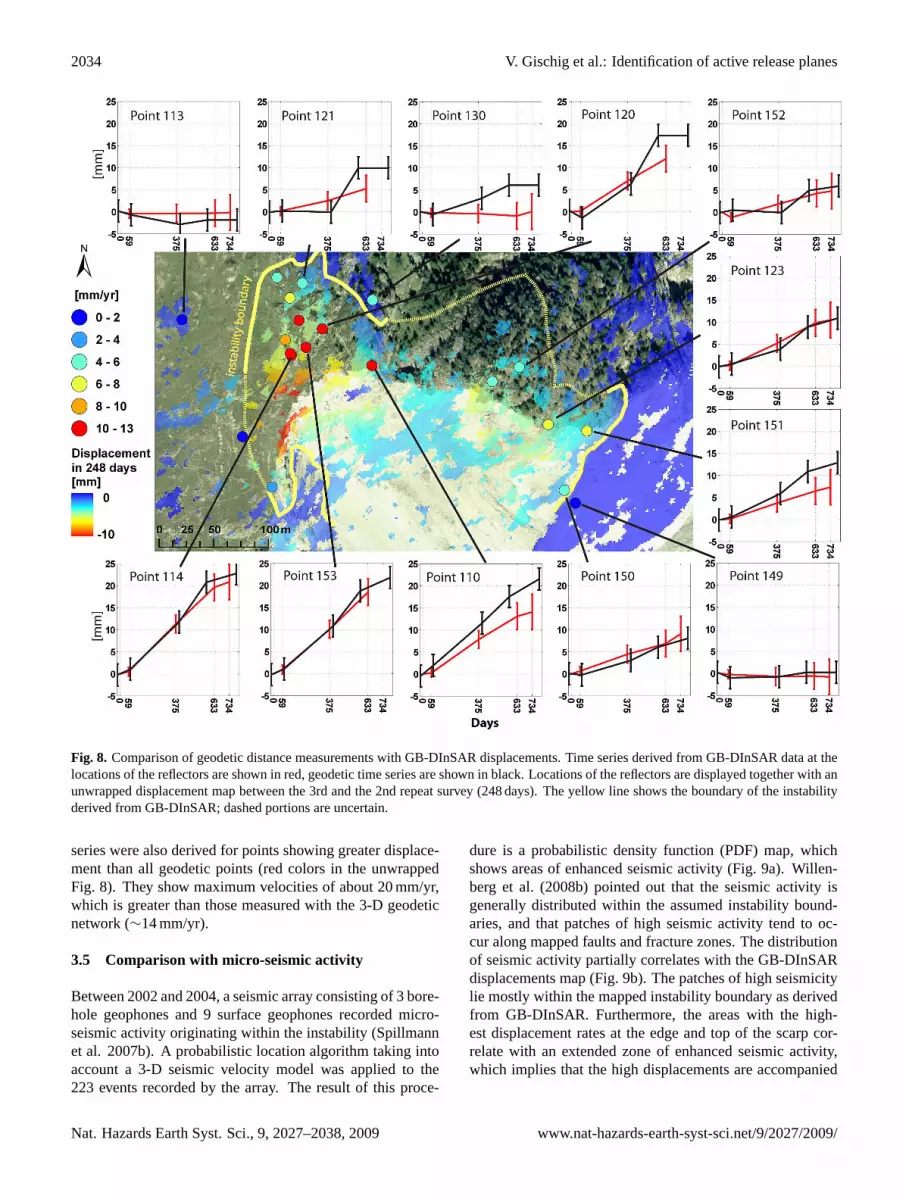
Since 1996, displacements of seven 3-D retro-reflectors weremeasured by surveying a geodetic network with a totalstation once or twice per year (Willenberg et al., 2008b;Jaboyedoff et al., 2004). The resultant vectors have an az-imuth of 135–140◦, which is sub-parallel to the LOS ofthe GB-DInSAR. Another 18 points were surveyed usinga total station positioned on a monument close to the GB-DInSAR base station resulting in a similar LOS. The totalstation surveys and the radar surveys were performed at timesless than 50 days from each other. Displacement time se-ries were derived from the five GB-DInSAR measurementsat the locations of the geodetic reflectors by summing thedisplacements between each time interval. Figure 8 showsthe time series for both GB-DInSAR and geodetic measure-ments, as well as the locations of these points on an un-wrapped (i.e. phase wrapping removed) displacement mapbetween the 2nd and 3rd repeat measurements (248 days in-terval). The error bars are 2.5 mm for the geodetic mea-surements and 1 mm for each GB-DInSAR repeat measure-ment. The latter error sums for each subsequent measure-ment. Comparison of the time series from both methodsshows good agreement in most cases. However, in someinstances GB-DInSAR shows lower velocities than the totalstation measurements (points 110, 130, and 151; Fig. 8), theaverage of these rate discrepancies is around 3 mm/yr. Time
www.nat-hazards-earth-syst-sci.net/9/2027/2009/ Nat. Hazards Earth Syst. Sci., 9, 2027–2038, 2009
2034 V. Gischig et al.: Identification of active release planes
Fig. 8. Comparison of geodetic distance measurements with GB-DInSAR displacements. Time series derived from GB-DInSAR data at thelocations of the reflectors are shown in red, geodetic time series are shown in black. Locations of the reflectors are displayed together with anunwrapped displacement map between the 3rd and the 2nd repeat survey (248 days). The yellow line shows the boundary of the instabilityderived from GB-DInSAR; dashed portions are uncertain.
series were also derived for points showing greater displace-ment than all geodetic points (red colors in the unwrappedFig. 8). They show maximum velocities of about 20 mm/yr,which is greater than those measured with the 3-D geodeticnetwork (∼14 mm/yr).
3.5 Comparison with micro-seismic activity
Between 2002 and 2004, a seismic array consisting of 3 bore-hole geophones and 9 surface geophones recorded micro-seismic activity originating within the instability (Spillmannet al. 2007b). A probabilistic location algorithm taking intoaccount a 3-D seismic velocity model was applied to the223 events recorded by the array. The result of this proce-
dure is a probabilistic density function (PDF) map, whichshows areas of enhanced seismic activity (Fig. 9a). Willen-berg et al. (2008b) pointed out that the seismic activity isgenerally distributed within the assumed instability bound-aries, and that patches of high seismic activity tend to oc-cur along mapped faults and fracture zones. The distributionof seismic activity partially correlates with the GB-DInSARdisplacements map (Fig. 9b). The patches of high seismicitylie mostly within the mapped instability boundary as derivedfrom GB-DInSAR. Furthermore, the areas with the high-est displacement rates at the edge and top of the scarp cor-relate with an extended zone of enhanced seismic activity,which implies that the high displacements are accompanied
Nat. Hazards Earth Syst. Sci., 9, 2027–2038, 2009 www.nat-hazards-earth-syst-sci.net/9/2027/2009/

V. Gischig et al.: Identification of active release planes 2035
Fig. 9. (A) Micro-seismic activity map. The locations of 223 micro-seismic events recorded between 2002 and 2004 are represented ascumulative probabilistic density functions (PDF). High PDF valuescorrespond to high micro-seismic activity. The values are represen-tative for a surface at 15 m vertically below the topographic surface.(B) Unwrapped GB-DInSAR images as in Fig. 8. Both images in-clude the boundary of the instability as derived from GB-DInSARas well as the discontinuity map from Willenberg et al. (2008a).
Fig. 10. Example of a geodetic point for which distance measure-ments (black line) yielded significantly higher velocities than thoseextracted from GB-DInSAR (red line). The reflector sits on a blockbounded by large open cracks. Due to the size of the block its move-ments cannot be resolved with GB-DInSAR.
by strong internal deformation and shearing. The areas oflow seismicity below correspond to the more uniformly mov-ing areas on the GB-DInSAR maps (Fig. 1, region d). How-ever, this region cannot be conclusively mapped as a low ac-tivity area, since the recorded seismicity may be adverselyaffected by high seismic attenuation within the strongly frac-tured rock mass.
4 Discussion
4.1 Spatial resolution
The spatial resolution of GB-DInSAR displacement maps isnot only a function of the theoretical system resolution, butalso influenced by post-processing filtering methods. Reso-lution is lowered by these filters as the signals are smearedover a few resolution cells (Tarchi et al., 2003a). Measureddisplacements are therefore representative of an extendedarea resulting in an effective resolution lower than the theo-retical resolution given by the system properties (in our case14×14 m instead of 1.94–6.5 m), and objects with high re-flectivity contribute more to the measured values.
A comparison of mapped discontinuities and the GB-DInSAR displacements (Fig. 6) shows that many discon-tinuities correlate with GB-DInSAR displacement patterns,although deviations of a few pixels occur. Opening ratesacross two discontinuities derived from GB-DInSAR aresomewhat lower than field measurements. Such discrepan-cies can be caused by displacements oblique to the LOSand post-processing filters smearing displacements over a14×14 m area, although small errors in geo-referencing ofthe GB-DInSAR images can also introduce further discrep-ancies. Within the scarp created by the 1991 failures, onlya few discontinuities were found to correlate with strongdifferential displacements on the GB-DInSAR maps. Lim-ited resolution is a possible explanation for this observa-tion, since sharp changes in the displacement pattern may besmoothed through filtering. However, it remains unknownwhether such sharp differential displacement patterns are ab-sent within the scarp due to filtering or because the real dis-placement field within the lower part of the current instabil-ity is continuous rather than localized along active structures.Continuous deformations could result from large-scale basalsliding, where large portions of the rock mass move at similarrates.
Resolution limitations can also explain discrepancies be-tween displacement rates derived from GB-DInSAR andgeodetic measurements. When a geodetic reflector movesat a different rate than the surrounding area because it isinstalled on a locally unstable block, the GB-DInSAR andgeodetic measurements may not show the same displace-ments. Points 110, 130, and 151 (Fig. 8) show higher ve-locities for the total station than for the radar measurements,which likely results from blocks that move locally fasterthan the surrounding rock mass. An example is displayedin Fig. 10 for point 110.
www.nat-hazards-earth-syst-sci.net/9/2027/2009/ Nat. Hazards Earth Syst. Sci., 9, 2027–2038, 2009

2036 V. Gischig et al.: Identification of active release planes
Fig. 11.Conceptual 2-D kinematic model of the instability. Both the results from Willenberg et al. (2008b) and from this study are included.The velocities indicated are the displacement rates derived from GB-DInSAR.
Such observations illustrate the spatial resolution limita-tions of GB-DInSAR, which are important to acknowledgein any attempt to interpret displacement patterns on a scaleclose to the effective resolution of the system. Differentialdisplacements along active fractures can only be interpretedproperly if their spatial extent and displacement differenceis large enough to not be affected by resolution limits andfiltering effects.
4.2 Temporal resolution
GB-DInSAR surveys at the slowly moving Randa rockslideshowed that phase wrapping occurs when the time inter-val between repeat surveys was longer than about 100 days.This value may change with variable deformation rates ex-
pected throughout the year. Phase unwrapping simplifies in-terpretation but introduces error and loss of data coverage(Fig. 8). For kinematic analysis it is essential to detect struc-tural boundaries, such as a basal rupture zone, which requiresa time interval sufficient to accumulate measurable defor-mation. Therefore, a trade-off exists between time intervalsshort enough to avoid phase wrapping and decorrelation, andlong intervals that allow important structures to become dis-tinguishable. Ideally, one would choose shorter time inter-vals and more repeat measurements. However, this is expen-sive in terms of both labor and cost. In our study, just fourinterferograms were available over a total period of 2 years.Nonetheless, individual images representing both short andlong intervals provide complementary information.
Nat. Hazards Earth Syst. Sci., 9, 2027–2038, 2009 www.nat-hazards-earth-syst-sci.net/9/2027/2009/
V. Gischig et al.: Identification of active release planes 2037
4.3 Volume calculation
Using the identified release planes, combined with mappedstructures and the LiDAR DTM, we were able to define likelyboundaries of the unstable rock mass at the Randa rockslide.We estimated the total volume to be 5.7±1.5 million m3,which lies within the range given by Ischi et al. (1991). Anorientation of 095/70 was used for the lateral release plane,while an orientation of 135/40 for the basal shear zone wasfound to best match the trace observed with GB-DInSAR.This orientation also matches the orientation of the basal fail-ure surface of the second 1991 event (Sartori et al., 2003) andthe azimuth of geodetic displacement vectors. For the backboundary to the north-west a nearly vertical plane as given byWillenberg et al. (2008a) was assumed. The northern bound-ary of the instability remains uncertain since it lies in a partlyshadowed and vegetated area with unreliable GB-DInSARdata. Two scenarios for the northern boundary were usedto delineate the rock mass: 1. the uninterrupted trace of thebasal rupture zone daylighting to the north, or 2. a plane dip-ping steeply to the south and cutting the basal rupture surfaceat depth. The volume estimates for both scenarios differed by0.6 million m3 for these two scenarios and were averaged forthe final number.
4.4 Implications for kinematics
A preliminary analysis of the kinematics of the current in-stability can be deduced from displacement patterns. A 2-Dconceptual model of the kinematics of the instability is dis-played in Fig. 11, which combines results from both Willen-berg et al. (2008b) and this study. The block toppling mech-anism suggested for the top of the instability is confirmed bythe GB-DInSAR images, which show a gradual increase ofdisplacements from 4.4 mm to about 12 mm over a verticaldistance of∼150 m towards the top edge of the scarp (re-gion (f) in Figs. 1 and 4). As shown on the micro-seismicactivity maps by Spillmann et al. (2007b) in Fig. 9, inter-nal deformation and shearing within this region are strongest,where the displacements rates are highest. Below the top ofthe scarp, a large area showing nearly uniform displacements(region (d) in Fig. 1c) suggests different kinematic behaviorfor the lower portion of the instability. This rather uniformlymoving area has a displacement magnitude similar to thatjust above the basal rupture zone. Within this area only fewsharp changes in the displacement field are found, as demon-strated in Fig. 7. Possibly only a few discontinuities are ac-tive within lower parts of the instability, whereas most of thedeformation is localized along the basal rupture plane. Weinterpret this displacement pattern as translational movementon a planar or stepped shear surface, as hypothesized by Wil-lenberg et al. (2008b), Jaboyedoff et al. (2004), and Sartoriet al. (2003). The transition between toppling and transla-tional failure occurs at a sharp change of the slope angle inthe 1991 failure scarp from about 80◦ at the top to about 60◦
below. The displacement rate on the basal rupture surface isestimated to be∼4.4 mm/yr. Some small-scale displacementpatterns deviating from this uniform rate in this region areinterpreted as superimposed secondary instabilities as shownin Fig. 7.
5 Conclusions
Displacements associated with a large-scale basal rupturezone and lateral release zone bounding the current insta-bility at the Randa rockslide were detected using GB-DInSAR. Structures associated with these displacementswere confirmed with high resolution aerial photographs anda helicopter-based LiDAR DTM. The basal rupture zone is ahighly persistent, narrow structure daylighting at the bound-ary between orthogneiss overlain by fractured paragneiss.Previous borehole surveys failed to intersect the basal rup-ture surface due to insufficient depth. The lateral releasesurface in the south was identified as a striated and steeply-dipping fault, which can be regarded as the continuation ofa lateral release surface from the 1991 rockslides. Both ofthese bounding structures outcrop on the inaccessible 1991failure scarp and were not conclusively detected by previ-ous investigations. The volume of the current instability wasestimated to be 5.7±1.5 million m3, and the area of the insta-bility with maximum displacement rate (up to∼20 mm/yr)was identified. Displacement patterns confirm block topplingin the upper part of the instability accompanied by micro-seismic activity suggesting some degree of internal defor-mation/shearing of the rock mass. The lower portion of theinstability exhibits little differential displacement along dis-continuities except for the basal rupture plane. Translationalfailure is thus suggested for lower regions of the instabilityas opposed to toppling at the top of the instability.
Many of the large discontinuities previously mappedwithin the accessible area at the top of the instability showedgood correlation with displacement patterns on GB-DInSARmaps. In two cases, we could directly compare crack open-ing rates measured by hand and by GB-DInSAR, with goodresults. Comparison of GB-DInSAR displacements with to-tal station measurements showed good agreement for mostreflector points. However, three points showed higher veloc-ities than measured with GB-DInSAR, which is likely dueto local block movements. Such discrepancies also occur inthe comparison of mapped structures with displacement pat-terns. They illustrate the influence of data filtering on the ef-fective resolution of GB-DInSAR. For detailed interpretationof displacement patterns, such spatial resolution limitationsof GB-DInSAR must be considered.
www.nat-hazards-earth-syst-sci.net/9/2027/2009/ Nat. Hazards Earth Syst. Sci., 9, 2027–2038, 2009

2038 V. Gischig et al.: Identification of active release planes
Acknowledgements.GB-DInSAR surveys were performed byEllegi Srl (Milano, Italy) using the GB-DInSAR LiSA systemand LiSALab software; Carlo Rivolta provided technical support.GB-DInSAR measurements were financed by the Federal Officefor the Environment, Switzerland. Geodetic measurements wereconducted by Klaus Aufdenblatten (Zermatt, Switzerland) anddirected by CREALP (Centre de Recherches sur l’EnvironnementAlpin, Switzerland). Helimap Systems SA (Switzerland) performedthe helicopter-based LiDAR survey. We thank Michel Jaboyedoff(University of Lausanne) and an anonymous reviewer for usefulcomments. This project was funded by the Swiss National ScienceFoundation (Project No. 2100-059238.99).
Edited by: A. GuntherReviewed by: M. Jaboyedoff and another anonymous referee
References
Eberhardt, E., Stead, D., and Coggan, J. S.: Numerical analysis ofinitiation and progressive failure in natural rock slopes–the 1991Randa rockslide, Int. J of Rock Mech. Min., 41(Eq. 1), 69–87,2004.
Fortuny, J. and Sieber, A. J.: Fast Algorithm for a Near-FieldSynthetic Aperture Radar Processor, IEEE T. Antenn. Propag.,42(10), 1458–1460, 1994.
Heincke, B., Green, A. G., van der Kruk, J., and Horstmeyer, H.:Acquisition and processing strategies for 3-D georadar surveyinga region characterized by rugged topography, Geophysics, 70(6),K53–K61, 2005.
Heincke, B., Maurer, H., Green, A. G., Willenberg, H., Spillmann,T., and Burlini L.: Characterizing an unstable mountain slopeusing shallow 2-D and 3-D seismic tomography, Geophysics,71(6), B241–B256, 2006.
Ischi, H., Keusen, H. R., and Scheller, E.: Randa Kt. Wallis.Bergsturz Grossufer vom April/Mai 1991, ZusammenfassenderBerichtuber die Aktivitaten der Geotest AG., unpublished report91126 Geotest AG, Martigny, 1991.
Jaboyedoff, M., Ornstein, P., and Rouiller, J.-D.: Design of ageodetic database and associated tools for monitoring rock-slopemovements: the example of the top of Randa rockfall scar, Nat.Hazards Earth Syst. Sci., 4, 187–196, 2004,http://www.nat-hazards-earth-syst-sci.net/4/187/2004/.
Leva, D., Nico, G., Tarchi, D., Fortuny-Guasch, J., and Sieber, A. J.:Temporal Analysis of a Landslide by Means of a Ground-BasedSAR Interferometer, IEEE T. Geosc. Remote, 41(4), 745–752,2003.
Lingua, A., Piatti, D., and Rinaudo, F.: Remote monitoring of alandslide using an integration of GB-InSAR and LiDAR tech-niques, The International Archives of the Photogrammetry, Re-mote Sensing and Spatial Information, Sciences, XXXVII(B1),361–366, 2008.
Lee, J.-S., Hoppel, K. W., Mango, S. A., and Miller, A. R.: Intensityand Phase Statistic of Multilook polarimetric and Interferomer-tric SAR Imagery, IEEE T., Geosc. Remote, 31(5), 1017–1028,1994.
Loew, S., Willenberg, H., Spillmann, T., Heincke, B., Maurer, H. R.,Eberhardt, E., and Evans, K.: Structure and kinematics of a largecomplex rockslide as determined from integrated geological andgeophysical investigations (Randa, Switzerland), in: 1st NorthAmerican Landslide Conference Association of Environmentaland Engineering Geologists, edited by: Schaefer, V. R., Schuster,R. L., Turner, A. K., Vail, CO, 11 pp., 2007.
Sartori, M., Baillifard, F., Jaboyedoff, M., and Rouiller, J.-D.: Kine-matics of the 1991 Randa rockslides (Valais, Switzerland), Nat.Hazards Earth Syst. Sci., 3, 423–433, 2003,http://www.nat-hazards-earth-syst-sci.net/3/423/2003/.
Schindler, C., Cuenod, Y., Eisenlohr, T., and Joris, C.-L.: DieEreignisse vom 18. April und 9. Mai 1991 bei Randa (VS): einatypischer Bergsturz in Raten, Eclogae Geol. Helv., 86(3), 643–665, 1993.
Spillmann, T., Maurer, H., Willenberg, H., Evans, K. F., Heincke,B., and Green, A. G.: Characterization of an unstable rock massbased on borehole logs and diverse borehole radar data, J. Appl.Geophys., 61(Eq. 1), 16–38, 2007a.
Spillmann, T., Maurer, H., Green, A. G., Heincke, B., Willen-berg, H., and Husen, S.: Microseismic investigation of an un-stable mountain slope in the Swiss Alps, J. Geophys. Res., 112(B07301), 2007b.
Tarchi, D., Casagli, N., Fanti, R., Leva, D., Luzi, G., Pasuto, A.,Pieraccini, M., and Silvano, S.: Landslide monitoring by usingground-based SAR interferometry: an example of application tothe Tessina landslide in Italy, Eng. Geol., 68, 15–30, 2003a.
Tarchi, D., Casagli, N., Moretti, S., Leva, D., and Sieber, A. J.:Monitoring landslide displacements by using ground-based syn-thetic aperture radar interferometry: Application to the Ruinonlandslide in the Italian Alps, J. Geophys. Res., 108(B8), 2387,doi:10.1029/2002JB002204, 2003b.
Willenberg, H., Loew, S., Eberhardt, E., Evans, K. F., Spillmann,T., Heincke, B., Maurer, H., and Green, A. G.: Internal struc-ture and deformation of an unstable crystalline rock mass aboveRanda (Switzerland): Part I – Internal structure from integratedgeological and geophysical investigations, Eng. Geol., 101, 1–14, 2008a.
Willenberg, H., Evans, K. F., Eberhardt, E., Spillmann, T., andLoew, S.: Internal structure and deformation of an unstablecrystalline rock mass above Randa (Switzerland): Part II –Three-dimensional deformation patterns, Eng. Geol., 101, 15–32, 2008b.
Nat. Hazards Earth Syst. Sci., 9, 2027–2038, 2009 www.nat-hazards-earth-syst-sci.net/9/2027/2009/