identification and characterization of factors controlling tablet coating uniformity in a wurster...
TRANSCRIPT
McGraw-Hill/Irwin Copyright © 2010 by The McGraw-Hill Companies, Inc. All rights reserved.
11
Introduction to
Operations Management
1-2
Learning ObjectivesLearning Objectives Define the term operations
management Identify the three major
functional areas of organizations and describe how they interrelate
Compare and contrast service and manufacturing operations
Describe the operations function and the nature of the operations manager’s job
1-3
Learning ObjectivesLearning Objectives Differentiate between design and operation of production systems
Describe the key aspects of operations management decision making
Briefly describe the historical evolution of operations management
Identify current trends that impact operations management
1-4
Operations ManagementOperations Management Operations Management is: The management of systems or processes that create goods and/or provide services
Operations Management affects: Companies’ ability to compete Nation’s ability to compete internationally
1-5
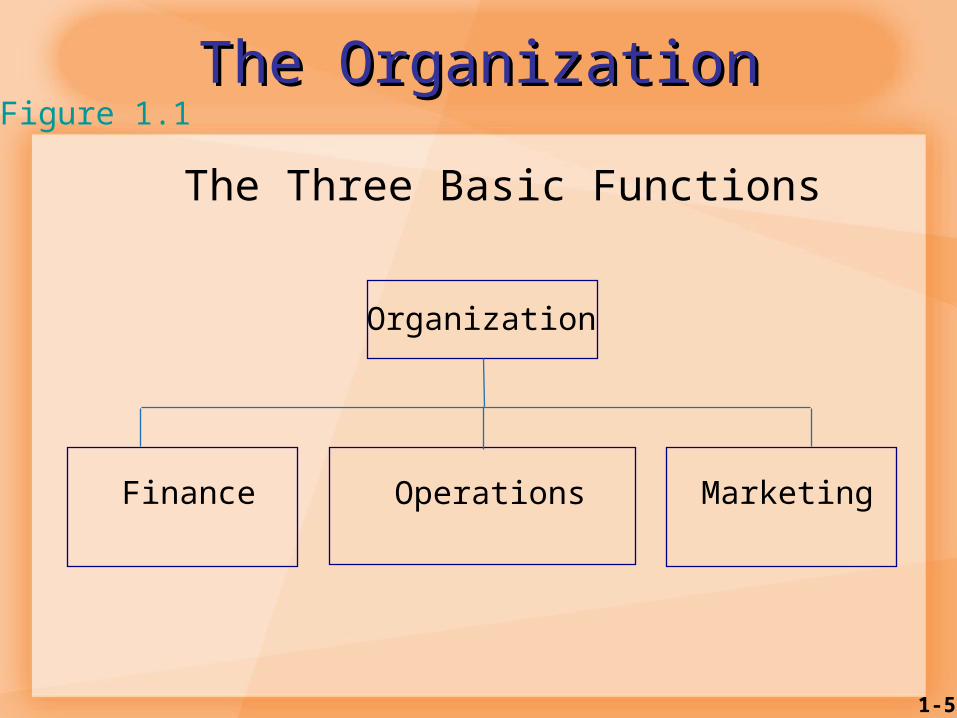
The OrganizationThe OrganizationThe Three Basic Functions
Organization
Finance Operations Marketing
Figure 1.1
1-6
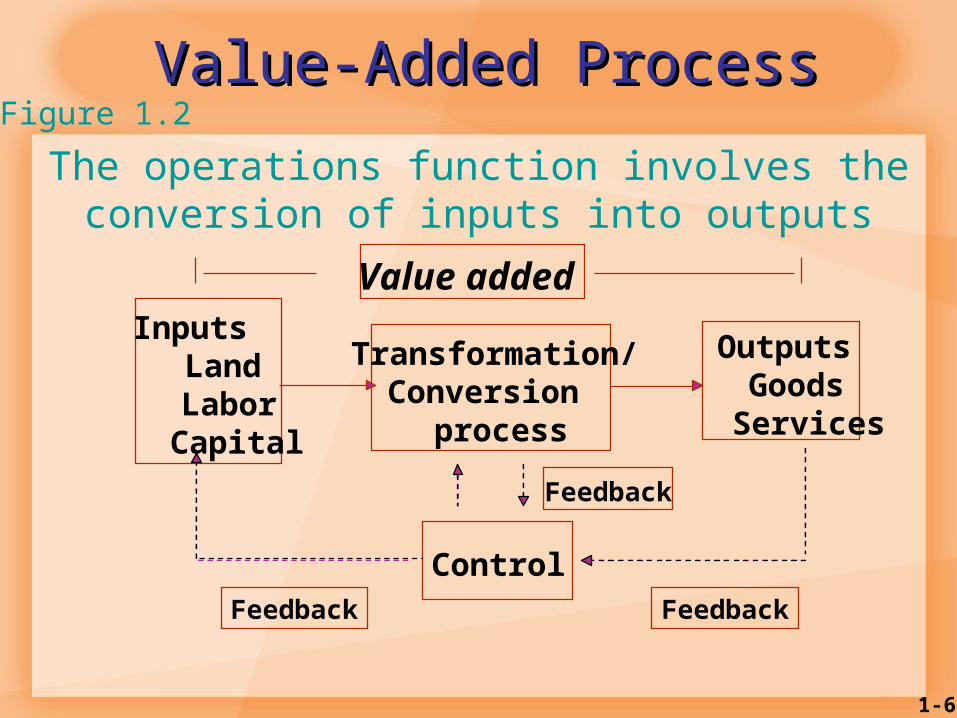
Value-Added ProcessValue-Added ProcessThe operations function involves the conversion of inputs into outputs
Inputs Land Labor Capital
Transformation/Conversion process
Outputs Goods Services
Control
Feedback
FeedbackFeedback
Value added
Figure 1.2
1-7
Value-Added and Product Value-Added and Product PackagesPackages
Value-added elements make the difference between the cost of inputs and the value or price of outputs.
Product packages are a combination of goods and services.
Product packages can make a company more competitive.
1-8
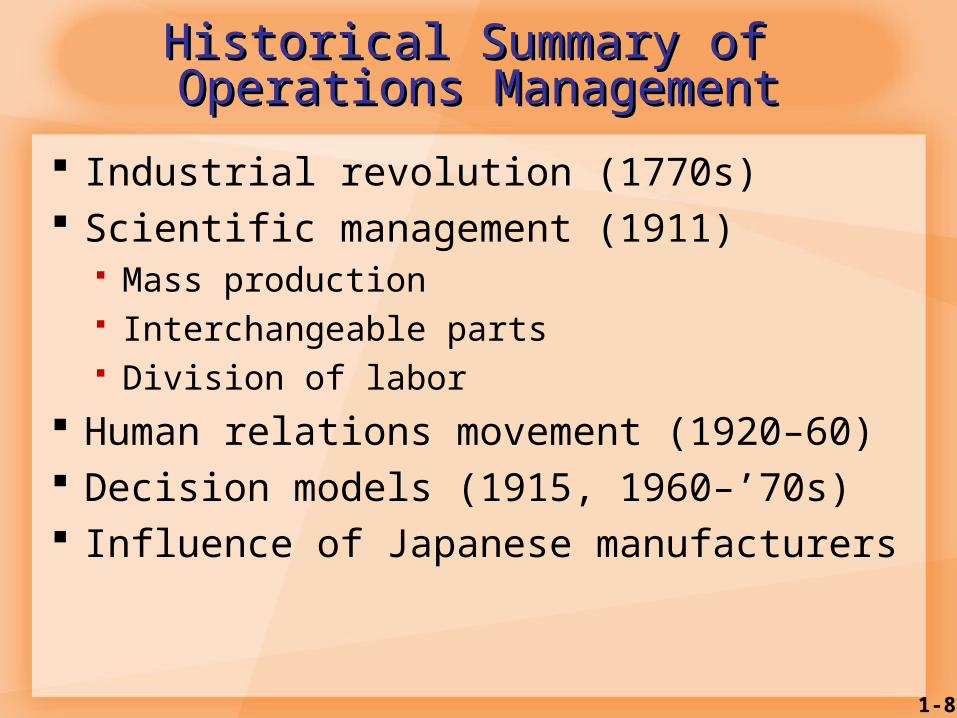
Historical Summary of Historical Summary of Operations ManagementOperations Management
Industrial revolution (1770s) Scientific management (1911)
Mass production Interchangeable parts Division of labor
Human relations movement (1920–60) Decision models (1915, 1960–’70s) Influence of Japanese manufacturers
1-9
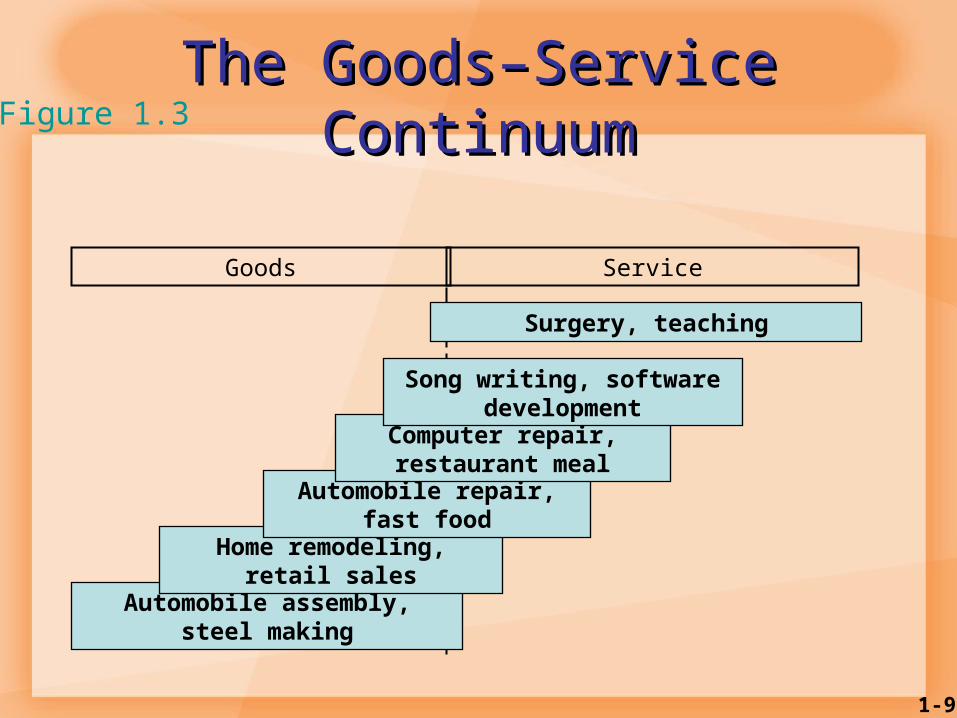
Automobile assembly, steel making
Home remodeling, retail sales
Automobile repair, fast food
The Goods–Service The Goods–Service ContinuumContinuumFigure 1.3
Computer repair, restaurant meal
Song writing, software development
Goods Service
Surgery, teaching
1-10
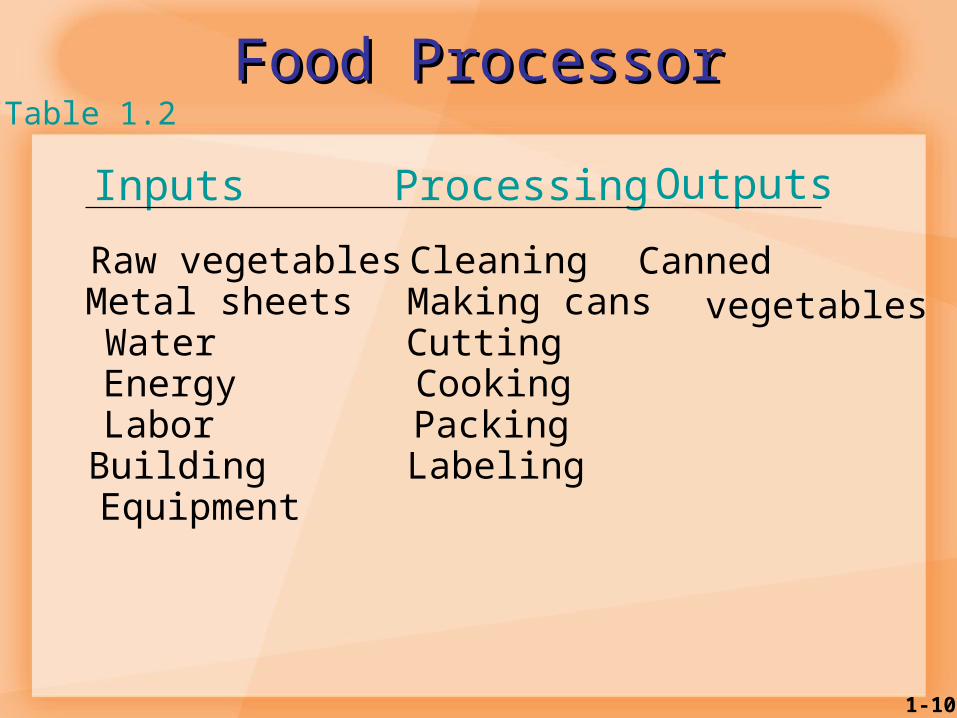
Food ProcessorFood Processor
Inputs ProcessingOutputs Raw vegetablesCleaning Canned
vegetables Metal sheets Making cansWater CuttingEnergy CookingLabor PackingBuilding LabelingEquipment
Table 1.2
1-11
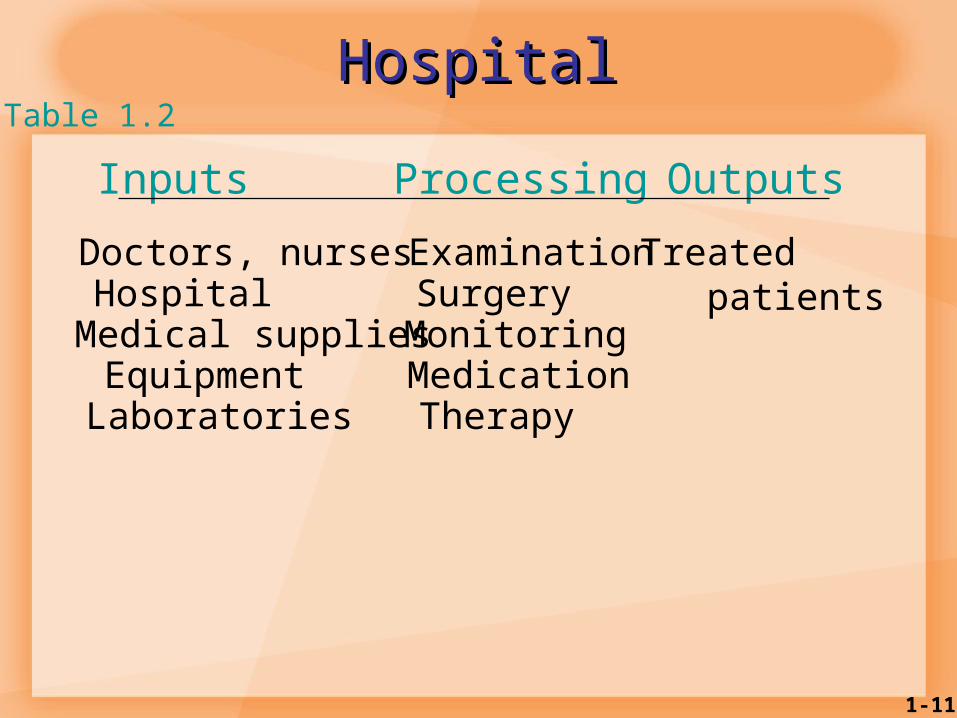
HospitalHospitalInputs Processing OutputsDoctors, nursesExaminationTreated
patientsHospital SurgeryMedical suppliesMonitoringEquipment MedicationLaboratories Therapy
Table 1.2
1-12
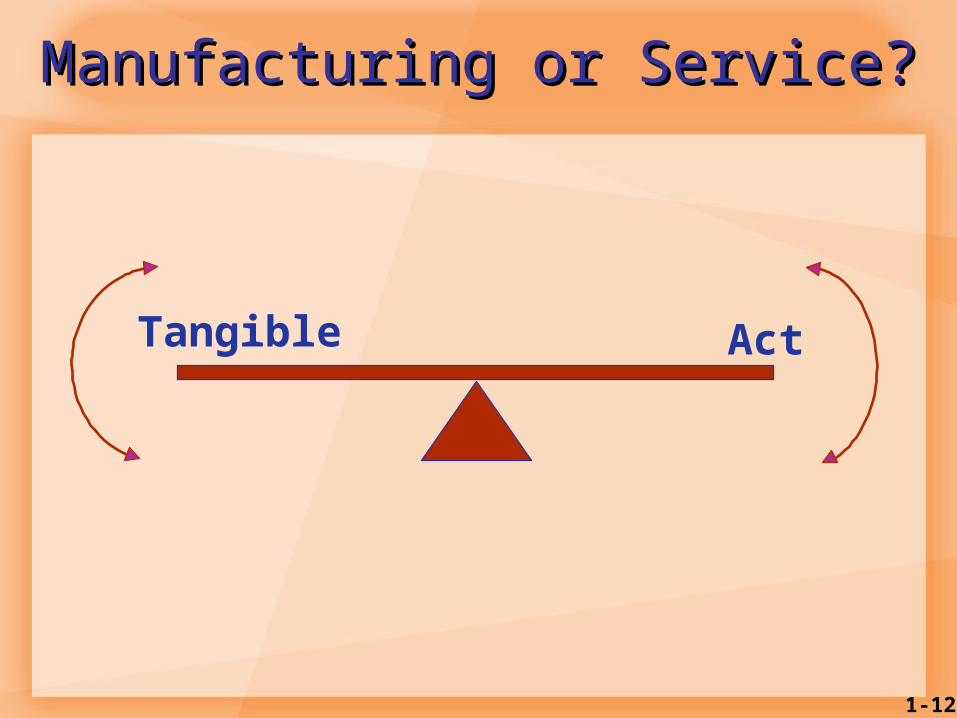
Manufacturing or Service?Manufacturing or Service?
Tangible Act
1-13
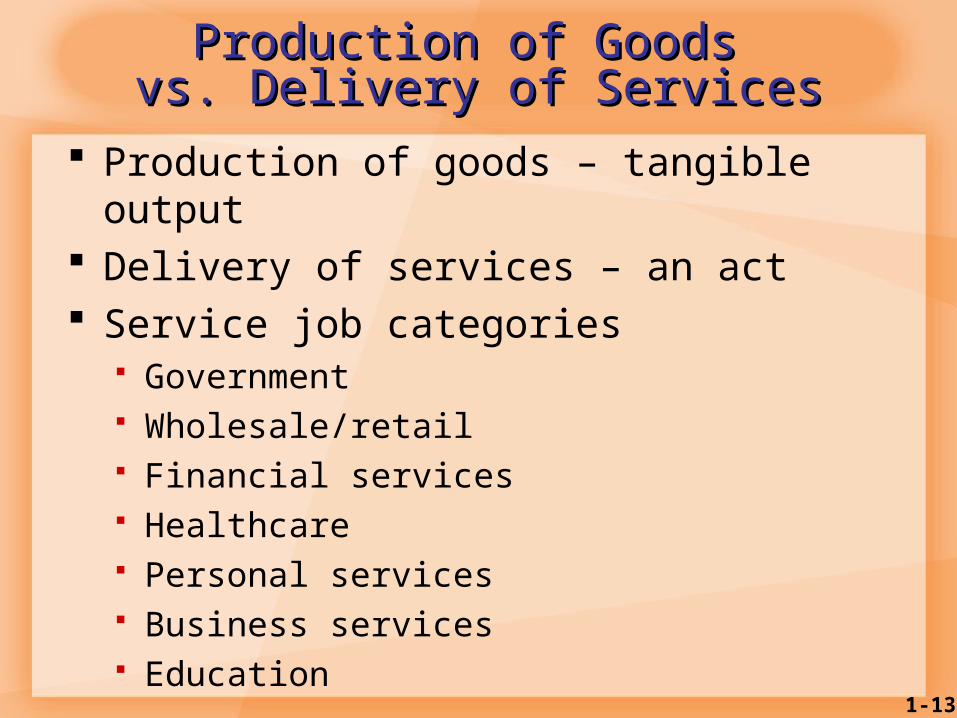
Production of Goods Production of Goods vs. Delivery of Servicesvs. Delivery of Services
Production of goods – tangible output
Delivery of services – an act Service job categories
Government Wholesale/retail Financial services Healthcare Personal services Business services Education
1-14
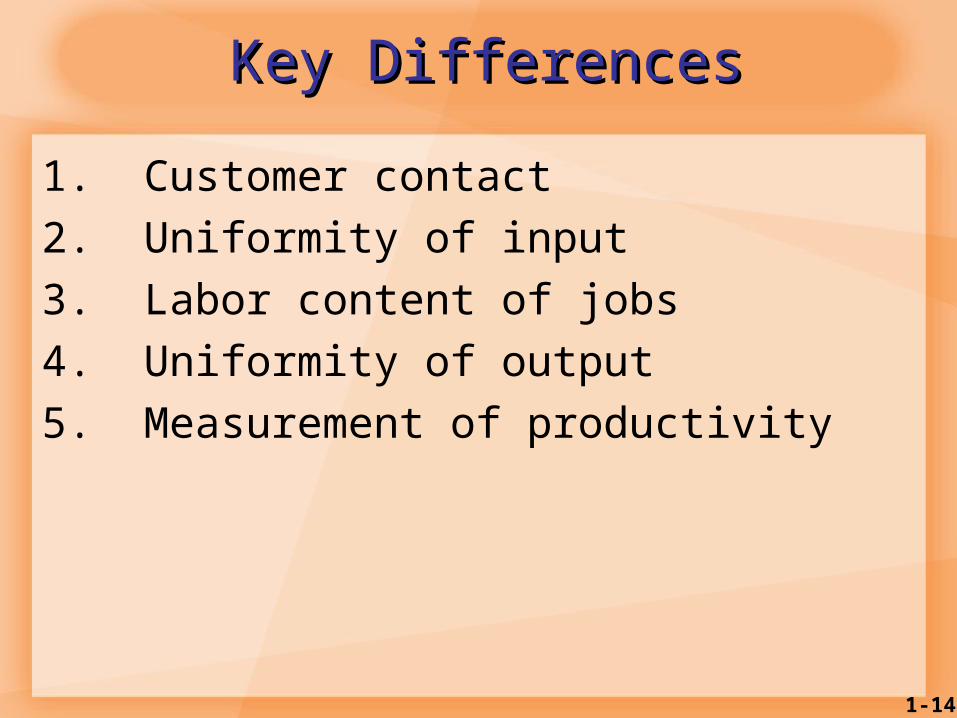
Key DifferencesKey Differences1. Customer contact2. Uniformity of input3. Labor content of jobs4. Uniformity of output5. Measurement of productivity
1-15
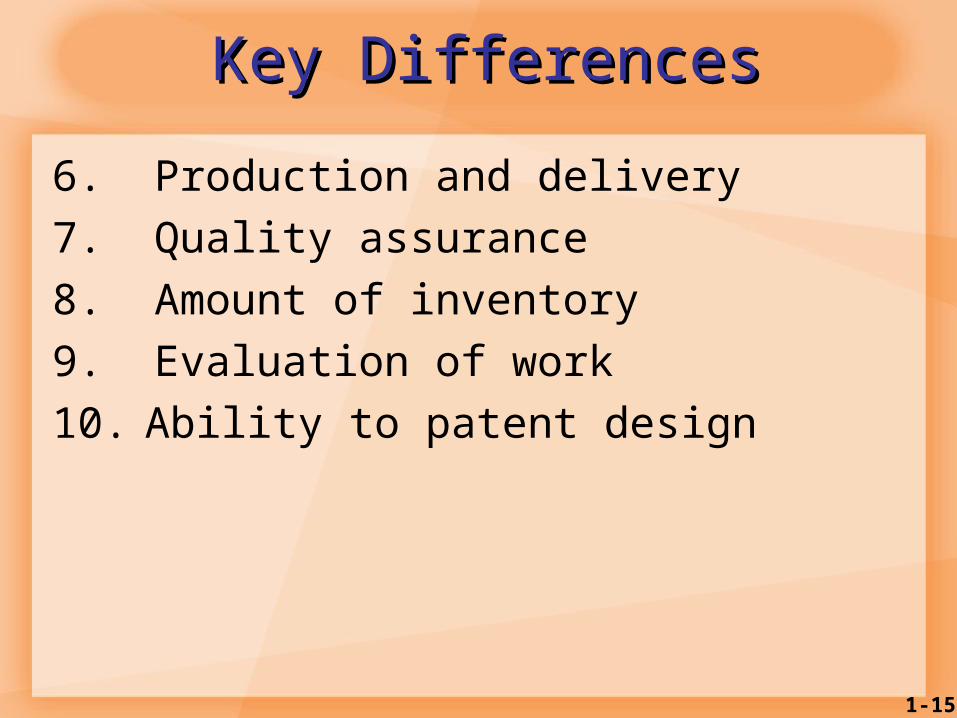
Key DifferencesKey Differences6. Production and delivery7. Quality assurance8. Amount of inventory9. Evaluation of work10. Ability to patent design
1-16
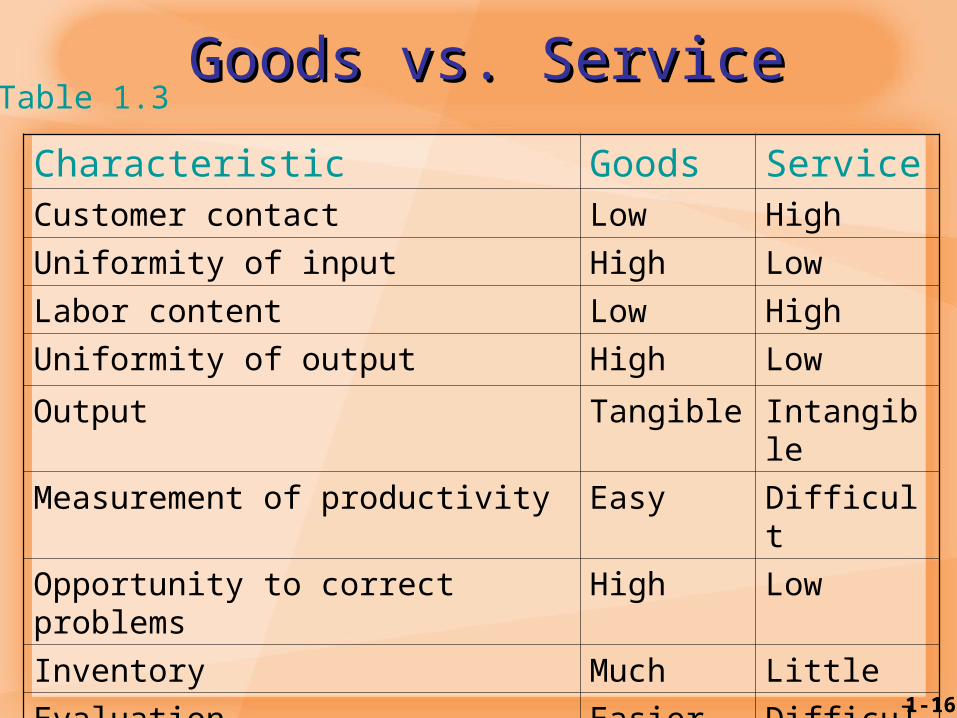
Goods vs. ServiceGoods vs. ServiceCharacteristic Goods ServiceCustomer contact Low HighUniformity of input High LowLabor content Low HighUniformity of output High LowOutput Tangible Intangib
leMeasurement of productivity Easy Difficul
tOpportunity to correct problems
High Low
Inventory Much LittleEvaluation Easier Difficul
tPatentable Usually Not
usually
Table 1.3
1-17
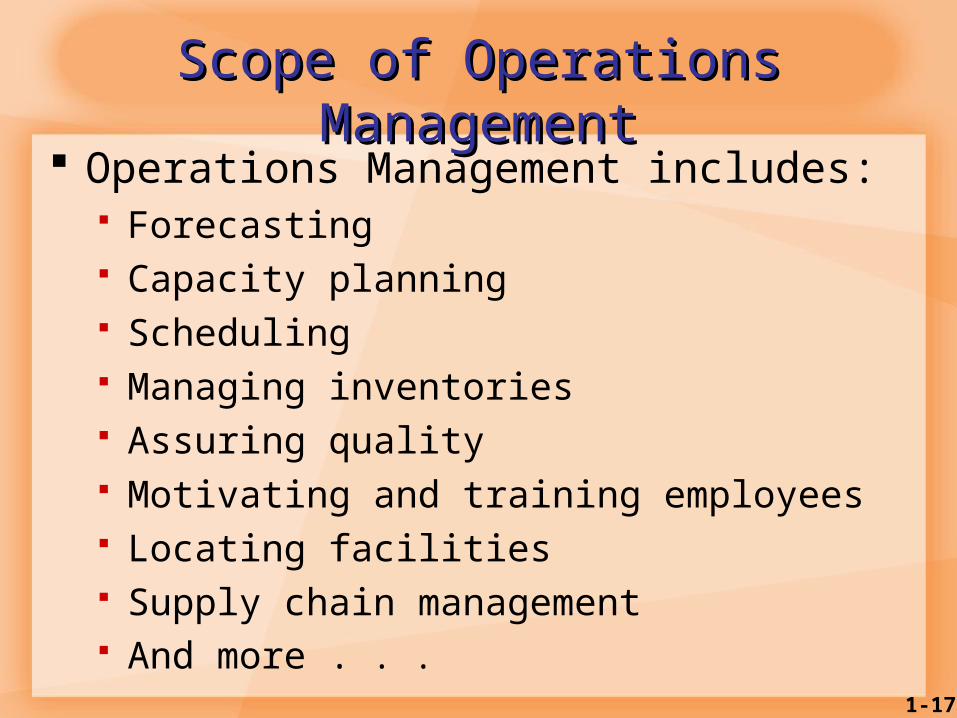
Operations Management includes: Forecasting Capacity planning Scheduling Managing inventories Assuring quality Motivating and training employees Locating facilities Supply chain management And more . . .
Scope of Operations Scope of Operations ManagementManagement
1-18
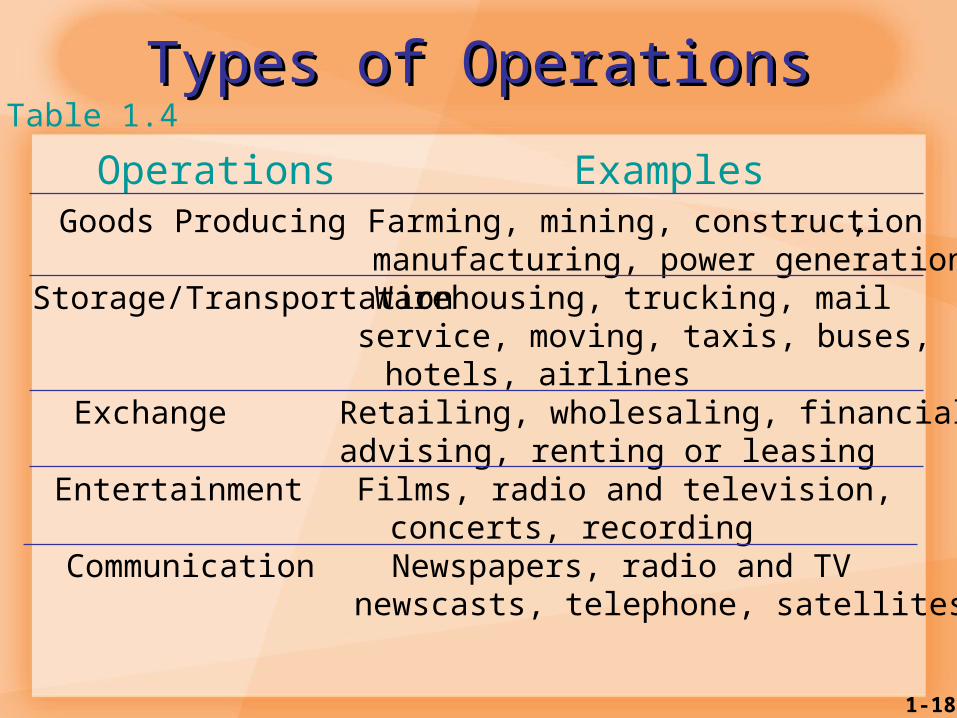
Types of OperationsTypes of OperationsTable 1.4
Operations ExamplesGoods Producing Farming, mining, construction,
manufacturing, power generationStorage/TransportationWarehousing, trucking, mail
service, moving, taxis, buses,hotels, airlines
Exchange Retailing, wholesaling, financial advising, renting or leasing
Entertainment Films, radio and television,concerts, recording
Communication Newspapers, radio and TV newscasts, telephone, satellites
1-19
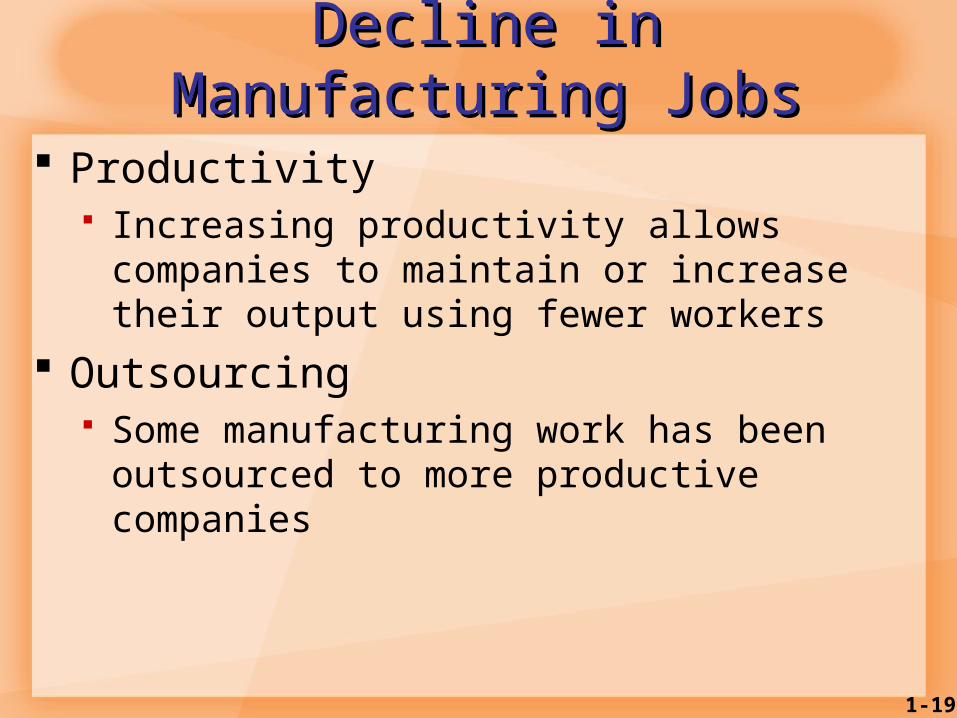
Decline in Decline in Manufacturing JobsManufacturing Jobs
Productivity Increasing productivity allows companies to maintain or increase their output using fewer workers
Outsourcing Some manufacturing work has been outsourced to more productive companies
1-20
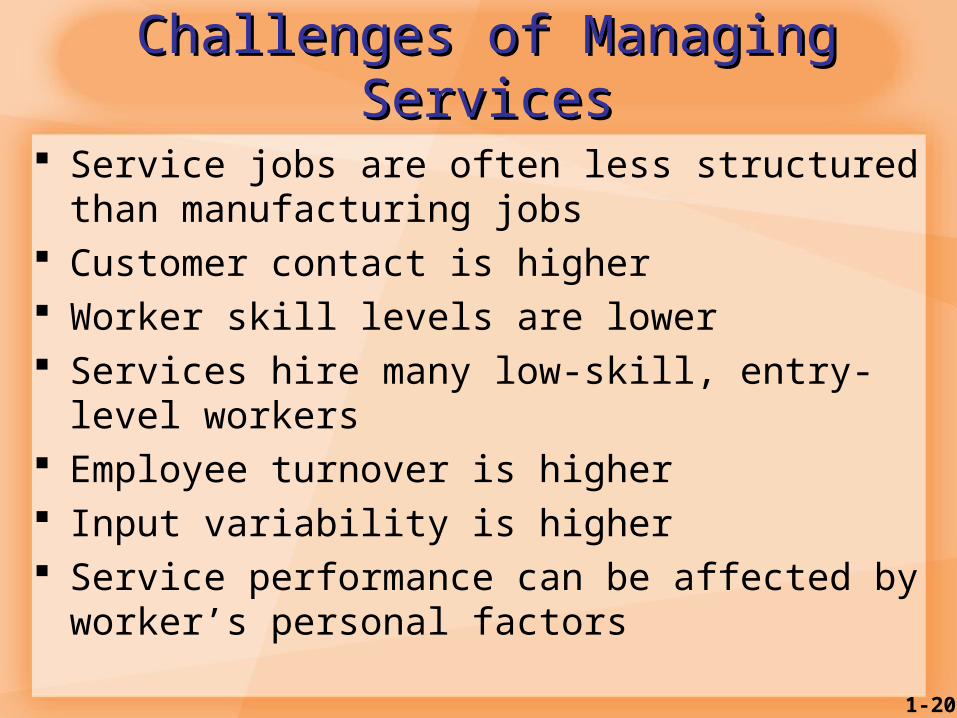
Challenges of Managing Challenges of Managing ServicesServices
Service jobs are often less structured than manufacturing jobs
Customer contact is higher Worker skill levels are lower Services hire many low-skill, entry-level workers
Employee turnover is higher Input variability is higher Service performance can be affected by worker’s personal factors
1-21
Operations Management Operations Management Decision MakingDecision Making
Models Quantitative approaches Performance metrics Analysis of trade-offs Systems approach Establishing priorities Ethics
1-22
Key Decisions of Operations Key Decisions of Operations ManagersManagers
WhatWhat resources/what amounts
WhenNeeded/scheduled/ordered
WhereWork to be done
HowDesigned
WhoTo do the work
1-23
Decision MakingDecision MakingSystem Design–capacity–location–arrangement of departments–product and service planning–acquisition and placement ofequipment
1-24
Decision MakingDecision MakingSystem operation
–personnel–inventory–scheduling–projectmanagement
–quality assurance
1-25
Decision MakingDecision Making Models Quantitative approaches Performance metrics Analysis of trade-offs Systems approach Establishing priorities Ethics
1-26
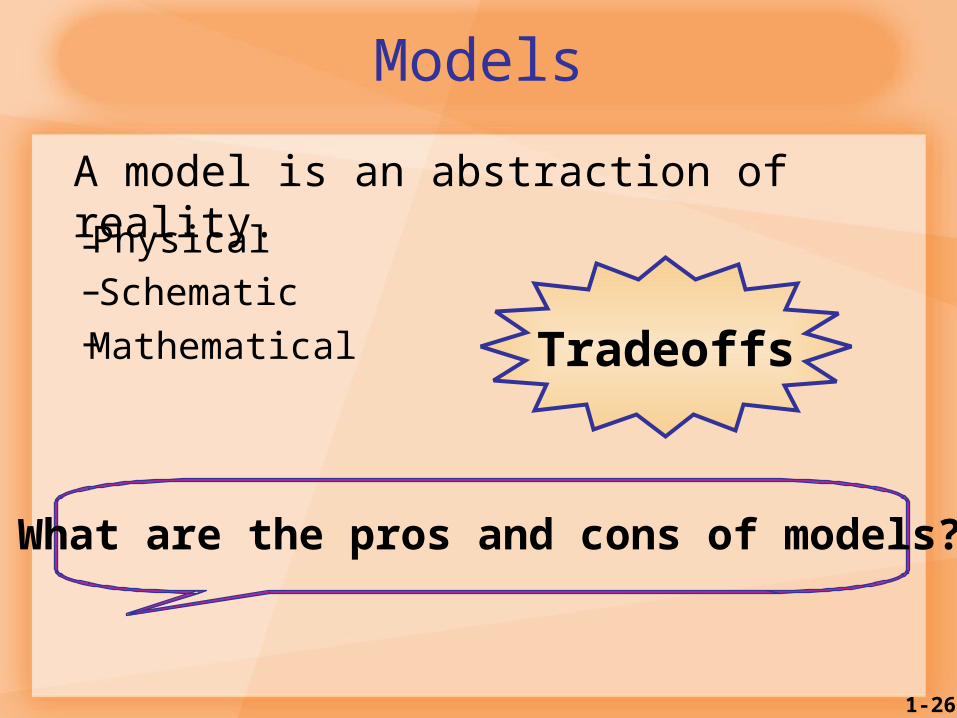
ModelsA model is an abstraction of reality.–Physical–Schematic–Mathematical
What are the pros and cons of models?
Tradeoffs
1-27
Models Are BeneficialModels Are Beneficial Easy to use, less expensive Require users to organize Increase understanding of the problem
Enable “what if” questions Consistent tool for evaluation and standardized format
Power of mathematics
1-28
Limitations of ModelsLimitations of Models Quantitative information may be emphasized over qualitative
Models may be incorrectly applied and results misinterpreted
Nonqualified users may not comprehend the rules on how to use the model
Use of models does not guarantee good decisions
1-29
Quantitative ApproachesQuantitative Approaches Linear programming Queuing techniques Inventory models Project models Statistical models
1-30
Analysis of Trade-OffsAnalysis of Trade-Offs Decision on the amount of inventory to stock Increased cost of holding inventory
vs. Level of customer service
1-31
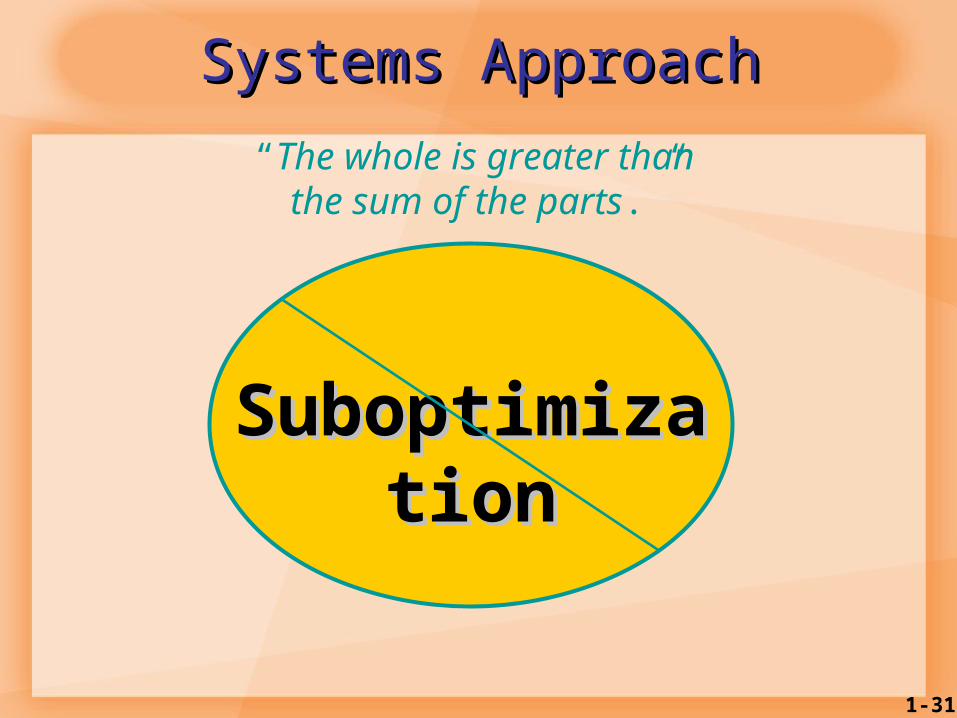
Systems ApproachSystems Approach“The whole is greater than
the sum of the parts.”
SuboptimizaSuboptimizationtion
1-32
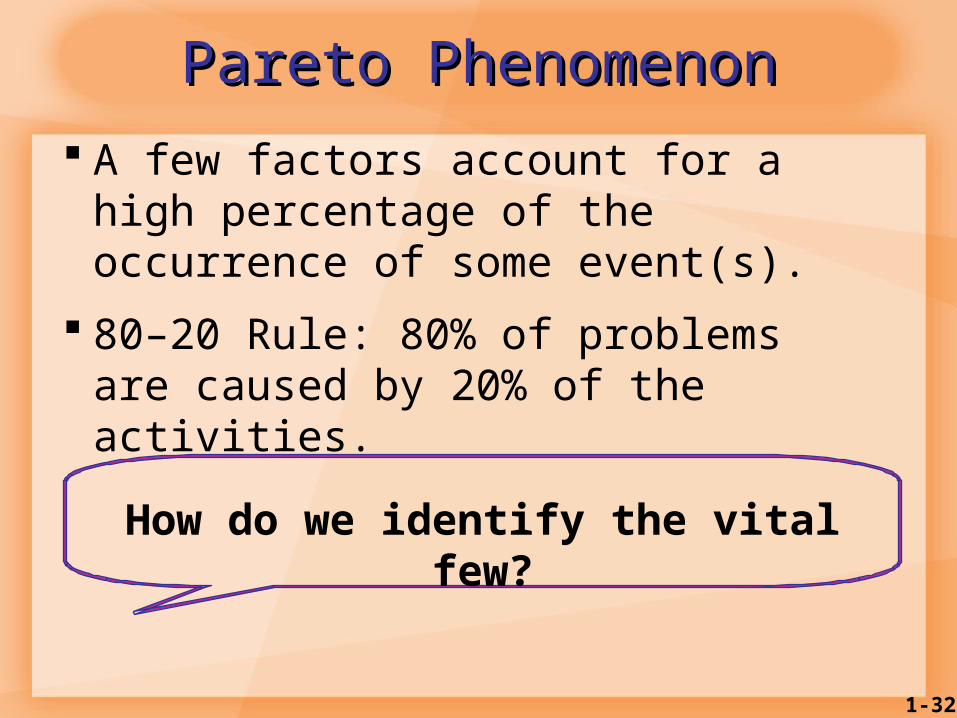
Pareto PhenomenonPareto Phenomenon A few factors account for a high percentage of the occurrence of some event(s).
80–20 Rule: 80% of problems are caused by 20% of the activities.How do we identify the vital
few?
1-33
Ethical IssuesEthical Issues Financial statements Worker safety Product safety Quality Environment Community Hiring/firing workers Closing facilities Worker’s rights
1-34
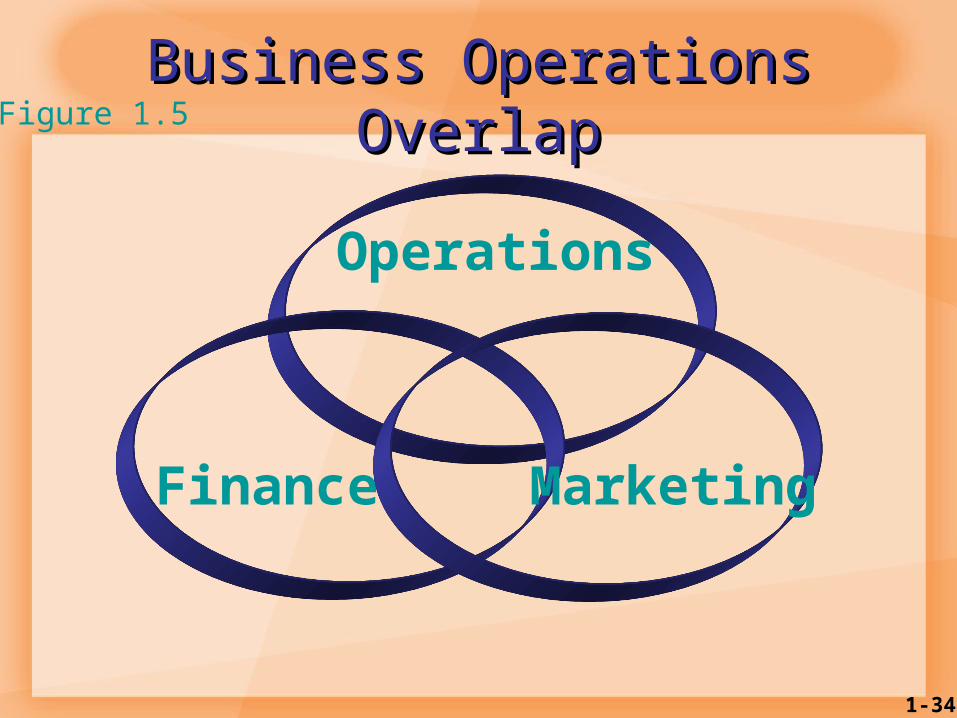
Business Operations Business Operations OverlapOverlap
Operations
Finance
Figure 1.5
Marketing
1-35
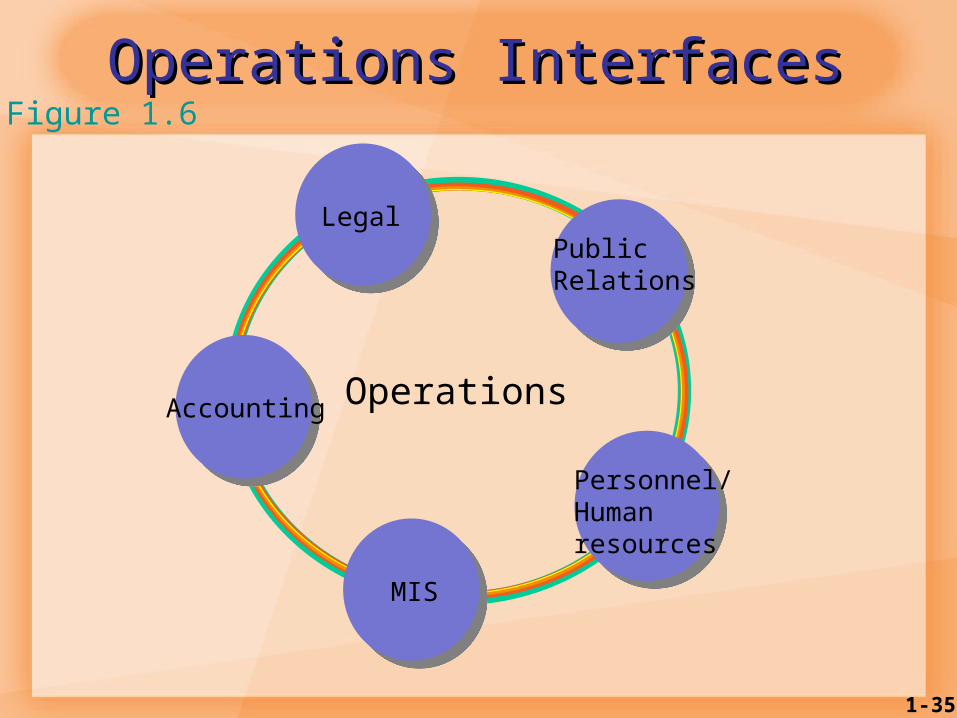
Operations InterfacesOperations Interfaces
Operations
Personnel/Human resources
MIS
LegalPublic Relations
Accounting
Figure 1.6
1-36
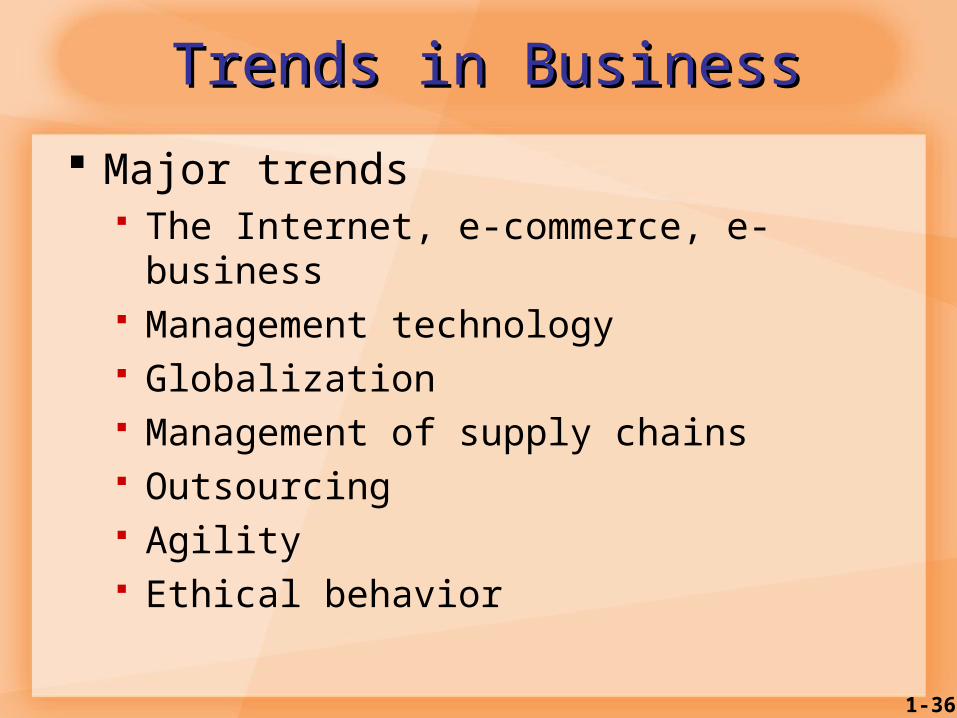
Trends in BusinessTrends in Business Major trends
The Internet, e-commerce, e-business
Management technology Globalization Management of supply chains Outsourcing Agility Ethical behavior
1-37
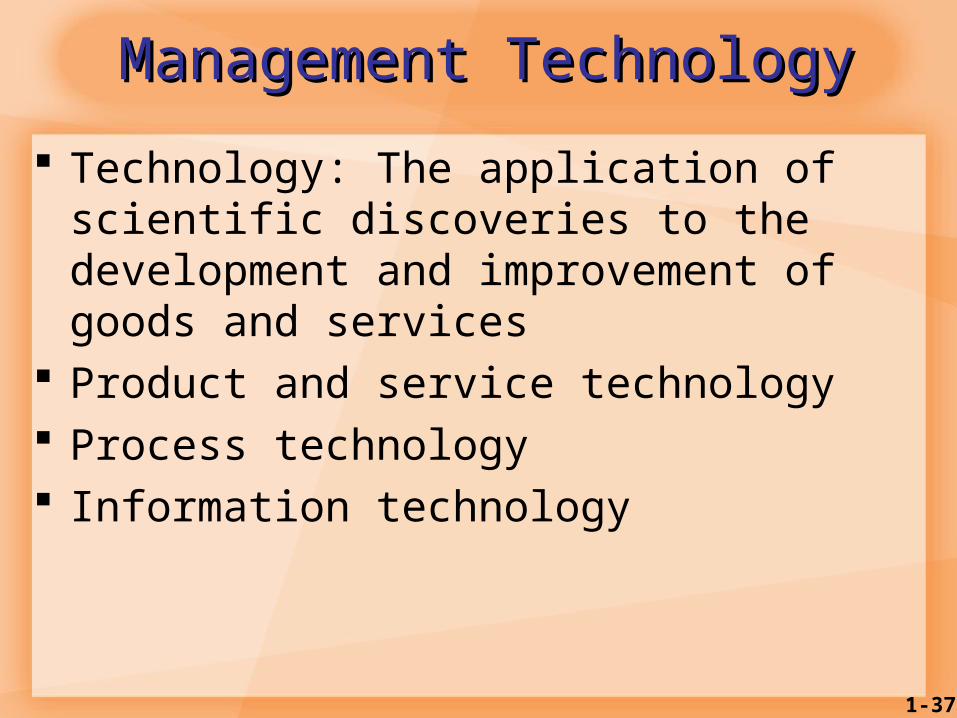
Management TechnologyManagement Technology Technology: The application of scientific discoveries to the development and improvement of goods and services
Product and service technology Process technology Information technology
1-38
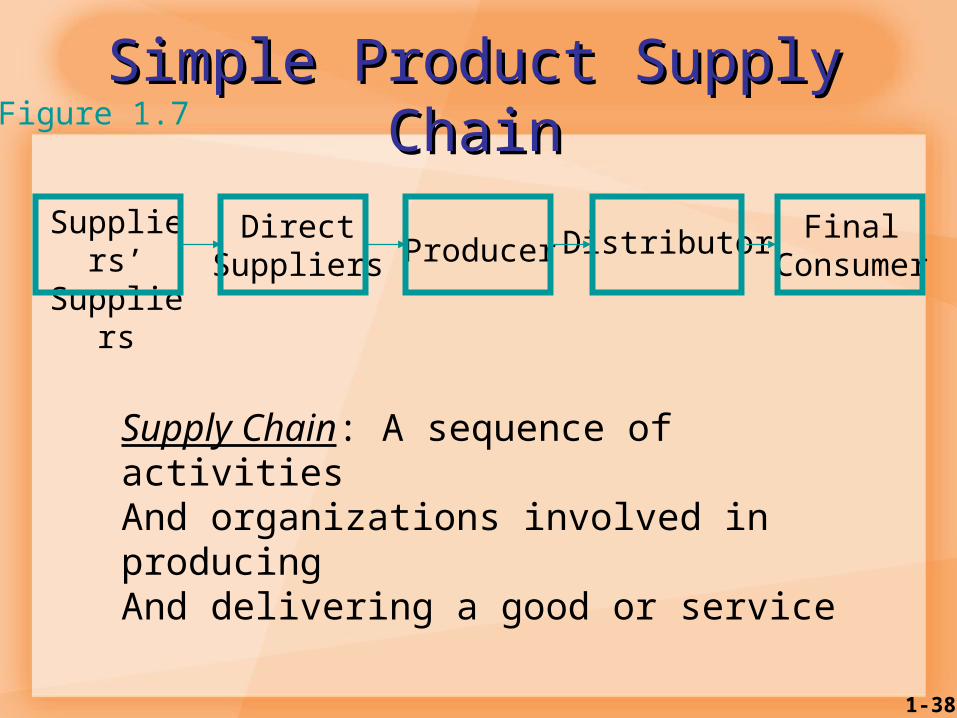
Suppliers’
Suppliers
DirectSuppliers Producer Distributor Final
Consumer
Simple Product Supply Simple Product Supply ChainChainFigure 1.7
Supply Chain: A sequence of activitiesAnd organizations involved in producingAnd delivering a good or service
1-39
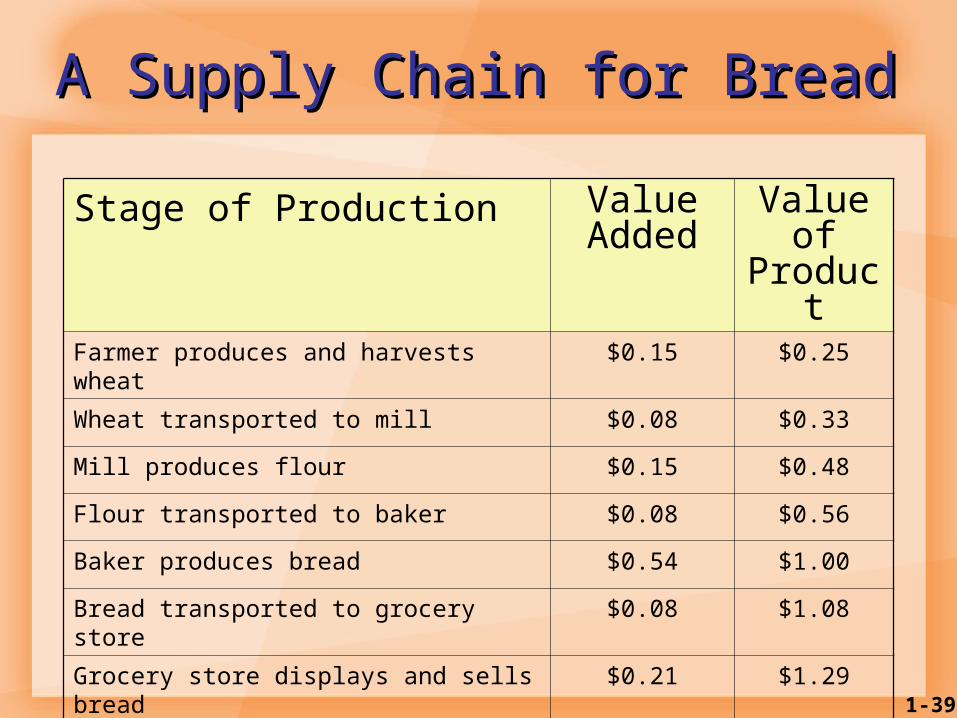
Stage of Production Value Added
Value of
Product
Farmer produces and harvests wheat
$0.15 $0.25
Wheat transported to mill $0.08 $0.33Mill produces flour $0.15 $0.48Flour transported to baker $0.08 $0.56Baker produces bread $0.54 $1.00Bread transported to grocery store
$0.08 $1.08
Grocery store displays and sells bread
$0.21 $1.29
Total Value-Added $1.29
A Supply Chain for BreadA Supply Chain for Bread

1-40
Other Important TrendsOther Important Trends Operations strategy Working with fewer resources Revenue management Process analysis and improvement
Increased regulation and product liability
Lean production