hot-mix asphalt construction - wv department of transportation
TRANSCRIPT
Hot-Mix Asphalt Construction
Federal Highway Administration
JOINT AASHTO
FHWAINDUSTRYTRAINING
COMMITTEE ON ASPHALT
“Partners in Performance”
1-1
Presentation Format
•Lecture/discussion•Protocol:
• Informal• Questions are encouraged• Class participation is essential• Respect others!• Observe class schedule
1-2
Module 1
Course Introduction, Communication, and Project
Documents
1-3
Need for the Course
•Training for individuals assigned to asphalt paving projects• Asphalt construction isn’t simple!• Confidence in work• More cost effective use of tax dollars spent on
asphalt pavements• FHWA requirement!• One person on paving crew certified
1-4
From the 2017 Standard Specifications
• The Contractor shall maintain necessary equipment and qualified personnel including at least one certified Asphalt Field and Compaction Technician at each project during paving operations.
• Additionally, a certified Asphalt Field and Compaction Technician with certification to perform nuclear density testing of asphalt pavements shall perform all testing necessary to assure compaction of the asphalt meets specification requirements.
1-5
Overall Course Objectives
1. Describe the purpose of project documents and cooperative communication on the job
2. List the steps involved in preparing bases and existing surfaces for asphalt overlays
3. Define a proper asphalt delivery process to the job site
4. Explain the effect of the various components of an asphalt paving machine on the finished mat
5. Describe what effect the compaction process has on the finished pavement
1-6
Overall Course Objectives
6. Identify the roles and responsibilities of the WV DOH Inspector
7. Describe how density measurements are taken8. Explain the different processes of QC/QA for
testing9. Define the key components of PWL paving10. Describe the process for troubleshooting if
things go wrong
1-7
Local Issues
• Typical design• Superpave? Marshall?
• Contractors/material suppliers• Aggregate source? Skid??
• Hauling• Laydown• Compaction• Other?
1-8
Course Reference Materials
• Participant’s Workbook• Hot-Mix Asphalt Paving
Handbook 2000• WVDOH Materials
• MP 401.05.20• Compaction Worksheets 401 & 407• Daily Work Report• Tack Coat Form (SM)
1-9
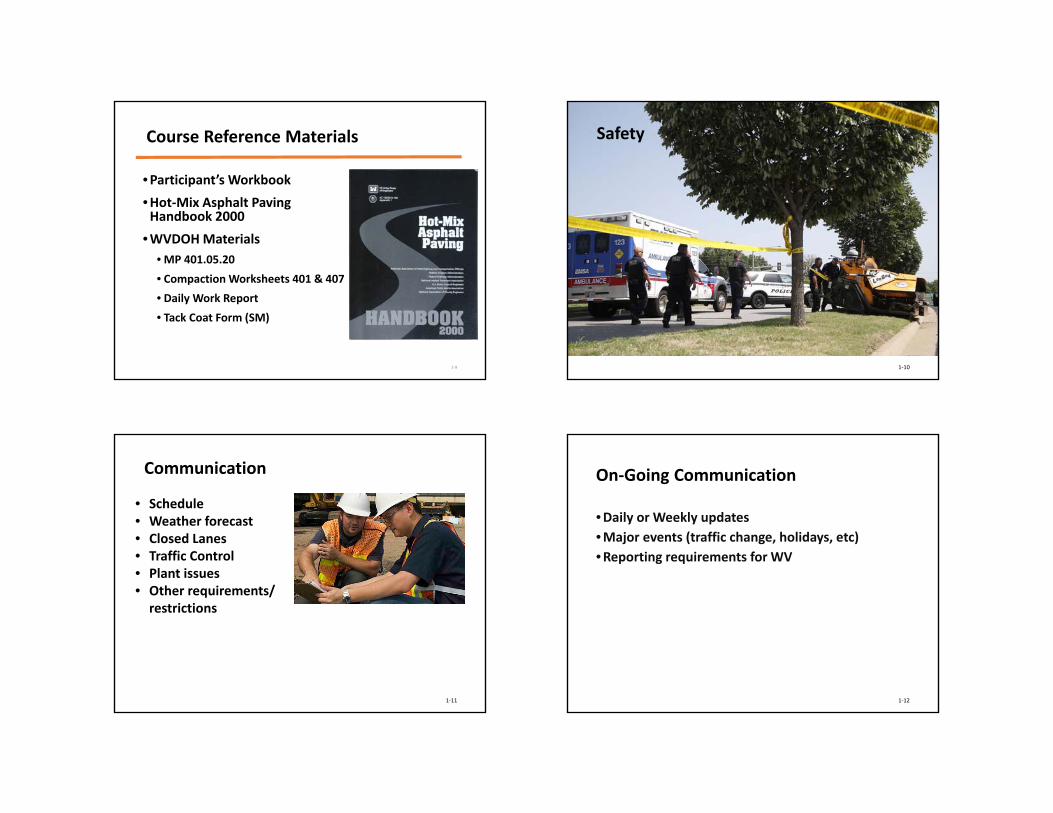
Safety
1-10
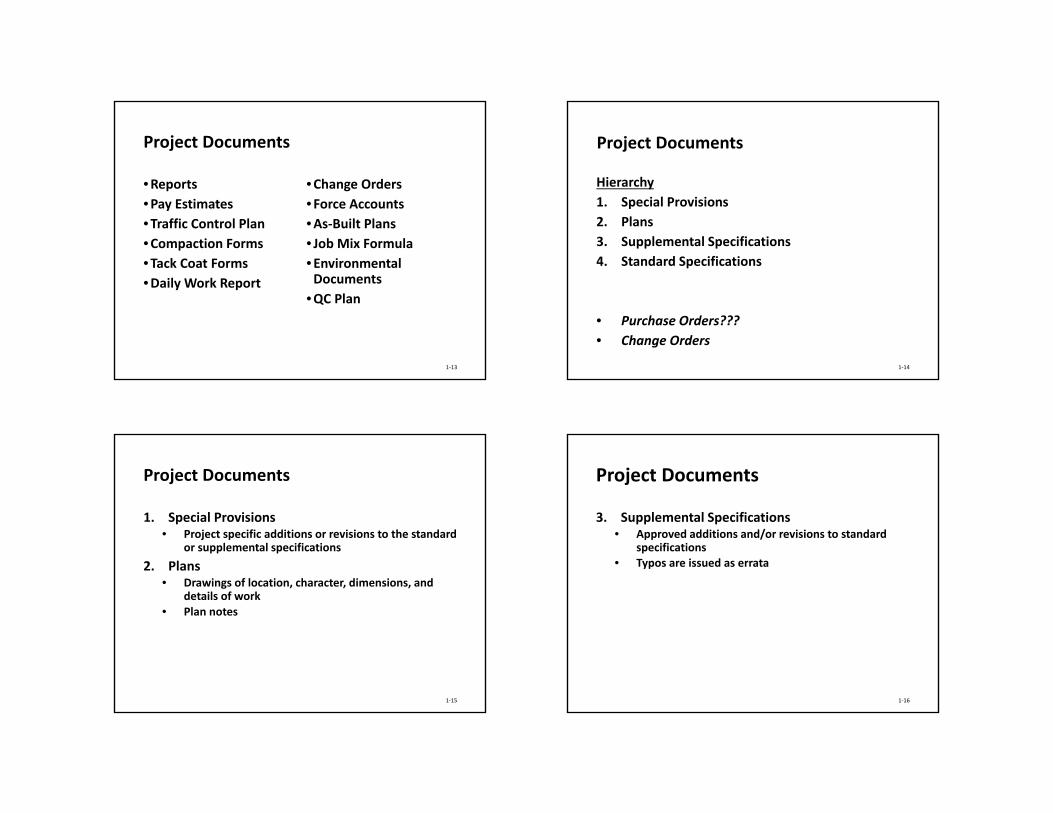
Communication
• Schedule• Weather forecast• Closed Lanes• Traffic Control• Plant issues• Other requirements/
restrictions
1-11
On-Going Communication
• Daily or Weekly updates• Major events (traffic change, holidays, etc)• Reporting requirements for WV
1-12
Project Documents
• Reports • Pay Estimates • Traffic Control Plan • Compaction Forms• Tack Coat Forms• Daily Work Report
• Change Orders• Force Accounts• As-Built Plans• Job Mix Formula• Environmental
Documents• QC Plan
1-13
Project Documents
Hierarchy1. Special Provisions2. Plans3. Supplemental Specifications4. Standard Specifications
• Purchase Orders???• Change Orders
1-14
Project Documents
1. Special Provisions• Project specific additions or revisions to the standard
or supplemental specifications2. Plans
• Drawings of location, character, dimensions, and details of work
• Plan notes
1-15
Project Documents
3. Supplemental Specifications• Approved additions and/or revisions to standard
specifications• Typos are issued as errata
1-16
Project Documents
4. Standard Specifications • Directions, provisions, and requirements for
performing the work illustrated and described in the plans
• Methods of performing the work, desired outcome, or qualities and quantities of materials and labor to be furnished
1-17
West Virginia Challenges
• WV is one of only four states that take care of both state and county routes
• Delaware, Virginia, and North Carolina are the others• WV has the 6th largest state-maintained highway
system in the nation• DOH owns 36,000 miles…24,500 miles are paved
• LOWEST total $ Disbursements/mile• US Avg: $178,000• WV: $35,000
• Highest Percentage of narrow lanes• US Avg: 10%• WV: 52%
• Source: 23rd Annual Highway Report on the Performance of State Highway Systems, 2018
1-18
The “Team”
•Owners•Long-term performance•Ensure quality
•HMA Industry•Provide quality•Increase performance•Lower costs
1-19
Teamwork and Cooperation
1-20

Questions
1-21

5-1
HMA Construction Program
Module 5 – Compaction
5-2
Learning Objectives
1. Objective of compaction2. Asphalt concrete properties related to
compaction 3. Material and mix properties that affect
compaction 4. Types of compaction equipment
5-3
Learning Objectives
5. Selection of compaction equipment 6. Identify compaction variables7. Main components of compaction
equipment maintenance8. Calculate roller productivity 9. Describe proper compaction operating
procedures
How to Manage Asphalt Density
• Training• Temperature• Proper Roller & Rolling Pattern• Communication
5-5
Definitions
• Density− the mass of the material that occupies a
certain volume
• Compaction − the process through which the asphalt mix is
compressed and reduced in volum• Cannot compress the aggregate or the binder• Volume reduction of the mix is the result of
squeezing out the air!
Definitions
• Pass− the entire roller moving over one point in
the mat one time
• Coverage − the roller moving over the entire width of
the mat one time
5-6
5-7
• Improve Mechanical Stability • Improve Resistance to Permanent
Deformation • Reduce Moisture/Air Penetration • Improve Fatigue Resistance • Reduce Low-Temperature Cracking
Potential
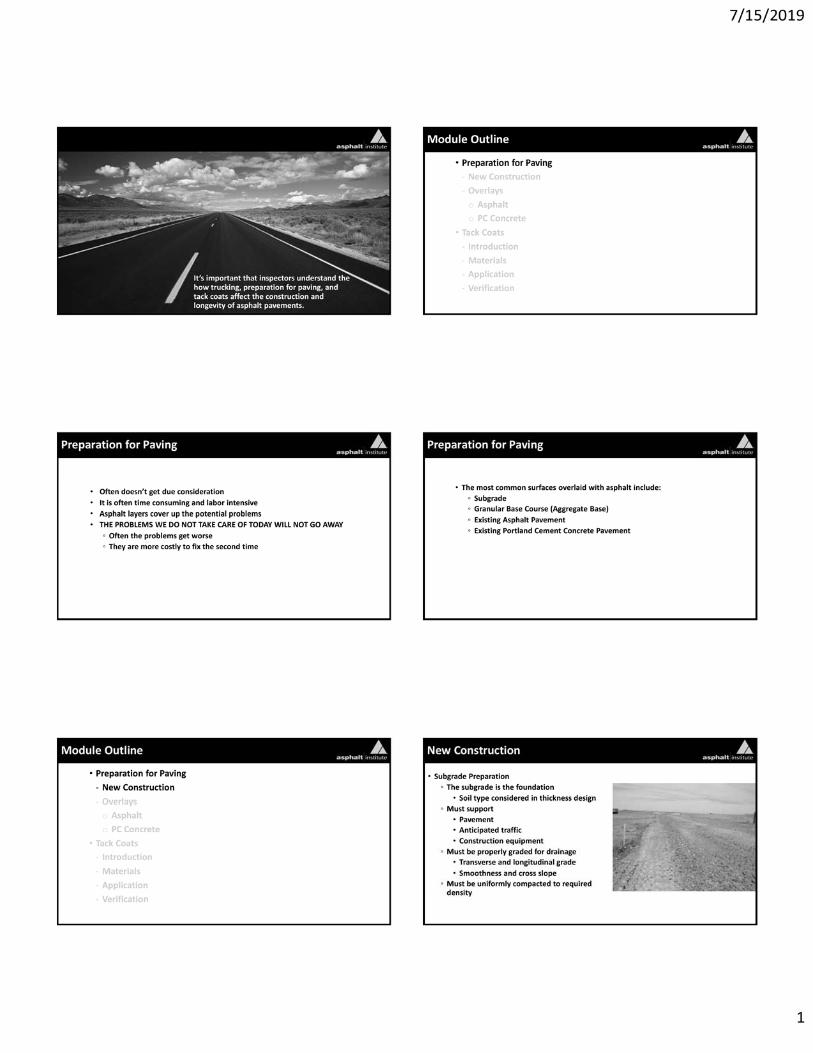
Importance of CompactionDuring the construction of HMA,
compaction is considered to be the most important factor that contributes to the performance of the pavement.
Importance Of Compaction
rollers are the last piece of equipment to touch the mat after it is placed and are the last
opportunity to “undo” the smooth mat that the paver has placed
“Density is not only a top quality indicator, in terms of how long the pavement will last, but it
is also a top pay item in most state specifications,”
5-8
Topics
• Factors affecting compaction• Time available for compaction• Roller types• Roller operations• Roller pattern • Production rate• Roller maintenance
5-9 5-10
Factors Affecting Compaction
• Properties of the Materials• Environmental Variables • Laydown Site Conditions
5-11
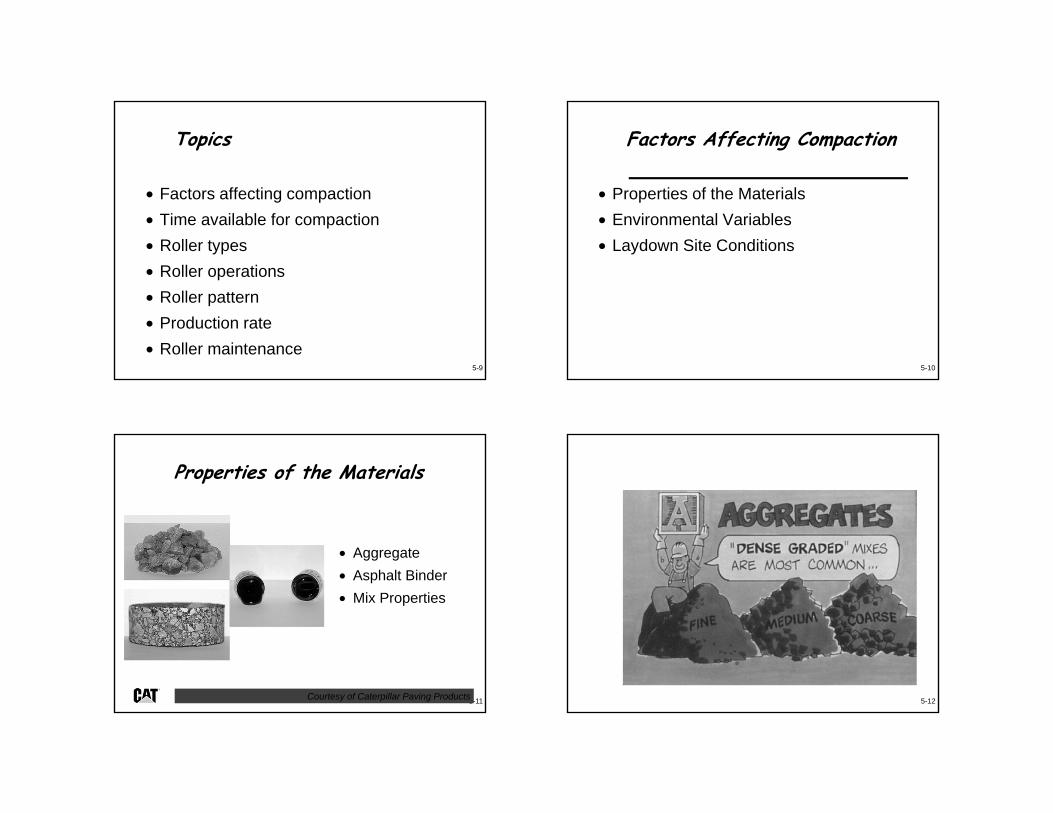
Properties of the Materials
• Aggregate • Asphalt Binder• Mix Properties
Courtesy of Caterpillar Paving Products 5-12
5-13
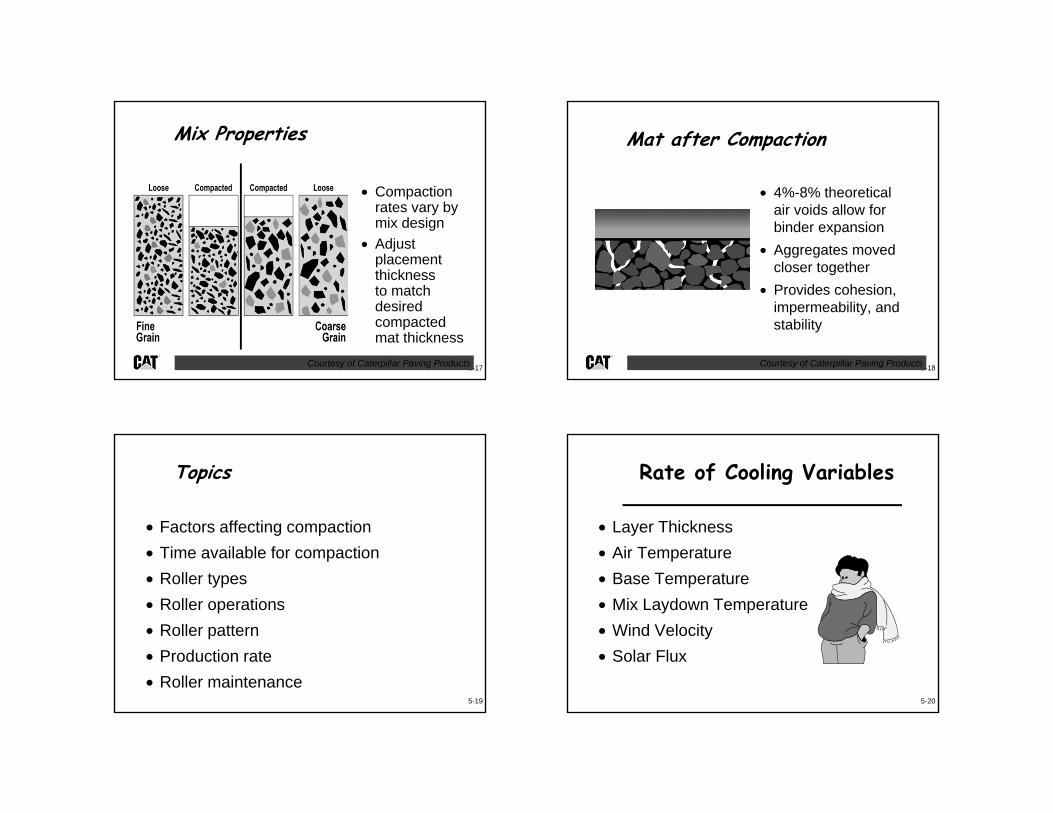
Aggregate Carries the Load
5-14
5-15
Binder and Compaction
• Asphalt binder holds particles together− Provides lubrication at high temperatures− Provides cohesion at in-service
temperatures
• Prevents air and water intrusion into mat
5-16
HMA
5-17
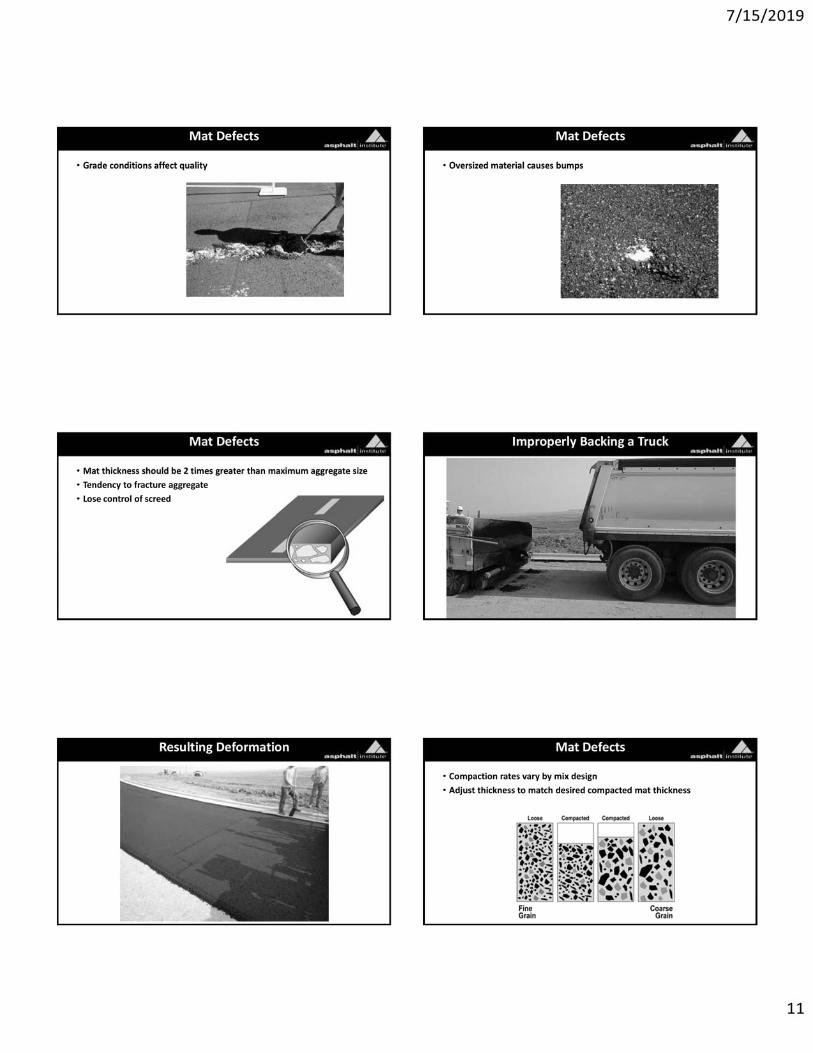
Mix Properties
• Compaction rates vary by mix design
• Adjust placement thickness to match desired compacted mat thickness
Courtesy of Caterpillar Paving Products 5-18
Mat after Compaction
• 4%-8% theoretical air voids allow for binder expansion
• Aggregates moved closer together
• Provides cohesion, impermeability, and stability
Courtesy of Caterpillar Paving Products
Topics
• Factors affecting compaction• Time available for compaction• Roller types• Roller operations• Roller pattern • Production rate• Roller maintenance
5-19 5-20
Rate of Cooling Variables
• Layer Thickness • Air Temperature• Base Temperature • Mix Laydown Temperature • Wind Velocity • Solar Flux
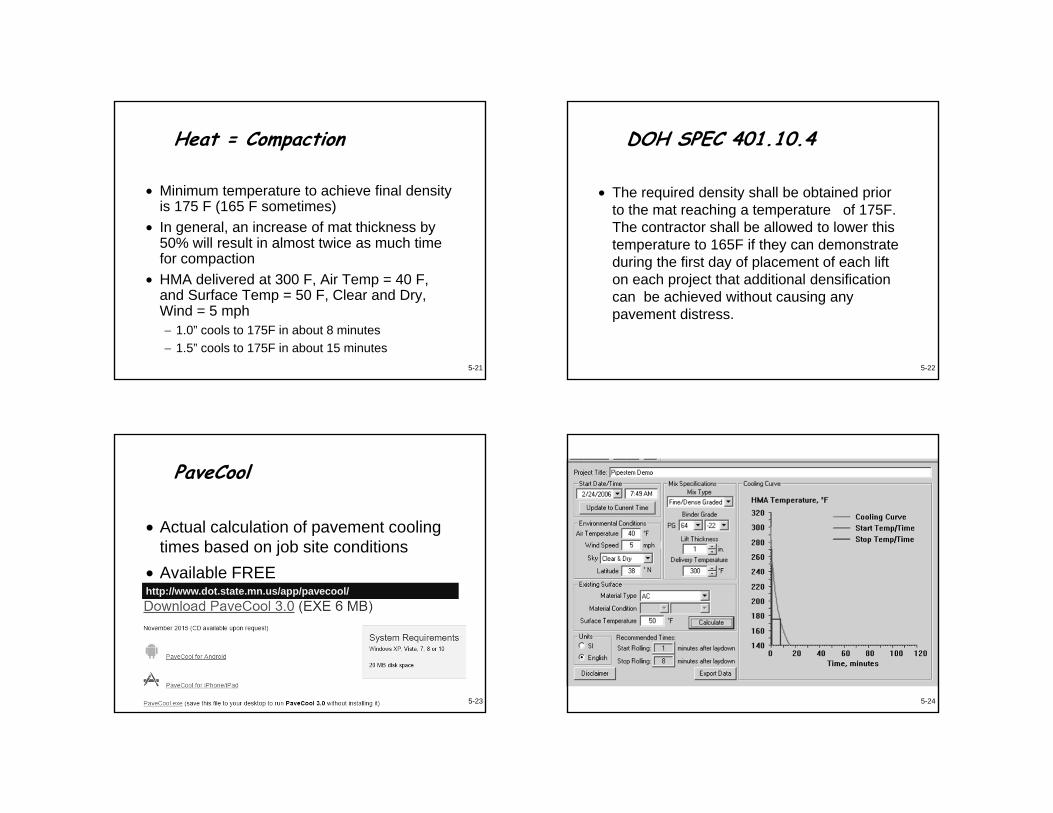
Heat = Compaction
• Minimum temperature to achieve final density is 175 F (165 F sometimes)
• In general, an increase of mat thickness by 50% will result in almost twice as much time for compaction
• HMA delivered at 300 F, Air Temp = 40 F, and Surface Temp = 50 F, Clear and Dry, Wind = 5 mph− 1.0” cools to 175F in about 8 minutes− 1.5” cools to 175F in about 15 minutes
5-21
DOH SPEC 401.10.4
• The required density shall be obtained prior to the mat reaching a temperature of 175F. The contractor shall be allowed to lower this temperature to 165F if they can demonstrate during the first day of placement of each lift on each project that additional densification can be achieved without causing any pavement distress.
5-22
5-23
PaveCool
• Actual calculation of pavement cooling times based on job site conditions
• Available FREEhtpp://www.mnroad.dot.us/research/MnRoad_Project/restools/cooltool.asphttp://www.dot.state.mn.us/app/pavecool/
5-24
5-25 5-26
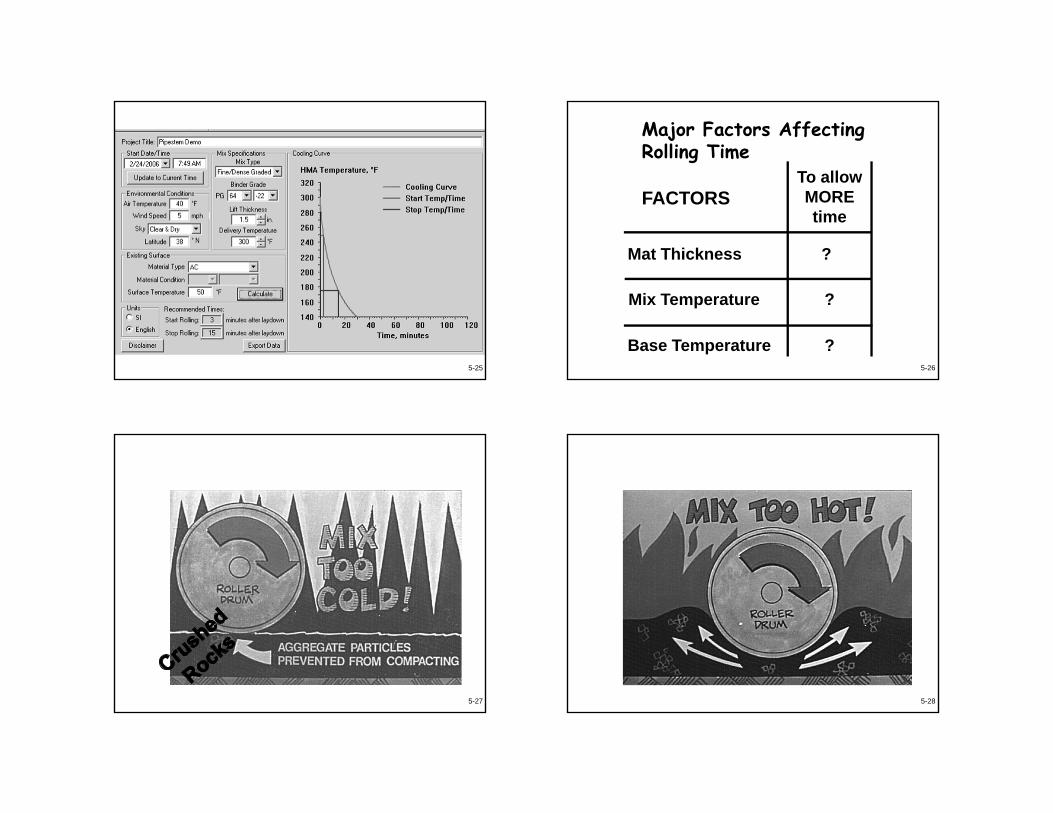
?
?
?
Base Temperature
Mix Temperature
Major Factors Affecting Rolling Time
Mat Thickness
To allow MORE time
FACTORS
5-27 5-28

•Temperature control is critical
•Take Regular Mat Temperature Readings
5-29 5-30
Typical Compaction Temperature Range
80 °C - 150 °C(175 °F) (~300 °F)
5-31
Laydown Site Conditions
• Lift thickness is determined by aggregate size− Marshall ~2x maximum aggregate size− Superpave ~3x nominal maximum agg. size*− Check with design directive 644 for specifics
• Lifts with variable thickness− Patch and Leveling− Scratch− Wedges and other unique conditions 5-32
Laydown Site Conditions
• Base/Existing Surface Conditions− Oxidized pavement − Rutted pavement− Cracked pavement− Soft and yielding
Topics
• Factors affecting compaction• Time available for compactionRoller types and stages• Roller operations• Roller pattern • Production rate• Roller maintenance
5-33 5-34
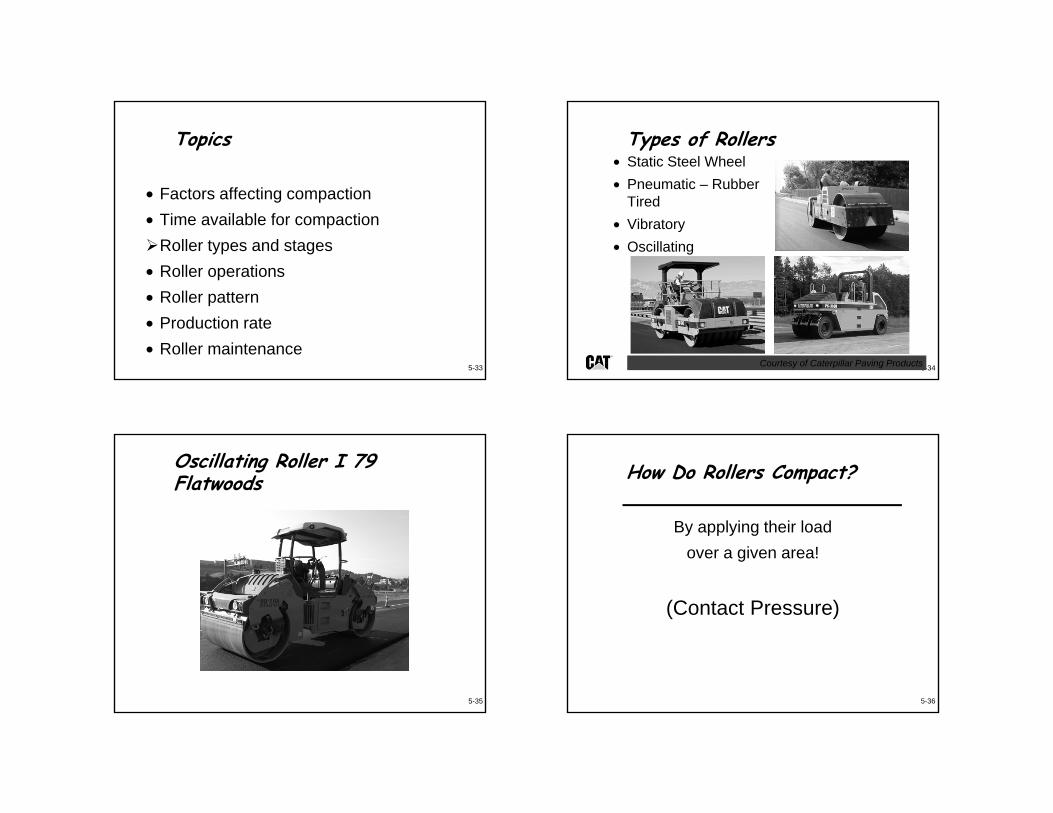
Types of Rollers• Static Steel Wheel • Pneumatic – Rubber
Tired• Vibratory • Oscillating
Courtesy of Caterpillar Paving Products
Oscillating Roller I 79 Flatwoods
5-35 5-36
How Do Rollers Compact?
By applying their load over a given area!
(Contact Pressure)
5-37
Static Steel Wheel Roller
• Contact Pressure • Operation
5-38
Static Steel Wheel Roller
5-39
Ground Contact Area Drum Width
Weight at Drum
Penetration Depth
Courtesy of Caterpillar Paving Products
Contact Pressure
5-40
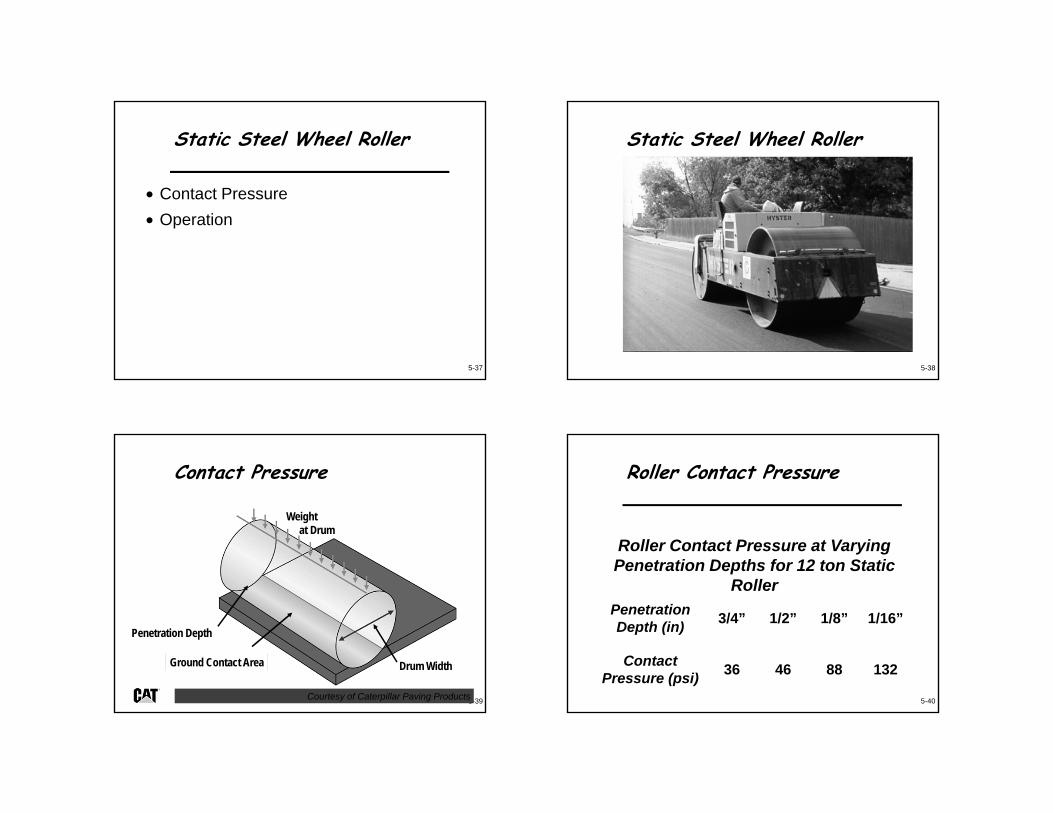
Roller Contact Pressure
Roller Contact Pressure at Varying Penetration Depths for 12 ton Static
RollerPenetration Depth (in) 3/4” 1/2” 1/8” 1/16”
Contact Pressure (psi) 36 46 88 132
5-41
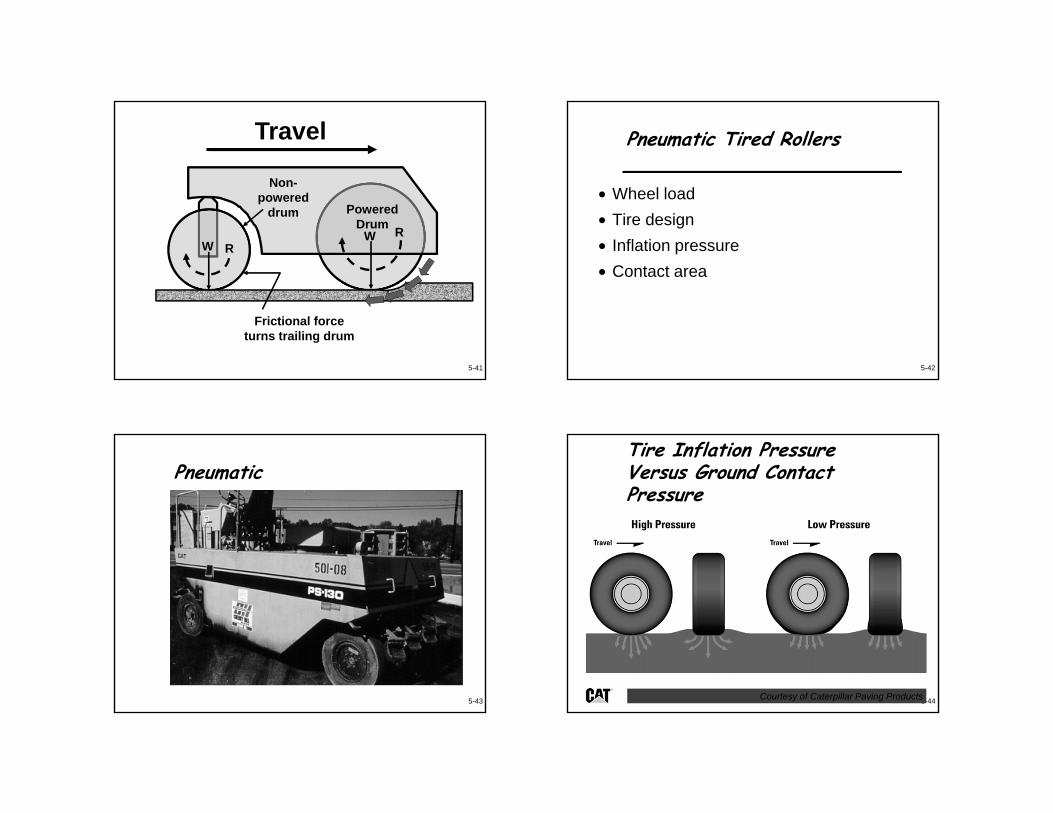
Travel
Frictional force turns trailing drum
Non-powered
drum Powered Drum
WW R
R
5-42
Pneumatic Tired Rollers
• Wheel load• Tire design • Inflation pressure• Contact area
5-43
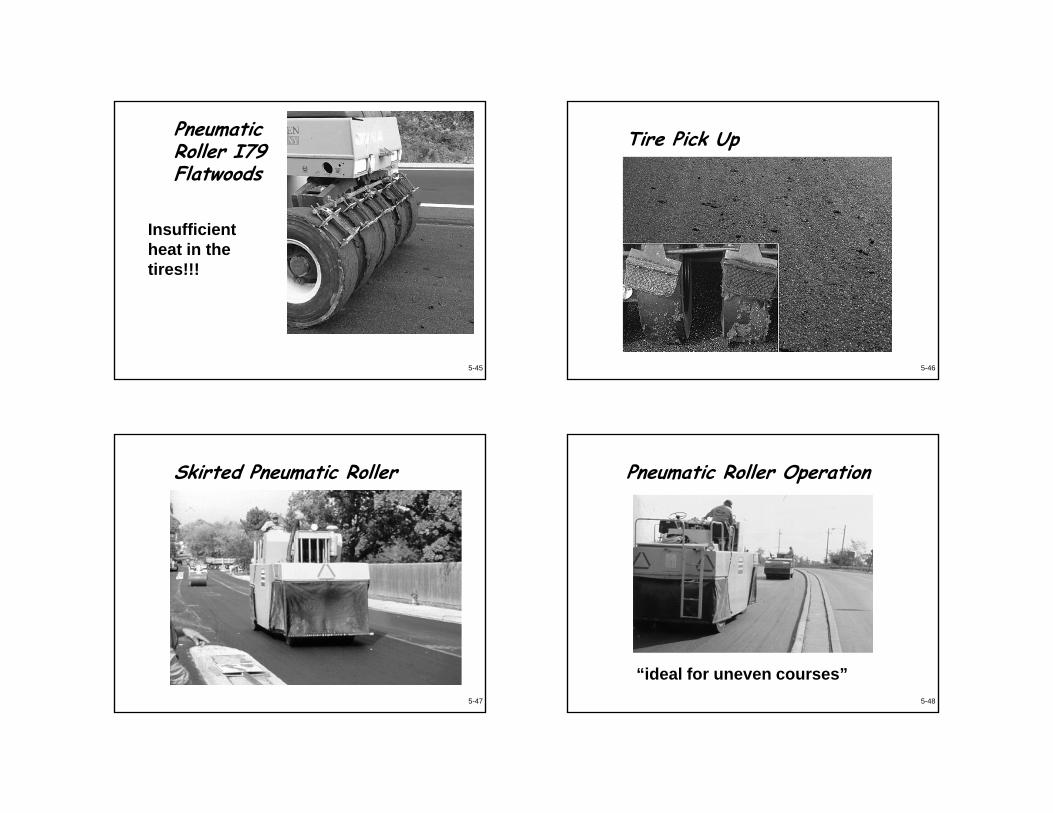
Pneumatic
5-44
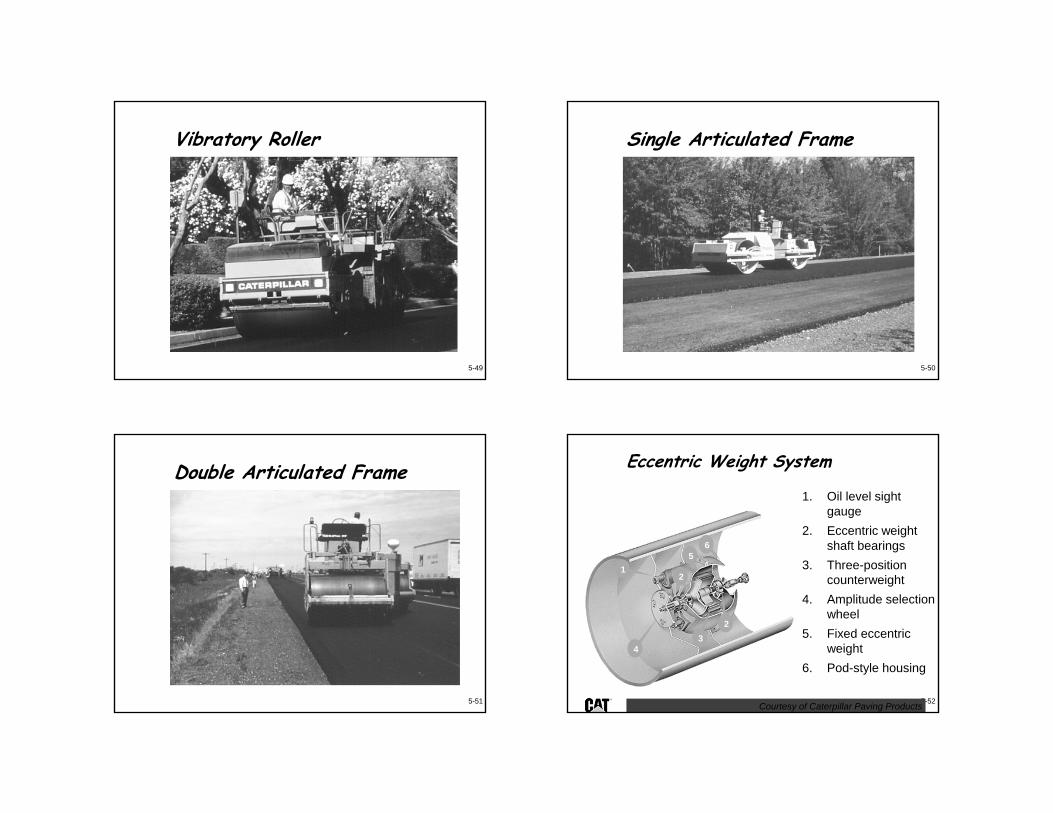
Tire Inflation Pressure Versus Ground Contact Pressure
Courtesy of Caterpillar Paving Products
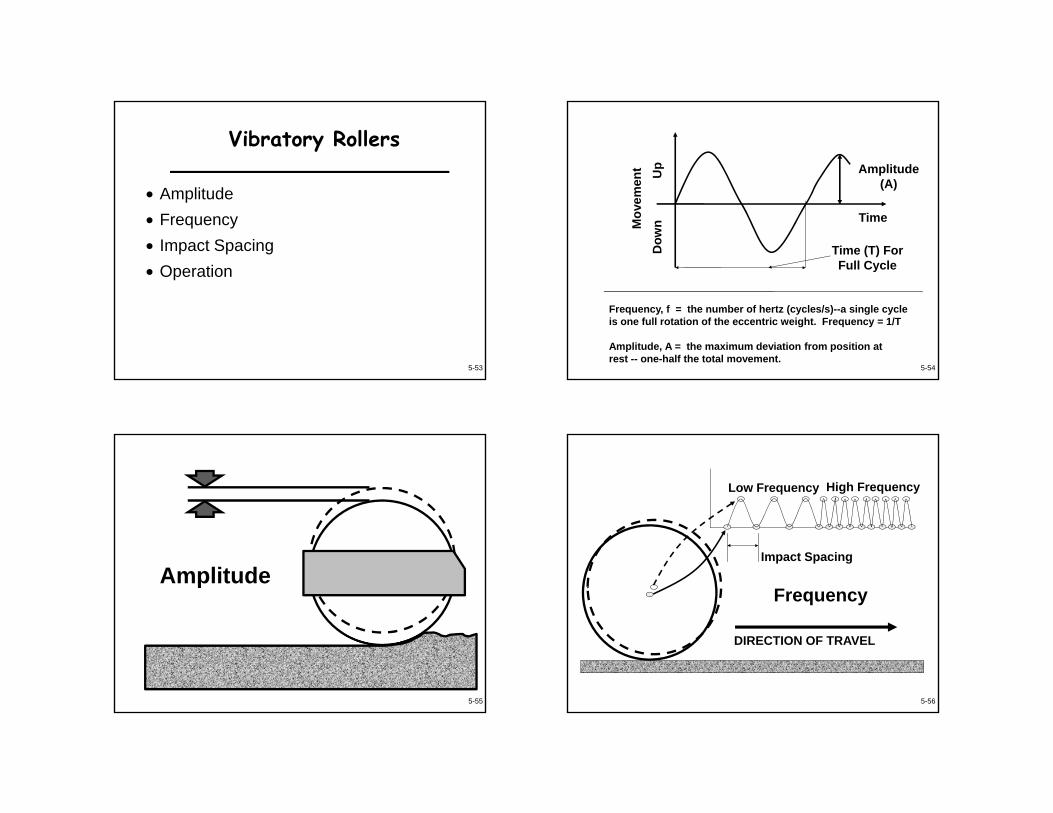
Pneumatic Roller I79 Flatwoods
5-45
Insufficient heat in the tires!!!
5-46
Tire Pick Up
5-47
Skirted Pneumatic Roller
5-48
Pneumatic Roller Operation
“ideal for uneven courses”
5-49
Vibratory Roller
5-50
Single Articulated Frame
5-51
Double Articulated Frame
5-52
Eccentric Weight System
12
5
34
2
6
1. Oil level sight gauge
2. Eccentric weight shaft bearings
3. Three-positioncounterweight
4. Amplitude selection wheel
5. Fixed eccentric weight
6. Pod-style housing
Courtesy of Caterpillar Paving Products
5-53
Vibratory Rollers
• Amplitude • Frequency• Impact Spacing • Operation
5-54
Frequency, f = the number of hertz (cycles/s)--a single cycle is one full rotation of the eccentric weight. Frequency = 1/T
Amplitude, A = the maximum deviation from position at rest -- one-half the total movement.
Amplitude(A)
Time
Up
Dow
n
Time (T) ForFull Cycle
Mov
emen
t
5-55
Amplitude
5-56
DIRECTION OF TRAVEL
Frequency
Impact Spacing
High FrequencyLow Frequency
5-57
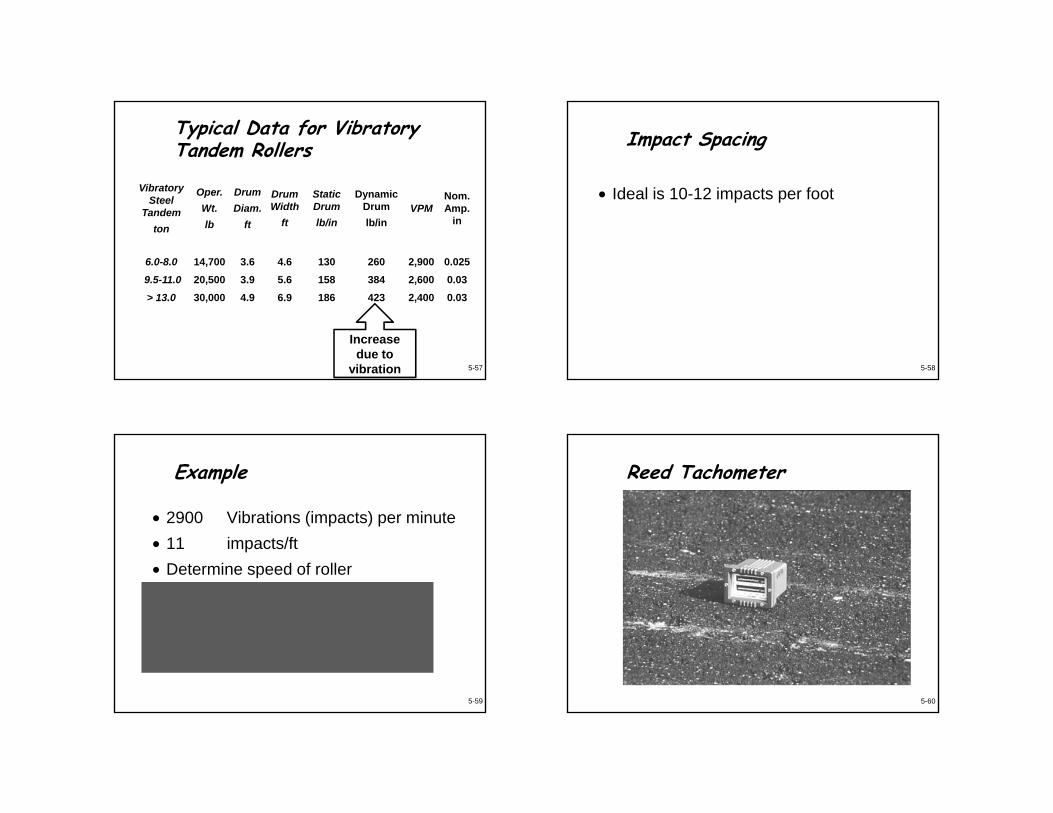
Typical Data for Vibratory Tandem Rollers
Vibratory Steel
Tandemton
Oper.Wt.lb
DrumDiam.
ft
Drum Width
ft
Static Drumlb/in
Dynamic Drumlb/in
VPMNom. Amp.
in
6.0-8.0 14,700 3.6 4.6 130 260 2,900 0.0259.5-11.0 20,500 3.9 5.6 158 384 2,600 0.03> 13.0 30,000 4.9 6.9 186 423 2,400 0.03
Increase due to
vibration
Impact Spacing
• Ideal is 10-12 impacts per foot
5-58
Example
• 2900 Vibrations (impacts) per minute• 11 impacts/ft• Determine speed of roller• 2900/11 = 264 ft/min• 264 x 60 = 15818 ft/hr
• 15818/5280 = 3.00 miles/hr
5-59 5-60
Reed Tachometer
5-61
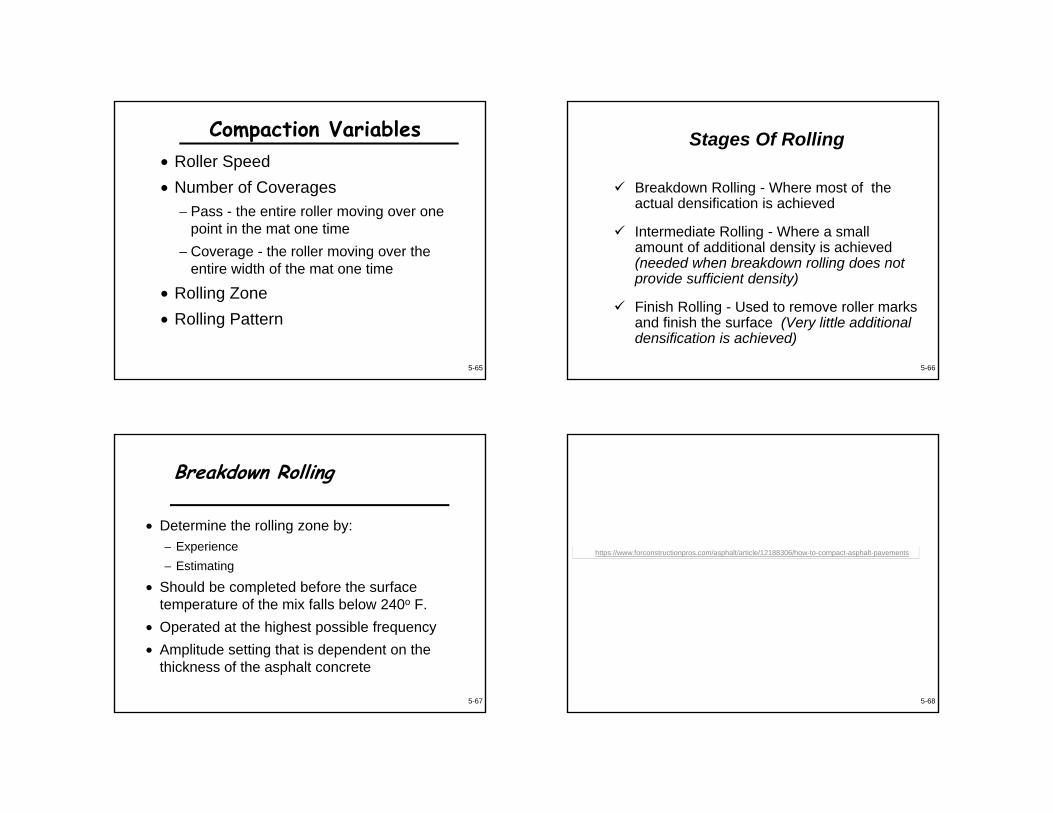
Improper Impact Spacing
Improper impact spacing can be obvious;but there can be differential compaction that is not initially seen at the surface that decreases long term pavement performance.
Topics
• Factors affecting compaction• Time available for compaction• Roller typesRoller operations• Roller pattern • Production rate• Roller maintenance
5-62
5-63
Roller Operator Controls
• Speed• Starts & Stops• Pattern• Amplitude• Frequency• Distance to paver
5-64
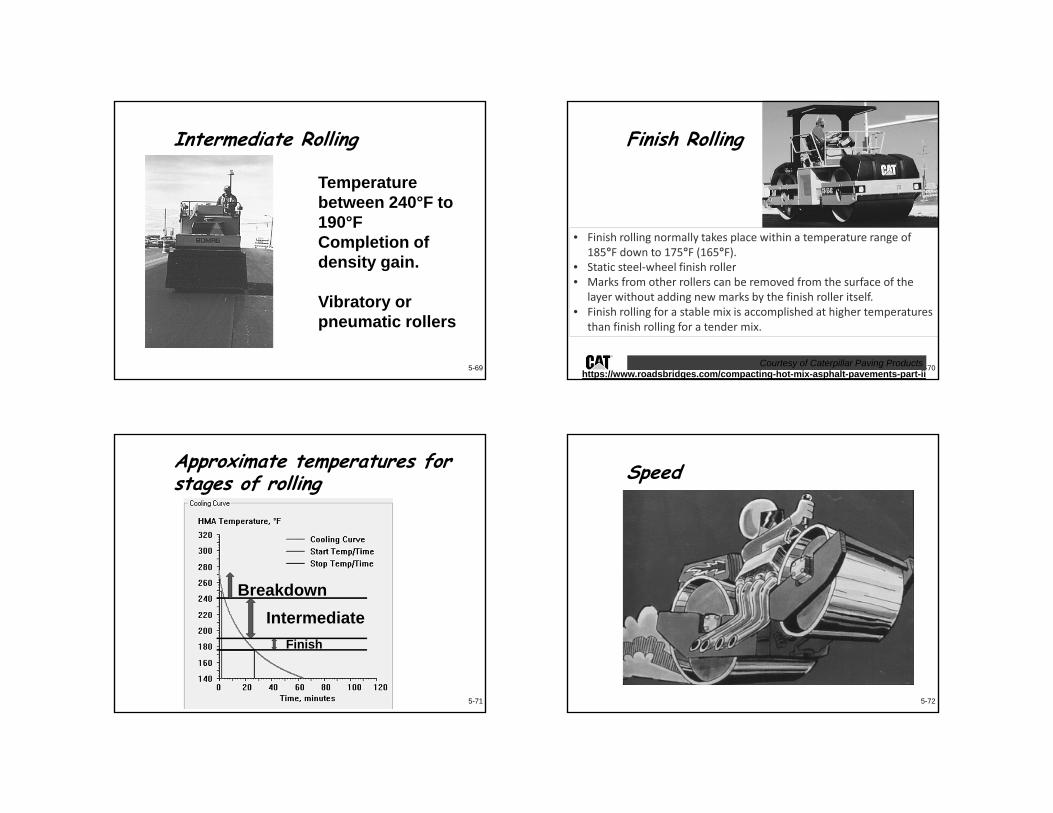
Roller Controls
5-65
Compaction Variables• Roller Speed• Number of Coverages
− Pass - the entire roller moving over one point in the mat one time
− Coverage - the roller moving over the entire width of the mat one time
• Rolling Zone • Rolling Pattern
Stages Of Rolling
Breakdown Rolling - Where most of the actual densification is achieved
Intermediate Rolling - Where a small amount of additional density is achieved (needed when breakdown rolling does not provide sufficient density)
Finish Rolling - Used to remove roller marks and finish the surface (Very little additional densification is achieved)
5-66
5-67
Breakdown Rolling
• Determine the rolling zone by: − Experience− Estimating
• Should be completed before the surface temperature of the mix falls below 240o F.
• Operated at the highest possible frequency• Amplitude setting that is dependent on the
thickness of the asphalt concrete
5-68
https://www.forconstructionpros.com/asphalt/article/12188306/how-to-compact-asphalt-pavements
5-69
Intermediate Rolling
Temperature between 240°F to 190°FCompletion of density gain.
Vibratory or pneumatic rollers
5-70Courtesy of Caterpillar Paving Products
Finish Rolling
• Finish rolling normally takes place within a temperature range of 185°F down to 175°F (165°F).
• Static steel-wheel finish roller • Marks from other rollers can be removed from the surface of the
layer without adding new marks by the finish roller itself. • Finish rolling for a stable mix is accomplished at higher temperatures
than finish rolling for a tender mix.
https://www.roadsbridges.com/compacting-hot-mix-asphalt-pavements-part-ii
Approximate temperatures for stages of rolling
5-71
BreakdownIntermediate
Finish
5-72
Speed
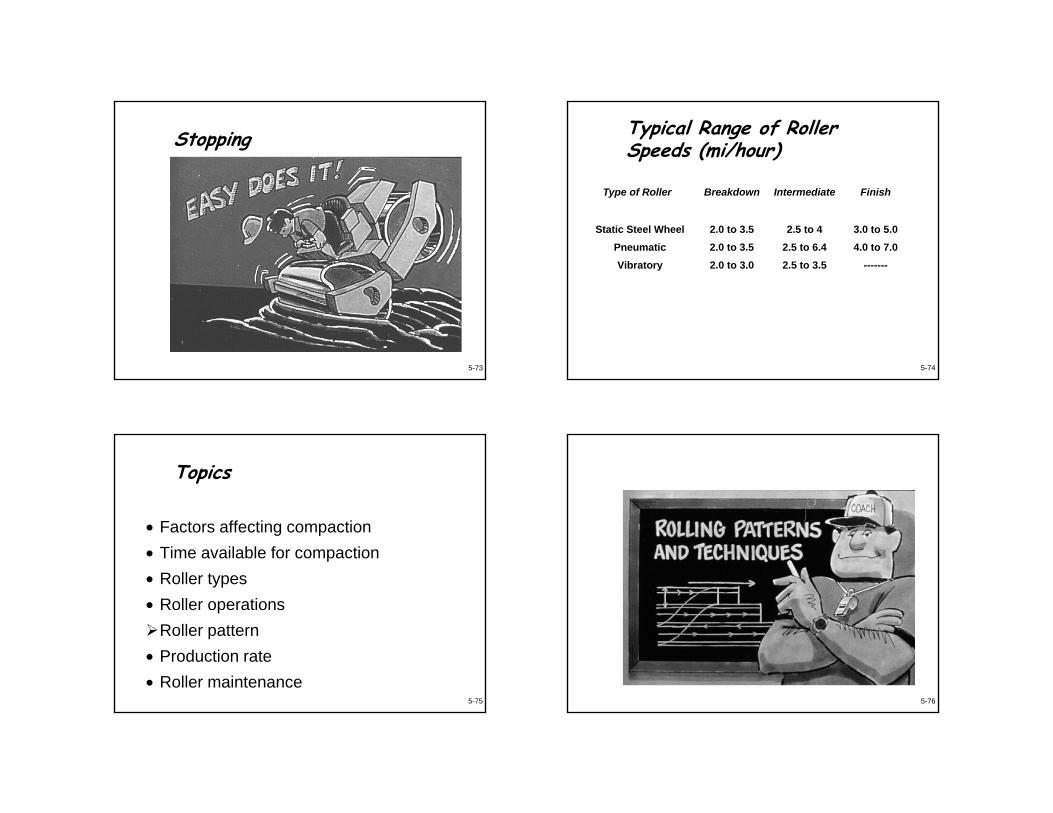
5-73
Stopping
5-74
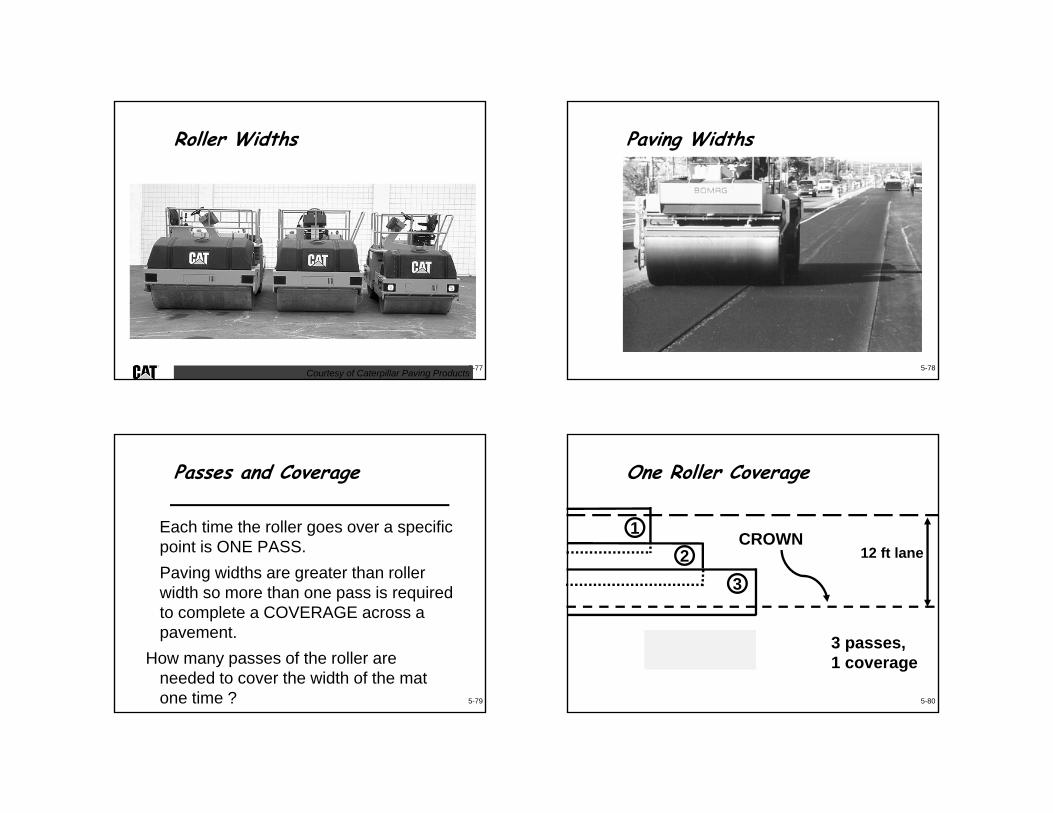
Typical Range of Roller Speeds (mi/hour)
Type of Roller Breakdown Intermediate Finish
Static Steel Wheel 2.0 to 3.5 2.5 to 4 3.0 to 5.0Pneumatic 2.0 to 3.5 2.5 to 6.4 4.0 to 7.0Vibratory 2.0 to 3.0 2.5 to 3.5 -------
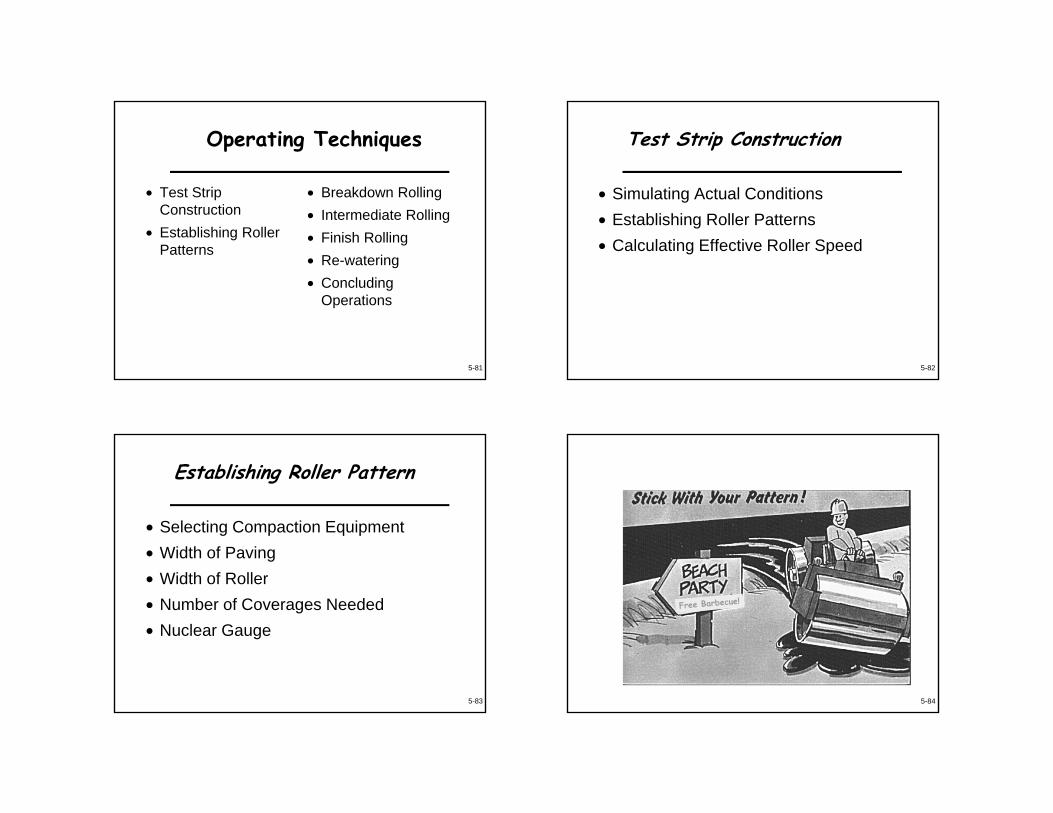
Topics
• Factors affecting compaction• Time available for compaction• Roller types• Roller operationsRoller pattern • Production rate• Roller maintenance
5-75 5-76
5-77Courtesy of Caterpillar Paving Products
Roller Widths
5-78
Paving Widths
5-79
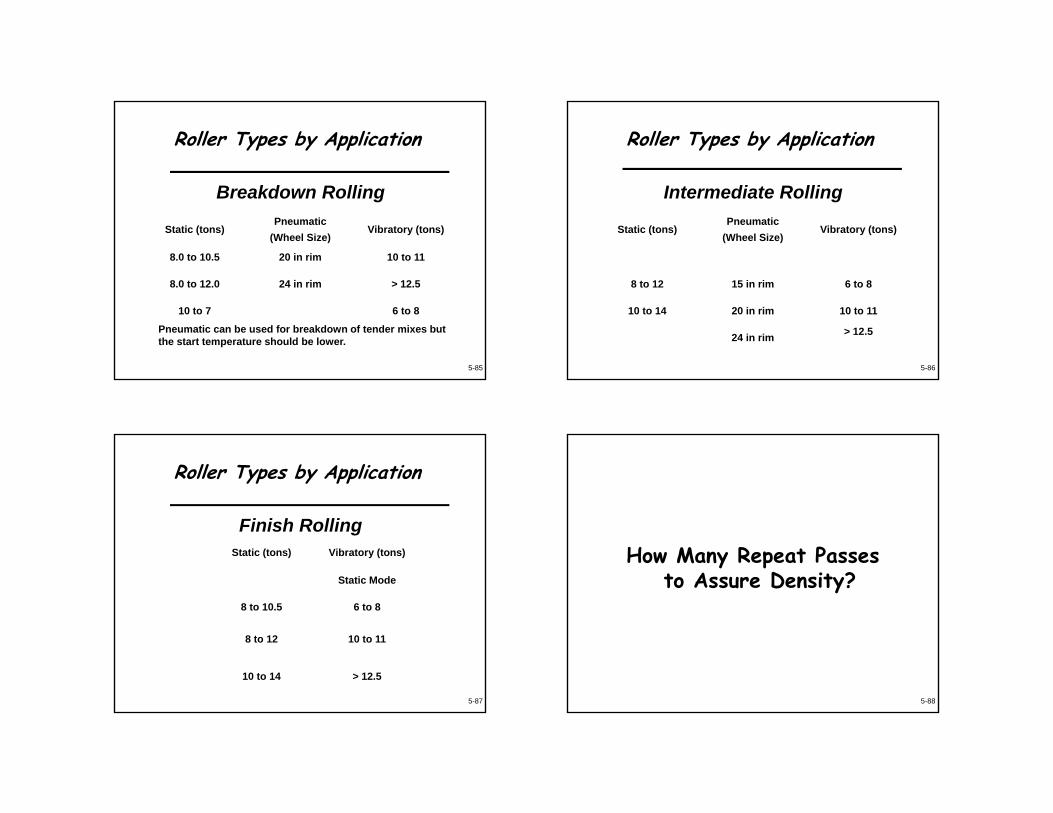
Passes and Coverage
Each time the roller goes over a specific point is ONE PASS.Paving widths are greater than roller width so more than one pass is required to complete a COVERAGE across a pavement.
How many passes of the roller are needed to cover the width of the mat one time ?
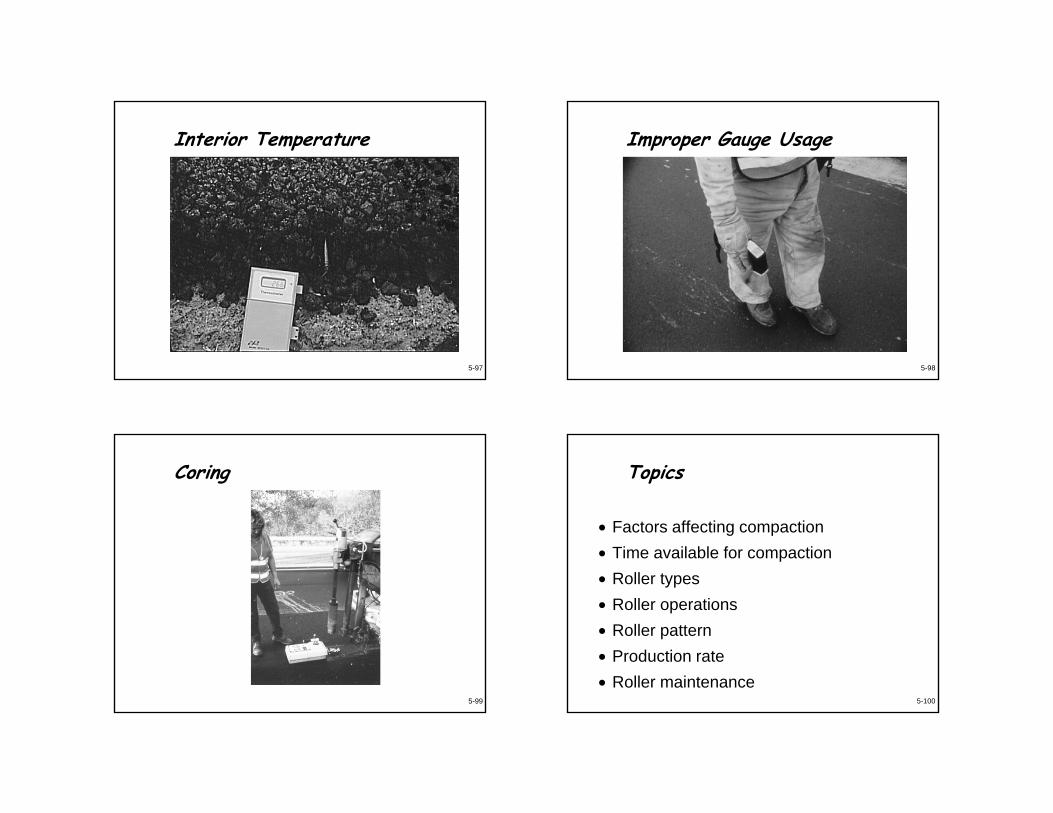
12
3
CROWN12 ft lane
One Roller Coverage
5 ft roller 3 passes, 1 coverage
5-80
5-81
Operating Techniques
• Test Strip Construction
• Establishing RollerPatterns
• Breakdown Rolling• Intermediate Rolling • Finish Rolling • Re-watering • Concluding
Operations
5-82
Test Strip Construction
• Simulating Actual Conditions • Establishing Roller Patterns • Calculating Effective Roller Speed
5-83
Establishing Roller Pattern
• Selecting Compaction Equipment • Width of Paving • Width of Roller • Number of Coverages Needed • Nuclear Gauge
5-84
5-85
Breakdown Rolling
Static (tons)Pneumatic
(Wheel Size)Vibratory (tons)
8.0 to 10.5 20 in rim 10 to 11
8.0 to 12.0 24 in rim > 12.5
10 to 7 6 to 8
Roller Types by Application
Pneumatic can be used for breakdown of tender mixes but the start temperature should be lower.
5-86
Intermediate Rolling
Static (tons)Pneumatic
(Wheel Size)Vibratory (tons)
8 to 12 15 in rim 6 to 8
10 to 14 20 in rim 10 to 11
24 in rim > 12.5
Roller Types by Application
5-87
Finish RollingStatic (tons) Vibratory (tons)
Static Mode
8 to 10.5 6 to 8
8 to 12 10 to 11
10 to 14 > 12.5
Roller Types by Application
5-88
How Many Repeat Passes to Assure Density?

5-89
Checking Density
5-90
Density
High
Low
DensityPassing
1 2 43 5 6
Roller Passes
5-91
Roller Pattern Problem #1
Decreasing Temperature 5-92
Roller Pattern Problem #2
Decreasing Temperature
5-93
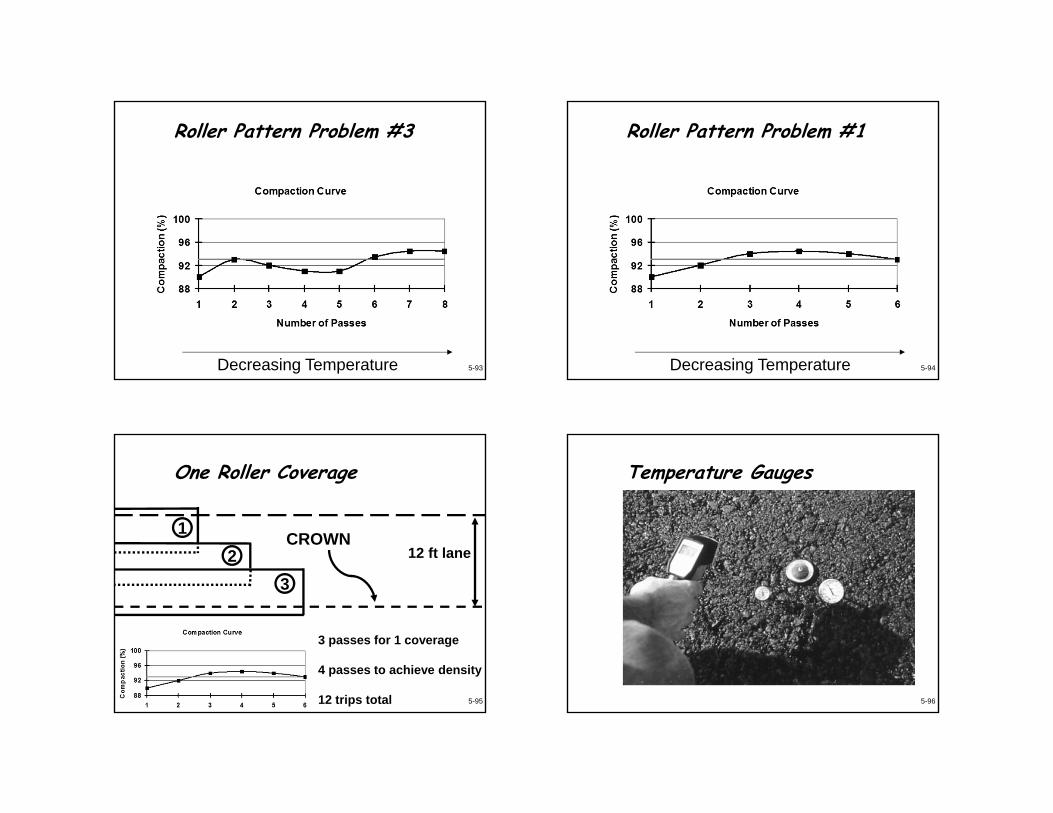
Roller Pattern Problem #3
Decreasing Temperature 5-94
Roller Pattern Problem #1
Decreasing Temperature
12
3
CROWN12 ft lane
One Roller Coverage
3 passes for 1 coverage
4 passes to achieve density
12 trips total 5-95 5-96
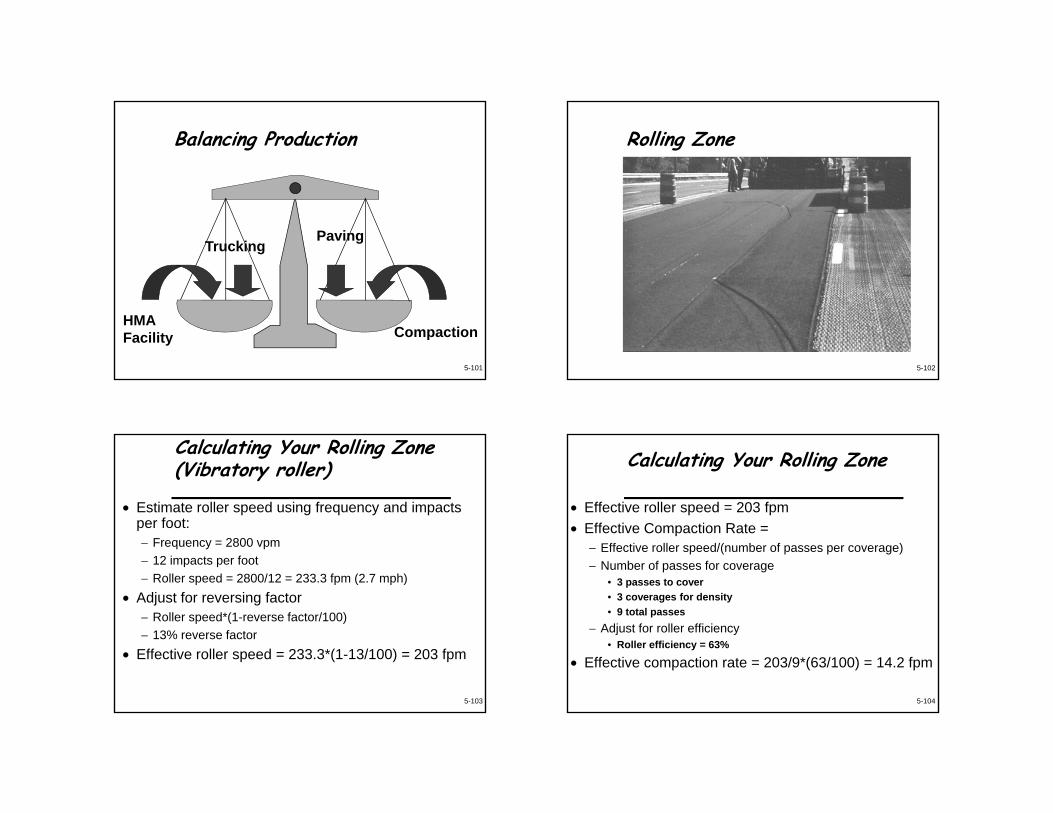
Temperature Gauges
5-97
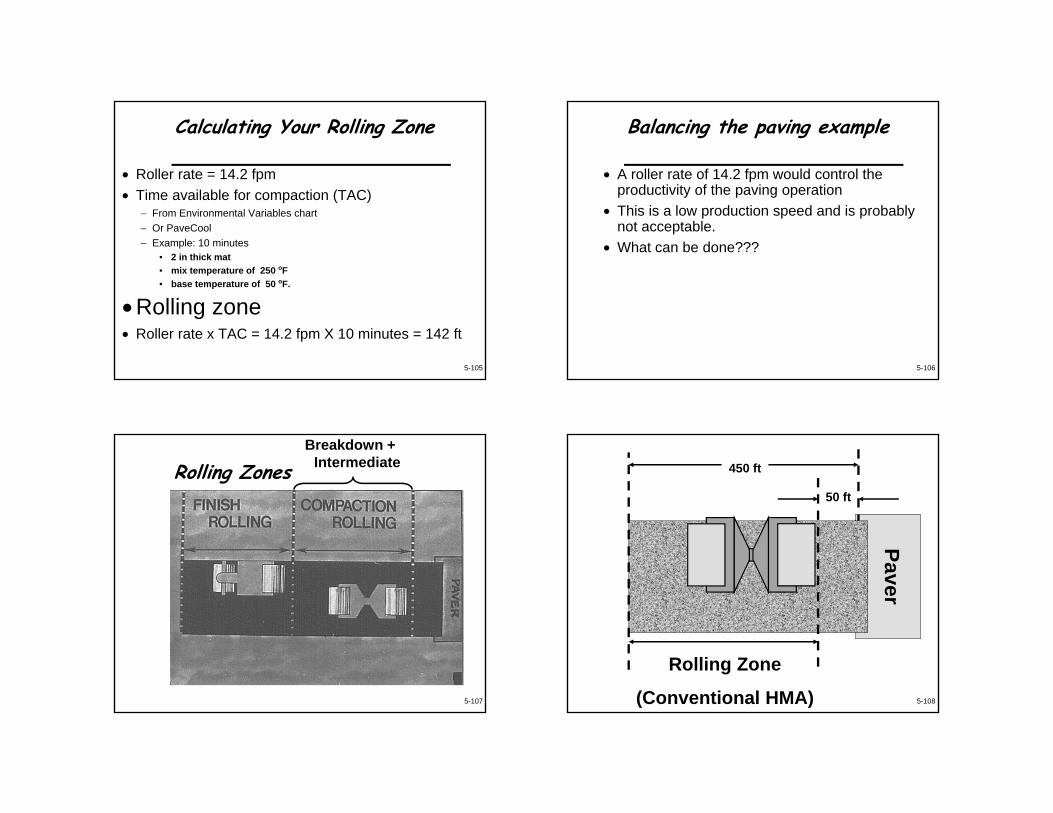
Interior Temperature
5-98
Improper Gauge Usage
5-99
Coring Topics
• Factors affecting compaction• Time available for compaction• Roller types• Roller operations• Roller pattern • Production rate• Roller maintenance
5-100
5-101
Balancing Production
Trucking
Compaction
Paving
HMA Facility
5-102
Rolling Zone
5-103
Calculating Your Rolling Zone(Vibratory roller)
• Estimate roller speed using frequency and impacts per foot:− Frequency = 2800 vpm− 12 impacts per foot− Roller speed = 2800/12 = 233.3 fpm (2.7 mph)
• Adjust for reversing factor− Roller speed*(1-reverse factor/100)− 13% reverse factor
• Effective roller speed = 233.3*(1-13/100) = 203 fpm
5-104
Calculating Your Rolling Zone
• Effective roller speed = 203 fpm• Effective Compaction Rate =
− Effective roller speed/(number of passes per coverage) − Number of passes for coverage
• 3 passes to cover• 3 coverages for density• 9 total passes
− Adjust for roller efficiency• Roller efficiency = 63%
• Effective compaction rate = 203/9*(63/100) = 14.2 fpm
5-105
Calculating Your Rolling Zone
• Roller rate = 14.2 fpm• Time available for compaction (TAC)
− From Environmental Variables chart − Or PaveCool− Example: 10 minutes
• 2 in thick mat • mix temperature of 250 oF• base temperature of 50 oF.
• Rolling zone• Roller rate x TAC = 14.2 fpm X 10 minutes = 142 ft
5-106
Balancing the paving example
• A roller rate of 14.2 fpm would control the productivity of the paving operation
• This is a low production speed and is probably not acceptable.
• What can be done???
5-107
Rolling ZonesBreakdown +
Intermediate
5-108
450 ft
50 ft
Rolling Zone
(Conventional HMA)
Paver
5-109
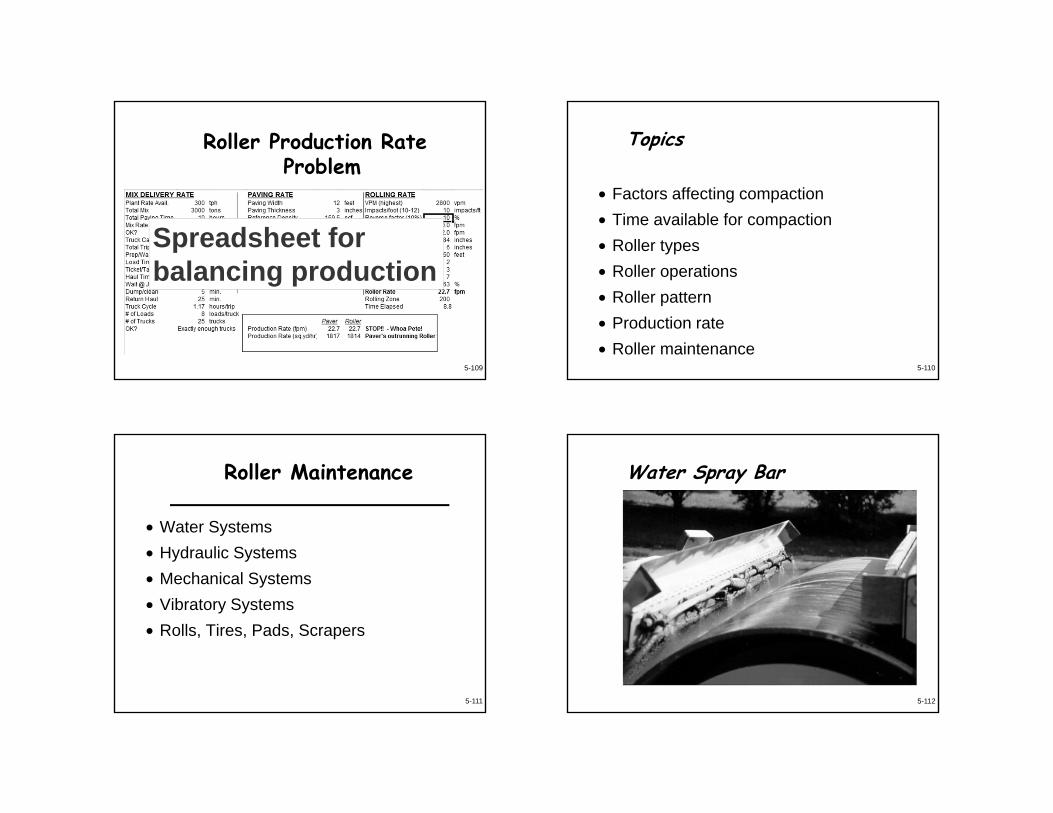
Roller Production Rate Problem
Spreadsheet for balancing production
Topics
• Factors affecting compaction• Time available for compaction• Roller types• Roller operations• Roller pattern • Production rate• Roller maintenance
5-110
5-111
Roller Maintenance
• Water Systems • Hydraulic Systems • Mechanical Systems • Vibratory Systems • Rolls, Tires, Pads, Scrapers
5-112
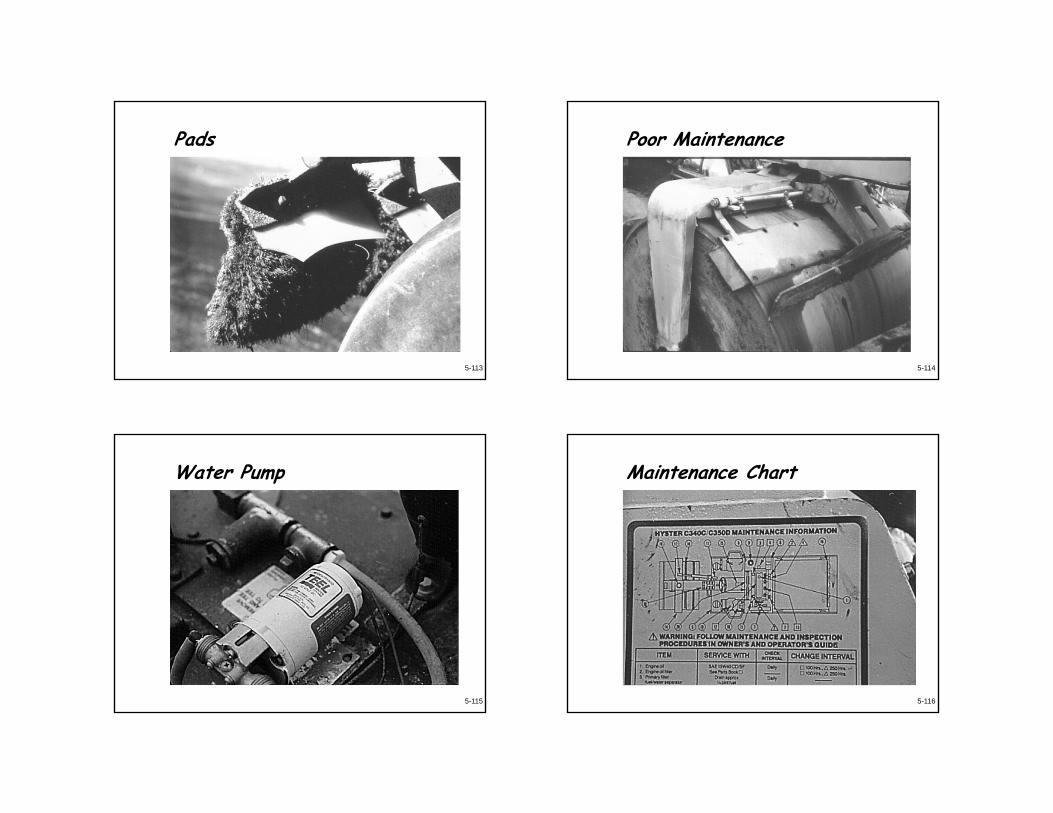
Water Spray Bar
5-113
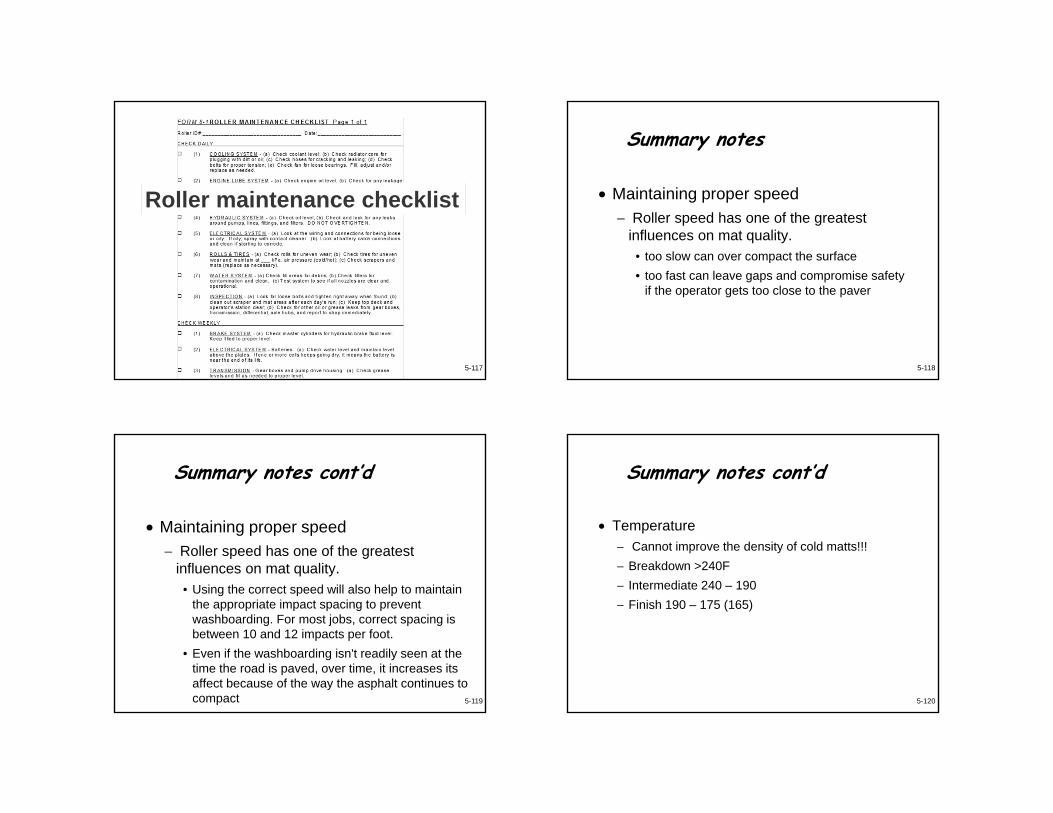
Pads
5-114
Poor Maintenance
5-115
Water Pump
5-116
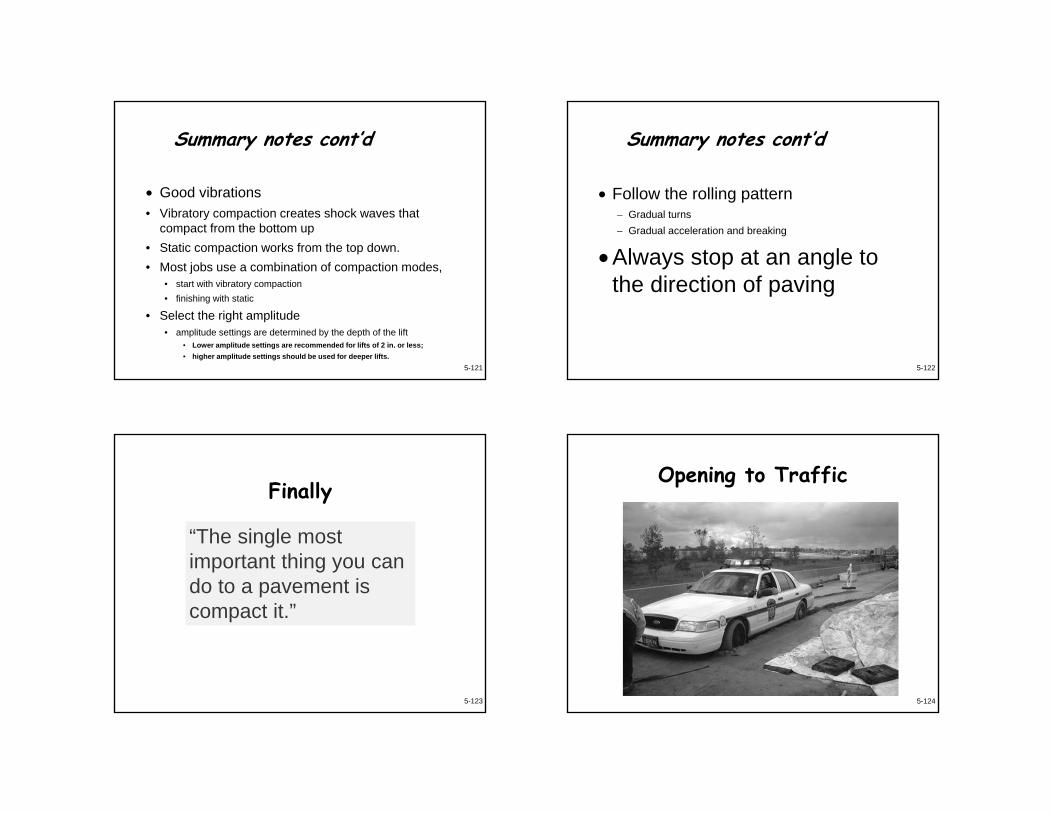
Maintenance Chart
5-117
Roller maintenance checklist
Summary notes
• Maintaining proper speed− Roller speed has one of the greatest
influences on mat quality. • too slow can over compact the surface• too fast can leave gaps and compromise safety
if the operator gets too close to the paver
5-118
Summary notes cont’d
• Maintaining proper speed− Roller speed has one of the greatest
influences on mat quality. • Using the correct speed will also help to maintain
the appropriate impact spacing to prevent washboarding. For most jobs, correct spacing is between 10 and 12 impacts per foot.
• Even if the washboarding isn't readily seen at the time the road is paved, over time, it increases its affect because of the way the asphalt continues to compact 5-119
Summary notes cont’d
• Temperature− Cannot improve the density of cold matts!!!− Breakdown >240F − Intermediate 240 – 190− Finish 190 – 175 (165)
5-120
Summary notes cont’d
• Good vibrations• Vibratory compaction creates shock waves that
compact from the bottom up• Static compaction works from the top down. • Most jobs use a combination of compaction modes,
• start with vibratory compaction• finishing with static
• Select the right amplitude• amplitude settings are determined by the depth of the lift
• Lower amplitude settings are recommended for lifts of 2 in. or less;• higher amplitude settings should be used for deeper lifts.
5-121
Summary notes cont’d
• Follow the rolling pattern− Gradual turns − Gradual acceleration and breaking
• Always stop at an angle to the direction of paving
5-122
5-123
Finally
“The single most important thing you can do to a pavement is compact it.”
5-124
Opening to Traffic
INSPECTOR’S DUTIES -ASPHALT PAVING
Modified by WVDOT/DOH,APAWV, and WVU ATP
6-1
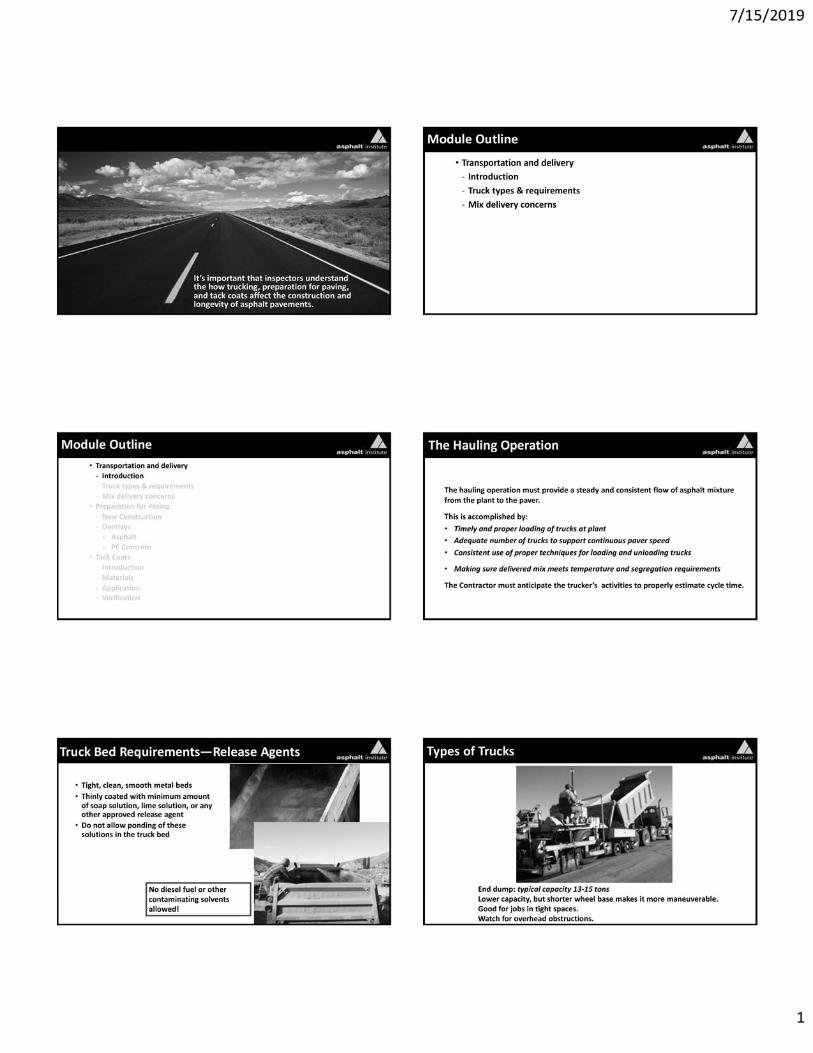
Work Includes…
Resurfacing Projects– State Funded– Federal Funded– Purchase Order
Paving
New Projects– New Roads– Bridge Approaches– Road Widening– Intersection
Improvements
6-2
Funding ProgramsState Funding– SLS – State and Local
service Routes (County Routes)
– Non-NHS State Routes
Federal Aid Funding(National Highway System)– Interstate– APD– Federal Aid Other
US routesState NHS routes
Inspector duties vary depending on the funding program, route, compaction method
6-3
Basic HMA ApplicationsBase Course – stone or HMA course placed above the subgrade or subbase of a road and helps to further distribute the load and improve the overall structure of the pavement section.– Marshall Base 1 and 2– Superpave Base 37.5, 25 and 19
Wearing Course – a single lift of constant thickness that is to be placed over the entire pavement surface and serves as the riding surface, receives the highest concentration of stress.– Marshall Wearing 1, 3, and 4 – Superpave 4.75, 9 and 12.5
6-4
Basic HMA Applications
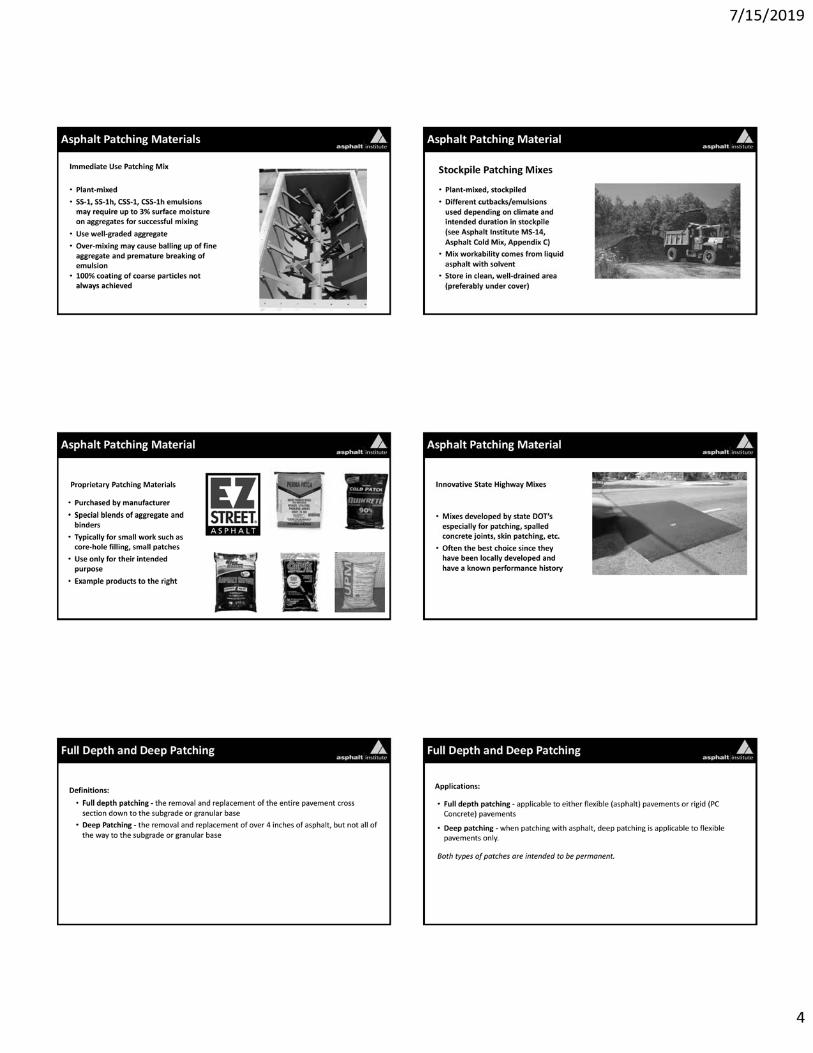
Patch & Level (P&L) – placed at various locations throughout the project to remove irregularities in the existing pavement, such as dips, or to raise the outside edge of pavement to improve the template prior to placing a base or wearing course.Scratch Course – a leveling course used for deviations less than an inch and can be placed over the entire length of the project.
6-5
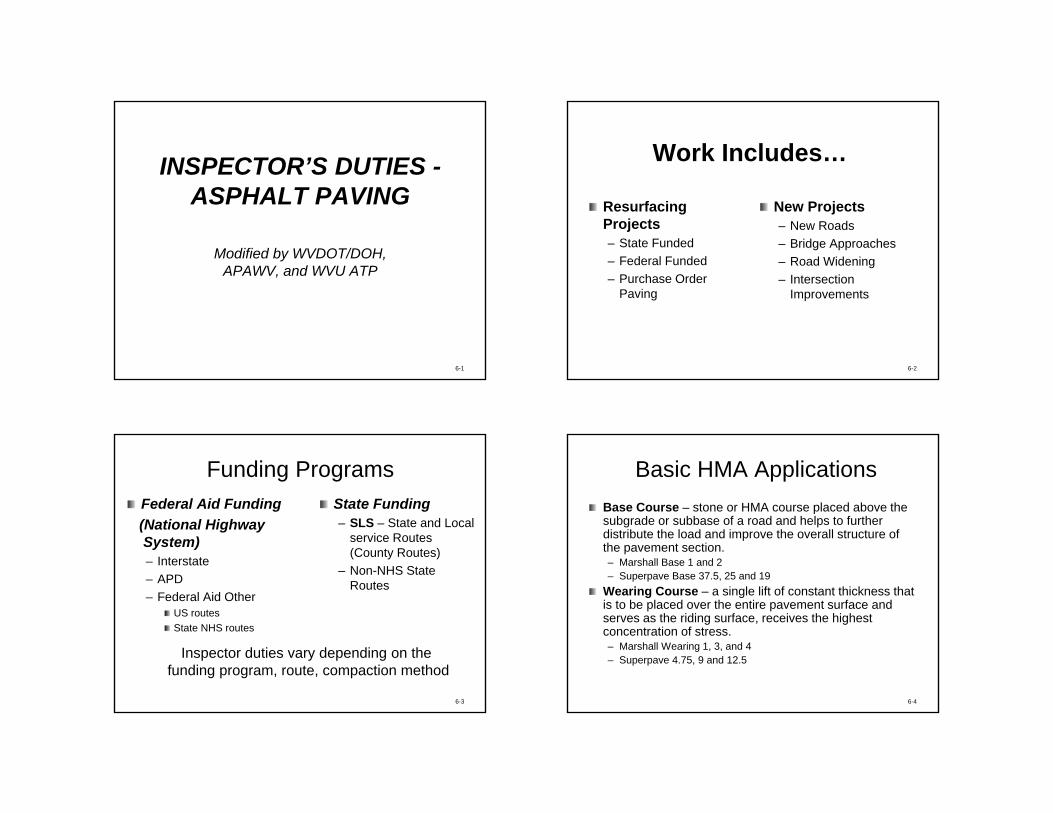
1.5” Overlay with paved shoulders
6-6
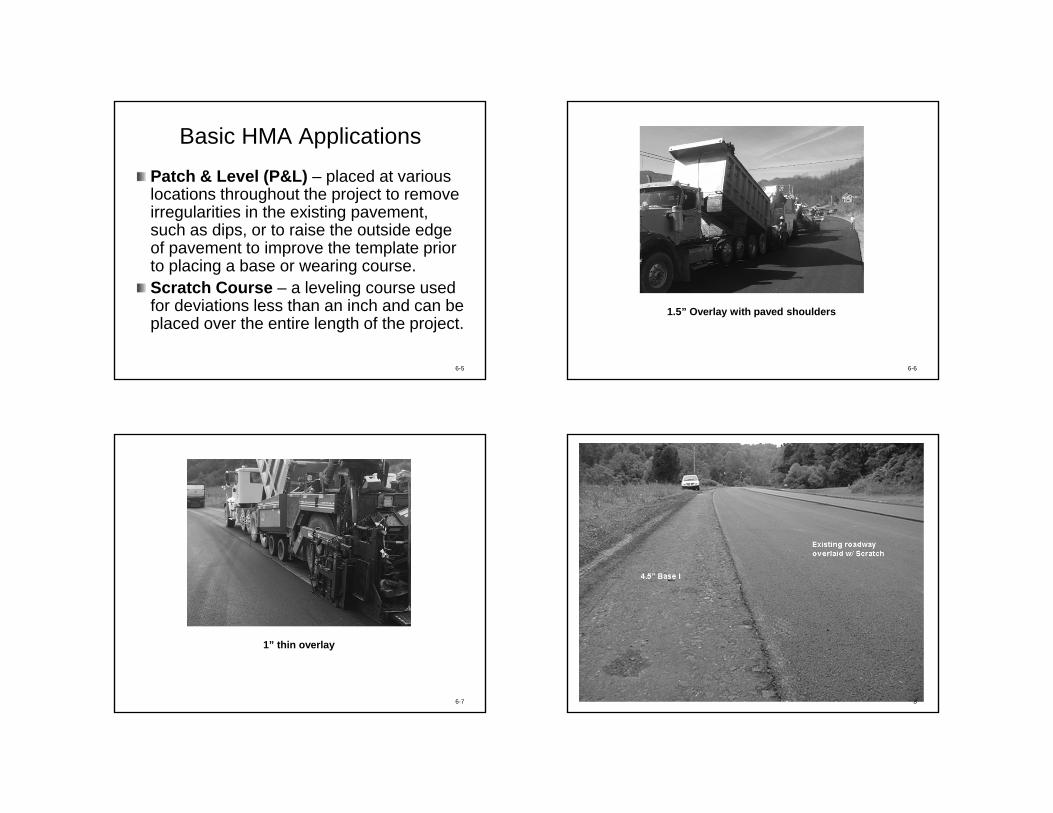
1” thin overlay
6-7 8
9
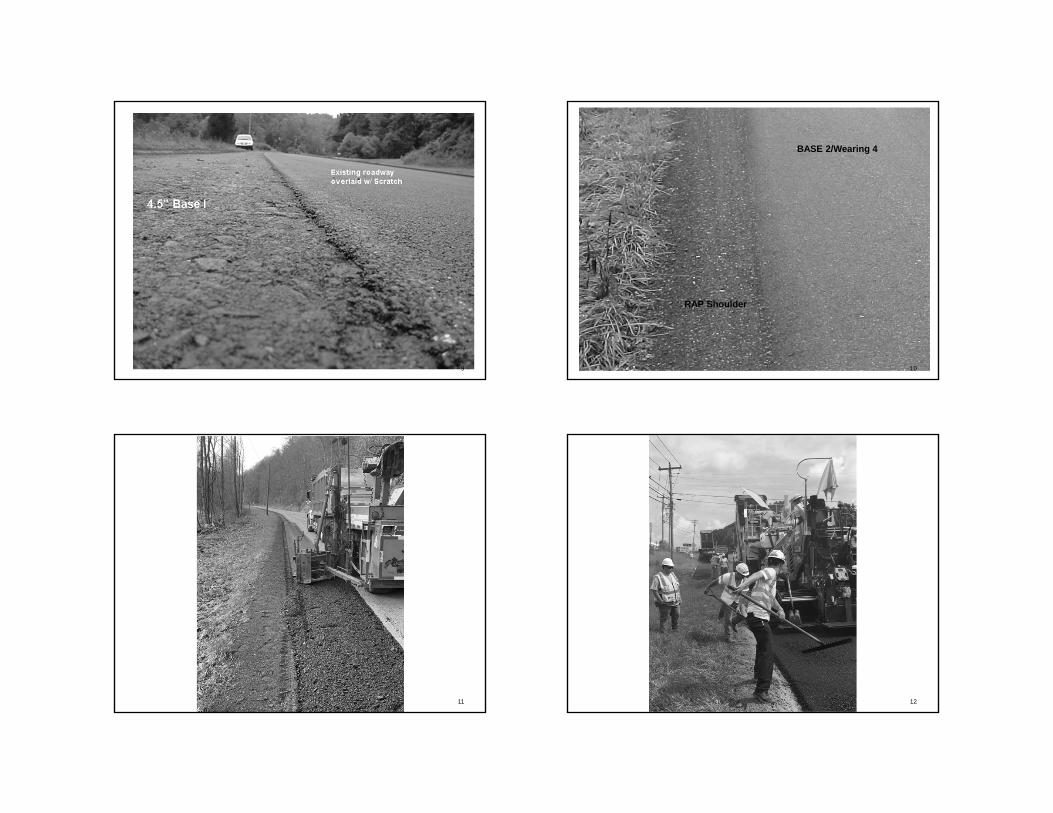
BASE 2/Wearing 4
RAP Shoulder
10
11 12
Activities Prior to and during Construction…
Bond and Insurance Checked – Issue NTPAll Requested Pertinent Paperwork– Key Personnel– EEO – DBE Plan for Participation– Waste and/or Borrow Pit Agreements (SHPO)– Pollution and Erosion Control Plan– QC Plan - Available? Approved?
Resurfacing Inspector may be requested to verify these items 6-13
Activities Prior to Construction…
Construction Layout– Staking the project– Mark Heel-ins– On larger projects this is usually included in
contractMaintenance Finished?– Have all pipes been placed, ditches pulled,
mowed, etcVerify Quantities In plans with Actual Field Measurements. 6-14
Verifying Quantities
Given road is 1 mile long and has an average width of 28’.Convert miles to lineal Ft (1 mile x 5280 ft/mi) End Station would be 52+805280 lf x 28 ft width = 147,840 sq ft.147,840 sq ft / 9= 16,426.67 SY
6-15
Approximate Rate and Lift Thickness
110 PSY = 1.0” Compacted (Stone or Gravel)165 PSY = 1.5” Compacted220 PSY = 2.0” Compacted
6-16

Verifying Quantities
16,426.67 SY x 165 lb/sy / 2000 lb/tn= 1355.20 tnHow much in each lanes?2 even wearing lanes1355.20 / 2= 677.6 tn each lane.
6-17
HMA Inspector’s Requirements
HMA Inspector has the same general duties regarding execution of the contract, but they do not have a field office. All forms, typicals, specs, etc. are kept in the “mobile field office.”Good Inspector can visualize the entire job from beginning to end– Foresee contract issues ahead of time so that
a plan of attack can be implemented right away
6-18
HMA Inspector’s Requirements
Generally needs to be trained in all aspects of materials and construction– Hot-mix Asphalt– PCC– Soils and Compaction– Environmental– Traffic Control
However, it is not a good idea to serve as the inspector and the Compaction Tech, etc.
6-19
HMA Inspector’s Requirements
Must have an understanding of the entire paving operation– Plant Operations– Hauling Limitations
Bridge Postings Truck weights
– Paving EquipmentPaver (Screed)Rollers
6-20
HMA Inspector’s Requirements
Materials and the JMF – Job Mix Formula (Approved Mix Design)– Temperature Range established for the mix– Maintain communication with the plant
inspector regarding other properties as wellMax DensityLab Number
– All mix designs are “Verified” at the beginning of each season
6-21
Night Work
More work is being done during night hours than in the past– Especially in congested areas on major routes– Everything is more difficult to inspect at night
Challenge the inspector faces is much greaterCooler temperatures can be a killer on compaction
6-22
Contractor’s RequirementsContractor should have an overall paving plan including…– Production Rate– Haul Distance– Number of Trucks
Properly staffed paving crew– Paving operator– Screed person– Broom– Compaction– Laborers
6-23
Contractor’s Requirements
On-site QC technician– Fully understands the process of density compliance
and the operation of a nuclear gaugeDo they know the difference between “Lot-by-lot” and “Rollerpass” testing?Are they capable of implementing the thin lift correction factors properly?
– Field Sampling Requirements for PWL– Good technician understands the limitations of the
JMF and has a general understanding of the nature of the specific mix
6-24
Inspector’s Daily Duties…
Traffic Control Check – need to maintain a good flow of traffic but maintain a SAFE WORKZONE.– Check all arrow boards and message boards, Type B
lights– Make sure flaggers understand the scope of traffic– Remember Night-time Limitations
Check Heel-insCheck surface conditionsTack Distributor – good conditionOther Equipment?
6-25
Inspector’s Daily Duties…
Collect tickets – JMF# and target density, truck weightsVerify Rollerpass or Lot-by-lotObserve mix characteristics – mat texture, segregation, flushing, contamination (Night-time!)Mat - screed setting and mat thicknessPaver must maintain a constant head of flow– Best to stop and start quickly
6-26
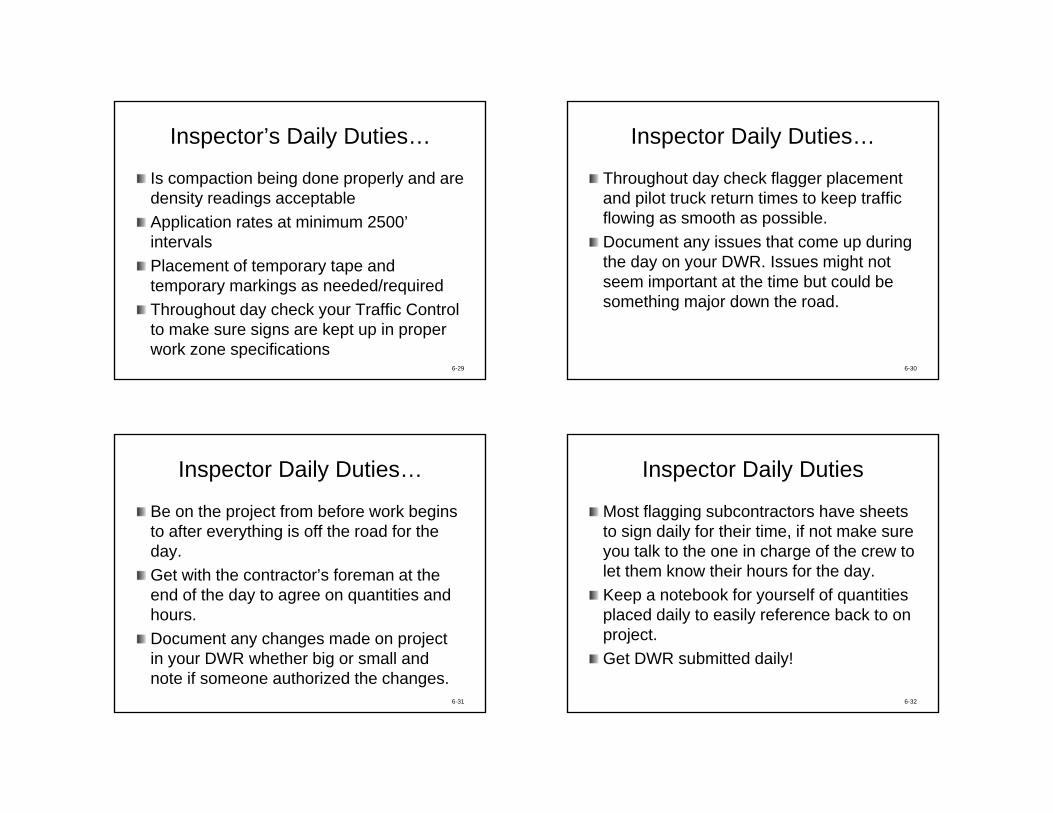
Contamination!!!
6-27
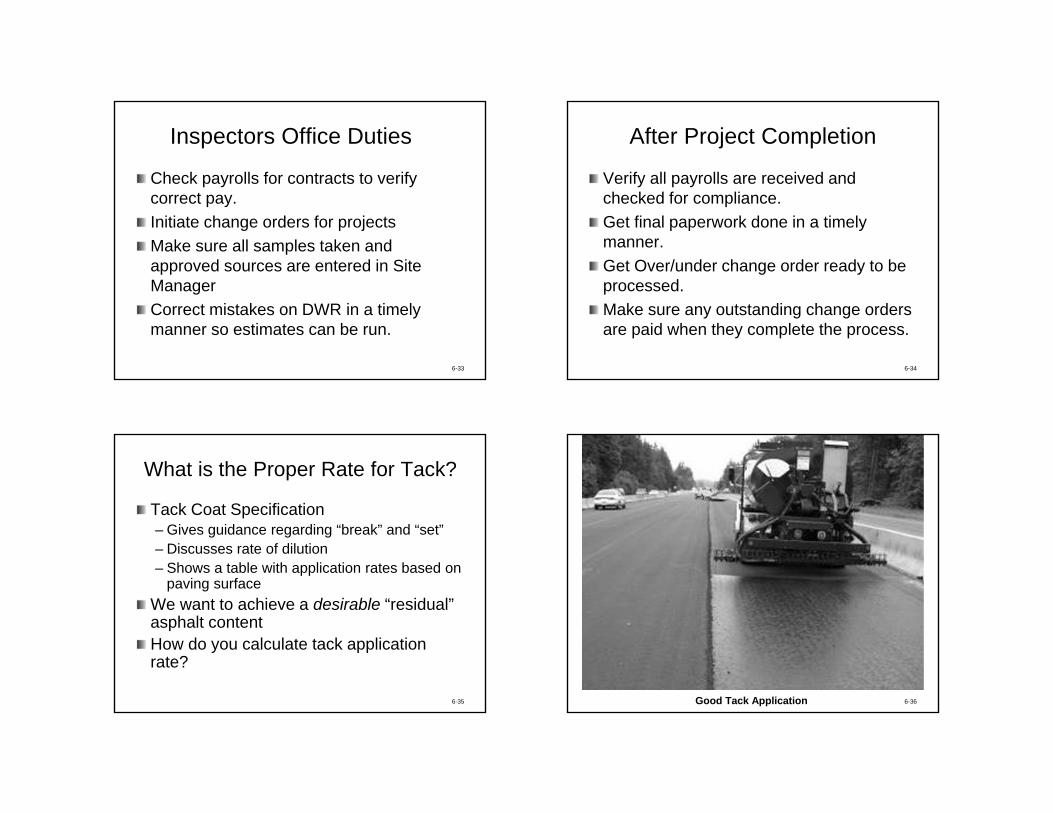
Contamination!!!
6-28
Inspector’s Daily Duties…
Is compaction being done properly and are density readings acceptableApplication rates at minimum 2500’ intervalsPlacement of temporary tape and temporary markings as needed/requiredThroughout day check your Traffic Control to make sure signs are kept up in proper work zone specifications
6-29
Inspector Daily Duties…
Throughout day check flagger placement and pilot truck return times to keep traffic flowing as smooth as possible. Document any issues that come up during the day on your DWR. Issues might not seem important at the time but could be something major down the road.
6-30
Inspector Daily Duties…
Be on the project from before work begins to after everything is off the road for the day. Get with the contractor’s foreman at the end of the day to agree on quantities and hours. Document any changes made on project in your DWR whether big or small and note if someone authorized the changes.
6-31
Inspector Daily Duties
Most flagging subcontractors have sheets to sign daily for their time, if not make sure you talk to the one in charge of the crew to let them know their hours for the day. Keep a notebook for yourself of quantities placed daily to easily reference back to on project.Get DWR submitted daily!
6-32
Inspectors Office Duties
Check payrolls for contracts to verify correct pay.Initiate change orders for projectsMake sure all samples taken and approved sources are entered in Site ManagerCorrect mistakes on DWR in a timely manner so estimates can be run.
6-33
After Project Completion
Verify all payrolls are received and checked for compliance. Get final paperwork done in a timely manner. Get Over/under change order ready to be processed. Make sure any outstanding change orders are paid when they complete the process.
6-34
What is the Proper Rate for Tack?
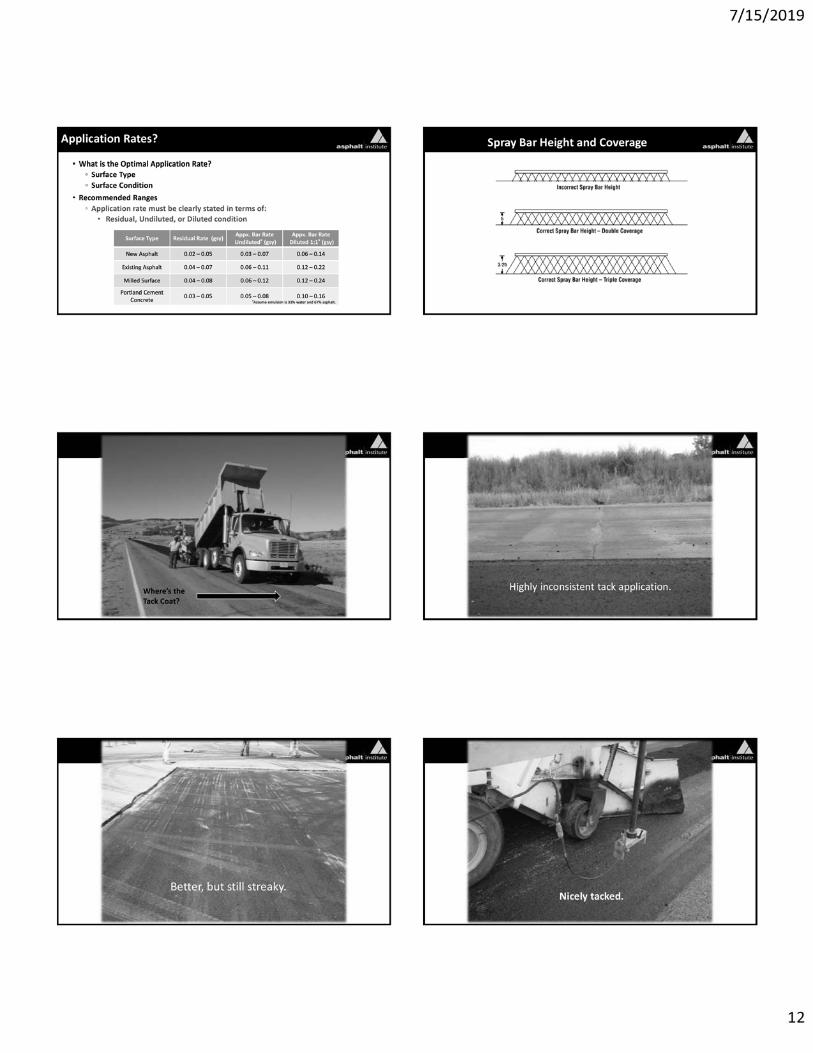
Tack Coat Specification– Gives guidance regarding “break” and “set”– Discusses rate of dilution– Shows a table with application rates based on
paving surfaceWe want to achieve a desirable “residual” asphalt contentHow do you calculate tack application rate?
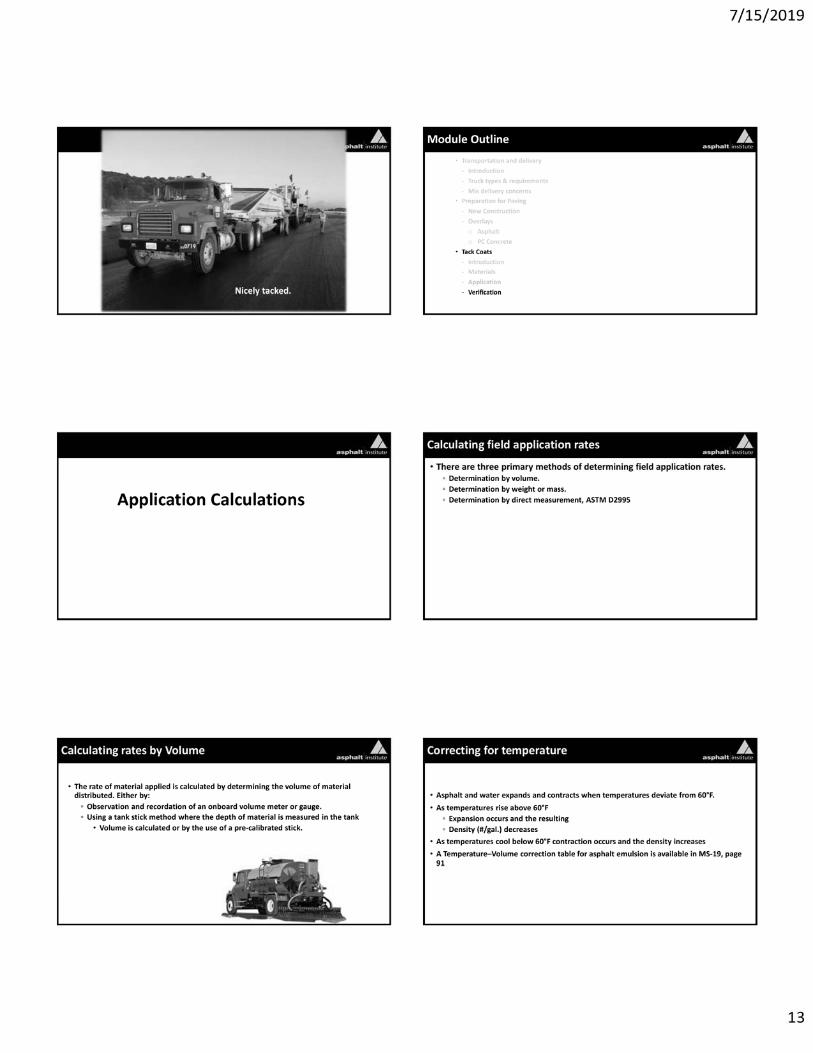
6-35 Good Tack Application 6-36
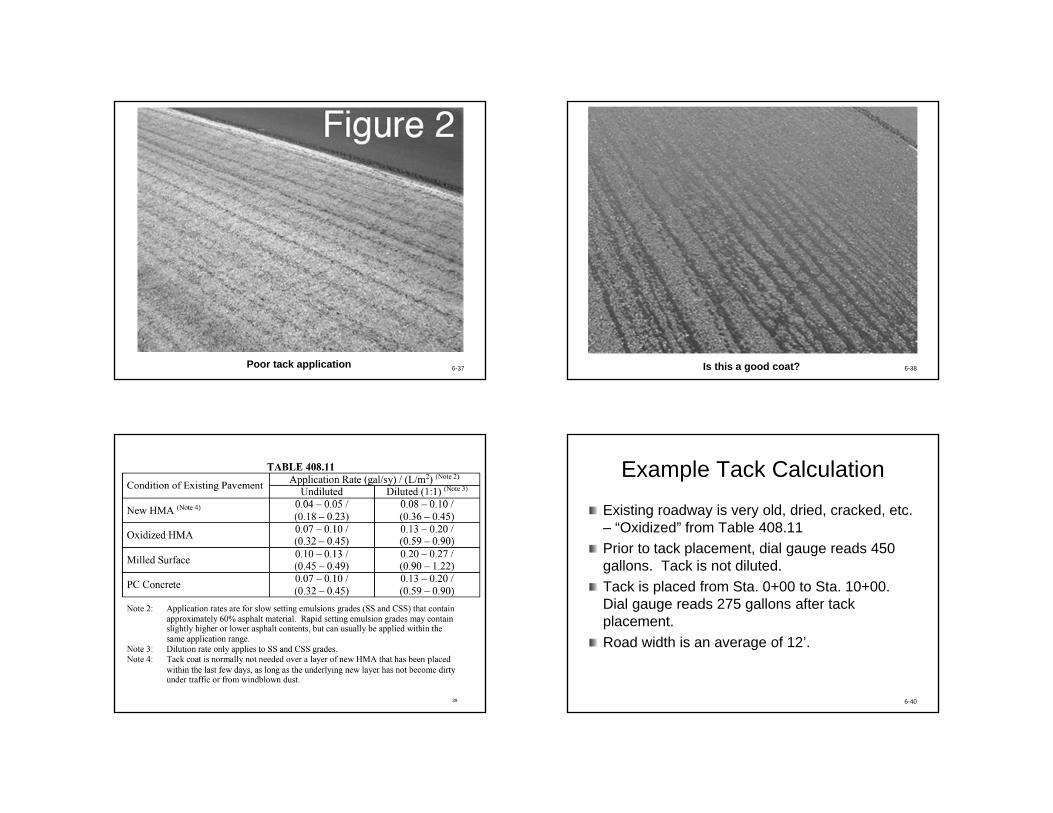
Poor tack application 6-37 Is this a good coat? 6-38
39
Example Tack Calculation
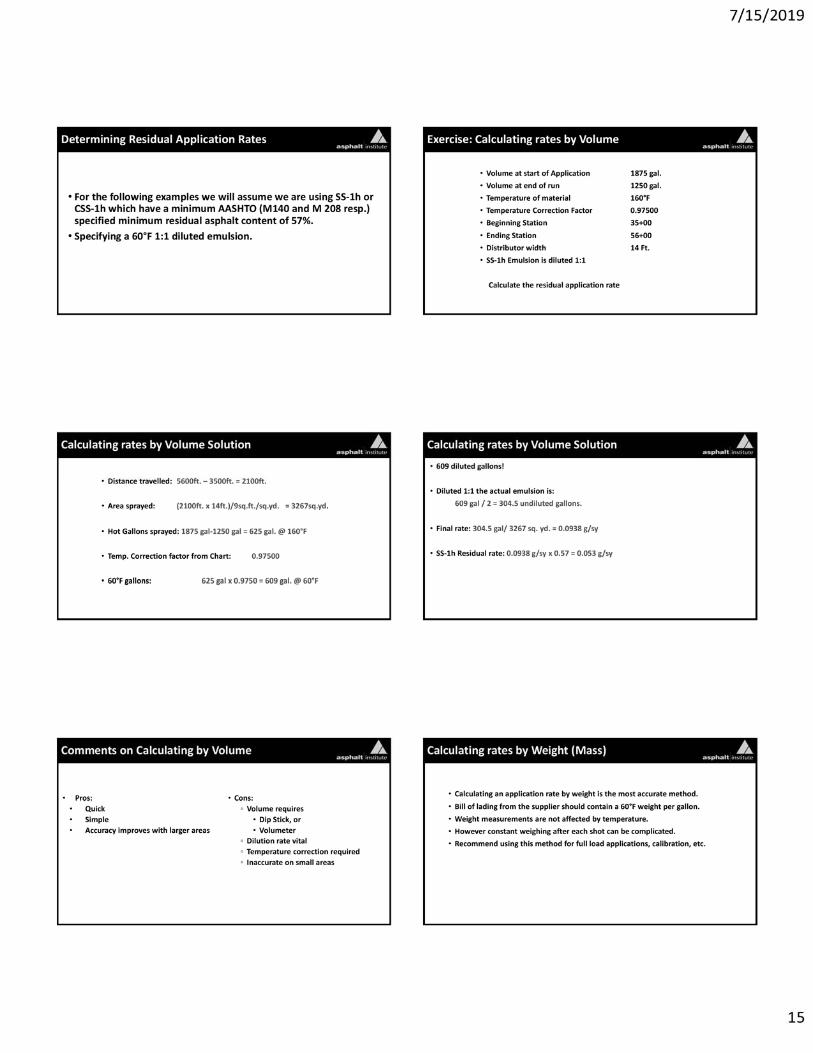
Existing roadway is very old, dried, cracked, etc. – “Oxidized” from Table 408.11Prior to tack placement, dial gauge reads 450 gallons. Tack is not diluted.Tack is placed from Sta. 0+00 to Sta. 10+00. Dial gauge reads 275 gallons after tack placement.Road width is an average of 12’.
6-40
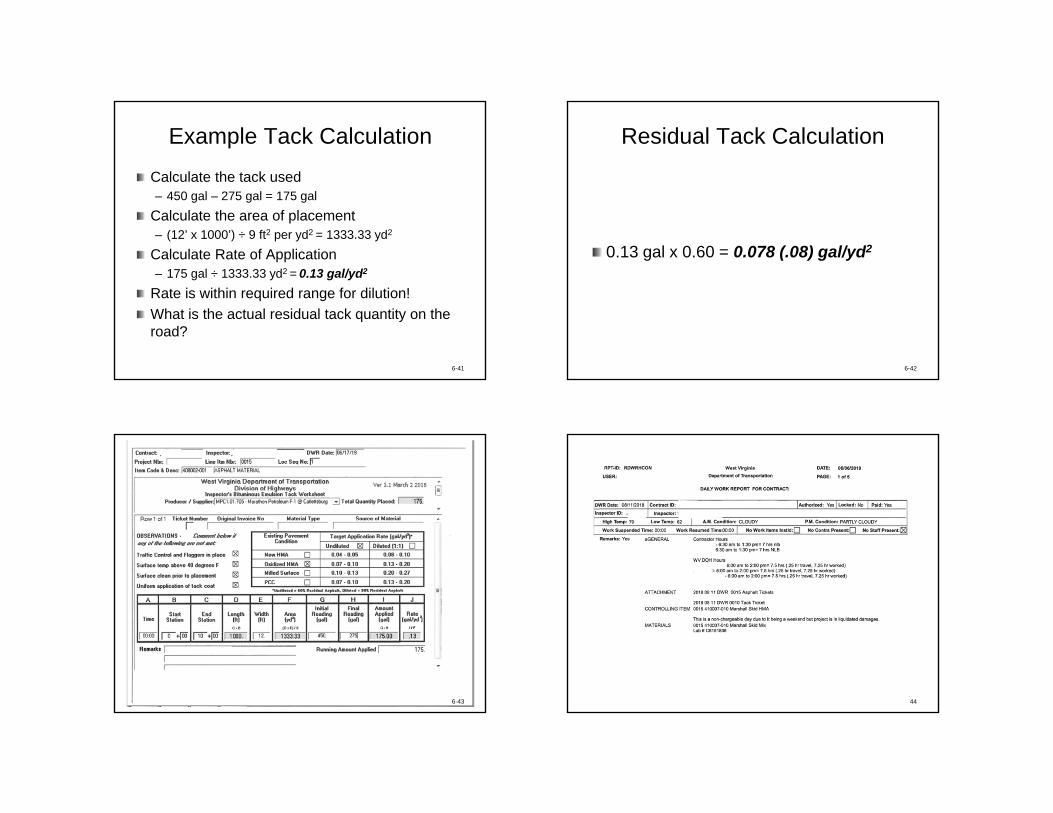
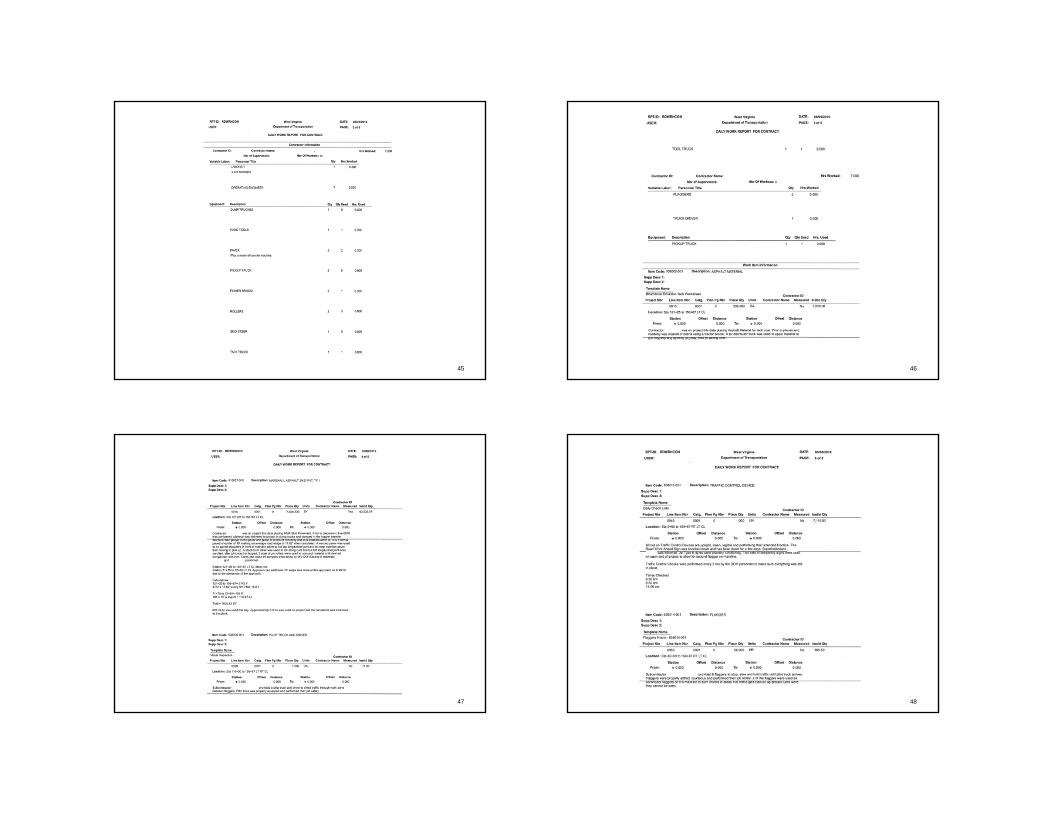
Example Tack Calculation
Calculate the tack used– 450 gal – 275 gal = 175 gal
Calculate the area of placement– (12’ x 1000’) ÷ 9 ft2 per yd2 = 1333.33 yd2
Calculate Rate of Application– 175 gal ÷ 1333.33 yd2 = 0.13 gal/yd2
Rate is within required range for dilution!What is the actual residual tack quantity on the road?
6-41
Residual Tack Calculation
0.13 gal x 0.60 = 0.078 (.08) gal/yd2
6-42
6-43 44
45 46
47 48
49 50
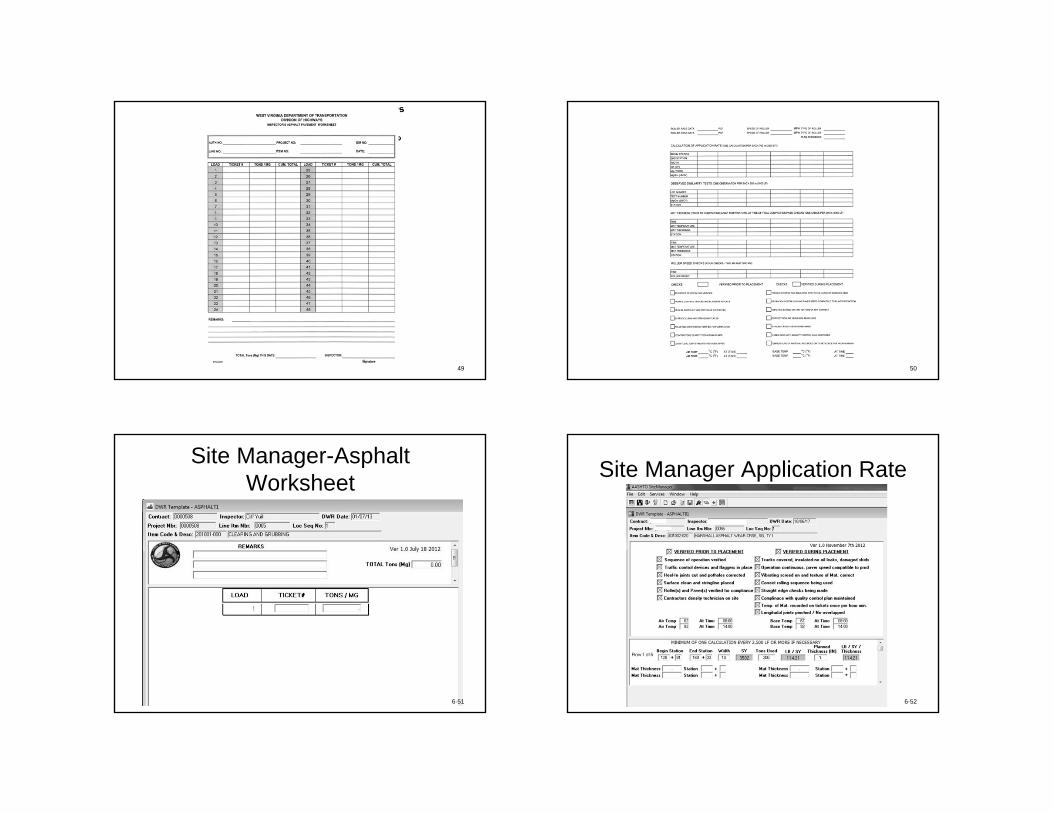
Site Manager-Asphalt Worksheet
6-51
Site Manager Application Rate
6-52

At the end of the day we want the same result.
6-53
?Any Questions???
6-54
Module 7
HMA Construction Program
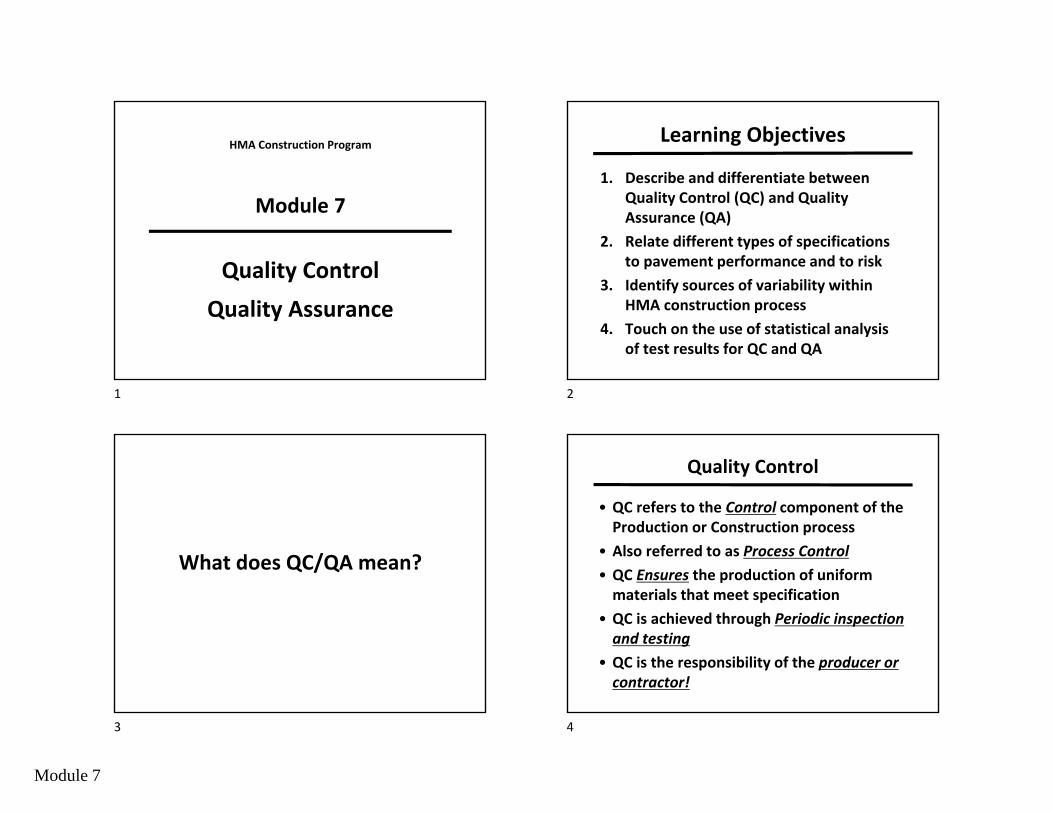
Module 7
Quality Control Quality Assurance
Learning Objectives
1. Describe and differentiate between Quality Control (QC) and Quality Assurance (QA)
2. Relate different types of specifications to pavement performance and to risk
3. Identify sources of variability within HMA construction process
4. Touch on the use of statistical analysis of test results for QC and QA
What does QC/QA mean?
Quality Control
• QC refers to the Control component of the Production or Construction process
• Also referred to as Process Control• QC Ensures the production of uniform
materials that meet specification• QC is achieved through Periodic inspection
and testing• QC is the responsibility of the producer or
contractor!
1 2
3 4
Module 7
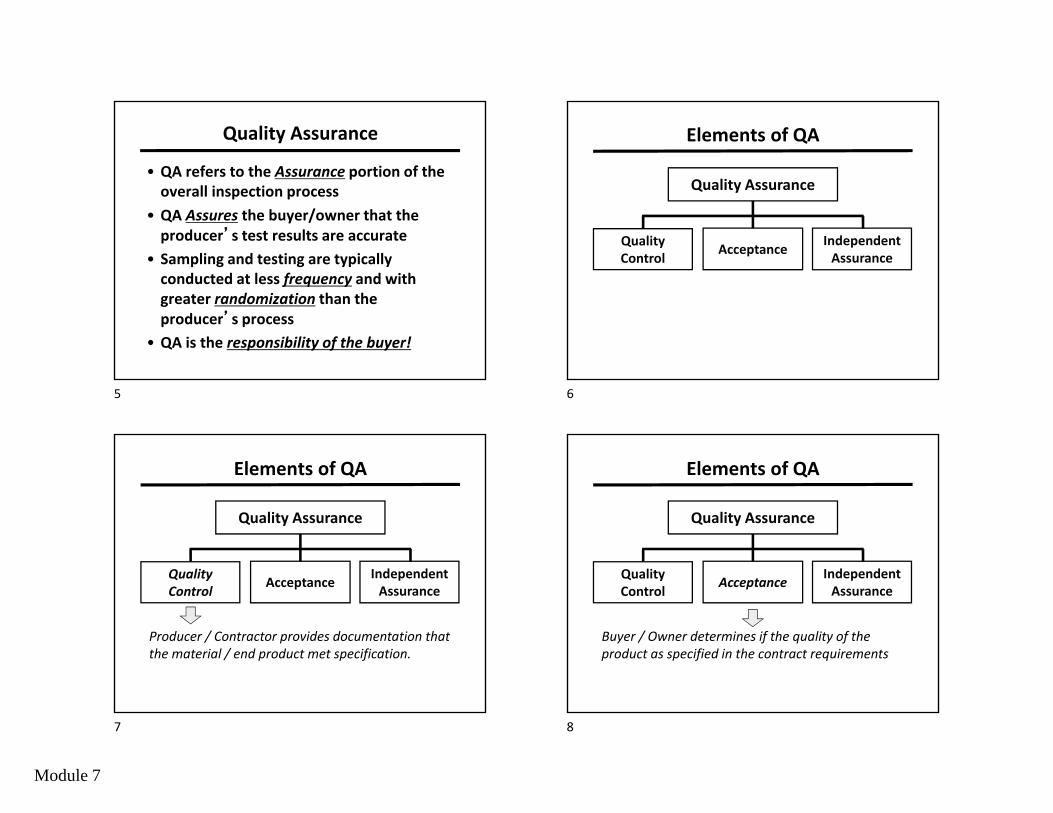
Quality Assurance
• QA refers to the Assurance portion of the overall inspection process
• QA Assures the buyer/owner that the producer’s test results are accurate
• Sampling and testing are typically conducted at less frequency and with greater randomization than the producer’s process
• QA is the responsibility of the buyer!
Quality Assurance
Elements of QA
QualityControl Acceptance Independent
Assurance
Quality Assurance
Elements of QA
QualityControl Acceptance Independent
Assurance
Producer / Contractor provides documentation that the material / end product met specification.
Quality Assurance
Elements of QA
QualityControl Acceptance Independent
Assurance
Buyer / Owner determines if the quality of the product as specified in the contract requirements
5 6
7 8

Module 7
Quality Assurance
Elements of QA
QualityControl Acceptance Independent
Assurance
Activities that combine to produce an unbiased and independent evaluation of all the sampling and testing procedures used in the acceptance program.
QA in Various Settings
Buyer/Owner Product
QCProcess
Accept-ance
IndependentAssurance
Individual New Car ? ? ?
Individual Fast Food
? ? ?
PublicAgency
Road-way
? ? ?
Specifications
• Types
• Relationship to performance
• Risk considerations
Types of Specifications
• Method (Recipe) Specifications
• End-Result Specifications
• QC / QA
• Performance Specifications
9 10
11 12
Module 7
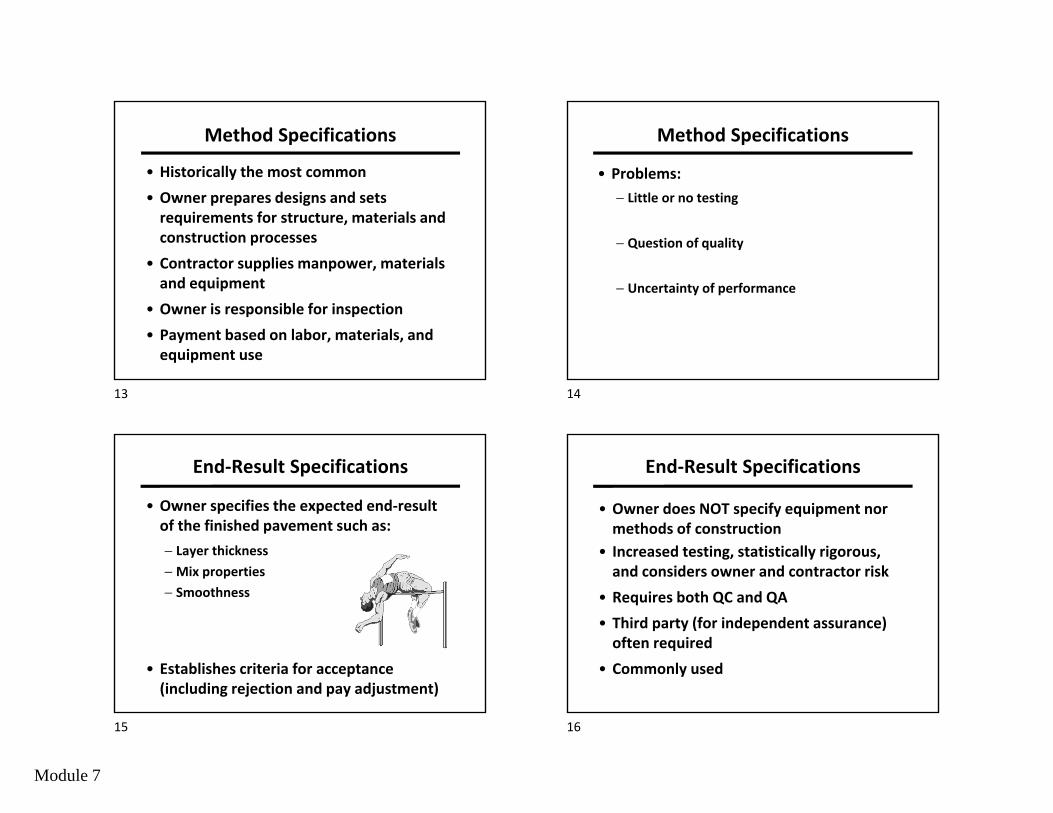
Method Specifications• Historically the most common • Owner prepares designs and sets
requirements for structure, materials and construction processes
• Contractor supplies manpower, materials and equipment
• Owner is responsible for inspection• Payment based on labor, materials, and
equipment use
Method Specifications
• Problems:− Little or no testing
− Question of quality
− Uncertainty of performance
End-Result Specifications
• Owner specifies the expected end-result of the finished pavement such as:− Layer thickness− Mix properties− Smoothness
• Establishes criteria for acceptance (including rejection and pay adjustment)
End-Result Specifications
• Owner does NOT specify equipment nor methods of construction
• Increased testing, statistically rigorous, and considers owner and contractor risk
• Requires both QC and QA• Third party (for independent assurance)
often required• Commonly used
13 14
15 16
Module 7
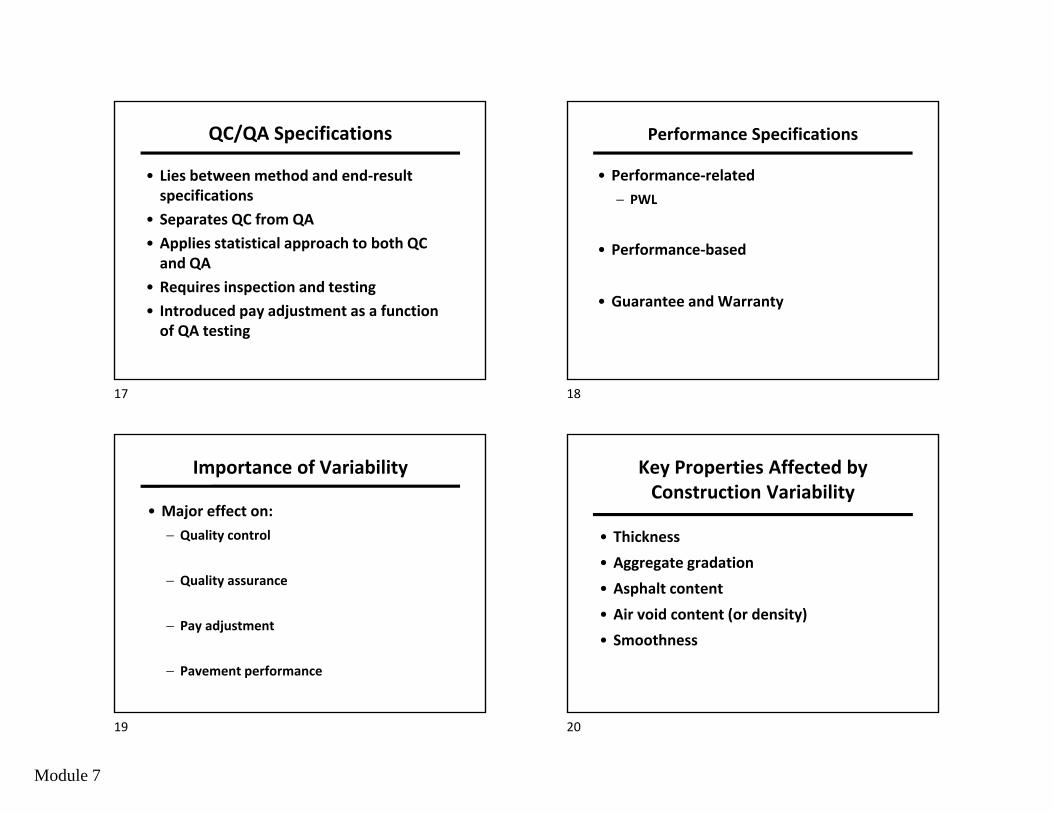
QC/QA Specifications
• Lies between method and end-result specifications
• Separates QC from QA• Applies statistical approach to both QC
and QA• Requires inspection and testing• Introduced pay adjustment as a function
of QA testing
Performance Specifications
• Performance-related− PWL
• Performance-based
• Guarantee and Warranty
Importance of Variability
• Major effect on:− Quality control
− Quality assurance
− Pay adjustment
− Pavement performance
Key Properties Affected by Construction Variability
• Thickness• Aggregate gradation• Asphalt content• Air void content (or density)• Smoothness
17 18
19 20
Module 7
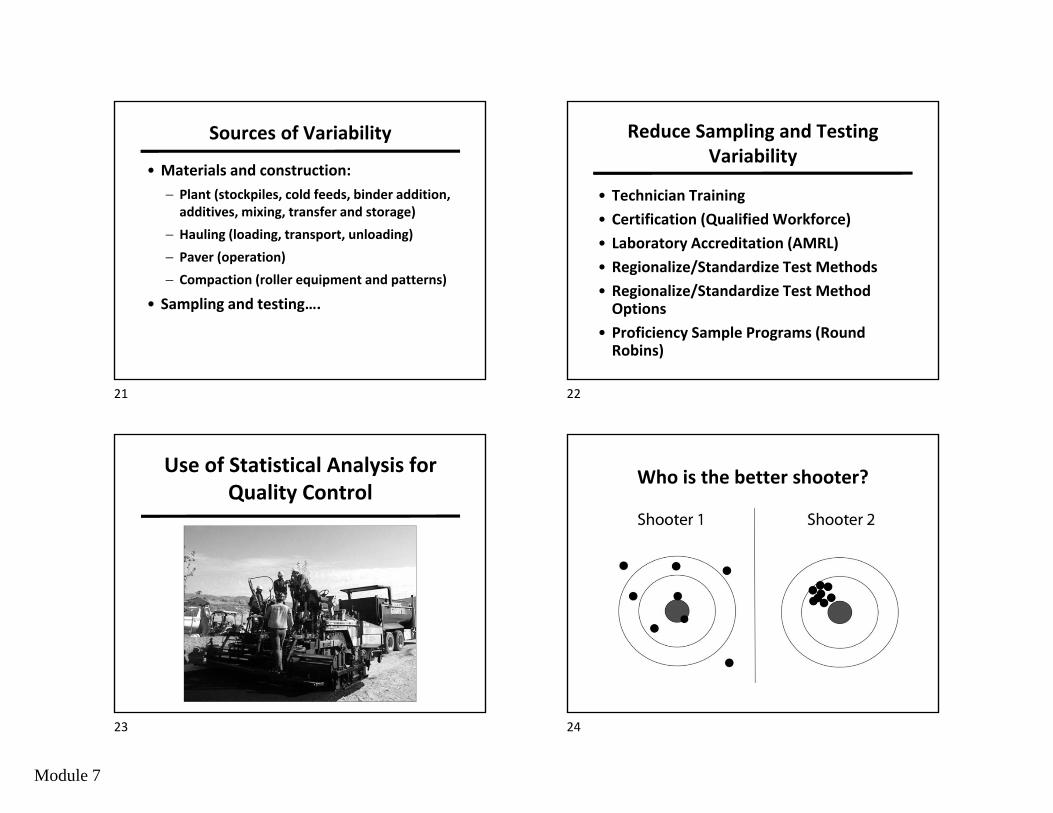
Sources of Variability
• Materials and construction:− Plant (stockpiles, cold feeds, binder addition,
additives, mixing, transfer and storage)− Hauling (loading, transport, unloading)− Paver (operation)− Compaction (roller equipment and patterns)
• Sampling and testing….
Reduce Sampling and Testing Variability
• Technician Training• Certification (Qualified Workforce)• Laboratory Accreditation (AMRL)• Regionalize/Standardize Test Methods• Regionalize/Standardize Test Method
Options • Proficiency Sample Programs (Round
Robins)
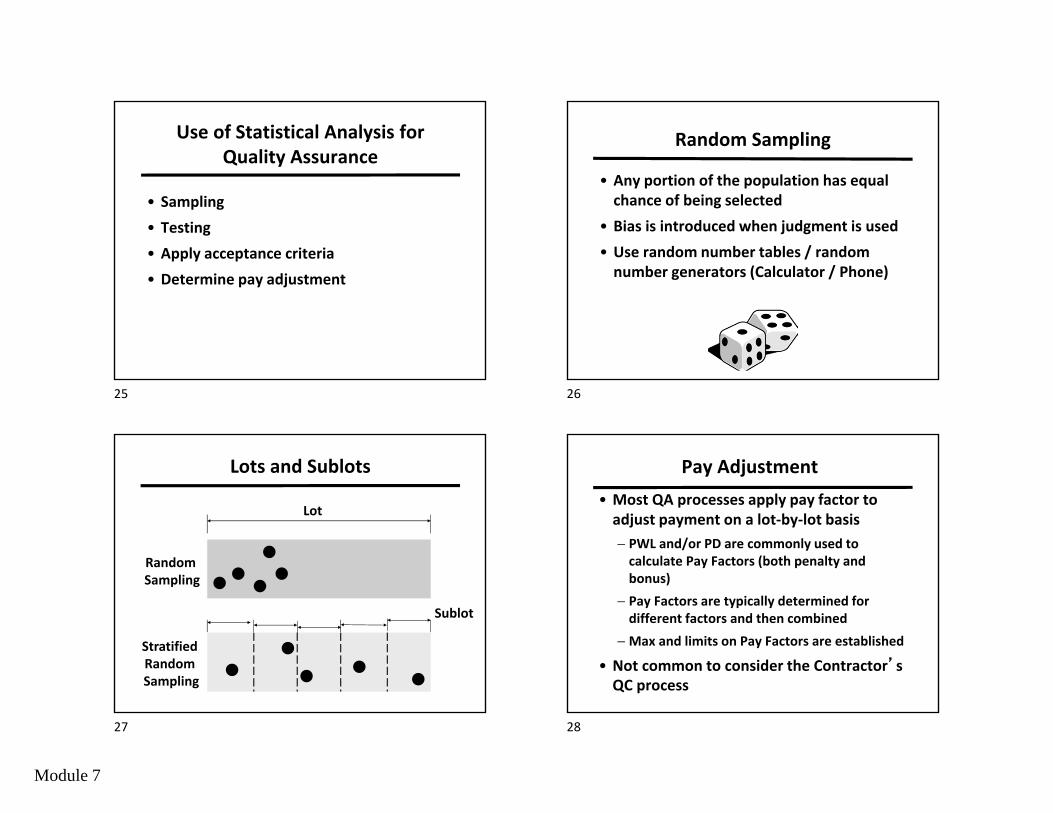
Use of Statistical Analysis for Quality Control
Who is the better shooter?
21 22
23 24
Module 7
Use of Statistical Analysis for Quality Assurance
• Sampling• Testing• Apply acceptance criteria• Determine pay adjustment
Random Sampling
• Any portion of the population has equal chance of being selected
• Bias is introduced when judgment is used• Use random number tables / random
number generators (Calculator / Phone)
Lots and Sublots
Lot
Sublot
Random Sampling
Stratified Random Sampling
Pay Adjustment• Most QA processes apply pay factor to
adjust payment on a lot-by-lot basis− PWL and/or PD are commonly used to
calculate Pay Factors (both penalty and bonus)
− Pay Factors are typically determined for different factors and then combined
− Max and limits on Pay Factors are established
• Not common to consider the Contractor’s QC process
25 26
27 28
Module 7
Summary1. Differentiate between Quality Control (QC) and
Quality Assurance (QA)- Who does QC? Who does QA?
2. Different types of specifications- Which is better? Most common in WV?
3. Sources of variability within HMA construction process
- Materials? Construction?
Questions?
29 30

Module 8
Module 8
Gauge Compaction Density Testing
Objectives :401 Compaction Overview
Gauge Comparisons
Lot by Lot - Random LocationsContractor Quality Control/AcceptanceDOH Quality Assurance/Verification
Roller Pass Method
MP 401.05.20Section 401 – 2019 Supplemental Specs.
Troxler 3400 Series Nuclear Gauges
Asphalt Layer
Density SourceCesium 137
DensityDetector Tubes
SCALER ENDFRONT
Backscatter Position
Paving Direction
Gauge Common SenseDO NOT OPERATE NEAR :Large metal objectsEquipmentCulvertsPower lines
Other gauges (minimum of 30 feet)
KEEP GAUGE DRY : Cover control panel if possible
1 2
3 4
Module 8
Good contact between Gauge and Surface
Fill Voids- Dry Mortar Sand - Silica Sand
Remove Excess
Gauge Operation Gauge in Position
Paving Direction
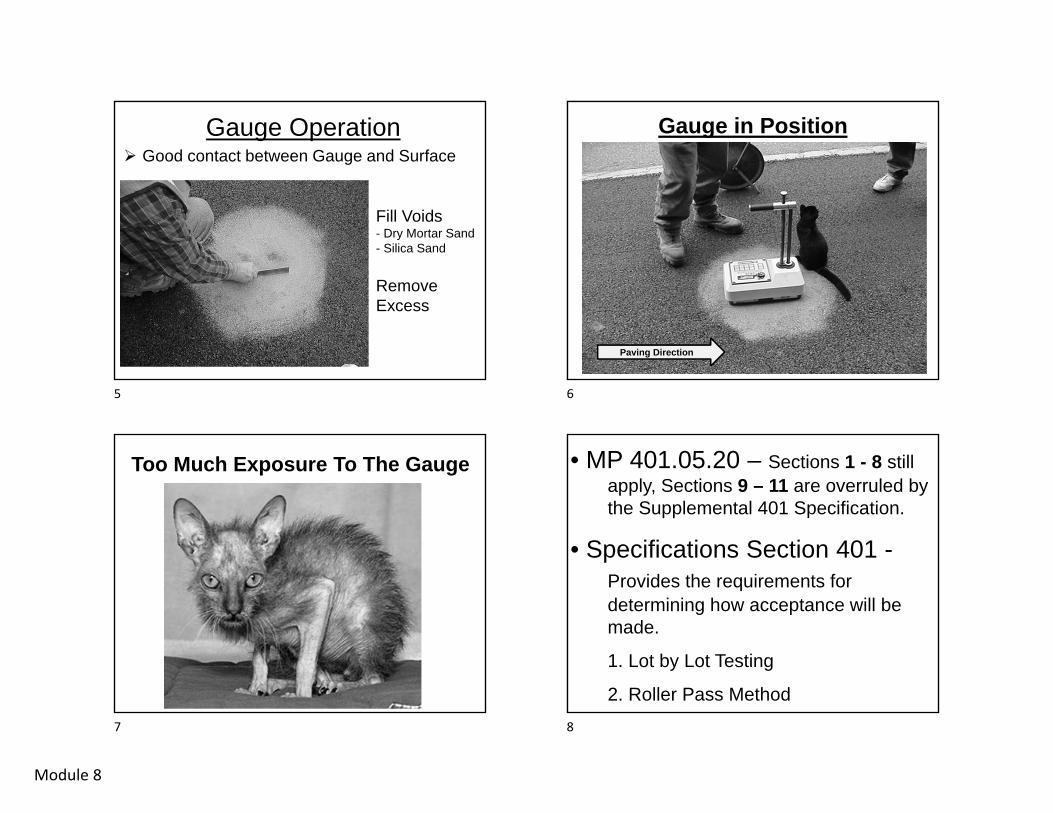
Too Much Exposure To The Gauge • MP 401.05.20 – Sections 1 - 8 still apply, Sections 9 – 11 are overruled by the Supplemental 401 Specification.
• Specifications Section 401 -Provides the requirements for determining how acceptance will be made.
1. Lot by Lot Testing
2. Roller Pass Method
5 6
7 8
Module 8
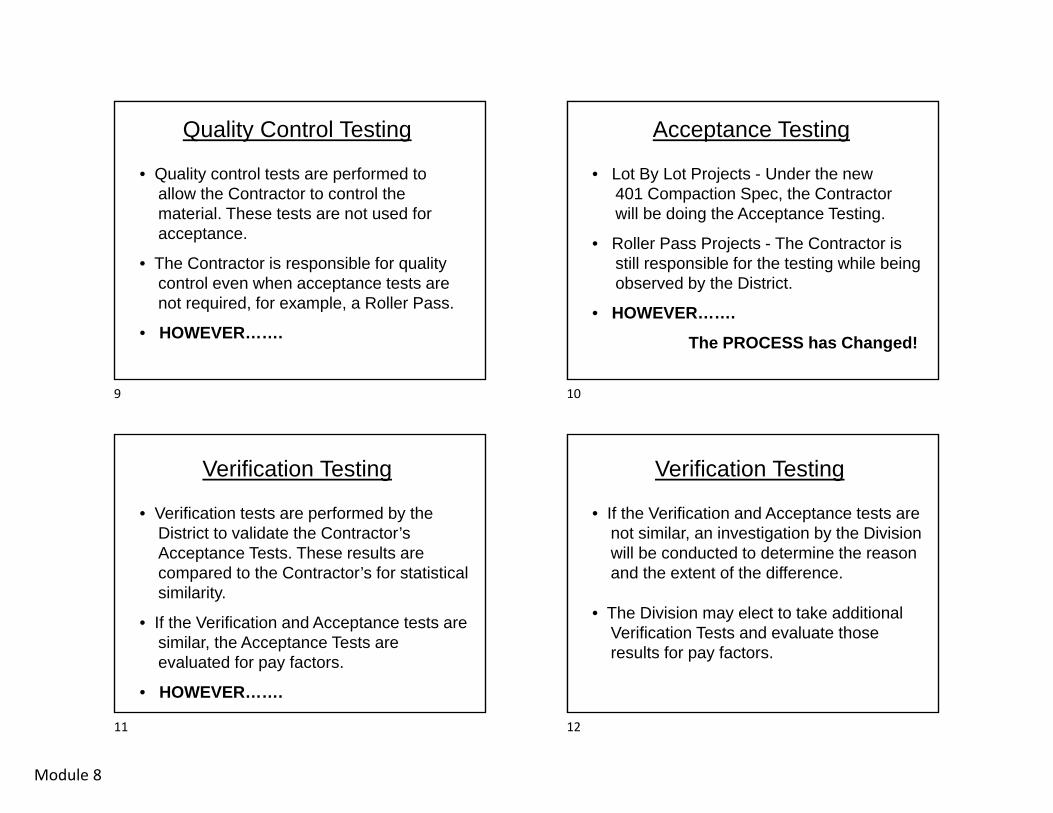
Quality Control Testing
• Quality control tests are performed to allow the Contractor to control the material. These tests are not used for acceptance.
• The Contractor is responsible for quality control even when acceptance tests are not required, for example, a Roller Pass.
• HOWEVER…….
Acceptance Testing
• Lot By Lot Projects - Under the new 401 Compaction Spec, the Contractor will be doing the Acceptance Testing.
• Roller Pass Projects - The Contractor is still responsible for the testing while being observed by the District.
• HOWEVER…….
The PROCESS has Changed!
Verification Testing
• Verification tests are performed by the District to validate the Contractor’s Acceptance Tests. These results are compared to the Contractor’s for statistical similarity.
• If the Verification and Acceptance tests are similar, the Acceptance Tests are evaluated for pay factors.
• HOWEVER…….
Verification Testing
• If the Verification and Acceptance tests are not similar, an investigation by the Division will be conducted to determine the reason and the extent of the difference.
• The Division may elect to take additional Verification Tests and evaluate those results for pay factors.
9 10
11 12

Module 8
Lots and Sublots
Lot
Sublot
Random Sampling
Stratified Random Sampling
Station Numbers
• Common way of tracking longitudinal distance on Projects
• The “ + “ Sign is simply a place holder –just like the comma in 10,000
• Beginning of Project (BOP) = 0+00
• End of Project (EOP) = 144+25 (Example)
• 144+25 = 14,425 Feet
Offsets
• Common way of tracking left & right distance on Projects
• On Paving Projects, typically measured from the centerline or the center joint
• Never test on the edge of the pavement –pull the gauge 1’ in away from the edge
• Offsets for Joint Testing with the gauge are always 4 inches
Site 5
Site 4
Site 3
Site 2
Site 1
15 ft.
1500ft
21+00
18+00
Ending
30+00
27+00
24+00
15+00Beginning
1500 / 5 = 300
Lot = 1500 ft.5 sub lots in a lot
Each sub lot or test site willrepresent300 ft.
15+003+00
18+00
18+003+00
21+00
21+003+00
24+00
24+003+00
27+00
27+003+00
30+00
CL
13 14
15 16
Module 8
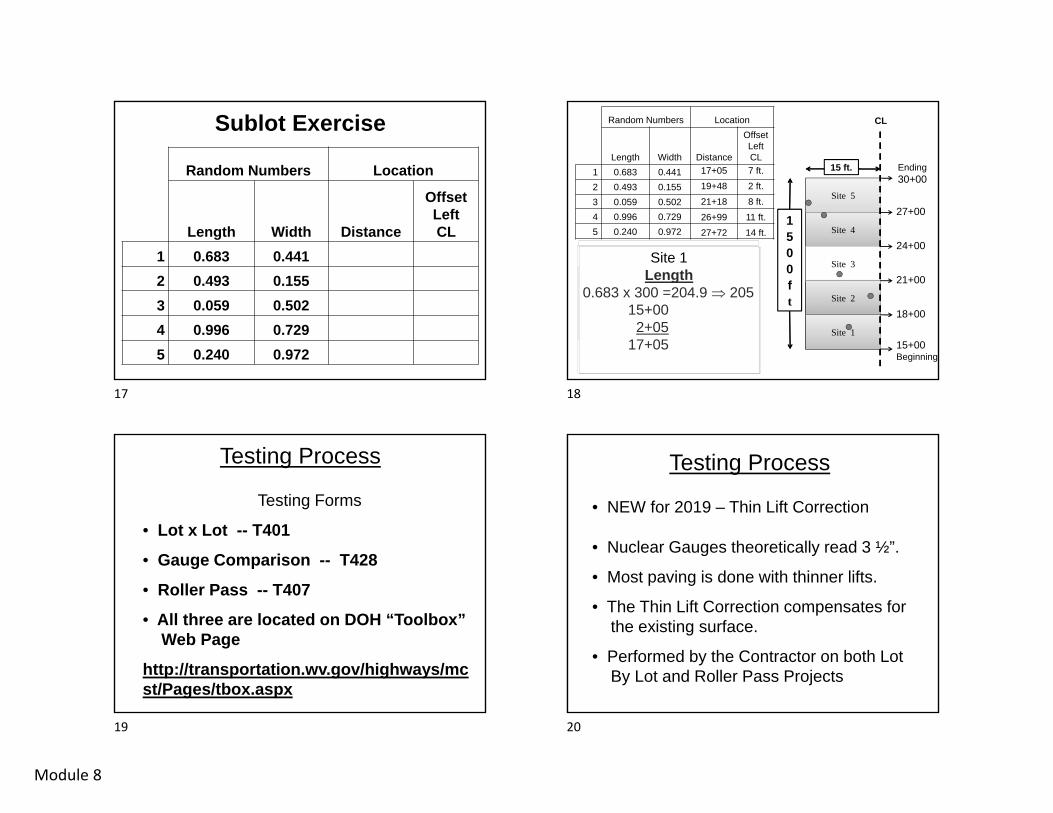
Sublot Exercise
Random Numbers Location
Length Width Distance
OffsetLeft CL
1 0.683 0.4412 0.493 0.1553 0.059 0.5024 0.996 0.7295 0.240 0.972
Site 2Length
0.493 x 300 =147.9 14818+001+48
19+48
Site 3Length
0.059 x 300 =17.7 1821+000+18
21+18
Site 4Length
0.996 x 300 =298.8 29924+002+99
26+99
Site 5Length
0.240 x 300 =72.0 7227+000+72
27+72
Site 5Width
0.972 x 15 = 14.6 15
Site 4Width
0.729 x 15 = 10.9 11
Site 3Width
0.502 x 15 = 7.5 8
Site 2Width
0.155 x 15 = 2.3 2
Site 5
Site 4
Site 3
Site 2
Site 1
15 ft.
1500ft
21+00
18+00
Ending30+00
27+00
24+00
15+00Beginning
Random Numbers Location
Length Width Distance
OffsetLeft CL
1 0.683 0.4412 0.493 0.1553 0.059 0.5024 0.996 0.7295 0.240 0.972
Site 1Width
0.441 x 15 = 6.6 7
17+05 7 ft.
Site 1Length
0.683 x 300 =204.9 20515+002+05
17+05
CL
19+48
21+18
26+9927+72
2 ft.
11 ft.
8 ft.
14 ft.
Testing Process
Testing Forms
• Lot x Lot -- T401
• Gauge Comparison -- T428
• Roller Pass -- T407
• All three are located on DOH “Toolbox” Web Page
http://transportation.wv.gov/highways/mcst/Pages/tbox.aspx
Testing Process
• NEW for 2019 – Thin Lift Correction
• Nuclear Gauges theoretically read 3 ½”.
• Most paving is done with thinner lifts.
• The Thin Lift Correction compensates for the existing surface.
• Performed by the Contractor on both Lot By Lot and Roller Pass Projects
17 18
19 20
Module 8
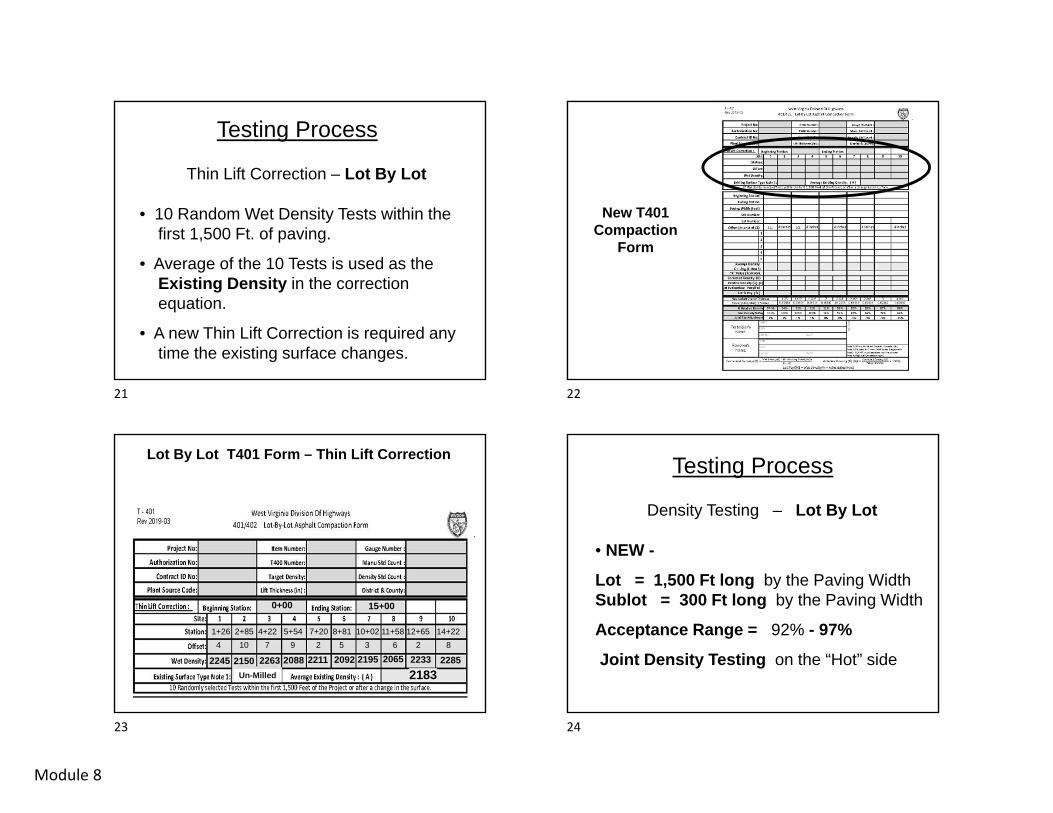
Testing Process
Thin Lift Correction – Lot By Lot
• 10 Random Wet Density Tests within the first 1,500 Ft. of paving.
• Average of the 10 Tests is used as the Existing Density in the correction equation.
• A new Thin Lift Correction is required any time the existing surface changes.
New T401 Compaction
Form
Lot By Lot T401 Form – Thin Lift Correction
2245 2150 2263 2088 2211 2092 2195 2065 2233 22852183
0+00 15+00
MilledScratchConcreteUn-Milled
1+26 2+85 4+22 5+54 7+20 8+81 10+02 11+58 12+65 14+22 4 10 7 9 2 5 3 6 2 8
Testing Process
Density Testing – Lot By Lot
• NEW -
Lot = 1,500 Ft long by the Paving Width Sublot = 300 Ft long by the Paving Width
Acceptance Range = 92% - 97%
Joint Density Testing on the “Hot” side
21 22
23 24

Module 8
Testing Process
Density Testing – Lot By Lot
• 5 Random 1 Minute Wet Density Tests per Lot as per MP 712.21.26.
• Average of the 5 Tests is used as the Average Density in the correction equation.
• NEW – Calculate The Corrected Density.
Proposed New T401
Compaction Form
Lot By Lot T401 Form – Density Testing
2305
2310
2317
2298
2321
2242
2255
2258
2233
2235
2310
Target Density 2477
2245
Average Density in the correction equation.
Proposed New T401
Compaction Form
25 26
27 28
Module 8
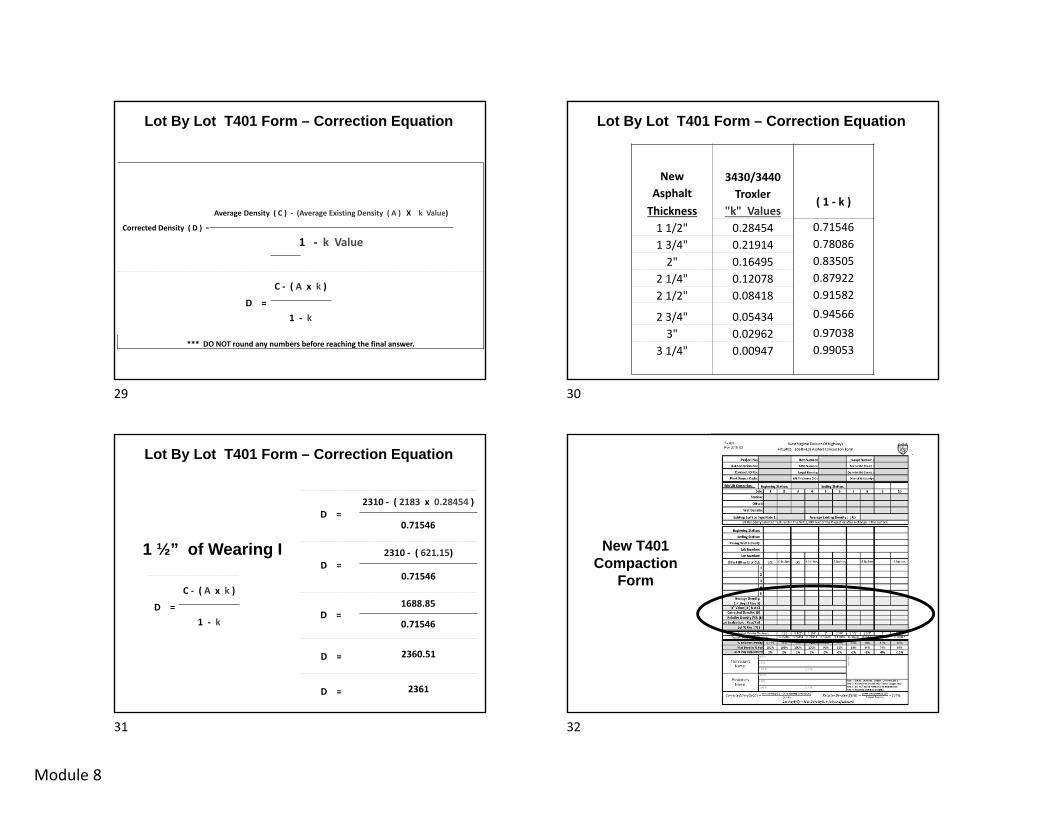
Lot By Lot T401 Form – Correction Equation
Average Density ( C ) - (Average Existing Density ( A ) X k Value)
Corrected Density ( D ) =
1 - k Value
C - ( A x k ) D =
1 - k
*** DO NOT round any numbers before reaching the final answer.
Lot By Lot T401 Form – Correction Equation
New 3430/3440Asphalt Troxler ( 1 - k )
Thickness "k" Values1 1/2" 0.28454 0.715461 3/4" 0.21914 0.78086
2" 0.16495 0.835052 1/4" 0.12078 0.879222 1/2" 0.08418 0.91582
2 3/4" 0.05434 0.945663" 0.02962 0.97038
3 1/4" 0.00947 0.99053
Lot By Lot T401 Form – Correction Equation
1 ½” of Wearing I
C - ( A x k ) D =
1 - k
2310 - ( 621.15) D =
0.71546
2310 - ( 2183 x 0.28454 ) D =
0.71546
1688.85D =
0.71546
2360.51D =
2361D =
New T401 Compaction
Form
29 30
31 32
Module 8
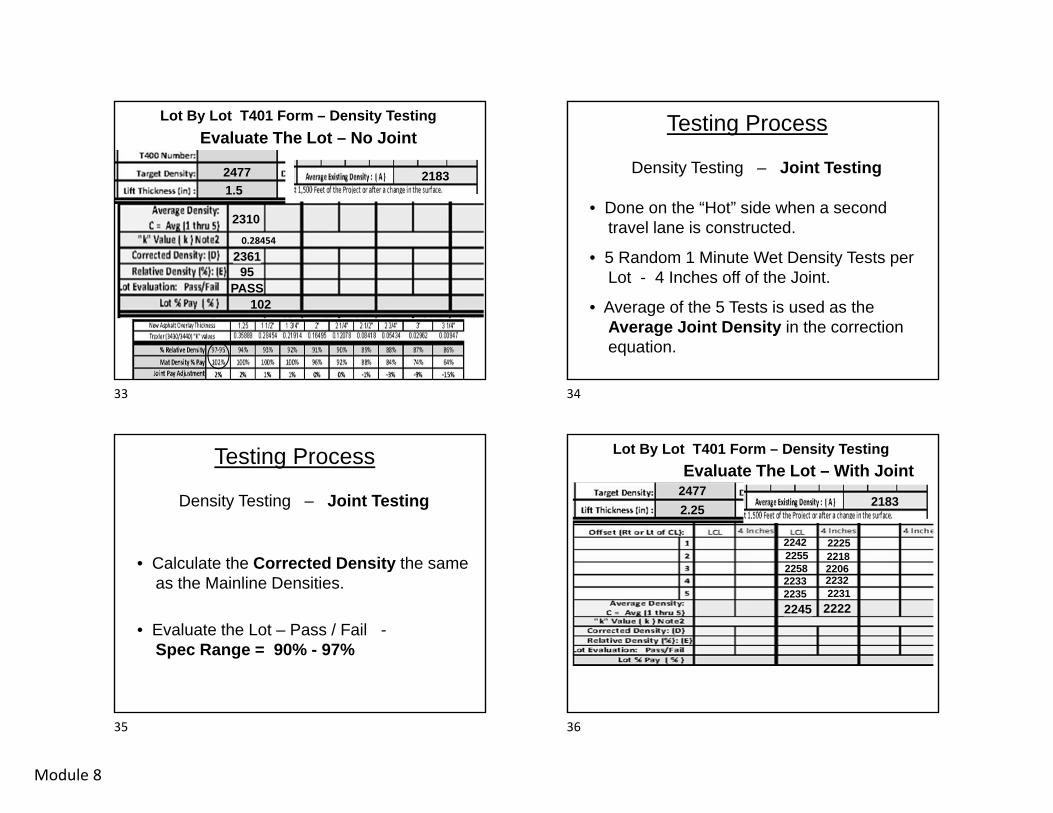
Lot By Lot T401 Form – Density Testing
2310
2477
95PASS
Evaluate The Lot – No Joint
2361
102
1.5
0.28454
2183
Testing Process
Density Testing – Joint Testing
• Done on the “Hot” side when a second travel lane is constructed.
• 5 Random 1 Minute Wet Density Tests per Lot - 4 Inches off of the Joint.
• Average of the 5 Tests is used as the Average Joint Density in the correction equation.
Testing Process
Density Testing – Joint Testing
• Calculate the Corrected Density the same as the Mainline Densities.
• Evaluate the Lot – Pass / Fail -Spec Range = 90% - 97%
Lot By Lot T401 Form – Density Testing
2245
2477Evaluate The Lot – With Joint
2.25
22422255
220622322231
225822332235
22182225
2222
2183
33 34
35 36
Module 8
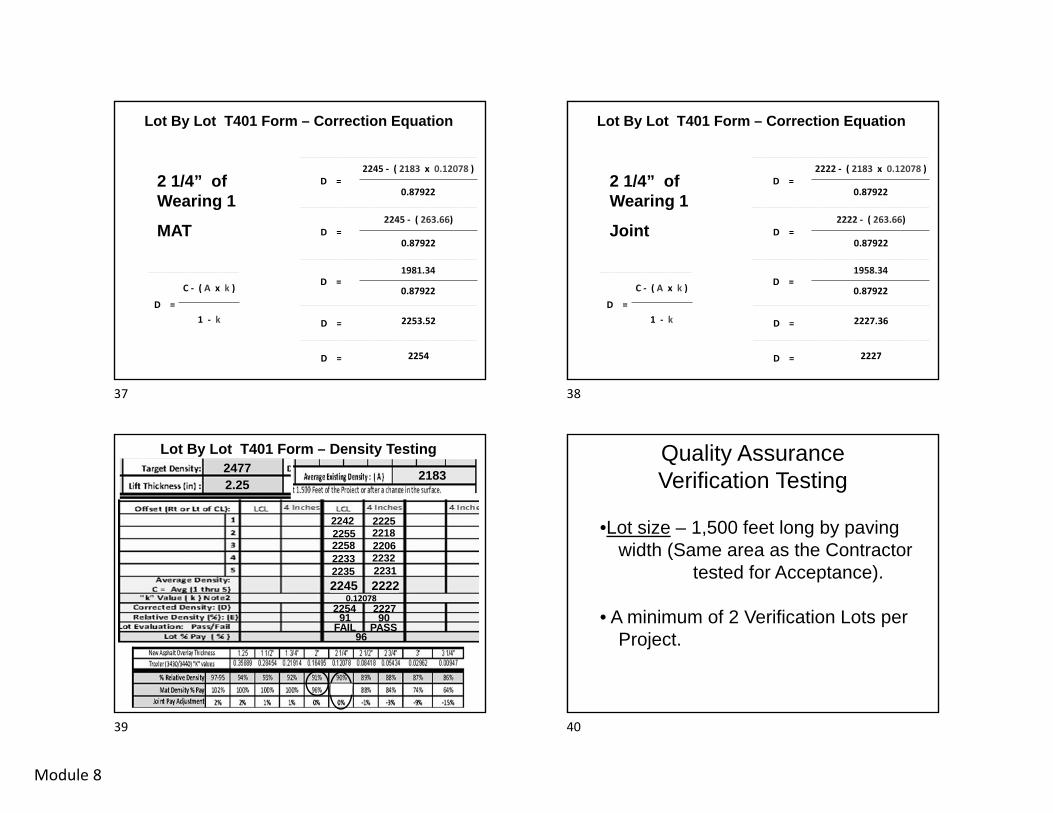
Lot By Lot T401 Form – Correction Equation
2 1/4” of Wearing 1
MAT
C - ( A x k ) D =
1 - k
2245 - ( 263.66) D =
0.87922
2245 - ( 2183 x 0.12078 ) D =
0.87922
1981.34D =
0.87922
2253.52D =
2254D =
Lot By Lot T401 Form – Correction Equation
2 1/4” of Wearing 1
Joint
C - ( A x k ) D =
1 - k
2222 - ( 263.66) D =
0.87922
2222 - ( 2183 x 0.12078 ) D =
0.87922
1958.34D =
0.87922
2227.36D =
2227D =
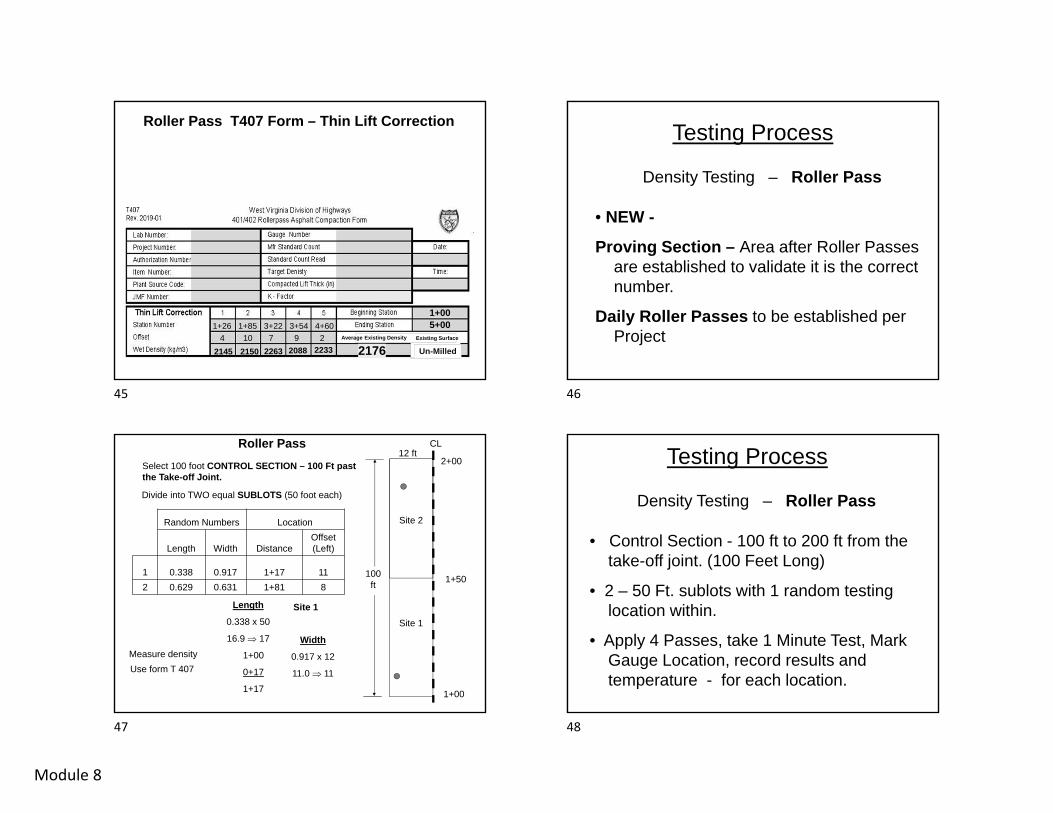
Lot By Lot T401 Form – Density Testing
2245
24772.25
22422255
220622322231
225822332235
22182225
2222
2183
0.120782254 2227
91FAIL
90PASS
96
Quality Assurance Verification Testing
•Lot size – 1,500 feet long by paving width (Same area as the Contractor
tested for Acceptance).
• A minimum of 2 Verification Lots per Project.
37 38
39 40
Module 8
Quality Assurance Verification Testing
• A minimum of 25% Verification Testing per Project. Must always have an even number of Verification Lots:1 – 8 Acceptance = 2 Verification
9 – 16 Acceptance = 4 Verification
17 – 24 Acceptance = 6 Verification
25 – 32 Acceptance = 8 Verification
Quality Assurance Verification Testing
• Thin Lift Correction is not required.
• The Uncorrected wet densities are evaluated for statistical similarity
Testing Process
Thin Lift Correction – Rollerpass
• 5 Random Wet Density Tests within the first 400 Ft. of paving beginning 100 Ft. beyond transverse joint
• Average of the 5 Tests is used as the Existing Density in the correction equation.
• A new Thin Lift Correction is required any time the existing surface changes.
New T407 Compaction
Form
41 42
43 44
Module 8
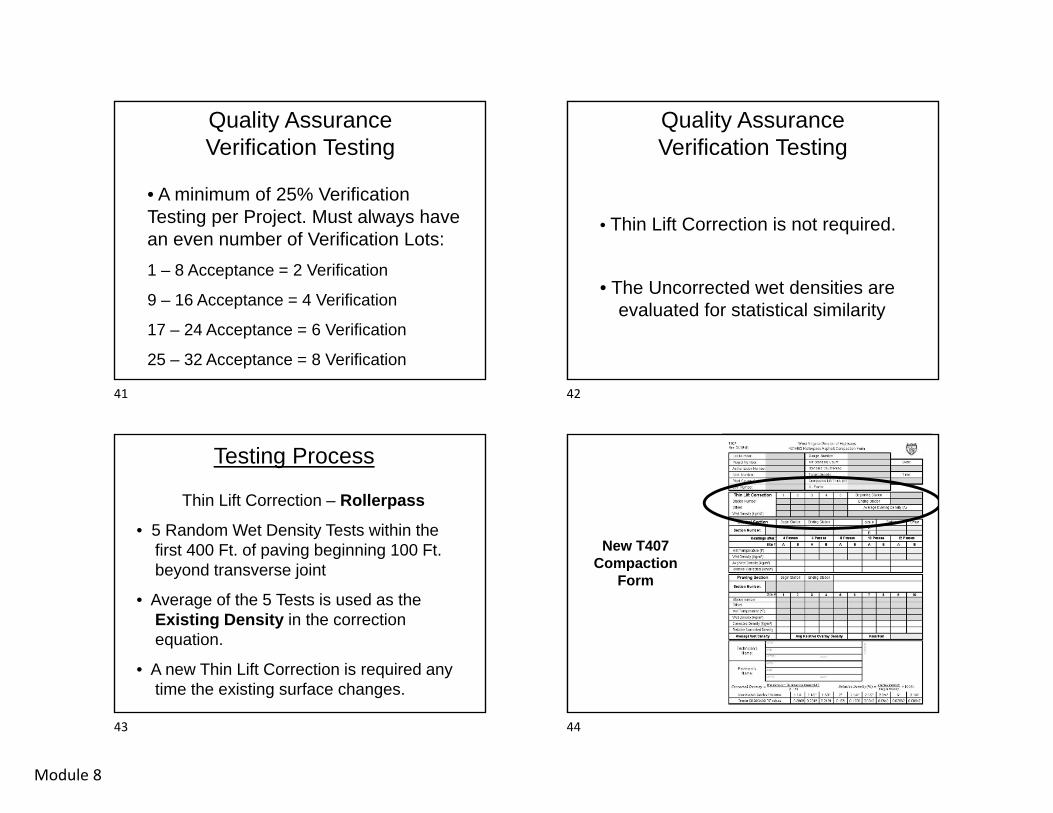
Roller Pass T407 Form – Thin Lift Correction
2145 2150 2263 2088 2233 2176
1+005+00
MilledScratchConcreteUn-Milled
1+26 1+85 3+22 3+54 4+604 10 7 9 2 Average Existing Density Existing Surface
Testing Process
Density Testing – Roller Pass
• NEW -
Proving Section – Area after Roller Passes are established to validate it is the correct number.
Daily Roller Passes to be established per Project
Measure density
Random Numbers Location
Length Width DistanceOffset(Left)
1 0.338 0.917 1+17 112 0.629 0.631 1+81 8
Roller Pass
Use form T 407
2+00
1+00
12 ftCL
1+50
Length
0.338 x 50
16.9 17
1+00
0+17
1+17
Width
0.917 x 12
11.0 11
100 ft
Site 1
Site 2
Site 1
Select 100 foot CONTROL SECTION – 100 Ft past the Take-off Joint.
Divide into TWO equal SUBLOTS (50 foot each)
Testing Process
Density Testing – Roller Pass
• Control Section - 100 ft to 200 ft from the take-off joint. (100 Feet Long)
• 2 – 50 Ft. sublots with 1 random testing location within.
• Apply 4 Passes, take 1 Minute Test, Mark Gauge Location, record results and temperature - for each location.
45 46
47 48

Module 8
Testing Process
Control Section – Roller Pass
• Add 2 more Passes – Repeat Test in the same spot as the first one, record results and temperature.
• Compare second set average wet density to the first set average wet density.
Testing ProcessControl Section – Roller Pass
Continue process – 2 Passes at a time until one of the following occur :
• Less than 5 kg/m³ increase in Average Wet Density.
• One or Both test Locations “Break Over” after achieving 92% Gmm (Corrected)
• The Corrected Relative Density exceeds 97% Gmm
8-51
Roller Pattern Problem #1
Decreasing Temperature 8-52
Roller Pattern Problem #2
Decreasing Temperature
49 50
51 52
Module 8
8-53
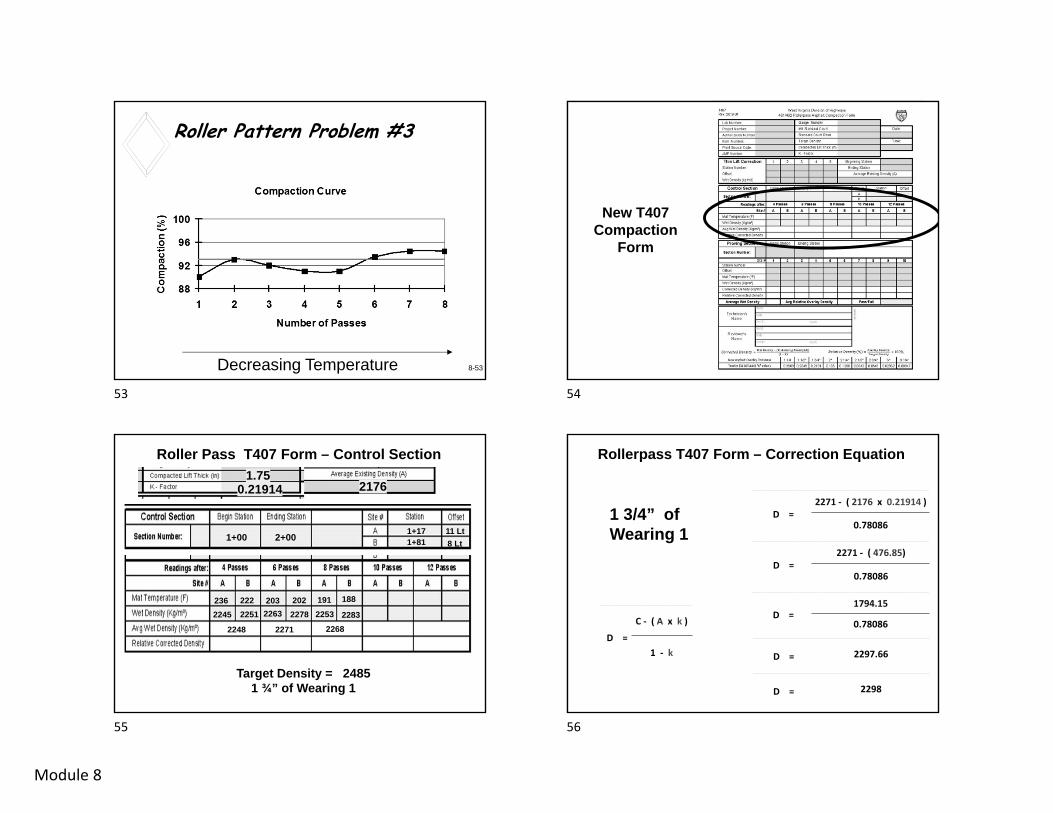
Roller Pattern Problem #3
Decreasing Temperature
New T407 Compaction
Form
Roller Pass T407 Form – Control Section
2245 2251 2263 2278 2253
2176
1+00 2+001+17 11 Lt1+81 8 Lt
2283
Target Density = 24851 ¾” of Wearing 1
236 222 203 202 191 188
2248 2271 2268
1.750.21914
Rollerpass T407 Form – Correction Equation
1 3/4” of Wearing 1
C - ( A x k ) D =
1 - k
2271 - ( 476.85) D =
0.78086
2271 - ( 2176 x 0.21914 ) D =
0.78086
1794.15D =
0.78086
2297.66D =
2298D =
53 54
55 56
Module 8
Roller Pass T407 Form – Control Section
2245 2251 2263 2278 2253
2176
1+00 2+001+17 11 Lt1+81 8 Lt
2283
Target Density = 2485
236 222 203 202 191 188
2248 2271 2268
1.750.21914
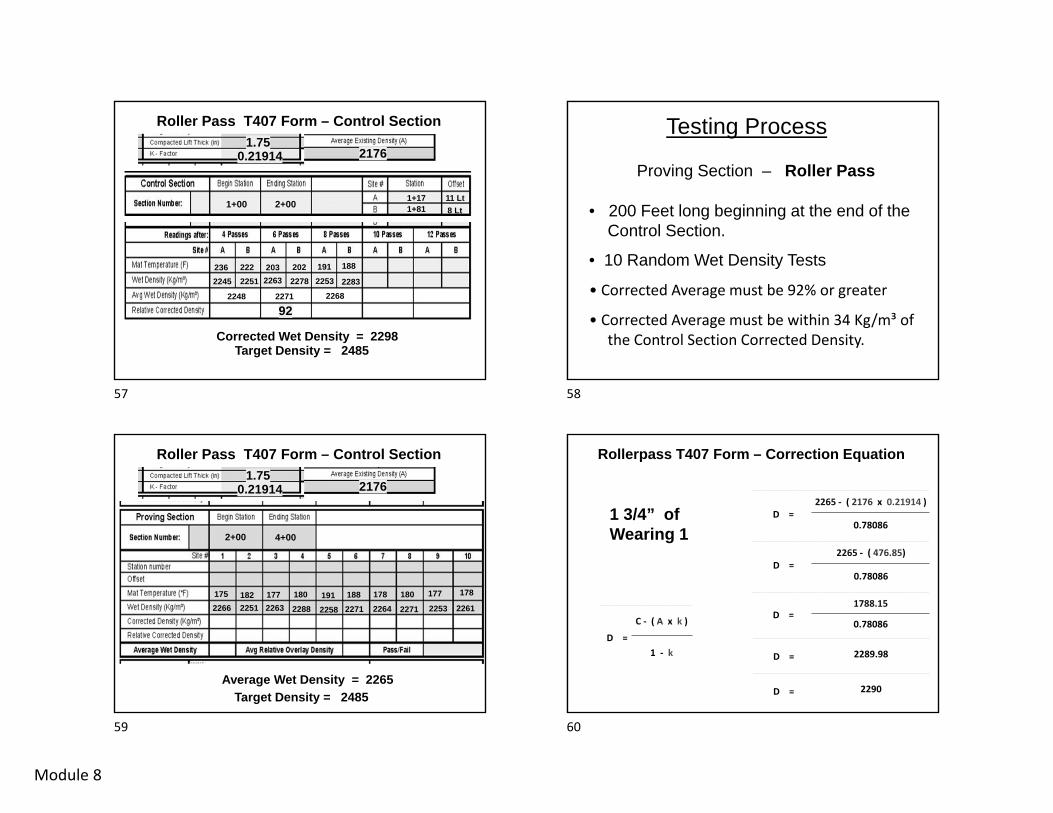
Corrected Wet Density = 2298
92
Testing Process
Proving Section – Roller Pass
• 200 Feet long beginning at the end of the Control Section.
• 10 Random Wet Density Tests
• Corrected Average must be 92% or greater
• Corrected Average must be within 34 Kg/m³ of the Control Section Corrected Density.
Roller Pass T407 Form – Control Section
2266 2251 2263 2288 2258
2176
4+002+00
2271
Target Density = 2485
175 182 177 180 191 188
1.750.21914
Average Wet Density = 2265
178 180 178177
2264 2271 2253 2261
Rollerpass T407 Form – Correction Equation
1 3/4” of Wearing 1
C - ( A x k ) D =
1 - k
2265 - ( 476.85) D =
0.78086
2265 - ( 2176 x 0.21914 ) D =
0.78086
1788.15D =
0.78086
2289.98D =
2290D =
57 58
59 60
Module 8
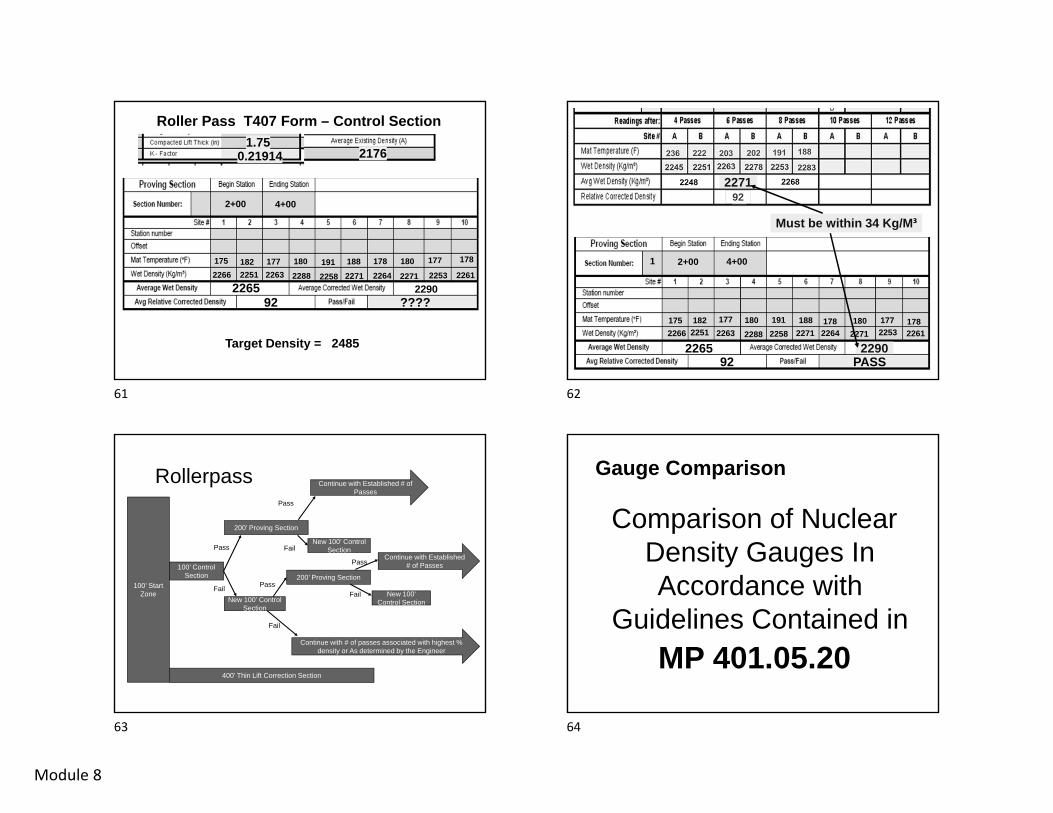
Roller Pass T407 Form – Control Section
2266 2251 2263 2288 2258
2176
4+002+00
2271
Target Density = 2485
175 182 177 180 191 188
2290
1.750.21914
226592
178 180 178177
2264 2271 2253 2261
????
2266 2251 2263 2288 2258
4+002+00
2271
Must be within 34 Kg/M³
175 182 177 180 191 188
2290226592
178 180 1781772264 2271 2253 2261
PASS
1
922271
Rollerpass
100’ Start Zone
100’ Control Section
200’ Proving Section
New 100’ Control Section
Pass
Fail
400’ Thin Lift Correction Section
200’ Proving Section
Continue with # of passes associated with highest % density or As determined by the Engineer
Pass
Fail
Pass
Fail
Continue with Established # of Passes
New 100’ Control Section
Pass
Fail
Continue with Established # of Passes
New 100’ Control Section
Gauge Comparison
Comparison of Nuclear Density Gauges In Accordance with
Guidelines Contained in MP 401.05.20
61 62
63 64
Module 8
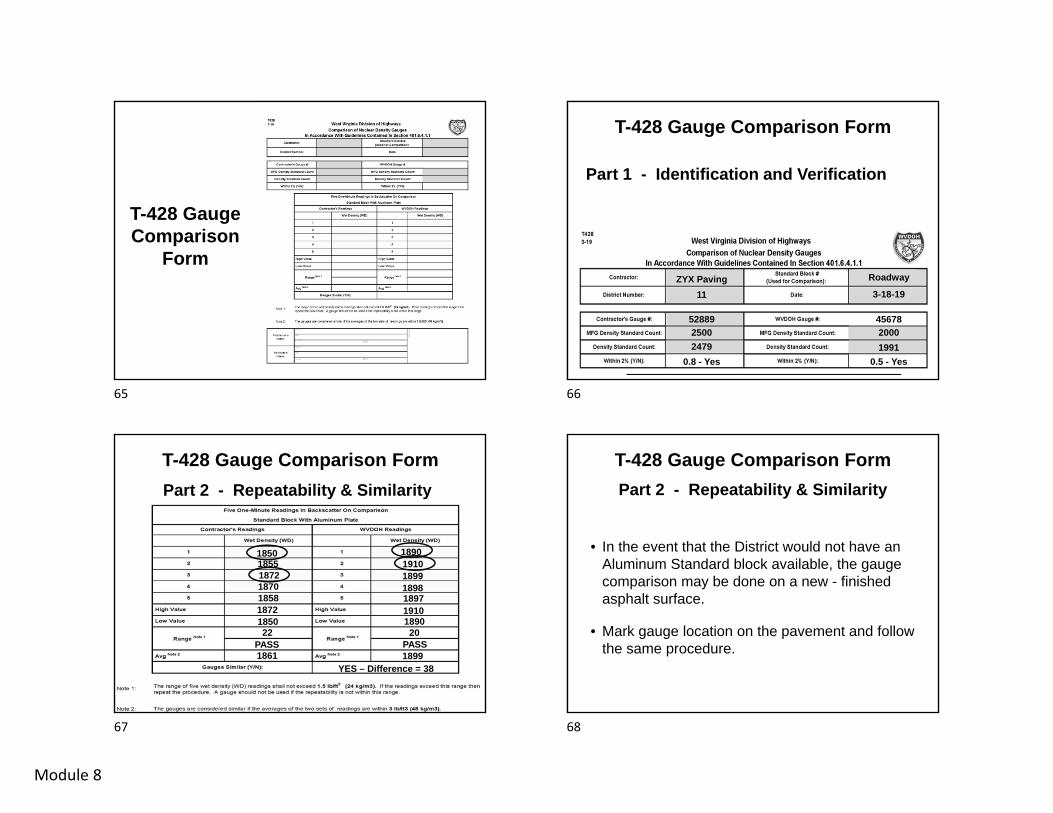
T-428 Gauge Comparison
Form
Part 1 - Identification and Verification
T-428 Gauge Comparison Form
ZYX Paving11
2479250052889
11-008Roadway
3-18-19
4567820001991
0.8 - Yes 0.5 - Yes
Part 2 - Repeatability & Similarity
T-428 Gauge Comparison Form
18501855187218701858
1890
1872185022
PASS
19101899189818971910189020
PASS1861 1899
YES – Difference = 38
Part 2 - Repeatability & Similarity
T-428 Gauge Comparison Form
• In the event that the District would not have an Aluminum Standard block available, the gauge comparison may be done on a new - finished asphalt surface.
• Mark gauge location on the pavement and follow the same procedure.
65 66
67 68

Module 8
Nuclear Gauge Testing Summary1. Use random numbers to locate test sites
according to MP 712.21.26.
2. Must have a void free surface, fill voids with dry mortar sand. Surface must be smooth and flat.
3. Take a ONE minute WET DENSITY Reading in BACKSCATTER Position.
4. Be careful that your gauge doesn’t get damaged by construction equipment etc.
69
Module 9
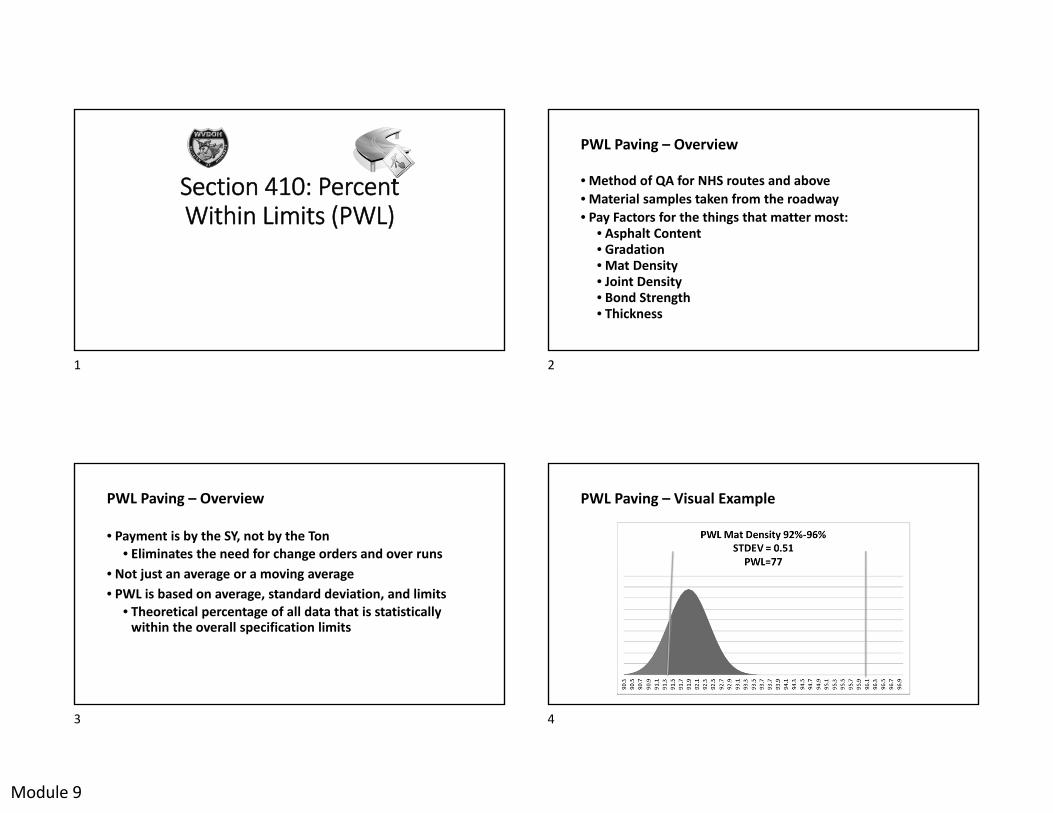
Section 410: Percent Within Limits (PWL)
PWL Paving – Overview
• Method of QA for NHS routes and above• Material samples taken from the roadway• Pay Factors for the things that matter most:
• Asphalt Content• Gradation• Mat Density• Joint Density• Bond Strength• Thickness
PWL Paving – Overview
• Payment is by the SY, not by the Ton• Eliminates the need for change orders and over runs
• Not just an average or a moving average• PWL is based on average, standard deviation, and limits
• Theoretical percentage of all data that is statistically within the overall specification limits
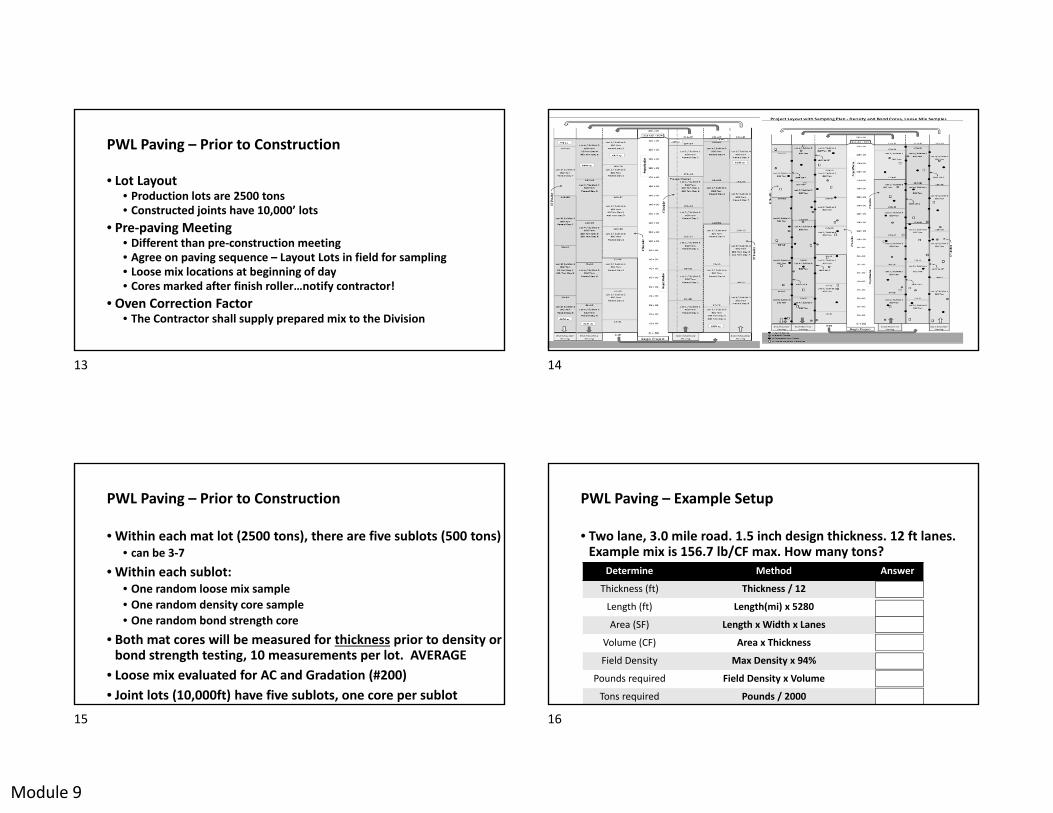
PWL Paving – Visual Example
1 2
3 4

Module 9
PWL Paving – Key Terms
• Upper Limit• Lower Limit• Mean• Standard Deviation• Pay Factor• PWL Rating
•Mat Lots•Loose Samples•Core Samples•Joint Lots•Shoulder Lots
PWL Paving – Specifications
• Section 410 – Asphalt Base and Wearing Courses, Percent within Limits (PWL)
• Section 109.11 – Square Yard Paving Adjustments
PWL Paving – Material Procedures
• MP 401.02.31 QC & Acceptance• MP 401.07.20 Sampling Loose Asphaltic Pavement Mixtures• MP 401.07.21 Sampling Compacted Asphalt• MP 401.07.22 Thickness of Asphalt Concrete Using Cores• MP 401.07.23 Bond Strength• MP 401.07.24 Pavement Macrotexture• MP 401.07.25 Evaluation of HMA Pavements• MP 401.13.50 Determination of PWL
PWL Paving – Loose Mix Samples
• Sampling Location• “Loose Mix” sample behind the paver for Pay• Still truck samples for plant QC/QA
• Samples tested at the District Materials Lab• 24hr turn around on AC Content and Gradation• Statistical Evaluation
• https://youtu.be/lTZeDmYojuM
5 6
7 8

Module 9
PWL Paving – Density Analysis
• Mat and Longitudinal Joint Evaluations• Coring the finished pavement• No field density testing is required
• Still a good Practice for QC• Can use non-nuclear
• Density tests in the lab• Statistical Evaluation
PWL Paving – Bond Strength
• Poor tack coats and surface prep can lead to premature failures
• Layer slip / Delamination / Cracking• Cores are tested in a Shear device
• Lower limit of 100psi• Statistical Evaluation
PWL Paving – Thickness
• Specified lift thickness• Check with the Density and
Bond cores• Agree on interface in the field
PWL Paving – Field Evaluations – Pavement Distresses
• What happens when something goes wrong• Means to stop production if segregation,
bleeding, etc occurs
9 10
11 12
Module 9
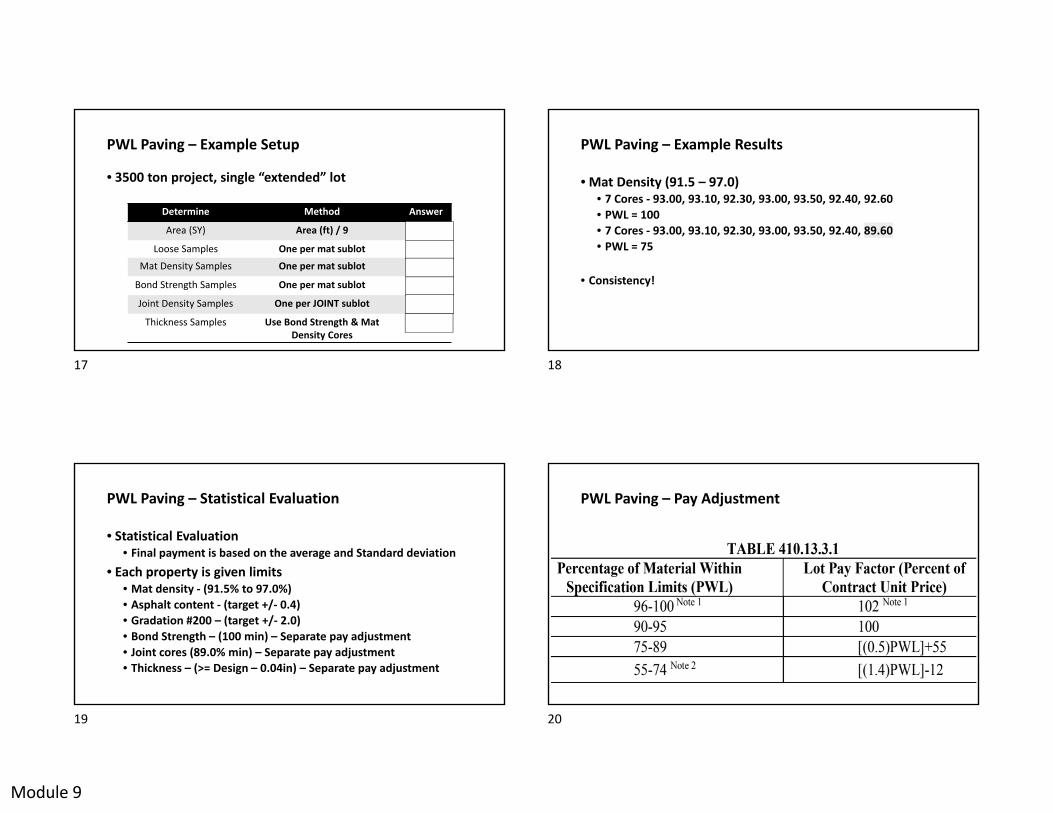
PWL Paving – Prior to Construction
• Lot Layout• Production lots are 2500 tons• Constructed joints have 10,000’ lots
• Pre-paving Meeting• Different than pre-construction meeting• Agree on paving sequence – Layout Lots in field for sampling• Loose mix locations at beginning of day• Cores marked after finish roller…notify contractor!
• Oven Correction Factor• The Contractor shall supply prepared mix to the Division
PWL Paving – Prior to Construction
• Within each mat lot (2500 tons), there are five sublots (500 tons)• can be 3-7
• Within each sublot:• One random loose mix sample• One random density core sample• One random bond strength core
• Both mat cores will be measured for thickness prior to density or bond strength testing, 10 measurements per lot. AVERAGE
• Loose mix evaluated for AC and Gradation (#200)• Joint lots (10,000ft) have five sublots, one core per sublot
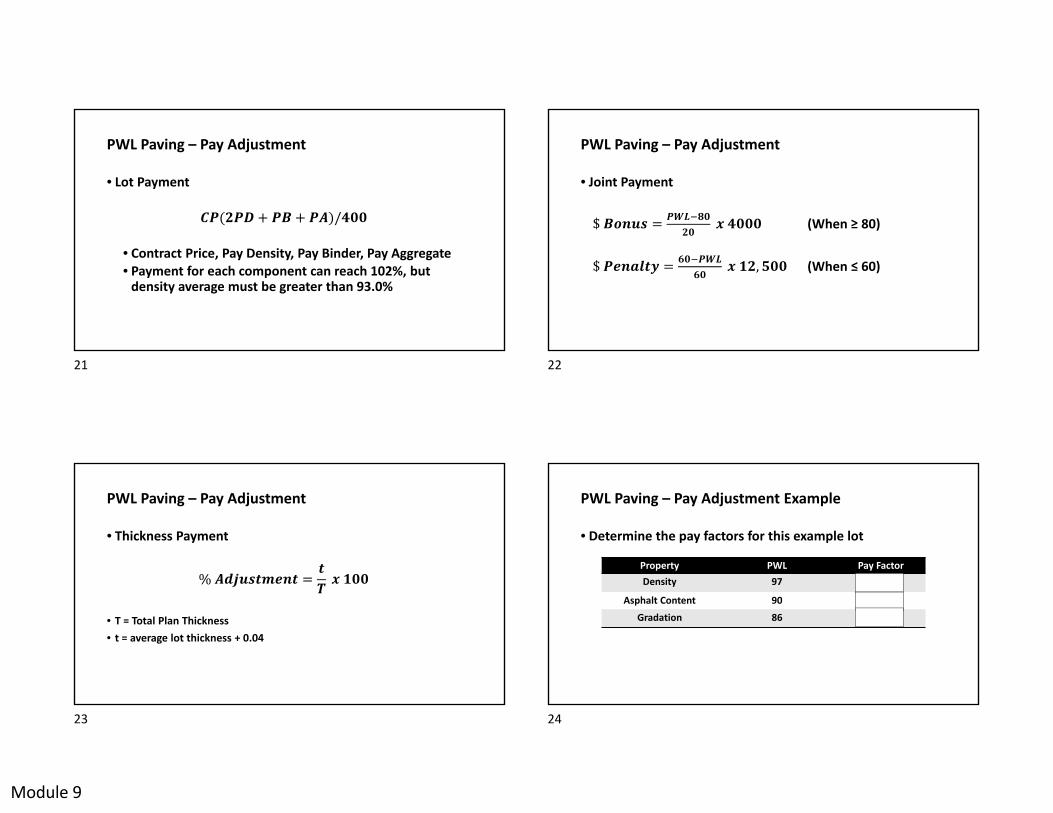
Determine Method AnswerThickness (ft) Thickness / 12 0.125
Length (ft) Length(mi) x 5280 15,840Area (SF) Length x Width x Lanes 380,160
Volume (CF) Area x Thickness 47,520Field Density Max Density x 94% 147.3
Pounds required Field Density x Volume 6,999,601Tons required Pounds / 2000 3500
PWL Paving – Example Setup
• Two lane, 3.0 mile road. 1.5 inch design thickness. 12 ft lanes. Example mix is 156.7 lb/CF max. How many tons?
13 14
15 16
Module 9
PWL Paving – Example Setup
• 3500 ton project, single “extended” lot
Determine Method AnswerArea (SY) Area (ft) / 9 42,240
Loose Samples One per mat sublot 7Mat Density Samples One per mat sublot 7
Bond Strength Samples One per mat sublot 7
Joint Density Samples One per JOINT sublot 8
Thickness Samples Use Bond Strength & Mat Density Cores
14
PWL Paving – Example Results
• Mat Density (91.5 – 97.0)• 7 Cores - 93.00, 93.10, 92.30, 93.00, 93.50, 92.40, 92.60• PWL = 100• 7 Cores - 93.00, 93.10, 92.30, 93.00, 93.50, 92.40, 89.60• PWL = 75
• Consistency!
PWL Paving – Statistical Evaluation
• Statistical Evaluation• Final payment is based on the average and Standard deviation
• Each property is given limits• Mat density - (91.5% to 97.0%)• Asphalt content - (target +/- 0.4)• Gradation #200 – (target +/- 2.0)• Bond Strength – (100 min) – Separate pay adjustment• Joint cores (89.0% min) – Separate pay adjustment• Thickness – (>= Design – 0.04in) – Separate pay adjustment
PWL Paving – Pay Adjustment
17 18
19 20
Module 9
PWL Paving – Pay Adjustment
• Lot Payment ( + + )/• Contract Price, Pay Density, Pay Binder, Pay Aggregate• Payment for each component can reach 102%, but
density average must be greater than 93.0%
PWL Paving – Pay Adjustment
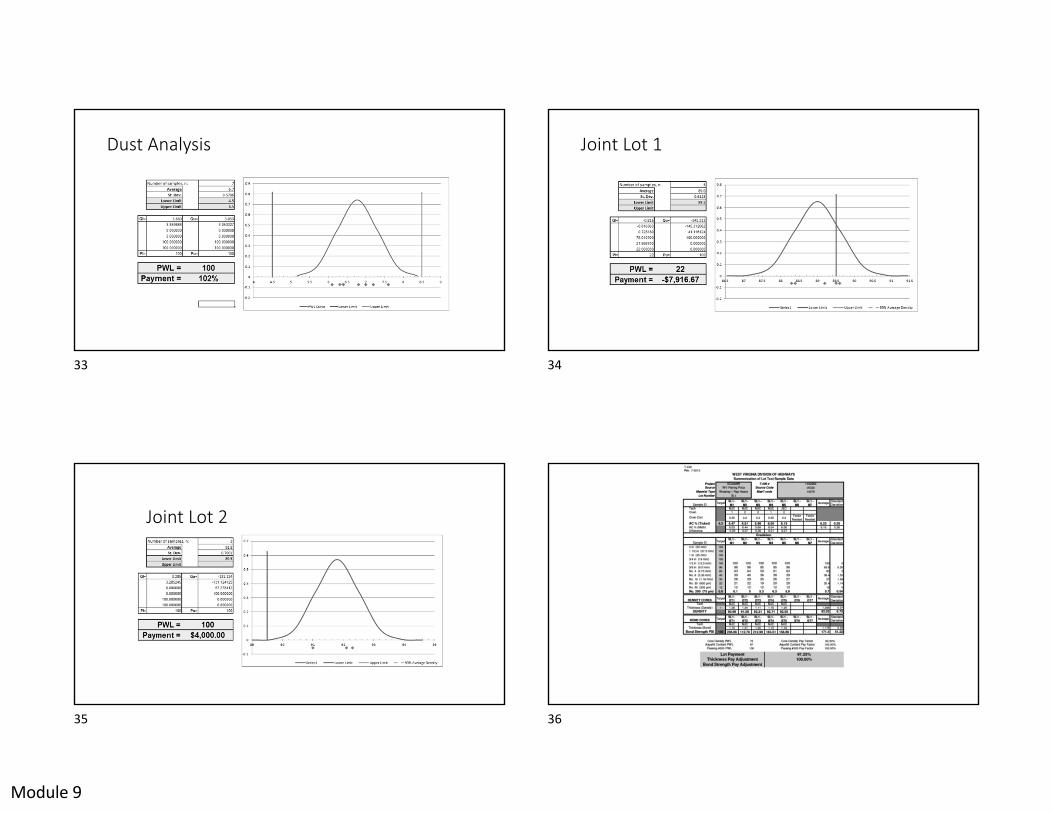
• Joint Payment
$ = (When ≥ 80)
$ = , (When ≤ 60)
PWL Paving – Pay Adjustment
• Thickness Payment
% = • T = Total Plan Thickness• t = average lot thickness + 0.04
PWL Paving – Pay Adjustment Example
• Determine the pay factors for this example lot
Property PWL Pay FactorDensity 97 102
Asphalt Content 90 100Gradation 86 98
21 22
23 24
Module 9
PWL Paving – Pay Adjustment Example
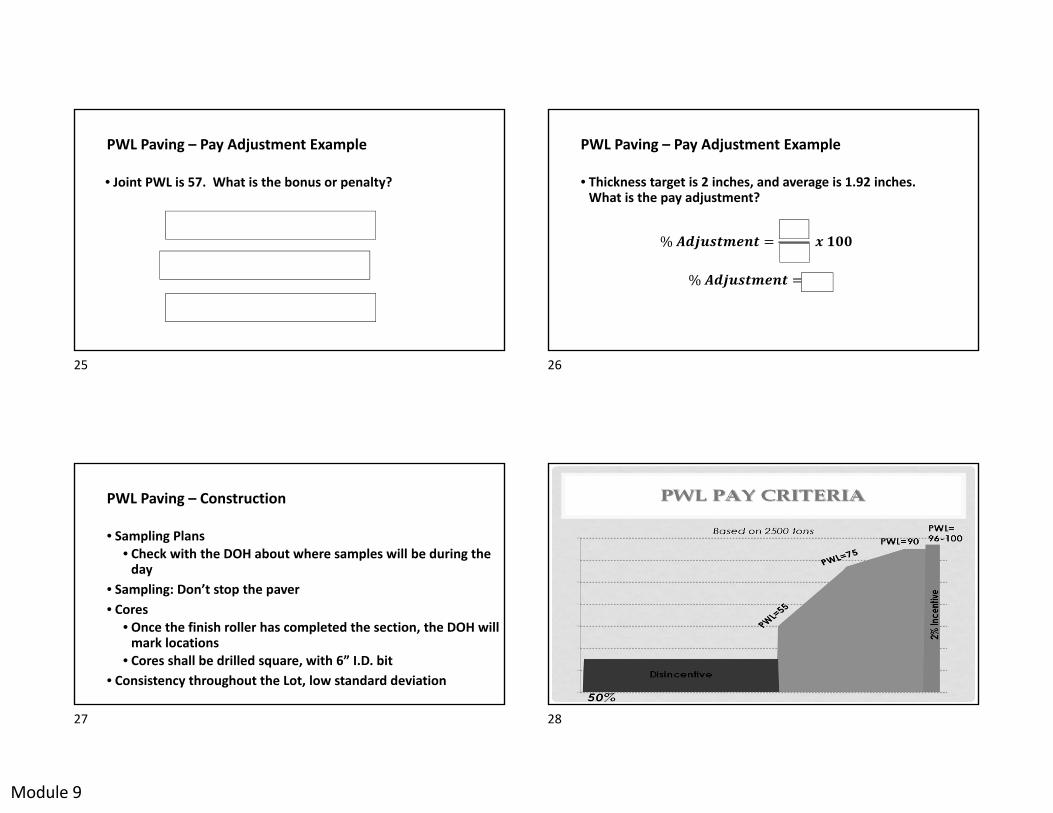
• Joint PWL is 57. What is the bonus or penalty?
= ,= . ,= $
PWL Paving – Pay Adjustment Example
• Thickness target is 2 inches, and average is 1.92 inches. What is the pay adjustment?
% = . % =
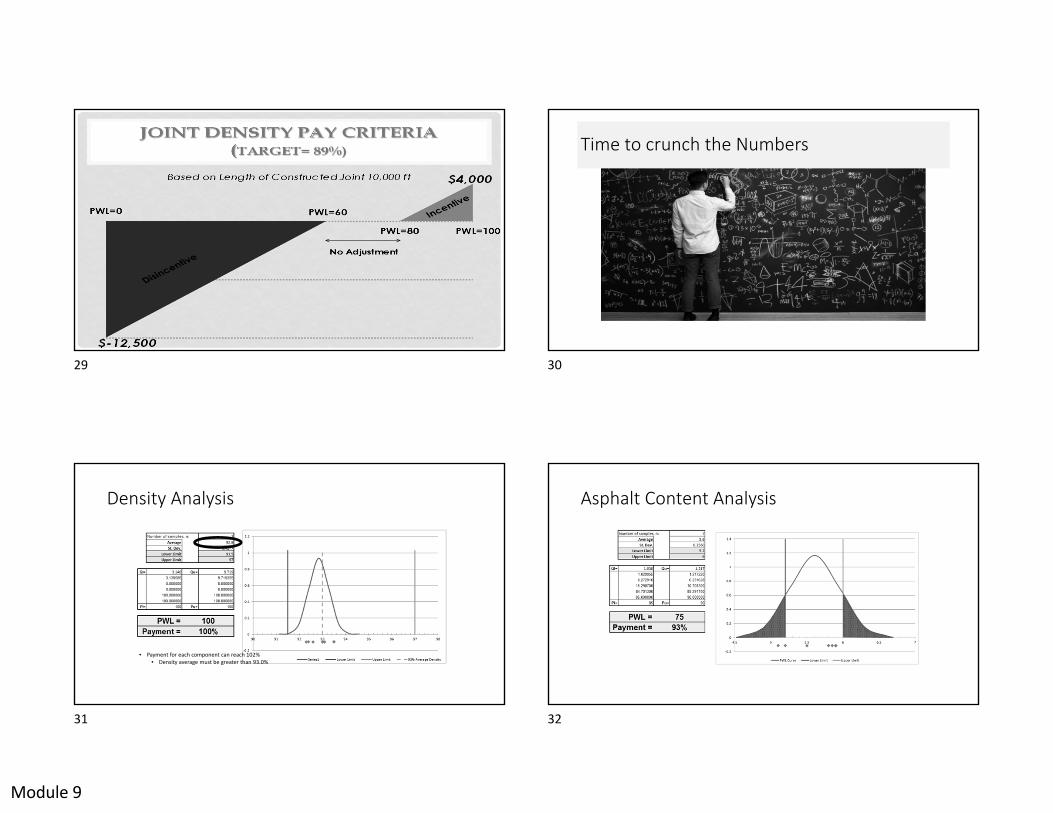
PWL Paving – Construction
• Sampling Plans• Check with the DOH about where samples will be during the
day• Sampling: Don’t stop the paver• Cores
• Once the finish roller has completed the section, the DOH will mark locations
• Cores shall be drilled square, with 6” I.D. bit• Consistency throughout the Lot, low standard deviation
25 26
27 28
Module 9
Significant Changes
• Joints have separate incentive/disincentive
Time to crunch the Numbers
Density Analysis
• Payment for each component can reach 102%• Density average must be greater than 93.0%
Asphalt Content Analysis
29 30
31 32
Module 9
Dust Analysis Joint Lot 1
Joint Lot 2
33 34
35 36

Module 9
PWL Paving – Conclusions
• Just remember...
• Best practices• Consistency
37 38
Module 10
HMA Construction Program
Module 10Troubleshooting
Learning Objectives1. State the objective of effective
troubleshooting2. List the steps needed to effectively
troubleshoot3. Analyze situations and recommend
action to be taken
Objective of EffectiveTroubleshooting?
• Isolating the problem so that an appropriate solution can be arrived at quickly and efficiently.
1 2
3 4
Module 10
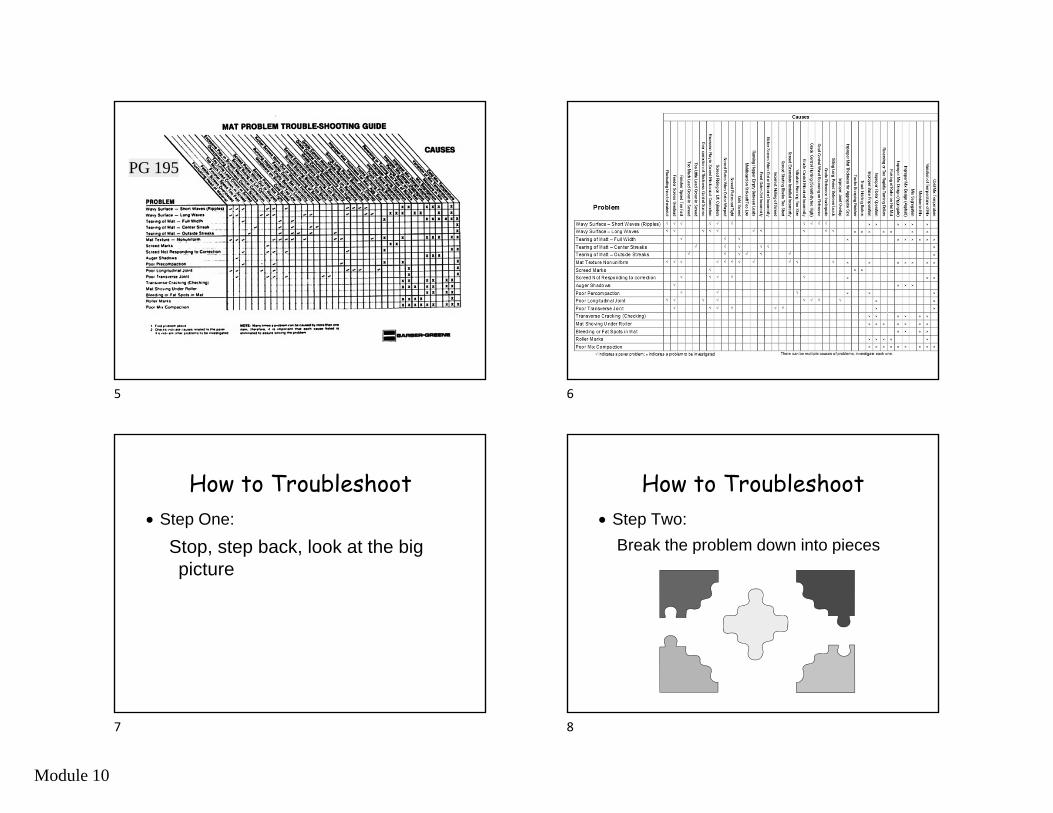
PG 195
How to Troubleshoot• Step One:
Stop, step back, look at the big picture
How to Troubleshoot• Step Two:
Break the problem down into pieces
5 6
7 8
Module 10
How to Troubleshoot• Step Three:
Eliminate the obvious factors first
How to Troubleshoot• Step Four:
Analyze each remaining element in full detail
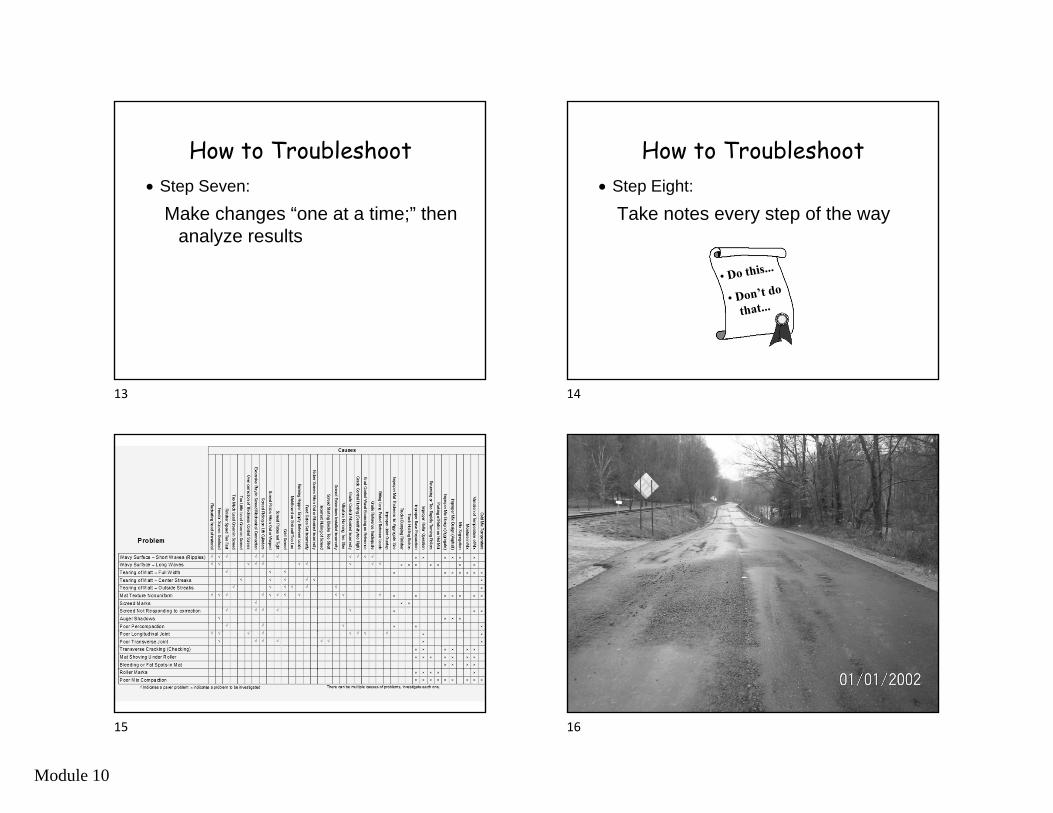
How to Troubleshoot • Step Five:
Re-combine the pieces of puzzleStop,
Step back,Look at big picture
Eliminate the obviousfactors first
Analyze eachelement infull detail
Break theproblem down in pieces
How to Troubleshoot• Step Six:
Make recommendations based on facts
9 10
11 12
Module 10
How to Troubleshoot• Step Seven:
Make changes “one at a time;” then analyze results
How to Troubleshoot• Step Eight:
Take notes every step of the way
13 14
15 16
Module 10
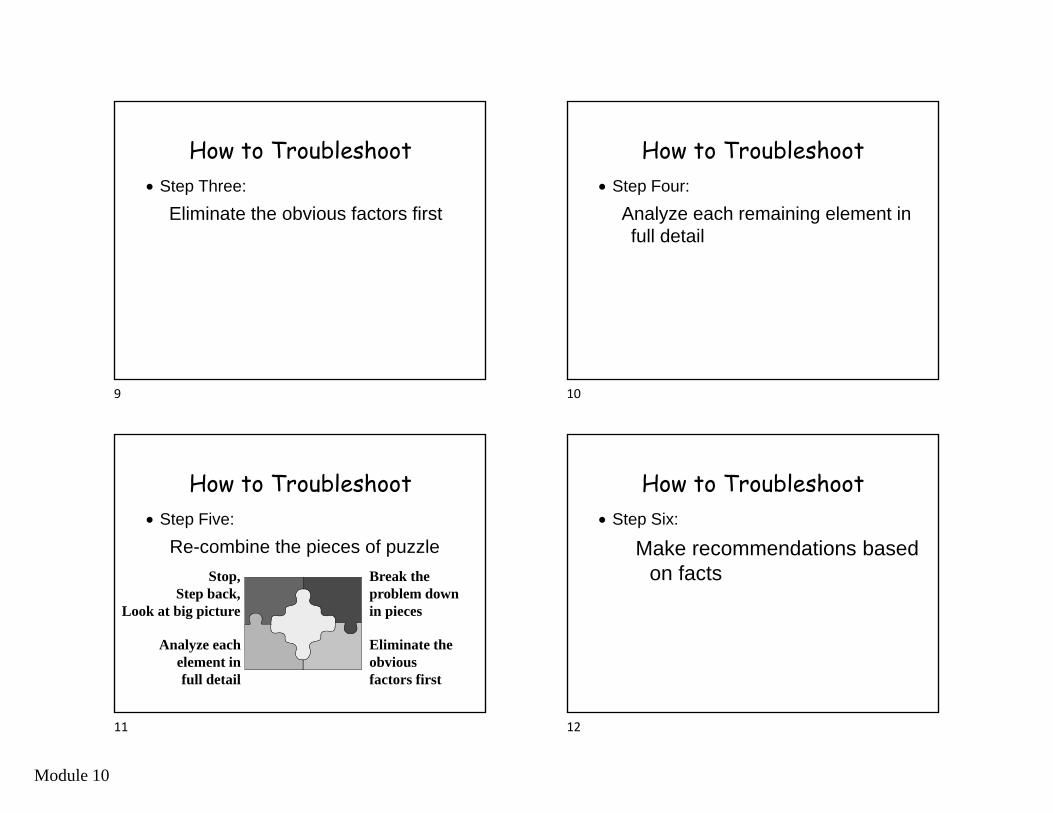
Segregation Troubleshooting
That’s 18 possible causes for non-uniform mat texture!
How to Troubleshoot• Stop, step back, look at big picture
• Break the problem down in pieces− Eliminate the obvious factors first
Analyze each element in full detailRe-combine the pieces of puzzle
− Recommendation based on facts• Changes “one at a time;” analyze
• Take notes every step of the way
17 18
19 20
Module 10
Section 19 -
Mat Problems
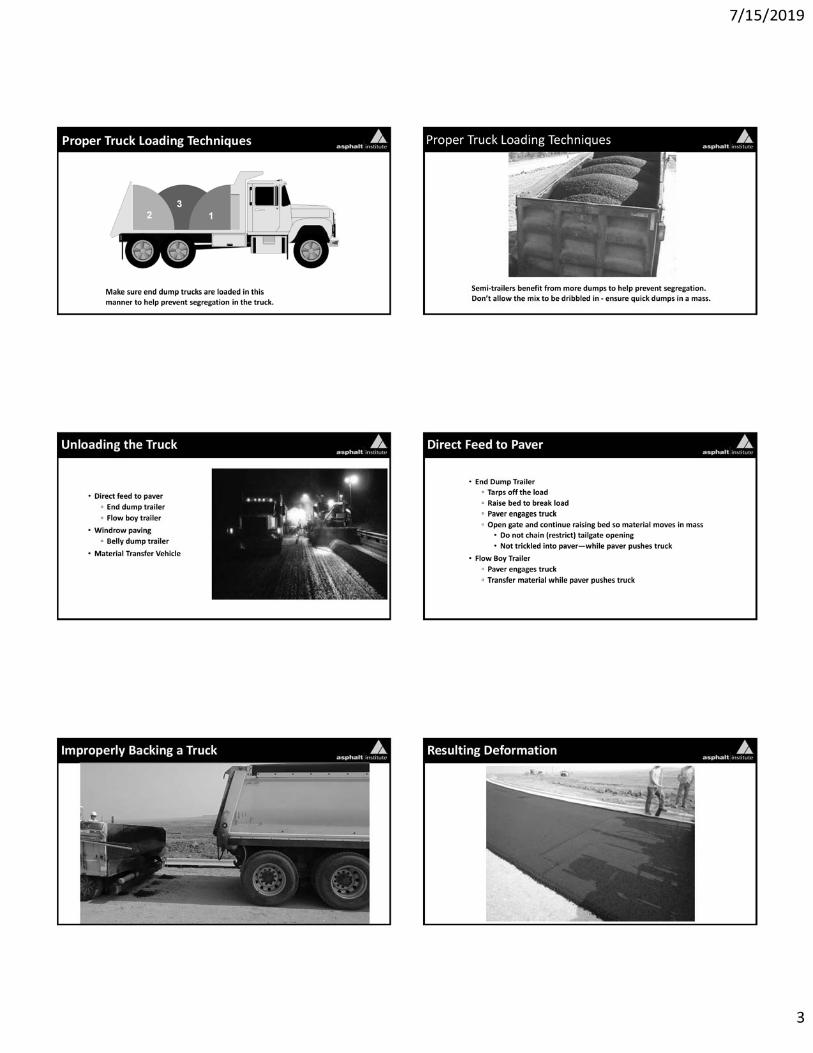
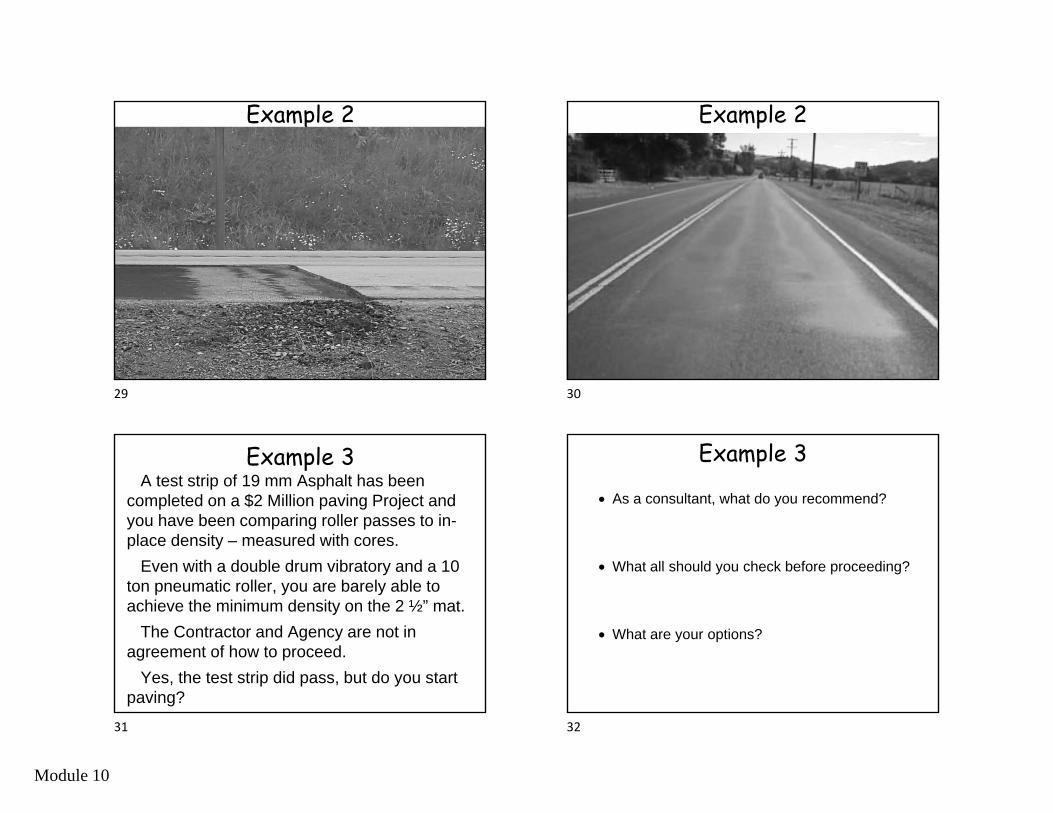
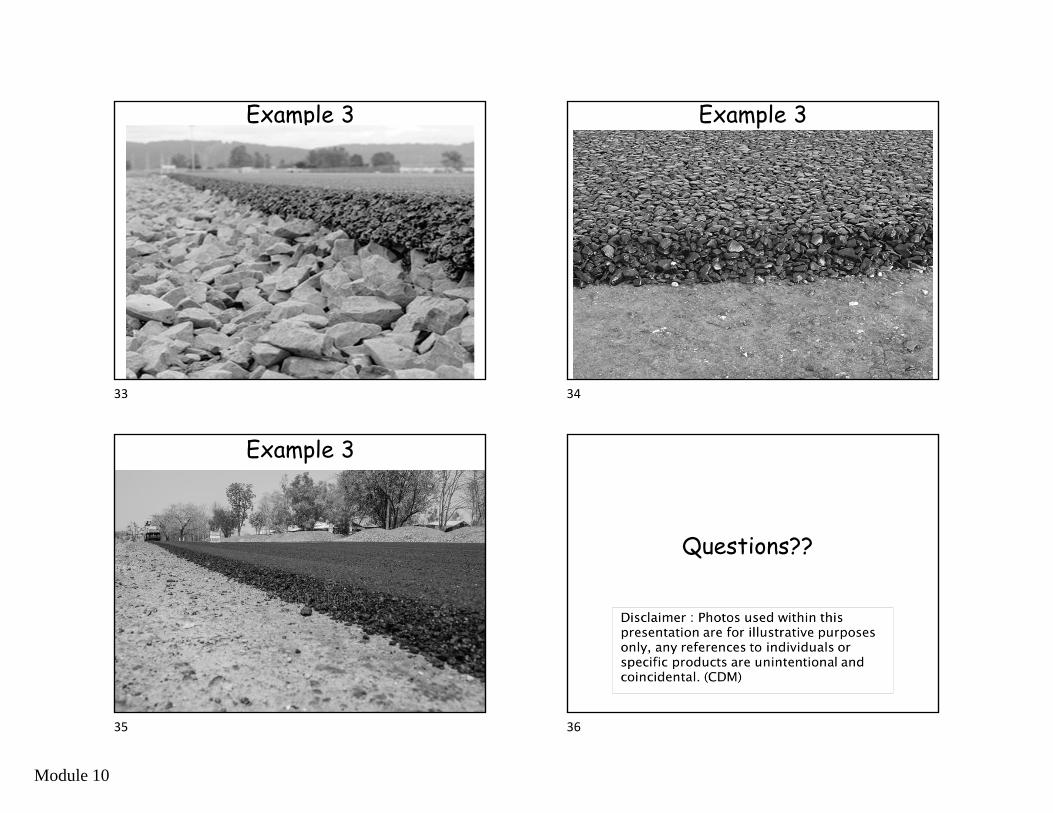
Example 1Your paving team has been using a double
drum steel wheel roller as the breakdown roller on an 1 ½” of Wearing 1 overlay.
You are experiencing some checking in the mat after the second or third pass.
The mix has been tested at the lab and isn't suspect – Asphalt & Dust contents are good.
Example 1
21 22
23 24
Module 10
Example 1
• What would cause this?
Handbook Pages 202 – 203
• What can you do right now to correct this?
Handbook Pages 203 - 204
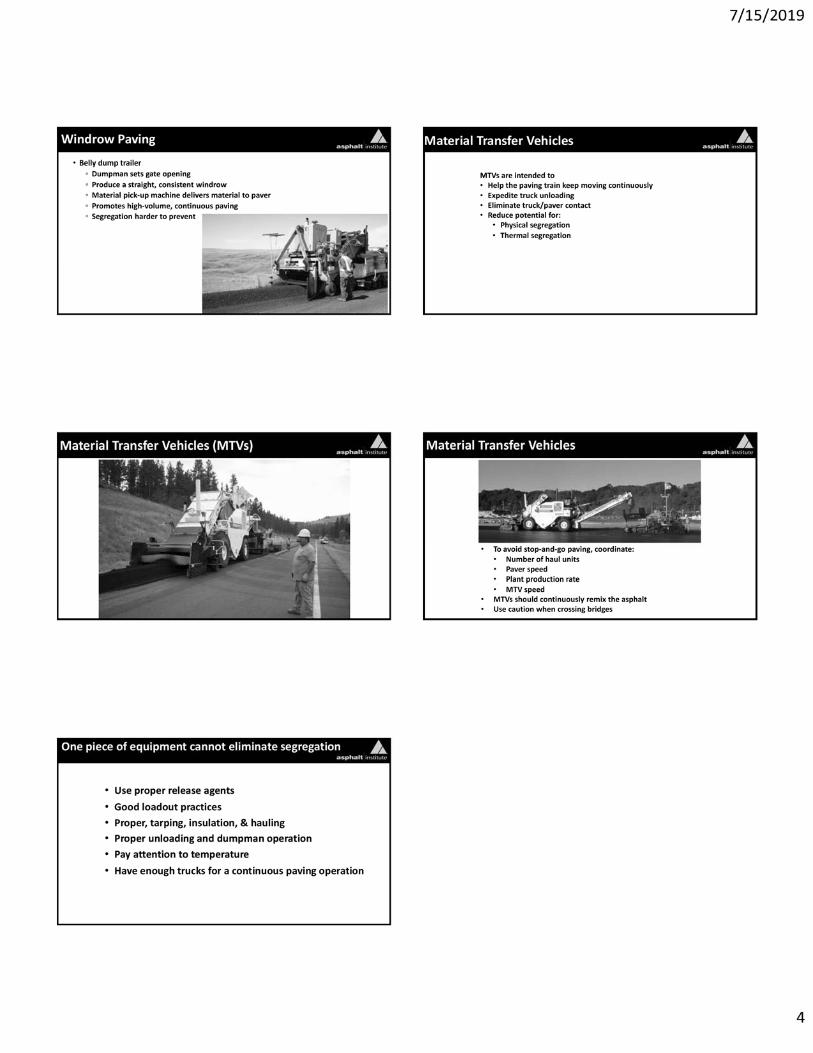
Example 2You are show up on the Project and see
random fat spots and bleeding in the wheel paths on a 1” Wearing 1 overlay placed yesterday . This is slightly more noticeable at the transverse
joints. The test results from the day before meets the
specifications. You are ready to start paving the same mix on
the same stretch of road today.
Example 2Example 2
• What would cause this?
• Should you Pave today?
• What can you do right now to correct this?
25 26
27 28
Module 10
Example 2 Example 2
Example 3A test strip of 19 mm Asphalt has been
completed on a $2 Million paving Project and you have been comparing roller passes to in-place density – measured with cores.
Even with a double drum vibratory and a 10 ton pneumatic roller, you are barely able to achieve the minimum density on the 2 ½” mat.
The Contractor and Agency are not in agreement of how to proceed.
Yes, the test strip did pass, but do you start paving?
Example 3
• As a consultant, what do you recommend?
• What all should you check before proceeding?
• What are your options?
29 30
31 32
Module 10
Example 3 Example 3
Example 3
Questions??
33 34
35 36
MP 401.05.20 ORIGINAL ISSUANCE: SEPTEMBER 1994 REVISED: MARCH 2000
PAGE 1 OF 7
WEST VIRGINIA DEPARTMENT OF TRANSPORTATIONDIVISION OF HIGHWAYS
CONTRACT ADMINISTRATION DIVISION
MATERIALS PROCEDURE_______________________________________________________________________________
COMPACTION TESTING OF HOT-MIX ASPHALT PAVEMENTS_______________________________________________________________________________
1.0 PURPOSE
1.1 The purpose of this procedure is to establish the test methods for quality controltesting by the Contractor and verification testing by the Division.
2.0 SCOPE
2.1 This procedure is applicable for all items of hot-mix asphalt pavements requiringcompaction testing.
3.0 DEFINITIONS
3.1 Quality Control Testing – Testing conducted by the Contractor to monitor andcontrol the production of their product.
3.2 Verification Testing – Testing conducted by the Division to determine specificationcompliance.
4.0 APPLICABLE DOCUMENTS
AASHTO R11MP 712.21.26
5.0 EQUIPMENT
5.1 Nuclear density gauges of the backscatter type.
5.2 One measuring tape of approximately 50 feet (20 meters).
5.3 Lime or other suitable material to mark test sites.
MP 401.05.20 ORIGINAL ISSUANCE: SEPTEMBER 1994 REVISED: MARCH 2000
PAGE 2 OF 7
5.4 Dry mortar sand.
5.5 Supply of T401 or T407 data sheets.
6.0 ROUNDING OF DATA
6.1 Test data must be rounded according to AASHTO R11.
6.2 Test data and calculations are rounded to the following nearest significant digit.
Station Number 1 ft (0.1 m) Offset 1 ft (0.1 m) Wet Density 0.1 lb/ft3 (1 kg/m3)
Target Density 0.1 lb/ft3 (1 kg/m3)
Lift Thickness Compacted 0.25 inch (1 mm)Relative Density 1 %Average Relative Density 1 %Average Wet Density 0.1 lb/ft3 (1 kg/m3)
7.0 STANDARDIZATION OF NUCLEAR GAUGE
7.1 Warm up the gauge in accordance with the manufacturer’s recommendations.
7.2 Standardization must be performed away from metal and other objects.
7.3 Clean the top of the standard block and the bottom of the gauge with a cloth.
7.4 Make sure the gauge is turned the correct way on the block.
7.5 After making the necessary adjustments on the gauge for standardization, take a fourminute count for density.
7.6 Compare the standard count to the manufacturer's standard count. The standardcount must be within ± 2% from the manufacturer's standard.
7.7 If the gauge is not within the specified tolerance, repeat the standardization. If thegauge will not standardize after four attempts, there is probably something wrongwith the gauge. There may be electronics problems, the gauge needs calibrated, or astability check needs to be performed. Do not use a gauge for testing if it will notstandardize.
MP 401.05.20 ORIGINAL ISSUANCE: SEPTEMBER 1994 REVISED: MARCH 2000
PAGE 3 OF 7
7.8 A gauge must be standardized before testing and at least every four hours duringtesting.
8.0 COMPARISON OF GAUGES
8.1 The gauge used for the Contractor’s quality control testing should be compared withthe gauge used for the Division’s verification testing.
8.2 Standardize both gauges according to 7.1 through 7.8.
8.3 Place the aluminum plate provided by the Division on the standard block used forverification testing. Place the standard block on material weighing a minimum of110 lb/ft3 (1762 kg/m3). The block must not be near metal or other objects duringtesting and must not be moved. Keep the gauges separated a minimum of 30 feet(9.1 meters) during testing.
8.4 Take 5 one minute wet density readings with each gauge in the backscatterposition. The gauges are to be oriented on the block the same as forstandardization.
8.5 Record the wet density readings exactly as shown on the gauge. The range of thefive readings shall not exceed 1.5 lb/ft3 (24 kg/m3). If the readings exceed thisrange, perform a new set of five readings. A gauge should not be used if therepeatability of the gauge is not within this range.
8.6 Average the five readings for each gauge. The gauges are considered similar if theaverages of the readings are within 3 lb/ft3 (48 kg/m3).
8.7 The density readings for verification testing will not be adjusted to compensate forany differences in readings between gauges.
9.0 QUALITY CONTROL TESTING
9.1 Record the test data on a T401 form.
9.2 Divide the LOT into five equal sublots.
9.3 Randomly locate a test site within each sublot according to MP 712.21.26.
9.4 Check each test site to determine if there are surface voids. Fill the voids with drymortar sand. Avoid a build-up of fines on the surface to no more than 0.1 inch (3mm).
MP 401.05.20 ORIGINAL ISSUANCE: SEPTEMBER 1994 REVISED: MARCH 2000
PAGE 4 OF 7
9.5 Take a one minute wet density reading on each test site.
9.6 Perform the calculations on the Division approved form.
9.7 Compare the relative densities to the specification requirements.
9.8 The results of the quality control tests should be used by the Contractor to judge ifthe LOT will meet specifications when verification tests are performed by theDivision. Corrective measures are to be taken to bring the LOT into specificationsif the quality control tests indicate that a nonconformance situation exists.
10.0 LOT-BY-LOT DIVISION VERIFICATION TESTING
10.1 Once the Contractor offers a LOT of material to the Division for testing, verificationtesting will be performed to determine compliance to the specifications.
10.2 Randomly locate a test site within the LOT according to MP 712.21.26.
10.3 Check each test site to determine if there are surface voids. Fill the voids with drymortar sand. Avoid a build-up of fines on the surface to no more than 0.1 inch (3mm).
10.4 Take a one minute wet density reading in the backscatter position.
10.5 Perform the calculations on the T401 form.
10.6 Compare the percent relative density to the specification range. If the value is withinthe range, the LOT is accepted for density.
10.7 When the percent relative density is outside the specification range, divide the LOTinto five equal sublots and randomly locate a test site in each sublot according to MP712.21.26.
10.8 Take a wet density reading at each test site.
10.9 Average the five wet densities.
10.10 Calculate the percent relative density.
10.11 The LOT would be acceptable if the average relative density falls within thespecification range. A nonconformance situation exists if the value is outside therange.
MP 401.05.20 ORIGINAL ISSUANCE: SEPTEMBER 1994 REVISED: MARCH 2000
PAGE 5 OF 7
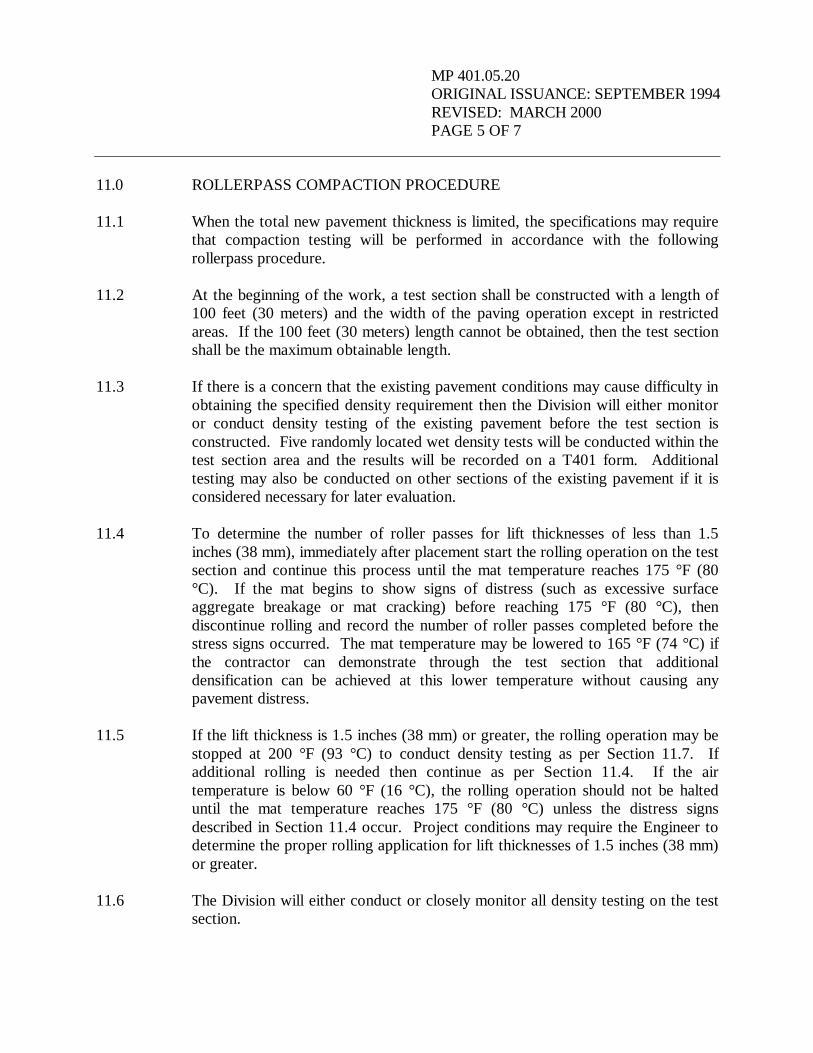
11.0 ROLLERPASS COMPACTION PROCEDURE
11.1 When the total new pavement thickness is limited, the specifications may requirethat compaction testing will be performed in accordance with the followingrollerpass procedure.
11.2 At the beginning of the work, a test section shall be constructed with a length of100 feet (30 meters) and the width of the paving operation except in restrictedareas. If the 100 feet (30 meters) length cannot be obtained, then the test sectionshall be the maximum obtainable length.
11.3 If there is a concern that the existing pavement conditions may cause difficulty inobtaining the specified density requirement then the Division will either monitoror conduct density testing of the existing pavement before the test section isconstructed. Five randomly located wet density tests will be conducted within thetest section area and the results will be recorded on a T401 form. Additionaltesting may also be conducted on other sections of the existing pavement if it isconsidered necessary for later evaluation.
11.4 To determine the number of roller passes for lift thicknesses of less than 1.5inches (38 mm), immediately after placement start the rolling operation on the testsection and continue this process until the mat temperature reaches 175 °F (80°C). If the mat begins to show signs of distress (such as excessive surfaceaggregate breakage or mat cracking) before reaching 175 °F (80 °C), thendiscontinue rolling and record the number of roller passes completed before thestress signs occurred. The mat temperature may be lowered to 165 °F (74 °C) ifthe contractor can demonstrate through the test section that additionaldensification can be achieved at this lower temperature without causing anypavement distress.
11.5 If the lift thickness is 1.5 inches (38 mm) or greater, the rolling operation may bestopped at 200 °F (93 °C) to conduct density testing as per Section 11.7. Ifadditional rolling is needed then continue as per Section 11.4. If the airtemperature is below 60 °F (16 °C), the rolling operation should not be halteduntil the mat temperature reaches 175 °F (80 °C) unless the distress signsdescribed in Section 11.4 occur. Project conditions may require the Engineer todetermine the proper rolling application for lift thicknesses of 1.5 inches (38 mm)or greater.
11.6 The Division will either conduct or closely monitor all density testing on the testsection.
MP 401.05.20 ORIGINAL ISSUANCE: SEPTEMBER 1994 REVISED: MARCH 2000
PAGE 6 OF 7
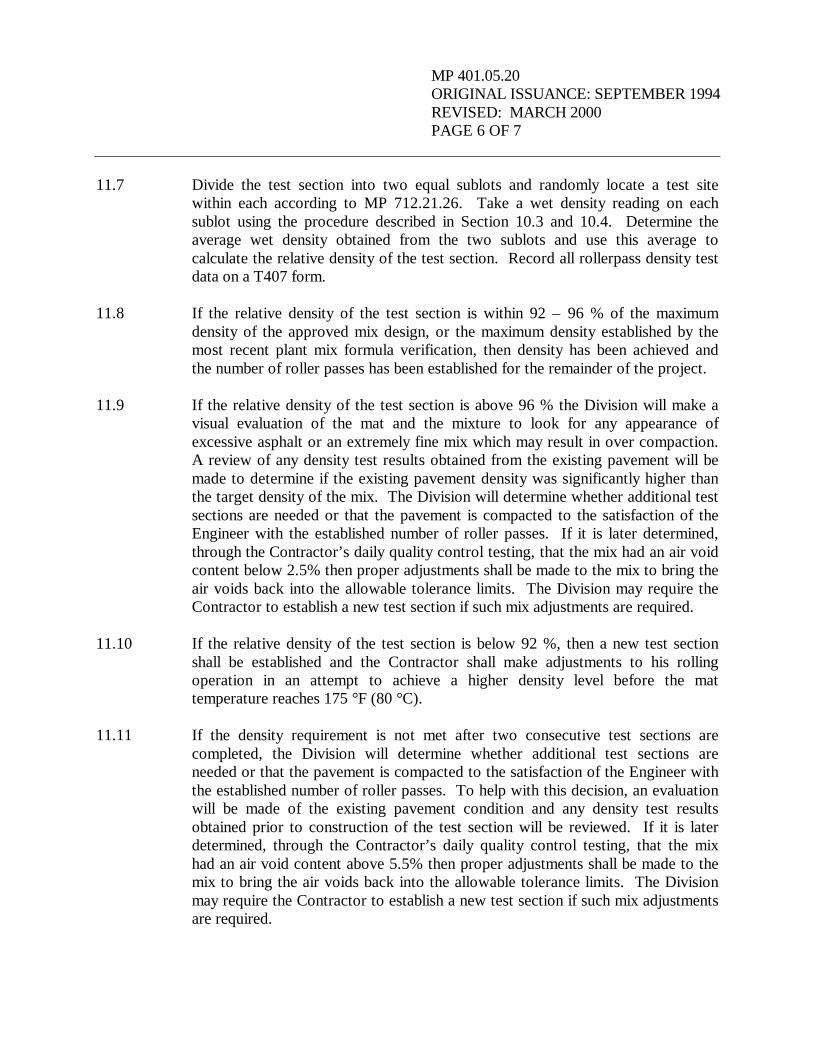
11.7 Divide the test section into two equal sublots and randomly locate a test sitewithin each according to MP 712.21.26. Take a wet density reading on eachsublot using the procedure described in Section 10.3 and 10.4. Determine theaverage wet density obtained from the two sublots and use this average tocalculate the relative density of the test section. Record all rollerpass density testdata on a T407 form.
11.8 If the relative density of the test section is within 92 – 96 % of the maximumdensity of the approved mix design, or the maximum density established by themost recent plant mix formula verification, then density has been achieved andthe number of roller passes has been established for the remainder of the project.
11.9 If the relative density of the test section is above 96 % the Division will make avisual evaluation of the mat and the mixture to look for any appearance ofexcessive asphalt or an extremely fine mix which may result in over compaction.A review of any density test results obtained from the existing pavement will bemade to determine if the existing pavement density was significantly higher thanthe target density of the mix. The Division will determine whether additional testsections are needed or that the pavement is compacted to the satisfaction of theEngineer with the established number of roller passes. If it is later determined,through the Contractor’s daily quality control testing, that the mix had an air voidcontent below 2.5% then proper adjustments shall be made to the mix to bring theair voids back into the allowable tolerance limits. The Division may require theContractor to establish a new test section if such mix adjustments are required.
11.10 If the relative density of the test section is below 92 %, then a new test sectionshall be established and the Contractor shall make adjustments to his rollingoperation in an attempt to achieve a higher density level before the mattemperature reaches 175 °F (80 °C).
11.11 If the density requirement is not met after two consecutive test sections arecompleted, the Division will determine whether additional test sections areneeded or that the pavement is compacted to the satisfaction of the Engineer withthe established number of roller passes. To help with this decision, an evaluationwill be made of the existing pavement condition and any density test resultsobtained prior to construction of the test section will be reviewed. If it is laterdetermined, through the Contractor’s daily quality control testing, that the mixhad an air void content above 5.5% then proper adjustments shall be made to themix to bring the air voids back into the allowable tolerance limits. The Divisionmay require the Contractor to establish a new test section if such mix adjustmentsare required.
MP 401.05.20 ORIGINAL ISSUANCE: SEPTEMBER 1994 REVISED: MARCH 2000
PAGE 7 OF 7
11.12 The established number of roller passes shall continue for the remainder of theproject unless the Division determines that weather conditions or changes in thecondition of the existing roadway are affecting the rolling operation. Under suchcircumstances, the Division may request that a new roller pattern be establishedthrough a new test section.
11.13 The designated number of roller passes shall continue to be completed before themat temperature falls below 175 °F (80 °C) unless the conditions of Section 11.4have been established.
11.14 The Contractor shall designate a person to monitor and document the number ofroller passes and the mat temperature through the duration of the project.
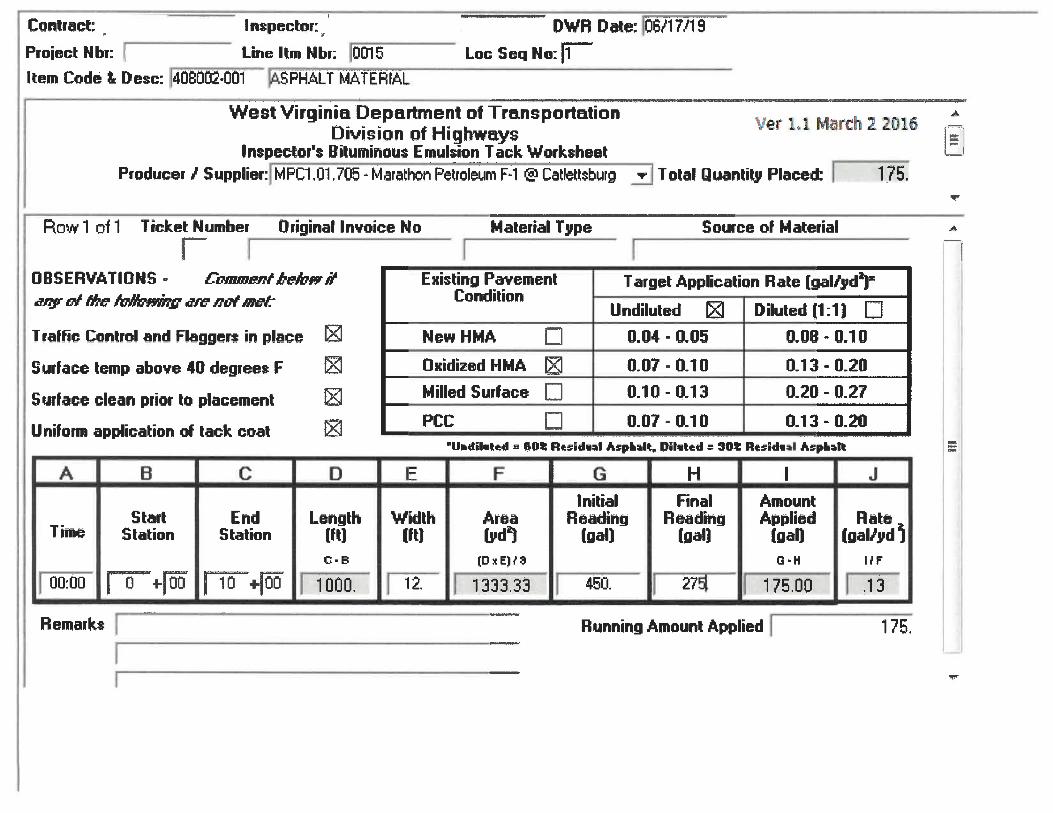
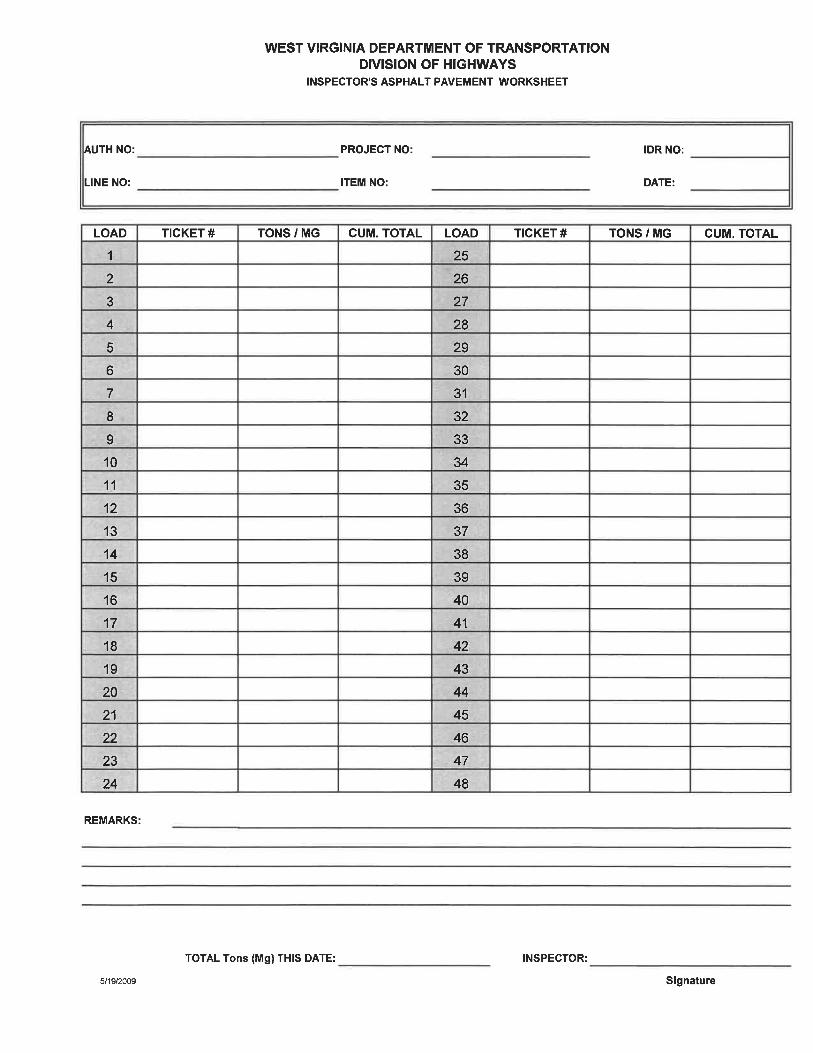
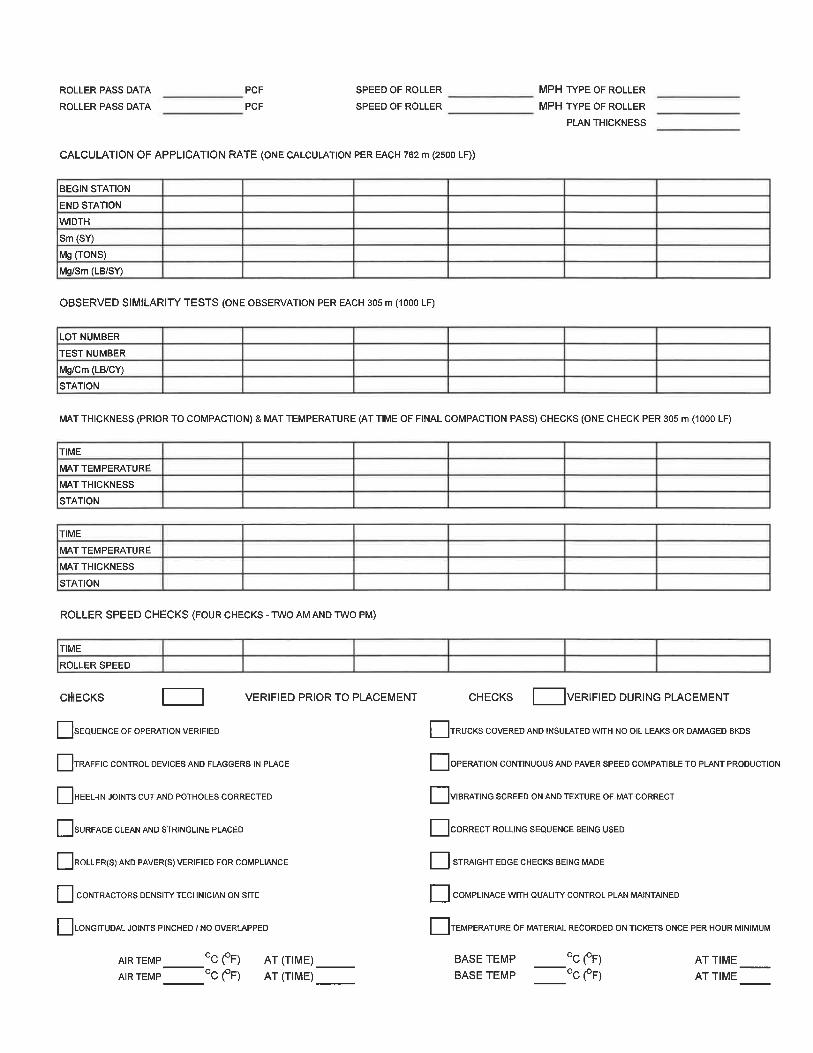
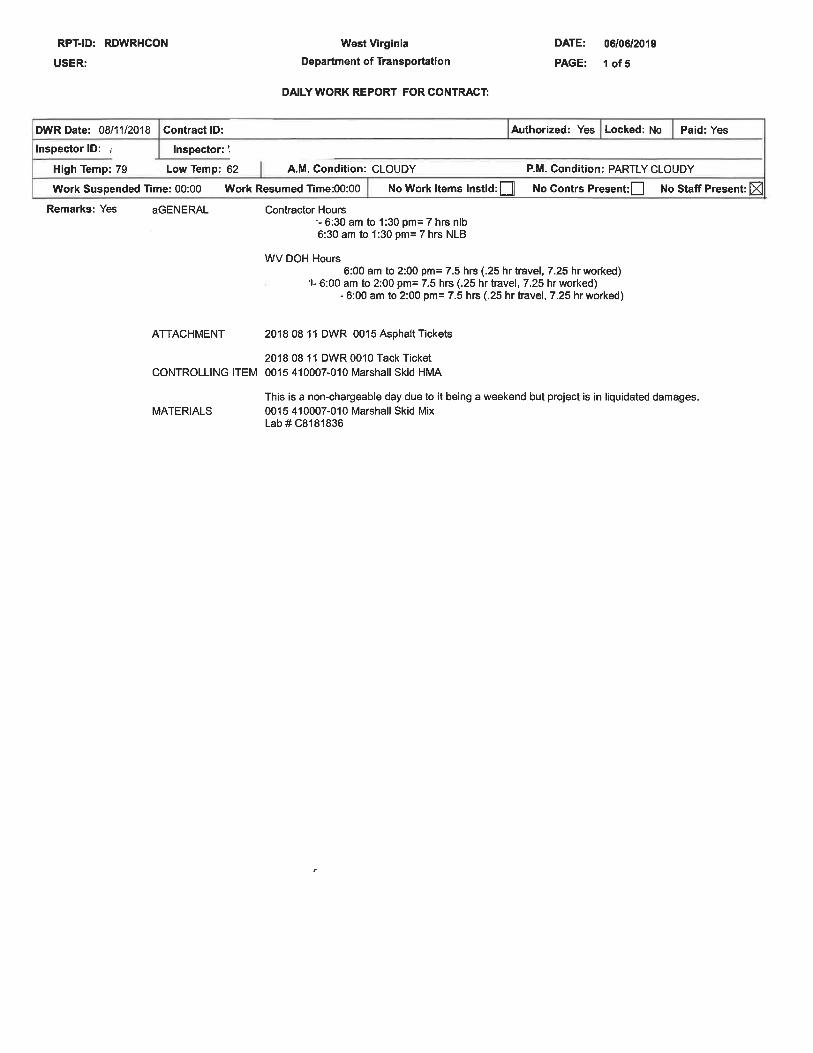
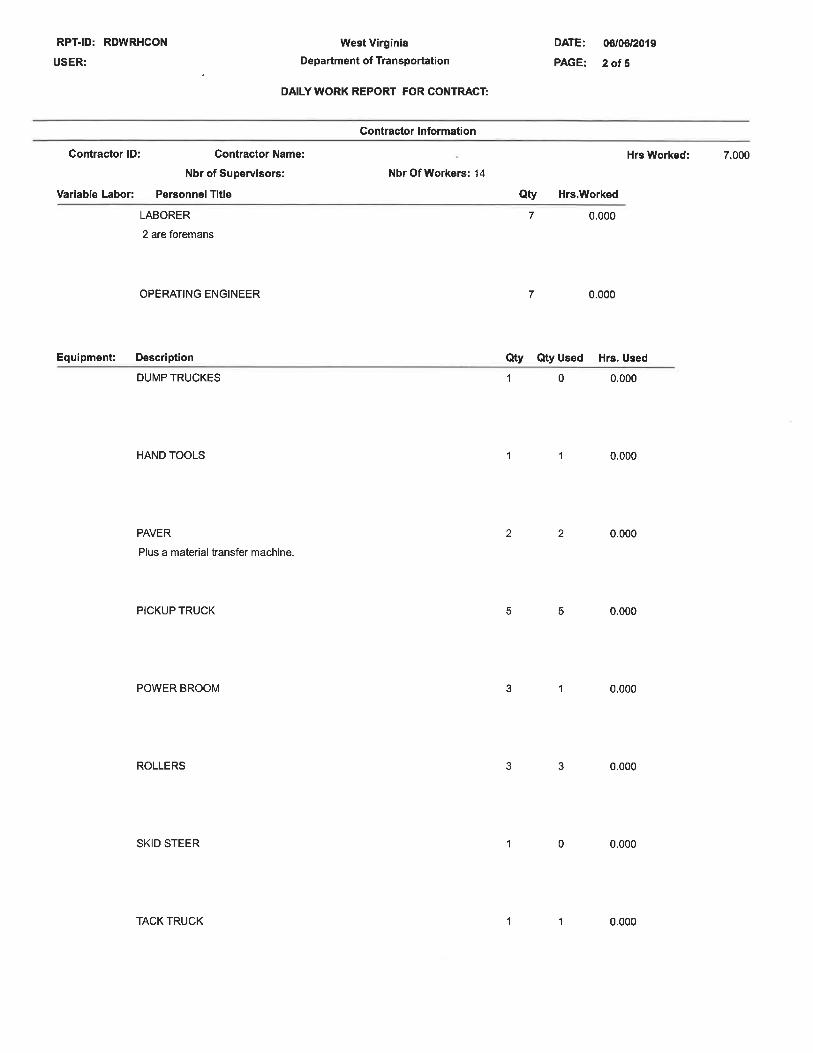
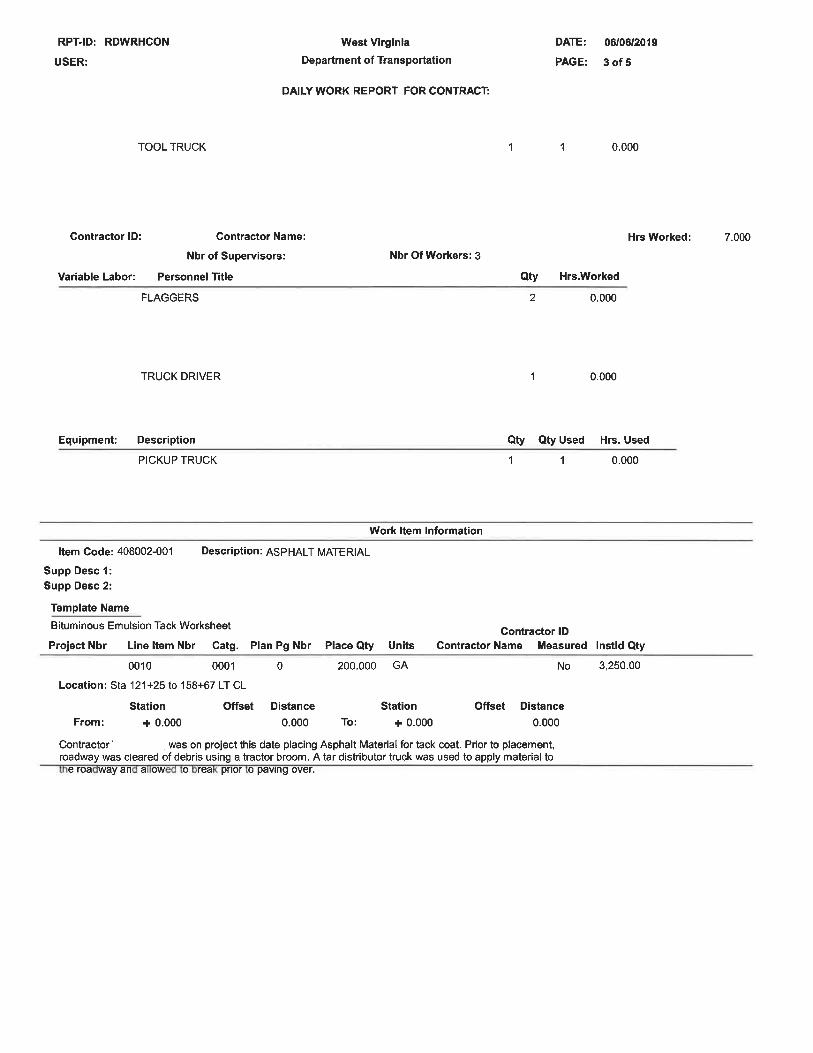
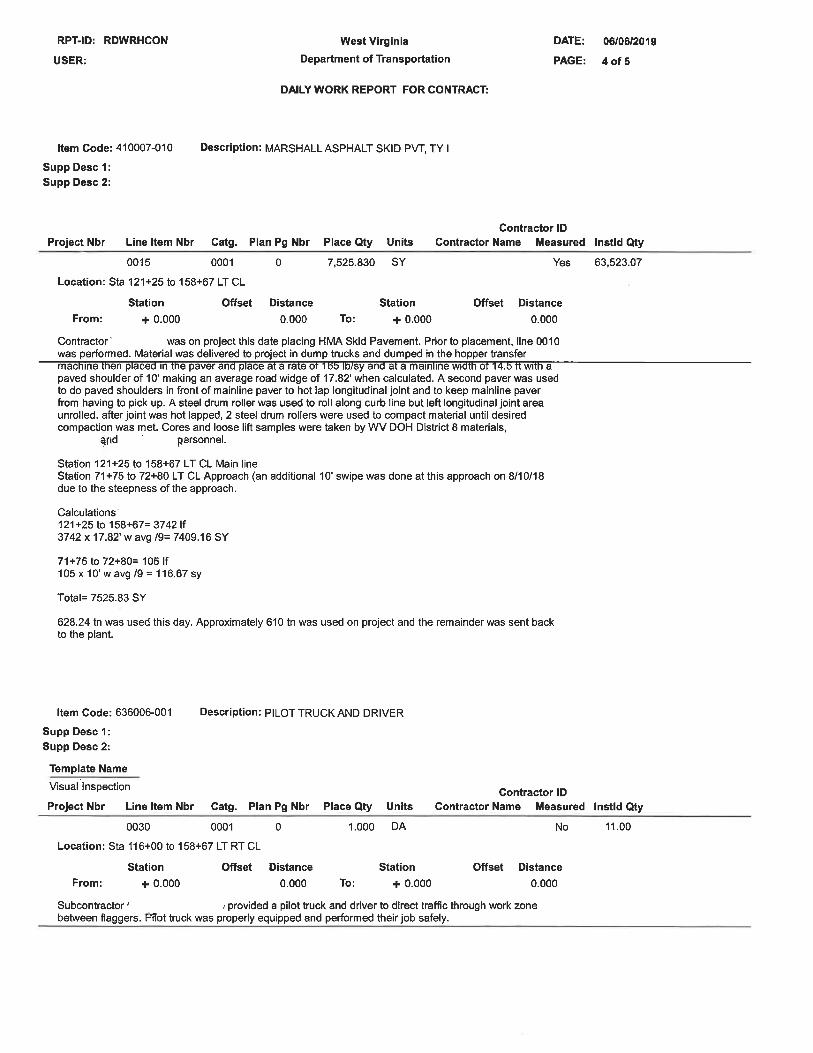
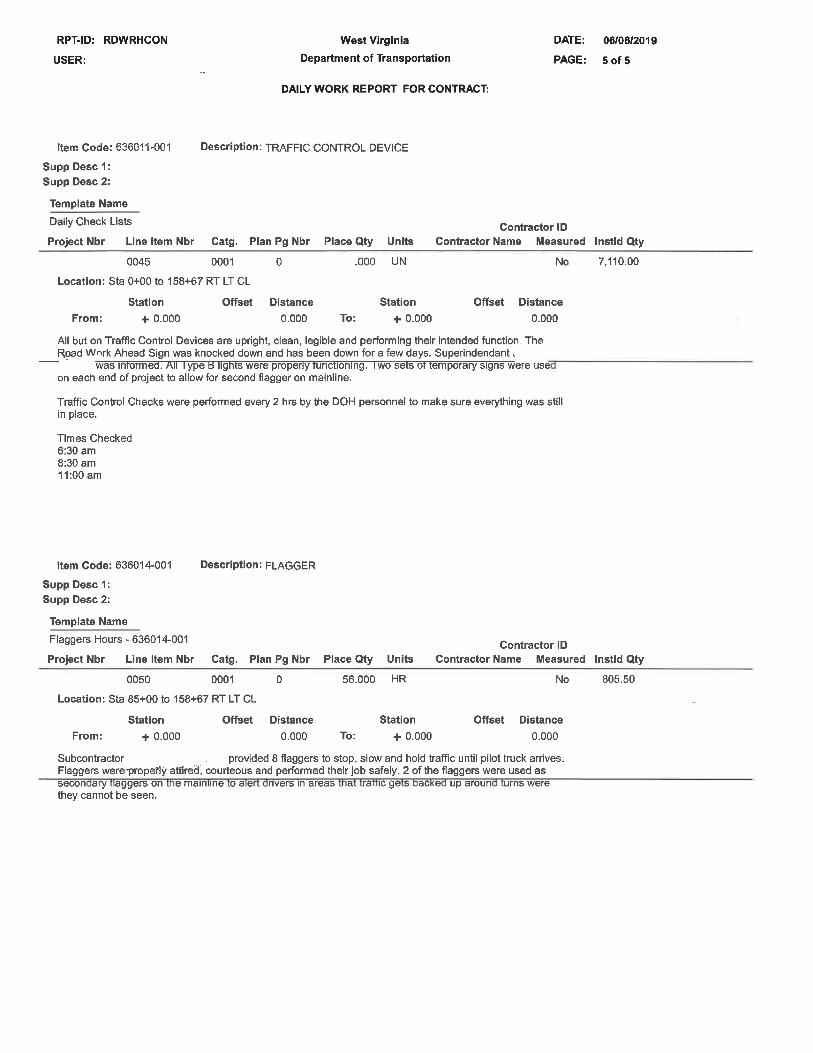
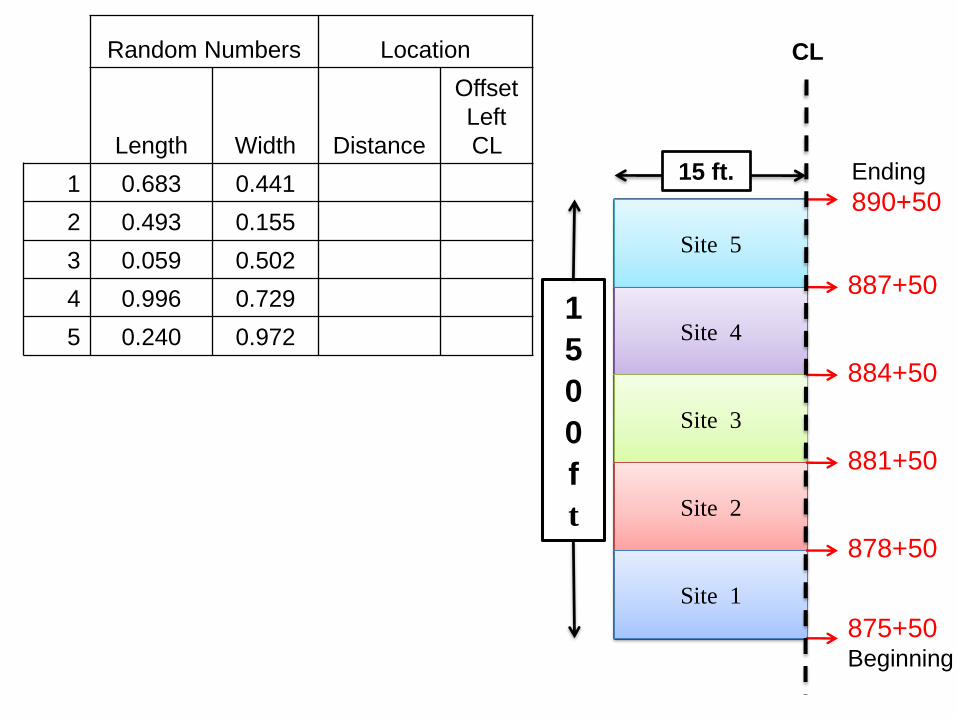
Site 5
Site 4
Site 3
Site 2
Site 1
15 ft.
1
5
0
0
f
t
881+50
878+50
Ending
890+50
887+50
884+50
875+50Beginning
Random Numbers Location
Length Width Distance
Offset
Left
CL
1 0.683 0.441
2 0.493 0.155
3 0.059 0.502
4 0.996 0.729
5 0.240 0.972
CL
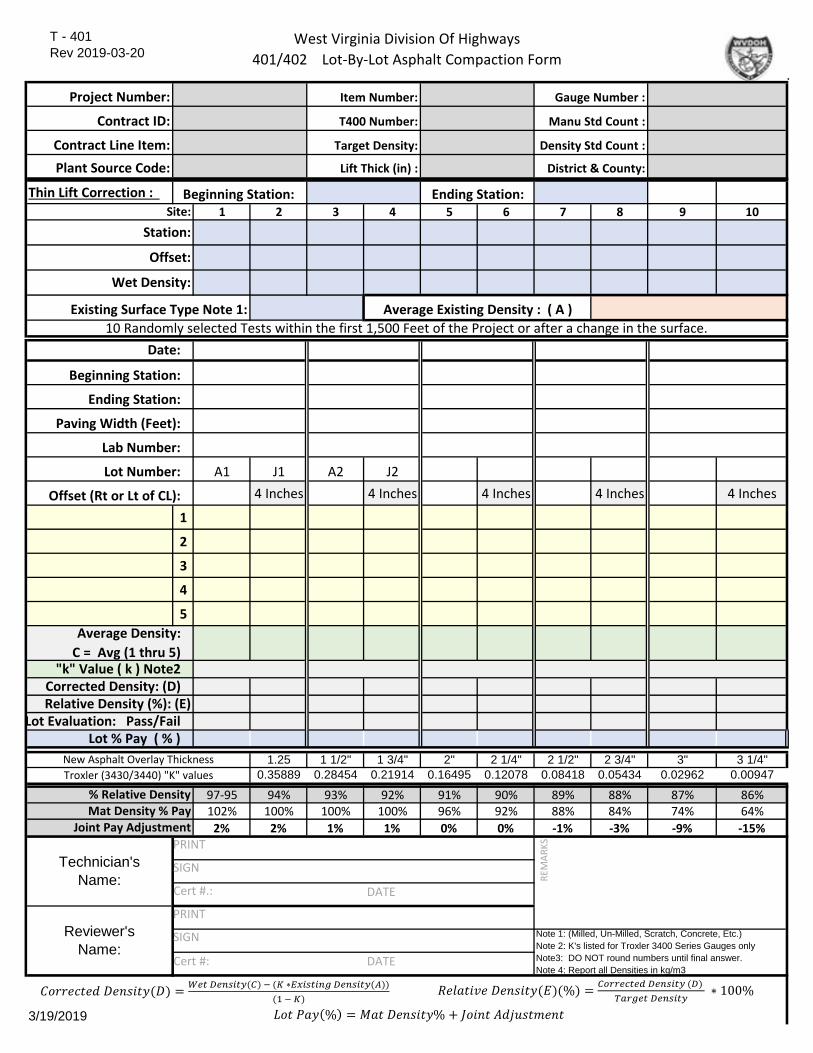
T - 401 Rev 2019-03-20
West Virginia Division Of Highways401/402 Lot-By-Lot Asphalt Compaction Form
.Project Number:
Contract ID:Contract Line Item:Plant Source Code:
Thin Lift Correction : 1 2 3 4 5 6 7 8 9 10
A1 J1 A2 J24 Inches 4 Inches 4 Inches 4 Inches 4 Inches
12345
1.25 1 1/2" 1 3/4" 2" 2 1/4" 2 1/2" 2 3/4" 3" 3 1/4"0.35889 0.28454 0.21914 0.16495 0.12078 0.08418 0.05434 0.02962 0.00947
97-95 94% 93% 92% 91% 90% 89% 88% 87% 86%102% 100% 100% 100% 96% 92% 88% 84% 74% 64%
2% 2% 1% 1% 0% 0% -1% -3% -9% -15%
3/19/2019
Note 1: (Milled, Un-Milled, Scratch, Concrete, Etc.)Note 2: K's listed for Troxler 3400 Series Gauges onlyNote3: DO NOT round numbers until final answer.Note 4: Report all Densities in kg/m3
Technician'sName:
Reviewer'sName:
New Asphalt Overlay ThicknessTroxler (3430/3440) "K" values
"k" Value ( k ) Note2
Average Density:C = Avg (1 thru 5)
Existing Surface Type Note 1:
Date:
Manu Std Count :
Beginning Station: Site:
Station:
Ending Station:
District & County:Density Std Count :
10 Randomly selected Tests within the first 1,500 Feet of the Project or after a change in the surface.Average Existing Density : ( A )
% Relative DensityMat Density % Pay
Joint Pay Adjustment
Paving Width (Feet):Lab Number:Lot Number:
Offset (Rt or Lt of CL):
Lot Evaluation: Pass/FailLot % Pay ( % )
Corrected Density: (D)Relative Density (%): (E)
Beginning Station:Ending Station:
Item Number: Gauge Number :
T400 Number:
Target Density: Lift Thick (in) :
Offset:Wet Density:
∗ % ∗ 100% % %
REM
ARKS
SIGN
DATECert #.:
SIGN
DATECert #:

T - 407 Rev 2019-04-04
West Virginia Division of Highways401/402 Rollerpass Asphalt Compaction Form
.Project Number:
Contract ID:Contract Line Item:Plant Source Code:
Lab Number:
1 2 3 4 5
Site # OffsetAB
A B A B A B A B A B
1 2 3 4 5 6 7 8 9 10
1 1/4 1 1/2" 1 3/4" 2" 2 1/4" 2 1/2" 2 3/4" 3" 3 1/4"
0.35889 0.28454 0.21914 0.16495 0.12078 0.08418 0.05434 0.02962 0.009472019-04-04 1.25 1.5 1.75 2 2.25 2.5 2.75 3 3.25
T400 Number:
Relative Corrected Density
Mfr Std Count :Target Density: Density Std Count : Lift Thick (in) : District & County:
Item Number: Gauge Number :
Existing Surface Type Note 1:
Proving Section Begin Station
Station numberOffset
Section Number:
Technician'sName:
Station Number
Begin Station
Ending Station
8 Passes
Ending Station
Beginning Station
Station
Note 1: (Milled, Un-Milled, Scratch, Concrete, Etc.)Note 2: K's listed for Troxler 3400 Series Gauges onlyNote3: DO NOT round numbers until final answer.Note 4: Report all Densities in kg/m3
Average Existing Density (A)
12 Passes
Date:K - Factor Note2:
New Asphalt Overlay Thickness
Thin Lift Correction
Average Corrected Wet Density
Avg Relative Corrected Density Pass/Fail
Ending Station
Offset (RoC/E)
Wet Density (kg/m3)
Control Section
Readings after:
Troxler (3430/3440) "K" values
Average Wet Density
Mat Temperature (°F)
Wet Density (Kg/m³)
Site #
Mat Temperature (F)
Corrected Density
Wet Density (Kg/m³)
Avg Wet Density (Kg/m³)
Site #
6 Passes
Section Number:
4 Passes 10 Passes
Reviewer'sName:
REM
ARKS
= ( ∗ ( ))( ) (%) = ∗ 100%
SIGN
DATECert #.:
SIGN
DATECert #:
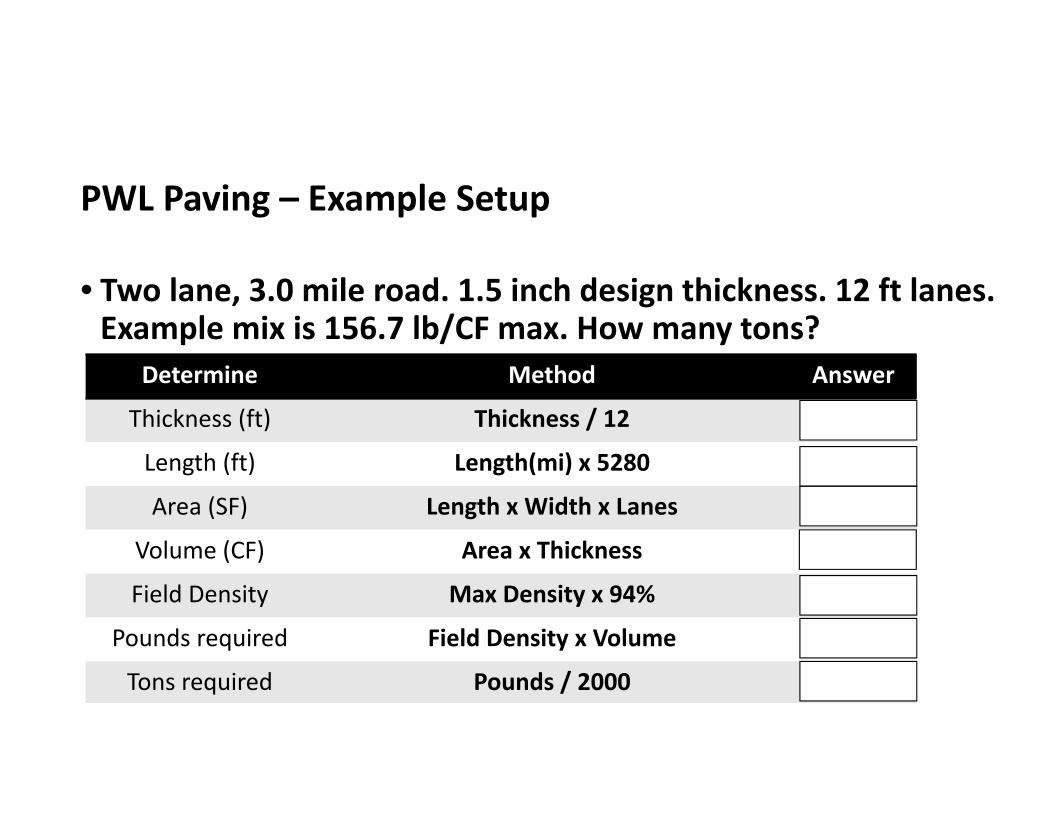
Determine Method AnswerThickness (ft) Thickness / 12 0.125
Length (ft) Length(mi) x 5280 15,840Area (SF) Length x Width x Lanes 380,160
Volume (CF) Area x Thickness 47,520Field Density Max Density x 94% 147.3
Pounds required Field Density x Volume 6,999,601Tons required Pounds / 2000 3500
PWL Paving – Example Setup
• Two lane, 3.0 mile road. 1.5 inch design thickness. 12 ft lanes. Example mix is 156.7 lb/CF max. How many tons?
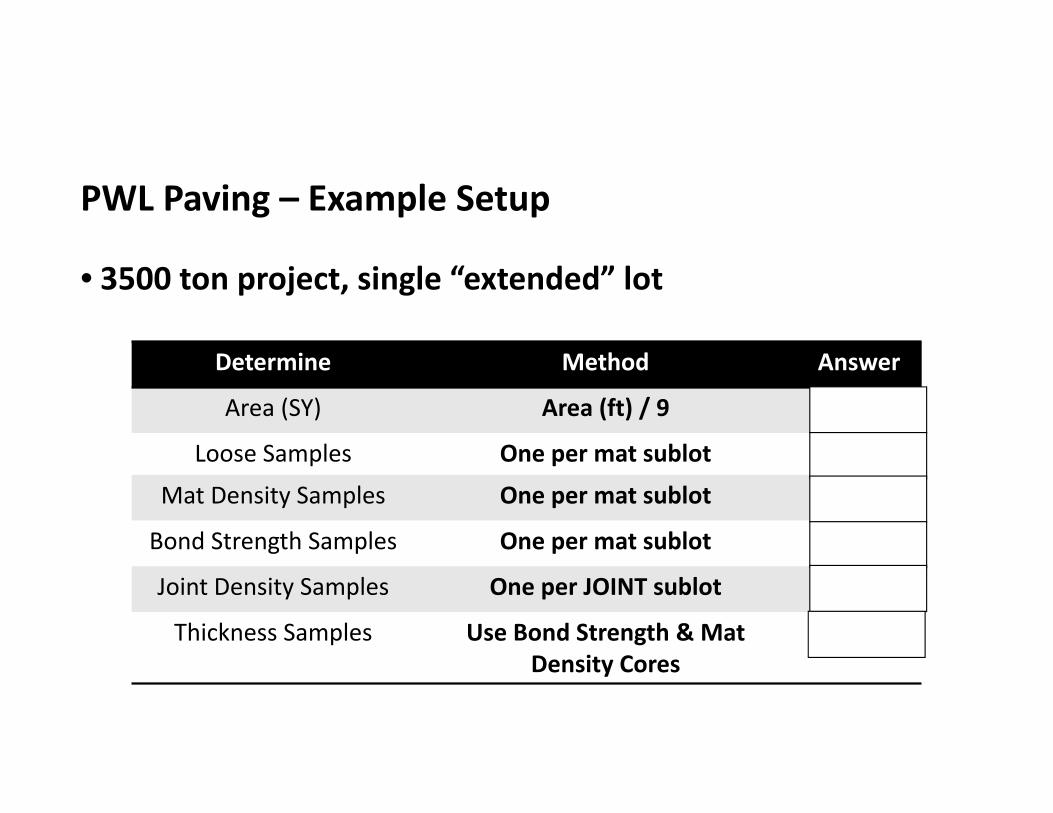
PWL Paving – Example Setup
• 3500 ton project, single “extended” lot
Determine Method Answer
Area (SY) Area (ft) / 9 42,240
Loose Samples One per mat sublot 7Mat Density Samples One per mat sublot 7
Bond Strength Samples One per mat sublot 7
Joint Density Samples One per JOINT sublot 8
Thickness Samples Use Bond Strength & Mat Density Cores
14
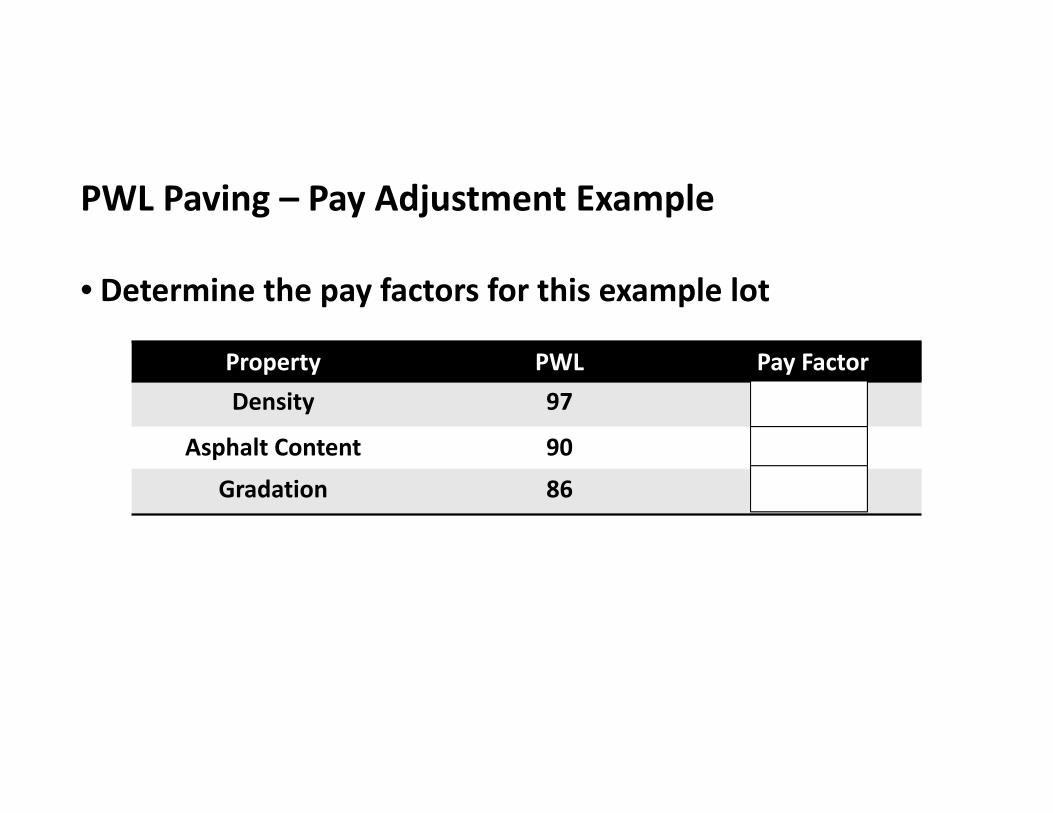
PWL Paving – Pay Adjustment Example
• Determine the pay factors for this example lot
Property PWL Pay FactorDensity 97 102
Asphalt Content 90 100Gradation 86 98
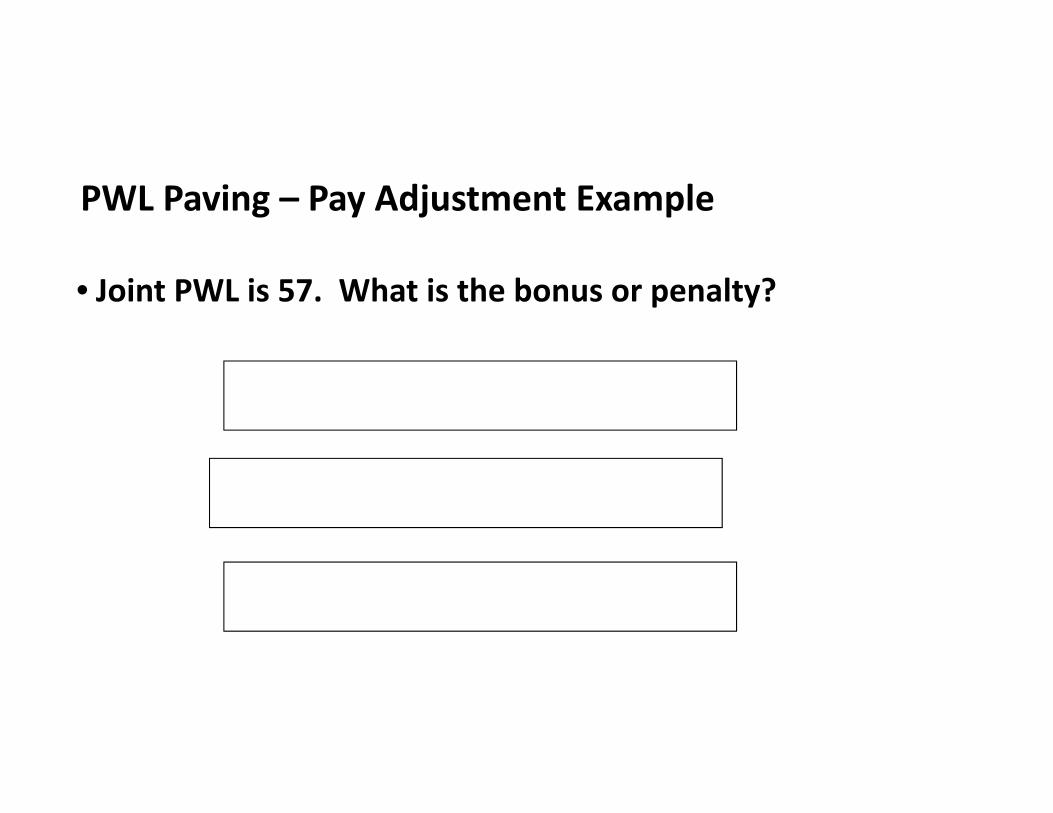
PWL Paving – Pay Adjustment Example
• Joint PWL is 57. What is the bonus or penalty?
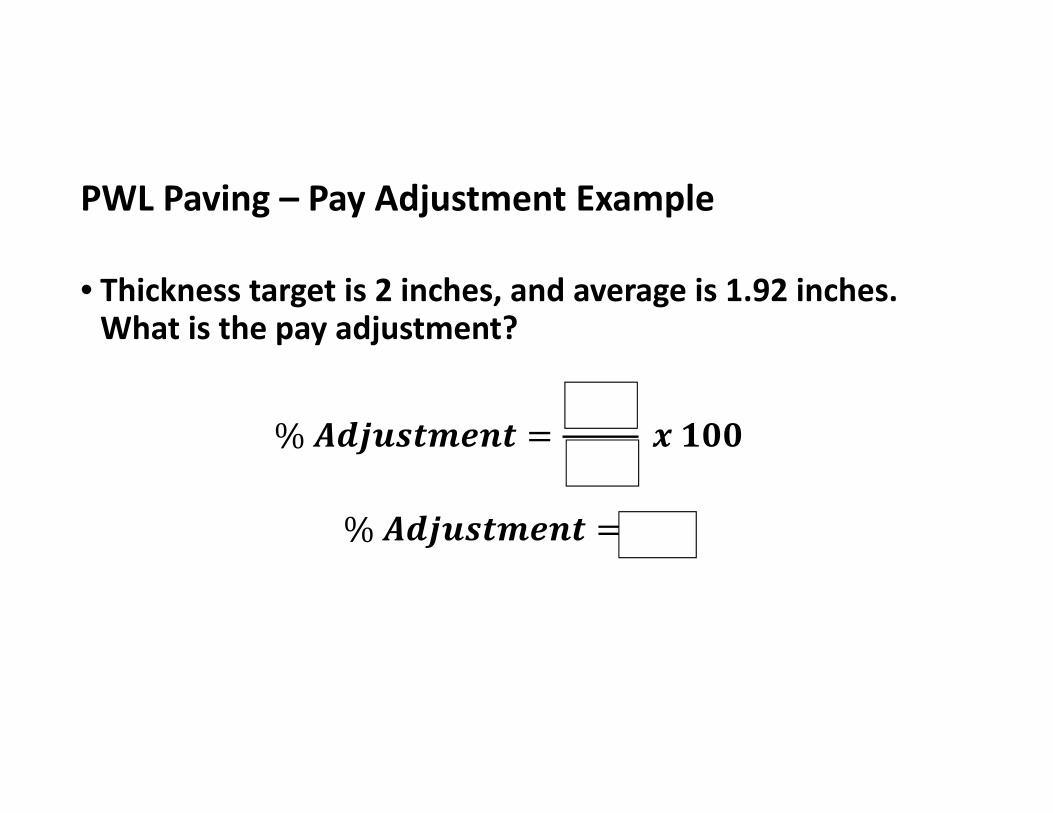
PWL Paving – Pay Adjustment Example
• Thickness target is 2 inches, and average is 1.92 inches. What is the pay adjustment?
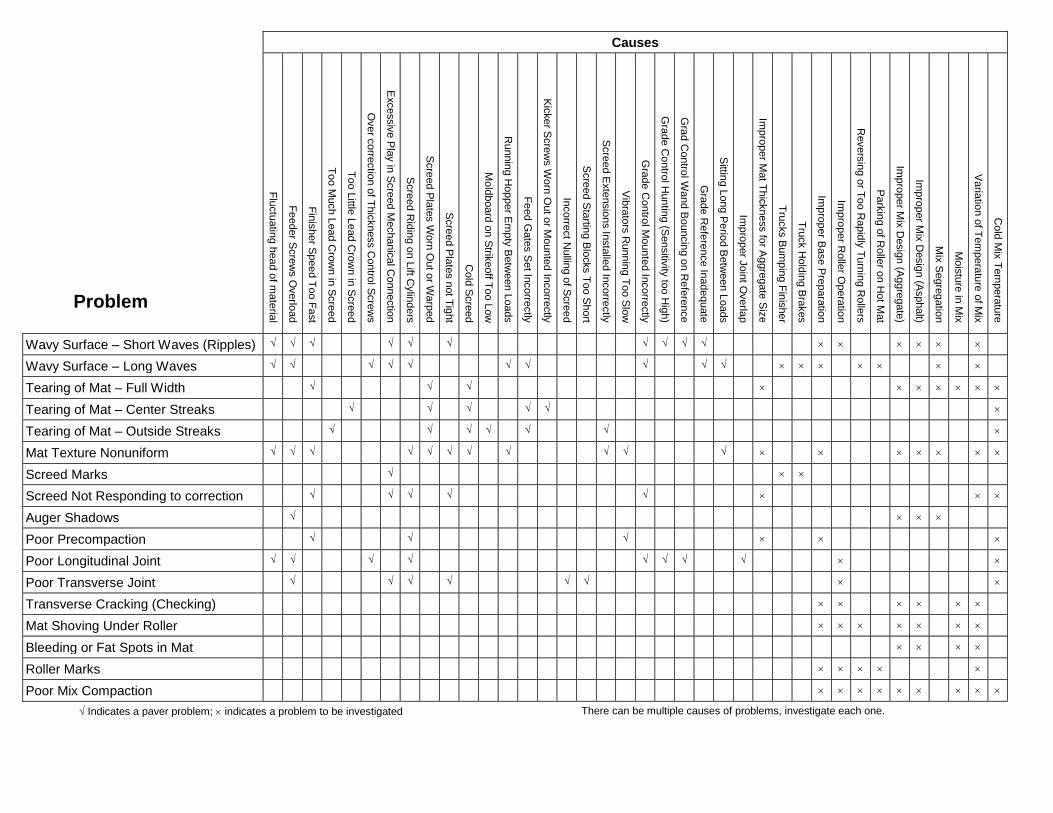
Problem
Causes
Flu
ctu
atin
g h
ead o
f ma
teria
l
Fe
eder S
cre
ws O
verlo
ad
Fin
isher S
peed T
oo F
ast
To
o M
uch L
ead C
row
n in
Scre
ed
To
o L
ittle L
ead C
row
n in
Scre
ed
Over c
orre
ctio
n o
f Th
ickness C
ontro
l Scre
ws
Excessiv
e P
lay in
Scre
ed M
echanic
al C
onnectio
n
Scre
ed R
idin
g o
n L
ift Cylin
ders
Scre
ed P
late
s W
orn
Out o
r Warp
ed
Scre
ed P
late
s n
ot T
ight
Cold
Scre
ed
Mo
ldboard
on S
trikeoff T
oo L
ow
Runnin
g H
opper E
mp
ty B
etw
een L
oads
Fe
ed G
ate
s S
et In
corre
ctly
Kic
ker S
cre
ws W
orn
Out o
r Mo
unte
d In
corre
ctly
Incorre
ct N
ullin
g o
f Scre
ed
Scre
ed S
tartin
g B
locks T
oo S
hort
Scre
ed E
xte
nsio
ns In
sta
lled In
corre
ctly
Vib
rato
rs R
unnin
g T
oo S
low
Gra
de C
ontro
l Mo
unte
d In
corre
ctly
Gra
de C
ontro
l Huntin
g (S
ensitiv
ity to
o H
igh)
Gra
d C
ontro
l Wand B
ouncin
g o
n R
efe
rence
Gra
de R
efe
rence In
adequate
Sittin
g L
ong P
erio
d B
etw
een L
oads
Imp
roper J
oin
t Overla
p
Imp
roper M
at T
hic
kness fo
r Aggre
gate
Siz
e
Tru
cks B
um
pin
g F
inis
her
Tru
ck H
old
ing B
rakes
Imp
roper B
ase P
repara
tion
Imp
roper R
olle
r Opera
tion
Revers
ing o
r To
o R
apid
ly T
urn
ing R
olle
rs
Park
ing o
f Rolle
r on H
ot M
at
Imp
roper M
ix D
esig
n (A
ggre
gate
)
Imp
roper M
ix D
esig
n (A
sphalt)
Mix
Segre
gatio
n
Mo
istu
re in
Mix
Varia
tion o
f Tem
pera
ture
of M
ix
Cold
Mix
Tem
pera
ture
Wavy Surface – Short Waves (Ripples) √ √ √ √ √ √ √ √ √ √
Wavy Surface – Long Waves √ √ √ √ √ √ √ √ √ √
Tearing of Mat – Full Width √ √ √
Tearing of Mat – Center Streaks √ √ √ √ √
Tearing of Mat – Outside Streaks √ √ √ √ √ √
Mat Texture Nonuniform √ √ √ √ √ √ √ √ √ √ √
Screed Marks √
Screed Not Responding to correction √ √ √ √ √
Auger Shadows √
Poor Precompaction √ √ √
Poor Longitudinal Joint √ √ √ √ √ √ √ √
Poor Transverse Joint √ √ √ √ √ √
Transverse Cracking (Checking)
Mat Shoving Under Roller
Bleeding or Fat Spots in Mat
Roller Marks
Poor Mix Compaction
√ Indicates a paver problem; indicates a problem to be investigated There can be multiple causes of problems, investigate each one.