warm-mix asphalt study: first-level analysis of phase 2b
TRANSCRIPT
UC DavisResearch reports
TitleWarm-Mix Asphalt Study: First-Level Analysis of Phase 2b Laboratory Testing on Laboratory-Prepared Specimens
Permalinkhttps://escholarship.org/uc/item/39c2g14q
AuthorsJones, D.Tsai, B.
Publication Date2012-06-01
eScholarship.org Powered by the California Digital LibraryUniversity of California
PREPARED FOR: California Department of Transportation Division of Research, Innovation and System Information Office of Materials and Infrastructure
PREPARED BY:
University of California Pavement Research Center
UC Davis, UC Berkeley
June 2012Research Report: UCPRC-RR-2012-07
Authors:D. Jones and B. Tsai
Partnered Pavement Research Program (PPRC) Contract Strategic Plan Element 4.18: Warm Mix Asphalt

UCPRC-RR-2012-07 i
DOCUMENT RETRIEVAL PAGE Research Report: UCPRC-RR-2012-07
Title: Warm-Mix Asphalt Study: First-Level Analysis of Phase 2b Laboratory Testing on Laboratory-Prepared Specimens
Authors: D. Jones and B. Tsai
Caltrans Technical Lead: C. Barros
Prepared for: Caltrans
FHWA No.: CA152385A
Work Submitted: 06/15/2015
DateJune 2012
Strategic Plan Element No.: 4.18
DRISI Task No.: 2385
Status: Final
Version No.: 2
Abstract: This report describes laboratory testing of laboratory-prepared specimens as part of the second phase of a warm mix asphalt study, which compares the performance of a hot mix control produced at 310°F (155°C) against the performance of warm mixes produced at 250°F (120°C) with four different technologies (Advera, Evotherm, Sasobit, and Rediset). Key findings from the study include: • The laboratory test results indicate that use of the warm mix technologies assessed in this study, which were
produced and compacted at lower temperatures, did not significantly influence the performance of the asphalt concrete when compared to control specimens produced and compacted at conventional hot mix asphalt temperatures.
• Laboratory performance in all the tests appeared to be mostly dependent on air-void content and less dependent on mix production temperature.
• Test results were influenced by specimen air-void content, actual stress and strain levels, and actual test temperature. Variation in these parameters needs to be taken into consideration when comparing performance between the different mixes.
• All mixes were sensitive to moisture content. Rutting performance, fatigue-cracking performance, and tensile strength retained all deteriorated with increasing moisture content in the specimens.
• All mixes performed significantly better in the Hamburg Wheel-Track Test when subjected to additional curing, indicating that hot and warm mixes are likely to have similar performance on in-service pavements after a short period of aging (e.g., 6 to 12 months). This is consistent with performance on the test track.
• Test results were consistent with those from earlier testing phases. The laboratory testing completed in this phase has provided no new results to suggest that warm mix technologies should not be used in dense- or open-graded mixes in California, provided that standard specified construction and performance limits for hot mix asphalt are met. It should be noted that lower production temperatures could lead to insufficient drying of aggregates, which in turn could result in moisture-related problems in the road. Moisture content in aggregates should be strictly controlled at asphalt plants and specified mix moisture contents (i.e., less than 1.0 percent by weight of the mix) should be adhered to.
Keywords: Warm mix asphalt, WMA, laboratory testing, accelerated pavement testing, Heavy Vehicle Simulator
Proposals for implementation: Continue with statewide implementation.
Related documents: UCPRC Workplan, WP-2007-01; Research Reports, RR-2008-11, RR-2009-02, RR-2011-02, RR-2011-03
Signatures:
D. Jones 1st Author
J. Harvey Technical Review
D. Spinner Editor
J. Harvey Principal Investigator
C. Barros Caltrans Technical Lead
T.J. Holland Caltrans Contract Manager

ii UCPRC-RR-2012-07
Blank page
UCPRC-RR-2012-07 iii
DISCLAIMER STATEMENT
This document is disseminated in the interest of information exchange. The contents of this report reflect
the views of the authors who are responsible for the facts and accuracy of the data presented herein. The
contents do not necessarily reflect the official views or policies of the State of California or the Federal
Highway Administration. This publication does not constitute a standard, specification or regulation. This
report does not constitute an endorsement by the Department of any product described herein.
For individuals with sensory disabilities, this document is available in alternate formats. For information,
call (916) 654-8899, TTY 711, or write to California Department of Transportation, Division of Research,
Innovation and System Information, MS-83, P.O. Box 942873, Sacramento, CA 94273-0001.
SUMMARY OF PROJECT OBJECTIVES
The objective of this warm mix asphalt study is to determine whether the use of additives that reduce the
production and construction temperatures of hot mix asphalt influences performance of the mix. This will
be achieved through the following tasks:
1. Preparation of a workplan to guide the research
2. Monitoring the construction of Heavy Vehicle Simulator (HVS) and in-service test sections
3. Sampling of mix and mix components during asphalt concrete production and construction
4. Trafficking of demarcated sections with the HVS in a series of tests to assess performance
5. Conducting laboratory tests to identify comparable laboratory performance measures
6. Monitoring the performance of in-service pilot sections
7. Preparation of first- and second-level analysis reports and a summary report detailing the
experiment and the findings
This report covers Tasks 5 and 7.
iv UCPRC-RR-2012-07
ACKNOWLEDGEMENTS
The University of California Pavement Research Center acknowledges the following individuals and
organizations who contributed to the project:
Ms. Cathrina Barros, Mr. Joseph Peterson, Ms. Terrie Bressette (retired), and Dr. T. Joseph Holland, Caltrans
Mr. Mike Cook and the staff of Graniterock Company Ms. Annette Smith, PQ Corporation Dr. Everett Crews, MWV Asphalt Innovations Dr. Sundaram Logaraj, Akzo Nobel Surface Chemistry, LLC. and Mr. Prem Naidoo consultant to
Akzo Nobel Surface Chemistry, LLC Mr. John Shaw and Mr. Larry Michael, Sasol Wax Americas The UCPRC Laboratory Staff
UCPRC-RR-2012-07 v
EXECUTIVE SUMMARY
Another phase of a comprehensive study into the use of warm mix asphalt has been completed for the
California Department of Transportation (Caltrans) by the University of California Pavement Research
Center (UCPRC). This phase of the study, which covered tests on laboratory-mixed, laboratory-
compacted (LMLC) specimens and compared results from previous testing on plant-mixed, field-
compacted (PMFC) and plant-mixed, laboratory-compacted specimens (PMLC), was based on a
workplan approved by Caltrans. Laboratory tests assessed rutting and fatigue cracking performance,
moisture sensitivity, and open-graded friction course durability. The objective of the study is to determine
whether the use of technologies that reduce the production and construction temperatures of asphalt
concrete influences performance of the mix. The study compared the performance of a control mix,
produced and compacted at conventional hot mix asphalt temperatures (310°F [154°C]), with four warm
mixes, produced and compacted at 36°F (20°C) lower than the control. These target production
temperatures were the same as those used for the production of asphalt for the test track used in the
Phase 1 and Phase 2 accelerated pavement testing studies. The warm-mix technologies assessed in the
laboratory study included Advera WMA®, Evotherm DATTM, and Sasobit®. In this report, the results for a
fourth technology (RedisetTM) that was tested in a separate study, but using the same aggregates and
testing procedures, are also included.
Specimens for this phase of the study were produced at the UCPRC laboratory in Richmond, California,
using the same mix design developed by the Graniterock Company for the test track described above. No
adjustments were made to the mix design to accommodate the warm mix technologies.
Key findings from this study include the following:
The laboratory test results indicate that use of the warm mix technologies assessed in this study, which were produced and compacted at lower temperatures, did not significantly influence the performance of the asphalt concrete when compared to control specimens produced and compacted at conventional hot mix asphalt temperatures.
Laboratory performance in all the tests appeared to be mostly dependent on air-void content and less dependent on mix production temperature.
Test results were influenced by specimen air-void content, actual stress and strain levels, and actual test temperature. Variation in these parameters needs to be taken into consideration when comparing performance between the different mixes.
All mixes were sensitive to moisture content. Rutting performance, fatigue-cracking performance, and tensile strength retained all deteriorated with increasing moisture content in the specimens.
All mixes performed significantly better in the Hamburg Wheel-Track Test when subjected to additional curing, indicating that hot and warm mixes are likely to have similar performance on in-
vi UCPRC-RR-2012-07
service pavements after a short period of aging (e.g., 6 to 12 months). This is consistent with performance on the test track.
Test results were consistent with those from earlier testing phases.
The laboratory testing completed in this phase of the study has provided no new results to suggest that
warm mix technologies should not be used in dense- or open-graded mixes in California, provided that
standard specified construction and performance limits for hot mix asphalt are met. It should be noted that
lower production temperatures could lead to insufficient drying of aggregates, which in turn could result
in moisture-related problems in the road. Moisture content in aggregates should be strictly controlled at
asphalt plants and specified mix moisture contents (i.e., less than 1.0 percent by weight of the mix) should
be adhered to.
UCPRC-RR-2012-07 vii
TABLE OF CONTENTS
EXECUTIVE SUMMARY ......................................................................................................................... v LIST OF TABLES ...................................................................................................................................... ix LIST OF FIGURES ..................................................................................................................................... x LIST OF ABBREVIATIONS .................................................................................................................... xi CONVERSION FACTORS ...................................................................................................................... xii 1. INTRODUCTION ............................................................................................................................. 1
1.1 Background ............................................................................................................................... 1 1.2 Project Objectives ...................................................................................................................... 1 1.3 Overall Project Organization ..................................................................................................... 2
1.3.1 Project Deliverables ...................................................................................................... 4 1.4 Structure and Content of this Report ......................................................................................... 4
1.4.1 Warm Mix Technologies Tested ................................................................................... 4 1.4.2 Report Layout ............................................................................................................... 5
1.5 Measurement Units .................................................................................................................... 5 1.6 Terminology .............................................................................................................................. 5
2. EXPERIMENTAL DESIGN ............................................................................................................ 7 2.1 Introduction ............................................................................................................................... 7 2.2 Experiment Design .................................................................................................................... 7
2.2.1 Rutting Performance Testing ........................................................................................ 7 2.2.2 Beam Fatigue Testing ................................................................................................... 8 2.2.3 Moisture Sensitivity Testing ......................................................................................... 9 2.2.4 Open-Graded Friction Course Durability Testing ....................................................... 10
2.3 Material Sampling ................................................................................................................... 10 2.4 Specimen Preparation .............................................................................................................. 10
2.4.1 Aggregate .................................................................................................................... 10 2.4.2 Warm Mix Additives .................................................................................................. 11 2.4.3 Asphalt Binder ............................................................................................................ 11 2.4.4 Curing ......................................................................................................................... 12 2.4.5 Compaction ................................................................................................................. 12
3. TEST RESULTS .............................................................................................................................. 13 3.1 Rutting Performance Tests ...................................................................................................... 13
3.1.1 Air-Void Content ........................................................................................................ 13 3.1.2 Resilient Shear Modulus (G) ....................................................................................... 13 3.1.3 Permanent Shear Strain at 5,000 Cycles ..................................................................... 15
3.2 Beam Fatigue Tests ................................................................................................................. 16 3.2.1 Air-Void Content ........................................................................................................ 16 3.2.2 Initial Stiffness ............................................................................................................ 17 3.2.3 Initial Phase Angle ...................................................................................................... 19 3.2.4 Fatigue Life at 50 Percent Stiffness Reduction ........................................................... 20
3.3 Flexural Frequency Sweep Test .............................................................................................. 21 3.3.1 Air-Void Content ........................................................................................................ 21 3.3.2 Complex Modulus ....................................................................................................... 22
3.4 Moisture Sensitivity: Hamburg Wheel-Track Test ................................................................ 28 3.4.1 Air-Void Content ........................................................................................................ 28 3.4.2 Hamburg Wheel-Track Rutting ................................................................................... 28 3.4.3 Hamburg Wheel-Track Rutting: Effect of Cure Time and Aggregate Moisture Content 29
3.5 Moisture Sensitivity: Tensile Strength Retained (TSR) Test ................................................. 31 3.5.1 Air-Void Content ........................................................................................................ 31 3.5.2 Tensile Strengths ......................................................................................................... 31
viii UCPRC-RR-2012-07
3.6 Durability of Open-Graded Friction Course Mixes: Cantabro Test ....................................... 32 3.6.1 Air-Void Content ........................................................................................................ 32 3.6.2 Abrasion Loss ............................................................................................................. 33
3.7 Summary of Laboratory Testing Results ................................................................................. 34 4. COMPARISON OF TEST RESULTS ........................................................................................... 35 5. CONCLUSIONS AND RECOMMENDATIONS ......................................................................... 37
5.1 Conclusions ............................................................................................................................. 37 5.2 Recommendations ................................................................................................................... 37
REFERENCES ........................................................................................................................................... 39 APPENDIX A: BEAM FATIGUE SOAKING PROCEDURE .......................................................... 41 APPENDIX B: LABORATORY TEST RESULTS ............................................................................ 43
UCPRC-RR-2012-07 ix
LIST OF TABLES
Table 2.1: Mix Design for Standard Test Specimen Preparation ............................................................... 11 Table 2.2: Mix Design for Cantabro Test Specimen Preparation .............................................................. 11 Table 3.1: Summary of Air-Void Contents of Shear Test Specimens ....................................................... 13 Table 3.2: Summary of Resilient Shear Modulus Results ......................................................................... 14 Table 3.3: Summary of Permanent Shear Strain at 5,000 Cycles .............................................................. 15 Table 3.4: Summary of Air-Void Contents of Beam Fatigue Specimens .................................................. 17 Table 3.5: Summary of Initial Stiffness Results at 20°C ........................................................................... 18 Table 3.6: Summary of Phase Angle Results at 20°C ................................................................................ 19 Table 3.7: Summary of Fatigue Life Results at 20°C ................................................................................ 20 Table 3.8: Summary of Air-Void Contents of Flexural Frequency Sweep Specimens ............................. 21 Table 3.9: Summary of Master Curves and Time-Temperature Relationships .......................................... 23 Table 3.10: Summary of Air-Void Contents of Hamburg Test Specimens ............................................... 28 Table 3.11: Summary of Hamburg Wheel-Track Test Results .................................................................. 29 Table 3.12: Summary of Hamburg Wheel-Track Test Results (Cure Time and Moisture Content) ......... 30 Table 3.13: Summary of Air-Void Contents of Tensile Strength Retained Test Specimens ..................... 31 Table 3.14: Summary of Tensile Strength Retained Test Results ............................................................. 32 Table 3.15: Summary of Air-Void Contents of Cantabro Test Specimens ................................................ 33 Table 3.16: Summary of Cantabro Test Results ........................................................................................ 33
x UCPRC-RR-2012-07
LIST OF FIGURES
Figure 3.1: Mean air-void contents of shear specimens. ............................................................................ 14 Figure 3.2: Average Resilient Shear Modulus at 45°C and 55°C. ............................................................. 15 Figure 3.3: Permanent shear strain at 5,000 cycles at 45°C and 55°C. ...................................................... 16 Figure 3.4: Mean air-void contents of beam fatigue specimens. ................................................................ 17 Figure 3.5: Plot of average initial stiffness for dry test. ............................................................................. 18 Figure 3.6: Plot of average initial phase angle. .......................................................................................... 19 Figure 3.7: Plot of average fatigue life. ...................................................................................................... 20 Figure 3.8: Mean air-void contents of flexural frequency sweep specimens. ............................................ 21 Figure 3.9: Complex modulus (E*) master curves (dry) at 20°C reference temperature. .......................... 24 Figure 3.10: Temperature-shifting relationship (dry) at 20°C reference temperature. ............................... 24 Figure 3.11: Complex modulus (E*) master curves (wet) at 20°C reference temperature. ........................ 25 Figure 3.12: Temperature-shifting relationship (wet) at 20°C reference temperature. .............................. 25 Figure 3.13: Percent change in stiffness between wet and dry tests. .......................................................... 26 Figure 3.14: Mean air-void contents of Hamburg Wheel-Track specimens. ............................................. 28 Figure 3.15: Average Hamburg Wheel-Track rut progression curves. ...................................................... 29 Figure 3.16: Effect of cure time and moisture content on Hamburg Wheel-Track test results. ................. 30 Figure 3.17: Mean air-void contents of TSR specimens. ........................................................................... 31 Figure 3.18: Average tensile strength retained for each mix. ..................................................................... 32 Figure 3.19: Mean air-void contents of Cantabro specimens. .................................................................... 33 Figure 3.20: Cantabro test results. .............................................................................................................. 34
UCPRC-RR-2012-07 xi
LIST OF ABBREVIATIONS
AASHTO American Association of State Highway and Transport Officials
ASTM American Society for Testing and Materials
Caltrans California Department of Transportation
DCP Dynamic Cone Penetrometer
DGAC Dense-graded asphalt concrete
ESAL Equivalent standard axle load
FHWA Federal Highway Administration
FWD Falling Weight Deflectometer
HMA Hot mix asphalt
HVS Heavy Vehicle Simulator
HWTT Hamburg Wheel-Track Test
LMLC Laboratory-mixed, laboratory-compacted
LVDT Linear variable differential transformer
MDD Multi-Depth Deflectometer
MPD Mean profile depth
NCAT National Center for Asphalt Technology
OGFC Open-graded friction course
PMFC Plant-mixed, field-compacted
PMLC Plant-mixed, laboratory-compacted
PPRC Partnered Pavement Research Center
PSS Permanent shear strain
RHMA-G Gap-graded rubberized hot mix asphalt
RWMA-G Gap-graded rubberized warm mix asphalt
SPE Strategic Plan Element
TSR Tensile strength retained
UCPRC University of California Pavement Research Center
WMA Warm mix asphalt
xii UCPRC-RR-2012-07
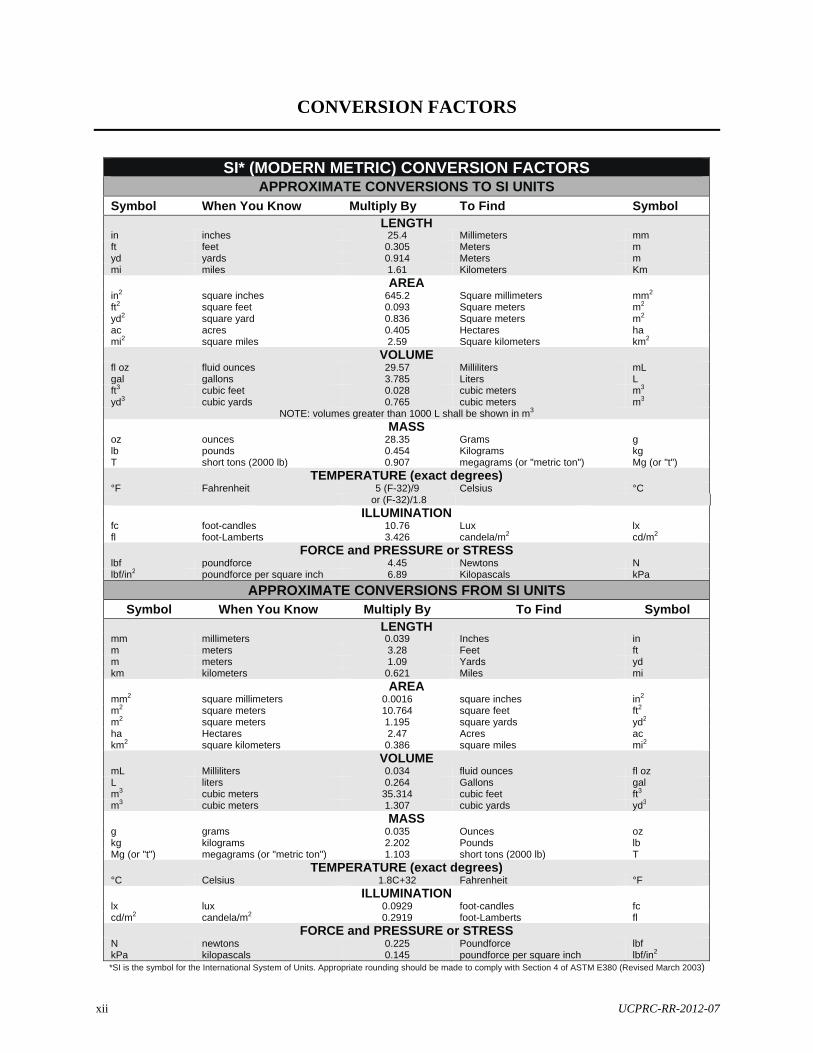
CONVERSION FACTORS
SI* (MODERN METRIC) CONVERSION FACTORS APPROXIMATE CONVERSIONS TO SI UNITS
Symbol When You Know Multiply By To Find Symbol LENGTH
in inches 25.4 Millimeters mm ft feet 0.305 Meters m yd yards 0.914 Meters m mi miles 1.61 Kilometers Km
AREAin2 square inches 645.2 Square millimeters mm2 ft2 square feet 0.093 Square meters m2 yd2 square yard 0.836 Square meters m2 ac acres 0.405 Hectares ha mi2 square miles 2.59 Square kilometers km2
VOLUMEfl oz fluid ounces 29.57 Milliliters mL gal gallons 3.785 Liters L ft3 cubic feet 0.028 cubic meters m3 yd3 cubic yards 0.765 cubic meters m3
NOTE: volumes greater than 1000 L shall be shown in m3
MASSoz ounces 28.35 Grams g lb pounds 0.454 Kilograms kg T short tons (2000 lb) 0.907 megagrams (or "metric ton") Mg (or "t")
TEMPERATURE (exact degrees)°F Fahrenheit 5 (F-32)/9 Celsius °C
or (F-32)/1.8
ILLUMINATION fc foot-candles 10.76 Lux lx fl foot-Lamberts 3.426 candela/m2 cd/m2
FORCE and PRESSURE or STRESS lbf poundforce 4.45 Newtons N lbf/in2 poundforce per square inch 6.89 Kilopascals kPa
APPROXIMATE CONVERSIONS FROM SI UNITS
Symbol When You Know Multiply By To Find Symbol LENGTH
mm millimeters 0.039 Inches in m meters 3.28 Feet ft m meters 1.09 Yards yd km kilometers 0.621 Miles mi
AREAmm2 square millimeters 0.0016 square inches in2 m2 square meters 10.764 square feet ft2 m2 square meters 1.195 square yards yd2 ha Hectares 2.47 Acres ac km2 square kilometers 0.386 square miles mi2
VOLUMEmL Milliliters 0.034 fluid ounces fl oz L liters 0.264 Gallons gal m3 cubic meters 35.314 cubic feet ft3 m3 cubic meters 1.307 cubic yards yd3
MASSg grams 0.035 Ounces oz kg kilograms 2.202 Pounds lb Mg (or "t") megagrams (or "metric ton") 1.103 short tons (2000 lb) T
TEMPERATURE (exact degrees) °C Celsius 1.8C+32 Fahrenheit °F
ILLUMINATION lx lux 0.0929 foot-candles fc cd/m2 candela/m2 0.2919 foot-Lamberts fl
FORCE and PRESSURE or STRESSN newtons 0.225 Poundforce lbf kPa kilopascals 0.145 poundforce per square inch lbf/in2
*SI is the symbol for the International System of Units. Appropriate rounding should be made to comply with Section 4 of ASTM E380 (Revised March 2003)
UCPRC-RR-2012-07 1
1. INTRODUCTION
1.1 Background
Warm mix asphalt (WMA) is a relatively new technology. It was developed in response to the needs for
reduced energy consumption and stack emissions during the production of asphalt concrete, and to allow
longer hauls, lower placement temperatures, improved workability, and better working conditions for
plant and paving crews. Studies in the United States and Europe indicate that significant reductions in
production and placement temperatures, and potentially related emissions, are possible.
Research initiatives on warm mix asphalt are currently being conducted in a number of states, as well as
by the Federal Highway Administration (FHWA) and the National Center for Asphalt Technology
(NCAT), with the latter currently carrying out accelerated pavement testing experiments.
The California Department of Transportation (Caltrans) has expressed interest in using warm mix asphalt
with a view to reducing stack emissions at asphalt plants, to allowing longer haul distances between
asphalt plants and construction projects, to improving construction quality (especially during nighttime
closures), to improving working conditions during construction, and to extending the annual period for
paving. However, use of warm mix asphalt technologies requires incorporating an additive into the mix,
and/or changes in production and construction procedures specifically related to temperature, and these
can influence the short- and long-term performance of the pavement as well as the emissions generated
during production and placement. Consequently, Caltrans identified the need for research to address a
range of concerns related to these changes before it would approve statewide implementation of the
technology.
1.2 Project Objectives
The research presented in this report is part of Partnered Pavement Research Center Strategic Plan
Element 4.18 (PPRC SPE 4.18), titled “Warm Mix Asphalt Study,” which was undertaken for Caltrans by
the University of California Pavement Research Center (UCPRC). The objective of this project is to
determine whether the use of additives intended to reduce the production and construction temperatures of
asphalt concrete influence mix production processes, construction procedures, and the short-, medium-,
and/or long-term performance of hot mix asphalt. The potential benefits of using the additives will also be
quantified. This is to be achieved through the following tasks:
Develop a detailed workplan (1) for Heavy Vehicle Simulator (HVS) and laboratory testing (Completed in September 2007)
2 UCPRC-RR-2012-07
Construct test tracks (subgrade preparation, aggregate base-course, tack coat, and asphalt wearing course) at the Graniterock A.R. Wilson quarry near Aromas, California (completed in September 2007 for the Phase 1 and Phase 2 studies), and UCPRC facility in Davis, California (completed in
April 2010 for the Phase 3 study)
Undertake HVS testing in separate phases, with later phases dependent on the outcome of earlier phases and laboratory tests (Phase 1 [rutting on HMA/WMA] completed in April 2008, Phase 2
[moisture sensitivity on HMA/WMA] completed in July 2009, and Phase 3 [rutting on RHMA-G/ R-WMA-G] completed in July 2011)
Carry out a series of laboratory tests to assess rutting and fatigue behavior (Phase 1 [plant-mixed, field-compacted] completed in August 2008, Phase 2a [plant-mixed, laboratory-compacted] completed in August 2009, Phase 2b [laboratory-mixed, laboratory-compacted] completed in June 2010 and documented in this report, and Phase 3 [plant-mixed, field-compacted] completed in December 2011)
Prepare a series of reports describing the research
Prepare recommendations for implementation
Selected pilot studies with warm mix technologies on in-service pavements will also be monitored as part
of the study.
1.3 Overall Project Organization
This UCPRC project has been planned as a comprehensive study to be carried out in a series of phases,
with later phases dependent on the results of the initial phase. The planned testing phases include (1) the
following:
Phase 1 compared early rutting potential at elevated temperatures (pavement temperature of 122°F at 2.0 in. [50°C at 50 mm]). HVS trafficking began approximately 45 days after construction. Cores and beams sawn from the sections immediately after construction were subjected to rutting, fatigue cracking, and moisture sensitivity testing in the laboratory. The workplan dictated that moisture sensitivity, additional rutting, and fatigue testing with the HVS would be considered if the warm mix asphalt concrete mixes performed differently than the conventional mixes. The results from this phase are discussed in a report entitled Warm-Mix Asphalt Study: Test Track Construction and
First-Level Analysis of Phase 1 HVS and Laboratory Testing (2).
Depending on the outcome of laboratory testing for moisture sensitivity, a testing phase, if deemed necessary, would assess general performance under dry and wet conditions with special emphasis on moisture sensitivity. The Phase 1 laboratory testing indicated a potential for moisture damage, prompting initiation of a second phase. Phase 2 compared rutting potential at elevated temperatures (pavement temperature of 122°F at 2.0 in. [50°C at 50 mm] pavement depth) and under wet conditions. HVS trafficking started approximately 90 days after completion of the Phase 1 HVS testing was completed (12 months after construction). The results from Phase 2 are discussed in two reports entitled Warm-Mix Asphalt Study: First-Level Analysis of Phase 2 HVS and Laboratory Testing, and Phase 1 and Phase 2 Forensic Assessments (3) and Warm-Mix Asphalt Study: First-Level Analysis of Phase 2b Laboratory Testing on Laboratory-Prepared Specimens (this report).
UCPRC-RR-2012-07 3
Depending on the outcome of laboratory testing for rutting, a testing phase, if deemed necessary, would assess rutting performance on artificially aged test sections at elevated temperatures (122°F at 2.0 in. [50°C at 50 mm]). The actual process used to artificially age the sections was not finalized, but it would probably follow a protocol developed by the Florida Department of Transportation Accelerated Pavement Testing program, which uses a combination of infrared and ultraviolet radiation. Phase 1 laboratory testing results and Phase 2 HVS testing results provided no indication of increased rutting on aged sections and consequently this phase was not undertaken.
Depending on the outcome of the laboratory study for fatigue, a testing phase, if deemed necessary, would assess fatigue performance at low temperatures (59°F at 2.0 in. [15°C at 50 mm]). Phase 1 laboratory testing did not indicate that the warm mix asphalt technologies tested would influence fatigue performance and consequently this phase was not undertaken.
Depending on the outcome of the above testing phases and if agreed upon by the stakeholders (Caltrans, contractors, and warm mix technology suppliers), the sequence listed above or a subset of the sequence would be repeated for gap-graded rubberized asphalt concrete (RHMA-G), and again for open-graded mixes. The testing of gap-graded rubberized mixes was undertaken in two sub-phases and is discussed in two reports entitled Warm-Mix Asphalt Study: Test Track Construction
and First-Level Analysis of Phase 3a HVS and Laboratory Testing (Rubberized Asphalt, Mix Design #1) (4) and Warm-Mix Asphalt Study: Test Track Construction and First-Level Analysis of Phase 3b HVS and Laboratory Testing (Rubberized Asphalt, Mix Design #2) (5).
Periodic assessment of the performance of open- and gap-graded mixes in full-scale field experiments. This work is discussed in a separate report on that study entitled Warm-Mix Asphalt Study: Field Test Performance Evaluation (6).
This test plan was designed to evaluate short-, medium-, and long-term performance of the mixes.
Short-term performance is defined as failure by rutting of the asphalt-bound materials.
Medium-term performance is defined as failure caused by moisture and/or construction-related issues.
Long-term performance is defined as failure from fatigue cracking, reflective cracking, and/or rutting of the asphalt-bound and/or unbound pavement layers.
The following questions, raised by Caltrans staff in a pre-study meeting, will be answered during the
various phases of the study (1):
What is the approximate comparative energy usage between HMA and WMA during mix preparation? This will be determined from asphalt plant records/observations in pilot studies where sufficient tonnages of HMA and WMA are produced to undertake an assessment.
Can satisfactory compaction be achieved at lower temperatures? This will be established from construction monitoring and subsequent laboratory tests.
What is the optimal temperature range for achieving compaction requirements? This will be established from construction monitoring and subsequent laboratory tests.
What are the cost implications? These will be determined with basic cost analyses from pilot studies where sufficient tonnages of HMA and WMA are produced to undertake an assessment.
Does the use of warm mix asphalt technologies influence the rutting performance of the mix? This will be determined from all HVS and laboratory tests.

4 UCPRC-RR-2012-07
Is the treated mix more susceptible to moisture sensitivity given that the aggregate is heated to lower temperatures? This will be determined from Phase 1 laboratory tests and Phase 2 HVS testing.
Does the use of warm mix asphalt technologies influence fatigue performance? This will be determined from Phase 1 and Phase 2 laboratory tests and potential additional laboratory and HVS testing.
Does the use of warm mix asphalt technologies influence the performance of the mix in any other way? This will be determined from HVS and laboratory tests, and from field observations (all phases).
If the experiment is extended to rubberized gap-graded mixes, and standard, rubberized and polymer-modified open-graded mixes, are the impacts of using the warm mix technologies in these mixes the same as for conventional dense-graded mixes? This will be determined from Phase 3 laboratory and HVS tests and from field studies.
1.3.1 Project Deliverables
Deliverables from the study will include the following:
A detailed workplan for the entire study (1) A report detailing construction, first-level data analysis of the Phase 1 HVS testing, first-level data
analysis of the Phase 1 laboratory testing, and preliminary recommendations (2) A report detailing first-level data analysis of the Phase 2 HVS testing, first-level data analysis of the
Phase 2a laboratory testing, Phase 1 and Phase 2 forensic investigations, and preliminary recommendations (3)
A report detailing first-level analysis of the Phase 2b laboratory testing on laboratory-mixed, laboratory-compacted specimens (this report)
A report detailing first-level data analysis of the Phase 3a (mixes produced at Granite Construction’s Bradshaw plant) HVS testing, first-level data analysis of the Phase 3a laboratory testing, a Phase 3a forensic investigation, and preliminary recommendations (4)
A report detailing first-level data analysis of the Phase 3b (mixes produced at George Reed’s Marysville plant) HVS testing, first-level data analysis of the Phase 3b laboratory testing, a Phase 3b forensic investigation, and preliminary recommendations (5)
A report summarizing periodic observations from test sections on in-service pavements (6) A summary report for the entire study
A series of conference and journal papers documenting various components of the study will also be
prepared.
1.4 Structure and Content of this Report
1.4.1 Warm Mix Technologies Tested
The three warm mix technologies used in the construction of the test track for the Phase 1 and Phase 2
HVS tests were also tested in this study to facilitate comparison of the results of tests on plant-mixed,
field-compacted specimens sampled from the test track (2), and plant-mixed, laboratory-compacted
specimens prepared on site on the day of construction (3). An additional technology (RedisetTM) assessed
as part of the Caltrans warm mix technology approval process was also included in selected tests. Details
of the additives are as follows:
UCPRC-RR-2012-07 5
Advera WMA®, chemical water-foaming technology, referred to as “Advera” in this report
Evotherm DATTM, chemical surfactant technology, referred to as “Evotherm” in this report
Sasobit®, organic wax technology, referred to as “Sasobit” in this report
RedisetTM, chemical surfactant technology, referred to as “Rediset” in this report
1.4.2 Report Layout
This report presents an overview of the work carried out in Phase 2b to continue meeting the objectives of
the study, and is organized as follows:
Chapter 2 summarizes the laboratory testing experimental design.
Chapter 3 discusses the laboratory testing results.
Chapter 4 compares the results of the different phases of laboratory testing.
Chapter 5 provides conclusions and preliminary recommendations.
1.5 Measurement Units
Although Caltrans has recently returned to the use of U.S. standard measurement units, metric units have
always been used by the UCPRC in the design and layout of HVS test tracks, and for laboratory and field
measurements and data storage. In this report, both English and metric units (provided in parentheses after
the English units) are provided in general discussion. In keeping with convention, only metric units are
used in HVS and laboratory data analyses and reporting. A conversion table is provided on page xi at the
beginning of this report.
1.6 Terminology
The term “asphalt concrete” is used in this report as a general descriptor for the surfacing on the test
tracks. The terms “hot mix asphalt (HMA)” and “warm mix asphalt (WMA)” are used as descriptors to
differentiate between the control and warm mixes discussed in this study.

6 UCPRC-RR-2012-07
Blank page
UCPRC-RR-2012-07 7
2. EXPERIMENTAL DESIGN
2.1 Introduction
Phase 2b laboratory testing included rutting performance (Repeated Simple Shear Test), fatigue cracking
(beam fatigue), moisture sensitivity (Hamburg Wheel-Track and Tensile Strength Retained), and open-
graded friction course durability tests (Cantabro). Additional Hamburg Wheel-Track tests were carried out
to assess the effects of moisture in the mix, and the effects of additional curing (i.e., short-term aging) of
the loose mix prior to compaction. Tests on these mix properties were carried out on beams and cores
prepared from materials sampled at the Graniterock Company’s A.R. Wilson Quarry and asphalt plant on
the day of construction of the test track used for the Phase 1 and Phase 2 accelerated pavement tests. The
specimens used in the laboratory testing study of plant-mixed, field-compacted (PMFC) and plant-mixed,
laboratory-compacted materials (PMLC) were sampled from this test track (2,3). With the exception of the
Cantabro tests, the same testing program used in the PMFC and PMLC studies was followed in this
laboratory-mixed, laboratory-compacted study to facilitate comparison of results.
2.2 Experiment Design
Six mixes were tested. These included a Control mix produced at 310°F (153°C), Advera, Evotherm,
Sasobit, and Rediset mixes produced at 250°F (121°C), and a Sasobit mix produced with a lower binder
content (4.5 percent) that was similar to that unintentionally used in the Sasobit section of the test track
used for the Phase 1 and Phase 2 accelerated pavement tests.
2.2.1 Rutting Performance Testing
Test Method
The AASHTO T 320 Permanent Shear Strain and Stiffness Test was used for shear testing in this study. In
the standard test methodology, cylindrical test specimens 6.0 in. (152 mm) in diameter and 2.0 in.
(50 mm) thick (cored from slabs compacted with a rolling wheel compactor) were subjected to repeated
loading in shear using a 0.1 second haversine waveform followed by a 0.6 second rest period. Three
different shear stresses were applied while the permanent (unrecoverable) and recoverable shear strains
were measured. The permanent shear strain versus applied repetitions was recorded up to a value of
5 percent although 5,000 repetitions are called for in the AASHTO procedure. During the test, constant
temperatures representative of the high temperatures that can cause rutting on in-service pavements
(113°F and 131°F [45°C and 55°C]) were maintained (these are termed the critical temperatures).
8 UCPRC-RR-2012-07
Number of Tests
A total of 18 shear tests were carried out on each mix (total of 108 tests for six mixes) as follows:
Two temperatures (45°C and 55°C [113°F and 131°F])
Three stresses (70 kPa, 100 kPa, and 130 kPa [10.2, 14.5, and 18.9 psi])
Three replicates
2.2.2 Beam Fatigue Testing
Test Method
The AASHTO T 321 Flexural Controlled-Deformation Fatigue Test Method was followed. In this test,
three replicate beam test specimens, 2.0 in. (50 mm) thick by 2.5 in. (63 mm) wide by 15 in. (380 mm)
long, cut from slabs compacted with a rolling wheel compactor, were subjected to four-point bending
using a haversine waveform at a loading frequency of 10 Hz. Testing was performed in both dry and wet
conditions at two different strain levels at one temperature. Flexural controlled-deformation frequency
sweep tests were used to establish the relationship between complex modulus and load frequency. The
same sinusoidal waveform was used in a controlled-deformation mode and at frequencies of 15, 10, 5, 2,
1, 0.5, 0.2, 0.1, 0.05, 0.02, and 0.01 Hz. The upper limit of 15 Hz was a constraint imposed by the
capabilities of the test machine. To ensure that the specimen was tested in a nondestructive manner, the
frequency sweep test was conducted at a small strain amplitude level, proceeding from the highest
frequency to the lowest in the sequence noted above.
The wet specimens used in the fatigue and frequency sweep tests were conditioned following the beam-
soaking procedure described in Appendix A. The beam was first vacuum-saturated to ensure a saturation
level greater than 70 percent, and then placed in a water bath at 140°F (60°C) for 24 hours, followed by a
second water bath at 68°F (20°C) for two hours. The beams were then wrapped with ParafilmTM and tested
within 24 hours after soaking.
Number of Tests
A total of 12 beam fatigue tests and 12 flexural fatigue frequency sweep tests were carried out on each
mix (total of 144 tests for the six mixes) as follows:
Standard test: + Two conditions (wet and dry) + One temperature (20°C [68°F]) + Two strains (200 microstrain and 400 microstrain) + Three replicates
Frequency sweep test: + Two conditions (wet and dry) + Three temperatures (10°C, 20°C, and 30°C [50°F, 68°F, and 86°F]) + One strain (100 microstrain) + Two replicates
UCPRC-RR-2012-07 9
2.2.3 Moisture Sensitivity Testing
Test Methods
In addition to the wet fatigue test described above, two other moisture sensitivity tests were conducted,
namely the Hamburg Wheel-Track and the Tensile Strength Retained (TSR) tests:
The AASHTO T 324 test method was followed for Hamburg Wheel-Track testing on 6.0 in. (152 mm) cores. All testing was carried out at 122°F (50°C).
The Caltrans CT 371 test method was followed for the Tensile Strength Retained Test on 4.0 in. (100 mm) cores. This test method is similar to the AASHTO T 283 test, but it has some modifications specific to California conditions.
A literature review on laboratory testing of warm mixes (1) indicated that warm mixes had consistently
poorer rutting performance compared to hot mix controls, and this was attributable to less aging of the
binder at the lower mixing temperatures. A small experiment was therefore undertaken to assess the
effects of additional curing on the Hamburg Wheel-Track specimens to assess the effects of this binder
aging on early rutting performance, and whether additional aging would result in similar performance to
the control specimens. Mixes were cured for an additional two hours and four hours prior to compaction.
Rediset was not tested in this part of the experiment.
Additional Hamburg Wheel-Track tests were also carried out to assess the potential effects on moisture
sensitivity of insufficient aggregate drying at the lower warm mix production temperatures. Additional
specimens were prepared with 0.5, 1.5, and 3.0 percent water by weight of the mix, with the water added
to the mix prior to compaction. The Caltrans Standard Specifications (Section 39) require that the water
content in dense-graded asphalt mixes does not exceed one percent by weight of the total mix. Rediset was
not tested in this part of the experiment.
The testing sequence of the specimens was randomized to avoid any potential block effect. Rut depth was
recorded at 11 equally spaced points along the wheelpath on each specimen. The average of the middle
seven points was then used in the analysis. This method ensures that localized distresses are smoothed and
variance in the data is minimized. It should be noted that some state departments of transportation only
measure the point of maximum final rut depth, which usually results in a larger variance in the test results.
Number of Tests
Four replicates of the Hamburg Wheel-Track Test and four replicates of the Tensile Strength Retained
Test were carried out for each mix (20 tests per method) in the standard test. Specimens were prepared as
follows for the additional Hamburg Wheel-Track testing (144 cores [note that two specimens are required
for each Hamburg Wheel-Track Test]):
10 UCPRC-RR-2012-07
Three moisture contents (0.5, 1.5, and 3.0 percent)
Two additional cure times (2 and 4 hours)
Two replicates
2.2.4 Open-Graded Friction Course Durability Testing
Test Method
The ASTM D7064 test method (Standard Practice for Open-Graded Friction Course (OGFC) Mix
Design, also known as the Cantabro test) was followed for OGFC durability testing on cylindrical
specimens 4.0 in. (100 mm) in diameter and 2.5 in. (63 mm) thick.
Number of Tests
Six replicates were tested for OGFC durability for each mix (total of 30 tests). The Sasobit mix with
4.5 percent binder content was not tested.
2.3 Material Sampling
Mix constituents were collected on the day of test track construction (2). A 20-ton truckload of aggregate
sample was collected off a feed from the aggregate conveyor into the asphalt plant drum. Asphalt binder
samples were collected from the delivery tanker. Warm mix additive samples were provided by the
manufacturers. All samples were transported to and stored at the UCPRC Richmond Field Station prior to
processing, specimen preparation, and testing.
2.4 Specimen Preparation
2.4.1 Aggregate
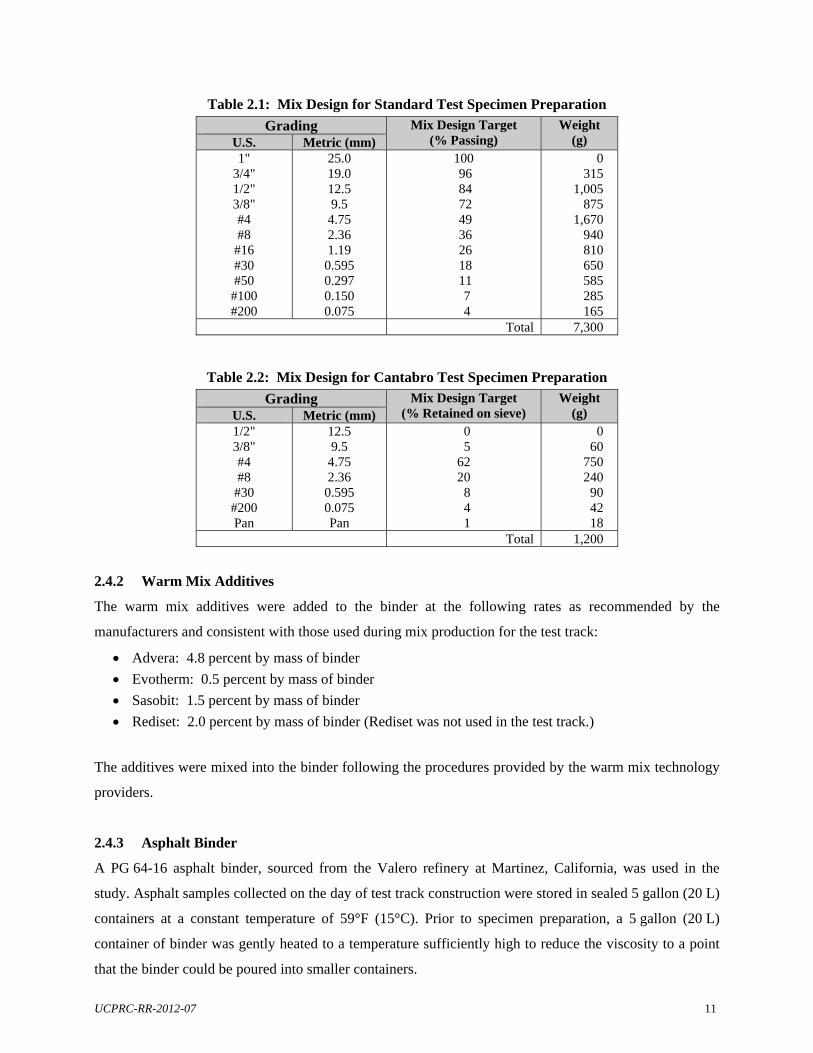
The bulk aggregate sample collected on the day of construction was dried and then screened into 11
different size fractions. These fractions were then reconstituted to prepare specimens for testing. For the
shear, fatigue, Hamburg Wheel-Track, and Tensile Strength Retained tests (hereafter referred to as
standard tests), samples weighing 258 oz. (7,300 g) were prepared according to the original mix design as
shown in Table 2.1. For the Cantabro tests, a separate open-graded friction course mix design was used,
with selected fractions reconstituted into 42 oz. (1,200 g) samples as shown in Table 2.2.
Aggregates used in the Control mixes were heated to 310°F (153°C) prior to mixing, while aggregates
used in the warm mixes were heated to 250°F (121°C). Both temperatures were consistent with those used
during mix production for the Phase 1 and Phase 2 test track.
UCPRC-RR-2012-07 11
Table 2.1: Mix Design for Standard Test Specimen Preparation
Grading Mix Design Target (% Passing)
Weight (g) U.S. Metric (mm)
1" 3/4" 1/2" 3/8" #4 #8 #16 #30 #50
#100 #200
25.0 19.0 12.5 9.5
4.75 2.36 1.19
0.595 0.297 0.150 0.075
100 96 84 72 49 36 26 18 11 7 4
0 315
1,005 875
1,670 940 810 650 585 285 165
Total 7,300
Table 2.2: Mix Design for Cantabro Test Specimen Preparation
Grading Mix Design Target (% Retained on sieve)
Weight (g) U.S. Metric (mm)
1/2" 3/8" #4 #8 #30
#200 Pan
12.5 9.5
4.75 2.36
0.595 0.075 Pan
0 5 62 20 8 4 1
0 60
750 240 90 42 18
Total 1,200
2.4.2 Warm Mix Additives
The warm mix additives were added to the binder at the following rates as recommended by the
manufacturers and consistent with those used during mix production for the test track:
Advera: 4.8 percent by mass of binder
Evotherm: 0.5 percent by mass of binder
Sasobit: 1.5 percent by mass of binder
Rediset: 2.0 percent by mass of binder (Rediset was not used in the test track.)
The additives were mixed into the binder following the procedures provided by the warm mix technology
providers.
2.4.3 Asphalt Binder
A PG 64-16 asphalt binder, sourced from the Valero refinery at Martinez, California, was used in the
study. Asphalt samples collected on the day of test track construction were stored in sealed 5 gallon (20 L)
containers at a constant temperature of 59°F (15°C). Prior to specimen preparation, a 5 gallon (20 L)
container of binder was gently heated to a temperature sufficiently high to reduce the viscosity to a point
that the binder could be poured into smaller containers.
12 UCPRC-RR-2012-07
The design asphalt binder content used in the test track was 5.2 percent (range of 5.1 to 5.4 percent) by
mass of the dry aggregate. Actual binder contents recorded during test track mix production were 5.3, 5.2,
5.2, and 4.5 percent for the Control, Advera, Evotherm, and Sasobit mixes, respectively. The asphalt
binder content for the standard tests in this laboratory study was therefore set at 5.2 percent. An additional
set of Sasobit specimens prepared with an asphalt binder content of 4.5 percent was included to facilitate
comparison of results from tests on specimens sampled from the test track (2,3). Binder contents of 5.2
and 4.5 percent equate to binder weights of 379.6 g and 328.5 g, respectively for the 7,300 g aggregate
sample. For the Cantabro test, a binder content of 5.9 percent was used, equating to a binder weight of
70.8 g for the 1,200 g aggregate sample.
The measured asphalt binder samples were heated to 310°F (154°C). The warm mix additives were then
added to the binder, which was constantly stirred with an electric laboratory mixer. Stirring continued for
at least three minutes after addition of the additive. The binder was then mixed into the aggregate in a
laboratory mixer.
2.4.4 Curing
After mixing, the control mix was cured for four hours at 275°F (135°C) prior to compaction, while the
warm mixes were cured for four hours at 250°F (121°C, i.e., the mix production temperatures) prior to
compaction. Selected samples were subjected to a further two or four hours of curing prior to compaction
to assess the effects of different aging conditions on the Hamburg Wheel-Track Test results.
2.4.5 Compaction
Standard Tests
After curing, mixes were compacted in ingot molds with a rolling wheel compactor according to the
AASHTO PP3-94 Standard Practice for Preparing Hot Mix Asphalt (HMA) Specimens by Means of the
Rolling Wheel Compactor test method. This method of compaction was chosen over gyratory compaction
to better facilitate comparison with the results obtained from specimens sampled from the test track.
Specimens prepared for additional Hamburg Wheel-Track testing (i.e., different moisture contents and
additional curing periods) were compacted in a gyratory compactor since there was no direct comparison
with field-compacted mixes. Specimens for Tensile Strength Retained tests were also compacted in a
gyratory compactor to meet the higher air-void contents required for this test.
Cantabro Tests
Test specimens prepared to measure the durability of open-graded friction courses were compacted in a
gyratory compactor since there was no direct comparison with field-compacted mixes.
UCPRC-RR-2012-07 13
3. TEST RESULTS
3.1 Rutting Performance Tests
Shear test results are listed in Table B.1 through Table B.6 in Appendix B. Key individual components of
the testing are discussed in the following sections.
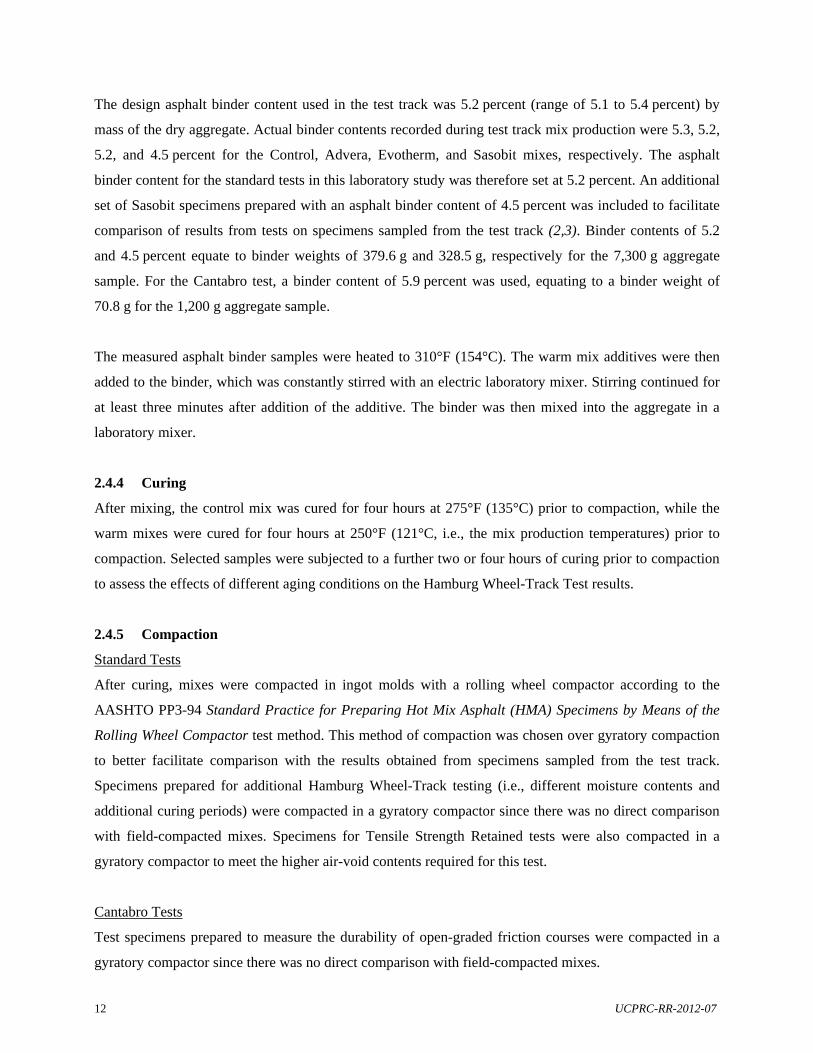
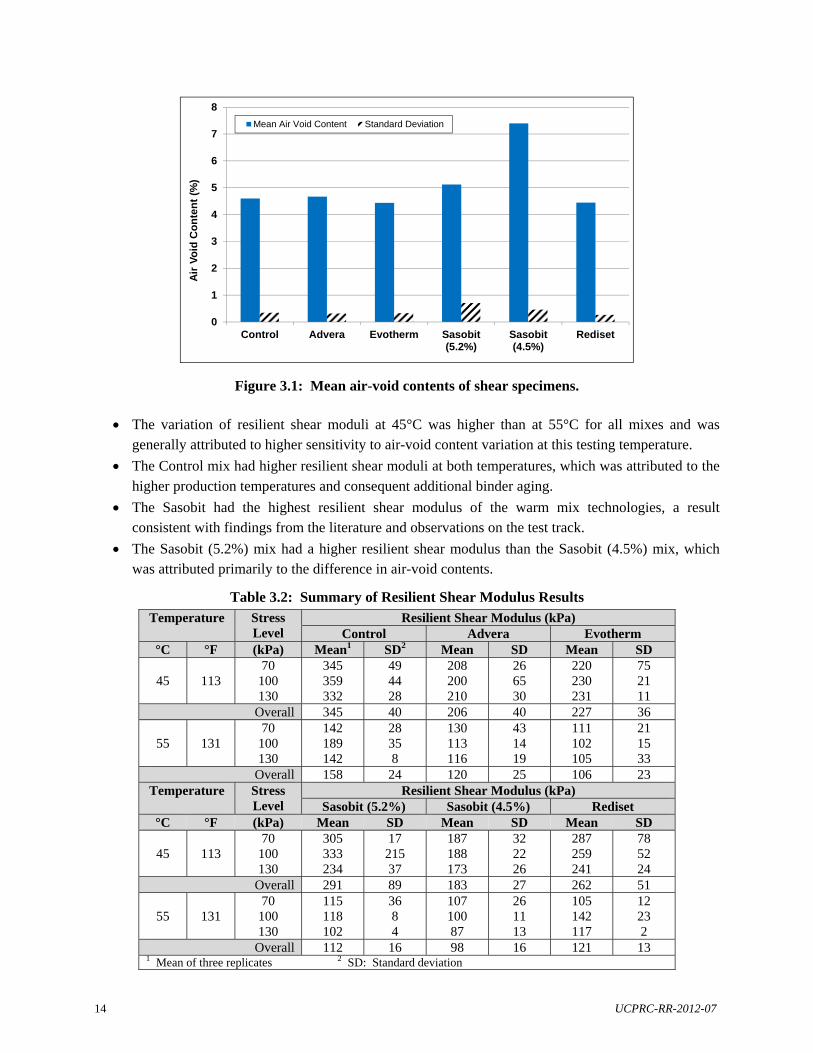
3.1.1 Air-Void Content
Air-void contents were measured using the CoreLok method and results are listed in Table B.1 through
Table B.6 in Appendix B. Table 3.1 summarizes the air-void distribution categorized by mix type, test
temperature, and test shear stress level. Figure 3.1 summarizes the mean air-void contents and standard
deviations for each warm mix technology. Air-void contents for the specimens prepared with the
5.2 percent binder content were consistent. The air-void contents of the Sasobit specimens prepared with
4.5 percent binder content were higher than those on the 5.2 percent binder content specimens, as
expected.
Table 3.1: Summary of Air-Void Contents of Shear Test Specimens
Temperature Stress Level
Air-Void Content (%) Control Advera Evotherm
°C °F (kPa) Mean1 SD2 Mean SD Mean SD
45 113 70
100 130
4.3 4.8 4.6
0.4 0.2 0.3
4.6 4.4 4.8
0.5 0.2 0.2
4.4 4.6 4.1
0.4 0.3 0.2
55 131 70
100 130
4.7 4.5 4.7
0.4 0.5 0.3
4.4 4.9 4.8
0.4 0.0 0.3
4.6 4.6 4.1
0.4 0.3 0.2
Overall 4.6 0.3 4.7 0.3 4.4 0.3 Temperature Stress
Level Air-Void Content (%)
Sasobit (5.2%) Sasobit (4.5%) Rediset °C °F (kPa) Mean SD Mean SD Mean SD
45 113 70
100 130
4.8 4.9 5.1
0.4 0.8 0.1
7.3 7.8 7.3
0.5 0.3 0.7
4.3 4.4 4.6
0.1 0.5 0.3
55 131 70
100 130
6.4 4.7 4.7
0.6 0.1 0.2
7.2 7.3 7.4
0.8 0.3 0.2
4.4 4.4 4.5
0.1 0.1 0.4
Overall 5.1 0.7 7.4 0.5 4.4 0.3 1 Mean of three replicates 2 SD: Standard deviation
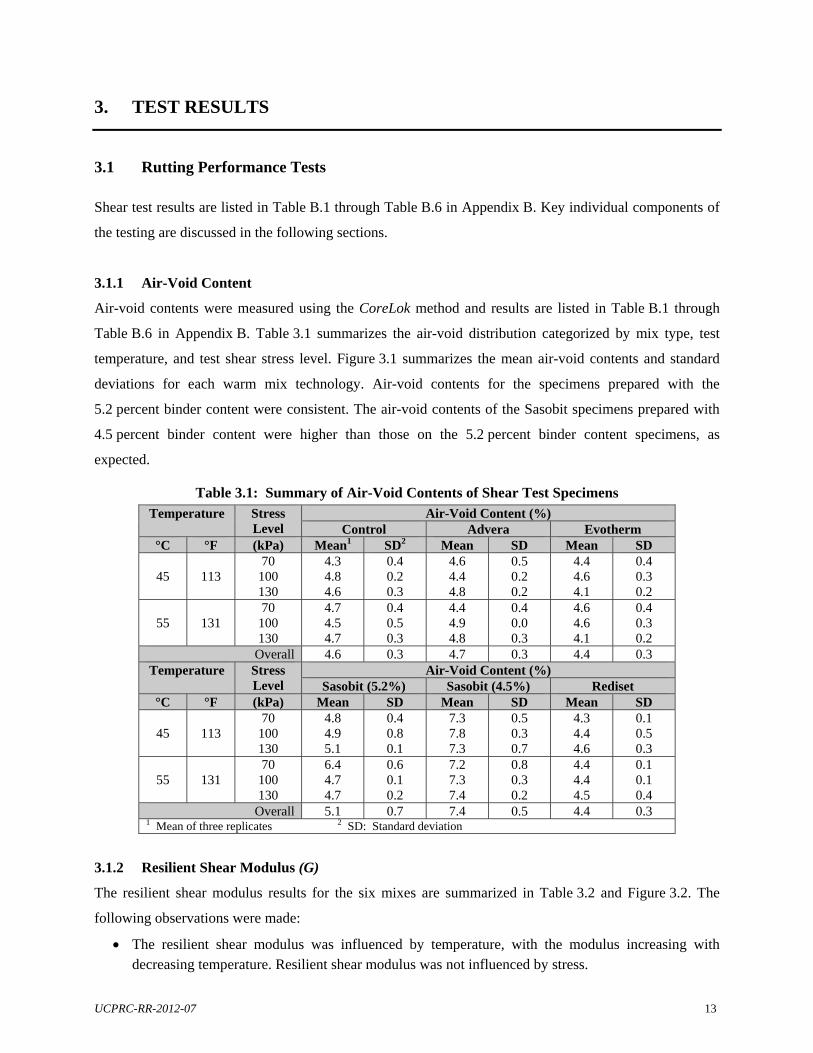
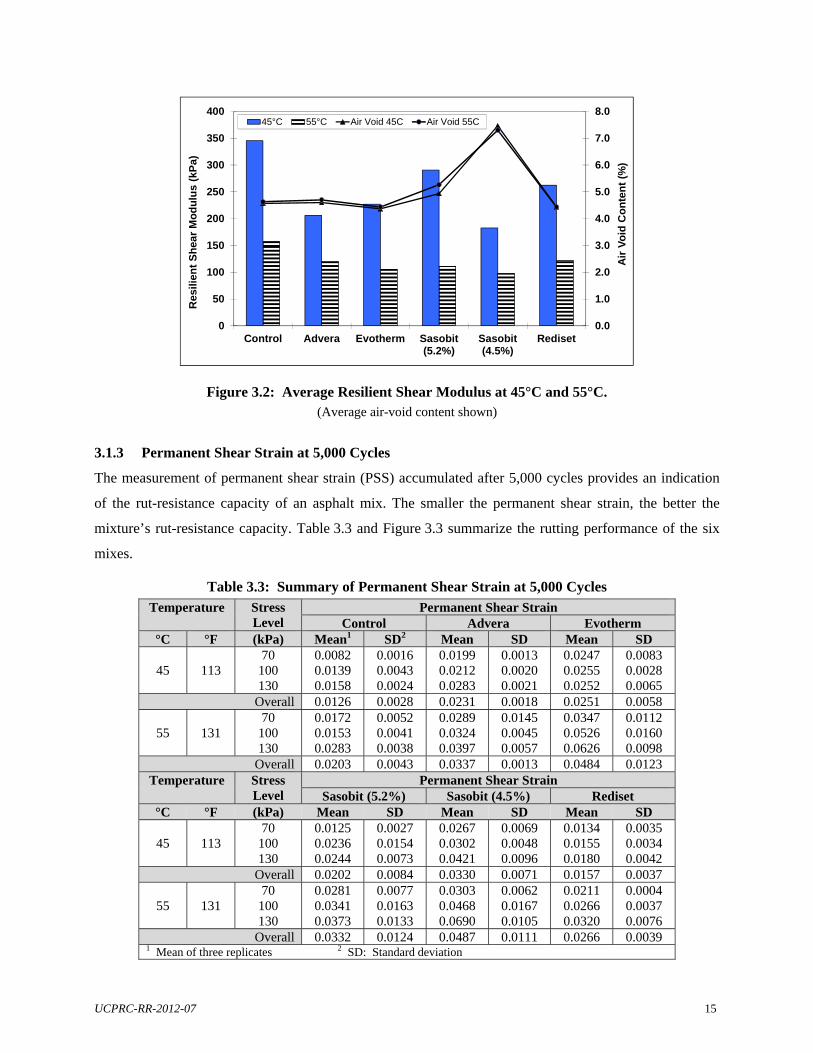
3.1.2 Resilient Shear Modulus (G)
The resilient shear modulus results for the six mixes are summarized in Table 3.2 and Figure 3.2. The
following observations were made:
The resilient shear modulus was influenced by temperature, with the modulus increasing with decreasing temperature. Resilient shear modulus was not influenced by stress.
14 UCPRC-RR-2012-07
Figure 3.1: Mean air-void contents of shear specimens.
The variation of resilient shear moduli at 45°C was higher than at 55°C for all mixes and was
generally attributed to higher sensitivity to air-void content variation at this testing temperature.
The Control mix had higher resilient shear moduli at both temperatures, which was attributed to the higher production temperatures and consequent additional binder aging.
The Sasobit had the highest resilient shear modulus of the warm mix technologies, a result consistent with findings from the literature and observations on the test track.
The Sasobit (5.2%) mix had a higher resilient shear modulus than the Sasobit (4.5%) mix, which was attributed primarily to the difference in air-void contents.
Table 3.2: Summary of Resilient Shear Modulus Results
Temperature Stress Level
Resilient Shear Modulus (kPa) Control Advera Evotherm
°C °F (kPa) Mean1 SD2 Mean SD Mean SD
45 113 70
100 130
345 359 332
49 44 28
208 200 210
26 65 30
220 230 231
75 21 11
Overall 345 40 206 40 227 36
55 131 70
100 130
142 189 142
28 35 8
130 113 116
43 14 19
111 102 105
21 15 33
Overall 158 24 120 25 106 23 Temperature Stress
Level Resilient Shear Modulus (kPa)
Sasobit (5.2%) Sasobit (4.5%) Rediset °C °F (kPa) Mean SD Mean SD Mean SD
45 113 70
100 130
305 333 234
17 215 37
187 188 173
32 22 26
287 259 241
78 52 24
Overall 291 89 183 27 262 51
55 131 70
100 130
115 118 102
36 8 4
107 100 87
26 11 13
105 142 117
12 23 2
Overall 112 16 98 16 121 13 1 Mean of three replicates 2 SD: Standard deviation
0
1
2
3
4
5
6
7
8
Control Advera Evotherm Sasobit(5.2%)
Sasobit(4.5%)
Rediset
Air
Vo
id C
on
ten
t (%
)
Mean Air Void Content Standard Deviation
UCPRC-RR-2012-07 15
Figure 3.2: Average Resilient Shear Modulus at 45°C and 55°C. (Average air-void content shown)
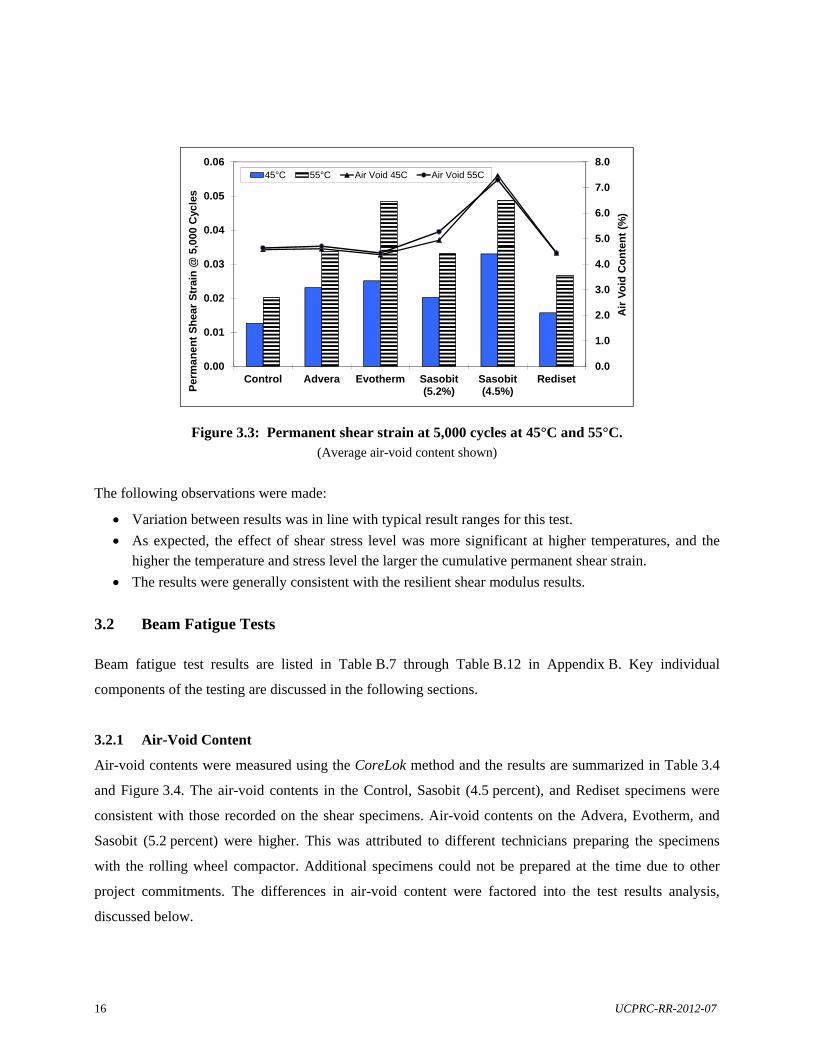
3.1.3 Permanent Shear Strain at 5,000 Cycles
The measurement of permanent shear strain (PSS) accumulated after 5,000 cycles provides an indication
of the rut-resistance capacity of an asphalt mix. The smaller the permanent shear strain, the better the
mixture’s rut-resistance capacity. Table 3.3 and Figure 3.3 summarize the rutting performance of the six
mixes.
Table 3.3: Summary of Permanent Shear Strain at 5,000 Cycles
Temperature Stress Level
Permanent Shear Strain Control Advera Evotherm
°C °F (kPa) Mean1 SD2 Mean SD Mean SD
45 113 70
100 130
0.0082 0.0139 0.0158
0.0016 0.0043 0.0024
0.0199 0.0212 0.0283
0.0013 0.0020 0.0021
0.0247 0.0255 0.0252
0.0083 0.0028 0.0065
Overall 0.0126 0.0028 0.0231 0.0018 0.0251 0.0058
55 131 70
100 130
0.0172 0.0153 0.0283
0.0052 0.0041 0.0038
0.0289 0.0324 0.0397
0.0145 0.0045 0.0057
0.0347 0.0526 0.0626
0.0112 0.0160 0.0098
Overall 0.0203 0.0043 0.0337 0.0013 0.0484 0.0123 Temperature Stress
Level Permanent Shear Strain
Sasobit (5.2%) Sasobit (4.5%) Rediset °C °F (kPa) Mean SD Mean SD Mean SD
45 113 70
100 130
0.0125 0.0236 0.0244
0.0027 0.0154 0.0073
0.0267 0.0302 0.0421
0.0069 0.0048 0.0096
0.0134 0.0155 0.0180
0.0035 0.0034 0.0042
Overall 0.0202 0.0084 0.0330 0.0071 0.0157 0.0037
55 131 70
100 130
0.0281 0.0341 0.0373
0.0077 0.0163 0.0133
0.0303 0.0468 0.0690
0.0062 0.0167 0.0105
0.0211 0.0266 0.0320
0.0004 0.0037 0.0076
Overall 0.0332 0.0124 0.0487 0.0111 0.0266 0.0039 1 Mean of three replicates 2 SD: Standard deviation
0.0
1.0
2.0
3.0
4.0
5.0
6.0
7.0
8.0
0
50
100
150
200
250
300
350
400
Control Advera Evotherm Sasobit(5.2%)
Sasobit(4.5%)
Rediset
Air
Vo
id C
on
ten
t (%
)
Res
ilie
nt
Sh
ear
Mo
du
lus
(kP
a)
45°C 55°C Air Void 45C Air Void 55C
16 UCPRC-RR-2012-07
Figure 3.3: Permanent shear strain at 5,000 cycles at 45°C and 55°C. (Average air-void content shown)
The following observations were made:
Variation between results was in line with typical result ranges for this test.
As expected, the effect of shear stress level was more significant at higher temperatures, and the higher the temperature and stress level the larger the cumulative permanent shear strain.
The results were generally consistent with the resilient shear modulus results.
3.2 Beam Fatigue Tests
Beam fatigue test results are listed in Table B.7 through Table B.12 in Appendix B. Key individual
components of the testing are discussed in the following sections.
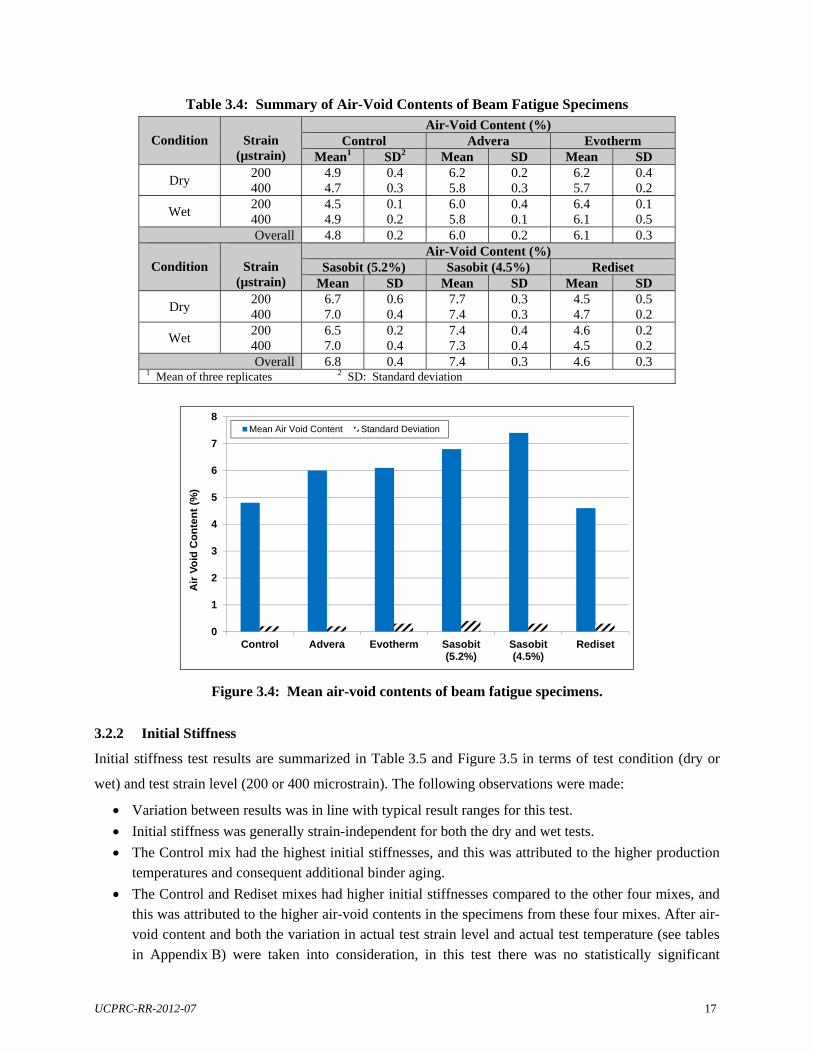
3.2.1 Air-Void Content
Air-void contents were measured using the CoreLok method and the results are summarized in Table 3.4
and Figure 3.4. The air-void contents in the Control, Sasobit (4.5 percent), and Rediset specimens were
consistent with those recorded on the shear specimens. Air-void contents on the Advera, Evotherm, and
Sasobit (5.2 percent) were higher. This was attributed to different technicians preparing the specimens
with the rolling wheel compactor. Additional specimens could not be prepared at the time due to other
project commitments. The differences in air-void content were factored into the test results analysis,
discussed below.
0.0
1.0
2.0
3.0
4.0
5.0
6.0
7.0
8.0
0.00
0.01
0.02
0.03
0.04
0.05
0.06
Control Advera Evotherm Sasobit(5.2%)
Sasobit(4.5%)
Rediset
Air
Vo
id C
on
ten
t (%
)
Per
ma
ne
nt
Sh
ear
Str
ain
@ 5
,000
Cyc
les
45°C 55°C Air Void 45C Air Void 55C
UCPRC-RR-2012-07 17
Table 3.4: Summary of Air-Void Contents of Beam Fatigue Specimens
Condition
Strain
(µstrain)
Air-Void Content (%) Control Advera Evotherm
Mean1 SD2 Mean SD Mean SD
Dry 200 400
4.9 4.7
0.4 0.3
6.2 5.8
0.2 0.3
6.2 5.7
0.4 0.2
Wet 200 400
4.5 4.9
0.1 0.2
6.0 5.8
0.4 0.1
6.4 6.1
0.1 0.5
Overall 4.8 0.2 6.0 0.2 6.1 0.3
Condition
Strain (µstrain)
Air-Void Content (%) Sasobit (5.2%) Sasobit (4.5%) Rediset
Mean SD Mean SD Mean SD
Dry 200 400
6.7 7.0
0.6 0.4
7.7 7.4
0.3 0.3
4.5 4.7
0.5 0.2
Wet 200 400
6.5 7.0
0.2 0.4
7.4 7.3
0.4 0.4
4.6 4.5
0.2 0.2
Overall 6.8 0.4 7.4 0.3 4.6 0.3 1 Mean of three replicates 2 SD: Standard deviation
Figure 3.4: Mean air-void contents of beam fatigue specimens.
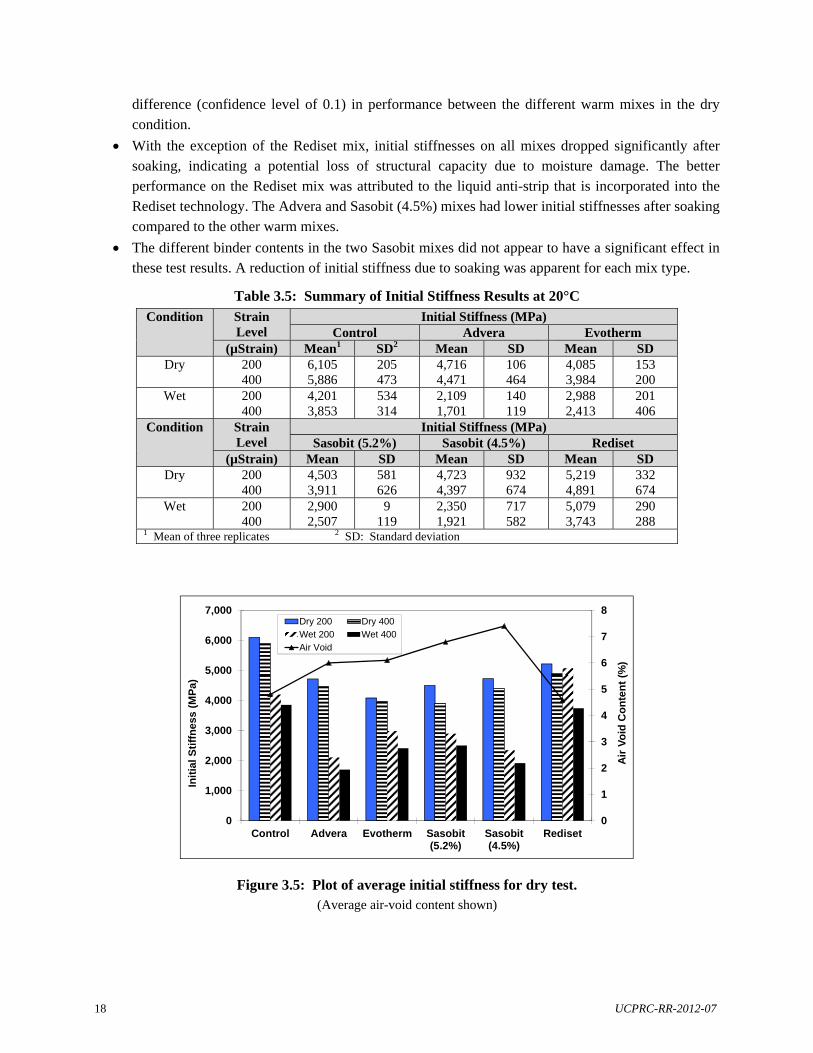
3.2.2 Initial Stiffness
Initial stiffness test results are summarized in Table 3.5 and Figure 3.5 in terms of test condition (dry or
wet) and test strain level (200 or 400 microstrain). The following observations were made:
Variation between results was in line with typical result ranges for this test.
Initial stiffness was generally strain-independent for both the dry and wet tests.
The Control mix had the highest initial stiffnesses, and this was attributed to the higher production temperatures and consequent additional binder aging.
The Control and Rediset mixes had higher initial stiffnesses compared to the other four mixes, and this was attributed to the higher air-void contents in the specimens from these four mixes. After air-void content and both the variation in actual test strain level and actual test temperature (see tables in Appendix B) were taken into consideration, in this test there was no statistically significant
0
1
2
3
4
5
6
7
8
Control Advera Evotherm Sasobit(5.2%)
Sasobit(4.5%)
Rediset
Air
Vo
id C
on
ten
t (%
)
Mean Air Void Content Standard Deviation
18 UCPRC-RR-2012-07
difference (confidence level of 0.1) in performance between the different warm mixes in the dry condition.
With the exception of the Rediset mix, initial stiffnesses on all mixes dropped significantly after soaking, indicating a potential loss of structural capacity due to moisture damage. The better performance on the Rediset mix was attributed to the liquid anti-strip that is incorporated into the Rediset technology. The Advera and Sasobit (4.5%) mixes had lower initial stiffnesses after soaking compared to the other warm mixes.
The different binder contents in the two Sasobit mixes did not appear to have a significant effect in these test results. A reduction of initial stiffness due to soaking was apparent for each mix type.
Table 3.5: Summary of Initial Stiffness Results at 20°C
Condition Strain Level
Initial Stiffness (MPa) Control Advera Evotherm
(µStrain) Mean1 SD2 Mean SD Mean SD Dry 200
400 6,105 5,886
205 473
4,716 4,471
106 464
4,085 3,984
153 200
Wet 200 400
4,201 3,853
534 314
2,109 1,701
140 119
2,988 2,413
201 406
Condition Strain Level
Initial Stiffness (MPa) Sasobit (5.2%) Sasobit (4.5%) Rediset
(µStrain) Mean SD Mean SD Mean SD Dry 200
400 4,503 3,911
581 626
4,723 4,397
932 674
5,219 4,891
332 674
Wet 200 400
2,900 2,507
9 119
2,350 1,921
717 582
5,079 3,743
290 288
1 Mean of three replicates 2 SD: Standard deviation
Figure 3.5: Plot of average initial stiffness for dry test. (Average air-void content shown)
0
1
2
3
4
5
6
7
8
0
1,000
2,000
3,000
4,000
5,000
6,000
7,000
Control Advera Evotherm Sasobit(5.2%)
Sasobit(4.5%)
Rediset
Air
Vo
id C
on
ten
t (%
)
Init
ial
Sti
ffn
ess
(M
Pa
)
Dry 200 Dry 400Wet 200 Wet 400Air Void
UCPRC-RR-2012-07 19
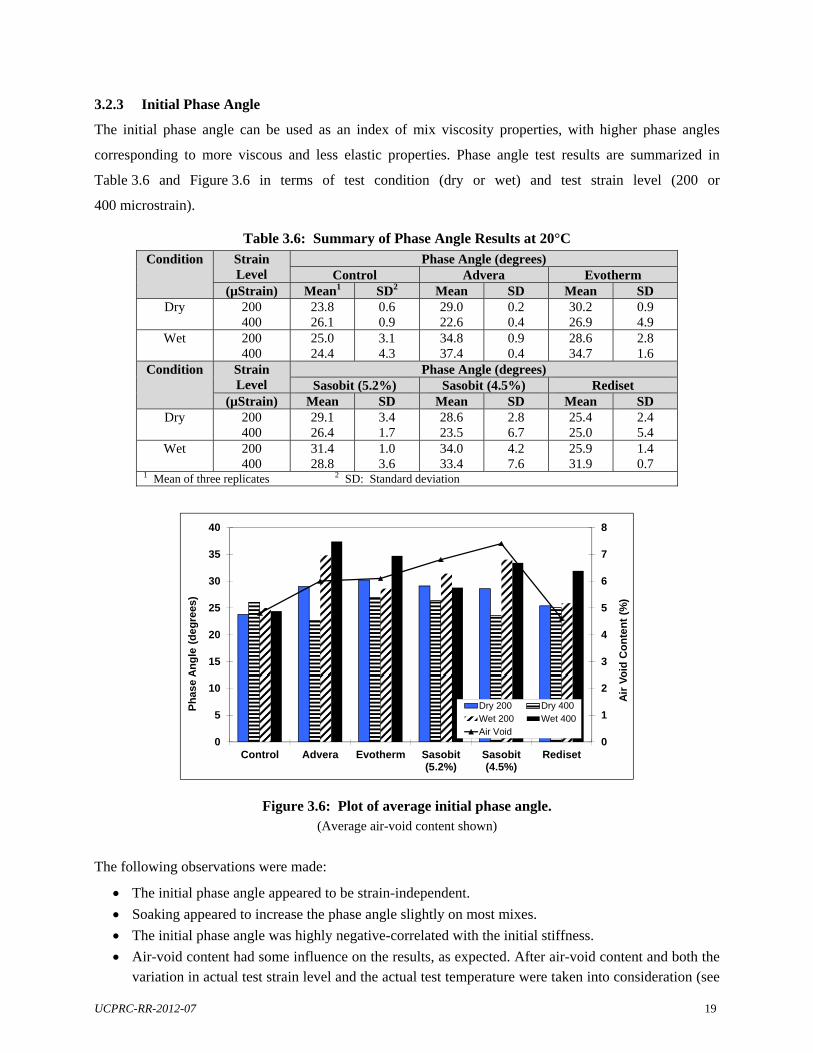
3.2.3 Initial Phase Angle
The initial phase angle can be used as an index of mix viscosity properties, with higher phase angles
corresponding to more viscous and less elastic properties. Phase angle test results are summarized in
Table 3.6 and Figure 3.6 in terms of test condition (dry or wet) and test strain level (200 or
400 microstrain).
Table 3.6: Summary of Phase Angle Results at 20°C
Condition Strain Level
Phase Angle (degrees) Control Advera Evotherm
(µStrain) Mean1 SD2 Mean SD Mean SD Dry 200
400 23.8 26.1
0.6 0.9
29.0 22.6
0.2 0.4
30.2 26.9
0.9 4.9
Wet 200 400
25.0 24.4
3.1 4.3
34.8 37.4
0.9 0.4
28.6 34.7
2.8 1.6
Condition Strain Level
Phase Angle (degrees) Sasobit (5.2%) Sasobit (4.5%) Rediset
(µStrain) Mean SD Mean SD Mean SD Dry 200
400 29.1 26.4
3.4 1.7
28.6 23.5
2.8 6.7
25.4 25.0
2.4 5.4
Wet 200 400
31.4 28.8
1.0 3.6
34.0 33.4
4.2 7.6
25.9 31.9
1.4 0.7
1 Mean of three replicates 2 SD: Standard deviation
Figure 3.6: Plot of average initial phase angle. (Average air-void content shown)
The following observations were made:
The initial phase angle appeared to be strain-independent.
Soaking appeared to increase the phase angle slightly on most mixes.
The initial phase angle was highly negative-correlated with the initial stiffness.
Air-void content had some influence on the results, as expected. After air-void content and both the variation in actual test strain level and the actual test temperature were taken into consideration (see
0
1
2
3
4
5
6
7
8
0
5
10
15
20
25
30
35
40
Control Advera Evotherm Sasobit(5.2%)
Sasobit(4.5%)
Rediset
Air
Vo
id C
on
ten
t (%
)
Ph
ase
An
gle
(d
eg
rees
)
Dry 200 Dry 400Wet 200 Wet 400Air Void
20 UCPRC-RR-2012-07
tables in Appendix B), in this test there was no statistically significant difference (confidence level of 0.1) in performance between the three warm mixes with higher air-void contents. The lower binder content in the Sasobit (4.5 percent) mix appeared to have some influence on test results, especially in the wet condition.
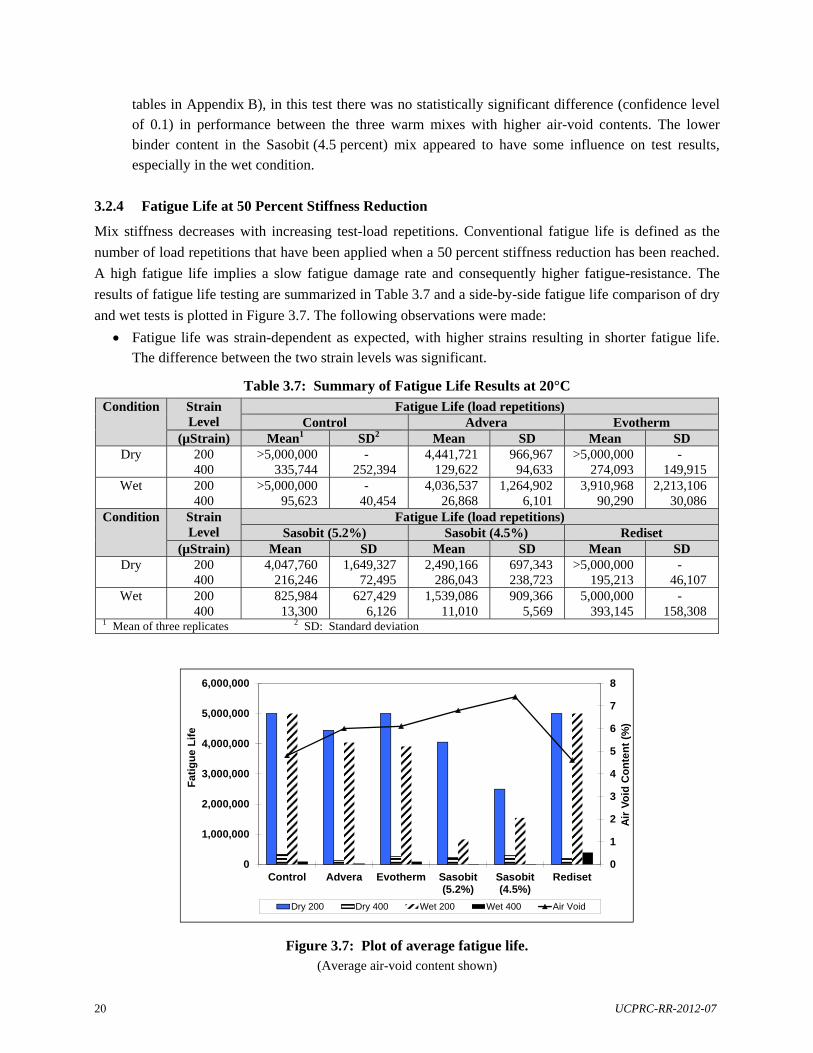
3.2.4 Fatigue Life at 50 Percent Stiffness Reduction
Mix stiffness decreases with increasing test-load repetitions. Conventional fatigue life is defined as the
number of load repetitions that have been applied when a 50 percent stiffness reduction has been reached.
A high fatigue life implies a slow fatigue damage rate and consequently higher fatigue-resistance. The
results of fatigue life testing are summarized in Table 3.7 and a side-by-side fatigue life comparison of dry
and wet tests is plotted in Figure 3.7. The following observations were made:
Fatigue life was strain-dependent as expected, with higher strains resulting in shorter fatigue life. The difference between the two strain levels was significant.
Table 3.7: Summary of Fatigue Life Results at 20°C
Condition Strain Level
Fatigue Life (load repetitions) Control Advera Evotherm
(µStrain) Mean1 SD2 Mean SD Mean SD Dry 200
400 >5,000,000
335,744 -
252,394 4,441,721
129,622 966,967
94,633 >5,000,000
274,093 -
149,915 Wet 200
400 >5,000,000
95,623 -
40,454 4,036,537
26,868 1,264,902
6,101 3,910,968
90,290 2,213,106
30,086 Condition Strain
Level Fatigue Life (load repetitions)
Sasobit (5.2%) Sasobit (4.5%) Rediset (µStrain) Mean SD Mean SD Mean SD
Dry 200 400
4,047,760 216,246
1,649,327 72,495
2,490,166 286,043
697,343 238,723
>5,000,000 195,213
- 46,107
Wet 200 400
825,984 13,300
627,429 6,126
1,539,086 11,010
909,366 5,569
5,000,000 393,145
- 158,308
1 Mean of three replicates 2 SD: Standard deviation
Figure 3.7: Plot of average fatigue life. (Average air-void content shown)
0
1
2
3
4
5
6
7
8
0
1,000,000
2,000,000
3,000,000
4,000,000
5,000,000
6,000,000
Control Advera Evotherm Sasobit(5.2%)
Sasobit(4.5%)
Rediset
Air
Vo
id C
on
ten
t (%
)
Fa
tig
ue
Lif
e
Dry 200 Dry 400 Wet 200 Wet 400 Air Void
UCPRC-RR-2012-07 21
Results varied between the mixes, with air-void content and binder content appearing to have the biggest influence on performance. Soaking generally resulted in a lower fatigue life compared to the unsoaked specimens.
The two Sasobit mixes had the shortest fatigue lives, with the mix with the 4.5 percent binder content having the lowest performance, as expected.
3.3 Flexural Frequency Sweep Test
Flexural frequency sweep test results are listed in Table B.13 through Table B.24 in Appendix B. Key
individual components of the testing are discussed in the following sections.
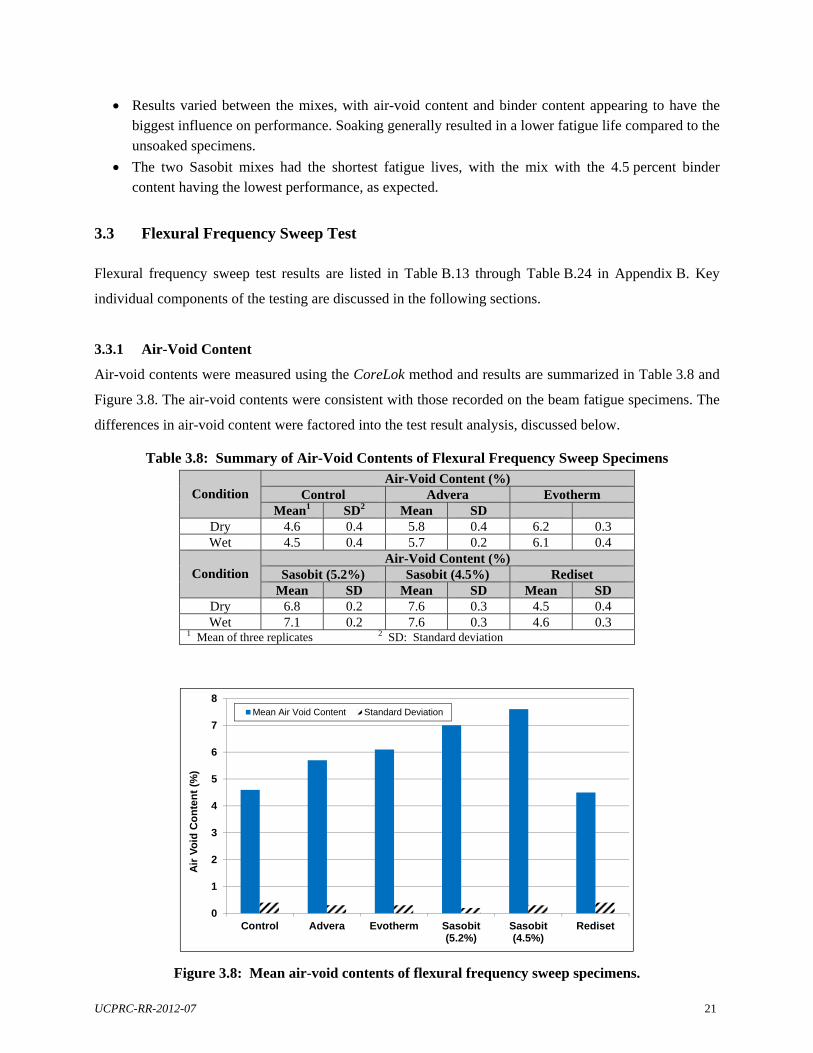
3.3.1 Air-Void Content
Air-void contents were measured using the CoreLok method and results are summarized in Table 3.8 and
Figure 3.8. The air-void contents were consistent with those recorded on the beam fatigue specimens. The
differences in air-void content were factored into the test result analysis, discussed below.
Table 3.8: Summary of Air-Void Contents of Flexural Frequency Sweep Specimens
Condition
Air-Void Content (%) Control Advera Evotherm
Mean1 SD2 Mean SD Dry 4.6 0.4 5.8 0.4 6.2 0.3 Wet 4.5 0.4 5.7 0.2 6.1 0.4
Condition
Air-Void Content (%) Sasobit (5.2%) Sasobit (4.5%) Rediset
Mean SD Mean SD Mean SD Dry 6.8 0.2 7.6 0.3 4.5 0.4 Wet 7.1 0.2 7.6 0.3 4.6 0.3
1 Mean of three replicates 2 SD: Standard deviation
Figure 3.8: Mean air-void contents of flexural frequency sweep specimens.
0
1
2
3
4
5
6
7
8
Control Advera Evotherm Sasobit(5.2%)
Sasobit(4.5%)
Rediset
Air
Vo
id C
on
ten
t (%
)
Mean Air Void Content Standard Deviation
22 UCPRC-RR-2012-07
3.3.2 Complex Modulus
The average stiffness values of the two replicates tested at the three temperatures were used to develop the
flexural complex modulus (E*) master curves. This is considered a useful tool for characterizing the
effects of loading frequency (or vehicle speed) and temperature on the initial stiffness of an asphalt mix
(i.e., before any fatigue damage has occurred). The shifted master curve with minimized residual-sum-of-
squares derived using a generic algorithm approach can be appropriately fitted with the following
modified Gamma function (Equation 3.1):
1
!exp1*
n
mm
m
mB
Cx
B
CxADE (3.1)
where: E* = flexural complex modulus (MPa); aTfreqx lnln = is the loading frequency in Hz and lnaT can be obtained from the
temperature-shifting relationship (Equation 3.2); A, B, C, D, and n are the experimentally-determined parameters.
B
TrefTAaT exp1ln (3.2)
where: lnaT = is a horizontal shift to correct the temperature effect with the same unit as ln freq, T = is the temperature in °C, Tref = is the reference temperature, in this case, Tref = 20°C A and B are the experimentally-determined parameters.
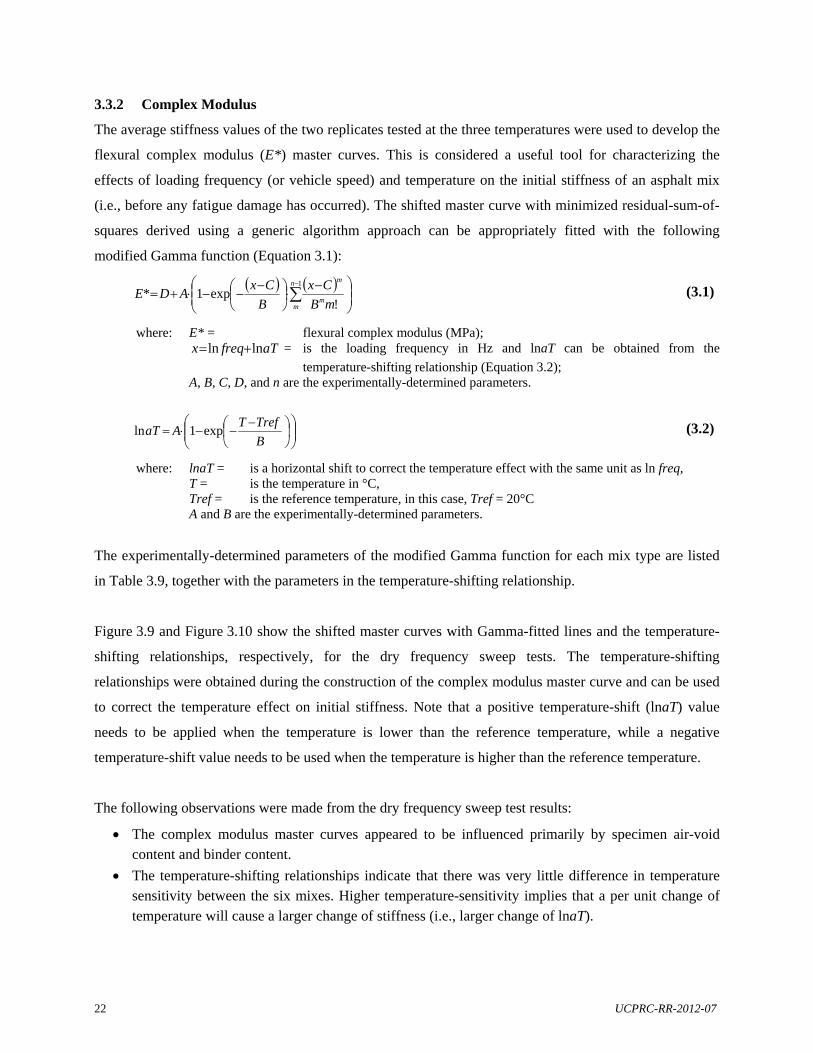
The experimentally-determined parameters of the modified Gamma function for each mix type are listed
in Table 3.9, together with the parameters in the temperature-shifting relationship.
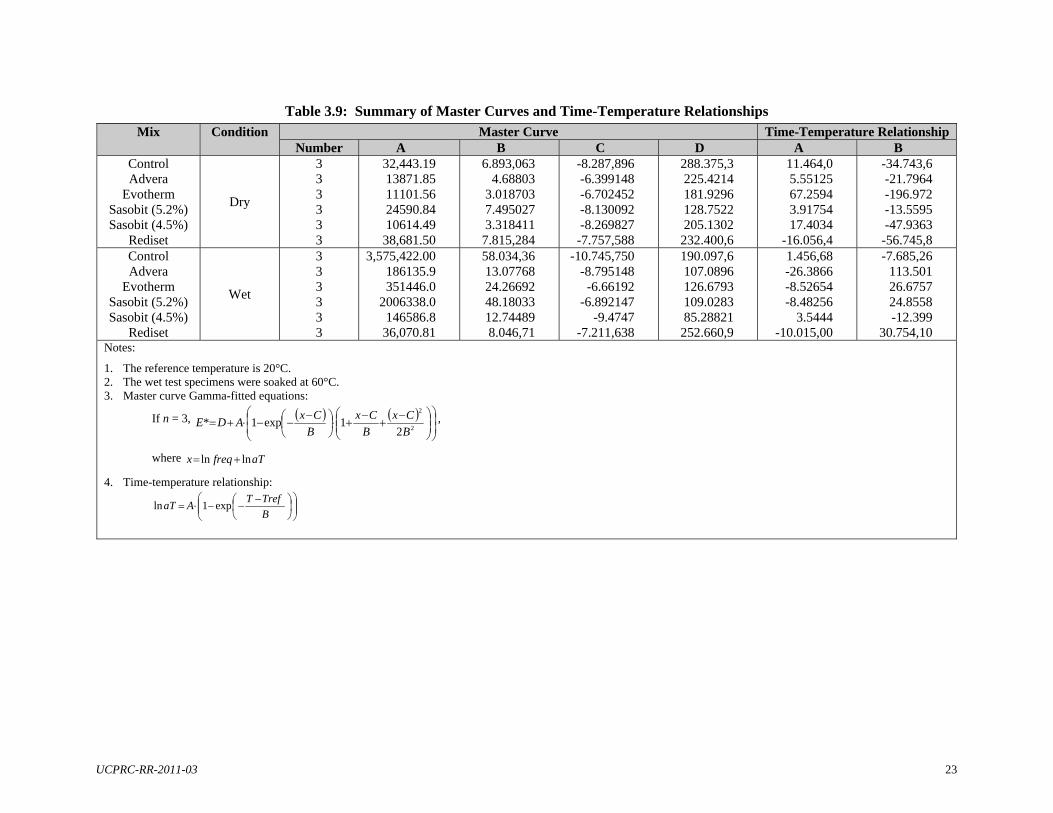
Figure 3.9 and Figure 3.10 show the shifted master curves with Gamma-fitted lines and the temperature-
shifting relationships, respectively, for the dry frequency sweep tests. The temperature-shifting
relationships were obtained during the construction of the complex modulus master curve and can be used
to correct the temperature effect on initial stiffness. Note that a positive temperature-shift (lnaT) value
needs to be applied when the temperature is lower than the reference temperature, while a negative
temperature-shift value needs to be used when the temperature is higher than the reference temperature.
The following observations were made from the dry frequency sweep test results:
The complex modulus master curves appeared to be influenced primarily by specimen air-void content and binder content.
The temperature-shifting relationships indicate that there was very little difference in temperature sensitivity between the six mixes. Higher temperature-sensitivity implies that a per unit change of temperature will cause a larger change of stiffness (i.e., larger change of lnaT).
UCPRC-RR-2011-03 23
Table 3.9: Summary of Master Curves and Time-Temperature Relationships
Mix Condition Master Curve Time-Temperature Relationship Number A B C D A B
Control Advera
Evotherm Sasobit (5.2%) Sasobit (4.5%)
Rediset
Dry
3 3 3 3 3 3
32,443.19 13871.85 11101.56 24590.84 10614.49
38,681.50
6.893,063 4.68803
3.018703 7.495027 3.318411
7.815,284
-8.287,896 -6.399148 -6.702452 -8.130092 -8.269827
-7.757,588
288.375,3 225.4214 181.9296 128.7522 205.1302
232.400,6
11.464,0 5.55125 67.2594 3.91754 17.4034
-16.056,4
-34.743,6 -21.7964 -196.972 -13.5595 -47.9363
-56.745,8 Control Advera
Evotherm Sasobit (5.2%) Sasobit (4.5%)
Rediset
Wet
3 3 3 3 3 3
3,575,422.00 186135.9 351446.0
2006338.0 146586.8
36,070.81
58.034,36 13.07768 24.26692 48.18033 12.74489 8.046,71
-10.745,750 -8.795148 -6.66192
-6.892147 -9.4747
-7.211,638
190.097,6 107.0896 126.6793 109.0283 85.28821
252.660,9
1.456,68 -26.3866 -8.52654 -8.48256
3.5444 -10.015,00
-7.685,26 113.501 26.6757 24.8558 -12.399
30.754,10 Notes:
1. The reference temperature is 20°C. 2. The wet test specimens were soaked at 60°C. 3. Master curve Gamma-fitted equations:
If n = 3,
2
2
21exp1*
B
Cx
B
Cx
B
CxADE ,
where aTfreqx lnln
4. Time-temperature relationship:
B
TrefTAaT exp1ln
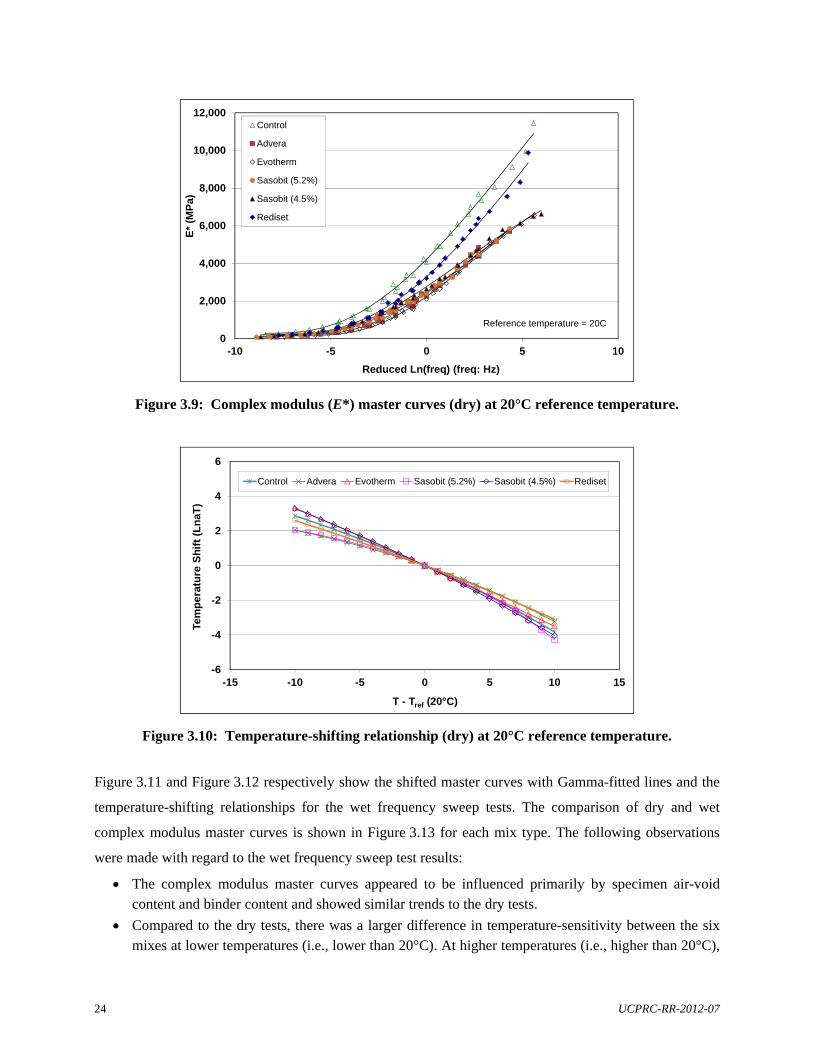
24 UCPRC-RR-2012-07
Figure 3.9: Complex modulus (E*) master curves (dry) at 20°C reference temperature.
Figure 3.10: Temperature-shifting relationship (dry) at 20°C reference temperature.
Figure 3.11 and Figure 3.12 respectively show the shifted master curves with Gamma-fitted lines and the
temperature-shifting relationships for the wet frequency sweep tests. The comparison of dry and wet
complex modulus master curves is shown in Figure 3.13 for each mix type. The following observations
were made with regard to the wet frequency sweep test results:
The complex modulus master curves appeared to be influenced primarily by specimen air-void content and binder content and showed similar trends to the dry tests.
Compared to the dry tests, there was a larger difference in temperature-sensitivity between the six mixes at lower temperatures (i.e., lower than 20°C). At higher temperatures (i.e., higher than 20°C),
0
2,000
4,000
6,000
8,000
10,000
12,000
-10 -5 0 5 10
E*
(MP
a)
Reduced Ln(freq) (freq: Hz)
Control
Advera
Evotherm
Sasobit (5.2%)
Sasobit (4.5%)
Rediset
Reference temperature = 20C
-6
-4
-2
0
2
4
6
-15 -10 -5 0 5 10 15
Tem
pe
ratu
re S
hif
t (L
na
T)
T - Tref (20°C)
Control Advera Evotherm Sasobit (5.2%) Sasobit (4.5%) Rediset
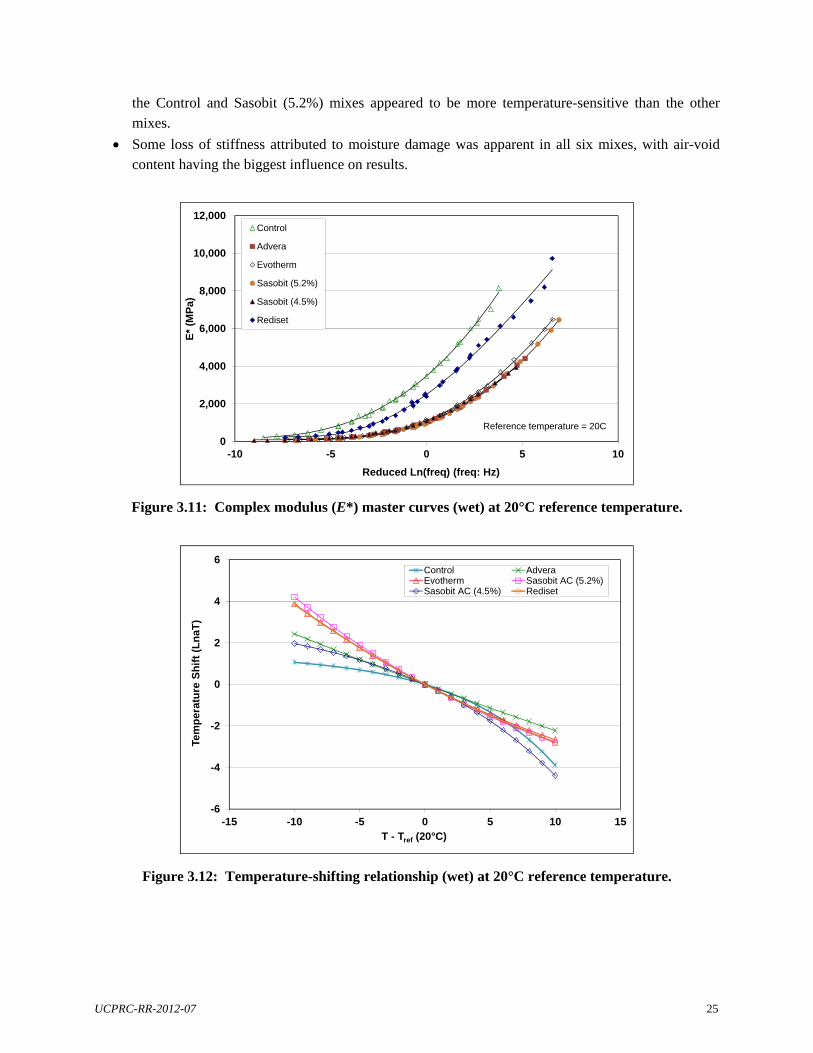
UCPRC-RR-2012-07 25
the Control and Sasobit (5.2%) mixes appeared to be more temperature-sensitive than the other mixes.
Some loss of stiffness attributed to moisture damage was apparent in all six mixes, with air-void content having the biggest influence on results.
Figure 3.11: Complex modulus (E*) master curves (wet) at 20°C reference temperature.
Figure 3.12: Temperature-shifting relationship (wet) at 20°C reference temperature.
0
2,000
4,000
6,000
8,000
10,000
12,000
-10 -5 0 5 10
E*
(MP
a)
Reduced Ln(freq) (freq: Hz)
Control
Advera
Evotherm
Sasobit (5.2%)
Sasobit (4.5%)
Rediset
Reference temperature = 20C
-6
-4
-2
0
2
4
6
-15 -10 -5 0 5 10 15
Tem
per
atu
re S
hif
t (L
naT
)
T - Tref (20°C)
Control AdveraEvotherm Sasobit AC (5.2%)Sasobit AC (4.5%) Rediset
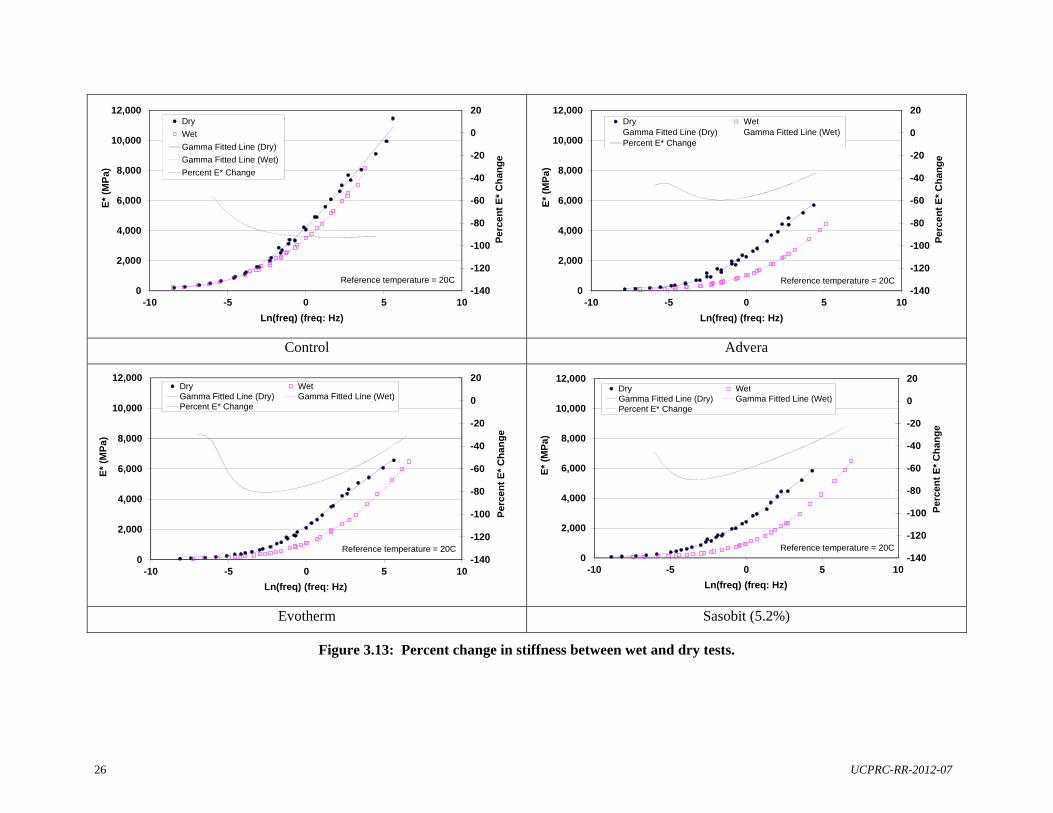
26 UCPRC-RR-2012-07
Control Advera
Evotherm Sasobit (5.2%)
Figure 3.13: Percent change in stiffness between wet and dry tests.
-140
-120
-100
-80
-60
-40
-20
0
20
0
2,000
4,000
6,000
8,000
10,000
12,000
-10 -5 0 5 10
Per
cen
t E
* C
han
ge
E*
(MP
a)
Ln(freq) (freq: Hz)
Dry
Wet
Gamma Fitted Line (Dry)
Gamma Fitted Line (Wet)
Percent E* Change
Reference temperature = 20C-140
-120
-100
-80
-60
-40
-20
0
20
0
2,000
4,000
6,000
8,000
10,000
12,000
-10 -5 0 5 10
Per
cen
t E
* C
han
ge
E*
(MP
a)
Ln(freq) (freq: Hz)
Dry WetGamma Fitted Line (Dry) Gamma Fitted Line (Wet)Percent E* Change
Reference temperature = 20C
-140
-120
-100
-80
-60
-40
-20
0
20
0
2,000
4,000
6,000
8,000
10,000
12,000
-10 -5 0 5 10
Pe
rcen
t E
* C
han
ge
E*
(MP
a)
Ln(freq) (freq: Hz)
Dry WetGamma Fitted Line (Dry) Gamma Fitted Line (Wet)Percent E* Change
Reference temperature = 20C-140
-120
-100
-80
-60
-40
-20
0
20
0
2,000
4,000
6,000
8,000
10,000
12,000
-10 -5 0 5 10
Per
cen
t E
* C
han
ge
E*
(MP
a)
Ln(freq) (freq: Hz)
Dry WetGamma Fitted Line (Dry) Gamma Fitted Line (Wet)Percent E* Change
Reference temperature = 20C
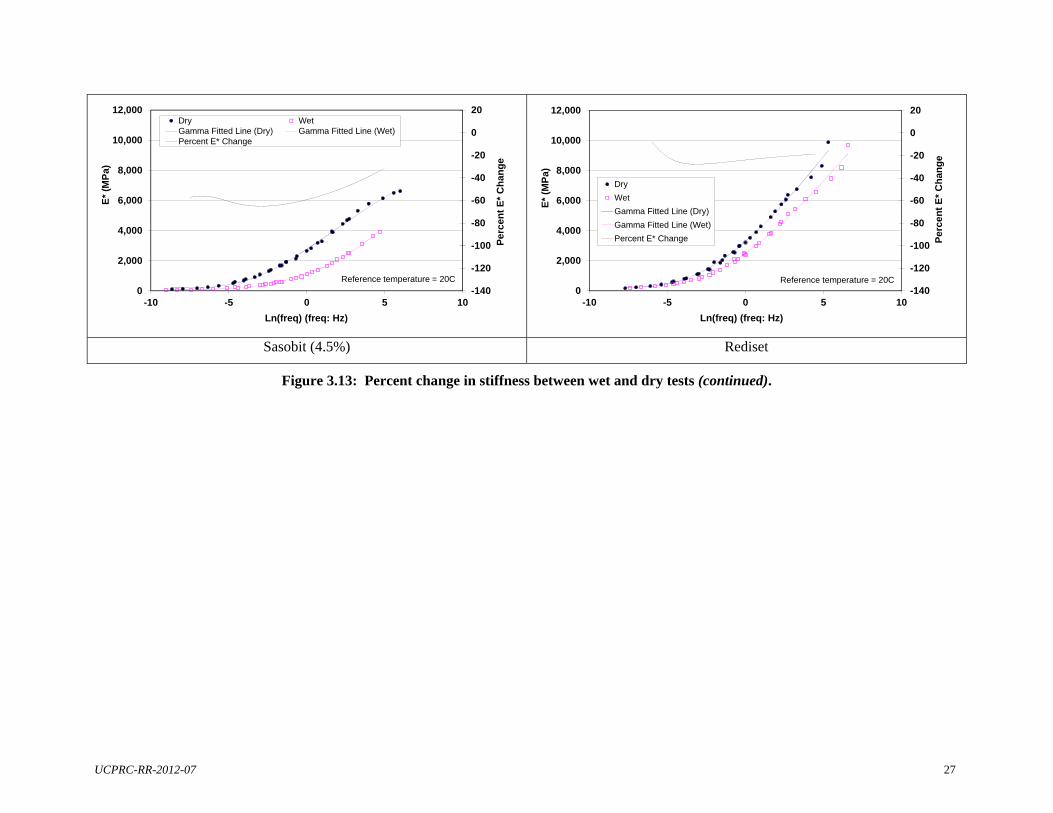
UCPRC-RR-2012-07 27
Sasobit (4.5%) Rediset
Figure 3.13: Percent change in stiffness between wet and dry tests (continued).
-140
-120
-100
-80
-60
-40
-20
0
20
0
2,000
4,000
6,000
8,000
10,000
12,000
-10 -5 0 5 10
Per
cen
t E
* C
han
ge
E*
(MP
a)
Ln(freq) (freq: Hz)
Dry WetGamma Fitted Line (Dry) Gamma Fitted Line (Wet)Percent E* Change
Reference temperature = 20C-140
-120
-100
-80
-60
-40
-20
0
20
0
2,000
4,000
6,000
8,000
10,000
12,000
-10 -5 0 5 10
Per
cen
t E
* C
han
ge
E*
(MP
a)
Ln(freq) (freq: Hz)
Dry
Wet
Gamma Fitted Line (Dry)
Gamma Fitted Line (Wet)
Percent E* Change
Reference temperature = 20C
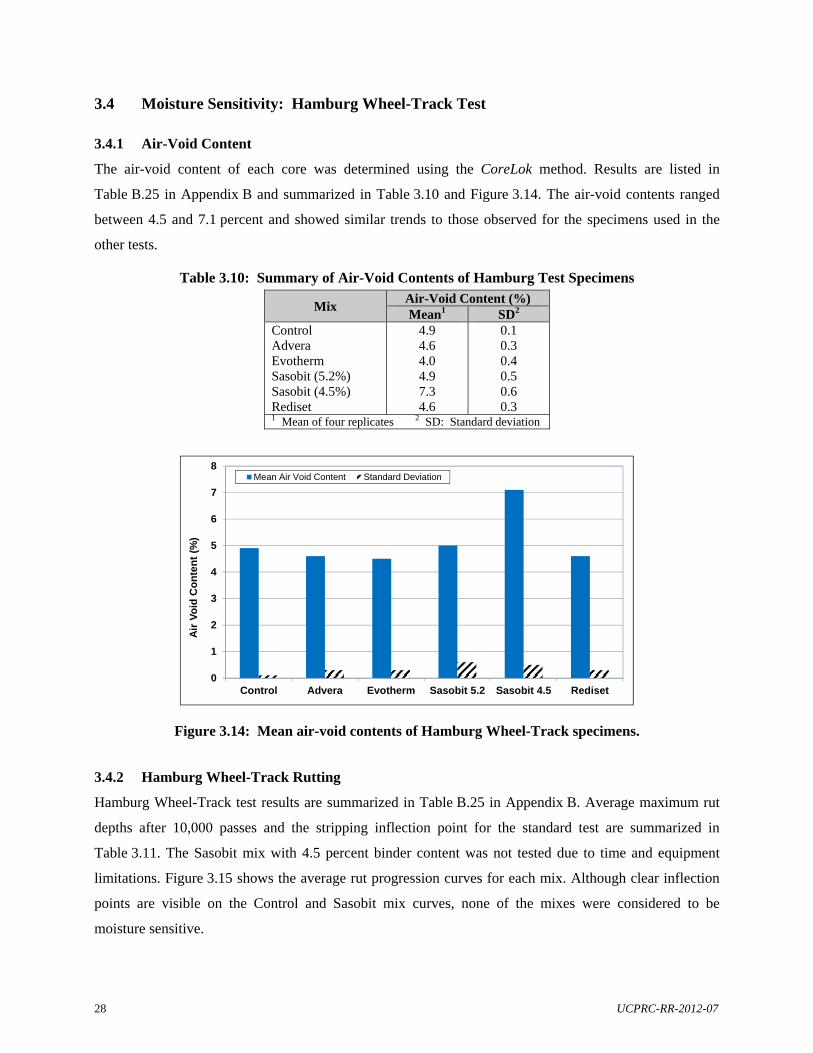
28 UCPRC-RR-2012-07
3.4 Moisture Sensitivity: Hamburg Wheel-Track Test
3.4.1 Air-Void Content
The air-void content of each core was determined using the CoreLok method. Results are listed in
Table B.25 in Appendix B and summarized in Table 3.10 and Figure 3.14. The air-void contents ranged
between 4.5 and 7.1 percent and showed similar trends to those observed for the specimens used in the
other tests.
Table 3.10: Summary of Air-Void Contents of Hamburg Test Specimens
Mix Air-Void Content (%) Mean1 SD2
Control Advera Evotherm Sasobit (5.2%) Sasobit (4.5%) Rediset
4.9 4.6 4.0 4.9 7.3 4.6
0.1 0.3 0.4 0.5 0.6 0.3
1 Mean of four replicates 2 SD: Standard deviation
Figure 3.14: Mean air-void contents of Hamburg Wheel-Track specimens.
3.4.2 Hamburg Wheel-Track Rutting
Hamburg Wheel-Track test results are summarized in Table B.25 in Appendix B. Average maximum rut
depths after 10,000 passes and the stripping inflection point for the standard test are summarized in
Table 3.11. The Sasobit mix with 4.5 percent binder content was not tested due to time and equipment
limitations. Figure 3.15 shows the average rut progression curves for each mix. Although clear inflection
points are visible on the Control and Sasobit mix curves, none of the mixes were considered to be
moisture sensitive.
0
1
2
3
4
5
6
7
8
Control Advera Evotherm Sasobit 5.2 Sasobit 4.5 Rediset
Air
Vo
id C
on
ten
t (%
)
Mean Air Void Content Standard Deviation
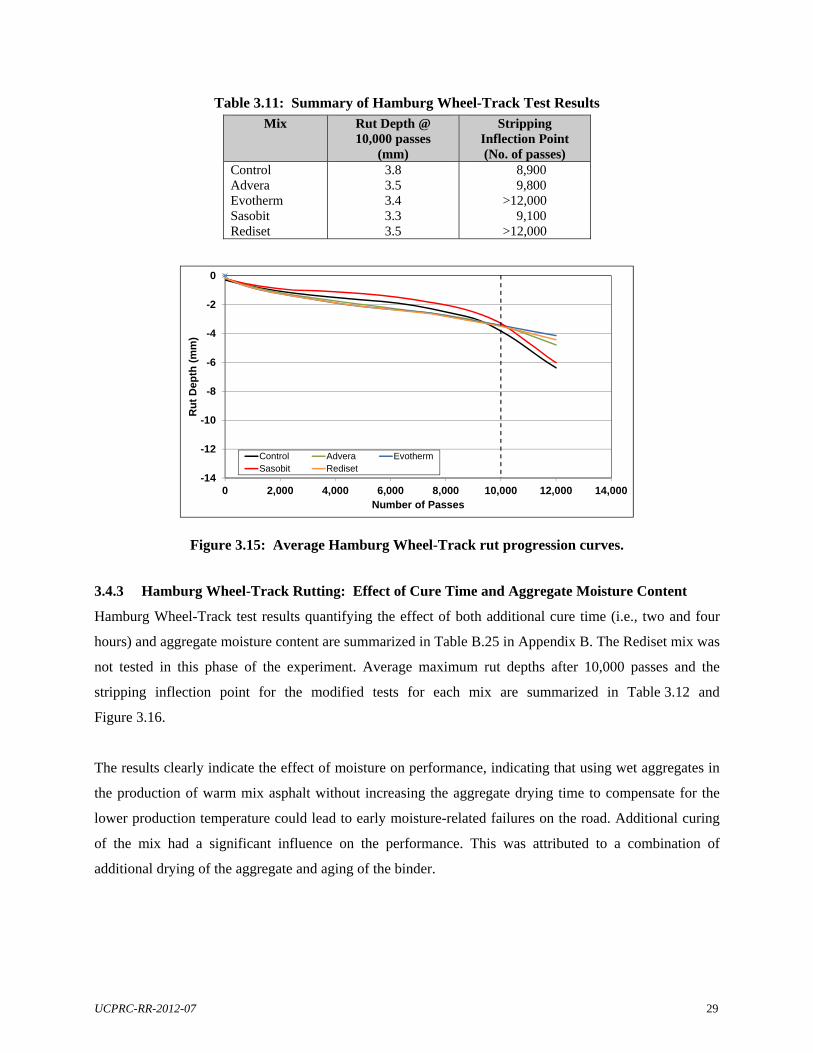
UCPRC-RR-2012-07 29
Table 3.11: Summary of Hamburg Wheel-Track Test Results
Mix Rut Depth @ 10,000 passes
(mm)
Stripping Inflection Point (No. of passes)
Control Advera Evotherm Sasobit Rediset
3.8 3.5 3.4 3.3 3.5
8,900 9,800 >12,000 9,100 >12,000
Figure 3.15: Average Hamburg Wheel-Track rut progression curves.
3.4.3 Hamburg Wheel-Track Rutting: Effect of Cure Time and Aggregate Moisture Content
Hamburg Wheel-Track test results quantifying the effect of both additional cure time (i.e., two and four
hours) and aggregate moisture content are summarized in Table B.25 in Appendix B. The Rediset mix was
not tested in this phase of the experiment. Average maximum rut depths after 10,000 passes and the
stripping inflection point for the modified tests for each mix are summarized in Table 3.12 and
Figure 3.16.
The results clearly indicate the effect of moisture on performance, indicating that using wet aggregates in
the production of warm mix asphalt without increasing the aggregate drying time to compensate for the
lower production temperature could lead to early moisture-related failures on the road. Additional curing
of the mix had a significant influence on the performance. This was attributed to a combination of
additional drying of the aggregate and aging of the binder.
-14
-12
-10
-8
-6
-4
-2
0
0 2,000 4,000 6,000 8,000 10,000 12,000 14,000
Ru
t D
epth
(m
m)
Number of Passes
Control Advera EvothermSasobit Rediset
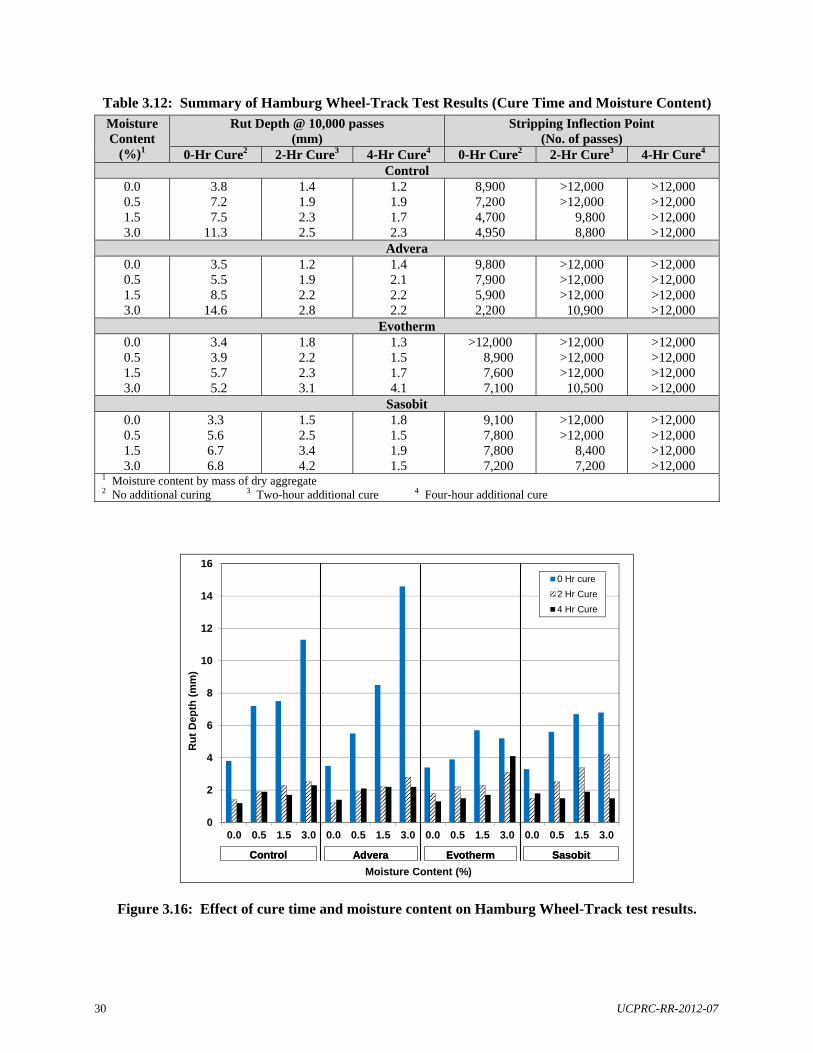
30 UCPRC-RR-2012-07
Table 3.12: Summary of Hamburg Wheel-Track Test Results (Cure Time and Moisture Content)
Moisture Content
(%)1
Rut Depth @ 10,000 passes (mm)
Stripping Inflection Point (No. of passes)
0-Hr Cure2 2-Hr Cure3 4-Hr Cure4 0-Hr Cure2 2-Hr Cure3 4-Hr Cure4
Control 0.0 0.5 1.5 3.0
3.8 7.2 7.5 11.3
1.4 1.9 2.3 2.5
1.2 1.9 1.7 2.3
8,900 7,200 4,700 4,950
>12,000 >12,000 9,800 8,800
>12,000 >12,000 >12,000 >12,000
Advera 0.0 0.5 1.5 3.0
3.5 5.5 8.5 14.6
1.2 1.9 2.2 2.8
1.4 2.1 2.2 2.2
9,800 7,900 5,900 2,200
>12,000 >12,000 >12,000 10,900
>12,000 >12,000 >12,000 >12,000
Evotherm 0.0 0.5 1.5 3.0
3.4 3.9 5.7 5.2
1.8 2.2 2.3 3.1
1.3 1.5 1.7 4.1
>12,000 8,900 7,600 7,100
>12,000 >12,000 >12,000 10,500
>12,000 >12,000 >12,000 >12,000
Sasobit 0.0 0.5 1.5 3.0
3.3 5.6 6.7 6.8
1.5 2.5 3.4 4.2
1.8 1.5 1.9 1.5
9,100 7,800 7,800 7,200
>12,000 >12,000 8,400 7,200
>12,000 >12,000 >12,000 >12,000
1 Moisture content by mass of dry aggregate 2 No additional curing 3 Two-hour additional cure 4 Four-hour additional cure
Figure 3.16: Effect of cure time and moisture content on Hamburg Wheel-Track test results.
0
2
4
6
8
10
12
14
16
0.0 0.5 1.5 3.0 0.0 0.5 1.5 3.0 0.0 0.5 1.5 3.0 0.0 0.5 1.5 3.0
Ru
t D
epth
(m
m)
Moisture Content (%)
0 Hr cure
2 Hr Cure
4 Hr Cure
Control Sasobit EvothermAdveraControl Sasobit EvothermAdvera
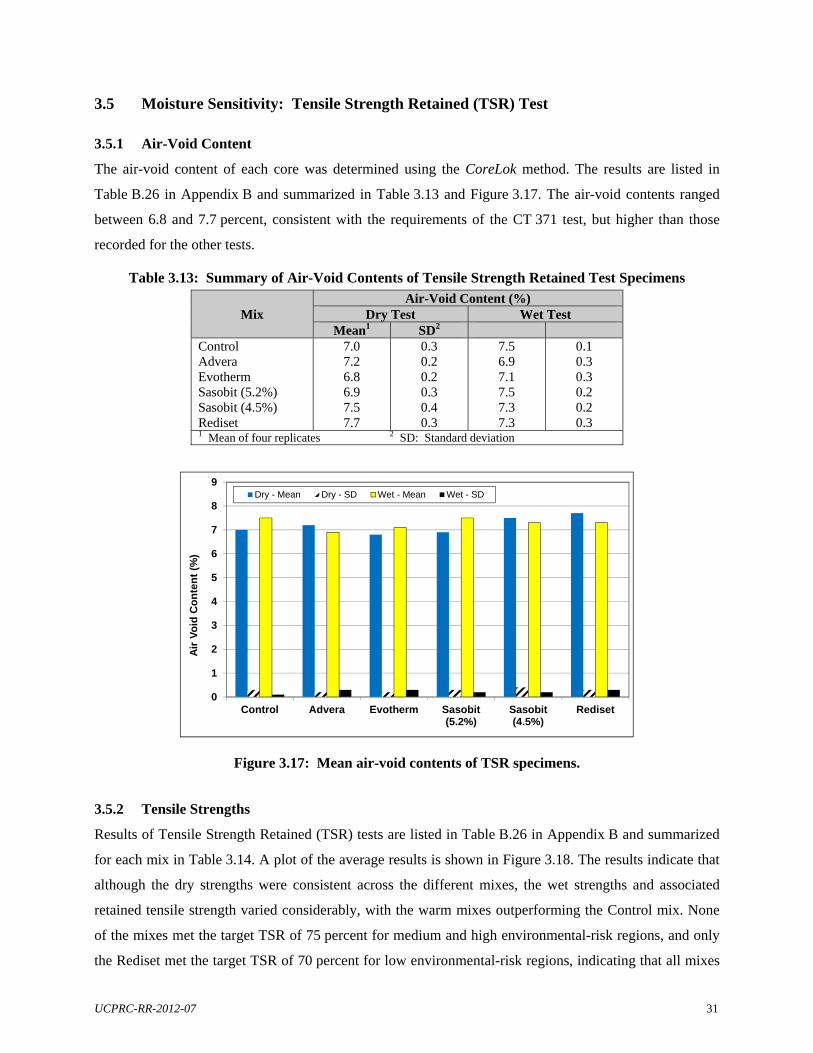
UCPRC-RR-2012-07 31
3.5 Moisture Sensitivity: Tensile Strength Retained (TSR) Test
3.5.1 Air-Void Content
The air-void content of each core was determined using the CoreLok method. The results are listed in
Table B.26 in Appendix B and summarized in Table 3.13 and Figure 3.17. The air-void contents ranged
between 6.8 and 7.7 percent, consistent with the requirements of the CT 371 test, but higher than those
recorded for the other tests.
Table 3.13: Summary of Air-Void Contents of Tensile Strength Retained Test Specimens
Mix Air-Void Content (%)
Dry Test Wet Test Mean1 SD2
Control Advera Evotherm Sasobit (5.2%) Sasobit (4.5%) Rediset
7.0 7.2 6.8 6.9 7.5 7.7
0.3 0.2 0.2 0.3 0.4 0.3
7.5 6.9 7.1 7.5 7.3 7.3
0.1 0.3 0.3 0.2 0.2 0.3
1 Mean of four replicates 2 SD: Standard deviation
Figure 3.17: Mean air-void contents of TSR specimens.
3.5.2 Tensile Strengths
Results of Tensile Strength Retained (TSR) tests are listed in Table B.26 in Appendix B and summarized
for each mix in Table 3.14. A plot of the average results is shown in Figure 3.18. The results indicate that
although the dry strengths were consistent across the different mixes, the wet strengths and associated
retained tensile strength varied considerably, with the warm mixes outperforming the Control mix. None
of the mixes met the target TSR of 75 percent for medium and high environmental-risk regions, and only
the Rediset met the target TSR of 70 percent for low environmental-risk regions, indicating that all mixes
0
1
2
3
4
5
6
7
8
9
Control Advera Evotherm Sasobit(5.2%)
Sasobit(4.5%)
Rediset
Air
Vo
id C
on
ten
t (%
)
Dry - Mean Dry - SD Wet - Mean Wet - SD
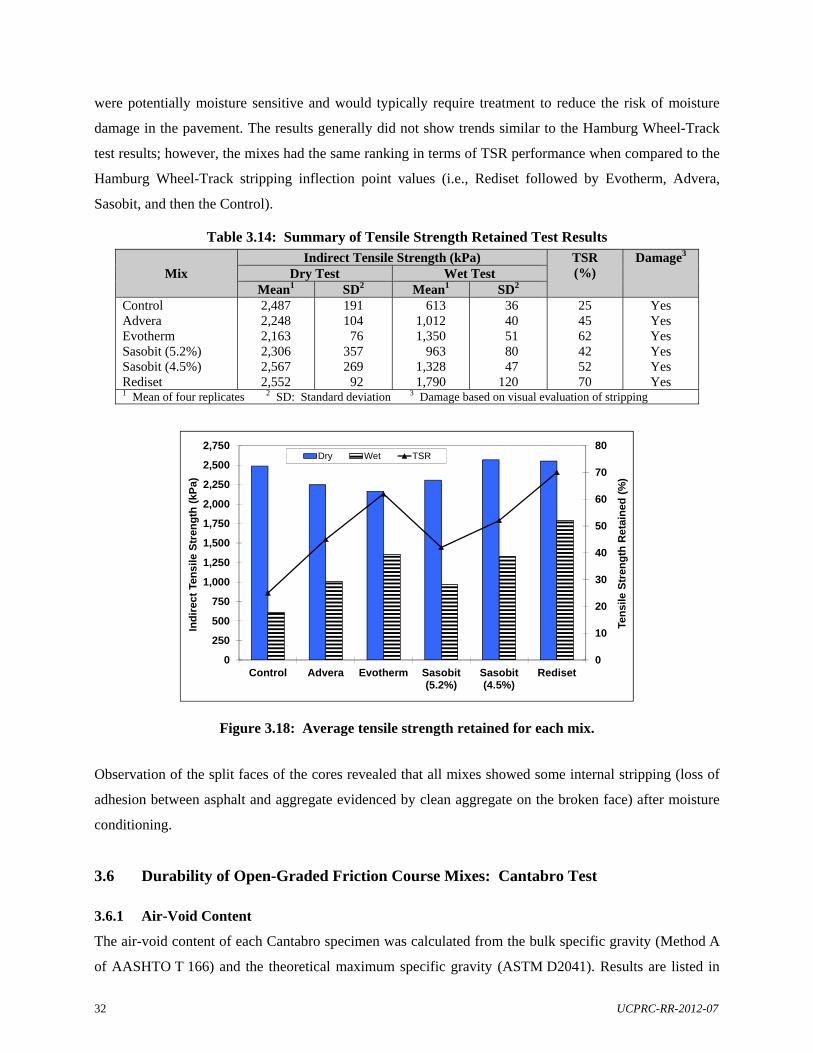
32 UCPRC-RR-2012-07
were potentially moisture sensitive and would typically require treatment to reduce the risk of moisture
damage in the pavement. The results generally did not show trends similar to the Hamburg Wheel-Track
test results; however, the mixes had the same ranking in terms of TSR performance when compared to the
Hamburg Wheel-Track stripping inflection point values (i.e., Rediset followed by Evotherm, Advera,
Sasobit, and then the Control).
Table 3.14: Summary of Tensile Strength Retained Test Results
Mix Indirect Tensile Strength (kPa) TSR
(%) Damage3
Dry Test Wet Test Mean1 SD2 Mean1 SD2
Control Advera Evotherm Sasobit (5.2%) Sasobit (4.5%) Rediset
2,487 2,248 2,163 2,306 2,567 2,552
191 104 76 357 269 92
613 1,012 1,350 963 1,328 1,790
36 40 51 80 47 120
25 45 62 42 52 70
Yes Yes Yes Yes Yes Yes
1 Mean of four replicates 2 SD: Standard deviation 3 Damage based on visual evaluation of stripping
Figure 3.18: Average tensile strength retained for each mix.
Observation of the split faces of the cores revealed that all mixes showed some internal stripping (loss of
adhesion between asphalt and aggregate evidenced by clean aggregate on the broken face) after moisture
conditioning.
3.6 Durability of Open-Graded Friction Course Mixes: Cantabro Test
3.6.1 Air-Void Content
The air-void content of each Cantabro specimen was calculated from the bulk specific gravity (Method A
of AASHTO T 166) and the theoretical maximum specific gravity (ASTM D2041). Results are listed in
0
10
20
30
40
50
60
70
80
0
250
500
750
1,000
1,250
1,500
1,750
2,000
2,250
2,500
2,750
Control Advera Evotherm Sasobit(5.2%)
Sasobit(4.5%)
Rediset
Ten
sile
Str
eng
th R
eta
ined
(%
)
Ind
irec
t Te
ns
ile
Str
eng
th (
kPa)
Dry Wet TSR
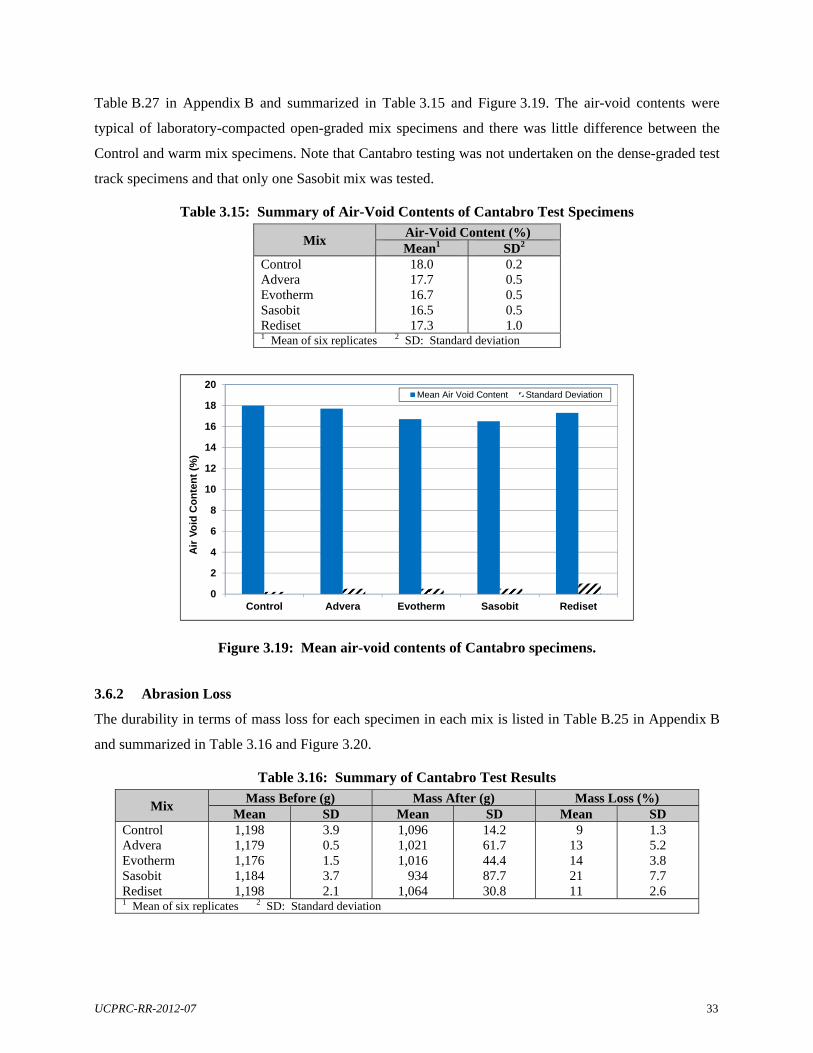
UCPRC-RR-2012-07 33
Table B.27 in Appendix B and summarized in Table 3.15 and Figure 3.19. The air-void contents were
typical of laboratory-compacted open-graded mix specimens and there was little difference between the
Control and warm mix specimens. Note that Cantabro testing was not undertaken on the dense-graded test
track specimens and that only one Sasobit mix was tested.
Table 3.15: Summary of Air-Void Contents of Cantabro Test Specimens
Mix Air-Void Content (%) Mean1 SD2
Control Advera Evotherm Sasobit Rediset
18.0 17.7 16.7 16.5 17.3
0.2 0.5 0.5 0.5 1.0
1 Mean of six replicates 2 SD: Standard deviation
Figure 3.19: Mean air-void contents of Cantabro specimens.
3.6.2 Abrasion Loss
The durability in terms of mass loss for each specimen in each mix is listed in Table B.25 in Appendix B
and summarized in Table 3.16 and Figure 3.20.
Table 3.16: Summary of Cantabro Test Results
Mix Mass Before (g) Mass After (g) Mass Loss (%)
Mean SD Mean SD Mean SD Control Advera Evotherm Sasobit Rediset
1,198 1,179 1,176 1,184 1,198
3.9 0.5 1.5 3.7 2.1
1,096 1,021 1,016 934 1,064
14.2 61.7 44.4 87.7 30.8
9 13 14 21 11
1.3 5.2 3.8 7.7 2.6
1 Mean of six replicates 2 SD: Standard deviation
0
2
4
6
8
10
12
14
16
18
20
Control Advera Evotherm Sasobit Rediset
Air
Vo
id C
on
ten
t (%
)
Mean Air Void Content Standard Deviation
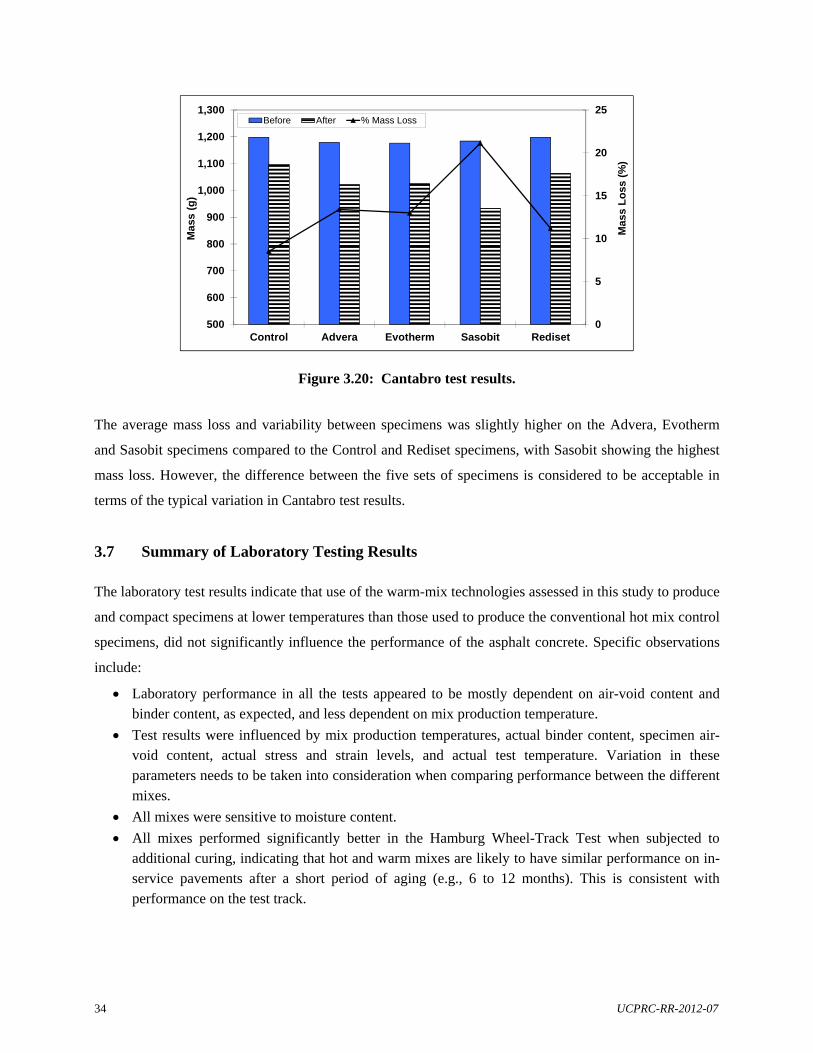
34 UCPRC-RR-2012-07
Figure 3.20: Cantabro test results.
The average mass loss and variability between specimens was slightly higher on the Advera, Evotherm
and Sasobit specimens compared to the Control and Rediset specimens, with Sasobit showing the highest
mass loss. However, the difference between the five sets of specimens is considered to be acceptable in
terms of the typical variation in Cantabro test results.
3.7 Summary of Laboratory Testing Results
The laboratory test results indicate that use of the warm-mix technologies assessed in this study to produce
and compact specimens at lower temperatures than those used to produce the conventional hot mix control
specimens, did not significantly influence the performance of the asphalt concrete. Specific observations
include:
Laboratory performance in all the tests appeared to be mostly dependent on air-void content and binder content, as expected, and less dependent on mix production temperature.
Test results were influenced by mix production temperatures, actual binder content, specimen air-void content, actual stress and strain levels, and actual test temperature. Variation in these parameters needs to be taken into consideration when comparing performance between the different mixes.
All mixes were sensitive to moisture content.
All mixes performed significantly better in the Hamburg Wheel-Track Test when subjected to additional curing, indicating that hot and warm mixes are likely to have similar performance on in-service pavements after a short period of aging (e.g., 6 to 12 months). This is consistent with performance on the test track.
0
5
10
15
20
25
500
600
700
800
900
1,000
1,100
1,200
1,300
Control Advera Evotherm Sasobit Rediset
Mas
s L
oss
(%
)
Ma
ss (
g)
Before After % Mass Loss
UCPRC-RR-2012-07 35
4. COMPARISON OF TEST RESULTS
Results from this phase of testing were compared to those from Phase 1 (tests on specimens cored or cut
from the test track) and Phase 2a (plant-mixed, laboratory-compacted specimens compacted at the test
track on the day of construction). Only a limited number of specimens could be prepared for the Phase 2a
experiment, and consequently only shear and beam fatigue tests were conducted. The results for the
Sasobit mix prepared with 5.2 percent binder content and the Rediset mix are not discussed as they were
not part of the Phase 1 and Phase 2a experiments. Observations from the comparisons are summarized as
follows:
The air-void contents measured in this phase were generally similar to those measured on the Phase 2a specimens and lower than those measured on the Phase 1 specimens, with the exception of the Sasobit with 4.5 percent binder, which had air-void contents similar to those recorded in the specimens removed from the test track. Tensile strength retained results could not be compared between Phase 1 and this phase due to the higher air-void contents of the Phase 2b specimens, which were prepared according to Caltrans CT 371 test method.
Resilient shear moduli and permanent shear strain at 5,000 cycles were consistent across all phases with differences in the results attributed to air-void content.
Initial stiffnesses, phase angles, and fatigue life recorded on fatigue beams were consistent across all phases with differences in the results attributed to air-void content.
Complex modulus values were similar for the specimens tested in Phase 1 and Phase 2b; however, the temperature-shifting relationships were different, indicating that the Phase 1 specimens were potentially more temperature-sensitive than the laboratory-prepared specimens. Differences were also attributed to the difference in air-void content.
Average maximum rut depths after 10,000 Hamburg Wheel-Track passes were significantly lower on the Phase 2b specimens compared to the Phase 1 specimens. This was attributed to the lower air-void contents of the Phase 2b specimens.
The TSR results for the warm mix specimens were similar for both phases; however, the results for the Control were significantly different, with the TSR for the Phase 2b tests significantly lower than that recorded in the Phase 1 tests. The reason for this is unclear.
This comparison indicates that comparable results can be obtained from specimens sampled from test
tracks and roads or prepared in the laboratory, provided that air-void content, binder content, and degree
of aging are taken into consideration.

36 UCPRC-RR-2012-07
Blank page
UCPRC-RR-2012-07 37
5. CONCLUSIONS AND RECOMMENDATIONS
5.1 Conclusions
This report describes laboratory testing of laboratory-prepared specimens as part of the second phase of a
warm mix asphalt (WMA) study, which compares the performance of a hot mix control produced at 310°F
(155°C) against the performance of warm mixes produced at 250°F (120°C) using four different
technologies (Advera, Evotherm, Sasobit, and Rediset).
Key findings from the study include the following:
The laboratory test results indicate that use of the warm mix technologies assessed in this study, which were produced and compacted at lower temperatures, did not significantly influence the performance of the asphalt concrete when compared to control specimens produced and compacted at conventional hot mix asphalt temperatures.
Laboratory performance in all tests appeared to be mostly dependent on air-void content and less dependent on mix production temperature.
Test results were influenced by specimen air-void content, actual stress and strain levels, and actual test temperature. Variation in these parameters needs to be taken into consideration when comparing performance between the different mixes.
All the mixes were sensitive to moisture content. Rutting performance, fatigue cracking performance, and tensile strength retained all deteriorated with increasing moisture content in the specimens.
All the mixes performed significantly better in the Hamburg Wheel-Track Test when subjected to additional curing, indicating that hot and warm mixes are likely to have similar performance on in-service pavements after a short period of aging (e.g., 6 to 12 months). This is consistent with performance on the test track.
Test results were consistent with those from earlier testing phases.
5.2 Recommendations
The laboratory testing completed in this phase has provided no new results to suggest that warm mix
technologies should not be used in dense- or open-graded mixes in California, provided that standard
specified construction and performance limits for hot mix asphalt are met. It should be noted that lower
production temperatures could lead to insufficient drying of aggregates, which in turn could result in
moisture-related problems in the road. Moisture content in aggregates should be strictly controlled at
asphalt plants and specified mix moisture contents (i.e., less than 1.0 percent by weight of the mix) should
be adhered to.

38 UCPRC-RR-2012-07
Blank page
UCPRC-RR-2012-07 39
REFERENCES
1. JONES, D. and Harvey, J. 2007. Warm-Mix Asphalt Study: Workplan for Comparison of
Conventional and Warm-Mix Asphalt Performance using HVS and Laboratory Testing.
Davis and Berkeley, CA: University of California Pavement Research Center (WP-2007-01).
2. JONES, D., Wu, R., Tsai, B., Lu, Q. and Harvey, J. 2008. Warm-Mix Asphalt Study: Test
Track Construction and First-Level Analysis of Phase 1 HVS and Laboratory Testing. Davis
and Berkeley, CA: University of California Pavement Research Center (RR-2008-11).
3. JONES, D., Wu, R., Tsai, B., Lu, Q. and Harvey, J. 2008. Warm-Mix Asphalt Study: First-
Level Analysis of Phase 2 HVS and Laboratory Testing, and Phase 1 and Phase 2 Forensic
Assessments. Davis and Berkeley, CA: University of California Pavement Research Center (RR-
2009-02).
4. JONES, D., Wu, R., Tsai, B. and Harvey, J. 2011. Warm-Mix Asphalt Study: Test Track
Construction and First-Level Analysis of Phase 3a HVS and Laboratory Testing (Rubberized Asphalt,
Mix Design #1). Davis and Berkeley, CA: University of California Pavement Research Center
(RR-2011-02).
5. JONES, D., Wu, R., Tsai, B. and Harvey, J. 2011. Warm-Mix Asphalt Study: Test Track
Construction and First-Level Analysis of Phase 3b HVS and Laboratory Testing (Rubberized Asphalt,
Mix Design #2). Davis and Berkeley, CA: University of California Pavement Research Center
(RR-2011-03).
6. JONES, D. 2013. Warm-Mix Asphalt Study: Field Test Performance Evaluation. Davis and
Berkeley, CA: University of California Pavement Research Center (RR-2013-08).
7. Standard Specifications. 2010. Sacramento, CA: State of California Department of
Transportation.

40 UCPRC-RR-2012-07
Blank page
UCPRC-RR-2012-07 41
APPENDIX A: BEAM FATIGUE SOAKING PROCEDURE
A.1 Preparation of Specimens
Specimens are prepared as follows:
1. Measure and record the bulk specific gravity, width, and height of each beam.
2. Dry each beam at room temperature (around 30C) in a forced draft oven or in a concrete
conditioning room to constant mass (defined as the mass at which further drying does not alter the
mass by more than 0.05 percent at two-hour drying intervals). Record the final dry mass. Note
that beams should be placed on a rigid, flat surface during drying.
3. Using epoxy resin, bond a nut to the beam for supporting the LVDT.
4. Record the mass of the beam with the nut.
A.2 Conditioning of Specimens
1. Place the beam in the vacuum container supported above the container bottom by a spacer. Fill
the container with water so that the beam is totally submerged. Apply a vacuum of 635 mm
(25 in.) of mercury for 30 minutes. Remove the vacuum and determine the saturated surface dry
mass according to AASHTO T 166. Calculate the volume of absorbed water and determine the
degree of saturation. If the saturation level is less than 70 percent, vacuum saturate the beam for a
longer time and determine the saturated surface dry mass again.
2. Place the vacuum-saturated beam in a water bath with the water temperature pre-set at 60C. The
beam should be supported on a rigid, flat (steel or wood) plate to prevent deformation during
conditioning. The top surface of the beam should be about 25 mm below the water surface.
3. After 24 hours, drain the water bath and refill it with cold tap water. Set the water bath
temperature to 20C. Wait for two hours for temperature equilibrium.
4. Remove the beam from the water bath, and determine its saturated surface dry mass.
5. Wrap the beam with Parafilm to ensure no water leakage.
6. Check the bonded nut. If it becomes loose, remove it and rebond it with epoxy resin.
7. Apply a layer of scotch tape to the areas where the beam contacts the clamps of the fatigue
machine. This will prevent adhesion between the Parafilm and the clamps.
8. Start the fatigue test of the conditioned beam within 24 hours.

42 UCPRC-RR-2012-07
Blank page
UCPRC-RR-2012-07 43
APPENDIX B: LABORATORY TEST RESULTS
B.1 Shear Test Results
Shear test results are summarized in Table B.1 through Table B.6.
B.2 Beam Fatigue Test Results
Beam fatigue test results are summarized in Table B.7 through Table B.12.
B.3 Flexural Frequency Sweep Test Results
Flexural frequency sweep test results are summarized in Table B.13 through Table B.24.
B.4 Hamburg Wheel-Track Test Results
Hamburg Wheel-Track test results are summarized in Table B.25.
B.5 Tensile Strength Retained Test Results
Tensile Strength Retained test results are summarized in Table B.26.
B.6 Open-Graded Friction Course Durability Test Results
Open-graded friction course durability (Cantabro) test results are summarized in Table B.27.
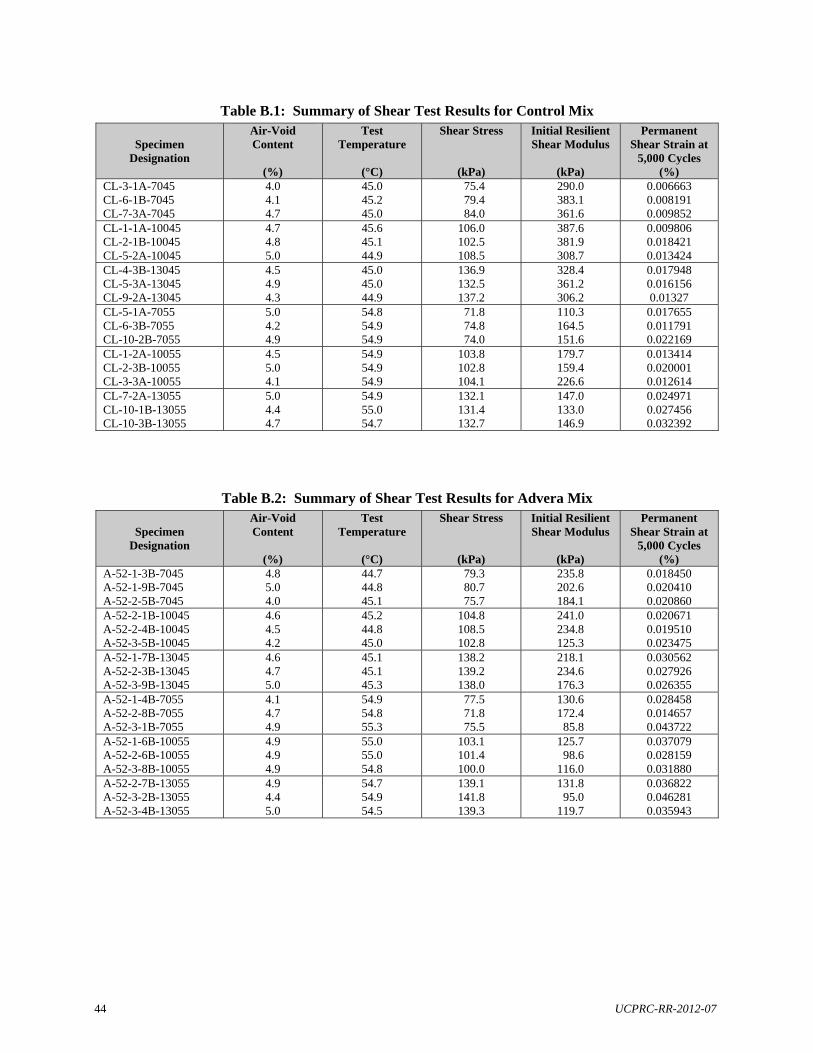
44 UCPRC-RR-2012-07
Table B.1: Summary of Shear Test Results for Control Mix
Specimen Designation
Air-Void Content
(%)
Test Temperature
(°C)
Shear Stress
(kPa)
Initial Resilient Shear Modulus
(kPa)
Permanent Shear Strain at
5,000 Cycles (%)
CL-3-1A-7045 CL-6-1B-7045 CL-7-3A-7045
4.0 4.1 4.7
45.0 45.2 45.0
75.4 79.4 84.0
290.0 383.1 361.6
0.006663 0.008191 0.009852
CL-1-1A-10045 CL-2-1B-10045 CL-5-2A-10045
4.7 4.8 5.0
45.6 45.1 44.9
106.0 102.5 108.5
387.6 381.9 308.7
0.009806 0.018421 0.013424
CL-4-3B-13045 CL-5-3A-13045 CL-9-2A-13045
4.5 4.9 4.3
45.0 45.0 44.9
136.9 132.5 137.2
328.4 361.2 306.2
0.017948 0.016156 0.01327
CL-5-1A-7055 CL-6-3B-7055 CL-10-2B-7055
5.0 4.2 4.9
54.8 54.9 54.9
71.8 74.8 74.0
110.3 164.5 151.6
0.017655 0.011791 0.022169
CL-1-2A-10055 CL-2-3B-10055 CL-3-3A-10055
4.5 5.0 4.1
54.9 54.9 54.9
103.8 102.8 104.1
179.7 159.4 226.6
0.013414 0.020001 0.012614
CL-7-2A-13055 CL-10-1B-13055 CL-10-3B-13055
5.0 4.4 4.7
54.9 55.0 54.7
132.1 131.4 132.7
147.0 133.0 146.9
0.024971 0.027456 0.032392
Table B.2: Summary of Shear Test Results for Advera Mix
Specimen Designation
Air-Void Content
(%)
Test Temperature
(°C)
Shear Stress
(kPa)
Initial Resilient Shear Modulus
(kPa)
Permanent Shear Strain at
5,000 Cycles (%)
A-52-1-3B-7045 A-52-1-9B-7045 A-52-2-5B-7045
4.8 5.0 4.0
44.7 44.8 45.1
79.3 80.7 75.7
235.8 202.6 184.1
0.018450 0.020410 0.020860
A-52-2-1B-10045 A-52-2-4B-10045 A-52-3-5B-10045
4.6 4.5 4.2
45.2 44.8 45.0
104.8 108.5 102.8
241.0 234.8 125.3
0.020671 0.019510 0.023475
A-52-1-7B-13045 A-52-2-3B-13045 A-52-3-9B-13045
4.6 4.7 5.0
45.1 45.1 45.3
138.2 139.2 138.0
218.1 234.6 176.3
0.030562 0.027926 0.026355
A-52-1-4B-7055 A-52-2-8B-7055 A-52-3-1B-7055
4.1 4.7 4.9
54.9 54.8 55.3
77.5 71.8 75.5
130.6 172.4 85.8
0.028458 0.014657 0.043722
A-52-1-6B-10055 A-52-2-6B-10055 A-52-3-8B-10055
4.9 4.9 4.9
55.0 55.0 54.8
103.1 101.4 100.0
125.7 98.6 116.0
0.037079 0.028159 0.031880
A-52-2-7B-13055 A-52-3-2B-13055 A-52-3-4B-13055
4.9 4.4 5.0
54.7 54.9 54.5
139.1 141.8 139.3
131.8 95.0 119.7
0.036822 0.046281 0.035943
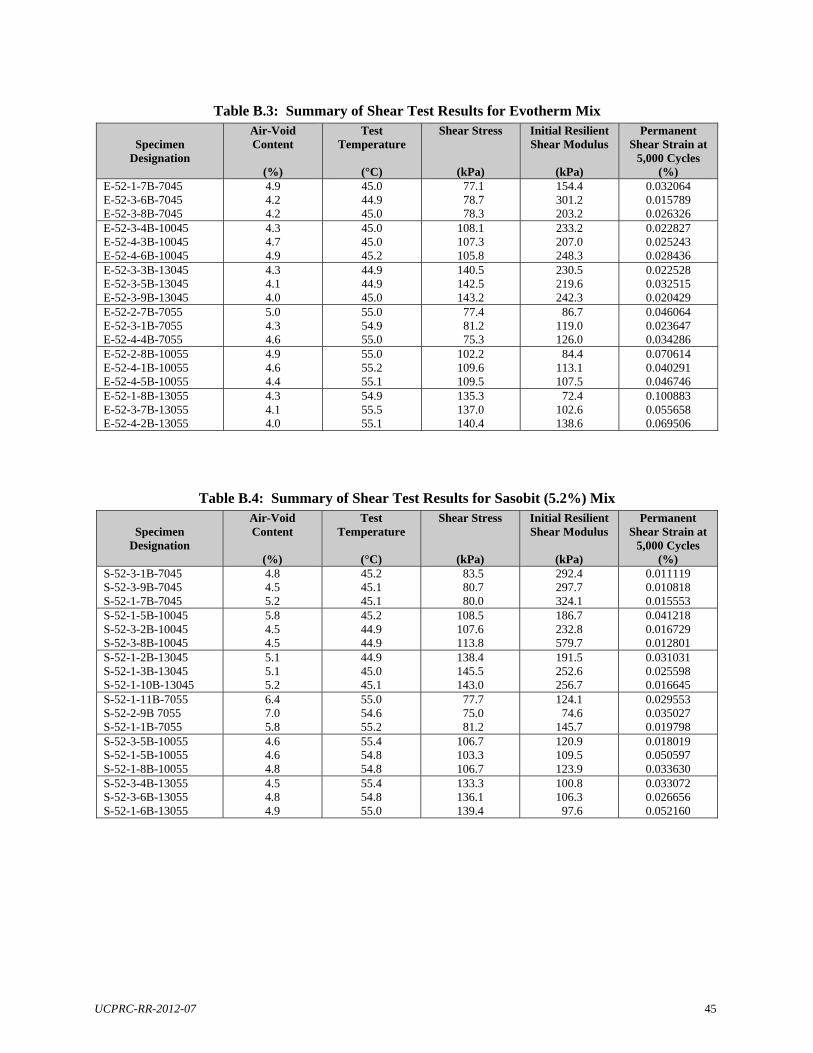
UCPRC-RR-2012-07 45
Table B.3: Summary of Shear Test Results for Evotherm Mix
Specimen Designation
Air-Void Content
(%)
Test Temperature
(°C)
Shear Stress
(kPa)
Initial Resilient Shear Modulus
(kPa)
Permanent Shear Strain at
5,000 Cycles (%)
E-52-1-7B-7045 E-52-3-6B-7045 E-52-3-8B-7045
4.9 4.2 4.2
45.0 44.9 45.0
77.1 78.7 78.3
154.4 301.2 203.2
0.032064 0.015789 0.026326
E-52-3-4B-10045 E-52-4-3B-10045 E-52-4-6B-10045
4.3 4.7 4.9
45.0 45.0 45.2
108.1 107.3 105.8
233.2 207.0 248.3
0.022827 0.025243 0.028436
E-52-3-3B-13045 E-52-3-5B-13045 E-52-3-9B-13045
4.3 4.1 4.0
44.9 44.9 45.0
140.5 142.5 143.2
230.5 219.6 242.3
0.022528 0.032515 0.020429
E-52-2-7B-7055 E-52-3-1B-7055 E-52-4-4B-7055
5.0 4.3 4.6
55.0 54.9 55.0
77.4 81.2 75.3
86.7 119.0 126.0
0.046064 0.023647 0.034286
E-52-2-8B-10055 E-52-4-1B-10055 E-52-4-5B-10055
4.9 4.6 4.4
55.0 55.2 55.1
102.2 109.6 109.5
84.4 113.1 107.5
0.070614 0.040291 0.046746
E-52-1-8B-13055 E-52-3-7B-13055 E-52-4-2B-13055
4.3 4.1 4.0
54.9 55.5 55.1
135.3 137.0 140.4
72.4 102.6 138.6
0.100883 0.055658 0.069506
Table B.4: Summary of Shear Test Results for Sasobit (5.2%) Mix
Specimen Designation
Air-Void Content
(%)
Test Temperature
(°C)
Shear Stress
(kPa)
Initial Resilient Shear Modulus
(kPa)
Permanent Shear Strain at
5,000 Cycles (%)
S-52-3-1B-7045 S-52-3-9B-7045 S-52-1-7B-7045
4.8 4.5 5.2
45.2 45.1 45.1
83.5 80.7 80.0
292.4 297.7 324.1
0.011119 0.010818 0.015553
S-52-1-5B-10045 S-52-3-2B-10045 S-52-3-8B-10045
5.8 4.5 4.5
45.2 44.9 44.9
108.5 107.6 113.8
186.7 232.8 579.7
0.041218 0.016729 0.012801
S-52-1-2B-13045 S-52-1-3B-13045 S-52-1-10B-13045
5.1 5.1 5.2
44.9 45.0 45.1
138.4 145.5 143.0
191.5 252.6 256.7
0.031031 0.025598 0.016645
S-52-1-11B-7055 S-52-2-9B 7055 S-52-1-1B-7055
6.4 7.0 5.8
55.0 54.6 55.2
77.7 75.0 81.2
124.1 74.6 145.7
0.029553 0.035027 0.019798
S-52-3-5B-10055 S-52-1-5B-10055 S-52-1-8B-10055
4.6 4.6 4.8
55.4 54.8 54.8
106.7 103.3 106.7
120.9 109.5 123.9
0.018019 0.050597 0.033630
S-52-3-4B-13055 S-52-3-6B-13055 S-52-1-6B-13055
4.5 4.8 4.9
55.4 54.8 55.0
133.3 136.1 139.4
100.8 106.3 97.6
0.033072 0.026656 0.052160
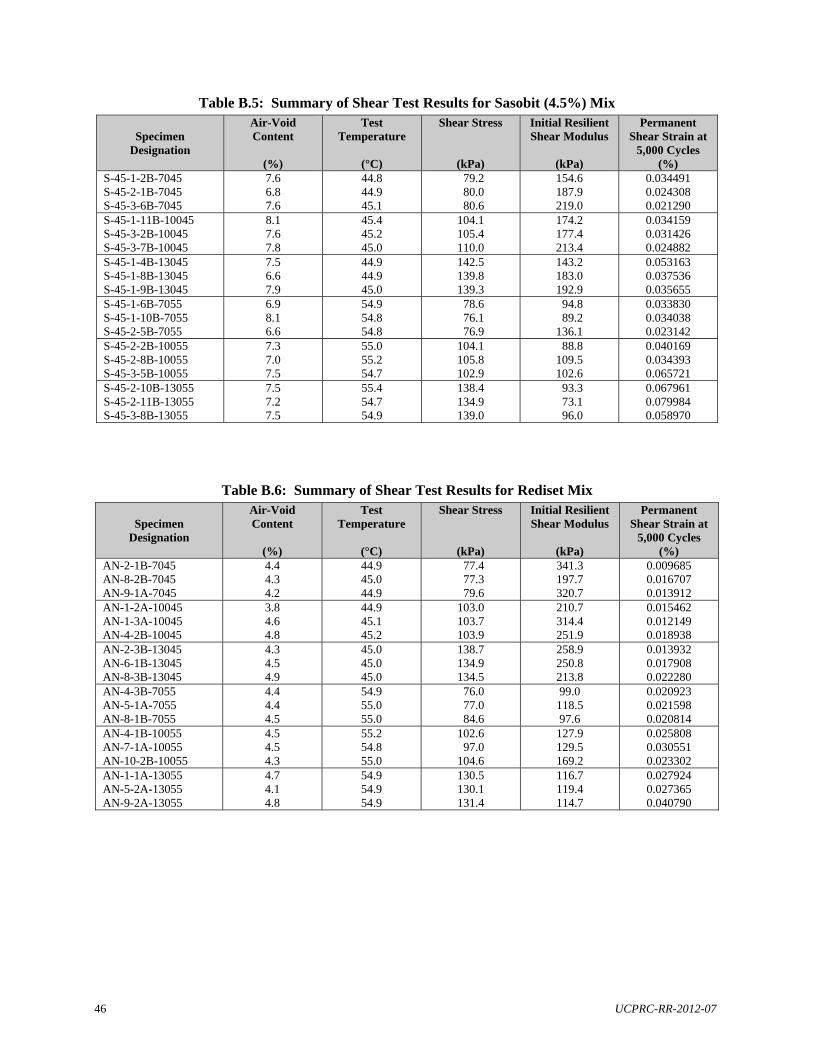
46 UCPRC-RR-2012-07
Table B.5: Summary of Shear Test Results for Sasobit (4.5%) Mix
Specimen Designation
Air-Void Content
(%)
Test Temperature
(°C)
Shear Stress
(kPa)
Initial Resilient Shear Modulus
(kPa)
Permanent Shear Strain at
5,000 Cycles (%)
S-45-1-2B-7045 S-45-2-1B-7045 S-45-3-6B-7045
7.6 6.8 7.6
44.8 44.9 45.1
79.2 80.0 80.6
154.6 187.9 219.0
0.034491 0.024308 0.021290
S-45-1-11B-10045 S-45-3-2B-10045 S-45-3-7B-10045
8.1 7.6 7.8
45.4 45.2 45.0
104.1 105.4 110.0
174.2 177.4 213.4
0.034159 0.031426 0.024882
S-45-1-4B-13045 S-45-1-8B-13045 S-45-1-9B-13045
7.5 6.6 7.9
44.9 44.9 45.0
142.5 139.8 139.3
143.2 183.0 192.9
0.053163 0.037536 0.035655
S-45-1-6B-7055 S-45-1-10B-7055 S-45-2-5B-7055
6.9 8.1 6.6
54.9 54.8 54.8
78.6 76.1 76.9
94.8 89.2 136.1
0.033830 0.034038 0.023142
S-45-2-2B-10055 S-45-2-8B-10055 S-45-3-5B-10055
7.3 7.0 7.5
55.0 55.2 54.7
104.1 105.8 102.9
88.8 109.5 102.6
0.040169 0.034393 0.065721
S-45-2-10B-13055 S-45-2-11B-13055 S-45-3-8B-13055
7.5 7.2 7.5
55.4 54.7 54.9
138.4 134.9 139.0
93.3 73.1 96.0
0.067961 0.079984 0.058970
Table B.6: Summary of Shear Test Results for Rediset Mix
Specimen Designation
Air-Void Content
(%)
Test Temperature
(°C)
Shear Stress
(kPa)
Initial Resilient Shear Modulus
(kPa)
Permanent Shear Strain at
5,000 Cycles (%)
AN-2-1B-7045 AN-8-2B-7045 AN-9-1A-7045
4.4 4.3 4.2
44.9 45.0 44.9
77.4 77.3 79.6
341.3 197.7 320.7
0.009685 0.016707 0.013912
AN-1-2A-10045 AN-1-3A-10045 AN-4-2B-10045
3.8 4.6 4.8
44.9 45.1 45.2
103.0 103.7 103.9
210.7 314.4 251.9
0.015462 0.012149 0.018938
AN-2-3B-13045 AN-6-1B-13045 AN-8-3B-13045
4.3 4.5 4.9
45.0 45.0 45.0
138.7 134.9 134.5
258.9 250.8 213.8
0.013932 0.017908 0.022280
AN-4-3B-7055 AN-5-1A-7055 AN-8-1B-7055
4.4 4.4 4.5
54.9 55.0 55.0
76.0 77.0 84.6
99.0 118.5 97.6
0.020923 0.021598 0.020814
AN-4-1B-10055 AN-7-1A-10055 AN-10-2B-10055
4.5 4.5 4.3
55.2 54.8 55.0
102.6 97.0 104.6
127.9 129.5 169.2
0.025808 0.030551 0.023302
AN-1-1A-13055 AN-5-2A-13055 AN-9-2A-13055
4.7 4.1 4.8
54.9 54.9 54.9
130.5 130.1 131.4
116.7 119.4 114.7
0.027924 0.027365 0.040790
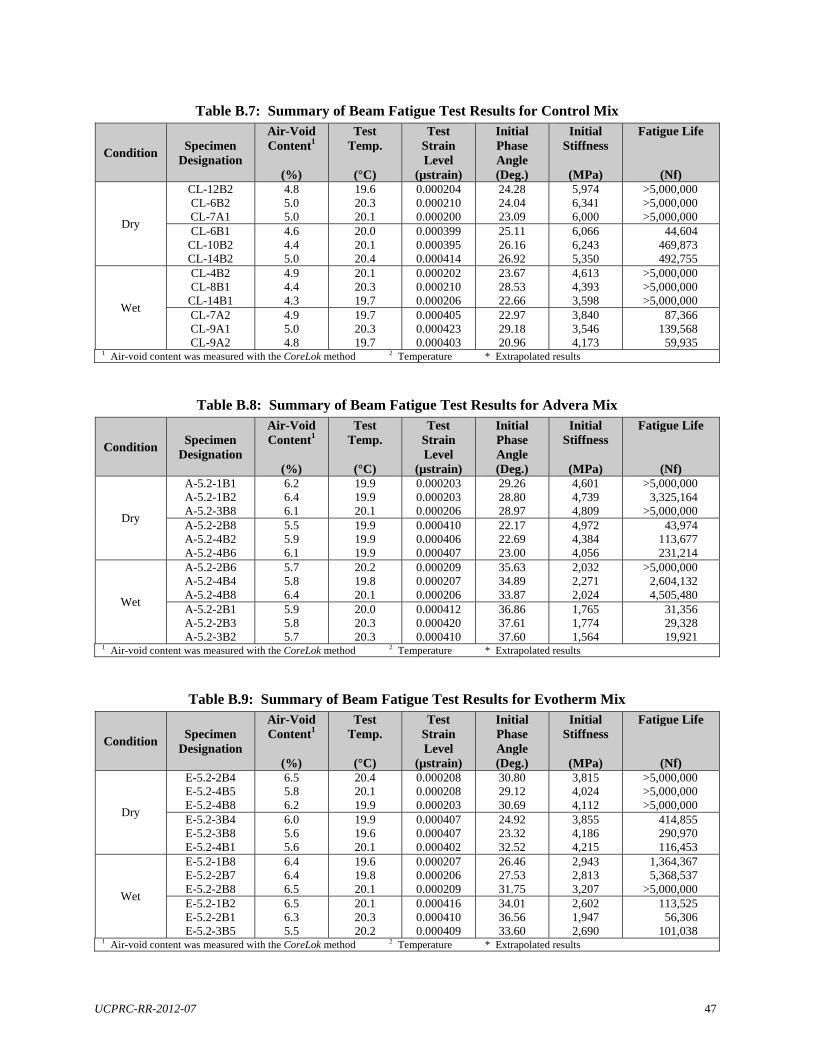
UCPRC-RR-2012-07 47
Table B.7: Summary of Beam Fatigue Test Results for Control Mix
Condition Specimen
Designation
Air-Void Content1
(%)
Test Temp.
(°C)
Test Strain Level
(µstrain)
Initial Phase Angle (Deg.)
Initial Stiffness
(MPa)
Fatigue Life
(Nf)
Dry
CL-12B2 CL-6B2 CL-7A1
4.8 5.0 5.0
19.6 20.3 20.1
0.000204 0.000210 0.000200
24.28 24.04 23.09
5,974 6,341 6,000
>5,000,000 >5,000,000 >5,000,000
CL-6B1 CL-10B2 CL-14B2
4.6 4.4 5.0
20.0 20.1 20.4
0.000399 0.000395 0.000414
25.11 26.16 26.92
6,066 6,243 5,350
44,604 469,873 492,755
Wet
CL-4B2 CL-8B1
CL-14B1
4.9 4.4 4.3
20.1 20.3 19.7
0.000202 0.000210 0.000206
23.67 28.53 22.66
4,613 4,393 3,598
>5,000,000 >5,000,000 >5,000,000
CL-7A2 CL-9A1 CL-9A2
4.9 5.0 4.8
19.7 20.3 19.7
0.000405 0.000423 0.000403
22.97 29.18 20.96
3,840 3,546 4,173
87,366 139,568 59,935
1 Air-void content was measured with the CoreLok method 2 Temperature * Extrapolated results
Table B.8: Summary of Beam Fatigue Test Results for Advera Mix
Condition Specimen
Designation
Air-Void Content1
(%)
Test Temp.
(°C)
Test Strain Level
(µstrain)
Initial Phase Angle (Deg.)
Initial Stiffness
(MPa)
Fatigue Life
(Nf)
Dry
A-5.2-1B1 A-5.2-1B2 A-5.2-3B8
6.2 6.4 6.1
19.9 19.9 20.1
0.000203 0.000203 0.000206
29.26 28.80 28.97
4,601 4,739 4,809
>5,000,000 3,325,164
>5,000,000 A-5.2-2B8 A-5.2-4B2 A-5.2-4B6
5.5 5.9 6.1
19.9 19.9 19.9
0.000410 0.000406 0.000407
22.17 22.69 23.00
4,972 4,384 4,056
43,974 113,677 231,214
Wet
A-5.2-2B6 A-5.2-4B4 A-5.2-4B8
5.7 5.8 6.4
20.2 19.8 20.1
0.000209 0.000207 0.000206
35.63 34.89 33.87
2,032 2,271 2,024
>5,000,000 2,604,132 4,505,480
A-5.2-2B1 A-5.2-2B3 A-5.2-3B2
5.9 5.8 5.7
20.0 20.3 20.3
0.000412 0.000420 0.000410
36.86 37.61 37.60
1,765 1,774 1,564
31,356 29,328 19,921
1 Air-void content was measured with the CoreLok method 2 Temperature * Extrapolated results
Table B.9: Summary of Beam Fatigue Test Results for Evotherm Mix
Condition Specimen
Designation
Air-Void Content1
(%)
Test Temp.
(°C)
Test Strain Level
(µstrain)
Initial Phase Angle (Deg.)
Initial Stiffness
(MPa)
Fatigue Life
(Nf)
Dry
E-5.2-2B4 E-5.2-4B5 E-5.2-4B8
6.5 5.8 6.2
20.4 20.1 19.9
0.000208 0.000208 0.000203
30.80 29.12 30.69
3,815 4,024 4,112
>5,000,000 >5,000,000 >5,000,000
E-5.2-3B4 E-5.2-3B8 E-5.2-4B1
6.0 5.6 5.6
19.9 19.6 20.1
0.000407 0.000407 0.000402
24.92 23.32 32.52
3,855 4,186 4,215
414,855 290,970 116,453
Wet
E-5.2-1B8 E-5.2-2B7 E-5.2-2B8
6.4 6.4 6.5
19.6 19.8 20.1
0.000207 0.000206 0.000209
26.46 27.53 31.75
2,943 2,813 3,207
1,364,367 5,368,537
>5,000,000 E-5.2-1B2 E-5.2-2B1 E-5.2-3B5
6.5 6.3 5.5
20.1 20.3 20.2
0.000416 0.000410 0.000409
34.01 36.56 33.60
2,602 1,947 2,690
113,525 56,306
101,038 1 Air-void content was measured with the CoreLok method 2 Temperature * Extrapolated results
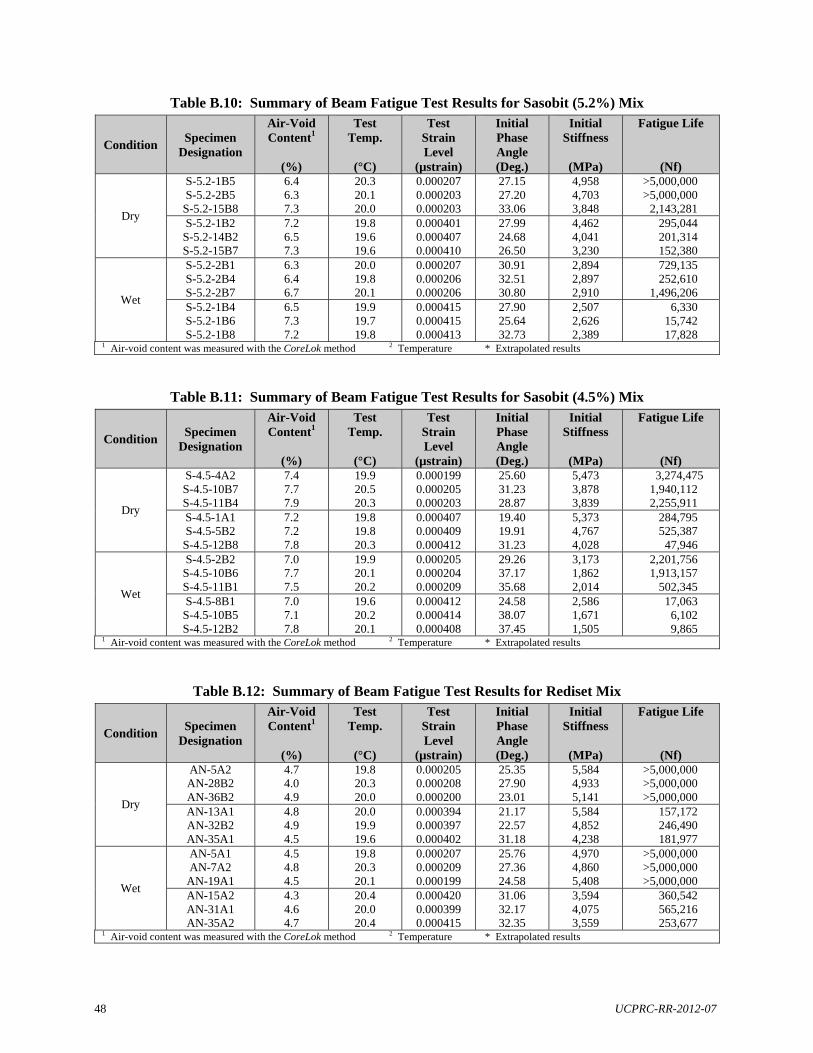
48 UCPRC-RR-2012-07
Table B.10: Summary of Beam Fatigue Test Results for Sasobit (5.2%) Mix
Condition Specimen
Designation
Air-Void Content1
(%)
Test Temp.
(°C)
Test Strain Level
(µstrain)
Initial Phase Angle (Deg.)
Initial Stiffness
(MPa)
Fatigue Life
(Nf)
Dry
S-5.2-1B5 S-5.2-2B5 S-5.2-15B8
6.4 6.3 7.3
20.3 20.1 20.0
0.000207 0.000203 0.000203
27.15 27.20 33.06
4,958 4,703 3,848
>5,000,000 >5,000,000
2,143,281 S-5.2-1B2 S-5.2-14B2 S-5.2-15B7
7.2 6.5 7.3
19.8 19.6 19.6
0.000401 0.000407 0.000410
27.99 24.68 26.50
4,462 4,041 3,230
295,044 201,314 152,380
Wet
S-5.2-2B1 S-5.2-2B4 S-5.2-2B7
6.3 6.4 6.7
20.0 19.8 20.1
0.000207 0.000206 0.000206
30.91 32.51 30.80
2,894 2,897 2,910
729,135 252,610
1,496,206 S-5.2-1B4 S-5.2-1B6 S-5.2-1B8
6.5 7.3 7.2
19.9 19.7 19.8
0.000415 0.000415 0.000413
27.90 25.64 32.73
2,507 2,626 2,389
6,330 15,742 17,828
1 Air-void content was measured with the CoreLok method 2 Temperature * Extrapolated results
Table B.11: Summary of Beam Fatigue Test Results for Sasobit (4.5%) Mix
Condition Specimen
Designation
Air-Void Content1
(%)
Test Temp.
(°C)
Test Strain Level
(µstrain)
Initial Phase Angle (Deg.)
Initial Stiffness
(MPa)
Fatigue Life
(Nf)
Dry
S-4.5-4A2 S-4.5-10B7 S-4.5-11B4
7.4 7.7 7.9
19.9 20.5 20.3
0.000199 0.000205 0.000203
25.60 31.23 28.87
5,473 3,878 3,839
3,274,475 1,940,112 2,255,911
S-4.5-1A1 S-4.5-5B2 S-4.5-12B8
7.2 7.2 7.8
19.8 19.8 20.3
0.000407 0.000409 0.000412
19.40 19.91 31.23
5,373 4,767 4,028
284,795 525,387 47,946
Wet
S-4.5-2B2 S-4.5-10B6 S-4.5-11B1
7.0 7.7 7.5
19.9 20.1 20.2
0.000205 0.000204 0.000209
29.26 37.17 35.68
3,173 1,862 2,014
2,201,756 1,913,157
502,345 S-4.5-8B1 S-4.5-10B5 S-4.5-12B2
7.0 7.1 7.8
19.6 20.2 20.1
0.000412 0.000414 0.000408
24.58 38.07 37.45
2,586 1,671 1,505
17,063 6,102 9,865
1 Air-void content was measured with the CoreLok method 2 Temperature * Extrapolated results
Table B.12: Summary of Beam Fatigue Test Results for Rediset Mix
Condition Specimen
Designation
Air-Void Content1
(%)
Test Temp.
(°C)
Test Strain Level
(µstrain)
Initial Phase Angle (Deg.)
Initial Stiffness
(MPa)
Fatigue Life
(Nf)
Dry
AN-5A2 AN-28B2 AN-36B2
4.7 4.0 4.9
19.8 20.3 20.0
0.000205 0.000208 0.000200
25.35 27.90 23.01
5,584 4,933 5,141
>5,000,000 >5,000,000 >5,000,000
AN-13A1 AN-32B2 AN-35A1
4.8 4.9 4.5
20.0 19.9 19.6
0.000394 0.000397 0.000402
21.17 22.57 31.18
5,584 4,852 4,238
157,172 246,490 181,977
Wet
AN-5A1 AN-7A2 AN-19A1
4.5 4.8 4.5
19.8 20.3 20.1
0.000207 0.000209 0.000199
25.76 27.36 24.58
4,970 4,860 5,408
>5,000,000 >5,000,000 >5,000,000
AN-15A2 AN-31A1 AN-35A2
4.3 4.6 4.7
20.4 20.0 20.4
0.000420 0.000399 0.000415
31.06 32.17 32.35
3,594 4,075 3,559
360,542 565,216 253,677
1 Air-void content was measured with the CoreLok method 2 Temperature * Extrapolated results
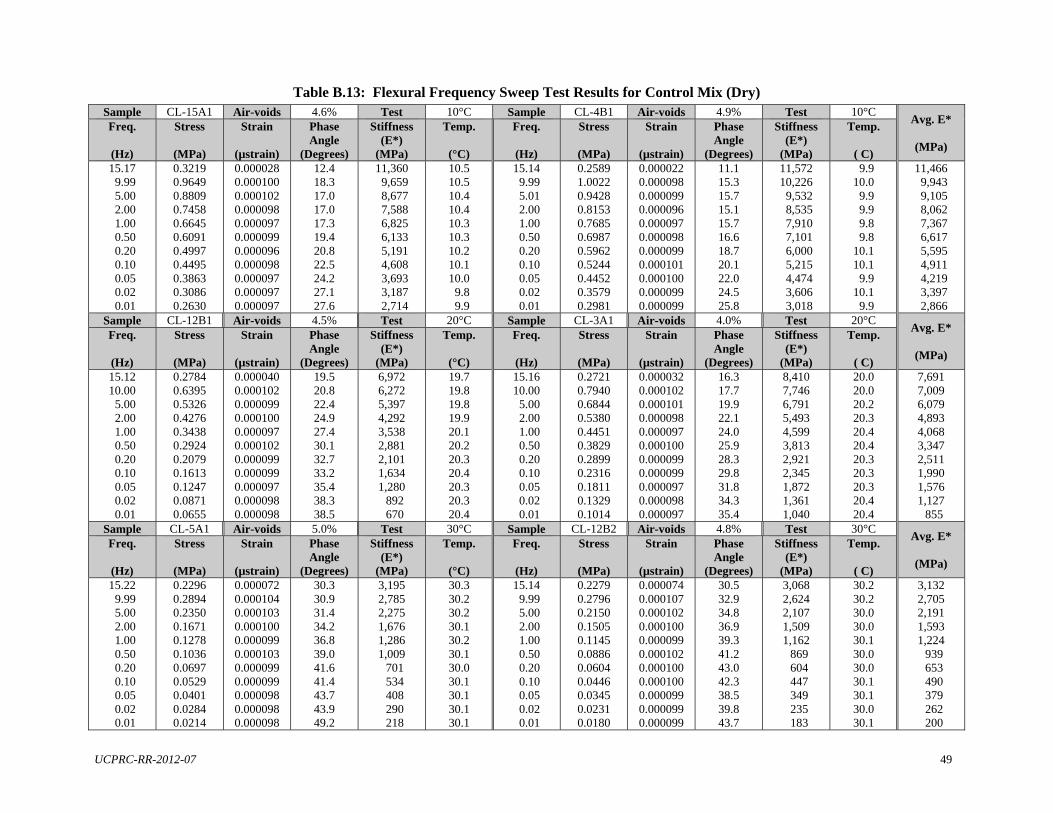
UCPRC-RR-2012-07 49
Table B.13: Flexural Frequency Sweep Test Results for Control Mix (Dry) Sample CL-15A1 Air-voids 4.6% Test 10°C Sample CL-4B1 Air-voids 4.9% Test 10°C
Avg. E*
(MPa)
Freq.
(Hz)
Stress
(MPa)
Strain
(µstrain)
Phase Angle
(Degrees)
Stiffness (E*)
(MPa)
Temp.
(°C)
Freq.
(Hz)
Stress
(MPa)
Strain
(µstrain)
Phase Angle
(Degrees)
Stiffness (E*)
(MPa)
Temp.
( C) 15.17 9.99 5.00 2.00 1.00 0.50 0.20 0.10 0.05 0.02 0.01
0.3219 0.9649 0.8809 0.7458 0.6645 0.6091 0.4997 0.4495 0.3863 0.3086 0.2630
0.000028 0.000100 0.000102 0.000098 0.000097 0.000099 0.000096 0.000098 0.000097 0.000097 0.000097
12.4 18.3 17.0 17.0 17.3 19.4 20.8 22.5 24.2 27.1 27.6
11,360 9,659 8,677 7,588 6,825 6,133 5,191 4,608 3,693 3,187 2,714
10.5 10.5 10.4 10.4 10.3 10.3 10.2 10.1 10.0 9.8 9.9
15.14 9.99 5.01 2.00 1.00 0.50 0.20 0.10 0.05 0.02 0.01
0.2589 1.0022 0.9428 0.8153 0.7685 0.6987 0.5962 0.5244 0.4452 0.3579 0.2981
0.000022 0.000098 0.000099 0.000096 0.000097 0.000098 0.000099 0.000101 0.000100 0.000099 0.000099
11.1 15.3 15.7 15.1 15.7 16.6 18.7 20.1 22.0 24.5 25.8
11,572 10,226 9,532 8,535 7,910 7,101 6,000 5,215 4,474 3,606 3,018
9.9 10.0 9.9 9.9 9.8 9.8 10.1 10.1 9.9 10.1 9.9
11,466 9,943 9,105 8,062 7,367 6,617 5,595 4,911 4,219 3,397 2,866
Sample CL-12B1 Air-voids 4.5% Test 20°C Sample CL-3A1 Air-voids 4.0% Test 20°C Avg. E*
(MPa)
Freq.
(Hz)
Stress
(MPa)
Strain
(µstrain)
Phase Angle
(Degrees)
Stiffness (E*)
(MPa)
Temp.
(°C)
Freq.
(Hz)
Stress
(MPa)
Strain
(µstrain)
Phase Angle
(Degrees)
Stiffness (E*)
(MPa)
Temp.
( C) 15.12 10.00 5.00 2.00 1.00 0.50 0.20 0.10 0.05 0.02 0.01
0.2784 0.6395 0.5326 0.4276 0.3438 0.2924 0.2079 0.1613 0.1247 0.0871 0.0655
0.000040 0.000102 0.000099 0.000100 0.000097 0.000102 0.000099 0.000099 0.000097 0.000098 0.000098
19.5 20.8 22.4 24.9 27.4 30.1 32.7 33.2 35.4 38.3 38.5
6,972 6,272 5,397 4,292 3,538 2,881 2,101 1,634 1,280 892 670
19.7 19.8 19.8 19.9 20.1 20.2 20.3 20.4 20.3 20.3 20.4
15.16 10.00 5.00 2.00 1.00 0.50 0.20 0.10 0.05 0.02 0.01
0.2721 0.7940 0.6844 0.5380 0.4451 0.3829 0.2899 0.2316 0.1811 0.1329 0.1014
0.000032 0.000102 0.000101 0.000098 0.000097 0.000100 0.000099 0.000099 0.000097 0.000098 0.000097
16.3 17.7 19.9 22.1 24.0 25.9 28.3 29.8 31.8 34.3 35.4
8,410 7,746 6,791 5,493 4,599 3,813 2,921 2,345 1,872 1,361 1,040
20.0 20.0 20.2 20.3 20.4 20.4 20.3 20.3 20.3 20.4 20.4
7,691 7,009 6,079 4,893 4,068 3,347 2,511 1,990 1,576 1,127 855
Sample CL-5A1 Air-voids 5.0% Test 30°C Sample CL-12B2 Air-voids 4.8% Test 30°C Avg. E*
(MPa)
Freq.
(Hz)
Stress
(MPa)
Strain
(µstrain)
Phase Angle
(Degrees)
Stiffness (E*)
(MPa)
Temp.
(°C)
Freq.
(Hz)
Stress
(MPa)
Strain
(µstrain)
Phase Angle
(Degrees)
Stiffness (E*)
(MPa)
Temp.
( C) 15.22 9.99 5.00 2.00 1.00 0.50 0.20 0.10 0.05 0.02 0.01
0.2296 0.2894 0.2350 0.1671 0.1278 0.1036 0.0697 0.0529 0.0401 0.0284 0.0214
0.000072 0.000104 0.000103 0.000100 0.000099 0.000103 0.000099 0.000099 0.000098 0.000098 0.000098
30.3 30.9 31.4 34.2 36.8 39.0 41.6 41.4 43.7 43.9 49.2
3,195 2,785 2,275 1,676 1,286 1,009 701 534 408 290 218
30.3 30.2 30.2 30.1 30.2 30.1 30.0 30.1 30.1 30.1 30.1
15.14 9.99 5.00 2.00 1.00 0.50 0.20 0.10 0.05 0.02 0.01
0.2279 0.2796 0.2150 0.1505 0.1145 0.0886 0.0604 0.0446 0.0345 0.0231 0.0180
0.000074 0.000107 0.000102 0.000100 0.000099 0.000102 0.000100 0.000100 0.000099 0.000099 0.000099
30.5 32.9 34.8 36.9 39.3 41.2 43.0 42.3 38.5 39.8 43.7
3,068 2,624 2,107 1,509 1,162 869 604 447 349 235 183
30.2 30.2 30.0 30.0 30.1 30.0 30.0 30.1 30.1 30.0 30.1
3,132 2,705 2,191 1,593 1,224 939 653 490 379 262 200
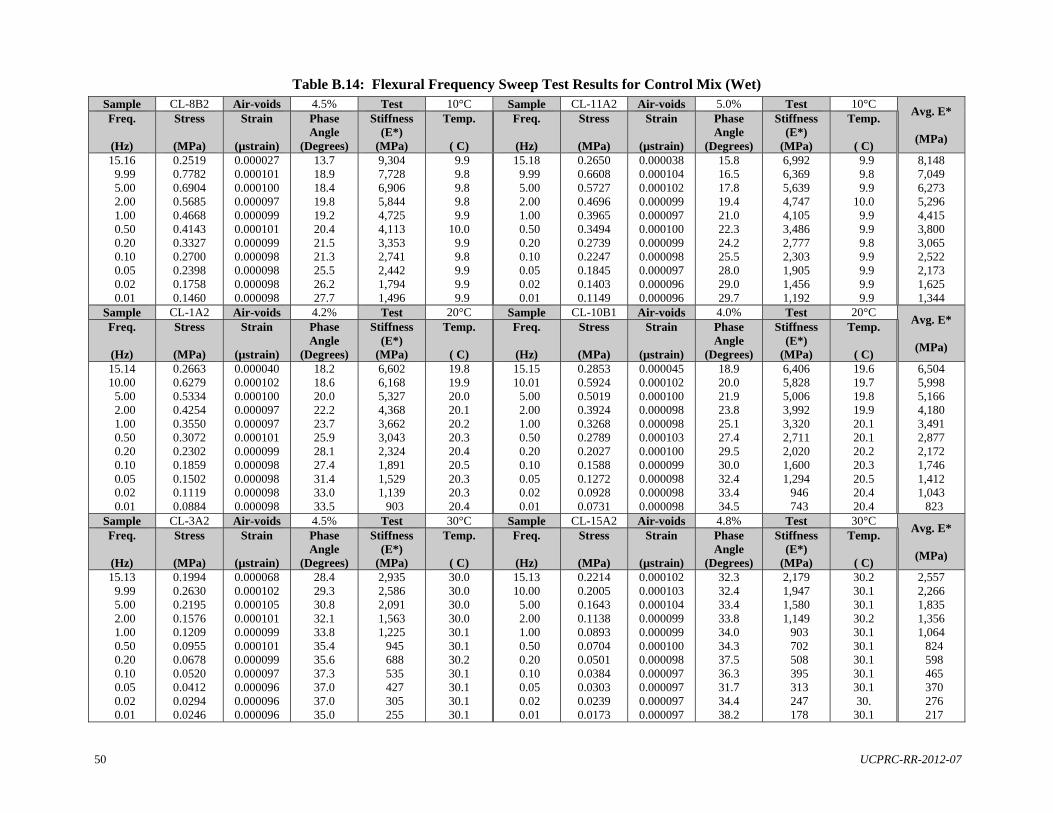
50 UCPRC-RR-2012-07
Table B.14: Flexural Frequency Sweep Test Results for Control Mix (Wet) Sample CL-8B2 Air-voids 4.5% Test 10°C Sample CL-11A2 Air-voids 5.0% Test 10°C
Avg. E*
(MPa)
Freq.
(Hz)
Stress
(MPa)
Strain
(µstrain)
Phase Angle
(Degrees)
Stiffness (E*)
(MPa)
Temp.
( C)
Freq.
(Hz)
Stress
(MPa)
Strain
(µstrain)
Phase Angle
(Degrees)
Stiffness (E*)
(MPa)
Temp.
( C) 15.16 9.99 5.00 2.00 1.00 0.50 0.20 0.10 0.05 0.02 0.01
0.2519 0.7782 0.6904 0.5685 0.4668 0.4143 0.3327 0.2700 0.2398 0.1758 0.1460
0.000027 0.000101 0.000100 0.000097 0.000099 0.000101 0.000099 0.000098 0.000098 0.000098 0.000098
13.7 18.9 18.4 19.8 19.2 20.4 21.5 21.3 25.5 26.2 27.7
9,304 7,728 6,906 5,844 4,725 4,113 3,353 2,741 2,442 1,794 1,496
9.9 9.8 9.8 9.8 9.9 10.0 9.9 9.8 9.9 9.9 9.9
15.18 9.99 5.00 2.00 1.00 0.50 0.20 0.10 0.05 0.02 0.01
0.2650 0.6608 0.5727 0.4696 0.3965 0.3494 0.2739 0.2247 0.1845 0.1403 0.1149
0.000038 0.000104 0.000102 0.000099 0.000097 0.000100 0.000099 0.000098 0.000097 0.000096 0.000096
15.8 16.5 17.8 19.4 21.0 22.3 24.2 25.5 28.0 29.0 29.7
6,992 6,369 5,639 4,747 4,105 3,486 2,777 2,303 1,905 1,456 1,192
9.9 9.8 9.9 10.0 9.9 9.9 9.8 9.9 9.9 9.9 9.9
8,148 7,049 6,273 5,296 4,415 3,800 3,065 2,522 2,173 1,625 1,344
Sample CL-1A2 Air-voids 4.2% Test 20°C Sample CL-10B1 Air-voids 4.0% Test 20°C Avg. E*
(MPa)
Freq.
(Hz)
Stress
(MPa)
Strain
(µstrain)
Phase Angle
(Degrees)
Stiffness (E*)
(MPa)
Temp.
( C)
Freq.
(Hz)
Stress
(MPa)
Strain
(µstrain)
Phase Angle
(Degrees)
Stiffness (E*)
(MPa)
Temp.
( C) 15.14 10.00 5.00 2.00 1.00 0.50 0.20 0.10 0.05 0.02 0.01
0.2663 0.6279 0.5334 0.4254 0.3550 0.3072 0.2302 0.1859 0.1502 0.1119 0.0884
0.000040 0.000102 0.000100 0.000097 0.000097 0.000101 0.000099 0.000098 0.000098 0.000098 0.000098
18.2 18.6 20.0 22.2 23.7 25.9 28.1 27.4 31.4 33.0 33.5
6,602 6,168 5,327 4,368 3,662 3,043 2,324 1,891 1,529 1,139 903
19.8 19.9 20.0 20.1 20.2 20.3 20.4 20.5 20.3 20.3 20.4
15.15 10.01 5.00 2.00 1.00 0.50 0.20 0.10 0.05 0.02 0.01
0.2853 0.5924 0.5019 0.3924 0.3268 0.2789 0.2027 0.1588 0.1272 0.0928 0.0731
0.000045 0.000102 0.000100 0.000098 0.000098 0.000103 0.000100 0.000099 0.000098 0.000098 0.000098
18.9 20.0 21.9 23.8 25.1 27.4 29.5 30.0 32.4 33.4 34.5
6,406 5,828 5,006 3,992 3,320 2,711 2,020 1,600 1,294 946 743
19.6 19.7 19.8 19.9 20.1 20.1 20.2 20.3 20.5 20.4 20.4
6,504 5,998 5,166 4,180 3,491 2,877 2,172 1,746 1,412 1,043 823
Sample CL-3A2 Air-voids 4.5% Test 30°C Sample CL-15A2 Air-voids 4.8% Test 30°C Avg. E*
(MPa)
Freq.
(Hz)
Stress
(MPa)
Strain
(µstrain)
Phase Angle
(Degrees)
Stiffness (E*)
(MPa)
Temp.
( C)
Freq.
(Hz)
Stress
(MPa)
Strain
(µstrain)
Phase Angle
(Degrees)
Stiffness (E*)
(MPa)
Temp.
( C) 15.13 9.99 5.00 2.00 1.00 0.50 0.20 0.10 0.05 0.02 0.01
0.1994 0.2630 0.2195 0.1576 0.1209 0.0955 0.0678 0.0520 0.0412 0.0294 0.0246
0.000068 0.000102 0.000105 0.000101 0.000099 0.000101 0.000099 0.000097 0.000096 0.000096 0.000096
28.4 29.3 30.8 32.1 33.8 35.4 35.6 37.3 37.0 37.0 35.0
2,935 2,586 2,091 1,563 1,225 945 688 535 427 305 255
30.0 30.0 30.0 30.0 30.1 30.1 30.2 30.1 30.1 30.1 30.1
15.13 10.00 5.00 2.00 1.00 0.50 0.20 0.10 0.05 0.02 0.01
0.2214 0.2005 0.1643 0.1138 0.0893 0.0704 0.0501 0.0384 0.0303 0.0239 0.0173
0.000102 0.000103 0.000104 0.000099 0.000099 0.000100 0.000098 0.000097 0.000097 0.000097 0.000097
32.3 32.4 33.4 33.8 34.0 34.3 37.5 36.3 31.7 34.4 38.2
2,179 1,947 1,580 1,149 903 702 508 395 313 247 178
30.2 30.1 30.1 30.2 30.1 30.1 30.1 30.1 30.1 30.
30.1
2,557 2,266 1,835 1,356 1,064 824 598 465 370 276 217
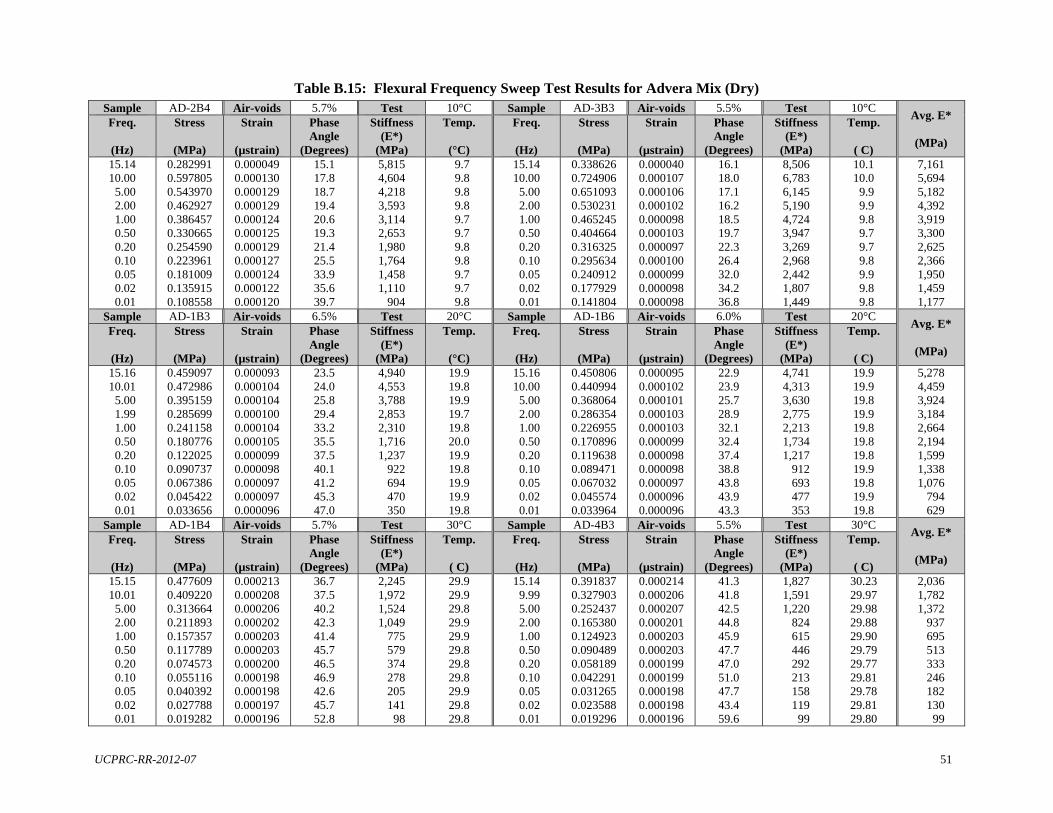
UCPRC-RR-2012-07 51
Table B.15: Flexural Frequency Sweep Test Results for Advera Mix (Dry) Sample AD-2B4 Air-voids 5.7% Test 10°C Sample AD-3B3 Air-voids 5.5% Test 10°C
Avg. E*
(MPa)
Freq.
(Hz)
Stress
(MPa)
Strain
(µstrain)
Phase Angle
(Degrees)
Stiffness (E*)
(MPa)
Temp.
(°C)
Freq.
(Hz)
Stress
(MPa)
Strain
(µstrain)
Phase Angle
(Degrees)
Stiffness (E*)
(MPa)
Temp.
( C) 15.14 10.00 5.00 2.00 1.00 0.50 0.20 0.10 0.05 0.02 0.01
0.282991 0.597805 0.543970 0.462927 0.386457 0.330665 0.254590 0.223961 0.181009 0.135915 0.108558
0.000049 0.000130 0.000129 0.000129 0.000124 0.000125 0.000129 0.000127 0.000124 0.000122 0.000120
15.1 17.8 18.7 19.4 20.6 19.3 21.4 25.5 33.9 35.6 39.7
5,815 4,604 4,218 3,593 3,114 2,653 1,980 1,764 1,458 1,110 904
9.7 9.8 9.8 9.8 9.7 9.7 9.8 9.8 9.7 9.7 9.8
15.14 10.00 5.00 2.00 1.00 0.50 0.20 0.10 0.05 0.02 0.01
0.338626 0.724906 0.651093 0.530231 0.465245 0.404664 0.316325 0.295634 0.240912 0.177929 0.141804
0.000040 0.000107 0.000106 0.000102 0.000098 0.000103 0.000097 0.000100 0.000099 0.000098 0.000098
16.1 18.0 17.1 16.2 18.5 19.7 22.3 26.4 32.0 34.2 36.8
8,506 6,783 6,145 5,190 4,724 3,947 3,269 2,968 2,442 1,807 1,449
10.1 10.0 9.9 9.9 9.8 9.7 9.7 9.8 9.9 9.8 9.8
7,161 5,694 5,182 4,392 3,919 3,300 2,625 2,366 1,950 1,459 1,177
Sample AD-1B3 Air-voids 6.5% Test 20°C Sample AD-1B6 Air-voids 6.0% Test 20°C Avg. E*
(MPa)
Freq.
(Hz)
Stress
(MPa)
Strain
(µstrain)
Phase Angle
(Degrees)
Stiffness (E*)
(MPa)
Temp.
(°C)
Freq.
(Hz)
Stress
(MPa)
Strain
(µstrain)
Phase Angle
(Degrees)
Stiffness (E*)
(MPa)
Temp.
( C) 15.16 10.01 5.00 1.99 1.00 0.50 0.20 0.10 0.05 0.02 0.01
0.459097 0.472986 0.395159 0.285699 0.241158 0.180776 0.122025 0.090737 0.067386 0.045422 0.033656
0.000093 0.000104 0.000104 0.000100 0.000104 0.000105 0.000099 0.000098 0.000097 0.000097 0.000096
23.5 24.0 25.8 29.4 33.2 35.5 37.5 40.1 41.2 45.3 47.0
4,940 4,553 3,788 2,853 2,310 1,716 1,237 922 694 470 350
19.9 19.8 19.9 19.7 19.8 20.0 19.9 19.8 19.9 19.9 19.8
15.16 10.00 5.00 2.00 1.00 0.50 0.20 0.10 0.05 0.02 0.01
0.450806 0.440994 0.368064 0.286354 0.226955 0.170896 0.119638 0.089471 0.067032 0.045574 0.033964
0.000095 0.000102 0.000101 0.000103 0.000103 0.000099 0.000098 0.000098 0.000097 0.000096 0.000096
22.9 23.9 25.7 28.9 32.1 32.4 37.4 38.8 43.8 43.9 43.3
4,741 4,313 3,630 2,775 2,213 1,734 1,217 912 693 477 353
19.9 19.9 19.8 19.9 19.8 19.8 19.8 19.9 19.8 19.9 19.8
5,278 4,459 3,924 3,184 2,664 2,194 1,599 1,338 1,076 794 629
Sample AD-1B4 Air-voids 5.7% Test 30°C Sample AD-4B3 Air-voids 5.5% Test 30°C Avg. E*
(MPa)
Freq.
(Hz)
Stress
(MPa)
Strain
(µstrain)
Phase Angle
(Degrees)
Stiffness (E*)
(MPa)
Temp.
( C)
Freq.
(Hz)
Stress
(MPa)
Strain
(µstrain)
Phase Angle
(Degrees)
Stiffness (E*)
(MPa)
Temp.
( C) 15.15 10.01 5.00 2.00 1.00 0.50 0.20 0.10 0.05 0.02 0.01
0.477609 0.409220 0.313664 0.211893 0.157357 0.117789 0.074573 0.055116 0.040392 0.027788 0.019282
0.000213 0.000208 0.000206 0.000202 0.000203 0.000203 0.000200 0.000198 0.000198 0.000197 0.000196
36.7 37.5 40.2 42.3 41.4 45.7 46.5 46.9 42.6 45.7 52.8
2,245 1,972 1,524 1,049 775 579 374 278 205 141 98
29.9 29.9 29.8 29.9 29.9 29.8 29.8 29.8 29.9 29.8 29.8
15.14 9.99 5.00 2.00 1.00 0.50 0.20 0.10 0.05 0.02 0.01
0.391837 0.327903 0.252437 0.165380 0.124923 0.090489 0.058189 0.042291 0.031265 0.023588 0.019296
0.000214 0.000206 0.000207 0.000201 0.000203 0.000203 0.000199 0.000199 0.000198 0.000198 0.000196
41.3 41.8 42.5 44.8 45.9 47.7 47.0 51.0 47.7 43.4 59.6
1,827 1,591 1,220 824 615 446 292 213 158 119 99
30.23 29.97 29.98 29.88 29.90 29.79 29.77 29.81 29.78 29.81 29.80
2,036 1,782 1,372 937 695 513 333 246 182 130 99

52 UCPRC-RR-2012-07
Table B.16: Flexural Frequency Sweep Test Results for Advera Mix (Wet) Sample AD-2B5 Air-voids 5.7% Test 10°C Sample AD-2B7 Air-voids 5.5% Test 10°C
Avg. E*
(MPa)
Freq.
(Hz)
Stress
(MPa)
Strain
(µstrain)
Phase Angle
(Degrees)
Stiffness (E*)
(MPa)
Temp.
(°C)
Freq.
(Hz)
Stress
(MPa)
Strain
(µstrain)
Phase Angle
(Degrees)
Stiffness (E*)
(MPa)
Temp.
( C) 15.14 10.00 5.00 2.00 1.00 0.50 0.20 0.10 0.05 0.02 0.01
0.396131 0.350509 0.307481 0.242507 0.190754 0.151878 0.109273 0.086468 0.069159 0.049178 0.042349
0.000105 0.000102 0.000105 0.000105 0.000101 0.000101 0.000097 0.000098 0.000098 0.000097 0.000097
22.8 23.3 24.0 26.6 28.0 29.4 32.1 31.9 35.1 37.3 42.3
3,769 3,447 2,926 2,301 1,884 1,509 1,122 879 709 509 437
10.4 10.3 10.2 10.2 10.1 10.0 10.0 9.9 9.7 9.7 9.7
15.17 10.01 5.00 2.00 1.00 0.50 0.20 0.10 0.05 0.02 0.01
0.510857 0.481832 0.411258 0.320756 0.263949 0.212608 0.154367 0.122529 0.097150 0.072164 0.058115
0.000101 0.000103 0.000102 0.000101 0.000099 0.000102 0.000097 0.000098 0.000096 0.000096 0.000097
20.2 21.4 21.9 24.7 26.3 28.3 29.5 31.1 33.3 36.9 35.7
5,049 4,675 4,015 3,179 2,664 2,081 1,590 1,246 1,007 749 602
9.8 9.8 9.9 9.8 9.7 9.8 9.8 9.7 9.8 9.7 9.7
4,409 4,061 3,471 2,740 2,274 1,795 1,356 1,063 858 629 520
Sample AD-3B1 Air-voids 5.5% Test 20°C Sample AD-3B6 Air-voids 5.6% Test 20°C Avg. E*
(MPa)
Freq.
(Hz)
Stress
(MPa)
Strain
(µstrain)
Phase Angle
(Degrees)
Stiffness (E*)
(MPa)
Temp.
(°C)
Freq.
(Hz)
Stress
(MPa)
Strain
(µstrain)
Phase Angle
(Degrees)
Stiffness (E*)
(MPa)
Temp.
( C) 15.17 9.99 5.00 2.00 1.00 0.50 0.20 0.10 0.05 0.02 0.01
0.251868 0.224852 0.182494 0.129950 0.101790 0.076490 0.052472 0.040010 0.031369 0.022236 0.015937
0.000107 0.000105 0.000104 0.000102 0.000100 0.000098 0.000096 0.000096 0.000095 0.000095 0.000095
30.7 31.0 31.4 34.2 35.0 37.0 36.0 36.3 41.4 38.6 38.3
2,361 2,146 1,750 1,277 1,017 779 547 415 329 234 168
19.8 20.0 19.9 19.8 19.9 19.9 19.9 19.9 19.9 19.9 19.9
15.15 9.99 5.00 2.00 1.00 0.50 0.20 0.10 0.05 0.02 0.01
0.265288 0.236880 0.192481 0.137096 0.103225 0.075932 0.050988 0.038456 0.028136 0.021112 0.015994
0.000107 0.000106 0.000106 0.000104 0.000101 0.000097 0.000094 0.000095 0.000094 0.000094 0.000093
31.2 31.4 32.5 34.8 36.6 36.6 39.1 39.4 43.4 40.5 46.3
2,481 2,240 1,818 1,318 1,026 780 542 406 299 225 173
19.8 20.0 19.9 19.8 19.8 20.0 19.8 19.8 19.8 19.9 19.9
2,421 2,193 1,784 1,298 1,022 780 545 411 314 230 171
Sample AD-2B2 Air-voids 5.7% Test 30°C Sample AD-4B1 Air-voids 5.9% Test 30°C Avg. E*
(MPa)
Freq.
(Hz)
Stress
(MPa)
Strain
(µstrain)
Phase Angle
(Degrees)
Stiffness (E*)
(MPa)
Temp.
( C)
Freq.
(Hz)
Stress
(MPa)
Strain
(µstrain)
Phase Angle
(Degrees)
Stiffness (E*)
(MPa)
Temp.
( C) 15.15 10.00 5.00 2.00 1.00 0.50 0.20 0.10 0.05 0.02 0.01
0.308944 0.269176 0.208568 0.142337 0.106327 0.077238 0.052580 0.039777 0.029060 0.021172 0.015281
0.000210 0.000208 0.000207 0.000202 0.000202 0.000201 0.000199 0.000197 0.000196 0.000196 0.000196
38.2 37.7 38.2 39.5 40.5 39.2 39.4 40.5 36.1 39.0 42.2
1,474 1,296 1,007 703 526 385 264 201 148 108 78
30.0 29.9 29.9 30.0 29.9 29.8 29.8 29.8 29.8 29.8 29.8
15.16 10.00 5.00 2.00 1.00 0.50 0.20 0.10 0.05 0.02 0.01
0.198525 0.177256 0.139331 0.095580 0.071964 0.055864 0.040678 0.031178 0.026121 0.021505 0.018247
0.000211 0.000210 0.000210 0.000202 0.000198 0.000200 0.000196 0.000196 0.000196 0.000196 0.000196
42.1 40.2 39.8 39.9 39.8 36.5 37.2 37.5 32.8 25.2 35.0
939 842 663 473 363 279 207 159 133 110 93
28.9 30.0 30.0 29.9 29.8 30.0 30.0 29.9 29.9 29.9 29.9
1,207 1,069 835 588 445 332 236 180 141 109 86
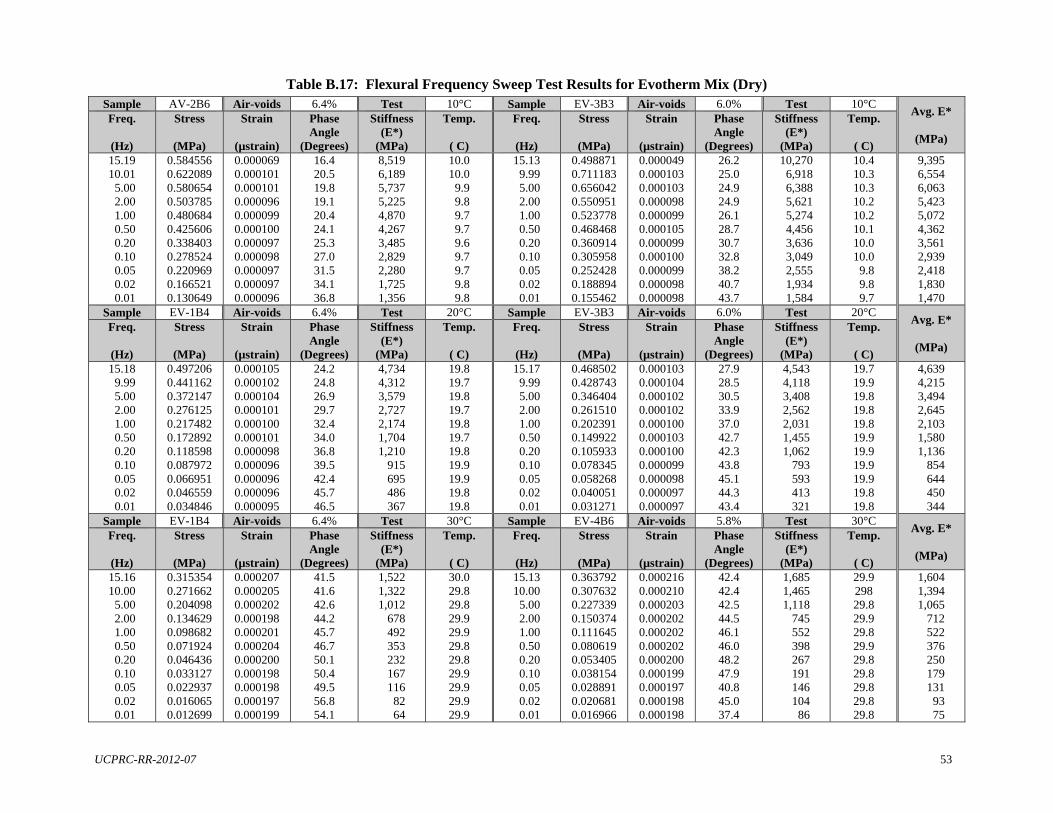
UCPRC-RR-2012-07 53
Table B.17: Flexural Frequency Sweep Test Results for Evotherm Mix (Dry) Sample AV-2B6 Air-voids 6.4% Test 10°C Sample EV-3B3 Air-voids 6.0% Test 10°C
Avg. E*
(MPa)
Freq.
(Hz)
Stress
(MPa)
Strain
(µstrain)
Phase Angle
(Degrees)
Stiffness (E*)
(MPa)
Temp.
( C)
Freq.
(Hz)
Stress
(MPa)
Strain
(µstrain)
Phase Angle
(Degrees)
Stiffness (E*)
(MPa)
Temp.
( C) 15.19 10.01 5.00 2.00 1.00 0.50 0.20 0.10 0.05 0.02 0.01
0.584556 0.622089 0.580654 0.503785 0.480684 0.425606 0.338403 0.278524 0.220969 0.166521 0.130649
0.000069 0.000101 0.000101 0.000096 0.000099 0.000100 0.000097 0.000098 0.000097 0.000097 0.000096
16.4 20.5 19.8 19.1 20.4 24.1 25.3 27.0 31.5 34.1 36.8
8,519 6,189 5,737 5,225 4,870 4,267 3,485 2,829 2,280 1,725 1,356
10.0 10.0 9.9 9.8 9.7 9.7 9.6 9.7 9.7 9.8 9.8
15.13 9.99 5.00 2.00 1.00 0.50 0.20 0.10 0.05 0.02 0.01
0.498871 0.711183 0.656042 0.550951 0.523778 0.468468 0.360914 0.305958 0.252428 0.188894 0.155462
0.000049 0.000103 0.000103 0.000098 0.000099 0.000105 0.000099 0.000100 0.000099 0.000098 0.000098
26.2 25.0 24.9 24.9 26.1 28.7 30.7 32.8 38.2 40.7 43.7
10,270 6,918 6,388 5,621 5,274 4,456 3,636 3,049 2,555 1,934 1,584
10.4 10.3 10.3 10.2 10.2 10.1 10.0 10.0 9.8 9.8 9.7
9,395 6,554 6,063 5,423 5,072 4,362 3,561 2,939 2,418 1,830 1,470
Sample EV-1B4 Air-voids 6.4% Test 20°C Sample EV-3B3 Air-voids 6.0% Test 20°C Avg. E*
(MPa)
Freq.
(Hz)
Stress
(MPa)
Strain
(µstrain)
Phase Angle
(Degrees)
Stiffness (E*)
(MPa)
Temp.
( C)
Freq.
(Hz)
Stress
(MPa)
Strain
(µstrain)
Phase Angle
(Degrees)
Stiffness (E*)
(MPa)
Temp.
( C) 15.18 9.99 5.00 2.00 1.00 0.50 0.20 0.10 0.05 0.02 0.01
0.497206 0.441162 0.372147 0.276125 0.217482 0.172892 0.118598 0.087972 0.066951 0.046559 0.034846
0.000105 0.000102 0.000104 0.000101 0.000100 0.000101 0.000098 0.000096 0.000096 0.000096 0.000095
24.2 24.8 26.9 29.7 32.4 34.0 36.8 39.5 42.4 45.7 46.5
4,734 4,312 3,579 2,727 2,174 1,704 1,210 915 695 486 367
19.8 19.7 19.8 19.7 19.8 19.7 19.8 19.9 19.9 19.8 19.8
15.17 9.99 5.00 2.00 1.00 0.50 0.20 0.10 0.05 0.02 0.01
0.468502 0.428743 0.346404 0.261510 0.202391 0.149922 0.105933 0.078345 0.058268 0.040051 0.031271
0.000103 0.000104 0.000102 0.000102 0.000100 0.000103 0.000100 0.000099 0.000098 0.000097 0.000097
27.9 28.5 30.5 33.9 37.0 42.7 42.3 43.8 45.1 44.3 43.4
4,543 4,118 3,408 2,562 2,031 1,455 1,062 793 593 413 321
19.7 19.9 19.8 19.8 19.8 19.9 19.9 19.9 19.9 19.8 19.8
4,639 4,215 3,494 2,645 2,103 1,580 1,136 854 644 450 344
Sample EV-1B4 Air-voids 6.4% Test 30°C Sample EV-4B6 Air-voids 5.8% Test 30°C Avg. E*
(MPa)
Freq.
(Hz)
Stress
(MPa)
Strain
(µstrain)
Phase Angle
(Degrees)
Stiffness (E*)
(MPa)
Temp.
( C)
Freq.
(Hz)
Stress
(MPa)
Strain
(µstrain)
Phase Angle
(Degrees)
Stiffness (E*)
(MPa)
Temp.
( C) 15.16 10.00 5.00 2.00 1.00 0.50 0.20 0.10 0.05 0.02 0.01
0.315354 0.271662 0.204098 0.134629 0.098682 0.071924 0.046436 0.033127 0.022937 0.016065 0.012699
0.000207 0.000205 0.000202 0.000198 0.000201 0.000204 0.000200 0.000198 0.000198 0.000197 0.000199
41.5 41.6 42.6 44.2 45.7 46.7 50.1 50.4 49.5 56.8 54.1
1,522 1,322 1,012 678 492 353 232 167 116 82 64
30.0 29.8 29.8 29.9 29.9 29.8 29.8 29.9 29.9 29.9 29.9
15.13 10.00 5.00 2.00 1.00 0.50 0.20 0.10 0.05 0.02 0.01
0.363792 0.307632 0.227339 0.150374 0.111645 0.080619 0.053405 0.038154 0.028891 0.020681 0.016966
0.000216 0.000210 0.000203 0.000202 0.000202 0.000202 0.000200 0.000199 0.000197 0.000198 0.000198
42.4 42.4 42.5 44.5 46.1 46.0 48.2 47.9 40.8 45.0 37.4
1,685 1,465 1,118 745 552 398 267 191 146 104 86
29.9 298 29.8 29.9 29.8 29.9 29.8 29.8 29.8 29.8 29.8
1,604 1,394 1,065 712 522 376 250 179 131 93 75
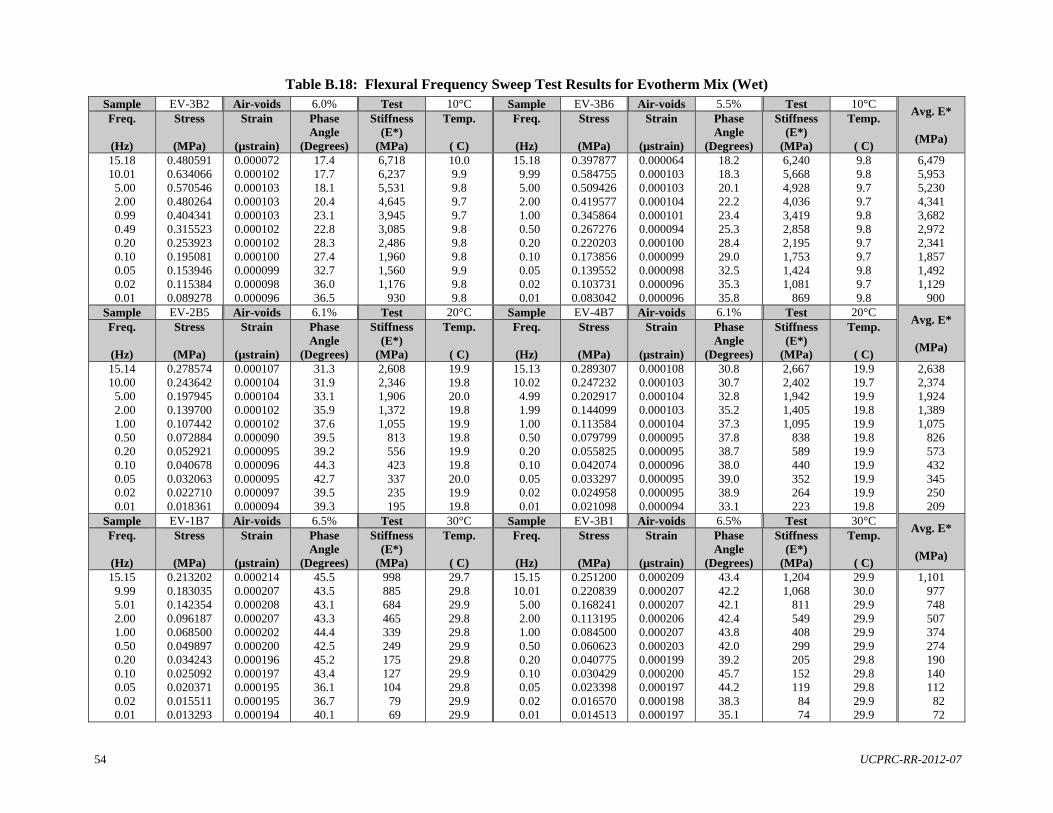
54 UCPRC-RR-2012-07
Table B.18: Flexural Frequency Sweep Test Results for Evotherm Mix (Wet) Sample EV-3B2 Air-voids 6.0% Test 10°C Sample EV-3B6 Air-voids 5.5% Test 10°C
Avg. E*
(MPa)
Freq.
(Hz)
Stress
(MPa)
Strain
(µstrain)
Phase Angle
(Degrees)
Stiffness (E*)
(MPa)
Temp.
( C)
Freq.
(Hz)
Stress
(MPa)
Strain
(µstrain)
Phase Angle
(Degrees)
Stiffness (E*)
(MPa)
Temp.
( C) 15.18 10.01 5.00 2.00 0.99 0.49 0.20 0.10 0.05 0.02 0.01
0.480591 0.634066 0.570546 0.480264 0.404341 0.315523 0.253923 0.195081 0.153946 0.115384 0.089278
0.000072 0.000102 0.000103 0.000103 0.000103 0.000102 0.000102 0.000100 0.000099 0.000098 0.000096
17.4 17.7 18.1 20.4 23.1 22.8 28.3 27.4 32.7 36.0 36.5
6,718 6,237 5,531 4,645 3,945 3,085 2,486 1,960 1,560 1,176 930
10.0 9.9 9.8 9.7 9.7 9.8 9.8 9.8 9.9 9.8 9.8
15.18 9.99 5.00 2.00 1.00 0.50 0.20 0.10 0.05 0.02 0.01
0.397877 0.584755 0.509426 0.419577 0.345864 0.267276 0.220203 0.173856 0.139552 0.103731 0.083042
0.000064 0.000103 0.000103 0.000104 0.000101 0.000094 0.000100 0.000099 0.000098 0.000096 0.000096
18.2 18.3 20.1 22.2 23.4 25.3 28.4 29.0 32.5 35.3 35.8
6,240 5,668 4,928 4,036 3,419 2,858 2,195 1,753 1,424 1,081 869
9.8 9.8 9.7 9.7 9.8 9.8 9.7 9.7 9.8 9.7 9.8
6,479 5,953 5,230 4,341 3,682 2,972 2,341 1,857 1,492 1,129 900
Sample EV-2B5 Air-voids 6.1% Test 20°C Sample EV-4B7 Air-voids 6.1% Test 20°C Avg. E*
(MPa)
Freq.
(Hz)
Stress
(MPa)
Strain
(µstrain)
Phase Angle
(Degrees)
Stiffness (E*)
(MPa)
Temp.
( C)
Freq.
(Hz)
Stress
(MPa)
Strain
(µstrain)
Phase Angle
(Degrees)
Stiffness (E*)
(MPa)
Temp.
( C) 15.14 10.00 5.00 2.00 1.00 0.50 0.20 0.10 0.05 0.02 0.01
0.278574 0.243642 0.197945 0.139700 0.107442 0.072884 0.052921 0.040678 0.032063 0.022710 0.018361
0.000107 0.000104 0.000104 0.000102 0.000102 0.000090 0.000095 0.000096 0.000095 0.000097 0.000094
31.3 31.9 33.1 35.9 37.6 39.5 39.2 44.3 42.7 39.5 39.3
2,608 2,346 1,906 1,372 1,055 813 556 423 337 235 195
19.9 19.8 20.0 19.8 19.9 19.8 19.9 19.8 20.0 19.9 19.8
15.13 10.02 4.99 1.99 1.00 0.50 0.20 0.10 0.05 0.02 0.01
0.289307 0.247232 0.202917 0.144099 0.113584 0.079799 0.055825 0.042074 0.033297 0.024958 0.021098
0.000108 0.000103 0.000104 0.000103 0.000104 0.000095 0.000095 0.000096 0.000095 0.000095 0.000094
30.8 30.7 32.8 35.2 37.3 37.8 38.7 38.0 39.0 38.9 33.1
2,667 2,402 1,942 1,405 1,095 838 589 440 352 264 223
19.9 19.7 19.9 19.8 19.9 19.8 19.9 19.9 19.9 19.9 19.8
2,638 2,374 1,924 1,389 1,075 826 573 432 345 250 209
Sample EV-1B7 Air-voids 6.5% Test 30°C Sample EV-3B1 Air-voids 6.5% Test 30°C Avg. E*
(MPa)
Freq.
(Hz)
Stress
(MPa)
Strain
(µstrain)
Phase Angle
(Degrees)
Stiffness (E*)
(MPa)
Temp.
( C)
Freq.
(Hz)
Stress
(MPa)
Strain
(µstrain)
Phase Angle
(Degrees)
Stiffness (E*)
(MPa)
Temp.
( C) 15.15 9.99 5.01 2.00 1.00 0.50 0.20 0.10 0.05 0.02 0.01
0.213202 0.183035 0.142354 0.096187 0.068500 0.049897 0.034243 0.025092 0.020371 0.015511 0.013293
0.000214 0.000207 0.000208 0.000207 0.000202 0.000200 0.000196 0.000197 0.000195 0.000195 0.000194
45.5 43.5 43.1 43.3 44.4 42.5 45.2 43.4 36.1 36.7 40.1
998 885 684 465 339 249 175 127 104 79 69
29.7 29.8 29.9 29.8 29.8 29.9 29.8 29.9 29.8 29.9 29.9
15.15 10.01 5.00 2.00 1.00 0.50 0.20 0.10 0.05 0.02 0.01
0.251200 0.220839 0.168241 0.113195 0.084500 0.060623 0.040775 0.030429 0.023398 0.016570 0.014513
0.000209 0.000207 0.000207 0.000206 0.000207 0.000203 0.000199 0.000200 0.000197 0.000198 0.000197
43.4 42.2 42.1 42.4 43.8 42.0 39.2 45.7 44.2 38.3 35.1
1,204 1,068 811 549 408 299 205 152 119 84 74
29.9 30.0 29.9 29.9 29.9 29.9 29.8 29.8 29.8 29.9 29.9
1,101 977 748 507 374 274 190 140 112 82 72
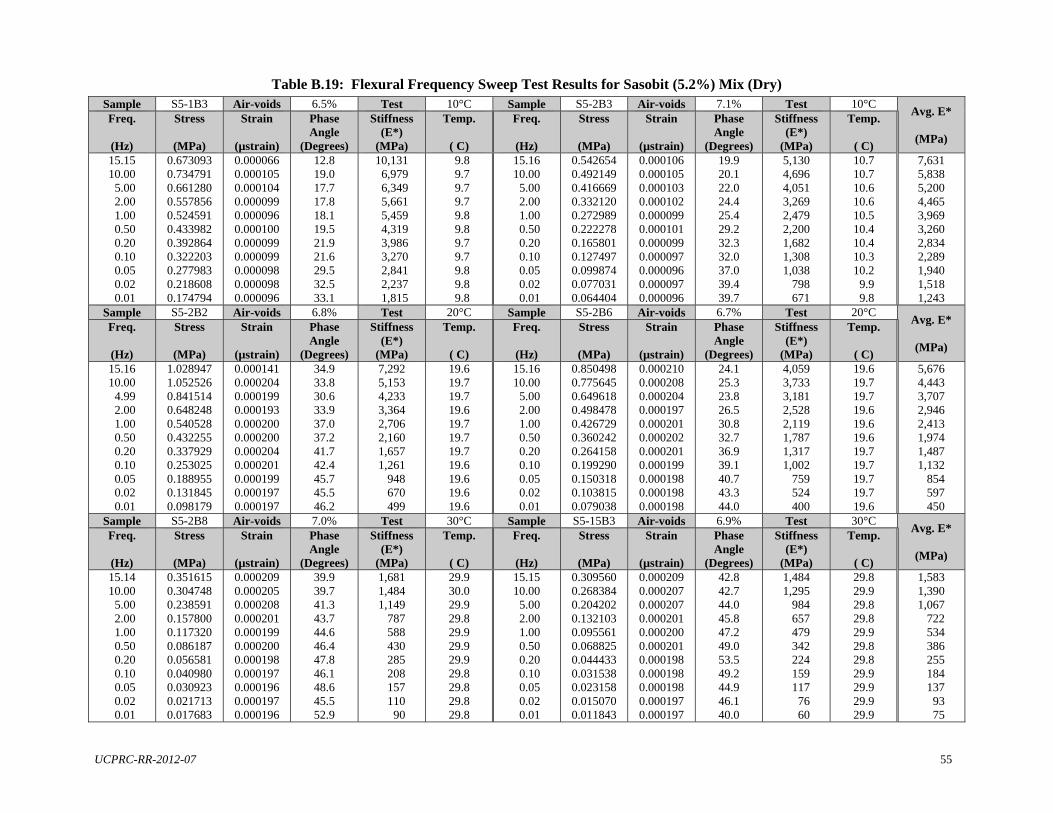
UCPRC-RR-2012-07 55
Table B.19: Flexural Frequency Sweep Test Results for Sasobit (5.2%) Mix (Dry) Sample S5-1B3 Air-voids 6.5% Test 10°C Sample S5-2B3 Air-voids 7.1% Test 10°C
Avg. E*
(MPa)
Freq.
(Hz)
Stress
(MPa)
Strain
(µstrain)
Phase Angle
(Degrees)
Stiffness (E*)
(MPa)
Temp.
( C)
Freq.
(Hz)
Stress
(MPa)
Strain
(µstrain)
Phase Angle
(Degrees)
Stiffness (E*)
(MPa)
Temp.
( C) 15.15 10.00 5.00 2.00 1.00 0.50 0.20 0.10 0.05 0.02 0.01
0.673093 0.734791 0.661280 0.557856 0.524591 0.433982 0.392864 0.322203 0.277983 0.218608 0.174794
0.000066 0.000105 0.000104 0.000099 0.000096 0.000100 0.000099 0.000099 0.000098 0.000098 0.000096
12.8 19.0 17.7 17.8 18.1 19.5 21.9 21.6 29.5 32.5 33.1
10,131 6,979 6,349 5,661 5,459 4,319 3,986 3,270 2,841 2,237 1,815
9.8 9.7 9.7 9.7 9.8 9.8 9.7 9.7 9.8 9.8 9.8
15.16 10.00 5.00 2.00 1.00 0.50 0.20 0.10 0.05 0.02 0.01
0.542654 0.492149 0.416669 0.332120 0.272989 0.222278 0.165801 0.127497 0.099874 0.077031 0.064404
0.000106 0.000105 0.000103 0.000102 0.000099 0.000101 0.000099 0.000097 0.000096 0.000097 0.000096
19.9 20.1 22.0 24.4 25.4 29.2 32.3 32.0 37.0 39.4 39.7
5,130 4,696 4,051 3,269 2,479 2,200 1,682 1,308 1,038 798 671
10.7 10.7 10.6 10.6 10.5 10.4 10.4 10.3 10.2 9.9 9.8
7,631 5,838 5,200 4,465 3,969 3,260 2,834 2,289 1,940 1,518 1,243
Sample S5-2B2 Air-voids 6.8% Test 20°C Sample S5-2B6 Air-voids 6.7% Test 20°C Avg. E*
(MPa)
Freq.
(Hz)
Stress
(MPa)
Strain
(µstrain)
Phase Angle
(Degrees)
Stiffness (E*)
(MPa)
Temp.
( C)
Freq.
(Hz)
Stress
(MPa)
Strain
(µstrain)
Phase Angle
(Degrees)
Stiffness (E*)
(MPa)
Temp.
( C) 15.16 10.00 4.99 2.00 1.00 0.50 0.20 0.10 0.05 0.02 0.01
1.028947 1.052526 0.841514 0.648248 0.540528 0.432255 0.337929 0.253025 0.188955 0.131845 0.098179
0.000141 0.000204 0.000199 0.000193 0.000200 0.000200 0.000204 0.000201 0.000199 0.000197 0.000197
34.9 33.8 30.6 33.9 37.0 37.2 41.7 42.4 45.7 45.5 46.2
7,292 5,153 4,233 3,364 2,706 2,160 1,657 1,261 948 670 499
19.6 19.7 19.7 19.6 19.7 19.7 19.7 19.6 19.6 19.6 19.6
15.16 10.00 5.00 2.00 1.00 0.50 0.20 0.10 0.05 0.02 0.01
0.850498 0.775645 0.649618 0.498478 0.426729 0.360242 0.264158 0.199290 0.150318 0.103815 0.079038
0.000210 0.000208 0.000204 0.000197 0.000201 0.000202 0.000201 0.000199 0.000198 0.000198 0.000198
24.1 25.3 23.8 26.5 30.8 32.7 36.9 39.1 40.7 43.3 44.0
4,059 3,733 3,181 2,528 2,119 1,787 1,317 1,002 759 524 400
19.6 19.7 19.7 19.6 19.6 19.6 19.7 19.7 19.7 19.7 19.6
5,676 4,443 3,707 2,946 2,413 1,974 1,487 1,132 854 597 450
Sample S5-2B8 Air-voids 7.0% Test 30°C Sample S5-15B3 Air-voids 6.9% Test 30°C Avg. E*
(MPa)
Freq.
(Hz)
Stress
(MPa)
Strain
(µstrain)
Phase Angle
(Degrees)
Stiffness (E*)
(MPa)
Temp.
( C)
Freq.
(Hz)
Stress
(MPa)
Strain
(µstrain)
Phase Angle
(Degrees)
Stiffness (E*)
(MPa)
Temp.
( C) 15.14 10.00 5.00 2.00 1.00 0.50 0.20 0.10 0.05 0.02 0.01
0.351615 0.304748 0.238591 0.157800 0.117320 0.086187 0.056581 0.040980 0.030923 0.021713 0.017683
0.000209 0.000205 0.000208 0.000201 0.000199 0.000200 0.000198 0.000197 0.000196 0.000197 0.000196
39.9 39.7 41.3 43.7 44.6 46.4 47.8 46.1 48.6 45.5 52.9
1,681 1,484 1,149 787 588 430 285 208 157 110 90
29.9 30.0 29.9 29.8 29.9 29.9 29.9 29.8 29.8 29.8 29.8
15.15 10.00 5.00 2.00 1.00 0.50 0.20 0.10 0.05 0.02 0.01
0.309560 0.268384 0.204202 0.132103 0.095561 0.068825 0.044433 0.031538 0.023158 0.015070 0.011843
0.000209 0.000207 0.000207 0.000201 0.000200 0.000201 0.000198 0.000198 0.000198 0.000197 0.000197
42.8 42.7 44.0 45.8 47.2 49.0 53.5 49.2 44.9 46.1 40.0
1,484 1,295 984 657 479 342 224 159 117 76 60
29.8 29.9 29.8 29.8 29.9 29.8 29.8 29.9 29.9 29.9 29.9
1,583 1,390 1,067 722 534 386 255 184 137 93 75

56 UCPRC-RR-2012-07
Table B.20: Flexural Frequency Sweep Test Results for Sasobit (5.2%) Mix (Wet) Sample S5-1B7 Air-voids 7.1% Test 10°C Sample S5-14B1 Air-voids 7.1% Test 10°C
Avg. E*
(MPa)
Freq.
(Hz)
Stress
(MPa)
Strain
(µstrain)
Phase Angle
(Degrees)
Stiffness (E*)
(MPa)
Temp.
( C)
Freq.
(Hz)
Stress
(MPa)
Strain
(µstrain)
Phase Angle
(Degrees)
Stiffness (E*)
(MPa)
Temp.
( C) 15.16 10.00 5.00 2.00 1.00 0.50 0.20 0.10 0.05 0.02 0.01
0.498320 0.649037 0.562475 0.475070 0.392025 0.319914 0.245300 0.199776 0.158263 0.118591 0.095570
0.000072 0.000103 0.000102 0.000104 0.000101 0.000102 0.000099 0.000099 0.000097 0.000096 0.000097
16.5 16.9 17.9 20.3 22.3 23.3 25.3 27.5 30.5 33.0 33.9
6,914 6,306 5,519 4,548 3,865 3,150 2,488 2,025 1,623 1,229 990
9.9 9.8 9.7 9.7 9.8 9.8 9.7 9.6 9.7 9.7 9.7
15.15 10.00 5.00 2.00 1.00 0.50 0.20 0.10 0.05 0.02 0.01
0.610620 0.561840 0.496228 0.409286 0.340428 0.275060 0.209924 0.168762 0.129905 0.096527 0.076735
0.000102 0.000102 0.000103 0.000104 0.000102 0.000099 0.000098 0.000099 0.000097 0.000096 0.000097
18.8 19.1 20.0 22.3 23.7 26.6 28.1 29.0 33.0 34.8 37.4
6,006 5,513 4,826 3,941 3,335 2,773 2,149 1,710 1,342 1,001 794
9.9 9.8 9.7 9.7 9.7 9.6 9.6 9.7 9.6 9.7 9.7
6,460 5,910 5,173 4,245 3,600 2,962 2,319 1,868 1,483 1,115 892
Sample S5-15B2 Air-voids 7.1% Test 20°C Sample S5-15B4 Air-voids 6.8% Test 20°C Avg. E*
(MPa)
Freq.
(Hz)
Stress
(MPa)
Strain
(µstrain)
Phase Angle
(Degrees)
Stiffness (E*)
(MPa)
Temp.
( C)
Freq.
(Hz)
Stress
(MPa)
Strain
(µstrain)
Phase Angle
(Degrees)
Stiffness (E*)
(MPa)
Temp.
( C) 15.16 10.00 5.01 2.00 1.00 0.50 0.20 0.10 0.05 0.02 0.01
0.515563 0.459918 0.367445 0.263133 0.204976 0.156305 0.106480 0.081112 0.057773 0.041099 0.031043
0.000207 0.000207 0.000205 0.000200 0.000203 0.000202 0.000199 0.000199 0.000194 0.000197 0.000198
30.8 31.5 32.9 35.5 36.7 38.8 40.6 40.1 43.8 45.5 42.2
2,494 2,222 1,791 1,314 1,011 772 536 407 297 208 157
19.8 19.8 19.6 19.8 19.9 19.8 19.8 19.8 19.9 19.8 19.8
15.15 9.99 5.01 2.00 1.00 0.50 0.20 0.10 0.05 0.02 0.01
0.473560 0.416153 0.331891 0.237672 0.184919 0.141591 0.097508 0.073143 0.056426 0.039682 0.032400
0.000212 0.000207 0.000206 0.000201 0.000203 0.000202 0.000198 0.000198 0.000197 0.000193 0.000198
31.3 31.7 32.9 35.4 36.8 38.2 39.0 39.3 40.3 40.4 44.5
2,234 2,009 1,613 1,181 912 701 491 370 287 205 164
19.7 19.9 19.7 19.9 19.9 19.8 19.9 19.8 19.8 19.8 19.8
2,364 2,116 1,702 1,248 962 737 514 389 292 207 161
Sample S5-1B1 Air-voids 7.3% Test 30°C Sample S5-15B6 Air-voids 7.1% Test 30°C Avg. E*
(MPa)
Freq.
(Hz)
Stress
(MPa)
Strain
(µstrain)
Phase Angle
(Degrees)
Stiffness (E*)
(MPa)
Temp.
( C)
Freq.
(Hz)
Stress
(MPa)
Strain
(µstrain)
Phase Angle
(Degrees)
Stiffness (E*)
(MPa)
Temp.
( C) 15.16 10.00 5.00 2.00 1.00 0.50 0.20 0.10 0.05 0.02 0.01
0.222460 0.192317 0.149855 0.102877 0.076202 0.057086 0.039285 0.029082 0.023139 0.016006
-
0.000214 0.000207 0.000207 0.000208 0.000204 0.000202 0.000199 0.000198 0.000196 0.000197
-
42.0 41.2 40.6 41.5 41.5 41.6 42.6 44.8 39.6 32.8
-
1,041 927 723 496 374 283 198 147 118 81
-
30.1 30.0 29.9 29.9 29.9 29.9 29.9 29.9 29.9 29.9
-
15.15 10.00 5.00 2.00 1.00 0.50 0.20 0.10 0.05 0.02 0.01
0.167723 0.144958 0.111667 0.074988 0.056057 0.040967 0.029106 0.021411 0.019003 0.013337 0.011466
0.000217 0.000210 0.000208 0.000203 0.000202 0.000202 0.000200 0.000199 0.000197 0.000197 0.000196
47.6 44.8 43.1 43.8 40.6 40.9 40.5 34.4 37.8 31.1 34.7
774 692 537 396 277 203 145 108 96 68 59
29.8 29.9 29.9 29.8 29.9 29.8 29.8 29.9 29.9 29.8 29.8
908 810 630 446 326 243 172 128 107 75 59

UCPRC-RR-2012-07 57
Table B.21: Flexural Frequency Sweep Test Results for Sasobit (4.5%) Mix (Dry) Sample S4-5B1 Air-voids 7.2% Test 10°C Sample S4-12B7 Air-voids 7.5% Test 10°C
Avg. E*
(MPa)
Freq.
(Hz)
Stress
(MPa)
Strain
(µstrain)
Phase Angle
(Degrees)
Stiffness (E*)
(MPa)
Temp.
( C)
Freq.
(Hz)
Stress
(MPa)
Strain
(µstrain)
Phase Angle
(Degrees)
Stiffness (E*)
(MPa)
Temp.
( C) 15.15 10.00 5.00 2.00 1.00 0.50 0.20 0.10 0.05 0.02 0.01
0.690938 0.723894 0.691721 0.645163 0.569475 0.503939 0.408925 0.351081 0.311185 0.264508 0.229572
0.000100 0.000104 0.000104 0.000100 0.000099 0.000098 0.000097 0.000096 0.000096 0.000095 0.000096
17.9 16.0 13.1 14.9 15.6 17.0 18.0 19.0 23.2 25.8 27.6
6,919 6,929 6,660 6,423 5,768 5,133 4,222 3,646 3,254 2,782 2,394
10.4 10.4 10.3 10.2 10.1 10.0 9.9 9.8 9.7 9.7 9.8
15.15 9.99 5.00 2.00 1.00 0.50 0.20 0.10 0.05 0.02 0.01
0.724956 0.598261 0.555666 0.493241 0.471902 0.427610 0.350863 0.285498 0.231446 0.176096 0.143116
0.000115 0.000099 0.000099 0.000096 0.000097 0.000101 0.000099 0.000098 0.000097 0.000097 0.000097
19.4 21.9 19.5 17.5 20.5 22.7 25.8 26.2 30.0 34.6 35.5
6,315 6,065 5,615 5,153 4,861 4,228 3,541 2,909 2,381 1,811 1,480
10.0 9.9 9.8 9.8 9.7 9.6 9.7 9.8 9.7 9.8 9.8
6,617 6,497 6,138 5,788 5,315 4,681 3,882 3,278 2,818 2,297 1,937
Sample S4-8B2 Air-voids 7.3% Test 20°C Sample S4-11B5 Air-voids 7.8% Test 20°C Avg. E*
(MPa)
Freq.
(Hz)
Stress
(MPa)
Strain
(µstrain)
Phase Angle
(Degrees)
Stiffness (E*)
(MPa)
Temp.
( C)
Freq.
(Hz)
Stress
(MPa)
Strain
(µstrain)
Phase Angle
(Degrees)
Stiffness (E*)
(MPa)
Temp.
( C) 15.16 9.99 5.00 2.00 1.00 0.50 0.20 0.10 0.05 0.02 0.01
1.061128 1.035982 0.923646 0.728919 0.621704 0.504258 0.393807 0.338587 0.266276 0.191740 0.142874
0.000197 0.000205 0.000206 0.000198 0.000201 0.000204 0.000200 0.000201 0.000200 0.000199 0.000198
19.8 20.2 20.1 22.2 24.0 25.5 28.0 31.3 34.7 37.1 38.7
5,380 5,055 4,479 3,679 3,087 2,471 1,972 1,687 1,331 963 723
19.8 19.8 19.8 19.7 19.6 19.6 19.7 19.7 19.7 19.7 19.6
15.15 9.99 5.00 2.00 1.00 0.50 0.20 0.10 0.05 0.02 0.01
0.904800 0.783086 0.690144 0.518847 0.455767 0.382192 0.283547 0.218299 0.168077 0.119186 0.091617
0.000217 0.000205 0.000203 0.000194 0.000207 0.000211 0.000204 0.000203 0.000202 0.000201 0.000200
23.6 24.6 24.5 26.8 29.8 32.1 35.5 37.1 39.3 41.0 41.7
4,174 3,823 3,393 2,679 2,207 1,812 1,389 1,076 833 593 459
19.7 19.8 19.7 19.7 19.8 19.8 19.6 19.6 19.8 19.7 19.7
4,777 4,439 3,936 3,179 2,647 2,142 1,681 1,382 1,082 778 591
Sample S4-11B3 Air-voids 7.9% Test 30°C Sample S4-11B7 Air-voids 7.8% Test 30°C Avg. E*
(MPa)
Freq.
(Hz)
Stress
(MPa)
Strain
(µstrain)
Phase Angle
(Degrees)
Stiffness (E*)
(MPa)
Temp.
( C)
Freq.
(Hz)
Stress
(MPa)
Strain
(µstrain)
Phase Angle
(Degrees)
Stiffness (E*)
(MPa)
Temp.
( C) 15.16 10.01 5.00 2.00 1.00 0.50 0.20 0.10 0.05 0.02 0.01
0.357825 0.306624 0.241627 0.160078 0.118344 0.087204 0.055172 0.040607 0.028752 0.019861 0.016160
0.000209 0.000204 0.000208 0.000201 0.000200 0.000200 0.000199 0.000197 0.000196 0.000195 0.000196
40.6 40.7 42.0 44.2 45.8 46.6 48.0 49.5 49.0 55.3 53.6
1,713 1,503 1,164 797 592 436 277 206 147 102 82
29.9 29.7 29.8 29.7 29.6 29.8 29.8 29.8 29.8 29.8 29.8
15.16 9.99 5.00 2.00 1.00 0.50 0.20 0.10 0.05 0.02 0.01
0.428344 0.382069 0.299614 0.205078 0.156145 0.116141 0.077803 0.056478 0.041381 0.028259 0.022664
0.000204 0.000206 0.000206 0.000200 0.000200 0.000201 0.000200 0.000198 0.000197 0.000197 0.000197
36.0 36.7 37.6 40.6 42.1 42.9 44.7 44.2 47.4 49.4 51.6
2,097 1,852 1,456 1,028 782 578 390 286 210 143 115
29.7 29.8 29.8 29.7 29.7 29.7 29.7 29.8 29.7 29.8 29.8
1,905 1,678 1,310 913 687 507 334 246 179 123 99
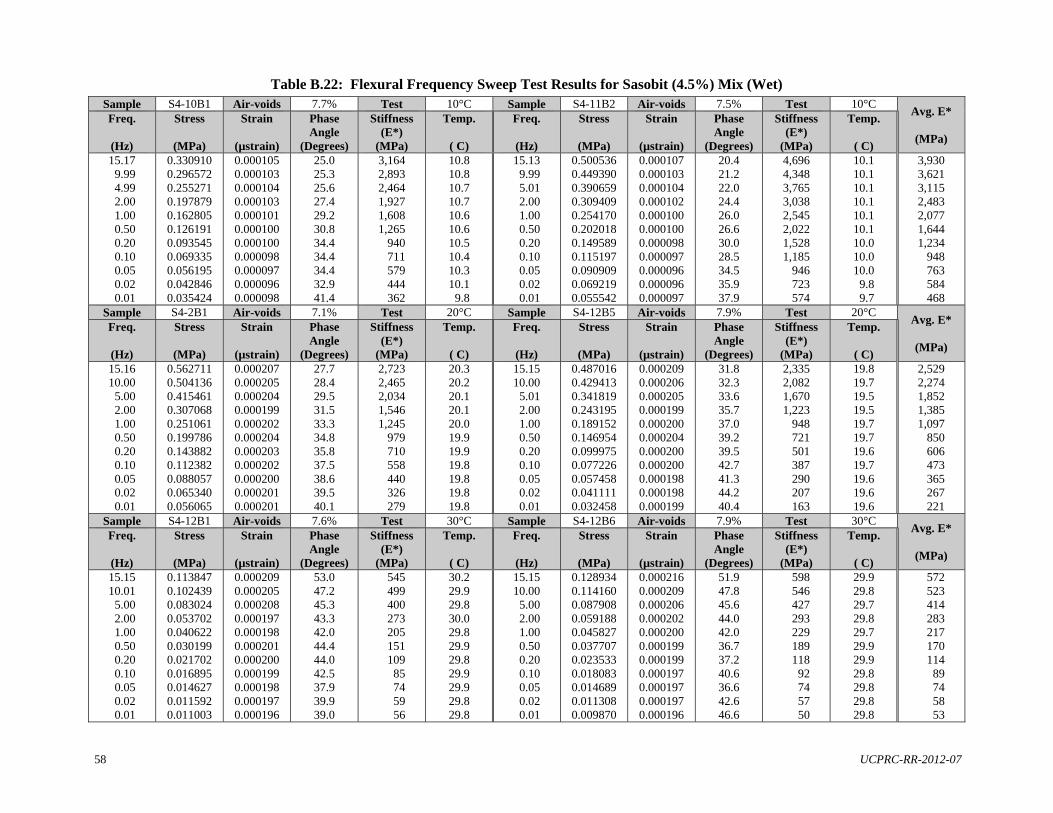
58 UCPRC-RR-2012-07
Table B.22: Flexural Frequency Sweep Test Results for Sasobit (4.5%) Mix (Wet) Sample S4-10B1 Air-voids 7.7% Test 10°C Sample S4-11B2 Air-voids 7.5% Test 10°C
Avg. E*
(MPa)
Freq.
(Hz)
Stress
(MPa)
Strain
(µstrain)
Phase Angle
(Degrees)
Stiffness (E*)
(MPa)
Temp.
( C)
Freq.
(Hz)
Stress
(MPa)
Strain
(µstrain)
Phase Angle
(Degrees)
Stiffness (E*)
(MPa)
Temp.
( C) 15.17 9.99 4.99 2.00 1.00 0.50 0.20 0.10 0.05 0.02 0.01
0.330910 0.296572 0.255271 0.197879 0.162805 0.126191 0.093545 0.069335 0.056195 0.042846 0.035424
0.000105 0.000103 0.000104 0.000103 0.000101 0.000100 0.000100 0.000098 0.000097 0.000096 0.000098
25.0 25.3 25.6 27.4 29.2 30.8 34.4 34.4 34.4 32.9 41.4
3,164 2,893 2,464 1,927 1,608 1,265 940 711 579 444 362
10.8 10.8 10.7 10.7 10.6 10.6 10.5 10.4 10.3 10.1 9.8
15.13 9.99 5.01 2.00 1.00 0.50 0.20 0.10 0.05 0.02 0.01
0.500536 0.449390 0.390659 0.309409 0.254170 0.202018 0.149589 0.115197 0.090909 0.069219 0.055542
0.000107 0.000103 0.000104 0.000102 0.000100 0.000100 0.000098 0.000097 0.000096 0.000096 0.000097
20.4 21.2 22.0 24.4 26.0 26.6 30.0 28.5 34.5 35.9 37.9
4,696 4,348 3,765 3,038 2,545 2,022 1,528 1,185 946 723 574
10.1 10.1 10.1 10.1 10.1 10.1 10.0 10.0 10.0 9.8 9.7
3,930 3,621 3,115 2,483 2,077 1,644 1,234 948 763 584 468
Sample S4-2B1 Air-voids 7.1% Test 20°C Sample S4-12B5 Air-voids 7.9% Test 20°C Avg. E*
(MPa)
Freq.
(Hz)
Stress
(MPa)
Strain
(µstrain)
Phase Angle
(Degrees)
Stiffness (E*)
(MPa)
Temp.
( C)
Freq.
(Hz)
Stress
(MPa)
Strain
(µstrain)
Phase Angle
(Degrees)
Stiffness (E*)
(MPa)
Temp.
( C) 15.16 10.00 5.00 2.00 1.00 0.50 0.20 0.10 0.05 0.02 0.01
0.562711 0.504136 0.415461 0.307068 0.251061 0.199786 0.143882 0.112382 0.088057 0.065340 0.056065
0.000207 0.000205 0.000204 0.000199 0.000202 0.000204 0.000203 0.000202 0.000200 0.000201 0.000201
27.7 28.4 29.5 31.5 33.3 34.8 35.8 37.5 38.6 39.5 40.1
2,723 2,465 2,034 1,546 1,245 979 710 558 440 326 279
20.3 20.2 20.1 20.1 20.0 19.9 19.9 19.8 19.8 19.8 19.8
15.15 10.00 5.01 2.00 1.00 0.50 0.20 0.10 0.05 0.02 0.01
0.487016 0.429413 0.341819 0.243195 0.189152 0.146954 0.099975 0.077226 0.057458 0.041111 0.032458
0.000209 0.000206 0.000205 0.000199 0.000200 0.000204 0.000200 0.000200 0.000198 0.000198 0.000199
31.8 32.3 33.6 35.7 37.0 39.2 39.5 42.7 41.3 44.2 40.4
2,335 2,082 1,670 1,223 948 721 501 387 290 207 163
19.8 19.7 19.5 19.5 19.7 19.7 19.6 19.7 19.6 19.6 19.6
2,529 2,274 1,852 1,385 1,097 850 606 473 365 267 221
Sample S4-12B1 Air-voids 7.6% Test 30°C Sample S4-12B6 Air-voids 7.9% Test 30°C Avg. E*
(MPa)
Freq.
(Hz)
Stress
(MPa)
Strain
(µstrain)
Phase Angle
(Degrees)
Stiffness (E*)
(MPa)
Temp.
( C)
Freq.
(Hz)
Stress
(MPa)
Strain
(µstrain)
Phase Angle
(Degrees)
Stiffness (E*)
(MPa)
Temp.
( C) 15.15 10.01 5.00 2.00 1.00 0.50 0.20 0.10 0.05 0.02 0.01
0.113847 0.102439 0.083024 0.053702 0.040622 0.030199 0.021702 0.016895 0.014627 0.011592 0.011003
0.000209 0.000205 0.000208 0.000197 0.000198 0.000201 0.000200 0.000199 0.000198 0.000197 0.000196
53.0 47.2 45.3 43.3 42.0 44.4 44.0 42.5 37.9 39.9 39.0
545 499 400 273 205 151 109 85 74 59 56
30.2 29.9 29.8 30.0 29.8 29.9 29.8 29.9 29.9 29.8 29.8
15.15 10.00 5.00 2.00 1.00 0.50 0.20 0.10 0.05 0.02 0.01
0.128934 0.114160 0.087908 0.059188 0.045827 0.037707 0.023533 0.018083 0.014689 0.011308 0.009870
0.000216 0.000209 0.000206 0.000202 0.000200 0.000199 0.000199 0.000197 0.000197 0.000197 0.000196
51.9 47.8 45.6 44.0 42.0 36.7 37.2 40.6 36.6 42.6 46.6
598 546 427 293 229 189 118 92 74 57 50
29.9 29.8 29.7 29.8 29.7 29.9 29.9 29.8 29.8 29.8 29.8
572 523 414 283 217 170 114 89 74 58 53
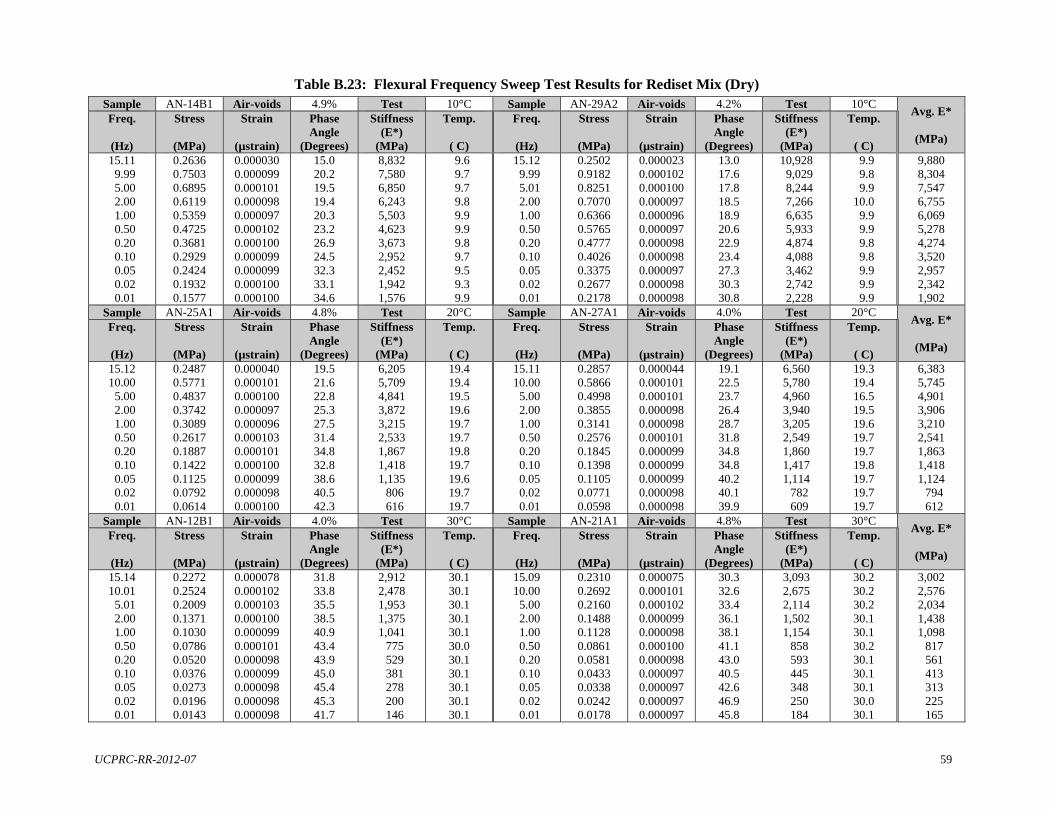
UCPRC-RR-2012-07 59
Table B.23: Flexural Frequency Sweep Test Results for Rediset Mix (Dry) Sample AN-14B1 Air-voids 4.9% Test 10°C Sample AN-29A2 Air-voids 4.2% Test 10°C
Avg. E*
(MPa)
Freq.
(Hz)
Stress
(MPa)
Strain
(µstrain)
Phase Angle
(Degrees)
Stiffness (E*)
(MPa)
Temp.
( C)
Freq.
(Hz)
Stress
(MPa)
Strain
(µstrain)
Phase Angle
(Degrees)
Stiffness (E*)
(MPa)
Temp.
( C) 15.11 9.99 5.00 2.00 1.00 0.50 0.20 0.10 0.05 0.02 0.01
0.2636 0.7503 0.6895 0.6119 0.5359 0.4725 0.3681 0.2929 0.2424 0.1932 0.1577
0.000030 0.000099 0.000101 0.000098 0.000097 0.000102 0.000100 0.000099 0.000099 0.000100 0.000100
15.0 20.2 19.5 19.4 20.3 23.2 26.9 24.5 32.3 33.1 34.6
8,832 7,580 6,850 6,243 5,503 4,623 3,673 2,952 2,452 1,942 1,576
9.6 9.7 9.7 9.8 9.9 9.9 9.8 9.7 9.5 9.3 9.9
15.12 9.99 5.01 2.00 1.00 0.50 0.20 0.10 0.05 0.02 0.01
0.2502 0.9182 0.8251 0.7070 0.6366 0.5765 0.4777 0.4026 0.3375 0.2677 0.2178
0.000023 0.000102 0.000100 0.000097 0.000096 0.000097 0.000098 0.000098 0.000097 0.000098 0.000098
13.0 17.6 17.8 18.5 18.9 20.6 22.9 23.4 27.3 30.3 30.8
10,928 9,029 8,244 7,266 6,635 5,933 4,874 4,088 3,462 2,742 2,228
9.9 9.8 9.9 10.0 9.9 9.9 9.8 9.8 9.9 9.9 9.9
9,880 8,304 7,547 6,755 6,069 5,278 4,274 3,520 2,957 2,342 1,902
Sample AN-25A1 Air-voids 4.8% Test 20°C Sample AN-27A1 Air-voids 4.0% Test 20°C Avg. E*
(MPa)
Freq.
(Hz)
Stress
(MPa)
Strain
(µstrain)
Phase Angle
(Degrees)
Stiffness (E*)
(MPa)
Temp.
( C)
Freq.
(Hz)
Stress
(MPa)
Strain
(µstrain)
Phase Angle
(Degrees)
Stiffness (E*)
(MPa)
Temp.
( C) 15.12 10.00 5.00 2.00 1.00 0.50 0.20 0.10 0.05 0.02 0.01
0.2487 0.5771 0.4837 0.3742 0.3089 0.2617 0.1887 0.1422 0.1125 0.0792 0.0614
0.000040 0.000101 0.000100 0.000097 0.000096 0.000103 0.000101 0.000100 0.000099 0.000098 0.000100
19.5 21.6 22.8 25.3 27.5 31.4 34.8 32.8 38.6 40.5 42.3
6,205 5,709 4,841 3,872 3,215 2,533 1,867 1,418 1,135 806 616
19.4 19.4 19.5 19.6 19.7 19.7 19.8 19.7 19.6 19.7 19.7
15.11 10.00 5.00 2.00 1.00 0.50 0.20 0.10 0.05 0.02 0.01
0.2857 0.5866 0.4998 0.3855 0.3141 0.2576 0.1845 0.1398 0.1105 0.0771 0.0598
0.000044 0.000101 0.000101 0.000098 0.000098 0.000101 0.000099 0.000099 0.000099 0.000098 0.000098
19.1 22.5 23.7 26.4 28.7 31.8 34.8 34.8 40.2 40.1 39.9
6,560 5,780 4,960 3,940 3,205 2,549 1,860 1,417 1,114 782 609
19.3 19.4 16.5 19.5 19.6 19.7 19.7 19.8 19.7 19.7 19.7
6,383 5,745 4,901 3,906 3,210 2,541 1,863 1,418 1,124 794 612
Sample AN-12B1 Air-voids 4.0% Test 30°C Sample AN-21A1 Air-voids 4.8% Test 30°C Avg. E*
(MPa)
Freq.
(Hz)
Stress
(MPa)
Strain
(µstrain)
Phase Angle
(Degrees)
Stiffness (E*)
(MPa)
Temp.
( C)
Freq.
(Hz)
Stress
(MPa)
Strain
(µstrain)
Phase Angle
(Degrees)
Stiffness (E*)
(MPa)
Temp.
( C) 15.14 10.01 5.01 2.00 1.00 0.50 0.20 0.10 0.05 0.02 0.01
0.2272 0.2524 0.2009 0.1371 0.1030 0.0786 0.0520 0.0376 0.0273 0.0196 0.0143
0.000078 0.000102 0.000103 0.000100 0.000099 0.000101 0.000098 0.000099 0.000098 0.000098 0.000098
31.8 33.8 35.5 38.5 40.9 43.4 43.9 45.0 45.4 45.3 41.7
2,912 2,478 1,953 1,375 1,041 775 529 381 278 200 146
30.1 30.1 30.1 30.1 30.1 30.0 30.1 30.1 30.1 30.1 30.1
15.09 10.00 5.00 2.00 1.00 0.50 0.20 0.10 0.05 0.02 0.01
0.2310 0.2692 0.2160 0.1488 0.1128 0.0861 0.0581 0.0433 0.0338 0.0242 0.0178
0.000075 0.000101 0.000102 0.000099 0.000098 0.000100 0.000098 0.000097 0.000097 0.000097 0.000097
30.3 32.6 33.4 36.1 38.1 41.1 43.0 40.5 42.6 46.9 45.8
3,093 2,675 2,114 1,502 1,154 858 593 445 348 250 184
30.2 30.2 30.2 30.1 30.1 30.2 30.1 30.1 30.1 30.0 30.1
3,002 2,576 2,034 1,438 1,098 817 561 413 313 225 165
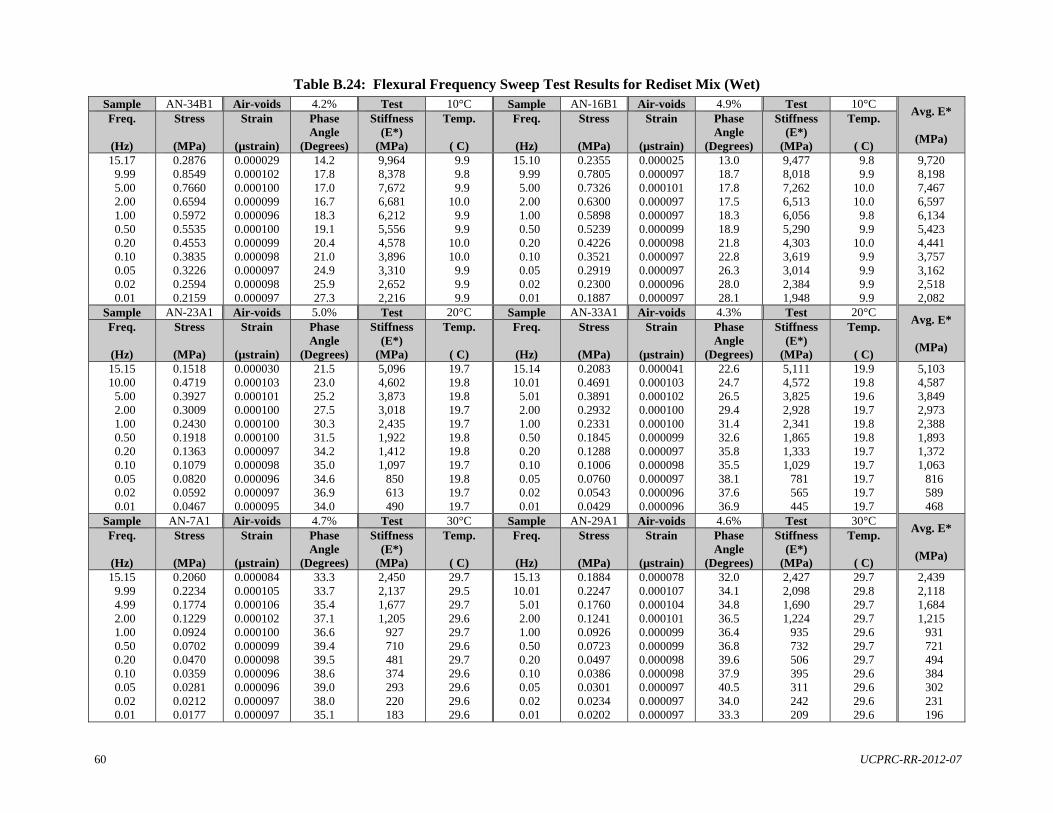
60 UCPRC-RR-2012-07
Table B.24: Flexural Frequency Sweep Test Results for Rediset Mix (Wet) Sample AN-34B1 Air-voids 4.2% Test 10°C Sample AN-16B1 Air-voids 4.9% Test 10°C
Avg. E*
(MPa)
Freq.
(Hz)
Stress
(MPa)
Strain
(µstrain)
Phase Angle
(Degrees)
Stiffness (E*)
(MPa)
Temp.
( C)
Freq.
(Hz)
Stress
(MPa)
Strain
(µstrain)
Phase Angle
(Degrees)
Stiffness (E*)
(MPa)
Temp.
( C) 15.17 9.99 5.00 2.00 1.00 0.50 0.20 0.10 0.05 0.02 0.01
0.2876 0.8549 0.7660 0.6594 0.5972 0.5535 0.4553 0.3835 0.3226 0.2594 0.2159
0.000029 0.000102 0.000100 0.000099 0.000096 0.000100 0.000099 0.000098 0.000097 0.000098 0.000097
14.2 17.8 17.0 16.7 18.3 19.1 20.4 21.0 24.9 25.9 27.3
9,964 8,378 7,672 6,681 6,212 5,556 4,578 3,896 3,310 2,652 2,216
9.9 9.8 9.9 10.0 9.9 9.9 10.0 10.0 9.9 9.9 9.9
15.10 9.99 5.00 2.00 1.00 0.50 0.20 0.10 0.05 0.02 0.01
0.2355 0.7805 0.7326 0.6300 0.5898 0.5239 0.4226 0.3521 0.2919 0.2300 0.1887
0.000025 0.000097 0.000101 0.000097 0.000097 0.000099 0.000098 0.000097 0.000097 0.000096 0.000097
13.0 18.7 17.8 17.5 18.3 18.9 21.8 22.8 26.3 28.0 28.1
9,477 8,018 7,262 6,513 6,056 5,290 4,303 3,619 3,014 2,384 1,948
9.8 9.9 10.0 10.0 9.8 9.9 10.0 9.9 9.9 9.9 9.9
9,720 8,198 7,467 6,597 6,134 5,423 4,441 3,757 3,162 2,518 2,082
Sample AN-23A1 Air-voids 5.0% Test 20°C Sample AN-33A1 Air-voids 4.3% Test 20°C Avg. E*
(MPa)
Freq.
(Hz)
Stress
(MPa)
Strain
(µstrain)
Phase Angle
(Degrees)
Stiffness (E*)
(MPa)
Temp.
( C)
Freq.
(Hz)
Stress
(MPa)
Strain
(µstrain)
Phase Angle
(Degrees)
Stiffness (E*)
(MPa)
Temp.
( C) 15.15 10.00 5.00 2.00 1.00 0.50 0.20 0.10 0.05 0.02 0.01
0.1518 0.4719 0.3927 0.3009 0.2430 0.1918 0.1363 0.1079 0.0820 0.0592 0.0467
0.000030 0.000103 0.000101 0.000100 0.000100 0.000100 0.000097 0.000098 0.000096 0.000097 0.000095
21.5 23.0 25.2 27.5 30.3 31.5 34.2 35.0 34.6 36.9 34.0
5,096 4,602 3,873 3,018 2,435 1,922 1,412 1,097 850 613 490
19.7 19.8 19.8 19.7 19.7 19.8 19.8 19.7 19.8 19.7 19.7
15.14 10.01 5.01 2.00 1.00 0.50 0.20 0.10 0.05 0.02 0.01
0.2083 0.4691 0.3891 0.2932 0.2331 0.1845 0.1288 0.1006 0.0760 0.0543 0.0429
0.000041 0.000103 0.000102 0.000100 0.000100 0.000099 0.000097 0.000098 0.000097 0.000096 0.000096
22.6 24.7 26.5 29.4 31.4 32.6 35.8 35.5 38.1 37.6 36.9
5,111 4,572 3,825 2,928 2,341 1,865 1,333 1,029 781 565 445
19.9 19.8 19.6 19.7 19.8 19.8 19.7 19.7 19.7 19.7 19.7
5,103 4,587 3,849 2,973 2,388 1,893 1,372 1,063 816 589 468
Sample AN-7A1 Air-voids 4.7% Test 30°C Sample AN-29A1 Air-voids 4.6% Test 30°C Avg. E*
(MPa)
Freq.
(Hz)
Stress
(MPa)
Strain
(µstrain)
Phase Angle
(Degrees)
Stiffness (E*)
(MPa)
Temp.
( C)
Freq.
(Hz)
Stress
(MPa)
Strain
(µstrain)
Phase Angle
(Degrees)
Stiffness (E*)
(MPa)
Temp.
( C) 15.15 9.99 4.99 2.00 1.00 0.50 0.20 0.10 0.05 0.02 0.01
0.2060 0.2234 0.1774 0.1229 0.0924 0.0702 0.0470 0.0359 0.0281 0.0212 0.0177
0.000084 0.000105 0.000106 0.000102 0.000100 0.000099 0.000098 0.000096 0.000096 0.000097 0.000097
33.3 33.7 35.4 37.1 36.6 39.4 39.5 38.6 39.0 38.0 35.1
2,450 2,137 1,677 1,205 927 710 481 374 293 220 183
29.7 29.5 29.7 29.6 29.7 29.6 29.7 29.6 29.6 29.6 29.6
15.13 10.01 5.01 2.00 1.00 0.50 0.20 0.10 0.05 0.02 0.01
0.1884 0.2247 0.1760 0.1241 0.0926 0.0723 0.0497 0.0386 0.0301 0.0234 0.0202
0.000078 0.000107 0.000104 0.000101 0.000099 0.000099 0.000098 0.000098 0.000097 0.000097 0.000097
32.0 34.1 34.8 36.5 36.4 36.8 39.6 37.9 40.5 34.0 33.3
2,427 2,098 1,690 1,224 935 732 506 395 311 242 209
29.7 29.8 29.7 29.7 29.6 29.7 29.7 29.6 29.6 29.6 29.6
2,439 2,118 1,684 1,215 931 721 494 384 302 231 196
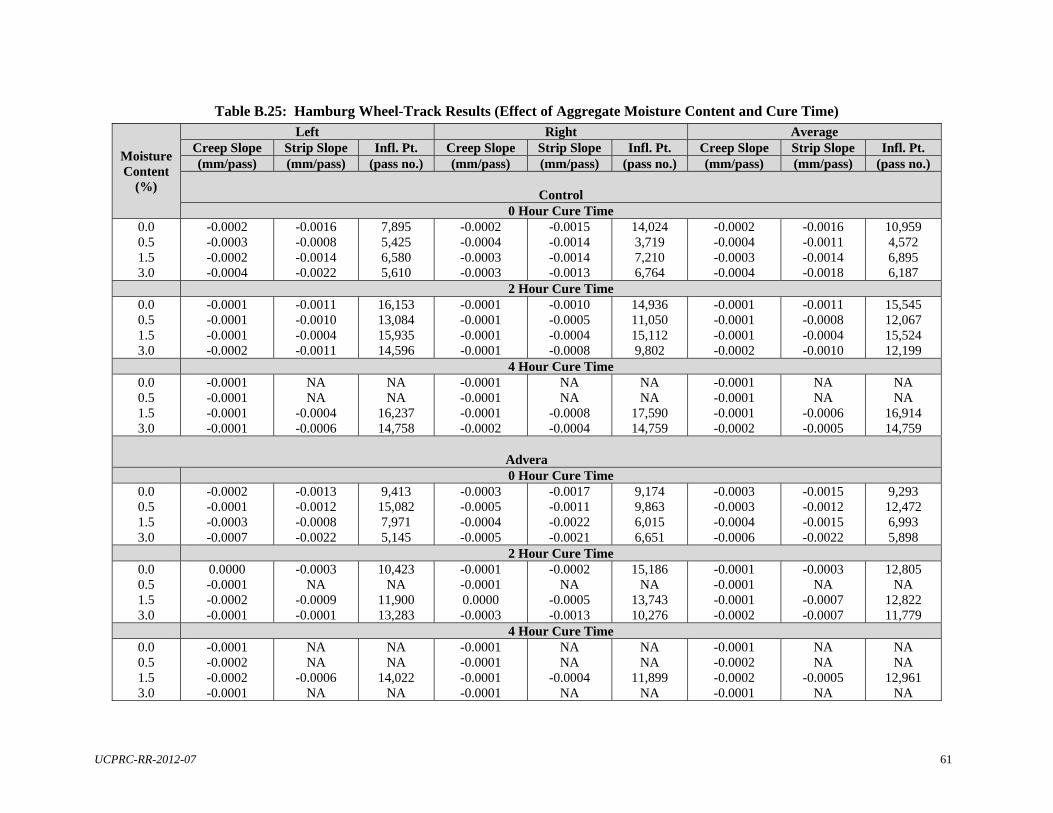
UCPRC-RR-2012-07 61
Table B.25: Hamburg Wheel-Track Results (Effect of Aggregate Moisture Content and Cure Time)
Moisture Content
(%)
Left Right Average Creep Slope Strip Slope Infl. Pt. Creep Slope Strip Slope Infl. Pt. Creep Slope Strip Slope Infl. Pt. (mm/pass) (mm/pass) (pass no.) (mm/pass) (mm/pass) (pass no.) (mm/pass) (mm/pass) (pass no.)
Control
0 Hour Cure Time 0.0 0.5 1.5 3.0
-0.0002 -0.0003 -0.0002 -0.0004
-0.0016 -0.0008 -0.0014 -0.0022
7,895 5,425 6,580 5,610
-0.0002 -0.0004 -0.0003 -0.0003
-0.0015 -0.0014 -0.0014 -0.0013
14,024 3,719 7,210 6,764
-0.0002 -0.0004 -0.0003 -0.0004
-0.0016 -0.0011 -0.0014 -0.0018
10,959 4,572 6,895 6,187
2 Hour Cure Time 0.0 0.5 1.5 3.0
-0.0001 -0.0001 -0.0001 -0.0002
-0.0011 -0.0010 -0.0004 -0.0011
16,153 13,084 15,935 14,596
-0.0001 -0.0001 -0.0001 -0.0001
-0.0010 -0.0005 -0.0004 -0.0008
14,936 11,050 15,112 9,802
-0.0001 -0.0001 -0.0001 -0.0002
-0.0011 -0.0008 -0.0004 -0.0010
15,545 12,067 15,524 12,199
4 Hour Cure Time 0.0 0.5 1.5 3.0
-0.0001 -0.0001 -0.0001 -0.0001
NA NA
-0.0004 -0.0006
NA NA
16,237 14,758
-0.0001 -0.0001 -0.0001 -0.0002
NA NA
-0.0008 -0.0004
NA NA
17,590 14,759
-0.0001 -0.0001 -0.0001 -0.0002
NA NA
-0.0006 -0.0005
NA NA
16,914 14,759
Advera
0 Hour Cure Time 0.0 0.5 1.5 3.0
-0.0002 -0.0001 -0.0003 -0.0007
-0.0013 -0.0012 -0.0008 -0.0022
9,413 15,082 7,971 5,145
-0.0003 -0.0005 -0.0004 -0.0005
-0.0017 -0.0011 -0.0022 -0.0021
9,174 9,863 6,015 6,651
-0.0003 -0.0003 -0.0004 -0.0006
-0.0015 -0.0012 -0.0015 -0.0022
9,293 12,472 6,993 5,898
2 Hour Cure Time 0.0 0.5 1.5 3.0
0.0000 -0.0001 -0.0002 -0.0001
-0.0003 NA
-0.0009 -0.0001
10,423 NA
11,900 13,283
-0.0001 -0.0001 0.0000 -0.0003
-0.0002 NA
-0.0005 -0.0013
15,186 NA
13,743 10,276
-0.0001 -0.0001 -0.0001 -0.0002
-0.0003 NA
-0.0007 -0.0007
12,805 NA
12,822 11,779
4 Hour Cure Time 0.0 0.5 1.5 3.0
-0.0001 -0.0002 -0.0002 -0.0001
NA NA
-0.0006 NA
NA NA
14,022 NA
-0.0001 -0.0001 -0.0001 -0.0001
NA NA
-0.0004 NA
NA NA
11,899 NA
-0.0001 -0.0002 -0.0002 -0.0001
NA NA
-0.0005 NA
NA NA
12,961 NA
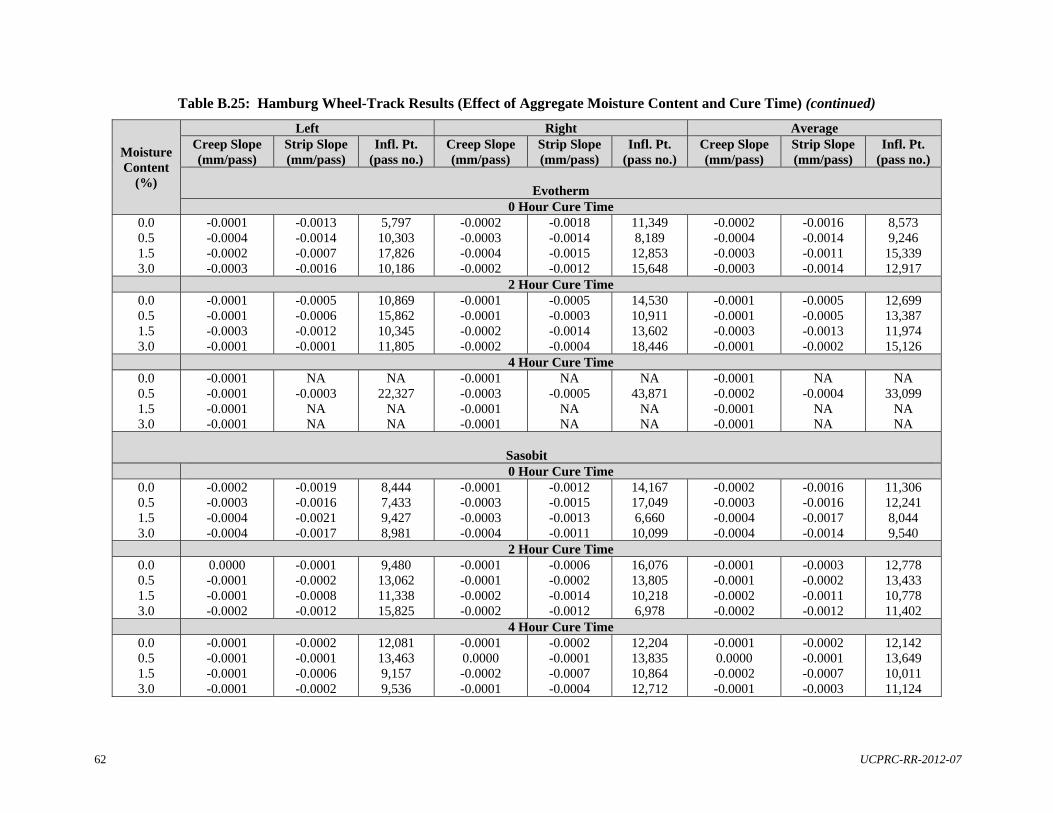
62 UCPRC-RR-2012-07
Table B.25: Hamburg Wheel-Track Results (Effect of Aggregate Moisture Content and Cure Time) (continued)
Moisture Content
(%)
Left Right Average Creep Slope (mm/pass)
Strip Slope (mm/pass)
Infl. Pt. (pass no.)
Creep Slope (mm/pass)
Strip Slope (mm/pass)
Infl. Pt. (pass no.)
Creep Slope (mm/pass)
Strip Slope (mm/pass)
Infl. Pt. (pass no.)
Evotherm
0 Hour Cure Time 0.0 0.5 1.5 3.0
-0.0001 -0.0004 -0.0002 -0.0003
-0.0013 -0.0014 -0.0007 -0.0016
5,797 10,303 17,826 10,186
-0.0002 -0.0003 -0.0004 -0.0002
-0.0018 -0.0014 -0.0015 -0.0012
11,349 8,189 12,853 15,648
-0.0002 -0.0004 -0.0003 -0.0003
-0.0016 -0.0014 -0.0011 -0.0014
8,573 9,246 15,339 12,917
2 Hour Cure Time 0.0 0.5 1.5 3.0
-0.0001 -0.0001 -0.0003 -0.0001
-0.0005 -0.0006 -0.0012 -0.0001
10,869 15,862 10,345 11,805
-0.0001 -0.0001 -0.0002 -0.0002
-0.0005 -0.0003 -0.0014 -0.0004
14,530 10,911 13,602 18,446
-0.0001 -0.0001 -0.0003 -0.0001
-0.0005 -0.0005 -0.0013 -0.0002
12,699 13,387 11,974 15,126
4 Hour Cure Time 0.0 0.5 1.5 3.0
-0.0001 -0.0001 -0.0001 -0.0001
NA -0.0003
NA NA
NA 22,327
NA NA
-0.0001 -0.0003 -0.0001 -0.0001
NA -0.0005
NA NA
NA 43,871
NA NA
-0.0001 -0.0002 -0.0001 -0.0001
NA -0.0004
NA NA
NA 33,099
NA NA
Sasobit 0 Hour Cure Time
0.0 0.5 1.5 3.0
-0.0002 -0.0003 -0.0004 -0.0004
-0.0019 -0.0016 -0.0021 -0.0017
8,444 7,433 9,427 8,981
-0.0001 -0.0003 -0.0003 -0.0004
-0.0012 -0.0015 -0.0013 -0.0011
14,167 17,049 6,660 10,099
-0.0002 -0.0003 -0.0004 -0.0004
-0.0016 -0.0016 -0.0017 -0.0014
11,306 12,241 8,044 9,540
2 Hour Cure Time 0.0 0.5 1.5 3.0
0.0000 -0.0001 -0.0001 -0.0002
-0.0001 -0.0002 -0.0008 -0.0012
9,480 13,062 11,338 15,825
-0.0001 -0.0001 -0.0002 -0.0002
-0.0006 -0.0002 -0.0014 -0.0012
16,076 13,805 10,218 6,978
-0.0001 -0.0001 -0.0002 -0.0002
-0.0003 -0.0002 -0.0011 -0.0012
12,778 13,433 10,778 11,402
4 Hour Cure Time 0.0 0.5 1.5 3.0
-0.0001 -0.0001 -0.0001 -0.0001
-0.0002 -0.0001 -0.0006 -0.0002
12,081 13,463 9,157 9,536
-0.0001 0.0000 -0.0002 -0.0001
-0.0002 -0.0001 -0.0007 -0.0004
12,204 13,835 10,864 12,712
-0.0001 0.0000 -0.0002 -0.0001
-0.0002 -0.0001 -0.0007 -0.0003
12,142 13,649 10,011 11,124
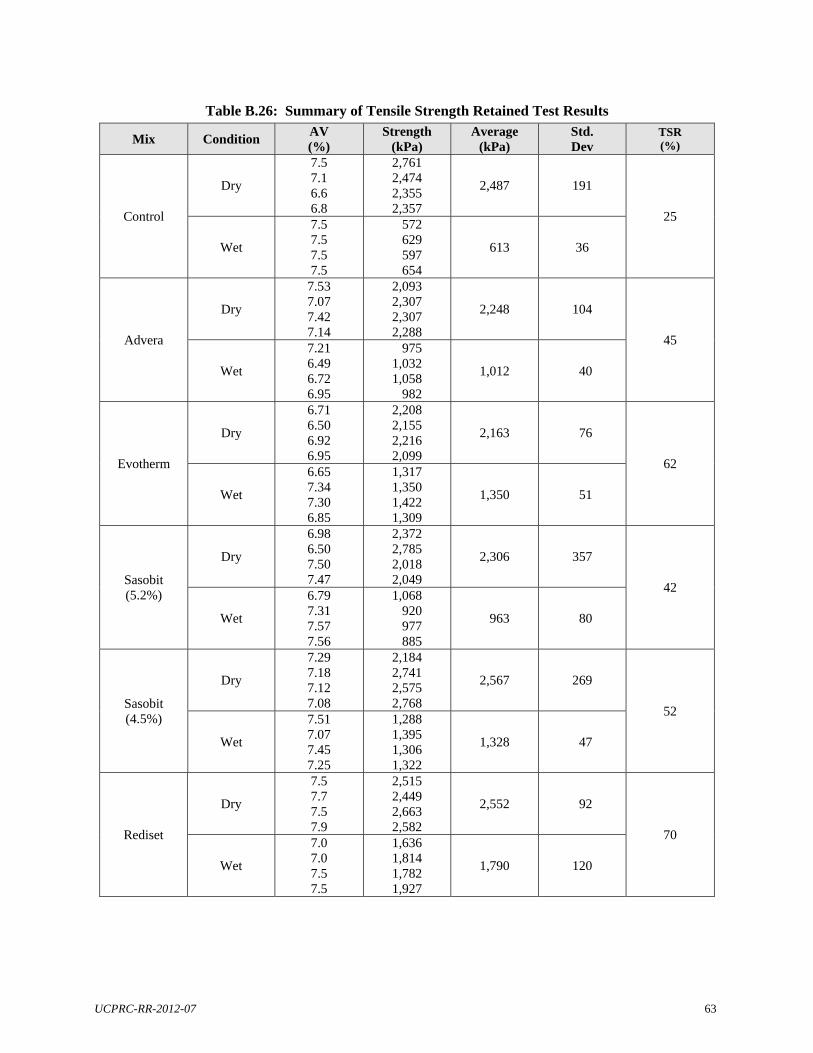
UCPRC-RR-2012-07 63
Table B.26: Summary of Tensile Strength Retained Test Results
Mix Condition AV (%)
Strength (kPa)
Average (kPa)
Std. Dev
TSR (%)
Control
Dry
7.5 7.1 6.6 6.8
2,761 2,474 2,355 2,357
2,487 191
25
Wet
7.5 7.5 7.5 7.5
572 629 597 654
613 36
Advera
Dry
7.53 7.07 7.42 7.14
2,093 2,307 2,307 2,288
2,248 104
45
Wet
7.21 6.49 6.72 6.95
975 1,032 1,058 982
1,012 40
Evotherm
Dry
6.71 6.50 6.92 6.95
2,208 2,155 2,216 2,099
2,163 76
62
Wet
6.65 7.34 7.30 6.85
1,317 1,350 1,422 1,309
1,350 51
Sasobit (5.2%)
Dry
6.98 6.50 7.50 7.47
2,372 2,785 2,018 2,049
2,306 357
42
Wet
6.79 7.31 7.57 7.56
1,068 920 977 885
963 80
Sasobit (4.5%)
Dry
7.29 7.18 7.12 7.08
2,184 2,741 2,575 2,768
2,567 269
52
Wet
7.51 7.07 7.45 7.25
1,288 1,395 1,306 1,322
1,328 47
Rediset
Dry
7.5 7.7 7.5 7.9
2,515 2,449 2,663 2,582
2,552 92
70
Wet
7.0 7.0 7.5 7.5
1,636 1,814 1,782 1,927
1,790 120
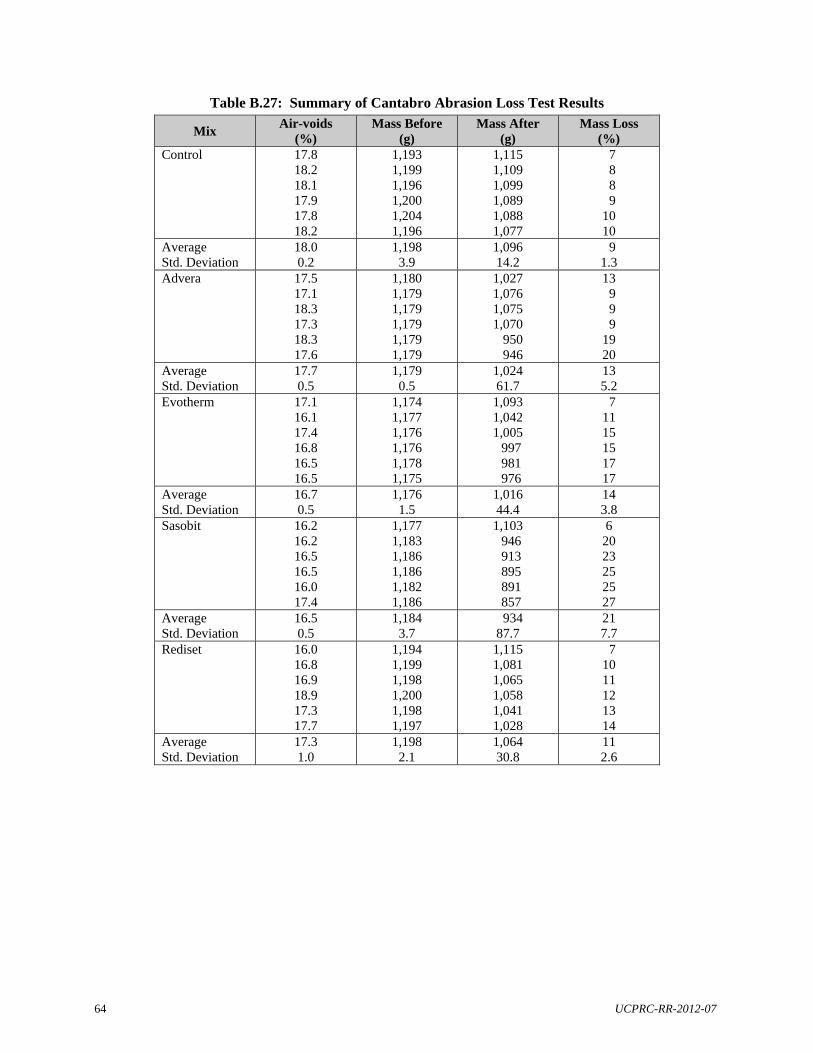
64 UCPRC-RR-2012-07
Table B.27: Summary of Cantabro Abrasion Loss Test Results
Mix Air-voids
(%) Mass Before
(g) Mass After
(g) Mass Loss
(%) Control 17.8
18.2 18.1 17.9 17.8 18.2
1,193 1,199 1,196 1,200 1,204 1,196
1,115 1,109 1,099 1,089 1,088 1,077
7 8 8 9 10 10
Average Std. Deviation
18.0 0.2
1,198 3.9
1,096 14.2
9 1.3
Advera 17.5 17.1 18.3 17.3 18.3 17.6
1,180 1,179 1,179 1,179 1,179 1,179
1,027 1,076 1,075 1,070 950 946
13 9 9 9 19 20
Average Std. Deviation
17.7 0.5
1,179 0.5
1,024 61.7
13 5.2
Evotherm 17.1 16.1 17.4 16.8 16.5 16.5
1,174 1,177 1,176 1,176 1,178 1,175
1,093 1,042 1,005 997 981 976
7 11 15 15 17 17
Average Std. Deviation
16.7 0.5
1,176 1.5
1,016 44.4
14 3.8
Sasobit 16.2 16.2 16.5 16.5 16.0 17.4
1,177 1,183 1,186 1,186 1,182 1,186
1,103 946 913 895 891 857
6 20 23 25 25 27
Average Std. Deviation
16.5 0.5
1,184 3.7
934 87.7
21 7.7
Rediset 16.0 16.8 16.9 18.9 17.3 17.7
1,194 1,199 1,198 1,200 1,198 1,197
1,115 1,081 1,065 1,058 1,041 1,028
7 10 11 12 13 14
Average Std. Deviation
17.3 1.0
1,198 2.1
1,064 30.8
11 2.6

UCPRC-RR-2012-07 65
Blank page