field performance of warm mix asphalt technologies
TRANSCRIPT
DETAILS
Distribution, posting, or copying of this PDF is strictly prohibited without written permission of the National Academies Press. (Request Permission) Unless otherwise indicated, all materials in this PDF are copyrighted by the National Academy of Sciences.
Copyright © National Academy of Sciences. All rights reserved.
THE NATIONAL ACADEMIES PRESS
Visit the National Academies Press at NAP.edu and login or register to get:
– Access to free PDF downloads of thousands of scientific reports
– 10% off the price of print titles
– Email or social media notifications of new titles related to your interests
– Special offers and discounts
GET THIS BOOK
FIND RELATED TITLES
This PDF is available at SHARE
CONTRIBUTORS
SUGGESTED CITATION
http://nap.edu/22272
Field Performance of Warm Mix Asphalt Technologies (2014)
240 pages | 8.5 x 11 | PAPERBACKISBN 978-0-309-30803-8 | DOI 10.17226/22272
National Academies of Sciences, Engineering, and Medicine 2014. FieldPerformance of Warm Mix Asphalt Technologies. Washington, DC: The NationalAcademies Press. https://doi.org/10.17226/22272.
Field Performance of Warm Mix Asphalt Technologies
Copyright National Academy of Sciences. All rights reserved.
N A T I O N A L C O O P E R A T I V E H I G H W A Y R E S E A R C H P R O G R A M
NCHRP REPORT 779
Field Performance of Warm Mix Asphalt Technologies
Randy WestCarolina Rodezno
Grant JulianNatioNal CeNter for asphalt teChNology
Auburn, AL
a n d
Brian ProwelladvaNCed Materials serviCes, llC
Auburn, AL
Bob FrankCoMpliaNCe MoNitoriNg serviCe
Linwood, NJ
Linda V. OsbornTony Kriech
heritage researCh group
Indianapolis, IN
Subscriber Categories
Construction • Environment • Materials
TRANSPORTAT ION RESEARCH BOARDWASHINGTON, D.C.
2014www.TRB.org
Research sponsored by the American Association of State Highway and Transportation Officials in cooperation with the Federal Highway Administration
Field Performance of Warm Mix Asphalt Technologies
Copyright National Academy of Sciences. All rights reserved.
NATIONAL COOPERATIVE HIGHWAY RESEARCH PROGRAM
Systematic, well-designed research provides the most effective
approach to the solution of many problems facing highway
administrators and engineers. Often, highway problems are of local
interest and can best be studied by highway departments individually
or in cooperation with their state universities and others. However, the
accelerating growth of highway transportation develops increasingly
complex problems of wide interest to highway authorities. These
problems are best studied through a coordinated program of
cooperative research.
In recognition of these needs, the highway administrators of the
American Association of State Highway and Transportation Officials
initiated in 1962 an objective national highway research program
employing modern scientific techniques. This program is supported on
a continuing basis by funds from participating member states of the
Association and it receives the full cooperation and support of the
Federal Highway Administration, United States Department of
Transportation.
The Transportation Research Board of the National Academies was
requested by the Association to administer the research program
because of the Board’s recognized objectivity and understanding of
modern research practices. The Board is uniquely suited for this
purpose as it maintains an extensive committee structure from which
authorities on any highway transportation subject may be drawn; it
possesses avenues of communications and cooperation with federal,
state and local governmental agencies, universities, and industry; its
relationship to the National Research Council is an insurance of
objectivity; it maintains a full-time research correlation staff of specialists
in highway transportation matters to bring the findings of research
directly to those who are in a position to use them.
The program is developed on the basis of research needs identified
by chief administrators of the highway and transportation departments
and by committees of AASHTO. Each year, specific areas of research
needs to be included in the program are proposed to the National
Research Council and the Board by the American Association of State
Highway and Transportation Officials. Research projects to fulfill these
needs are defined by the Board, and qualified research agencies are
selected from those that have submitted proposals. Administration and
surveillance of research contracts are the responsibilities of the National
Research Council and the Transportation Research Board.
The needs for highway research are many, and the National
Cooperative Highway Research Program can make significant
contributions to the solution of highway transportation problems of
mutual concern to many responsible groups. The program, however, is
intended to complement rather than to substitute for or duplicate other
highway research programs.
Published reports of the
NATIONAL COOPERATIVE HIGHWAY RESEARCH PROGRAM
are available from:
Transportation Research BoardBusiness Office500 Fifth Street, NWWashington, DC 20001
and can be ordered through the Internet at:
http://www.national-academies.org/trb/bookstore
Printed in the United States of America
NCHRP REPORT 779
Project 9-47A ISSN 0077-5614 ISBN 978-0-309-30803-8 Library of Congress Control Number 2014949286
© 2014 National Academy of Sciences. All rights reserved.
COPYRIGHT INFORMATION
Authors herein are responsible for the authenticity of their materials and for obtaining written permissions from publishers or persons who own the copyright to any previously published or copyrighted material used herein.
Cooperative Research Programs (CRP) grants permission to reproduce material in this publication for classroom and not-for-profit purposes. Permission is given with the understanding that none of the material will be used to imply TRB, AASHTO, FAA, FHWA, FMCSA, FTA, or Transit Development Corporation endorsement of a particular product, method, or practice. It is expected that those reproducing the material in this document for educational and not-for-profit uses will give appropriate acknowledgment of the source of any reprinted or reproduced material. For other uses of the material, request permission from CRP.
NOTICE
The project that is the subject of this report was a part of the National Cooperative Highway Research Program, conducted by the Transportation Research Board with the approval of the Governing Board of the National Research Council.
The members of the technical panel selected to monitor this project and to review this report were chosen for their special competencies and with regard for appropriate balance. The report was reviewed by the technical panel and accepted for publication according to procedures established and overseen by the Transportation Research Board and approved by the Governing Board of the National Research Council.
The opinions and conclusions expressed or implied in this report are those of the researchers who performed the research and are not necessarily those of the Transportation Research Board, the National Research Council, or the program sponsors.
The Transportation Research Board of the National Academies, the National Research Council, and the sponsors of the National Cooperative Highway Research Program do not endorse products or manufacturers. Trade or manufacturers’ names appear herein solely because they are considered essential to the object of the report.
Field Performance of Warm Mix Asphalt Technologies
Copyright National Academy of Sciences. All rights reserved.
The National Academy of Sciences is a private, nonprofit, self-perpetuating society of distinguished scholars engaged in scientific
and engineering research, dedicated to the furtherance of science and technology and to their use for the general welfare. Upon the
authority of the charter granted to it by the Congress in 1863, the Academy has a mandate that requires it to advise the federal
government on scientific and technical matters. Dr. Ralph J. Cicerone is president of the National Academy of Sciences.
The National Academy of Engineering was established in 1964, under the charter of the National Academy of Sciences, as a parallel
organization of outstanding engineers. It is autonomous in its administration and in the selection of its members, sharing with the
National Academy of Sciences the responsibility for advising the federal government. The National Academy of Engineering also
sponsors engineering programs aimed at meeting national needs, encourages education and research, and recognizes the superior
achievements of engineers. Dr. C. D. Mote, Jr., is president of the National Academy of Engineering.
The Institute of Medicine was established in 1970 by the National Academy of Sciences to secure the services of eminent members
of appropriate professions in the examination of policy matters pertaining to the health of the public. The Institute acts under the
responsibility given to the National Academy of Sciences by its congressional charter to be an adviser to the federal government
and, upon its own initiative, to identify issues of medical care, research, and education. Dr. Victor J. Dzau is president of the
Institute of Medicine.
The National Research Council was organized by the National Academy of Sciences in 1916 to associate the broad community of
science and technology with the Academy’s purposes of furthering knowledge and advising the federal government. Functioning in
accordance with general policies determined by the Academy, the Council has become the principal operating agency of both the
National Academy of Sciences and the National Academy of Engineering in providing services to the government, the public, and
the scientific and engineering communities. The Council is administered jointly by both Academies and the Institute of Medicine.
Dr. Ralph J. Cicerone and Dr. C. D. Mote, Jr., are chair and vice chair, respectively, of the National Research Council.
The Transportation Research Board is one of six major divisions of the National Research Council. The mission of the Transporta-
tion Research Board is to provide leadership in transportation innovation and progress through research and information exchange,
conducted within a setting that is objective, interdisciplinary, and multimodal. The Board’s varied activities annually engage about
7,000 engineers, scientists, and other transportation researchers and practitioners from the public and private sectors and academia,
all of whom contribute their expertise in the public interest. The program is supported by state transportation departments, federal
agencies including the component administrations of the U.S. Department of Transportation, and other organizations and individu-
als interested in the development of transportation. www.TRB.org
www.national-academies.org
Field Performance of Warm Mix Asphalt Technologies
Copyright National Academy of Sciences. All rights reserved.
C O O P E R A T I V E R E S E A R C H P R O G R A M S
CRP STAFF FOR NCHRP REPORT 779
Christopher W. Jenks, Director, Cooperative Research ProgramsChristopher Hedges, Manager, National Cooperative Highway Research ProgramEdward T. Harrigan, Senior Program OfficerAnthony P. Avery, Senior Program AssistantEileen P. Delaney, Director of PublicationsSharon Lamberton, Editor
NCHRP PROJECT 9-47A PANELField of Materials and Construction—Area of Bituminous Minerals
Bouzid Choubane, Florida DOT, Gainesville, FL (Chair)Kim A. Willoughby, Washington State DOT, Olympia, WA Cathrina Barros, California DOT, Sacramento, CA German Claros, Rodriguez Engineering, Houston, TX Colin Franco, Rhode Island DOT, Providence, RI Kim J. Jenkins, University of Stellenbosch, Matieland, South Africa Julie E. Kliewer, Arizona DOT, Phoenix, AZ Howard S. Marks, National Asphalt Pavement Association, Lanham, MD Jorge A. Prozzi, University of Texas–Austin, Austin, TX Ronald A. Sines, Oldcastle Materials, Leominster, MA Matthew Corrigan, FHWA Liaison Nelson H. Gibson, FHWA Liaison Frederick Hejl, TRB Liaison
Field Performance of Warm Mix Asphalt Technologies
Copyright National Academy of Sciences. All rights reserved.
F O R E W O R D
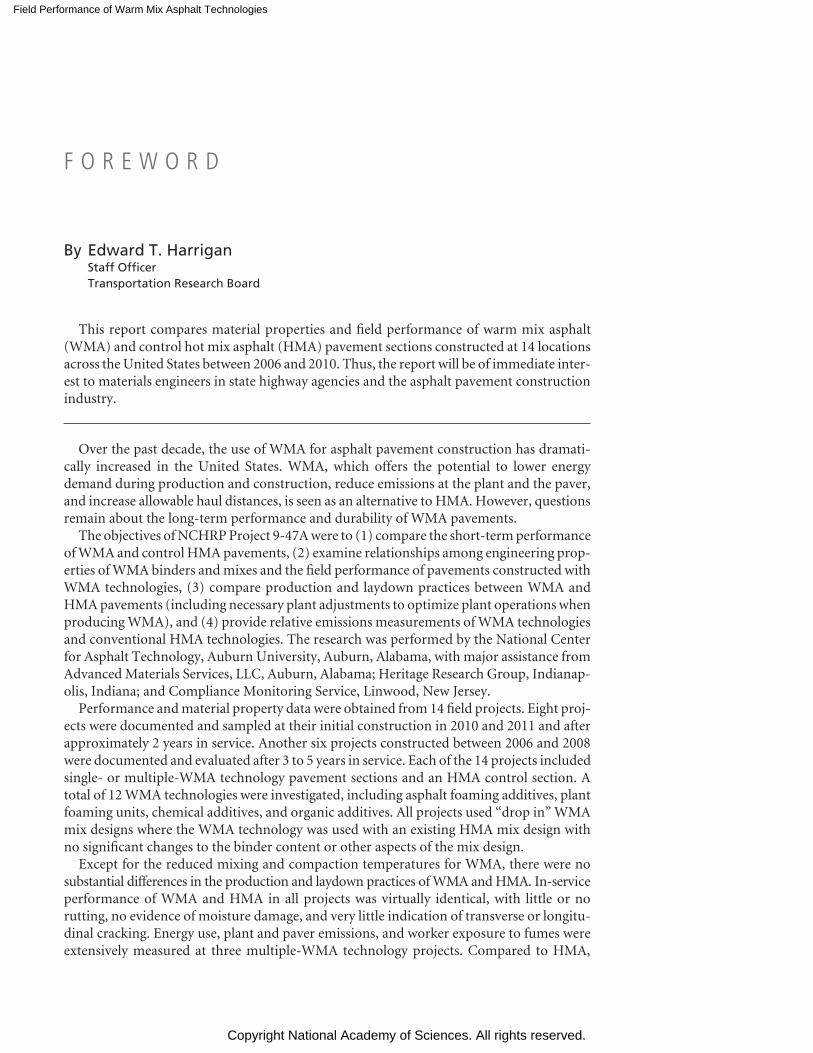
This report compares material properties and field performance of warm mix asphalt (WMA) and control hot mix asphalt (HMA) pavement sections constructed at 14 locations across the United States between 2006 and 2010. Thus, the report will be of immediate inter-est to materials engineers in state highway agencies and the asphalt pavement construction industry.
Over the past decade, the use of WMA for asphalt pavement construction has dramati-cally increased in the United States. WMA, which offers the potential to lower energy demand during production and construction, reduce emissions at the plant and the paver, and increase allowable haul distances, is seen as an alternative to HMA. However, questions remain about the long-term performance and durability of WMA pavements.
The objectives of NCHRP Project 9-47A were to (1) compare the short-term performance of WMA and control HMA pavements, (2) examine relationships among engineering prop-erties of WMA binders and mixes and the field performance of pavements constructed with WMA technologies, (3) compare production and laydown practices between WMA and HMA pavements (including necessary plant adjustments to optimize plant operations when producing WMA), and (4) provide relative emissions measurements of WMA technologies and conventional HMA technologies. The research was performed by the National Center for Asphalt Technology, Auburn University, Auburn, Alabama, with major assistance from Advanced Materials Services, LLC, Auburn, Alabama; Heritage Research Group, Indianap-olis, Indiana; and Compliance Monitoring Service, Linwood, New Jersey.
Performance and material property data were obtained from 14 field projects. Eight proj-ects were documented and sampled at their initial construction in 2010 and 2011 and after approximately 2 years in service. Another six projects constructed between 2006 and 2008 were documented and evaluated after 3 to 5 years in service. Each of the 14 projects included single- or multiple-WMA technology pavement sections and an HMA control section. A total of 12 WMA technologies were investigated, including asphalt foaming additives, plant foaming units, chemical additives, and organic additives. All projects used “drop in” WMA mix designs where the WMA technology was used with an existing HMA mix design with no significant changes to the binder content or other aspects of the mix design.
Except for the reduced mixing and compaction temperatures for WMA, there were no substantial differences in the production and laydown practices of WMA and HMA. In-service performance of WMA and HMA in all projects was virtually identical, with little or no rutting, no evidence of moisture damage, and very little indication of transverse or longitu-dinal cracking. Energy use, plant and paver emissions, and worker exposure to fumes were extensively measured at three multiple-WMA technology projects. Compared to HMA,
By Edward T. HarriganStaff OfficerTransportation Research Board
Field Performance of Warm Mix Asphalt Technologies
Copyright National Academy of Sciences. All rights reserved.
the reduced temperatures used in WMA production and laydown yielded lower energy consumption and emissions and reduced worker exposure to respirable fumes. Overall, then, no penalties and some potential benefits were observed in the short term when WMA replaced HMA.
The key finding of laboratory testing of WMA binders and mixtures from the projects sampled at construction was the expected lower stiffness of the WMA materials that would have potential effects on pavement rutting and cracking. However, the equivalent perfor-mance of the WMA and HMA pavement sections over several years of service suggests that these differences in material properties, when present, were not great enough to affect the relative performances of HMA and WMA.
This report fully documents the research in two parts bound in one report. Part 1 includes an appendix on Falling Weight Deflectometer Testing; Part 2 includes an appendix on Documenting Emissions and Energy Reductions of WMA and Conventional HMA During Plant and Paving Operations.
Field Performance of Warm Mix Asphalt Technologies
Copyright National Academy of Sciences. All rights reserved.
C O N T E N T S
P A R T 1 Engineering Properties and Field Performance of Warm Mix Asphalt Technologies
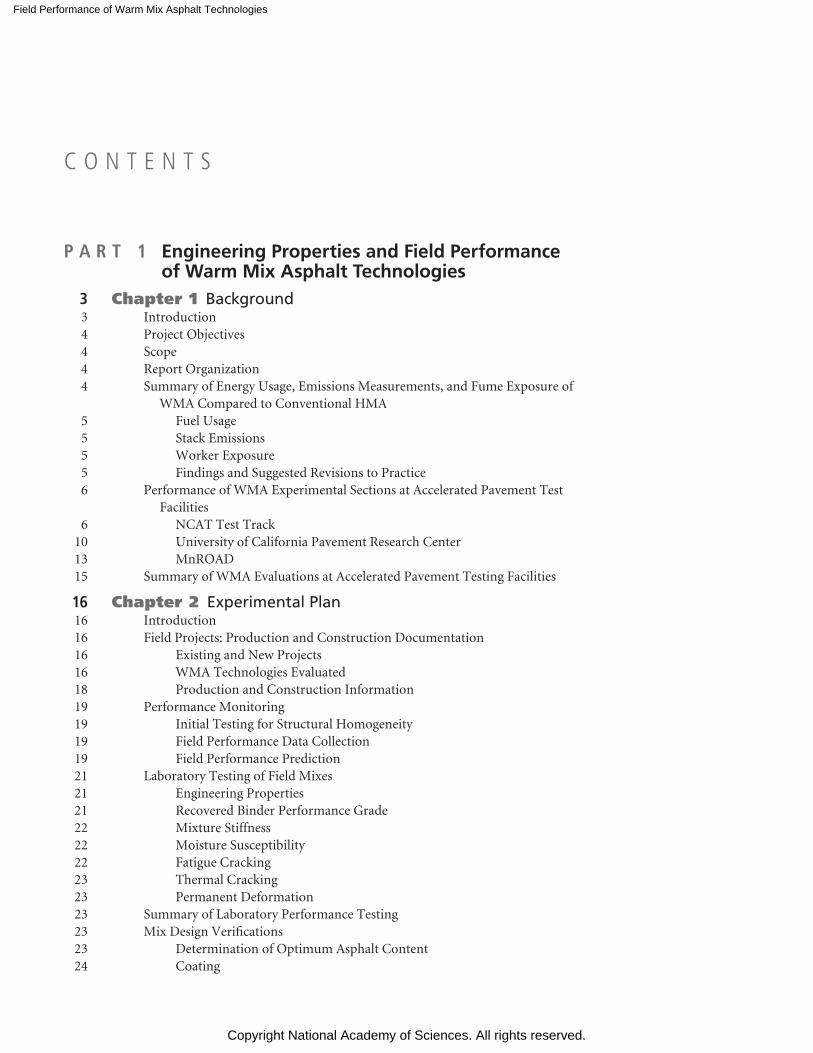
3 Chapter 1 Background 3 Introduction 4 Project Objectives 4 Scope 4 Report Organization 4 Summary of Energy Usage, Emissions Measurements, and Fume Exposure of
WMA Compared to Conventional HMA 5 Fuel Usage 5 Stack Emissions 5 Worker Exposure 5 Findings and Suggested Revisions to Practice 6 Performance of WMA Experimental Sections at Accelerated Pavement Test
Facilities 6 NCAT Test Track 10 University of California Pavement Research Center 13 MnROAD 15 Summary of WMA Evaluations at Accelerated Pavement Testing Facilities
16 Chapter 2 Experimental Plan 16 Introduction 16 Field Projects: Production and Construction Documentation 16 Existing and New Projects 16 WMA Technologies Evaluated 18 Production and Construction Information 19 Performance Monitoring 19 Initial Testing for Structural Homogeneity 19 Field Performance Data Collection 19 Field Performance Prediction 21 Laboratory Testing of Field Mixes 21 Engineering Properties 21 Recovered Binder Performance Grade 22 Mixture Stiffness 22 Moisture Susceptibility 22 Fatigue Cracking 23 Thermal Cracking 23 Permanent Deformation 23 Summary of Laboratory Performance Testing 23 Mix Design Verifications 23 Determination of Optimum Asphalt Content 24 Coating
Field Performance of Warm Mix Asphalt Technologies
Copyright National Academy of Sciences. All rights reserved.
25 Compactability 25 Moisture Susceptibility 25 Rutting Resistance 25 Summary Comparisons
26 Chapter 3 WMA Field Projects 26 Existing Projects 26 St. Louis, Missouri 30 Iron Mountain, Michigan 34 Silverthorne, Colorado 39 Franklin, Tennessee 45 Graham, Texas 49 George, Washington 54 New Projects 54 Walla Walla, Washington 62 Centreville, Virginia 69 Rapid River, Michigan 77 Baker, Montana 84 Munster, Indiana 95 Jefferson County, Florida 102 New York, New York 110 Casa Grande, Arizona 118 Comparison of Observed and Predicted Performance of WMA and HMA for
New Projects 118 Rutting 120 Longitudinal, Top-Down Cracking 121 Thermal Cracking 122 Summary of Performance Prediction Comparisons 122 Practical Guidelines for Production and Placement of WMA 122 Stockpile Moisture Content 122 Maintaining Adequate Baghouse Temperatures 124 Burner Performance 124 Producing Mixes with RAP and RAS 124 Placement Changes 125 Compaction
126 Chapter 4 Engineering Properties of HMA and WMA 126 Binder Properties 131 Mixture Properties 131 Mix Moisture Contents 131 Densities 136 Binder Absorption 138 Dynamic Modulus 146 Flow Number 146 Tensile Strength 151 Tensile Strength Ratio 153 Hamburg Wheel Tracking Test 156 Fatigue 161 Indirect Tension Compliance and Strength 161 Comparison of Lab Test Results and Field Performance 162 Rutting 163 Moisture Damage
Field Performance of Warm Mix Asphalt Technologies
Copyright National Academy of Sciences. All rights reserved.
164 Fatigue Cracking 166 Low Temperature Cracking
168 Chapter 5 WMA Project Mix Verification 168 Determination of Optimum Asphalt Content 168 Rapid River, Michigan 168 Baker, Montana 168 Munster, Indiana 169 New York, New York 173 Jefferson County, Florida 173 Summary Comparisons 176 Coating 178 Compactability 178 Moisture Susceptibility 179 Flow Number Test 180 Proposed Revisions to the Draft Appendix to AASHTO R 35
185 Chapter 6 Cost Analysis of WMA
188 Chapter 7 Findings 188 Production and Construction of WMA 188 Energy and Emissions 189 Short-Term WMA Field Performance 189 Engineering Properties of WMA 190 Predicted Performance 191 Mix Design Verification 191 Suggestions for Modifying Practice 191 Mix Design 191 Production 191 Other Research
192 References
194 Appendix Falling Weight Deflectometer Testing
P A R T 2 Effects of WMA on Plant Energy and Emissions and Worker Exposures to Respirable Fumes
205 Chapter 1 Background and Problem Statement 205 Experimental Plan
207 Chapter 2 Energy Usage 207 Background on Energy Used to Produce HMA and WMA 209 Research Approach 210 Results and Discussion 210 Fuel Savings 210 Distribution of Fuel Savings 213 Comparison of Measured and Predicted Fuel Savings 213 Influence of Aggregate Moisture Content 215 Summary 215 Recommendations
Field Performance of Warm Mix Asphalt Technologies
Copyright National Academy of Sciences. All rights reserved.
216 Chapter 3 Stack Emissions 216 Reported Emissions Reductions from WMA 216 Research Approach 217 Results and Discussion 217 Carbon Dioxide 217 Carbon Monoxide and Volatile Organic Compounds 220 Sulfur Dioxide 221 Nitrogen Oxides 221 Formaldehyde 221 PM-10 223 Summary 223 Recommendations
224 Chapter 4 Worker Exposure 224 Background 225 Research Approach 225 Study Population 225 Study Design 225 Collection and Analysis of Breathing Zone Samples 226 Results 231 Discussion 232 Summary
233 Chapter 5 Findings and Conclusions 233 Findings 233 Fuel Usage 233 Stack Emissions 234 Worker Exposure 234 Conclusions
235 References
237 Appendix Documenting Emissions and Energy Reductions of WMA and Conventional HMA During Plant and Paving Operations
Field Performance of Warm Mix Asphalt Technologies
Copyright National Academy of Sciences. All rights reserved.
Engineering Properties and Field Performance of Warm Mix Asphalt Technologies
P A R T 1
Field Performance of Warm Mix Asphalt Technologies
Copyright National Academy of Sciences. All rights reserved.
3
Recent surveys show that the use of warm mix asphalt (WMA) continues to expand in the United States because of its environ-mental benefits, energy savings, and construction advantages. In at least eight states, WMA technologies are used to produce more than half of all asphalt paving mixtures (1). However, as WMA moves into mainstream use, one of the obstacles to implementation is uncertainty about how WMA may affect short- and long-term field performance. Given that asphalt binders may harden less at the lower production temperatures used with WMA, there has been some concern that WMA pave-ments may have a greater potential for rutting. There has also been concern about WMA pavements being more susceptible to moisture damage. Furthermore, a better understanding of how WMA affects engineering properties of asphalt mixtures and how those properties relate to field performance is needed to facilitate the implementation of this technology.
Introduction
Attention to the impact of human activities on the envi-ronment has increased around the world. An outgrowth of this interest was the Kyoto Protocol that challenged nations to reduce their collective emissions of six greenhouse gases by 5.2% of 1990 levels, with the majority of this decrease expected to come from manufacturing. In many parts of the world, the asphalt paving industry has begun to use WMA in lieu of hot mix asphalt (HMA) to reduce greenhouse gases emitted during asphalt paving operations.
The primary difference between WMA and HMA is the temperature at which it is produced. The production tempera ture of WMA is typically 25°F to 90°F (14°C to 50°C) below that of HMA. The actual temperature reduction depends upon the warm mix technology used.
Development of the first WMA technologies began in Europe, where WMA use has remained limited for the past decade. In 2002, representatives from the United States asphalt paving industry traveled to Europe to learn about Europeans’ advance-
ments in the area of WMA. The first documented WMA pave-ment in the United States was constructed in 2004, and since then, several hundred field trials have been completed.
WMA technologies allow the complete coating of aggre-gates, placement, and compaction at lower temperatures than conventional HMA. Although the reduction in temperature varies by technology, WMA is generally produced at tempera-tures ranging from 25°F lower than HMA to the boiling point of water (212°F). Simply put, WMA technologies are aids to workability and compaction.
Currently, there are three categories of WMA technolo-gies: asphalt foaming technologies, organic additives, and chemical additives. A fourth category, referred to as hybrids, utilizes combinations of the other categories. The asphalt foaming technologies include a variety of processes to foam asphalt, including water-injecting systems, damp aggregate, or the addition of a hydrophilic material such as a zeolite. In the asphalt plant, the water turns to steam, disperses throughout the asphalt, and expands the binder, providing a correspond-ing temporary increase in volume and fluids content, similar in effect to increasing the binder content. Available chemi-cal additives often include surfactants that aid in coating and lubrication of the asphalt binder in the mixture. The organic additives are typically special types of waxes that cause a decrease in binder viscosity above the melting point of the wax. Therefore, wax properties are carefully selected based on the planned in-service temperatures. Approximately 30 WMA technologies are currently marketed in the United States.
Benefits of WMA may include reduced emissions, reduced fuel usage, reduced binder oxidation, and paving benefits such as the potential for increased densities, less binder aging, cool-weather paving, longer haul distances, and improved working conditions for the paving crew. These purported benefits need to be better documented. Although most aspects of designing and constructing WMA are similar to those of HMA, lower production temperatures and changes in binder characteristics associated with WMA could result
C H A P T E R 1
Background
Field Performance of Warm Mix Asphalt Technologies
Copyright National Academy of Sciences. All rights reserved.
4
in differences in pavement performance relative to HMA. Reduced oxidation of the binder may improve the cracking resistance of a pavement but may reduce its moisture and rut-ting resistance. Reduced oxidation and better compactabil-ity of WMA may allow for higher percentages of reclaimed asphalt pavement (RAP); however, the lower mixing temper-atures may not facilitate the initial extent of blending of the aged and virgin binder typically seen with HMA.
The two primary concerns associated with WMA are the potential for rutting and moisture damage. Because the mix-ing and compaction temperatures are lower than those of HMA, the binder experiences less aging and can be less stiff and potentially more prone to rutting. Moisture suscepti-bility is a concern with WMA because the aggregates are not exposed to the higher mixing temperatures associated with HMA and, therefore, may not be dried completely. In addi-tion, binders are less oxidized during the mix production pro-cess, and softer binders can be more susceptible to moisture damage susceptibility (2).
Evidence of the environmental benefits of WMA also needs to be better documented. If WMA is demonstrated to reduce fuel consumption and stack emissions while facilitating higher RAP and reclaimed asphalt shingle contents (RAS), then the use of WMA would be a significant step toward sustainable development for highway agencies and industry. Reduction of emissions other than carbon dioxide (CO2) may also assist in compliance in non-attainment areas. Addition-ally, the use of WMA could further reduce the exposure of workers to asphalt fumes.
Project Objectives
NCHRP Project 9-47A had four primary objectives:
1. Establish relationships between laboratory-measured engi-neering properties of WMA mixes and the field perfor-mance of pavements constructed with WMA technologies.
2. Compare the relative measures of performance between WMA and conventional HMA pavements.
3. Compare production and placement practices, and if pos-sible, costs between WMA and HMA pavements.
4. Provide relative energy usage, emissions measurements, and fume exposure of WMA compared to conventional HMA.
Scope
This research was divided into two phases. The first phase involved literature reviews on engineering properties of WMA mixtures, WMA mix design, production, environmental and emissions assessments, and field performance of WMA. From these reviews, a state-of-knowledge report on WMA was prepared. Phase 1 also included the development of experi-mental plans to accomplish the research objectives.
Phase 2 of the project involved executing the approved experimental plans to gather materials from WMA field proj-ects; evaluate the engineering properties of WMA and HMA; compare the early-life field performance of WMA and HMA; quantify energy, emissions, and health benefits associated with WMA; and validate the WMA mix design recommendations from NCHRP Project 9-43. NCHRP Report 779 details all the activities and analyses to accomplish these Phase 2 objectives.
Report Organization
NCHRP Report 779 has two parts. Part 1 includes the experiments related to the analysis of engineering properties of WMA compared to HMA and the early field performance of WMA and companion HMA test sections built across the United States. Chapter 1 introduces the report, presenting the objectives of the project, scope of work, and a summary of accelerated pavement testing of WMA pavement test sections. The experimental plans for laboratory and field testing are pre-sented in Chapter 2, which also contains the plans for perfor-mance monitoring and mix design verifications. Chapters 3, 4, and 5 present the results and analyses of laboratory test results and the field performance for each project. Chapter 5 also dis-cusses proposed revisions to the Draft Appendix to AASHTO R 35: Special Mixture Design Considerations and Methods for Warm-Mix Asphalt (WMA) that was developed in NCHRP Project 9-43. Chapter 6 provides a brief economic analysis of WMA, and Chapter 7 summarizes the project findings and presents suggestions for modifying current practice. Table and figure numbering is consecutive across chapters within each part and includes the part number in front (e.g., Table 1.1, Table 1.2, Figure 1.1, etc., in Part 1, and Table 2.1, Table 2.2, Figure 2.1, etc., in Part 2). The appendix to Part 1 presents information on falling weight deflectometer testing in Florida, Arizona, Indiana, Michigan, New York, and Montana.
Summary of Energy Usage, Emissions Measurements, and Fume Exposure of WMA Compared to Conventional HMA
Part 2 of NCHRP Report 779 details the testing, analysis, and findings associated with the experiments to assess energy savings, plant emissions, and health impacts to paving crews. For readers’ convenience, the main findings from Part 2 are summarized in this section of Part 1, Chapter 1.
Experiments conducted in this study to compare plant emissions during WMA production to those during HMA production included the following:
• Monitoring fuel usage for six projects consisting of the production of six HMA control mixtures and 11 WMA mixtures.
Field Performance of Warm Mix Asphalt Technologies
Copyright National Academy of Sciences. All rights reserved.
5
• Measuring plant stack emissions of duplicate production runs at three projects consisting of three HMA controls and eight WMA mixtures.
• Collecting worker exposures to respirable fumes over com-plete production days during two multi-technology proj-ects consisting of two HMA controls and six WMA mixes.
• Developing revised recommendations for monitoring fuel usage based on stack emission data to evaluate energy con-sumption during mix production.
• Reviewing and refining procedures for collecting and analyzing worker exposure to fumes during paving. The revised protocol is based on total organic matter (TOM) instead of benzene soluble fraction (BSF).
Fuel Usage
Analysis of fuel usage data revealed the importance of com-paring the energy consumption of different technologies, such as WMA to HMA, over similar, steady-state, time frames. His-torical fuel usage data typically available for HMA production includes fuel used for warm up, plant waste, and end-of-run cleanout. The data collected in the project experiments showed that an average reduction in mix temperature of 48°F resulted in average fuel savings of 22.1%. This was higher than predictions based on thermodynamic material properties. The increased fuel savings appear to be related to the fact that the heat radiated through the plant’s dryer shell and ductwork into the surrounding environment instead of being trans-ferred to the mix was actually larger than expected. Potential errors were identified for direct measures of fuel usage such as tank sticks and gas meter readings by comparing measured fuel usage to fuel usage calculated from stoichiometric plant stack emissions. Gas meters were found to update usage only after large time intervals, on the order of 30 minutes for some meters, inducing error. Recommended best practices for mix production include reducing aggregate moisture contents by sloping stockpile areas away from the plant, feeding the plant using dryer materials obtained from the high side of the stockpiles, and covering stockpiles with high fines contents. Significant fuel savings were demonstrated for one project with low stockpile moisture contents.
Stack Emissions
Emissions of greenhouse gases such as CO2 decreased with reduced fuel usage. Measurements of carbon monoxide (CO) and volatile organic compounds (VOC) appear to be more related to burner maintenance and tuning and less related to reductions in fuel usage and consequently the use of WMA. One project with a parallel-flow dryer, using reclaimed oil as fuel, indicated a reduction in VOC when producing WMA. Significant reductions in sulfur dioxide (SO2) were observed
for the same project. The two other projects used natural gas, which has a lower sulfur content, as fuel. Emissions of nitrous oxide (NOx), a precursor to the formation of ground-level ozone, are higher for fuel oils compared to natural gas. With one exception, small reductions in NOx were noted for WMA. For the exception, the burner was set at 26% of its fir-ing rate for the WMA compared to 75% for the correspond-ing HMA at the same production rate. This low firing rate may have resulted in more excess air than necessary for com-plete combustion, contributing to NOx formation. Formal-dehyde, classified as a hazardous air pollutant, is a byproduct of the combustion of carbon-based fuels. The distribution of formaldehyde measurements was lower for WMA than for HMA and comparable to state-of-the-art plant performance observed in the mid-Atlantic United States.
Worker Exposure
Worker exposure to asphalt fumes has typically been assessed by measuring the BSF of the fumes. In most studies comparing worker exposures between HMA and WMA, BSFs were below detectable limits. Thus quantitative comparisons could not be made. The researchers developed a new measure for this study based on TOM. Worker exposure was measured at two multi-technology sites. At one site, HMA temperatures behind the screed were cooler than normal for HMA and were actually within the expected temperature range for WMA. This resulted in a low temperature differential between the HMA and WMA (on average only 12°C different). At the other site, mat temperatures immediately behind the screed were, on average, 50°C cooler. With one exception, the WMA mixtures at both sites resulted in a minimum of 33% reduc-tion in TOM, the one exception being an 8.4% increase at the site where the HMA was placed near WMA temperatures. The TOM reduction was statistically significant at the 95% con-fidence level for five of six mixes. The asphalt binder at one site showed higher overall emissions in the temperature range typically associated with HMA production. The sample with the highest overall TOM from each mix/site combination was tested for polycyclic aromatic compounds (PAC). Naphtha-lene was detected in the highest concentrations. Only one non-carcinogenic 4-6 ring PAC, pyrene, was detected, and it was from an HMA sample. All of the nine PAC for asphalt reviewed by IARC (the International Agency for Research on Cancer) were below detectable limits.
Findings and Suggested Revisions to Practice
The use of WMA reduces fuel usage during mixture pro-duction. These reductions can help offset the cost of WMA technologies or equipment. Reductions in stack emissions of
Field Performance of Warm Mix Asphalt Technologies
Copyright National Academy of Sciences. All rights reserved.
6
greenhouse gases are consistent with reductions in fuel usage. Use of WMA should receive credit for reductions in green-house gases in life-cycle assessments. WMA also resulted in reductions in SO2 when using high sulfur fuels such as reclaimed oil.
Recommended revisions to the Test Framework for Doc-umenting Emissions and Energy Reductions of WMA and Conventional HMA (3) are:
• Corresponding WMA and HMA measurements should be made over similar time periods of steady-state production to compare fuel usage and stack emissions of WMA and HMA.
• Direct fuel measurements—tank sticks, fuel meter, or gas meter readings—should be supplemented with stoi-chiometric fuel measurements in accordance with EPA Method 19.
• TOM should replace BSF for quantitative comparison of WMA and HMA worker exposure.
Performance of WMA Experimental Sections at Accelerated Pavement Test Facilities
WMA has been evaluated at three noteworthy accelerated pavement test facilities in the United States: the National Center for Asphalt Technology (NCAT) Test Track, the Uni-versity of California Pavement Research Center (UCPRC), and MnROAD. This section provides a summary of the per-formance of the WMA experimental sections tested at these facilities.
NCAT Test Track
Since 2005, several WMA technologies have been evaluated at the NCAT Test Track. Experimental objectives have var-ied with the different evaluations. Test sections at the NCAT Test Track are 200 feet in length and are trafficked 16 hours per day in 2-year periods by five heavily loaded truck-trailer rigs. Axle loads on the trailers are set at 20,000 pounds, the maximum legal limit permitted on United States Interstate highways. Performance of test sections is closely monitored for distress. Some sections are also instrumented to measure the pavement’s response to loading and climatic changes. Details of the NCAT Test Track have been reported in earlier studies (4).
The first evaluation of a WMA technology on the test track occurred in the fall of 2005, when three temporary test sec-tions were constructed to evaluate the rutting performance of MeadWestvaco’s early Evotherm® ET technology (5). The test sections were built late in the second cycle of the test track, when previously constructed test sections from another experiment failed and repairs were necessary to safely and effi-
ciently complete the track’s operations. Two of the temporary test sections contained Evotherm ET in the intermediate pave-ment layers. The surface layers were 9.5 mm Superpave mixes, and the intermediate layers were 19.0 mm Superpave mixes. One of the three sections was a control section with an HMA surface layer (Section N2). The control section contained a PG 67-22 binder. Another section contained Evotherm ET in the surface layer (Section E9). The Evotherm ET technology was an emulsion-based system that is no longer marketed in the United States. The third section (Section N1) contained Evotherm ET and 3% SBR latex by weight of binder in the surface layer. The same mix design was used for each of the three surface mixes. The surface layers were constructed to be 1 in. thick.
The mixes were produced at an Astec Double Barrel® plant. The mixing temperature of the WMA mixes was 239°F (115°C), and the target compaction temperature was 225°F (107°C). However, equipment problems were encountered during paving the surface of section N1, so the WMA was kept in a silo for 17 hours. By the time it was placed, the mix had cooled to 205°F (96°C). Once paving was completed, images from an infrared camera showed that the WMA sec-tions had much less thermal segregation than did the HMA sections. Cores were used to determine in-place densities. Results showed that each of the surface layers had average densities between 92.1% and 93.4% of theoretical maximum specific gravity (Gmm), which indicated that Evotherm ET provided good compactability at significantly lower produc-tion and placement temperatures than conventional HMA.
The WMA placed in Section N1 was opened to traffic 1.75 hours after paving. After 43 days in service (to the end of the test cycle), the maximum rutting measured in any section was 1.1 mm. During the 43-day time span, 515,333 ESALs (equivalent single axle loads) were applied to the sections. The Evotherm test sections remained in service throughout the next cycle with no cracking and excellent rutting perfor-mance. Section E9 ultimately endured more than 16 million ESALs with only 4 mm of rutting before the test section was removed for a different experiment.
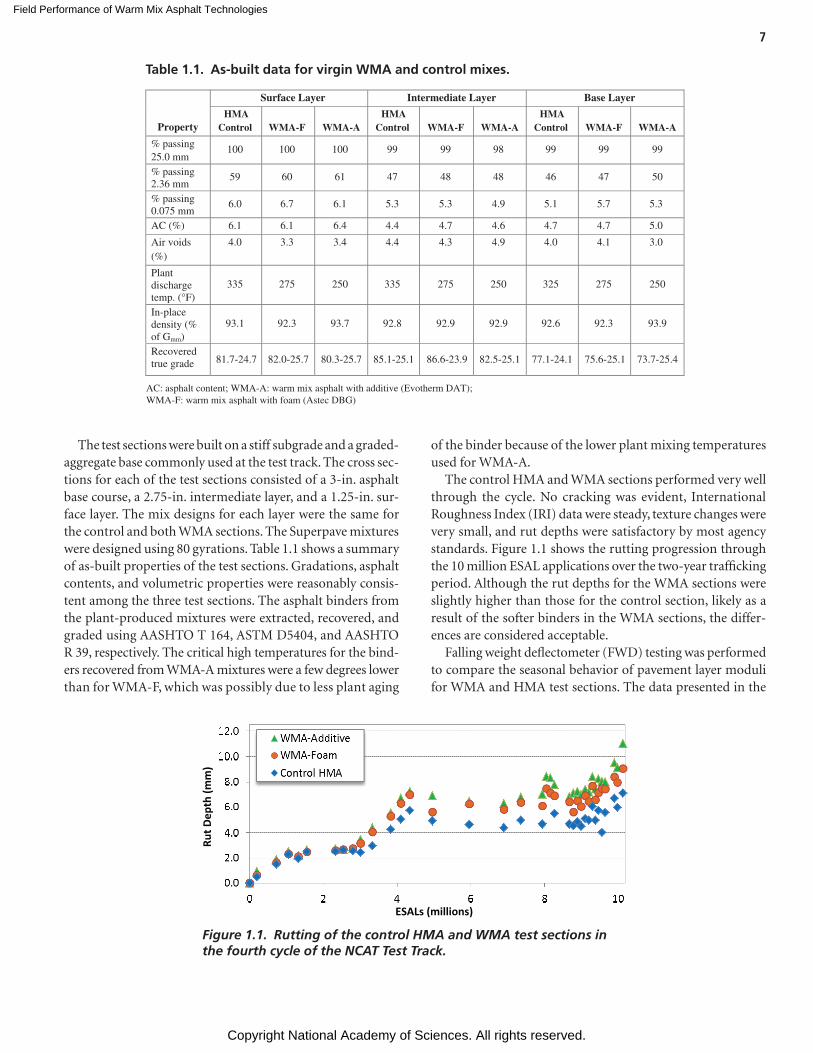
In 2009, another group of WMA and control HMA test sections were constructed as part of the test track’s fourth research cycle (4). These WMA sections were built using the WMA technologies in each lift of a 7-in. asphalt pavement structure. The objective of this experiment was to evaluate the pavement structural responses and short-term perfor-mance of WMA under full-scale accelerated pavement test-ing. State department of transportation (DOT) sponsors of the experiment selected two WMA technologies to use in the test sections: Evotherm® DAT and Astec Double Barrel Green® (Astec DBG), referred to in Table 1.1 as WMA-A (warm mix asphalt with additive) and WMA-F (warm mix asphalt with foam), respectively.
Field Performance of Warm Mix Asphalt Technologies
Copyright National Academy of Sciences. All rights reserved.
7
The test sections were built on a stiff subgrade and a graded-aggregate base commonly used at the test track. The cross sec-tions for each of the test sections consisted of a 3-in. asphalt base course, a 2.75-in. intermediate layer, and a 1.25-in. sur-face layer. The mix designs for each layer were the same for the control and both WMA sections. The Superpave mixtures were designed using 80 gyrations. Table 1.1 shows a summary of as-built properties of the test sections. Gradations, asphalt contents, and volumetric properties were reasonably consis-tent among the three test sections. The asphalt binders from the plant-produced mixtures were extracted, recovered, and graded using AASHTO T 164, ASTM D5404, and AASHTO R 39, respectively. The critical high temperatures for the bind-ers recovered from WMA-A mixtures were a few degrees lower than for WMA-F, which was possibly due to less plant aging
of the binder because of the lower plant mixing temperatures used for WMA-A.
The control HMA and WMA sections performed very well through the cycle. No cracking was evident, International Roughness Index (IRI) data were steady, texture changes were very small, and rut depths were satisfactory by most agency standards. Figure 1.1 shows the rutting progression through the 10 million ESAL applications over the two-year trafficking period. Although the rut depths for the WMA sections were slightly higher than those for the control section, likely as a result of the softer binders in the WMA sections, the differ-ences are considered acceptable.
Falling weight deflectometer (FWD) testing was performed to compare the seasonal behavior of pavement layer moduli for WMA and HMA test sections. The data presented in the
Property
Surface Layer Intermediate Layer Base Layer
HMAControl WMA-F WMA-A
HMAControl WMA-F WMA-A
HMAControl WMA-F WMA-A
% passing 25.0 mm
100 100 100 99 99 98 99 99 99
% passing 2.36 mm
59 60 61 47 48 48 46 47 50
% passing 0.075 mm
6.0 6.7 6.1 5.3 5.3 4.9 5.1 5.7 5.3
AC (%) 6.1 6.1 6.4 4.4 4.7 4.6 4.7 4.7 5.0
Air voids (%)
4.0 3.3 3.4 4.4 4.3 4.9 4.0 4.1 3.0
Plant discharge temp. (°F)
335 275 250 335 275 250 325 275 250
In-placedensity (% of Gmm)
93.1 92.3 93.7 92.8 92.9 92.9 92.6 92.3 93.9
Recovered true grade 81.7-24.7 82.0-25.7 80.3-25.7 85.1-25.1 86.6-23.9 82.5-25.1 77.1-24.1 75.6-25.1 73.7-25.4
AC: asphalt content; WMA-A: warm mix asphalt with additive (Evotherm DAT);WMA-F: warm mix asphalt with foam (Astec DBG)
Table 1.1. As-built data for virgin WMA and control mixes.
Figure 1.1. Rutting of the control HMA and WMA test sections in the fourth cycle of the NCAT Test Track.
ESALs (millions)
Rut D
epth
(mm
)
Field Performance of Warm Mix Asphalt Technologies
Copyright National Academy of Sciences. All rights reserved.
8
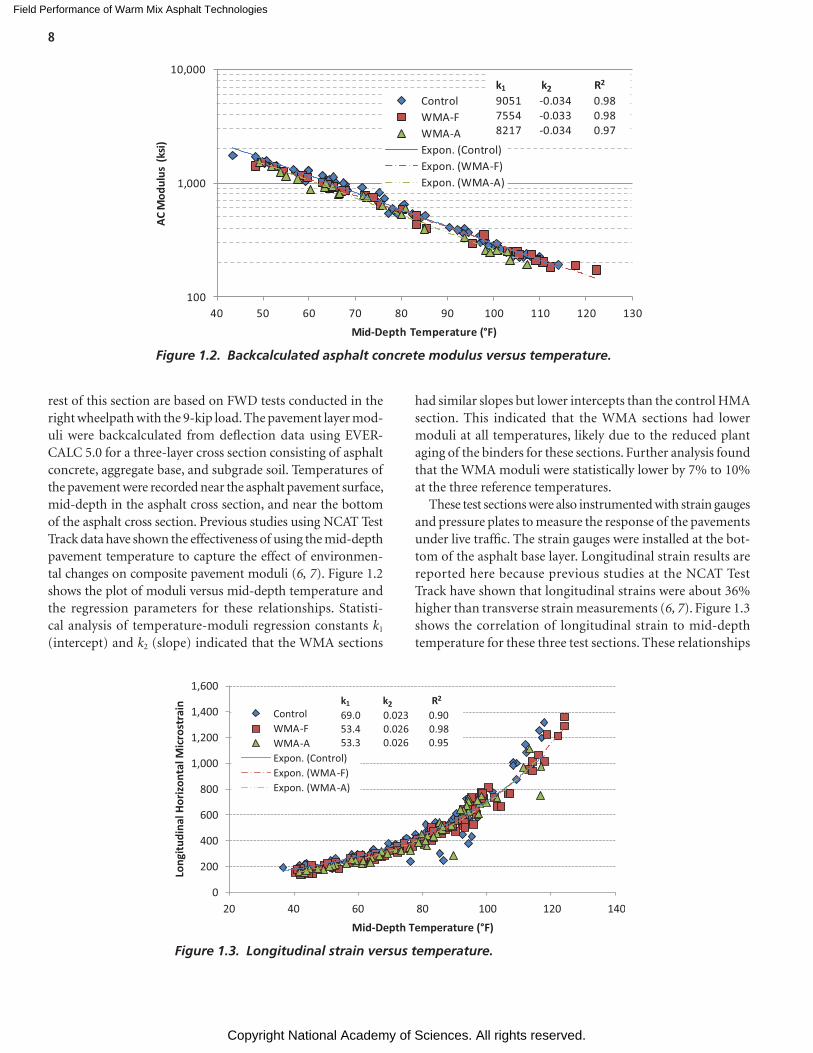
rest of this section are based on FWD tests conducted in the right wheelpath with the 9-kip load. The pavement layer mod-uli were backcalculated from deflection data using EVER-CALC 5.0 for a three-layer cross section consisting of asphalt concrete, aggregate base, and subgrade soil. Temperatures of the pavement were recorded near the asphalt pavement surface, mid-depth in the asphalt cross section, and near the bottom of the asphalt cross section. Previous studies using NCAT Test Track data have shown the effectiveness of using the mid-depth pavement temperature to capture the effect of environmen-tal changes on composite pavement moduli (6, 7). Figure 1.2 shows the plot of moduli versus mid-depth temperature and the regression parameters for these relationships. Statisti-cal analysis of temperature-moduli regression constants k1 (intercept) and k2 (slope) indicated that the WMA sections
had similar slopes but lower intercepts than the control HMA section. This indicated that the WMA sections had lower moduli at all temperatures, likely due to the reduced plant aging of the binders for these sections. Further analysis found that the WMA moduli were statistically lower by 7% to 10% at the three reference temperatures.
These test sections were also instrumented with strain gauges and pressure plates to measure the response of the pavements under live traffic. The strain gauges were installed at the bot-tom of the asphalt base layer. Longitudinal strain results are reported here because previous studies at the NCAT Test Track have shown that longitudinal strains were about 36% higher than transverse strain measurements (6, 7). Figure 1.3 shows the correlation of longitudinal strain to mid-depth temperature for these three test sections. These relationships
Figure 1.2. Backcalculated asphalt concrete modulus versus temperature.
100
1,000
10,000
40 50 60 70 80 90 100 110 120 130
AC M
odul
us (
ksi)
Mid-Depth Temperature (°F)
ControlWMA-FWMA-AExpon. (Control)Expon. (WMA-F)Expon. (WMA-A)
k1 k2 R2
9051 -0.034 0.987554 -0.033 0.988217 -0.034 0.97
Figure 1.3. Longitudinal strain versus temperature.
0
200
400
600
800
1,000
1,200
1,400
1,600
20 40 60 80 100 120 140
Long
itudi
nal H
oriz
onta
l Mic
rost
rain
Mid-Depth Temperature (°F)
ControlWMA-FWMA-AExpon. (Control)Expon. (WMA-F)Expon. (WMA-A)
k1 k2 R2
69.0 0.023 0.9053.4 0.026 0.9853.3 0.026 0.95
Field Performance of Warm Mix Asphalt Technologies
Copyright National Academy of Sciences. All rights reserved.
9
follow an exponential function; the regression constants and correlation coefficients are shown in the figure. A statistical analysis found that the regression coefficients of the WMA sections were not statistically different from the control. This indicated that despite the small differences in moduli for WMA and HMA, the pavements did not respond differently under traffic for critical strains.
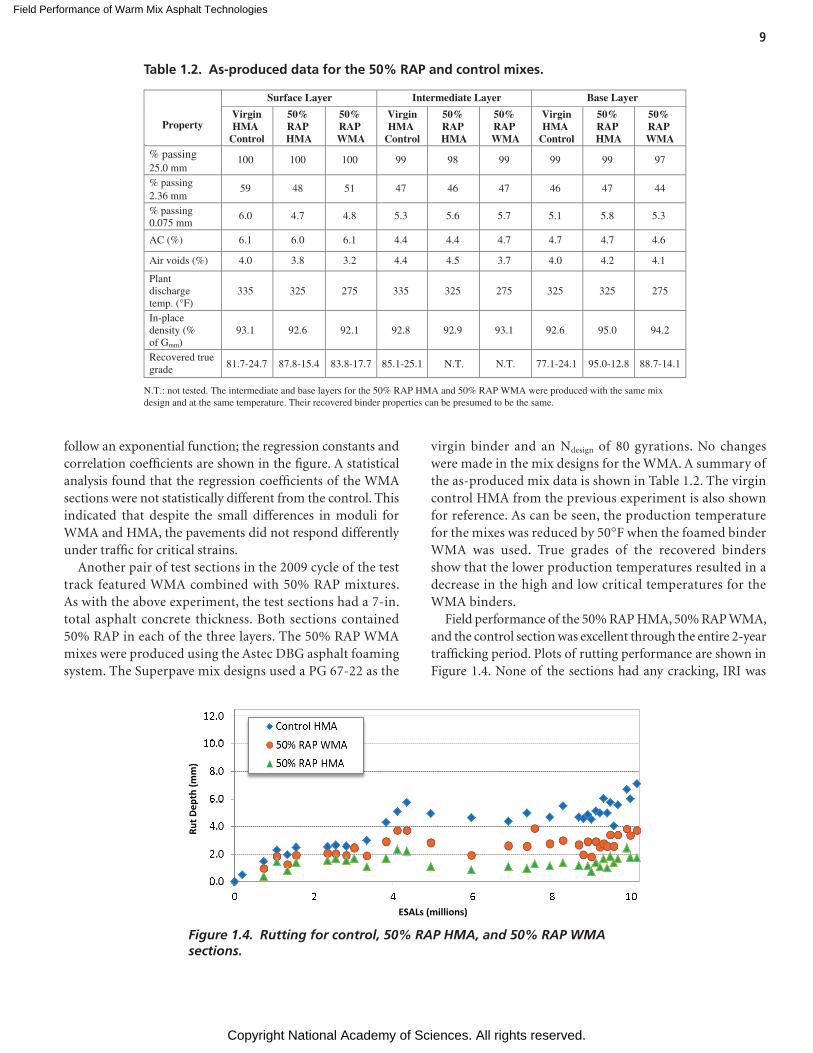
Another pair of test sections in the 2009 cycle of the test track featured WMA combined with 50% RAP mixtures. As with the above experiment, the test sections had a 7-in. total asphalt concrete thickness. Both sections contained 50% RAP in each of the three layers. The 50% RAP WMA mixes were produced using the Astec DBG asphalt foaming system. The Superpave mix designs used a PG 67-22 as the
virgin binder and an Ndesign of 80 gyrations. No changes were made in the mix designs for the WMA. A summary of the as-produced mix data is shown in Table 1.2. The virgin control HMA from the previous experiment is also shown for reference. As can be seen, the production temperature for the mixes was reduced by 50°F when the foamed binder WMA was used. True grades of the recovered binders show that the lower production temperatures resulted in a decrease in the high and low critical temperatures for the WMA binders.
Field performance of the 50% RAP HMA, 50% RAP WMA, and the control section was excellent through the entire 2-year trafficking period. Plots of rutting performance are shown in Figure 1.4. None of the sections had any cracking, IRI was
Figure 1.4. Rutting for control, 50% RAP HMA, and 50% RAP WMA sections.
ESALs (millions)
Rut D
epth
(mm
)
Property
Surface Layer Intermediate Layer Base Layer
VirginHMA
Control
50% RAP HMA
50% RAP WMA
VirginHMA
Control
50% RAP HMA
50% RAP WMA
VirginHMA
Control
50% RAP HMA
50% RAP WMA
% passing25.0 mm
100 100 100 99 98 99 99 99 97
% passing 2.36 mm
59 48 51 47 46 47 46 47 44
% passing 0.075 mm
6.0 4.7 4.8 5.3 5.6 5.7 5.1 5.8 5.3
AC (%) 6.1 6.0 6.1 4.4 4.4 4.7 4.7 4.7 4.6
Air voids (%) 4.0 3.8 3.2 4.4 4.5 3.7 4.0 4.2 4.1
Plant discharge temp. (°F)
335 325 275 335 325 275 325 325 275
In-placedensity (% of Gmm)
93.1 92.6 92.1 92.8 92.9 93.1 92.6 95.0 94.2
Recovered true grade 81.7-24.7 87.8-15.4 83.8-17.7 85.1-25.1 N.T. N.T. 77.1-24.1 95.0-12.8 88.7-14.1
N.T.: not tested. The intermediate and base layers for the 50% RAP HMA and 50% RAP WMA were produced with the same mixdesign and at the same temperature. Their recovered binder properties can be presumed to be the same.
Table 1.2. As-produced data for the 50% RAP and control mixes.
Field Performance of Warm Mix Asphalt Technologies
Copyright National Academy of Sciences. All rights reserved.
10
steady, and texture changes were typical for the first 2 years of dense-graded surface mixes.
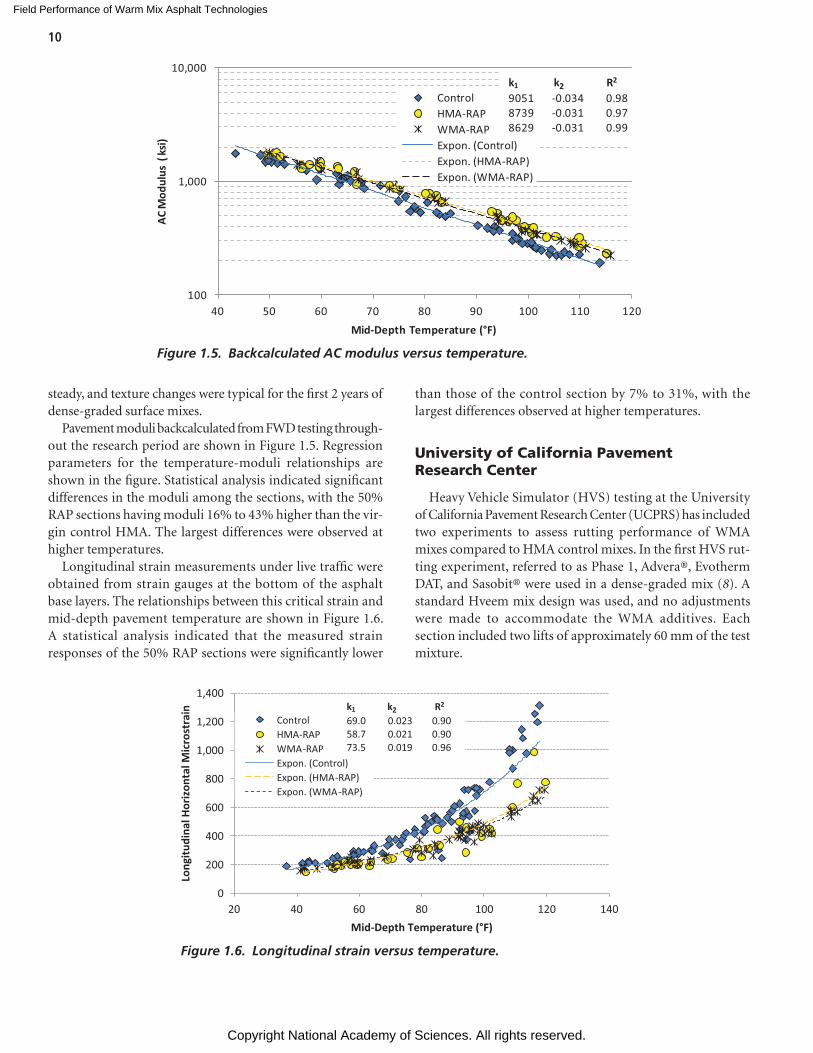
Pavement moduli backcalculated from FWD testing through-out the research period are shown in Figure 1.5. Regression parameters for the temperature-moduli relationships are shown in the figure. Statistical analysis indicated significant differences in the moduli among the sections, with the 50% RAP sections having moduli 16% to 43% higher than the vir-gin control HMA. The largest differences were observed at higher temperatures.
Longitudinal strain measurements under live traffic were obtained from strain gauges at the bottom of the asphalt base layers. The relationships between this critical strain and mid-depth pavement temperature are shown in Figure 1.6. A statistical analysis indicated that the measured strain responses of the 50% RAP sections were significantly lower
than those of the control section by 7% to 31%, with the largest differences observed at higher temperatures.
University of California Pavement Research Center
Heavy Vehicle Simulator (HVS) testing at the University of California Pavement Research Center (UCPRS) has included two experiments to assess rutting performance of WMA mixes compared to HMA control mixes. In the first HVS rut-ting experiment, referred to as Phase 1, Advera®, Evotherm DAT, and Sasobit® were used in a dense-graded mix (8). A standard Hveem mix design was used, and no adjustments were made to accommodate the WMA additives. Each section included two lifts of approximately 60 mm of the test mixture.
100
1,000
10,000
40 50 60 70 80 90 100 110 120
AC M
odul
us (
ksi)
Mid-Depth Temperature (°F)
ControlHMA-RAPWMA-RAPExpon. (Control)Expon. (HMA-RAP)Expon. (WMA-RAP)
k1 k2 R2
9051 -0.034 0.988739 -0.031 0.978629 -0.031 0.99
Figure 1.5. Backcalculated AC modulus versus temperature.
Figure 1.6. Longitudinal strain versus temperature.
0
200
400
600
800
1,000
1,200
1,400
20 40 60 80 100 120 140
Long
itudi
nal H
oriz
onta
l Mic
rost
rain
Mid-Depth Temperature (°F)
ControlHMA-RAPWMA-RAPExpon. (Control)Expon. (HMA-RAP)Expon. (WMA-RAP)
k1 k2 R2
69.0 0.023 0.9058.7 0.021 0.9073.5 0.019 0.96
Field Performance of Warm Mix Asphalt Technologies
Copyright National Academy of Sciences. All rights reserved.
11
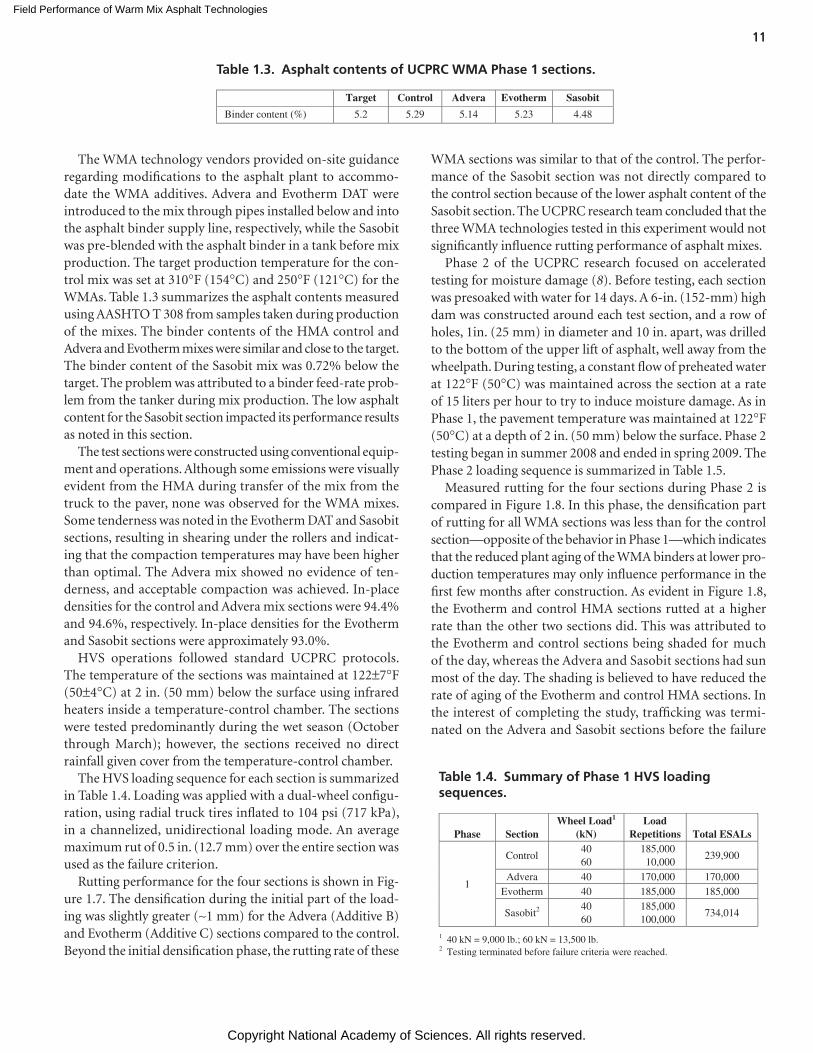
The WMA technology vendors provided on-site guidance regarding modifications to the asphalt plant to accommo-date the WMA additives. Advera and Evotherm DAT were introduced to the mix through pipes installed below and into the asphalt binder supply line, respectively, while the Sasobit was pre-blended with the asphalt binder in a tank before mix production. The target production temperature for the con-trol mix was set at 310°F (154°C) and 250°F (121°C) for the WMAs. Table 1.3 summarizes the asphalt contents measured using AASHTO T 308 from samples taken during production of the mixes. The binder contents of the HMA control and Advera and Evotherm mixes were similar and close to the target. The binder content of the Sasobit mix was 0.72% below the target. The problem was attributed to a binder feed-rate prob-lem from the tanker during mix production. The low asphalt content for the Sasobit section impacted its performance results as noted in this section.
The test sections were constructed using conventional equip-ment and operations. Although some emissions were visually evident from the HMA during transfer of the mix from the truck to the paver, none was observed for the WMA mixes. Some tenderness was noted in the Evotherm DAT and Sasobit sections, resulting in shearing under the rollers and indicat-ing that the compaction temperatures may have been higher than optimal. The Advera mix showed no evidence of ten-derness, and acceptable compaction was achieved. In-place densities for the control and Advera mix sections were 94.4% and 94.6%, respectively. In-place densities for the Evotherm and Sasobit sections were approximately 93.0%.
HVS operations followed standard UCPRC protocols. The temperature of the sections was maintained at 122±7°F (50±4°C) at 2 in. (50 mm) below the surface using infrared heaters inside a temperature-control chamber. The sections were tested predominantly during the wet season (October through March); however, the sections received no direct rainfall given cover from the temperature-control chamber.
The HVS loading sequence for each section is summarized in Table 1.4. Loading was applied with a dual-wheel configu-ration, using radial truck tires inflated to 104 psi (717 kPa), in a channelized, unidirectional loading mode. An average maximum rut of 0.5 in. (12.7 mm) over the entire section was used as the failure criterion.
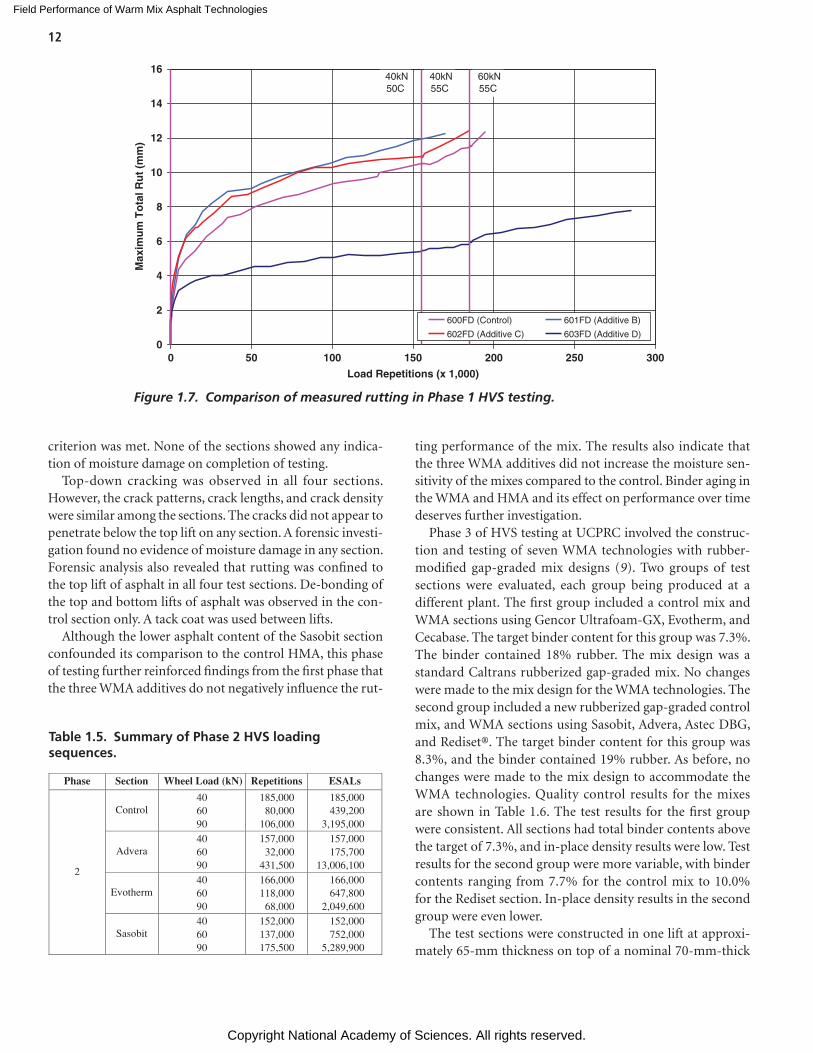
Rutting performance for the four sections is shown in Fig-ure 1.7. The densification during the initial part of the load-ing was slightly greater (~1 mm) for the Advera (Additive B) and Evotherm (Additive C) sections compared to the control. Beyond the initial densification phase, the rutting rate of these
WMA sections was similar to that of the control. The perfor-mance of the Sasobit section was not directly compared to the control section because of the lower asphalt content of the Sasobit section. The UCPRC research team concluded that the three WMA technologies tested in this experiment would not significantly influence rutting performance of asphalt mixes.
Phase 2 of the UCPRC research focused on accelerated testing for moisture damage (8). Before testing, each section was presoaked with water for 14 days. A 6-in. (152-mm) high dam was constructed around each test section, and a row of holes, 1in. (25 mm) in diameter and 10 in. apart, was drilled to the bottom of the upper lift of asphalt, well away from the wheelpath. During testing, a constant flow of preheated water at 122°F (50°C) was maintained across the section at a rate of 15 liters per hour to try to induce moisture damage. As in Phase 1, the pavement temperature was maintained at 122°F (50°C) at a depth of 2 in. (50 mm) below the surface. Phase 2 testing began in summer 2008 and ended in spring 2009. The Phase 2 loading sequence is summarized in Table 1.5.
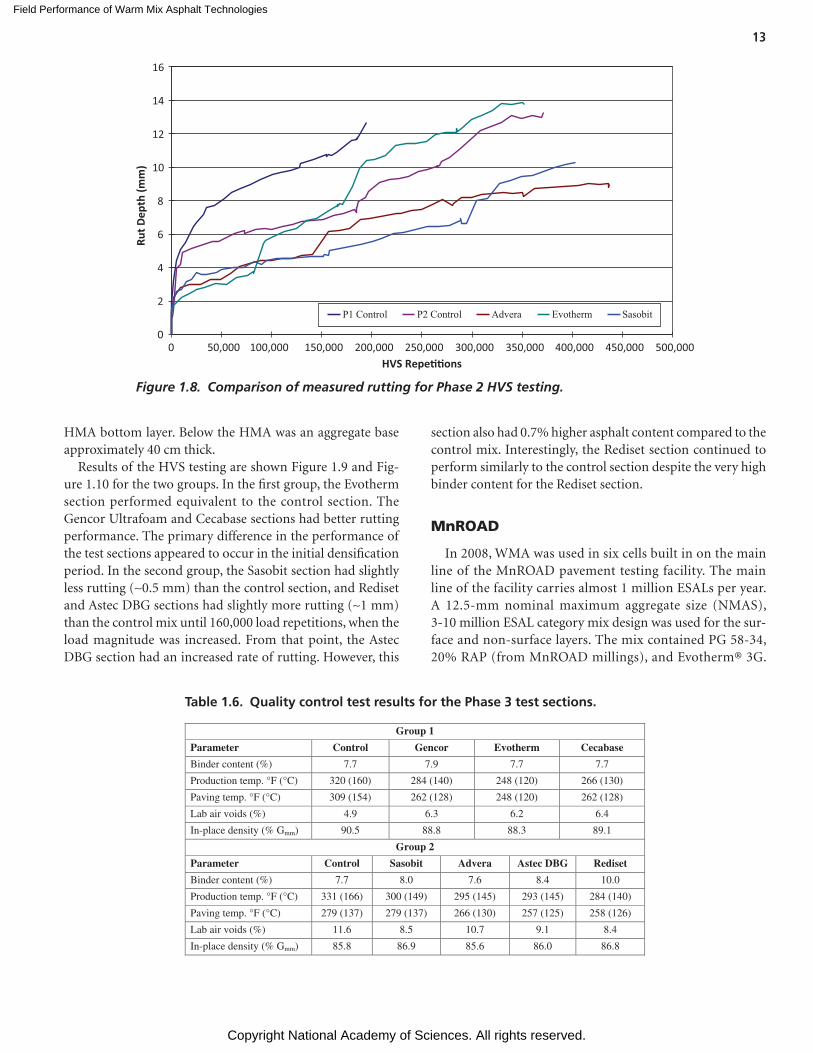
Measured rutting for the four sections during Phase 2 is compared in Figure 1.8. In this phase, the densification part of rutting for all WMA sections was less than for the control section—opposite of the behavior in Phase 1—which indicates that the reduced plant aging of the WMA binders at lower pro-duction temperatures may only influence performance in the first few months after construction. As evident in Figure 1.8, the Evotherm and control HMA sections rutted at a higher rate than the other two sections did. This was attributed to the Evotherm and control sections being shaded for much of the day, whereas the Advera and Sasobit sections had sun most of the day. The shading is believed to have reduced the rate of aging of the Evotherm and control HMA sections. In the interest of completing the study, trafficking was termi-nated on the Advera and Sasobit sections before the failure
Table 1.3. Asphalt contents of UCPRC WMA Phase 1 sections.
Target Control Advera Evotherm Sasobit
Binder content (%) 5.2 5.29 5.14 5.23 4.48
Table 1.4. Summary of Phase 1 HVS loading sequences.
Phase Section Wheel Load1
(kN) Load
Repetitions Total ESALs
1
Control 40 60
185,000 10,000
239,900
Advera 40 170,000 170,000 Evotherm 40 185,000 185,000
Sasobit2 40 60
185,000 100,000
734,014
1 40 kN = 9,000 lb.; 60 kN = 13,500 lb. 2 Testing terminated before failure criteria were reached.
Field Performance of Warm Mix Asphalt Technologies
Copyright National Academy of Sciences. All rights reserved.
12
criterion was met. None of the sections showed any indica-tion of moisture damage on completion of testing.
Top-down cracking was observed in all four sections. However, the crack patterns, crack lengths, and crack density were similar among the sections. The cracks did not appear to penetrate below the top lift on any section. A forensic investi-gation found no evidence of moisture damage in any section. Forensic analysis also revealed that rutting was confined to the top lift of asphalt in all four test sections. De-bonding of the top and bottom lifts of asphalt was observed in the con-trol section only. A tack coat was used between lifts.
Although the lower asphalt content of the Sasobit section confounded its comparison to the control HMA, this phase of testing further reinforced findings from the first phase that the three WMA additives do not negatively influence the rut-
ting performance of the mix. The results also indicate that the three WMA additives did not increase the moisture sen-sitivity of the mixes compared to the control. Binder aging in the WMA and HMA and its effect on performance over time deserves further investigation.
Phase 3 of HVS testing at UCPRC involved the construc-tion and testing of seven WMA technologies with rubber-modified gap-graded mix designs (9). Two groups of test sections were evaluated, each group being produced at a different plant. The first group included a control mix and WMA sections using Gencor Ultrafoam-GX, Evotherm, and Cecabase. The target binder content for this group was 7.3%. The binder contained 18% rubber. The mix design was a standard Caltrans rubberized gap-graded mix. No changes were made to the mix design for the WMA technologies. The second group included a new rubberized gap-graded control mix, and WMA sections using Sasobit, Advera, Astec DBG, and Rediset®. The target binder content for this group was 8.3%, and the binder contained 19% rubber. As before, no changes were made to the mix design to accommodate the WMA technologies. Quality control results for the mixes are shown in Table 1.6. The test results for the first group were consistent. All sections had total binder contents above the target of 7.3%, and in-place density results were low. Test results for the second group were more variable, with binder contents ranging from 7.7% for the control mix to 10.0% for the Rediset section. In-place density results in the second group were even lower.
The test sections were constructed in one lift at approxi-mately 65-mm thickness on top of a nominal 70-mm-thick
Figure 1.7. Comparison of measured rutting in Phase 1 HVS testing.
0
2
4
6
8
10
12
14
16
0 50 100 150 200 250 300
Load Repetitions (x 1,000)
Max
imu
m T
ota
l Ru
t (m
m)
600FD (Control) 601FD (Additive B)
602FD (Additive C) 603FD (Additive D)
40kN50C
40kN55C
60kN55C
Phase Section Wheel Load (kN) Repetitions ESALs
2
Control 40 60 90
185,000 80,000
106,000
185,000 439,200
3,195,000
Advera 40 60 90
157,000 32,000
431,500
157,000 175,700
13,006,100
Evotherm 40 60 90
166,000 118,000
68,000
166,000 647,800
2,049,600
Sasobit 40 60 90
152,000 137,000 175,500
152,000 752,000
5,289,900
Table 1.5. Summary of Phase 2 HVS loading sequences.
Field Performance of Warm Mix Asphalt Technologies
Copyright National Academy of Sciences. All rights reserved.
13
HMA bottom layer. Below the HMA was an aggregate base approximately 40 cm thick.
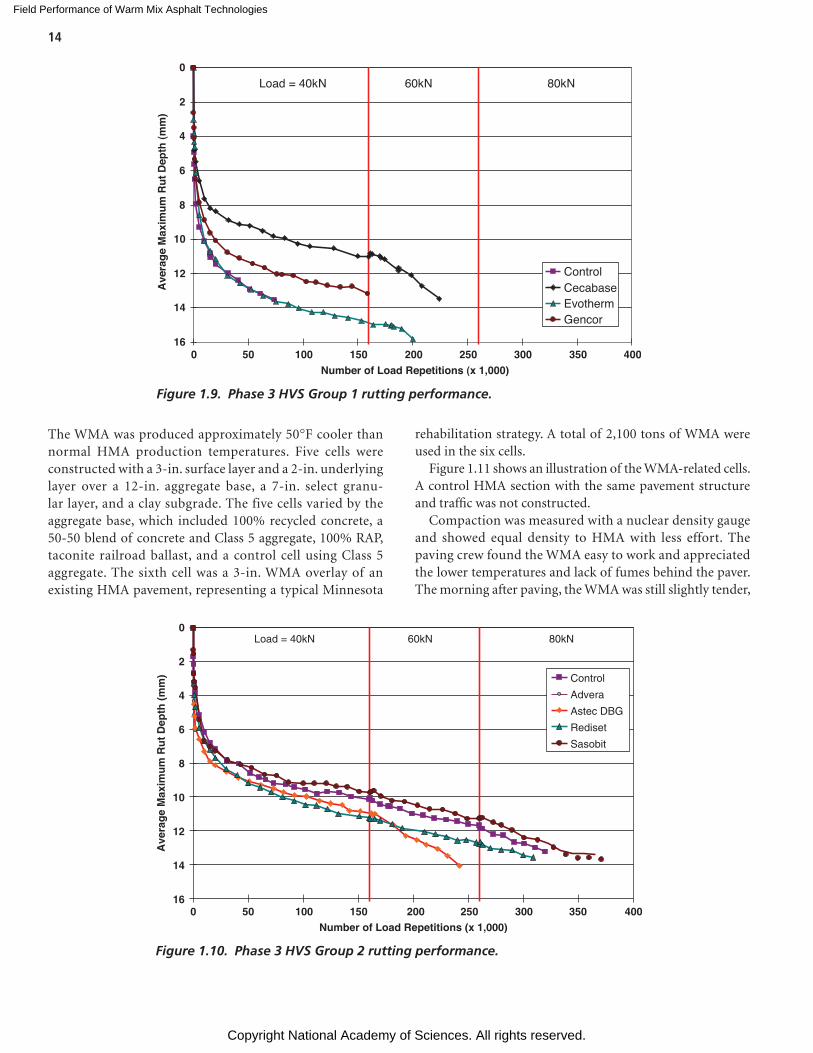
Results of the HVS testing are shown Figure 1.9 and Fig-ure 1.10 for the two groups. In the first group, the Evotherm section performed equivalent to the control section. The Gencor Ultrafoam and Cecabase sections had better rutting performance. The primary difference in the performance of the test sections appeared to occur in the initial densification period. In the second group, the Sasobit section had slightly less rutting (~0.5 mm) than the control section, and Rediset and Astec DBG sections had slightly more rutting (~1 mm) than the control mix until 160,000 load repetitions, when the load magnitude was increased. From that point, the Astec DBG section had an increased rate of rutting. However, this
0
2
4
6
8
10
12
14
16
0 50,000 100,000 150,000 200,000 250,000 300,000 350,000 400,000 450,000 500,000HVS Repe��ons
Rut D
epth
(mm
)
P1 Control P2 Control Advera Evotherm Sasobit
Figure 1.8. Comparison of measured rutting for Phase 2 HVS testing.
Table 1.6. Quality control test results for the Phase 3 test sections.
Group 1
Parameter Control Gencor Evotherm Cecabase
Binder content (%) 7.7 7.9 7.7 7.7
Production temp. °F (°C) 320 (160) 284 (140) 248 (120) 266 (130)
Paving temp. °F (°C) 309 (154) 262 (128) 248 (120) 262 (128)
Lab air voids (%) 4.9 6.3 6.2 6.4
In-place density (% Gmm) 90.5 88.8 88.3 89.1
Group 2
Parameter Control Sasobit Advera Astec DBG Rediset
Binder content (%) 7.7 8.0 7.6 8.4 10.0
Production temp. °F (°C) 331 (166) 300 (149) 295 (145) 293 (145) 284 (140)
Paving temp. °F (°C) 279 (137) 279 (137) 266 (130) 257 (125) 258 (126)
Lab air voids (%) 11.6 8.5 10.7 9.1 8.4
In-place density (% Gmm) 85.8 86.9 85.6 86.0 86.8
section also had 0.7% higher asphalt content compared to the control mix. Interestingly, the Rediset section continued to perform similarly to the control section despite the very high binder content for the Rediset section.
MnROAD
In 2008, WMA was used in six cells built in on the main line of the MnROAD pavement testing facility. The main line of the facility carries almost 1 million ESALs per year. A 12.5-mm nominal maximum aggregate size (NMAS), 3-10 million ESAL category mix design was used for the sur-face and non-surface layers. The mix contained PG 58-34, 20% RAP (from MnROAD millings), and Evotherm® 3G.
Field Performance of Warm Mix Asphalt Technologies
Copyright National Academy of Sciences. All rights reserved.
14
Figure 1.9. Phase 3 HVS Group 1 rutting performance.
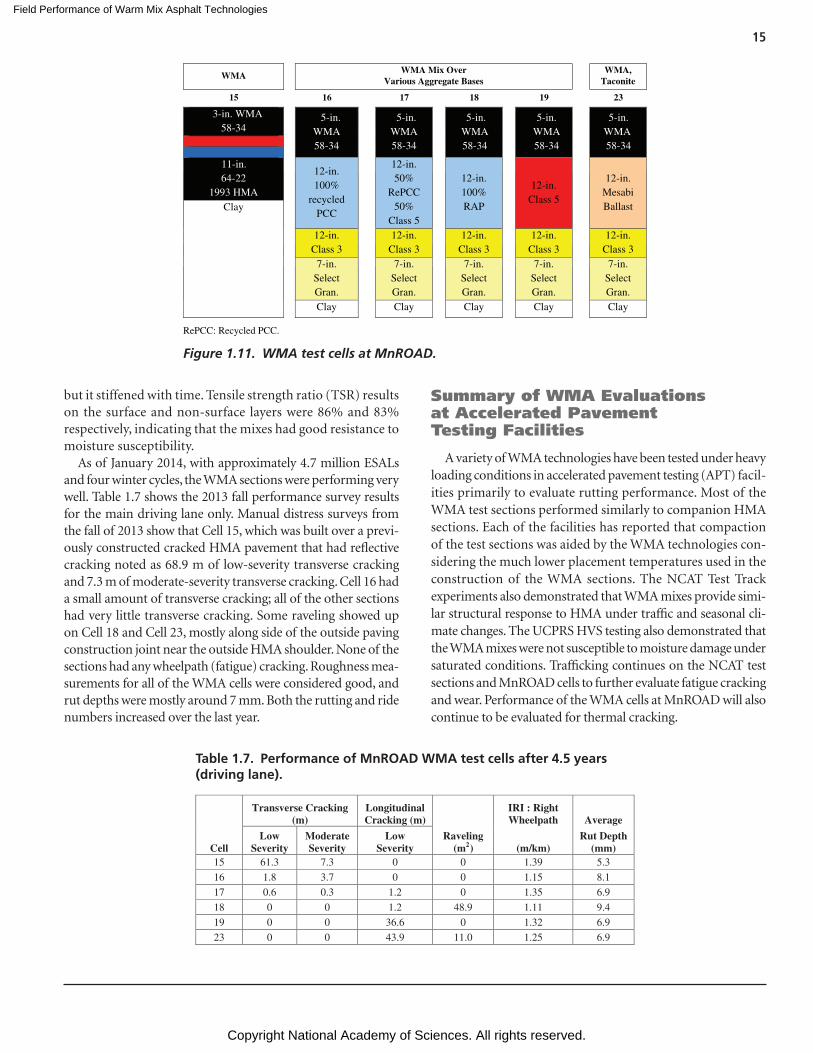
The WMA was produced approximately 50°F cooler than normal HMA production temperatures. Five cells were constructed with a 3-in. surface layer and a 2-in. underlying layer over a 12-in. aggregate base, a 7-in. select granu-lar layer, and a clay subgrade. The five cells varied by the aggregate base, which included 100% recycled concrete, a 50-50 blend of concrete and Class 5 aggregate, 100% RAP, taconite railroad ballast, and a control cell using Class 5 aggregate. The sixth cell was a 3-in. WMA overlay of an existing HMA pavement, representing a typical Minnesota
rehabilitation strategy. A total of 2,100 tons of WMA were used in the six cells.
Figure 1.11 shows an illustration of the WMA-related cells. A control HMA section with the same pavement structure and traffic was not constructed.
Compaction was measured with a nuclear density gauge and showed equal density to HMA with less effort. The paving crew found the WMA easy to work and appreciated the lower temperatures and lack of fumes behind the paver. The morning after paving, the WMA was still slightly tender,
0
2
4
6
8
10
12
14
160 50 100 150 200 250 300 350 400
Number of Load Repetitions (x 1,000)
Ave
rag
e M
axim
um
Ru
t D
epth
(m
m) Control
Advera
Astec DBG
Rediset
Sasobit
Load = 40kN 60kN 80kN
Figure 1.10. Phase 3 HVS Group 2 rutting performance.
0
2
4
6
8
10
12
14
160 50 100 150 200 250 300 350 400
Number of Load Repetitions (x 1,000)
Ave
rage
Max
imum
Rut
Dep
th (m
m)
ControlCecabaseEvothermGencor
Load = 40kN 60kN 80kN
Field Performance of Warm Mix Asphalt Technologies
Copyright National Academy of Sciences. All rights reserved.
15
but it stiffened with time. Tensile strength ratio (TSR) results on the surface and non-surface layers were 86% and 83% respectively, indicating that the mixes had good resistance to moisture susceptibility.
As of January 2014, with approximately 4.7 million ESALs and four winter cycles, the WMA sections were performing very well. Table 1.7 shows the 2013 fall performance survey results for the main driving lane only. Manual distress surveys from the fall of 2013 show that Cell 15, which was built over a previ-ously constructed cracked HMA pavement that had reflective cracking noted as 68.9 m of low-severity transverse cracking and 7.3 m of moderate-severity transverse cracking. Cell 16 had a small amount of transverse cracking; all of the other sections had very little transverse cracking. Some raveling showed up on Cell 18 and Cell 23, mostly along side of the outside paving construction joint near the outside HMA shoulder. None of the sections had any wheelpath (fatigue) cracking. Roughness mea-surements for all of the WMA cells were considered good, and rut depths were mostly around 7 mm. Both the rutting and ride numbers increased over the last year.
Summary of WMA Evaluations at Accelerated Pavement Testing Facilities
A variety of WMA technologies have been tested under heavy loading conditions in accelerated pavement testing (APT) facil-ities primarily to evaluate rutting performance. Most of the WMA test sections performed similarly to companion HMA sections. Each of the facilities has reported that compaction of the test sections was aided by the WMA technologies con-sidering the much lower placement temperatures used in the construction of the WMA sections. The NCAT Test Track experiments also demonstrated that WMA mixes provide simi-lar structural response to HMA under traffic and seasonal cli-mate changes. The UCPRS HVS testing also demonstrated that the WMA mixes were not susceptible to moisture damage under saturated conditions. Trafficking continues on the NCAT test sections and MnROAD cells to further evaluate fatigue cracking and wear. Performance of the WMA cells at MnROAD will also continue to be evaluated for thermal cracking.
Cell
Transverse Cracking (m)
Longitudinal Cracking (m)
Raveling (m )2
IRI : Right Wheelpath Average
Low Severity
Moderate Severity
Low Severity (m/km)
Rut Depth (mm)
15 61.3 7.3 0 0 1.39 5.3
16 1.8 3.7 0 0 1.15 8.1
17 0.6 0.3 1.2 0 1.35 6.9
18 0 0 1.2 48.9 1.11 9.4
19 0 0 36.6 0 1.32 6.9
23 0 0 43.9 11.0 1.25 6.9
Table 1.7. Performance of MnROAD WMA test cells after 4.5 years (driving lane).
WMAWMA Mix Over
Various Aggregate Bases WMA,
Taconite
15 16 17 18 19 23
3-in. WMA 58-34
5-in. WMA 58-34
5-in. WMA 58-34
5-in. WMA 58-34
5-in. WMA 58-34
WMA 58-34
11-in. 64-22
1993 HMA
12-in. 100%
recycled PCC
12-in. 50%
RePCC 50%
Class 5
12-in. 100% RAP
12-in. Class 5
12-in. Mesabi Ballast Clay
12-in. Class 3
12-in. Class 3
12-in. Class 3
12-in. Class 3
12-in. Class 3
7-in. Select Gran.
7-in. Select Gran.
7-in. Select Gran.
7-in. Select Gran.
7-in. Select Gran.
Clay Clay Clay Clay Clay
RePCC: Recycled PCC.
5-in.
Figure 1.11. WMA test cells at MnROAD.
Field Performance of Warm Mix Asphalt Technologies
Copyright National Academy of Sciences. All rights reserved.
16
Introduction
Plans for field and laboratory experiments were developed to meet the objectives of this study. The field experiment was developed to gather information to assess short-term pavement performance of new and existing warm mix asphalt (WMA) pavements. Field performance assessments were limited to short-term performance since the oldest documented WMA pavement was less than 10 years old at the completion of this study. The field experimental plan also included the collection of energy usage data, plant emissions data, and industrial hygiene testing. That experiment and its data, analyses, and findings are described in Part 2. The laboratory testing determined material properties, compared those properties for WMA and hot mix asphalt (HMA), used the properties in models to predict long-term pavement performance, and validated current recommen-dations for mix design and testing of WMA in the laboratory.
Field Projects: Production and Construction Documentation
Existing and New Projects
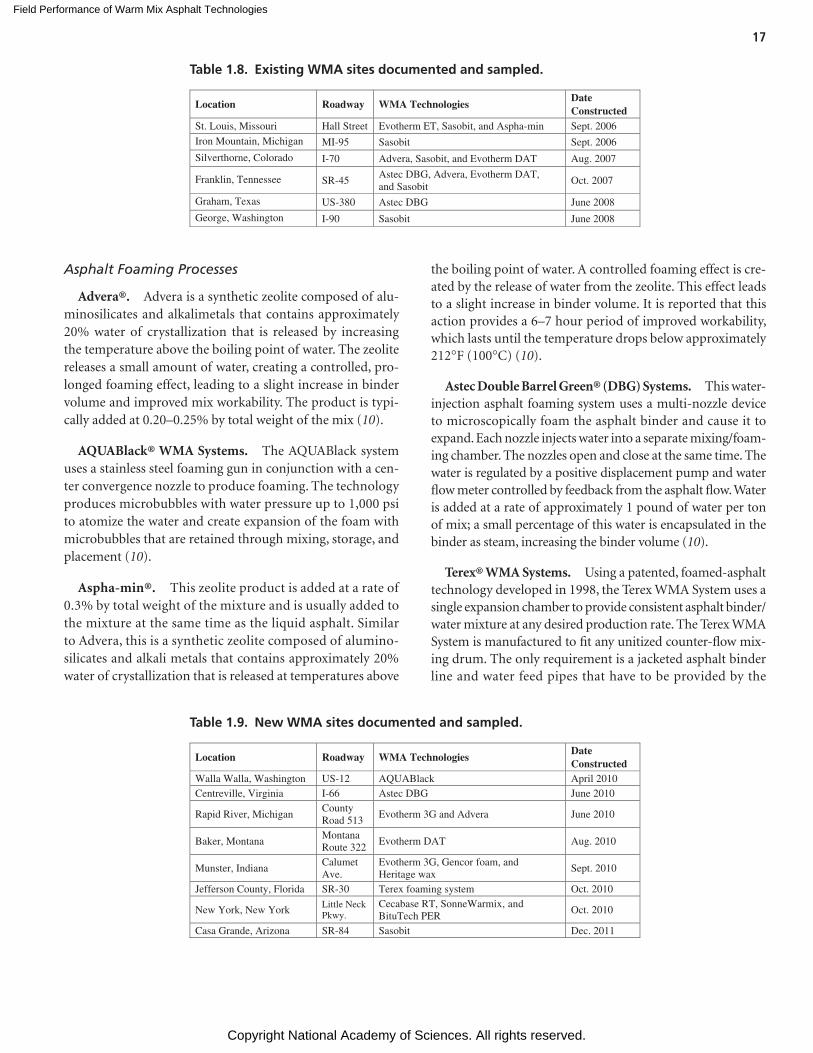
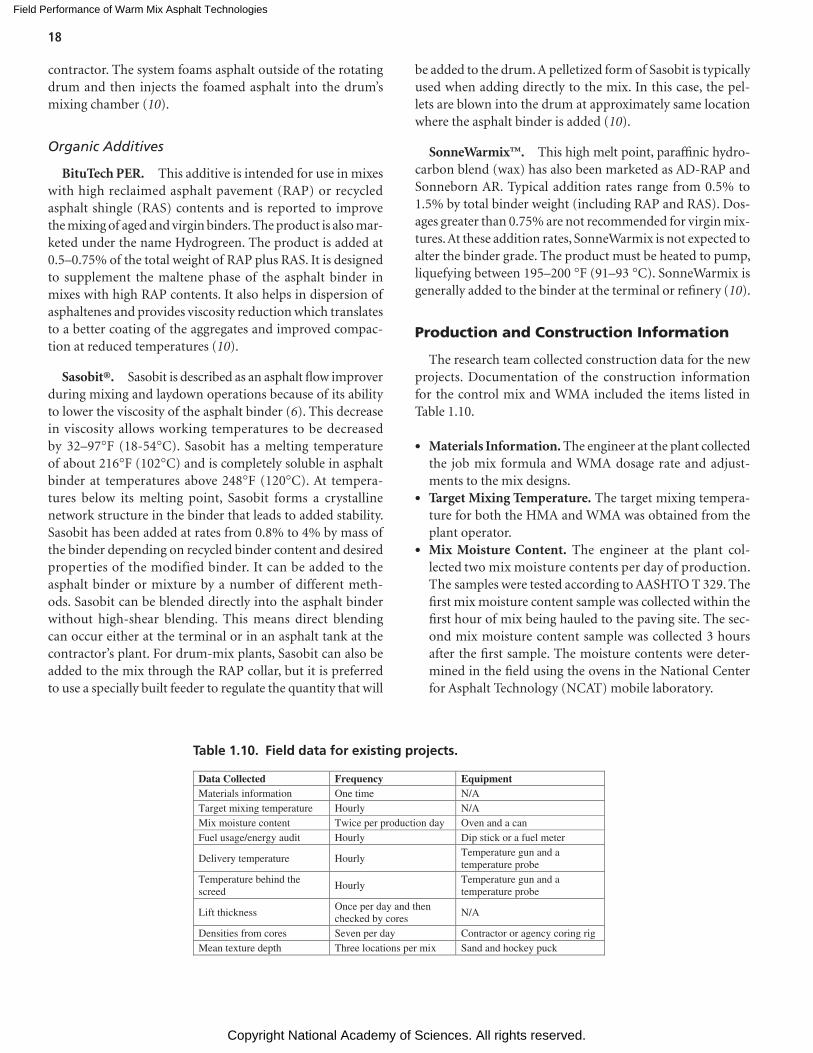
Production and construction information was collected from six WMA projects built prior to the start of NCHRP Project 9-47A and eight new WMA projects that were con-structed and monitored during the course of this study. The projects built prior to the start of this study are referred to as the existing projects; the eight projects built and evalu-ated during the study are referred to as the new projects. The existing and new projects are listed in Table 1.8 and Table 1.9, respectively. For each project (existing and new), a control HMA section was constructed to provide a direct comparison for field performance and materials properties. The materials properties were also used to examine relationships between engineering properties and field performance.
WMA Technologies Evaluated
As previously noted, WMA technologies can be classified in three categories: chemical additives, asphalt foaming pro-cesses, and organic additives.
Chemical Additives
Cecabase RT®. Cecabase RT was developed by CECA, a division of the Arkema Group. Initially developed in France in 2003, Cecabase RT is a patented, water-free, chemical addi-tive (made up of 50% renewable raw materials) that imparts increased workability to asphalt mixtures at lower tempera-tures. The blend of surfactants in Cecabase RT is designed to reduce the surface tension of the binder, improving coating at low temperatures, and to act as a lubricant at the binder/aggregate interface, facilitating compaction. A liquid additive, it can be injected directly into the asphalt line. Recommended addition rates are typically 0.3% to 0.5% by weight of asphalt binder (10).
Evotherm®. Evotherm is a chemical package used to enhance coating, adhesion, and workability at reduced tem-peratures. It was developed by Mead Westvaco in the United States. It was originally introduced in 2004 as Evotherm Emul-sion Technology (ET). In 2005, Evotherm Dispersed Asphalt Technology (DAT) was introduced, using the same chemical additive as Evotherm ET. The Evotherm DAT is diluted with a small amount of water that will affect the degree of tem-perature reduction. The chemical solution is injected into the asphalt line before mixing for drum plants, or into the pug mill for batch plants. Evotherm 3G (Third Generation) was later introduced with the difference that the additive does not contain water and can be added at the binder terminal or mix plant. Evotherm DAT allows a slightly higher reduction in temperature than Evotherm 3G (10).
C H A P T E R 2
Experimental Plan
Field Performance of Warm Mix Asphalt Technologies
Copyright National Academy of Sciences. All rights reserved.
17
Asphalt Foaming Processes
Advera®. Advera is a synthetic zeolite composed of alu-minosilicates and alkalimetals that contains approximately 20% water of crystallization that is released by increasing the temperature above the boiling point of water. The zeolite releases a small amount of water, creating a controlled, pro-longed foaming effect, leading to a slight increase in binder volume and improved mix workability. The product is typi-cally added at 0.20–0.25% by total weight of the mix (10).
AQUABlack® WMA Systems. The AQUABlack system uses a stainless steel foaming gun in conjunction with a cen-ter convergence nozzle to produce foaming. The technology produces microbubbles with water pressure up to 1,000 psi to atomize the water and create expansion of the foam with microbubbles that are retained through mixing, storage, and placement (10).
Aspha-min®. This zeolite product is added at a rate of 0.3% by total weight of the mixture and is usually added to the mixture at the same time as the liquid asphalt. Similar to Advera, this is a synthetic zeolite composed of alumino-silicates and alkali metals that contains approximately 20% water of crystallization that is released at temperatures above
the boiling point of water. A controlled foaming effect is cre-ated by the release of water from the zeolite. This effect leads to a slight increase in binder volume. It is reported that this action provides a 6–7 hour period of improved workability, which lasts until the temperature drops below approximately 212°F (100°C) (10).
Astec Double Barrel Green® (DBG) Systems. This water-injection asphalt foaming system uses a multi-nozzle device to microscopically foam the asphalt binder and cause it to expand. Each nozzle injects water into a separate mixing/foam-ing chamber. The nozzles open and close at the same time. The water is regulated by a positive displacement pump and water flow meter controlled by feedback from the asphalt flow. Water is added at a rate of approximately 1 pound of water per ton of mix; a small percentage of this water is encapsulated in the binder as steam, increasing the binder volume (10).
Terex® WMA Systems. Using a patented, foamed-asphalt technology developed in 1998, the Terex WMA System uses a single expansion chamber to provide consistent asphalt binder/water mixture at any desired production rate. The Terex WMA System is manufactured to fit any unitized counter-flow mix-ing drum. The only requirement is a jacketed asphalt binder line and water feed pipes that have to be provided by the
Location Roadway WMA Technologies DateConstructed
St. Louis, Missouri Hall Street Evotherm ET, Sasobit, and Aspha-min Sept. 2006
Iron Mountain, Michigan MI-95 Sasobit Sept. 2006
Silverthorne, Colorado I-70 Advera, Sasobit, and Evotherm DAT Aug. 2007
Franklin, Tennessee SR-45 Astec DBG, Advera, Evotherm DAT, and Sasobit
Oct. 2007
Graham, Texas US-380 Astec DBG June 2008
George, Washington I-90 Sasobit June 2008
Table 1.8. Existing WMA sites documented and sampled.
Location Roadway WMA Technologies Date Constructed
Walla Walla, Washington US-12 AQUABlack April 2010 Centreville, Virginia I-66 Astec DBG June 2010
Rapid River, Michigan County Road 513
Evotherm 3G and Advera June 2010
Baker, Montana Montana Route 322
Evotherm DAT Aug. 2010
Munster, Indiana Calumet Ave.
Evotherm 3G, Gencor foam, andHeritage wax
Sept. 2010
Jefferson County, Florida SR-30 Terex foaming system Oct. 2010
New York, New York Little Neck Pkwy.
Cecabase RT, SonneWarmix, and BituTech PER
Oct. 2010
Casa Grande, Arizona SR-84 Sasobit Dec. 2011
Table 1.9. New WMA sites documented and sampled.
Field Performance of Warm Mix Asphalt Technologies
Copyright National Academy of Sciences. All rights reserved.
18
contractor. The system foams asphalt outside of the rotating drum and then injects the foamed asphalt into the drum’s mixing chamber (10).
Organic Additives
BituTech PER. This additive is intended for use in mixes with high reclaimed asphalt pavement (RAP) or recycled asphalt shingle (RAS) contents and is reported to improve the mixing of aged and virgin binders. The product is also mar-keted under the name Hydrogreen. The product is added at 0.5–0.75% of the total weight of RAP plus RAS. It is designed to supplement the maltene phase of the asphalt binder in mixes with high RAP contents. It also helps in dispersion of asphaltenes and provides viscosity reduction which translates to a better coating of the aggregates and improved compac-tion at reduced temperatures (10).
Sasobit®. Sasobit is described as an asphalt flow improver during mixing and laydown operations because of its ability to lower the viscosity of the asphalt binder (6). This decrease in viscosity allows working temperatures to be decreased by 32–97°F (18-54°C). Sasobit has a melting temperature of about 216°F (102°C) and is completely soluble in asphalt binder at temperatures above 248°F (120°C). At tempera-tures below its melting point, Sasobit forms a crystalline network structure in the binder that leads to added stability. Sasobit has been added at rates from 0.8% to 4% by mass of the binder depending on recycled binder content and desired properties of the modified binder. It can be added to the asphalt binder or mixture by a number of different meth-ods. Sasobit can be blended directly into the asphalt binder without high-shear blending. This means direct blending can occur either at the terminal or in an asphalt tank at the contractor’s plant. For drum-mix plants, Sasobit can also be added to the mix through the RAP collar, but it is preferred to use a specially built feeder to regulate the quantity that will
be added to the drum. A pelletized form of Sasobit is typically used when adding directly to the mix. In this case, the pel-lets are blown into the drum at approximately same location where the asphalt binder is added (10).
SonneWarmix™. This high melt point, paraffinic hydro-carbon blend (wax) has also been marketed as AD-RAP and Sonneborn AR. Typical addition rates range from 0.5% to 1.5% by total binder weight (including RAP and RAS). Dos-ages greater than 0.75% are not recommended for virgin mix-tures. At these addition rates, SonneWarmix is not expected to alter the binder grade. The product must be heated to pump, liquefying between 195–200 °F (91–93 °C). SonneWarmix is generally added to the binder at the terminal or refinery (10).
Production and Construction Information
The research team collected construction data for the new projects. Documentation of the construction information for the control mix and WMA included the items listed in Table 1.10.
• Materials Information. The engineer at the plant collected the job mix formula and WMA dosage rate and adjust-ments to the mix designs.
• Target Mixing Temperature. The target mixing tempera-ture for both the HMA and WMA was obtained from the plant operator.
• Mix Moisture Content. The engineer at the plant col-lected two mix moisture contents per day of production. The samples were tested according to AASHTO T 329. The first mix moisture content sample was collected within the first hour of mix being hauled to the paving site. The sec-ond mix moisture content sample was collected 3 hours after the first sample. The moisture contents were deter-mined in the field using the ovens in the National Center for Asphalt Technology (NCAT) mobile laboratory.
Data Collected Frequency Equipment Materials information One time N/A Target mixing temperature Hourly N/A Mix moisture content Twice per production day Oven and a can Fuel usage/energy audit Hourly Dip stick or a fuel meter
Delivery temperature Hourly Temperature gun and a temperature probe
Temperature behind the screed
Hourly Temperature gun and a temperature probe
Lift thickness Once per day and then checked by cores
N/A
Densities from cores Seven per day Contractor or agency coring rig Mean texture depth Three locations per mix Sand and hockey puck
Table 1.10. Field data for existing projects.
Field Performance of Warm Mix Asphalt Technologies
Copyright National Academy of Sciences. All rights reserved.
19
• Fuel Usage/Energy Audit. A comprehensive energy audit was conducted for multiple technology projects in con-junction with stack emissions testing.
• Delivery Temperature. Delivery temperatures were recorded every 10 minutes at the beginning of each paving day until the delivery temperature stabilized. Experience has shown that the delivery temperature for both HMA and WMA will tend to fluctuate at the beginning of each paving day for the first few truckloads or any time the plant starts and stops. Once the delivery temperature had stabilized, delivery temperatures were recorded hourly. Identifying the differences in delivery temperatures between the HMA and WMA was important to compare the two types of mixes.
• Temperature Behind the Screed. Temperature readings were taken immediately behind the screed.
• Lift Thickness. The target lift thickness was obtained by the engineer at the paving site. Lift thickness measurements were obtained from cores.
• Densities from Cores. Cores were obtained after con-struction to determine the initial density of the pavement. The cores were obtained by the engineer at the paving site and the densities were determined at the main NCAT laboratory.
• Mean Texture Depth. The engineer at the site conducted the sand patch test in accordance with ASTM E 965 at three locations on the finished surface. The location of the tests was recorded using a handheld global positioning system (GPS) receiver. The sand patch test provided the mean tex-ture depth of the pavement.
Performance Monitoring
Initial Testing for Structural Homogeneity
All the mixes sampled as part of this project were sur-face mixes. The comparative performance of the WMA and HMA control sections could be influenced by the underly-ing pavement structure. To assess this on the new projects, falling weight deflectometer (FWD) testing was completed by the agency or by NCAT if agency data were not available. Arizona, Florida, and Montana provided FWD test data. Vir-ginia DOT planned on providing FWD test data, but because of equipment problems, testing was never completed. NCAT performed FWD testing for the Indiana, Michigan, and New York projects.
Generally, FWD testing was completed before placing the test mixes. The Montana testing was performed approxi-mately 3 years after the placement of the overlay. ModTag software was used to calculate the subgrade resilient modulus (Mr) and effective structural number (SNeff) of the pavement as described in the 1993 AASHTO Pavement Design Guide
(11). These data were used to assess the homogeneity of the sections. The backcalculated Mr was considered when select-ing subgrade soil properties for the Mechanistic-Empirical Pavement Design Guide (MEPDG). The FWD test results are presented in the appendix to Part 1.
Field Performance Data Collection
To collect field performance data for the projects, a mem-ber of the research team carefully reviewed the entire project length by driving and then randomly selected three evalua-tion sections per mix placed during construction (for the new projects) or during the first field performance inspection (for the existing projects). These evaluation sections were 200 ft (61 m) in length and contained the location of the original field cores taken at the time of construction. All the field per-formance inspections, regardless of whether the site was a new or existing site, included detailed visual examinations and distress mapping of each 200 ft (61 m) evaluation section to quantify the extent of cracking, rutting, raveling, patching, potholes, shoving, and bleeding. Classification of distresses was in accordance with the Distress Identification Manual for the Long-Term Pavement Performance Program (12). Rut-ting was assessed by string line measurements or 6 ft (1.8 m) straight edge. Raveling was quantified by assessing changes in surface macrotexture using the sand patch test (ASTM E 965).
Cores were obtained from one of the randomly selected evaluation sections per mix to assess in-place densification, changes in binder absorption (calculated from maximum specific gravity tests), changes in tensile strength with time, and changes in binder properties based on recovered binder testing. Three cores were taken between wheelpaths and three in the right wheelpath to assess changes in density and strength. An additional core was taken between the wheel-paths to determine the change in binder properties. Table 1.11 summarizes the field inspection activities per mix placed.
Field Performance Prediction
Although this project monitored and compared the short-term performance of WMA versus HMA sections, agencies are also concerned about the long-term performance of WMA. The MEPDG Version 1.003 software with the NCHRP Proj-ect 1-37A nationally calibrated models was used to predict the performance of the new WMA and HMA test sections. A 20-year design life was used for all the projects, although Washington State reported a 40-year design life for the pave-ment. The following paragraphs describe the data and analysis methods used in the MEPDG.
Traffic volume in vehicles per day and percent trucks were obtained from the DOT where the test sections were located. In some cases, project-specific information was provided; in
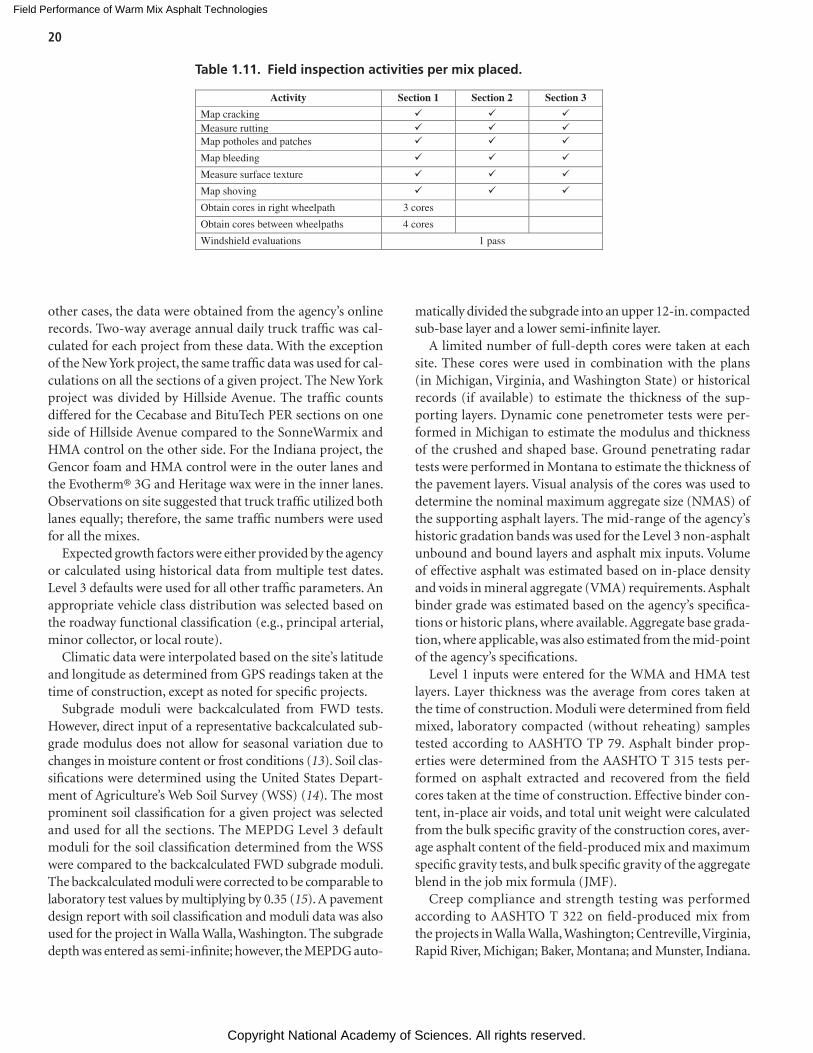
Field Performance of Warm Mix Asphalt Technologies
Copyright National Academy of Sciences. All rights reserved.
20
other cases, the data were obtained from the agency’s online records. Two-way average annual daily truck traffic was cal-culated for each project from these data. With the exception of the New York project, the same traffic data was used for cal-culations on all the sections of a given project. The New York project was divided by Hillside Avenue. The traffic counts differed for the Cecabase and BituTech PER sections on one side of Hillside Avenue compared to the SonneWarmix and HMA control on the other side. For the Indiana project, the Gencor foam and HMA control were in the outer lanes and the Evotherm® 3G and Heritage wax were in the inner lanes. Observations on site suggested that truck traffic utilized both lanes equally; therefore, the same traffic numbers were used for all the mixes.
Expected growth factors were either provided by the agency or calculated using historical data from multiple test dates. Level 3 defaults were used for all other traffic parameters. An appropriate vehicle class distribution was selected based on the roadway functional classification (e.g., principal arterial, minor collector, or local route).
Climatic data were interpolated based on the site’s latitude and longitude as determined from GPS readings taken at the time of construction, except as noted for specific projects.
Subgrade moduli were backcalculated from FWD tests. However, direct input of a representative backcalculated sub-grade modulus does not allow for seasonal variation due to changes in moisture content or frost conditions (13). Soil clas-sifications were determined using the United States Depart-ment of Agriculture’s Web Soil Survey (WSS) (14). The most prominent soil classification for a given project was selected and used for all the sections. The MEPDG Level 3 default moduli for the soil classification determined from the WSS were compared to the backcalculated FWD subgrade moduli. The backcalculated moduli were corrected to be comparable to laboratory test values by multiplying by 0.35 (15). A pavement design report with soil classification and moduli data was also used for the project in Walla Walla, Washington. The subgrade depth was entered as semi-infinite; however, the MEPDG auto-
matically divided the subgrade into an upper 12-in. compacted sub-base layer and a lower semi-infinite layer.
A limited number of full-depth cores were taken at each site. These cores were used in combination with the plans (in Michigan, Virginia, and Washington State) or historical records (if available) to estimate the thickness of the sup-porting layers. Dynamic cone penetrometer tests were per-formed in Michigan to estimate the modulus and thickness of the crushed and shaped base. Ground penetrating radar tests were performed in Montana to estimate the thickness of the pavement layers. Visual analysis of the cores was used to determine the nominal maximum aggregate size (NMAS) of the supporting asphalt layers. The mid-range of the agency’s historic gradation bands was used for the Level 3 non-asphalt unbound and bound layers and asphalt mix inputs. Volume of effective asphalt was estimated based on in-place density and voids in mineral aggregate (VMA) requirements. Asphalt binder grade was estimated based on the agency’s specifica-tions or historic plans, where available. Aggregate base grada-tion, where applicable, was also estimated from the mid-point of the agency’s specifications.
Level 1 inputs were entered for the WMA and HMA test layers. Layer thickness was the average from cores taken at the time of construction. Moduli were determined from field mixed, laboratory compacted (without reheating) samples tested according to AASHTO TP 79. Asphalt binder prop-erties were determined from the AASHTO T 315 tests per-formed on asphalt extracted and recovered from the field cores taken at the time of construction. Effective binder con-tent, in-place air voids, and total unit weight were calculated from the bulk specific gravity of the construction cores, aver-age asphalt content of the field-produced mix and maximum specific gravity tests, and bulk specific gravity of the aggregate blend in the job mix formula (JMF).
Creep compliance and strength testing was performed according to AASHTO T 322 on field-produced mix from the projects in Walla Walla, Washington; Centreville, Virginia, Rapid River, Michigan; Baker, Montana; and Munster, Indiana.
Table 1.11. Field inspection activities per mix placed.
Activity Section 1 Section 2 Section 3
Map cracking Measure rutting Map potholes and patches
Map bleeding
Measure surface texture
Map shoving
Obtain cores in right wheelpath 3 cores
Obtain cores between wheelpaths 4 cores
Windshield evaluations 1 pass
Field Performance of Warm Mix Asphalt Technologies
Copyright National Academy of Sciences. All rights reserved.
21
The MEPDG only accepts creep compliance and strength test data conducted at -4°F, 14°F, and 32°F. The samples from Rapid River were tested at lower temperatures because of the project’s PG 52-34 binder. Therefore, these data could not be used in the MEPDG. The creep compliance and strength data were entered in the MEPDG for Level 1 thermal cracking analysis for the remaining aforementioned projects. Thermal cracking was evaluated using Level 3 inputs for the projects in Rapid River, Michigan; Jefferson County, Florida; New York, New York; and Casa Grande, Arizona.
For each new project, a comparison of the surface-down cracking length and rut depth between HMA and WMA sec-tions is given in Chapter 3. For the projects where Level 1 creep compliance and strength data were available, thermal cracking comparisons are also presented. Bottom-up fatigue crack-ing is not reported because the test sections were all wearing courses and the remaining pavement structure would have a greater influence on bottom-up fatigue cracking than the overlay.
Summary comparisons are made between the predicted (50% reliability) and observed performance at the field per-formance monitoring intervals. Comparisons are also made between the WMA and HMA predicted performance at 12 and 20 years with considerations for the observed perfor-mance during the monitoring period.
Laboratory Testing of Field Mixes
Two objectives were addressed in the laboratory experi-mental plan: (1) determine the engineering properties of WMA compared to HMA, and (2) determine whether or not the recommended WMA mix design procedures are appro-priate. The information to accomplish both objectives was obtained from mixtures and materials collected from exist-ing and new WMA projects. This section details the approach adopted to address the two objectives of the laboratory research.
Engineering Properties
The first objective of the laboratory study was to deter-mine the engineering properties of WMA and control HMA. This objective was accomplished by compiling laboratory test results from materials obtained from existing and new WMA projects.
Engineering properties of plant-produced WMA and HMA were used for paired statistical comparisons. The results of the laboratory testing were also used to determine if the current testing procedures could adequately predict the performance of WMA pavements in the field. The engineering properties included those recommended in NCHRP Project 9-43 along with additional testing as agreed upon by the research team
and the NCHRP project panel. The laboratory testing pro-gram evaluated recovered binder performance grade, mixture stiffness over a wide temperature range, moisture susceptibil-ity, fatigue cracking, thermal cracking, and permanent defor-mation, as follows:
• Performance grade of extracted and recovered binder• Mixture stiffness-dynamic modulus (AASHTO TP 79)• Moisture susceptibility (AASHTO T 283)• Hamburg wheel tracking test (AASHTO T 324)• Flow number (AASHTO TP 79)• Asphalt mixture performance tester (AMPT) fatigue (sim-
plified viscoelastic continuum damage—S-VECD model)• Creep compliance and strength (AASHTO T 322)
The next sections summarize the purpose of each test selected for this study.
Recovered Binder Performance Grade
The following tests were used to extract and recover the binder from the mixes:
• AASHTO T 164, Quantitative Extraction of Asphalt Binder from Hot Mix Asphalt (HMA)—Method A using trichlo-roethylene solvent
• ASTM D5404, Practice for Recovery of Asphalt from Solu-tion Using the Rotary Evaporator
Tests were run to determine the performance grade (PG) of the recovered binders according to AASHTO M 320, Per-formance Graded Asphalt Binder, and AASHTO R 29, Grading or Verifying the Performance Grade (PG) of an Asphalt Binder, as follows:
• AASHTO T 316, Viscosity Determination of Asphalt at Elevated Temperatures Using a Rotational Viscometer
• AASHTO R 28, Accelerated Aging of Asphalt Binder Using a Pressurized Aging Vessel (PAV)
• AASHTO T 315, Determining the Rheological Proper-ties of Asphalt Binder Using a Dynamic Shear Rheometer (DSR)
• AASHTO T 313, Determining the Flexural Creep Stiffness of Asphalt Binder Using the Bending Beam Rheometer (BBR)
Extracted and recovered asphalt binders were considered to be already short-term aged; therefore the Rolling Thin Film Oven (RTFO) aging procedure normally used to short-term age binders was eliminated. The high temperature grade was determined by testing the as-recovered binder in the DSR at high temperatures as an RTFO-aged binder. The recovered
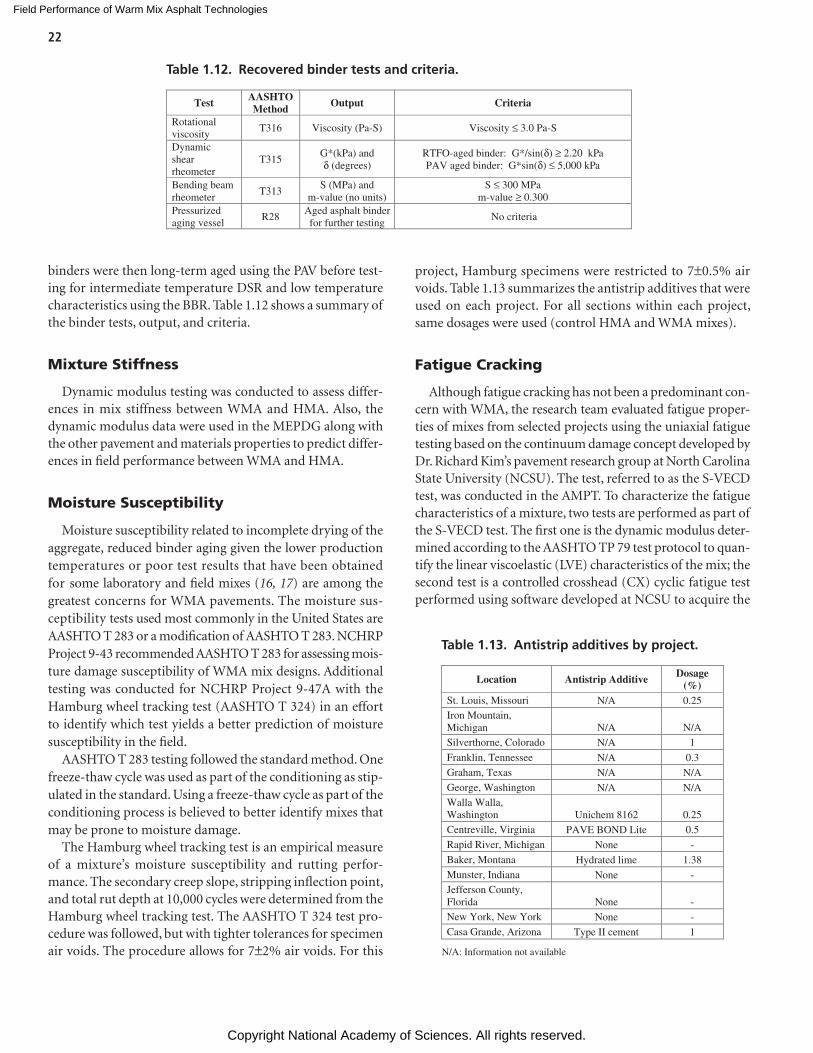
Field Performance of Warm Mix Asphalt Technologies
Copyright National Academy of Sciences. All rights reserved.
22
binders were then long-term aged using the PAV before test-ing for intermediate temperature DSR and low temperature characteristics using the BBR. Table 1.12 shows a summary of the binder tests, output, and criteria.
Mixture Stiffness
Dynamic modulus testing was conducted to assess differ-ences in mix stiffness between WMA and HMA. Also, the dynamic modulus data were used in the MEPDG along with the other pavement and materials properties to predict differ-ences in field performance between WMA and HMA.
Moisture Susceptibility
Moisture susceptibility related to incomplete drying of the aggregate, reduced binder aging given the lower production temperatures or poor test results that have been obtained for some laboratory and field mixes (16, 17) are among the greatest concerns for WMA pavements. The moisture sus-ceptibility tests used most commonly in the United States are AASHTO T 283 or a modification of AASHTO T 283. NCHRP Project 9-43 recommended AASHTO T 283 for assessing mois-ture damage susceptibility of WMA mix designs. Additional testing was conducted for NCHRP Project 9-47A with the Hamburg wheel tracking test (AASHTO T 324) in an effort to identify which test yields a better prediction of moisture susceptibility in the field.
AASHTO T 283 testing followed the standard method. One freeze-thaw cycle was used as part of the conditioning as stip-ulated in the standard. Using a freeze-thaw cycle as part of the conditioning process is believed to better identify mixes that may be prone to moisture damage.
The Hamburg wheel tracking test is an empirical measure of a mixture’s moisture susceptibility and rutting perfor-mance. The secondary creep slope, stripping inflection point, and total rut depth at 10,000 cycles were determined from the Hamburg wheel tracking test. The AASHTO T 324 test pro-cedure was followed, but with tighter tolerances for specimen air voids. The procedure allows for 7±2% air voids. For this
project, Hamburg specimens were restricted to 7±0.5% air voids. Table 1.13 summarizes the antistrip additives that were used on each project. For all sections within each project, same dosages were used (control HMA and WMA mixes).
Fatigue Cracking
Although fatigue cracking has not been a predominant con-cern with WMA, the research team evaluated fatigue proper-ties of mixes from selected projects using the uniaxial fatigue testing based on the continuum damage concept developed by Dr. Richard Kim’s pavement research group at North Carolina State University (NCSU). The test, referred to as the S-VECD test, was conducted in the AMPT. To characterize the fatigue characteristics of a mixture, two tests are performed as part of the S-VECD test. The first one is the dynamic modulus deter-mined according to the AASHTO TP 79 test protocol to quan-tify the linear viscoelastic (LVE) characteristics of the mix; the second test is a controlled crosshead (CX) cyclic fatigue test performed using software developed at NCSU to acquire the
Test AASHTO Method
Output Criteria
Rotational viscosity
T316 Viscosity (Pa-S) Viscosity ≤ 3.0 Pa-S
Dynamic shear rheometer
T315 G*(kPa) and δ (degrees)
RTFO-aged binder: G*/sin(δ) ≥ 2.20 kPa PAV aged binder: G*sin(δ) ≤ 5,000 kPa
Bending beam rheometer
T313 S (MPa) and
m-value (no units) S ≤ 300 MPa
m-value ≥ 0.300 Pressurized aging vessel
R28 Aged asphalt binder for further testing
No criteria
Table 1.12. Recovered binder tests and criteria.
Location Antistrip Additive Dosage (%)
St. Louis, Missouri N/A 0.25 Iron Mountain, Michigan N/A N/A Silverthorne, Colorado N/A 1
Franklin, Tennessee N/A 0.3 Graham, Texas N/A N/A George, Washington N/A N/A Walla Walla, Washington Unichem 8162 0.25 Centreville, Virginia PAVE BOND Lite 0.5 Rapid River, Michigan None -
Baker, Montana Hydrated lime 1.38 Munster, Indiana None - Jefferson County, Florida None -
New York, New York None - Casa Grande, Arizona Type II cement 1
N/A: Information not available
Table 1.13. Antistrip additives by project.
Field Performance of Warm Mix Asphalt Technologies
Copyright National Academy of Sciences. All rights reserved.
23
necessary fatigue data. The complete theoretical background of this method can be found elsewhere (18).
The results of the fatigue testing for this study were also used to compare WMA and HMA fatigue properties. The mixtures used in the fatigue testing experiments came from the three multiple technology projects.
Thermal Cracking
Thermal cracking, like fatigue cracking, may be improved for WMA compared to HMA because WMA binders are aged less during production. An exception may exist for Sasobit and similar organic additives. Asphalt binders containing Sasobit typically have an increase in the critical low temperature, which indicates that those mixes may be slightly more prone to thermal cracking. However, a demonstration site using a wax additive in northern Michigan did not exhibit any ther-mal cracking after 2 years (19).
A preliminary recommendation from NCHRP Project 9-43 was to evaluate thermal cracking properties of WMA using the indirect tensile (IDT) creep compliance and strength tests (AASHTO T 322). The research team tested thermal crack-ing potential using AASHTO T 322 on mixes from a limited number of sites where there was a higher potential for thermal cracking. The selected projects were: Walla, Walla, Washington, Centreville, Virginia, Rapid River, Michigan, Baker, Montana and Munster, Indiana.
The IDT system was used to collect the necessary data for the critical cracking temperature analysis. The testing was con-ducted using an MTS load frame equipped with an environ-mental chamber capable of maintaining the low temperatures required for this test. Creep compliance was measured at 0°C, -10°C, and -20°C, and tensile strength at -10°C in accordance with AASHTO T 322. Lower test temperatures (-10°C, -20°C, and -30°C) and tensile strength at -20°C were used for the Michigan site to correspond with the PG 52-34 binder used on that project. Four samples were prepared for each mix. The first sample was used to find a suitable creep load for that par-ticular mix at each testing temperature. The remaining three samples were tested at this load. Specimens used for the creep and strength tests were prepared to 7±0.5% air voids.
Permanent Deformation
Reduced aging of binders because of the lower WMA mix production temperatures may result in WMA mixes being more prone to permanent deformation, particularly early in their service lives. Although field results, thus far, have not indicated that rutting is an issue, some laboratory permanent deformation tests have indicated a potential for more rut-ting. Tests that have been used for evaluating WMA perma-nent deformation include the Asphalt Pavement Analyzer rut
test, the Hamburg wheel tracking test, and the flow number. NCHRP Project 9-43 recommended that flow number testing be used to evaluate the permanent deformation potential of WMA during mix design.
Before beginning this study, FHWA and NCAT had per-formed flow number tests on confined specimens with a deviator stress of 100 psi, a confining pressure of 10 psi, and a target air void content of 7±0.5%. NCHRP Project 9-33 recommended testing unconfined specimens (target air void content of 7±0.5%) at the 50% reliability high temperature determined from LTPPBind software (20). Confined tests were believed to better represent field conditions and more accurately predict the performance of certain mix types, such as stone matrix asphalt. The research team conducted some flow number tests using both methods, confined and uncon-fined, so that the recommendations from NCHRP Project 9-43 could be evaluated and to provide additional informa-tion regarding which test condition best matches field perfor-mance. The results of the Hamburg testing were also used to evaluate rutting susceptibility of WMA compared to HMA.
Summary of Laboratory Performance Testing
A variety of laboratory tests were conducted to evaluate the mix properties of WMA. The results of all tests were used to compare the engineering properties of WMA to those of HMA. Table 1.14 summarizes the testing for each of the new projects.
Mix Design Verifications
The second objective of the laboratory experiment was to determine whether the recommended WMA mix design pro-cedures are appropriate. Part of this evaluation was based on whether WMA mixes produced in the laboratory matched those produced in the field.
The mixes from the multi-technology projects (Michigan, Indiana, and New York) along with the mixes from two single-technology sites (Montana and Florida) were verified according to the Draft Appendix to AASHTO R 35: Special Mixture Design Considerations and Methods for Warm Mix Asphalt (WMA) presented in NCHRP Report 691: Mix Design Practices for Warm Mix Asphalt, the published final report of NCHRP Project 9-43 (21). This selection provided a range of WMA technologies, aggregate types, and production and compaction temperatures.
Determination of Optimum Asphalt Content
The same HMA and WMA design, in terms of target asphalt content and gradation, was used by the contractor for all the
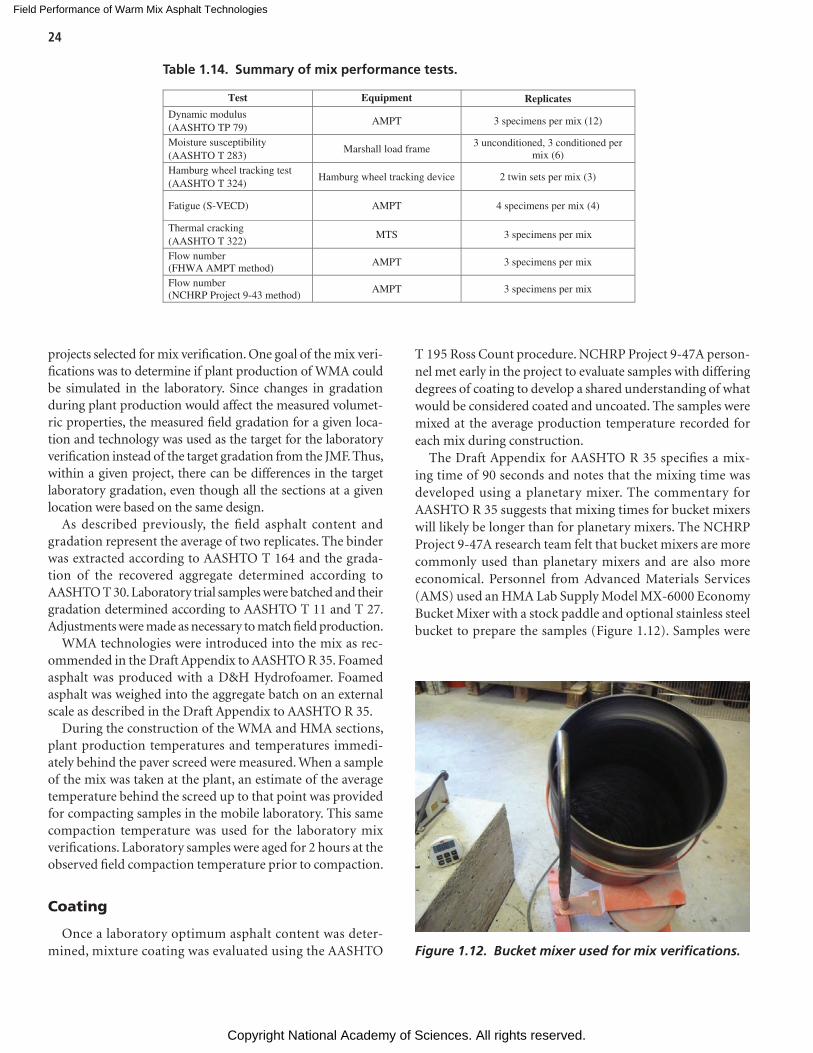
Field Performance of Warm Mix Asphalt Technologies
Copyright National Academy of Sciences. All rights reserved.
24
projects selected for mix verification. One goal of the mix veri-fications was to determine if plant production of WMA could be simulated in the laboratory. Since changes in gradation during plant production would affect the measured volumet-ric properties, the measured field gradation for a given loca-tion and technology was used as the target for the laboratory verification instead of the target gradation from the JMF. Thus, within a given project, there can be differences in the target laboratory gradation, even though all the sections at a given location were based on the same design.
As described previously, the field asphalt content and gradation represent the average of two replicates. The binder was extracted according to AASHTO T 164 and the grada-tion of the recovered aggregate determined according to AASHTO T 30. Laboratory trial samples were batched and their gradation determined according to AASHTO T 11 and T 27. Adjustments were made as necessary to match field production.
WMA technologies were introduced into the mix as rec-ommended in the Draft Appendix to AASHTO R 35. Foamed asphalt was produced with a D&H Hydrofoamer. Foamed asphalt was weighed into the aggregate batch on an external scale as described in the Draft Appendix to AASHTO R 35.
During the construction of the WMA and HMA sections, plant production temperatures and temperatures immedi-ately behind the paver screed were measured. When a sample of the mix was taken at the plant, an estimate of the average temperature behind the screed up to that point was provided for compacting samples in the mobile laboratory. This same compaction temperature was used for the laboratory mix verifications. Laboratory samples were aged for 2 hours at the observed field compaction temperature prior to compaction.
Coating
Once a laboratory optimum asphalt content was deter-mined, mixture coating was evaluated using the AASHTO
T 195 Ross Count procedure. NCHRP Project 9-47A person-nel met early in the project to evaluate samples with differing degrees of coating to develop a shared understanding of what would be considered coated and uncoated. The samples were mixed at the average production temperature recorded for each mix during construction.
The Draft Appendix for AASHTO R 35 specifies a mix-ing time of 90 seconds and notes that the mixing time was developed using a planetary mixer. The commentary for AASHTO R 35 suggests that mixing times for bucket mixers will likely be longer than for planetary mixers. The NCHRP Project 9-47A research team felt that bucket mixers are more commonly used than planetary mixers and are also more economical. Personnel from Advanced Materials Services (AMS) used an HMA Lab Supply Model MX-6000 Economy Bucket Mixer with a stock paddle and optional stainless steel bucket to prepare the samples (Figure 1.12). Samples were
Test Equipment Replicates
Dynamic modulus (AASHTO TP 79)
AMPT 3 specimens per mix (12)
Moisture susceptibility (AASHTO T 283)
Marshall load frame 3 unconditioned, 3 conditioned per
mix (6)
Hamburg wheel tracking test (AASHTO T 324)
Hamburg wheel tracking device 2 twin sets per mix (3)
Fatigue (S-VECD) AMPT 4 specimens per mix (4)
Thermal cracking (AASHTO T 322)
MTS 3 specimens per mix
Flow number (FHWA AMPT method)
AMPT 3 specimens per mix
Flow number (NCHRP Project 9-43 method)
AMPT 3 specimens per mix
Table 1.14. Summary of mix performance tests.
Figure 1.12. Bucket mixer used for mix verifications.
Field Performance of Warm Mix Asphalt Technologies
Copyright National Academy of Sciences. All rights reserved.
25
mixed for the 90 seconds specified in the Draft Appendix to AASHTO R 35. If the mixture produced a degree of coat-ing that failed the specification compared to the field result, a longer mixing time would be tried. If the field degree of coating still could not be achieved, then a planetary mixer would be tried.
Compactability
To evaluate the proposed compaction temperature, the Draft Appendix to AASHTO R 35 specifies that the ratio of the number of gyrations to 92% density at 30°C (54°F) below the proposed compaction temperature to the number of gyrations to 92% density at the proposed compaction tem-perature must be less than 1.25. The ratio is based on work by Leiva and West (22). Both sets of samples are mixed and aged at the same temperature. One set is allowed to cool prior to compaction.
Moisture Susceptibility
Similar to Superpave mix design, the Draft Appendix to AASHTO R 35 specifies the tensile strength ratio (TSR) test according to AASHTO T 283 for WMA mix design. This pro-cedure was used in the mix verifications. The tests were con-ducted at optimum asphalt content. Aging was in accordance
with the test procedure. One freeze-thaw cycle was included as specified.
Rutting Resistance
For projects with greater than 3 million design ESALs, the Draft Appendix to AASHTO R 35 specifies the flow number test to evaluate rutting resistance. Samples were fabricated according to AASHTO PP 60. Cored and sawed samples were prepared at 7.0 ±1.0% air voids. Flow number tests were per-formed according to AASHTO TP 79. Tests were conducted at the 50% reliability design temperature determined using LTPPBind Version 3.1 at a depth of 20 mm from the surface of the pavement.
Summary Comparisons
For each project verified, summary comparisons were made between the field and laboratory produced mixes. Compari-sons included volumetric properties, optimum asphalt con-tent, maximum specific gravity, binder absorption, coating, and moisture susceptibility. Comparisons were also made between compactability and in-place density achieved in the field. A summary discussion is provided on the observed changes in optimum asphalt content compared to the HMA and field performance.
Field Performance of Warm Mix Asphalt Technologies
Copyright National Academy of Sciences. All rights reserved.
26
The existing and new projects are discussed in the chrono-logical order of their construction.
Existing Projects
St. Louis, Missouri
This field trial was placed on Hall Street in St. Louis, Mis-souri. Hall Street is a 4-lane roadway with an additional center turn lane through a heavily trafficked industrial area (23). The approximate average annual daily traffic (AADT) for this por-tion of Hall Street was 21,000 vehicles per day and 7% trucks. The contractor for this project was Pace Construction Com-pany, St. Louis, Missouri. The original surface was a con-crete pavement that had been overlaid with hot mix asphalt (HMA). The reflective cracking in the existing HMA was sealed with a rubberized asphalt sealant. This project origi-nally consisted of another 2-in. HMA overlay to be placed over the existing pavement. However, during paving in cool weather, bumps began to form over the sealed cracks. It was believed that by using warm mix asphalt (WMA) in lieu of HMA, the lower placement temperatures might prevent the reflective bumps from occurring because the crack sealant would expand less.
The project was constructed over a 10-day period in May 2006 using three WMA technologies: Aspha-min®, Sasobit®, and Evotherm® ET. The job mix formula (JMF) for all mixes consisted of 12.5-mm nominal maximum aggregate size (NMAS) Superpave mixture compacted to 100 gyrations. A portion of the HMA had previously been placed in the fall of 2005. The mixture used limestone and porphyry aggregates and contained 10% reclaimed asphalt pavement (RAP). The asphalt binder used in the mixtures was a polymer-modified PG 70-22 with an antistripping agent (ARR MAZ) added at a rate of 0.25% by weight of virgin asphalt. The aggregate stockpile percentages used are shown in Table 1.15, and the design aggregate gradation, asphalt content, and volumetric properties are shown in Table 1.16.
Production
The Evotherm ET addition rate was adjusted so that the resulting asphalt binder residue equaled the control HMA mix design content. Aspha-min was added at a rate of 0.30% by weight of total mix, while the Sasobit was added at a rate of 1.5% by weight of total asphalt binder. The Sasobit was added using a feeder system that injected the material directly into the mixture at the point where the asphalt binder entered the drum. The Aspha-min was added at this same location.
The production temperature for the control HMA was 320°F. The Sasobit mix was originally produced at 275°F. Once the in-place densities and constructability were deemed acceptable, the production temperature for the Sasobit mix was decreased to 240°F. The Evotherm ET mix was produced at 275°F and then decreased to 250°F. It was further decreased to 225°F once the 250°F temperature was deemed acceptable. The Aspha-min mix was produced at 275°F. Table 1.17 shows the production temperatures used for each WMA technology.
The plant used to produce these mixes was a CMI counter-flow drum plant using recycled oil for the burner fuel. The plant is shown in Figure 1.13. The average production rate was approximately 200–250 tons per hour for all of the WMA sections.
Volumetric Mix Properties
During production, loose mix samples were taken from the end-dump trucks before they left the plant. Samples were typically taken twice a day, once at the beginning of production and once towards the end of production. For each field sam-ple, six volumetric specimens were compacted on-site without significant reheating. Samples were placed in an oven for approximately 30 minutes to account for the heat loss that occurred between sampling and splitting. A second set of vol-umetric samples was compacted with reheated mix to simu-late the comparison between the contractor’s data and the data from the state department of transportation (DOT). All
C H A P T E R 3
WMA Field Projects
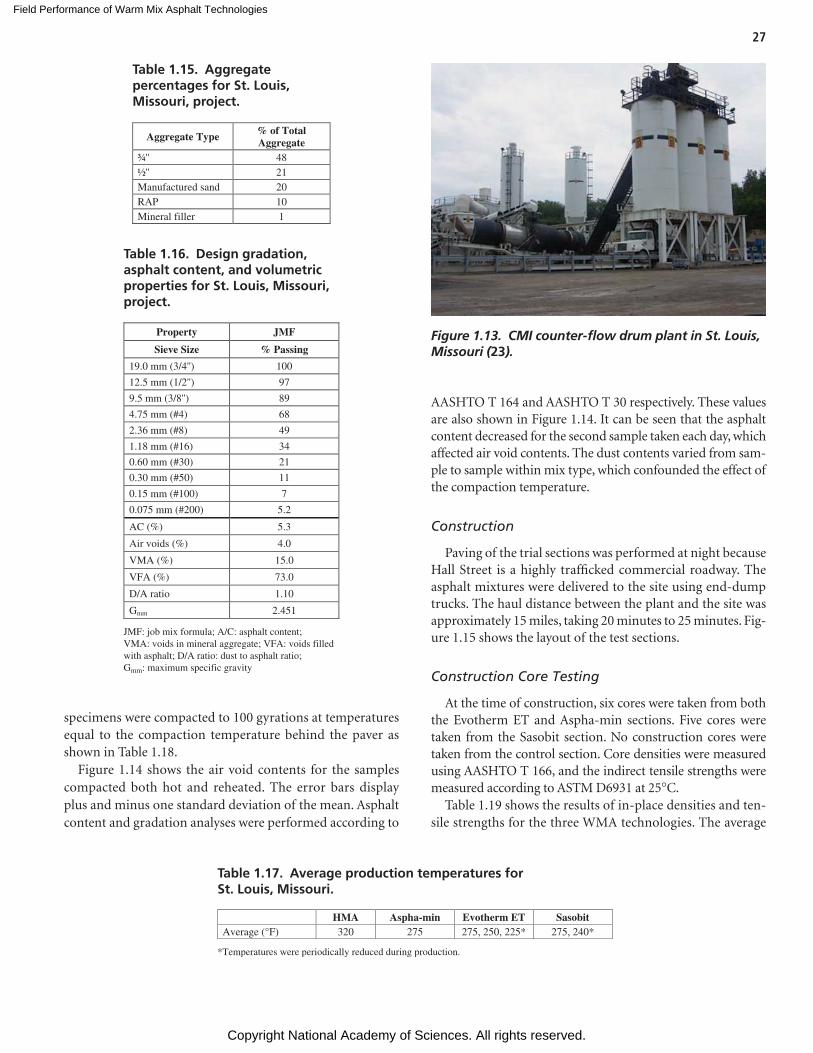
Field Performance of Warm Mix Asphalt Technologies
Copyright National Academy of Sciences. All rights reserved.
27
specimens were compacted to 100 gyrations at temperatures equal to the compaction temperature behind the paver as shown in Table 1.18.
Figure 1.14 shows the air void contents for the samples compacted both hot and reheated. The error bars display plus and minus one standard deviation of the mean. Asphalt content and gradation analyses were performed according to
AASHTO T 164 and AASHTO T 30 respectively. These values are also shown in Figure 1.14. It can be seen that the asphalt content decreased for the second sample taken each day, which affected air void contents. The dust contents varied from sam-ple to sample within mix type, which confounded the effect of the compaction temperature.
Construction
Paving of the trial sections was performed at night because Hall Street is a highly trafficked commercial roadway. The asphalt mixtures were delivered to the site using end-dump trucks. The haul distance between the plant and the site was approximately 15 miles, taking 20 minutes to 25 minutes. Fig-ure 1.15 shows the layout of the test sections.
Construction Core Testing
At the time of construction, six cores were taken from both the Evotherm ET and Aspha-min sections. Five cores were taken from the Sasobit section. No construction cores were taken from the control section. Core densities were measured using AASHTO T 166, and the indirect tensile strengths were measured according to ASTM D6931 at 25°C.
Table 1.19 shows the results of in-place densities and ten-sile strengths for the three WMA technologies. The average
Aggregate Type % of Total Aggregate
¾'' 48 ½'' 21 Manufactured sand 20 RAP 10 Mineral filler 1
Table 1.15. Aggregate percentages for St. Louis, Missouri, project.
Property JMF
Sieve Size % Passing
19.0 mm (3/4'') 100
12.5 mm (1/2'') 97
9.5 mm (3/8'') 89
4.75 mm (#4) 68
2.36 mm (#8) 49
1.18 mm (#16) 34
0.60 mm (#30) 21
0.30 mm (#50) 11
0.15 mm (#100) 7
0.075 mm (#200) 5.2
AC (%) 5.3
Air voids (%) 4.0
VMA (%) 15.0
VFA (%) 73.0
D/A ratio 1.10
Gmm 2.451
JMF: job mix formula; A/C: asphalt content; VMA: voids in mineral aggregate; VFA: voids filledwith asphalt; D/A ratio: dust to asphalt ratio;Gmm: maximum specific gravity
Table 1.16. Design gradation, asphalt content, and volumetric properties for St. Louis, Missouri, project.
Table 1.17. Average production temperatures for St. Louis, Missouri.
HMA Aspha-min Evotherm ET Sasobit Average (°F) 320 275 275, 250, 225* 275, 240*
*Temperatures were periodically reduced during production.
Figure 1.13. CMI counter-flow drum plant in St. Louis, Missouri (23).
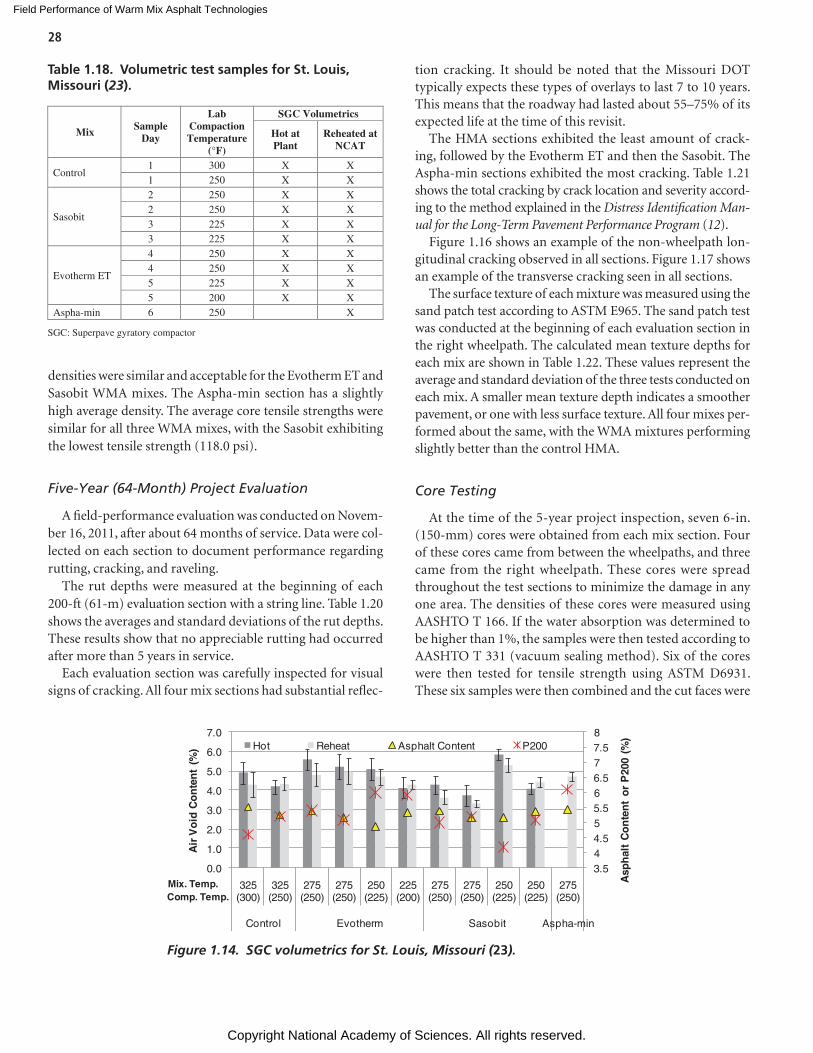
Field Performance of Warm Mix Asphalt Technologies
Copyright National Academy of Sciences. All rights reserved.
28
Mix Sample Day
Lab Compaction Temperature
(°F)
SGC Volumetrics
Hot at Plant
Reheated at NCAT
Control 1 300 X X 1 250 X X
Sasobit
2 250 X X 2 250 X X 3 225 X X 3 225 X X
Evotherm ET
4 250 X X 4 250 X X 5 225 X X 5 200 X X
Aspha-min 6 250 X
SGC: Superpave gyratory compactor
Table 1.18. Volumetric test samples for St. Louis, Missouri (23).
3.544.555.566.577.58
0.0
1.0
2.0
3.0
4.0
5.0
6.0
7.0
325 (300)
325 (250)
275 (250)
275 (250)
250 (225)
225 (200)
275 (250)
275 (250)
250 (225)
250 (225)
275 (250)
Control Evotherm Sasobit Aspha-min
Asp
hal
t C
on
ten
t o
r P
200
(%)
Air
Vo
id C
on
ten
t (%
) Hot Reheat Asphalt Content P200
Mix. Temp.Comp. Temp.
Figure 1.14. SGC volumetrics for St. Louis, Missouri (23).
densities were similar and acceptable for the Evotherm ET and Sasobit WMA mixes. The Aspha-min section has a slightly high average density. The average core tensile strengths were similar for all three WMA mixes, with the Sasobit exhibiting the lowest tensile strength (118.0 psi).
Five-Year (64-Month) Project Evaluation
A field-performance evaluation was conducted on Novem-ber 16, 2011, after about 64 months of service. Data were col-lected on each section to document performance regarding rutting, cracking, and raveling.
The rut depths were measured at the beginning of each 200-ft (61-m) evaluation section with a string line. Table 1.20 shows the averages and standard deviations of the rut depths. These results show that no appreciable rutting had occurred after more than 5 years in service.
Each evaluation section was carefully inspected for visual signs of cracking. All four mix sections had substantial reflec-
tion cracking. It should be noted that the Missouri DOT typically expects these types of overlays to last 7 to 10 years. This means that the roadway had lasted about 55–75% of its expected life at the time of this revisit.
The HMA sections exhibited the least amount of crack-ing, followed by the Evotherm ET and then the Sasobit. The Aspha-min sections exhibited the most cracking. Table 1.21 shows the total cracking by crack location and severity accord-ing to the method explained in the Distress Identification Man-ual for the Long-Term Pavement Performance Program (12).
Figure 1.16 shows an example of the non-wheelpath lon-gitudinal cracking observed in all sections. Figure 1.17 shows an example of the transverse cracking seen in all sections.
The surface texture of each mixture was measured using the sand patch test according to ASTM E965. The sand patch test was conducted at the beginning of each evaluation section in the right wheelpath. The calculated mean texture depths for each mix are shown in Table 1.22. These values represent the average and standard deviation of the three tests conducted on each mix. A smaller mean texture depth indicates a smoother pavement, or one with less surface texture. All four mixes per-formed about the same, with the WMA mixtures performing slightly better than the control HMA.
Core Testing
At the time of the 5-year project inspection, seven 6-in. (150-mm) cores were obtained from each mix section. Four of these cores came from between the wheelpaths, and three came from the right wheelpath. These cores were spread throughout the test sections to minimize the damage in any one area. The densities of these cores were measured using AASHTO T 166. If the water absorption was determined to be higher than 1%, the samples were then tested according to AASHTO T 331 (vacuum sealing method). Six of the cores were then tested for tensile strength using ASTM D6931. These six samples were then combined and the cut faces were
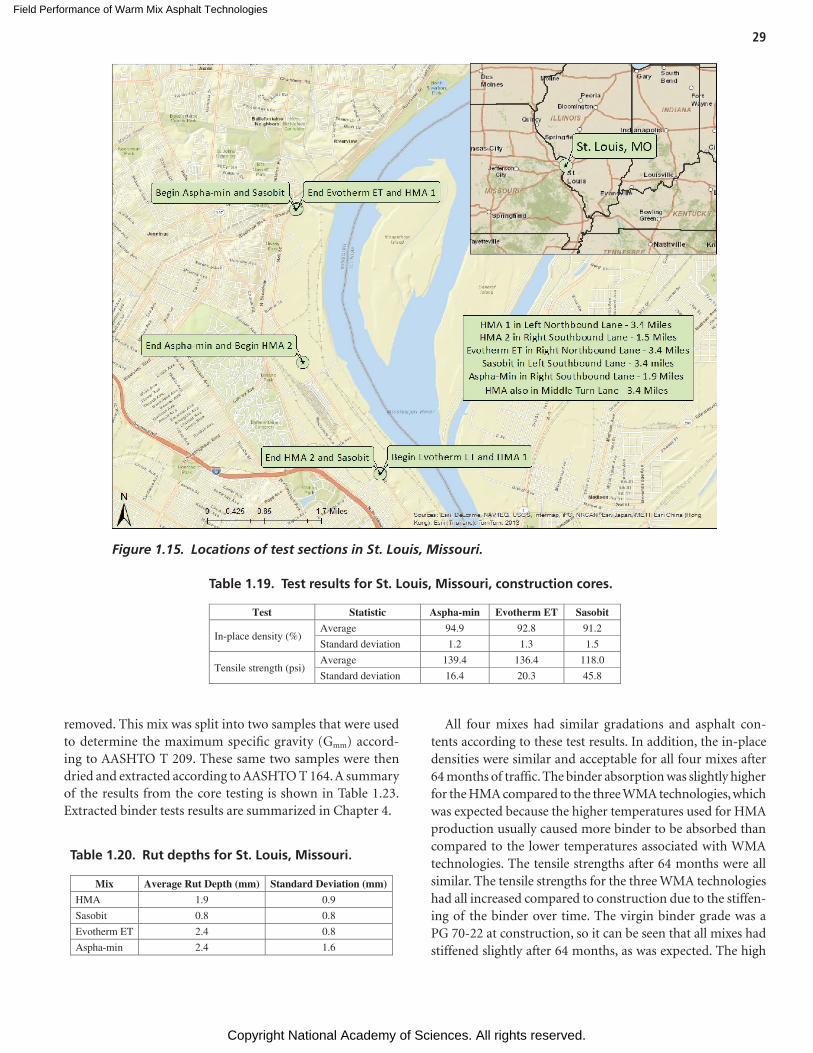
Field Performance of Warm Mix Asphalt Technologies
Copyright National Academy of Sciences. All rights reserved.
29
Figure 1.15. Locations of test sections in St. Louis, Missouri.
Test Statistic Aspha-min Evotherm ET Sasobit
In-place density (%) Average 94.9 92.8 91.2
Standard deviation 1.2 1.3 1.5
Tensile strength (psi) Average 139.4 136.4 118.0
Standard deviation 16.4 20.3 45.8
Table 1.19. Test results for St. Louis, Missouri, construction cores.
Table 1.20. Rut depths for St. Louis, Missouri.
Mix Average Rut Depth (mm) Standard Deviation (mm)
HMA 1.9 0.9
Sasobit 0.8 0.8
Evotherm ET 2.4 0.8
Aspha-min 2.4 1.6
removed. This mix was split into two samples that were used to determine the maximum specific gravity (Gmm) accord-ing to AASHTO T 209. These same two samples were then dried and extracted according to AASHTO T 164. A summary of the results from the core testing is shown in Table 1.23. Extracted binder tests results are summarized in Chapter 4.
All four mixes had similar gradations and asphalt con-tents according to these test results. In addition, the in-place densities were similar and acceptable for all four mixes after 64 months of traffic. The binder absorption was slightly higher for the HMA compared to the three WMA technologies, which was expected because the higher temperatures used for HMA production usually caused more binder to be absorbed than compared to the lower temperatures associated with WMA technologies. The tensile strengths after 64 months were all similar. The tensile strengths for the three WMA technologies had all increased compared to construction due to the stiffen-ing of the binder over time. The virgin binder grade was a PG 70-22 at construction, so it can be seen that all mixes had stiffened slightly after 64 months, as was expected. The high
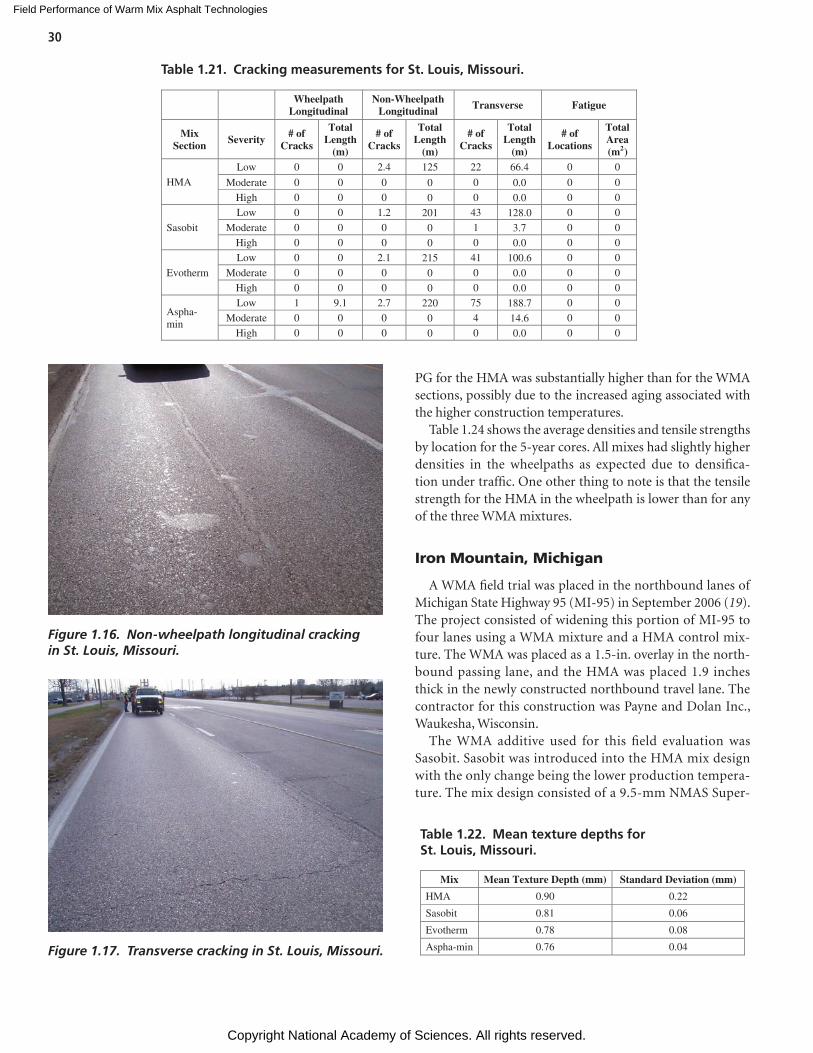
Field Performance of Warm Mix Asphalt Technologies
Copyright National Academy of Sciences. All rights reserved.
30
PG for the HMA was substantially higher than for the WMA sections, possibly due to the increased aging associated with the higher construction temperatures.
Table 1.24 shows the average densities and tensile strengths by location for the 5-year cores. All mixes had slightly higher densities in the wheelpaths as expected due to densifica-tion under traffic. One other thing to note is that the tensile strength for the HMA in the wheelpath is lower than for any of the three WMA mixtures.
Iron Mountain, Michigan
A WMA field trial was placed in the northbound lanes of Michigan State Highway 95 (MI-95) in September 2006 (19). The project consisted of widening this portion of MI-95 to four lanes using a WMA mixture and a HMA control mix-ture. The WMA was placed as a 1.5-in. overlay in the north-bound passing lane, and the HMA was placed 1.9 inches thick in the newly constructed northbound travel lane. The contractor for this construction was Payne and Dolan Inc., Waukesha, Wisconsin.
The WMA additive used for this field evaluation was Sasobit. Sasobit was introduced into the HMA mix design with the only change being the lower production tempera-ture. The mix design consisted of a 9.5-mm NMAS Super-
Wheelpath
Longitudinal Non-Wheelpath
Longitudinal Transverse Fatigue
Mix Section Severity # of
Cracks
Total Length
(m)
# of Cracks
Total Length
(m)
# of Cracks
Total Length
(m)
# of Locations
Total Area (m )2
HMA
Low 0 0 2.4 125 22 66.4 0 0
Moderate 0 0 0 0 0 0.0 0 0
High 0 0 0 0 0 0.0 0 0
Sasobit
Low 0 0 1.2 201 43 128.0 0 0
Moderate 0 0 0 0 1 3.7 0 0
High 0 0 0 0 0 0.0 0 0
Evotherm
Low 0 0 2.1 215 41 100.6 0 0
Moderate 0 0 0 0 0 0.0 0 0
High 0 0 0 0 0 0.0 0 0
Aspha-min
Low 1 9.1 2.7 220 75 188.7 0 0
Moderate 0 0 0 0 4 14.6 0 0
High 0 0 0 0 0 0.0 0 0
Table 1.21. Cracking measurements for St. Louis, Missouri.
Figure 1.16. Non-wheelpath longitudinal cracking in St. Louis, Missouri.
Figure 1.17. Transverse cracking in St. Louis, Missouri.
Mix Mean Texture Depth (mm) Standard Deviation (mm)
HMA 0.90 0.22
Sasobit 0.81 0.06
Evotherm 0.78 0.08
Aspha-min 0.76 0.04
Table 1.22. Mean texture depths for St. Louis, Missouri.
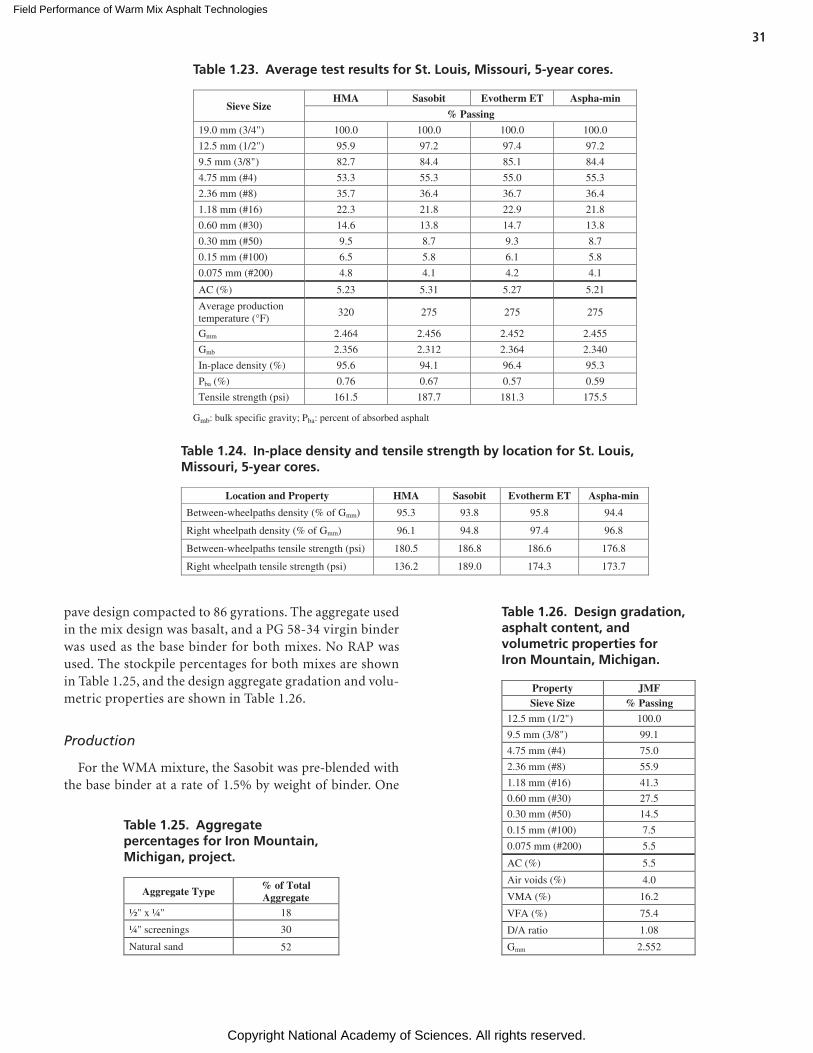
Field Performance of Warm Mix Asphalt Technologies
Copyright National Academy of Sciences. All rights reserved.
31
pave design compacted to 86 gyrations. The aggregate used in the mix design was basalt, and a PG 58-34 virgin binder was used as the base binder for both mixes. No RAP was used. The stockpile percentages for both mixes are shown in Table 1.25, and the design aggregate gradation and volu-metric properties are shown in Table 1.26.
Production
For the WMA mixture, the Sasobit was pre-blended with the base binder at a rate of 1.5% by weight of binder. One
Sieve Size HMA Sasobit Evotherm ET Aspha-min
% Passing
19.0 mm (3/4") 100.0 100.0 100.0 100.0
12.5 mm (1/2") 95.9 97.2 97.4 97.2
9.5 mm (3/8") 82.7 84.4 85.1 84.4
4.75 mm (#4) 53.3 55.3 55.0 55.3
2.36 mm (#8) 35.7 36.4 36.7 36.4
1.18 mm (#16) 22.3 21.8 22.9 21.8
0.60 mm (#30) 14.6 13.8 14.7 13.8
0.30 mm (#50) 9.5 8.7 9.3 8.7
0.15 mm (#100) 6.5 5.8 6.1 5.8
0.075 mm (#200) 4.8 4.1 4.2 4.1
AC (%) 5.23 5.31 5.27 5.21
Average production temperature (°F)
320 275 275 275
Gmm 2.464 2.456 2.452 2.455
Gmb 2.356 2.312 2.364 2.340
In-place density (%) 95.6 94.1 96.4 95.3
Pba (%) 0.76 0.67 0.57 0.59
Tensile strength (psi) 161.5 187.7 181.3 175.5
Gmb: bulk specific gravity; Pba: percent of absorbed asphalt
Table 1.23. Average test results for St. Louis, Missouri, 5-year cores.
Aggregate Type % of Total Aggregate
½" x ¼" 18
¼" screenings 30
Natural sand 52
Location and Property HMA Sasobit Evotherm ET Aspha-min
Between-wheelpaths density (% of Gmm) 95.3 93.8 95.8 94.4
Right wheelpath density (% of Gmm) 96.1 94.8 97.4 96.8
Between-wheelpaths tensile strength (psi) 180.5 186.8 186.6 176.8
Right wheelpath tensile strength (psi) 136.2 189.0 174.3 173.7
Table 1.24. In-place density and tensile strength by location for St. Louis, Missouri, 5-year cores.
Table 1.25. Aggregate percentages for Iron Mountain, Michigan, project.
Property JMF Sieve Size % Passing
12.5 mm (1/2") 100.0
9.5 mm (3/8") 99.1
4.75 mm (#4) 75.0
2.36 mm (#8) 55.9
1.18 mm (#16) 41.3
0.60 mm (#30) 27.5
0.30 mm (#50) 14.5
0.15 mm (#100) 7.5
0.075 mm (#200) 5.5
AC (%) 5.5
Air voids (%) 4.0
VMA (%) 16.2
VFA (%) 75.4
D/A ratio 1.08
Gmm 2.552
Table 1.26. Design gradation, asphalt content, and volumetric properties for Iron Mountain, Michigan.
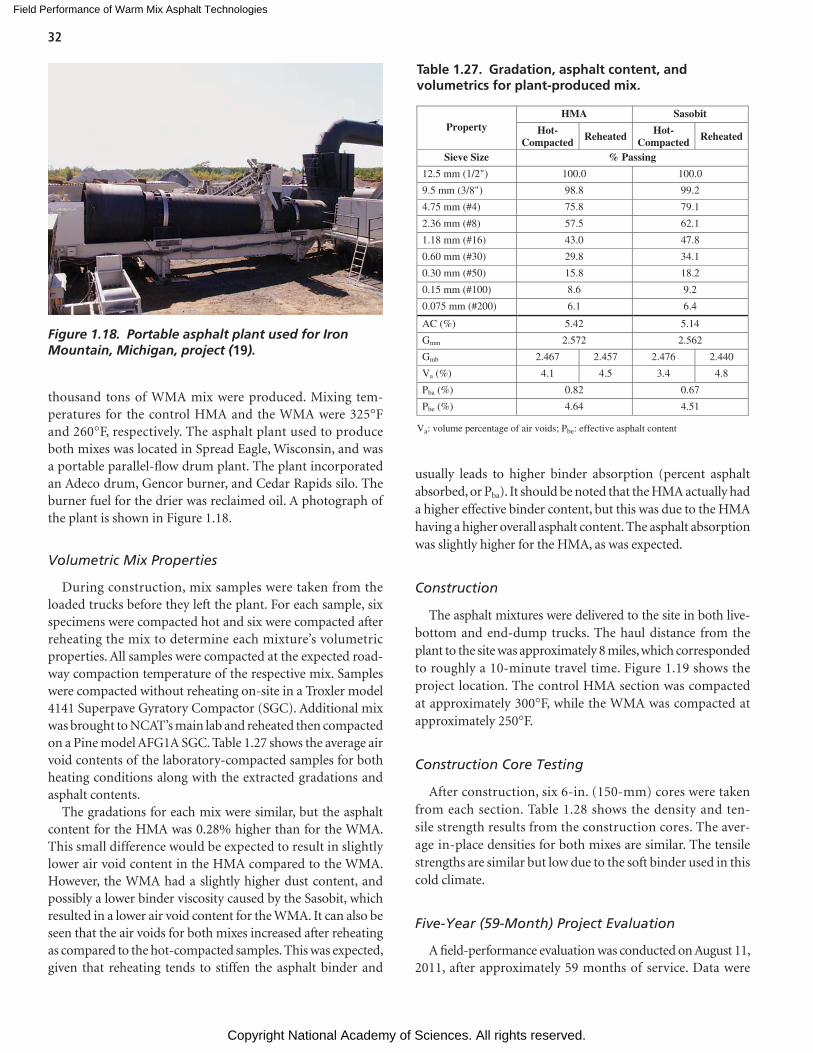
Field Performance of Warm Mix Asphalt Technologies
Copyright National Academy of Sciences. All rights reserved.
32
thousand tons of WMA mix were produced. Mixing tem-peratures for the control HMA and the WMA were 325°F and 260°F, respectively. The asphalt plant used to produce both mixes was located in Spread Eagle, Wisconsin, and was a portable parallel-flow drum plant. The plant incorporated an Adeco drum, Gencor burner, and Cedar Rapids silo. The burner fuel for the drier was reclaimed oil. A photograph of the plant is shown in Figure 1.18.
Volumetric Mix Properties
During construction, mix samples were taken from the loaded trucks before they left the plant. For each sample, six specimens were compacted hot and six were compacted after reheating the mix to determine each mixture’s volumetric properties. All samples were compacted at the expected road-way compaction temperature of the respective mix. Samples were compacted without reheating on-site in a Troxler model 4141 Superpave Gyratory Compactor (SGC). Additional mix was brought to NCAT’s main lab and reheated then compacted on a Pine model AFG1A SGC. Table 1.27 shows the average air void contents of the laboratory-compacted samples for both heating conditions along with the extracted gradations and asphalt contents.
The gradations for each mix were similar, but the asphalt content for the HMA was 0.28% higher than for the WMA. This small difference would be expected to result in slightly lower air void content in the HMA compared to the WMA. However, the WMA had a slightly higher dust content, and possibly a lower binder viscosity caused by the Sasobit, which resulted in a lower air void content for the WMA. It can also be seen that the air voids for both mixes increased after reheating as compared to the hot-compacted samples. This was expected, given that reheating tends to stiffen the asphalt binder and
usually leads to higher binder absorption (percent asphalt absorbed, or Pba). It should be noted that the HMA actually had a higher effective binder content, but this was due to the HMA having a higher overall asphalt content. The asphalt absorption was slightly higher for the HMA, as was expected.
Construction
The asphalt mixtures were delivered to the site in both live- bottom and end-dump trucks. The haul distance from the plant to the site was approximately 8 miles, which corresponded to roughly a 10-minute travel time. Figure 1.19 shows the project location. The control HMA section was compacted at approximately 300°F, while the WMA was compacted at approximately 250°F.
Construction Core Testing
After construction, six 6-in. (150-mm) cores were taken from each section. Table 1.28 shows the density and ten-sile strength results from the construction cores. The aver-age in-place densities for both mixes are similar. The tensile strengths are similar but low due to the soft binder used in this cold climate.
Five-Year (59-Month) Project Evaluation
A field-performance evaluation was conducted on August 11, 2011, after approximately 59 months of service. Data were
Figure 1.18. Portable asphalt plant used for Iron Mountain, Michigan, project (19).
Property HMA Sasobit
Hot-Compacted Reheated Hot-
Compacted Reheated
Sieve Size % Passing
12.5 mm (1/2") 100.0 100.0
9.5 mm (3/8") 98.8 99.2
4.75 mm (#4) 75.8 79.1
2.36 mm (#8) 57.5 62.1
1.18 mm (#16) 43.0 47.8
0.60 mm (#30) 29.8 34.1
0.30 mm (#50) 15.8 18.2
0.15 mm (#100) 8.6 9.2
0.075 mm (#200) 6.1 6.4
AC (%) 5.42 5.14
Gmm 2.572 2.562
Gmb 2.467 2.457 2.476 2.440
Va (%) 4.1 4.5 3.4 4.8
Pba (%) 0.82 0.67
Pbe (%) 4.64 4.51
Va: volume percentage of air voids; Pbe: effective asphalt content
Table 1.27. Gradation, asphalt content, and volumetrics for plant-produced mix.
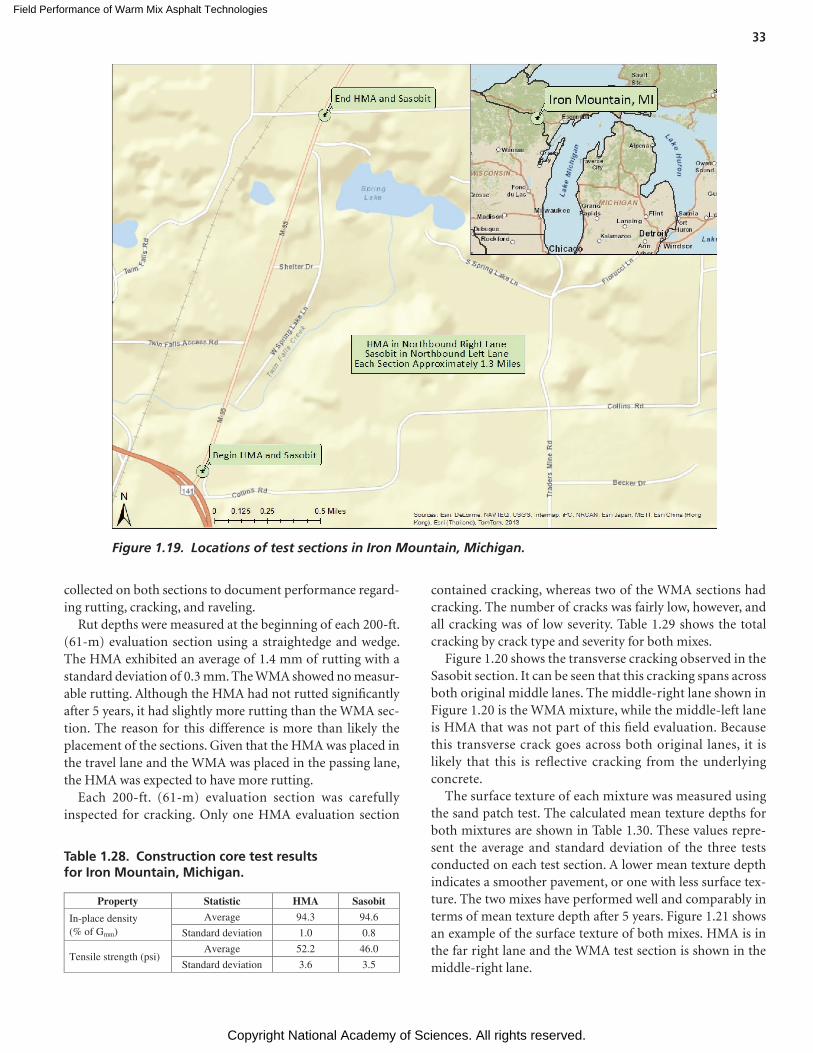
Field Performance of Warm Mix Asphalt Technologies
Copyright National Academy of Sciences. All rights reserved.
33
contained cracking, whereas two of the WMA sections had cracking. The number of cracks was fairly low, however, and all cracking was of low severity. Table 1.29 shows the total cracking by crack type and severity for both mixes.
Figure 1.20 shows the transverse cracking observed in the Sasobit section. It can be seen that this cracking spans across both original middle lanes. The middle-right lane shown in Figure 1.20 is the WMA mixture, while the middle-left lane is HMA that was not part of this field evaluation. Because this transverse crack goes across both original lanes, it is likely that this is reflective cracking from the underlying concrete.
The surface texture of each mixture was measured using the sand patch test. The calculated mean texture depths for both mixtures are shown in Table 1.30. These values repre-sent the average and standard deviation of the three tests conducted on each test section. A lower mean texture depth indicates a smoother pavement, or one with less surface tex-ture. The two mixes have performed well and comparably in terms of mean texture depth after 5 years. Figure 1.21 shows an example of the surface texture of both mixes. HMA is in the far right lane and the WMA test section is shown in the middle-right lane.
Figure 1.19. Locations of test sections in Iron Mountain, Michigan.
collected on both sections to document performance regard-ing rutting, cracking, and raveling.
Rut depths were measured at the beginning of each 200-ft. (61-m) evaluation section using a straightedge and wedge. The HMA exhibited an average of 1.4 mm of rutting with a standard deviation of 0.3 mm. The WMA showed no measur-able rutting. Although the HMA had not rutted significantly after 5 years, it had slightly more rutting than the WMA sec-tion. The reason for this difference is more than likely the placement of the sections. Given that the HMA was placed in the travel lane and the WMA was placed in the passing lane, the HMA was expected to have more rutting.
Each 200-ft. (61-m) evaluation section was carefully inspected for cracking. Only one HMA evaluation section
Property Statistic HMA Sasobit
In-place density (% of Gmm)
Average 94.3 94.6
Standard deviation 1.0 0.8
Tensile strength (psi)Average 52.2 46.0
Standard deviation 3.6 3.5
Table 1.28. Construction core test results for Iron Mountain, Michigan.
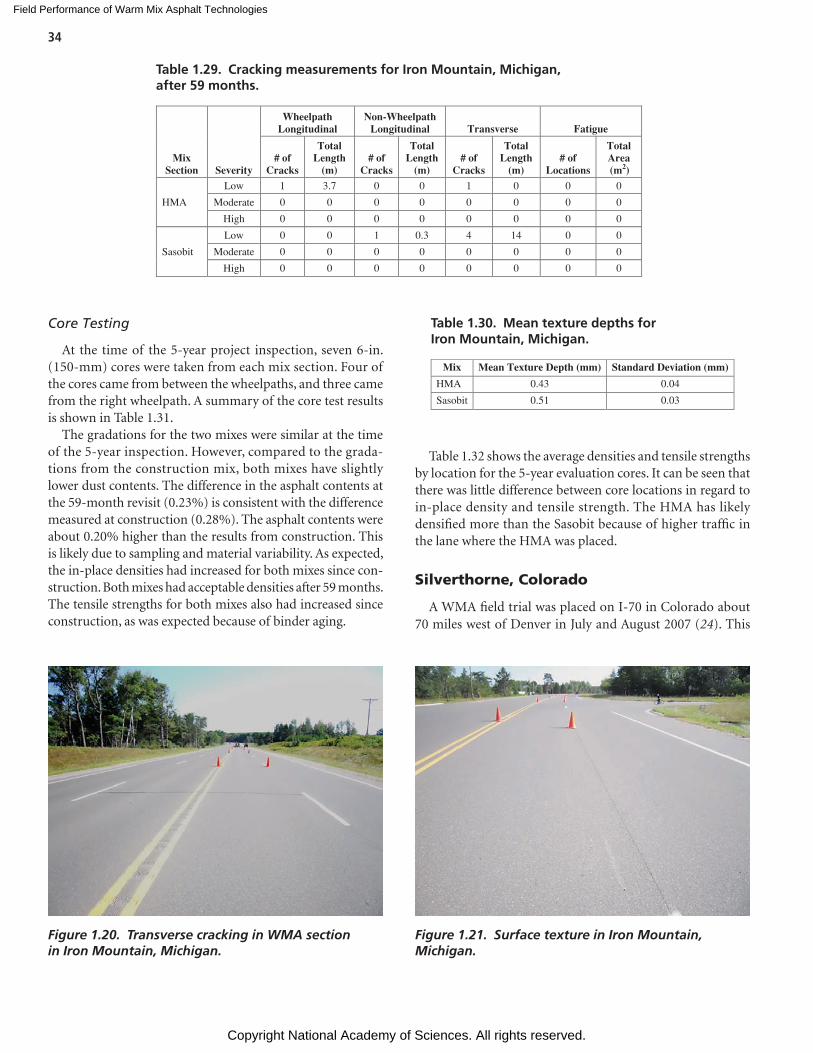
Field Performance of Warm Mix Asphalt Technologies
Copyright National Academy of Sciences. All rights reserved.
34
Core Testing
At the time of the 5-year project inspection, seven 6-in. (150-mm) cores were taken from each mix section. Four of the cores came from between the wheelpaths, and three came from the right wheelpath. A summary of the core test results is shown in Table 1.31.
The gradations for the two mixes were similar at the time of the 5-year inspection. However, compared to the grada-tions from the construction mix, both mixes have slightly lower dust contents. The difference in the asphalt contents at the 59-month revisit (0.23%) is consistent with the difference measured at construction (0.28%). The asphalt contents were about 0.20% higher than the results from construction. This is likely due to sampling and material variability. As expected, the in-place densities had increased for both mixes since con-struction. Both mixes had acceptable densities after 59 months. The tensile strengths for both mixes also had increased since construction, as was expected because of binder aging.
Table 1.32 shows the average densities and tensile strengths by location for the 5-year evaluation cores. It can be seen that there was little difference between core locations in regard to in-place density and tensile strength. The HMA has likely densified more than the Sasobit because of higher traffic in the lane where the HMA was placed.
Silverthorne, Colorado
A WMA field trial was placed on I-70 in Colorado about 70 miles west of Denver in July and August 2007 (24). This
Severity
WheelpathLongitudinal
Non-Wheelpath Longitudinal Transverse Fatigue
Mix Section
# of Cracks
TotalLength
(m) # of
Cracks
TotalLength
(m) # of
Cracks
TotalLength
(m) # of
Locations
TotalArea (m2)
HMA
Low 1 3.7 0 0 1 0 0 0
Moderate 0 0 0 0 0 0 0 0
High 0 0 0 0 0 0 0 0
Sasobit
Low 0 0 1 0.3 4 14 0 0
Moderate 0 0 0 0 0 0 0 0
High 0 0 0 0 0 0 0 0
Table 1.29. Cracking measurements for Iron Mountain, Michigan, after 59 months.
Figure 1.20. Transverse cracking in WMA section in Iron Mountain, Michigan.
Mix Mean Texture Depth (mm) Standard Deviation (mm)
HMA 0.43 0.04
Sasobit 0.51 0.03
Table 1.30. Mean texture depths for Iron Mountain, Michigan.
Figure 1.21. Surface texture in Iron Mountain, Michigan.
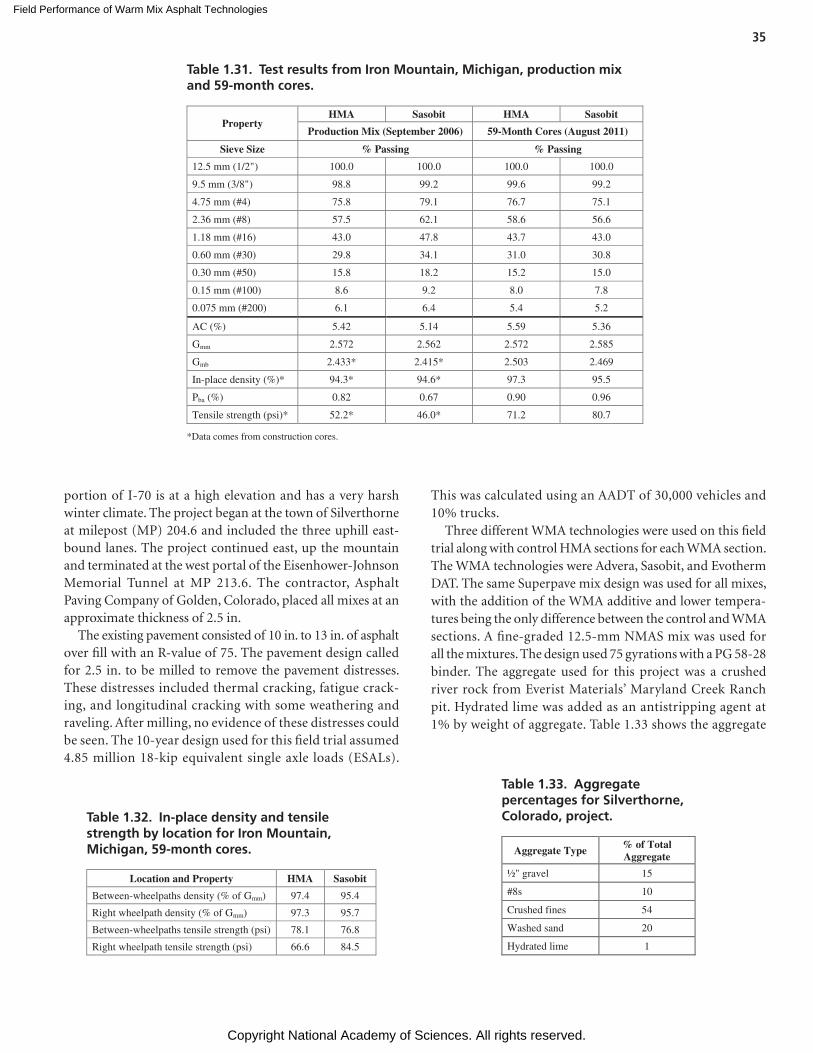
Field Performance of Warm Mix Asphalt Technologies
Copyright National Academy of Sciences. All rights reserved.
35
portion of I-70 is at a high elevation and has a very harsh winter climate. The project began at the town of Silverthorne at milepost (MP) 204.6 and included the three uphill east-bound lanes. The project continued east, up the mountain and terminated at the west portal of the Eisenhower-Johnson Memorial Tunnel at MP 213.6. The contractor, Asphalt Paving Company of Golden, Colorado, placed all mixes at an approximate thickness of 2.5 in.
The existing pavement consisted of 10 in. to 13 in. of asphalt over fill with an R-value of 75. The pavement design called for 2.5 in. to be milled to remove the pavement distresses. These distresses included thermal cracking, fatigue crack-ing, and longitudinal cracking with some weathering and raveling. After milling, no evidence of these distresses could be seen. The 10-year design used for this field trial assumed 4.85 million 18-kip equivalent single axle loads (ESALs).
This was calculated using an AADT of 30,000 vehicles and 10% trucks.
Three different WMA technologies were used on this field trial along with control HMA sections for each WMA section. The WMA technologies were Advera, Sasobit, and Evotherm DAT. The same Superpave mix design was used for all mixes, with the addition of the WMA additive and lower tempera-tures being the only difference between the control and WMA sections. A fine-graded 12.5-mm NMAS mix was used for all the mixtures. The design used 75 gyrations with a PG 58-28 binder. The aggregate used for this project was a crushed river rock from Everist Materials’ Maryland Creek Ranch pit. Hydrated lime was added as an antistripping agent at 1% by weight of aggregate. Table 1.33 shows the aggregate
Property HMA Sasobit HMA Sasobit
Production Mix (September 2006) 59-Month Cores (August 2011)
Sieve Size % Passing % Passing
12.5 mm (1/2") 100.0 100.0 100.0 100.0
9.5 mm (3/8") 98.8 99.2 99.6 99.2
4.75 mm (#4) 75.8 79.1 76.7 75.1
2.36 mm (#8) 57.5 62.1 58.6 56.6
1.18 mm (#16) 43.0 47.8 43.7 43.0
0.60 mm (#30) 29.8 34.1 31.0 30.8
0.30 mm (#50) 15.8 18.2 15.2 15.0
0.15 mm (#100) 8.6 9.2 8.0 7.8
0.075 mm (#200) 6.1 6.4 5.4 5.2
AC (%) 5.42 5.14 5.59 5.36
Gmm 2.572 2.562 2.572 2.585
Gmb 2.433* 2.415* 2.503 2.469
In-place density (%)* 94.3* 94.6* 97.3 95.5
Pba (%) 0.82 0.67 0.90 0.96
Tensile strength (psi)* 52.2* 46.0* 71.2 80.7
*Data comes from construction cores.
Table 1.31. Test results from Iron Mountain, Michigan, production mix and 59-month cores.
Location and Property HMA Sasobit
Between-wheelpaths density (% of Gmm) 97.4 95.4
Right wheelpath density (% of Gmm) 97.3 95.7
Between-wheelpaths tensile strength (psi) 78.1 76.8
Right wheelpath tensile strength (psi) 66.6 84.5
Table 1.32. In-place density and tensile strength by location for Iron Mountain, Michigan, 59-month cores. Aggregate Type
% of Total Aggregate
½" gravel 15
#8s 10
Crushed fines 54
Washed sand 20
Hydrated lime 1
Table 1.33. Aggregate percentages for Silverthorne, Colorado, project.
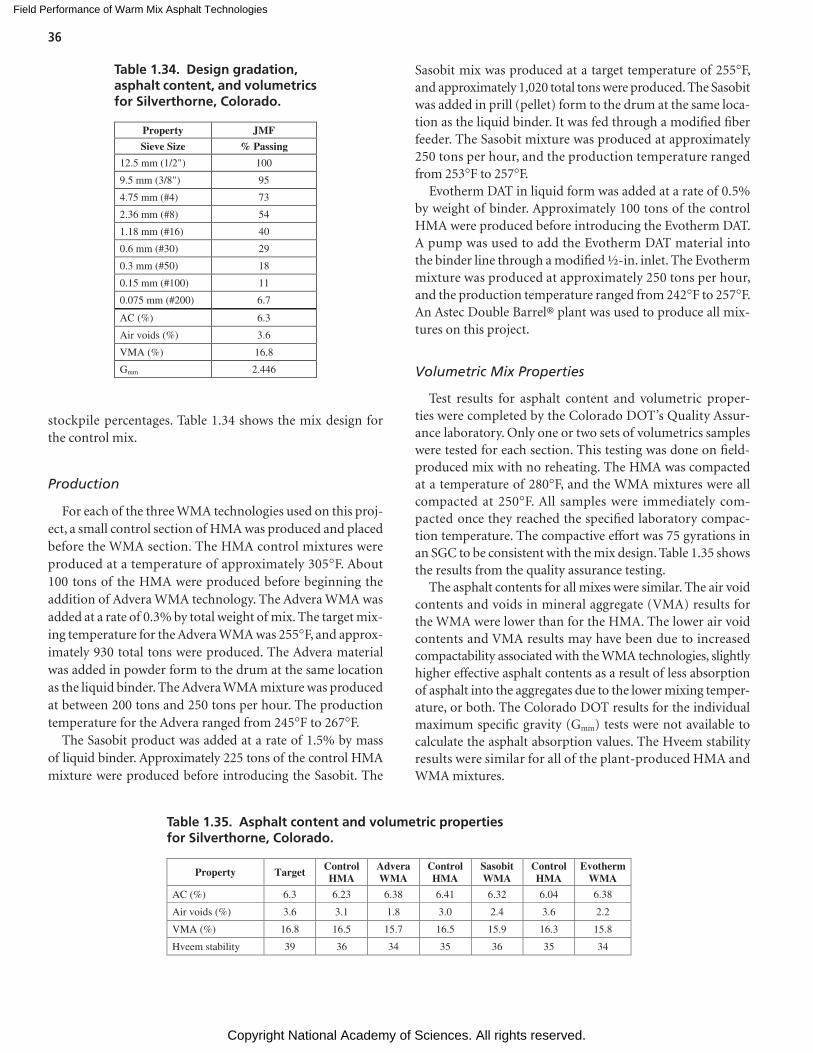
Field Performance of Warm Mix Asphalt Technologies
Copyright National Academy of Sciences. All rights reserved.
36
stockpile percentages. Table 1.34 shows the mix design for the control mix.
Production
For each of the three WMA technologies used on this proj-ect, a small control section of HMA was produced and placed before the WMA section. The HMA control mixtures were produced at a temperature of approximately 305°F. About 100 tons of the HMA were produced before beginning the addition of Advera WMA technology. The Advera WMA was added at a rate of 0.3% by total weight of mix. The target mix-ing temperature for the Advera WMA was 255°F, and approx-imately 930 total tons were produced. The Advera material was added in powder form to the drum at the same location as the liquid binder. The Advera WMA mixture was produced at between 200 tons and 250 tons per hour. The production temperature for the Advera ranged from 245°F to 267°F.
The Sasobit product was added at a rate of 1.5% by mass of liquid binder. Approximately 225 tons of the control HMA mixture were produced before introducing the Sasobit. The
Sasobit mix was produced at a target temperature of 255°F, and approximately 1,020 total tons were produced. The Sasobit was added in prill (pellet) form to the drum at the same loca-tion as the liquid binder. It was fed through a modified fiber feeder. The Sasobit mixture was produced at approximately 250 tons per hour, and the production temperature ranged from 253°F to 257°F.
Evotherm DAT in liquid form was added at a rate of 0.5% by weight of binder. Approximately 100 tons of the control HMA were produced before introducing the Evotherm DAT. A pump was used to add the Evotherm DAT material into the binder line through a modified ½-in. inlet. The Evotherm mixture was produced at approximately 250 tons per hour, and the production temperature ranged from 242°F to 257°F. An Astec Double Barrel® plant was used to produce all mix-tures on this project.
Volumetric Mix Properties
Test results for asphalt content and volumetric proper-ties were completed by the Colorado DOT’s Quality Assur-ance laboratory. Only one or two sets of volumetrics samples were tested for each section. This testing was done on field- produced mix with no reheating. The HMA was compacted at a temperature of 280°F, and the WMA mixtures were all compacted at 250°F. All samples were immediately com-pacted once they reached the specified laboratory compac-tion temperature. The compactive effort was 75 gyrations in an SGC to be consistent with the mix design. Table 1.35 shows the results from the quality assurance testing.
The asphalt contents for all mixes were similar. The air void contents and voids in mineral aggregate (VMA) results for the WMA were lower than for the HMA. The lower air void contents and VMA results may have been due to increased compactability associated with the WMA technologies, slightly higher effective asphalt contents as a result of less absorption of asphalt into the aggregates due to the lower mixing temper-ature, or both. The Colorado DOT results for the individual maximum specific gravity (Gmm) tests were not available to calculate the asphalt absorption values. The Hveem stability results were similar for all of the plant-produced HMA and WMA mixtures.
Property JMF
Sieve Size % Passing
12.5 mm (1/2") 100
9.5 mm (3/8") 95
4.75 mm (#4) 73
2.36 mm (#8) 54
1.18 mm (#16) 40
0.6 mm (#30) 29
0.3 mm (#50) 18
0.15 mm (#100) 11
0.075 mm (#200) 6.7
AC (%) 6.3
Air voids (%) 3.6
VMA (%) 16.8
Gmm 2.446
Table 1.34. Design gradation, asphalt content, and volumetrics for Silverthorne, Colorado.
Property Target Control HMA
Advera WMA
Control HMA
Sasobit WMA
Control HMA
Evotherm WMA
AC (%) 6.3 6.23 6.38 6.41 6.32 6.04 6.38
Air voids (%) 3.6 3.1 1.8 3.0 2.4 3.6 2.2
VMA (%) 16.8 16.5 15.7 16.5 15.9 16.3 15.8
Hveem stability 39 36 34 35 36 35 34
Table 1.35. Asphalt content and volumetric properties for Silverthorne, Colorado.
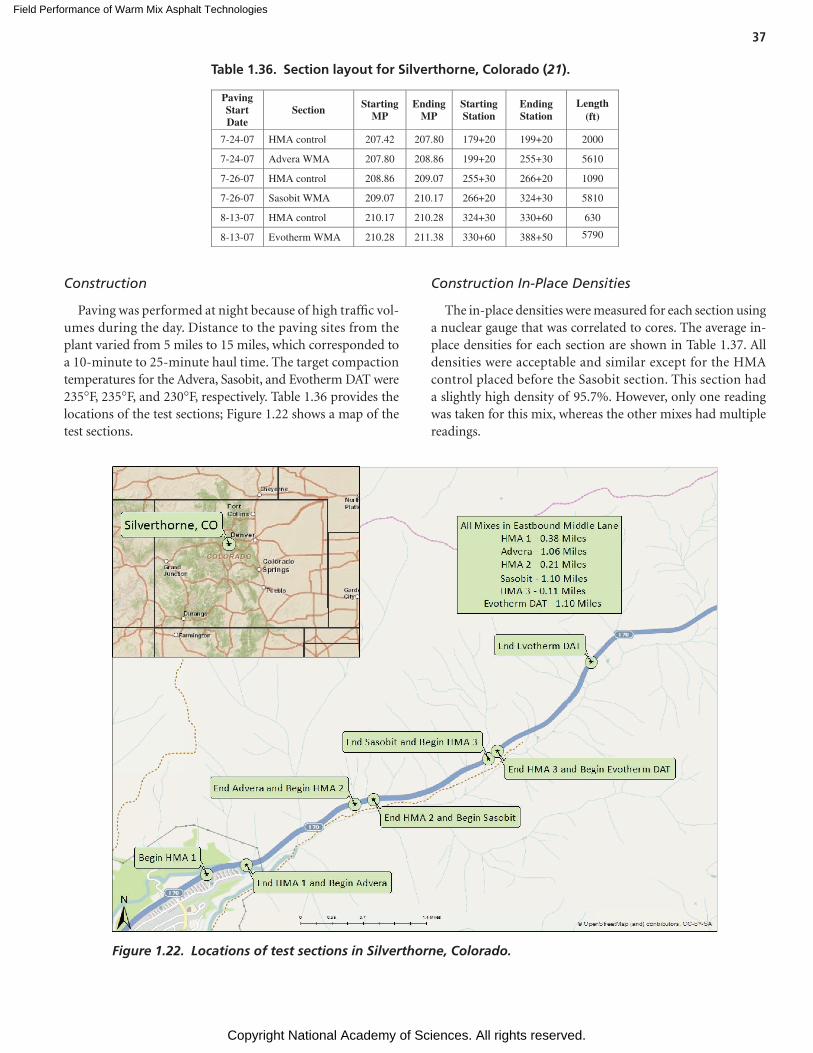
Field Performance of Warm Mix Asphalt Technologies
Copyright National Academy of Sciences. All rights reserved.
37
Construction
Paving was performed at night because of high traffic vol-umes during the day. Distance to the paving sites from the plant varied from 5 miles to 15 miles, which corresponded to a 10-minute to 25-minute haul time. The target compaction temperatures for the Advera, Sasobit, and Evotherm DAT were 235°F, 235°F, and 230°F, respectively. Table 1.36 provides the locations of the test sections; Figure 1.22 shows a map of the test sections.
Construction In-Place Densities
The in-place densities were measured for each section using a nuclear gauge that was correlated to cores. The average in-place densities for each section are shown in Table 1.37. All densities were acceptable and similar except for the HMA control placed before the Sasobit section. This section had a slightly high density of 95.7%. However, only one reading was taken for this mix, whereas the other mixes had multiple readings.
Figure 1.22. Locations of test sections in Silverthorne, Colorado.
Paving Start Date
Section Starting MP
Ending MP
Starting Station
Ending Station
Length (ft)
7-24-07 HMA control 207.42 207.80 179+20 199+20 2000
7-24-07 Advera WMA 207.80 208.86 199+20 255+30 5610
7-26-07 HMA control 208.86 209.07 255+30 266+20 1090
7-26-07 Sasobit WMA 209.07 210.17 266+20 324+30 5810
8-13-07 HMA control 210.17 210.28 324+30 330+60 630
8-13-07 Evotherm WMA 210.28 211.38 330+60 388+50 5790
Table 1.36. Section layout for Silverthorne, Colorado (21).
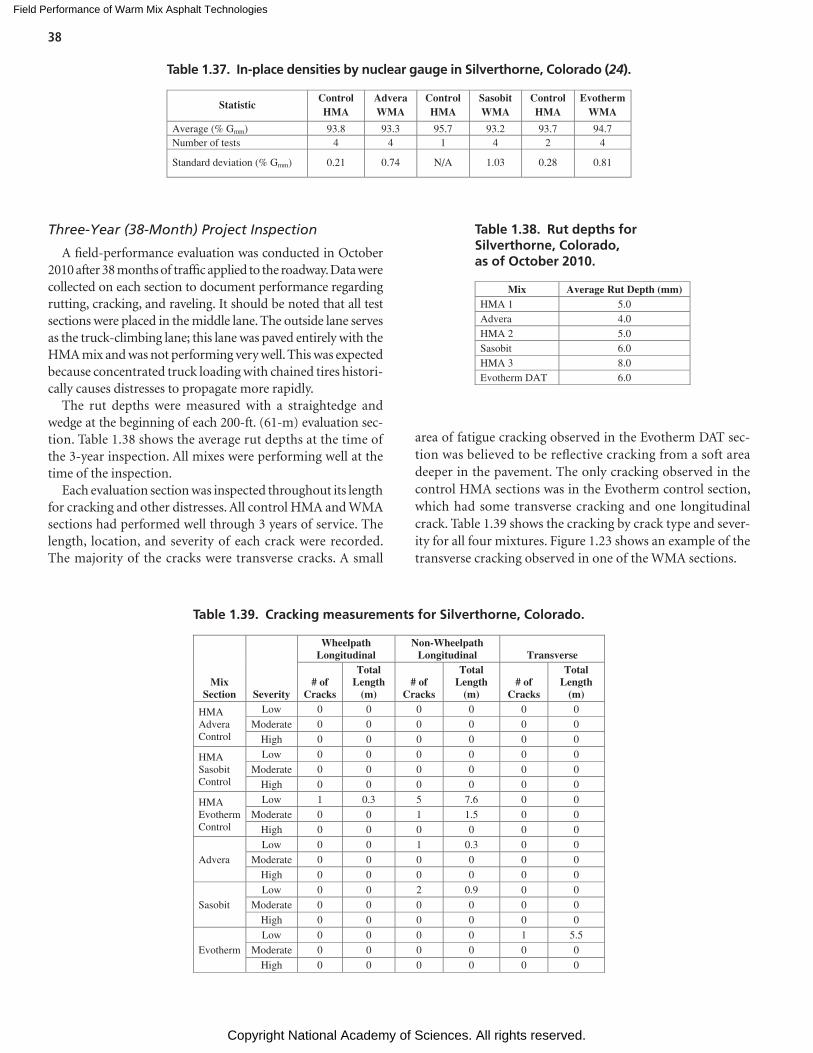
Field Performance of Warm Mix Asphalt Technologies
Copyright National Academy of Sciences. All rights reserved.
38
Three-Year (38-Month) Project Inspection
A field-performance evaluation was conducted in October 2010 after 38 months of traffic applied to the roadway. Data were collected on each section to document performance regarding rutting, cracking, and raveling. It should be noted that all test sections were placed in the middle lane. The outside lane serves as the truck-climbing lane; this lane was paved entirely with the HMA mix and was not performing very well. This was expected because concentrated truck loading with chained tires histori-cally causes distresses to propagate more rapidly.
The rut depths were measured with a straightedge and wedge at the beginning of each 200-ft. (61-m) evaluation sec-tion. Table 1.38 shows the average rut depths at the time of the 3-year inspection. All mixes were performing well at the time of the inspection.
Each evaluation section was inspected throughout its length for cracking and other distresses. All control HMA and WMA sections had performed well through 3 years of service. The length, location, and severity of each crack were recorded. The majority of the cracks were transverse cracks. A small
area of fatigue cracking observed in the Evotherm DAT sec-tion was believed to be reflective cracking from a soft area deeper in the pavement. The only cracking observed in the control HMA sections was in the Evotherm control section, which had some transverse cracking and one longitudinal crack. Table 1.39 shows the cracking by crack type and sever-ity for all four mixtures. Figure 1.23 shows an example of the transverse cracking observed in one of the WMA sections.
Mix Average Rut Depth (mm) HMA 1 5.0 Advera 4.0 HMA 2 5.0 Sasobit 6.0 HMA 3 8.0 Evotherm DAT 6.0
Table 1.38. Rut depths for Silverthorne, Colorado, as of October 2010.
Mix Section Severity
Wheelpath Longitudinal
Non-Wheelpath Longitudinal Transverse
# of Cracks
Total Length
(m) # of
Cracks
Total Length
(m) # of
Cracks
Total Length
(m)
HMA Advera Control
Low 0 0 0 0 0 0
Moderate 0 0 0 0 0 0
High 0 0 0 0 0 0
HMA Sasobit Control
Low 0 0 0 0 0 0
Moderate 0 0 0 0 0 0
High 0 0 0 0 0 0
HMA Evotherm Control
Low 1 0.3 5 7.6 0 0
Moderate 0 0 1 1.5 0 0
High 0 0 0 0 0 0
Advera
Low 0 0 1 0.3 0 0
Moderate 0 0 0 0 0 0
High 0 0 0 0 0 0
Sasobit
Low 0 0 2 0.9 0 0
Moderate 0 0 0 0 0 0
High 0 0 0 0 0 0
Evotherm
Low 0 0 0 0 1 5.5
Moderate 0 0 0 0 0 0
High 0 0 0 0 0 0
Table 1.39. Cracking measurements for Silverthorne, Colorado.
Table 1.37. In-place densities by nuclear gauge in Silverthorne, Colorado (24).
Statistic Control HMA
Advera WMA
Control HMA
Sasobit WMA
Control HMA
Evotherm WMA
Average (% Gmm) 93.8 93.3 95.7 93.2 93.7 94.7 Number of tests 4 4 1 4 2 4
Standard deviation (% Gmm) 0.21 0.74 N/A 1.03 0.28 0.81
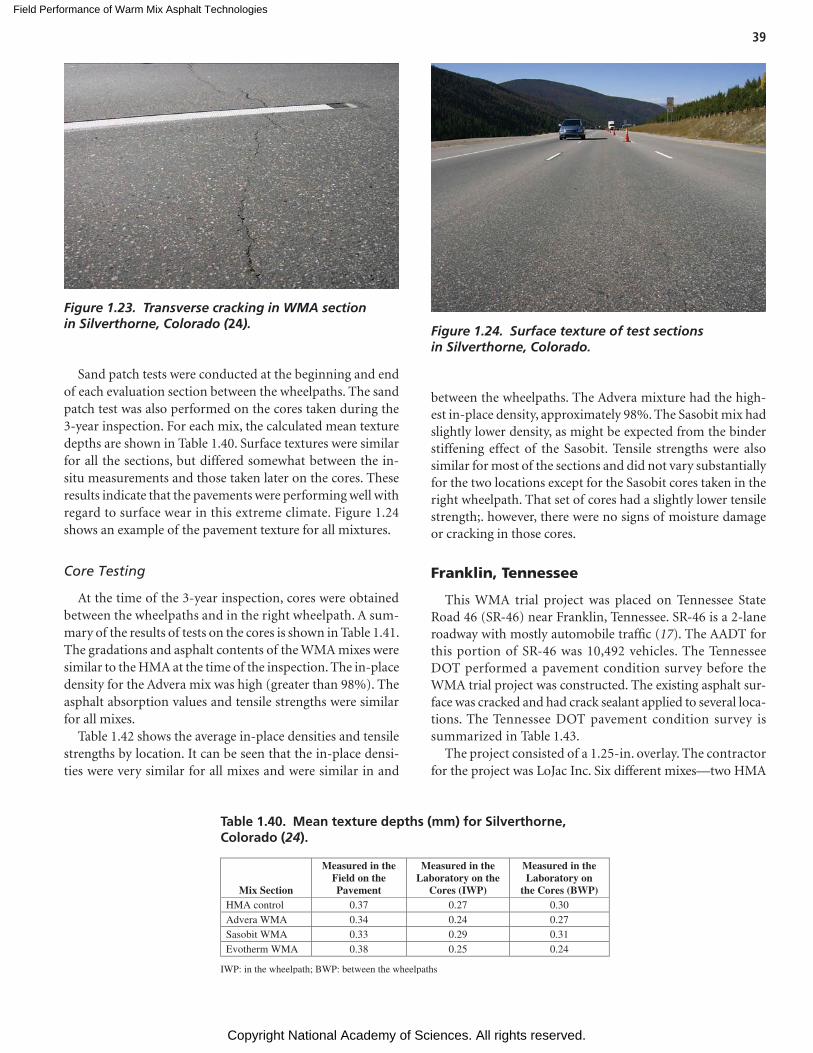
Field Performance of Warm Mix Asphalt Technologies
Copyright National Academy of Sciences. All rights reserved.
39
Sand patch tests were conducted at the beginning and end of each evaluation section between the wheelpaths. The sand patch test was also performed on the cores taken during the 3-year inspection. For each mix, the calculated mean texture depths are shown in Table 1.40. Surface textures were similar for all the sections, but differed somewhat between the in-situ measurements and those taken later on the cores. These results indicate that the pavements were performing well with regard to surface wear in this extreme climate. Figure 1.24 shows an example of the pavement texture for all mixtures.
Core Testing
At the time of the 3-year inspection, cores were obtained between the wheelpaths and in the right wheelpath. A sum-mary of the results of tests on the cores is shown in Table 1.41. The gradations and asphalt contents of the WMA mixes were similar to the HMA at the time of the inspection. The in-place density for the Advera mix was high (greater than 98%). The asphalt absorption values and tensile strengths were similar for all mixes.
Table 1.42 shows the average in-place densities and tensile strengths by location. It can be seen that the in-place densi-ties were very similar for all mixes and were similar in and
between the wheelpaths. The Advera mixture had the high-est in-place density, approximately 98%. The Sasobit mix had slightly lower density, as might be expected from the binder stiffening effect of the Sasobit. Tensile strengths were also similar for most of the sections and did not vary substantially for the two locations except for the Sasobit cores taken in the right wheelpath. That set of cores had a slightly lower tensile strength;. however, there were no signs of moisture damage or cracking in those cores.
Franklin, Tennessee
This WMA trial project was placed on Tennessee State Road 46 (SR-46) near Franklin, Tennessee. SR-46 is a 2-lane roadway with mostly automobile traffic (17). The AADT for this portion of SR-46 was 10,492 vehicles. The Tennessee DOT performed a pavement condition survey before the WMA trial project was constructed. The existing asphalt sur-face was cracked and had crack sealant applied to several loca-tions. The Tennessee DOT pavement condition survey is summarized in Table 1.43.
The project consisted of a 1.25-in. overlay. The contractor for the project was LoJac Inc. Six different mixes—two HMA
Figure 1.23. Transverse cracking in WMA section in Silverthorne, Colorado (24). Figure 1.24. Surface texture of test sections
in Silverthorne, Colorado.
Mix Section
Measured in the Field on the Pavement
Measured in the Laboratory on the
Cores (IWP)
Measured in the Laboratory on
the Cores (BWP)HMA control 0.37 0.27 0.30 Advera WMA 0.34 0.24 0.27 Sasobit WMA 0.33 0.29 0.31 Evotherm WMA 0.38 0.25 0.24
IWP: in the wheelpath; BWP: between the wheelpaths
Table 1.40. Mean texture depths (mm) for Silverthorne, Colorado (24).
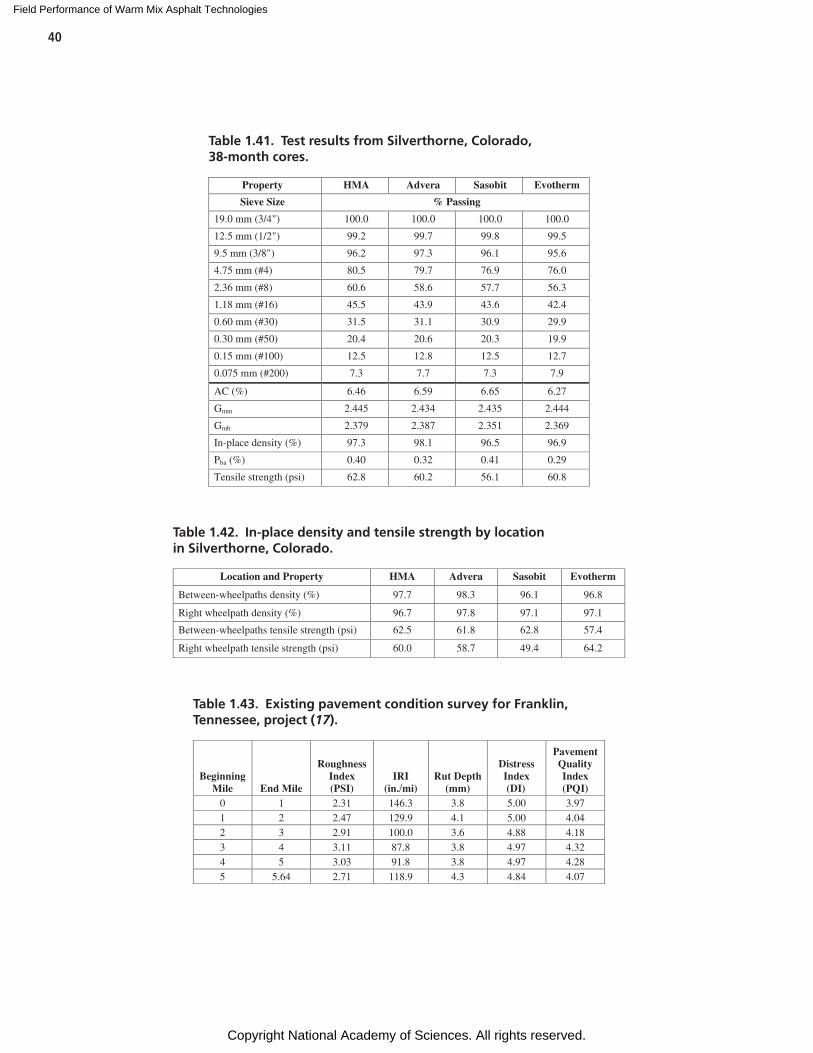
Field Performance of Warm Mix Asphalt Technologies
Copyright National Academy of Sciences. All rights reserved.
40
Property HMA Advera Sasobit Evotherm
Sieve Size % Passing
19.0 mm (3/4") 100.0 100.0 100.0 100.0
12.5 mm (1/2") 99.2 99.7 99.8 99.5
9.5 mm (3/8") 96.2 97.3 96.1 95.6
4.75 mm (#4) 80.5 79.7 76.9 76.0
2.36 mm (#8) 60.6 58.6 57.7 56.3
1.18 mm (#16) 45.5 43.9 43.6 42.4
0.60 mm (#30) 31.5 31.1 30.9 29.9
0.30 mm (#50) 20.4 20.6 20.3 19.9
0.15 mm (#100) 12.5 12.8 12.5 12.7
0.075 mm (#200) 7.3 7.7 7.3 7.9
AC (%) 6.46 6.59 6.65 6.27
Gmm 2.445 2.434 2.435 2.444
Gmb 2.379 2.387 2.351 2.369
In-place density (%) 97.3 98.1 96.5 96.9
Pba (%) 0.40 0.32 0.41 0.29
Tensile strength (psi) 62.8 60.2 56.1 60.8
Table 1.41. Test results from Silverthorne, Colorado, 38-month cores.
Location and Property HMA Advera Sasobit Evotherm
Between-wheelpaths density (%) 97.7 98.3 96.1 96.8
Right wheelpath density (%) 96.7 97.8 97.1 97.1
Between-wheelpaths tensile strength (psi) 62.5 61.8 62.8 57.4
Right wheelpath tensile strength (psi) 60.0 58.7 49.4 64.2
Table 1.42. In-place density and tensile strength by location in Silverthorne, Colorado.
Beginning Mile End Mile
Roughness Index (PSI)
IRI(in./mi)
Rut Depth(mm)
Distress Index (DI)
Pavement QualityIndex(PQI)
0 1 2.31 146.3 3.8 5.00 3.971 2 2.47 129.9 4.1 5.00 4.042 3 2.91 100.0 3.6 4.88 4.183 4 3.11 87.8 3.8 4.97 4.324 5 3.03 91.8 3.8 4.97 4.285 5.64 2.71 118.9 4.3 4.84 4.07
Table 1.43. Existing pavement condition survey for Franklin, Tennessee, project (17).
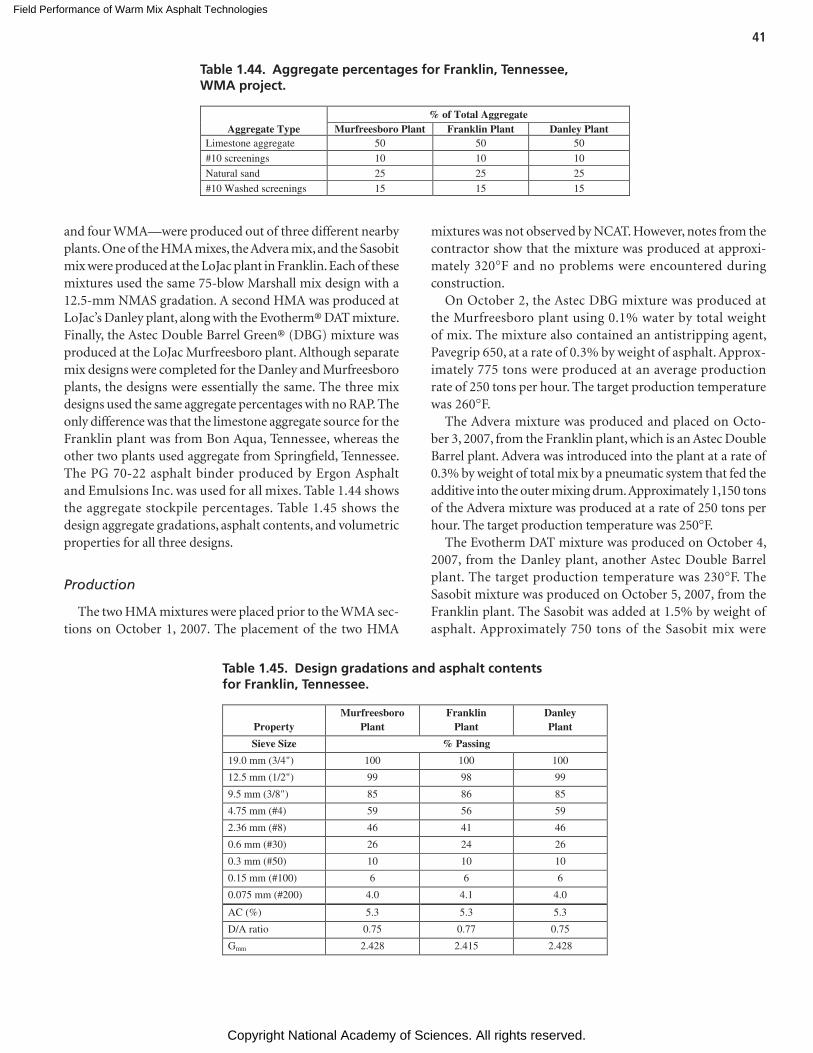
Field Performance of Warm Mix Asphalt Technologies
Copyright National Academy of Sciences. All rights reserved.
41
and four WMA—were produced out of three different nearby plants. One of the HMA mixes, the Advera mix, and the Sasobit mix were produced at the LoJac plant in Franklin. Each of these mixtures used the same 75-blow Marshall mix design with a 12.5-mm NMAS gradation. A second HMA was produced at LoJac’s Danley plant, along with the Evotherm® DAT mixture. Finally, the Astec Double Barrel Green® (DBG) mixture was produced at the LoJac Murfreesboro plant. Although separate mix designs were completed for the Danley and Murfreesboro plants, the designs were essentially the same. The three mix designs used the same aggregate percentages with no RAP. The only difference was that the limestone aggregate source for the Franklin plant was from Bon Aqua, Tennessee, whereas the other two plants used aggregate from Springfield, Tennessee. The PG 70-22 asphalt binder produced by Ergon Asphalt and Emulsions Inc. was used for all mixes. Table 1.44 shows the aggregate stockpile percentages. Table 1.45 shows the design aggregate gradations, asphalt contents, and volu metric properties for all three designs.
Production
The two HMA mixtures were placed prior to the WMA sec-tions on October 1, 2007. The placement of the two HMA
mixtures was not observed by NCAT. However, notes from the contractor show that the mixture was produced at approxi-mately 320°F and no problems were encountered during construction.
On October 2, the Astec DBG mixture was produced at the Murfreesboro plant using 0.1% water by total weight of mix. The mixture also contained an antistripping agent, Pave grip 650, at a rate of 0.3% by weight of asphalt. Approx-imately 775 tons were produced at an average production rate of 250 tons per hour. The target production temperature was 260°F.
The Advera mixture was produced and placed on Octo-ber 3, 2007, from the Franklin plant, which is an Astec Double Barrel plant. Advera was introduced into the plant at a rate of 0.3% by weight of total mix by a pneumatic system that fed the additive into the outer mixing drum. Approximately 1,150 tons of the Advera mixture was produced at a rate of 250 tons per hour. The target production temperature was 250°F.
The Evotherm DAT mixture was produced on October 4, 2007, from the Danley plant, another Astec Double Barrel plant. The target production temperature was 230°F. The Sasobit mixture was produced on October 5, 2007, from the Franklin plant. The Sasobit was added at 1.5% by weight of asphalt. Approximately 750 tons of the Sasobit mix were
Aggregate Type % of Total Aggregate
Murfreesboro Plant Franklin Plant Danley PlantLimestone aggregate 50 50 50
#10 screenings 10 10 10
Natural sand 25 25 25
#10 Washed screenings 15 15 15
Table 1.44. Aggregate percentages for Franklin, Tennessee, WMA project.
PropertyMurfreesboro
PlantFranklin
PlantDanley Plant
Sieve Size % Passing
19.0 mm (3/4") 100 100 100
12.5 mm (1/2") 99 98 99
9.5 mm (3/8") 85 86 85
4.75 mm (#4) 59 56 59
2.36 mm (#8) 46 41 46
0.6 mm (#30) 26 24 26
0.3 mm (#50) 10 10 10
0.15 mm (#100) 6 6 6
0.075 mm (#200) 4.0 4.1 4.0
AC (%) 5.3 5.3 5.3
D/A ratio 0.75 0.77 0.75
Gmm 2.428 2.415 2.428
Table 1.45. Design gradations and asphalt contents for Franklin, Tennessee.
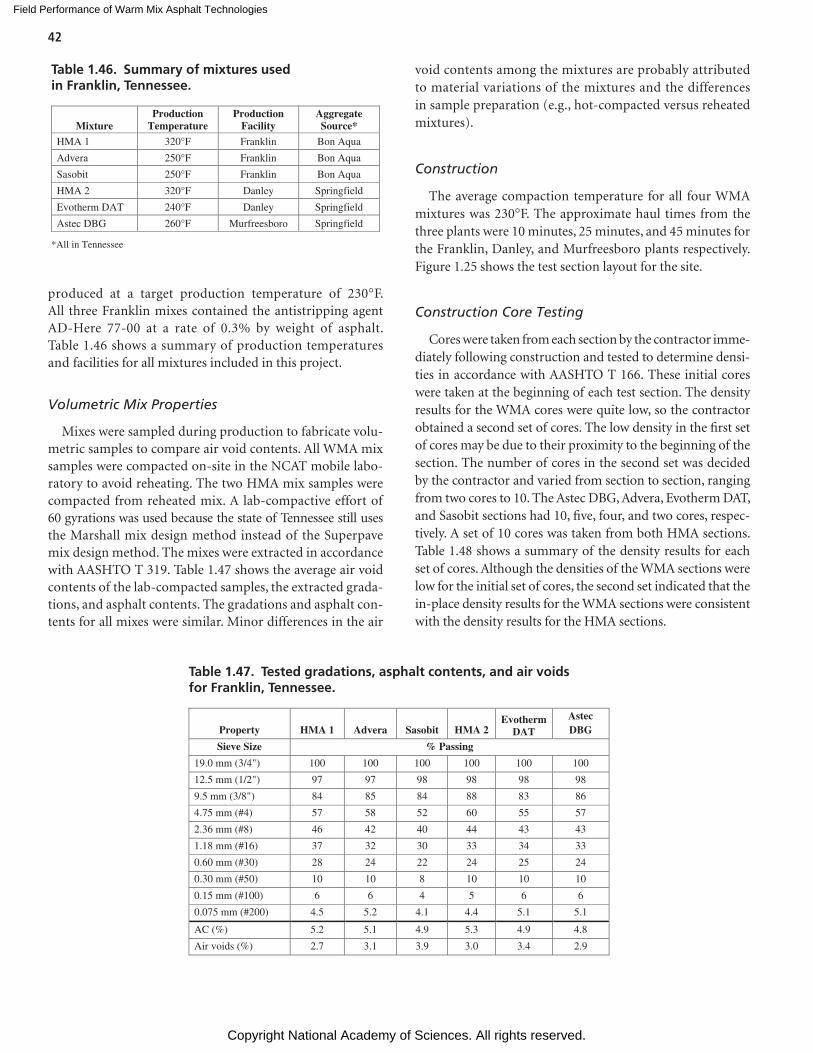
Field Performance of Warm Mix Asphalt Technologies
Copyright National Academy of Sciences. All rights reserved.
42
produced at a target production temperature of 230°F. All three Franklin mixes contained the antistripping agent AD-Here 77-00 at a rate of 0.3% by weight of asphalt. Table 1.46 shows a summary of production temperatures and facilities for all mixtures included in this project.
Volumetric Mix Properties
Mixes were sampled during production to fabricate volu-metric samples to compare air void contents. All WMA mix samples were compacted on-site in the NCAT mobile labo-ratory to avoid reheating. The two HMA mix samples were compacted from reheated mix. A lab-compactive effort of 60 gyrations was used because the state of Tennessee still uses the Marshall mix design method instead of the Superpave mix design method. The mixes were extracted in accordance with AASHTO T 319. Table 1.47 shows the average air void contents of the lab-compacted samples, the extracted grada-tions, and asphalt contents. The gradations and asphalt con-tents for all mixes were similar. Minor differences in the air
void contents among the mixtures are probably attributed to material variations of the mixtures and the differences in sample preparation (e.g., hot-compacted versus reheated mixtures).
Construction
The average compaction temperature for all four WMA mixtures was 230°F. The approximate haul times from the three plants were 10 minutes, 25 minutes, and 45 minutes for the Franklin, Danley, and Murfreesboro plants respectively. Figure 1.25 shows the test section layout for the site.
Construction Core Testing
Cores were taken from each section by the contractor imme-diately following construction and tested to determine densi-ties in accordance with AASHTO T 166. These initial cores were taken at the beginning of each test section. The density results for the WMA cores were quite low, so the contractor obtained a second set of cores. The low density in the first set of cores may be due to their proximity to the beginning of the section. The number of cores in the second set was decided by the contractor and varied from section to section, ranging from two cores to 10. The Astec DBG, Advera, Evotherm DAT, and Sasobit sections had 10, five, four, and two cores, respec-tively. A set of 10 cores was taken from both HMA sections. Table 1.48 shows a summary of the density results for each set of cores. Although the densities of the WMA sections were low for the initial set of cores, the second set indicated that the in-place density results for the WMA sections were consistent with the density results for the HMA sections.
MixtureProduction
Temperature Production
Facility Aggregate Source*
HMA 1 320°F Franklin Bon Aqua
Advera 250°F Franklin Bon Aqua
Sasobit 250°F Franklin Bon Aqua
HMA 2 320°F Danley Springfield
Evotherm DAT 240°F Danley Springfield
Astec DBG 260°F Murfreesboro Springfield
*All in Tennessee
Table 1.46. Summary of mixtures used in Franklin, Tennessee.
Property HMA 1 Advera Sasobit HMA 2 Evotherm
DAT
Astec DBG
Sieve Size % Passing
19.0 mm (3/4" ) 100 100 100 100 100 100
12.5 mm (1/2") 97 97 98 98 98 98
9.5 mm (3/8") 84 85 84 88 83 86
4.75 mm (#4) 57 58 52 60 55 57
2.36 mm (#8) 46 42 40 44 43 43
1.18 mm (#16) 37 32 30 33 34 33
0.60 mm (#30) 28 24 22 24 25 24
0.30 mm (#50) 10 10 8 10 10 10
0.15 mm (#100) 6 6 4 5 6 6
0.075 mm (#200) 4.5 5.2 4.1 4.4 5.1 5.1
AC (%) 5.2 5.1 4.9 5.3 4.9 4.8
Air voids (%) 2.7 3.1 3.9 3.0 3.4 2.9
Table 1.47. Tested gradations, asphalt contents, and air voids for Franklin, Tennessee.
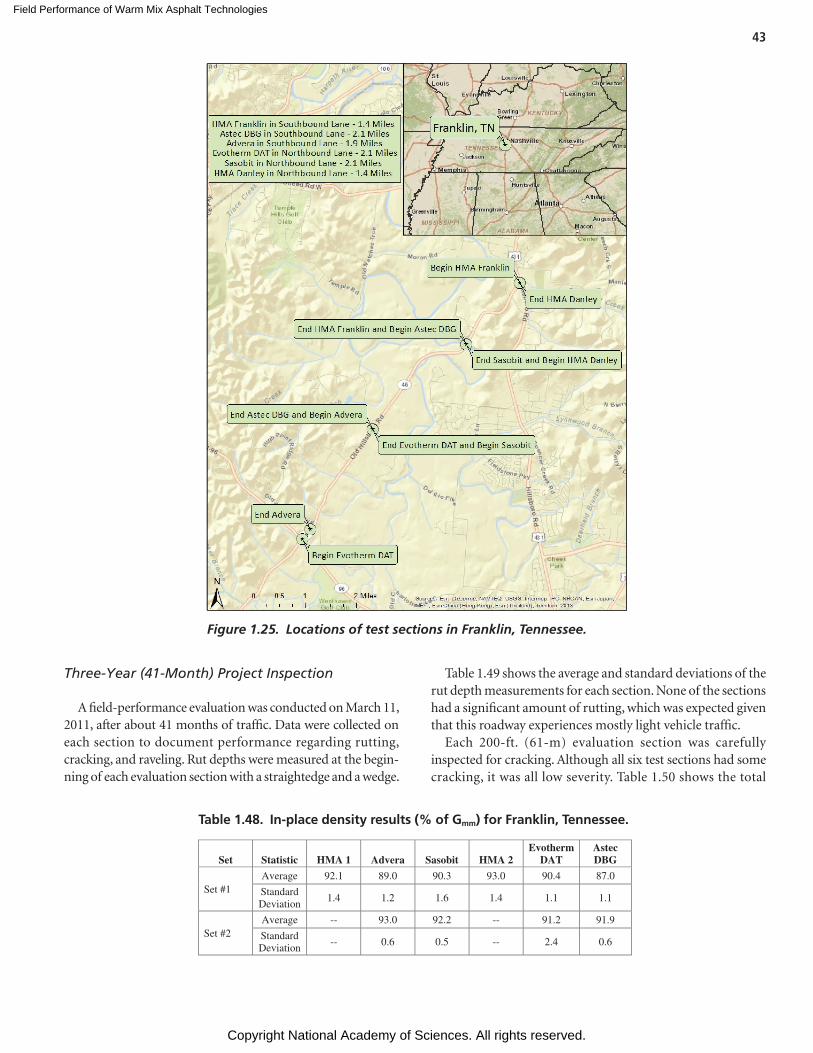
Field Performance of Warm Mix Asphalt Technologies
Copyright National Academy of Sciences. All rights reserved.
43
Set Statistic HMA 1 Advera Sasobit HMA 2 Evotherm
DATAstec DBG
Set #1Average 92.1 89.0 90.3 93.0 90.4 87.0
StandardDeviation
1.4 1.2 1.6 1.4 1.1 1.1
Set #2Average -- 93.0 92.2 -- 91.2 91.9
StandardDeviation
-- 0.6 0.5 -- 2.4 0.6
Table 1.48. In-place density results (% of Gmm) for Franklin, Tennessee.
Figure 1.25. Locations of test sections in Franklin, Tennessee.
Three-Year (41-Month) Project Inspection
A field-performance evaluation was conducted on March 11, 2011, after about 41 months of traffic. Data were collected on each section to document performance regarding rutting, cracking, and raveling. Rut depths were measured at the begin-ning of each evaluation section with a straightedge and a wedge.
Table 1.49 shows the average and standard deviations of the rut depth measurements for each section. None of the sections had a significant amount of rutting, which was expected given that this roadway experiences mostly light vehicle traffic.
Each 200-ft. (61-m) evaluation section was carefully inspected for cracking. Although all six test sections had some cracking, it was all low severity. Table 1.50 shows the total
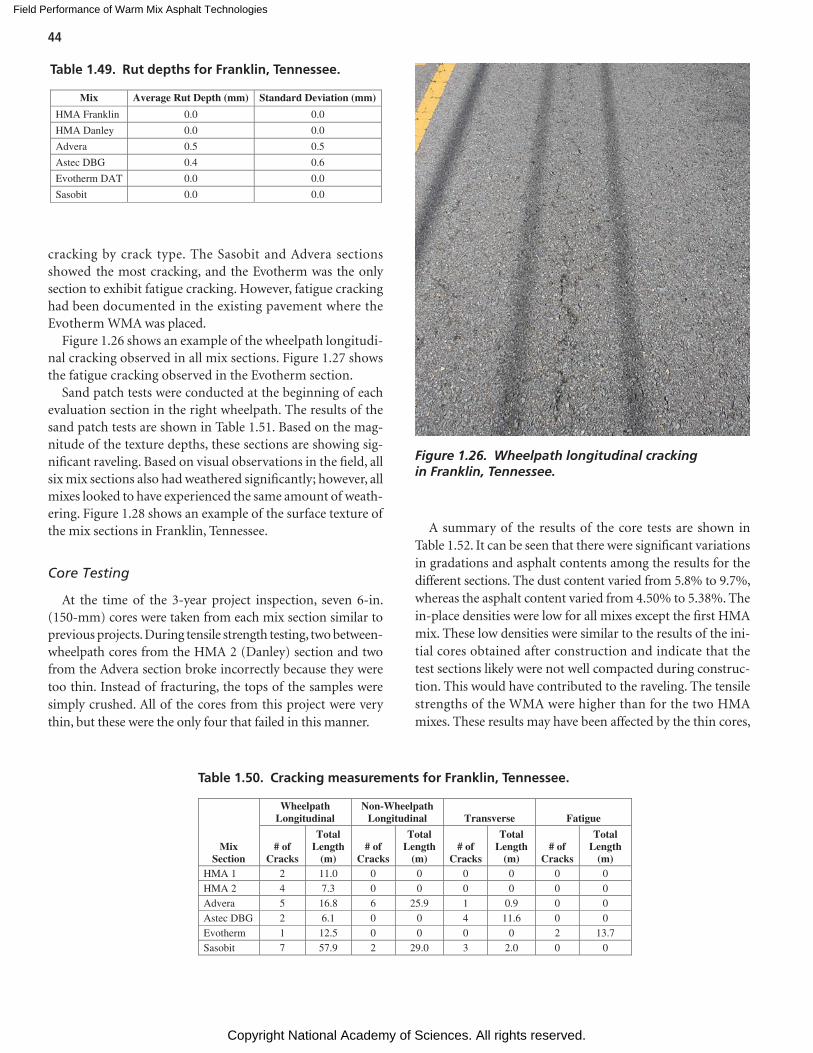
Field Performance of Warm Mix Asphalt Technologies
Copyright National Academy of Sciences. All rights reserved.
44
cracking by crack type. The Sasobit and Advera sections showed the most cracking, and the Evotherm was the only section to exhibit fatigue cracking. However, fatigue cracking had been documented in the existing pavement where the Evotherm WMA was placed.
Figure 1.26 shows an example of the wheelpath longitudi-nal cracking observed in all mix sections. Figure 1.27 shows the fatigue cracking observed in the Evotherm section.
Sand patch tests were conducted at the beginning of each evaluation section in the right wheelpath. The results of the sand patch tests are shown in Table 1.51. Based on the mag-nitude of the texture depths, these sections are showing sig-nificant raveling. Based on visual observations in the field, all six mix sections also had weathered significantly; however, all mixes looked to have experienced the same amount of weath-ering. Figure 1.28 shows an example of the surface texture of the mix sections in Franklin, Tennessee.
Core Testing
At the time of the 3-year project inspection, seven 6-in. (150-mm) cores were taken from each mix section similar to previous projects. During tensile strength testing, two between-wheelpath cores from the HMA 2 (Danley) section and two from the Advera section broke incorrectly because they were too thin. Instead of fracturing, the tops of the samples were simply crushed. All of the cores from this project were very thin, but these were the only four that failed in this manner.
Mix Average Rut Depth (mm) Standard Deviation (mm)
HMA Franklin 0.0 0.0
HMA Danley 0.0 0.0
Advera 0.5 0.5
Astec DBG 0.4 0.6
Evotherm DAT 0.0 0.0
Sasobit 0.0 0.0
Table 1.49. Rut depths for Franklin, Tennessee.
A summary of the results of the core tests are shown in Table 1.52. It can be seen that there were significant variations in gradations and asphalt contents among the results for the different sections. The dust content varied from 5.8% to 9.7%, whereas the asphalt content varied from 4.50% to 5.38%. The in-place densities were low for all mixes except the first HMA mix. These low densities were similar to the results of the ini-tial cores obtained after construction and indicate that the test sections likely were not well compacted during construc-tion. This would have contributed to the raveling. The tensile strengths of the WMA were higher than for the two HMA mixes. These results may have been affected by the thin cores,
MixSection
Wheelpath Longitudinal
Non-Wheelpath Longitudinal Transverse Fatigue
# ofCracks
Total Length
(m) # of
Cracks
Total Length
(m) # of
Cracks
Total Length
(m) # of
Cracks
Total Length
(m) HMA 1 2 11.0 0 0 0 0 0 0 HMA 2 4 7.3 0 0 0 0 0 0 Advera 5 16.8 6 25.9 1 0.9 0 0 Astec DBG 2 6.1 0 0 4 11.6 0 0 Evotherm 1 12.5 0 0 0 0 2 13.7Sasobit 7 57.9 2 29.0 3 2.0 0 0
Table 1.50. Cracking measurements for Franklin, Tennessee.
Figure 1.26. Wheelpath longitudinal cracking in Franklin, Tennessee.
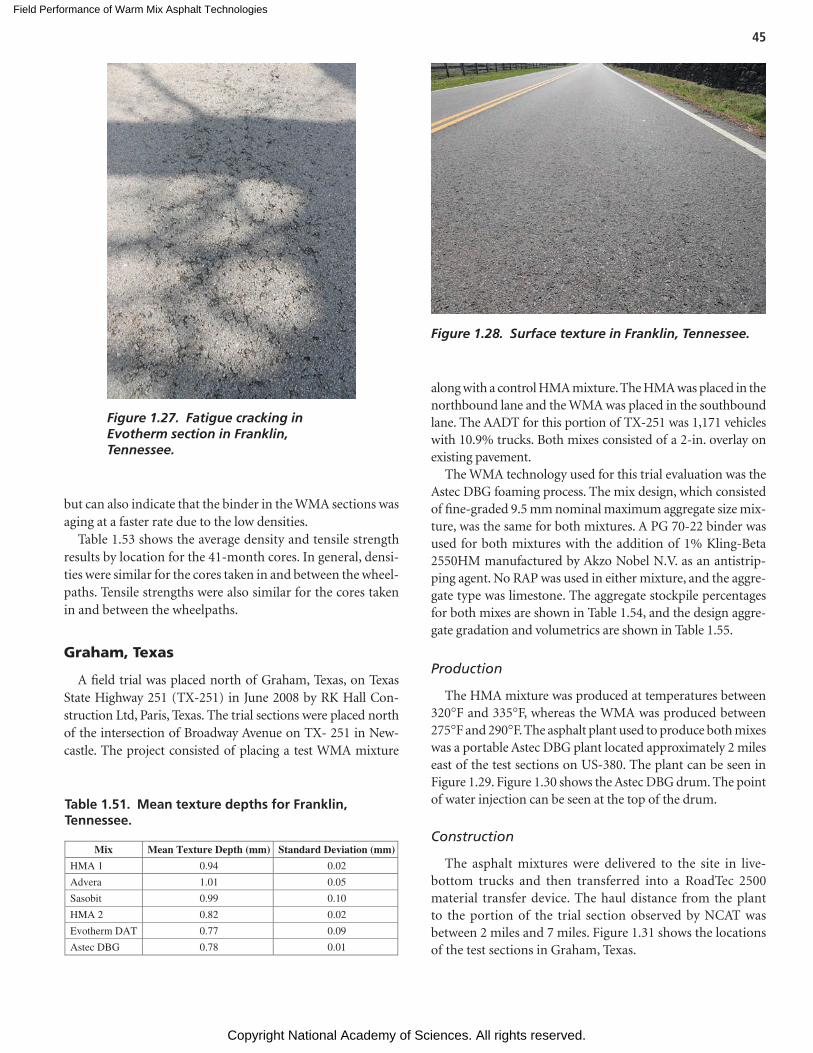
Field Performance of Warm Mix Asphalt Technologies
Copyright National Academy of Sciences. All rights reserved.
45
Figure 1.27. Fatigue cracking in Evotherm section in Franklin, Tennessee.
Mix Mean Texture Depth (mm) Standard Deviation (mm)
HMA 1 0.94 0.02
Advera 1.01 0.05
Sasobit 0.99 0.10
HMA 2 0.82 0.02
Evotherm DAT 0.77 0.09
Astec DBG 0.78 0.01
Table 1.51. Mean texture depths for Franklin, Tennessee.
Figure 1.28. Surface texture in Franklin, Tennessee.
but can also indicate that the binder in the WMA sections was aging at a faster rate due to the low densities.
Table 1.53 shows the average density and tensile strength results by location for the 41-month cores. In general, densi-ties were similar for the cores taken in and between the wheel-paths. Tensile strengths were also similar for the cores taken in and between the wheelpaths.
Graham, Texas
A field trial was placed north of Graham, Texas, on Texas State Highway 251 (TX-251) in June 2008 by RK Hall Con-struction Ltd, Paris, Texas. The trial sections were placed north of the intersection of Broadway Avenue on TX- 251 in New-castle. The project consisted of placing a test WMA mixture
along with a control HMA mixture. The HMA was placed in the northbound lane and the WMA was placed in the southbound lane. The AADT for this portion of TX-251 was 1,171 vehicles with 10.9% trucks. Both mixes consisted of a 2-in. overlay on existing pavement.
The WMA technology used for this trial evaluation was the Astec DBG foaming process. The mix design, which consisted of fine-graded 9.5 mm nominal maximum aggregate size mix-ture, was the same for both mixtures. A PG 70-22 binder was used for both mixtures with the addition of 1% Kling-Beta 2550HM manufactured by Akzo Nobel N.V. as an antistrip-ping agent. No RAP was used in either mixture, and the aggre-gate type was limestone. The aggregate stockpile percentages for both mixes are shown in Table 1.54, and the design aggre-gate gradation and volumetrics are shown in Table 1.55.
Production
The HMA mixture was produced at temperatures between 320°F and 335°F, whereas the WMA was produced between 275°F and 290°F. The asphalt plant used to produce both mixes was a portable Astec DBG plant located approximately 2 miles east of the test sections on US-380. The plant can be seen in Figure 1.29. Figure 1.30 shows the Astec DBG drum. The point of water injection can be seen at the top of the drum.
Construction
The asphalt mixtures were delivered to the site in live- bottom trucks and then transferred into a RoadTec 2500 material transfer device. The haul distance from the plant to the portion of the trial section observed by NCAT was between 2 miles and 7 miles. Figure 1.31 shows the locations of the test sections in Graham, Texas.
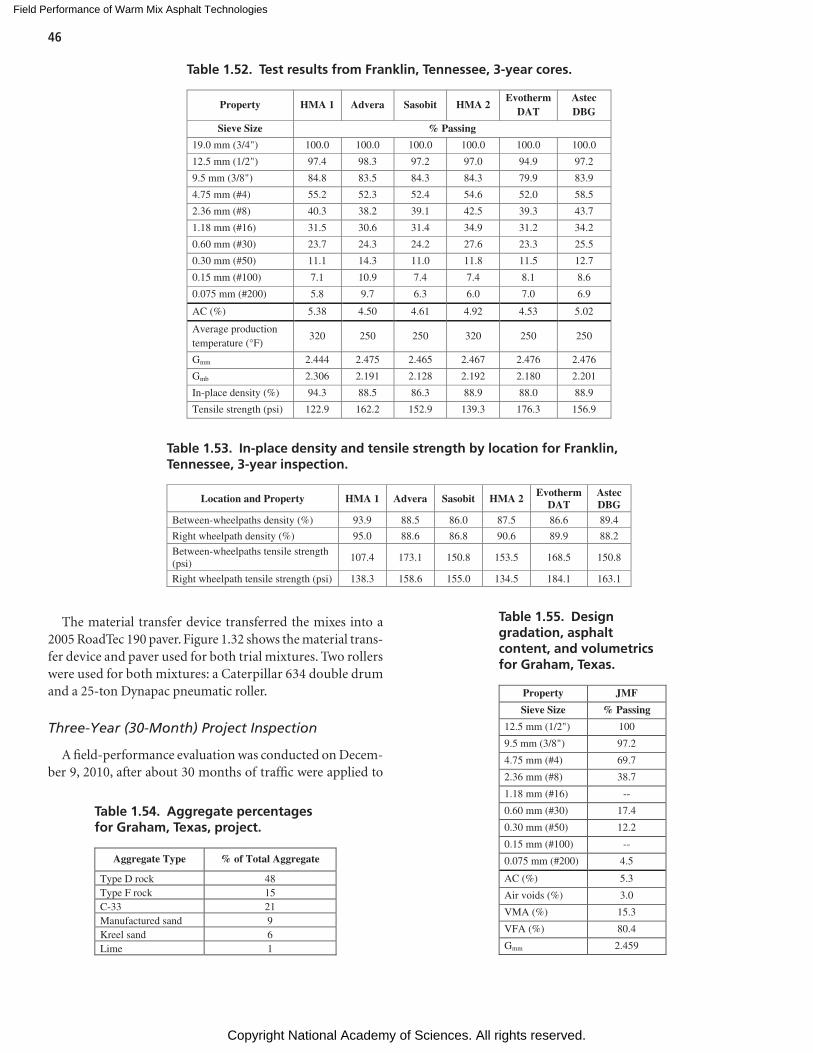
Field Performance of Warm Mix Asphalt Technologies
Copyright National Academy of Sciences. All rights reserved.
46
The material transfer device transferred the mixes into a 2005 RoadTec 190 paver. Figure 1.32 shows the material trans-fer device and paver used for both trial mixtures. Two rollers were used for both mixtures: a Caterpillar 634 double drum and a 25-ton Dynapac pneumatic roller.
Three-Year (30-Month) Project Inspection
A field-performance evaluation was conducted on Decem-ber 9, 2010, after about 30 months of traffic were applied to
Location and Property HMA 1 Advera Sasobit HMA 2 EvothermDAT
Astec DBG
Between-wheelpaths density (%) 93.9 88.5 86.0 87.5 86.6 89.4
Right wheelpath density (%) 95.0 88.6 86.8 90.6 89.9 88.2
Between-wheelpaths tensile strength(psi)
107.4 173.1 150.8 153.5 168.5 150.8
Right wheelpath tensile strength (psi) 138.3 158.6 155.0 134.5 184.1 163.1
Table 1.53. In-place density and tensile strength by location for Franklin, Tennessee, 3-year inspection.
Aggregate Type % of Total Aggregate
Type D rock 48Type F rock 15C-33 21Manufactured sand 9 Kreel sand 6 Lime 1
Table 1.54. Aggregate percentages for Graham, Texas, project.
Property JMF
Sieve Size % Passing
12.5 mm (1/2") 100
9.5 mm (3/8") 97.2
4.75 mm (#4) 69.7
2.36 mm (#8) 38.7
1.18 mm (#16) --
0.60 mm (#30) 17.4
0.30 mm (#50) 12.2
0.15 mm (#100) --
0.075 mm (#200) 4.5
AC (%) 5.3
Air voids (%) 3.0
VMA (%) 15.3
VFA (%) 80.4
Gmm 2.459
Table 1.55. Design gradation, asphalt content, and volumetrics for Graham, Texas.
Property HMA 1 Advera Sasobit HMA 2 Evotherm
DATAstec DBG
Sieve Size % Passing
19.0 mm (3/4") 100.0 100.0 100.0 100.0 100.0 100.0
12.5 mm (1/2") 97.4 98.3 97.2 97.0 94.9 97.2
9.5 mm (3/8") 84.8 83.5 84.3 84.3 79.9 83.9
4.75 mm (#4) 55.2 52.3 52.4 54.6 52.0 58.5
2.36 mm (#8) 40.3 38.2 39.1 42.5 39.3 43.7
1.18 mm (#16) 31.5 30.6 31.4 34.9 31.2 34.2
0.60 mm (#30) 23.7 24.3 24.2 27.6 23.3 25.5
0.30 mm (#50) 11.1 14.3 11.0 11.8 11.5 12.7
0.15 mm (#100) 7.1 10.9 7.4 7.4 8.1 8.6
0.075 mm (#200) 5.8 9.7 6.3 6.0 7.0 6.9
AC (%) 5.38 4.50 4.61 4.92 4.53 5.02
Average productiontemperature (°F)
320 250 250 320 250 250
Gmm 2.444 2.475 2.465 2.467 2.476 2.476
Gmb 2.306 2.191 2.128 2.192 2.180 2.201
In-place density (%) 94.3 88.5 86.3 88.9 88.0 88.9
Tensile strength (psi) 122.9 162.2 152.9 139.3 176.3 156.9
Table 1.52. Test results from Franklin, Tennessee, 3-year cores.
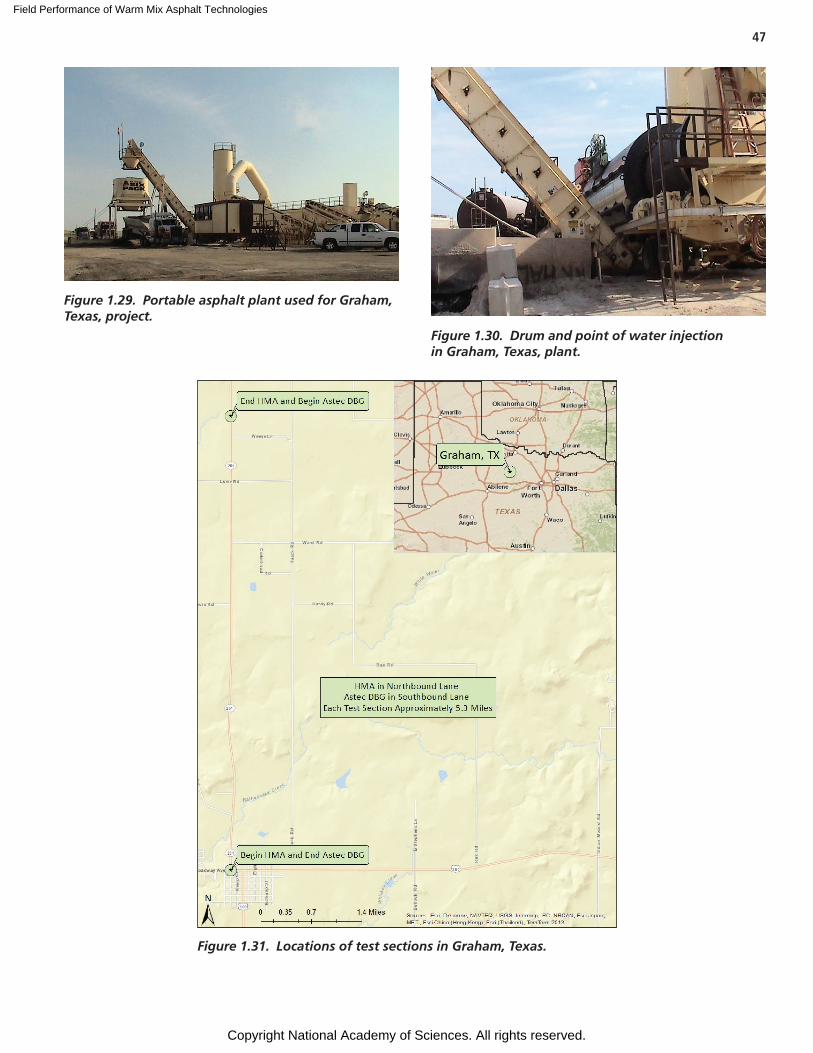
Field Performance of Warm Mix Asphalt Technologies
Copyright National Academy of Sciences. All rights reserved.
47
Figure 1.29. Portable asphalt plant used for Graham, Texas, project.
Figure 1.30. Drum and point of water injection in Graham, Texas, plant.
Figure 1.31. Locations of test sections in Graham, Texas.
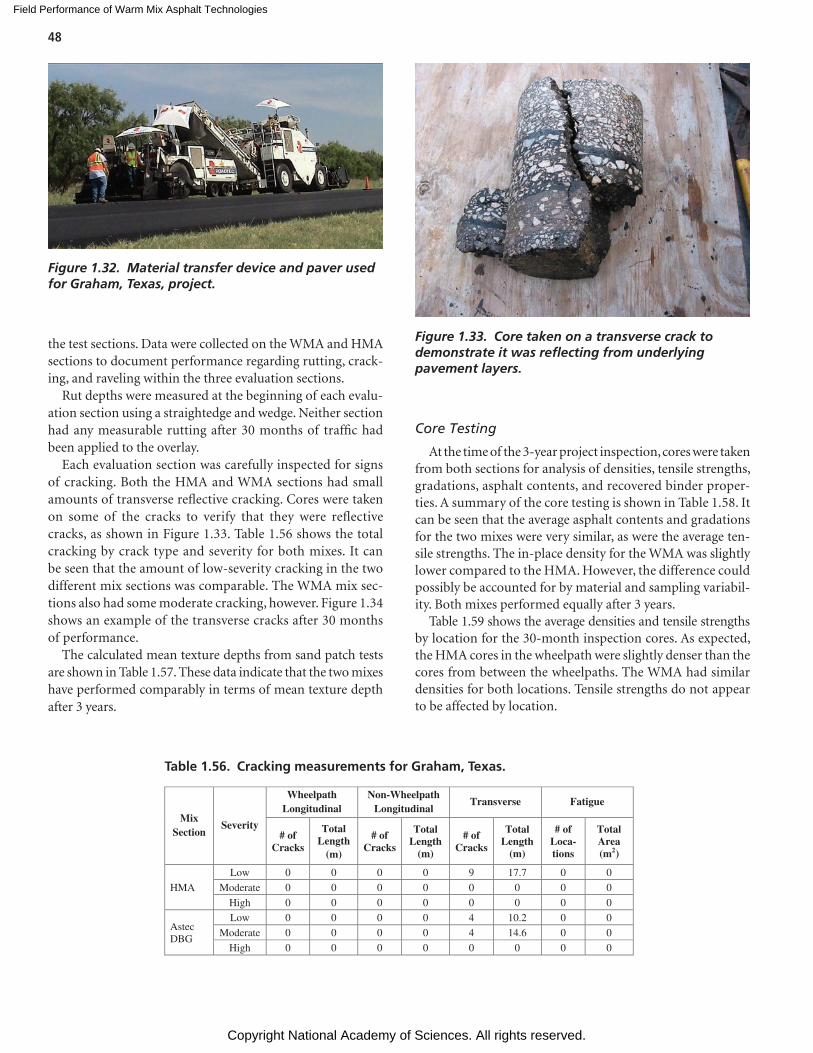
Field Performance of Warm Mix Asphalt Technologies
Copyright National Academy of Sciences. All rights reserved.
48
Figure 1.32. Material transfer device and paver used for Graham, Texas, project.
Figure 1.33. Core taken on a transverse crack to demonstrate it was reflecting from underlying pavement layers.
MixSection
Severity
Wheelpath Longitudinal
Non-Wheelpath Longitudinal
Transverse Fatigue
# ofCracks
Total Length
(m)
# ofCracks
Total Length
(m)
# ofCracks
Total Length
(m)
# ofLoca-tions
Total Area (m )2
HMA
Low 0 0 0 0 9 17.7 0 0
Moderate 0 0 0 0 0 0 0 0
High 0 0 0 0 0 0 0 0
AstecDBG
Low 0 0 0 0 4 10.2 0 0
Moderate 0 0 0 0 4 14.6 0 0
High 0 0 0 0 0 0 0 0
Table 1.56. Cracking measurements for Graham, Texas.
the test sections. Data were collected on the WMA and HMA sections to document performance regarding rutting, crack-ing, and raveling within the three evaluation sections.
Rut depths were measured at the beginning of each evalu-ation section using a straightedge and wedge. Neither section had any measurable rutting after 30 months of traffic had been applied to the overlay.
Each evaluation section was carefully inspected for signs of cracking. Both the HMA and WMA sections had small amounts of transverse reflective cracking. Cores were taken on some of the cracks to verify that they were reflective cracks, as shown in Figure 1.33. Table 1.56 shows the total cracking by crack type and severity for both mixes. It can be seen that the amount of low-severity cracking in the two different mix sections was comparable. The WMA mix sec-tions also had some moderate cracking, however. Figure 1.34 shows an example of the transverse cracks after 30 months of performance.
The calculated mean texture depths from sand patch tests are shown in Table 1.57. These data indicate that the two mixes have performed comparably in terms of mean texture depth after 3 years.
Core Testing
At the time of the 3-year project inspection, cores were taken from both sections for analysis of densities, tensile strengths, gradations, asphalt contents, and recovered binder proper-ties. A summary of the core testing is shown in Table 1.58. It can be seen that the average asphalt contents and gradations for the two mixes were very similar, as were the average ten-sile strengths. The in-place density for the WMA was slightly lower compared to the HMA. However, the difference could possibly be accounted for by material and sampling variabil-ity. Both mixes performed equally after 3 years.
Table 1.59 shows the average densities and tensile strengths by location for the 30-month inspection cores. As expected, the HMA cores in the wheelpath were slightly denser than the cores from between the wheelpaths. The WMA had similar densities for both locations. Tensile strengths do not appear to be affected by location.
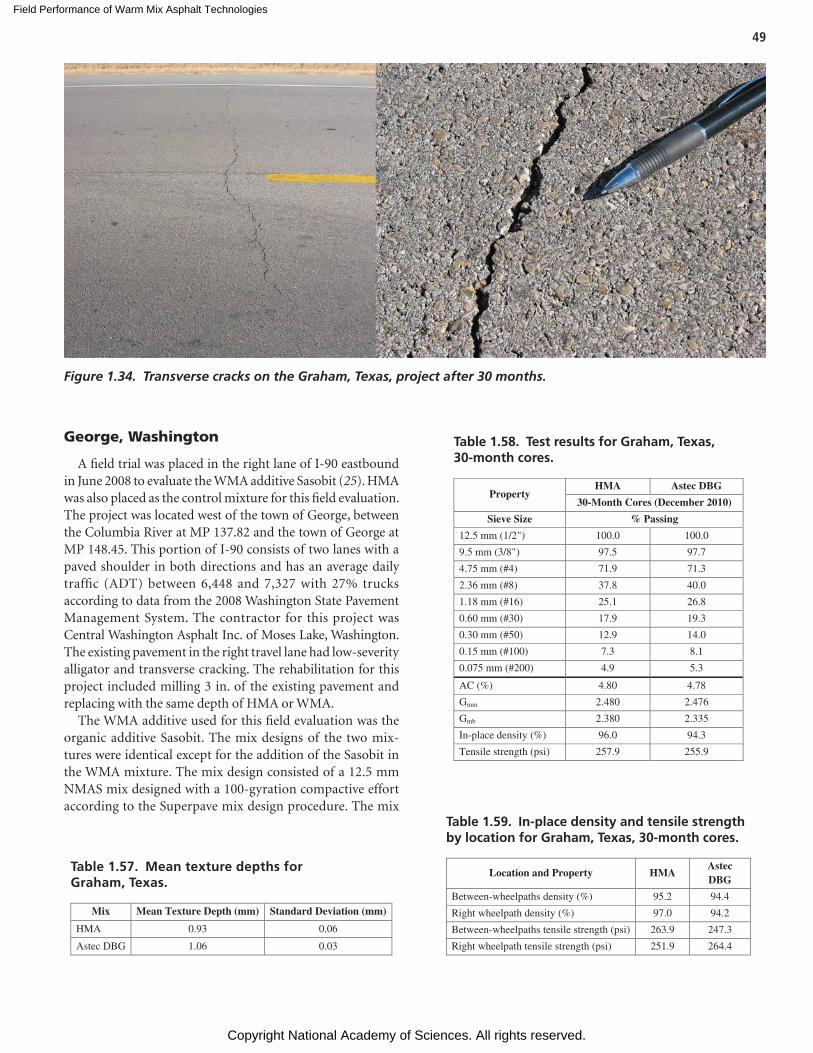
Field Performance of Warm Mix Asphalt Technologies
Copyright National Academy of Sciences. All rights reserved.
49
Figure 1.34. Transverse cracks on the Graham, Texas, project after 30 months.
George, Washington
A field trial was placed in the right lane of I-90 eastbound in June 2008 to evaluate the WMA additive Sasobit (25). HMA was also placed as the control mixture for this field evaluation. The project was located west of the town of George, between the Columbia River at MP 137.82 and the town of George at MP 148.45. This portion of I-90 consists of two lanes with a paved shoulder in both directions and has an average daily traffic (ADT) between 6,448 and 7,327 with 27% trucks according to data from the 2008 Washington State Pavement Management System. The contractor for this project was Central Washington Asphalt Inc. of Moses Lake, Washington. The existing pavement in the right travel lane had low-severity alligator and transverse cracking. The rehabilitation for this project included milling 3 in. of the existing pavement and replacing with the same depth of HMA or WMA.
The WMA additive used for this field evaluation was the organic additive Sasobit. The mix designs of the two mix-tures were identical except for the addition of the Sasobit in the WMA mixture. The mix design consisted of a 12.5 mm NMAS mix designed with a 100-gyration compactive effort according to the Superpave mix design procedure. The mix
Mix Mean Texture Depth (mm) Standard Deviation (mm)
HMA 0.93 0.06
Astec DBG 1.06 0.03
Table 1.57. Mean texture depths for Graham, Texas.
PropertyHMA Astec DBG
30-Month Cores (December 2010)
Sieve Size % Passing
12.5 mm (1/2") 100.0 100.0
9.5 mm (3/8") 97.5 97.7
4.75 mm (#4) 71.9 71.3
2.36 mm (#8) 37.8 40.0
1.18 mm (#16) 25.1 26.8
0.60 mm (#30) 17.9 19.3
0.30 mm (#50) 12.9 14.0
0.15 mm (#100) 7.3 8.1
0.075 mm (#200) 4.9 5.3
AC (%) 4.80 4.78
Gmm 2.480 2.476
Gmb 2.380 2.335
In-place density (%) 96.0 94.3
Tensile strength (psi) 257.9 255.9
Table 1.58. Test results for Graham, Texas, 30-month cores.
Location and Property HMAAstec DBG
Between-wheelpaths density (%) 95.2 94.4
Right wheelpath density (%) 97.0 94.2
Between-wheelpaths tensile strength (psi) 263.9 247.3
Right wheelpath tensile strength (psi) 251.9 264.4
Table 1.59. In-place density and tensile strength by location for Graham, Texas, 30-month cores.
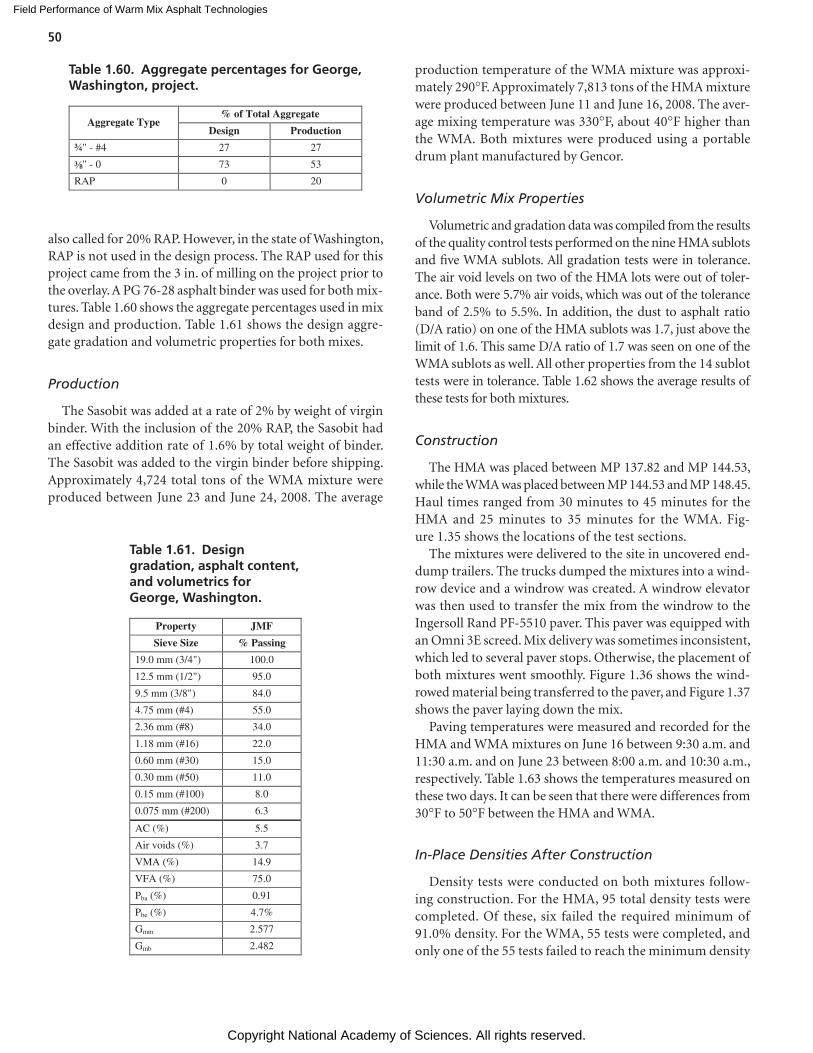
Field Performance of Warm Mix Asphalt Technologies
Copyright National Academy of Sciences. All rights reserved.
50
also called for 20% RAP. However, in the state of Washington, RAP is not used in the design process. The RAP used for this project came from the 3 in. of milling on the project prior to the overlay. A PG 76-28 asphalt binder was used for both mix-tures. Table 1.60 shows the aggregate percentages used in mix design and production. Table 1.61 shows the design aggre-gate gradation and volumetric properties for both mixes.
Production
The Sasobit was added at a rate of 2% by weight of virgin binder. With the inclusion of the 20% RAP, the Sasobit had an effective addition rate of 1.6% by total weight of binder. The Sasobit was added to the virgin binder before shipping. Approximately 4,724 total tons of the WMA mixture were produced between June 23 and June 24, 2008. The average
production temperature of the WMA mixture was approxi-mately 290°F. Approximately 7,813 tons of the HMA mixture were produced between June 11 and June 16, 2008. The aver-age mixing temperature was 330°F, about 40°F higher than the WMA. Both mixtures were produced using a portable drum plant manufactured by Gencor.
Volumetric Mix Properties
Volumetric and gradation data was compiled from the results of the quality control tests performed on the nine HMA sublots and five WMA sublots. All gradation tests were in tolerance. The air void levels on two of the HMA lots were out of toler-ance. Both were 5.7% air voids, which was out of the tolerance band of 2.5% to 5.5%. In addition, the dust to asphalt ratio (D/A ratio) on one of the HMA sublots was 1.7, just above the limit of 1.6. This same D/A ratio of 1.7 was seen on one of the WMA sublots as well. All other properties from the 14 sublot tests were in tolerance. Table 1.62 shows the average results of these tests for both mixtures.
Construction
The HMA was placed between MP 137.82 and MP 144.53, while the WMA was placed between MP 144.53 and MP 148.45. Haul times ranged from 30 minutes to 45 minutes for the HMA and 25 minutes to 35 minutes for the WMA. Fig-ure 1.35 shows the locations of the test sections.
The mixtures were delivered to the site in uncovered end-dump trailers. The trucks dumped the mixtures into a wind-row device and a windrow was created. A windrow elevator was then used to transfer the mix from the windrow to the Ingersoll Rand PF-5510 paver. This paver was equipped with an Omni 3E screed. Mix delivery was sometimes inconsistent, which led to several paver stops. Otherwise, the placement of both mixtures went smoothly. Figure 1.36 shows the wind-rowed material being transferred to the paver, and Figure 1.37 shows the paver laying down the mix.
Paving temperatures were measured and recorded for the HMA and WMA mixtures on June 16 between 9:30 a.m. and 11:30 a.m. and on June 23 between 8:00 a.m. and 10:30 a.m., respectively. Table 1.63 shows the temperatures measured on these two days. It can be seen that there were differences from 30°F to 50°F between the HMA and WMA.
In-Place Densities After Construction
Density tests were conducted on both mixtures follow-ing construction. For the HMA, 95 total density tests were completed. Of these, six failed the required minimum of 91.0% density. For the WMA, 55 tests were completed, and only one of the 55 tests failed to reach the minimum density
Aggregate Type % of Total Aggregate
Design Production
¾" - #4 27 27
" - 0 73 53
RAP 0 20
8
Table 1.60. Aggregate percentages for George, Washington, project.
Property JMF
Sieve Size % Passing
19.0 mm (3/4") 100.0
12.5 mm (1/2") 95.0
9.5 mm (3/8") 84.0
4.75 mm (#4) 55.0
2.36 mm (#8) 34.0
1.18 mm (#16) 22.0
0.60 mm (#30) 15.0
0.30 mm (#50) 11.0
0.15 mm (#100) 8.0
0.075 mm (#200) 6.3
AC (%) 5.5
Air voids (%) 3.7
VMA (%) 14.9
VFA (%) 75.0
Pba (%) 0.91
Pbe (%) 4.7%
Gmm 2.577
Gmb 2.482
Table 1.61. Design gradation, asphalt content, and volumetrics for George, Washington.
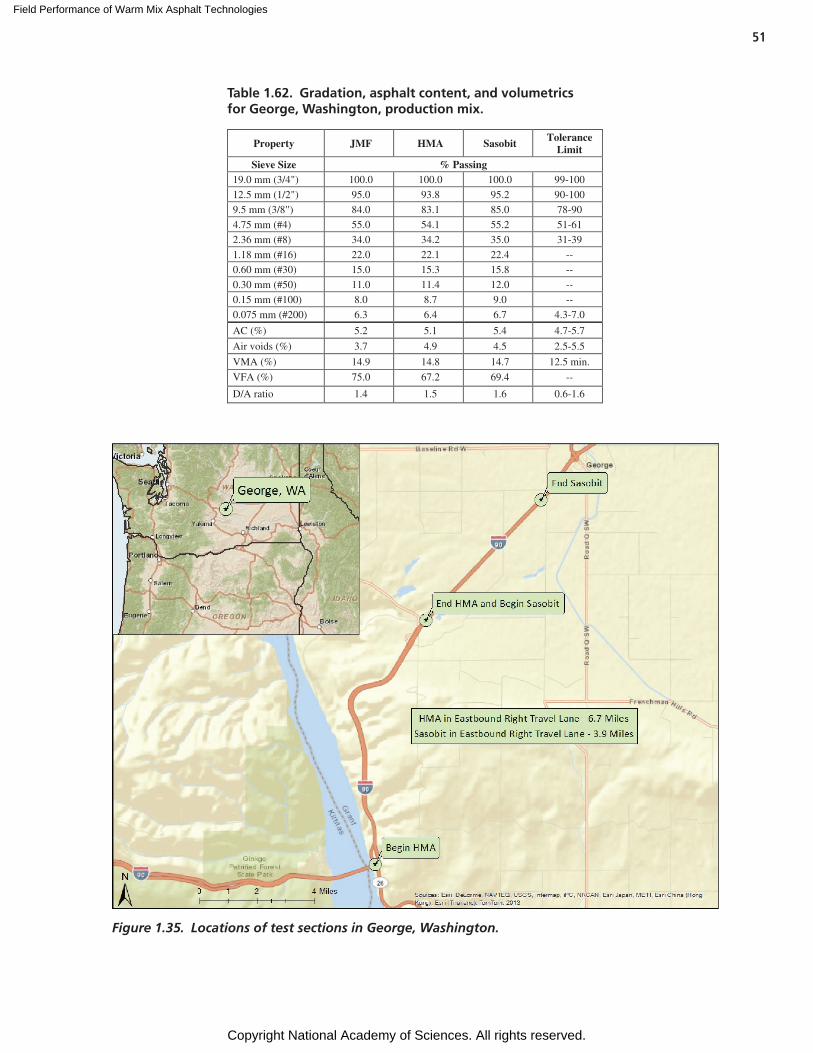
Field Performance of Warm Mix Asphalt Technologies
Copyright National Academy of Sciences. All rights reserved.
51
Property JMF HMA Sasobit Tolerance Limit
Sieve Size % Passing19.0 mm (3/4") 100.0 100.0 100.0 99-100
12.5 mm (1/2") 95.0 93.8 95.2 90-100
9.5 mm (3/8") 84.0 83.1 85.0 78-90
4.75 mm (#4) 55.0 54.1 55.2 51-61
2.36 mm (#8) 34.0 34.2 35.0 31-39
1.18 mm (#16) 22.0 22.1 22.4 --
0.60 mm (#30) 15.0 15.3 15.8 --
0.30 mm (#50) 11.0 11.4 12.0 --
0.15 mm (#100) 8.0 8.7 9.0 --
0.075 mm (#200) 6.3 6.4 6.7 4.3-7.0
AC (%) 5.2 5.1 5.4 4.7-5.7
Air voids (%) 3.7 4.9 4.5 2.5-5.5
VMA (%) 14.9 14.8 14.7 12.5 min.
VFA (%) 75.0 67.2 69.4 --
D/A ratio 1.4 1.5 1.6 0.6-1.6
Table 1.62. Gradation, asphalt content, and volumetrics for George, Washington, production mix.
Figure 1.35. Locations of test sections in George, Washington.
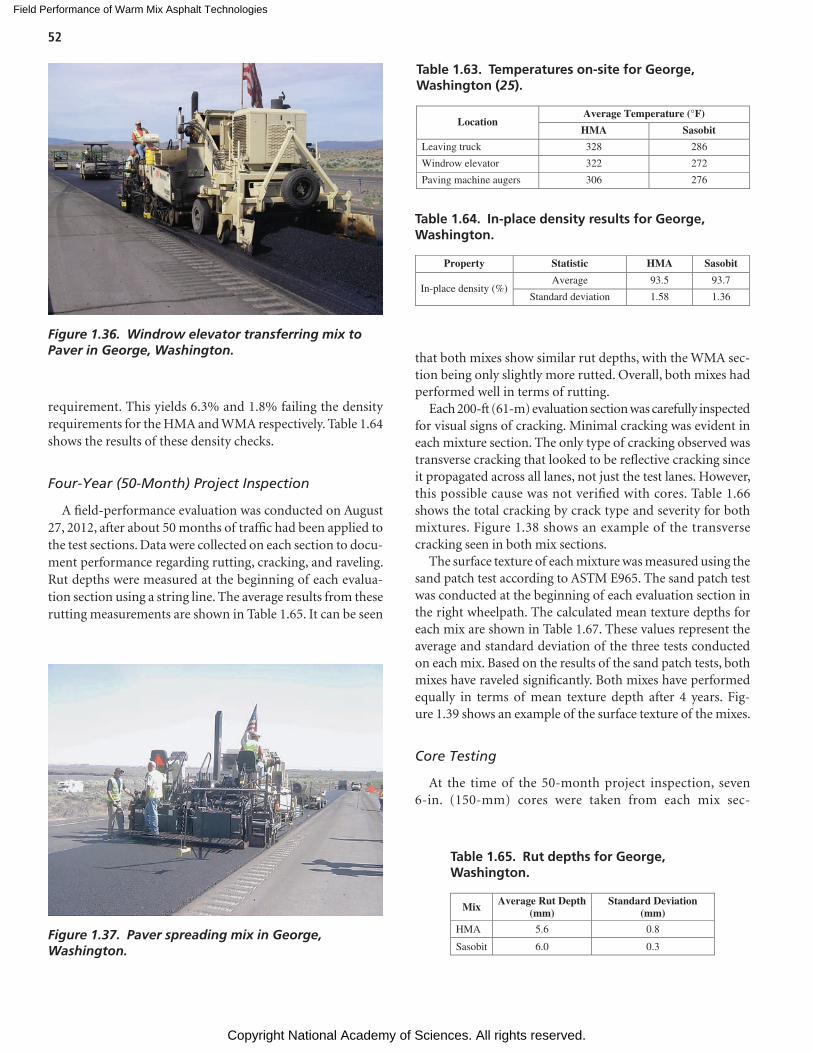
Field Performance of Warm Mix Asphalt Technologies
Copyright National Academy of Sciences. All rights reserved.
52
requirement. This yields 6.3% and 1.8% failing the density requirements for the HMA and WMA respectively. Table 1.64 shows the results of these density checks.
Four-Year (50-Month) Project Inspection
A field-performance evaluation was conducted on August 27, 2012, after about 50 months of traffic had been applied to the test sections. Data were collected on each section to docu-ment performance regarding rutting, cracking, and raveling. Rut depths were measured at the beginning of each evalua-tion section using a string line. The average results from these rutting measurements are shown in Table 1.65. It can be seen
that both mixes show similar rut depths, with the WMA sec-tion being only slightly more rutted. Overall, both mixes had performed well in terms of rutting.
Each 200-ft (61-m) evaluation section was carefully inspected for visual signs of cracking. Minimal cracking was evident in each mixture section. The only type of cracking observed was transverse cracking that looked to be reflective cracking since it propagated across all lanes, not just the test lanes. However, this possible cause was not verified with cores. Table 1.66 shows the total cracking by crack type and severity for both mixtures. Figure 1.38 shows an example of the transverse cracking seen in both mix sections.
The surface texture of each mixture was measured using the sand patch test according to ASTM E965. The sand patch test was conducted at the beginning of each evaluation section in the right wheelpath. The calculated mean texture depths for each mix are shown in Table 1.67. These values represent the average and standard deviation of the three tests conducted on each mix. Based on the results of the sand patch tests, both mixes have raveled significantly. Both mixes have performed equally in terms of mean texture depth after 4 years. Fig-ure 1.39 shows an example of the surface texture of the mixes.
Core Testing
At the time of the 50-month project inspection, seven 6-in. (150-mm) cores were taken from each mix sec-
Figure 1.36. Windrow elevator transferring mix to Paver in George, Washington.
Figure 1.37. Paver spreading mix in George, Washington.
Location Average Temperature (°F)
HMA Sasobit
Leaving truck 328 286
Windrow elevator 322 272
Paving machine augers 306 276
Table 1.63. Temperatures on-site for George, Washington (25).
Property Statistic HMA Sasobit
In-place density (%) Average 93.5 93.7
Standard deviation 1.58 1.36
Table 1.64. In-place density results for George, Washington.
Mix Average Rut Depth (mm)
Standard Deviation (mm)
HMA 5.6 0.8
Sasobit 6.0 0.3
Table 1.65. Rut depths for George, Washington.
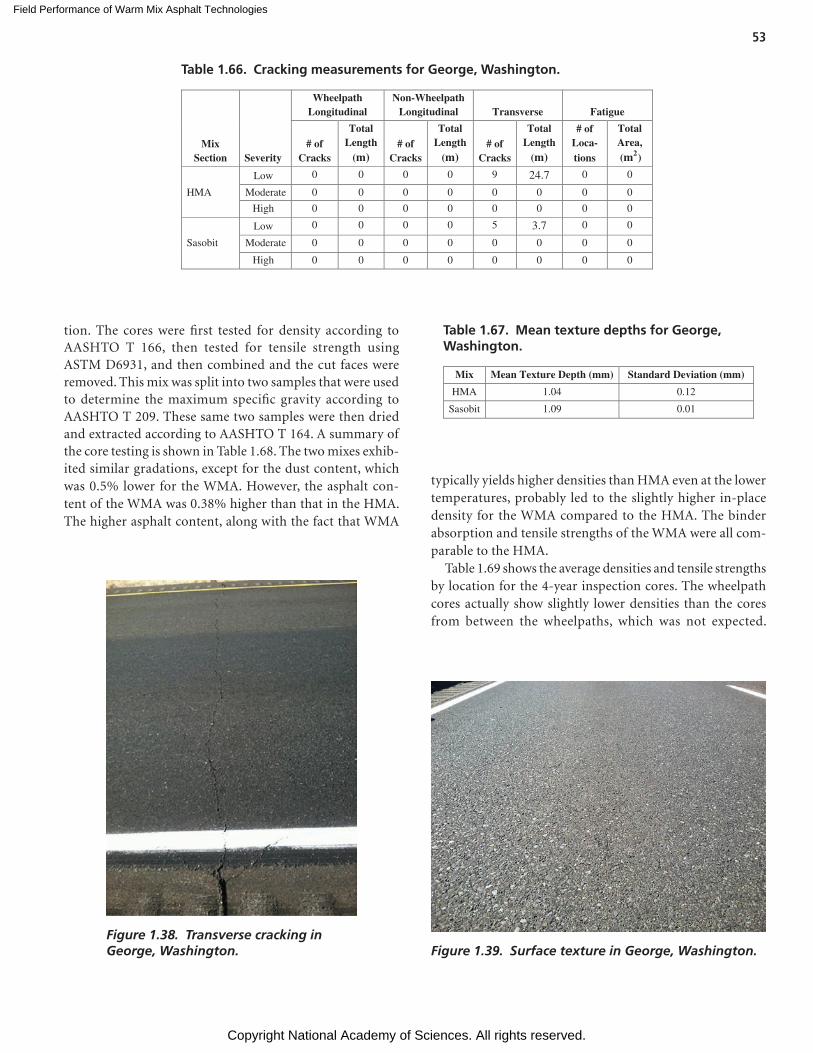
Field Performance of Warm Mix Asphalt Technologies
Copyright National Academy of Sciences. All rights reserved.
53
tion. The cores were first tested for density according to AASHTO T 166, then tested for tensile strength using ASTM D6931, and then combined and the cut faces were removed. This mix was split into two samples that were used to determine the maximum specific gravity according to AASHTO T 209. These same two samples were then dried and extracted according to AASHTO T 164. A summary of the core testing is shown in Table 1.68. The two mixes exhib-ited similar gradations, except for the dust content, which was 0.5% lower for the WMA. However, the asphalt con-tent of the WMA was 0.38% higher than that in the HMA. The higher asphalt content, along with the fact that WMA
typically yields higher densities than HMA even at the lower temperatures, probably led to the slightly higher in-place density for the WMA compared to the HMA. The binder absorption and tensile strengths of the WMA were all com-parable to the HMA.
Table 1.69 shows the average densities and tensile strengths by location for the 4-year inspection cores. The wheelpath cores actually show slightly lower densities than the cores from between the wheelpaths, which was not expected.
MixSection Severity
Wheelpath Longitudinal
Non-Wheelpath Longitudinal Transverse Fatigue
# ofCracks
Total Length
(m)# of
Cracks
Total Length
(m)# of
Cracks
Total Length
(m)
# ofLoca- tions
Total Area,(m )2
HMA
Low 0 0 0 0 9 24.7 0 0
Moderate 0 0 0 0 0 0 0 0
High 0 0 0 0 0 0 0 0
Sasobit
Low 0 0 0 0 5 3.7 0 0
Moderate 0 0 0 0 0 0 0 0
High 0 0 0 0 0 0 0 0
Table 1.66. Cracking measurements for George, Washington.
Figure 1.38. Transverse cracking in George, Washington.
Mix Mean Texture Depth (mm) Standard Deviation (mm)
HMA 1.04 0.12
Sasobit 1.09 0.01
Table 1.67. Mean texture depths for George, Washington.
Figure 1.39. Surface texture in George, Washington.
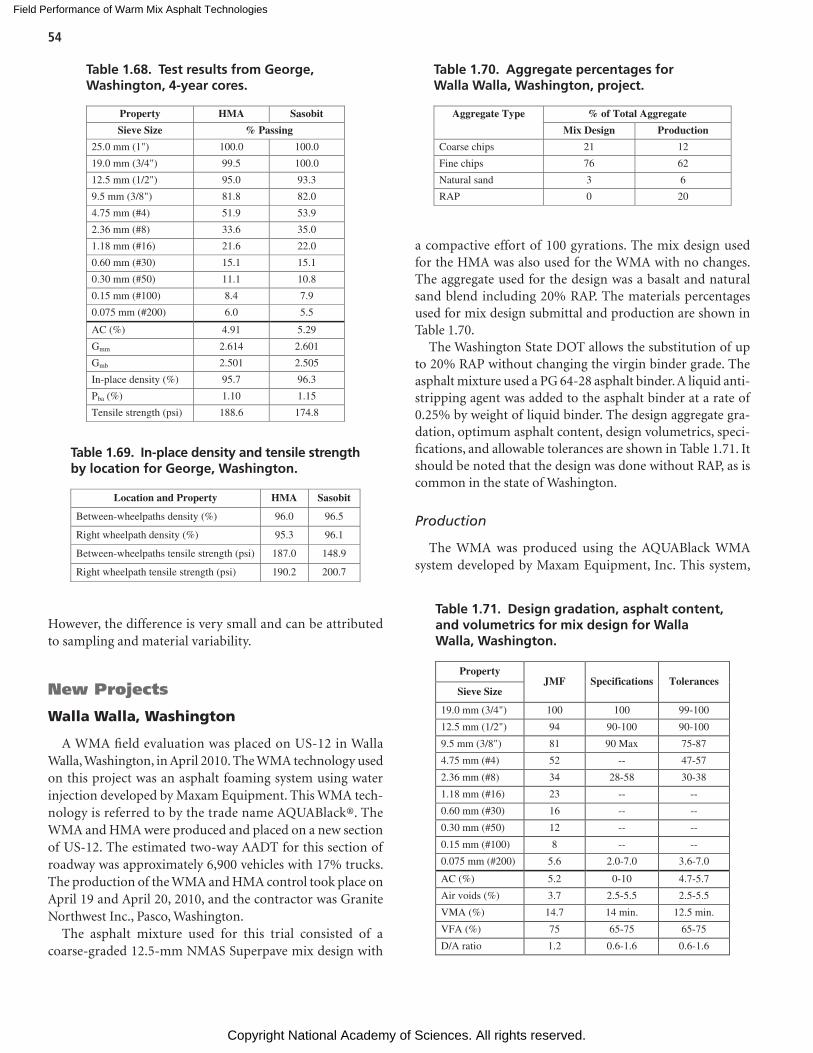
Field Performance of Warm Mix Asphalt Technologies
Copyright National Academy of Sciences. All rights reserved.
54
However, the difference is very small and can be attributed to sampling and material variability.
New Projects
Walla Walla, Washington
A WMA field evaluation was placed on US-12 in Walla Walla, Washington, in April 2010. The WMA technology used on this project was an asphalt foaming system using water injection developed by Maxam Equipment. This WMA tech-nology is referred to by the trade name AQUABlack®. The WMA and HMA were produced and placed on a new section of US-12. The estimated two-way AADT for this section of roadway was approximately 6,900 vehicles with 17% trucks. The production of the WMA and HMA control took place on April 19 and April 20, 2010, and the contractor was Granite Northwest Inc., Pasco, Washington.
The asphalt mixture used for this trial consisted of a coarse-graded 12.5-mm NMAS Superpave mix design with
a compactive effort of 100 gyrations. The mix design used for the HMA was also used for the WMA with no changes. The aggregate used for the design was a basalt and natural sand blend including 20% RAP. The materials percentages used for mix design submittal and production are shown in Table 1.70.
The Washington State DOT allows the substitution of up to 20% RAP without changing the virgin binder grade. The asphalt mixture used a PG 64-28 asphalt binder. A liquid anti-stripping agent was added to the asphalt binder at a rate of 0.25% by weight of liquid binder. The design aggregate gra-dation, optimum asphalt content, design volumetrics, speci-fications, and allowable tolerances are shown in Table 1.71. It should be noted that the design was done without RAP, as is common in the state of Washington.
Production
The WMA was produced using the AQUABlack WMA system developed by Maxam Equipment, Inc. This system,
Property HMA Sasobit
Sieve Size % Passing
25.0 mm (1") 100.0 100.0
19.0 mm (3/4") 99.5 100.0
12.5 mm (1/2") 95.0 93.3
9.5 mm (3/8") 81.8 82.0
4.75 mm (#4) 51.9 53.9
2.36 mm (#8) 33.6 35.0
1.18 mm (#16) 21.6 22.0
0.60 mm (#30) 15.1 15.1
0.30 mm (#50) 11.1 10.8
0.15 mm (#100) 8.4 7.9
0.075 mm (#200) 6.0 5.5
AC (%) 4.91 5.29
Gmm 2.614 2.601
Gmb 2.501 2.505
In-place density (%) 95.7 96.3
Pba (%) 1.10 1.15
Tensile strength (psi) 188.6 174.8
Table 1.68. Test results from George, Washington, 4-year cores.
Location and Property HMA Sasobit
Between-wheelpaths density (%) 96.0 96.5
Right wheelpath density (%) 95.3 96.1
Between-wheelpaths tensile strength (psi) 187.0 148.9
Right wheelpath tensile strength (psi) 190.2 200.7
Table 1.69. In-place density and tensile strength by location for George, Washington.
Aggregate Type % of Total Aggregate
Mix Design Production
Coarse chips 21 12
Fine chips 76 62
Natural sand 3 6
RAP 0 20
Table 1.70. Aggregate percentages for Walla Walla, Washington, project.
PropertyJMF Specifications Tolerances
Sieve Size
19.0 mm (3/4") 100 100 99-100
12.5 mm (1/2") 94 90-100 90-100
9.5 mm (3/8") 81 90 Max 75-87
4.75 mm (#4) 52 -- 47-57
2.36 mm (#8) 34 28-58 30-38
1.18 mm (#16) 23 -- --
0.60 mm (#30) 16 -- --
0.30 mm (#50) 12 -- --
0.15 mm (#100) 8 -- --
0.075 mm (#200) 5.6 2.0-7.0 3.6-7.0
AC (%) 5.2 0-10 4.7-5.7
Air voids (%) 3.7 2.5-5.5 2.5-5.5
VMA (%) 14.7 14 min. 12.5 min.
VFA (%) 75 65-75 65-75
D/A ratio 1.2 0.6-1.6 0.6-1.6
Table 1.71. Design gradation, asphalt content, and volumetrics for mix design for Walla Walla, Washington.
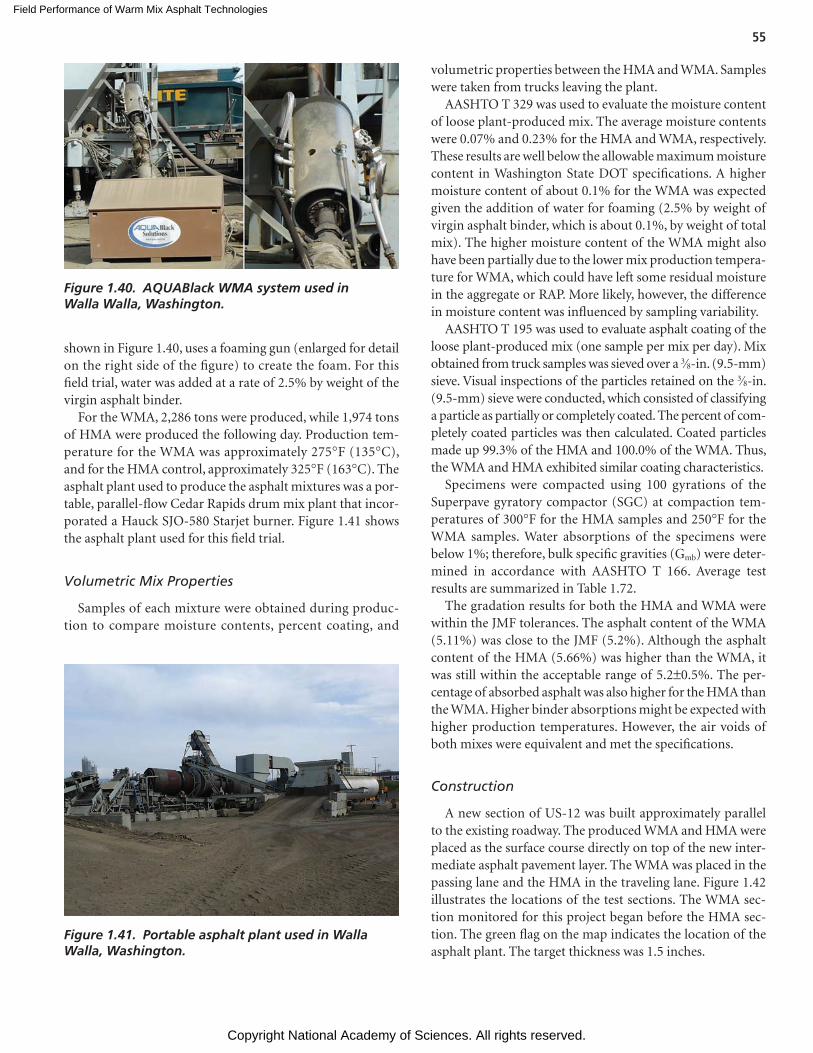
Field Performance of Warm Mix Asphalt Technologies
Copyright National Academy of Sciences. All rights reserved.
55
shown in Figure 1.40, uses a foaming gun (enlarged for detail on the right side of the figure) to create the foam. For this field trial, water was added at a rate of 2.5% by weight of the virgin asphalt binder.
For the WMA, 2,286 tons were produced, while 1,974 tons of HMA were produced the following day. Production tem-perature for the WMA was approximately 275°F (135°C), and for the HMA control, approximately 325°F (163°C). The asphalt plant used to produce the asphalt mixtures was a por-table, parallel-flow Cedar Rapids drum mix plant that incor-porated a Hauck SJO-580 Starjet burner. Figure 1.41 shows the asphalt plant used for this field trial.
Volumetric Mix Properties
Samples of each mixture were obtained during produc-tion to compare moisture contents, percent coating, and
volumetric properties between the HMA and WMA. Samples were taken from trucks leaving the plant.
AASHTO T 329 was used to evaluate the moisture content of loose plant-produced mix. The average moisture contents were 0.07% and 0.23% for the HMA and WMA, respectively. These results are well below the allowable maximum moisture content in Washington State DOT specifications. A higher moisture content of about 0.1% for the WMA was expected given the addition of water for foaming (2.5% by weight of virgin asphalt binder, which is about 0.1%, by weight of total mix). The higher moisture content of the WMA might also have been partially due to the lower mix production tempera-ture for WMA, which could have left some residual moisture in the aggregate or RAP. More likely, however, the difference in moisture content was influenced by sampling variability.
AASHTO T 195 was used to evaluate asphalt coating of the loose plant-produced mix (one sample per mix per day). Mix obtained from truck samples was sieved over a 3⁄8-in. (9.5-mm) sieve. Visual inspections of the particles retained on the 3⁄8-in. (9.5-mm) sieve were conducted, which consisted of classifying a particle as partially or completely coated. The percent of com-pletely coated particles was then calculated. Coated particles made up 99.3% of the HMA and 100.0% of the WMA. Thus, the WMA and HMA exhibited similar coating characteristics.
Specimens were compacted using 100 gyrations of the Superpave gyratory compactor (SGC) at compaction tem-peratures of 300°F for the HMA samples and 250°F for the WMA samples. Water absorptions of the specimens were below 1%; therefore, bulk specific gravities (Gmb) were deter-mined in accordance with AASHTO T 166. Average test results are summarized in Table 1.72.
The gradation results for both the HMA and WMA were within the JMF tolerances. The asphalt content of the WMA (5.11%) was close to the JMF (5.2%). Although the asphalt content of the HMA (5.66%) was higher than the WMA, it was still within the acceptable range of 5.2±0.5%. The per-centage of absorbed asphalt was also higher for the HMA than the WMA. Higher binder absorptions might be expected with higher production temperatures. However, the air voids of both mixes were equivalent and met the specifications.
Construction
A new section of US-12 was built approximately parallel to the existing roadway. The produced WMA and HMA were placed as the surface course directly on top of the new inter-mediate asphalt pavement layer. The WMA was placed in the passing lane and the HMA in the traveling lane. Figure 1.42 illustrates the locations of the test sections. The WMA sec-tion monitored for this project began before the HMA sec-tion. The green flag on the map indicates the location of the asphalt plant. The target thickness was 1.5 inches.
Figure 1.40. AQUABlack WMA system used in Walla Walla, Washington.
Figure 1.41. Portable asphalt plant used in Walla Walla, Washington.
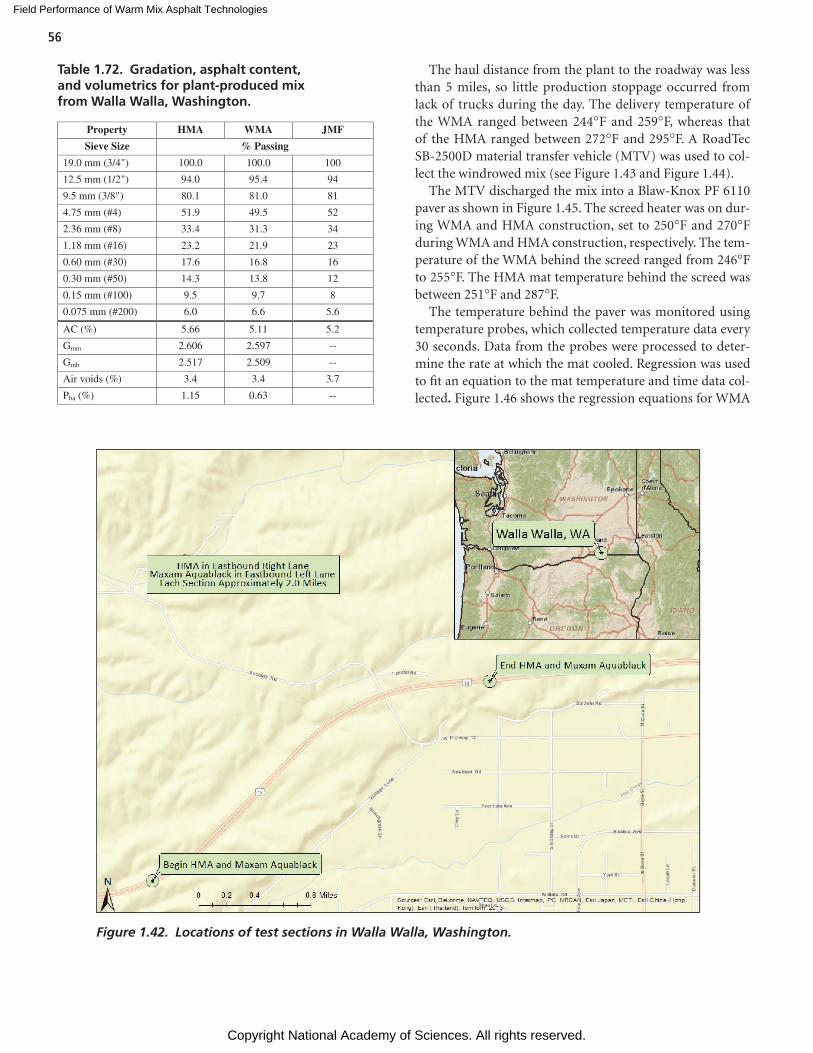
Field Performance of Warm Mix Asphalt Technologies
Copyright National Academy of Sciences. All rights reserved.
56
The haul distance from the plant to the roadway was less than 5 miles, so little production stoppage occurred from lack of trucks during the day. The delivery temperature of the WMA ranged between 244°F and 259°F, whereas that of the HMA ranged between 272°F and 295°F. A RoadTec SB-2500D material transfer vehicle (MTV) was used to col-lect the windrowed mix (see Figure 1.43 and Figure 1.44).
The MTV discharged the mix into a Blaw-Knox PF 6110 paver as shown in Figure 1.45. The screed heater was on dur-ing WMA and HMA construction, set to 250°F and 270°F during WMA and HMA construction, respectively. The tem-perature of the WMA behind the screed ranged from 246°F to 255°F. The HMA mat temperature behind the screed was between 251°F and 287°F.
The temperature behind the paver was monitored using temperature probes, which collected temperature data every 30 seconds. Data from the probes were processed to deter-mine the rate at which the mat cooled. Regression was used to fit an equation to the mat temperature and time data col-lected. Figure 1.46 shows the regression equations for WMA
Property HMA WMA JMF
Sieve Size % Passing 19.0 mm (3/4") 100.0 100.0 100
12.5 mm (1/2") 94.0 95.4 94
9.5 mm (3/8") 80.1 81.0 81
4.75 mm (#4) 51.9 49.5 52
2.36 mm (#8) 33.4 31.3 34
1.18 mm (#16) 23.2 21.9 23
0.60 mm (#30) 17.6 16.8 16
0.30 mm (#50) 14.3 13.8 12
0.15 mm (#100) 9.5 9.7 8
0.075 mm (#200) 6.0 6.6 5.6
AC (%) 5.66 5.11 5.2
Gmm 2.606 2.597 --
Gmb 2.517 2.509 --
Air voids (%) 3.4 3.4 3.7
Pba (%) 1.15 0.63 --
Table 1.72. Gradation, asphalt content, and volumetrics for plant-produced mix from Walla Walla, Washington.
Figure 1.42. Locations of test sections in Walla Walla, Washington.
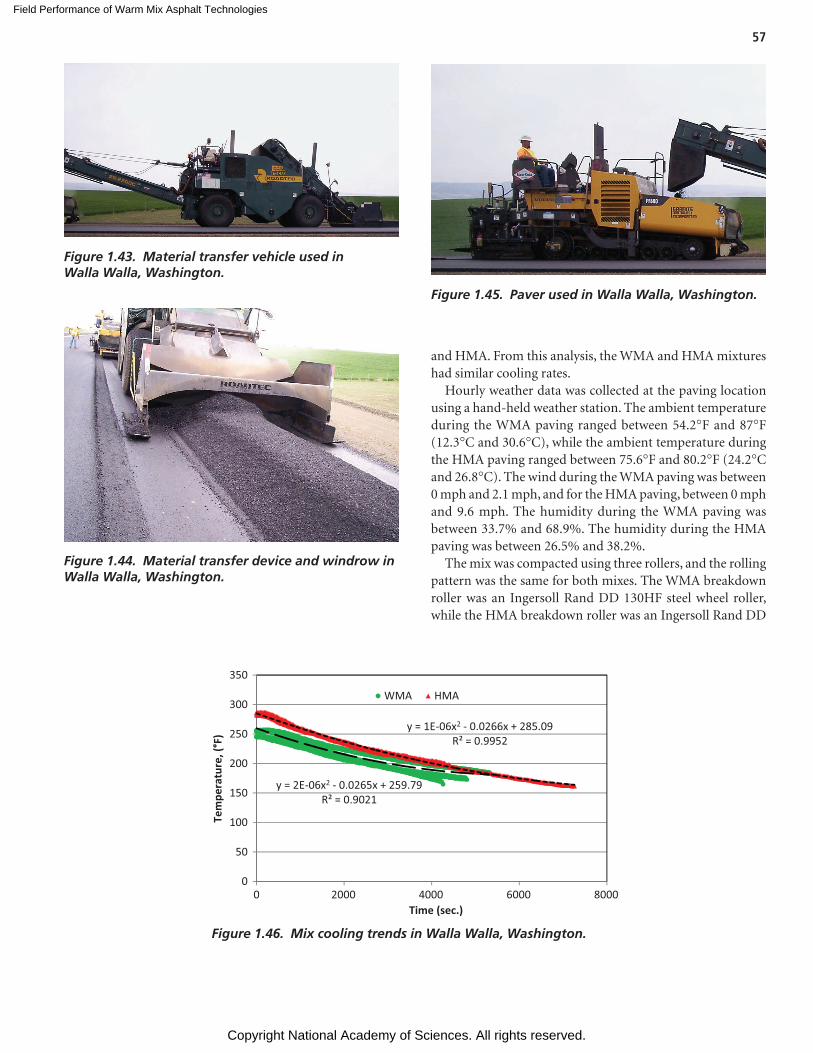
Field Performance of Warm Mix Asphalt Technologies
Copyright National Academy of Sciences. All rights reserved.
57
and HMA. From this analysis, the WMA and HMA mixtures had similar cooling rates.
Hourly weather data was collected at the paving location using a hand-held weather station. The ambient temperature during the WMA paving ranged between 54.2°F and 87°F (12.3°C and 30.6°C), while the ambient temperature during the HMA paving ranged between 75.6°F and 80.2°F (24.2°C and 26.8°C). The wind during the WMA paving was between 0 mph and 2.1 mph, and for the HMA paving, between 0 mph and 9.6 mph. The humidity during the WMA paving was between 33.7% and 68.9%. The humidity during the HMA paving was between 26.5% and 38.2%.
The mix was compacted using three rollers, and the rolling pattern was the same for both mixes. The WMA breakdown roller was an Ingersoll Rand DD 130HF steel wheel roller, while the HMA breakdown roller was an Ingersoll Rand DD
Figure 1.43. Material transfer vehicle used in Walla Walla, Washington.
Figure 1.44. Material transfer device and windrow in Walla Walla, Washington.
Figure 1.45. Paver used in Walla Walla, Washington.
y = 2E 06x2 0.0265x + 259.79R² = 0.9021
y = 1E 06x2 0.0266x + 285.09R² = 0.9952
0
50
100
150
200
250
300
350
0 2000 4000 6000 8000
Tem
pera
ture
, (°F
)
Time (sec.)
WMA HMA
Figure 1.46. Mix cooling trends in Walla Walla, Washington.
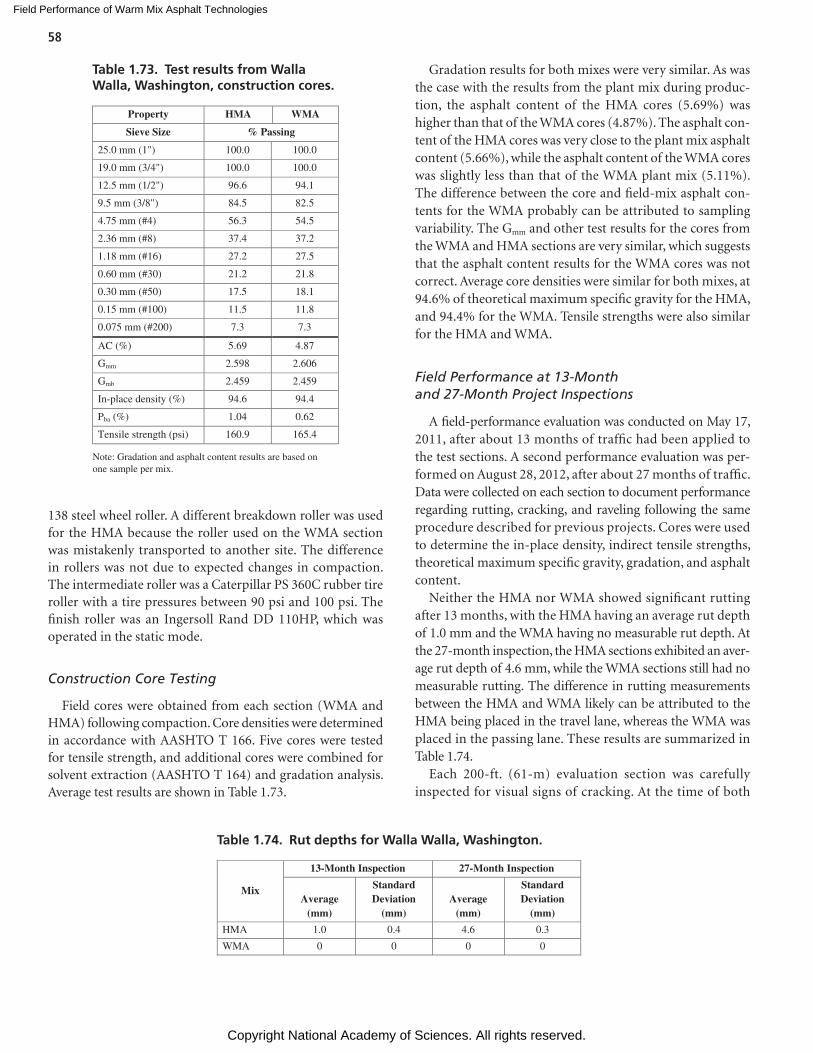
Field Performance of Warm Mix Asphalt Technologies
Copyright National Academy of Sciences. All rights reserved.
58
138 steel wheel roller. A different breakdown roller was used for the HMA because the roller used on the WMA section was mistakenly transported to another site. The difference in rollers was not due to expected changes in compaction. The intermediate roller was a Caterpillar PS 360C rubber tire roller with a tire pressures between 90 psi and 100 psi. The finish roller was an Ingersoll Rand DD 110HP, which was operated in the static mode.
Construction Core Testing
Field cores were obtained from each section (WMA and HMA) following compaction. Core densities were determined in accordance with AASHTO T 166. Five cores were tested for tensile strength, and additional cores were combined for solvent extraction (AASHTO T 164) and gradation analysis. Average test results are shown in Table 1.73.
Gradation results for both mixes were very similar. As was the case with the results from the plant mix during produc-tion, the asphalt content of the HMA cores (5.69%) was higher than that of the WMA cores (4.87%). The asphalt con-tent of the HMA cores was very close to the plant mix asphalt content (5.66%), while the asphalt content of the WMA cores was slightly less than that of the WMA plant mix (5.11%). The difference between the core and field-mix asphalt con-tents for the WMA probably can be attributed to sampling variability. The Gmm and other test results for the cores from the WMA and HMA sections are very similar, which suggests that the asphalt content results for the WMA cores was not correct. Average core densities were similar for both mixes, at 94.6% of theoretical maximum specific gravity for the HMA, and 94.4% for the WMA. Tensile strengths were also similar for the HMA and WMA.
Field Performance at 13-Month and 27-Month Project Inspections
A field-performance evaluation was conducted on May 17, 2011, after about 13 months of traffic had been applied to the test sections. A second performance evaluation was per-formed on August 28, 2012, after about 27 months of traffic. Data were collected on each section to document performance regarding rutting, cracking, and raveling following the same procedure described for previous projects. Cores were used to determine the in-place density, indirect tensile strengths, theoretical maximum specific gravity, gradation, and asphalt content.
Neither the HMA nor WMA showed significant rutting after 13 months, with the HMA having an average rut depth of 1.0 mm and the WMA having no measurable rut depth. At the 27-month inspection, the HMA sections exhibited an aver-age rut depth of 4.6 mm, while the WMA sections still had no measurable rutting. The difference in rutting measurements between the HMA and WMA likely can be attributed to the HMA being placed in the travel lane, whereas the WMA was placed in the passing lane. These results are summarized in Table 1.74.
Each 200-ft. (61-m) evaluation section was carefully inspected for visual signs of cracking. At the time of both
Property HMA WMA
Sieve Size % Passing
25.0 mm (1") 100.0 100.0
19.0 mm (3/4") 100.0 100.0
12.5 mm (1/2") 96.6 94.1
9.5 mm (3/8") 84.5 82.5
4.75 mm (#4) 56.3 54.5
2.36 mm (#8) 37.4 37.2
1.18 mm (#16) 27.2 27.5
0.60 mm (#30) 21.2 21.8
0.30 mm (#50) 17.5 18.1
0.15 mm (#100) 11.5 11.8
0.075 mm (#200) 7.3 7.3
AC (%) 5.69 4.87
Gmm 2.598 2.606
Gmb 2.459 2.459
In-place density (%) 94.6 94.4
Pba (%) 1.04 0.62
Tensile strength (psi) 160.9 165.4
Note: Gradation and asphalt content results are based onone sample per mix.
Table 1.73. Test results from Walla Walla, Washington, construction cores.
Mix
13-Month Inspection 27-Month Inspection
Average (mm)
StandardDeviation
(mm)Average
(mm)
StandardDeviation
(mm)
HMA 1.0 0.4 4.6 0.3
WMA 0 0 0 0
Table 1.74. Rut depths for Walla Walla, Washington.
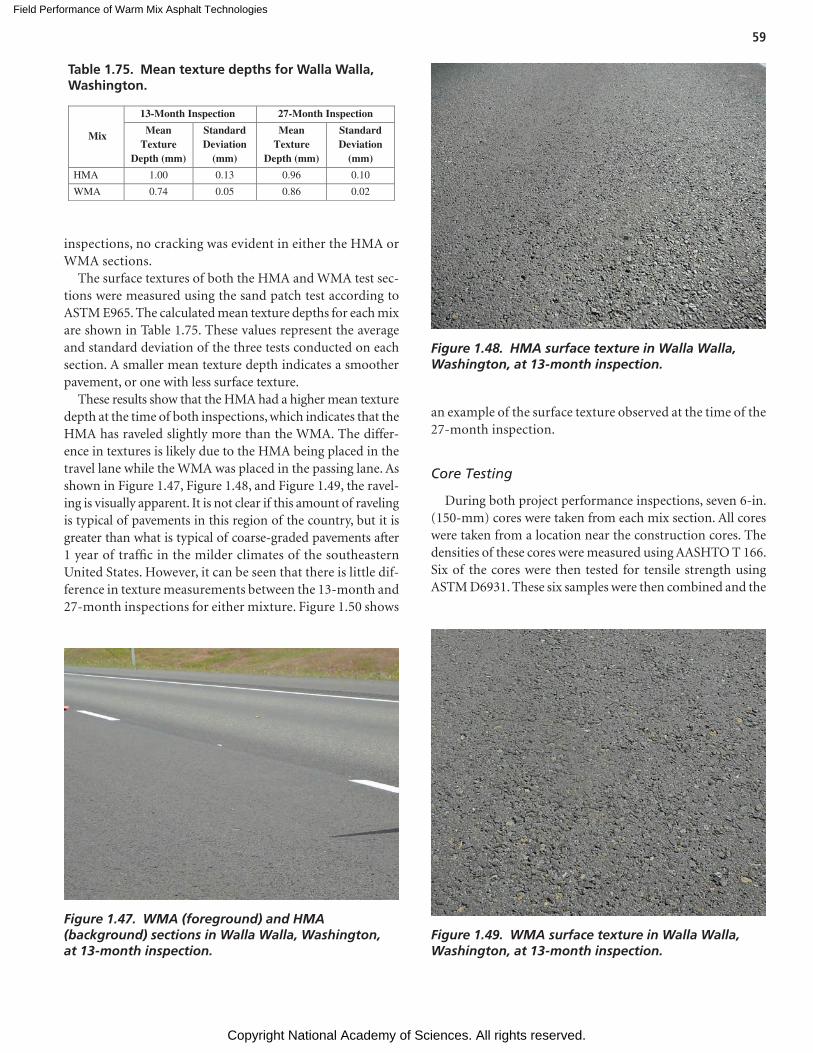
Field Performance of Warm Mix Asphalt Technologies
Copyright National Academy of Sciences. All rights reserved.
59
inspections, no cracking was evident in either the HMA or WMA sections.
The surface textures of both the HMA and WMA test sec-tions were measured using the sand patch test according to ASTM E965. The calculated mean texture depths for each mix are shown in Table 1.75. These values represent the average and standard deviation of the three tests conducted on each section. A smaller mean texture depth indicates a smoother pavement, or one with less surface texture.
These results show that the HMA had a higher mean texture depth at the time of both inspections, which indicates that the HMA has raveled slightly more than the WMA. The differ-ence in textures is likely due to the HMA being placed in the travel lane while the WMA was placed in the passing lane. As shown in Figure 1.47, Figure 1.48, and Figure 1.49, the ravel-ing is visually apparent. It is not clear if this amount of raveling is typical of pavements in this region of the country, but it is greater than what is typical of coarse-graded pavements after 1 year of traffic in the milder climates of the southeastern United States. However, it can be seen that there is little dif-ference in texture measurements between the 13-month and 27-month inspections for either mixture. Figure 1.50 shows
Mix
13-Month Inspection 27-Month Inspection
MeanTexture
Depth (mm)
Standard Deviation
(mm)
MeanTexture
Depth (mm)
Standard Deviation
(mm)
HMA 1.00 0.13 0.96 0.10
WMA 0.74 0.05 0.86 0.02
Table 1.75. Mean texture depths for Walla Walla, Washington.
Figure 1.47. WMA (foreground) and HMA (background) sections in Walla Walla, Washington, at 13-month inspection.
Figure 1.48. HMA surface texture in Walla Walla, Washington, at 13-month inspection.
Figure 1.49. WMA surface texture in Walla Walla, Washington, at 13-month inspection.
an example of the surface texture observed at the time of the 27-month inspection.
Core Testing
During both project performance inspections, seven 6-in. (150-mm) cores were taken from each mix section. All cores were taken from a location near the construction cores. The densities of these cores were measured using AASHTO T 166. Six of the cores were then tested for tensile strength using ASTM D6931. These six samples were then combined and the
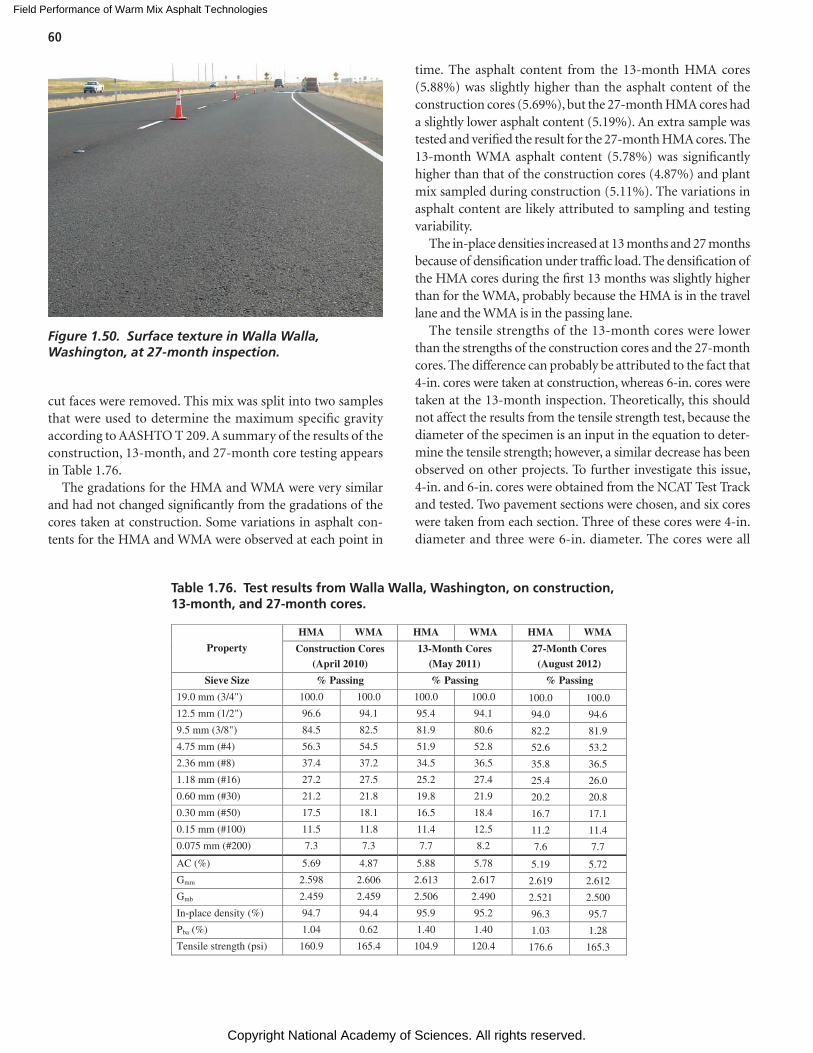
Field Performance of Warm Mix Asphalt Technologies
Copyright National Academy of Sciences. All rights reserved.
60
cut faces were removed. This mix was split into two samples that were used to determine the maximum specific gravity according to AASHTO T 209. A summary of the results of the construction, 13-month, and 27-month core testing appears in Table 1.76.
The gradations for the HMA and WMA were very similar and had not changed significantly from the gradations of the cores taken at construction. Some variations in asphalt con-tents for the HMA and WMA were observed at each point in
time. The asphalt content from the 13-month HMA cores (5.88%) was slightly higher than the asphalt content of the construction cores (5.69%), but the 27-month HMA cores had a slightly lower asphalt content (5.19%). An extra sample was tested and verified the result for the 27-month HMA cores. The 13-month WMA asphalt content (5.78%) was significantly higher than that of the construction cores (4.87%) and plant mix sampled during construction (5.11%). The variations in asphalt content are likely attributed to sampling and testing variability.
The in-place densities increased at 13 months and 27 months because of densification under traffic load. The densification of the HMA cores during the first 13 months was slightly higher than for the WMA, probably because the HMA is in the travel lane and the WMA is in the passing lane.
The tensile strengths of the 13-month cores were lower than the strengths of the construction cores and the 27-month cores. The difference can probably be attributed to the fact that 4-in. cores were taken at construction, whereas 6-in. cores were taken at the 13-month inspection. Theoretically, this should not affect the results from the tensile strength test, because the diameter of the specimen is an input in the equation to deter-mine the tensile strength; however, a similar decrease has been observed on other projects. To further investigate this issue, 4-in. and 6-in. cores were obtained from the NCAT Test Track and tested. Two pavement sections were chosen, and six cores were taken from each section. Three of these cores were 4-in. diameter and three were 6-in. diameter. The cores were all
Figure 1.50. Surface texture in Walla Walla, Washington, at 27-month inspection.
Property
HMA WMA HMA WMA HMA WMA
Construction Cores (April 2010)
13-Month Cores(May 2011)
27-Month Cores(August 2012)
Sieve Size % Passing % Passing % Passing
19.0 mm (3/4") 100.0 100.0 100.0 100.0 100.0 100.0
12.5 mm (1/2") 96.6 94.1 95.4 94.1 94.0 94.6
9.5 mm (3/8") 84.5 82.5 81.9 80.6 82.2 81.9
4.75 mm (#4) 56.3 54.5 51.9 52.8 52.6 53.2
2.36 mm (#8) 37.4 37.2 34.5 36.5 35.8 36.5
1.18 mm (#16) 27.2 27.5 25.2 27.4 25.4 26.0
0.60 mm (#30) 21.2 21.8 19.8 21.9 20.2 20.8
0.30 mm (#50) 17.5 18.1 16.5 18.4 16.7 17.1
0.15 mm (#100) 11.5 11.8 11.4 12.5 11.2 11.4
0.075 mm (#200) 7.3 7.3 7.7 8.2 7.6 7.7
AC (%) 5.69 4.87 5.88 5.78 5.19 5.72
Gmm 2.598 2.606 2.613 2.617 2.619 2.612
Gmb 2.459 2.459 2.506 2.490 2.521 2.500
In-place density (%) 94.7 94.4 95.9 95.2 96.3 95.7
Pba (%) 1.04 0.62 1.40 1.40 1.03 1.28
Tensile strength (psi) 160.9 165.4 104.9 120.4 176.6 165.3
Table 1.76. Test results from Walla Walla, Washington, on construction, 13-month, and 27-month cores.
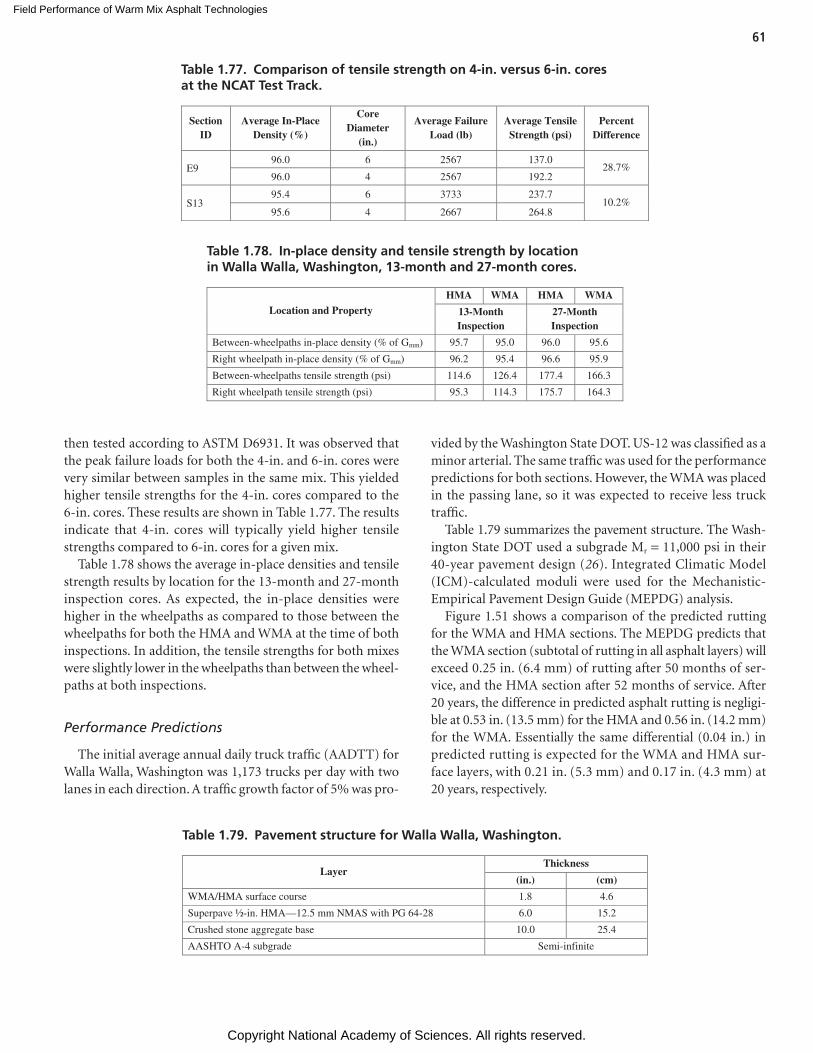
Field Performance of Warm Mix Asphalt Technologies
Copyright National Academy of Sciences. All rights reserved.
61
then tested according to ASTM D6931. It was observed that the peak failure loads for both the 4-in. and 6-in. cores were very similar between samples in the same mix. This yielded higher tensile strengths for the 4-in. cores compared to the 6-in. cores. These results are shown in Table 1.77. The results indicate that 4-in. cores will typically yield higher tensile strengths compared to 6-in. cores for a given mix.
Table 1.78 shows the average in-place densities and tensile strength results by location for the 13-month and 27-month inspection cores. As expected, the in-place densities were higher in the wheelpaths as compared to those between the wheelpaths for both the HMA and WMA at the time of both inspections. In addition, the tensile strengths for both mixes were slightly lower in the wheelpaths than between the wheel-paths at both inspections.
Performance Predictions
The initial average annual daily truck traffic (AADTT) for Walla Walla, Washington was 1,173 trucks per day with two lanes in each direction. A traffic growth factor of 5% was pro-
vided by the Washington State DOT. US-12 was classified as a minor arterial. The same traffic was used for the performance predictions for both sections. However, the WMA was placed in the passing lane, so it was expected to receive less truck traffic.
Table 1.79 summarizes the pavement structure. The Wash-ington State DOT used a subgrade Mr = 11,000 psi in their 40-year pavement design (26). Integrated Climatic Model (ICM)-calculated moduli were used for the Mechanistic-Empirical Pavement Design Guide (MEPDG) analysis.
Figure 1.51 shows a comparison of the predicted rutting for the WMA and HMA sections. The MEPDG predicts that the WMA section (subtotal of rutting in all asphalt layers) will exceed 0.25 in. (6.4 mm) of rutting after 50 months of ser-vice, and the HMA section after 52 months of service. After 20 years, the difference in predicted asphalt rutting is negligi-ble at 0.53 in. (13.5 mm) for the HMA and 0.56 in. (14.2 mm) for the WMA. Essentially the same differential (0.04 in.) in predicted rutting is expected for the WMA and HMA sur-face layers, with 0.21 in. (5.3 mm) and 0.17 in. (4.3 mm) at 20 years, respectively.
SectionID
Average In-Place Density (%)
Core Diameter
(in.)
Average Failure Load (lb)
Average Tensile Strength (psi)
Percent Difference
E996.0 6 2567 137.0
28.7% 96.0 4 2567 192.2
S13 95.4 6 3733 237.7
10.2% 95.6 4 2667 264.8
Table 1.77. Comparison of tensile strength on 4-in. versus 6-in. cores at the NCAT Test Track.
Location and PropertyHMA WMA HMA WMA
13-MonthInspection
27-MonthInspection
Between-wheelpaths in-place density (% of Gmm) 95.7 95.0 96.0 95.6
Right wheelpath in-place density (% of Gmm) 96.2 95.4 96.6 95.9
Between-wheelpaths tensile strength (psi) 114.6 126.4 177.4 166.3
Right wheelpath tensile strength (psi) 95.3 114.3 175.7 164.3
Table 1.78. In-place density and tensile strength by location in Walla Walla, Washington, 13-month and 27-month cores.
Layer Thickness
(in.) (cm)
WMA/HMA surface course 1.8 4.6
Superpave ½-in. HMA—12.5 mm NMAS with PG 64-28 6.0 15.2
Crushed stone aggregate base 10.0 25.4
AASHTO A-4 subgrade Semi-infinite
Table 1.79. Pavement structure for Walla Walla, Washington.
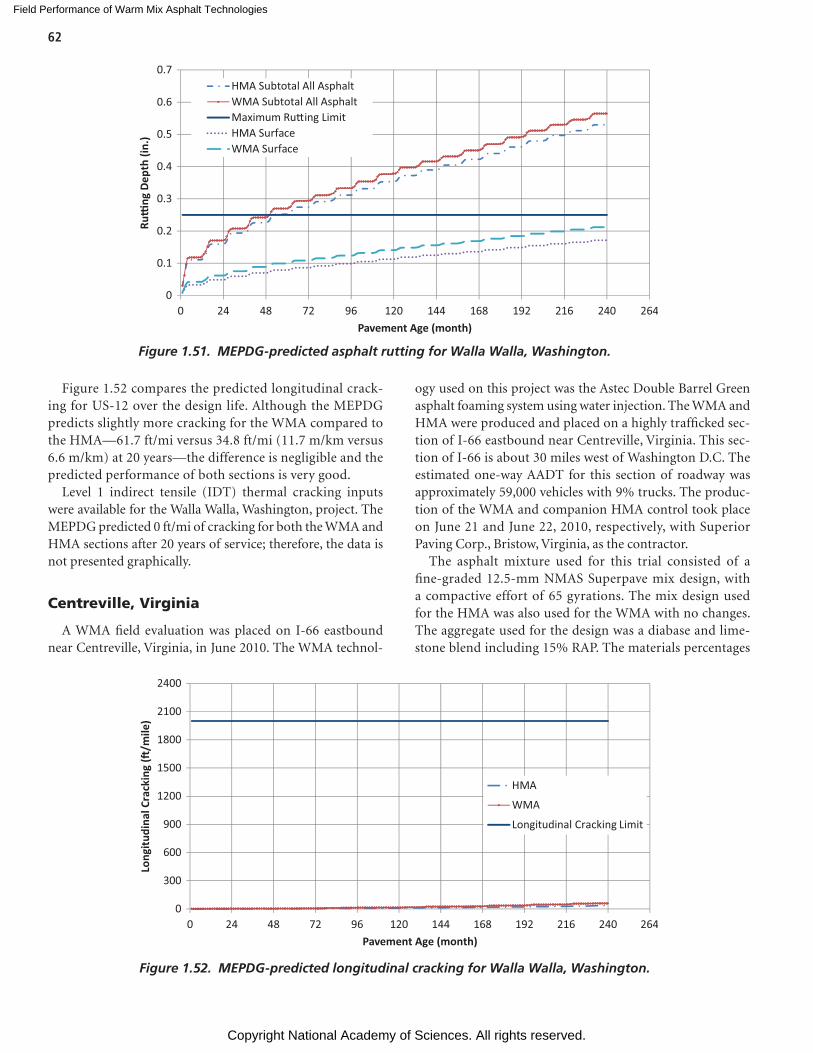
Field Performance of Warm Mix Asphalt Technologies
Copyright National Academy of Sciences. All rights reserved.
62
Figure 1.52 compares the predicted longitudinal crack-ing for US-12 over the design life. Although the MEPDG predicts slightly more cracking for the WMA compared to the HMA—61.7 ft/mi versus 34.8 ft/mi (11.7 m/km versus 6.6 m/km) at 20 years—the difference is negligible and the predicted performance of both sections is very good.
Level 1 indirect tensile (IDT) thermal cracking inputs were available for the Walla Walla, Washington, project. The MEPDG predicted 0 ft/mi of cracking for both the WMA and HMA sections after 20 years of service; therefore, the data is not presented graphically.
Centreville, Virginia
A WMA field evaluation was placed on I-66 eastbound near Centreville, Virginia, in June 2010. The WMA technol-
ogy used on this project was the Astec Double Barrel Green asphalt foaming system using water injection. The WMA and HMA were produced and placed on a highly trafficked sec-tion of I-66 eastbound near Centreville, Virginia. This sec-tion of I-66 is about 30 miles west of Washington D.C. The estimated one-way AADT for this section of roadway was approximately 59,000 vehicles with 9% trucks. The produc-tion of the WMA and companion HMA control took place on June 21 and June 22, 2010, respectively, with Superior Paving Corp., Bristow, Virginia, as the contractor.
The asphalt mixture used for this trial consisted of a fine-graded 12.5-mm NMAS Superpave mix design, with a compactive effort of 65 gyrations. The mix design used for the HMA was also used for the WMA with no changes. The aggregate used for the design was a diabase and lime-stone blend including 15% RAP. The materials percentages
0
0.1
0.2
0.3
0.4
0.5
0.6
0.7
0 24 48 72 96 120 144 168 192 216 240 264
Ru�
ng D
epth
(in.
)
Pavement Age (month)
HMA Subtotal All AsphaltWMA Subtotal All AsphaltMaximum Ru�ing LimitHMA SurfaceWMA Surface
Figure 1.51. MEPDG-predicted asphalt rutting for Walla Walla, Washington.
0
300
600
900
1200
1500
1800
2100
2400
0 24 48 72 96 120 144 168 192 216 240 264
Long
itudi
nal C
rack
ing
(�/m
ile)
Pavement Age (month)
HMA
WMA
Longitudinal Cracking Limit
Figure 1.52. MEPDG-predicted longitudinal cracking for Walla Walla, Washington.
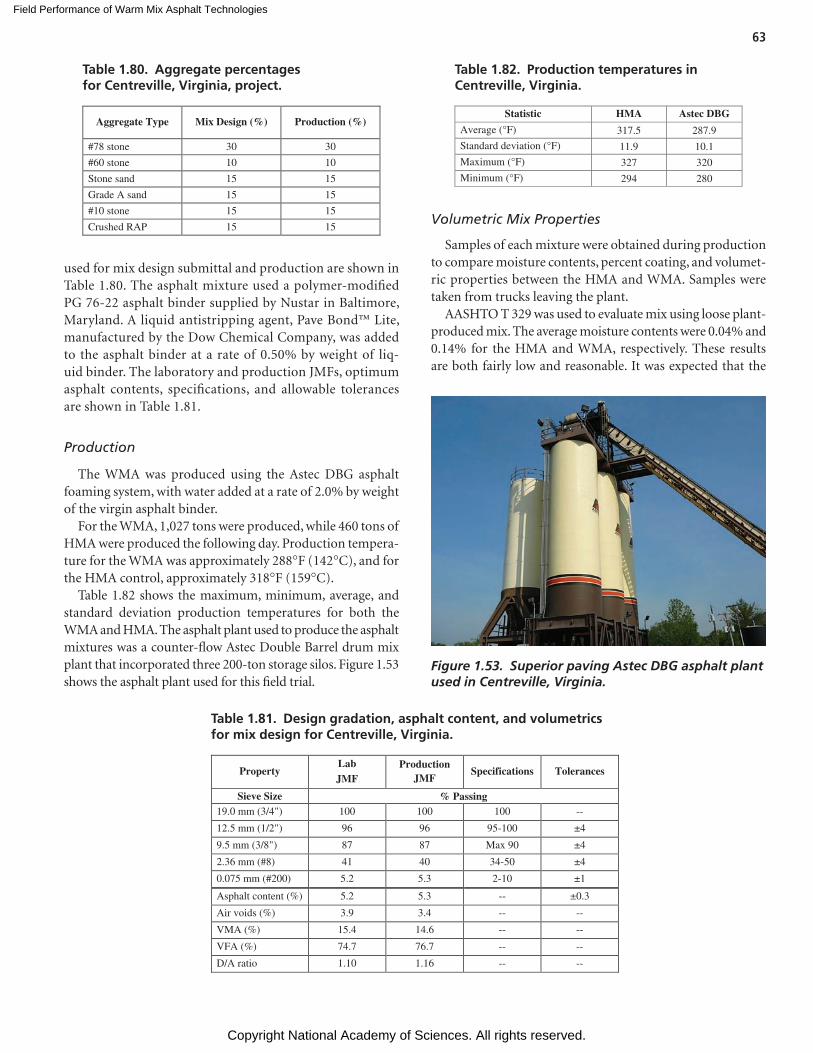
Field Performance of Warm Mix Asphalt Technologies
Copyright National Academy of Sciences. All rights reserved.
63
used for mix design submittal and production are shown in Table 1.80. The asphalt mixture used a polymer-modified PG 76-22 asphalt binder supplied by Nustar in Baltimore, Maryland. A liquid antistripping agent, Pave Bond™ Lite, manufactured by the Dow Chemical Company, was added to the asphalt binder at a rate of 0.50% by weight of liq-uid binder. The laboratory and production JMFs, optimum asphalt contents, specifications, and allowable tolerances are shown in Table 1.81.
Production
The WMA was produced using the Astec DBG asphalt foaming system, with water added at a rate of 2.0% by weight of the virgin asphalt binder.
For the WMA, 1,027 tons were produced, while 460 tons of HMA were produced the following day. Production tempera-ture for the WMA was approximately 288°F (142°C), and for the HMA control, approximately 318°F (159°C).
Table 1.82 shows the maximum, minimum, average, and standard deviation production temperatures for both the WMA and HMA. The asphalt plant used to produce the asphalt mixtures was a counter-flow Astec Double Barrel drum mix plant that incorporated three 200-ton storage silos. Figure 1.53 shows the asphalt plant used for this field trial.
Volumetric Mix Properties
Samples of each mixture were obtained during production to compare moisture contents, percent coating, and volumet-ric properties between the HMA and WMA. Samples were taken from trucks leaving the plant.
AASHTO T 329 was used to evaluate mix using loose plant-produced mix. The average moisture contents were 0.04% and 0.14% for the HMA and WMA, respectively. These results are both fairly low and reasonable. It was expected that the
Aggregate Type Mix Design (%) Production (%)
#78 stone 30 30
#60 stone 10 10
Stone sand 15 15
Grade A sand 15 15
#10 stone 15 15
Crushed RAP 15 15
Table 1.80. Aggregate percentages for Centreville, Virginia, project.
PropertyLab JMF
Production JMF
Specifications Tolerances
Sieve Size % Passing19.0 mm (3/4") 100 100 100 --
12.5 mm (1/2") 96 96 95-100 ±4
9.5 mm (3/8") 87 87 Max 90 ±4
2.36 mm (#8) 41 40 34-50 ±4
0.075 mm (#200) 5.2 5.3 2-10 ±1
Asphalt content (%) 5.2 5.3 -- ±0.3
Air voids (%) 3.9 3.4 -- --
VMA (%) 15.4 14.6 -- --
VFA (%) 74.7 76.7 -- --
D/A ratio 1.10 1.16 -- --
Table 1.81. Design gradation, asphalt content, and volumetrics for mix design for Centreville, Virginia.
Statistic HMA Astec DBG
Average (°F) 317.5 287.9
Standard deviation (°F) 11.9 10.1
Maximum (°F) 327 320
Minimum (°F) 294 280
Table 1.82. Production temperatures in Centreville, Virginia.
Figure 1.53. Superior paving Astec DBG asphalt plant used in Centreville, Virginia.
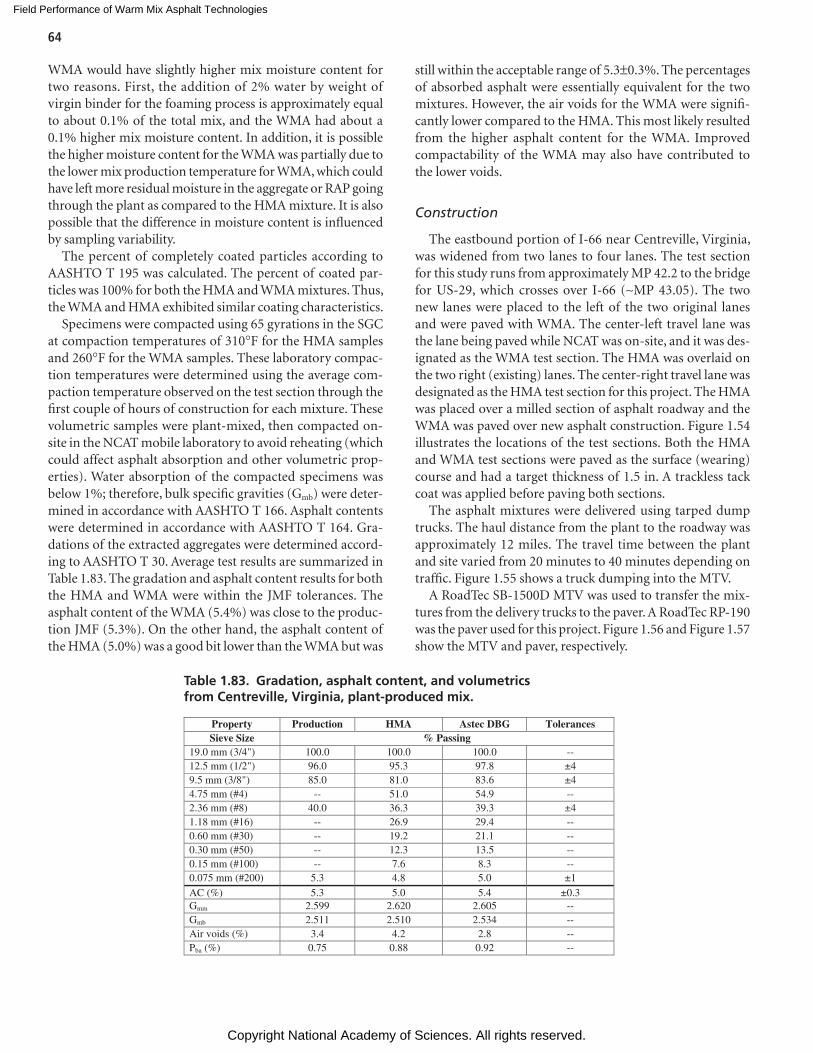
Field Performance of Warm Mix Asphalt Technologies
Copyright National Academy of Sciences. All rights reserved.
64
WMA would have slightly higher mix moisture content for two reasons. First, the addition of 2% water by weight of virgin binder for the foaming process is approximately equal to about 0.1% of the total mix, and the WMA had about a 0.1% higher mix moisture content. In addition, it is possible the higher moisture content for the WMA was partially due to the lower mix production temperature for WMA, which could have left more residual moisture in the aggregate or RAP going through the plant as compared to the HMA mixture. It is also possible that the difference in moisture content is influenced by sampling variability.
The percent of completely coated particles according to AASHTO T 195 was calculated. The percent of coated par-ticles was 100% for both the HMA and WMA mixtures. Thus, the WMA and HMA exhibited similar coating characteristics.
Specimens were compacted using 65 gyrations in the SGC at compaction temperatures of 310°F for the HMA samples and 260°F for the WMA samples. These laboratory compac-tion temperatures were determined using the average com-paction temperature observed on the test section through the first couple of hours of construction for each mixture. These volumetric samples were plant-mixed, then compacted on-site in the NCAT mobile laboratory to avoid reheating (which could affect asphalt absorption and other volumetric prop-erties). Water absorption of the compacted specimens was below 1%; therefore, bulk specific gravities (Gmb) were deter-mined in accordance with AASHTO T 166. Asphalt contents were determined in accordance with AASHTO T 164. Gra-dations of the extracted aggregates were determined accord-ing to AASHTO T 30. Average test results are summarized in Table 1.83. The gradation and asphalt content results for both the HMA and WMA were within the JMF tolerances. The asphalt content of the WMA (5.4%) was close to the produc-tion JMF (5.3%). On the other hand, the asphalt content of the HMA (5.0%) was a good bit lower than the WMA but was
still within the acceptable range of 5.3±0.3%. The percentages of absorbed asphalt were essentially equivalent for the two mixtures. However, the air voids for the WMA were signifi-cantly lower compared to the HMA. This most likely resulted from the higher asphalt content for the WMA. Improved compactability of the WMA may also have contributed to the lower voids.
Construction
The eastbound portion of I-66 near Centreville, Virginia, was widened from two lanes to four lanes. The test section for this study runs from approximately MP 42.2 to the bridge for US-29, which crosses over I-66 (~MP 43.05). The two new lanes were placed to the left of the two original lanes and were paved with WMA. The center-left travel lane was the lane being paved while NCAT was on-site, and it was des-ignated as the WMA test section. The HMA was overlaid on the two right (existing) lanes. The center-right travel lane was designated as the HMA test section for this project. The HMA was placed over a milled section of asphalt roadway and the WMA was paved over new asphalt construction. Figure 1.54 illustrates the locations of the test sections. Both the HMA and WMA test sections were paved as the surface (wearing) course and had a target thickness of 1.5 in. A trackless tack coat was applied before paving both sections.
The asphalt mixtures were delivered using tarped dump trucks. The haul distance from the plant to the roadway was approximately 12 miles. The travel time between the plant and site varied from 20 minutes to 40 minutes depending on traffic. Figure 1.55 shows a truck dumping into the MTV.
A RoadTec SB-1500D MTV was used to transfer the mix-tures from the delivery trucks to the paver. A RoadTec RP-190 was the paver used for this project. Figure 1.56 and Figure 1.57 show the MTV and paver, respectively.
Property Production HMA Astec DBG TolerancesSieve Size % Passing
19.0 mm (3/4") 100.0 100.0 100.0 -- 12.5 mm (1/2") 96.0 95.3 97.8 ±49.5 mm (3/8") 85.0 81.0 83.6 ±44.75 mm (#4) -- 51.0 54.9 -- 2.36 mm (#8) 40.0 36.3 39.3 ±41.18 mm (#16) -- 26.9 29.4 -- 0.60 mm (#30) -- 19.2 21.1 -- 0.30 mm (#50) -- 12.3 13.5 -- 0.15 mm (#100) -- 7.6 8.3 -- 0.075 mm (#200) 5.3 4.8 5.0 ±1
AC (%) 5.3 5.0 5.4 ±0.3Gmm 2.599 2.620 2.605 -- Gmb 2.511 2.510 2.534 -- Air voids (%) 3.4 4.2 2.8 -- Pba (%) 0.75 0.88 0.92 --
Table 1.83. Gradation, asphalt content, and volumetrics from Centreville, Virginia, plant-produced mix.
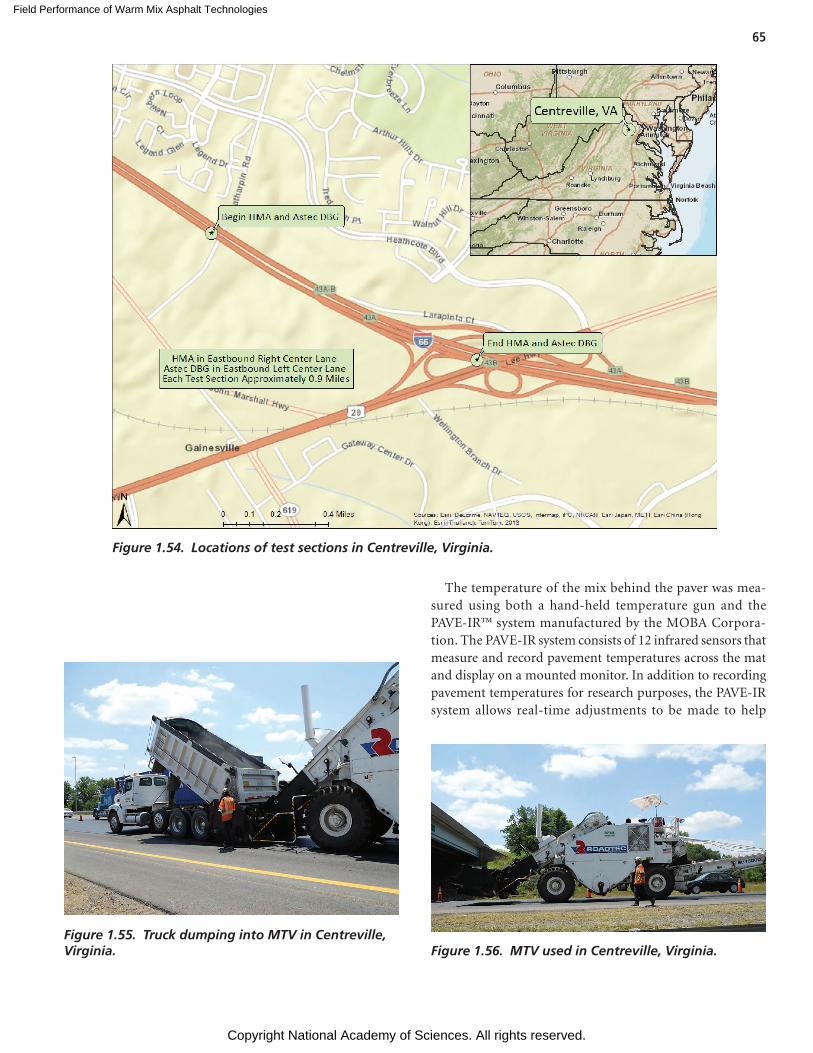
Field Performance of Warm Mix Asphalt Technologies
Copyright National Academy of Sciences. All rights reserved.
65
The temperature of the mix behind the paver was mea-sured using both a hand-held temperature gun and the PAVE-IR™ system manufactured by the MOBA Corpora-tion. The PAVE-IR system consists of 12 infrared sensors that measure and record pavement temperatures across the mat and display on a mounted monitor. In addition to recording pavement temperatures for research purposes, the PAVE-IR system allows real-time adjustments to be made to help
Figure 1.54. Locations of test sections in Centreville, Virginia.
Figure 1.55. Truck dumping into MTV in Centreville, Virginia. Figure 1.56. MTV used in Centreville, Virginia.
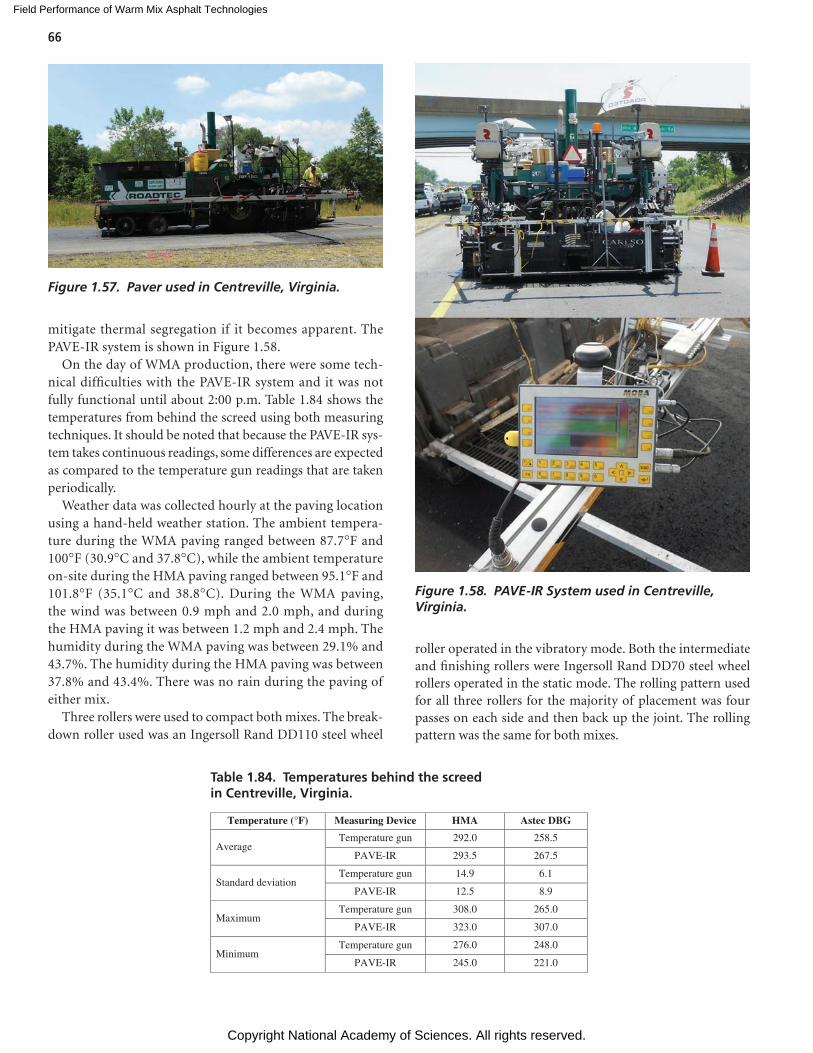
Field Performance of Warm Mix Asphalt Technologies
Copyright National Academy of Sciences. All rights reserved.
66
mitigate thermal segregation if it becomes apparent. The PAVE-IR system is shown in Figure 1.58.
On the day of WMA production, there were some tech-nical difficulties with the PAVE-IR system and it was not fully functional until about 2:00 p.m. Table 1.84 shows the temperatures from behind the screed using both measuring techniques. It should be noted that because the PAVE-IR sys-tem takes continuous readings, some differences are expected as compared to the temperature gun readings that are taken periodically.
Weather data was collected hourly at the paving location using a hand-held weather station. The ambient tempera-ture during the WMA paving ranged between 87.7°F and 100°F (30.9°C and 37.8°C), while the ambient temperature on-site during the HMA paving ranged between 95.1°F and 101.8°F (35.1°C and 38.8°C). During the WMA paving, the wind was between 0.9 mph and 2.0 mph, and during the HMA paving it was between 1.2 mph and 2.4 mph. The humidity during the WMA paving was between 29.1% and 43.7%. The humidity during the HMA paving was between 37.8% and 43.4%. There was no rain during the paving of either mix.
Three rollers were used to compact both mixes. The break-down roller used was an Ingersoll Rand DD110 steel wheel
roller operated in the vibratory mode. Both the intermediate and finishing rollers were Ingersoll Rand DD70 steel wheel rollers operated in the static mode. The rolling pattern used for all three rollers for the majority of placement was four passes on each side and then back up the joint. The rolling pattern was the same for both mixes.
Figure 1.57. Paver used in Centreville, Virginia.
Figure 1.58. PAVE-IR System used in Centreville, Virginia.
Temperature (°F) Measuring Device HMA Astec DBG
AverageTemperature gun 292.0 258.5
PAVE-IR 293.5 267.5
Standard deviationTemperature gun 14.9 6.1
PAVE-IR 12.5 8.9
MaximumTemperature gun 308.0 265.0
PAVE-IR 323.0 307.0
MinimumTemperature gun 276.0 248.0
PAVE-IR 245.0 221.0
Table 1.84. Temperatures behind the screed in Centreville, Virginia.
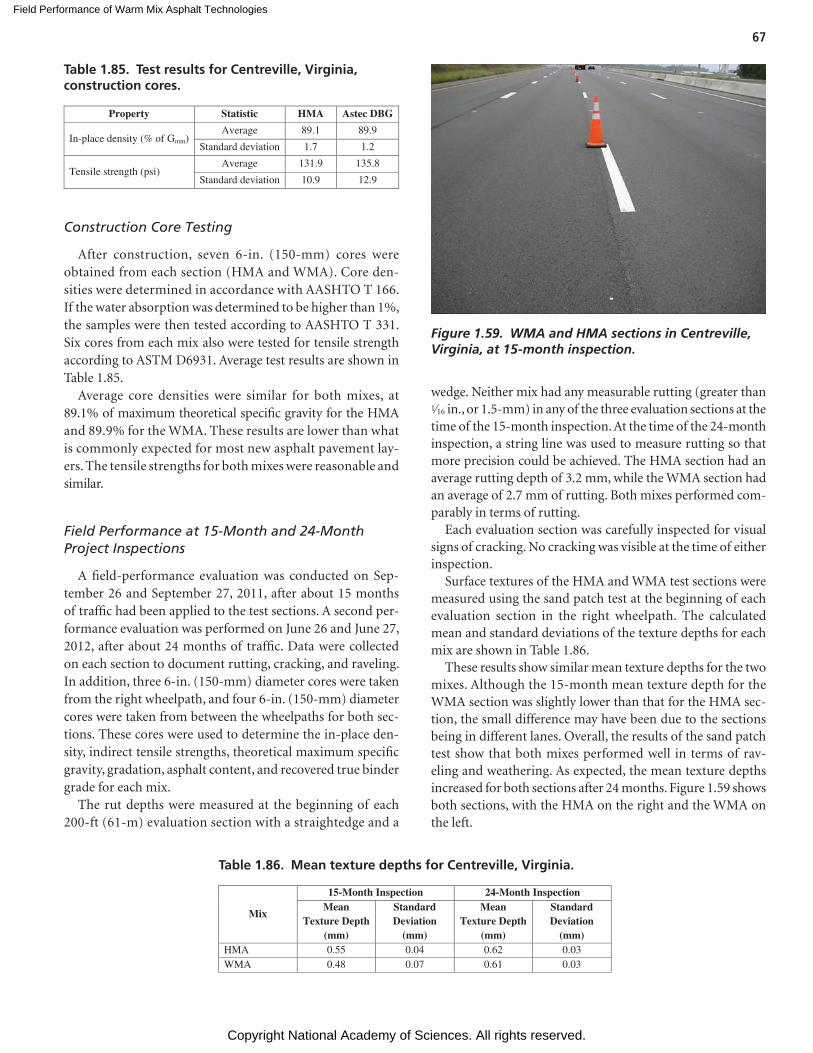
Field Performance of Warm Mix Asphalt Technologies
Copyright National Academy of Sciences. All rights reserved.
67
Construction Core Testing
After construction, seven 6-in. (150-mm) cores were obtained from each section (HMA and WMA). Core den-sities were determined in accordance with AASHTO T 166. If the water absorption was determined to be higher than 1%, the samples were then tested according to AASHTO T 331. Six cores from each mix also were tested for tensile strength according to ASTM D6931. Average test results are shown in Table 1.85.
Average core densities were similar for both mixes, at 89.1% of maximum theoretical specific gravity for the HMA and 89.9% for the WMA. These results are lower than what is commonly expected for most new asphalt pavement lay-ers. The tensile strengths for both mixes were reasonable and similar.
Field Performance at 15-Month and 24-Month Project Inspections
A field-performance evaluation was conducted on Sep-tember 26 and September 27, 2011, after about 15 months of traffic had been applied to the test sections. A second per-formance evaluation was performed on June 26 and June 27, 2012, after about 24 months of traffic. Data were collected on each section to document rutting, cracking, and raveling. In addition, three 6-in. (150-mm) diameter cores were taken from the right wheelpath, and four 6-in. (150-mm) diameter cores were taken from between the wheelpaths for both sec-tions. These cores were used to determine the in-place den-sity, indirect tensile strengths, theoretical maximum specific gravity, gradation, asphalt content, and recovered true binder grade for each mix.
The rut depths were measured at the beginning of each 200-ft (61-m) evaluation section with a straightedge and a
wedge. Neither mix had any measurable rutting (greater than 1⁄16 in., or 1.5-mm) in any of the three evaluation sections at the time of the 15-month inspection. At the time of the 24-month inspection, a string line was used to measure rutting so that more precision could be achieved. The HMA section had an average rutting depth of 3.2 mm, while the WMA section had an average of 2.7 mm of rutting. Both mixes performed com-parably in terms of rutting.
Each evaluation section was carefully inspected for visual signs of cracking. No cracking was visible at the time of either inspection.
Surface textures of the HMA and WMA test sections were measured using the sand patch test at the beginning of each evaluation section in the right wheelpath. The calculated mean and standard deviations of the texture depths for each mix are shown in Table 1.86.
These results show similar mean texture depths for the two mixes. Although the 15-month mean texture depth for the WMA section was slightly lower than that for the HMA sec-tion, the small difference may have been due to the sections being in different lanes. Overall, the results of the sand patch test show that both mixes performed well in terms of rav-eling and weathering. As expected, the mean texture depths increased for both sections after 24 months. Figure 1.59 shows both sections, with the HMA on the right and the WMA on the left.
Property Statistic HMA Astec DBG
In-place density (% of Gmm) Average 89.1 89.9
Standard deviation 1.7 1.2
Tensile strength (psi)Average 131.9 135.8
Standard deviation 10.9 12.9
Table 1.85. Test results for Centreville, Virginia, construction cores.
Mix
15-Month Inspection 24-Month InspectionMean
Texture Depth (mm)
Standard Deviation
(mm)
Mean Texture Depth
(mm)
Standard Deviation
(mm)HMA 0.55 0.04 0.62 0.03WMA 0.48 0.07 0.61 0.03
Table 1.86. Mean texture depths for Centreville, Virginia.
Figure 1.59. WMA and HMA sections in Centreville, Virginia, at 15-month inspection.
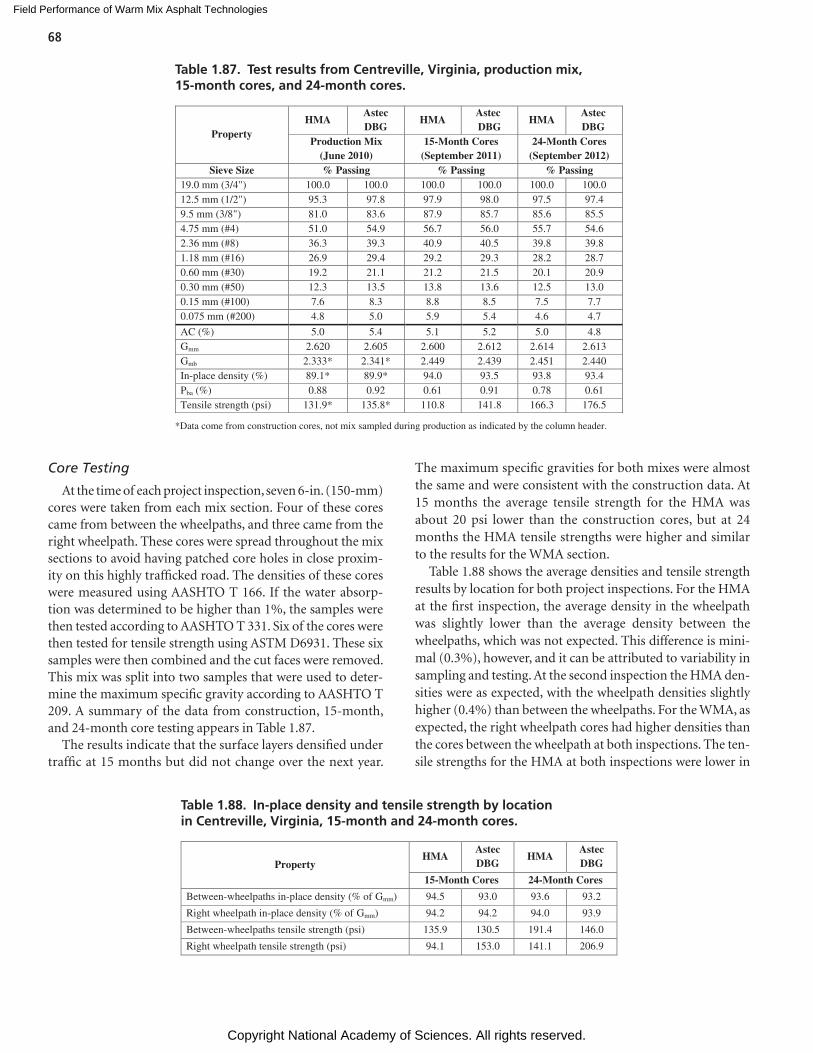
Field Performance of Warm Mix Asphalt Technologies
Copyright National Academy of Sciences. All rights reserved.
68
Core Testing
At the time of each project inspection, seven 6-in. (150-mm) cores were taken from each mix section. Four of these cores came from between the wheelpaths, and three came from the right wheelpath. These cores were spread throughout the mix sections to avoid having patched core holes in close proxim-ity on this highly trafficked road. The densities of these cores were measured using AASHTO T 166. If the water absorp-tion was determined to be higher than 1%, the samples were then tested according to AASHTO T 331. Six of the cores were then tested for tensile strength using ASTM D6931. These six samples were then combined and the cut faces were removed. This mix was split into two samples that were used to deter-mine the maximum specific gravity according to AASHTO T 209. A summary of the data from construction, 15-month, and 24-month core testing appears in Table 1.87.
The results indicate that the surface layers densified under traffic at 15 months but did not change over the next year.
The maximum specific gravities for both mixes were almost the same and were consistent with the construction data. At 15 months the average tensile strength for the HMA was about 20 psi lower than the construction cores, but at 24 months the HMA tensile strengths were higher and similar to the results for the WMA section.
Table 1.88 shows the average densities and tensile strength results by location for both project inspections. For the HMA at the first inspection, the average density in the wheelpath was slightly lower than the average density between the wheelpaths, which was not expected. This difference is mini-mal (0.3%), however, and it can be attributed to variability in sampling and testing. At the second inspection the HMA den-sities were as expected, with the wheelpath densities slightly higher (0.4%) than between the wheelpaths. For the WMA, as expected, the right wheelpath cores had higher densities than the cores between the wheelpath at both inspections. The ten-sile strengths for the HMA at both inspections were lower in
PropertyHMA
Astec DBG
HMAAstec DBG
HMAAstec DBG
Production Mix (June 2010)
15-Month Cores (September 2011)
24-Month Cores (September 2012)
Sieve Size % Passing % Passing % Passing19.0 mm (3/4") 100.0 100.0 100.0 100.0 100.0 100.012.5 mm (1/2") 95.3 97.8 97.9 98.0 97.5 97.49.5 mm (3/8") 81.0 83.6 87.9 85.7 85.6 85.54.75 mm (#4) 51.0 54.9 56.7 56.0 55.7 54.62.36 mm (#8) 36.3 39.3 40.9 40.5 39.8 39.81.18 mm (#16) 26.9 29.4 29.2 29.3 28.2 28.70.60 mm (#30) 19.2 21.1 21.2 21.5 20.1 20.90.30 mm (#50) 12.3 13.5 13.8 13.6 12.5 13.00.15 mm (#100) 7.6 8.3 8.8 8.5 7.5 7.70.075 mm (#200) 4.8 5.0 5.9 5.4 4.6 4.7
AC (%) 5.0 5.4 5.1 5.2 5.0 4.8Gmm 2.620 2.605 2.600 2.612 2.614 2.613Gmb 2.333* 2.341* 2.449 2.439 2.451 2.440In-place density (%) 89.1* 89.9* 94.0 93.5 93.8 93.4Pba (%) 0.88 0.92 0.61 0.91 0.78 0.61Tensile strength (psi) 131.9* 135.8* 110.8 141.8 166.3 176.5
*Data come from construction cores, not mix sampled during production as indicated by the column header.
Table 1.87. Test results from Centreville, Virginia, production mix, 15-month cores, and 24-month cores.
PropertyHMA
Astec DBG
HMAAstec DBG
15-Month Cores 24-Month Cores
Between-wheelpaths in-place density (% of Gmm) 94.5 93.0 93.6 93.2
Right wheelpath in-place density (% of Gmm) 94.2 94.2 94.0 93.9
Between-wheelpaths tensile strength (psi) 135.9 130.5 191.4 146.0
Right wheelpath tensile strength (psi) 94.1 153.0 141.1 206.9
Table 1.88. In-place density and tensile strength by location in Centreville, Virginia, 15-month and 24-month cores.
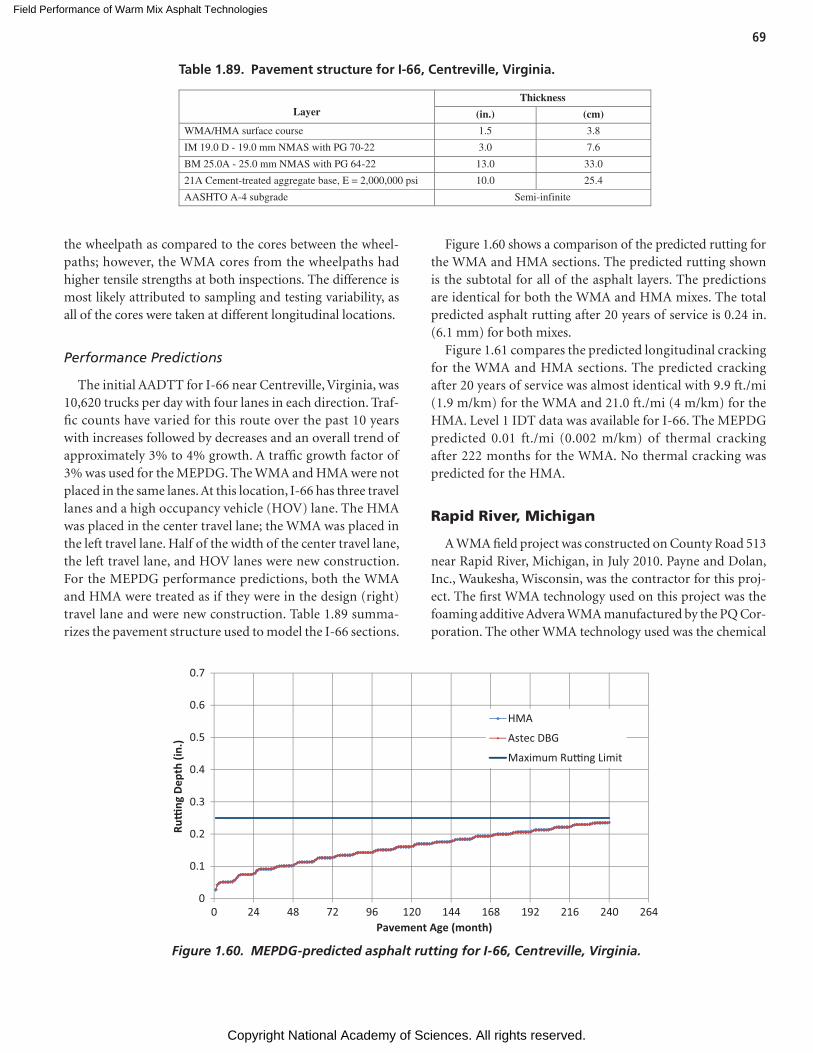
Field Performance of Warm Mix Asphalt Technologies
Copyright National Academy of Sciences. All rights reserved.
69
the wheelpath as compared to the cores between the wheel-paths; however, the WMA cores from the wheelpaths had higher tensile strengths at both inspections. The difference is most likely attributed to sampling and testing variability, as all of the cores were taken at different longitudinal locations.
Performance Predictions
The initial AADTT for I-66 near Centreville, Virginia, was 10,620 trucks per day with four lanes in each direction. Traf-fic counts have varied for this route over the past 10 years with increases followed by decreases and an overall trend of approximately 3% to 4% growth. A traffic growth factor of 3% was used for the MEPDG. The WMA and HMA were not placed in the same lanes. At this location, I-66 has three travel lanes and a high occupancy vehicle (HOV) lane. The HMA was placed in the center travel lane; the WMA was placed in the left travel lane. Half of the width of the center travel lane, the left travel lane, and HOV lanes were new construction. For the MEPDG performance predictions, both the WMA and HMA were treated as if they were in the design (right) travel lane and were new construction. Table 1.89 summa-rizes the pavement structure used to model the I-66 sections.
Figure 1.60 shows a comparison of the predicted rutting for the WMA and HMA sections. The predicted rutting shown is the subtotal for all of the asphalt layers. The predictions are identical for both the WMA and HMA mixes. The total predicted asphalt rutting after 20 years of service is 0.24 in. (6.1 mm) for both mixes.
Figure 1.61 compares the predicted longitudinal cracking for the WMA and HMA sections. The predicted cracking after 20 years of service was almost identical with 9.9 ft./mi (1.9 m/km) for the WMA and 21.0 ft./mi (4 m/km) for the HMA. Level 1 IDT data was available for I-66. The MEPDG predicted 0.01 ft./mi (0.002 m/km) of thermal cracking after 222 months for the WMA. No thermal cracking was predicted for the HMA.
Rapid River, Michigan
A WMA field project was constructed on County Road 513 near Rapid River, Michigan, in July 2010. Payne and Dolan, Inc., Waukesha, Wisconsin, was the contractor for this proj-ect. The first WMA technology used on this project was the foaming additive Advera WMA manufactured by the PQ Cor-poration. The other WMA technology used was the chemical
Layer Thickness
(in.) (cm)
WMA/HMA surface course 1.5 3.8
IM 19.0 D - 19.0 mm NMAS with PG 70-22 3.0 7.6
BM 25.0A - 25.0 mm NMAS with PG 64-22 13.0 33.0
21A Cement-treated aggregate base, E = 2,000,000 psi 10.0 25.4
AASHTO A-4 subgrade Semi-infinite
Table 1.89. Pavement structure for I-66, Centreville, Virginia.
0
0.1
0.2
0.3
0.4
0.5
0.6
0.7
0 24 48 72 96 120 144 168 192 216 240 264
Ru�
ng D
epth
(in.
)
Pavement Age (month)
HMA
Astec DBG
Maximum Ru�ng Limit
Figure 1.60. MEPDG-predicted asphalt rutting for I-66, Centreville, Virginia.
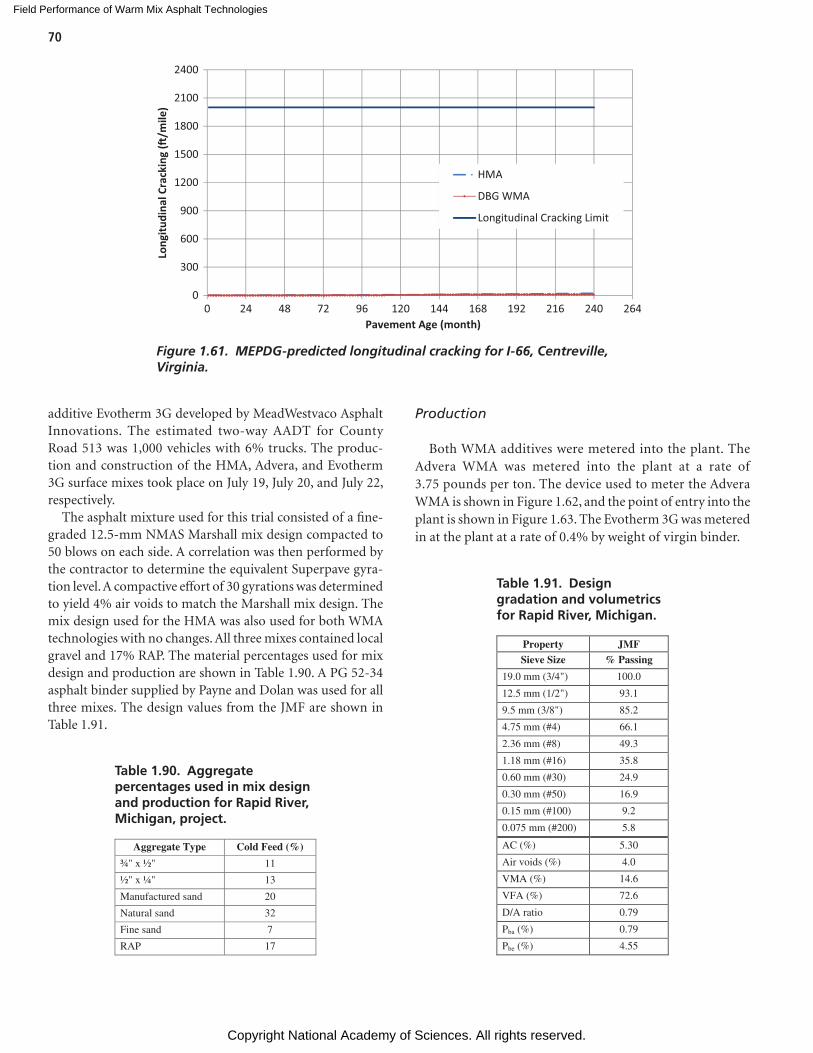
Field Performance of Warm Mix Asphalt Technologies
Copyright National Academy of Sciences. All rights reserved.
70
additive Evotherm 3G developed by MeadWestvaco Asphalt Innovations. The estimated two-way AADT for County Road 513 was 1,000 vehicles with 6% trucks. The produc-tion and construction of the HMA, Advera, and Evotherm 3G surface mixes took place on July 19, July 20, and July 22, respectively.
The asphalt mixture used for this trial consisted of a fine-graded 12.5-mm NMAS Marshall mix design compacted to 50 blows on each side. A correlation was then performed by the contractor to determine the equivalent Superpave gyra-tion level. A compactive effort of 30 gyrations was determined to yield 4% air voids to match the Marshall mix design. The mix design used for the HMA was also used for both WMA technologies with no changes. All three mixes contained local gravel and 17% RAP. The material percentages used for mix design and production are shown in Table 1.90. A PG 52-34 asphalt binder supplied by Payne and Dolan was used for all three mixes. The design values from the JMF are shown in Table 1.91.
Production
Both WMA additives were metered into the plant. The Advera WMA was metered into the plant at a rate of 3.75 pounds per ton. The device used to meter the Advera WMA is shown in Figure 1.62, and the point of entry into the plant is shown in Figure 1.63. The Evotherm 3G was metered in at the plant at a rate of 0.4% by weight of virgin binder.
0
300
600
900
1200
1500
1800
2100
2400
0 24 48 72 96 120 144 168 192 216 240 264
Long
itudi
nal C
rack
ing
(�/m
ile)
Pavement Age (month)
HMA
DBG WMA
Longitudinal Cracking Limit
Figure 1.61. MEPDG-predicted longitudinal cracking for I-66, Centreville, Virginia.
Aggregate Type Cold Feed (%)
¾" x ½" 11
½" x ¼" 13
Manufactured sand 20
Natural sand 32
Fine sand 7
RAP 17
Table 1.90. Aggregate percentages used in mix design and production for Rapid River, Michigan, project.
Property JMF
Sieve Size % Passing
19.0 mm (3/4") 100.0
12.5 mm (1/2") 93.1
9.5 mm (3/8") 85.2
4.75 mm (#4) 66.1
2.36 mm (#8) 49.3
1.18 mm (#16) 35.8
0.60 mm (#30) 24.9
0.30 mm (#50) 16.9
0.15 mm (#100) 9.2
0.075 mm (#200) 5.8
AC (%) 5.30
Air voids (%) 4.0
VMA (%) 14.6
VFA (%) 72.6
D/A ratio 0.79
Pba (%) 0.79
Pbe (%) 4.55
Table 1.91. Design gradation and volumetrics for Rapid River, Michigan.
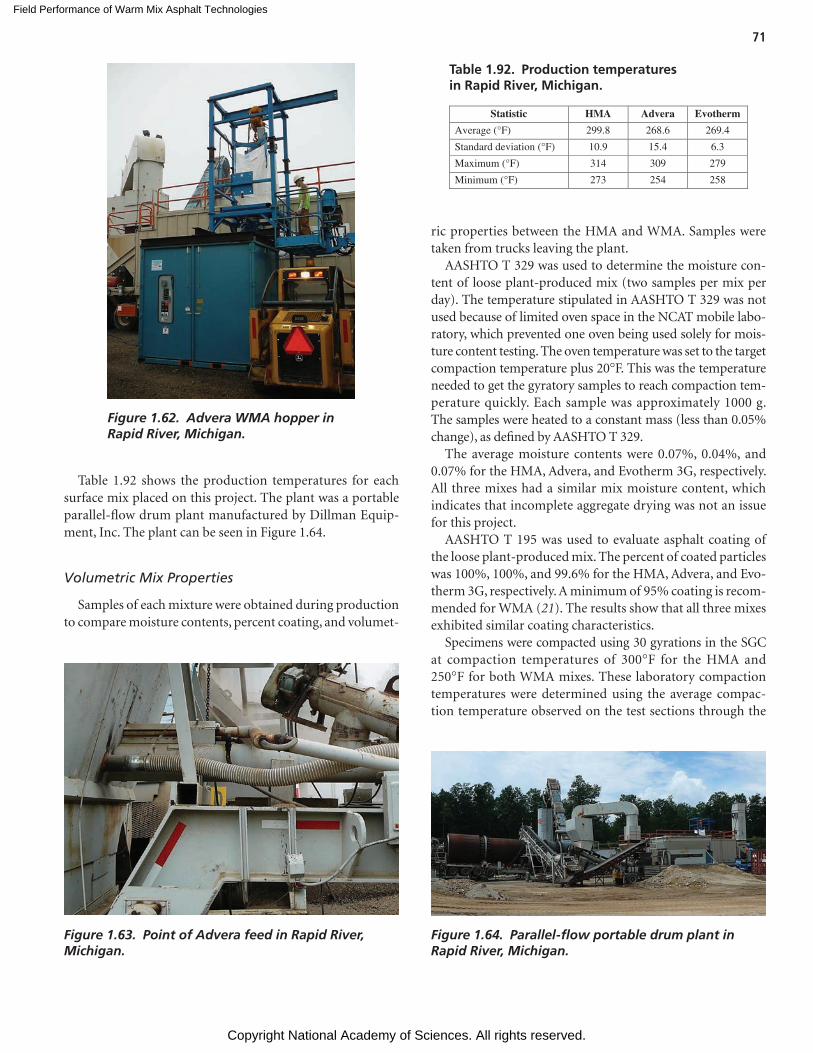
Field Performance of Warm Mix Asphalt Technologies
Copyright National Academy of Sciences. All rights reserved.
71
Table 1.92 shows the production temperatures for each surface mix placed on this project. The plant was a portable parallel-flow drum plant manufactured by Dillman Equip-ment, Inc. The plant can be seen in Figure 1.64.
Volumetric Mix Properties
Samples of each mixture were obtained during production to compare moisture contents, percent coating, and volumet-
ric properties between the HMA and WMA. Samples were taken from trucks leaving the plant.
AASHTO T 329 was used to determine the moisture con-tent of loose plant-produced mix (two samples per mix per day). The temperature stipulated in AASHTO T 329 was not used because of limited oven space in the NCAT mobile labo-ratory, which prevented one oven being used solely for mois-ture content testing. The oven temperature was set to the target compaction temperature plus 20°F. This was the temperature needed to get the gyratory samples to reach compaction tem-perature quickly. Each sample was approximately 1000 g. The samples were heated to a constant mass (less than 0.05% change), as defined by AASHTO T 329.
The average moisture contents were 0.07%, 0.04%, and 0.07% for the HMA, Advera, and Evotherm 3G, respectively. All three mixes had a similar mix moisture content, which indicates that incomplete aggregate drying was not an issue for this project.
AASHTO T 195 was used to evaluate asphalt coating of the loose plant-produced mix. The percent of coated particles was 100%, 100%, and 99.6% for the HMA, Advera, and Evo-therm 3G, respectively. A minimum of 95% coating is recom-mended for WMA (21). The results show that all three mixes exhibited similar coating characteristics.
Specimens were compacted using 30 gyrations in the SGC at compaction temperatures of 300°F for the HMA and 250°F for both WMA mixes. These laboratory compaction temperatures were determined using the average compac-tion temperature observed on the test sections through the
Figure 1.62. Advera WMA hopper in Rapid River, Michigan.
Figure 1.63. Point of Advera feed in Rapid River, Michigan.
Statistic HMA Advera Evotherm
Average (°F) 299.8 268.6 269.4
Standard deviation (°F) 10.9 15.4 6.3
Maximum (°F) 314 309 279
Minimum (°F) 273 254 258
Table 1.92. Production temperatures in Rapid River, Michigan.
Figure 1.64. Parallel-flow portable drum plant in Rapid River, Michigan.
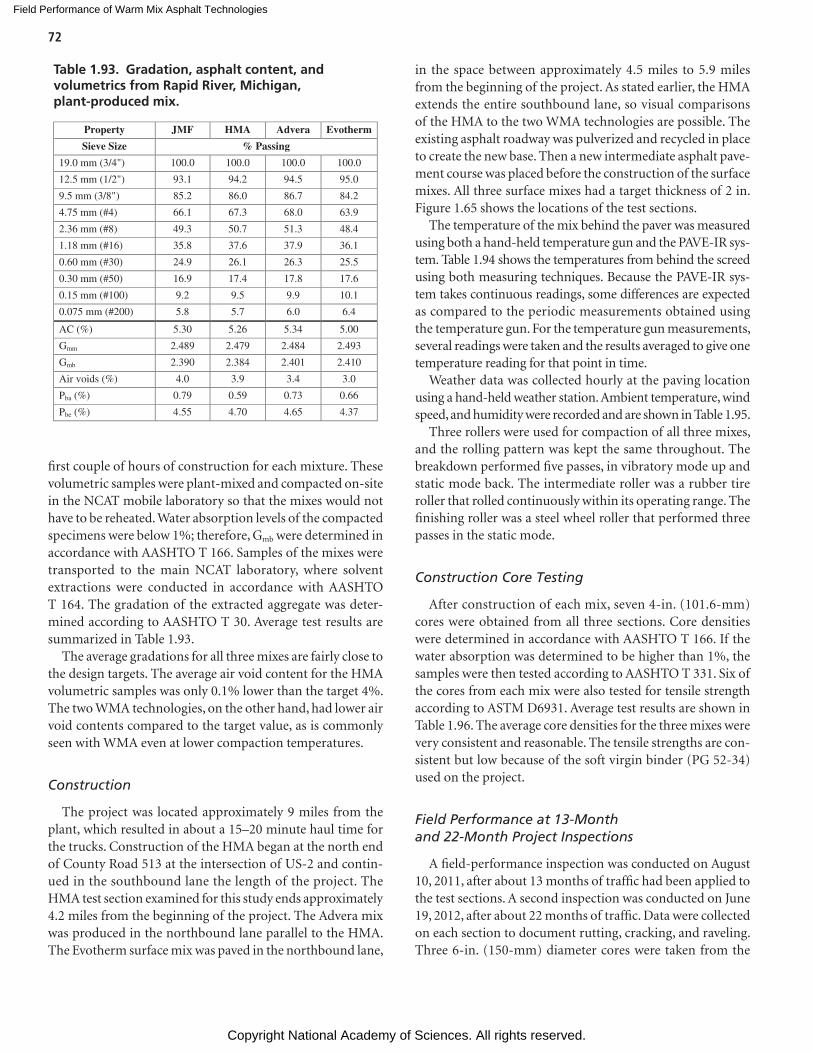
Field Performance of Warm Mix Asphalt Technologies
Copyright National Academy of Sciences. All rights reserved.
72
first couple of hours of construction for each mixture. These volumetric samples were plant-mixed and compacted on-site in the NCAT mobile laboratory so that the mixes would not have to be reheated. Water absorption levels of the compacted specimens were below 1%; therefore, Gmb were determined in accordance with AASHTO T 166. Samples of the mixes were transported to the main NCAT laboratory, where solvent extractions were conducted in accordance with AASHTO T 164. The gradation of the extracted aggregate was deter-mined according to AASHTO T 30. Average test results are summarized in Table 1.93.
The average gradations for all three mixes are fairly close to the design targets. The average air void content for the HMA volumetric samples was only 0.1% lower than the target 4%. The two WMA technologies, on the other hand, had lower air void contents compared to the target value, as is commonly seen with WMA even at lower compaction temperatures.
Construction
The project was located approximately 9 miles from the plant, which resulted in about a 15–20 minute haul time for the trucks. Construction of the HMA began at the north end of County Road 513 at the intersection of US-2 and contin-ued in the southbound lane the length of the project. The HMA test section examined for this study ends approximately 4.2 miles from the beginning of the project. The Advera mix was produced in the northbound lane parallel to the HMA. The Evotherm surface mix was paved in the northbound lane,
in the space between approximately 4.5 miles to 5.9 miles from the beginning of the project. As stated earlier, the HMA extends the entire southbound lane, so visual comparisons of the HMA to the two WMA technologies are possible. The existing asphalt roadway was pulverized and recycled in place to create the new base. Then a new intermediate asphalt pave-ment course was placed before the construction of the surface mixes. All three surface mixes had a target thickness of 2 in. Figure 1.65 shows the locations of the test sections.
The temperature of the mix behind the paver was measured using both a hand-held temperature gun and the PAVE-IR sys-tem. Table 1.94 shows the temperatures from behind the screed using both measuring techniques. Because the PAVE-IR sys-tem takes continuous readings, some differences are expected as compared to the periodic measurements obtained using the temperature gun. For the temperature gun measurements, several readings were taken and the results averaged to give one temperature reading for that point in time.
Weather data was collected hourly at the paving location using a hand-held weather station. Ambient temperature, wind speed, and humidity were recorded and are shown in Table 1.95.
Three rollers were used for compaction of all three mixes, and the rolling pattern was kept the same throughout. The breakdown performed five passes, in vibratory mode up and static mode back. The intermediate roller was a rubber tire roller that rolled continuously within its operating range. The finishing roller was a steel wheel roller that performed three passes in the static mode.
Construction Core Testing
After construction of each mix, seven 4-in. (101.6-mm) cores were obtained from all three sections. Core densities were determined in accordance with AASHTO T 166. If the water absorption was determined to be higher than 1%, the samples were then tested according to AASHTO T 331. Six of the cores from each mix were also tested for tensile strength according to ASTM D6931. Average test results are shown in Table 1.96. The average core densities for the three mixes were very consistent and reasonable. The tensile strengths are con-sistent but low because of the soft virgin binder (PG 52-34) used on the project.
Field Performance at 13-Month and 22-Month Project Inspections
A field-performance inspection was conducted on August 10, 2011, after about 13 months of traffic had been applied to the test sections. A second inspection was conducted on June 19, 2012, after about 22 months of traffic. Data were collected on each section to document rutting, cracking, and raveling. Three 6-in. (150-mm) diameter cores were taken from the
Property JMF HMA Advera Evotherm
Sieve Size % Passing
19.0 mm (3/4") 100.0 100.0 100.0 100.0
12.5 mm (1/2") 93.1 94.2 94.5 95.0
9.5 mm (3/8") 85.2 86.0 86.7 84.2
4.75 mm (#4) 66.1 67.3 68.0 63.9
2.36 mm (#8) 49.3 50.7 51.3 48.4
1.18 mm (#16) 35.8 37.6 37.9 36.1
0.60 mm (#30) 24.9 26.1 26.3 25.5
0.30 mm (#50) 16.9 17.4 17.8 17.6
0.15 mm (#100) 9.2 9.5 9.9 10.1
0.075 mm (#200) 5.8 5.7 6.0 6.4
AC (%) 5.30 5.26 5.34 5.00
Gmm 2.489 2.479 2.484 2.493
Gmb 2.390 2.384 2.401 2.410
Air voids (%) 4.0 3.9 3.4 3.0
Pba (%) 0.79 0.59 0.73 0.66
Pbe (%) 4.55 4.70 4.65 4.37
Table 1.93. Gradation, asphalt content, and volumetrics from Rapid River, Michigan, plant-produced mix.
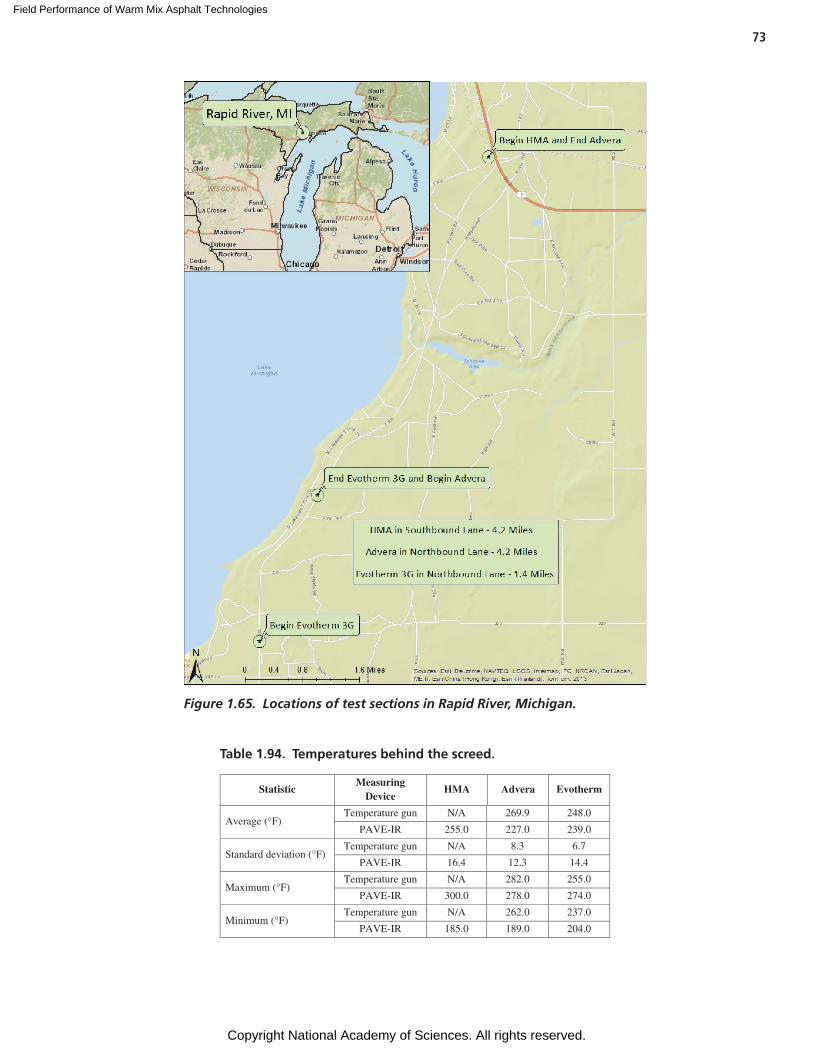
Field Performance of Warm Mix Asphalt Technologies
Copyright National Academy of Sciences. All rights reserved.
73
Figure 1.65. Locations of test sections in Rapid River, Michigan.
StatisticMeasuring
DeviceHMA Advera Evotherm
Average (°F)Temperature gun N/A 269.9 248.0
PAVE-IR 255.0 227.0 239.0
Standard deviation (°F)Temperature gun N/A 8.3 6.7
PAVE-IR 16.4 12.3 14.4
Maximum (°F)Temperature gun N/A 282.0 255.0
PAVE-IR 300.0 278.0 274.0
Minimum (°F)Temperature gun N/A 262.0 237.0
PAVE-IR 185.0 189.0 204.0
Table 1.94. Temperatures behind the screed.
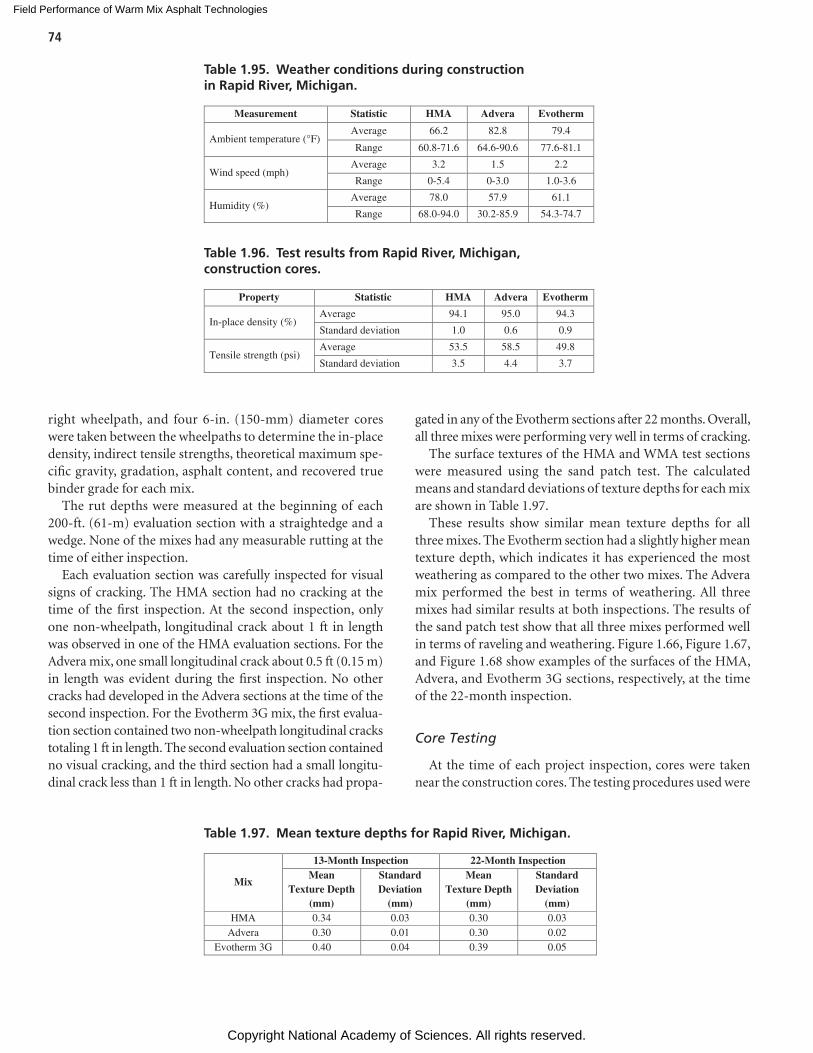
Field Performance of Warm Mix Asphalt Technologies
Copyright National Academy of Sciences. All rights reserved.
74
right wheelpath, and four 6-in. (150-mm) diameter cores were taken between the wheelpaths to determine the in-place density, indirect tensile strengths, theoretical maximum spe-cific gravity, gradation, asphalt content, and recovered true binder grade for each mix.
The rut depths were measured at the beginning of each 200-ft. (61-m) evaluation section with a straightedge and a wedge. None of the mixes had any measurable rutting at the time of either inspection.
Each evaluation section was carefully inspected for visual signs of cracking. The HMA section had no cracking at the time of the first inspection. At the second inspection, only one non-wheelpath, longitudinal crack about 1 ft in length was observed in one of the HMA evaluation sections. For the Advera mix, one small longitudinal crack about 0.5 ft (0.15 m) in length was evident during the first inspection. No other cracks had developed in the Advera sections at the time of the second inspection. For the Evotherm 3G mix, the first evalua-tion section contained two non-wheelpath longitudinal cracks totaling 1 ft in length. The second evaluation section contained no visual cracking, and the third section had a small longitu-dinal crack less than 1 ft in length. No other cracks had propa-
gated in any of the Evotherm sections after 22 months. Overall, all three mixes were performing very well in terms of cracking.
The surface textures of the HMA and WMA test sections were measured using the sand patch test. The calculated means and standard deviations of texture depths for each mix are shown in Table 1.97.
These results show similar mean texture depths for all three mixes. The Evotherm section had a slightly higher mean texture depth, which indicates it has experienced the most weathering as compared to the other two mixes. The Advera mix performed the best in terms of weathering. All three mixes had similar results at both inspections. The results of the sand patch test show that all three mixes performed well in terms of raveling and weathering. Figure 1.66, Figure 1.67, and Figure 1.68 show examples of the surfaces of the HMA, Advera, and Evotherm 3G sections, respectively, at the time of the 22-month inspection.
Core Testing
At the time of each project inspection, cores were taken near the construction cores. The testing procedures used were
Measurement Statistic HMA Advera Evotherm
Ambient temperature (°F)Average 66.2 82.8 79.4
Range 60.8-71.6 64.6-90.6 77.6-81.1
Wind speed (mph) Average 3.2 1.5 2.2
Range 0-5.4 0-3.0 1.0-3.6
Humidity (%)Average 78.0 57.9 61.1
Range 68.0-94.0 30.2-85.9 54.3-74.7
Table 1.95. Weather conditions during construction in Rapid River, Michigan.
Property Statistic HMA Advera Evotherm
In-place density (%)Average 94.1 95.0 94.3
Standard deviation 1.0 0.6 0.9
Tensile strength (psi)Average 53.5 58.5 49.8
Standard deviation 3.5 4.4 3.7
Table 1.96. Test results from Rapid River, Michigan, construction cores.
Mix
13-Month Inspection 22-Month InspectionMean
Texture Depth (mm)
Standard Deviation
(mm)
Mean Texture Depth
(mm)
Standard Deviation
(mm)HMA 0.34 0.03 0.30 0.03
Advera 0.30 0.01 0.30 0.02Evotherm 3G 0.40 0.04 0.39 0.05
Table 1.97. Mean texture depths for Rapid River, Michigan.
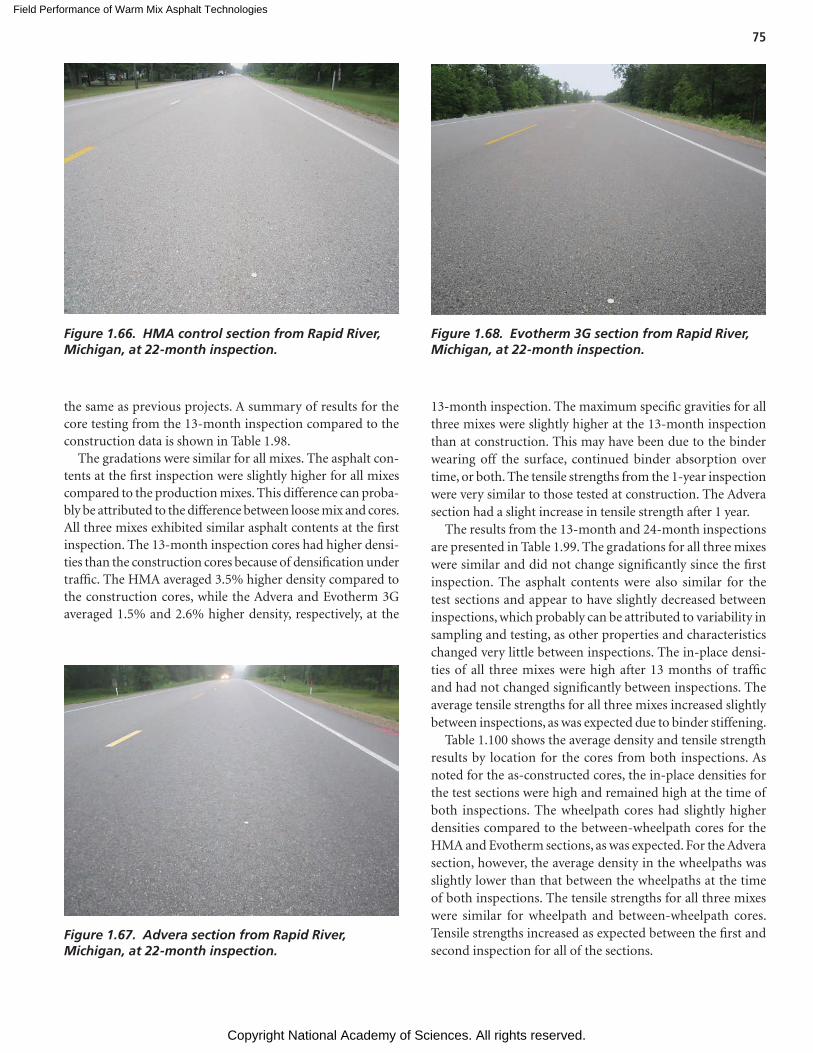
Field Performance of Warm Mix Asphalt Technologies
Copyright National Academy of Sciences. All rights reserved.
75
the same as previous projects. A summary of results for the core testing from the 13-month inspection compared to the construction data is shown in Table 1.98.
The gradations were similar for all mixes. The asphalt con-tents at the first inspection were slightly higher for all mixes compared to the production mixes. This difference can proba-bly be attributed to the difference between loose mix and cores. All three mixes exhibited similar asphalt contents at the first inspection. The 13-month inspection cores had higher densi-ties than the construction cores because of densification under traffic. The HMA averaged 3.5% higher density compared to the construction cores, while the Advera and Evotherm 3G averaged 1.5% and 2.6% higher density, respectively, at the
13-month inspection. The maximum specific gravities for all three mixes were slightly higher at the 13-month inspection than at construction. This may have been due to the binder wearing off the surface, continued binder absorption over time, or both. The tensile strengths from the 1-year inspection were very similar to those tested at construction. The Advera section had a slight increase in tensile strength after 1 year.
The results from the 13-month and 24-month inspections are presented in Table 1.99. The gradations for all three mixes were similar and did not change significantly since the first inspection. The asphalt contents were also similar for the test sections and appear to have slightly decreased between inspections, which probably can be attributed to variability in sampling and testing, as other properties and characteristics changed very little between inspections. The in-place densi-ties of all three mixes were high after 13 months of traffic and had not changed significantly between inspections. The average tensile strengths for all three mixes increased slightly between inspections, as was expected due to binder stiffening.
Table 1.100 shows the average density and tensile strength results by location for the cores from both inspections. As noted for the as-constructed cores, the in-place densities for the test sections were high and remained high at the time of both inspections. The wheelpath cores had slightly higher densities compared to the between-wheelpath cores for the HMA and Evotherm sections, as was expected. For the Advera section, however, the average density in the wheelpaths was slightly lower than that between the wheelpaths at the time of both inspections. The tensile strengths for all three mixes were similar for wheelpath and between-wheelpath cores. Tensile strengths increased as expected between the first and second inspection for all of the sections.
Figure 1.66. HMA control section from Rapid River, Michigan, at 22-month inspection.
Figure 1.67. Advera section from Rapid River, Michigan, at 22-month inspection.
Figure 1.68. Evotherm 3G section from Rapid River, Michigan, at 22-month inspection.
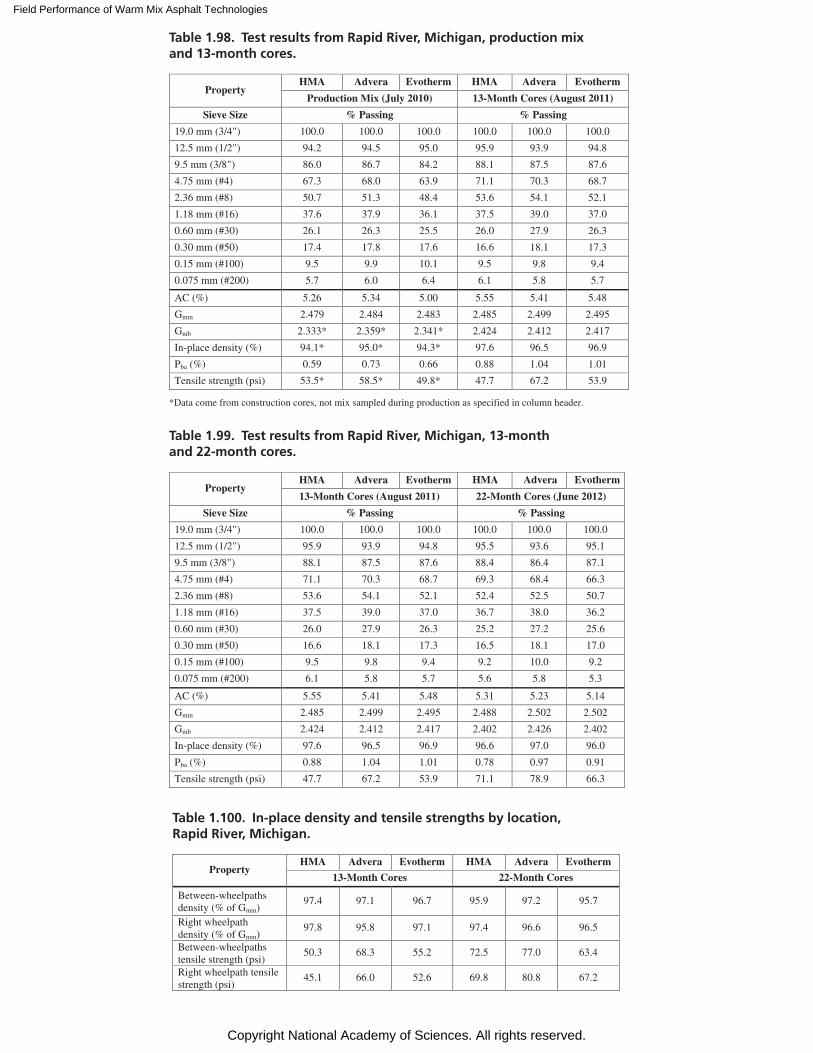
Field Performance of Warm Mix Asphalt Technologies
Copyright National Academy of Sciences. All rights reserved.
PropertyHMA Advera Evotherm HMA Advera Evotherm
Production Mix (July 2010) 13-Month Cores (August 2011)
Sieve Size % Passing % Passing
19.0 mm (3/4") 100.0 100.0 100.0 100.0 100.0 100.0
12.5 mm (1/2") 94.2 94.5 95.0 95.9 93.9 94.8
9.5 mm (3/8") 86.0 86.7 84.2 88.1 87.5 87.6
4.75 mm (#4) 67.3 68.0 63.9 71.1 70.3 68.7
2.36 mm (#8) 50.7 51.3 48.4 53.6 54.1 52.1
1.18 mm (#16) 37.6 37.9 36.1 37.5 39.0 37.0
0.60 mm (#30) 26.1 26.3 25.5 26.0 27.9 26.3
0.30 mm (#50) 17.4 17.8 17.6 16.6 18.1 17.3
0.15 mm (#100) 9.5 9.9 10.1 9.5 9.8 9.4
0.075 mm (#200) 5.7 6.0 6.4 6.1 5.8 5.7
AC (%) 5.26 5.34 5.00 5.55 5.41 5.48
Gmm 2.479 2.484 2.483 2.485 2.499 2.495
Gmb 2.333* 2.359* 2.341* 2.424 2.412 2.417
In-place density (%) 94.1* 95.0* 94.3* 97.6 96.5 96.9
Pba (%) 0.59 0.73 0.66 0.88 1.04 1.01
Tensile strength (psi) 53.5* 58.5* 49.8* 47.7 67.2 53.9
*Data come from construction cores, not mix sampled during production as specified in column header.
Table 1.98. Test results from Rapid River, Michigan, production mix and 13-month cores.
PropertyHMA Advera Evotherm HMA Advera Evotherm
13-Month Cores (August 2011) 22-Month Cores (June 2012)
Sieve Size % Passing % Passing
19.0 mm (3/4") 100.0 100.0 100.0 100.0 100.0 100.0
12.5 mm (1/2") 95.9 93.9 94.8 95.5 93.6 95.1
9.5 mm (3/8") 88.1 87.5 87.6 88.4 86.4 87.1
4.75 mm (#4) 71.1 70.3 68.7 69.3 68.4 66.3
2.36 mm (#8) 53.6 54.1 52.1 52.4 52.5 50.7
1.18 mm (#16) 37.5 39.0 37.0 36.7 38.0 36.2
0.60 mm (#30) 26.0 27.9 26.3 25.2 27.2 25.6
0.30 mm (#50) 16.6 18.1 17.3 16.5 18.1 17.0
0.15 mm (#100) 9.5 9.8 9.4 9.2 10.0 9.2
0.075 mm (#200) 6.1 5.8 5.7 5.6 5.8 5.3
AC (%) 5.55 5.41 5.48 5.31 5.23 5.14
Gmm 2.485 2.499 2.495 2.488 2.502 2.502
Gmb 2.424 2.412 2.417 2.402 2.426 2.402
In-place density (%) 97.6 96.5 96.9 96.6 97.0 96.0
Pba (%) 0.88 1.04 1.01 0.78 0.97 0.91
Tensile strength (psi) 47.7 67.2 53.9 71.1 78.9 66.3
Table 1.99. Test results from Rapid River, Michigan, 13-month and 22-month cores.
PropertyHMA Advera Evotherm HMA Advera Evotherm
13-Month Cores 22-Month Cores
Between-wheelpaths density (% of Gmm)
97.4 97.1 96.7 95.9 97.2 95.7
Right wheelpath density (% of Gmm)
97.8 95.8 97.1 97.4 96.6 96.5
Between-wheelpaths tensile strength (psi)
50.3 68.3 55.2 72.5 77.0 63.4
Right wheelpath tensile strength (psi)
45.1 66.0 52.6 69.8 80.8 67.2
Table 1.100. In-place density and tensile strengths by location, Rapid River, Michigan.
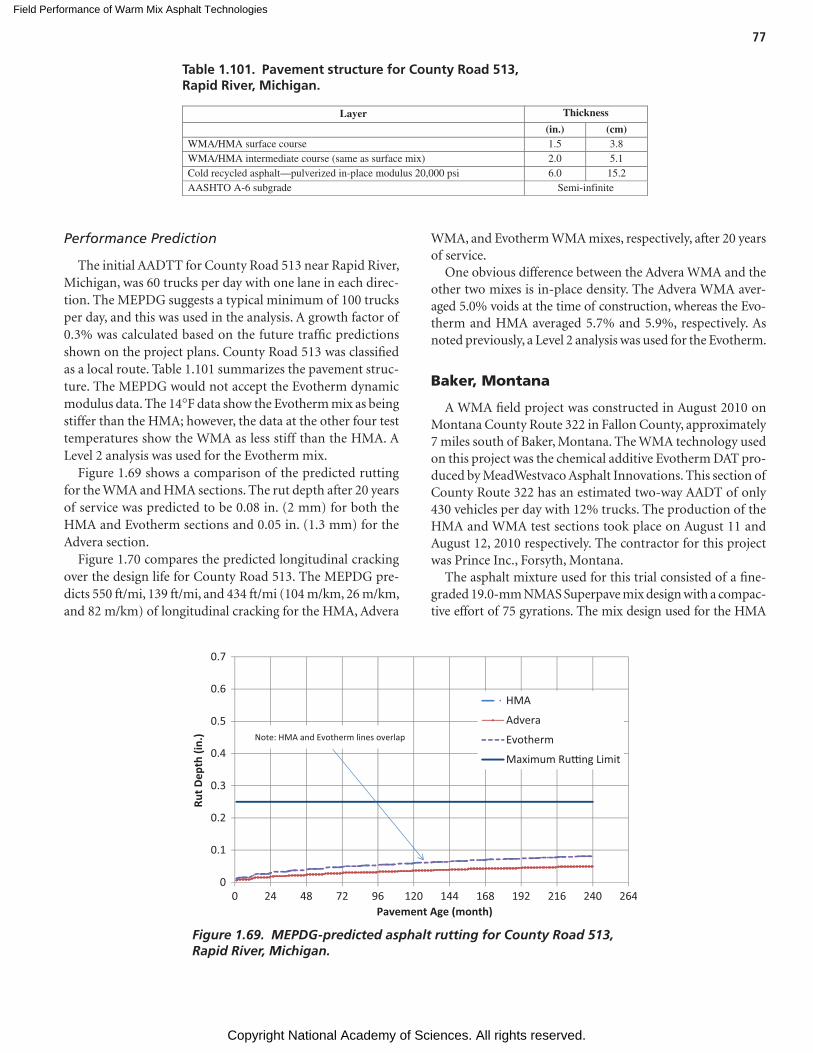
Field Performance of Warm Mix Asphalt Technologies
Copyright National Academy of Sciences. All rights reserved.
77
Performance Prediction
The initial AADTT for County Road 513 near Rapid River, Michigan, was 60 trucks per day with one lane in each direc-tion. The MEPDG suggests a typical minimum of 100 trucks per day, and this was used in the analysis. A growth factor of 0.3% was calculated based on the future traffic predictions shown on the project plans. County Road 513 was classified as a local route. Table 1.101 summarizes the pavement struc-ture. The MEPDG would not accept the Evotherm dynamic modulus data. The 14°F data show the Evotherm mix as being stiffer than the HMA; however, the data at the other four test temperatures show the WMA as less stiff than the HMA. A Level 2 analysis was used for the Evotherm mix.
Figure 1.69 shows a comparison of the predicted rutting for the WMA and HMA sections. The rut depth after 20 years of service was predicted to be 0.08 in. (2 mm) for both the HMA and Evotherm sections and 0.05 in. (1.3 mm) for the Advera section.
Figure 1.70 compares the predicted longitudinal cracking over the design life for County Road 513. The MEPDG pre-dicts 550 ft/mi, 139 ft/mi, and 434 ft/mi (104 m/km, 26 m/km, and 82 m/km) of longitudinal cracking for the HMA, Advera
WMA, and Evotherm WMA mixes, respectively, after 20 years of service.
One obvious difference between the Advera WMA and the other two mixes is in-place density. The Advera WMA aver-aged 5.0% voids at the time of construction, whereas the Evo-therm and HMA averaged 5.7% and 5.9%, respectively. As noted previously, a Level 2 analysis was used for the Evotherm.
Baker, Montana
A WMA field project was constructed in August 2010 on Montana County Route 322 in Fallon County, approximately 7 miles south of Baker, Montana. The WMA technology used on this project was the chemical additive Evotherm DAT pro-duced by MeadWestvaco Asphalt Innovations. This section of County Route 322 has an estimated two-way AADT of only 430 vehicles per day with 12% trucks. The production of the HMA and WMA test sections took place on August 11 and August 12, 2010 respectively. The contractor for this project was Prince Inc., Forsyth, Montana.
The asphalt mixture used for this trial consisted of a fine-graded 19.0-mm NMAS Superpave mix design with a compac-tive effort of 75 gyrations. The mix design used for the HMA
Layer Thickness
(in.) (cm) WMA/HMA surface course 1.5 3.8 WMA/HMA intermediate course (same as surface mix) 2.0 5.1 Cold recycled asphalt—pulverized in-place modulus 20,000 psi 6.0 15.2AASHTO A-6 subgrade Semi-infinite
Table 1.101. Pavement structure for County Road 513, Rapid River, Michigan.
0
0.1
0.2
0.3
0.4
0.5
0.6
0.7
0 24 48 72 96 120 144 168 192 216 240 264
Rut D
epth
(in.
)
Pavement Age (month)
HMA
Advera
Evotherm
Maximum Ru�ng Limit
Note: HMA and Evotherm lines overlap
Figure 1.69. MEPDG-predicted asphalt rutting for County Road 513, Rapid River, Michigan.
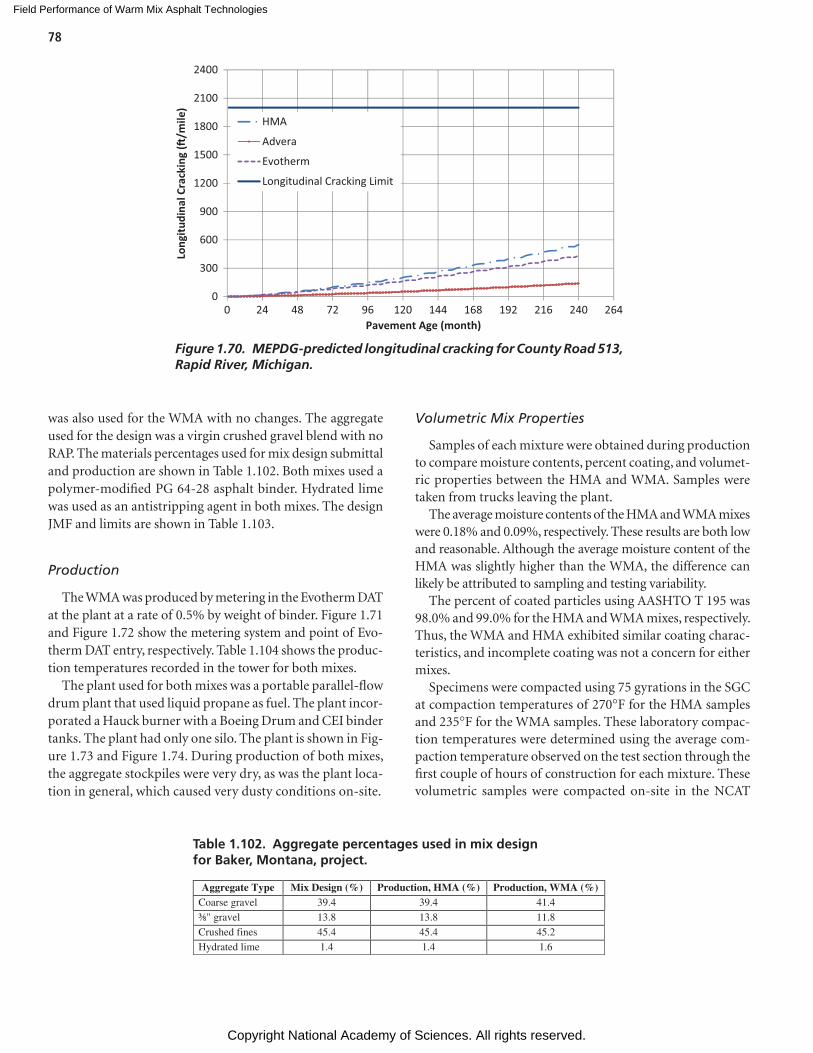
Field Performance of Warm Mix Asphalt Technologies
Copyright National Academy of Sciences. All rights reserved.
78
was also used for the WMA with no changes. The aggregate used for the design was a virgin crushed gravel blend with no RAP. The materials percentages used for mix design submittal and production are shown in Table 1.102. Both mixes used a polymer-modified PG 64-28 asphalt binder. Hydrated lime was used as an antistripping agent in both mixes. The design JMF and limits are shown in Table 1.103.
Production
The WMA was produced by metering in the Evotherm DAT at the plant at a rate of 0.5% by weight of binder. Figure 1.71 and Figure 1.72 show the metering system and point of Evo-therm DAT entry, respectively. Table 1.104 shows the produc-tion temperatures recorded in the tower for both mixes.
The plant used for both mixes was a portable parallel-flow drum plant that used liquid propane as fuel. The plant incor-porated a Hauck burner with a Boeing Drum and CEI binder tanks. The plant had only one silo. The plant is shown in Fig-ure 1.73 and Figure 1.74. During production of both mixes, the aggregate stockpiles were very dry, as was the plant loca-tion in general, which caused very dusty conditions on-site.
Volumetric Mix Properties
Samples of each mixture were obtained during production to compare moisture contents, percent coating, and volumet-ric properties between the HMA and WMA. Samples were taken from trucks leaving the plant.
The average moisture contents of the HMA and WMA mixes were 0.18% and 0.09%, respectively. These results are both low and reasonable. Although the average moisture content of the HMA was slightly higher than the WMA, the difference can likely be attributed to sampling and testing variability.
The percent of coated particles using AASHTO T 195 was 98.0% and 99.0% for the HMA and WMA mixes, respectively. Thus, the WMA and HMA exhibited similar coating charac-teristics, and incomplete coating was not a concern for either mixes.
Specimens were compacted using 75 gyrations in the SGC at compaction temperatures of 270°F for the HMA samples and 235°F for the WMA samples. These laboratory compac-tion temperatures were determined using the average com-paction temperature observed on the test section through the first couple of hours of construction for each mixture. These volumetric samples were compacted on-site in the NCAT
0
300
600
900
1200
1500
1800
2100
2400
0 24 48 72 96 120 144 168 192 216 240 264
Long
itudi
nal C
rack
ing
(�/m
ile)
Pavement Age (month)
HMA
Advera
Evotherm
Longitudinal Cracking Limit
Figure 1.70. MEPDG-predicted longitudinal cracking for County Road 513, Rapid River, Michigan.
Aggregate Type Mix Design (%) Production, HMA (%) Production, WMA (%)Coarse gravel 39.4 39.4 41.4
" gravel 13.8 13.8 11.8Crushed fines 45.4 45.4 45.2Hydrated lime 1.4 1.4 1.6
Table 1.102. Aggregate percentages used in mix design for Baker, Montana, project.
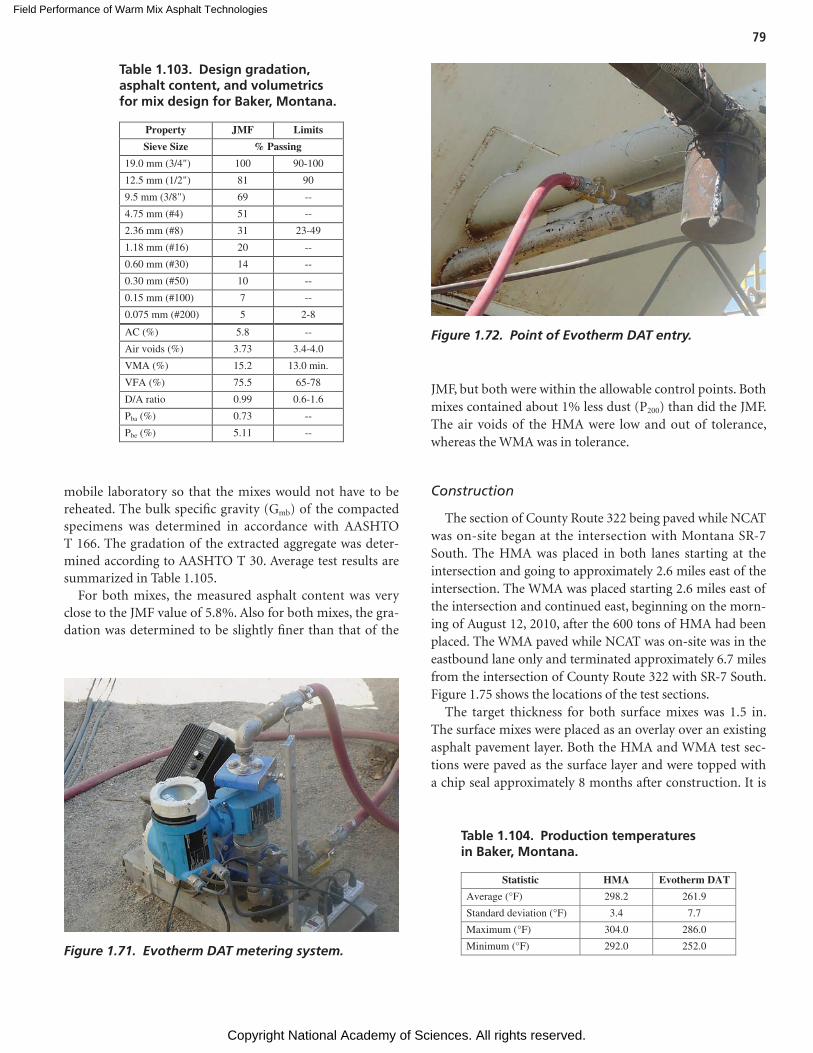
Field Performance of Warm Mix Asphalt Technologies
Copyright National Academy of Sciences. All rights reserved.
79
mobile laboratory so that the mixes would not have to be reheated. The bulk specific gravity (Gmb) of the compacted specimens was determined in accordance with AASHTO T 166. The gradation of the extracted aggregate was deter-mined according to AASHTO T 30. Average test results are summarized in Table 1.105.
For both mixes, the measured asphalt content was very close to the JMF value of 5.8%. Also for both mixes, the gra-dation was determined to be slightly finer than that of the
JMF, but both were within the allowable control points. Both mixes contained about 1% less dust (P200) than did the JMF. The air voids of the HMA were low and out of tolerance, whereas the WMA was in tolerance.
Construction
The section of County Route 322 being paved while NCAT was on-site began at the intersection with Montana SR-7 South. The HMA was placed in both lanes starting at the intersection and going to approximately 2.6 miles east of the intersection. The WMA was placed starting 2.6 miles east of the intersection and continued east, beginning on the morn-ing of August 12, 2010, after the 600 tons of HMA had been placed. The WMA paved while NCAT was on-site was in the eastbound lane only and terminated approximately 6.7 miles from the intersection of County Route 322 with SR-7 South. Figure 1.75 shows the locations of the test sections.
The target thickness for both surface mixes was 1.5 in. The surface mixes were placed as an overlay over an existing asphalt pavement layer. Both the HMA and WMA test sec-tions were paved as the surface layer and were topped with a chip seal approximately 8 months after construction. It is
Property JMF Limits
Sieve Size % Passing
19.0 mm (3/4") 100 90-100
12.5 mm (1/2") 81 90
9.5 mm (3/8") 69 --
4.75 mm (#4) 51 --
2.36 mm (#8) 31 23-49
1.18 mm (#16) 20 --
0.60 mm (#30) 14 --
0.30 mm (#50) 10 --
0.15 mm (#100) 7 --
0.075 mm (#200) 5 2-8
AC (%) 5.8 --
Air voids (%) 3.73 3.4-4.0
VMA (%) 15.2 13.0 min.
VFA (%) 75.5 65-78
D/A ratio 0.99 0.6-1.6
Pba (%) 0.73 --
Pbe (%) 5.11 --
Table 1.103. Design gradation, asphalt content, and volumetrics for mix design for Baker, Montana.
Figure 1.71. Evotherm DAT metering system.
Figure 1.72. Point of Evotherm DAT entry.
Statistic HMA Evotherm DAT
Average (°F) 298.2 261.9
Standard deviation (°F) 3.4 7.7
Maximum (°F) 304.0 286.0
Minimum (°F) 292.0 252.0
Table 1.104. Production temperatures in Baker, Montana.
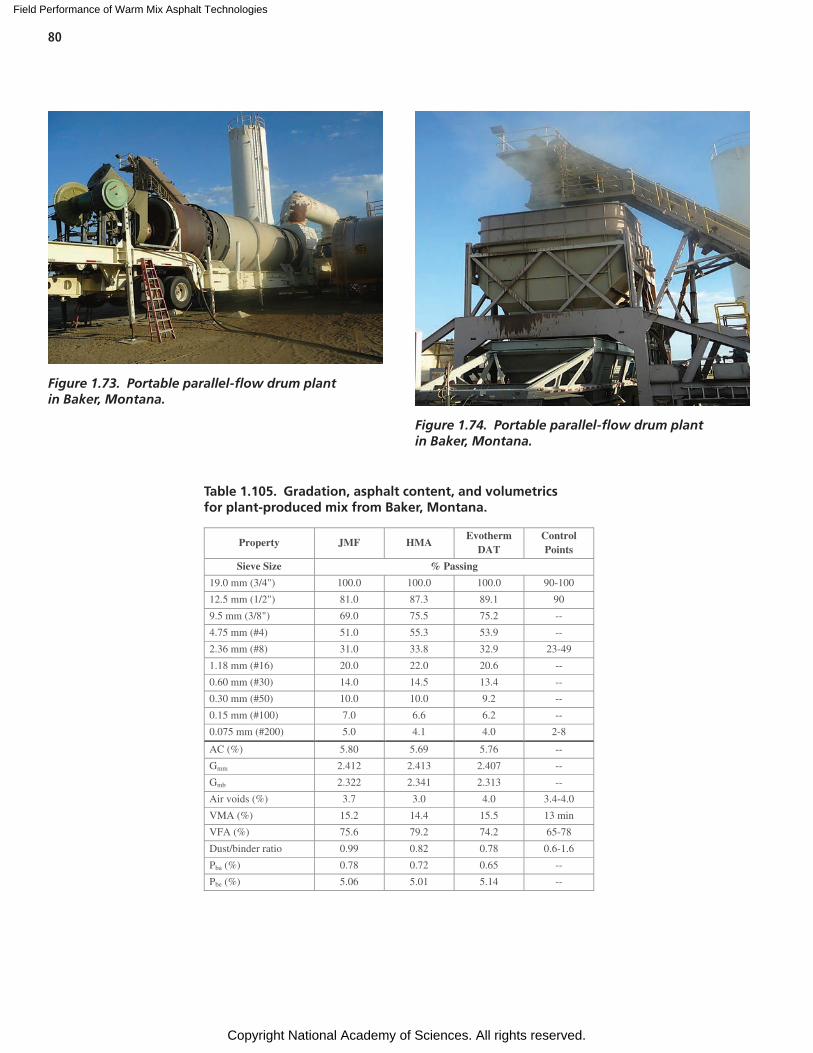
Field Performance of Warm Mix Asphalt Technologies
Copyright National Academy of Sciences. All rights reserved.
80
Figure 1.73. Portable parallel-flow drum plant in Baker, Montana.
Figure 1.74. Portable parallel-flow drum plant in Baker, Montana.
Property JMF HMAEvotherm
DATControl Points
Sieve Size % Passing
19.0 mm (3/4") 100.0 100.0 100.0 90-100
12.5 mm (1/2") 81.0 87.3 89.1 90
9.5 mm (3/8") 69.0 75.5 75.2 --
4.75 mm (#4) 51.0 55.3 53.9 --
2.36 mm (#8) 31.0 33.8 32.9 23-49
1.18 mm (#16) 20.0 22.0 20.6 --
0.60 mm (#30) 14.0 14.5 13.4 --
0.30 mm (#50) 10.0 10.0 9.2 --
0.15 mm (#100) 7.0 6.6 6.2 --
0.075 mm (#200) 5.0 4.1 4.0 2-8
AC (%) 5.80 5.69 5.76 --
Gmm 2.412 2.413 2.407 --
Gmb 2.322 2.341 2.313 --
Air voids (%) 3.7 3.0 4.0 3.4-4.0
VMA (%) 15.2 14.4 15.5 13 min
VFA (%) 75.6 79.2 74.2 65-78
Dust/binder ratio 0.99 0.82 0.78 0.6-1.6
Pba (%) 0.78 0.72 0.65 --
Pbe (%) 5.06 5.01 5.14 --
Table 1.105. Gradation, asphalt content, and volumetrics for plant-produced mix from Baker, Montana.
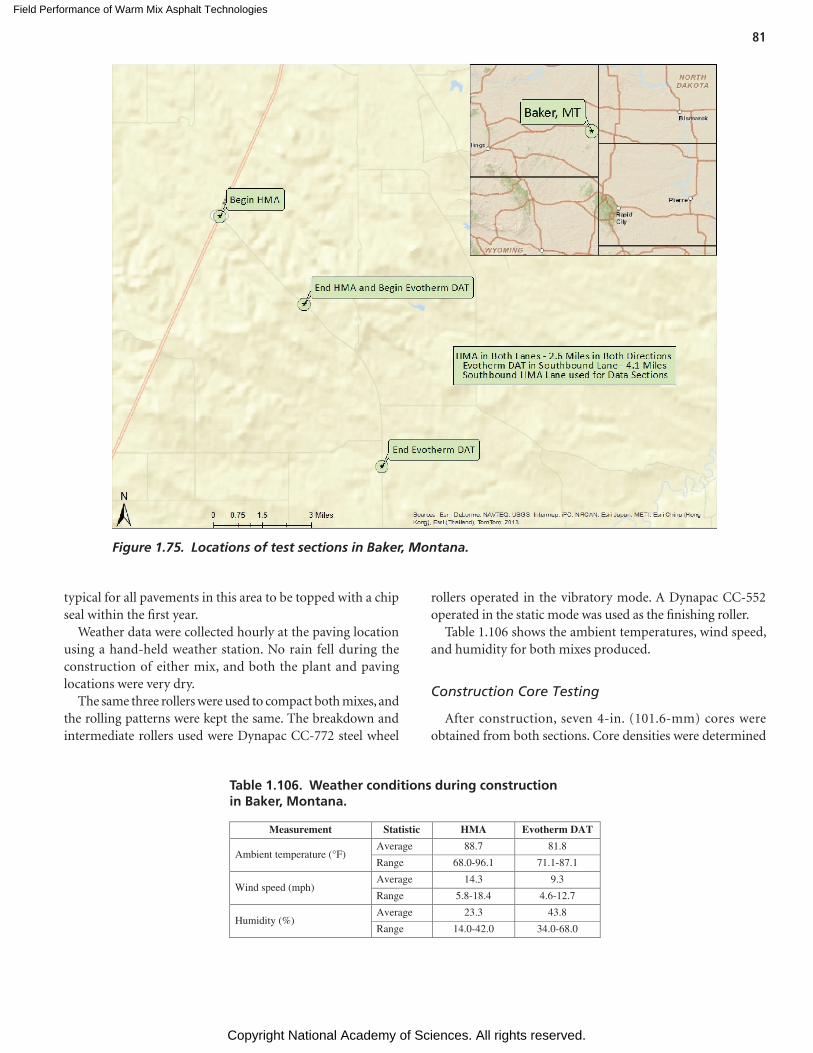
Field Performance of Warm Mix Asphalt Technologies
Copyright National Academy of Sciences. All rights reserved.
81
typical for all pavements in this area to be topped with a chip seal within the first year.
Weather data were collected hourly at the paving location using a hand-held weather station. No rain fell during the construction of either mix, and both the plant and paving locations were very dry.
The same three rollers were used to compact both mixes, and the rolling patterns were kept the same. The breakdown and intermediate rollers used were Dynapac CC-772 steel wheel
rollers operated in the vibratory mode. A Dynapac CC-552 operated in the static mode was used as the finishing roller.
Table 1.106 shows the ambient temperatures, wind speed, and humidity for both mixes produced.
Construction Core Testing
After construction, seven 4-in. (101.6-mm) cores were obtained from both sections. Core densities were determined
Figure 1.75. Locations of test sections in Baker, Montana.
Measurement Statistic HMA Evotherm DAT
Ambient temperature (°F)Average 88.7 81.8
Range 68.0-96.1 71.1-87.1
Wind speed (mph) Average 14.3 9.3
Range 5.8-18.4 4.6-12.7
Humidity (%)Average 23.3 43.8
Range 14.0-42.0 34.0-68.0
Table 1.106. Weather conditions during construction in Baker, Montana.
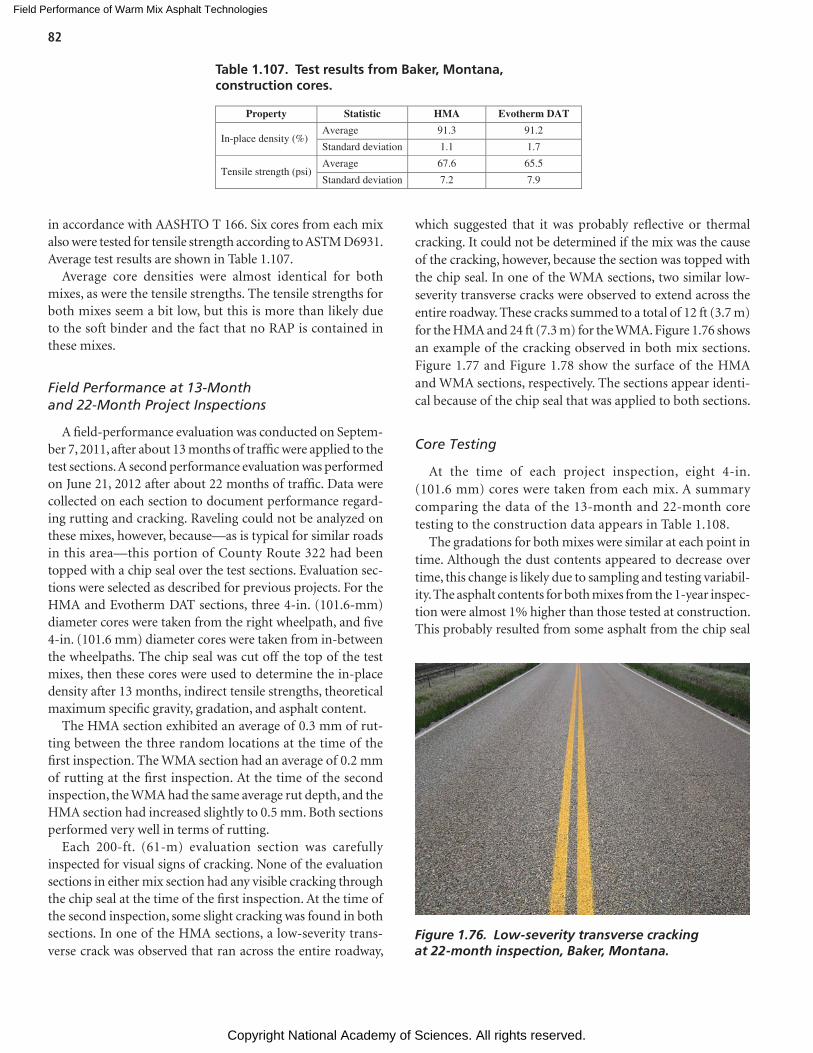
Field Performance of Warm Mix Asphalt Technologies
Copyright National Academy of Sciences. All rights reserved.
82
in accordance with AASHTO T 166. Six cores from each mix also were tested for tensile strength according to ASTM D6931. Average test results are shown in Table 1.107.
Average core densities were almost identical for both mixes, as were the tensile strengths. The tensile strengths for both mixes seem a bit low, but this is more than likely due to the soft binder and the fact that no RAP is contained in these mixes.
Field Performance at 13-Month and 22-Month Project Inspections
A field-performance evaluation was conducted on Septem-ber 7, 2011, after about 13 months of traffic were applied to the test sections. A second performance evaluation was performed on June 21, 2012 after about 22 months of traffic. Data were collected on each section to document performance regard-ing rutting and cracking. Raveling could not be analyzed on these mixes, however, because—as is typical for similar roads in this area—this portion of County Route 322 had been topped with a chip seal over the test sections. Evaluation sec-tions were selected as described for previous projects. For the HMA and Evotherm DAT sections, three 4-in. (101.6-mm) diameter cores were taken from the right wheelpath, and five 4-in. (101.6 mm) diameter cores were taken from in-between the wheelpaths. The chip seal was cut off the top of the test mixes, then these cores were used to determine the in-place density after 13 months, indirect tensile strengths, theoretical maximum specific gravity, gradation, and asphalt content.
The HMA section exhibited an average of 0.3 mm of rut-ting between the three random locations at the time of the first inspection. The WMA section had an average of 0.2 mm of rutting at the first inspection. At the time of the second inspection, the WMA had the same average rut depth, and the HMA section had increased slightly to 0.5 mm. Both sections performed very well in terms of rutting.
Each 200-ft. (61-m) evaluation section was carefully inspected for visual signs of cracking. None of the evaluation sections in either mix section had any visible cracking through the chip seal at the time of the first inspection. At the time of the second inspection, some slight cracking was found in both sections. In one of the HMA sections, a low-severity trans-verse crack was observed that ran across the entire roadway,
which suggested that it was probably reflective or thermal cracking. It could not be determined if the mix was the cause of the cracking, however, because the section was topped with the chip seal. In one of the WMA sections, two similar low-severity transverse cracks were observed to extend across the entire roadway. These cracks summed to a total of 12 ft (3.7 m) for the HMA and 24 ft (7.3 m) for the WMA. Figure 1.76 shows an example of the cracking observed in both mix sections. Figure 1.77 and Figure 1.78 show the surface of the HMA and WMA sections, respectively. The sections appear identi-cal because of the chip seal that was applied to both sections.
Core Testing
At the time of each project inspection, eight 4-in. (101.6 mm) cores were taken from each mix. A summary comparing the data of the 13-month and 22-month core testing to the construction data appears in Table 1.108.
The gradations for both mixes were similar at each point in time. Although the dust contents appeared to decrease over time, this change is likely due to sampling and testing variabil-ity. The asphalt contents for both mixes from the 1-year inspec-tion were almost 1% higher than those tested at construction. This probably resulted from some asphalt from the chip seal
Property Statistic HMA Evotherm DAT
In-place density (%)Average 91.3 91.2
Standard deviation 1.1 1.7
Tensile strength (psi)Average 67.6 65.5
Standard deviation 7.2 7.9
Table 1.107. Test results from Baker, Montana, construction cores.
Figure 1.76. Low-severity transverse cracking at 22-month inspection, Baker, Montana.
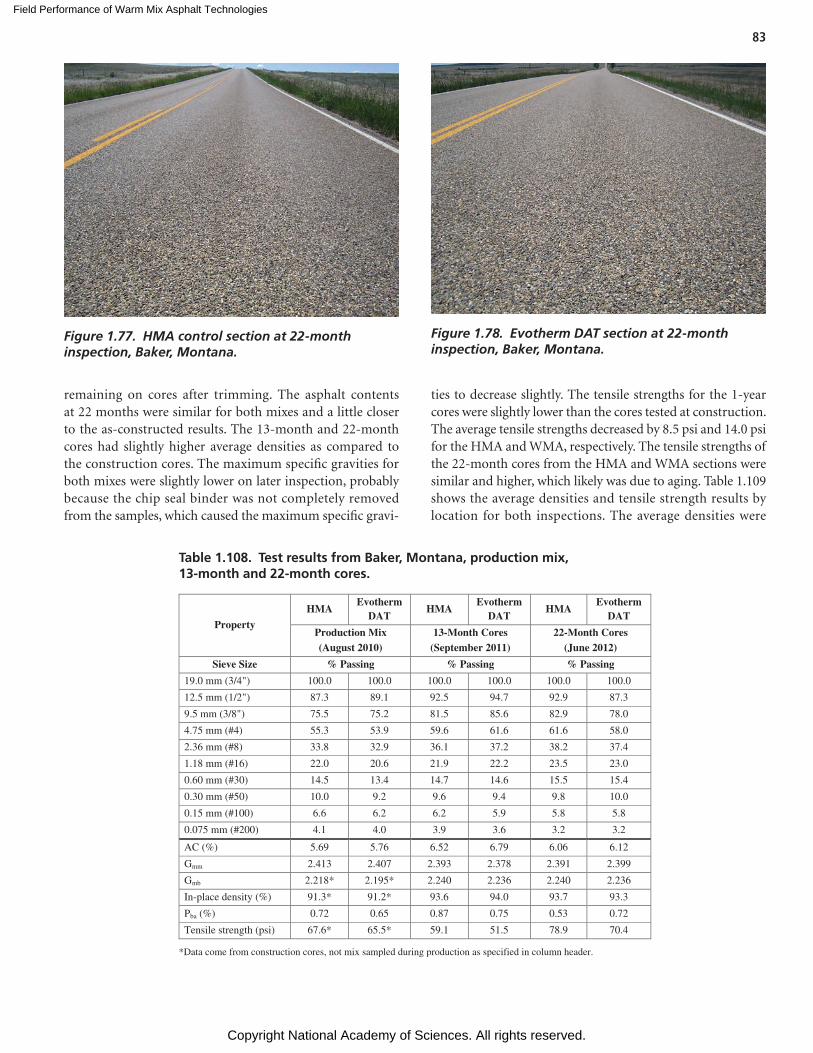
Field Performance of Warm Mix Asphalt Technologies
Copyright National Academy of Sciences. All rights reserved.
83
remaining on cores after trimming. The asphalt contents at 22 months were similar for both mixes and a little closer to the as-constructed results. The 13-month and 22-month cores had slightly higher average densities as compared to the construction cores. The maximum specific gravities for both mixes were slightly lower on later inspection, probably because the chip seal binder was not completely removed from the samples, which caused the maximum specific gravi-
ties to decrease slightly. The tensile strengths for the 1-year cores were slightly lower than the cores tested at construction. The average tensile strengths decreased by 8.5 psi and 14.0 psi for the HMA and WMA, respectively. The tensile strengths of the 22-month cores from the HMA and WMA sections were similar and higher, which likely was due to aging. Table 1.109 shows the average densities and tensile strength results by location for both inspections. The average densities were
Figure 1.77. HMA control section at 22-month inspection, Baker, Montana.
Figure 1.78. Evotherm DAT section at 22-month inspection, Baker, Montana.
Property
HMAEvotherm
DATHMA
EvothermDAT
HMAEvotherm
DAT
Production Mix (August 2010)
13-Month Cores (September 2011)
22-Month Cores (June 2012)
Sieve Size % Passing % Passing % Passing
19.0 mm (3/4") 100.0 100.0 100.0 100.0 100.0 100.0
12.5 mm (1/2") 87.3 89.1 92.5 94.7 92.9 87.3
9.5 mm (3/8") 75.5 75.2 81.5 85.6 82.9 78.0
4.75 mm (#4) 55.3 53.9 59.6 61.6 61.6 58.0
2.36 mm (#8) 33.8 32.9 36.1 37.2 38.2 37.4
1.18 mm (#16) 22.0 20.6 21.9 22.2 23.5 23.0
0.60 mm (#30) 14.5 13.4 14.7 14.6 15.5 15.4
0.30 mm (#50) 10.0 9.2 9.6 9.4 9.8 10.0
0.15 mm (#100) 6.6 6.2 6.2 5.9 5.8 5.8
0.075 mm (#200) 4.1 4.0 3.9 3.6 3.2 3.2
AC (%) 5.69 5.76 6.52 6.79 6.06 6.12
Gmm 2.413 2.407 2.393 2.378 2.391 2.399
Gmb 2.218* 2.195* 2.240 2.236 2.240 2.236
In-place density (%) 91.3* 91.2* 93.6 94.0 93.7 93.3
Pba (%) 0.72 0.65 0.87 0.75 0.53 0.72
Tensile strength (psi) 67.6* 65.5* 59.1 51.5 78.9 70.4
*Data come from construction cores, not mix sampled during production as specified in column header.
Table 1.108. Test results from Baker, Montana, production mix, 13-month and 22-month cores.
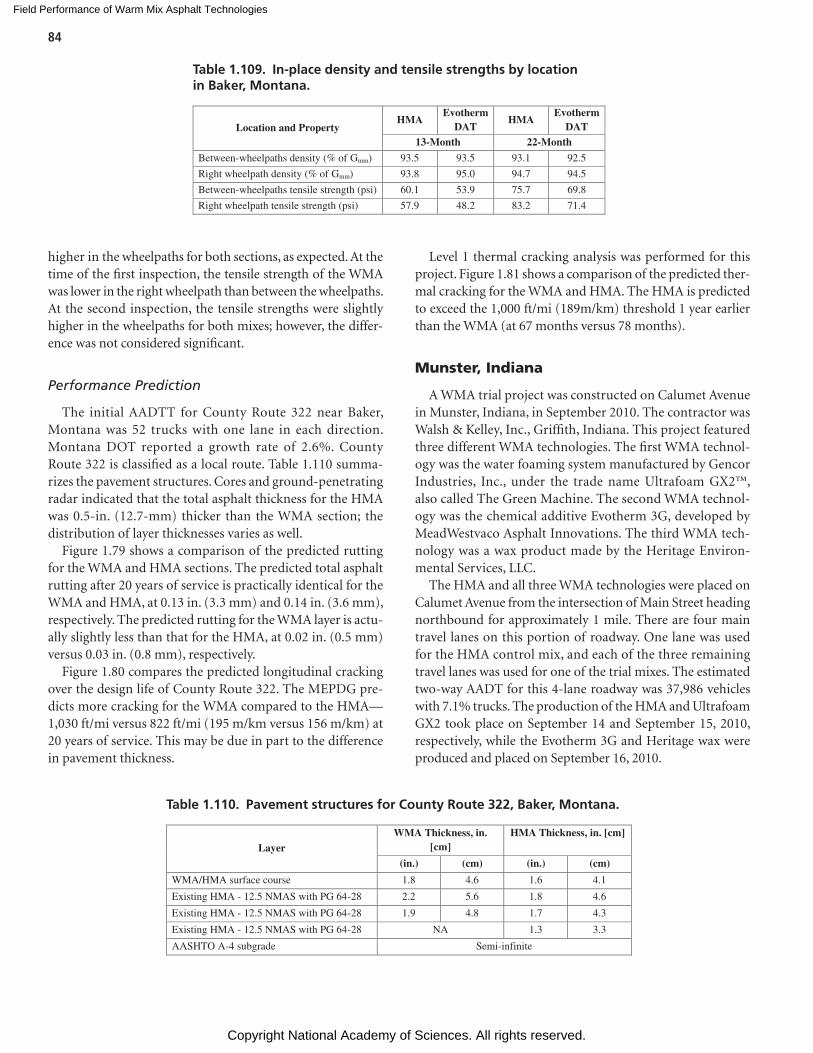
Field Performance of Warm Mix Asphalt Technologies
Copyright National Academy of Sciences. All rights reserved.
84
higher in the wheelpaths for both sections, as expected. At the time of the first inspection, the tensile strength of the WMA was lower in the right wheelpath than between the wheelpaths. At the second inspection, the tensile strengths were slightly higher in the wheelpaths for both mixes; however, the differ-ence was not considered significant.
Performance Prediction
The initial AADTT for County Route 322 near Baker, Montana was 52 trucks with one lane in each direction. Montana DOT reported a growth rate of 2.6%. County Route 322 is classified as a local route. Table 1.110 summa-rizes the pavement structures. Cores and ground-penetrating radar indicated that the total asphalt thickness for the HMA was 0.5-in. (12.7-mm) thicker than the WMA section; the distribution of layer thicknesses varies as well.
Figure 1.79 shows a comparison of the predicted rutting for the WMA and HMA sections. The predicted total asphalt rutting after 20 years of service is practically identical for the WMA and HMA, at 0.13 in. (3.3 mm) and 0.14 in. (3.6 mm), respectively. The predicted rutting for the WMA layer is actu-ally slightly less than that for the HMA, at 0.02 in. (0.5 mm) versus 0.03 in. (0.8 mm), respectively.
Figure 1.80 compares the predicted longitudinal cracking over the design life of County Route 322. The MEPDG pre-dicts more cracking for the WMA compared to the HMA—1,030 ft/mi versus 822 ft/mi (195 m/km versus 156 m/km) at 20 years of service. This may be due in part to the difference in pavement thickness.
Level 1 thermal cracking analysis was performed for this project. Figure 1.81 shows a comparison of the predicted ther-mal cracking for the WMA and HMA. The HMA is predicted to exceed the 1,000 ft/mi (189m/km) threshold 1 year earlier than the WMA (at 67 months versus 78 months).
Munster, Indiana
A WMA trial project was constructed on Calumet Avenue in Munster, Indiana, in September 2010. The contractor was Walsh & Kelley, Inc., Griffith, Indiana. This project featured three different WMA technologies. The first WMA technol-ogy was the water foaming system manufactured by Gencor Industries, Inc., under the trade name Ultrafoam GX2™, also called The Green Machine. The second WMA technol-ogy was the chemical additive Evotherm 3G, developed by MeadWestvaco Asphalt Innovations. The third WMA tech-nology was a wax product made by the Heritage Environ-mental Services, LLC.
The HMA and all three WMA technologies were placed on Calumet Avenue from the intersection of Main Street heading northbound for approximately 1 mile. There are four main travel lanes on this portion of roadway. One lane was used for the HMA control mix, and each of the three remaining travel lanes was used for one of the trial mixes. The estimated two-way AADT for this 4-lane roadway was 37,986 vehicles with 7.1% trucks. The production of the HMA and Ultrafoam GX2 took place on September 14 and September 15, 2010, respectively, while the Evotherm 3G and Heritage wax were produced and placed on September 16, 2010.
Location and PropertyHMA
EvothermDAT
HMAEvotherm
DAT13-Month 22-Month
Between-wheelpaths density (% of Gmm) 93.5 93.5 93.1 92.5
Right wheelpath density (% of Gmm) 93.8 95.0 94.7 94.5
Between-wheelpaths tensile strength (psi) 60.1 53.9 75.7 69.8
Right wheelpath tensile strength (psi) 57.9 48.2 83.2 71.4
Table 1.109. In-place density and tensile strengths by location in Baker, Montana.
Layer WMA Thickness, in.
[cm] HMA Thickness, in. [cm]
(in.) (cm) (in.) (cm)
WMA/HMA surface course 1.8 4.6 1.6 4.1
Existing HMA - 12.5 NMAS with PG 64-28 2.2 5.6 1.8 4.6
Existing HMA - 12.5 NMAS with PG 64-28 1.9 4.8 1.7 4.3
Existing HMA - 12.5 NMAS with PG 64-28 NA 1.3 3.3
AASHTO A-4 subgrade Semi-infinite
Table 1.110. Pavement structures for County Route 322, Baker, Montana.
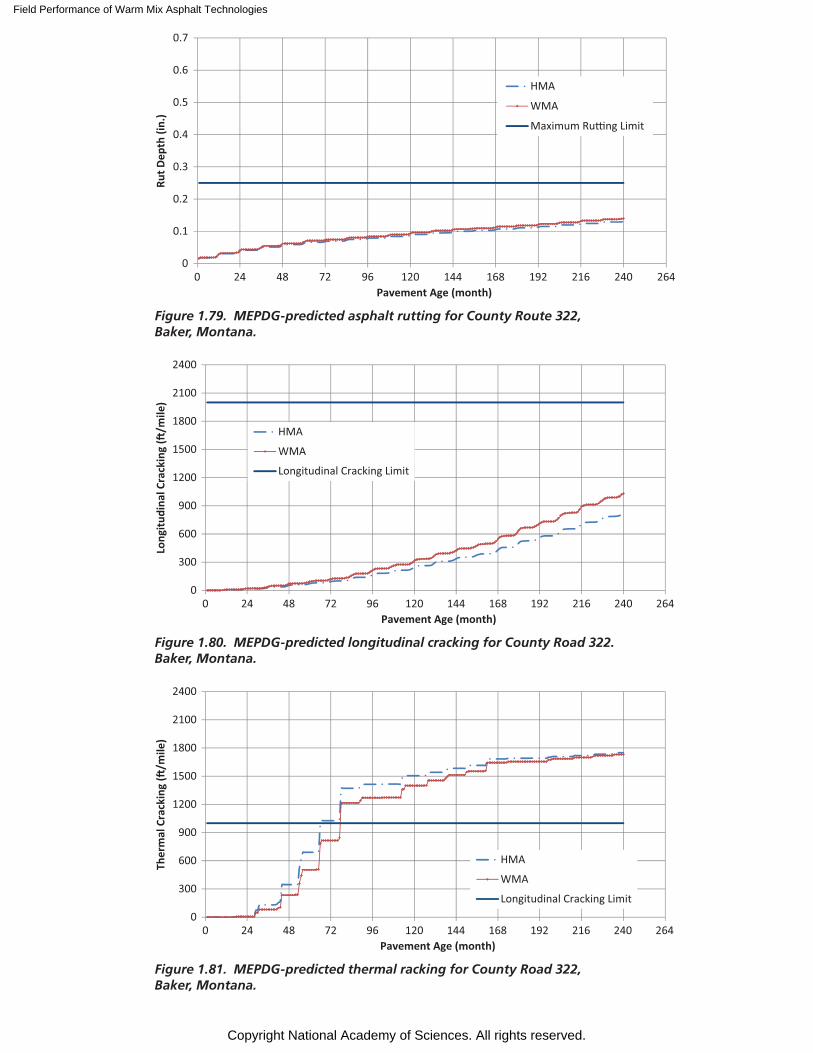
Field Performance of Warm Mix Asphalt Technologies
Copyright National Academy of Sciences. All rights reserved.
0
0.1
0.2
0.3
0.4
0.5
0.6
0.7
0 24 48 72 96 120 144 168 192 216 240 264
Rut D
epth
(in.
)
Pavement Age (month)
HMA
WMA
Maximum Ru�ng Limit
Figure 1.79. MEPDG-predicted asphalt rutting for County Route 322, Baker, Montana.
0
300
600
900
1200
1500
1800
2100
2400
0 24 48 72 96 120 144 168 192 216 240 264
Long
itudi
nal C
rack
ing
(�/m
ile)
Pavement Age (month)
HMA
WMA
Longitudinal Cracking Limit
Figure 1.80. MEPDG-predicted longitudinal cracking for County Road 322. Baker, Montana.
0
300
600
900
1200
1500
1800
2100
2400
0 24 48 72 96 120 144 168 192 216 240 264
Ther
mal
Cra
ckin
g (�
/mile
)
Pavement Age (month)
HMA
WMA
Longitudinal Cracking Limit
Figure 1.81. MEPDG-predicted thermal racking for County Road 322, Baker, Montana.
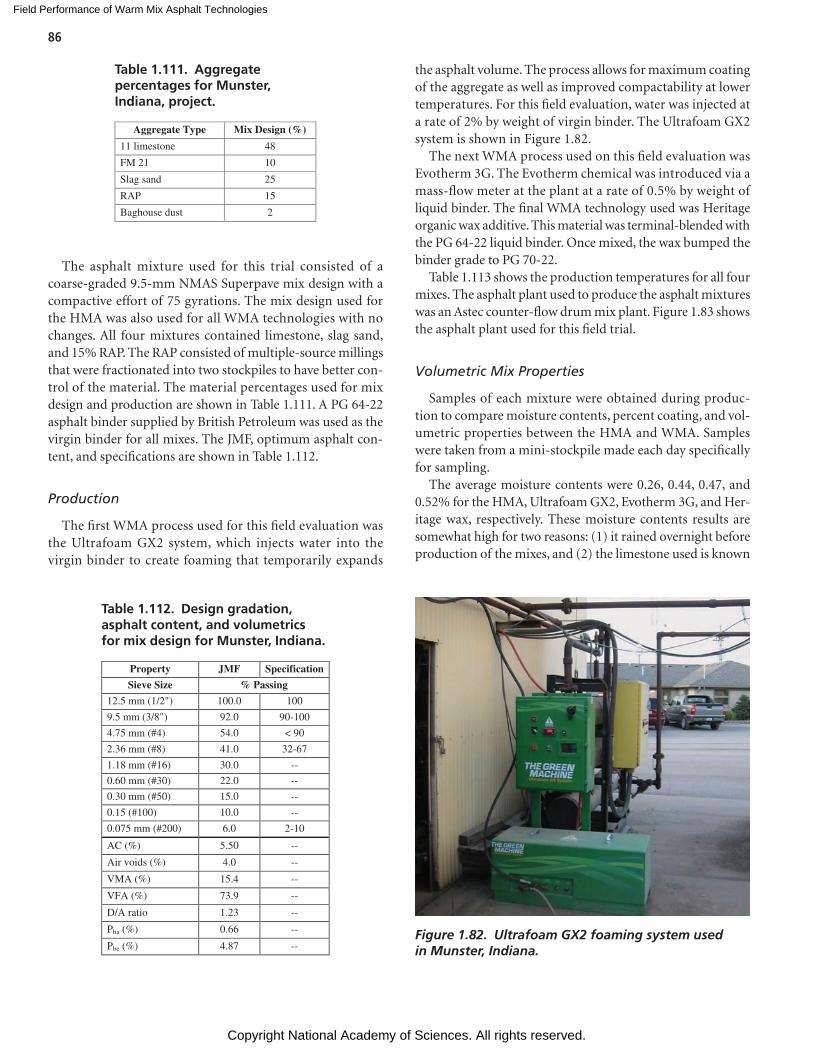
Field Performance of Warm Mix Asphalt Technologies
Copyright National Academy of Sciences. All rights reserved.
86
The asphalt mixture used for this trial consisted of a coarse-graded 9.5-mm NMAS Superpave mix design with a compactive effort of 75 gyrations. The mix design used for the HMA was also used for all WMA technologies with no changes. All four mixtures contained limestone, slag sand, and 15% RAP. The RAP consisted of multiple-source millings that were fractionated into two stockpiles to have better con-trol of the material. The material percentages used for mix design and production are shown in Table 1.111. A PG 64-22 asphalt binder supplied by British Petroleum was used as the virgin binder for all mixes. The JMF, optimum asphalt con-tent, and specifications are shown in Table 1.112.
Production
The first WMA process used for this field evaluation was the Ultrafoam GX2 system, which injects water into the virgin binder to create foaming that temporarily expands
the asphalt volume. The process allows for maximum coating of the aggregate as well as improved compactability at lower temperatures. For this field evaluation, water was injected at a rate of 2% by weight of virgin binder. The Ultrafoam GX2 system is shown in Figure 1.82.
The next WMA process used on this field evaluation was Evotherm 3G. The Evotherm chemical was introduced via a mass-flow meter at the plant at a rate of 0.5% by weight of liquid binder. The final WMA technology used was Heritage organic wax additive. This material was terminal-blended with the PG 64-22 liquid binder. Once mixed, the wax bumped the binder grade to PG 70-22.
Table 1.113 shows the production temperatures for all four mixes. The asphalt plant used to produce the asphalt mixtures was an Astec counter-flow drum mix plant. Figure 1.83 shows the asphalt plant used for this field trial.
Volumetric Mix Properties
Samples of each mixture were obtained during produc-tion to compare moisture contents, percent coating, and vol-umetric properties between the HMA and WMA. Samples were taken from a mini-stockpile made each day specifically for sampling.
The average moisture contents were 0.26, 0.44, 0.47, and 0.52% for the HMA, Ultrafoam GX2, Evotherm 3G, and Her-itage wax, respectively. These moisture contents results are somewhat high for two reasons: (1) it rained overnight before production of the mixes, and (2) the limestone used is known
Aggregate Type Mix Design (%)
11 limestone 48
FM 21 10
Slag sand 25
RAP 15
Baghouse dust 2
Table 1.111. Aggregate percentages for Munster, Indiana, project.
Property JMF Specification
Sieve Size % Passing
12.5 mm (1/2") 100.0 100
9.5 mm (3/8") 92.0 90-100
4.75 mm (#4) 54.0 < 90
2.36 mm (#8) 41.0 32-67
1.18 mm (#16) 30.0 --
0.60 mm (#30) 22.0 --
0.30 mm (#50) 15.0 --
0.15 (#100) 10.0 --
0.075 mm (#200) 6.0 2-10
AC (%) 5.50 --
Air voids (%) 4.0 --
VMA (%) 15.4 --
VFA (%) 73.9 --
D/A ratio 1.23 --
Pba (%) 0.66 --
Pbe (%) 4.87 --
Table 1.112. Design gradation, asphalt content, and volumetrics for mix design for Munster, Indiana.
Figure 1.82. Ultrafoam GX2 foaming system used in Munster, Indiana.
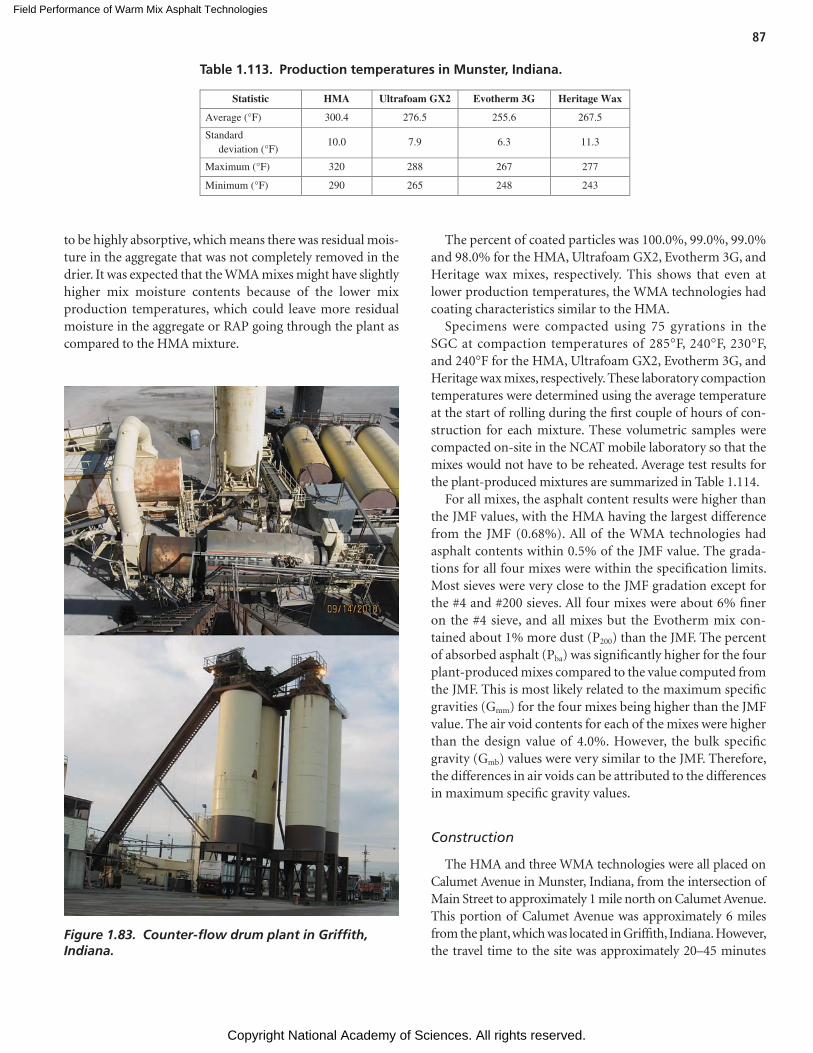
Field Performance of Warm Mix Asphalt Technologies
Copyright National Academy of Sciences. All rights reserved.
87
to be highly absorptive, which means there was residual mois-ture in the aggregate that was not completely removed in the drier. It was expected that the WMA mixes might have slightly higher mix moisture contents because of the lower mix production temperatures, which could leave more residual moisture in the aggregate or RAP going through the plant as compared to the HMA mixture.
The percent of coated particles was 100.0%, 99.0%, 99.0% and 98.0% for the HMA, Ultrafoam GX2, Evotherm 3G, and Heritage wax mixes, respectively. This shows that even at lower production temperatures, the WMA technologies had coating characteristics similar to the HMA.
Specimens were compacted using 75 gyrations in the SGC at compaction temperatures of 285°F, 240°F, 230°F, and 240°F for the HMA, Ultrafoam GX2, Evotherm 3G, and Heritage wax mixes, respectively. These laboratory compaction temperatures were determined using the average temperature at the start of rolling during the first couple of hours of con-struction for each mixture. These volumetric samples were compacted on-site in the NCAT mobile laboratory so that the mixes would not have to be reheated. Average test results for the plant-produced mixtures are summarized in Table 1.114.
For all mixes, the asphalt content results were higher than the JMF values, with the HMA having the largest difference from the JMF (0.68%). All of the WMA technologies had asphalt contents within 0.5% of the JMF value. The grada-tions for all four mixes were within the specification limits. Most sieves were very close to the JMF gradation except for the #4 and #200 sieves. All four mixes were about 6% finer on the #4 sieve, and all mixes but the Evotherm mix con-tained about 1% more dust (P200) than the JMF. The percent of absorbed asphalt (Pba) was significantly higher for the four plant-produced mixes compared to the value computed from the JMF. This is most likely related to the maximum specific gravities (Gmm) for the four mixes being higher than the JMF value. The air void contents for each of the mixes were higher than the design value of 4.0%. However, the bulk specific gravity (Gmb) values were very similar to the JMF. Therefore, the differences in air voids can be attributed to the differences in maximum specific gravity values.
Construction
The HMA and three WMA technologies were all placed on Calumet Avenue in Munster, Indiana, from the intersection of Main Street to approximately 1 mile north on Calumet Avenue. This portion of Calumet Avenue was approximately 6 miles from the plant, which was located in Griffith, Indiana. However, the travel time to the site was approximately 20–45 minutes
Statistic HMA Ultrafoam GX2 Evotherm 3G Heritage Wax
Average (°F) 300.4 276.5 255.6 267.5
Standard deviation (°F)
10.0 7.9 6.3 11.3
Maximum (°F) 320 288 267 277
Minimum (°F) 290 265 248 243
Table 1.113. Production temperatures in Munster, Indiana.
Figure 1.83. Counter-flow drum plant in Griffith, Indiana.
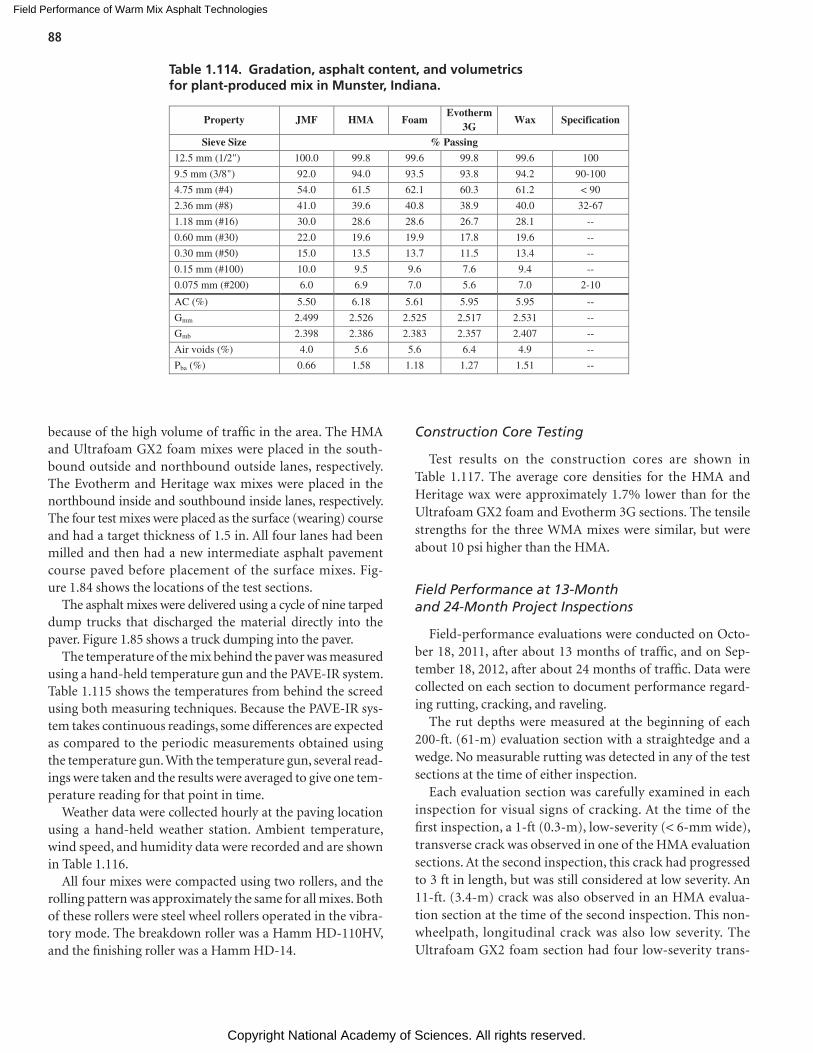
Field Performance of Warm Mix Asphalt Technologies
Copyright National Academy of Sciences. All rights reserved.
88
because of the high volume of traffic in the area. The HMA and Ultrafoam GX2 foam mixes were placed in the south-bound outside and northbound outside lanes, respectively. The Evotherm and Heritage wax mixes were placed in the northbound inside and southbound inside lanes, respectively. The four test mixes were placed as the surface (wearing) course and had a target thickness of 1.5 in. All four lanes had been milled and then had a new intermediate asphalt pavement course paved before placement of the surface mixes. Fig-ure 1.84 shows the locations of the test sections.
The asphalt mixes were delivered using a cycle of nine tarped dump trucks that discharged the material directly into the paver. Figure 1.85 shows a truck dumping into the paver.
The temperature of the mix behind the paver was measured using a hand-held temperature gun and the PAVE-IR system. Table 1.115 shows the temperatures from behind the screed using both measuring techniques. Because the PAVE-IR sys-tem takes continuous readings, some differences are expected as compared to the periodic measurements obtained using the temperature gun. With the temperature gun, several read-ings were taken and the results were averaged to give one tem-perature reading for that point in time.
Weather data were collected hourly at the paving location using a hand-held weather station. Ambient temperature, wind speed, and humidity data were recorded and are shown in Table 1.116.
All four mixes were compacted using two rollers, and the rolling pattern was approximately the same for all mixes. Both of these rollers were steel wheel rollers operated in the vibra-tory mode. The breakdown roller was a Hamm HD-110HV, and the finishing roller was a Hamm HD-14.
Construction Core Testing
Test results on the construction cores are shown in Table 1.117. The average core densities for the HMA and Heritage wax were approximately 1.7% lower than for the Ultrafoam GX2 foam and Evotherm 3G sections. The tensile strengths for the three WMA mixes were similar, but were about 10 psi higher than the HMA.
Field Performance at 13-Month and 24-Month Project Inspections
Field-performance evaluations were conducted on Octo-ber 18, 2011, after about 13 months of traffic, and on Sep-tember 18, 2012, after about 24 months of traffic. Data were collected on each section to document performance regard-ing rutting, cracking, and raveling.
The rut depths were measured at the beginning of each 200-ft. (61-m) evaluation section with a straightedge and a wedge. No measurable rutting was detected in any of the test sections at the time of either inspection.
Each evaluation section was carefully examined in each inspection for visual signs of cracking. At the time of the first inspection, a 1-ft (0.3-m), low-severity (< 6-mm wide), transverse crack was observed in one of the HMA evaluation sections. At the second inspection, this crack had progressed to 3 ft in length, but was still considered at low severity. An 11-ft. (3.4-m) crack was also observed in an HMA evalua-tion section at the time of the second inspection. This non-wheelpath, longitudinal crack was also low severity. The Ultrafoam GX2 foam section had four low-severity trans-
Property JMF HMA FoamEvotherm
3GWax Specification
Sieve Size % Passing
12.5 mm (1/2") 100.0 99.8 99.6 99.8 99.6 100
9.5 mm (3/8") 92.0 94.0 93.5 93.8 94.2 90-100
4.75 mm (#4) 54.0 61.5 62.1 60.3 61.2 < 90
2.36 mm (#8) 41.0 39.6 40.8 38.9 40.0 32-67
1.18 mm (#16) 30.0 28.6 28.6 26.7 28.1 --
0.60 mm (#30) 22.0 19.6 19.9 17.8 19.6 --
0.30 mm (#50) 15.0 13.5 13.7 11.5 13.4 --
0.15 mm (#100) 10.0 9.5 9.6 7.6 9.4 --
0.075 mm (#200) 6.0 6.9 7.0 5.6 7.0 2-10
AC (%) 5.50 6.18 5.61 5.95 5.95 --
Gmm 2.499 2.526 2.525 2.517 2.531 --
Gmb 2.398 2.386 2.383 2.357 2.407 --
Air voids (%) 4.0 5.6 5.6 6.4 4.9 --
Pba (%) 0.66 1.58 1.18 1.27 1.51 --
Table 1.114. Gradation, asphalt content, and volumetrics for plant-produced mix in Munster, Indiana.
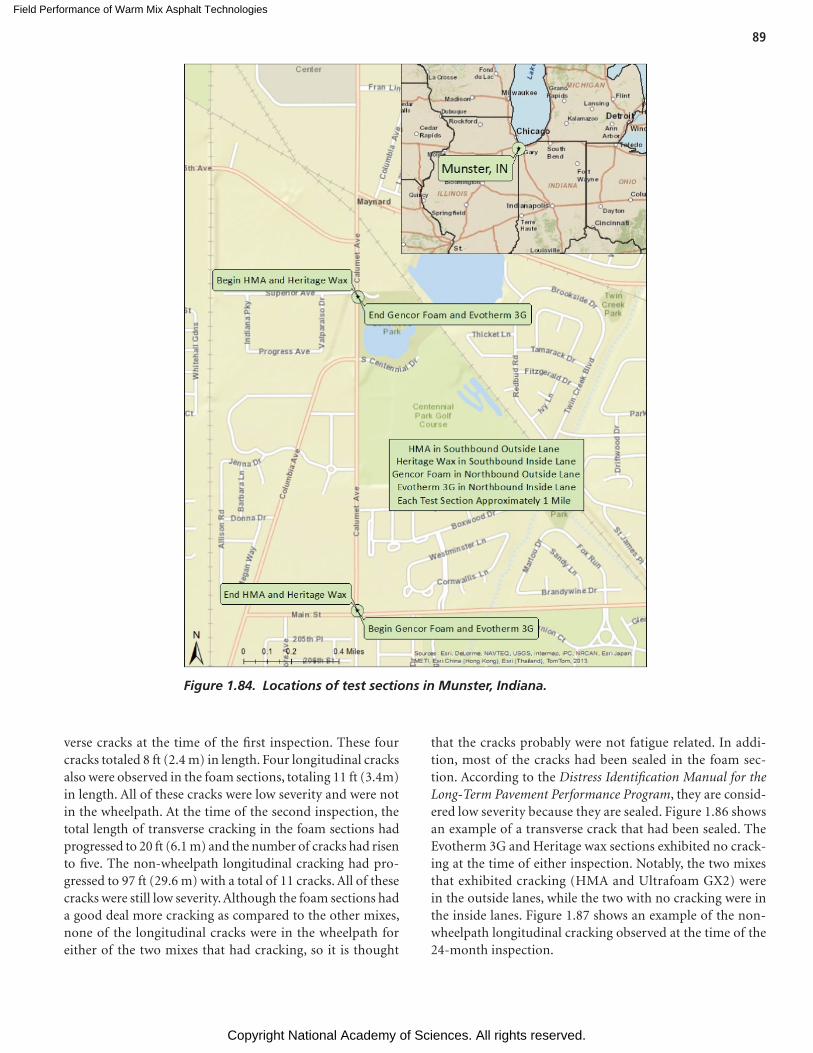
Field Performance of Warm Mix Asphalt Technologies
Copyright National Academy of Sciences. All rights reserved.
89
verse cracks at the time of the first inspection. These four cracks totaled 8 ft (2.4 m) in length. Four longitudinal cracks also were observed in the foam sections, totaling 11 ft (3.4m) in length. All of these cracks were low severity and were not in the wheelpath. At the time of the second inspection, the total length of transverse cracking in the foam sections had progressed to 20 ft (6.1 m) and the number of cracks had risen to five. The non-wheelpath longitudinal cracking had pro-gressed to 97 ft (29.6 m) with a total of 11 cracks. All of these cracks were still low severity. Although the foam sections had a good deal more cracking as compared to the other mixes, none of the longitudinal cracks were in the wheelpath for either of the two mixes that had cracking, so it is thought
that the cracks probably were not fatigue related. In addi-tion, most of the cracks had been sealed in the foam sec-tion. According to the Distress Identification Manual for the Long-Term Pavement Performance Program, they are consid-ered low severity because they are sealed. Figure 1.86 shows an example of a transverse crack that had been sealed. The Evotherm 3G and Heritage wax sections exhibited no crack-ing at the time of either inspection. Notably, the two mixes that exhibited cracking (HMA and Ultrafoam GX2) were in the outside lanes, while the two with no cracking were in the inside lanes. Figure 1.87 shows an example of the non-wheelpath longitudinal cracking observed at the time of the 24-month inspection.
Figure 1.84. Locations of test sections in Munster, Indiana.
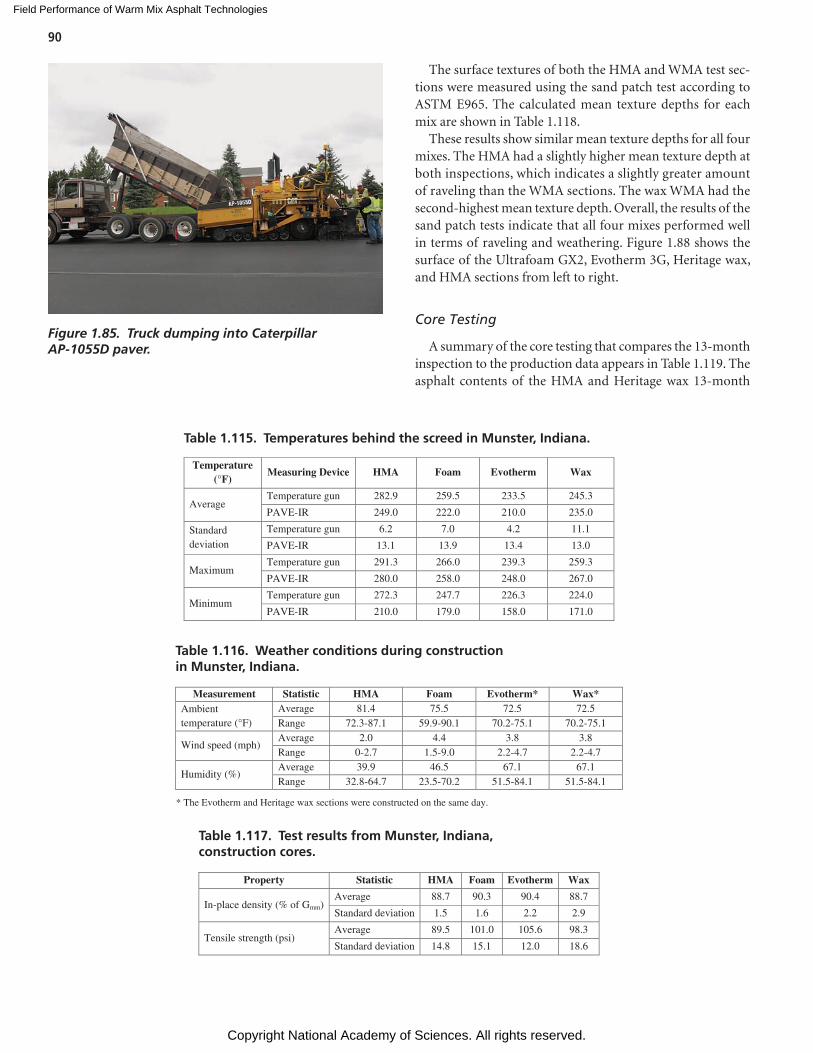
Field Performance of Warm Mix Asphalt Technologies
Copyright National Academy of Sciences. All rights reserved.
90
The surface textures of both the HMA and WMA test sec-tions were measured using the sand patch test according to ASTM E965. The calculated mean texture depths for each mix are shown in Table 1.118.
These results show similar mean texture depths for all four mixes. The HMA had a slightly higher mean texture depth at both inspections, which indicates a slightly greater amount of raveling than the WMA sections. The wax WMA had the second-highest mean texture depth. Overall, the results of the sand patch tests indicate that all four mixes performed well in terms of raveling and weathering. Figure 1.88 shows the surface of the Ultrafoam GX2, Evotherm 3G, Heritage wax, and HMA sections from left to right.
Core Testing
A summary of the core testing that compares the 13-month inspection to the production data appears in Table 1.119. The asphalt contents of the HMA and Heritage wax 13-month
Figure 1.85. Truck dumping into Caterpillar AP-1055D paver.
Temperature (°F)
Measuring Device HMA Foam Evotherm Wax
AverageTemperature gun 282.9 259.5 233.5 245.3
PAVE-IR 249.0 222.0 210.0 235.0
Standarddeviation
Temperature gun 6.2 7.0 4.2 11.1
PAVE-IR 13.1 13.9 13.4 13.0
MaximumTemperature gun 291.3 266.0 239.3 259.3
PAVE-IR 280.0 258.0 248.0 267.0
MinimumTemperature gun 272.3 247.7 226.3 224.0
PAVE-IR 210.0 179.0 158.0 171.0
Table 1.115. Temperatures behind the screed in Munster, Indiana.
Measurement Statistic HMA Foam Evotherm* Wax*Ambient temperature (°F)
Average 81.4 75.5 72.5 72.5Range 72.3-87.1 59.9-90.1 70.2-75.1 70.2-75.1
Wind speed (mph) Average 2.0 4.4 3.8 3.8 Range 0-2.7 1.5-9.0 2.2-4.7 2.2-4.7
Humidity (%)Average 39.9 46.5 67.1 67.1Range 32.8-64.7 23.5-70.2 51.5-84.1 51.5-84.1
* The Evotherm and Heritage wax sections were constructed on the same day.
Table 1.116. Weather conditions during construction in Munster, Indiana.
Property Statistic HMA Foam Evotherm Wax
In-place density (% of Gmm) Average 88.7 90.3 90.4 88.7
Standard deviation 1.5 1.6 2.2 2.9
Tensile strength (psi)Average 89.5 101.0 105.6 98.3
Standard deviation 14.8 15.1 12.0 18.6
Table 1.117. Test results from Munster, Indiana, construction cores.
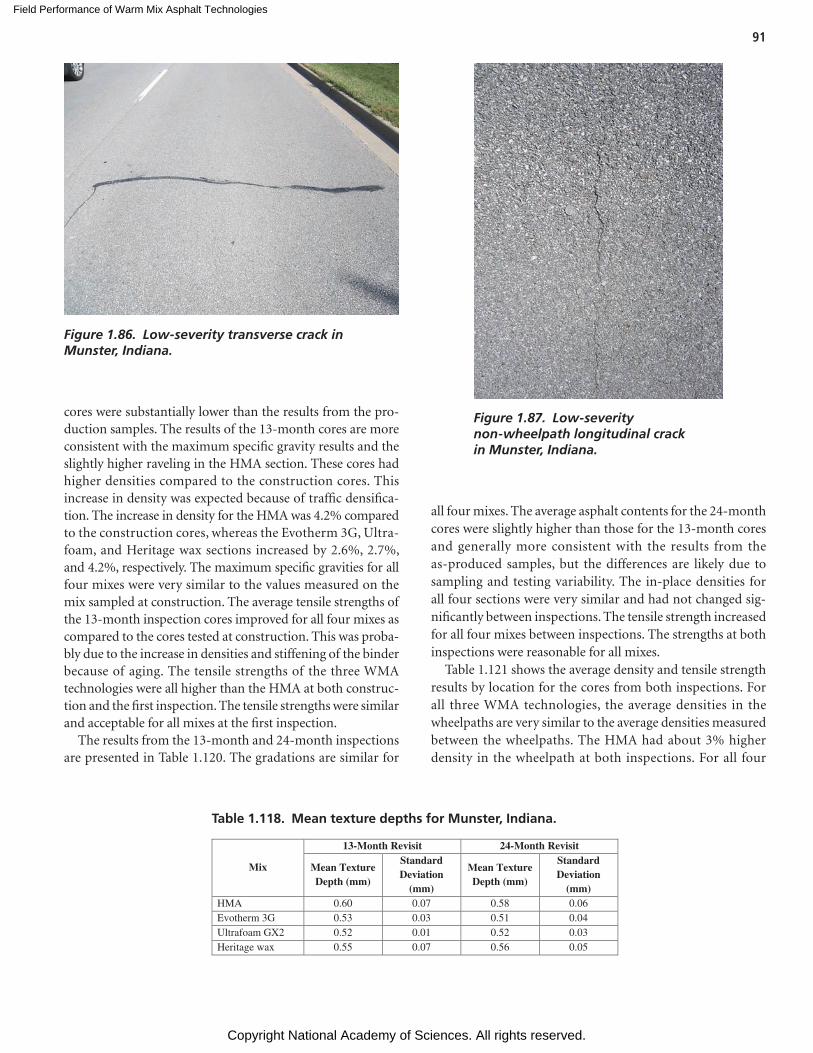
Field Performance of Warm Mix Asphalt Technologies
Copyright National Academy of Sciences. All rights reserved.
91
cores were substantially lower than the results from the pro-duction samples. The results of the 13-month cores are more consistent with the maximum specific gravity results and the slightly higher raveling in the HMA section. These cores had higher densities compared to the construction cores. This increase in density was expected because of traffic densifica-tion. The increase in density for the HMA was 4.2% compared to the construction cores, whereas the Evotherm 3G, Ultra-foam, and Heritage wax sections increased by 2.6%, 2.7%, and 4.2%, respectively. The maximum specific gravities for all four mixes were very similar to the values measured on the mix sampled at construction. The average tensile strengths of the 13-month inspection cores improved for all four mixes as compared to the cores tested at construction. This was proba-bly due to the increase in densities and stiffening of the binder because of aging. The tensile strengths of the three WMA technologies were all higher than the HMA at both construc-tion and the first inspection. The tensile strengths were similar and acceptable for all mixes at the first inspection.
The results from the 13-month and 24-month inspections are presented in Table 1.120. The gradations are similar for
all four mixes. The average asphalt contents for the 24-month cores were slightly higher than those for the 13-month cores and generally more consistent with the results from the as-produced samples, but the differences are likely due to sampling and testing variability. The in-place densities for all four sections were very similar and had not changed sig-nificantly between inspections. The tensile strength increased for all four mixes between inspections. The strengths at both inspections were reasonable for all mixes.
Table 1.121 shows the average density and tensile strength results by location for the cores from both inspections. For all three WMA technologies, the average densities in the wheelpaths are very similar to the average densities measured between the wheelpaths. The HMA had about 3% higher density in the wheelpath at both inspections. For all four
Mix
13-Month Revisit 24-Month Revisit
Mean Texture Depth (mm)
Standard Deviation
(mm)
Mean Texture Depth (mm)
Standard Deviation
(mm)HMA 0.60 0.07 0.58 0.06Evotherm 3G 0.53 0.03 0.51 0.04Ultrafoam GX2 0.52 0.01 0.52 0.03Heritage wax 0.55 0.07 0.56 0.05
Table 1.118. Mean texture depths for Munster, Indiana.
Figure 1.86. Low-severity transverse crack in Munster, Indiana.
Figure 1.87. Low-severity non-wheelpath longitudinal crack in Munster, Indiana.
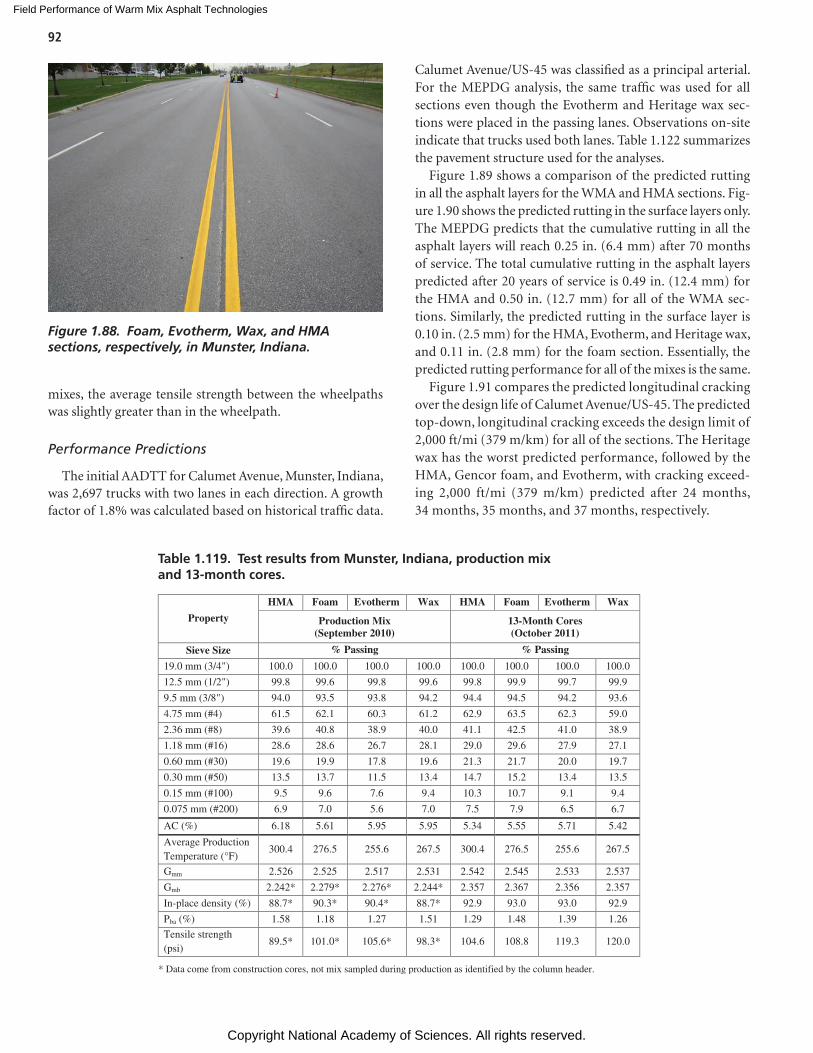
Field Performance of Warm Mix Asphalt Technologies
Copyright National Academy of Sciences. All rights reserved.
92
mixes, the average tensile strength between the wheelpaths was slightly greater than in the wheelpath.
Performance Predictions
The initial AADTT for Calumet Avenue, Munster, Indiana, was 2,697 trucks with two lanes in each direction. A growth factor of 1.8% was calculated based on historical traffic data.
Calumet Avenue/US-45 was classified as a principal arterial. For the MEPDG analysis, the same traffic was used for all sections even though the Evotherm and Heritage wax sec-tions were placed in the passing lanes. Observations on-site indicate that trucks used both lanes. Table 1.122 summarizes the pavement structure used for the analyses.
Figure 1.89 shows a comparison of the predicted rutting in all the asphalt layers for the WMA and HMA sections. Fig-ure 1.90 shows the predicted rutting in the surface layers only. The MEPDG predicts that the cumulative rutting in all the asphalt layers will reach 0.25 in. (6.4 mm) after 70 months of service. The total cumulative rutting in the asphalt layers predicted after 20 years of service is 0.49 in. (12.4 mm) for the HMA and 0.50 in. (12.7 mm) for all of the WMA sec-tions. Similarly, the predicted rutting in the surface layer is 0.10 in. (2.5 mm) for the HMA, Evotherm, and Heritage wax, and 0.11 in. (2.8 mm) for the foam section. Essentially, the predicted rutting performance for all of the mixes is the same.
Figure 1.91 compares the predicted longitudinal cracking over the design life of Calumet Avenue/US-45. The predicted top-down, longitudinal cracking exceeds the design limit of 2,000 ft/mi (379 m/km) for all of the sections. The Heritage wax has the worst predicted performance, followed by the HMA, Gencor foam, and Evotherm, with cracking exceed-ing 2,000 ft/mi (379 m/km) predicted after 24 months, 34 months, 35 months, and 37 months, respectively.
Figure 1.88. Foam, Evotherm, Wax, and HMA sections, respectively, in Munster, Indiana.
Property
HMA Foam Evotherm Wax HMA Foam Evotherm Wax
Production Mix (September 2010)
13-Month Cores(October 2011)
Sieve Size % Passing % Passing
19.0 mm (3/4") 100.0 100.0 100.0 100.0 100.0 100.0 100.0 100.0
12.5 mm (1/2") 99.8 99.6 99.8 99.6 99.8 99.9 99.7 99.9
9.5 mm (3/8") 94.0 93.5 93.8 94.2 94.4 94.5 94.2 93.6
4.75 mm (#4) 61.5 62.1 60.3 61.2 62.9 63.5 62.3 59.0
2.36 mm (#8) 39.6 40.8 38.9 40.0 41.1 42.5 41.0 38.9
1.18 mm (#16) 28.6 28.6 26.7 28.1 29.0 29.6 27.9 27.1
0.60 mm (#30) 19.6 19.9 17.8 19.6 21.3 21.7 20.0 19.7
0.30 mm (#50) 13.5 13.7 11.5 13.4 14.7 15.2 13.4 13.5
0.15 mm (#100) 9.5 9.6 7.6 9.4 10.3 10.7 9.1 9.4
0.075 mm (#200) 6.9 7.0 5.6 7.0 7.5 7.9 6.5 6.7
AC (%) 6.18 5.61 5.95 5.95 5.34 5.55 5.71 5.42
Average Production Temperature (°F)
300.4 276.5 255.6 267.5 300.4 276.5 255.6 267.5
Gmm 2.526 2.525 2.517 2.531 2.542 2.545 2.533 2.537
Gmb 2.242* 2.279* 2.276* 2.244* 2.357 2.367 2.356 2.357
In-place density (%) 88.7* 90.3* 90.4* 88.7* 92.9 93.0 93.0 92.9
Pba (%) 1.58 1.18 1.27 1.51 1.29 1.48 1.39 1.26
Tensile strength (psi)
89.5* 101.0* 105.6* 98.3* 104.6 108.8 119.3 120.0
* Data come from construction cores, not mix sampled during production as identified by the column header.
Table 1.119. Test results from Munster, Indiana, production mix and 13-month cores.
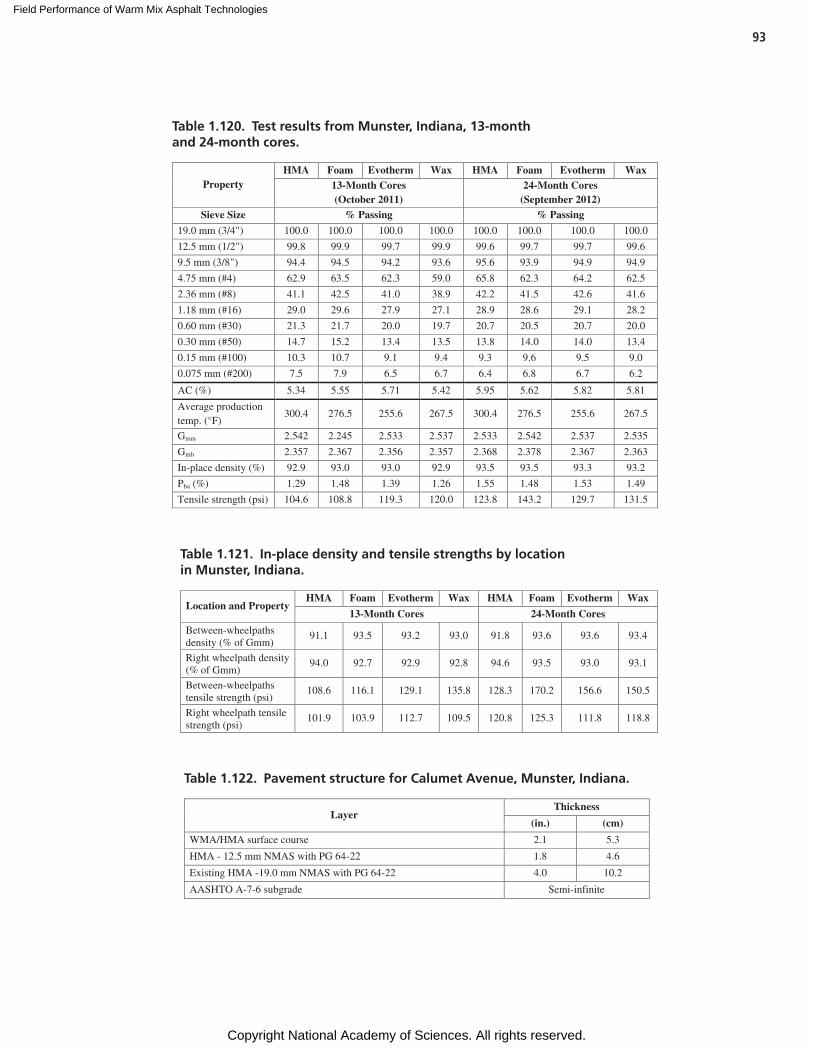
Field Performance of Warm Mix Asphalt Technologies
Copyright National Academy of Sciences. All rights reserved.
93
PropertyHMA Foam Evotherm Wax HMA Foam Evotherm Wax
13-Month Cores(October 2011)
24-Month Cores(September 2012)
Sieve Size % Passing % Passing
19.0 mm (3/4") 100.0 100.0 100.0 100.0 100.0 100.0 100.0 100.0
12.5 mm (1/2") 99.8 99.9 99.7 99.9 99.6 99.7 99.7 99.6
9.5 mm (3/8") 94.4 94.5 94.2 93.6 95.6 93.9 94.9 94.9
4.75 mm (#4) 62.9 63.5 62.3 59.0 65.8 62.3 64.2 62.5
2.36 mm (#8) 41.1 42.5 41.0 38.9 42.2 41.5 42.6 41.6
1.18 mm (#16) 29.0 29.6 27.9 27.1 28.9 28.6 29.1 28.2
0.60 mm (#30) 21.3 21.7 20.0 19.7 20.7 20.5 20.7 20.0
0.30 mm (#50) 14.7 15.2 13.4 13.5 13.8 14.0 14.0 13.4
0.15 mm (#100) 10.3 10.7 9.1 9.4 9.3 9.6 9.5 9.0
0.075 mm (#200) 7.5 7.9 6.5 6.7 6.4 6.8 6.7 6.2
AC (%) 5.34 5.55 5.71 5.42 5.95 5.62 5.82 5.81
Average production temp. (°F)
300.4 276.5 255.6 267.5 300.4 276.5 255.6 267.5
Gmm 2.542 2.245 2.533 2.537 2.533 2.542 2.537 2.535
Gmb 2.357 2.367 2.356 2.357 2.368 2.378 2.367 2.363
In-place density (%) 92.9 93.0 93.0 92.9 93.5 93.5 93.3 93.2
Pba (%) 1.29 1.48 1.39 1.26 1.55 1.48 1.53 1.49
Tensile strength (psi) 104.6 108.8 119.3 120.0 123.8 143.2 129.7 131.5
Table 1.120. Test results from Munster, Indiana, 13-month and 24-month cores.
Location and PropertyHMA Foam Evotherm Wax HMA Foam Evotherm Wax
13-Month Cores 24-Month Cores
Between-wheelpaths density (% of Gmm)
91.1 93.5 93.2 93.0 91.8 93.6 93.6 93.4
Right wheelpath density (% of Gmm)
94.0 92.7 92.9 92.8 94.6 93.5 93.0 93.1
Between-wheelpaths tensile strength (psi)
108.6 116.1 129.1 135.8 128.3 170.2 156.6 150.5
Right wheelpath tensile strength (psi)
101.9 103.9 112.7 109.5 120.8 125.3 111.8 118.8
Table 1.121. In-place density and tensile strengths by location in Munster, Indiana.
Layer Thickness
(in.) (cm)
WMA/HMA surface course 2.1 5.3
HMA - 12.5 mm NMAS with PG 64-22 1.8 4.6
Existing HMA -19.0 mm NMAS with PG 64-22 4.0 10.2
AASHTO A-7-6 subgrade Semi-infinite
Table 1.122. Pavement structure for Calumet Avenue, Munster, Indiana.
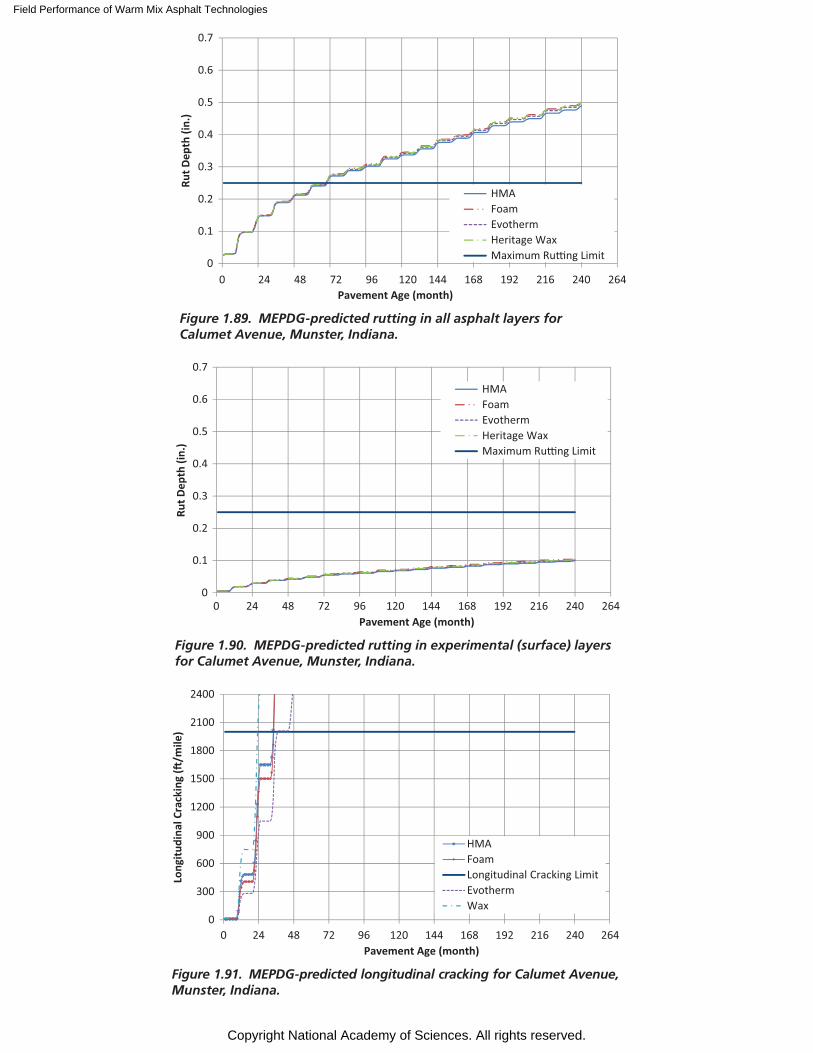
Field Performance of Warm Mix Asphalt Technologies
Copyright National Academy of Sciences. All rights reserved.
0
0.1
0.2
0.3
0.4
0.5
0.6
0.7
0 24 48 72 96 120 144 168 192 216 240 264
Rut D
epth
(in.
)
Pavement Age (month)
HMAFoamEvothermHeritage WaxMaximum Ru�ng Limit
Figure 1.89. MEPDG-predicted rutting in all asphalt layers for Calumet Avenue, Munster, Indiana.
0
0.1
0.2
0.3
0.4
0.5
0.6
0.7
0 24 48 72 96 120 144 168 192 216 240 264
Rut D
epth
(in.
)
Pavement Age (month)
HMAFoamEvothermHeritage WaxMaximum Ru�ng Limit
Figure 1.90. MEPDG-predicted rutting in experimental (surface) layers for Calumet Avenue, Munster, Indiana.
0
300
600
900
1200
1500
1800
2100
2400
0 24 48 72 96 120 144 168 192 216 240 264
Long
itudi
nal C
rack
ing
(�/m
ile)
Pavement Age (month)
HMAFoamLongitudinal Cracking LimitEvothermWax
Figure 1.91. MEPDG-predicted longitudinal cracking for Calumet Avenue, Munster, Indiana.
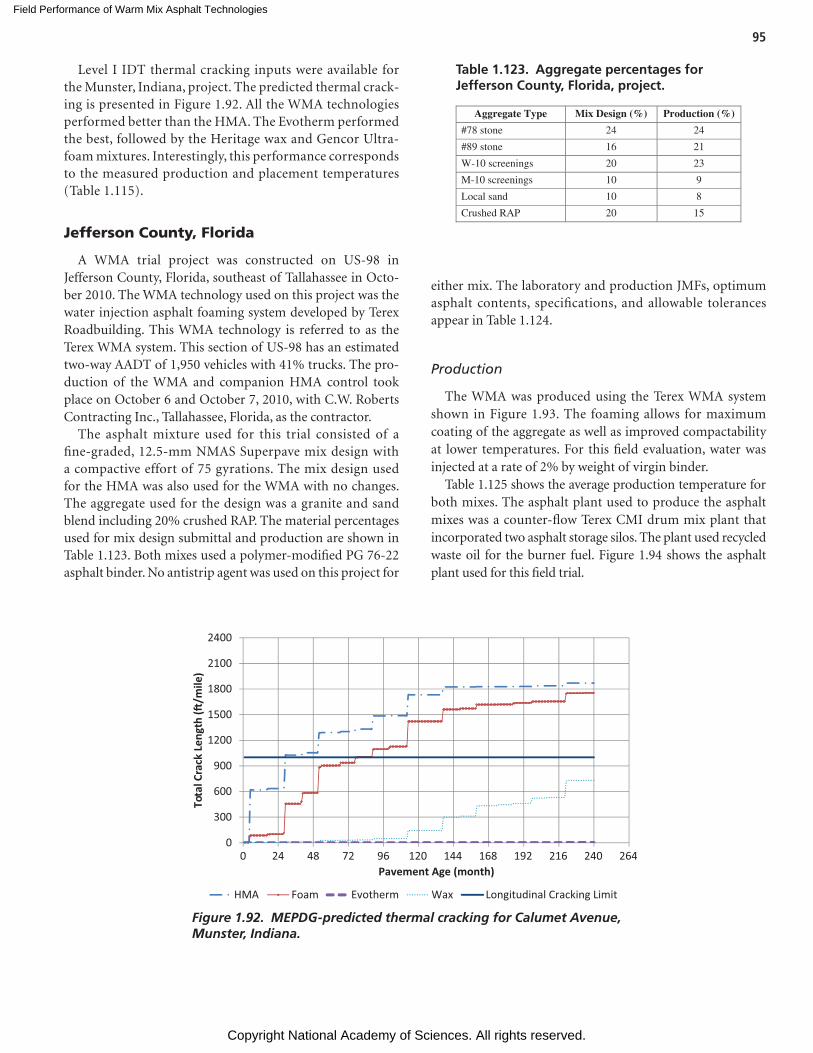
Field Performance of Warm Mix Asphalt Technologies
Copyright National Academy of Sciences. All rights reserved.
95
Level I IDT thermal cracking inputs were available for the Munster, Indiana, project. The predicted thermal crack-ing is presented in Figure 1.92. All the WMA technologies performed better than the HMA. The Evotherm performed the best, followed by the Heritage wax and Gencor Ultra-foam mixtures. Interestingly, this performance corresponds to the measured production and placement temperatures (Table 1.115).
Jefferson County, Florida
A WMA trial project was constructed on US-98 in Jefferson County, Florida, southeast of Tallahassee in Octo-ber 2010. The WMA technology used on this project was the water injection asphalt foaming system developed by Terex Roadbuilding. This WMA technology is referred to as the Terex WMA system. This section of US-98 has an estimated two-way AADT of 1,950 vehicles with 41% trucks. The pro-duction of the WMA and companion HMA control took place on October 6 and October 7, 2010, with C.W. Roberts Contracting Inc., Tallahassee, Florida, as the contractor.
The asphalt mixture used for this trial consisted of a fine-graded, 12.5-mm NMAS Superpave mix design with a compactive effort of 75 gyrations. The mix design used for the HMA was also used for the WMA with no changes. The aggregate used for the design was a granite and sand blend including 20% crushed RAP. The material percentages used for mix design submittal and production are shown in Table 1.123. Both mixes used a polymer-modified PG 76-22 asphalt binder. No antistrip agent was used on this project for
either mix. The laboratory and production JMFs, optimum asphalt contents, specifications, and allowable tolerances appear in Table 1.124.
Production
The WMA was produced using the Terex WMA system shown in Figure 1.93. The foaming allows for maximum coating of the aggregate as well as improved compactability at lower temperatures. For this field evaluation, water was injected at a rate of 2% by weight of virgin binder.
Table 1.125 shows the average production temperature for both mixes. The asphalt plant used to produce the asphalt mixes was a counter-flow Terex CMI drum mix plant that incorporated two asphalt storage silos. The plant used recycled waste oil for the burner fuel. Figure 1.94 shows the asphalt plant used for this field trial.
0 24 48 72 96 120 144 168 192 216 240 2640
300
600
900
1200
1500
1800
2100
2400
Tota
lCra
ckLe
ngth
(�/m
ile)
Pavement Age (month)
HMA Foam Evotherm Wax Longitudinal Cracking Limit
Figure 1.92. MEPDG-predicted thermal cracking for Calumet Avenue, Munster, Indiana.
Aggregate Type Mix Design (%) Production (%)
#78 stone 24 24
#89 stone 16 21
W-10 screenings 20 23
M-10 screenings 10 9
Local sand 10 8
Crushed RAP 20 15
Table 1.123. Aggregate percentages for Jefferson County, Florida, project.
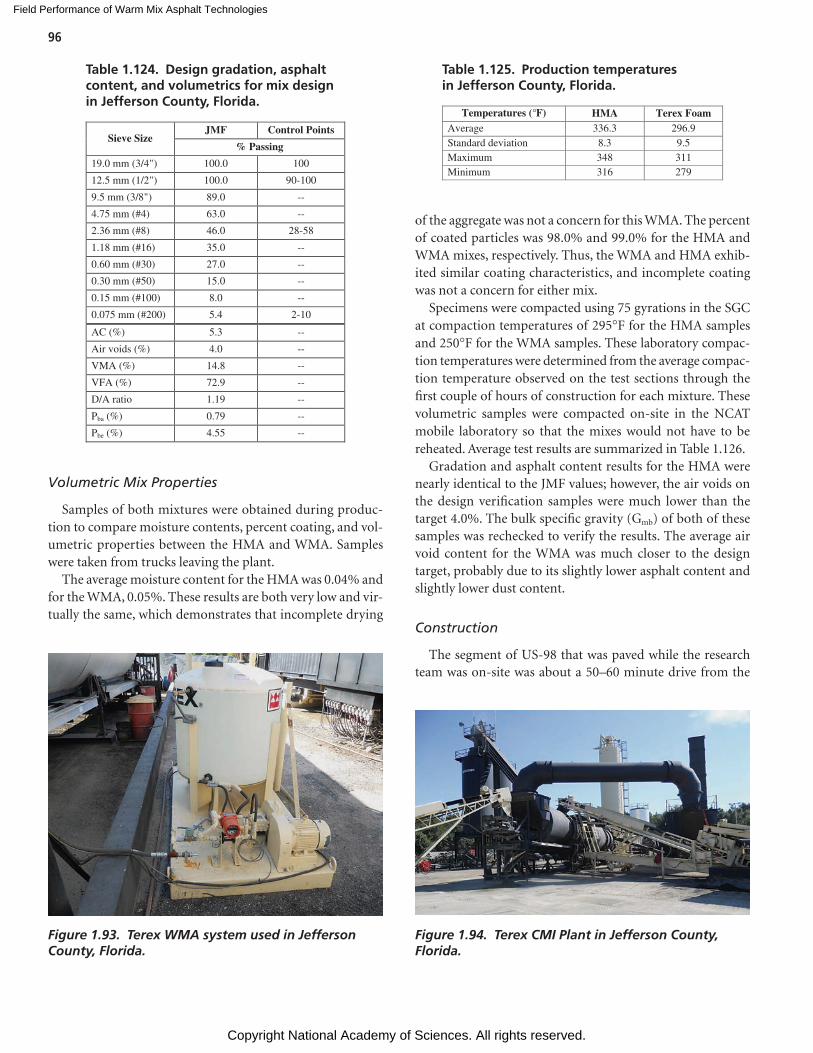
Field Performance of Warm Mix Asphalt Technologies
Copyright National Academy of Sciences. All rights reserved.
96
Volumetric Mix Properties
Samples of both mixtures were obtained during produc-tion to compare moisture contents, percent coating, and vol-umetric properties between the HMA and WMA. Samples were taken from trucks leaving the plant.
The average moisture content for the HMA was 0.04% and for the WMA, 0.05%. These results are both very low and vir-tually the same, which demonstrates that incomplete drying
of the aggregate was not a concern for this WMA. The percent of coated particles was 98.0% and 99.0% for the HMA and WMA mixes, respectively. Thus, the WMA and HMA exhib-ited similar coating characteristics, and incomplete coating was not a concern for either mix.
Specimens were compacted using 75 gyrations in the SGC at compaction temperatures of 295°F for the HMA samples and 250°F for the WMA samples. These laboratory compac-tion temperatures were determined from the average compac-tion temperature observed on the test sections through the first couple of hours of construction for each mixture. These volumetric samples were compacted on-site in the NCAT mobile laboratory so that the mixes would not have to be reheated. Average test results are summarized in Table 1.126.
Gradation and asphalt content results for the HMA were nearly identical to the JMF values; however, the air voids on the design verification samples were much lower than the target 4.0%. The bulk specific gravity (Gmb) of both of these samples was rechecked to verify the results. The average air void content for the WMA was much closer to the design target, probably due to its slightly lower asphalt content and slightly lower dust content.
Construction
The segment of US-98 that was paved while the research team was on-site was about a 50–60 minute drive from the
Sieve SizeJMF Control Points
% Passing
19.0 mm (3/4") 100.0 100
12.5 mm (1/2") 100.0 90-100
9.5 mm (3/8") 89.0 --
4.75 mm (#4) 63.0 --
2.36 mm (#8) 46.0 28-58
1.18 mm (#16) 35.0 --
0.60 mm (#30) 27.0 --
0.30 mm (#50) 15.0 --
0.15 mm (#100) 8.0 --
0.075 mm (#200) 5.4 2-10
AC (%) 5.3 --
Air voids (%) 4.0 --
VMA (%) 14.8 --
VFA (%) 72.9 --
D/A ratio 1.19 --
Pba (%) 0.79 --
Pbe (%) 4.55 --
Table 1.124. Design gradation, asphalt content, and volumetrics for mix design in Jefferson County, Florida.
Figure 1.93. Terex WMA system used in Jefferson County, Florida.
Temperatures (°F) HMA Terex FoamAverage 336.3 296.9Standard deviation 8.3 9.5 Maximum 348 311Minimum 316 279
Table 1.125. Production temperatures in Jefferson County, Florida.
Figure 1.94. Terex CMI Plant in Jefferson County, Florida.
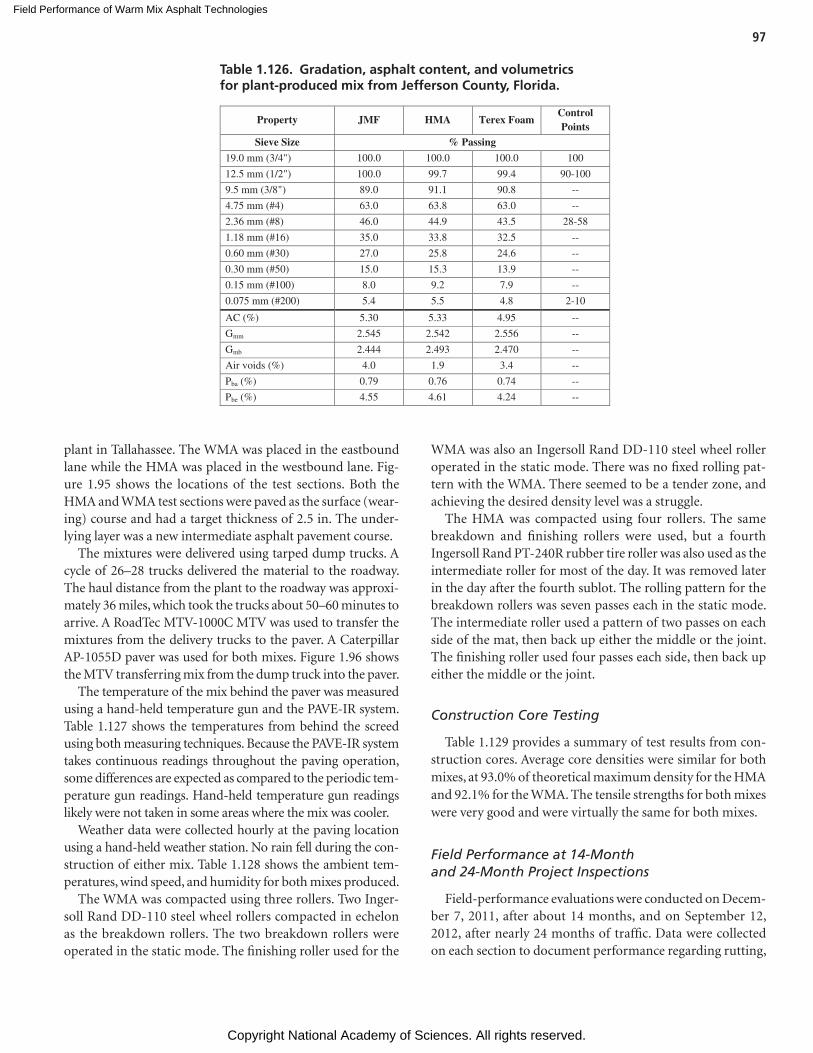
Field Performance of Warm Mix Asphalt Technologies
Copyright National Academy of Sciences. All rights reserved.
97
plant in Tallahassee. The WMA was placed in the eastbound lane while the HMA was placed in the westbound lane. Fig-ure 1.95 shows the locations of the test sections. Both the HMA and WMA test sections were paved as the surface (wear-ing) course and had a target thickness of 2.5 in. The under-lying layer was a new intermediate asphalt pavement course.
The mixtures were delivered using tarped dump trucks. A cycle of 26–28 trucks delivered the material to the roadway. The haul distance from the plant to the roadway was approxi-mately 36 miles, which took the trucks about 50–60 minutes to arrive. A RoadTec MTV-1000C MTV was used to transfer the mixtures from the delivery trucks to the paver. A Caterpillar AP-1055D paver was used for both mixes. Figure 1.96 shows the MTV transferring mix from the dump truck into the paver.
The temperature of the mix behind the paver was measured using a hand-held temperature gun and the PAVE-IR system. Table 1.127 shows the temperatures from behind the screed using both measuring techniques. Because the PAVE-IR system takes continuous readings throughout the paving operation, some differences are expected as compared to the periodic tem-perature gun readings. Hand-held temperature gun readings likely were not taken in some areas where the mix was cooler.
Weather data were collected hourly at the paving location using a hand-held weather station. No rain fell during the con-struction of either mix. Table 1.128 shows the ambient tem-peratures, wind speed, and humidity for both mixes produced.
The WMA was compacted using three rollers. Two Inger-soll Rand DD-110 steel wheel rollers compacted in echelon as the breakdown rollers. The two breakdown rollers were operated in the static mode. The finishing roller used for the
WMA was also an Ingersoll Rand DD-110 steel wheel roller operated in the static mode. There was no fixed rolling pat-tern with the WMA. There seemed to be a tender zone, and achieving the desired density level was a struggle.
The HMA was compacted using four rollers. The same breakdown and finishing rollers were used, but a fourth Ingersoll Rand PT-240R rubber tire roller was also used as the intermediate roller for most of the day. It was removed later in the day after the fourth sublot. The rolling pattern for the breakdown rollers was seven passes each in the static mode. The intermediate roller used a pattern of two passes on each side of the mat, then back up either the middle or the joint. The finishing roller used four passes each side, then back up either the middle or the joint.
Construction Core Testing
Table 1.129 provides a summary of test results from con-struction cores. Average core densities were similar for both mixes, at 93.0% of theoretical maximum density for the HMA and 92.1% for the WMA. The tensile strengths for both mixes were very good and were virtually the same for both mixes.
Field Performance at 14-Month and 24-Month Project Inspections
Field-performance evaluations were conducted on Decem-ber 7, 2011, after about 14 months, and on September 12, 2012, after nearly 24 months of traffic. Data were collected on each section to document performance regarding rutting,
Property JMF HMA Terex FoamControl Points
Sieve Size % Passing
19.0 mm (3/4") 100.0 100.0 100.0 100
12.5 mm (1/2") 100.0 99.7 99.4 90-100
9.5 mm (3/8") 89.0 91.1 90.8 --
4.75 mm (#4) 63.0 63.8 63.0 --
2.36 mm (#8) 46.0 44.9 43.5 28-58
1.18 mm (#16) 35.0 33.8 32.5 --
0.60 mm (#30) 27.0 25.8 24.6 --
0.30 mm (#50) 15.0 15.3 13.9 --
0.15 mm (#100) 8.0 9.2 7.9 --
0.075 mm (#200) 5.4 5.5 4.8 2-10
AC (%) 5.30 5.33 4.95 --
Gmm 2.545 2.542 2.556 --
Gmb 2.444 2.493 2.470 --
Air voids (%) 4.0 1.9 3.4 --
Pba (%) 0.79 0.76 0.74 --
Pbe (%) 4.55 4.61 4.24 --
Table 1.126. Gradation, asphalt content, and volumetrics for plant-produced mix from Jefferson County, Florida.
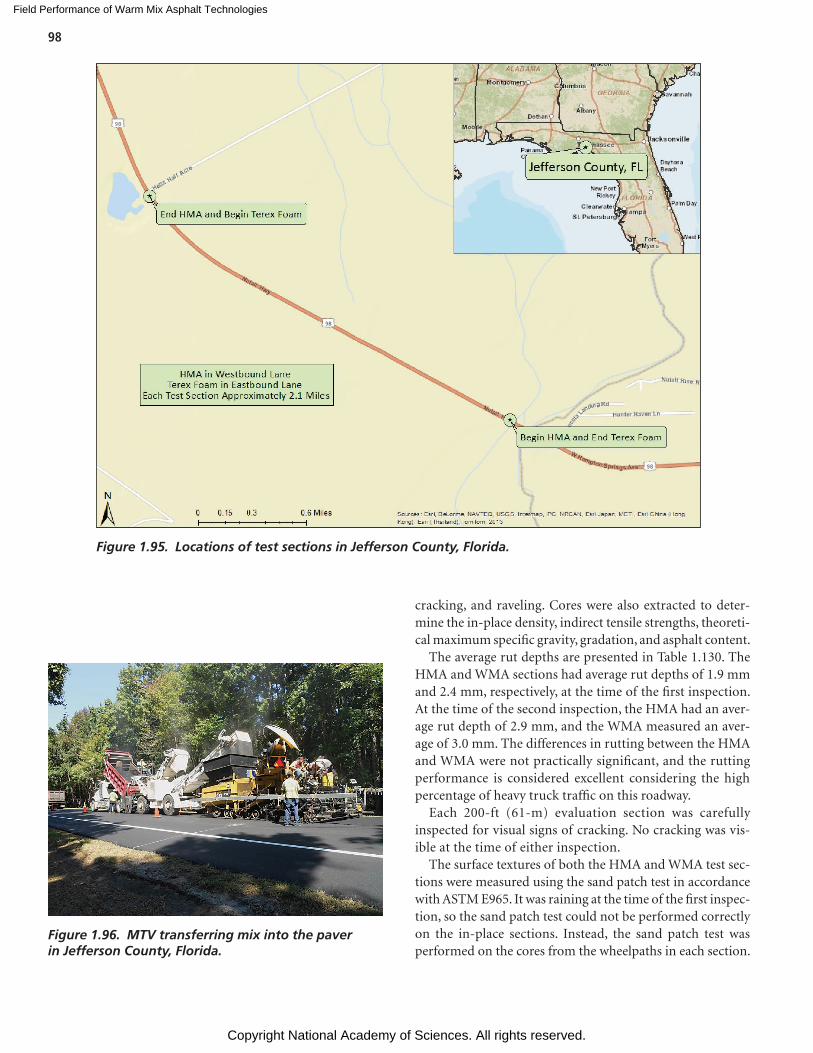
Field Performance of Warm Mix Asphalt Technologies
Copyright National Academy of Sciences. All rights reserved.
98
cracking, and raveling. Cores were also extracted to deter-mine the in-place density, indirect tensile strengths, theoreti-cal maximum specific gravity, gradation, and asphalt content.
The average rut depths are presented in Table 1.130. The HMA and WMA sections had average rut depths of 1.9 mm and 2.4 mm, respectively, at the time of the first inspection. At the time of the second inspection, the HMA had an aver-age rut depth of 2.9 mm, and the WMA measured an aver-age of 3.0 mm. The differences in rutting between the HMA and WMA were not practically significant, and the rutting performance is considered excellent considering the high percentage of heavy truck traffic on this roadway.
Each 200-ft (61-m) evaluation section was carefully inspected for visual signs of cracking. No cracking was vis-ible at the time of either inspection.
The surface textures of both the HMA and WMA test sec-tions were measured using the sand patch test in accordance with ASTM E965. It was raining at the time of the first inspec-tion, so the sand patch test could not be performed correctly on the in-place sections. Instead, the sand patch test was performed on the cores from the wheelpaths in each section.
Figure 1.95. Locations of test sections in Jefferson County, Florida.
Figure 1.96. MTV transferring mix into the paver in Jefferson County, Florida.
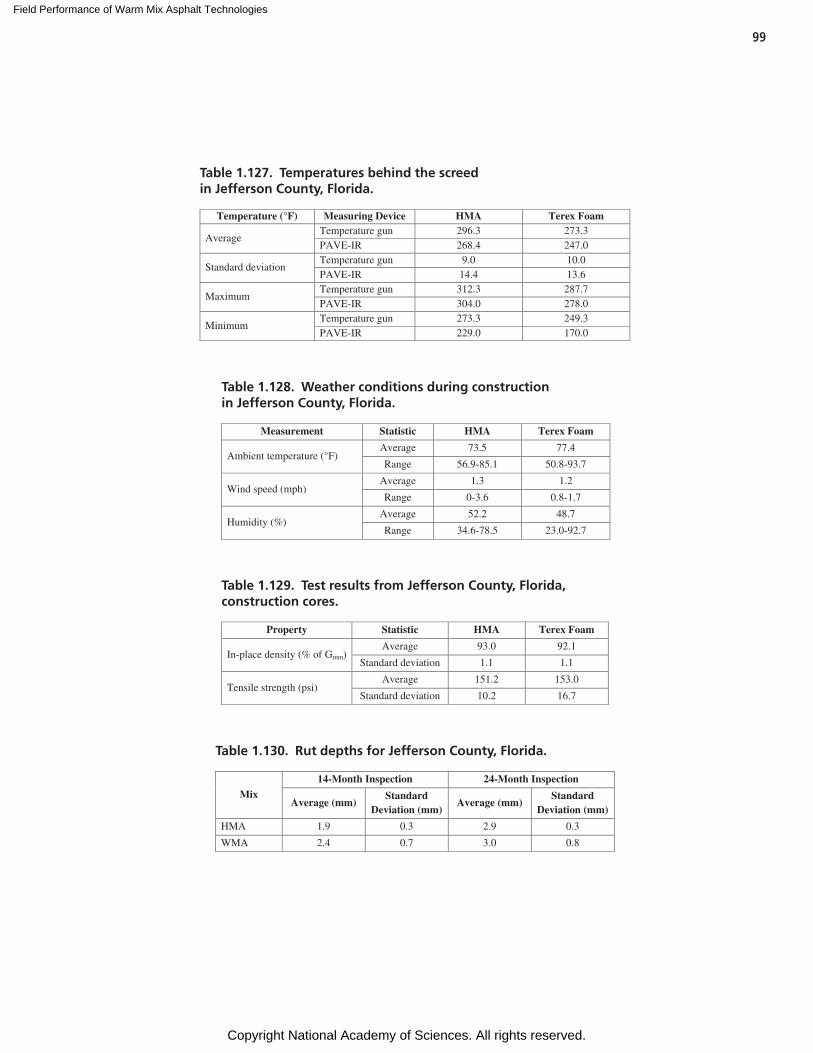
Field Performance of Warm Mix Asphalt Technologies
Copyright National Academy of Sciences. All rights reserved.
99
Temperature (°F) Measuring Device HMA Terex Foam
AverageTemperature gun 296.3 273.3PAVE-IR 268.4 247.0
Standard deviationTemperature gun 9.0 10.0PAVE-IR 14.4 13.6
MaximumTemperature gun 312.3 287.7PAVE-IR 304.0 278.0
MinimumTemperature gun 273.3 249.3PAVE-IR 229.0 170.0
Table 1.127. Temperatures behind the screed in Jefferson County, Florida.
Measurement Statistic HMA Terex Foam
Ambient temperature (°F)Average 73.5 77.4
Range 56.9-85.1 50.8-93.7
Wind speed (mph) Average 1.3 1.2
Range 0-3.6 0.8-1.7
Humidity (%)Average 52.2 48.7
Range 34.6-78.5 23.0-92.7
Table 1.128. Weather conditions during construction in Jefferson County, Florida.
Property Statistic HMA Terex Foam
In-place density (% of Gmm) Average 93.0 92.1
Standard deviation 1.1 1.1
Tensile strength (psi) Average 151.2 153.0
Standard deviation 10.2 16.7
Table 1.129. Test results from Jefferson County, Florida, construction cores.
Mix
14-Month Inspection 24-Month Inspection
Average (mm)Standard
Deviation (mm)Average (mm)
StandardDeviation (mm)
HMA 1.9 0.3 2.9 0.3
WMA 2.4 0.7 3.0 0.8
Table 1.130. Rut depths for Jefferson County, Florida.
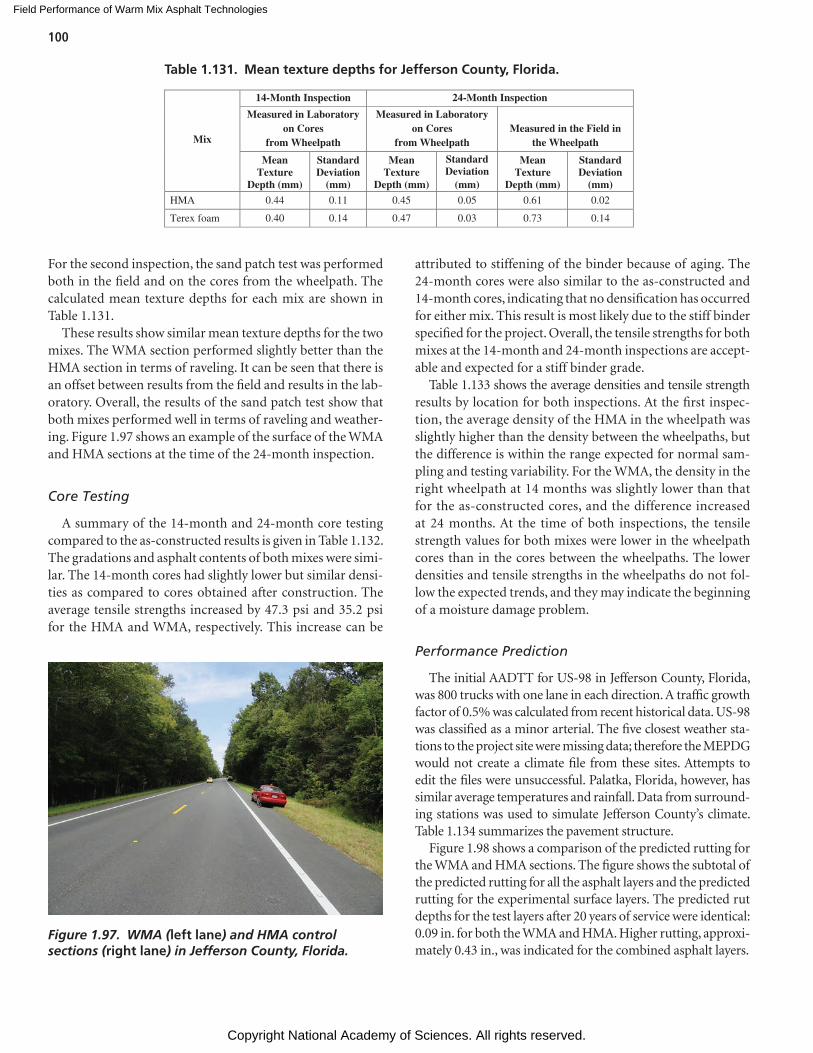
Field Performance of Warm Mix Asphalt Technologies
Copyright National Academy of Sciences. All rights reserved.
100
For the second inspection, the sand patch test was performed both in the field and on the cores from the wheelpath. The calculated mean texture depths for each mix are shown in Table 1.131.
These results show similar mean texture depths for the two mixes. The WMA section performed slightly better than the HMA section in terms of raveling. It can be seen that there is an offset between results from the field and results in the lab-oratory. Overall, the results of the sand patch test show that both mixes performed well in terms of raveling and weather-ing. Figure 1.97 shows an example of the surface of the WMA and HMA sections at the time of the 24-month inspection.
Core Testing
A summary of the 14-month and 24-month core testing compared to the as-constructed results is given in Table 1.132. The gradations and asphalt contents of both mixes were simi-lar. The 14-month cores had slightly lower but similar densi-ties as compared to cores obtained after construction. The average tensile strengths increased by 47.3 psi and 35.2 psi for the HMA and WMA, respectively. This increase can be
attributed to stiffening of the binder because of aging. The 24-month cores were also similar to the as-constructed and 14-month cores, indicating that no densification has occurred for either mix. This result is most likely due to the stiff binder specified for the project. Overall, the tensile strengths for both mixes at the 14-month and 24-month inspections are accept-able and expected for a stiff binder grade.
Table 1.133 shows the average densities and tensile strength results by location for both inspections. At the first inspec-tion, the average density of the HMA in the wheelpath was slightly higher than the density between the wheelpaths, but the difference is within the range expected for normal sam-pling and testing variability. For the WMA, the density in the right wheelpath at 14 months was slightly lower than that for the as-constructed cores, and the difference increased at 24 months. At the time of both inspections, the tensile strength values for both mixes were lower in the wheelpath cores than in the cores between the wheelpaths. The lower densities and tensile strengths in the wheelpaths do not fol-low the expected trends, and they may indicate the beginning of a moisture damage problem.
Performance Prediction
The initial AADTT for US-98 in Jefferson County, Florida, was 800 trucks with one lane in each direction. A traffic growth factor of 0.5% was calculated from recent historical data. US-98 was classified as a minor arterial. The five closest weather sta-tions to the project site were missing data; therefore the MEPDG would not create a climate file from these sites. Attempts to edit the files were unsuccessful. Palatka, Florida, however, has similar average temperatures and rainfall. Data from surround-ing stations was used to simulate Jefferson County’s climate. Table 1.134 summarizes the pavement structure.
Figure 1.98 shows a comparison of the predicted rutting for the WMA and HMA sections. The figure shows the subtotal of the predicted rutting for all the asphalt layers and the predicted rutting for the experimental surface layers. The predicted rut depths for the test layers after 20 years of service were identical: 0.09 in. for both the WMA and HMA. Higher rutting, approxi-mately 0.43 in., was indicated for the combined asphalt layers.
Mix
24-Month Inspection
Measured in Laboratory on Cores
from Wheelpath
Measured in Laboratory on Cores
from WheelpathMeasured in the Field in
the Wheelpath
MeanTexture
14-Month Inspection
Depth (mm)
Standard Deviation
(mm)
MeanTexture
Depth (mm)
Standard Deviation
(mm)
MeanTexture
Depth (mm)
Standard Deviation
(mm)
HMA 0.44 0.11 0.45 0.05 0.61 0.02
Terex foam 0.40 0.14 0.47 0.03 0.73 0.14
Table 1.131. Mean texture depths for Jefferson County, Florida.
Figure 1.97. WMA (left lane) and HMA control sections (right lane) in Jefferson County, Florida.
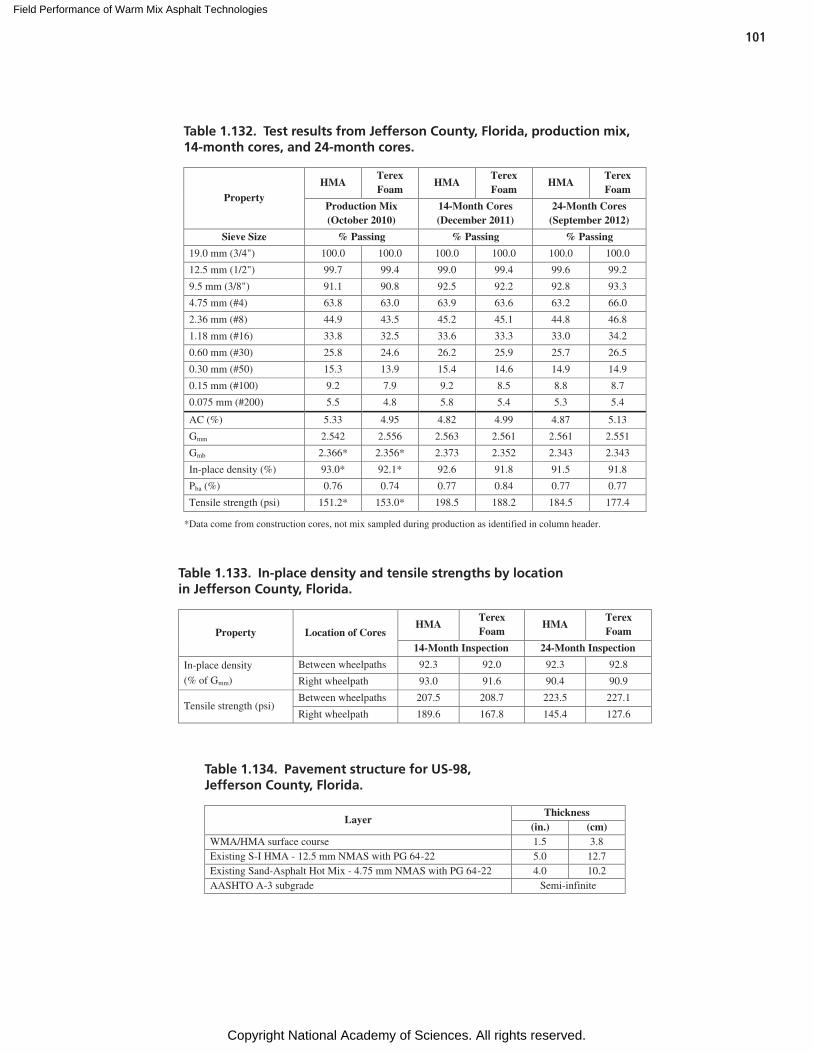
Field Performance of Warm Mix Asphalt Technologies
Copyright National Academy of Sciences. All rights reserved.
101
PropertyHMA
Terex Foam
HMATerex Foam
HMATerex Foam
Production Mix (October 2010)
14-Month Cores (December 2011)
24-Month Cores (September 2012)
Sieve Size % Passing % Passing % Passing
19.0 mm (3/4") 100.0 100.0 100.0 100.0 100.0 100.0
12.5 mm (1/2") 99.7 99.4 99.0 99.4 99.6 99.2
9.5 mm (3/8") 91.1 90.8 92.5 92.2 92.8 93.3
4.75 mm (#4) 63.8 63.0 63.9 63.6 63.2 66.0
2.36 mm (#8) 44.9 43.5 45.2 45.1 44.8 46.8
1.18 mm (#16) 33.8 32.5 33.6 33.3 33.0 34.2
0.60 mm (#30) 25.8 24.6 26.2 25.9 25.7 26.5
0.30 mm (#50) 15.3 13.9 15.4 14.6 14.9 14.9
0.15 mm (#100) 9.2 7.9 9.2 8.5 8.8 8.7
0.075 mm (#200) 5.5 4.8 5.8 5.4 5.3 5.4
AC (%) 5.33 4.95 4.82 4.99 4.87 5.13
Gmm 2.542 2.556 2.563 2.561 2.561 2.551
Gmb 2.366* 2.356* 2.373 2.352 2.343 2.343
In-place density (%) 93.0* 92.1* 92.6 91.8 91.5 91.8
Pba (%) 0.76 0.74 0.77 0.84 0.77 0.77
Tensile strength (psi) 151.2* 153.0* 198.5 188.2 184.5 177.4
*Data come from construction cores, not mix sampled during production as identified in column header.
Table 1.132. Test results from Jefferson County, Florida, production mix, 14-month cores, and 24-month cores.
Property Location of CoresHMA
Terex Foam
HMATerex Foam
14-Month Inspection 24-Month Inspection
In-place density
(% of Gmm)
Between wheelpaths 92.3 92.0 92.3 92.8
Right wheelpath 93.0 91.6 90.4 90.9
Tensile strength (psi)Between wheelpaths 207.5 208.7 223.5 227.1
Right wheelpath 189.6 167.8 145.4 127.6
Table 1.133. In-place density and tensile strengths by location in Jefferson County, Florida.
Layer Thickness
(in.) (cm)WMA/HMA surface course 1.5 3.8 Existing S-I HMA - 12.5 mm NMAS with PG 64-22 5.0 12.7Existing Sand-Asphalt Hot Mix - 4.75 mm NMAS with PG 64-22 4.0 10.2AASHTO A-3 subgrade Semi-infinite
Table 1.134. Pavement structure for US-98, Jefferson County, Florida.
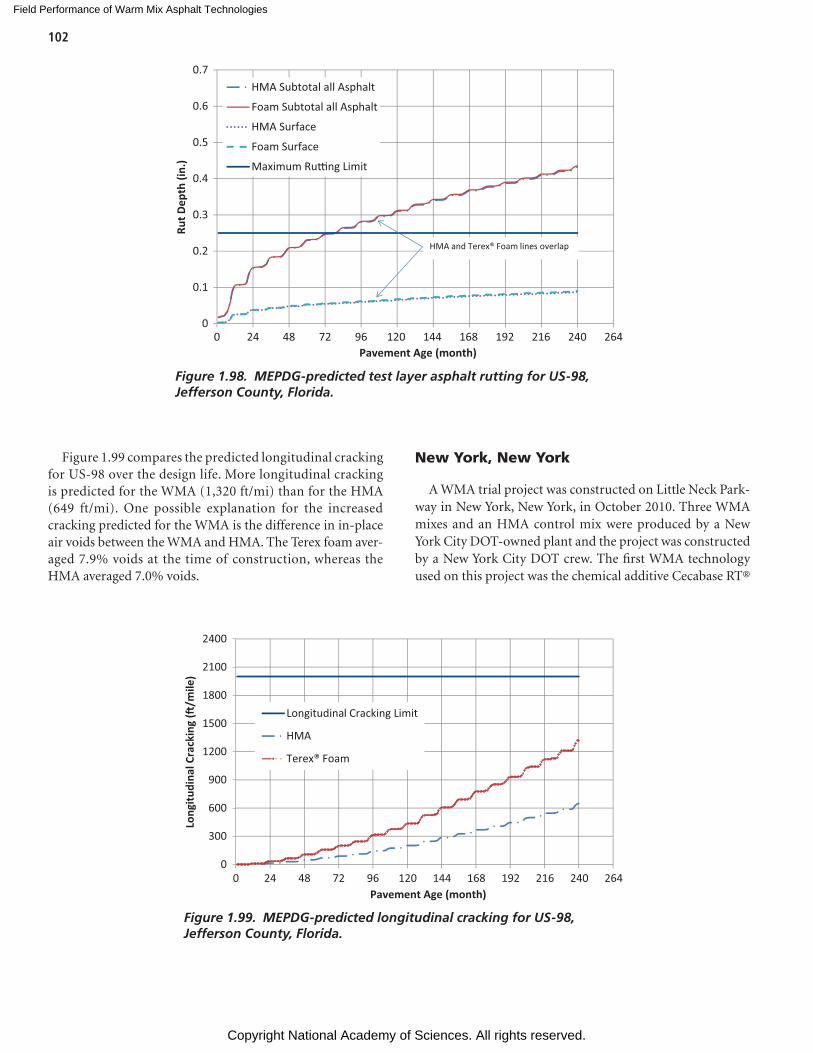
Field Performance of Warm Mix Asphalt Technologies
Copyright National Academy of Sciences. All rights reserved.
102
Figure 1.99 compares the predicted longitudinal cracking for US-98 over the design life. More longitudinal cracking is predicted for the WMA (1,320 ft/mi) than for the HMA (649 ft/mi). One possible explanation for the increased cracking predicted for the WMA is the difference in in-place air voids between the WMA and HMA. The Terex foam aver-aged 7.9% voids at the time of construction, whereas the HMA averaged 7.0% voids.
New York, New York
A WMA trial project was constructed on Little Neck Park-way in New York, New York, in October 2010. Three WMA mixes and an HMA control mix were produced by a New York City DOT-owned plant and the project was constructed by a New York City DOT crew. The first WMA technology used on this project was the chemical additive Cecabase RT®
0
0.1
0.2
0.3
0.4
0.5
0.6
0.7
0 24 48 72 96 120 144 168 192 216 240 264
Rut D
epth
(in.
)
Pavement Age (month)
HMA Subtotal all Asphalt
Foam Subtotal all Asphalt
HMA Surface
Foam Surface
Maximum Ru�ng Limit
HMA and Terex® Foam lines overlap
Figure 1.98. MEPDG-predicted test layer asphalt rutting for US-98, Jefferson County, Florida.
0
300
600
900
1200
1500
1800
2100
2400
0 24 48 72 96 120 144 168 192 216 240 264
Long
itudi
nal C
rack
ing
(�/m
ile)
Pavement Age (month)
Longitudinal Cracking Limit
HMA
Terex® Foam
Figure 1.99. MEPDG-predicted longitudinal cracking for US-98, Jefferson County, Florida.
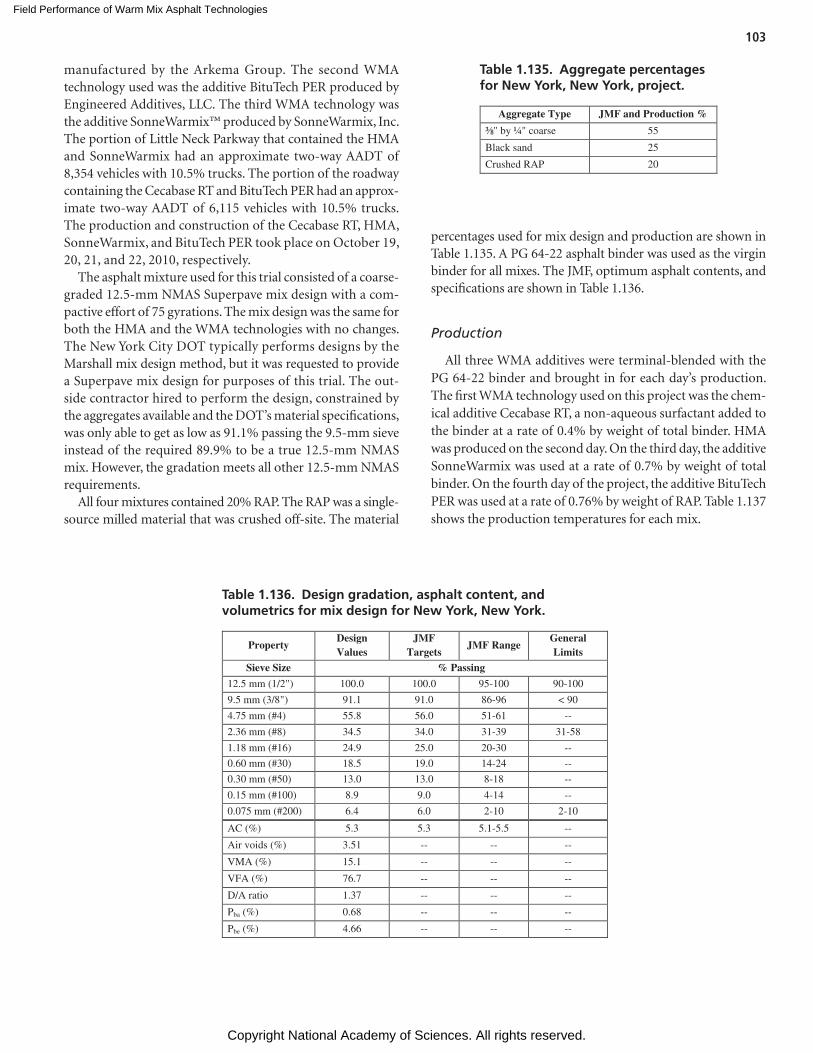
Field Performance of Warm Mix Asphalt Technologies
Copyright National Academy of Sciences. All rights reserved.
103
manufactured by the Arkema Group. The second WMA technology used was the additive BituTech PER produced by Engineered Additives, LLC. The third WMA technology was the additive SonneWarmix™ produced by SonneWarmix, Inc. The portion of Little Neck Parkway that contained the HMA and SonneWarmix had an approximate two-way AADT of 8,354 vehicles with 10.5% trucks. The portion of the roadway containing the Cecabase RT and BituTech PER had an approx-imate two-way AADT of 6,115 vehicles with 10.5% trucks. The production and construction of the Cecabase RT, HMA, SonneWarmix, and BituTech PER took place on October 19, 20, 21, and 22, 2010, respectively.
The asphalt mixture used for this trial consisted of a coarse-graded 12.5-mm NMAS Superpave mix design with a com-pactive effort of 75 gyrations. The mix design was the same for both the HMA and the WMA technologies with no changes. The New York City DOT typically performs designs by the Marshall mix design method, but it was requested to provide a Superpave mix design for purposes of this trial. The out-side contractor hired to perform the design, constrained by the aggregates available and the DOT’s material specifications, was only able to get as low as 91.1% passing the 9.5-mm sieve instead of the required 89.9% to be a true 12.5-mm NMAS mix. However, the gradation meets all other 12.5-mm NMAS requirements.
All four mixtures contained 20% RAP. The RAP was a single-source milled material that was crushed off-site. The material
percentages used for mix design and production are shown in Table 1.135. A PG 64-22 asphalt binder was used as the virgin binder for all mixes. The JMF, optimum asphalt contents, and specifications are shown in Table 1.136.
Production
All three WMA additives were terminal-blended with the PG 64-22 binder and brought in for each day’s production. The first WMA technology used on this project was the chem-ical additive Cecabase RT, a non-aqueous surfactant added to the binder at a rate of 0.4% by weight of total binder. HMA was produced on the second day. On the third day, the additive SonneWarmix was used at a rate of 0.7% by weight of total binder. On the fourth day of the project, the additive BituTech PER was used at a rate of 0.76% by weight of RAP. Table 1.137 shows the production temperatures for each mix.
Aggregate Type JMF and Production %
" by ¼" coarse 55
Black sand 25
Crushed RAP 20
Table 1.135. Aggregate percentages for New York, New York, project.
PropertyDesign Values
JMF Targets
JMF RangeGeneral Limits
Sieve Size % Passing
12.5 mm (1/2") 100.0 100.0 95-100 90-100
9.5 mm (3/8") 91.1 91.0 86-96 < 90
4.75 mm (#4) 55.8 56.0 51-61 --
2.36 mm (#8) 34.5 34.0 31-39 31-58
1.18 mm (#16) 24.9 25.0 20-30 --
0.60 mm (#30) 18.5 19.0 14-24 --
0.30 mm (#50) 13.0 13.0 8-18 --
0.15 mm (#100) 8.9 9.0 4-14 --
0.075 mm (#200) 6.4 6.0 2-10 2-10
AC (%) 5.3 5.3 5.1-5.5 --
Air voids (%) 3.51 -- -- --
VMA (%) 15.1 -- -- --
VFA (%) 76.7 -- -- --
D/A ratio 1.37 -- -- --
Pba (%) 0.68 -- -- --
Pbe (%) 4.66 -- -- --
Table 1.136. Design gradation, asphalt content, and volumetrics for mix design for New York, New York.
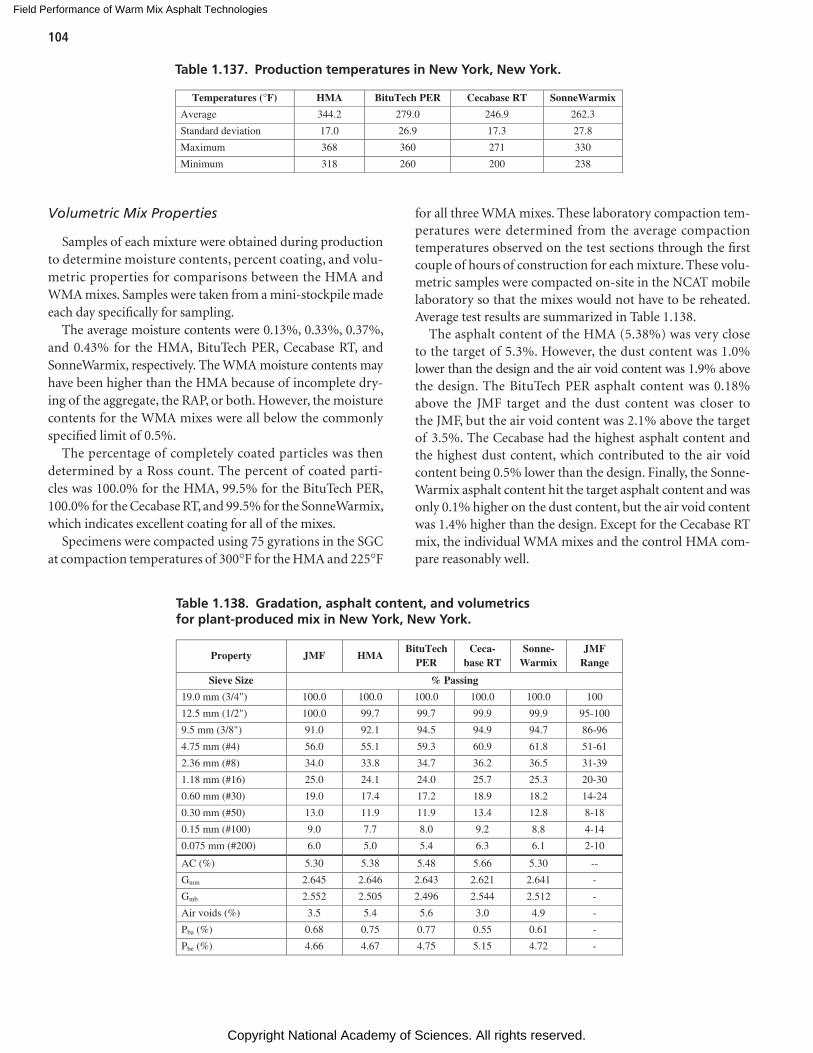
Field Performance of Warm Mix Asphalt Technologies
Copyright National Academy of Sciences. All rights reserved.
104
Volumetric Mix Properties
Samples of each mixture were obtained during production to determine moisture contents, percent coating, and volu-metric properties for comparisons between the HMA and WMA mixes. Samples were taken from a mini-stockpile made each day specifically for sampling.
The average moisture contents were 0.13%, 0.33%, 0.37%, and 0.43% for the HMA, BituTech PER, Cecabase RT, and SonneWarmix, respectively. The WMA moisture contents may have been higher than the HMA because of incomplete dry-ing of the aggregate, the RAP, or both. However, the moisture contents for the WMA mixes were all below the commonly specified limit of 0.5%.
The percentage of completely coated particles was then determined by a Ross count. The percent of coated parti-cles was 100.0% for the HMA, 99.5% for the BituTech PER, 100.0% for the Cecabase RT, and 99.5% for the SonneWarmix, which indicates excellent coating for all of the mixes.
Specimens were compacted using 75 gyrations in the SGC at compaction temperatures of 300°F for the HMA and 225°F
for all three WMA mixes. These laboratory compaction tem-peratures were determined from the average compaction temperatures observed on the test sections through the first couple of hours of construction for each mixture. These volu-metric samples were compacted on-site in the NCAT mobile laboratory so that the mixes would not have to be reheated. Average test results are summarized in Table 1.138.
The asphalt content of the HMA (5.38%) was very close to the target of 5.3%. However, the dust content was 1.0% lower than the design and the air void content was 1.9% above the design. The BituTech PER asphalt content was 0.18% above the JMF target and the dust content was closer to the JMF, but the air void content was 2.1% above the target of 3.5%. The Cecabase had the highest asphalt content and the highest dust content, which contributed to the air void content being 0.5% lower than the design. Finally, the Sonne-Warmix asphalt content hit the target asphalt content and was only 0.1% higher on the dust content, but the air void content was 1.4% higher than the design. Except for the Cecabase RT mix, the individual WMA mixes and the control HMA com-pare reasonably well.
Temperatures (°F) HMA BituTech PER Cecabase RT SonneWarmix
Average 344.2 279.0 246.9 262.3
Standard deviation 17.0 26.9 17.3 27.8
Maximum 368 360 271 330
Minimum 318 260 200 238
Table 1.137. Production temperatures in New York, New York.
Property JMF HMABituTech
PERCeca-
base RTSonne-
WarmixJMF
Range
Sieve Size % Passing
19.0 mm (3/4") 100.0 100.0 100.0 100.0 100.0 100
12.5 mm (1/2") 100.0 99.7 99.7 99.9 99.9 95-100
9.5 mm (3/8") 91.0 92.1 94.5 94.9 94.7 86-96
4.75 mm (#4) 56.0 55.1 59.3 60.9 61.8 51-61
2.36 mm (#8) 34.0 33.8 34.7 36.2 36.5 31-39
1.18 mm (#16) 25.0 24.1 24.0 25.7 25.3 20-30
0.60 mm (#30) 19.0 17.4 17.2 18.9 18.2 14-24
0.30 mm (#50) 13.0 11.9 11.9 13.4 12.8 8-18
0.15 mm (#100) 9.0 7.7 8.0 9.2 8.8 4-14
0.075 mm (#200) 6.0 5.0 5.4 6.3 6.1 2-10
AC (%) 5.30 5.38 5.48 5.66 5.30 --
Gmm 2.645 2.646 2.643 2.621 2.641 -
Gmb 2.552 2.505 2.496 2.544 2.512 -
Air voids (%) 3.5 5.4 5.6 3.0 4.9 -
Pba (%) 0.68 0.75 0.77 0.55 0.61 -
Pbe (%) 4.66 4.67 4.75 5.15 4.72 -
Table 1.138. Gradation, asphalt content, and volumetrics for plant-produced mix in New York, New York.
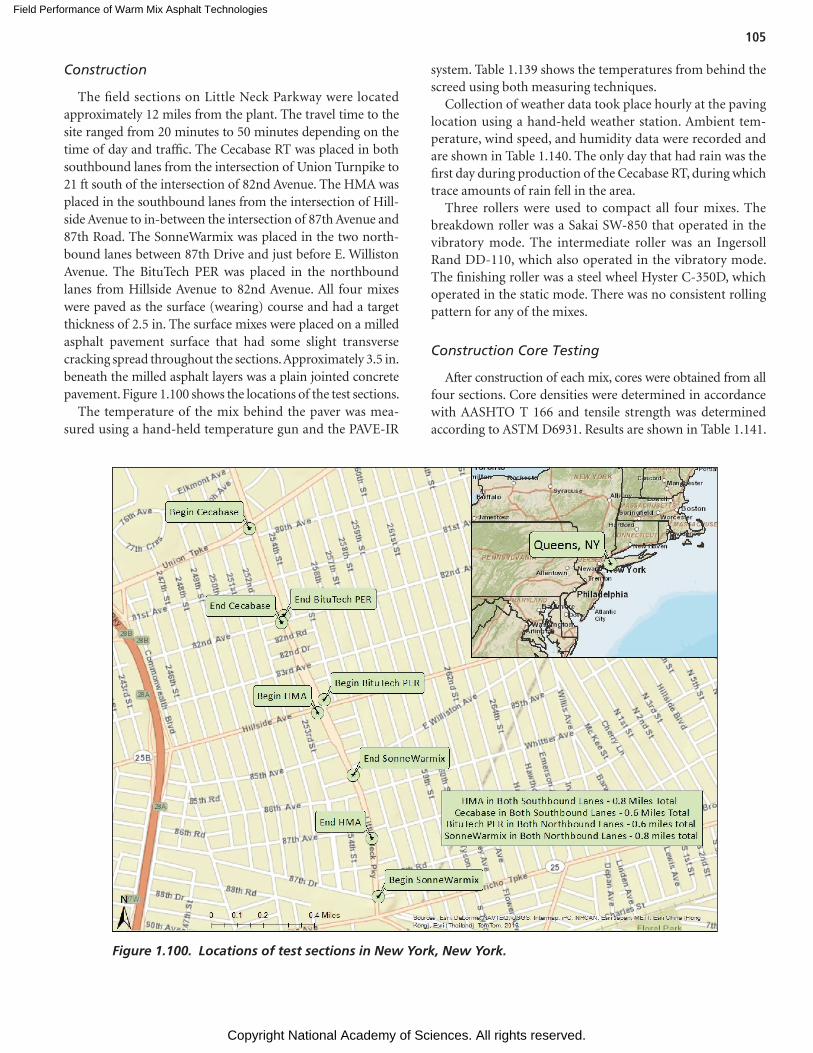
Field Performance of Warm Mix Asphalt Technologies
Copyright National Academy of Sciences. All rights reserved.
105
Construction
The field sections on Little Neck Parkway were located approximately 12 miles from the plant. The travel time to the site ranged from 20 minutes to 50 minutes depending on the time of day and traffic. The Cecabase RT was placed in both southbound lanes from the intersection of Union Turnpike to 21 ft south of the intersection of 82nd Avenue. The HMA was placed in the southbound lanes from the intersection of Hill-side Avenue to in-between the intersection of 87th Avenue and 87th Road. The SonneWarmix was placed in the two north-bound lanes between 87th Drive and just before E. Williston Avenue. The BituTech PER was placed in the northbound lanes from Hillside Avenue to 82nd Avenue. All four mixes were paved as the surface (wearing) course and had a target thickness of 2.5 in. The surface mixes were placed on a milled asphalt pavement surface that had some slight transverse cracking spread throughout the sections. Approximately 3.5 in. beneath the milled asphalt layers was a plain jointed concrete pavement. Figure 1.100 shows the locations of the test sections.
The temperature of the mix behind the paver was mea-sured using a hand-held temperature gun and the PAVE-IR
system. Table 1.139 shows the temperatures from behind the screed using both measuring techniques.
Collection of weather data took place hourly at the paving location using a hand-held weather station. Ambient tem-perature, wind speed, and humidity data were recorded and are shown in Table 1.140. The only day that had rain was the first day during production of the Cecabase RT, during which trace amounts of rain fell in the area.
Three rollers were used to compact all four mixes. The breakdown roller was a Sakai SW-850 that operated in the vibratory mode. The intermediate roller was an Ingersoll Rand DD-110, which also operated in the vibratory mode. The finishing roller was a steel wheel Hyster C-350D, which operated in the static mode. There was no consistent rolling pattern for any of the mixes.
Construction Core Testing
After construction of each mix, cores were obtained from all four sections. Core densities were determined in accordance with AASHTO T 166 and tensile strength was determined according to ASTM D6931. Results are shown in Table 1.141.
Figure 1.100. Locations of test sections in New York, New York.
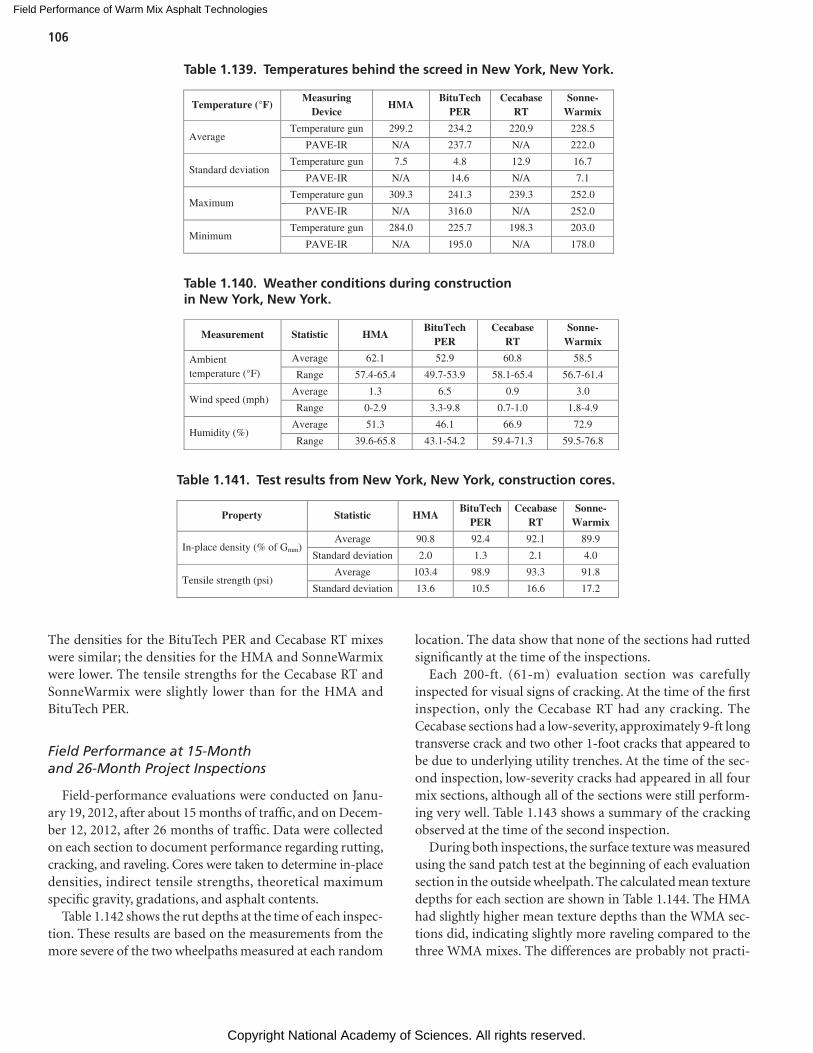
Field Performance of Warm Mix Asphalt Technologies
Copyright National Academy of Sciences. All rights reserved.
106
The densities for the BituTech PER and Cecabase RT mixes were similar; the densities for the HMA and SonneWarmix were lower. The tensile strengths for the Cecabase RT and SonneWarmix were slightly lower than for the HMA and BituTech PER.
Field Performance at 15-Month and 26-Month Project Inspections
Field-performance evaluations were conducted on Janu-ary 19, 2012, after about 15 months of traffic, and on Decem-ber 12, 2012, after 26 months of traffic. Data were collected on each section to document performance regarding rutting, cracking, and raveling. Cores were taken to determine in-place densities, indirect tensile strengths, theoretical maximum specific gravity, gradations, and asphalt contents.
Table 1.142 shows the rut depths at the time of each inspec-tion. These results are based on the measurements from the more severe of the two wheelpaths measured at each random
location. The data show that none of the sections had rutted significantly at the time of the inspections.
Each 200-ft. (61-m) evaluation section was carefully inspected for visual signs of cracking. At the time of the first inspection, only the Cecabase RT had any cracking. The Cecabase sections had a low-severity, approximately 9-ft long transverse crack and two other 1-foot cracks that appeared to be due to underlying utility trenches. At the time of the sec-ond inspection, low-severity cracks had appeared in all four mix sections, although all of the sections were still perform-ing very well. Table 1.143 shows a summary of the cracking observed at the time of the second inspection.
During both inspections, the surface texture was measured using the sand patch test at the beginning of each evaluation section in the outside wheelpath. The calculated mean texture depths for each section are shown in Table 1.144. The HMA had slightly higher mean texture depths than the WMA sec-tions did, indicating slightly more raveling compared to the three WMA mixes. The differences are probably not practi-
Temperature (°F)Measuring
DeviceHMA
BituTech PER
Cecabase RT
Sonne-Warmix
AverageTemperature gun 299.2 234.2 220.9 228.5
PAVE-IR N/A 237.7 N/A 222.0
Standard deviationTemperature gun 7.5 4.8 12.9 16.7
PAVE-IR N/A 14.6 N/A 7.1
MaximumTemperature gun 309.3 241.3 239.3 252.0
PAVE-IR N/A 316.0 N/A 252.0
MinimumTemperature gun 284.0 225.7 198.3 203.0
PAVE-IR N/A 195.0 N/A 178.0
Table 1.139. Temperatures behind the screed in New York, New York.
Measurement Statistic HMABituTech
PERCecabase
RTSonne-
Warmix
Ambient temperature (°F)
Average 62.1 52.9 60.8 58.5
Range 57.4-65.4 49.7-53.9 58.1-65.4 56.7-61.4
Wind speed (mph) Average 1.3 6.5 0.9 3.0
Range 0-2.9 3.3-9.8 0.7-1.0 1.8-4.9
Humidity (%)Average 51.3 46.1 66.9 72.9
Range 39.6-65.8 43.1-54.2 59.4-71.3 59.5-76.8
Table 1.140. Weather conditions during construction in New York, New York.
Property Statistic HMABituTech
PER Cecabase
RTSonne-
Warmix
In-place density (% of Gmm) Average 90.8 92.4 92.1 89.9
Standard deviation 2.0 1.3 2.1 4.0
Tensile strength (psi)Average 103.4 98.9 93.3 91.8
Standard deviation 13.6 10.5 16.6 17.2
Table 1.141. Test results from New York, New York, construction cores.
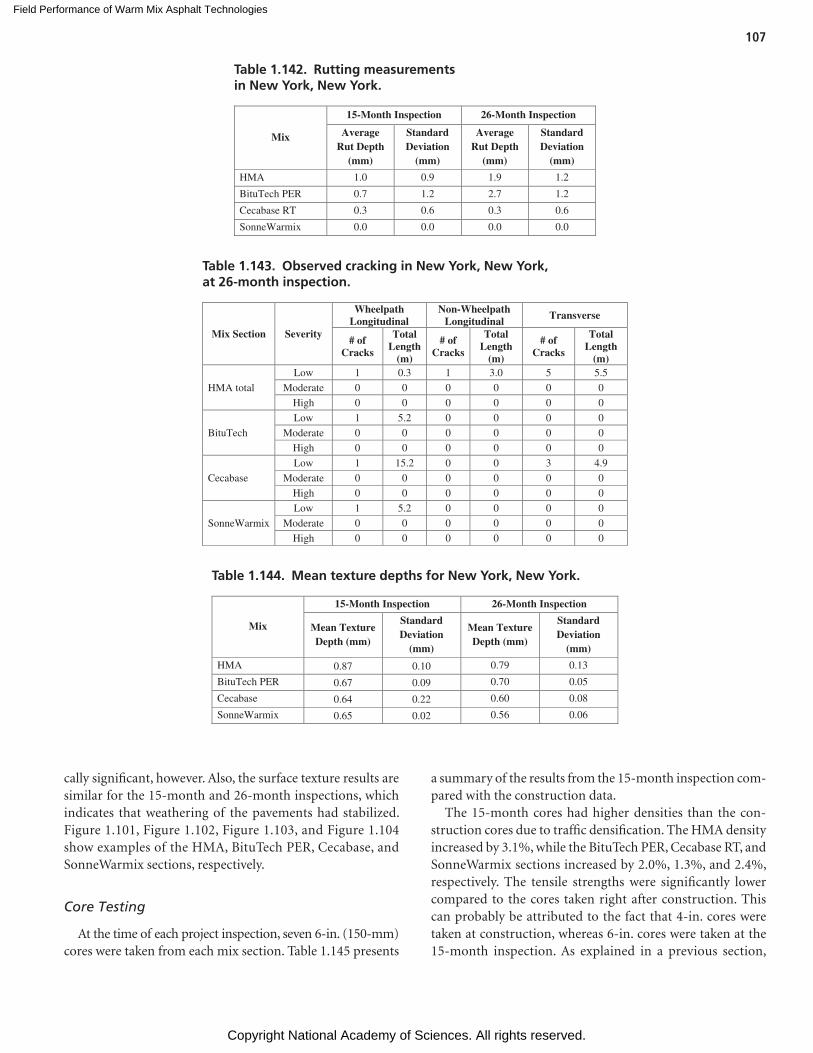
Field Performance of Warm Mix Asphalt Technologies
Copyright National Academy of Sciences. All rights reserved.
107
cally significant, however. Also, the surface texture results are similar for the 15-month and 26-month inspections, which indicates that weathering of the pavements had stabilized. Figure 1.101, Figure 1.102, Figure 1.103, and Figure 1.104 show examples of the HMA, BituTech PER, Cecabase, and SonneWarmix sections, respectively.
Core Testing
At the time of each project inspection, seven 6-in. (150-mm) cores were taken from each mix section. Table 1.145 presents
a summary of the results from the 15-month inspection com-pared with the construction data.
The 15-month cores had higher densities than the con-struction cores due to traffic densification. The HMA density increased by 3.1%, while the BituTech PER, Cecabase RT, and SonneWarmix sections increased by 2.0%, 1.3%, and 2.4%, respectively. The tensile strengths were significantly lower compared to the cores taken right after construction. This can probably be attributed to the fact that 4-in. cores were taken at construction, whereas 6-in. cores were taken at the 15-month inspection. As explained in a previous section,
Mix
15-Month Inspection 26-Month Inspection
Average Rut Depth
(mm)
Standard Deviation
(mm)
Average Rut Depth
(mm)
Standard Deviation
(mm)
HMA 1.0 0.9 1.9 1.2
BituTech PER 0.7 1.2 2.7 1.2
Cecabase RT 0.3 0.6 0.3 0.6
SonneWarmix 0.0 0.0 0.0 0.0
Table 1.142. Rutting measurements in New York, New York.
Mix Section Severity
Wheelpath Longitudinal
Non-Wheelpath Longitudinal Transverse
# ofCracks
Total Length
(m)
# ofCracks
Total Length
(m)
# ofCracks
Total Length
(m)
HMA total
Low 1 0.3 1 3.0 5 5.5
Moderate 0 0 0 0 0 0
High 0 0 0 0 0 0
BituTech
Low 1 5.2 0 0 0 0
Moderate 0 0 0 0 0 0
High 0 0 0 0 0 0
Cecabase
Low 1 15.2 0 0 3 4.9
Moderate 0 0 0 0 0 0
High 0 0 0 0 0 0
SonneWarmix
Low 1 5.2 0 0 0 0
Moderate 0 0 0 0 0 0
High 0 0 0 0 0 0
Table 1.143. Observed cracking in New York, New York, at 26-month inspection.
Mix
15-Month Inspection 26-Month Inspection
Mean Texture Depth (mm)
Standard Deviation
(mm)
Mean Texture Depth (mm)
Standard Deviation
(mm)
HMA 0.87 0.10 0.79 0.13
BituTech PER 0.67 0.09 0.70 0.05
Cecabase 0.64 0.22 0.60 0.08
SonneWarmix 0.65 0.02 0.56 0.06
Table 1.144. Mean texture depths for New York, New York.
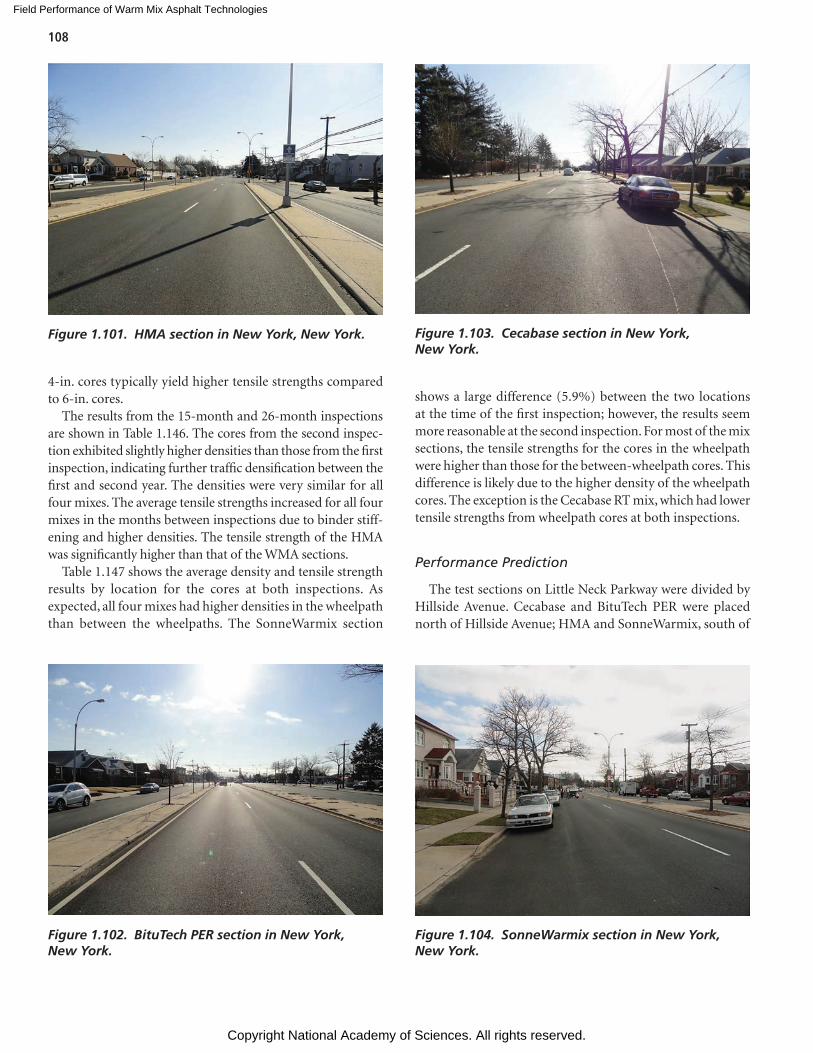
Field Performance of Warm Mix Asphalt Technologies
Copyright National Academy of Sciences. All rights reserved.
108
4-in. cores typically yield higher tensile strengths compared to 6-in. cores.
The results from the 15-month and 26-month inspections are shown in Table 1.146. The cores from the second inspec-tion exhibited slightly higher densities than those from the first inspection, indicating further traffic densification between the first and second year. The densities were very similar for all four mixes. The average tensile strengths increased for all four mixes in the months between inspections due to binder stiff-ening and higher densities. The tensile strength of the HMA was significantly higher than that of the WMA sections.
Table 1.147 shows the average density and tensile strength results by location for the cores at both inspections. As expected, all four mixes had higher densities in the wheelpath than between the wheelpaths. The SonneWarmix section
shows a large difference (5.9%) between the two locations at the time of the first inspection; however, the results seem more reasonable at the second inspection. For most of the mix sections, the tensile strengths for the cores in the wheelpath were higher than those for the between-wheelpath cores. This difference is likely due to the higher density of the wheelpath cores. The exception is the Cecabase RT mix, which had lower tensile strengths from wheelpath cores at both inspections.
Performance Prediction
The test sections on Little Neck Parkway were divided by Hillside Avenue. Cecabase and BituTech PER were placed north of Hillside Avenue; HMA and SonneWarmix, south of
Figure 1.101. HMA section in New York, New York.
Figure 1.102. BituTech PER section in New York, New York.
Figure 1.103. Cecabase section in New York, New York.
Figure 1.104. SonneWarmix section in New York, New York.
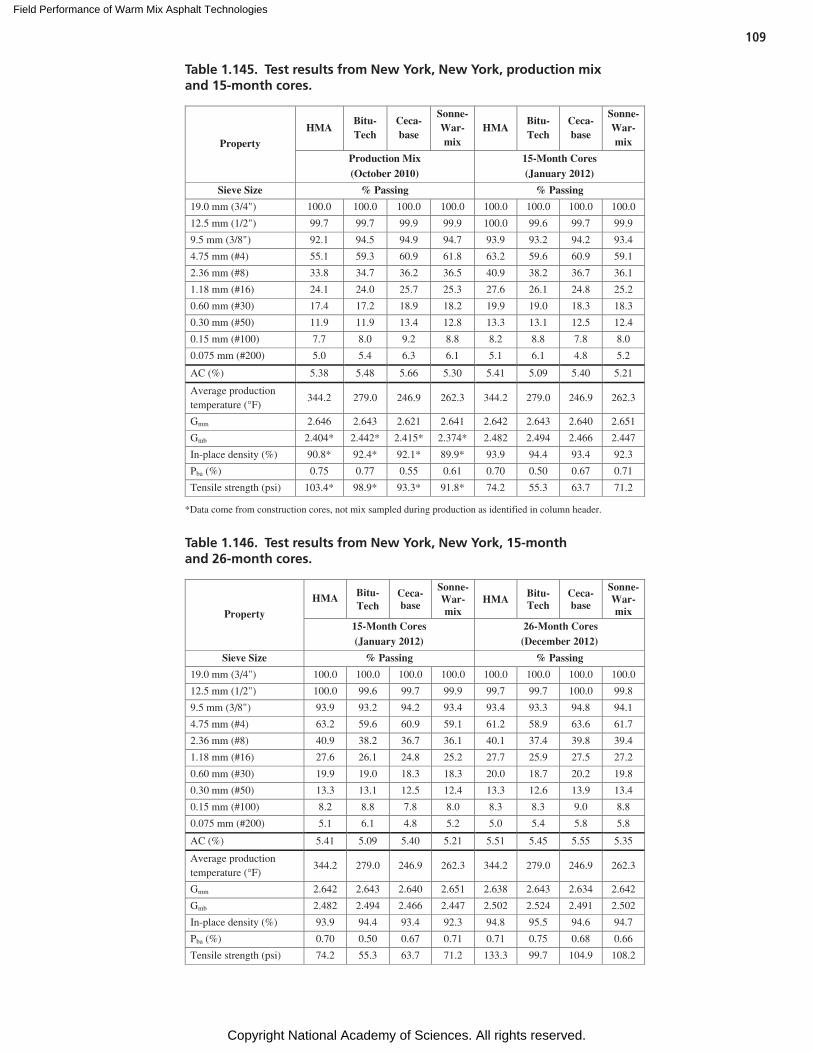
Field Performance of Warm Mix Asphalt Technologies
Copyright National Academy of Sciences. All rights reserved.
109
Property
HMA Bitu-Tech
Ceca-base
Sonne-War-mix
HMA Bitu-Tech
Ceca-base
Sonne-War-mix
Production Mix (October 2010)
15-Month Cores (January 2012)
Sieve Size % Passing % Passing
19.0 mm (3/4") 100.0 100.0 100.0 100.0 100.0 100.0 100.0 100.0
12.5 mm (1/2") 99.7 99.7 99.9 99.9 100.0 99.6 99.7 99.9
9.5 mm (3/8" ) 92.1 94.5 94.9 94.7 93.9 93.2 94.2 93.4
4.75 mm (#4) 55.1 59.3 60.9 61.8 63.2 59.6 60.9 59.1
2.36 mm (#8) 33.8 34.7 36.2 36.5 40.9 38.2 36.7 36.1
1.18 mm (#16) 24.1 24.0 25.7 25.3 27.6 26.1 24.8 25.2
0.60 mm (#30) 17.4 17.2 18.9 18.2 19.9 19.0 18.3 18.3
0.30 mm (#50) 11.9 11.9 13.4 12.8 13.3 13.1 12.5 12.4
0.15 mm (#100) 7.7 8.0 9.2 8.8 8.2 8.8 7.8 8.0
0.075 mm (#200) 5.0 5.4 6.3 6.1 5.1 6.1 4.8 5.2
AC (%) 5.38 5.48 5.66 5.30 5.41 5.09 5.40 5.21
Average production temperature (°F)
344.2 279.0 246.9 262.3 344.2 279.0 246.9 262.3
Gmm 2.646 2.643 2.621 2.641 2.642 2.643 2.640 2.651
Gmb 2.404* 2.442* 2.415* 2.374* 2.482 2.494 2.466 2.447
In-place density (%) 90.8* 92.4* 92.1* 89.9* 93.9 94.4 93.4 92.3
Pba (%) 0.75 0.77 0.55 0.61 0.70 0.50 0.67 0.71
Tensile strength (psi) 103.4* 98.9* 93.3* 91.8* 74.2 55.3 63.7 71.2
*Data come from construction cores, not mix sampled during production as identified in column header.
Table 1.145. Test results from New York, New York, production mix and 15-month cores.
PropertyHMA Bitu-
Tech Ceca-base
Sonne-War-mix
HMA Bitu-Tech
Ceca-base
Sonne-War-mix
15-Month Cores(January 2012)
26-Month Cores(December 2012)
Sieve Size % Passing % Passing
19.0 mm (3/4") 100.0 100.0 100.0 100.0 100.0 100.0 100.0 100.0
12.5 mm (1/2") 100.0 99.6 99.7 99.9 99.7 99.7 100.0 99.8
9.5 mm (3/8") 93.9 93.2 94.2 93.4 93.4 93.3 94.8 94.1
4.75 mm (#4) 63.2 59.6 60.9 59.1 61.2 58.9 63.6 61.7
2.36 mm (#8) 40.9 38.2 36.7 36.1 40.1 37.4 39.8 39.4
1.18 mm (#16) 27.6 26.1 24.8 25.2 27.7 25.9 27.5 27.2
0.60 mm (#30) 19.9 19.0 18.3 18.3 20.0 18.7 20.2 19.8
0.30 mm (#50) 13.3 13.1 12.5 12.4 13.3 12.6 13.9 13.4
0.15 mm (#100) 8.2 8.8 7.8 8.0 8.3 8.3 9.0 8.8
0.075 mm (#200) 5.1 6.1 4.8 5.2 5.0 5.4 5.8 5.8
AC (%) 5.41 5.09 5.40 5.21 5.51 5.45 5.55 5.35
Average production temperature (°F)
344.2 279.0 246.9 262.3 344.2 279.0 246.9 262.3
Gmm 2.642 2.643 2.640 2.651 2.638 2.643 2.634 2.642
Gmb 2.482 2.494 2.466 2.447 2.502 2.524 2.491 2.502
In-place density (%) 93.9 94.4 93.4 92.3 94.8 95.5 94.6 94.7
Pba (%) 0.70 0.50 0.67 0.71 0.71 0.75 0.68 0.66
Tensile strength (psi) 74.2 55.3 63.7 71.2 133.3 99.7 104.9 108.2
Table 1.146. Test results from New York, New York, 15-month and 26-month cores.
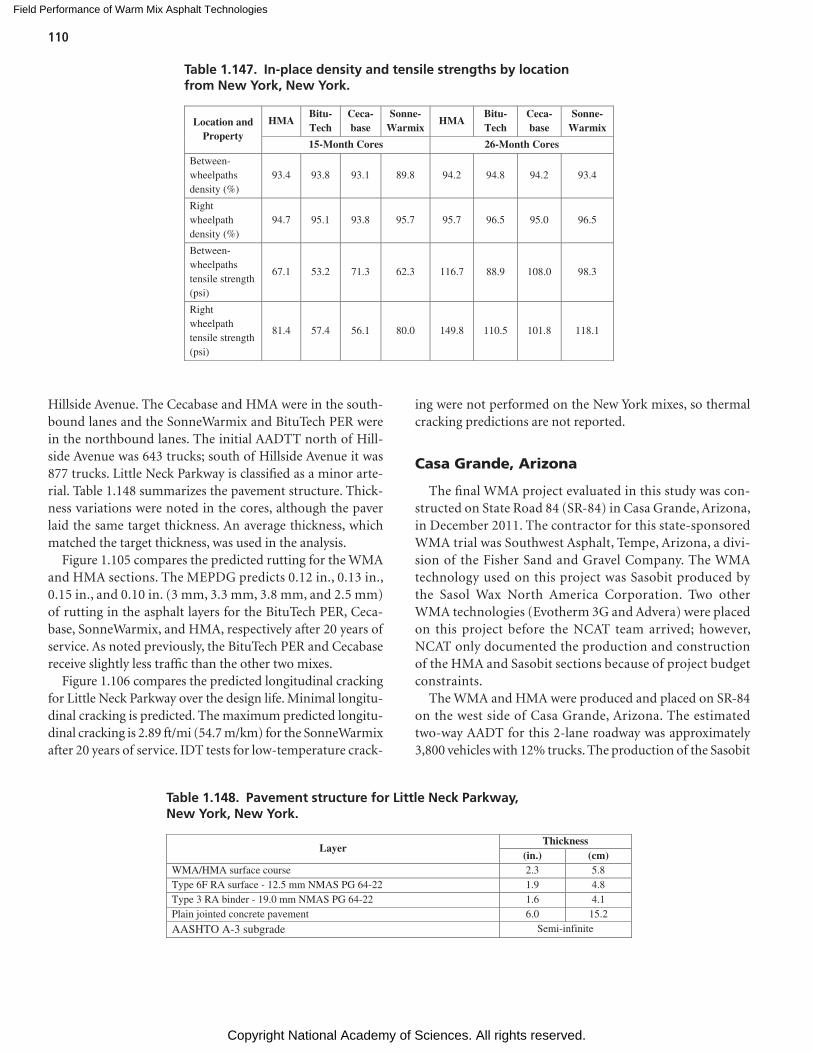
Field Performance of Warm Mix Asphalt Technologies
Copyright National Academy of Sciences. All rights reserved.
110
Hillside Avenue. The Cecabase and HMA were in the south-bound lanes and the SonneWarmix and BituTech PER were in the northbound lanes. The initial AADTT north of Hill-side Avenue was 643 trucks; south of Hillside Avenue it was 877 trucks. Little Neck Parkway is classified as a minor arte-rial. Table 1.148 summarizes the pavement structure. Thick-ness variations were noted in the cores, although the paver laid the same target thickness. An average thickness, which matched the target thickness, was used in the analysis.
Figure 1.105 compares the predicted rutting for the WMA and HMA sections. The MEPDG predicts 0.12 in., 0.13 in., 0.15 in., and 0.10 in. (3 mm, 3.3 mm, 3.8 mm, and 2.5 mm) of rutting in the asphalt layers for the BituTech PER, Ceca-base, SonneWarmix, and HMA, respectively after 20 years of service. As noted previously, the BituTech PER and Cecabase receive slightly less traffic than the other two mixes.
Figure 1.106 compares the predicted longitudinal cracking for Little Neck Parkway over the design life. Minimal longitu-dinal cracking is predicted. The maximum predicted longitu-dinal cracking is 2.89 ft/mi (54.7 m/km) for the SonneWarmix after 20 years of service. IDT tests for low-temperature crack-
ing were not performed on the New York mixes, so thermal cracking predictions are not reported.
Casa Grande, Arizona
The final WMA project evaluated in this study was con-structed on State Road 84 (SR-84) in Casa Grande, Arizona, in December 2011. The contractor for this state-sponsored WMA trial was Southwest Asphalt, Tempe, Arizona, a divi-sion of the Fisher Sand and Gravel Company. The WMA technology used on this project was Sasobit produced by the Sasol Wax North America Corporation. Two other WMA technologies (Evotherm 3G and Advera) were placed on this project before the NCAT team arrived; however, NCAT only documented the production and construction of the HMA and Sasobit sections because of project budget constraints.
The WMA and HMA were produced and placed on SR-84 on the west side of Casa Grande, Arizona. The estimated two-way AADT for this 2-lane roadway was approximately 3,800 vehicles with 12% trucks. The production of the Sasobit
Location and Property
HMA Bitu-Tech
Ceca-base
Sonne-Warmix
HMA Bitu-Tech
Ceca-base
Sonne- Warmix
15-Month Cores 26-Month Cores
Between-wheelpaths density (%)
93.4 93.8 93.1 89.8 94.2 94.8 94.2 93.4
Right wheelpath density (%)
94.7 95.1 93.8 95.7 95.7 96.5 95.0 96.5
Between-wheelpaths tensile strength (psi)
67.1 53.2 71.3 62.3 116.7 88.9 108.0 98.3
Right wheelpath tensile strength (psi)
81.4 57.4 56.1 80.0 149.8 110.5 101.8 118.1
Table 1.147. In-place density and tensile strengths by location from New York, New York.
Layer Thickness
(in.) (cm) WMA/HMA surface course 2.3 5.8 Type 6F RA surface - 12.5 mm NMAS PG 64-22 1.9 4.8 Type 3 RA binder - 19.0 mm NMAS PG 64-22 1.6 4.1 Plain jointed concrete pavement 6.0 15.2
AASHTO A-3 subgrade Semi-infinite
Table 1.148. Pavement structure for Little Neck Parkway, New York, New York.
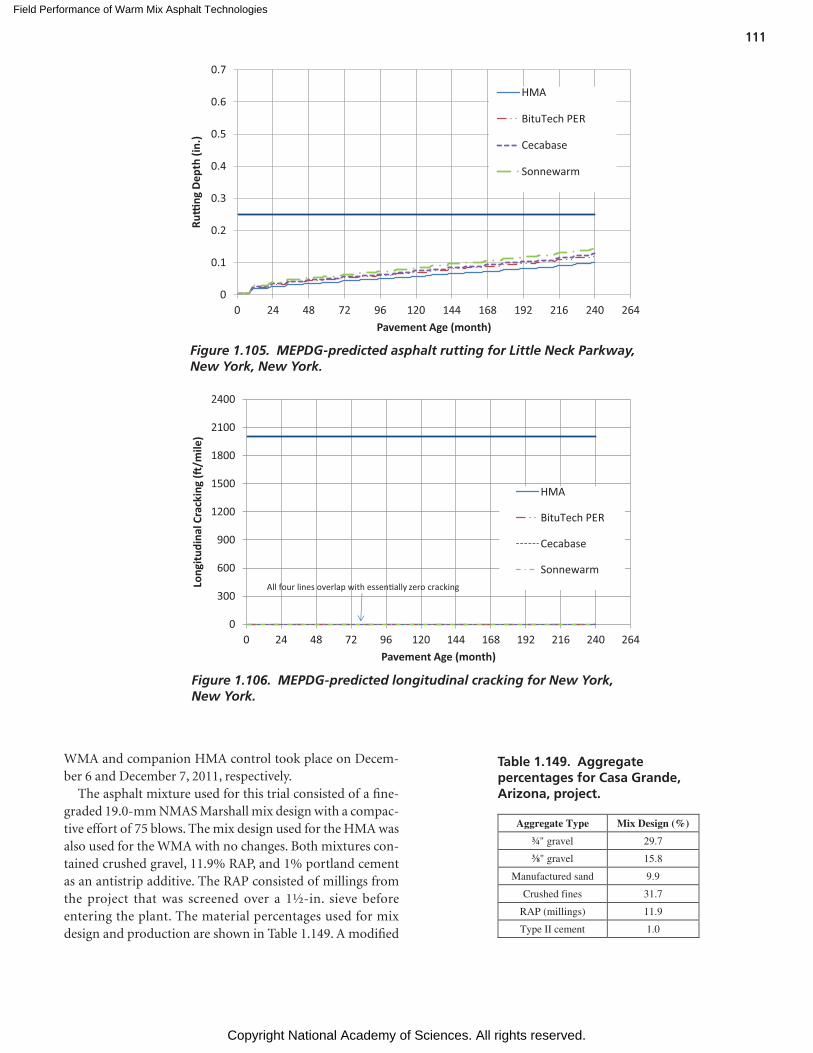
Field Performance of Warm Mix Asphalt Technologies
Copyright National Academy of Sciences. All rights reserved.
111
WMA and companion HMA control took place on Decem-ber 6 and December 7, 2011, respectively.
The asphalt mixture used for this trial consisted of a fine-graded 19.0-mm NMAS Marshall mix design with a compac-tive effort of 75 blows. The mix design used for the HMA was also used for the WMA with no changes. Both mixtures con-tained crushed gravel, 11.9% RAP, and 1% portland cement as an antistrip additive. The RAP consisted of millings from the project that was screened over a 1½-in. sieve before entering the plant. The material percentages used for mix design and production are shown in Table 1.149. A modified
0
0.1
0.2
0.3
0.4
0.5
0.6
0.7
0 24 48 72 96 120 144 168 192 216 240 264
Ru�
ng D
epth
(in.
)
Pavement Age (month)
HMA
BituTech PER
Cecabase
Sonnewarm
Figure 1.105. MEPDG-predicted asphalt rutting for Little Neck Parkway, New York, New York.
0
300
600
900
1200
1500
1800
2100
2400
0 24 48 72 96 120 144 168 192 216 240 264
Long
itudi
nal C
rack
ing
(�/m
ile)
Pavement Age (month)
HMA
BituTech PER
Cecabase
SonnewarmAll four lines overlap with essen�ally zero cracking
Figure 1.106. MEPDG-predicted longitudinal cracking for New York, New York.
Aggregate Type Mix Design (%)
¾" gravel 3⁄8" gravel
29.7
15.8
Manufactured sand 9.9
Crushed fines 31.7
RAP (millings) 11.9
Type II cement 1.0
Table 1.149. Aggregate percentages for Casa Grande, Arizona, project.
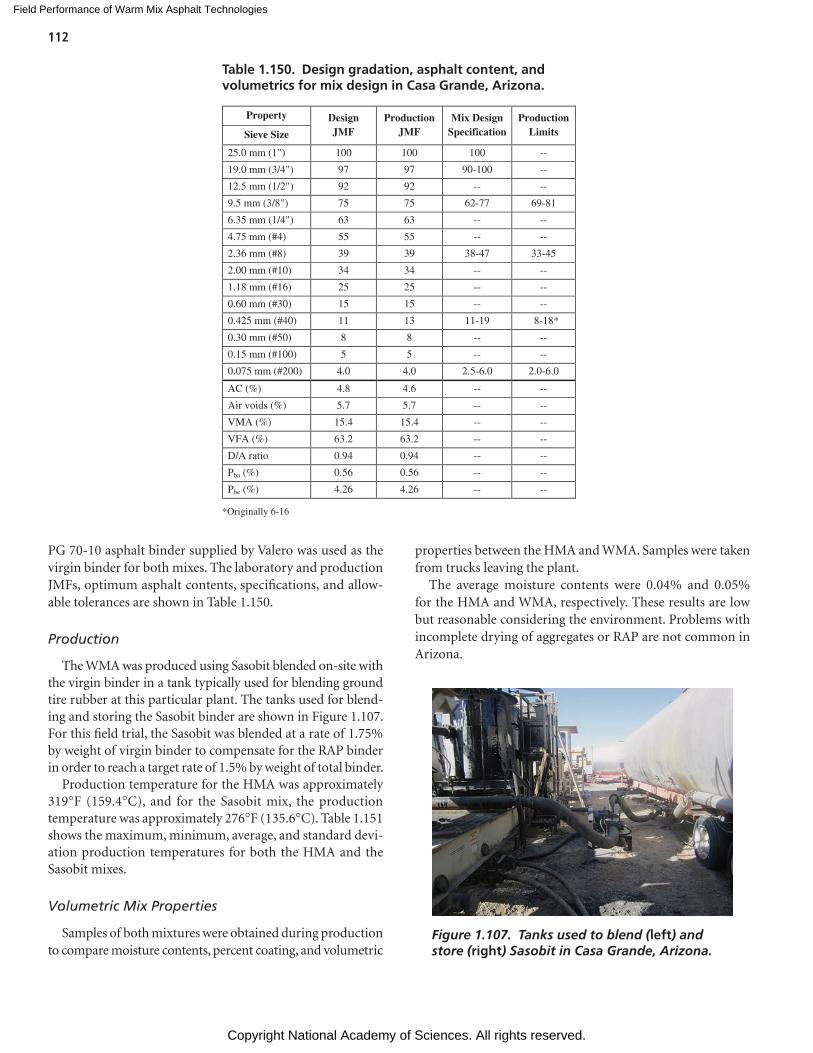
Field Performance of Warm Mix Asphalt Technologies
Copyright National Academy of Sciences. All rights reserved.
112
PG 70-10 asphalt binder supplied by Valero was used as the virgin binder for both mixes. The laboratory and production JMFs, optimum asphalt contents, specifications, and allow-able tolerances are shown in Table 1.150.
Production
The WMA was produced using Sasobit blended on-site with the virgin binder in a tank typically used for blending ground tire rubber at this particular plant. The tanks used for blend-ing and storing the Sasobit binder are shown in Figure 1.107. For this field trial, the Sasobit was blended at a rate of 1.75% by weight of virgin binder to compensate for the RAP binder in order to reach a target rate of 1.5% by weight of total binder.
Production temperature for the HMA was approximately 319°F (159.4°C), and for the Sasobit mix, the production temperature was approximately 276°F (135.6°C). Table 1.151 shows the maximum, minimum, average, and standard devi-ation production temperatures for both the HMA and the Sasobit mixes.
Volumetric Mix Properties
Samples of both mixtures were obtained during production to compare moisture contents, percent coating, and volumetric
Property Design JMF
Production JMF
Mix Design Specification
Production Limits Sieve Size
25.0 mm (1") 100 100 100 --
19.0 mm (3/4") 97 97 90-100 --
12.5 mm (1/2") 92 92 -- --
9.5 mm (3/8") 75 75 62-77 69-81
6.35 mm (1/4") 63 63 -- --
4.75 mm (#4) 55 55 -- --
2.36 mm (#8) 39 39 38-47 33-45
2.00 mm (#10) 34 34 -- --
1.18 mm (#16) 25 25 -- --
0.60 mm (#30) 15 15 -- --
0.425 mm (#40) 11 13 11-19 8-18*
0.30 mm (#50) 8 8 -- --
0.15 mm (#100) 5 5 -- --
0.075 mm (#200) 4.0 4.0 2.5-6.0 2.0-6.0
AC (%) 4.8 4.6 -- --
Air voids (%) 5.7 5.7 -- --
VMA (%) 15.4 15.4 -- --
VFA (%) 63.2 63.2 -- --
D/A ratio 0.94 0.94 -- --
Pba (%) 0.56 0.56 -- --
Pbe (%) 4.26 4.26 -- --
*Originally 6-16
Table 1.150. Design gradation, asphalt content, and volumetrics for mix design in Casa Grande, Arizona.
Figure 1.107. Tanks used to blend (left) and store (right) Sasobit in Casa Grande, Arizona.
properties between the HMA and WMA. Samples were taken from trucks leaving the plant.
The average moisture contents were 0.04% and 0.05% for the HMA and WMA, respectively. These results are low but reasonable considering the environment. Problems with incomplete drying of aggregates or RAP are not common in Arizona.
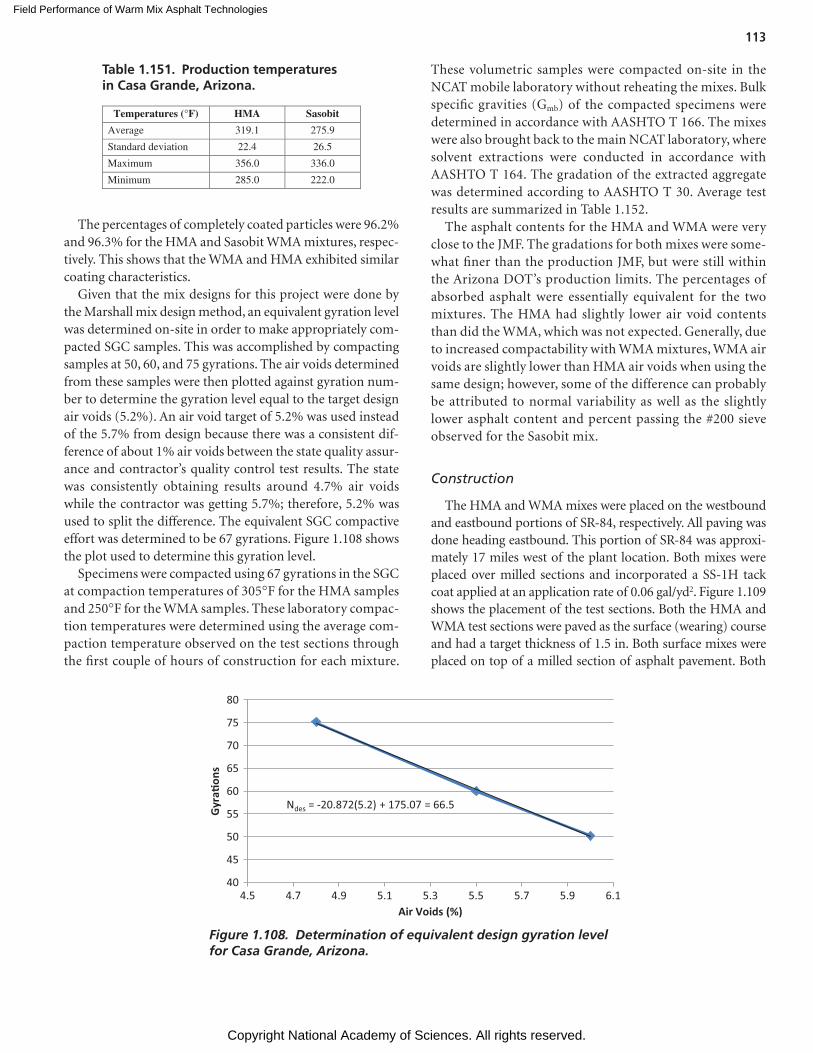
Field Performance of Warm Mix Asphalt Technologies
Copyright National Academy of Sciences. All rights reserved.
113
The percentages of completely coated particles were 96.2% and 96.3% for the HMA and Sasobit WMA mixtures, respec-tively. This shows that the WMA and HMA exhibited similar coating characteristics.
Given that the mix designs for this project were done by the Marshall mix design method, an equivalent gyration level was determined on-site in order to make appropriately com-pacted SGC samples. This was accomplished by compacting samples at 50, 60, and 75 gyrations. The air voids determined from these samples were then plotted against gyration num-ber to determine the gyration level equal to the target design air voids (5.2%). An air void target of 5.2% was used instead of the 5.7% from design because there was a consistent dif-ference of about 1% air voids between the state quality assur-ance and contractor’s quality control test results. The state was consistently obtaining results around 4.7% air voids while the contractor was getting 5.7%; therefore, 5.2% was used to split the difference. The equivalent SGC compactive effort was determined to be 67 gyrations. Figure 1.108 shows the plot used to determine this gyration level.
Specimens were compacted using 67 gyrations in the SGC at compaction temperatures of 305°F for the HMA samples and 250°F for the WMA samples. These laboratory compac-tion temperatures were determined using the average com-paction temperature observed on the test sections through the first couple of hours of construction for each mixture.
These volumetric samples were compacted on-site in the NCAT mobile laboratory without reheating the mixes. Bulk specific gravities (Gmb) of the compacted specimens were determined in accordance with AASHTO T 166. The mixes were also brought back to the main NCAT laboratory, where solvent extractions were conducted in accordance with AASHTO T 164. The gradation of the extracted aggregate was determined according to AASHTO T 30. Average test results are summarized in Table 1.152.
The asphalt contents for the HMA and WMA were very close to the JMF. The gradations for both mixes were some-what finer than the production JMF, but were still within the Arizona DOT’s production limits. The percentages of absorbed asphalt were essentially equivalent for the two mixtures. The HMA had slightly lower air void contents than did the WMA, which was not expected. Generally, due to increased compactability with WMA mixtures, WMA air voids are slightly lower than HMA air voids when using the same design; however, some of the difference can probably be attributed to normal variability as well as the slightly lower asphalt content and percent passing the #200 sieve observed for the Sasobit mix.
Construction
The HMA and WMA mixes were placed on the westbound and eastbound portions of SR-84, respectively. All paving was done heading eastbound. This portion of SR-84 was approxi-mately 17 miles west of the plant location. Both mixes were placed over milled sections and incorporated a SS-1H tack coat applied at an application rate of 0.06 gal/yd2. Figure 1.109 shows the placement of the test sections. Both the HMA and WMA test sections were paved as the surface (wearing) course and had a target thickness of 1.5 in. Both surface mixes were placed on top of a milled section of asphalt pavement. Both
Temperatures (°F) HMA Sasobit
Average 319.1 275.9
Standard deviation 22.4 26.5
Maximum 356.0 336.0
Minimum 285.0 222.0
Table 1.151. Production temperatures in Casa Grande, Arizona.
Ndes = -20.872(5.2) + 175.07 = 66.5
40
45
50
60
70
55
65
75
80
4.5 4.7 4.9 5.1 5.3 5.5 5.7 5.9 6.1
Gyr
a�on
s
Air Voids (%)
Figure 1.108. Determination of equivalent design gyration level for Casa Grande, Arizona.
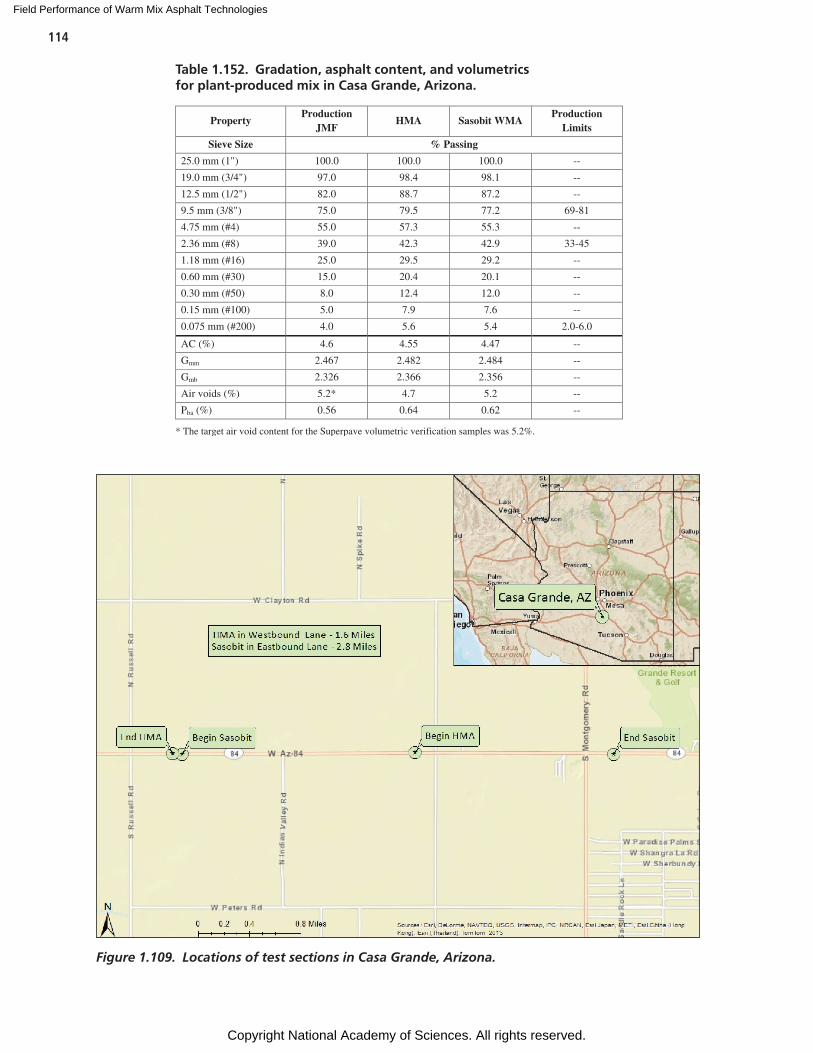
Field Performance of Warm Mix Asphalt Technologies
Copyright National Academy of Sciences. All rights reserved.
114
Property Production
JMF HMA Sasobit WMA
Production Limits
Sieve Size % Passing
25.0 mm (1") 100.0 100.0 100.0 --
19.0 mm (3/4") 97.0 98.4 98.1 --
12.5 mm (1/2") 82.0 88.7 87.2 --
9.5 mm (3/8") 75.0 79.5 77.2 69-81
4.75 mm (#4) 55.0 57.3 55.3 --
2.36 mm (#8) 39.0 42.3 42.9 33-45
1.18 mm (#16) 25.0 29.5 29.2 --
0.60 mm (#30) 15.0 20.4 20.1 --
0.30 mm (#50) 8.0 12.4 12.0 --
0.15 mm (#100) 5.0 7.9 7.6 --
0.075 mm (#200) 4.0 5.6 5.4 2.0-6.0
AC (%) 4.6 4.55 4.47 --
Gmm 2.467 2.482 2.484 --
Gmb 2.326 2.366 2.356 --
Air voids (%) 5.2* 4.7 5.2 --
Pba (%) 0.56 0.64 0.62 --
* The target air void content for the Superpave volumetric verification samples was 5.2%.
Table 1.152. Gradation, asphalt content, and volumetrics for plant-produced mix in Casa Grande, Arizona.
Figure 1.109. Locations of test sections in Casa Grande, Arizona.
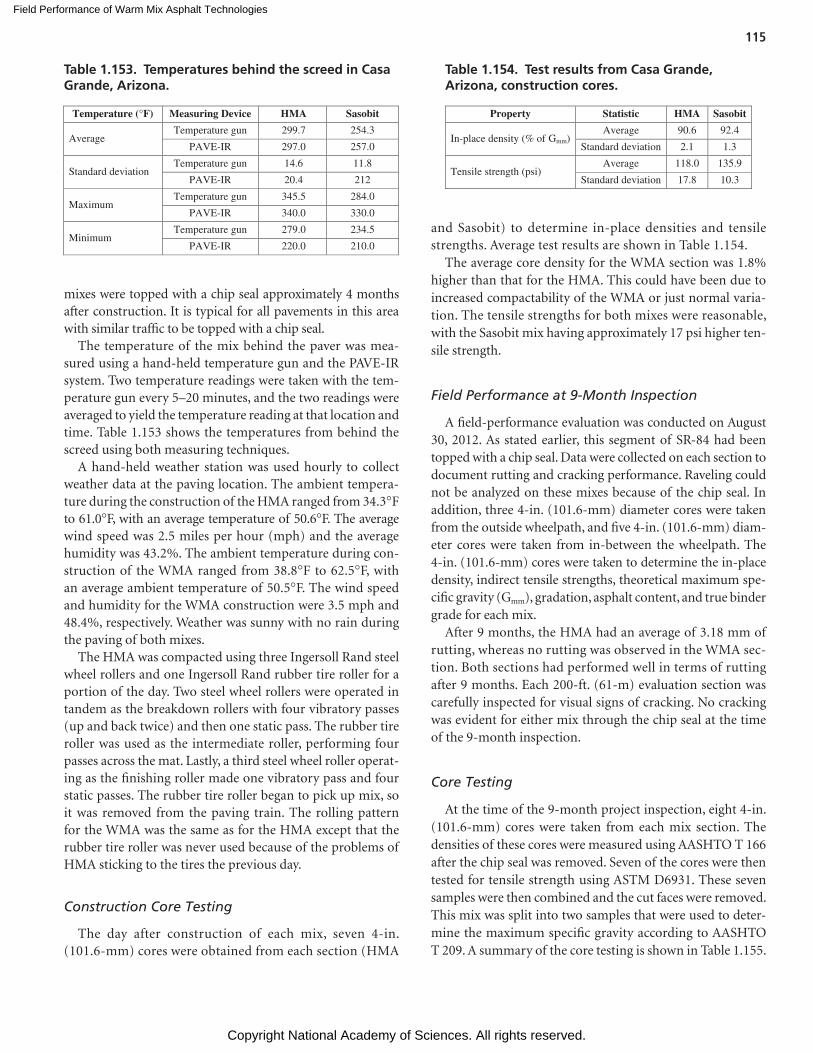
Field Performance of Warm Mix Asphalt Technologies
Copyright National Academy of Sciences. All rights reserved.
115
mixes were topped with a chip seal approximately 4 months after construction. It is typical for all pavements in this area with similar traffic to be topped with a chip seal.
The temperature of the mix behind the paver was mea-sured using a hand-held temperature gun and the PAVE-IR system. Two temperature readings were taken with the tem-perature gun every 5–20 minutes, and the two readings were averaged to yield the temperature reading at that location and time. Table 1.153 shows the temperatures from behind the screed using both measuring techniques.
A hand-held weather station was used hourly to collect weather data at the paving location. The ambient tempera-ture during the construction of the HMA ranged from 34.3°F to 61.0°F, with an average temperature of 50.6°F. The average wind speed was 2.5 miles per hour (mph) and the average humidity was 43.2%. The ambient temperature during con-struction of the WMA ranged from 38.8°F to 62.5°F, with an average ambient temperature of 50.5°F. The wind speed and humidity for the WMA construction were 3.5 mph and 48.4%, respectively. Weather was sunny with no rain during the paving of both mixes.
The HMA was compacted using three Ingersoll Rand steel wheel rollers and one Ingersoll Rand rubber tire roller for a portion of the day. Two steel wheel rollers were operated in tandem as the breakdown rollers with four vibratory passes (up and back twice) and then one static pass. The rubber tire roller was used as the intermediate roller, performing four passes across the mat. Lastly, a third steel wheel roller operat-ing as the finishing roller made one vibratory pass and four static passes. The rubber tire roller began to pick up mix, so it was removed from the paving train. The rolling pattern for the WMA was the same as for the HMA except that the rubber tire roller was never used because of the problems of HMA sticking to the tires the previous day.
Construction Core Testing
The day after construction of each mix, seven 4-in. (101.6-mm) cores were obtained from each section (HMA
and Sasobit) to determine in-place densities and tensile strengths. Average test results are shown in Table 1.154.
The average core density for the WMA section was 1.8% higher than that for the HMA. This could have been due to increased compactability of the WMA or just normal varia-tion. The tensile strengths for both mixes were reasonable, with the Sasobit mix having approximately 17 psi higher ten-sile strength.
Field Performance at 9-Month Inspection
A field-performance evaluation was conducted on August 30, 2012. As stated earlier, this segment of SR-84 had been topped with a chip seal. Data were collected on each section to document rutting and cracking performance. Raveling could not be analyzed on these mixes because of the chip seal. In addition, three 4-in. (101.6-mm) diameter cores were taken from the outside wheelpath, and five 4-in. (101.6-mm) diam-eter cores were taken from in-between the wheelpath. The 4-in. (101.6-mm) cores were taken to determine the in-place density, indirect tensile strengths, theoretical maximum spe-cific gravity (Gmm), gradation, asphalt content, and true binder grade for each mix.
After 9 months, the HMA had an average of 3.18 mm of rutting, whereas no rutting was observed in the WMA sec-tion. Both sections had performed well in terms of rutting after 9 months. Each 200-ft. (61-m) evaluation section was carefully inspected for visual signs of cracking. No cracking was evident for either mix through the chip seal at the time of the 9-month inspection.
Core Testing
At the time of the 9-month project inspection, eight 4-in. (101.6-mm) cores were taken from each mix section. The densities of these cores were measured using AASHTO T 166 after the chip seal was removed. Seven of the cores were then tested for tensile strength using ASTM D6931. These seven samples were then combined and the cut faces were removed. This mix was split into two samples that were used to deter-mine the maximum specific gravity according to AASHTO T 209. A summary of the core testing is shown in Table 1.155.
Temperature (°F) Measuring Device HMA Sasobit
Average Temperature gun 299.7 254.3
PAVE-IR 297.0 257.0
Standard deviation Temperature gun 14.6 11.8
PAVE-IR 20.4 212
Maximum Temperature gun 345.5 284.0
PAVE-IR 340.0 330.0
Minimum Temperature gun 279.0 234.5
PAVE-IR 220.0 210.0
Table 1.153. Temperatures behind the screed in Casa Grande, Arizona.
Property Statistic HMA Sasobit
In-place density (% of Gmm) Average 90.6 92.4
Standard deviation 2.1 1.3
Tensile strength (psi) Average 118.0 135.9
Standard deviation 17.8 10.3
Table 1.154. Test results from Casa Grande, Arizona, construction cores.
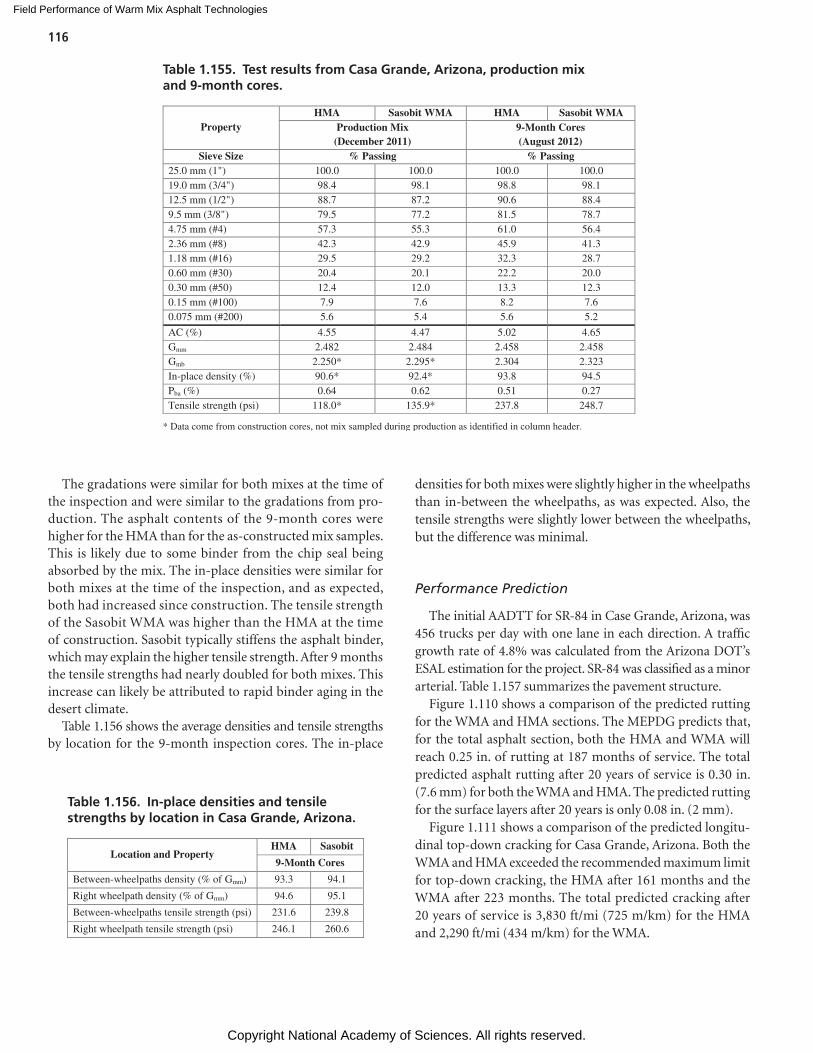
Field Performance of Warm Mix Asphalt Technologies
Copyright National Academy of Sciences. All rights reserved.
116
The gradations were similar for both mixes at the time of the inspection and were similar to the gradations from pro-duction. The asphalt contents of the 9-month cores were higher for the HMA than for the as-constructed mix samples. This is likely due to some binder from the chip seal being absorbed by the mix. The in-place densities were similar for both mixes at the time of the inspection, and as expected, both had increased since construction. The tensile strength of the Sasobit WMA was higher than the HMA at the time of construction. Sasobit typically stiffens the asphalt binder, which may explain the higher tensile strength. After 9 months the tensile strengths had nearly doubled for both mixes. This increase can likely be attributed to rapid binder aging in the desert climate.
Table 1.156 shows the average densities and tensile strengths by location for the 9-month inspection cores. The in-place
densities for both mixes were slightly higher in the wheelpaths than in-between the wheelpaths, as was expected. Also, the tensile strengths were slightly lower between the wheelpaths, but the difference was minimal.
Performance Prediction
The initial AADTT for SR-84 in Case Grande, Arizona, was 456 trucks per day with one lane in each direction. A traffic growth rate of 4.8% was calculated from the Arizona DOT’s ESAL estimation for the project. SR-84 was classified as a minor arterial. Table 1.157 summarizes the pavement structure.
Figure 1.110 shows a comparison of the predicted rutting for the WMA and HMA sections. The MEPDG predicts that, for the total asphalt section, both the HMA and WMA will reach 0.25 in. of rutting at 187 months of service. The total predicted asphalt rutting after 20 years of service is 0.30 in. (7.6 mm) for both the WMA and HMA. The predicted rutting for the surface layers after 20 years is only 0.08 in. (2 mm).
Figure 1.111 shows a comparison of the predicted longitu-dinal top-down cracking for Casa Grande, Arizona. Both the WMA and HMA exceeded the recommended maximum limit for top-down cracking, the HMA after 161 months and the WMA after 223 months. The total predicted cracking after 20 years of service is 3,830 ft/mi (725 m/km) for the HMA and 2,290 ft/mi (434 m/km) for the WMA.
Property HMA Sasobit WMA HMA Sasobit WMA
Production Mix (December 2011)
9-Month Cores (August 2012)
Sieve Size % Passing % Passing 25.0 mm (1") 100.0 100.0 100.0 100.0 19.0 mm (3/4") 98.4 98.1 98.8 98.1 12.5 mm (1/2") 88.7 87.2 90.6 88.4 9.5 mm (3/8") 79.5 77.2 81.5 78.7 4.75 mm (#4) 57.3 55.3 61.0 56.4 2.36 mm (#8) 42.3 42.9 45.9 41.3 1.18 mm (#16) 29.5 29.2 32.3 28.7 0.60 mm (#30) 20.4 20.1 22.2 20.0 0.30 mm (#50) 12.4 12.0 13.3 12.3 0.15 mm (#100) 7.9 7.6 8.2 7.6 0.075 mm (#200) 5.6 5.4 5.6 5.2
AC (%) 4.55 4.47 5.02 4.65 Gmm 2.482 2.484 2.458 2.458 Gmb 2.250* 2.295* 2.304 2.323 In-place density (%) 90.6* 92.4* 93.8 94.5 Pba (%) 0.64 0.62 0.51 0.27 Tensile strength (psi) 118.0* 135.9* 237.8 248.7
* Data come from construction cores, not mix sampled during production as identified in column header.
Table 1.155. Test results from Casa Grande, Arizona, production mix and 9-month cores.
Location and Property HMA Sasobit
9-Month Cores
Between-wheelpaths density (% of Gmm) 93.3 94.1
Right wheelpath density (% of Gmm) 94.6 95.1
Between-wheelpaths tensile strength (psi) 231.6 239.8
Right wheelpath tensile strength (psi) 246.1 260.6
Table 1.156. In-place densities and tensile strengths by location in Casa Grande, Arizona.
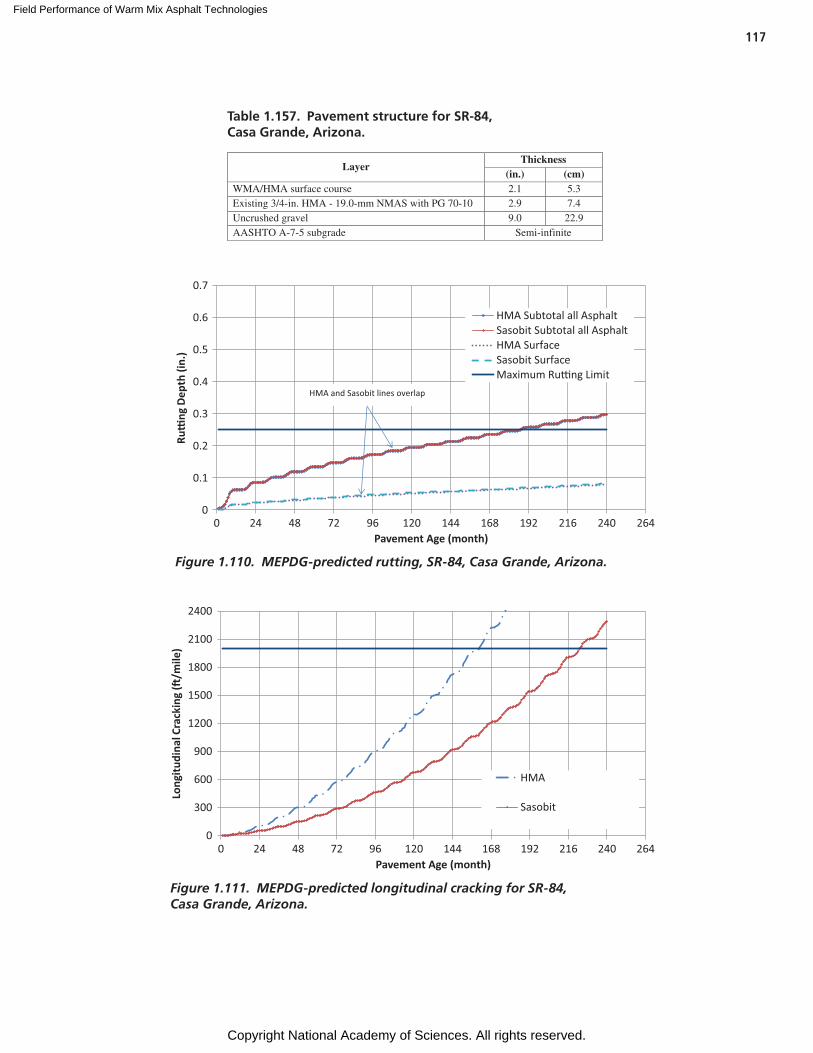
Field Performance of Warm Mix Asphalt Technologies
Copyright National Academy of Sciences. All rights reserved.
117
Layer Thickness
(in.) (cm) WMA/HMA surface course 2.1 5.3 Existing 3/4-in. HMA - 19.0-mm NMAS with PG 70-10 2.9 7.4 Uncrushed gravel 9.0 22.9 AASHTO A-7-5 subgrade Semi-infinite
Table 1.157. Pavement structure for SR-84, Casa Grande, Arizona.
0
0.1
0.2
0.3
0.4
0.5
0.6
0.7
0 24 48 72 96 120 144 168 192 216 240 264
Ru�
ng D
epth
(in.
)
Pavement Age (month)
HMA Subtotal all AsphaltSasobit Subtotal all AsphaltHMA SurfaceSasobit SurfaceMaximum Ru�ng Limit
HMA and Sasobit lines overlap
Figure 1.110. MEPDG-predicted rutting, SR-84, Casa Grande, Arizona.
0
300
600
900
1200
1500
1800
2100
2400
0 24 48 72 96 120 144 168 192 216 240 264
Long
itudi
nal C
rack
ing
(�/m
ile)
Pavement Age (month)
HMA
Sasobit
Figure 1.111. MEPDG-predicted longitudinal cracking for SR-84, Casa Grande, Arizona.
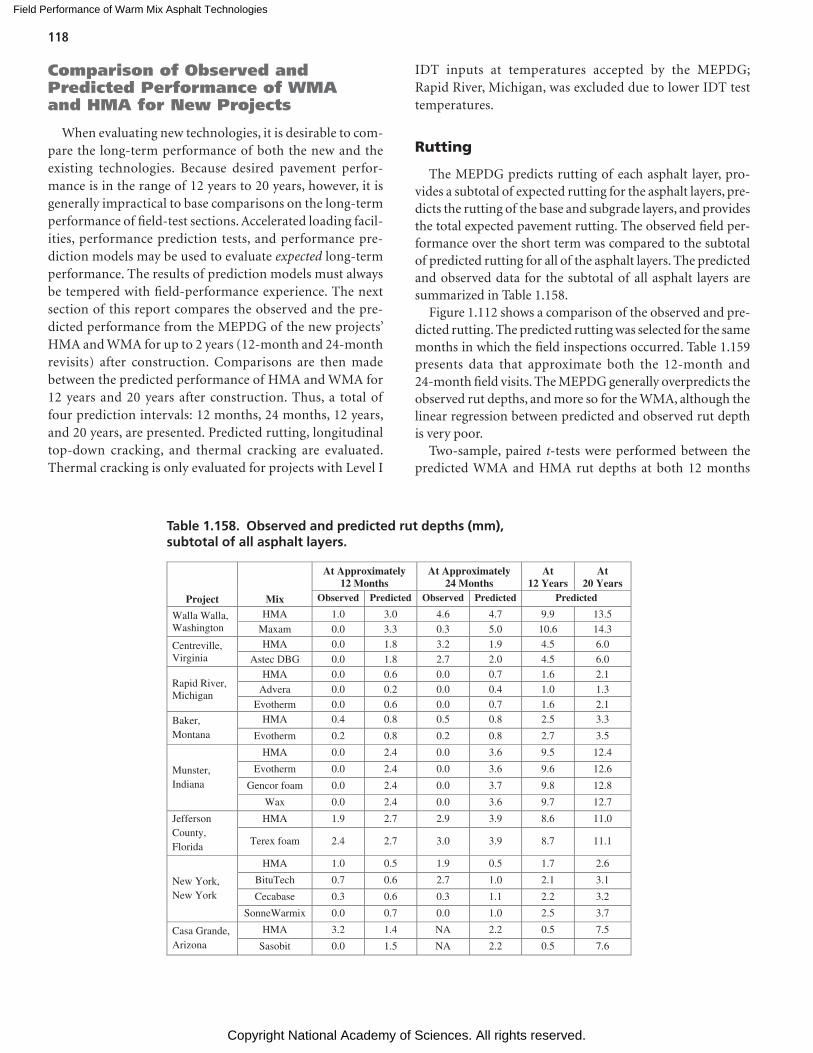
Field Performance of Warm Mix Asphalt Technologies
Copyright National Academy of Sciences. All rights reserved.
118
Comparison of Observed and Predicted Performance of WMA and HMA for New Projects
When evaluating new technologies, it is desirable to com-pare the long-term performance of both the new and the existing technologies. Because desired pavement perfor-mance is in the range of 12 years to 20 years, however, it is generally impractical to base comparisons on the long-term performance of field-test sections. Accelerated loading facil-ities, performance prediction tests, and performance pre-diction models may be used to evaluate expected long-term performance. The results of prediction models must always be tempered with field-performance experience. The next section of this report compares the observed and the pre-dicted performance from the MEPDG of the new projects’ HMA and WMA for up to 2 years (12-month and 24-month revisits) after construction. Comparisons are then made between the predicted performance of HMA and WMA for 12 years and 20 years after construction. Thus, a total of four prediction intervals: 12 months, 24 months, 12 years, and 20 years, are presented. Predicted rutting, longitudinal top-down cracking, and thermal cracking are evaluated. Thermal cracking is only evaluated for projects with Level I
IDT inputs at temperatures accepted by the MEPDG; Rapid River, Michigan, was excluded due to lower IDT test temperatures.
Rutting
The MEPDG predicts rutting of each asphalt layer, pro-vides a subtotal of expected rutting for the asphalt layers, pre-dicts the rutting of the base and subgrade layers, and provides the total expected pavement rutting. The observed field per-formance over the short term was compared to the subtotal of predicted rutting for all of the asphalt layers. The predicted and observed data for the subtotal of all asphalt layers are summarized in Table 1.158.
Figure 1.112 shows a comparison of the observed and pre-dicted rutting. The predicted rutting was selected for the same months in which the field inspections occurred. Table 1.159 presents data that approximate both the 12-month and 24-month field visits. The MEPDG generally overpredicts the observed rut depths, and more so for the WMA, although the linear regression between predicted and observed rut depth is very poor.
Two-sample, paired t-tests were performed between the predicted WMA and HMA rut depths at both 12 months
Project Mix
At Approximately 12 Months
At Approximately 24 Months
At 12 Years
At 20 Years
Observed Predicted Observed Predicted Predicted
Walla Walla, Washington
HMA 1.0 3.0 4.6 4.7 9.9 13.5
Maxam 0.0 3.3 0.3 5.0 10.6 14.3
Centreville, Virginia
HMA 0.0 1.8 3.2 1.9 4.5 6.0
Astec DBG 0.0 1.8 2.7 2.0 4.5 6.0
Rapid River, Michigan
HMA 0.0 0.6 0.0 0.7 1.6 2.1
Advera 0.0 0.2 0.0 0.4 1.0 1.3
Evotherm 0.0 0.6 0.0 0.7 1.6 2.1
Baker, Montana
HMA 0.4 0.8 0.5 0.8 2.5 3.3
Evotherm 0.2 0.8 0.2 0.8 2.7 3.5
Munster, Indiana
HMA 0.0 2.4 0.0 3.6 9.5 12.4
Evotherm 0.0 2.4 0.0 3.6 9.6 12.6
Gencor foam 0.0 2.4 0.0 3.7 9.8 12.8
Wax 0.0 2.4 0.0 3.6 9.7 12.7
Jefferson County, Florida
HMA 1.9 2.7 2.9 3.9 8.6 11.0
Terex foam 2.4 2.7 3.0 3.9 8.7 11.1
New York, New York
HMA 1.0 0.5 1.9 0.5 1.7 2.6
BituTech 0.7 0.6 2.7 1.0 2.1 3.1
Cecabase 0.3 0.6 0.3 1.1 2.2 3.2
SonneWarmix 0.0 0.7 0.0 1.0 2.5 3.7
Casa Grande, Arizona
HMA 3.2 1.4 NA 2.2 0.5 7.5
Sasobit 0.0 1.5 NA 2.2 0.5 7.6
Table 1.158. Observed and predicted rut depths (mm), subtotal of all asphalt layers.
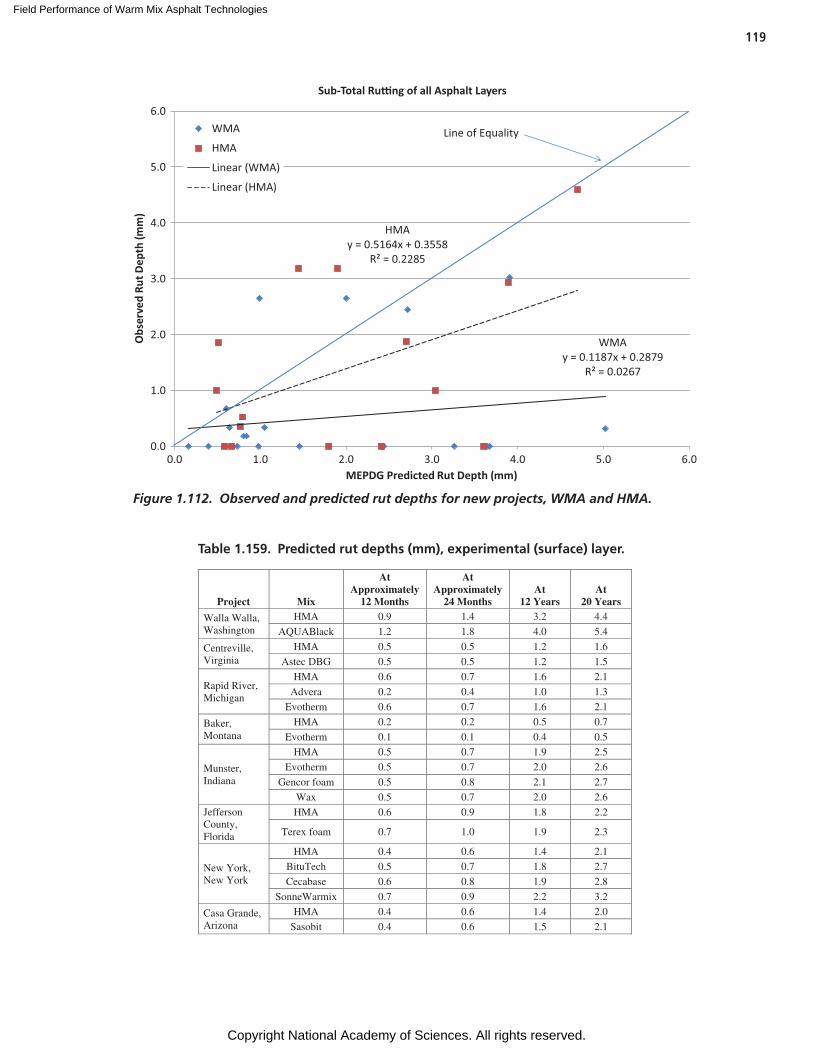
Field Performance of Warm Mix Asphalt Technologies
Copyright National Academy of Sciences. All rights reserved.
119
WMAy = 0.1187x + 0.2879
R² = 0.0267
HMAy = 0.5164x + 0.3558
R² = 0.2285
0.0
1.0
2.0
3.0
4.0
5.0
6.0
0.0 1.0 2.0 3.0 4.0 5.0 6.0
Obs
erve
d Ru
t Dep
th (m
m)
MEPDG Predicted Rut Depth (mm)
Sub-Total Ru�ng of all Asphalt Layers
WMA
HMA
Linear (WMA)
Linear (HMA)
Line of Equality
Figure 1.112. Observed and predicted rut depths for new projects, WMA and HMA.
Project Mix
At Approximately
12 Months
At Approximately
24 Months At
12 Years At
20 Years
Walla Walla, Washington
HMA 0.9 1.4 3.2 4.4
AQUABlack 1.2 1.8 4.0 5.4
Centreville, Virginia
HMA 0.5 0.5 1.2 1.6
Astec DBG 0.5 0.5 1.2 1.5
Rapid River, Michigan
HMA 0.6 0.7 1.6 2.1
Advera 0.2 0.4 1.0 1.3
Evotherm 0.6 0.7 1.6 2.1
Baker, Montana
HMA 0.2 0.2 0.5 0.7
Evotherm 0.1 0.1 0.4 0.5
Munster, Indiana
HMA 0.5 0.7 1.9 2.5
Evotherm 0.5 0.7 2.0 2.6
Gencor foam 0.5 0.8 2.1 2.7
Wax 0.5 0.7 2.0 2.6
Jefferson County, Florida
HMA 0.6 0.9 1.8 2.2
Terex foam 0.7 1.0 1.9 2.3
New York, New York
HMA 0.4 0.6 1.4 2.1
BituTech 0.5 0.7 1.8 2.7
Cecabase 0.6 0.8 1.9 2.8
SonneWarmix 0.7 0.9 2.2 3.2
Casa Grande, Arizona
HMA 0.4 0.6 1.4 2.0
Sasobit 0.4 0.6 1.5 2.1
Table 1.159. Predicted rut depths (mm), experimental (surface) layer.
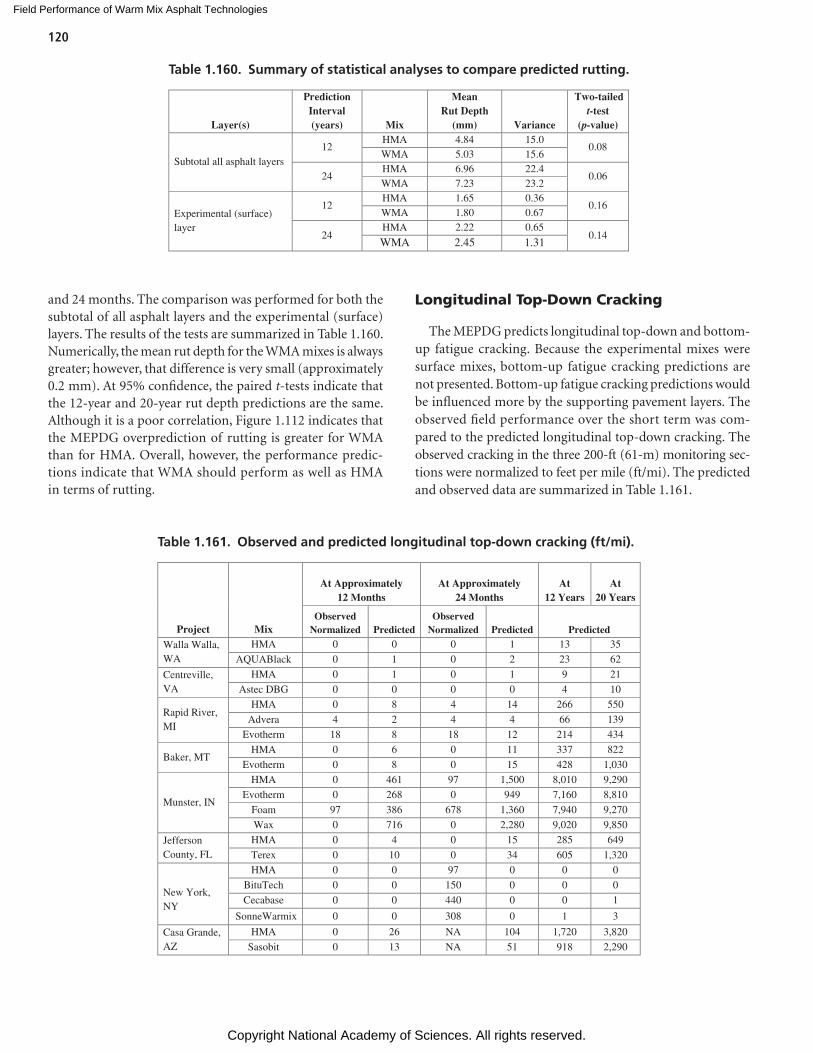
Field Performance of Warm Mix Asphalt Technologies
Copyright National Academy of Sciences. All rights reserved.
120
and 24 months. The comparison was performed for both the subtotal of all asphalt layers and the experimental (surface) layers. The results of the tests are summarized in Table 1.160. Numerically, the mean rut depth for the WMA mixes is always greater; however, that difference is very small (approximately 0.2 mm). At 95% confidence, the paired t-tests indicate that the 12-year and 20-year rut depth predictions are the same. Although it is a poor correlation, Figure 1.112 indicates that the MEPDG overprediction of rutting is greater for WMA than for HMA. Overall, however, the performance predic-tions indicate that WMA should perform as well as HMA in terms of rutting.
Longitudinal Top-Down Cracking
The MEPDG predicts longitudinal top-down and bottom-up fatigue cracking. Because the experimental mixes were surface mixes, bottom-up fatigue cracking predictions are not presented. Bottom-up fatigue cracking predictions would be influenced more by the supporting pavement layers. The observed field performance over the short term was com-pared to the predicted longitudinal top-down cracking. The observed cracking in the three 200-ft (61-m) monitoring sec-tions were normalized to feet per mile (ft/mi). The predicted and observed data are summarized in Table 1.161.
Layer(s)
Prediction Interval (years) Mix
Mean Rut Depth
(mm) Variance
Two-tailed t-test
(p-value)
Subtotal all asphalt layers 12
HMA 4.84 15.0 0.08
WMA 5.03 15.6
24 HMA 6.96 22.4
0.06 WMA 7.23 23.2
Experimental (surface) layer
12 HMA 1.65 0.36
0.16 WMA 1.80 0.67
24 HMA 2.22 0.65
0.14 WMA 2.45 1.31
Table 1.160. Summary of statistical analyses to compare predicted rutting.
Project Mix
At Approximately 12 Months
At Approximately 24 Months
At 12 Years
At
20 Years
Observed Normalized Predicted
Observed Normalized Predicted Predicted
Walla Walla, WA
HMA 0 0 0 1 13 35
AQUABlack 0 1 0 2 23 62
Centreville, VA
HMA 0 1 0 1 9 21
Astec DBG 0 0 0 0 4 10
Rapid River, MI
HMA 0 8 4 14 266 550
Advera 4 2 4 4 66 139
Evotherm 18 8 18 12 214 434
Baker, MT HMA 0 6 0 11 337 822
Evotherm 0 8 0 15 428 1,030
Munster, IN
HMA 0 461 97 1,500 8,010 9,290
Evotherm 0 268 0 949 7,160 8,810
Foam 97 386 678 1,360 7,940 9,270
Wax 0 716 0 2,280 9,020 9,850
Jefferson County, FL
HMA 0 4 0 15 285 649
Terex 0 10 0 34 605 1,320
New York, NY
HMA 0 0 97 0 0 0
BituTech 0 0 150 0 0 0
Cecabase 0 0 440 0 0 1
SonneWarmix 0 0 308 0 1 3
Casa Grande, AZ
HMA 0 26 NA 104 1,720 3,820
Sasobit 0 13 NA 51 918 2,290
Table 1.161. Observed and predicted longitudinal top-down cracking (ft/mi).
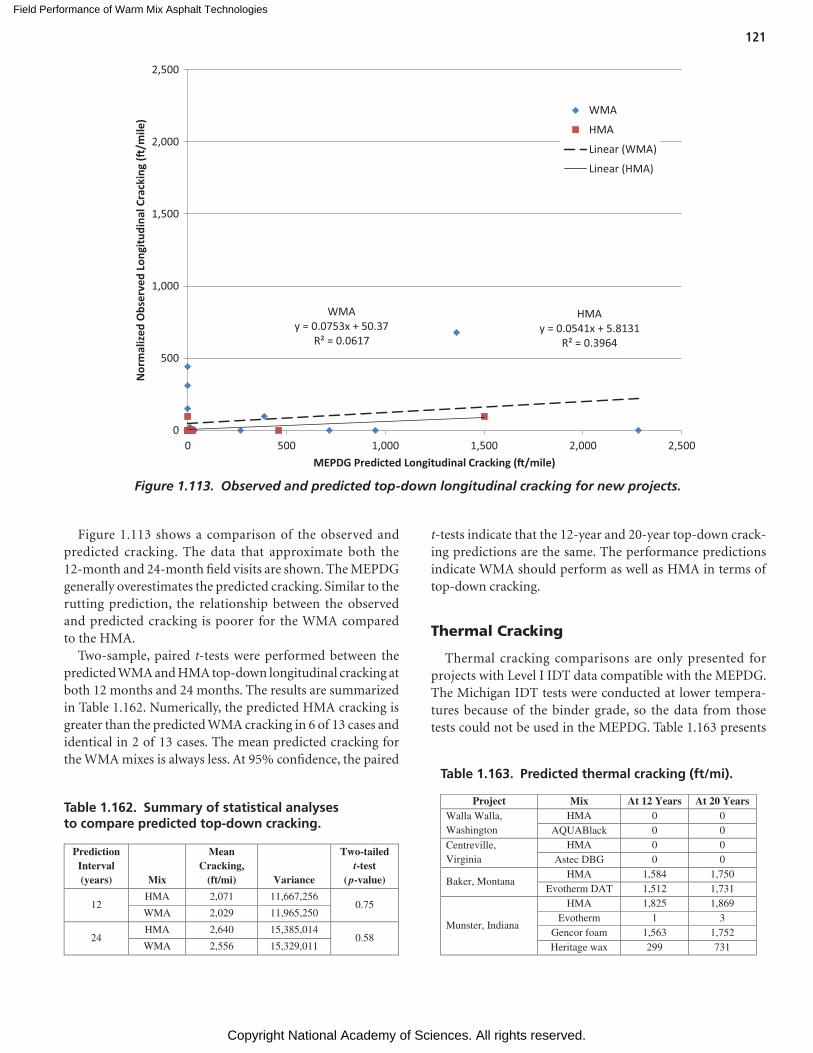
Field Performance of Warm Mix Asphalt Technologies
Copyright National Academy of Sciences. All rights reserved.
121
Figure 1.113 shows a comparison of the observed and predicted cracking. The data that approximate both the 12-month and 24-month field visits are shown. The MEPDG generally overestimates the predicted cracking. Similar to the rutting prediction, the relationship between the observed and predicted cracking is poorer for the WMA compared to the HMA.
Two-sample, paired t-tests were performed between the predicted WMA and HMA top-down longitudinal cracking at both 12 months and 24 months. The results are summarized in Table 1.162. Numerically, the predicted HMA cracking is greater than the predicted WMA cracking in 6 of 13 cases and identical in 2 of 13 cases. The mean predicted cracking for the WMA mixes is always less. At 95% confidence, the paired
WMAy = 0.0753x + 50.37
R² = 0.0617
HMAy = 0.0541x + 5.8131
R² = 0.3964
0
500
1,000
1,500
2,000
2,500
0 500 1,000 1,500 2,000 2,500
Nor
mal
ized
Obs
erve
d Lo
ngitu
dina
l Cra
ckin
g (�
/mile
)
MEPDG Predicted Longitudinal Cracking (�/mile)
WMA
HMA
Linear (WMA)
Linear (HMA)
Figure 1.113. Observed and predicted top-down longitudinal cracking for new projects.
t-tests indicate that the 12-year and 20-year top-down crack-ing predictions are the same. The performance predictions indicate WMA should perform as well as HMA in terms of top-down cracking.
Thermal Cracking
Thermal cracking comparisons are only presented for projects with Level I IDT data compatible with the MEPDG. The Michigan IDT tests were conducted at lower tempera-tures because of the binder grade, so the data from those tests could not be used in the MEPDG. Table 1.163 presents
Project Mix At 12 Years At 20 Years Walla Walla, Washington
HMA 0 0 AQUABlack 0 0
Centreville, Virginia
HMA 0 0 Astec DBG 0 0
Baker, Montana HMA 1,584 1,750
Evotherm DAT 1,512 1,731
Munster, Indiana
HMA 1,825 1,869 Evotherm 1 3
Gencor foam 1,563 1,752 Heritage wax 299 731
PredictionInterval(years) Mix
MeanCracking,
(ft/mi) Variance
Two-tailedt-test
( p-value)
12HMA 2,071 11,667,256
0.75WMA 2,029 11,965,250
24HMA 2,640 15,385,014
0.58WMA 2,556 15,329,011
Table 1.162. Summary of statistical analyses to compare predicted top-down cracking.
Table 1.163. Predicted thermal cracking (ft/mi).
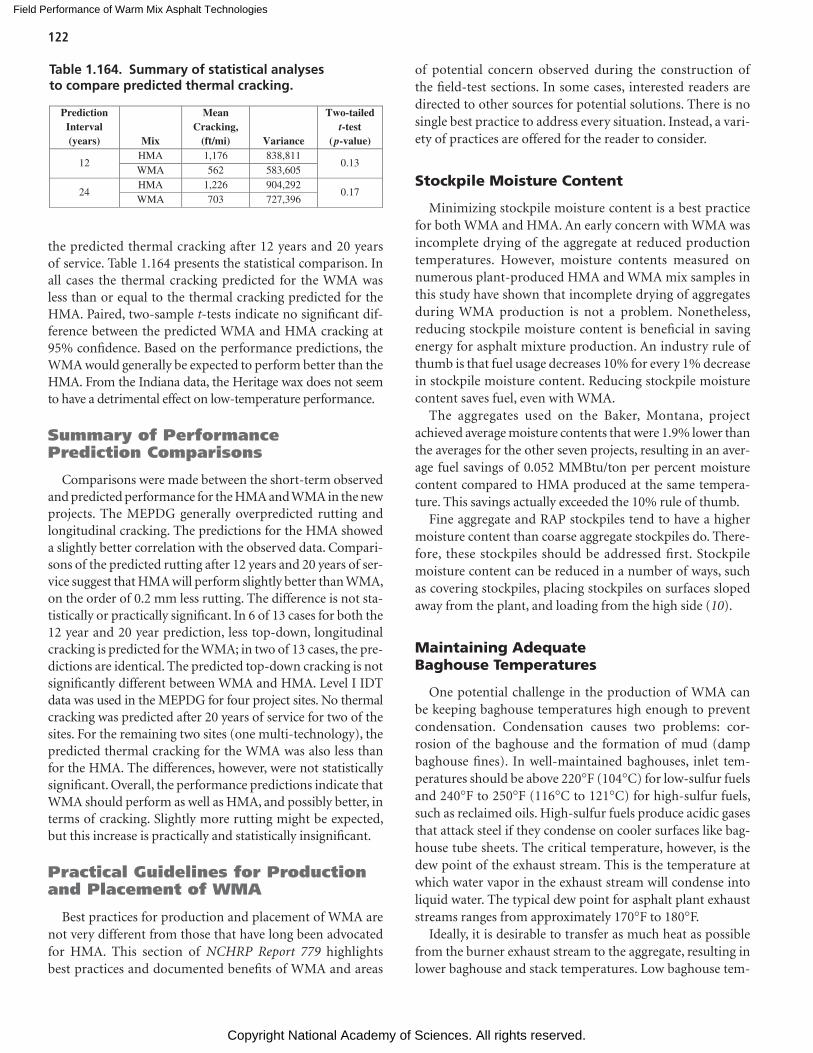
Field Performance of Warm Mix Asphalt Technologies
Copyright National Academy of Sciences. All rights reserved.
122
the predicted thermal cracking after 12 years and 20 years of service. Table 1.164 presents the statistical comparison. In all cases the thermal cracking predicted for the WMA was less than or equal to the thermal cracking predicted for the HMA. Paired, two-sample t-tests indicate no significant dif-ference between the predicted WMA and HMA cracking at 95% confidence. Based on the performance predictions, the WMA would generally be expected to perform better than the HMA. From the Indiana data, the Heritage wax does not seem to have a detrimental effect on low-temperature performance.
Summary of Performance Prediction Comparisons
Comparisons were made between the short-term observed and predicted performance for the HMA and WMA in the new projects. The MEPDG generally overpredicted rutting and longitudinal cracking. The predictions for the HMA showed a slightly better correlation with the observed data. Compari-sons of the predicted rutting after 12 years and 20 years of ser-vice suggest that HMA will perform slightly better than WMA, on the order of 0.2 mm less rutting. The difference is not sta-tistically or practically significant. In 6 of 13 cases for both the 12 year and 20 year prediction, less top-down, longitudinal cracking is predicted for the WMA; in two of 13 cases, the pre-dictions are identical. The predicted top-down cracking is not significantly different between WMA and HMA. Level I IDT data was used in the MEPDG for four project sites. No thermal cracking was predicted after 20 years of service for two of the sites. For the remaining two sites (one multi-technology), the predicted thermal cracking for the WMA was also less than for the HMA. The differences, however, were not statistically significant. Overall, the performance predictions indicate that WMA should perform as well as HMA, and possibly better, in terms of cracking. Slightly more rutting might be expected, but this increase is practically and statistically insignificant.
Practical Guidelines for Production and Placement of WMA
Best practices for production and placement of WMA are not very different from those that have long been advocated for HMA. This section of NCHRP Report 779 highlights best practices and documented benefits of WMA and areas
of potential concern observed during the construction of the field-test sections. In some cases, interested readers are directed to other sources for potential solutions. There is no single best practice to address every situation. Instead, a vari-ety of practices are offered for the reader to consider.
Stockpile Moisture Content
Minimizing stockpile moisture content is a best practice for both WMA and HMA. An early concern with WMA was incomplete drying of the aggregate at reduced production temperatures. However, moisture contents measured on numerous plant-produced HMA and WMA mix samples in this study have shown that incomplete drying of aggregates during WMA production is not a problem. Nonetheless, reducing stockpile moisture content is beneficial in saving energy for asphalt mixture production. An industry rule of thumb is that fuel usage decreases 10% for every 1% decrease in stockpile moisture content. Reducing stockpile moisture content saves fuel, even with WMA.
The aggregates used on the Baker, Montana, project achieved average moisture contents that were 1.9% lower than the averages for the other seven projects, resulting in an aver-age fuel savings of 0.052 MMBtu/ton per percent moisture content compared to HMA produced at the same tempera-ture. This savings actually exceeded the 10% rule of thumb.
Fine aggregate and RAP stockpiles tend to have a higher moisture content than coarse aggregate stockpiles do. There-fore, these stockpiles should be addressed first. Stockpile moisture content can be reduced in a number of ways, such as covering stockpiles, placing stockpiles on surfaces sloped away from the plant, and loading from the high side (10).
Maintaining Adequate Baghouse Temperatures
One potential challenge in the production of WMA can be keeping baghouse temperatures high enough to prevent condensation. Condensation causes two problems: cor-rosion of the baghouse and the formation of mud (damp baghouse fines). In well-maintained baghouses, inlet tem-peratures should be above 220°F (104°C) for low-sulfur fuels and 240°F to 250°F (116°C to 121°C) for high-sulfur fuels, such as reclaimed oils. High-sulfur fuels produce acidic gases that attack steel if they condense on cooler surfaces like bag-house tube sheets. The critical temperature, however, is the dew point of the exhaust stream. This is the temperature at which water vapor in the exhaust stream will condense into liquid water. The typical dew point for asphalt plant exhaust streams ranges from approximately 170°F to 180°F.
Ideally, it is desirable to transfer as much heat as possible from the burner exhaust stream to the aggregate, resulting in lower baghouse and stack temperatures. Low baghouse tem-
PredictionInterval (years) Mix
MeanCracking,
(ft/mi) Variance
Two-tailed t-test
( p-value)
12HMA 1,176 838,811
0.13WMA 562 583,605
24HMA 1,226 904,292
0.17WMA 703 727,396
Table 1.164. Summary of statistical analyses to compare predicted thermal cracking.
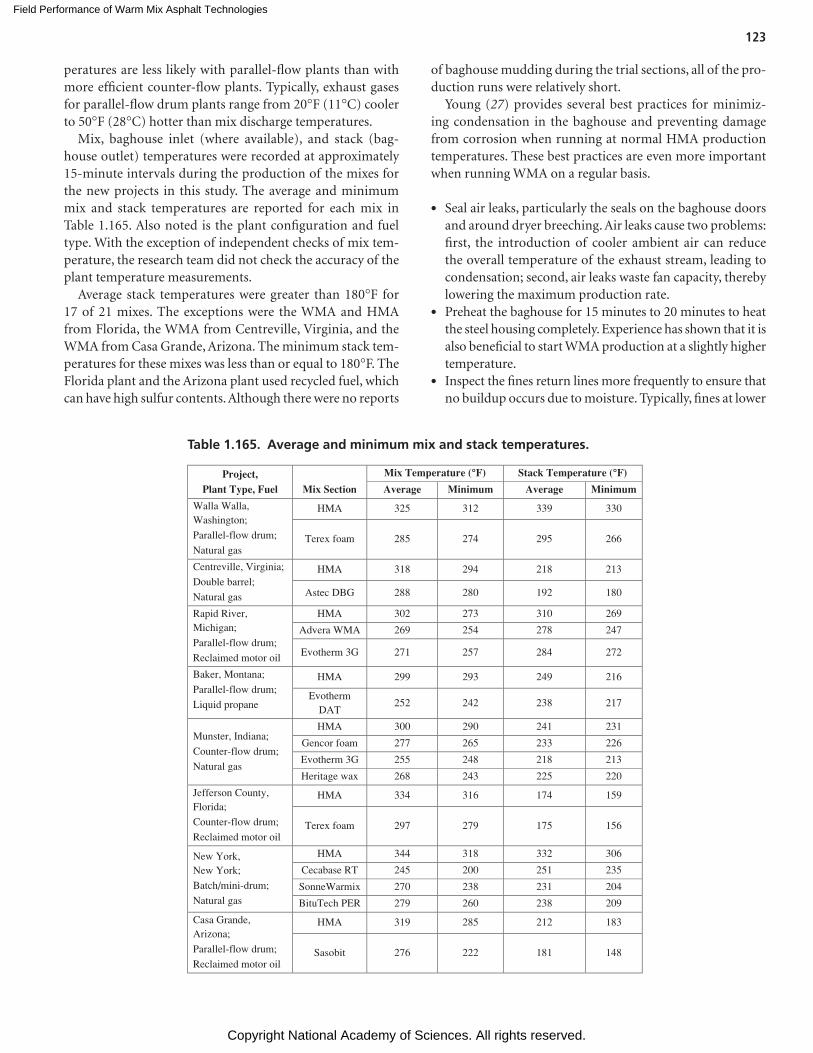
Field Performance of Warm Mix Asphalt Technologies
Copyright National Academy of Sciences. All rights reserved.
123
peratures are less likely with parallel-flow plants than with more efficient counter-flow plants. Typically, exhaust gases for parallel-flow drum plants range from 20°F (11°C) cooler to 50°F (28°C) hotter than mix discharge temperatures.
Mix, baghouse inlet (where available), and stack (bag-house outlet) temperatures were recorded at approximately 15-minute intervals during the production of the mixes for the new projects in this study. The average and minimum mix and stack temperatures are reported for each mix in Table 1.165. Also noted is the plant configuration and fuel type. With the exception of independent checks of mix tem-perature, the research team did not check the accuracy of the plant temperature measurements.
Average stack temperatures were greater than 180°F for 17 of 21 mixes. The exceptions were the WMA and HMA from Florida, the WMA from Centreville, Virginia, and the WMA from Casa Grande, Arizona. The minimum stack tem-peratures for these mixes was less than or equal to 180°F. The Florida plant and the Arizona plant used recycled fuel, which can have high sulfur contents. Although there were no reports
of baghouse mudding during the trial sections, all of the pro-duction runs were relatively short.
Young (27) provides several best practices for minimiz-ing condensation in the baghouse and preventing damage from corrosion when running at normal HMA production temperatures. These best practices are even more important when running WMA on a regular basis.
• Seal air leaks, particularly the seals on the baghouse doors and around dryer breeching. Air leaks cause two problems: first, the introduction of cooler ambient air can reduce the overall temperature of the exhaust stream, leading to condensation; second, air leaks waste fan capacity, thereby lowering the maximum production rate.
• Preheat the baghouse for 15 minutes to 20 minutes to heat the steel housing completely. Experience has shown that it is also beneficial to start WMA production at a slightly higher temperature.
• Inspect the fines return lines more frequently to ensure that no buildup occurs due to moisture. Typically, fines at lower
Project, Plant Type, Fuel Mix Section
Mix Temperature (°F) Stack Temperature (°F)
Average Minimum Average Minimum
Walla Walla, Washington;
Parallel-flow drum;
Natural gas
HMA 325 312 339 330
Terex foam 285 274 295 266
Centreville, Virginia;
Double barrel;
Natural gas
HMA 318 294 218 213
Astec DBG 288 280 192 180
Rapid River, Michigan;
Parallel-flow drum;
Reclaimed motor oil
HMA 302 273 310 269
Advera WMA 269 254 278 247
Evotherm 3G 271 257 284 272
Baker, Montana;
Parallel-flow drum;
Liquid propane
HMA 299 293 249 216
Evotherm DAT
252 242 238 217
Munster, Indiana;
Counter-flow drum;
Natural gas
HMA 300 290 241 231
Gencor foam 277 265 233 226
Evotherm 3G 255 248 218 213
Heritage wax 268 243 225 220
Jefferson County, Florida;
Counter-flow drum;
Reclaimed motor oil
HMA 334 316 174 159
Terex foam 297 279 175 156
New York, New York;
Batch/mini-drum;
Natural gas
HMA 344 318 332 306
Cecabase RT 245 200 251 235
SonneWarmix 270 238 231 204
BituTech PER 279 260 238 209
Casa Grande, Arizona;
Parallel-flow drum;
Reclaimed motor oil
HMA 319 285 212 183
Sasobit 276 222 181 148
Table 1.165. Average and minimum mix and stack temperatures.
Field Performance of Warm Mix Asphalt Technologies
Copyright National Academy of Sciences. All rights reserved.
124
temperatures are more susceptible to moisture, affecting flow back into the mix.
• Condensation may only occur in a limited portion of the baghouse, such as the windward side. In this case, periodic painting of the interior surfaces can minimize corrosion, and insulation of exterior surfaces can reduce heat loss.
The minimum exhaust temperature necessary to avoid problems with condensation and returning baghouse fines will vary from plant to plant and from mix to mix. Cold weather and high aggregate moisture can be a dangerous combination when it comes to condensation and dust problems. Tight, well-maintained plants can be more sensitive to condensation because of higher moisture concentrations in the exhaust gas. Several strategies suitable for increasing baghouse tempera-tures are outlined in Prowell, Hurley, and Frank’s Warm Mix Asphalt: Best Practices, 3rd edition (10). Some of these strate-gies are quick to implement and others are inexpensive. Also, some options require equipment upgrades that offer more benefits than simply raising stack temperatures.
Burner Performance
An improperly tuned burner can increase fuel usage and result in mix contamination. An expert on the NCHRP Proj-ect 9-47A project team conducted burner tuning for the team before each of the multi-technology projects (in Michigan, Indiana, and New York). One plant had a 24.8% reduction in fuel usage for HMA after burner tuning. One symptom of improper burner adjustment and maintenance is unburned fuel. Unburned liquid fuels can contaminate the mix, leading to a binder that is less stiff than desired. The potential for mix damage from uncombusted fuel is probably greater for WMA than for HMA, because unburned fuel is more likely to vapor-ize at HMA temperatures. Uncombusted fuel was observed in a few early WMA trial projects before this study was initiated. WMA contaminated with fuel oil can be detected by a brown coloration of the coated aggregate. Performance testing of fuel- contaminated mixes will also yield increased rutting susceptibil-ity and lower dynamic modulus (stiffness) values. If fuels are not combusted, stack emissions tests will also indicate elevated levels of carbon monoxide (CO) and total hydrocarbons (THC).
Most burners have one modulating actuator motor with mechanical linkage driving dampers and fuel valves. The challenge with a mechanical linkage is making sure that the air-to-fuel ratio is optimal through the full operating range. Some contractors have reported difficulties adjusting burn-ers to sufficiently low levels to reach the desired production temperatures for WMA. This problem has generally been exacerbated when the plant runs at a very slow production rate for a small WMA trial. At normal production rates, most burners should be able to produce the lower temperatures
required for WMA. In any case, a contractor attempting their first WMA trial should have an experienced burner techni-cian inspect the burner and aid with adjustments.
Uncombusted fuel can result from a number of causes with both WMA and HMA. Clogged burner nozzles and fuel filters are always good places to start looking. When burn-ing heavy or reclaimed fuel oil, accelerated pump wear and challenges in maintaining the fuel preheater temperatures to obtain a suitable viscosity for fuel atomization are frequent problem areas.
Producing Mixes with RAP and RAS
The addition of even a relatively small percentage of RAP to WMA can greatly aid in drying the virgin aggregate and increasing the baghouse temperature with no detrimental consequences. For a discharge temperature of 220°F, the virgin aggregate must be superheated to a temperature of 280°F for a batch plant running a mixture with 10% RAP with a mois-ture content of 3% (27). Superheating the virgin aggregate will increase the likelihood that the internal moisture in the virgin aggregate is removed. Superheating the virgin aggregate will also increase the temperature of the exhaust gases going to the baghouse. Thus, the addition of a small amount of RAP helps to satisfy both needs. The mix designs for seven of eight NCHRP Project 9-47A field trials included at least 12% RAP; the Baker, Montana, project used a virgin mix.
On the performance side, one purported benefit of WMA is reduced aging of the binder. Performance grading of binder recovered from the NCHRP Project 9-47A field sec-tions generally supports this. Nine of 14 WMA mixes had low-temperature true grades that were lower than the cor-responding HMA control mixes. The five remaining WMAs had low-temperature true grades within 0.6°C of the HMA control. Only one WMA had a recovered high-temperature true grade higher than its corresponding HMA (Virginia, 1.2°C). The addition of RAP to WMA production also can be expected to increase the early-life composite stiffness of the mixture, helping to counteract any concerns over the impact of reduced aging on high-temperature performance.
Placement Changes
Several contractors have commented that equipment remains cleaner, with less asphalt buildup, when placing WMA. In a few instances, material flow issues have been observed at asphalt plants and when dumping into transfer vehicles or pavers; these issues most likely occur because of the reduced temperatures. Observed differences included the following:
• Sluggish flow of mix into vertical bucket elevator (in a project that preceded NCHRP Project 9-47A), resolved by a slight increase in mix temperature
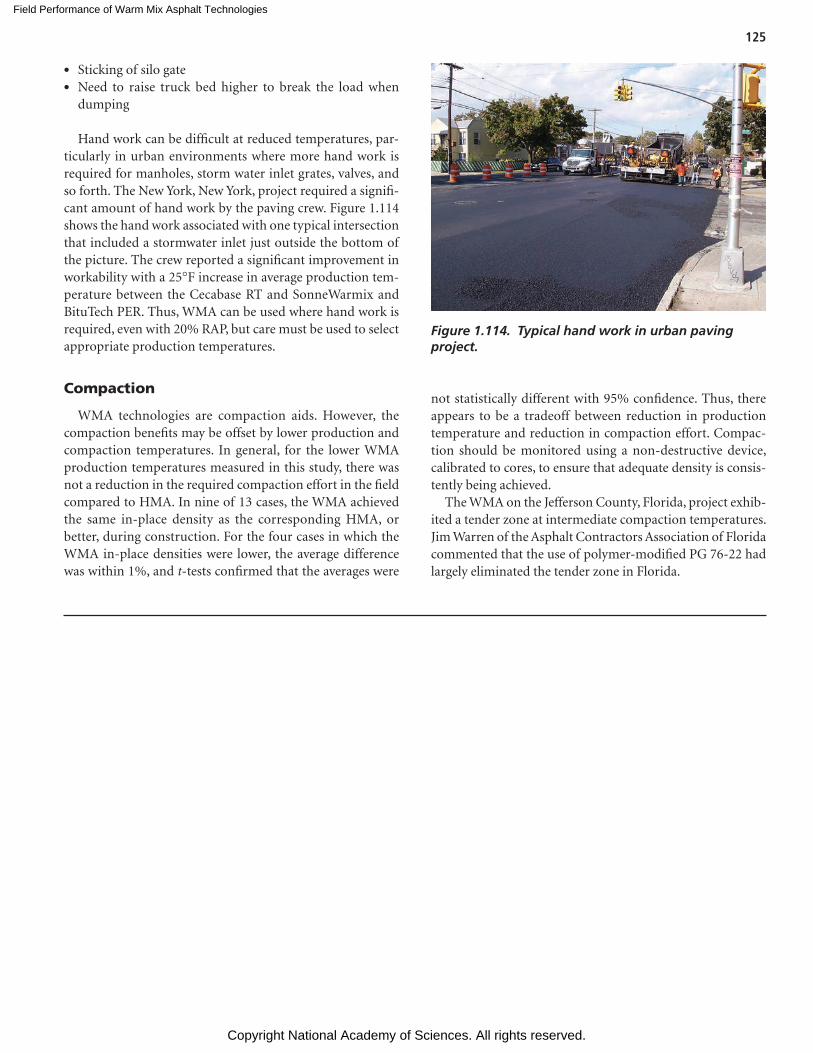
Field Performance of Warm Mix Asphalt Technologies
Copyright National Academy of Sciences. All rights reserved.
125
• Sticking of silo gate• Need to raise truck bed higher to break the load when
dumping
Hand work can be difficult at reduced temperatures, par-ticularly in urban environments where more hand work is required for manholes, storm water inlet grates, valves, and so forth. The New York, New York, project required a signifi-cant amount of hand work by the paving crew. Figure 1.114 shows the hand work associated with one typical intersection that included a stormwater inlet just outside the bottom of the picture. The crew reported a significant improvement in workability with a 25°F increase in average production tem-perature between the Cecabase RT and SonneWarmix and BituTech PER. Thus, WMA can be used where hand work is required, even with 20% RAP, but care must be used to select appropriate production temperatures.
Compaction
WMA technologies are compaction aids. However, the compaction benefits may be offset by lower production and compaction temperatures. In general, for the lower WMA production temperatures measured in this study, there was not a reduction in the required compaction effort in the field compared to HMA. In nine of 13 cases, the WMA achieved the same in-place density as the corresponding HMA, or better, during construction. For the four cases in which the WMA in-place densities were lower, the average difference was within 1%, and t-tests confirmed that the averages were
not statistically different with 95% confidence. Thus, there appears to be a tradeoff between reduction in production temperature and reduction in compaction effort. Compac-tion should be monitored using a non-destructive device, calibrated to cores, to ensure that adequate density is consis-tently being achieved.
The WMA on the Jefferson County, Florida, project exhib-ited a tender zone at intermediate compaction temperatures. Jim Warren of the Asphalt Contractors Association of Florida commented that the use of polymer-modified PG 76-22 had largely eliminated the tender zone in Florida.
Figure 1.114. Typical hand work in urban paving project.
Field Performance of Warm Mix Asphalt Technologies
Copyright National Academy of Sciences. All rights reserved.
126
Statistical analyses were conducted to assess whether dif-ferences exist between warm mix asphalt (WMA) and hot mix asphalt (HMA) for the binder properties, mix char-acteristics, in-place properties, and laboratory-measured engineering properties. For projects with one WMA and an HMA control, F tests and t-tests were used to compare the characteristics and properties that have replicate data with a 90% confidence interval (a = 0.10). F tests were used to com-pare variances of the properties; t-tests were used to com-pare means of the properties. For projects with more than one WMA technology, an analysis of variance (ANOVA) was used to detect statistical differences among the results. Some test results, such as tensile strength ratio (TSR), do not have replicate data because they are computed from average tensile strength results. Comparisons of such properties for WMA and HMA were made using paired t-tests with the results from all projects.
For the mix properties, statistical analysis results were used to compare WMA and HMA sections in terms of equal, lower, or higher performance. Equal performance indicates that no statistical differences were found in the results, and lower or higher performance indicates that there were differences between them.
Binder Properties
The performance grades of the recovered asphalt binders were determined in accordance with AASHTO M 320 and AASHTO R 29 for all the mixes of each project under study. For the new projects, asphalt binders were recovered from mixes sampled during construction and cores from inspec-tions at approximately 1 and 2 years after construction. For the existing projects, asphalt binders were recovered from cores obtained from one inspection only; the ages of these cores vary depending on the project and range between 30 months and 65 months.
Tables 1.166 to 1.173 present the true grade and perfor-mance grade of the extracted binders for all the mixes of each new project. The results are as follows:
Walla, Walla, Washington (Table 1.166). The performance grades were the same for both WMA and HMA recovered binders at three different ages (at production, at 13 months, and at 27 months). The high performance grade for both HMA and WMA binders were one grade lower at 13 months and 27 months than the high performance grade at production.
Centreville, Virginia (Table 1.167). The performance grades were the same for HMA and WMA binders for the production mix and 24-month cores. For the 15-month cores, the high performance grade of the WMA-Astec DBG binder was one grade lower than the HMA binder. The low perfor-mance grade for the WMA binder at 15 months was about 4 degrees lower than the HMA binder. It is also observed that the high performance grades for WMA and HMA binders were one grade lower at 24 months compared to the produc-tion mix, which is not expected since the binders should show a stiffer behavior.
Rapid River, Michigan (Table 1.168). At production, the performance grades were the same for HMA and WMA binders. At 13 months, the performance grades were the same for the WMA-Evotherm and HMA binders, and the high and low performance grades of the WMA-Advera binders were one grade higher than the HMA binder. At 22 months, the high performance grades were the same for the HMA and WMA-Advera binders, but the WMA-Evotherm binder was one grade lower than the HMA binder. The low performance grades were the same for all binders.
Baker, Montana (Table 1.169). The performance grades were the same for binders recovered from WMA and HMA at two different ages, production and 13 months. At 22 months, the WMA-Evotherm DAT binder was one grade lower at the
C H A P T E R 4
Engineering Properties of HMA and WMA
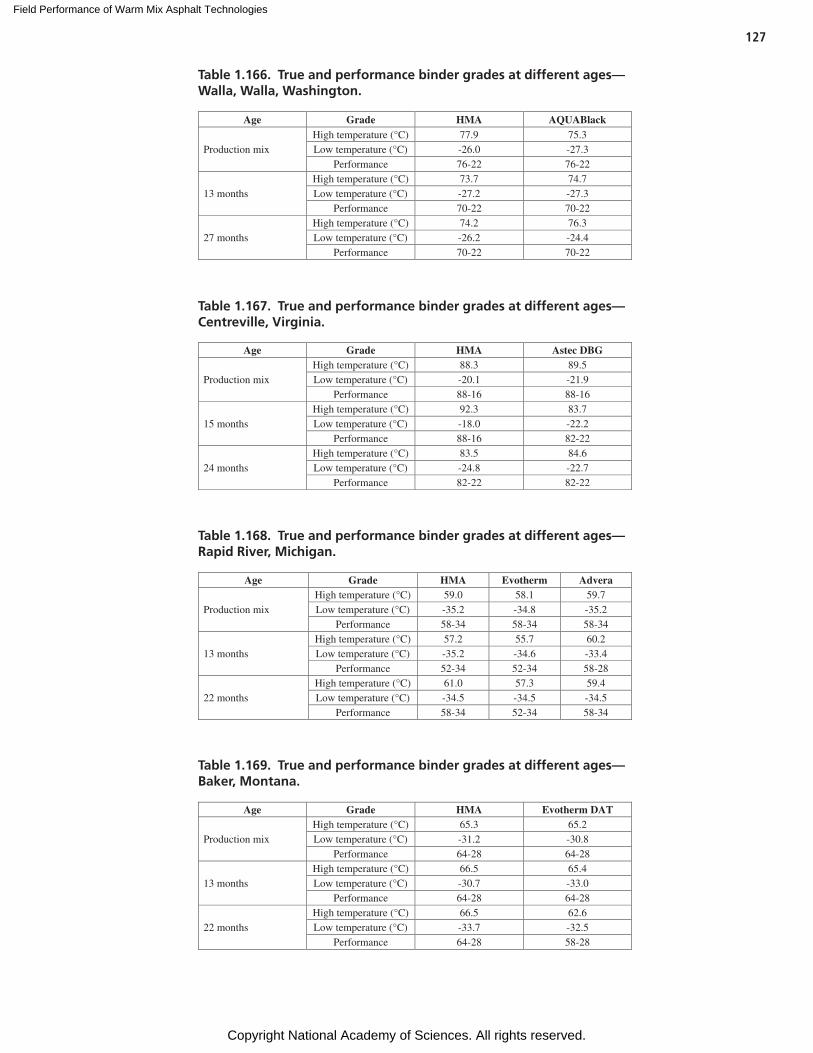
Field Performance of Warm Mix Asphalt Technologies
Copyright National Academy of Sciences. All rights reserved.
127
Age Grade HMA AQUABlack
Production mix High temperature (°C) 77.9 75.3 Low temperature (°C) -26.0 -27.3
Performance 76-22 76-22
13 months High temperature (°C) 73.7 74.7 Low temperature (°C) -27.2 -27.3
Performance 70-22 70-22
27 months High temperature (°C) 74.2 76.3 Low temperature (°C) -26.2 -24.4
Performance 70-22 70-22
Table 1.166. True and performance binder grades at different ages—Walla, Walla, Washington.
Age Grade HMA Astec DBG
Production mix High temperature (°C) 88.3 89.5 Low temperature (°C) -20.1 -21.9
Performance 88-16 88-16
15 months High temperature (°C) 92.3 83.7 Low temperature (°C) -18.0 -22.2
Performance 88-16 82-22
24 months High temperature (°C) 83.5 84.6 Low temperature (°C) -24.8 -22.7
Performance 82-22 82-22
Table 1.167. True and performance binder grades at different ages—Centreville, Virginia.
Age Grade HMA Evotherm Advera
Production mix High temperature (°C) 59.0 58.1 59.7 Low temperature (°C) -35.2 -34.8 -35.2
Performance 58-34 58-34 58-34
13 months High temperature (°C) 57.2 55.7 60.2 Low temperature (°C) -35.2 -34.6 -33.4
Performance 52-34 52-34 58-28
22 months High temperature (°C) 61.0 57.3 59.4 Low temperature (°C) -34.5 -34.5 -34.5
Performance 58-34 52-34 58-34
Table 1.168. True and performance binder grades at different ages—Rapid River, Michigan.
Age Grade HMA Evotherm DAT
Production mix High temperature (°C) 65.3 65.2 Low temperature (°C) -31.2 -30.8
Performance 64-28 64-28
13 months High temperature (°C) 66.5 65.4 Low temperature (°C) -30.7 -33.0
Performance 64-28 64-28
22 months High temperature (°C) 66.5 62.6 Low temperature (°C) -33.7 -32.5
Performance 64-28 58-28
Table 1.169. True and performance binder grades at different ages—Baker, Montana.
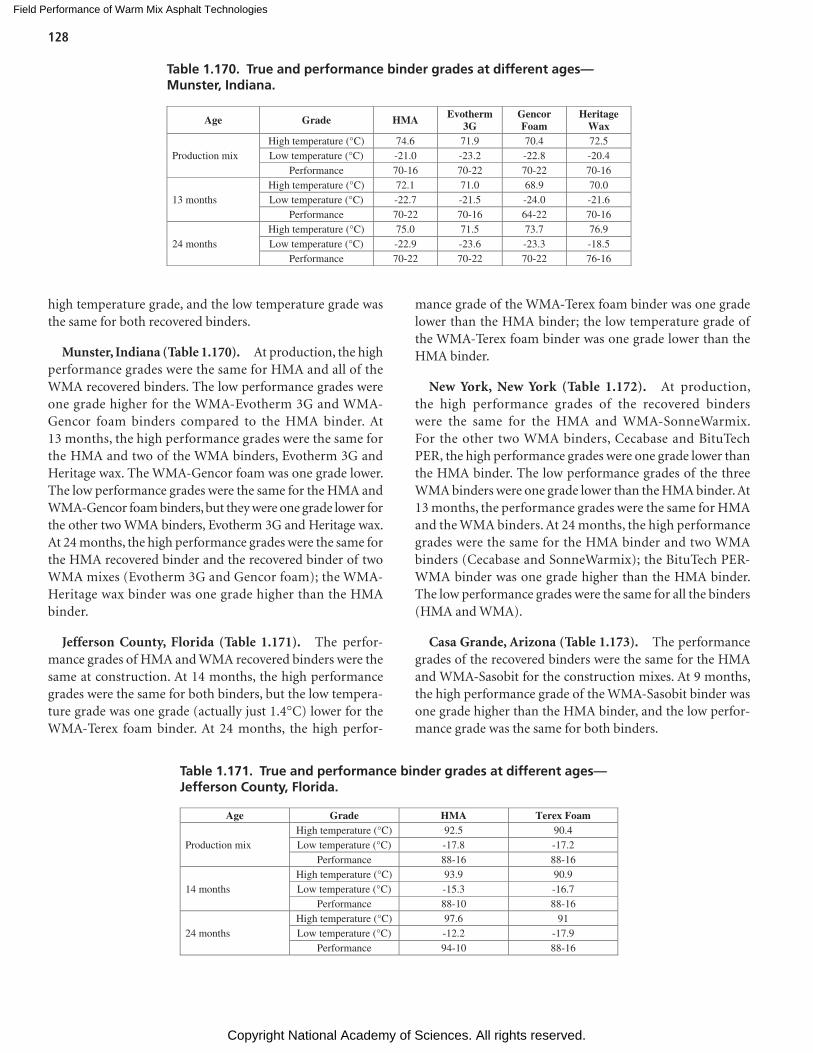
Field Performance of Warm Mix Asphalt Technologies
Copyright National Academy of Sciences. All rights reserved.
128
high temperature grade, and the low temperature grade was the same for both recovered binders.
Munster, Indiana (Table 1.170). At production, the high performance grades were the same for HMA and all of the WMA recovered binders. The low performance grades were one grade higher for the WMA-Evotherm 3G and WMA-Gencor foam binders compared to the HMA binder. At 13 months, the high performance grades were the same for the HMA and two of the WMA binders, Evotherm 3G and Heritage wax. The WMA-Gencor foam was one grade lower. The low performance grades were the same for the HMA and WMA-Gencor foam binders, but they were one grade lower for the other two WMA binders, Evotherm 3G and Heritage wax. At 24 months, the high performance grades were the same for the HMA recovered binder and the recovered binder of two WMA mixes (Evotherm 3G and Gencor foam); the WMA-Heritage wax binder was one grade higher than the HMA binder.
Jefferson County, Florida (Table 1.171). The perfor-mance grades of HMA and WMA recovered binders were the same at construction. At 14 months, the high performance grades were the same for both binders, but the low tempera-ture grade was one grade (actually just 1.4°C) lower for the WMA-Terex foam binder. At 24 months, the high perfor-
mance grade of the WMA-Terex foam binder was one grade lower than the HMA binder; the low temperature grade of the WMA-Terex foam binder was one grade lower than the HMA binder.
New York, New York (Table 1.172). At production, the high performance grades of the recovered binders were the same for the HMA and WMA-SonneWarmix. For the other two WMA binders, Cecabase and BituTech PER, the high performance grades were one grade lower than the HMA binder. The low performance grades of the three WMA binders were one grade lower than the HMA binder. At 13 months, the performance grades were the same for HMA and the WMA binders. At 24 months, the high performance grades were the same for the HMA binder and two WMA binders (Cecabase and SonneWarmix); the BituTech PER-WMA binder was one grade higher than the HMA binder. The low performance grades were the same for all the binders (HMA and WMA).
Casa Grande, Arizona (Table 1.173). The performance grades of the recovered binders were the same for the HMA and WMA-Sasobit for the construction mixes. At 9 months, the high performance grade of the WMA-Sasobit binder was one grade higher than the HMA binder, and the low perfor-mance grade was the same for both binders.
Age Grade HMA Evotherm
3G Gencor Foam
Heritage Wax
Production mix High temperature (°C) 74.6 71.9 70.4 72.5 Low temperature (°C) -21.0 -23.2 -22.8 -20.4
Performance 70-16 70-22 70-22 70-16
13 months High temperature (°C) 72.1 71.0 68.9 70.0 Low temperature (°C) -22.7 -21.5 -24.0 -21.6
Performance 70-22 70-16 64-22 70-16
24 months High temperature (°C) 75.0 71.5 73.7 76.9 Low temperature (°C) -22.9 -23.6 -23.3 -18.5
Performance 70-22 70-22 70-22 76-16
Table 1.170. True and performance binder grades at different ages—Munster, Indiana.
Age Grade HMA Terex Foam
Production mix High temperature (°C) 92.5 90.4 Low temperature (°C) -17.8 -17.2
Performance 88-16 88-16
14 months High temperature (°C) 93.9 90.9 Low temperature (°C) -15.3 -16.7
Performance 88-10 88-16
24 months High temperature (°C) 97.6 91 Low temperature (°C) -12.2 -17.9
Performance 94-10 88-16
Table 1.171. True and performance binder grades at different ages—Jefferson County, Florida.
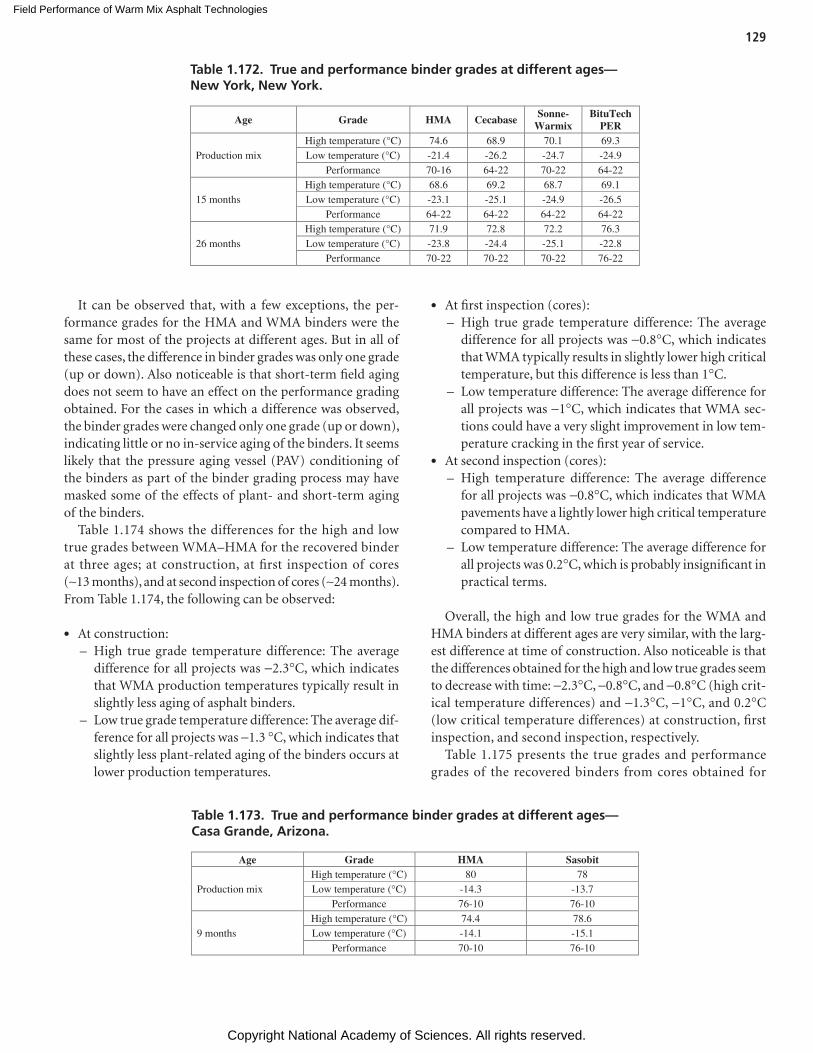
Field Performance of Warm Mix Asphalt Technologies
Copyright National Academy of Sciences. All rights reserved.
129
It can be observed that, with a few exceptions, the per-formance grades for the HMA and WMA binders were the same for most of the projects at different ages. But in all of these cases, the difference in binder grades was only one grade (up or down). Also noticeable is that short-term field aging does not seem to have an effect on the performance grading obtained. For the cases in which a difference was observed, the binder grades were changed only one grade (up or down), indicating little or no in-service aging of the binders. It seems likely that the pressure aging vessel (PAV) conditioning of the binders as part of the binder grading process may have masked some of the effects of plant- and short-term aging of the binders.
Table 1.174 shows the differences for the high and low true grades between WMA–HMA for the recovered binder at three ages; at construction, at first inspection of cores (~13 months), and at second inspection of cores (~24 months). From Table 1.174, the following can be observed:
• At construction: – High true grade temperature difference: The average
difference for all projects was -2.3°C, which indicates that WMA production temperatures typically result in slightly less aging of asphalt binders.
– Low true grade temperature difference: The average dif-ference for all projects was -1.3 °C, which indicates that slightly less plant-related aging of the binders occurs at lower production temperatures.
• At first inspection (cores): – High true grade temperature difference: The average
difference for all projects was -0.8°C, which indicates that WMA typically results in slightly lower high critical temperature, but this difference is less than 1°C.
– Low temperature difference: The average difference for all projects was -1°C, which indicates that WMA sec-tions could have a very slight improvement in low tem-perature cracking in the first year of service.
• At second inspection (cores): – High temperature difference: The average difference
for all projects was -0.8°C, which indicates that WMA pavements have a lightly lower high critical temperature compared to HMA.
– Low temperature difference: The average difference for all projects was 0.2°C, which is probably insignificant in practical terms.
Overall, the high and low true grades for the WMA and HMA binders at different ages are very similar, with the larg-est difference at time of construction. Also noticeable is that the differences obtained for the high and low true grades seem to decrease with time: -2.3°C, -0.8°C, and -0.8°C (high crit-ical temperature differences) and -1.3°C, -1°C, and 0.2°C (low critical temperature differences) at construction, first inspection, and second inspection, respectively.
Table 1.175 presents the true grades and performance grades of the recovered binders from cores obtained for
Table 1.172. True and performance binder grades at different ages—New York, New York.
Age Grade HMA Cecabase Sonne-
Warmix BituTech
PER
Production mix High temperature (°C) 74.6 68.9 70.1 69.3 Low temperature (°C) -21.4 -26.2 -24.7 -24.9
Performance 70-16 64-22 70-22 64-22
15 months High temperature (°C) 68.6 69.2 68.7 69.1 Low temperature (°C) -23.1 -25.1 -24.9 -26.5
Performance 64-22 64-22 64-22 64-22
26 months High temperature (°C) 71.9 72.8 72.2 76.3 Low temperature (°C) -23.8 -24.4 -25.1 -22.8
Performance 70-22 70-22 70-22 76-22
Table 1.173. True and performance binder grades at different ages—Casa Grande, Arizona.
Age Grade HMA Sasobit
Production mix High temperature (°C) 80 78 Low temperature (°C) -14.3 -13.7
Performance 76-10 76-10
9 months High temperature (°C) 74.4 78.6 Low temperature (°C) -14.1 -15.1
Performance 70-10 76-10
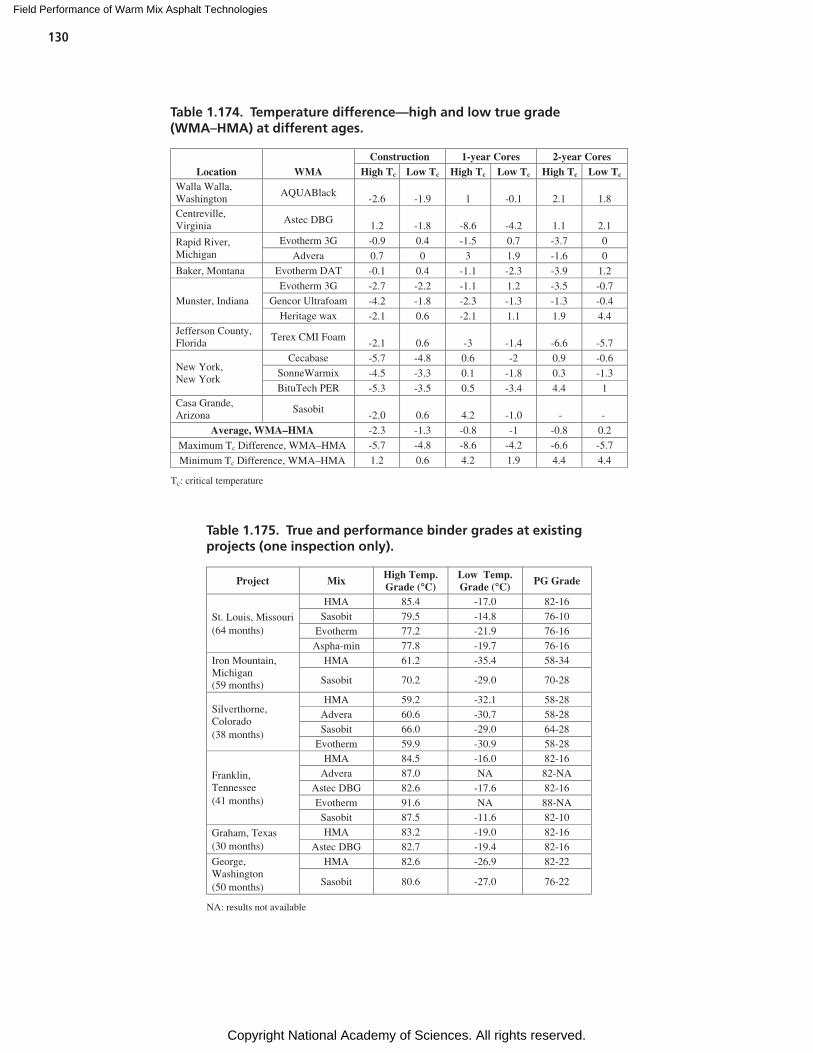
Field Performance of Warm Mix Asphalt Technologies
Copyright National Academy of Sciences. All rights reserved.
130
Table 1.174. Temperature difference—high and low true grade (WMA–HMA) at different ages.
Location WMA Construction 1-year Cores 2-year Cores
High Tc Low Tc High Tc Low Tc High Tc Low Tc Walla Walla, Washington
AQUABlack -2.6 -1.9 1 -0.1 2.1 1.8
Centreville, Virginia
Astec DBG 1.2 -1.8 -8.6 -4.2 1.1 2.1
Rapid River, Michigan
Evotherm 3G -0.9 0.4 -1.5 0.7 -3.7 0 Advera 0.7 0 3 1.9 -1.6 0
Baker, Montana Evotherm DAT -0.1 0.4 -1.1 -2.3 -3.9 1.2
Munster, Indiana
Evotherm 3G -2.7 -2.2 -1.1 1.2 -3.5 -0.7 Gencor Ultrafoam -4.2 -1.8 -2.3 -1.3 -1.3 -0.4
Heritage wax -2.1 0.6 -2.1 1.1 1.9 4.4 Jefferson County, Florida
Terex CMI Foam -2.1 0.6 -3 -1.4 -6.6 -5.7
New York, New York
Cecabase -5.7 -4.8 0.6 -2 0.9 -0.6 SonneWarmix -4.5 -3.3 0.1 -1.8 0.3 -1.3
BituTech PER -5.3 -3.5 0.5 -3.4 4.4 1 Casa Grande, Arizona
Sasobit -2.0 0.6 4.2 -1.0 - -
Average, WMA–HMA -2.3 -1.3 -0.8 -1 -0.8 0.2
Maximum Tc Difference, WMA–HMA -5.7 -4.8 -8.6 -4.2 -6.6 -5.7
Minimum Tc Difference, WMA–HMA 1.2 0.6 4.2 1.9 4.4 4.4
Tc: critical temperature
Project Mix High Temp. Grade (°C)
Low Temp. Grade (°C) PG Grade
St. Louis, Missouri (64 months)
HMA 85.4 -17.0 82-16 Sasobit 79.5 -14.8 76-10
Evotherm 77.2 -21.9 76-16 Aspha-min 77.8 -19.7 76-16
Iron Mountain, Michigan (59 months)
HMA 61.2 -35.4 58-34
Sasobit 70.2 -29.0 70-28
Silverthorne, Colorado (38 months)
HMA 59.2 -32.1 58-28 Advera 60.6 -30.7 58-28 Sasobit 66.0 -29.0 64-28
Evotherm 59.9 -30.9 58-28
Franklin, Tennessee (41 months)
HMA 84.5 -16.0 82-16 Advera 87.0 NA 82-NA
Astec DBG 82.6 -17.6 82-16 Evotherm 91.6 NA 88-NA
Sasobit 87.5 -11.6 82-10
Graham, Texas (30 months)
HMA 83.2 -19.0 82-16 Astec DBG 82.7 -19.4 82-16
George, Washington (50 months)
HMA 82.6 -26.9 82-22
Sasobit 80.6 -27.0 76-22
NA: results not available
Table 1.175. True and performance binder grades at existing projects (one inspection only).
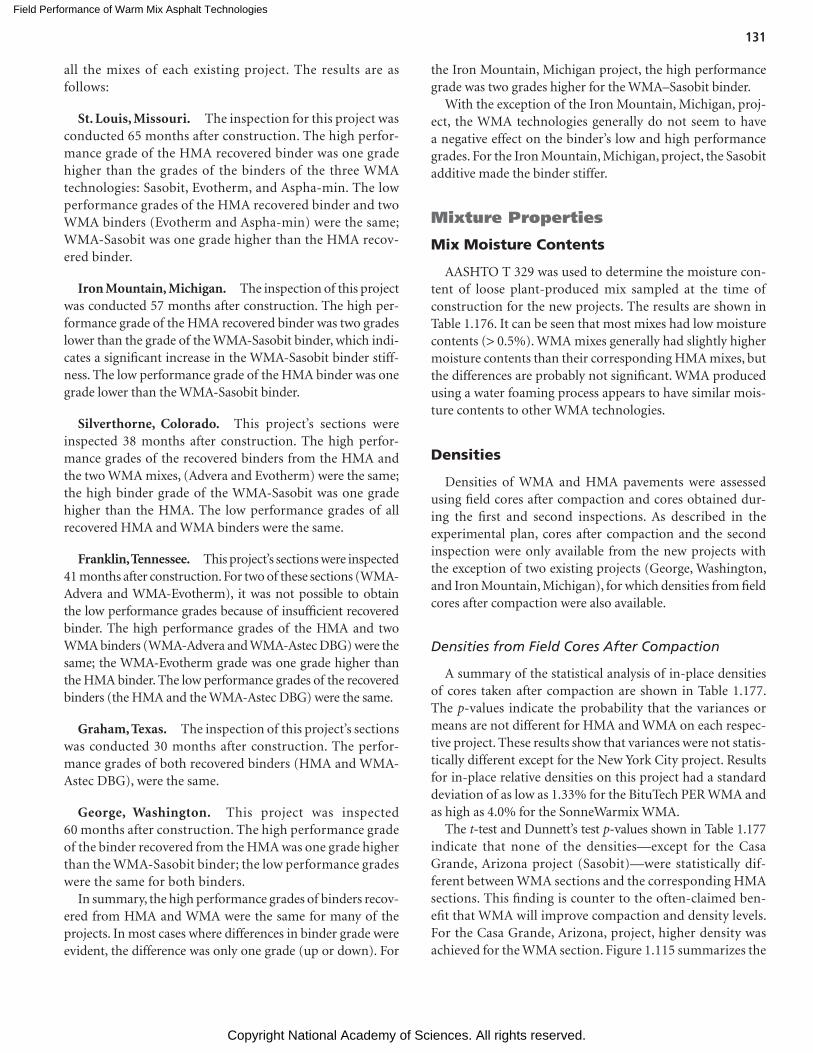
Field Performance of Warm Mix Asphalt Technologies
Copyright National Academy of Sciences. All rights reserved.
131
all the mixes of each existing project. The results are as follows:
St. Louis, Missouri. The inspection for this project was conducted 65 months after construction. The high perfor-mance grade of the HMA recovered binder was one grade higher than the grades of the binders of the three WMA technologies: Sasobit, Evotherm, and Aspha-min. The low performance grades of the HMA recovered binder and two WMA binders (Evotherm and Aspha-min) were the same; WMA-Sasobit was one grade higher than the HMA recov-ered binder.
Iron Mountain, Michigan. The inspection of this project was conducted 57 months after construction. The high per-formance grade of the HMA recovered binder was two grades lower than the grade of the WMA-Sasobit binder, which indi-cates a significant increase in the WMA-Sasobit binder stiff-ness. The low performance grade of the HMA binder was one grade lower than the WMA-Sasobit binder.
Silverthorne, Colorado. This project’s sections were inspected 38 months after construction. The high perfor-mance grades of the recovered binders from the HMA and the two WMA mixes, (Advera and Evotherm) were the same; the high binder grade of the WMA-Sasobit was one grade higher than the HMA. The low performance grades of all recovered HMA and WMA binders were the same.
Franklin, Tennessee. This project’s sections were inspected 41 months after construction. For two of these sections (WMA-Advera and WMA-Evotherm), it was not possible to obtain the low performance grades because of insufficient recovered binder. The high performance grades of the HMA and two WMA binders (WMA-Advera and WMA-Astec DBG) were the same; the WMA-Evotherm grade was one grade higher than the HMA binder. The low performance grades of the recovered binders (the HMA and the WMA-Astec DBG) were the same.
Graham, Texas. The inspection of this project’s sections was conducted 30 months after construction. The perfor-mance grades of both recovered binders (HMA and WMA-Astec DBG), were the same.
George, Washington. This project was inspected 60 months after construction. The high performance grade of the binder recovered from the HMA was one grade higher than the WMA-Sasobit binder; the low performance grades were the same for both binders.
In summary, the high performance grades of binders recov-ered from HMA and WMA were the same for many of the projects. In most cases where differences in binder grade were evident, the difference was only one grade (up or down). For
the Iron Mountain, Michigan project, the high performance grade was two grades higher for the WMA–Sasobit binder.
With the exception of the Iron Mountain, Michigan, proj-ect, the WMA technologies generally do not seem to have a negative effect on the binder’s low and high performance grades. For the Iron Mountain, Michigan, project, the Sasobit additive made the binder stiffer.
Mixture Properties
Mix Moisture Contents
AASHTO T 329 was used to determine the moisture con-tent of loose plant-produced mix sampled at the time of construction for the new projects. The results are shown in Table 1.176. It can be seen that most mixes had low moisture contents (> 0.5%). WMA mixes generally had slightly higher moisture contents than their corresponding HMA mixes, but the differences are probably not significant. WMA produced using a water foaming process appears to have similar mois-ture contents to other WMA technologies.
Densities
Densities of WMA and HMA pavements were assessed using field cores after compaction and cores obtained dur-ing the first and second inspections. As described in the experimental plan, cores after compaction and the second inspection were only available from the new projects with the exception of two existing projects (George, Washington, and Iron Mountain, Michigan), for which densities from field cores after compaction were also available.
Densities from Field Cores After Compaction
A summary of the statistical analysis of in-place densities of cores taken after compaction are shown in Table 1.177. The p-values indicate the probability that the variances or means are not different for HMA and WMA on each respec-tive project. These results show that variances were not statis-tically different except for the New York City project. Results for in-place relative densities on this project had a standard deviation of as low as 1.33% for the BituTech PER WMA and as high as 4.0% for the SonneWarmix WMA.
The t-test and Dunnett’s test p-values shown in Table 1.177 indicate that none of the densities—except for the Casa Grande, Arizona project (Sasobit)—were statistically dif-ferent between WMA sections and the corresponding HMA sections. This finding is counter to the often-claimed ben-efit that WMA will improve compaction and density levels. For the Casa Grande, Arizona, project, higher density was achieved for the WMA section. Figure 1.115 summarizes the
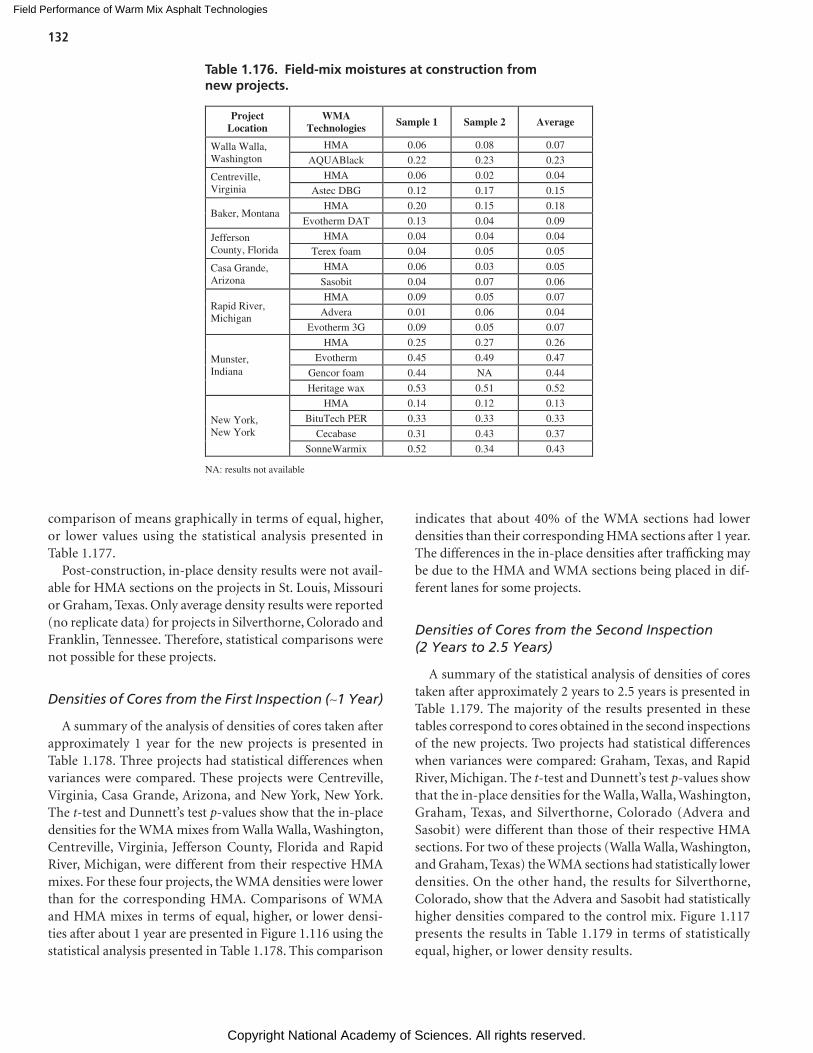
Field Performance of Warm Mix Asphalt Technologies
Copyright National Academy of Sciences. All rights reserved.
132
comparison of means graphically in terms of equal, higher, or lower values using the statistical analysis presented in Table 1.177.
Post-construction, in-place density results were not avail-able for HMA sections on the projects in St. Louis, Missouri or Graham, Texas. Only average density results were reported (no replicate data) for projects in Silverthorne, Colorado and Franklin, Tennessee. Therefore, statistical comparisons were not possible for these projects.
Densities of Cores from the First Inspection (~1 Year)
A summary of the analysis of densities of cores taken after approximately 1 year for the new projects is presented in Table 1.178. Three projects had statistical differences when variances were compared. These projects were Centreville, Virginia, Casa Grande, Arizona, and New York, New York. The t-test and Dunnett’s test p-values show that the in-place densities for the WMA mixes from Walla Walla, Washington, Centreville, Virginia, Jefferson County, Florida and Rapid River, Michigan, were different from their respective HMA mixes. For these four projects, the WMA densities were lower than for the corresponding HMA. Comparisons of WMA and HMA mixes in terms of equal, higher, or lower densi-ties after about 1 year are presented in Figure 1.116 using the statistical analysis presented in Table 1.178. This comparison
indicates that about 40% of the WMA sections had lower densities than their corresponding HMA sections after 1 year. The differences in the in-place densities after trafficking may be due to the HMA and WMA sections being placed in dif-ferent lanes for some projects.
Densities of Cores from the Second Inspection (2 Years to 2.5 Years)
A summary of the statistical analysis of densities of cores taken after approximately 2 years to 2.5 years is presented in Table 1.179. The majority of the results presented in these tables correspond to cores obtained in the second inspections of the new projects. Two projects had statistical differences when variances were compared: Graham, Texas, and Rapid River, Michigan. The t-test and Dunnett’s test p-values show that the in-place densities for the Walla, Walla, Washington, Graham, Texas, and Silverthorne, Colorado (Advera and Sasobit) were different than those of their respective HMA sections. For two of these projects (Walla Walla, Washington, and Graham, Texas) the WMA sections had statistically lower densities. On the other hand, the results for Silverthorne, Colorado, show that the Advera and Sasobit had statistically higher densities compared to the control mix. Figure 1.117 presents the results in Table 1.179 in terms of statistically equal, higher, or lower density results.
Project Location
WMA Technologies Sample 1 Sample 2 Average
Walla Walla, Washington
HMA 0.06 0.08 0.07
AQUABlack 0.22 0.23 0.23
Centreville, Virginia
HMA 0.06 0.02 0.04
Astec DBG 0.12 0.17 0.15
Baker, Montana HMA 0.20 0.15 0.18
Evotherm DAT 0.13 0.04 0.09
Jefferson County, Florida
HMA 0.04 0.04 0.04
Terex foam 0.04 0.05 0.05
Casa Grande, Arizona
HMA 0.06 0.03 0.05
Sasobit 0.04 0.07 0.06
Rapid River, Michigan
HMA 0.09 0.05 0.07
Advera 0.01 0.06 0.04
Evotherm 3G 0.09 0.05 0.07
Munster, Indiana
HMA 0.25 0.27 0.26
Evotherm 0.45 0.49 0.47
Gencor foam 0.44 NA 0.44
Heritage wax 0.53 0.51 0.52
New York, New York
HMA 0.14 0.12 0.13
BituTech PER 0.33 0.33 0.33
Cecabase 0.31 0.43 0.37
SonneWarmix 0.52 0.34 0.43
NA: results not available
Table 1.176. Field-mix moistures at construction from new projects.
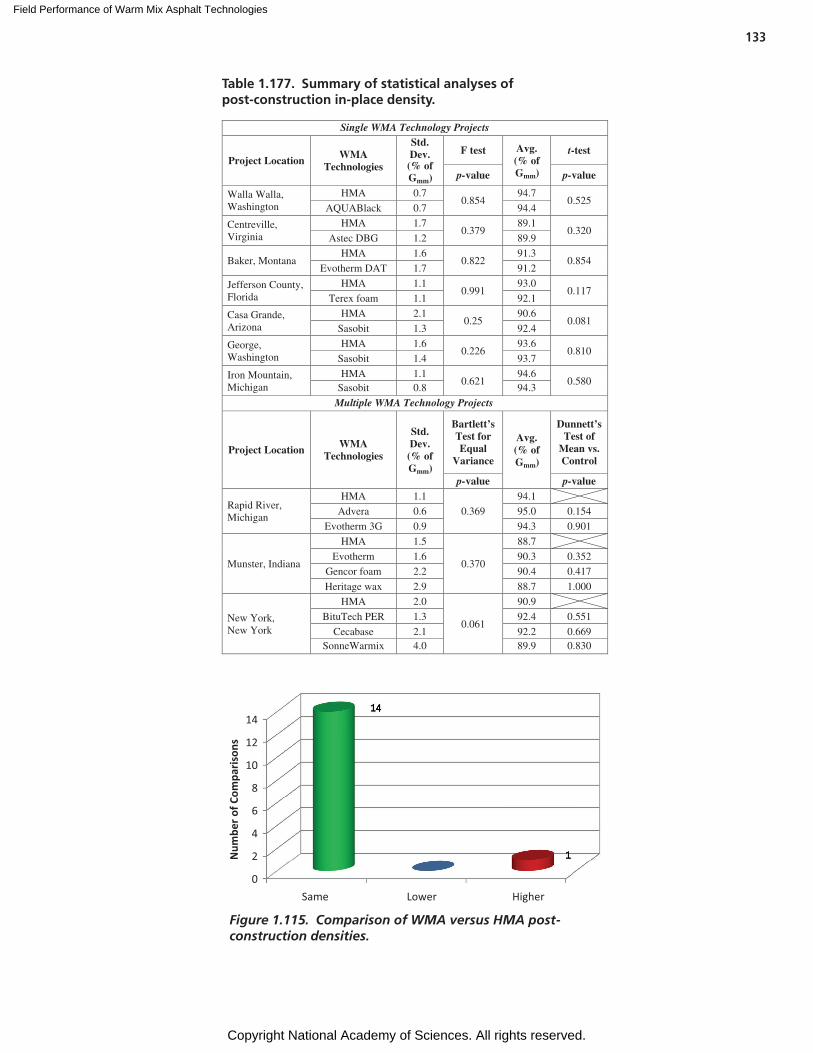
Field Performance of Warm Mix Asphalt Technologies
Copyright National Academy of Sciences. All rights reserved.
133
Single WMA Technology Projects
Project Location WMA
Technologies
Std. Dev. (% of Gmm)
F test Avg. (% of Gmm)
t-test
p-value p-value
Walla Walla, Washington
HMA 0.7 0.854
94.7 0.525
AQUABlack 0.7 94.4
Centreville, Virginia
HMA 1.7 0.379
89.1 0.320
Astec DBG 1.2 89.9
Baker, Montana HMA 1.6
0.822 91.3
0.854 Evotherm DAT 1.7 91.2
Jefferson County, Florida
HMA 1.1 0.991
93.0 0.117
Terex foam 1.1 92.1
Casa Grande, Arizona
HMA 2.1 0.25
90.6 0.081
Sasobit 1.3 92.4
George, Washington
HMA 1.6 0.226
93.6 0.810
Sasobit 1.4 93.7
Iron Mountain, Michigan
HMA 1.1 0.621
94.6 0.580
Sasobit 0.8 94.3
Multiple WMA Technology Projects
Project Location WMA Technologies
Std. Dev. (% of Gmm)
Bartlett’s Test for Equal
Variance
Avg. (% of Gmm)
Dunnett’s Test of
Mean vs. Control
p-value p-value
Rapid River, Michigan
HMA 1.1
0.369
94.1
Advera 0.6 95.0 0.154
Evotherm 3G 0.9 94.3 0.901
Munster, Indiana
HMA 1.5
0.370
88.7
Evotherm 1.6 90.3 0.352
Gencor foam 2.2 90.4 0.417
Heritage wax 2.9 88.7 1.000
New York, New York
HMA 2.0
0.061
90.9
BituTech PER 1.3 92.4 0.551
Cecabase 2.1 92.2 0.669 SonneWarmix 4.0 89.9 0.830
Table 1.177. Summary of statistical analyses of post-construction in-place density.
Figure 1.115. Comparison of WMA versus HMA post-construction densities.
0
2
4
6
8
10
12
14
Num
ber o
f Com
paris
ons
Same Lower Higher
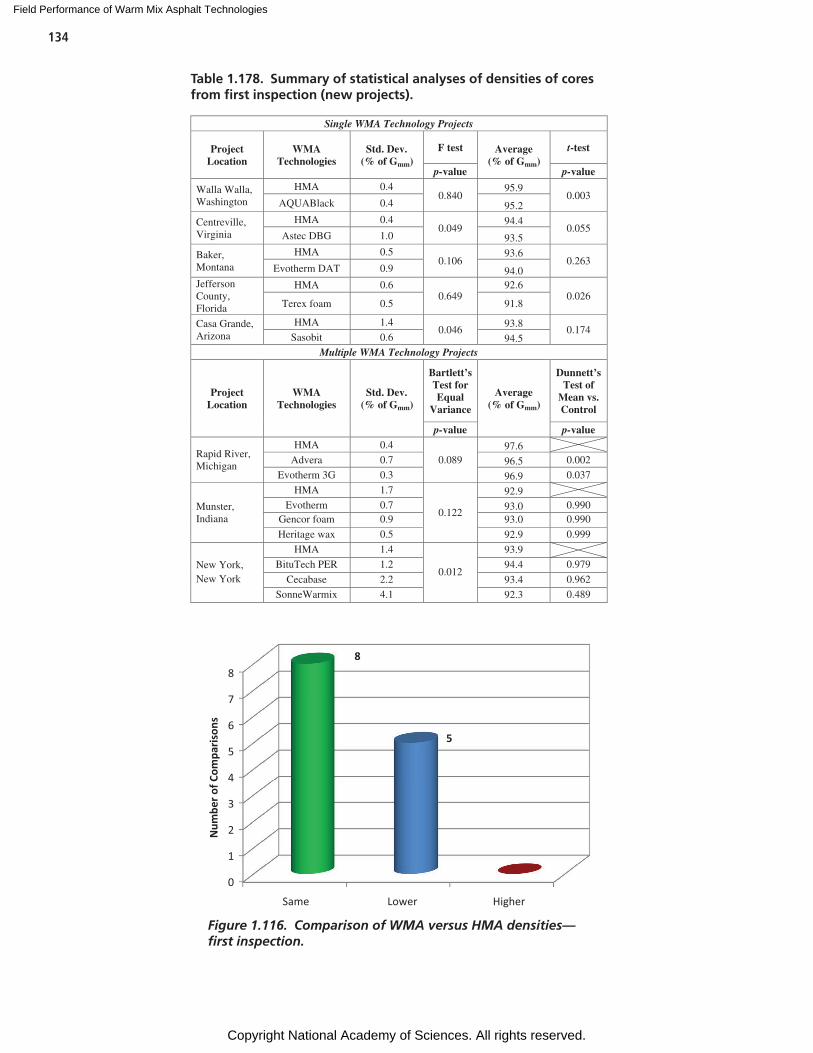
Field Performance of Warm Mix Asphalt Technologies
Copyright National Academy of Sciences. All rights reserved.
134
Single WMA Technology Projects
Project Location
WMA Technologies
Std. Dev. (% of Gmm)
F test Average (% of Gmm)
t-test
p-value p-value
Walla Walla, Washington
HMA 0.4 0.840
95.9 0.003
AQUABlack 0.4 95.2
Centreville, Virginia
HMA 0.40.049
94.4 0.055
Astec DBG 1.0 93.5
Baker, Montana
HMA 0.5 0.106
93.6 0.263
Evotherm DAT 0.9 94.0 Jefferson County, Florida
HMA 0.6 0.649
92.6 0.026
Terex foam 0.5 91.8
Casa Grande, Arizona
HMA 1.4 0.046
93.8 0.174
Sasobit 0.6 94.5 Multiple WMA Technology Projects
Project Location
WMA Technologies
Std. Dev. (% of Gmm)
Bartlett’s Test for Equal
Variance
Average (% of Gmm)
Dunnett’s Test of
Mean vs.Control
p-value p-value
Rapid River, Michigan
HMA 0.4
0.089 97.6
Advera 0.7 96.5 0.002
Evotherm 3G 0.3 96.9 0.037
Munster, Indiana
HMA 1.7
0.122
92.9
Evotherm 0.7 93.0 0.990 Gencor foam 0.9 93.0 0.990
Heritage wax 0.5 92.9 0.999
New York, New York
HMA 1.4
0.012
93.9
BituTech PER 1.2 94.4 0.979
Cecabase 2.2 93.4 0.962
SonneWarmix 4.1 92.3 0.489
Table 1.178. Summary of statistical analyses of densities of cores from first inspection (new projects).
Figure 1.116. Comparison of WMA versus HMA densities—first inspection.
5
0
1
2
3
4
6
7
8
5
8
Num
ber o
f Com
paris
ons
Same Lower Higher
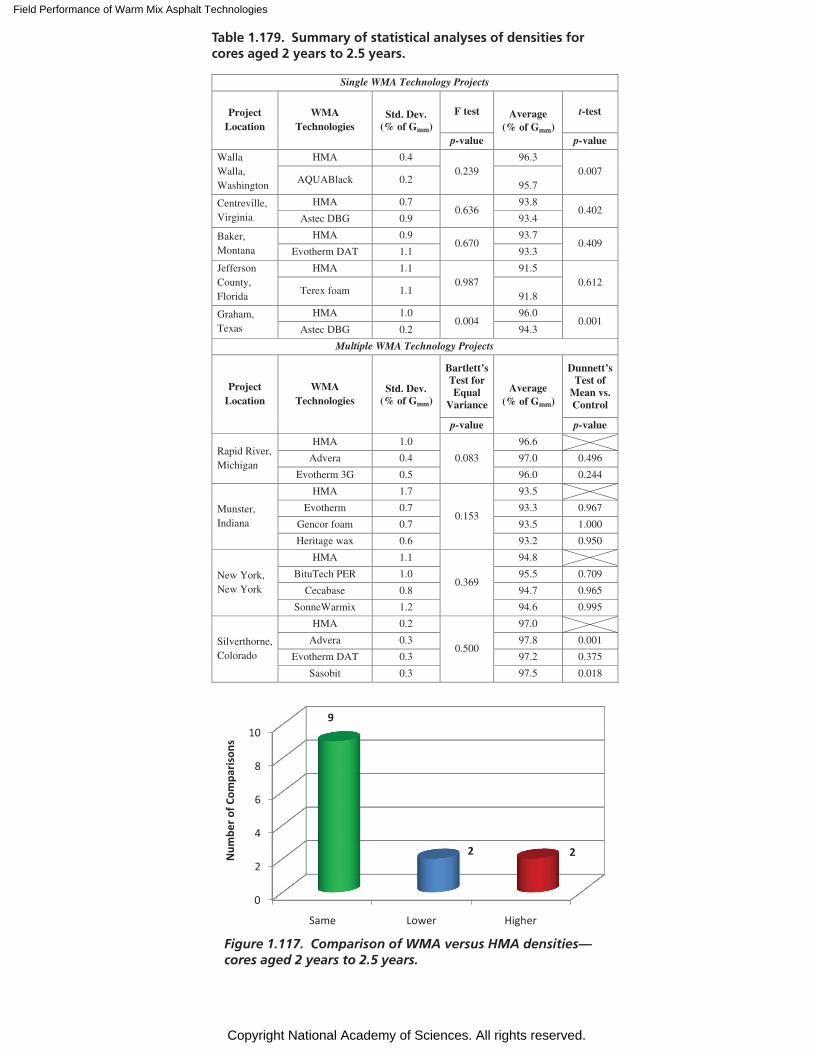
Field Performance of Warm Mix Asphalt Technologies
Copyright National Academy of Sciences. All rights reserved.
Single WMA Technology Projects
Project Location
WMA Technologies
Std. Dev. (% of Gmm)
F test Average (% of Gmm)
t-test
p-value p-value
Walla Walla, Washington
HMA 0.4 0.239
96.3 0.007
AQUABlack 0.2 95.7
Centreville, Virginia
HMA 0.7 0.636
93.8 0.402
Astec DBG 0.9 93.4
Baker, Montana
HMA 0.9 0.670
93.7 0.409
Evotherm DAT 1.1 93.3
Jefferson County, Florida
HMA 1.1 0.987
91.5 0.612
Terex foam 1.1 91.8
Graham, Texas
HMA 1.0 0.004
96.0 0.001
Astec DBG 0.2 94.3
Multiple WMA Technology Projects
Project Location
WMA Technologies
Std. Dev. (% of Gmm)
Bartlett’s Test for Equal
Variance
Average (% of Gmm)
Dunnett’s Test of
Mean vs. Control
p-value p-value
Rapid River, Michigan
HMA 1.0
0.083
96.6
Advera 0.4 97.0 0.496
Evotherm 3G 0.5 96.0 0.244
Munster, Indiana
HMA 1.7
0.153
93.5
Evotherm 0.7 93.3 0.967
Gencor foam 0.7 93.5 1.000
Heritage wax 0.6 93.2 0.950
New York, New York
HMA 1.1
0.369
94.8
BituTech PER 1.0 95.5 0.709
Cecabase 0.8 94.7 0.965
SonneWarmix 1.2 94.6 0.995
Silverthorne, Colorado
HMA 0.2
0.500
97.0
Advera 0.3 97.8 0.001
Evotherm DAT 0.3 97.2 0.375
Sasobit 0.3 97.5 0.018
Table 1.179. Summary of statistical analyses of densities for cores aged 2 years to 2.5 years.
0
2
4
6
8
10
Same Lower Higher
9
2 2Num
ber o
f Com
paris
ons
Figure 1.117. Comparison of WMA versus HMA densities—cores aged 2 years to 2.5 years.
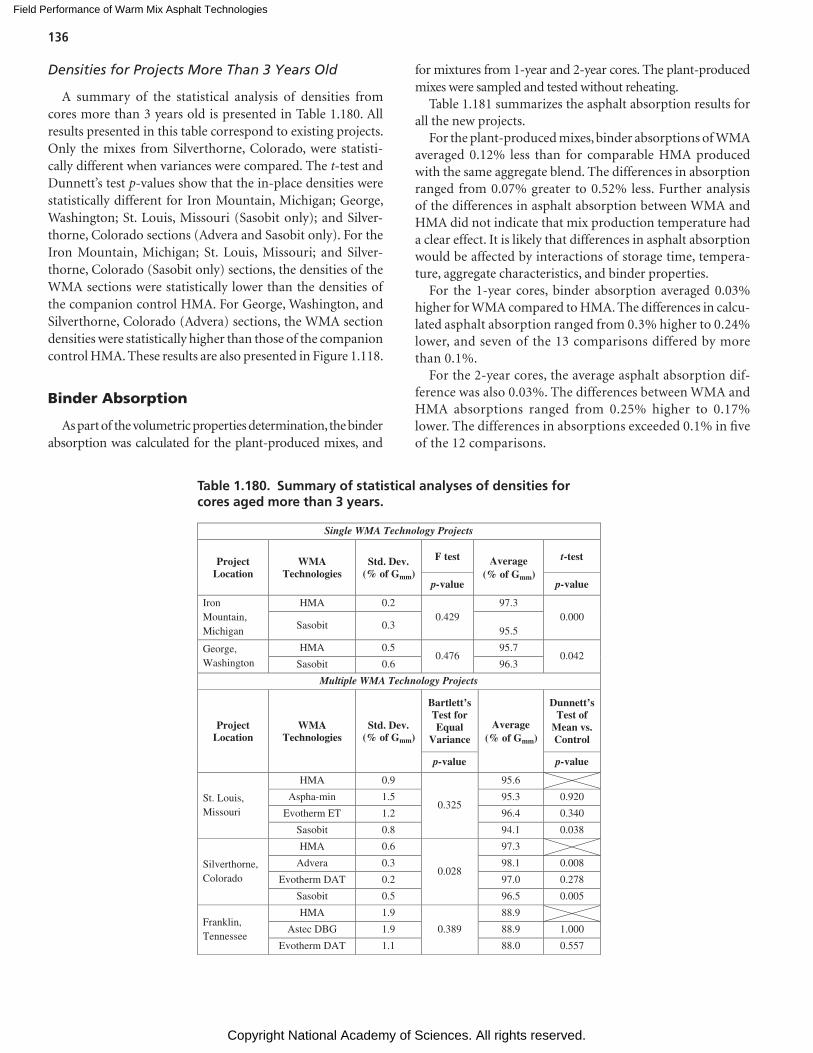
Field Performance of Warm Mix Asphalt Technologies
Copyright National Academy of Sciences. All rights reserved.
136
Densities for Projects More Than 3 Years Old
A summary of the statistical analysis of densities from cores more than 3 years old is presented in Table 1.180. All results presented in this table correspond to existing projects. Only the mixes from Silverthorne, Colorado, were statisti-cally different when variances were compared. The t-test and Dunnett’s test p-values show that the in-place densities were statistically different for Iron Mountain, Michigan; George, Washington; St. Louis, Missouri (Sasobit only); and Silver-thorne, Colorado sections (Advera and Sasobit only). For the Iron Mountain, Michigan; St. Louis, Missouri; and Silver-thorne, Colorado (Sasobit only) sections, the densities of the WMA sections were statistically lower than the densities of the companion control HMA. For George, Washington, and Silverthorne, Colorado (Advera) sections, the WMA section densities were statistically higher than those of the companion control HMA. These results are also presented in Figure 1.118.
Binder Absorption
As part of the volumetric properties determination, the binder absorption was calculated for the plant-produced mixes, and
for mixtures from 1-year and 2-year cores. The plant-produced mixes were sampled and tested without reheating.
Table 1.181 summarizes the asphalt absorption results for all the new projects.
For the plant-produced mixes, binder absorptions of WMA averaged 0.12% less than for comparable HMA produced with the same aggregate blend. The differences in absorption ranged from 0.07% greater to 0.52% less. Further analysis of the differences in asphalt absorption between WMA and HMA did not indicate that mix production temperature had a clear effect. It is likely that differences in asphalt absorption would be affected by interactions of storage time, tempera-ture, aggregate characteristics, and binder properties.
For the 1-year cores, binder absorption averaged 0.03% higher for WMA compared to HMA. The differences in calcu-lated asphalt absorption ranged from 0.3% higher to 0.24% lower, and seven of the 13 comparisons differed by more than 0.1%.
For the 2-year cores, the average asphalt absorption dif-ference was also 0.03%. The differences between WMA and HMA absorptions ranged from 0.25% higher to 0.17% lower. The differences in absorptions exceeded 0.1% in five of the 12 comparisons.
Single WMA Technology Projects
Project Location
WMA Technologies
Std. Dev. (% of Gmm)
F test Average (% of Gmm)
t-test
p-value p-value
Iron Mountain, Michigan
HMA 0.2 0.429
97.3 0.000
Sasobit 0.3 95.5
George, Washington
HMA 0.5 0.476
95.7 0.042
Sasobit 0.6 96.3
Multiple WMA Technology Projects
Project Location
WMA Technologies
Std. Dev. (% of Gmm)
Bartlett’s Test for Equal
Variance Average
(% of Gmm)
Dunnett’s Test of
Mean vs. Control
p-value p-value
St. Louis, Missouri
HMA 0.9
0.325
95.6
Aspha-min 1.5 95.3 0.920
Evotherm ET 1.2 96.4 0.340
Sasobit 0.8 94.1 0.038
Silverthorne, Colorado
HMA 0.6
0.028
97.3
Advera 0.3 98.1 0.008
Evotherm DAT 0.2 97.0 0.278
Sasobit 0.5 96.5 0.005
Franklin, Tennessee
HMA 1.9
0.389
88.9
Astec DBG 1.9 88.9 1.000
Evotherm DAT 1.1 88.0 0.557
Table 1.180. Summary of statistical analyses of densities for cores aged more than 3 years.
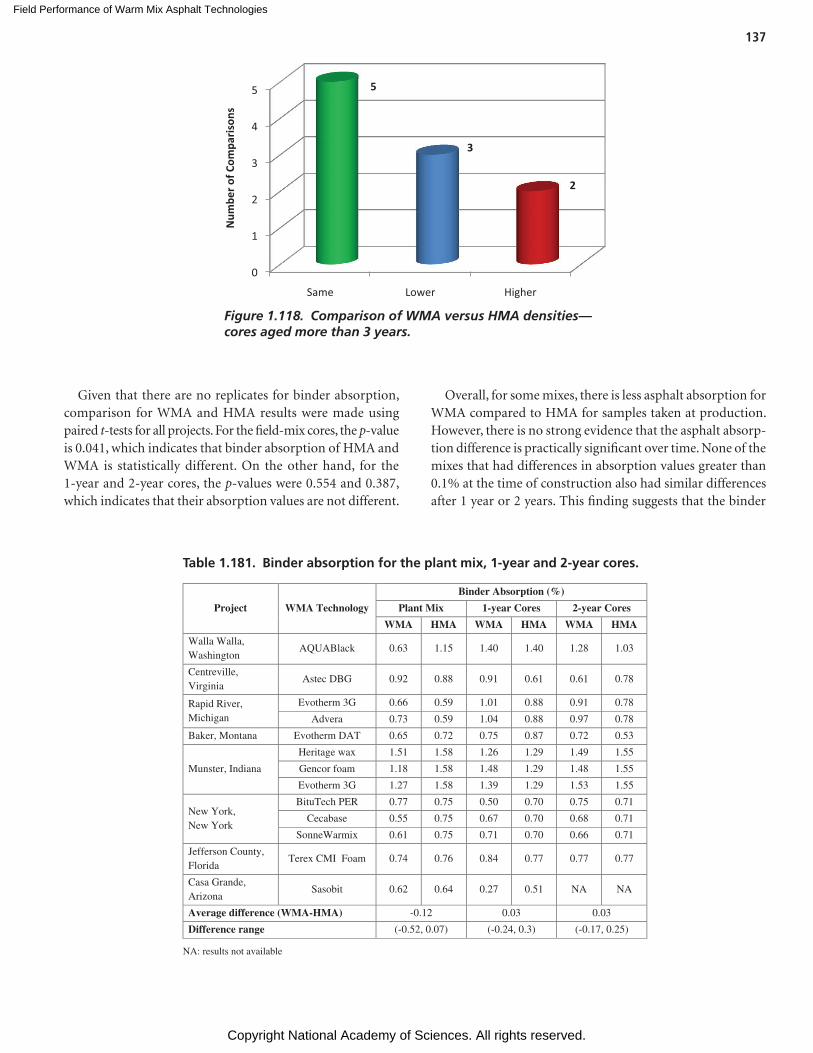
Field Performance of Warm Mix Asphalt Technologies
Copyright National Academy of Sciences. All rights reserved.
137
Given that there are no replicates for binder absorption, comparison for WMA and HMA results were made using paired t-tests for all projects. For the field-mix cores, the p-value is 0.041, which indicates that binder absorption of HMA and WMA is statistically different. On the other hand, for the 1-year and 2-year cores, the p-values were 0.554 and 0.387, which indicates that their absorption values are not different.
Overall, for some mixes, there is less asphalt absorption for WMA compared to HMA for samples taken at production. However, there is no strong evidence that the asphalt absorp-tion difference is practically significant over time. None of the mixes that had differences in absorption values greater than 0.1% at the time of construction also had similar differences after 1 year or 2 years. This finding suggests that the binder
0
1
2
3
4
5 5
3
2
Num
ber o
f Com
paris
ons
Same Lower Higher
Figure 1.118. Comparison of WMA versus HMA densities—cores aged more than 3 years.
Project WMA Technology
Binder Absorption (%)
Plant Mix 1-year Cores 2-year Cores
WMA HMA WMA HMA WMA HMA
Walla Walla, Washington
AQUABlack 0.63 1.15 1.40 1.40 1.28 1.03
Centreville, Virginia
Astec DBG 0.92 0.88 0.91 0.61 0.61 0.78
Rapid River, Michigan
Evotherm 3G 0.66 0.59 1.01 0.88 0.91 0.78
Advera 0.73 0.59 1.04 0.88 0.97 0.78
Baker, Montana Evotherm DAT 0.65 0.72 0.75 0.87 0.72 0.53
Munster, Indiana
Heritage wax 1.51 1.58 1.26 1.29 1.49 1.55
Gencor foam 1.18 1.58 1.48 1.29 1.48 1.55
Evotherm 3G 1.27 1.58 1.39 1.29 1.53 1.55
New York, New York
BituTech PER 0.77 0.75 0.50 0.70 0.75 0.71
Cecabase 0.55 0.75 0.67 0.70 0.68 0.71
SonneWarmix 0.61 0.75 0.71 0.70 0.66 0.71
Jefferson County, Florida
Terex CMI Foam 0.74 0.76 0.84 0.77 0.77 0.77
Casa Grande, Arizona
Sasobit 0.62 0.64 0.27 0.51 NA NA
Average difference (WMA-HMA) -0.12 0.03 0.03
Difference range (-0.52, 0.07) (-0.24, 0.3) (-0.17, 0.25)
NA: results not available
Table 1.181. Binder absorption for the plant mix, 1-year and 2-year cores.
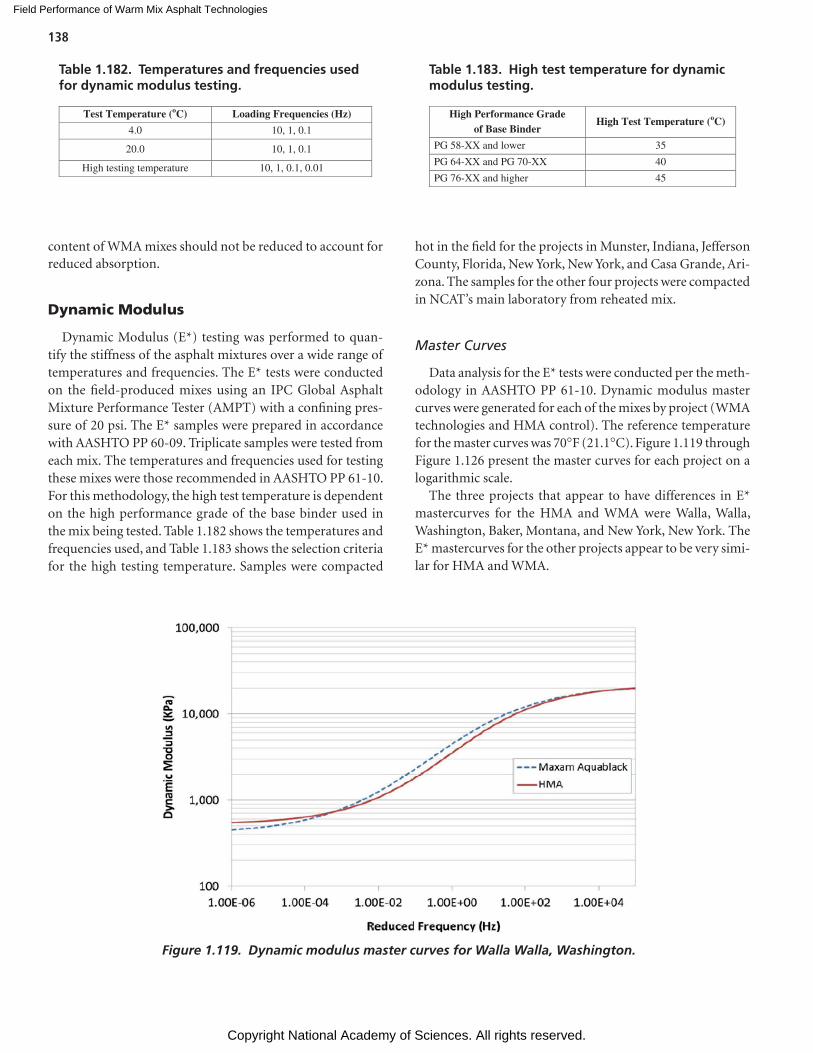
Field Performance of Warm Mix Asphalt Technologies
Copyright National Academy of Sciences. All rights reserved.
138
content of WMA mixes should not be reduced to account for reduced absorption.
Dynamic Modulus
Dynamic Modulus (E*) testing was performed to quan-tify the stiffness of the asphalt mixtures over a wide range of temperatures and frequencies. The E* tests were conducted on the field-produced mixes using an IPC Global Asphalt Mixture Performance Tester (AMPT) with a confining pres-sure of 20 psi. The E* samples were prepared in accordance with AASHTO PP 60-09. Triplicate samples were tested from each mix. The temperatures and frequencies used for testing these mixes were those recommended in AASHTO PP 61-10. For this methodology, the high test temperature is dependent on the high performance grade of the base binder used in the mix being tested. Table 1.182 shows the temperatures and frequencies used, and Table 1.183 shows the selection criteria for the high testing temperature. Samples were compacted
hot in the field for the projects in Munster, Indiana, Jefferson County, Florida, New York, New York, and Casa Grande, Ari-zona. The samples for the other four projects were compacted in NCAT’s main laboratory from reheated mix.
Master Curves
Data analysis for the E* tests were conducted per the meth-odology in AASHTO PP 61-10. Dynamic modulus master curves were generated for each of the mixes by project (WMA technologies and HMA control). The reference temperature for the master curves was 70°F (21.1°C). Figure 1.119 through Figure 1.126 present the master curves for each project on a logarithmic scale.
The three projects that appear to have differences in E* mastercurves for the HMA and WMA were Walla, Walla, Washington, Baker, Montana, and New York, New York. The E* mastercurves for the other projects appear to be very simi-lar for HMA and WMA.
Table 1.182. Temperatures and frequencies used for dynamic modulus testing.
Test Temperature (oC) Loading Frequencies (Hz)
4.0 10, 1, 0.1
20.0 10, 1, 0.1
High testing temperature 10, 1, 0.1, 0.01
Table 1.183. High test temperature for dynamic modulus testing.
High Performance Grade of Base Binder
High Test Temperature (oC)
PG 58-XX and lower 35
PG 64-XX and PG 70-XX 40
PG 76-XX and higher 45
Figure 1.119. Dynamic modulus master curves for Walla Walla, Washington.
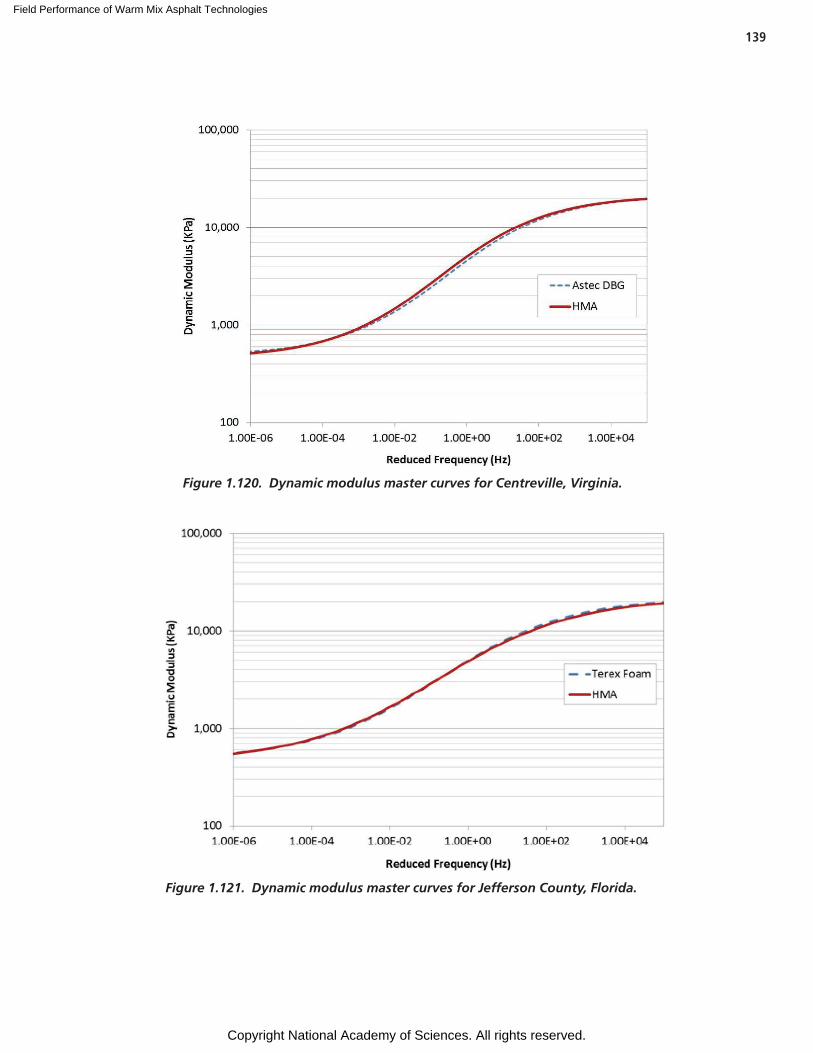
Field Performance of Warm Mix Asphalt Technologies
Copyright National Academy of Sciences. All rights reserved.
139
Figure 1.120. Dynamic modulus master curves for Centreville, Virginia.
Figure 1.121. Dynamic modulus master curves for Jefferson County, Florida.
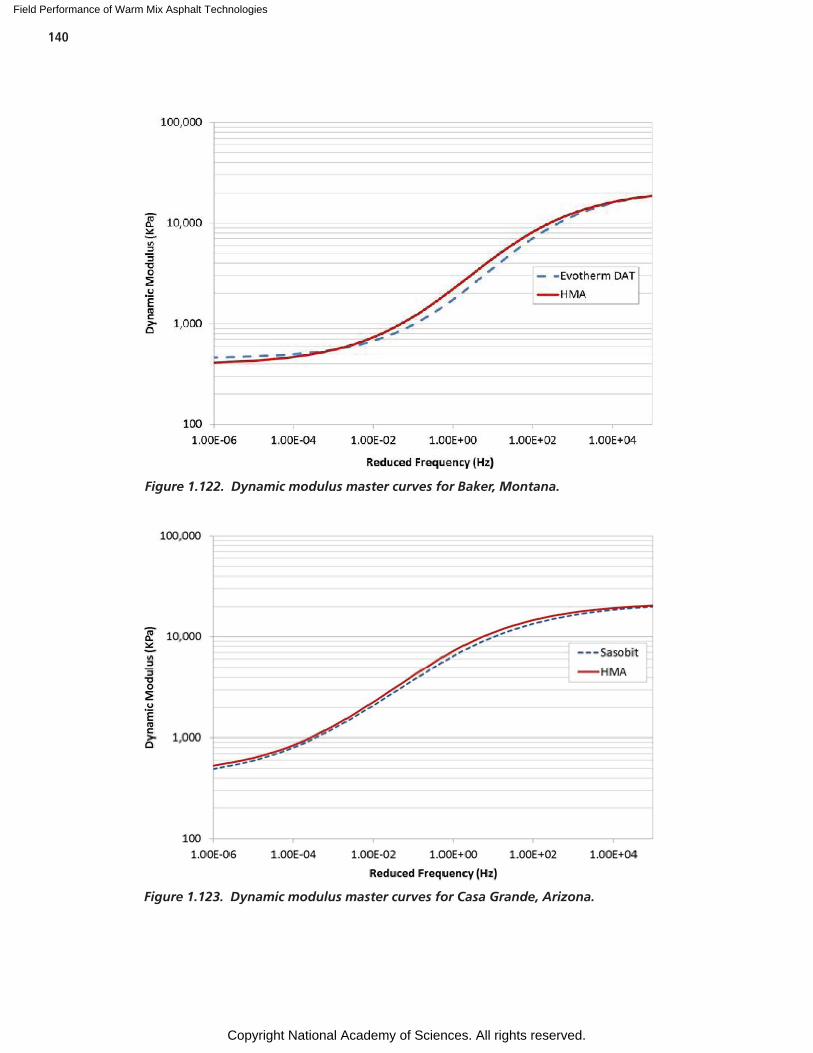
Field Performance of Warm Mix Asphalt Technologies
Copyright National Academy of Sciences. All rights reserved.
140
Figure 1.122. Dynamic modulus master curves for Baker, Montana.
Figure 1.123. Dynamic modulus master curves for Casa Grande, Arizona.
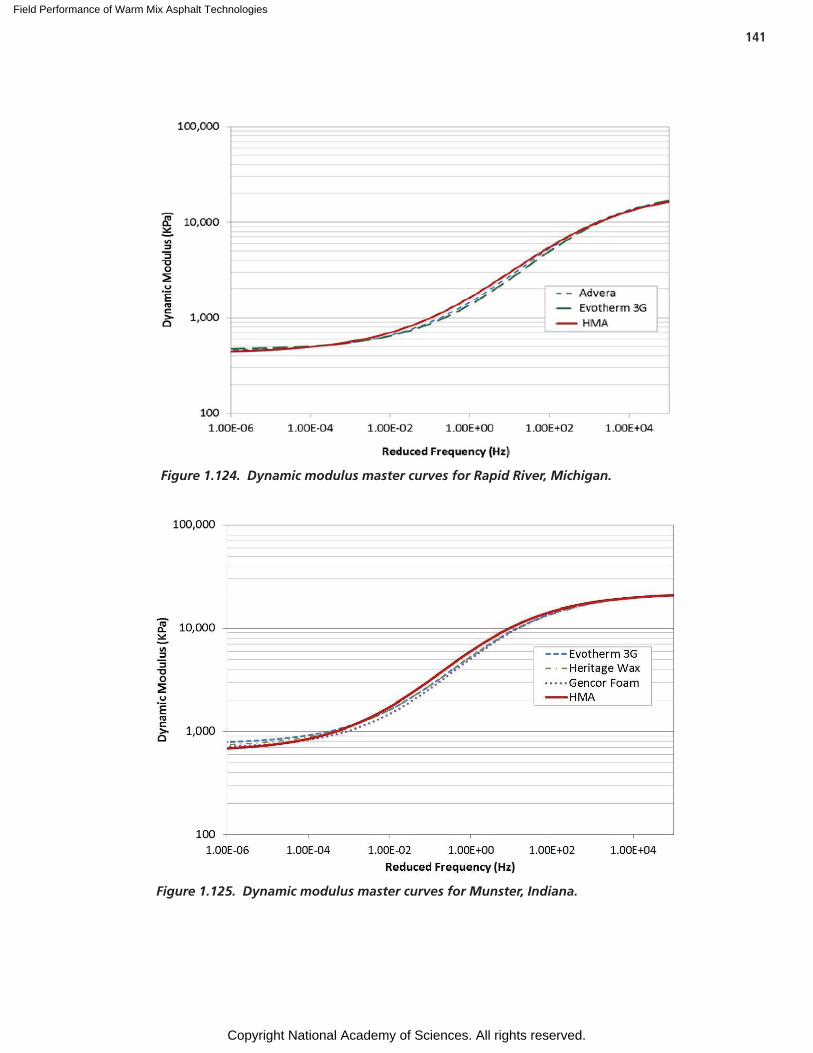
Field Performance of Warm Mix Asphalt Technologies
Copyright National Academy of Sciences. All rights reserved.
141
Figure 1.124. Dynamic modulus master curves for Rapid River, Michigan.
Figure 1.125. Dynamic modulus master curves for Munster, Indiana.
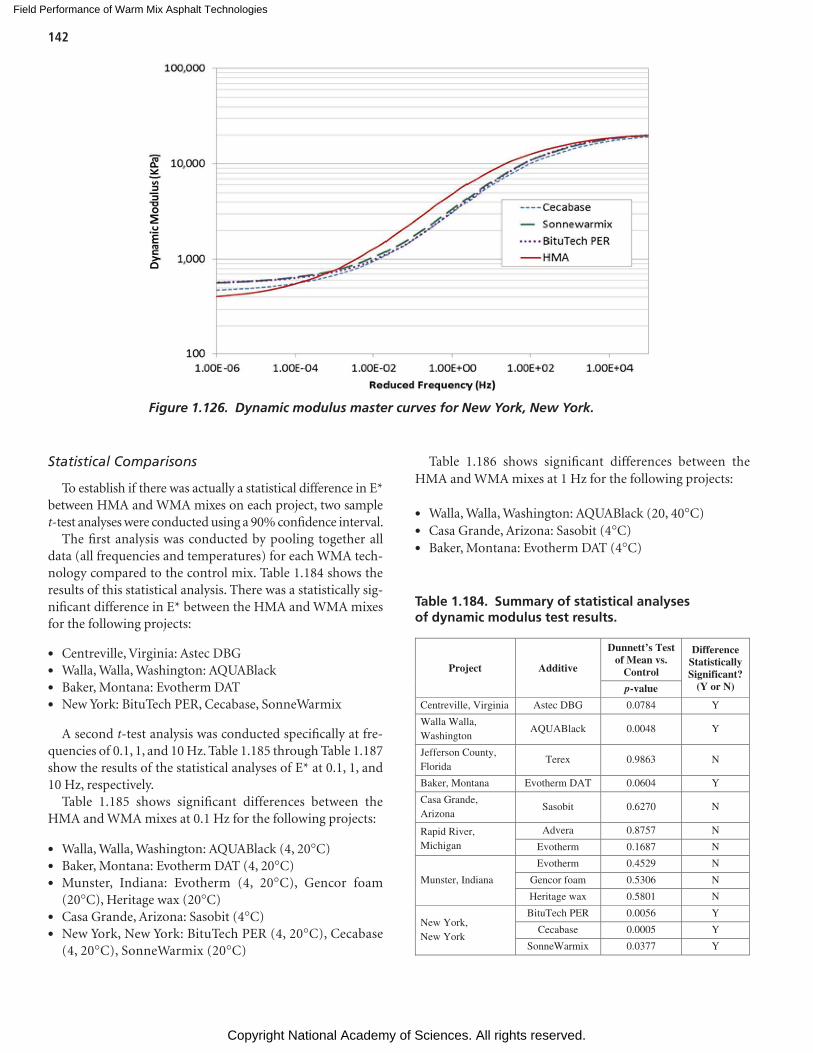
Field Performance of Warm Mix Asphalt Technologies
Copyright National Academy of Sciences. All rights reserved.
142
Statistical Comparisons
To establish if there was actually a statistical difference in E* between HMA and WMA mixes on each project, two sample t-test analyses were conducted using a 90% confidence interval.
The first analysis was conducted by pooling together all data (all frequencies and temperatures) for each WMA tech-nology compared to the control mix. Table 1.184 shows the results of this statistical analysis. There was a statistically sig-nificant difference in E* between the HMA and WMA mixes for the following projects:
• Centreville, Virginia: Astec DBG• Walla, Walla, Washington: AQUABlack• Baker, Montana: Evotherm DAT• New York: BituTech PER, Cecabase, SonneWarmix
A second t-test analysis was conducted specifically at fre-quencies of 0.1, 1, and 10 Hz. Table 1.185 through Table 1.187 show the results of the statistical analyses of E* at 0.1, 1, and 10 Hz, respectively.
Table 1.185 shows significant differences between the HMA and WMA mixes at 0.1 Hz for the following projects:
• Walla, Walla, Washington: AQUABlack (4, 20°C)• Baker, Montana: Evotherm DAT (4, 20°C)• Munster, Indiana: Evotherm (4, 20°C), Gencor foam
(20°C), Heritage wax (20°C)• Casa Grande, Arizona: Sasobit (4°C)• New York, New York: BituTech PER (4, 20°C), Cecabase
(4, 20°C), SonneWarmix (20°C)
Table 1.186 shows significant differences between the HMA and WMA mixes at 1 Hz for the following projects:
• Walla, Walla, Washington: AQUABlack (20, 40°C)• Casa Grande, Arizona: Sasobit (4°C)• Baker, Montana: Evotherm DAT (4°C)
Figure 1.126. Dynamic modulus master curves for New York, New York.
Project Additive
Dunnett’s Test of Mean vs.
Control
Difference Statistically Significant?
(Y or N) p-value
Centreville, Virginia Astec DBG 0.0784 Y
Walla Walla, Washington
AQUABlack 0.0048 Y
Jefferson County, Florida
Terex 0.9863 N
Baker, Montana Evotherm DAT 0.0604 Y
Casa Grande, Arizona
Sasobit 0.6270 N
Rapid River, Michigan
Advera 0.8757 N
Evotherm 0.1687 N
Munster, Indiana
Evotherm 0.4529 N
Gencor foam 0.5306 N
Heritage wax 0.5801 N
New York, New York
BituTech PER 0.0056 Y
Cecabase 0.0005 Y
SonneWarmix 0.0377 Y
Table 1.184. Summary of statistical analyses of dynamic modulus test results.
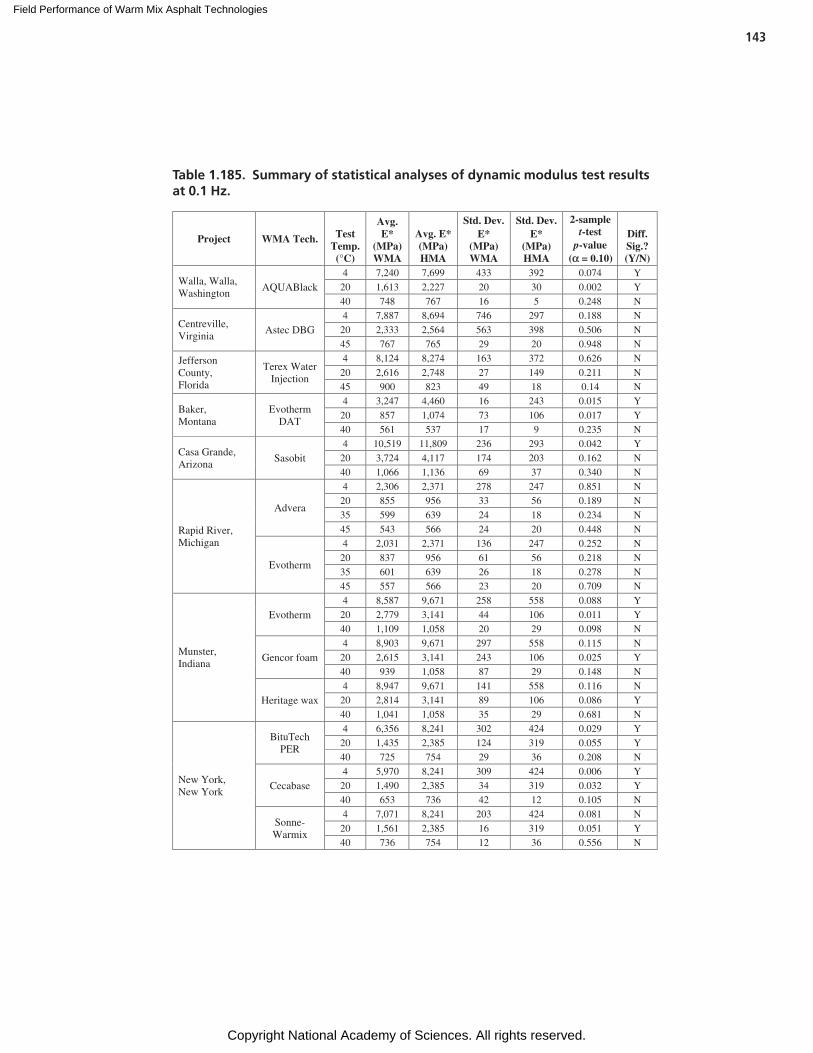
Field Performance of Warm Mix Asphalt Technologies
Copyright National Academy of Sciences. All rights reserved.
143
Project WMA Tech. Test Temp. (°C)
Avg. E*
(MPa) WMA
Avg. E* (MPa) HMA
Std. Dev. E*
(MPa) WMA
Std. Dev. E*
(MPa) HMA
2-sample t-test
p-value (α = 0.10)
Diff. Sig.? (Y/N)
Walla, Walla, Washington
AQUABlack 4 7,240 7,699 433 392 0.074 Y
20 1,613 2,227 20 30 0.002 Y
40 748 767 16 5 0.248 N
Centreville, Virginia
Astec DBG 4 7,887 8,694 746 297 0.188 N
20 2,333 2,564 563 398 0.506 N 45 767 765 29 20 0.948 N
Jefferson County, Florida
Terex Water Injection
4 8,124 8,274 163 372 0.626 N
20 2,616 2,748 27 149 0.211 N 45 900 823 49 18 0.14 N
Baker, Montana
Evotherm DAT
4 3,247 4,460 16 243 0.015 Y
20 857 1,074 73 106 0.017 Y 40 561 537 17 9 0.235 N
Casa Grande, Arizona
Sasobit 4 10,519 11,809 236 293 0.042 Y
20 3,724 4,117 174 203 0.162 N
40 1,066 1,136 69 37 0.340 N
Rapid River, Michigan
Advera
4 2,306 2,371 278 247 0.851 N
20 855 956 33 56 0.189 N
35 599 639 24 18 0.234 N
45 543 566 24 20 0.448 N
Evotherm
4 2,031 2,371 136 247 0.252 N
20 837 956 61 56 0.218 N
35 601 639 26 18 0.278 N 45 557 566 23 20 0.709 N
Munster, Indiana
Evotherm 4 8,587 9,671 258 558 0.088 Y
20 2,779 3,141 44 106 0.011 Y 40 1,109 1,058 20 29 0.098 N
Gencor foam 4 8,903 9,671 297 558 0.115 N
20 2,615 3,141 243 106 0.025 Y 40 939 1,058 87 29 0.148 N
Heritage wax 4 8,947 9,671 141 558 0.116 N
20 2,814 3,141 89 106 0.086 Y 40 1,041 1,058 35 29 0.681 N
New York, New York
BituTech PER
4 6,356 8,241 302 424 0.029 Y
20 1,435 2,385 124 319 0.055 Y 40 725 754 29 36 0.208 N
Cecabase 4 5,970 8,241 309 424 0.006 Y
20 1,490 2,385 34 319 0.032 Y 40 653 736 42 12 0.105 N
Sonne-Warmix
4 7,071 8,241 203 424 0.081 N
20 1,561 2,385 16 319 0.051 Y 40 736 754 12 36 0.556 N
Table 1.185. Summary of statistical analyses of dynamic modulus test results at 0.1 Hz.
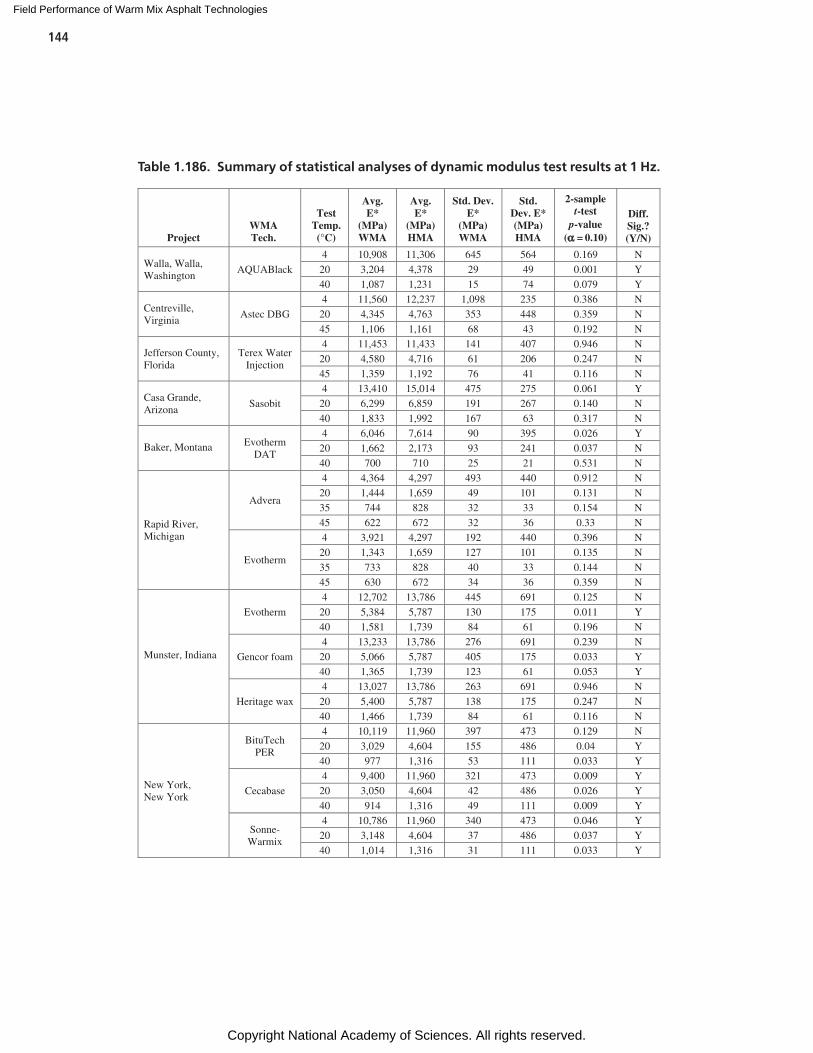
Field Performance of Warm Mix Asphalt Technologies
Copyright National Academy of Sciences. All rights reserved.
144
ProjectWMA Tech.
TestTemp.(°C)
Avg. E*
(MPa) WMA
Avg. E*
(MPa) HMA
Std. Dev. E*
(MPa) WMA
Std. Dev. E* (MPa) HMA
2-sample t-test
p-value (α = 0.10)
Diff. Sig.? (Y/N)
Walla, Walla, Washington
AQUABlack
4 10,908 11,306 645 564 0.169 N
20 3,204 4,378 29 49 0.001 Y
40 1,087 1,231 15 74 0.079 Y
Centreville, Virginia
Astec DBG
4 11,560 12,237 1,098 235 0.386 N
20 4,345 4,763 353 448 0.359 N
45 1,106 1,161 68 43 0.192 N
Jefferson County, Florida
Terex Water Injection
4 11,453 11,433 141 407 0.946 N
20 4,580 4,716 61 206 0.247 N
45 1,359 1,192 76 41 0.116 N
Casa Grande, Arizona
Sasobit
4 13,410 15,014 475 275 0.061 Y
20 6,299 6,859 191 267 0.140 N
40 1,833 1,992 167 63 0.317 N
Baker, Montana
Evotherm DAT
4 6,046 7,614 90 395 0.026 Y
20 1,662 2,173 93 241 0.037 N
40 700 710 25 21 0.531 N
Rapid River, Michigan
Advera
4 4,364 4,297 493 440 0.912 N 20 1,444 1,659 49 101 0.131 N
35 744 828 32 33 0.154 N
45 622 672 32 36 0.33 N
Evotherm
4 3,921 4,297 192 440 0.396 N
20 1,343 1,659 127 101 0.135 N
35 733 828 40 33 0.144 N
45 630 672 34 36 0.359 N
Munster, Indiana
Evotherm
4 12,702 13,786 445 691 0.125 N
20 5,384 5,787 130 175 0.011 Y
40 1,581 1,739 84 61 0.196 N
Gencor foam
4 13,233 13,786 276 691 0.239 N
20 5,066 5,787 405 175 0.033 Y 40 1,365 1,739 123 61 0.053 Y
Heritage wax
4 13,027 13,786 263 691 0.946 N
20 5,400 5,787 138 175 0.247 N 40 1,466 1,739 84 61 0.116 N
New York, New York
BituTech PER
4 10,119 11,960 397 473 0.129 N
20 3,029 4,604 155 486 0.04 Y 40 977 1,316 53 111 0.033 Y
Cecabase 4 9,400 11,960 321 473 0.009 Y
20 3,050 4,604 42 486 0.026 Y
40 914 1,316 49 111 0.009 Y
Sonne-Warmix
4 10,786 11,960 340 473 0.046 Y
20 3,148 4,604 37 486 0.037 Y
40 1,014 1,316 31 111 0.033 Y
Table 1.186. Summary of statistical analyses of dynamic modulus test results at 1 Hz.
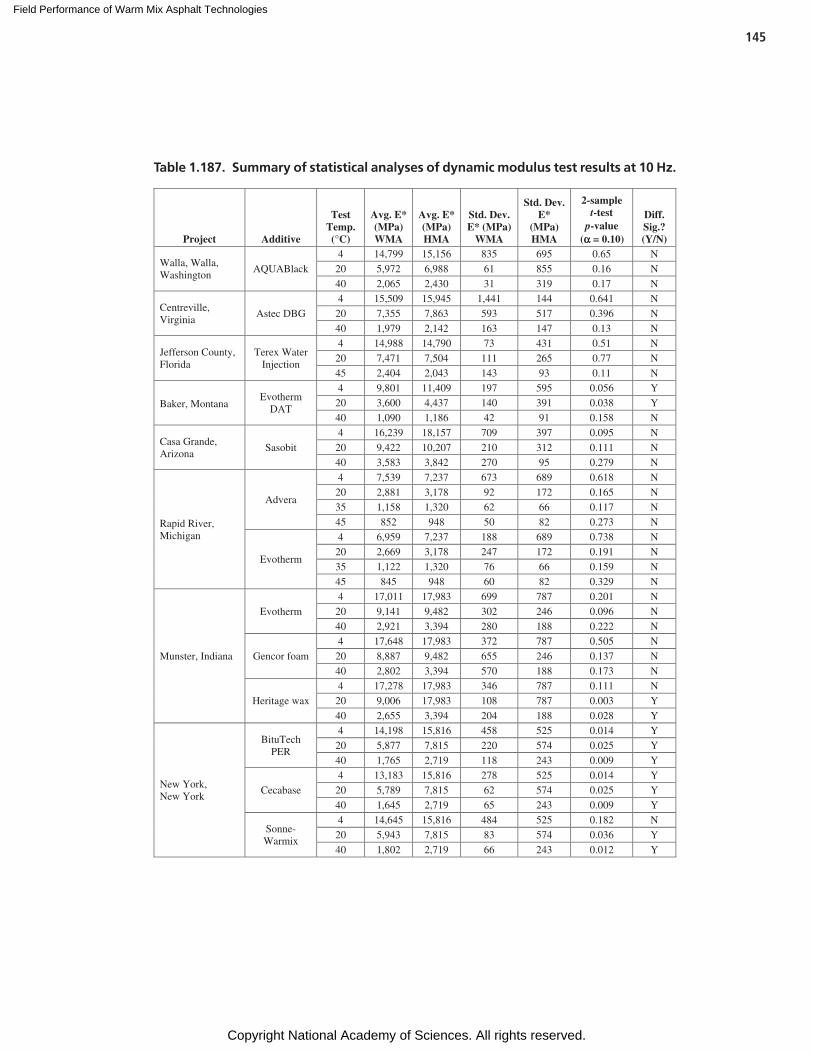
Field Performance of Warm Mix Asphalt Technologies
Copyright National Academy of Sciences. All rights reserved.
145
Project Additive
Test Temp. (°C)
Avg. E* (MPa) WMA
Avg. E* (MPa) HMA
Std. Dev. E* (MPa)
WMA
Std. Dev. E*
(MPa) HMA
2-sample t-test
p-value (α = 0.10)
Diff. Sig.? (Y/N)
Walla, Walla, Washington
AQUABlack
4 14,799 15,156 835 695 0.65 N
20 5,972 6,988 61 855 0.16 N
40 2,065 2,430 31 319 0.17 N
Centreville, Virginia
Astec DBG
4 15,509 15,945 1,441 144 0.641 N
20 7,355 7,863 593 517 0.396 N
40 1,979 2,142 163 147 0.13 N
Jefferson County, Florida
Terex Water Injection
4 14,988 14,790 73 431 0.51 N
20 7,471 7,504 111 265 0.77 N
45 2,404 2,043 143 93 0.11 N
Baker, Montana
Evotherm
DAT
4 9,801 11,409 197 595 0.056 Y 20 3,600 4,437 140 391 0.038 Y
40 1,090 1,186 42 91 0.158 N
Casa Grande, Arizona
Sasobit
4 16,239 18,157 709 397 0.095 N
20 9,422 10,207 210 312 0.111 N 40 3,583 3,842 270 95 0.279 N
Rapid River, Michigan
Advera
4 7,539 7,237 673 689 0.618 N
20 2,881 3,178 92 172 0.165 N 35 1,158 1,320 62 66 0.117 N
45 852 948 50 82 0.273 N
Evotherm
4 6,959 7,237 188 689 0.738 N 20 2,669 3,178 247 172 0.191 N
35 1,122 1,320 76 66 0.159 N 45 845 948 60 82 0.329 N
Munster, Indiana
Evotherm
4 17,011 17,983 699 787 0.201 N
20 9,141 9,482 302 246 0.096 N 40 2,921 3,394 280 188 0.222 N
Gencor foam
4 17,648 17,983 372 787 0.505 N
20 8,887 9,482 655 246 0.137 N 40 2,802 3,394 570 188 0.173 N
Heritage wax
4 17,278 17,983 346 787 0.111 N
20 9,006 17,983 108 787 0.003 Y
40 2,655 3,394 204 188 0.028 Y
New York, New York
BituTech PER
4 14,198 15,816 458 525 0.014 Y
20 5,877 7,815 220 574 0.025 Y
40 1,765 2,719 118 243 0.009 Y
Cecabase
4 13,183 15,816 278 525 0.014 Y
20 5,789 7,815 62 574 0.025 Y
40 1,645 2,719 65 243 0.009 Y
Sonne-Warmix
4 14,645 15,816 484 525 0.182 N
20 5,943 7,815 83 574 0.036 Y
40 1,802 2,719 66 243 0.012 Y
Table 1.187. Summary of statistical analyses of dynamic modulus test results at 10 Hz.
Field Performance of Warm Mix Asphalt Technologies
Copyright National Academy of Sciences. All rights reserved.
146
• Munster, Indiana: Evotherm (20°C), Foam (20, 40°C)• New York, New York: BituTech PER (20, 40°C), Cecabase
(4, 20, 40°C), SonneWarmix (4, 20, 40°C)
Similarly, Table 1.187 shows significant differences between the HMA and WMA mixes at 10 Hz for the following projects:
• Baker, Montana: Evotherm DAT (4, 20°C)• Munster, Indiana: Heritage Wax (20, 40°C)• New York, New York: BituTech PER (4, 20, 40°C), Cecabase
(4, 20, 40°C), SonneWarmix (20, 40°C)
For all cases where significant differences were found, the WMA had lower E* than the corresponding HMA mix. The evaluation by frequencies agrees with the overall analysis for the projects in Walla Walla, Washington, and New York, New York. For Munster, Indiana, Baker, Montana, and Casa Grande, Arizona, the analyses by frequencies show that the dif-ferences are specific to certain temperatures and frequencies.
Flow Number
Specimens for the flow number test were compacted either in the field (hot samples) or in the laboratory (reheated sam-ples), in accordance with AASHTO PP 30. Two sets of flow number tests were conducted with three specimens per set. The first set was tested unconfined in accordance with the rec-ommendations from NCHRP Project 9-43. A deviator stress of 87 psi was used for the unconfined specimens. The second set was tested confined with a confining pressure of 10 psi. A deviator stress of 100 psi was used for confined testing.
Table 1.188 shows the results of the statistical analysis for the unconfined flow number tests for hot and reheated samples. Variances of the unconfined flow number results were sig-nificantly different for all projects except for the hot samples from Walla Walla, Washington, and Casa Grande, Arizona, and reheated samples from Walla Walla, Washington, and Jefferson County, Florida. For mixes compacted hot, variances of the HMA mixes were higher than for the corresponding WMA. HMA mixes had higher unconfined flow number results than WMA for the following projects:
• Walla, Walla, Washington (reheated samples)• Centreville, Virginia (reheated samples)• Jefferson County, Florida (hot samples)• Rapid River, Michigan (reheated samples, both WMA
technologies)• Munster, Indiana (hot samples, all three WMA technologies)• New York, New York (hot samples, all three WMA
technologies)
For the other projects, the differences between HMA and WMA flow number results were not significant at a = 0.1;
however, except for the Casa Grande projects, the p-values for the t-tests comparing the flow number results were fairly low (0.118–0.146), indicating that the WMA mixes have a greater susceptibility to deformation compared to HMA. Figure 1.127 summarizes the results presented in Table 1.188.
Table 1.189 shows the results of the confined flow num-ber tests. All confined flow number tests ran 20,000 cycles before being terminated by the software. Because tertiary flow was not achieved for any of the mixes, the accumu-lated microstrain at 20,000 cycles was used as the parameter to evaluate the relative deformation resistance. For all the projects except for New York, New York, the variances were not statistically different. The statistical analysis indicates, however, that there was a difference in mean accumulated microstrain between the WMA and corresponding HMA mix for nine of 14 mixes compared. For these nine comparisons, the average accumulated microstrain for the WMA mixes was higher than for the corresponding HMA (Figure 1.128). The remaining comparisons between WMA and HMA mixes were not statistically different for the following projects:
• Walla, Walla, Washington (reheated samples)• Baker, Montana (reheated samples)• Casa Grande, Arizona (hot samples)• George, Washington (reheated samples)• Munster, Indiana (hot samples, Evotherm 3G only)
Considering the combined unconfined and confined flow number test results, most WMA mixes were less resistant to rutting than their corresponding HMA mixes. Although flow number results were similar for WMA and HMA in a few cases, the finding that these laboratory tests generally indicate a greater rutting potential in WMA mixes compared to HMA mixes is consistent with other laboratory studies.
Tensile Strength
Tensile Strength from Cores
Tensile strength tests were conducted on cores taken after compaction operations were completed on the projects and on cores taken during project inspections after approximately 1 and 2 years of construction for the new projects. Tensile strength tests were also conducted on laboratory-molded specimens tested as part of AASHTO T 283.
Table 1.190 shows a summary of the statistical analysis of tensile strengths from cores taken after compaction. Except for the Casa Grande project, variances were not statistically different. Mean tensile strengths of WMA and HMA were not statistically different (a = 0.10) except for Iron Moun-tain, Michigan and Rapid River, Michigan (Advera only). On the Iron Mountain project, the Sasobit section had a lower tensile strength than the HMA section. On the Rapid River
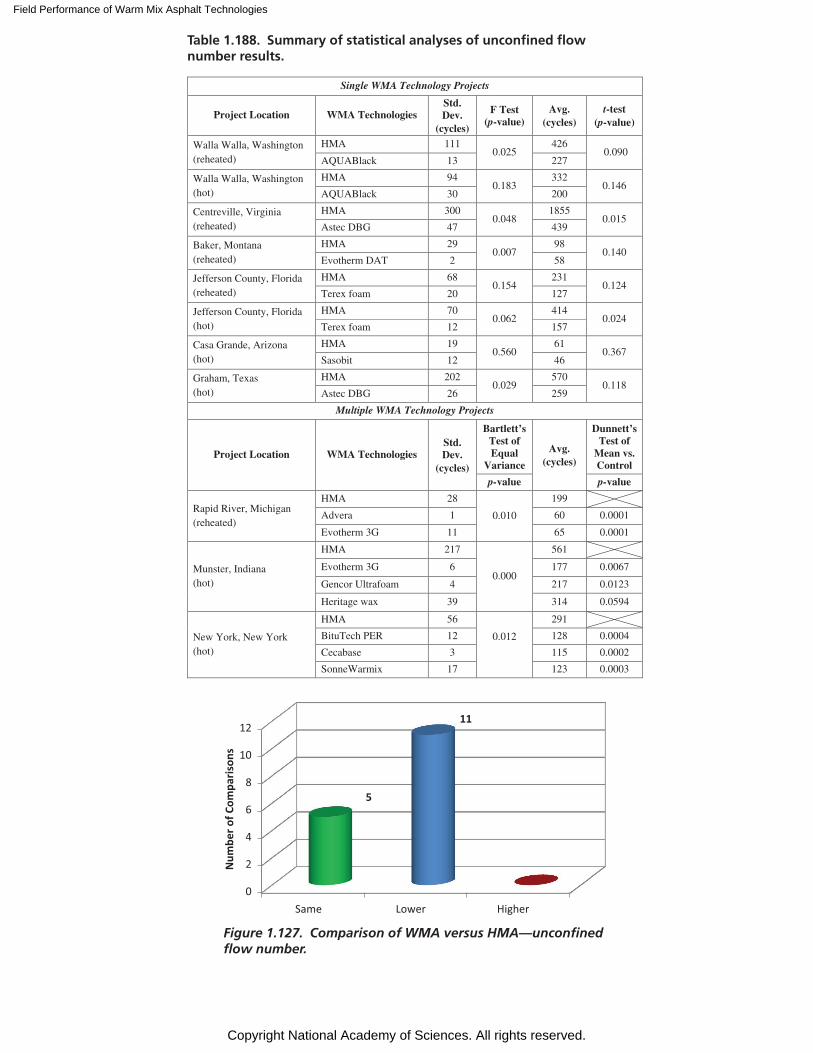
Field Performance of Warm Mix Asphalt Technologies
Copyright National Academy of Sciences. All rights reserved.
Single WMA Technology Projects
Project Location WMA Technologies Std. Dev.
(cycles)
F Test (p-value)
Avg. (cycles)
t-test (p-value)
Walla Walla, Washington (reheated)
HMA 111 0.025
426 0.090
AQUABlack 13 227
Walla Walla, Washington (hot)
HMA 94 0.183
332 0.146
AQUABlack 30 200
Centreville, Virginia (reheated)
HMA 300 0.048
1855 0.015
Astec DBG 47 439
Baker, Montana (reheated)
HMA 29 0.007
98 0.140
Evotherm DAT 2 58
Jefferson County, Florida (reheated)
HMA 68 0.154
231 0.124
Terex foam 20 127
Jefferson County, Florida (hot)
HMA 70 0.062
414 0.024
Terex foam 12 157
Casa Grande, Arizona (hot)
HMA 19 0.560
61 0.367
Sasobit 12 46
Graham, Texas (hot)
HMA 202 0.029
570 0.118
Astec DBG 26 259
Multiple WMA Technology Projects
Project Location WMA Technologies Std. Dev.
(cycles)
Bartlett’s Test of Equal
Variance
Avg. (cycles)
Dunnett’s Test of
Mean vs. Control
p-value p-value
Rapid River, Michigan (reheated)
HMA 28
0.010
199
Advera 1 60 0.0001
Evotherm 3G 11 65 0.0001
Munster, Indiana (hot)
HMA 217
0.000
561
Evotherm 3G 6 177 0.0067
Gencor Ultrafoam 4 217 0.0123
Heritage wax 39 314 0.0594
New York, New York (hot)
HMA 56
0.012
291
BituTech PER 12 128 0.0004
Cecabase 3 115 0.0002
SonneWarmix 17 123 0.0003
Table 1.188. Summary of statistical analyses of unconfined flow number results.
Figure 1.127. Comparison of WMA versus HMA—unconfined flow number.
0
2
4
6
8
10
12
Same Lower Higher
5
11
Num
ber o
f Com
paris
ons
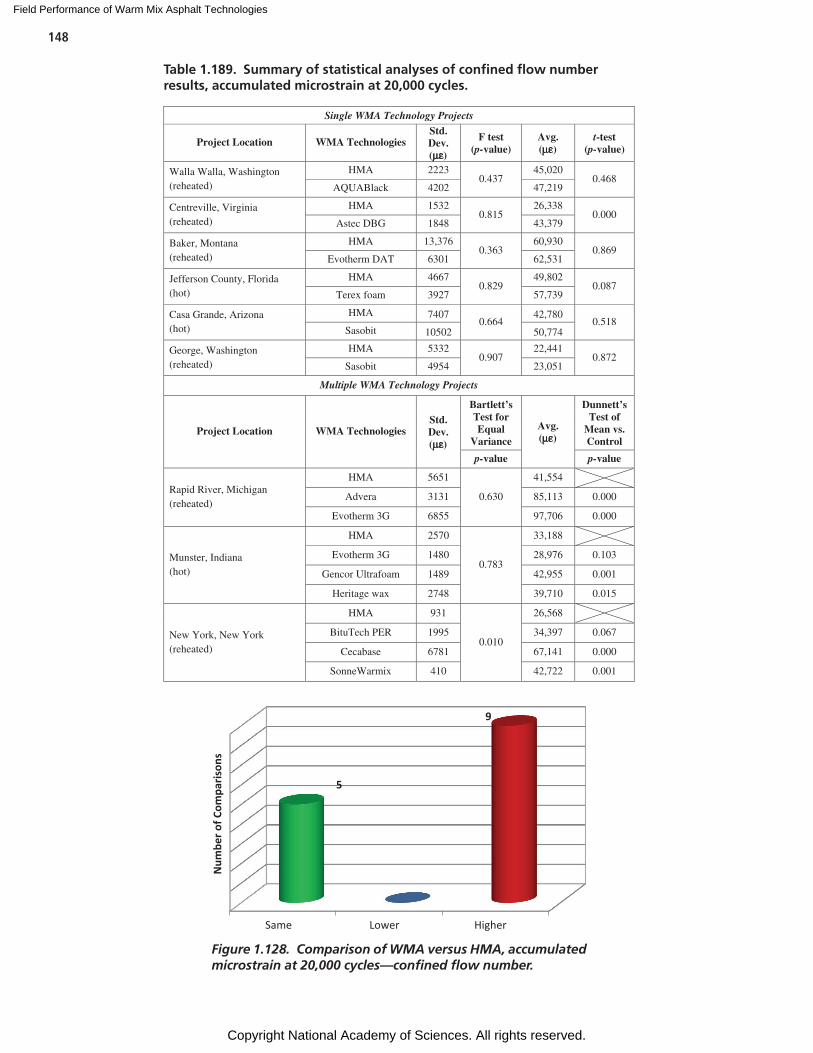
Field Performance of Warm Mix Asphalt Technologies
Copyright National Academy of Sciences. All rights reserved.
148
Single WMA Technology Projects
Project Location WMA Technologies Std. Dev. (µε)
F test (p-value)
Avg. (µε)
t-test (p-value)
Walla Walla, Washington (reheated)
HMA 2223 0.437
45,020 0.468
AQUABlack 4202 47,219
Centreville, Virginia (reheated)
HMA 1532 0.815
26,338 0.000
Astec DBG 1848 43,379
Baker, Montana (reheated)
HMA 13,376 0.363
60,930 0.869
Evotherm DAT 6301 62,531
Jefferson County, Florida (hot)
HMA 4667 0.829
49,802 0.087
Terex foam 3927 57,739
Casa Grande, Arizona (hot)
HMA 7407 0.664
42,780 0.518
Sasobit 10502 50,774
George, Washington (reheated)
HMA 5332 0.907
22,441 0.872
Sasobit 4954 23,051
Multiple WMA Technology Projects
Project Location WMA Technologies Std. Dev. (µε)
Bartlett’s Test for Equal
Variance
Avg. (µε)
Dunnett’s Test of
Mean vs. Control
p-value p-value
Rapid River, Michigan (reheated)
HMA 5651
0.630
41,554
Advera 3131 85,113 0.000
Evotherm 3G 6855 97,706 0.000
Munster, Indiana (hot)
HMA 2570
0.783
33,188
Evotherm 3G 1480 28,976 0.103
Gencor Ultrafoam 1489 42,955 0.001
Heritage wax 2748 39,710 0.015
New York, New York (reheated)
HMA 931
0.010
26,568
BituTech PER 1995 34,397 0.067
Cecabase 6781 67,141 0.000
SonneWarmix 410 42,722 0.001
Table 1.189. Summary of statistical analyses of confined flow number results, accumulated microstrain at 20,000 cycles.
Figure 1.128. Comparison of WMA versus HMA, accumulated microstrain at 20,000 cycles—confined flow number.
Same Lower Higher
5
9
Num
ber o
f Com
paris
ons
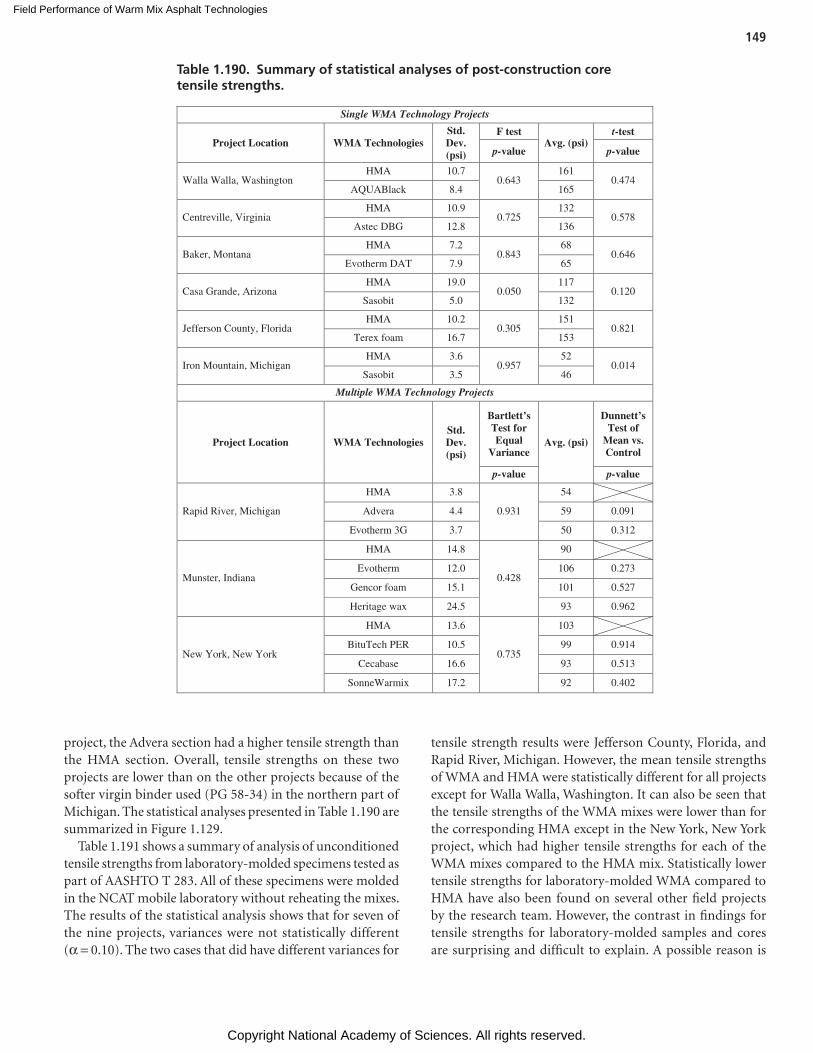
Field Performance of Warm Mix Asphalt Technologies
Copyright National Academy of Sciences. All rights reserved.
149
project, the Advera section had a higher tensile strength than the HMA section. Overall, tensile strengths on these two projects are lower than on the other projects because of the softer virgin binder used (PG 58-34) in the northern part of Michigan. The statistical analyses presented in Table 1.190 are summarized in Figure 1.129.
Table 1.191 shows a summary of analysis of unconditioned tensile strengths from laboratory-molded specimens tested as part of AASHTO T 283. All of these specimens were molded in the NCAT mobile laboratory without reheating the mixes. The results of the statistical analysis shows that for seven of the nine projects, variances were not statistically different (a = 0.10). The two cases that did have different variances for
Single WMA Technology Projects
Project Location WMA Technologies Std. Dev. (psi)
F test Avg. (psi)
t-test
p-value p-value
Walla Walla, Washington HMA 10.7
0.643 161
0.474 AQUABlack 8.4 165
Centreville, Virginia HMA 10.9
0.725 132
0.578 Astec DBG 12.8 136
Baker, Montana HMA 7.2
0.843 68
0.646 Evotherm DAT 7.9 65
Casa Grande, Arizona HMA 19.0
0.050 117
0.120 Sasobit 5.0 132
Jefferson County, Florida HMA 10.2
0.305 151
0.821 Terex foam 16.7 153
Iron Mountain, Michigan HMA 3.6
0.957 52
0.014 Sasobit 3.5 46
Multiple WMA Technology Projects
Project Location WMA Technologies Std. Dev. (psi)
Bartlett’s Test for Equal
Variance Avg. (psi)
Dunnett’s Test of
Mean vs. Control
p-value p-value
Rapid River, Michigan
HMA 3.8
0.931
54
Advera 4.4 59 0.091
Evotherm 3G 3.7 50 0.312
Munster, Indiana
HMA 14.8
0.428
90
Evotherm 12.0 106 0.273
Gencor foam 15.1 101 0.527
Heritage wax 24.5 93 0.962
New York, New York
HMA 13.6
0.735
103
BituTech PER 10.5 99 0.914
Cecabase 16.6 93 0.513
SonneWarmix 17.2 92 0.402
Table 1.190. Summary of statistical analyses of post-construction core tensile strengths.
tensile strength results were Jefferson County, Florida, and Rapid River, Michigan. However, the mean tensile strengths of WMA and HMA were statistically different for all projects except for Walla Walla, Washington. It can also be seen that the tensile strengths of the WMA mixes were lower than for the corresponding HMA except in the New York, New York project, which had higher tensile strengths for each of the WMA mixes compared to the HMA mix. Statistically lower tensile strengths for laboratory-molded WMA compared to HMA have also been found on several other field projects by the research team. However, the contrast in findings for tensile strengths for laboratory-molded samples and cores are surprising and difficult to explain. A possible reason is
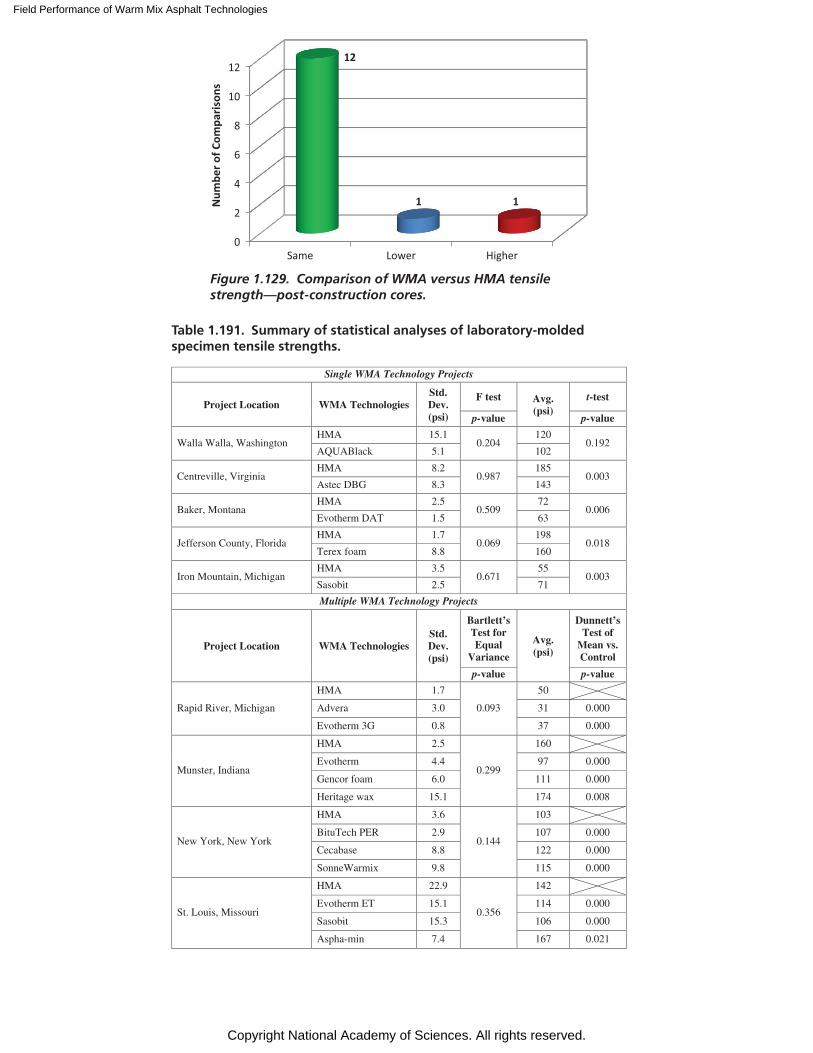
Field Performance of Warm Mix Asphalt Technologies
Copyright National Academy of Sciences. All rights reserved.
Single WMA Technology Projects
Project Location WMA Technologies Std. Dev. (psi)
F test Avg. (psi)
t-test
p-value p-value
Walla Walla, Washington HMA 15.1
0.204 120
0.192 AQUABlack 5.1 102
Centreville, Virginia HMA 8.2
0.987 185
0.003 Astec DBG 8.3 143
Baker, Montana HMA 2.5
0.509 72
0.006 Evotherm DAT 1.5 63
Jefferson County, Florida HMA 1.7
0.069 198
0.018 Terex foam 8.8 160
Iron Mountain, Michigan HMA 3.5
0.671 55
0.003 Sasobit 2.5 71
Multiple WMA Technology Projects
Project Location WMA Technologies Std. Dev. (psi)
Bartlett’s Test for Equal
Variance
Avg. (psi)
Dunnett’s Test of
Mean vs. Control
p-value p-value
Rapid River, Michigan
HMA 1.7
0.093
50
Advera 3.0 31 0.000
Evotherm 3G 0.8 37 0.000
Munster, Indiana
HMA 2.5
0.299
160
Evotherm 4.4 97 0.000
Gencor foam 6.0 111 0.000
Heritage wax 15.1 174 0.008
New York, New York
HMA 3.6
0.144
103
BituTech PER 2.9 107 0.000
Cecabase 8.8 122 0.000
SonneWarmix 9.8 115 0.000
St. Louis, Missouri
HMA 22.9
0.356
142
Evotherm ET 15.1 114 0.000
Sasobit 15.3 106 0.000
Aspha-min 7.4 167 0.021
Table 1.191. Summary of statistical analyses of laboratory-molded specimen tensile strengths.
0
2
4
6
8
10
12
Same Lower Higher
12
1 1Num
ber o
f Com
paris
ons
Figure 1.129. Comparison of WMA versus HMA tensile strength—post-construction cores.
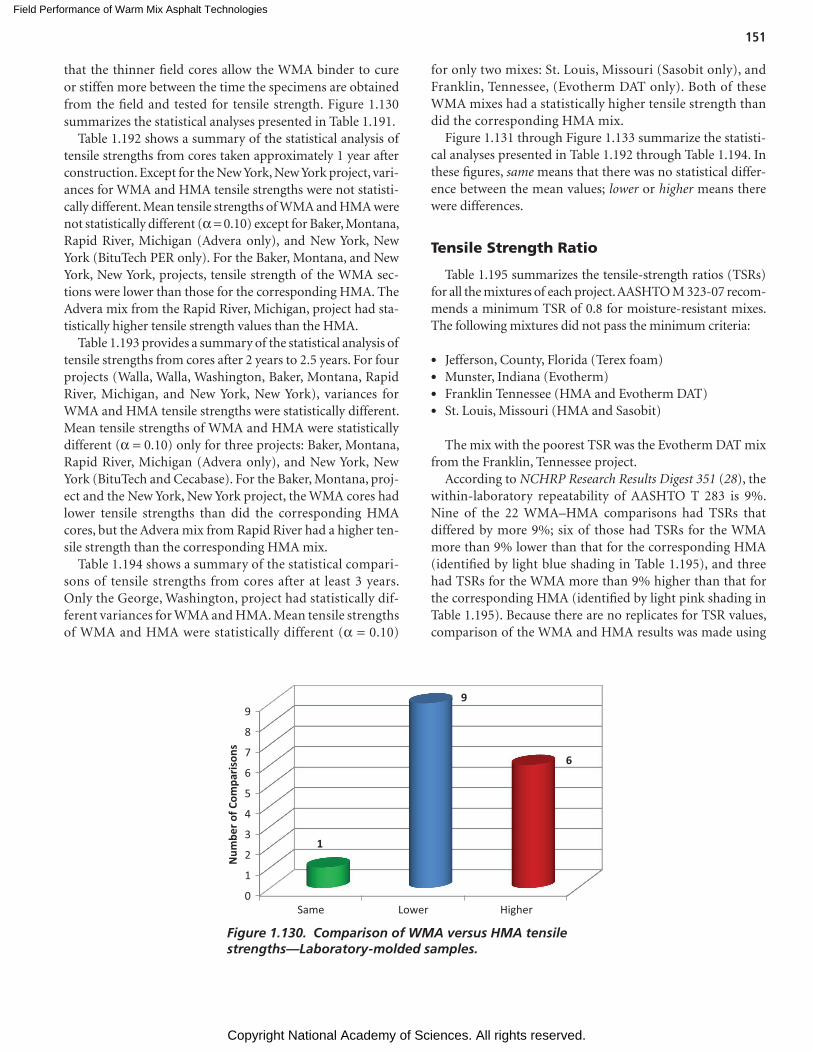
Field Performance of Warm Mix Asphalt Technologies
Copyright National Academy of Sciences. All rights reserved.
151
that the thinner field cores allow the WMA binder to cure or stiffen more between the time the specimens are obtained from the field and tested for tensile strength. Figure 1.130 summarizes the statistical analyses presented in Table 1.191.
Table 1.192 shows a summary of the statistical analysis of tensile strengths from cores taken approximately 1 year after construction. Except for the New York, New York project, vari-ances for WMA and HMA tensile strengths were not statisti-cally different. Mean tensile strengths of WMA and HMA were not statistically different (a = 0.10) except for Baker, Montana, Rapid River, Michigan (Advera only), and New York, New York (BituTech PER only). For the Baker, Montana, and New York, New York, projects, tensile strength of the WMA sec-tions were lower than those for the corresponding HMA. The Advera mix from the Rapid River, Michigan, project had sta-tistically higher tensile strength values than the HMA.
Table 1.193 provides a summary of the statistical analysis of tensile strengths from cores after 2 years to 2.5 years. For four projects (Walla, Walla, Washington, Baker, Montana, Rapid River, Michigan, and New York, New York), variances for WMA and HMA tensile strengths were statistically different. Mean tensile strengths of WMA and HMA were statistically different (a = 0.10) only for three projects: Baker, Montana, Rapid River, Michigan (Advera only), and New York, New York (BituTech and Cecabase). For the Baker, Montana, proj-ect and the New York, New York project, the WMA cores had lower tensile strengths than did the corresponding HMA cores, but the Advera mix from Rapid River had a higher ten-sile strength than the corresponding HMA mix.
Table 1.194 shows a summary of the statistical compari-sons of tensile strengths from cores after at least 3 years. Only the George, Washington, project had statistically dif-ferent variances for WMA and HMA. Mean tensile strengths of WMA and HMA were statistically different (a = 0.10)
for only two mixes: St. Louis, Missouri (Sasobit only), and Franklin, Tennessee, (Evotherm DAT only). Both of these WMA mixes had a statistically higher tensile strength than did the corresponding HMA mix.
Figure 1.131 through Figure 1.133 summarize the statisti-cal analyses presented in Table 1.192 through Table 1.194. In these figures, same means that there was no statistical differ-ence between the mean values; lower or higher means there were differences.
Tensile Strength Ratio
Table 1.195 summarizes the tensile-strength ratios (TSRs) for all the mixtures of each project. AASHTO M 323-07 recom-mends a minimum TSR of 0.8 for moisture-resistant mixes. The following mixtures did not pass the minimum criteria:
• Jefferson, County, Florida (Terex foam)• Munster, Indiana (Evotherm)• Franklin Tennessee (HMA and Evotherm DAT)• St. Louis, Missouri (HMA and Sasobit)
The mix with the poorest TSR was the Evotherm DAT mix from the Franklin, Tennessee project.
According to NCHRP Research Results Digest 351 (28), the within-laboratory repeatability of AASHTO T 283 is 9%. Nine of the 22 WMA–HMA comparisons had TSRs that differed by more 9%; six of those had TSRs for the WMA more than 9% lower than that for the corresponding HMA (identified by light blue shading in Table 1.195), and three had TSRs for the WMA more than 9% higher than that for the corresponding HMA (identified by light pink shading in Table 1.195). Because there are no replicates for TSR values, comparison of the WMA and HMA results was made using
0
1
2
3
4
5
6
7
8
9
Same Lower Higher
1
9
6
Num
ber o
f Com
paris
ons
Figure 1.130. Comparison of WMA versus HMA tensile strengths—Laboratory-molded samples.
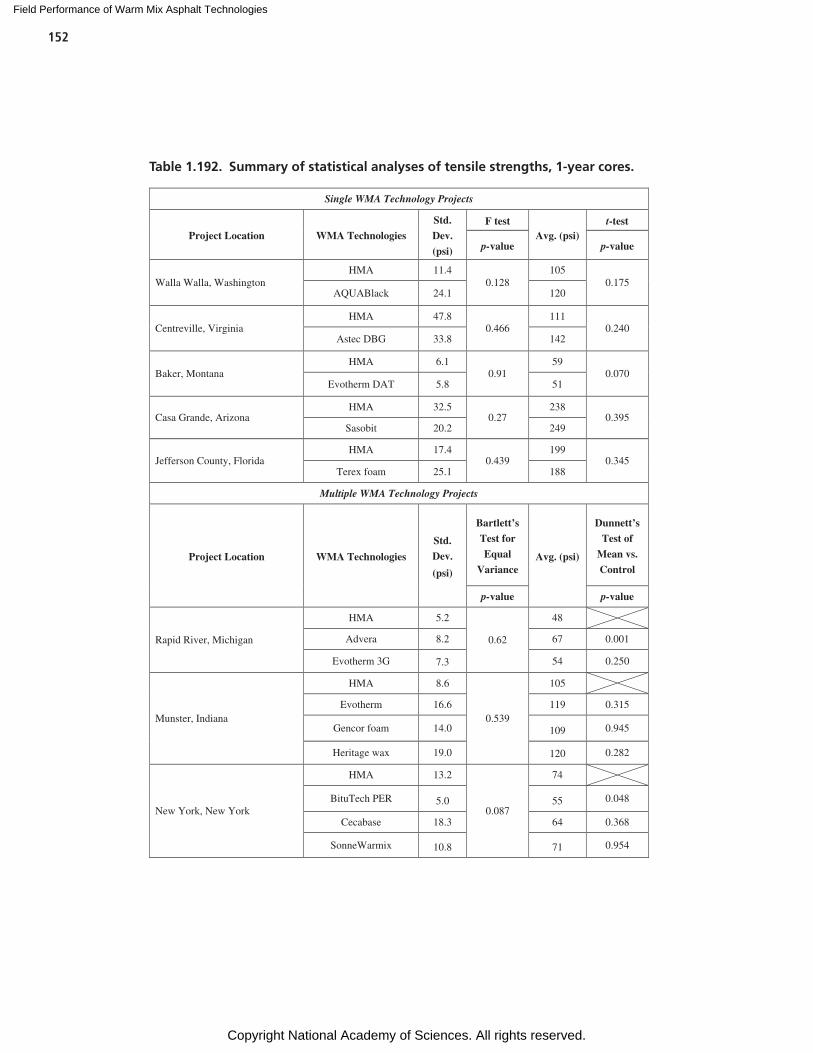
Field Performance of Warm Mix Asphalt Technologies
Copyright National Academy of Sciences. All rights reserved.
152
Table 1.192. Summary of statistical analyses of tensile strengths, 1-year cores.
Single WMA Technology Projects
Project Location WMA Technologies
Std.
Dev.
(psi)
F testAvg. (psi)
t-test
p-value p-value
Walla Walla, Washington HMA 11.4
0.128105
0.175AQUABlack 24.1 120
Centreville, VirginiaHMA 47.8
0.466111
0.240Astec DBG 33.8 142
Baker, Montana HMA 6.1
0.9159
0.070Evotherm DAT 5.8 51
Casa Grande, Arizona HMA 32.5
0.27238
0.395Sasobit 20.2 249
Jefferson County, FloridaHMA 17.4
0.439199
0.345Terex foam 25.1 188
Multiple WMA Technology Projects
Project Location WMA Technologies
Std.
Dev.
(psi)
Bartlett’s
Test for
Equal
VarianceAvg. (psi)
Dunnett’s
Test of
Mean vs.
Control
p-value p-value
Rapid River, Michigan
HMA 5.2
0.62
48
Advera 8.2 67 0.001
Evotherm 3G 7.3 54 0.250
Munster, Indiana
HMA 8.6
0.539
105
Evotherm 16.6 119 0.315
Gencor foam 14.0 109 0.945
Heritage wax 19.0 120 0.282
New York, New York
HMA 13.2
0.087
74
BituTech PER 5.0 55 0.048
Cecabase 18.3 64 0.368
SonneWarmix 10.8 71 0.954
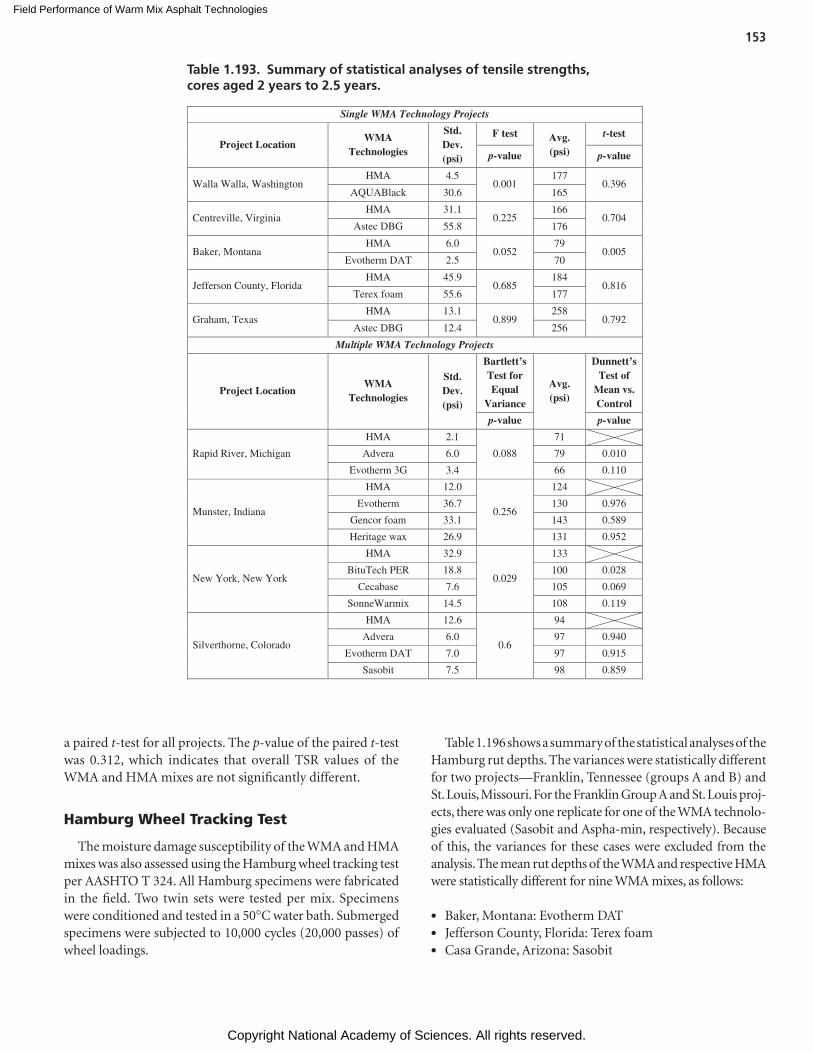
Field Performance of Warm Mix Asphalt Technologies
Copyright National Academy of Sciences. All rights reserved.
153
a paired t-test for all projects. The p-value of the paired t-test was 0.312, which indicates that overall TSR values of the WMA and HMA mixes are not significantly different.
Hamburg Wheel Tracking Test
The moisture damage susceptibility of the WMA and HMA mixes was also assessed using the Hamburg wheel tracking test per AASHTO T 324. All Hamburg specimens were fabricated in the field. Two twin sets were tested per mix. Specimens were conditioned and tested in a 50°C water bath. Submerged specimens were subjected to 10,000 cycles (20,000 passes) of wheel loadings.
Table 1.196 shows a summary of the statistical analyses of the Hamburg rut depths. The variances were statistically different for two projects—Franklin, Tennessee (groups A and B) and St. Louis, Missouri. For the Franklin Group A and St. Louis proj-ects, there was only one replicate for one of the WMA technolo-gies evaluated (Sasobit and Aspha-min, respectively). Because of this, the variances for these cases were excluded from the analysis. The mean rut depths of the WMA and respective HMA were statistically different for nine WMA mixes, as follows:
• Baker, Montana: Evotherm DAT• Jefferson County, Florida: Terex foam• Casa Grande, Arizona: Sasobit
Single WMA Technology Projects
Project Location WMA
Technologies
Std. Dev. (psi)
F test Avg. (psi)
t-test
p-value p-value
Walla Walla, Washington HMA 4.5
0.001 177
0.396 AQUABlack 30.6 165
Centreville, Virginia HMA 31.1
0.225 166
0.704 Astec DBG 55.8 176
Baker, Montana HMA 6.0
0.052 79
0.005 Evotherm DAT 2.5 70
Jefferson County, Florida HMA 45.9
0.685 184
0.816 Terex foam 55.6 177
Graham, Texas HMA 13.1
0.899 258
0.792 Astec DBG 12.4 256
Multiple WMA Technology Projects
Project Location WMA
Technologies
Std. Dev. (psi)
Bartlett’s Test for Equal
Variance
Avg. (psi)
Dunnett’s Test of
Mean vs. Control
p-value p-value
Rapid River, Michigan
HMA 2.1
0.088
71
Advera 6.0 79 0.010
Evotherm 3G 3.4 66 0.110
Munster, Indiana
HMA 12.0
0.256
124
Evotherm 36.7 130 0.976
Gencor foam 33.1 143 0.589
Heritage wax 26.9 131 0.952
New York, New York
HMA 32.9
0.029
133
BituTech PER 18.8 100 0.028
Cecabase 7.6 105 0.069
SonneWarmix 14.5 108 0.119
Silverthorne, Colorado
HMA 12.6
0.6
94
Advera 6.0 97 0.940
Evotherm DAT 7.0 97 0.915
Sasobit 7.5 98 0.859
Table 1.193. Summary of statistical analyses of tensile strengths, cores aged 2 years to 2.5 years.
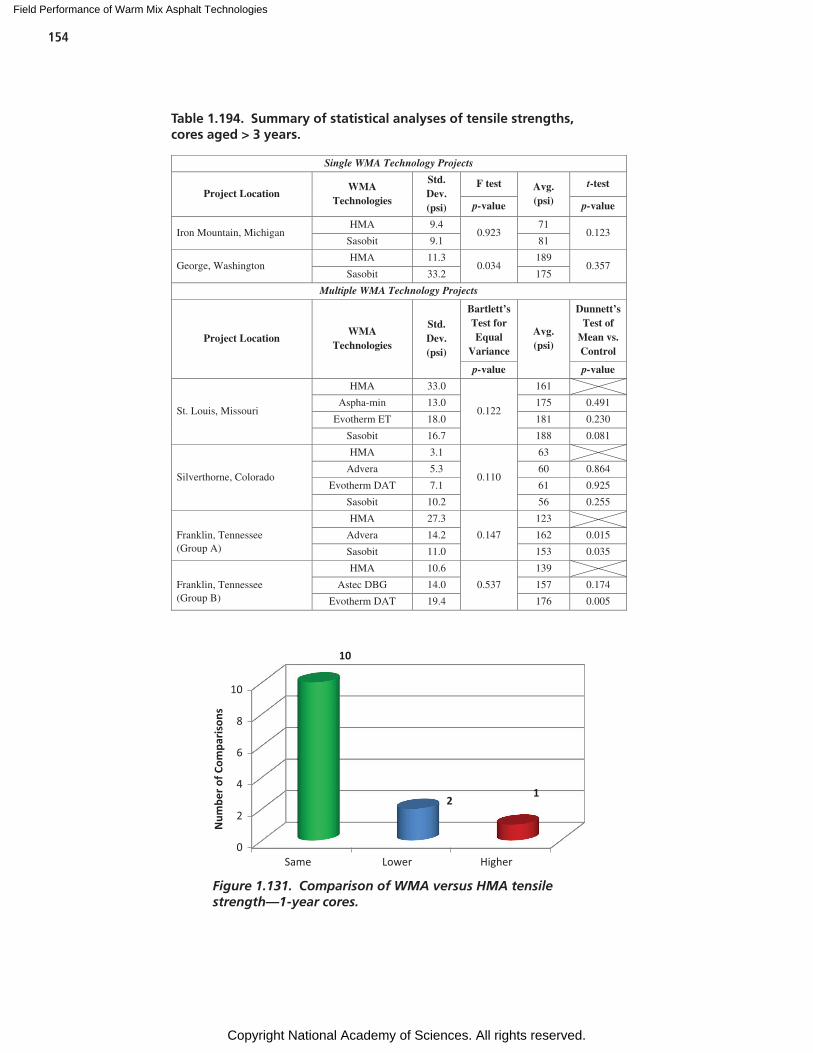
Field Performance of Warm Mix Asphalt Technologies
Copyright National Academy of Sciences. All rights reserved.
154
Single WMA Technology Projects
Project Location WMA
Technologies
Std. Dev.(psi)
F test Avg. (psi)
t-test
p-value p-value
Iron Mountain, MichiganHMA 9.4
0.92371
0.123Sasobit 9.1 81
George, WashingtonHMA 11.3
0.034189
0.357Sasobit 33.2 175
Multiple WMA Technology Projects
Project Location WMA
Technologies
Std. Dev.(psi)
Bartlett’s Test for Equal
Variance
Avg. (psi)
Dunnett’s Test of
Mean vs. Control
p-value p-value
St. Louis, Missouri
HMA 33.0
0.122
161
Aspha-min 13.0 175 0.491
Evotherm ET 18.0 181 0.230
Sasobit 16.7 188 0.081
Silverthorne, Colorado
HMA 3.1
0.110
63
Advera 5.3 60 0.864
Evotherm DAT 7.1 61 0.925
Sasobit 10.2 56 0.255
Franklin, Tennessee
HMA 27.3
0.147
123
Advera 14.2 162 0.015
Sasobit 11.0 153 0.035
Franklin, Tennessee(Group B)
(Group A)
HMA 10.6
0.537
139
Astec DBG 14.0 157 0.174
Evotherm DAT 19.4 176 0.005
Table 1.194. Summary of statistical analyses of tensile strengths, cores aged > 3 years.
Figure 1.131. Comparison of WMA versus HMA tensile strength—1-year cores.
0
2
4
6
8
10
Same Lower Higher
10
21
Num
ber o
f Com
paris
ons
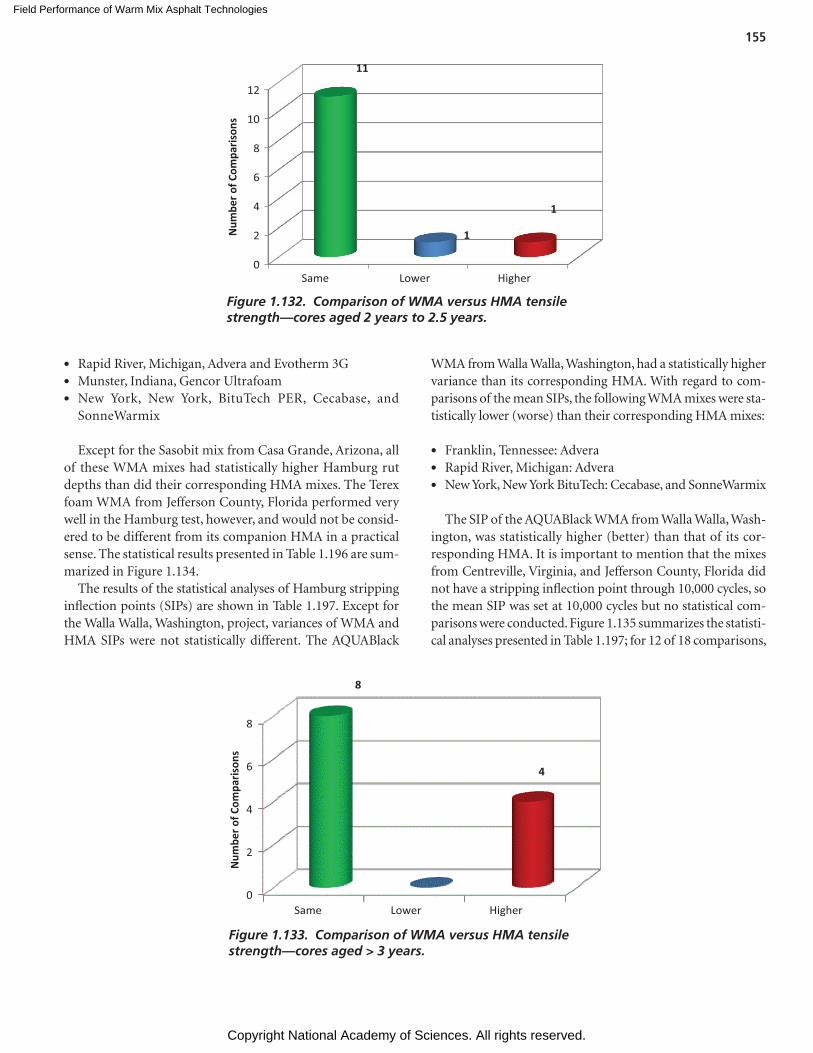
Field Performance of Warm Mix Asphalt Technologies
Copyright National Academy of Sciences. All rights reserved.
155
• Rapid River, Michigan, Advera and Evotherm 3G• Munster, Indiana, Gencor Ultrafoam• New York, New York, BituTech PER, Cecabase, and
Sonne Warmix
Except for the Sasobit mix from Casa Grande, Arizona, all of these WMA mixes had statistically higher Hamburg rut depths than did their corresponding HMA mixes. The Terex foam WMA from Jefferson County, Florida performed very well in the Hamburg test, however, and would not be consid-ered to be different from its companion HMA in a practical sense. The statistical results presented in Table 1.196 are sum-marized in Figure 1.134.
The results of the statistical analyses of Hamburg stripping inflection points (SIPs) are shown in Table 1.197. Except for the Walla Walla, Washington, project, variances of WMA and HMA SIPs were not statistically different. The AQUABlack
WMA from Walla Walla, Washington, had a statistically higher variance than its corresponding HMA. With regard to com-parisons of the mean SIPs, the following WMA mixes were sta-tistically lower (worse) than their corresponding HMA mixes:
• Franklin, Tennessee: Advera• Rapid River, Michigan: Advera• New York, New York BituTech: Cecabase, and SonneWarmix
The SIP of the AQUABlack WMA from Walla Walla, Wash-ington, was statistically higher (better) than that of its cor-responding HMA. It is important to mention that the mixes from Centreville, Virginia, and Jefferson County, Florida did not have a stripping inflection point through 10,000 cycles, so the mean SIP was set at 10,000 cycles but no statistical com-parisons were conducted. Figure 1.135 summarizes the statisti-cal analyses presented in Table 1.197; for 12 of 18 comparisons,
0
2
4
6
8
8
4
Num
ber o
f Com
paris
ons
Same Lower Higher
Figure 1.133. Comparison of WMA versus HMA tensile strength—cores aged > 3 years.
0
2
4
6
8
10
12
Same Lower Higher
11
1
1
Num
ber o
f Com
paris
ons
Figure 1.132. Comparison of WMA versus HMA tensile strength—cores aged 2 years to 2.5 years.
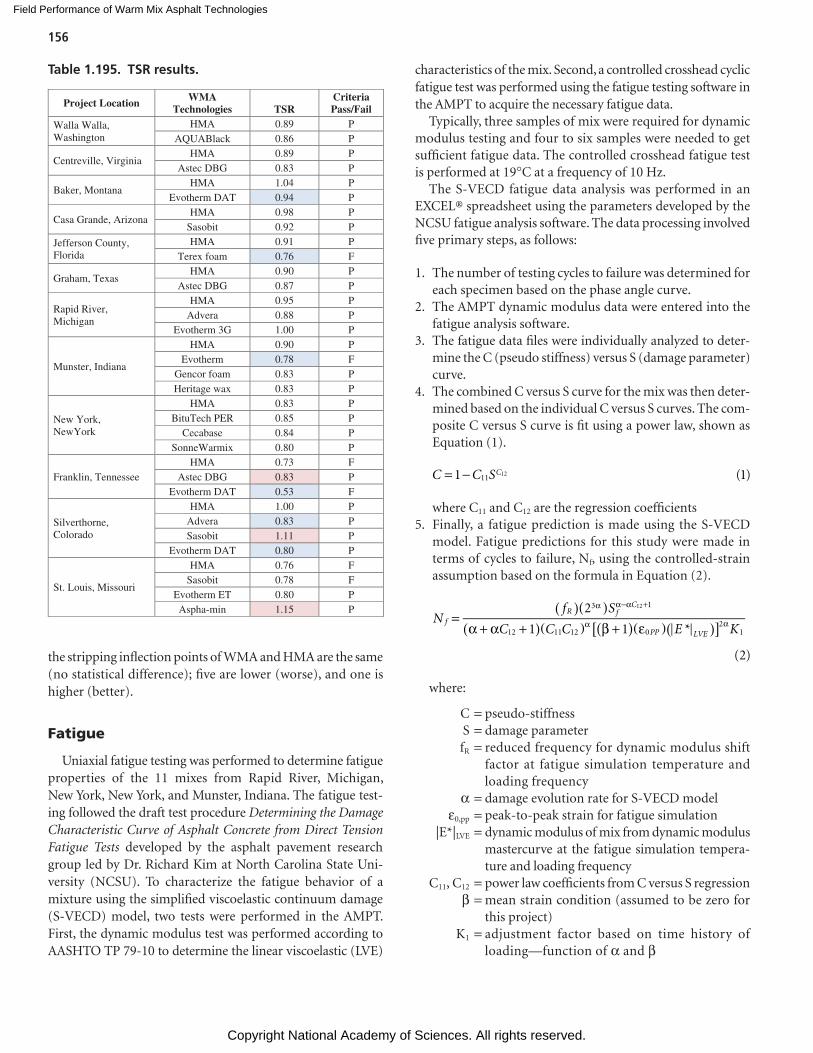
Field Performance of Warm Mix Asphalt Technologies
Copyright National Academy of Sciences. All rights reserved.
156
the stripping inflection points of WMA and HMA are the same (no statistical difference); five are lower (worse), and one is higher (better).
Fatigue
Uniaxial fatigue testing was performed to determine fatigue properties of the 11 mixes from Rapid River, Michigan, New York, New York, and Munster, Indiana. The fatigue test-ing followed the draft test procedure Determining the Damage Characteristic Curve of Asphalt Concrete from Direct Tension Fatigue Tests developed by the asphalt pavement research group led by Dr. Richard Kim at North Carolina State Uni-versity (NCSU). To characterize the fatigue behavior of a mixture using the simplified viscoelastic continuum damage (S-VECD) model, two tests were performed in the AMPT. First, the dynamic modulus test was performed according to AASHTO TP 79-10 to determine the linear viscoelastic (LVE)
characteristics of the mix. Second, a controlled crosshead cyclic fatigue test was performed using the fatigue testing software in the AMPT to acquire the necessary fatigue data.
Typically, three samples of mix were required for dynamic modulus testing and four to six samples were needed to get sufficient fatigue data. The controlled crosshead fatigue test is performed at 19°C at a frequency of 10 Hz.
The S-VECD fatigue data analysis was performed in an EXCEL® spreadsheet using the parameters developed by the NCSU fatigue analysis software. The data processing involved five primary steps, as follows:
1. The number of testing cycles to failure was determined for each specimen based on the phase angle curve.
2. The AMPT dynamic modulus data were entered into the fatigue analysis software.
3. The fatigue data files were individually analyzed to deter-mine the C (pseudo stiffness) versus S (damage parameter) curve.
4. The combined C versus S curve for the mix was then deter-mined based on the individual C versus S curves. The com-posite C versus S curve is fit using a power law, shown as Equation (1).
1 (1)1112C C SC= −
where C11 and C12 are the regression coefficients5. Finally, a fatigue prediction is made using the S-VECD
model. Fatigue predictions for this study were made in terms of cycles to failure, Nf, using the controlled-strain assumption based on the formula in Equation (2).
2
1 1 *
(2)
3 1
12 11 12 02
1
12
Nf S
C C C E Kf
R fC
PP LVE[ ]( )( )
( )( )( )
( )( )=
α + α + β + ε
α α−α +
α α
where:
C = pseudo-stiffness S = damage parameter fR = reduced frequency for dynamic modulus shift
factor at fatigue simulation temperature and loading frequency
a = damage evolution rate for S-VECD model e0,pp = peak-to-peak strain for fatigue simulation |E*|LVE = dynamic modulus of mix from dynamic modulus
mastercurve at the fatigue simulation tempera-ture and loading frequency
C11, C12 = power law coefficients from C versus S regression b = mean strain condition (assumed to be zero for
this project) K1 = adjustment factor based on time history of
loading—function of a and b
Project Location WMA Technologies TSR
Criteria Pass/Fail
Walla Walla, Washington
HMA 0.89 P AQUABlack 0.86 P
Centreville, Virginia HMA 0.89 P
Astec DBG 0.83 P
Baker, Montana HMA 1.04 P
Evotherm DAT 0.94 P
Casa Grande, Arizona HMA 0.98 P
Sasobit 0.92 P
Jefferson County, Florida
HMA 0.91 P Terex foam 0.76 F
Graham, Texas HMA 0.90 P
Astec DBG 0.87 P
Rapid River, Michigan
HMA 0.95 P Advera 0.88 P
Evotherm 3G 1.00 P
Munster, Indiana
HMA 0.90 P Evotherm 0.78 F
Gencor foam 0.83 P Heritage wax 0.83 P
New York, NewYork
HMA 0.83 P BituTech PER 0.85 P
Cecabase 0.84 P SonneWarmix 0.80 P
Franklin, Tennessee HMA 0.73 F
Astec DBG 0.83 P Evotherm DAT 0.53 F
Silverthorne, Colorado
HMA 1.00 P Advera 0.83 P Sasobit 1.11 P
Evotherm DAT 0.80 P
St. Louis, Missouri
HMA 0.76 F Sasobit 0.78 F
Evotherm ET 0.80 P Aspha-min 1.15 P
Table 1.195. TSR results.
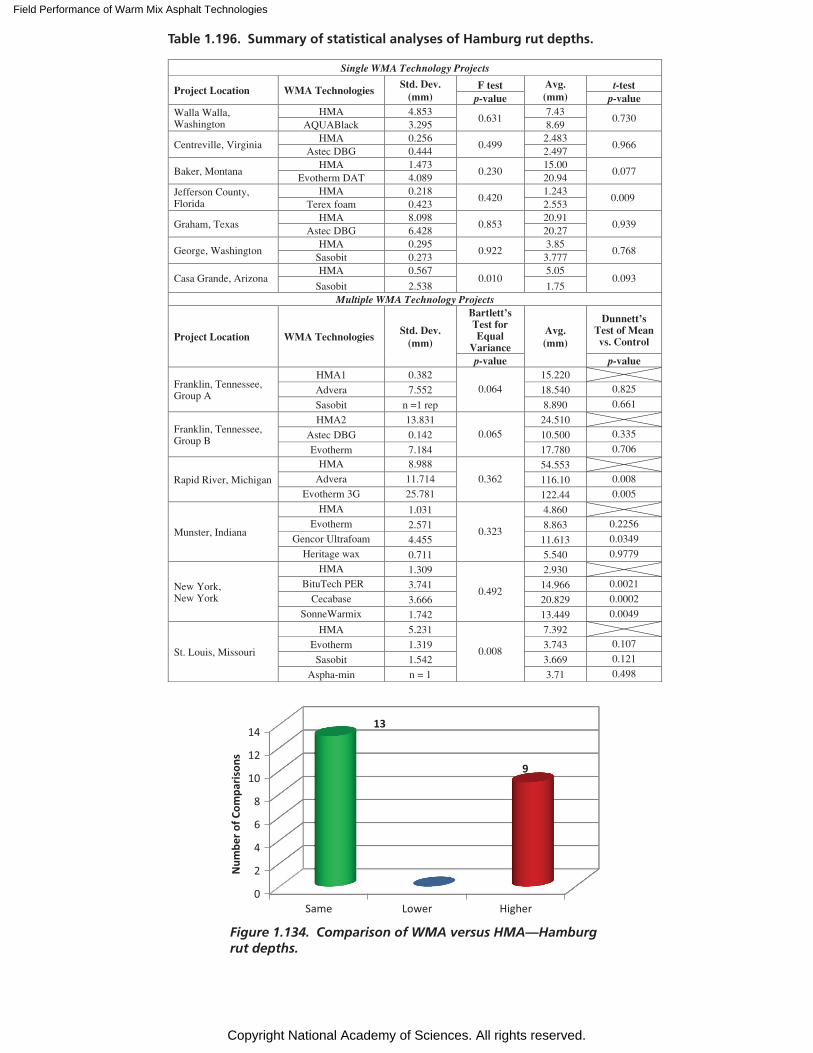
Field Performance of Warm Mix Asphalt Technologies
Copyright National Academy of Sciences. All rights reserved.
Single WMA Technology Projects
Project Location WMA Technologies Std. Dev.(mm)
F test Avg.(mm)
t-testp-value p-value
Walla Walla,Washington
HMA 4.8530.631
7.430.730
AQUABlack 3.295 8.69
Centreville, VirginiaHMA 0.256
0.4992.483
0.966Astec DBG 0.444 2.497
Baker, Montana HMA 1.473
0.23015.00
0.077Evotherm DAT 4.089 20.94
Jefferson County,Florida
HMA 0.2180.420
1.2430.009
Terex foam 0.423 2.553
Graham, TexasHMA 8.098
0.85320.91
0.939 Astec DBG 6.428 20.27
George, WashingtonHMA 0.295
0.9223.85
0.768Sasobit 0.273 3.777
Casa Grande, Arizona HMA 0.567
0.0105.05
0.093Sasobit 2.538 1.75
Multiple WMA Technology Projects
Project Location WMA Technologies Std. Dev.(mm)
Bartlett’s Test for Equal
Variance
Avg.(mm)
Dunnett’s Test of Meanvs. Control
p-value p-value
Franklin, Tennessee, Group A
HMA1 0.3820.064
15.220
Advera 7.552 18.540 0.825
Sasobit n =1 rep 8.890 0.661
Franklin, Tennessee, Group B
HMA2 13.831 0.065
24.510
Astec DBG 0.142 10.500 0.335
Evotherm 7.184 17.780 0.706
Rapid River, Michigan
HMA 8.988
0.36254.553
Advera 11.714 116.10 0.008
Evotherm 3G 25.781 122.44 0.005
Munster, Indiana
HMA 1.031
0.323
4.860Evotherm 2.571 8.863 0.2256
Gencor Ultrafoam 4.455 11.613 0.0349
Heritage wax 0.711 5.540 0.9779
New York, New York
HMA 1.309
0.492
2.930BituTech PER 3.741 14.966 0.0021
Cecabase 3.666 20.829 0.0002
SonneWarmix 1.742 13.449 0.0049
St. Louis, Missouri
HMA 5.231
0.008
7.392
Evotherm 1.319 3.743 0.107
Sasobit 1.542 3.669 0.121
Aspha-min n = 1 3.71 0.498
Table 1.196. Summary of statistical analyses of Hamburg rut depths.
Figure 1.134. Comparison of WMA versus HMA—Hamburg rut depths.
0
2
4
6
8
10
12
14
Same Lower Higher
13
9
Num
ber o
f Com
paris
ons
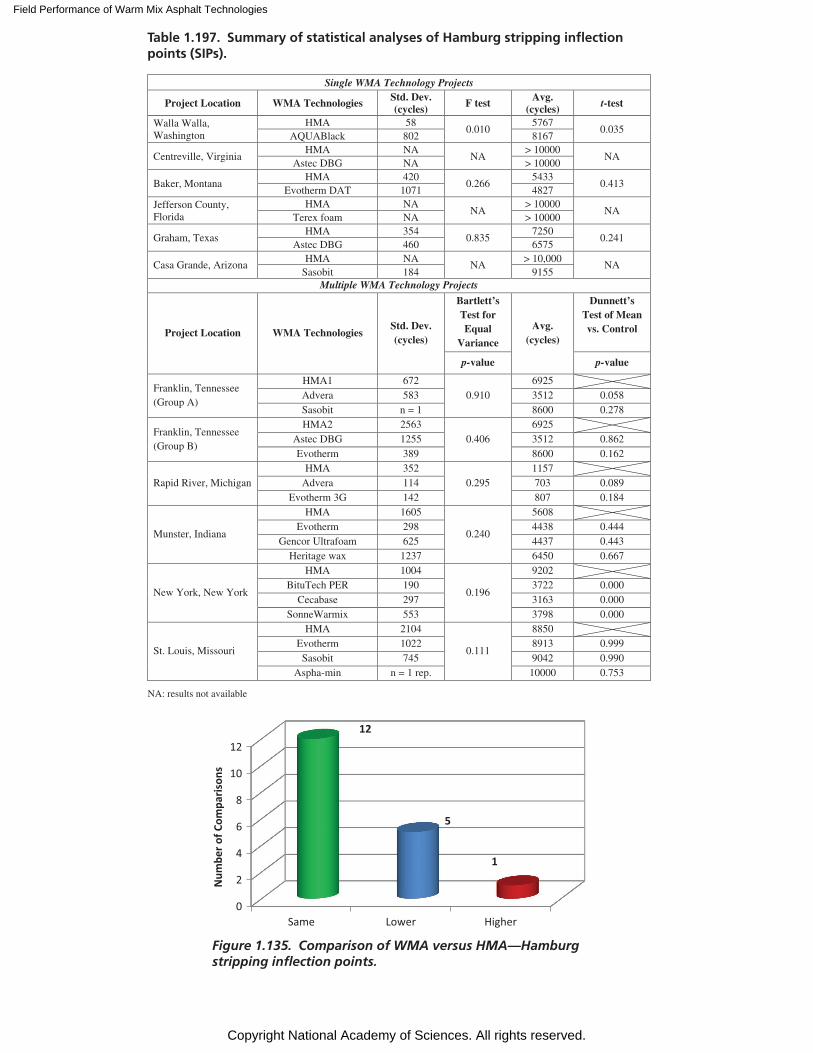
Field Performance of Warm Mix Asphalt Technologies
Copyright National Academy of Sciences. All rights reserved.
Table 1.197. Summary of statistical analyses of Hamburg stripping inflection points (SIPs).
Single WMA Technology Projects
Project Location WMA Technologies Std. Dev. (cycles) F test Avg.
(cycles) t-test
Walla Walla, Washington
HMA 58 0.010
5767 0.035
AQUABlack 802 8167
Centreville, Virginia HMA NA
NA > 10000
NA Astec DBG NA > 10000
Baker, Montana HMA 420
0.266 5433
0.413 Evotherm DAT 1071 4827
Jefferson County, Florida
HMA NA NA
> 10000 NA
Terex foam NA > 10000
Graham, Texas HMA 354
0.835 7250
0.241 Astec DBG 460 6575
Casa Grande, Arizona HMA NA
NA > 10,000
NA Sasobit 184 9155
Multiple WMA Technology Projects
Project Location WMA Technologies Std. Dev. (cycles)
Bartlett’s Test for Equal
Variance
Avg. (cycles)
Dunnett’s Test of Mean vs. Control
p-value p-value
Franklin, Tennessee (Group A)
HMA1 672 0.910
6925 Advera 583 3512 0.058 Sasobit n = 1 8600 0.278
Franklin, Tennessee (Group B)
HMA2 2563 0.406
6925 Astec DBG 1255 3512 0.862 Evotherm 389 8600 0.162
Rapid River, Michigan HMA 352
0.295 1157
Advera 114 703 0.089 Evotherm 3G 142 807 0.184
Munster, Indiana
HMA 1605
0.240
5608 Evotherm 298 4438 0.444
Gencor Ultrafoam 625 4437 0.443 Heritage wax 1237 6450 0.667
New York, New York
HMA 1004
0.196
9202 BituTech PER 190 3722 0.000
Cecabase 297 3163 0.000 SonneWarmix 553 3798 0.000
St. Louis, Missouri
HMA 2104
0.111
8850 Evotherm 1022 8913 0.999 Sasobit 745 9042 0.990
Aspha-min n = 1 rep. 10000 0.753
NA: results not available
Figure 1.135. Comparison of WMA versus HMA—Hamburg stripping inflection points.
0
2
4
6
8
10
12
Same Lower Higher
12
5
1
Num
ber o
f Com
paris
ons
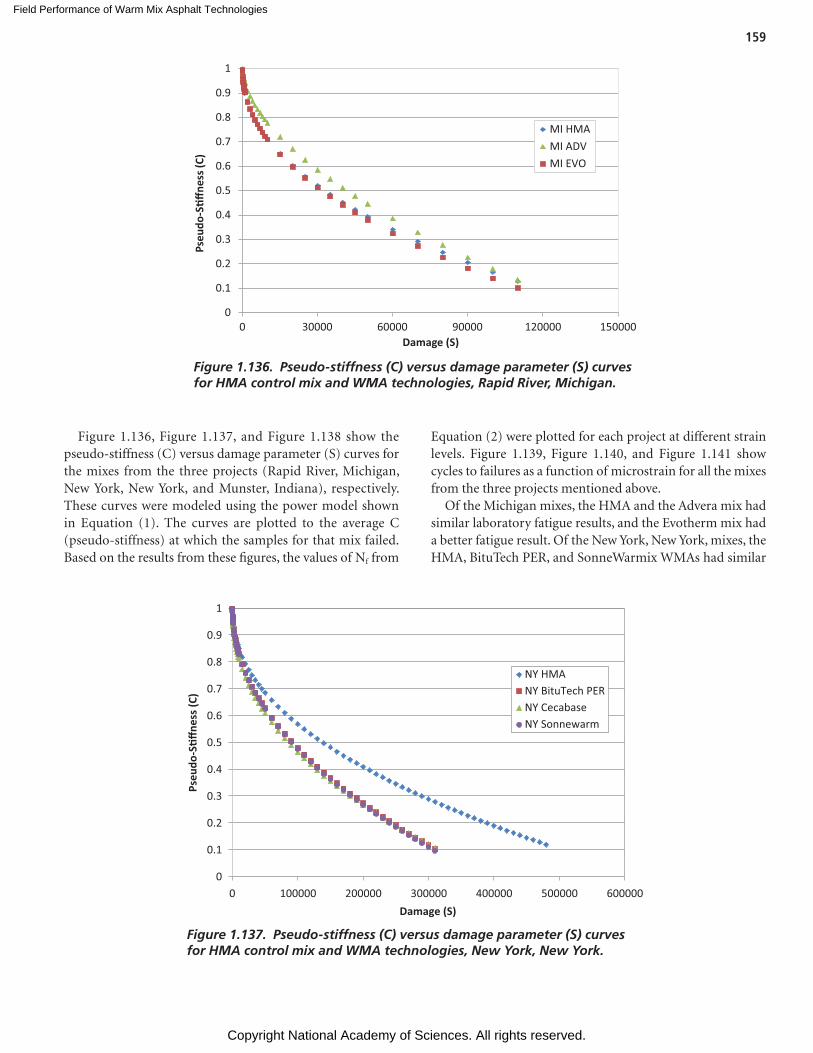
Field Performance of Warm Mix Asphalt Technologies
Copyright National Academy of Sciences. All rights reserved.
159
Figure 1.136, Figure 1.137, and Figure 1.138 show the pseudo-stiffness (C) versus damage parameter (S) curves for the mixes from the three projects (Rapid River, Michigan, New York, New York, and Munster, Indiana), respectively. These curves were modeled using the power model shown in Equation (1). The curves are plotted to the average C (pseudo-stiffness) at which the samples for that mix failed. Based on the results from these figures, the values of Nf from
Equation (2) were plotted for each project at different strain levels. Figure 1.139, Figure 1.140, and Figure 1.141 show cycles to failures as a function of microstrain for all the mixes from the three projects mentioned above.
Of the Michigan mixes, the HMA and the Advera mix had similar laboratory fatigue results, and the Evotherm mix had a better fatigue result. Of the New York, New York, mixes, the HMA, BituTech PER, and SonneWarmix WMAs had similar
0
0.1
0.2
0.3
0.4
0.5
0.6
0.7
0.8
0.9
1
0 100000 200000 300000 400000 500000 600000
Pseu
do-S
�ffne
ss (C
)
Damage (S)
NY HMANY BituTech PERNY CecabaseNY Sonnewarm
Figure 1.137. Pseudo-stiffness (C) versus damage parameter (S) curves for HMA control mix and WMA technologies, New York, New York.
0
0.1
0.2
0.3
0.4
0.5
0.6
0.7
0.8
0.9
1
0 30000 60000 90000 120000 150000
Pseu
do-S
�ffne
ss (C
)
Damage (S)
MI HMA
MI ADV
MI EVO
Figure 1.136. Pseudo-stiffness (C) versus damage parameter (S) curves for HMA control mix and WMA technologies, Rapid River, Michigan.
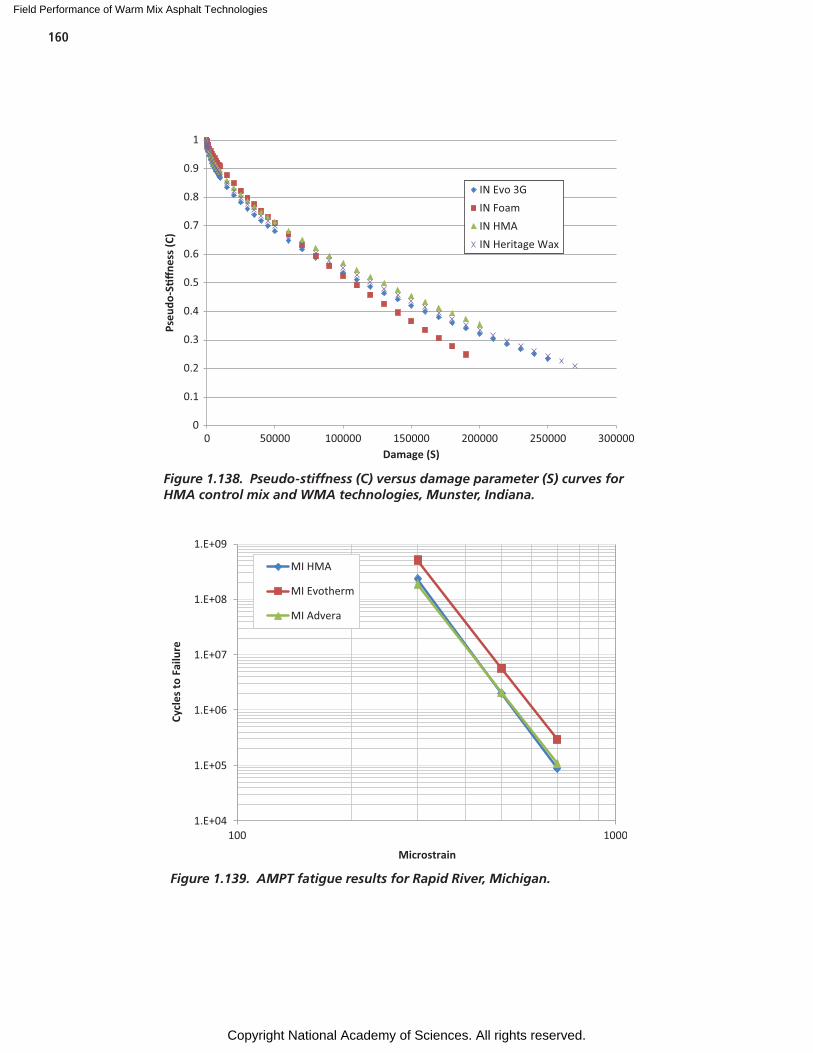
Field Performance of Warm Mix Asphalt Technologies
Copyright National Academy of Sciences. All rights reserved.
160
0
0.1
0.2
0.3
0.4
0.5
0.6
0.7
0.8
0.9
1
0 50000 100000 150000 200000 250000 300000
Pseu
do-S
�ffne
ss (C
)
Damage (S)
IN Evo 3G
IN Foam
IN HMA
IN Heritage Wax
Figure 1.138. Pseudo-stiffness (C) versus damage parameter (S) curves for HMA control mix and WMA technologies, Munster, Indiana.
1.E+04
1.E+05
1.E+06
1.E+07
1.E+08
1.E+09
100 1000
Cycl
es to
Fai
lure
Microstrain
MI HMA
MI Evotherm
MI Advera
Figure 1.139. AMPT fatigue results for Rapid River, Michigan.
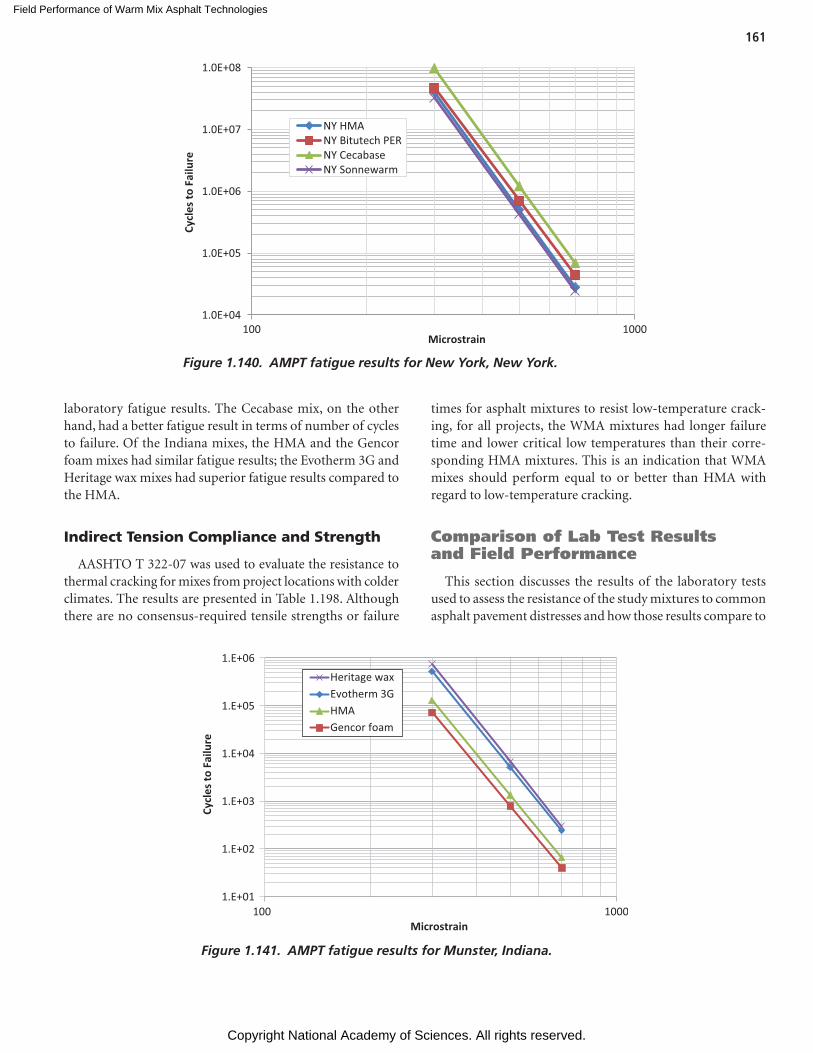
Field Performance of Warm Mix Asphalt Technologies
Copyright National Academy of Sciences. All rights reserved.
161
1.0E+04
1.0E+05
1.0E+06
1.0E+07
1.0E+08
100 1000
Cycl
es to
Fai
lure
Microstrain
NY HMANY Bitutech PERNY CecabaseNY Sonnewarm
Figure 1.140. AMPT fatigue results for New York, New York.
1.E+01
1.E+02
1.E+03
1.E+04
1.E+05
1.E+06
100 1000
Cycl
es to
Fai
lure
Microstrain
Heritage waxEvotherm 3GHMAGencor foam
Figure 1.141. AMPT fatigue results for Munster, Indiana.
laboratory fatigue results. The Cecabase mix, on the other hand, had a better fatigue result in terms of number of cycles to failure. Of the Indiana mixes, the HMA and the Gencor foam mixes had similar fatigue results; the Evotherm 3G and Heritage wax mixes had superior fatigue results compared to the HMA.
Indirect Tension Compliance and Strength
AASHTO T 322-07 was used to evaluate the resistance to thermal cracking for mixes from project locations with colder climates. The results are presented in Table 1.198. Although there are no consensus-required tensile strengths or failure
times for asphalt mixtures to resist low-temperature crack-ing, for all projects, the WMA mixtures had longer failure time and lower critical low temperatures than their corre-sponding HMA mixtures. This is an indication that WMA mixes should perform equal to or better than HMA with regard to low-temperature cracking.
Comparison of Lab Test Results and Field Performance
This section discusses the results of the laboratory tests used to assess the resistance of the study mixtures to common asphalt pavement distresses and how those results compare to
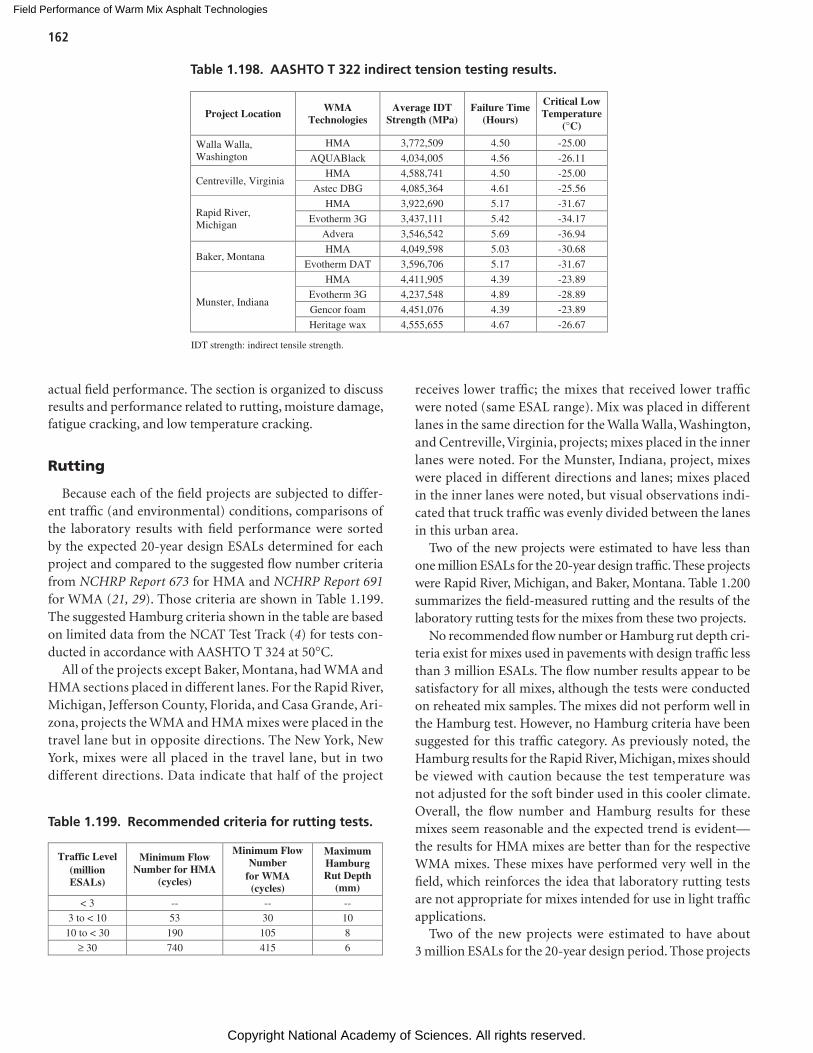
Field Performance of Warm Mix Asphalt Technologies
Copyright National Academy of Sciences. All rights reserved.
162
actual field performance. The section is organized to discuss results and performance related to rutting, moisture damage, fatigue cracking, and low temperature cracking.
Rutting
Because each of the field projects are subjected to differ-ent traffic (and environmental) conditions, comparisons of the laboratory results with field performance were sorted by the expected 20-year design ESALs determined for each project and compared to the suggested flow number criteria from NCHRP Report 673 for HMA and NCHRP Report 691 for WMA (21, 29). Those criteria are shown in Table 1.199. The suggested Hamburg criteria shown in the table are based on limited data from the NCAT Test Track (4) for tests con-ducted in accordance with AASHTO T 324 at 50°C.
All of the projects except Baker, Montana, had WMA and HMA sections placed in different lanes. For the Rapid River, Michigan, Jefferson County, Florida, and Casa Grande, Ari-zona, projects the WMA and HMA mixes were placed in the travel lane but in opposite directions. The New York, New York, mixes were all placed in the travel lane, but in two different directions. Data indicate that half of the project
receives lower traffic; the mixes that received lower traffic were noted (same ESAL range). Mix was placed in different lanes in the same direction for the Walla Walla, Washington, and Centreville, Virginia, projects; mixes placed in the inner lanes were noted. For the Munster, Indiana, project, mixes were placed in different directions and lanes; mixes placed in the inner lanes were noted, but visual observations indi-cated that truck traffic was evenly divided between the lanes in this urban area.
Two of the new projects were estimated to have less than one million ESALs for the 20-year design traffic. These projects were Rapid River, Michigan, and Baker, Montana. Table 1.200 summarizes the field-measured rutting and the results of the laboratory rutting tests for the mixes from these two projects.
No recommended flow number or Hamburg rut depth cri-teria exist for mixes used in pavements with design traffic less than 3 million ESALs. The flow number results appear to be satisfactory for all mixes, although the tests were conducted on reheated mix samples. The mixes did not perform well in the Hamburg test. However, no Hamburg criteria have been suggested for this traffic category. As previously noted, the Hamburg results for the Rapid River, Michigan, mixes should be viewed with caution because the test temperature was not adjusted for the soft binder used in this cooler climate. Overall, the flow number and Hamburg results for these mixes seem reasonable and the expected trend is evident—the results for HMA mixes are better than for the respective WMA mixes. These mixes have performed very well in the field, which reinforces the idea that laboratory rutting tests are not appropriate for mixes intended for use in light traffic applications.
Two of the new projects were estimated to have about 3 million ESALs for the 20-year design period. Those projects
Traffic Level (million ESALs)
Minimum Flow Number for HMA
(cycles)
Minimum Flow Number
for WMA (cycles)
MaximumHamburg Rut Depth
(mm) < 3 -- -- --
3 to < 10 53 30 10
10 to < 30 190 105 8
≥ 30 740 415 6
Table 1.199. Recommended criteria for rutting tests.
Project Location WMA Technologies
Average IDT Strength (MPa)
Failure Time (Hours)
Critical Low Temperature
(°C)
Walla Walla, Washington
HMA 3,772,509 4.50 -25.00
AQUABlack 4,034,005 4.56 -26.11
Centreville, Virginia HMA 4,588,741 4.50 -25.00
Astec DBG 4,085,364 4.61 -25.56
Rapid River, Michigan
HMA 3,922,690 5.17 -31.67
Evotherm 3G 3,437,111 5.42 -34.17
Advera 3,546,542 5.69 -36.94
Baker, Montana HMA 4,049,598 5.03 -30.68
Evotherm DAT 3,596,706 5.17 -31.67
Munster, Indiana
HMA 4,411,905 4.39 -23.89
Evotherm 3G 4,237,548 4.89 -28.89
Gencor foam 4,451,076 4.39 -23.89
Heritage wax 4,555,655 4.67 -26.67
IDT strength: indirect tensile strength.
Table 1.198. AASHTO T 322 indirect tension testing results.
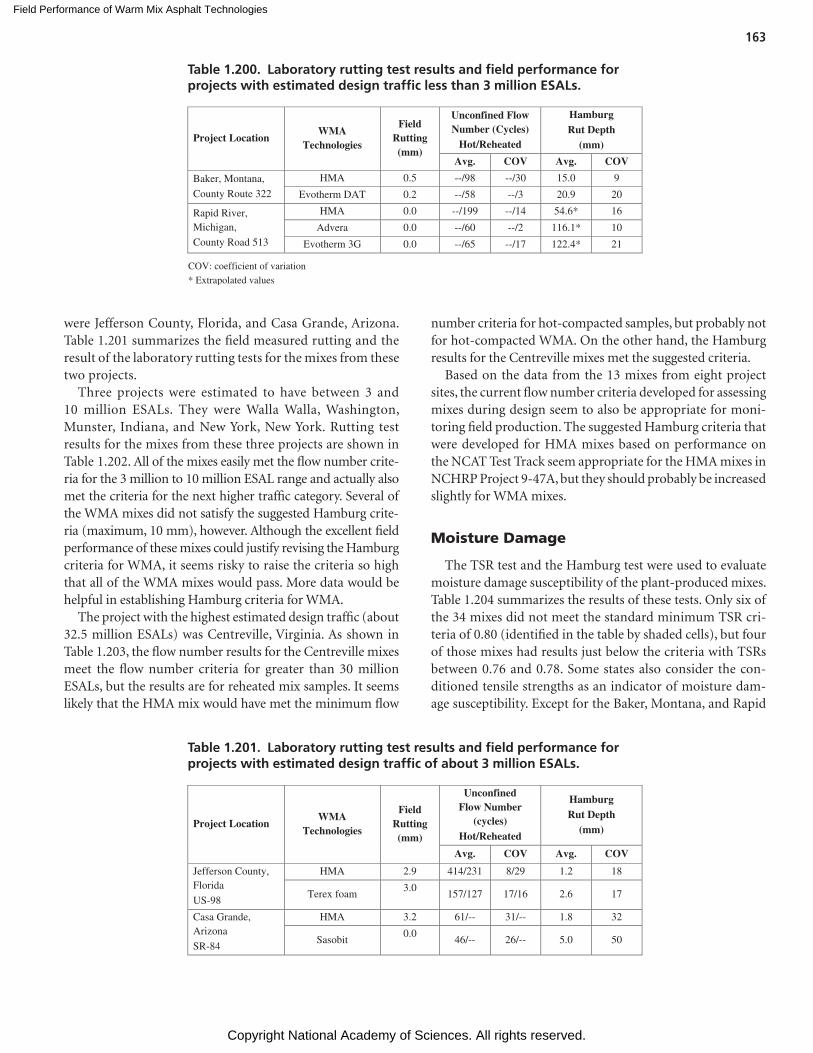
Field Performance of Warm Mix Asphalt Technologies
Copyright National Academy of Sciences. All rights reserved.
163
were Jefferson County, Florida, and Casa Grande, Arizona. Table 1.201 summarizes the field measured rutting and the result of the laboratory rutting tests for the mixes from these two projects.
Three projects were estimated to have between 3 and 10 million ESALs. They were Walla Walla, Washington, Munster, Indiana, and New York, New York. Rutting test results for the mixes from these three projects are shown in Table 1.202. All of the mixes easily met the flow number crite-ria for the 3 million to 10 million ESAL range and actually also met the criteria for the next higher traffic category. Several of the WMA mixes did not satisfy the suggested Hamburg crite-ria (maximum, 10 mm), however. Although the excellent field performance of these mixes could justify revising the Hamburg criteria for WMA, it seems risky to raise the criteria so high that all of the WMA mixes would pass. More data would be helpful in establishing Hamburg criteria for WMA.
The project with the highest estimated design traffic (about 32.5 million ESALs) was Centreville, Virginia. As shown in Table 1.203, the flow number results for the Centreville mixes meet the flow number criteria for greater than 30 million ESALs, but the results are for reheated mix samples. It seems likely that the HMA mix would have met the minimum flow
number criteria for hot-compacted samples, but probably not for hot-compacted WMA. On the other hand, the Hamburg results for the Centreville mixes met the suggested criteria.
Based on the data from the 13 mixes from eight project sites, the current flow number criteria developed for assessing mixes during design seem to also be appropriate for moni-toring field production. The suggested Hamburg criteria that were developed for HMA mixes based on performance on the NCAT Test Track seem appropriate for the HMA mixes in NCHRP Project 9-47A, but they should probably be increased slightly for WMA mixes.
Moisture Damage
The TSR test and the Hamburg test were used to evaluate moisture damage susceptibility of the plant-produced mixes. Table 1.204 summarizes the results of these tests. Only six of the 34 mixes did not meet the standard minimum TSR cri-teria of 0.80 (identified in the table by shaded cells), but four of those mixes had results just below the criteria with TSRs between 0.76 and 0.78. Some states also consider the con-ditioned tensile strengths as an indicator of moisture dam-age susceptibility. Except for the Baker, Montana, and Rapid
Project Location WMA
Technologies
Field Rutting (mm)
Unconfined Flow Number
(cycles) Hot/Reheated
Hamburg Rut Depth
(mm)
Avg. COV Avg. COV
Jefferson County, Florida
US-98
HMA 2.9 414/231 8/29 1.2 18
Terex foam 3.0
157/127 17/16 2.6 17
Casa Grande, Arizona
SR-84
HMA 3.2 61/-- 31/-- 1.8 32
Sasobit 0.0
46/-- 26/-- 5.0 50
Table 1.201. Laboratory rutting test results and field performance for projects with estimated design traffic of about 3 million ESALs.
Project Location WMA
Technologies
Field Rutting (mm)
Unconfined Flow Number (Cycles)
Hot/Reheated
Hamburg Rut Depth
(mm)
Avg. COV Avg. COV
Baker, Montana,
County Route 322
HMA 0.5 --/98 --/30 15.0 9
Evotherm DAT 0.2 --/58 --/3 20.9 20
Rapid River, Michigan,
County Road 513
HMA 0.0 --/199 --/14 54.6* 16
Advera 0.0 --/60 --/2 116.1* 10
Evotherm 3G 0.0 --/65 --/17 122.4* 21
COV: coefficient of variation
* Extrapolated values
Table 1.200. Laboratory rutting test results and field performance for projects with estimated design traffic less than 3 million ESALs.
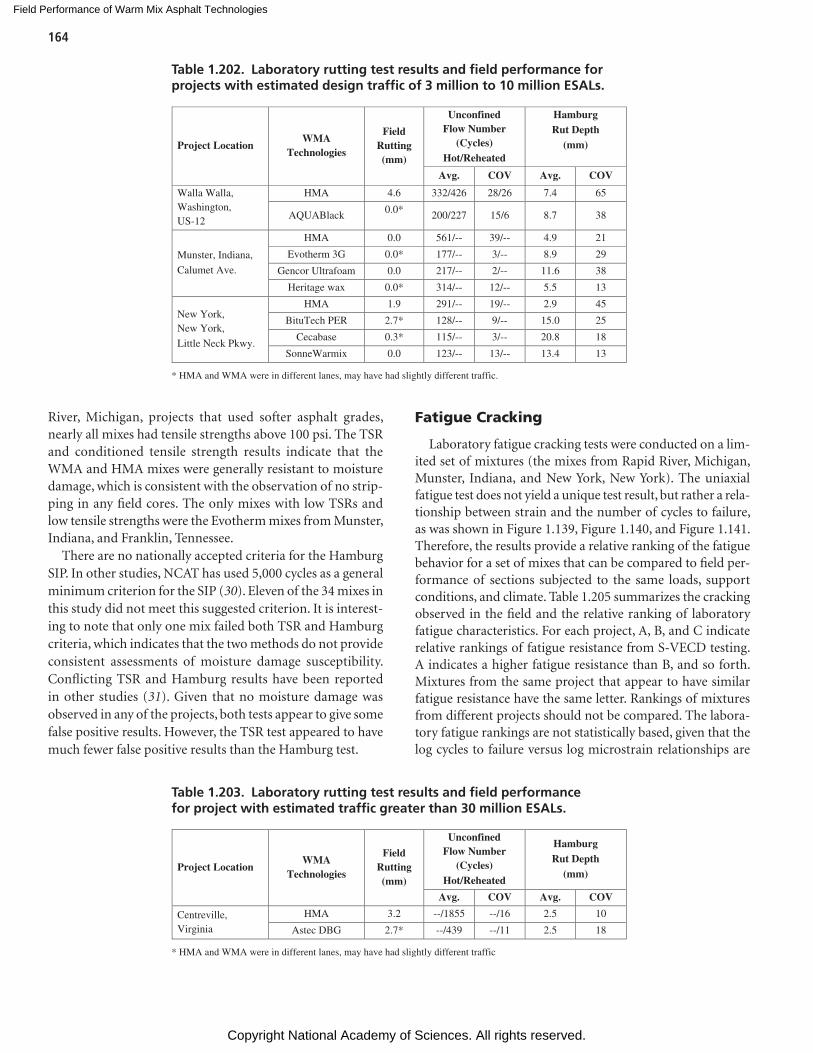
Field Performance of Warm Mix Asphalt Technologies
Copyright National Academy of Sciences. All rights reserved.
164
River, Michigan, projects that used softer asphalt grades, nearly all mixes had tensile strengths above 100 psi. The TSR and conditioned tensile strength results indicate that the WMA and HMA mixes were generally resistant to moisture damage, which is consistent with the observation of no strip-ping in any field cores. The only mixes with low TSRs and low tensile strengths were the Evotherm mixes from Munster, Indiana, and Franklin, Tennessee.
There are no nationally accepted criteria for the Hamburg SIP. In other studies, NCAT has used 5,000 cycles as a general minimum criterion for the SIP (30). Eleven of the 34 mixes in this study did not meet this suggested criterion. It is interest-ing to note that only one mix failed both TSR and Hamburg criteria, which indicates that the two methods do not provide consistent assessments of moisture damage susceptibility. Conflicting TSR and Hamburg results have been reported in other studies (31). Given that no moisture damage was observed in any of the projects, both tests appear to give some false positive results. However, the TSR test appeared to have much fewer false positive results than the Hamburg test.
Fatigue Cracking
Laboratory fatigue cracking tests were conducted on a lim-ited set of mixtures (the mixes from Rapid River, Michigan, Munster, Indiana, and New York, New York). The uniaxial fatigue test does not yield a unique test result, but rather a rela-tionship between strain and the number of cycles to failure, as was shown in Figure 1.139, Figure 1.140, and Figure 1.141. Therefore, the results provide a relative ranking of the fatigue behavior for a set of mixes that can be compared to field per-formance of sections subjected to the same loads, support conditions, and climate. Table 1.205 summarizes the cracking observed in the field and the relative ranking of laboratory fatigue characteristics. For each project, A, B, and C indicate relative rankings of fatigue resistance from S-VECD testing. A indicates a higher fatigue resistance than B, and so forth. Mixtures from the same project that appear to have similar fatigue resistance have the same letter. Rankings of mixtures from different projects should not be compared. The labora-tory fatigue rankings are not statistically based, given that the log cycles to failure versus log microstrain relationships are
Project Location WMA
Technologies
Field Rutting (mm)
Unconfined Flow Number
(Cycles) Hot/Reheated
Hamburg Rut Depth
(mm)
Avg. COV Avg. COV
Walla Walla, Washington, US-12
HMA 4.6 332/426 28/26 7.4 65
AQUABlack 0.0* 200/227 15/6 8.7 38
Munster, Indiana,
Calumet Ave.
HMA 0.0 561/-- 39/-- 4.9 21
Evotherm 3G 0.0* 177/-- 3/-- 8.9 29
Gencor Ultrafoam 0.0 217/-- 2/-- 11.6 38
Heritage wax 0.0* 314/-- 12/-- 5.5 13
New York, New York,
Little Neck Pkwy.
HMA 1.9 291/-- 19/-- 2.9 45
BituTech PER 2.7* 128/-- 9/-- 15.0 25
Cecabase 0.3* 115/-- 3/-- 20.8 18
SonneWarmix 0.0 123/-- 13/-- 13.4 13
* HMA and WMA were in different lanes, may have had slightly different traffic.
Table 1.202. Laboratory rutting test results and field performance for projects with estimated design traffic of 3 million to 10 million ESALs.
Project Location WMA
Technologies
Field Rutting (mm)
Unconfined Flow Number
(Cycles) Hot/Reheated
Hamburg Rut Depth
(mm)
Avg. COV Avg. COV
Centreville, Virginia
HMA 3.2 --/1855 --/16 2.5 10
Astec DBG 2.7* --/439 --/11 2.5 18
* HMA and WMA were in different lanes, may have had slightly different traffic
Table 1.203. Laboratory rutting test results and field performance for project with estimated traffic greater than 30 million ESALs.
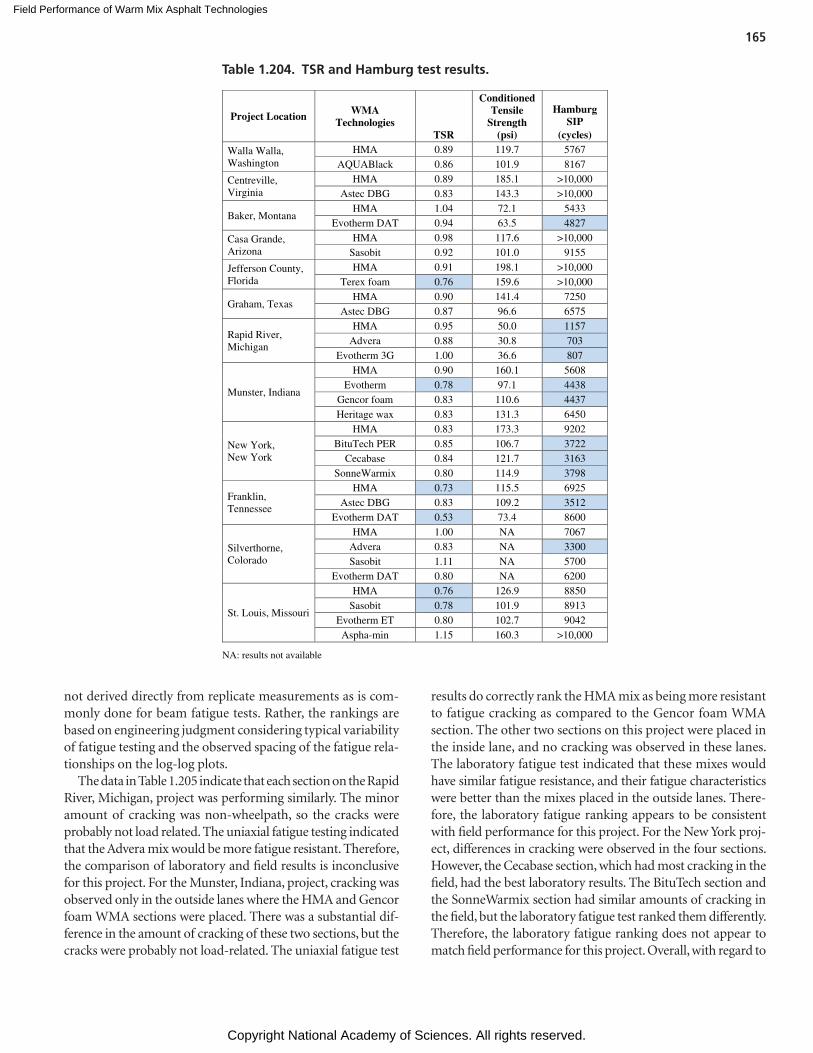
Field Performance of Warm Mix Asphalt Technologies
Copyright National Academy of Sciences. All rights reserved.
165
not derived directly from replicate measurements as is com-monly done for beam fatigue tests. Rather, the rankings are based on engineering judgment considering typical variability of fatigue testing and the observed spacing of the fatigue rela-tionships on the log-log plots.
The data in Table 1.205 indicate that each section on the Rapid River, Michigan, project was performing similarly. The minor amount of cracking was non-wheelpath, so the cracks were probably not load related. The uniaxial fatigue testing indicated that the Advera mix would be more fatigue resistant. Therefore, the comparison of laboratory and field results is inconclusive for this project. For the Munster, Indiana, project, cracking was observed only in the outside lanes where the HMA and Gencor foam WMA sections were placed. There was a substantial dif-ference in the amount of cracking of these two sections, but the cracks were probably not load-related. The uniaxial fatigue test
results do correctly rank the HMA mix as being more resistant to fatigue cracking as compared to the Gencor foam WMA section. The other two sections on this project were placed in the inside lane, and no cracking was observed in these lanes. The laboratory fatigue test indicated that these mixes would have similar fatigue resistance, and their fatigue characteristics were better than the mixes placed in the outside lanes. There-fore, the laboratory fatigue ranking appears to be consistent with field performance for this project. For the New York proj-ect, differences in cracking were observed in the four sections. However, the Cecabase section, which had most cracking in the field, had the best laboratory results. The BituTech section and the SonneWarmix section had similar amounts of cracking in the field, but the laboratory fatigue test ranked them differently. Therefore, the laboratory fatigue ranking does not appear to match field performance for this project. Overall, with regard to
Project Location WMA Technologies
TSR
Conditioned Tensile
Strength (psi)
Hamburg SIP
(cycles)
Walla Walla, Washington
HMA 0.89 119.7 5767 AQUABlack 0.86 101.9 8167
Centreville, Virginia
HMA 0.89 185.1 >10,000 Astec DBG 0.83 143.3 >10,000
Baker, Montana HMA 1.04 72.1 5433
Evotherm DAT 0.94 63.5 4827
Casa Grande, Arizona
HMA 0.98 117.6 >10,000 Sasobit 0.92 101.0 9155
Jefferson County, Florida
HMA 0.91 198.1 >10,000 Terex foam 0.76 159.6 >10,000
Graham, Texas HMA 0.90 141.4 7250
Astec DBG 0.87 96.6 6575
Rapid River, Michigan
HMA 0.95 50.0 1157 Advera 0.88 30.8 703
Evotherm 3G 1.00 36.6 807
Munster, Indiana
HMA 0.90 160.1 5608 Evotherm 0.78 97.1 4438
Gencor foam 0.83 110.6 4437 Heritage wax 0.83 131.3 6450
New York, New York
HMA 0.83 173.3 9202 BituTech PER 0.85 106.7 3722
Cecabase 0.84 121.7 3163 SonneWarmix 0.80 114.9 3798
Franklin, Tennessee
HMA 0.73 115.5 6925 Astec DBG 0.83 109.2 3512
Evotherm DAT 0.53 73.4 8600
Silverthorne, Colorado
HMA 1.00 NA 7067 Advera 0.83 NA 3300 Sasobit 1.11 NA 5700
Evotherm DAT 0.80 NA 6200
St. Louis, Missouri
HMA 0.76 126.9 8850 Sasobit 0.78 101.9 8913
Evotherm ET 0.80 102.7 9042 Aspha-min 1.15 160.3 >10,000
NA: results not available
Table 1.204. TSR and Hamburg test results.
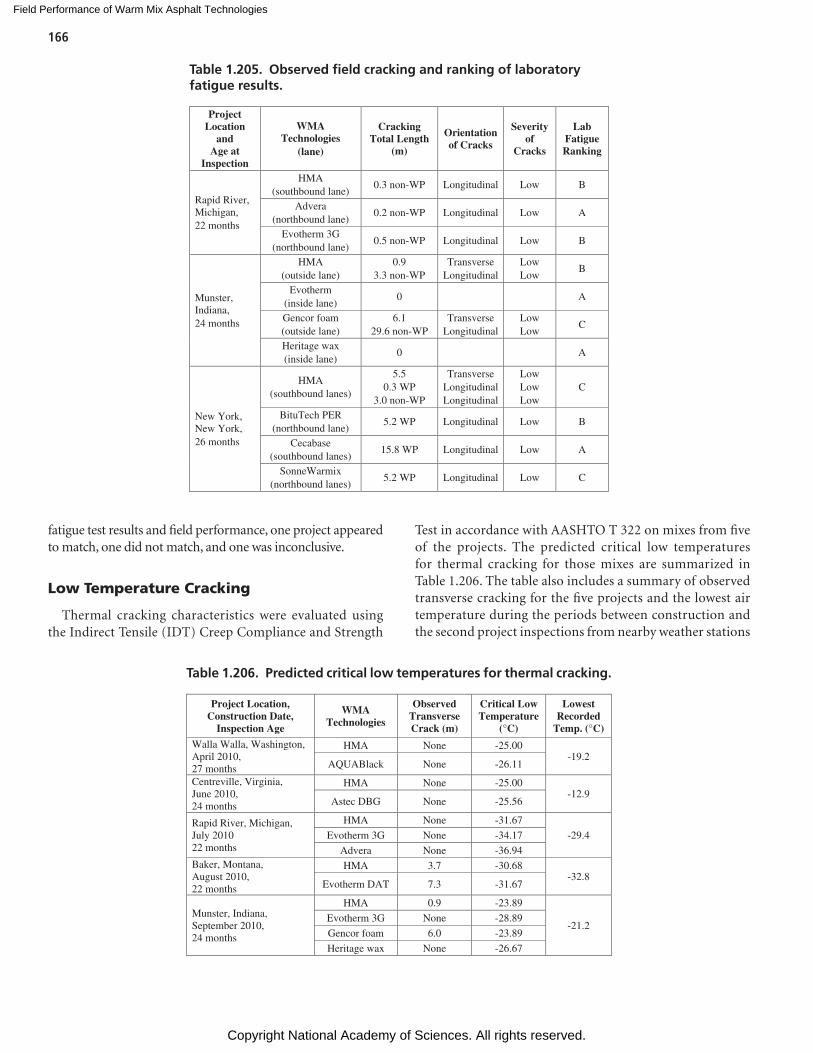
Field Performance of Warm Mix Asphalt Technologies
Copyright National Academy of Sciences. All rights reserved.
166
fatigue test results and field performance, one project appeared to match, one did not match, and one was inconclusive.
Low Temperature Cracking
Thermal cracking characteristics were evaluated using the Indirect Tensile (IDT) Creep Compliance and Strength
Test in accordance with AASHTO T 322 on mixes from five of the projects. The predicted critical low temperatures for thermal cracking for those mixes are summarized in Table 1.206. The table also includes a summary of observed transverse cracking for the five projects and the lowest air temperature during the periods between construction and the second project inspections from nearby weather stations
Project Location, Construction Date,
Inspection Age
WMA Technologies
Observed Transverse Crack (m)
Critical Low Temperature
(°C)
Lowest Recorded
Temp. (°C)
Walla Walla, Washington, April 2010, 27 months
HMA None -25.00 -19.2
AQUABlack None -26.11
Centreville, Virginia, June 2010, 24 months
HMA None -25.00 -12.9
Astec DBG None -25.56
Rapid River, Michigan, July 2010 22 months
HMA None -31.67
-29.4 Evotherm 3G None -34.17
Advera None -36.94 Baker, Montana, August 2010, 22 months
HMA 3.7 -30.68 -32.8
Evotherm DAT 7.3 -31.67
Munster, Indiana, September 2010, 24 months
HMA 0.9 -23.89
-21.2 Evotherm 3G None -28.89
Gencor foam 6.0 -23.89
Heritage wax None -26.67
Table 1.206. Predicted critical low temperatures for thermal cracking.
Project Location
and Age at
Inspection
WMA Technologies
(lane)
Cracking Total Length
(m)
Orientation of Cracks
Severity of
Cracks
Lab Fatigue Ranking
Rapid River, Michigan, 22 months
HMA (southbound lane)
0.3 non-WP Longitudinal Low B
Advera (northbound lane)
0.2 non-WP Longitudinal Low A
Evotherm 3G (northbound lane)
0.5 non-WP Longitudinal Low B
Munster, Indiana, 24 months
HMA (outside lane)
0.9 3.3 non-WP
Transverse Longitudinal
Low Low
B
Evotherm (inside lane)
0 A
Gencor foam (outside lane)
6.1 29.6 non-WP
Transverse Longitudinal
Low Low
C
Heritage wax (inside lane)
0 A
New York, New York, 26 months
HMA (southbound lanes)
5.5 0.3 WP
3.0 non-WP
Transverse Longitudinal Longitudinal
Low Low Low
C
BituTech PER (northbound lane)
5.2 WP Longitudinal Low B
Cecabase (southbound lanes)
15.8 WP Longitudinal Low A
SonneWarmix (northbound lanes)
5.2 WP Longitudinal Low C
Table 1.205. Observed field cracking and ranking of laboratory fatigue results.
Field Performance of Warm Mix Asphalt Technologies
Copyright National Academy of Sciences. All rights reserved.
167
from the Weather Underground website (www.wunder ground.com). As shown in the table, no transverse cracking was observed for the first three projects. The recorded air temperatures for those projects were well above the criti-cal low temperatures determined from the laboratory ther-mal cracking testing and analysis. For the Baker, Montana, project, the Evotherm WMA section had more cracking than the HMA section, even though the calculated critical cracking temperature was 1°C lower for the WMA mixture. The actual low temperature for Baker, Montana, was a few degrees colder than the critical cracking temperature for the
two mixes on that project. For the Munster, Indiana, project, the actual low temperature was higher than the calculated critical cracking temperature for all four test sections. The two sections with the lowest critical cracking temperature determined from laboratory tests (HMA and Gencor foam WMA) did have cracking, but the amount of cracking was different. The other two WMA sections had higher criti-cal cracking temperatures, and no transverse cracks were observed. Overall, the relationship between the IDT Creep Compliance and Strength test results and the observed field performance was inconclusive.
Field Performance of Warm Mix Asphalt Technologies
Copyright National Academy of Sciences. All rights reserved.
168
The mixes from the warm mix asphalt (WMA) technology projects in Michigan, Indiana, and New York, along with the mixes from Montana and Florida, were verified according to the Draft Appendix to AASHTO R35: Special Mixture Design Considerations and Methods for Warm Mix Asphalt (WMA) presented with NCHRP Report 691: Mix Design Practices for Warm Mix Asphalt which is the final report for NCHRP Proj-ect 9-43 (21). This group of mixes provided a range of WMA technologies, aggregate types, and production and compac-tion temperatures.
Determination of Optimum Asphalt Content
One goal of the mix verifications was to determine if plant production of WMA could be simulated in the laboratory. Given that changes in gradation during plant production affect the measured volumetric properties, the as-produced gradation and asphalt content were used as the target for the laboratory mix design verification for each combination of location and technology. Thus, within a given project, there were some differences in the target laboratory gradation even though all of the mixes from a given location were based on the same design.
Rapid River, Michigan
Table 1.207 shows the job mix formula (JMF), measured field gradations, and gradation checks of laboratory batched samples. For the Michigan project, the laboratory verification of the hot mix asphalt (HMA) mixture targeted the JMF rather than the field gradation to demonstrate that the research team could match the contractor’s design. The asphalt contents for the field mixes are those measured in the field samples; the laboratory asphalt contents are the optimum asphalt con-tents determined from the mix verification. For this project, the optimum asphalt contents were selected at 4% air voids
at 30 Ndesign gyrations. Both WMA technologies resulted in a reduction in optimum asphalt content compared to the HMA control.
Table 1.208 shows the volumetric properties at the asphalt contents used to bracket the field-measured asphalt content. The field volumetric properties are also shown for compari-son. The AASHTO T 312 1s and d2s precision limits for rela-tive density in multi-laboratory mixes (with NCAT personnel in NCAT mobile laboratory and AMS personnel in AMS lab-oratory) are 0.6% and 1.7%, respectively. All the laboratory-to-field comparisons were within the d2s limit. It should be noted that the JMF gradation was targeted for the HMA laboratory verification and not the field-produced HMA gra-dation. The HMA verification indicated a 0.02% difference in optimum asphalt content. The difference between rela-tive density at Ndesign of the field-produced and laboratory-produced Evotherm 3G was 0.7%.
Baker, Montana
For the Montana project, Ndesign was specified as 75 gyra-tions. Table 1.209 shows the JMF, measured field grada-tions, and gradation checks of laboratory batched samples. Table 1.210 shows the volumetric properties at the asphalt con-tents used to bracket the field-measured asphalt content. The field volumetric properties are also shown for comparison.
The laboratory verification of the Evotherm DAT mix could not achieve 4.0% air voids. At the field-measured asphalt con-tent, the air void content was 4.8%. Higher asphalt contents appeared to be on the wet side of the voids in mineral aggre-gate (VMA) curve.
Munster, Indiana
For the Indiana project, Ndesign was specified as 75 gyra-tions. Table 1.211 shows the JMF, measured field gradations, and gradation checks of laboratory batched samples.
C H A P T E R 5
WMA Project Mix Verification
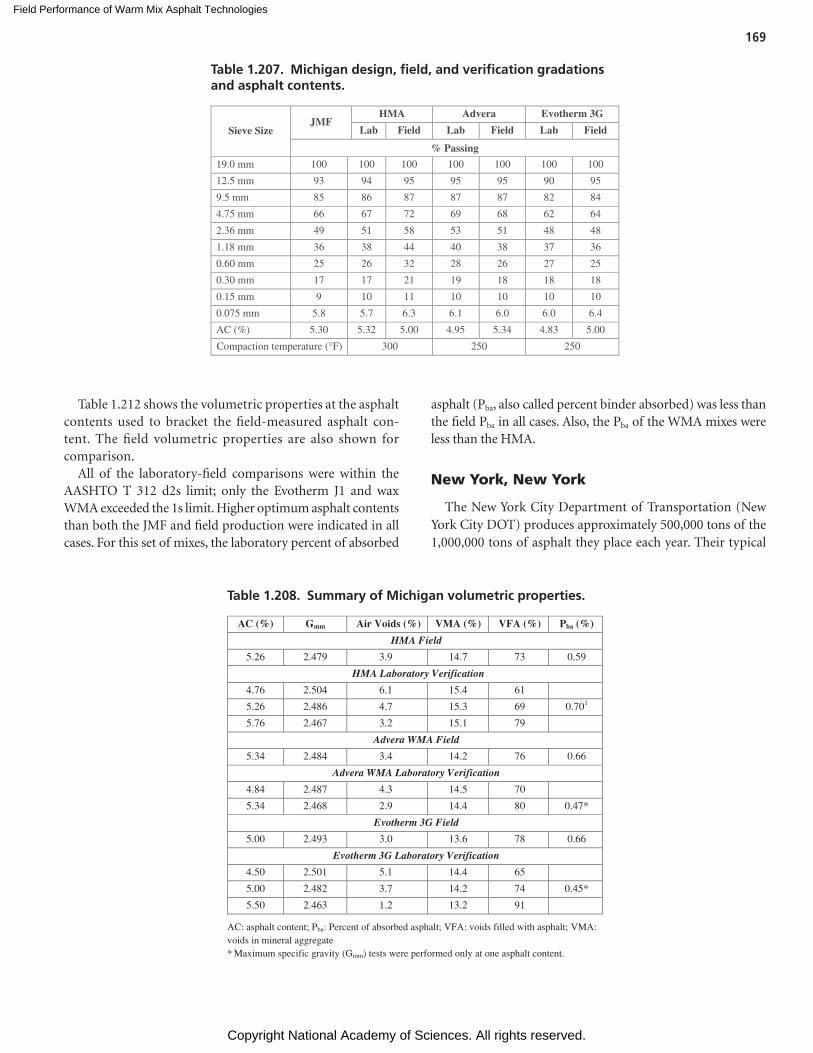
Field Performance of Warm Mix Asphalt Technologies
Copyright National Academy of Sciences. All rights reserved.
169
Table 1.207. Michigan design, field, and verification gradations and asphalt contents.
Sieve Size JMF
HMA Advera Evotherm 3G
Lab Field Lab Field Lab Field
% Passing
19.0 mm 100 100 100 100 100 100 100
12.5 mm 93 94 95 95 95 90 95
9.5 mm 85 86 87 87 87 82 84
4.75 mm 66 67 72 69 68 62 64
2.36 mm 49 51 58 53 51 48 48
1.18 mm 36 38 44 40 38 37 36
0.60 mm 25 26 32 28 26 27 25
0.30 mm 17 17 21 19 18 18 18
0.15 mm 9 10 11 10 10 10 10
0.075 mm 5.8 5.7 6.3 6.1 6.0 6.0 6.4
AC (%) 5.30 5.32 5.00 4.95 5.34 4.83 5.00
Compaction temperature (°F) 300 250 250
Table 1.208. Summary of Michigan volumetric properties.
AC (%) Gmm Air Voids (%) VMA (%) VFA (%) Pba (%)
HMA Field
5.26 2.479 3.9 14.7 73 0.59
HMA Laboratory Verification
4.76 2.504 6.1 15.4 61
5.26 2.486 4.7 15.3 69 0.701
5.76 2.467 3.2 15.1 79
Advera WMA Field
5.34 2.484 3.4 14.2 76 0.66
Advera WMA Laboratory Verification
4.84 2.487 4.3 14.5 70
5.34 2.468 2.9 14.4 80 0.47*
Evotherm 3G Field
5.00 2.493 3.0 13.6 78 0.66
Evotherm 3G Laboratory Verification
4.50 2.501 5.1 14.4 65
5.00 2.482 3.7 14.2 74 0.45*
5.50 2.463 1.2 13.2 91
AC: asphalt content; Pba: Percent of absorbed asphalt; VFA: voids filled with asphalt; VMA: voids in mineral aggregate* Maximum specific gravity (Gmm) tests were performed only at one asphalt content.
Table 1.212 shows the volumetric properties at the asphalt contents used to bracket the field-measured asphalt con-tent. The field volumetric properties are also shown for comparison.
All of the laboratory-field comparisons were within the AASHTO T 312 d2s limit; only the Evotherm J1 and wax WMA exceeded the 1s limit. Higher optimum asphalt contents than both the JMF and field production were indicated in all cases. For this set of mixes, the laboratory percent of absorbed
asphalt (Pba, also called percent binder absorbed) was less than the field Pba in all cases. Also, the Pba of the WMA mixes were less than the HMA.
New York, New York
The New York City Department of Transportation (New York City DOT) produces approximately 500,000 tons of the 1,000,000 tons of asphalt they place each year. Their typical
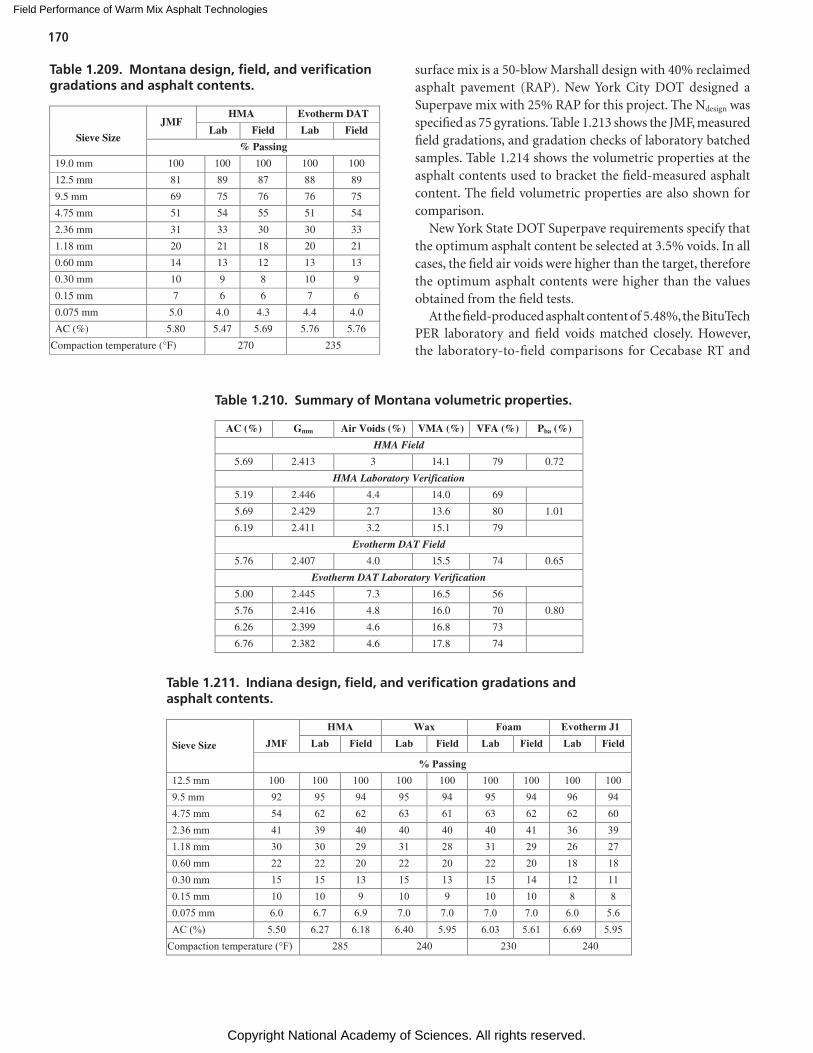
Field Performance of Warm Mix Asphalt Technologies
Copyright National Academy of Sciences. All rights reserved.
170
Table 1.209. Montana design, field, and verification gradations and asphalt contents.
Sieve Size
JMF HMA Evotherm DAT
Lab Field Lab Field
% Passing
19.0 mm 100 100 100 100 100
12.5 mm 81 89 87 88 89
9.5 mm 69 75 76 76 75
4.75 mm 51 54 55 51 54
2.36 mm 31 33 30 30 33
1.18 mm 20 21 18 20 21
0.60 mm 14 13 12 13 13
0.30 mm 10 9 8 10 9
0.15 mm 7 6 6 7 6
0.075 mm 5.0 4.0 4.3 4.4 4.0
AC (%) 5.80 5.47 5.69 5.76 5.76
Compaction temperature (°F) 270 235
Table 1.210. Summary of Montana volumetric properties.
AC (%) Gmm Air Voids (%) VMA (%) VFA (%) Pba (%)
HMA Field
5.69 2.413 3 14.1 79 0.72
HMA Laboratory Verification
5.19 2.446 4.4 14.0 69
5.69 2.429 2.7 13.6 80 1.01
6.19 2.411 3.2 15.1 79
Evotherm DAT Field
5.76 2.407 4.0 15.5 74 0.65
Evotherm DAT Laboratory Verification
5.00 2.445 7.3 16.5 56
5.76 2.416 4.8 16.0 70 0.80
6.26 2.399 4.6 16.8 73
6.76 2.382 4.6 17.8 74
Table 1.211. Indiana design, field, and verification gradations and asphalt contents.
Sieve Size JMFHMA Wax Foam Evotherm J1
Lab Field Lab Field Lab Field Lab Field
% Passing12.5 mm 100 100 100 100 100 100 100 100 1009.5 mm 92 95 94 95 94 95 94 96 944.75 mm 54 62 62 63 61 63 62 62 602.36 mm 41 39 40 40 40 40 41 36 391.18 mm 30 30 29 31 28 31 29 26 270.60 mm 22 22 20 22 20 22 20 18 180.30 mm 15 15 13 15 13 15 14 12 110.15 mm 10 10 9 10 9 10 10 8 8 0.075 mm 6.0 6.7 6.9 7.0 7.0 7.0 7.0 6.0 5.6 AC (%) 5.50 6.27 6.18 6.40 5.95 6.03 5.61 6.69 5.95
Compaction temperature (°F) 285 240 230 240
surface mix is a 50-blow Marshall design with 40% reclaimed asphalt pavement (RAP). New York City DOT designed a Superpave mix with 25% RAP for this project. The Ndesign was specified as 75 gyrations. Table 1.213 shows the JMF, measured field gradations, and gradation checks of laboratory batched samples. Table 1.214 shows the volumetric properties at the asphalt contents used to bracket the field-measured asphalt content. The field volumetric properties are also shown for comparison.
New York State DOT Superpave requirements specify that the optimum asphalt content be selected at 3.5% voids. In all cases, the field air voids were higher than the target, therefore the optimum asphalt contents were higher than the values obtained from the field tests.
At the field-produced asphalt content of 5.48%, the BituTech PER laboratory and field voids matched closely. However, the laboratory-to-field comparisons for Cecabase RT and
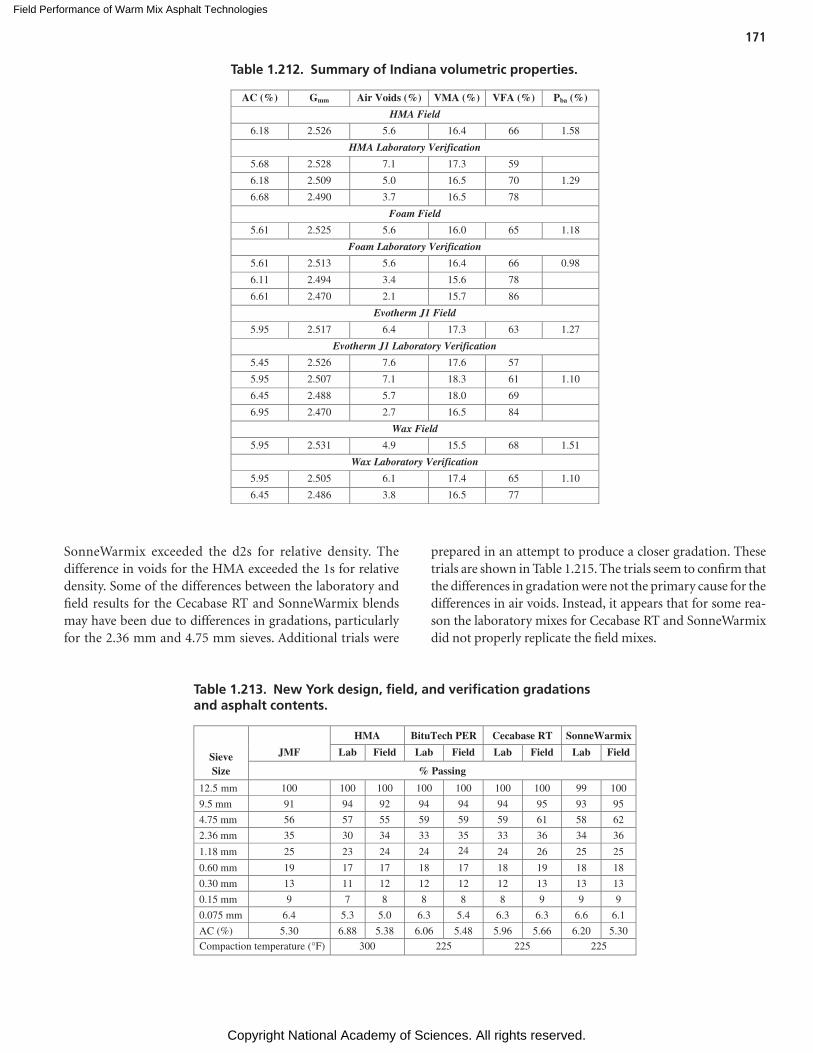
Field Performance of Warm Mix Asphalt Technologies
Copyright National Academy of Sciences. All rights reserved.
171
SonneWarmix exceeded the d2s for relative density. The difference in voids for the HMA exceeded the 1s for relative density. Some of the differences between the laboratory and field results for the Cecabase RT and SonneWarmix blends may have been due to differences in gradations, particularly for the 2.36 mm and 4.75 mm sieves. Additional trials were
prepared in an attempt to produce a closer gradation. These trials are shown in Table 1.215. The trials seem to confirm that the differences in gradation were not the primary cause for the differences in air voids. Instead, it appears that for some rea-son the laboratory mixes for Cecabase RT and SonneWarmix did not properly replicate the field mixes.
AC (%) Gmm Air Voids (%) VMA (%) VFA (%) Pba (%)
HMA Field
6.18 2.526 5.6 16.4 66 1.58
HMA Laboratory Verification
5.68 2.528 7.1 17.3 59
6.18 2.509 5.0 16.5 70 1.29
6.68 2.490 3.7 16.5 78
Foam Field
5.61 2.525 5.6 16.0 65 1.18
Foam Laboratory Verification
5.61 2.513 5.6 16.4 66 0.98
6.11 2.494 3.4 15.6 78
6.61 2.470 2.1 15.7 86
Evotherm J1 Field
5.95 2.517 6.4 17.3 63 1.27
Evotherm J1 Laboratory Verification
5.45 2.526 7.6 17.6 57
5.95 2.507 7.1 18.3 61 1.10
6.45 2.488 5.7 18.0 69
6.95 2.470 2.7 16.5 84
Wax Field
5.95 2.531 4.9 15.5 68 1.51
Wax Laboratory Verification
5.95 2.505 6.1 17.4 65 1.10
6.45 2.486 3.8 16.5 77
Table 1.212. Summary of Indiana volumetric properties.
Table 1.213. New York design, field, and verification gradations and asphalt contents.
Sieve Size
JMF
HMA BituTech PER Cecabase RT SonneWarmix
Lab Field Lab Field Lab Field Lab Field
% Passing
12.5 mm 100 100 100 100 100 100 100 99 100
9.5 mm 91 94 92 94 94 94 95 93 95
4.75 mm 56 57 55 59 59 59 61 58 62
2.36 mm 35 30 34 33 35 33 36 34 36
1.18 mm 25 23 24 24 24 24 26 25 25
0.60 mm 19 17 17 18 17 18 19 18 18
0.30 mm 13 11 12 12 12 12 13 13 13
0.15 mm 9 7 8 8 8 8 9 9 9
0.075 mm 6.4 5.3 5.0 6.3 5.4 6.3 6.3 6.6 6.1
AC (%) 5.30 6.88 5.38 6.06 5.48 5.96 5.66 6.20 5.30
Compaction temperature (°F) 300 225 225 225
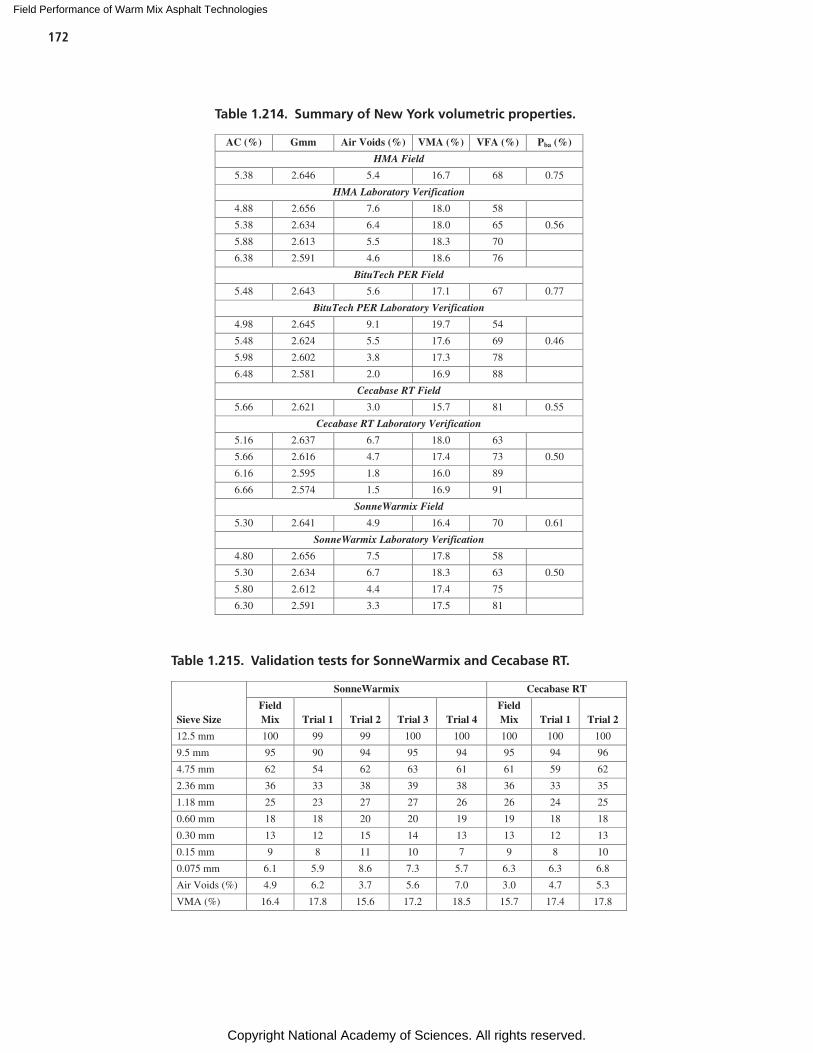
Field Performance of Warm Mix Asphalt Technologies
Copyright National Academy of Sciences. All rights reserved.
172
Table 1.214. Summary of New York volumetric properties.
AC (%) Gmm Air Voids (%) VMA (%) VFA (%) Pba (%)
HMA Field
5.38 2.646 5.4 16.7 68 0.75
HMA Laboratory Verification
4.88 2.656 7.6 18.0 58
5.38 2.634 6.4 18.0 65 0.56
5.88 2.613 5.5 18.3 70
6.38 2.591 4.6 18.6 76
BituTech PER Field
5.48 2.643 5.6 17.1 67 0.77
BituTech PER Laboratory Verification
4.98 2.645 9.1 19.7 54
5.48 2.624 5.5 17.6 69 0.46
5.98 2.602 3.8 17.3 78
6.48 2.581 2.0 16.9 88
Cecabase RT Field
5.66 2.621 3.0 15.7 81 0.55
Cecabase RT Laboratory Verification
5.16 2.637 6.7 18.0 63
5.66 2.616 4.7 17.4 73 0.50
6.16 2.595 1.8 16.0 89
6.66 2.574 1.5 16.9 91
SonneWarmix Field
5.30 2.641 4.9 16.4 70 0.61
SonneWarmix Laboratory Verification
4.80 2.656 7.5 17.8 58
5.30 2.634 6.7 18.3 63 0.50
5.80 2.612 4.4 17.4 75
6.30 2.591 3.3 17.5 81
Sieve Size
SonneWarmix Cecabase RT
Field Mix Trial 1 Trial 2 Trial 3 Trial 4
Field Mix Trial 1 Trial 2
12.5 mm 100 99 99 100 100 100 100 100
9.5 mm 95 90 94 95 94 95 94 96
4.75 mm 62 54 62 63 61 61 59 62
2.36 mm 36 33 38 39 38 36 33 35
1.18 mm 25 23 27 27 26 26 24 25
0.60 mm 18 18 20 20 19 19 18 18
0.30 mm 13 12 15 14 13 13 12 13
0.15 mm 9 8 11 10 7 9 8 10
0.075 mm 6.1 5.9 8.6 7.3 5.7 6.3 6.3 6.8
Air Voids (%) 4.9 6.2 3.7 5.6 7.0 3.0 4.7 5.3
VMA (%) 16.4 17.8 15.6 17.2 18.5 15.7 17.4 17.8
Table 1.215. Validation tests for SonneWarmix and Cecabase RT.
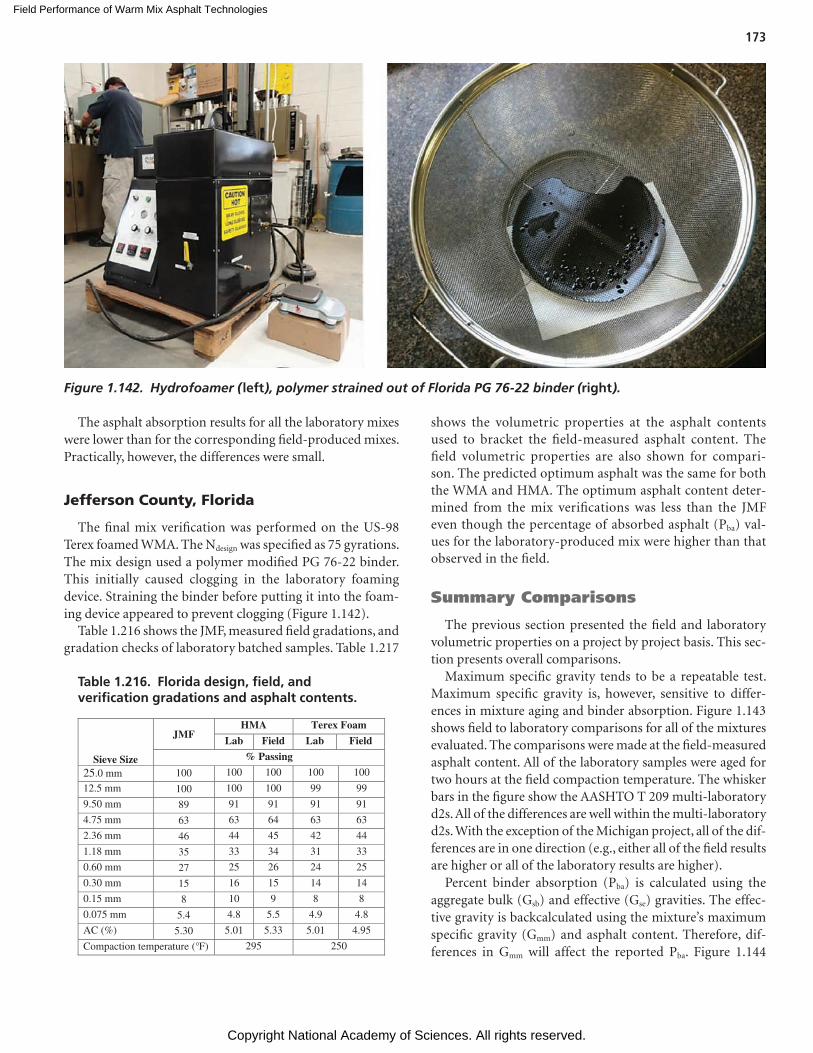
Field Performance of Warm Mix Asphalt Technologies
Copyright National Academy of Sciences. All rights reserved.
173
Figure 1.142. Hydrofoamer (left), polymer strained out of Florida PG 76-22 binder (right).
Table 1.216. Florida design, field, and verification gradations and asphalt contents.
Sieve Size
JMF HMA Terex Foam
Lab Field Lab Field
% Passing
25.0 mm 100 100 100 100 100
12.5 mm 100 100 100 99 99
9.50 mm 89 91 91 91 91
4.75 mm 63 63 64 63 63
2.36 mm 46 44 45 42 44
1.18 mm 35 33 34 31 33
0.60 mm 27 25 26 24 25
0.30 mm 15 16 15 14 14
0.15 mm 8 10 9 8 8
0.075 mm 5.4 4.8 5.5 4.9 4.8
AC (%) 5.30 5.01 5.33 5.01 4.95
Compaction temperature (°F) 295 250
The asphalt absorption results for all the laboratory mixes were lower than for the corresponding field-produced mixes. Practically, however, the differences were small.
Jefferson County, Florida
The final mix verification was performed on the US-98 Terex foamed WMA. The Ndesign was specified as 75 gyrations. The mix design used a polymer modified PG 76-22 binder. This initially caused clogging in the laboratory foaming device. Straining the binder before putting it into the foam-ing device appeared to prevent clogging (Figure 1.142).
Table 1.216 shows the JMF, measured field gradations, and gradation checks of laboratory batched samples. Table 1.217
shows the volumetric properties at the asphalt contents used to bracket the field-measured asphalt content. The field volumetric properties are also shown for compari-son. The predicted optimum asphalt was the same for both the WMA and HMA. The optimum asphalt content deter-mined from the mix verifications was less than the JMF even though the percentage of absorbed asphalt (Pba) val-ues for the laboratory-produced mix were higher than that observed in the field.
Summary Comparisons
The previous section presented the field and laboratory volumetric properties on a project by project basis. This sec-tion presents overall comparisons.
Maximum specific gravity tends to be a repeatable test. Maximum specific gravity is, however, sensitive to differ-ences in mixture aging and binder absorption. Figure 1.143 shows field to laboratory comparisons for all of the mixtures evaluated. The comparisons were made at the field-measured asphalt content. All of the laboratory samples were aged for two hours at the field compaction temperature. The whisker bars in the figure show the AASHTO T 209 multi-laboratory d2s. All of the differences are well within the multi-laboratory d2s. With the exception of the Michigan project, all of the dif-ferences are in one direction (e.g., either all of the field results are higher or all of the laboratory results are higher).
Percent binder absorption (Pba) is calculated using the aggregate bulk (Gsb) and effective (Gse) gravities. The effec-tive gravity is backcalculated using the mixture’s maximum specific gravity (Gmm) and asphalt content. Therefore, dif-ferences in Gmm will affect the reported Pba. Figure 1.144
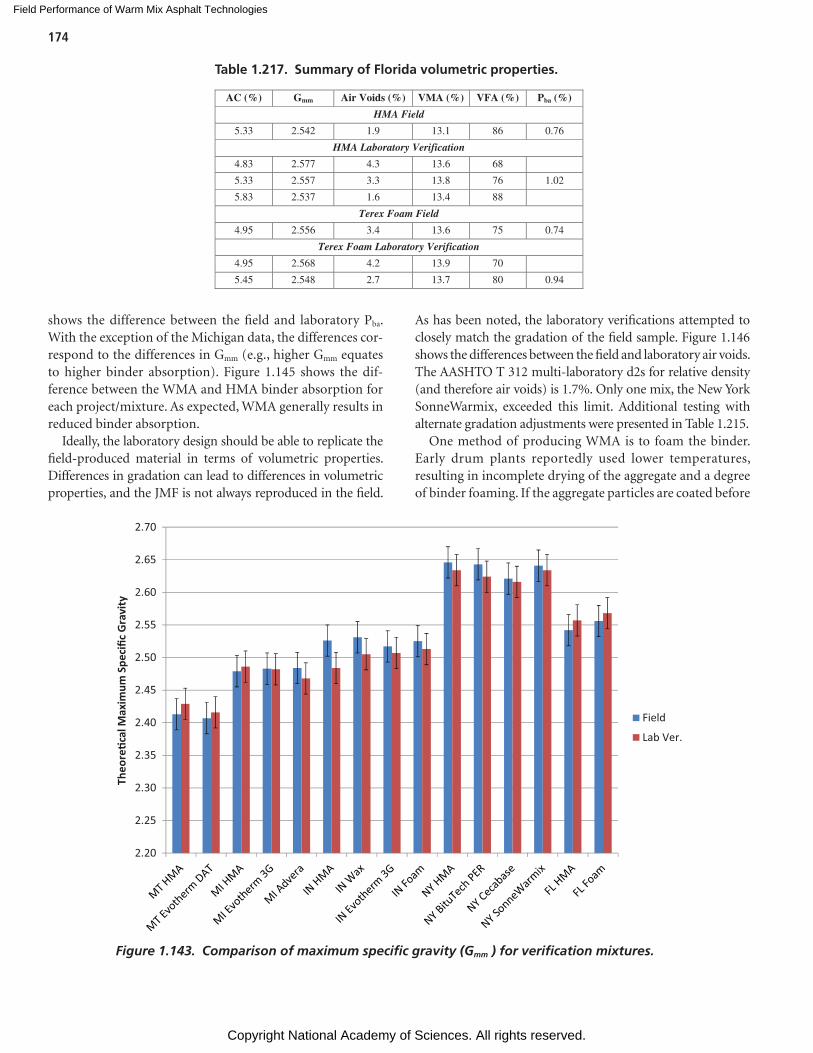
Field Performance of Warm Mix Asphalt Technologies
Copyright National Academy of Sciences. All rights reserved.
174
Table 1.217. Summary of Florida volumetric properties.
AC (%) Gmm Air Voids (%) VMA (%) VFA (%) Pba (%)
HMA Field
5.33 2.542 1.9 13.1 86 0.76
HMA Laboratory Verification
4.83 2.577 4.3 13.6 68
5.33 2.557 3.3 13.8 76 1.02
5.83 2.537 1.6 13.4 88
Terex Foam Field
4.95 2.556 3.4 13.6 75 0.74
Terex Foam Laboratory Verification
4.95 2.568 4.2 13.9 70
5.45 2.548 2.7 13.7 80 0.94
Figure 1.143. Comparison of maximum specific gravity (Gmm ) for verification mixtures.
2.20
2.25
2.30
2.35
2.40
2.45
2.50
2.55
2.60
2.65
2.70
Theo
re�c
al M
axim
um S
peci
fic G
ravi
ty
Field
Lab Ver.
shows the difference between the field and laboratory Pba. With the exception of the Michigan data, the differences cor-respond to the differences in Gmm (e.g., higher Gmm equates to higher binder absorption). Figure 1.145 shows the dif-ference between the WMA and HMA binder absorption for each project/mixture. As expected, WMA generally results in reduced binder absorption.
Ideally, the laboratory design should be able to replicate the field-produced material in terms of volumetric properties. Differences in gradation can lead to differences in volumetric properties, and the JMF is not always reproduced in the field.
As has been noted, the laboratory verifications attempted to closely match the gradation of the field sample. Figure 1.146 shows the differences between the field and laboratory air voids. The AASHTO T 312 multi-laboratory d2s for relative density (and therefore air voids) is 1.7%. Only one mix, the New York SonneWarmix, exceeded this limit. Additional testing with alternate gradation adjustments were presented in Table 1.215.
One method of producing WMA is to foam the binder. Early drum plants reportedly used lower temperatures, resulting in incomplete drying of the aggregate and a degree of binder foaming. If the aggregate particles are coated before
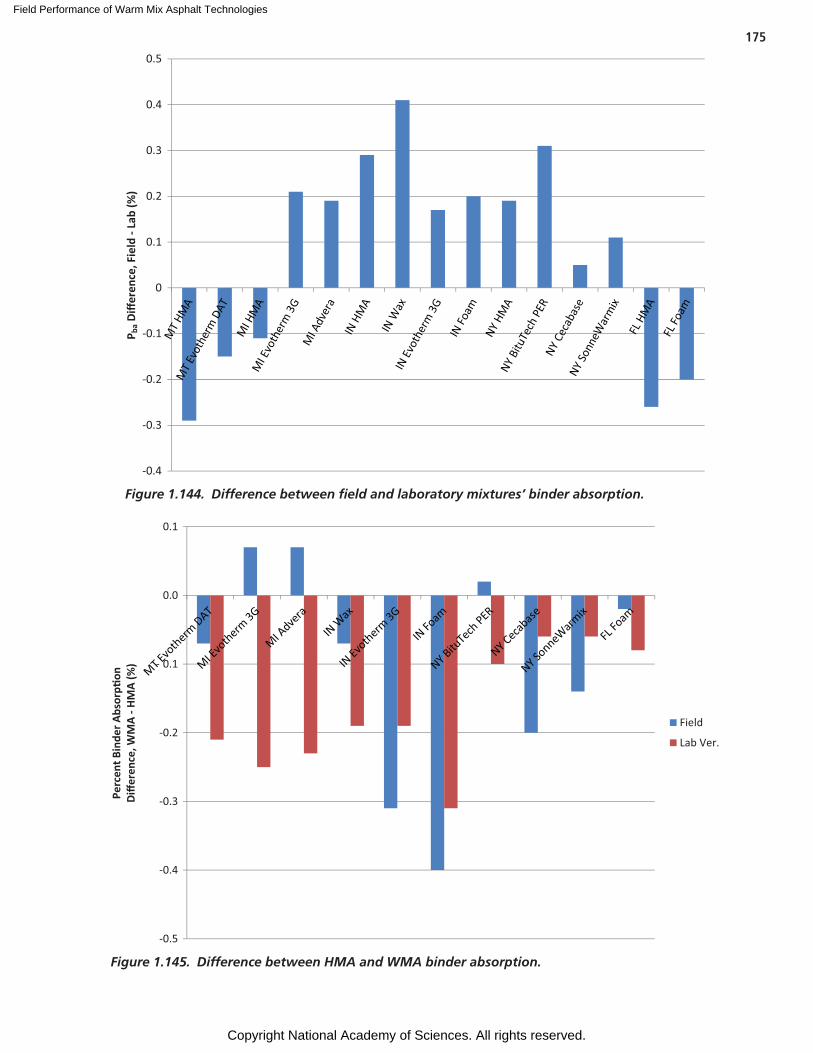
Field Performance of Warm Mix Asphalt Technologies
Copyright National Academy of Sciences. All rights reserved.
175
0.4
0.3
0.2
0.1
0
0.1
0.2
0.3
0.4
0.5
P ba D
iffer
ence
, Fie
ld -
Lab
(%)
Figure 1.144. Difference between field and laboratory mixtures’ binder absorption.
-0.5
-0.4
-0.3
-0.2
0.1
0.0
0.1
Perc
ent B
inde
r Abs
orp�
onDi
ffere
nce,
WM
A - H
MA
(%)
Field
Lab Ver.
Figure 1.145. Difference between HMA and WMA binder absorption.
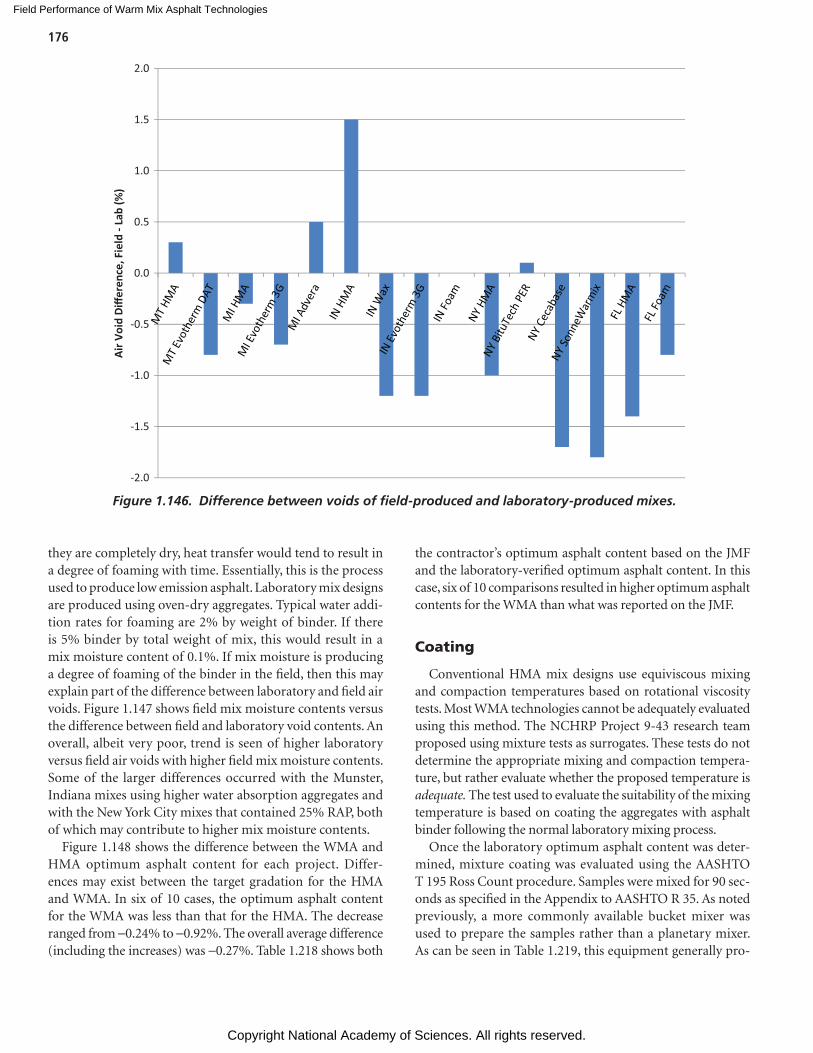
Field Performance of Warm Mix Asphalt Technologies
Copyright National Academy of Sciences. All rights reserved.
176
they are completely dry, heat transfer would tend to result in a degree of foaming with time. Essentially, this is the process used to produce low emission asphalt. Laboratory mix designs are produced using oven-dry aggregates. Typical water addi-tion rates for foaming are 2% by weight of binder. If there is 5% binder by total weight of mix, this would result in a mix moisture content of 0.1%. If mix moisture is producing a degree of foaming of the binder in the field, then this may explain part of the difference between laboratory and field air voids. Figure 1.147 shows field mix moisture contents versus the difference between field and laboratory void contents. An overall, albeit very poor, trend is seen of higher laboratory versus field air voids with higher field mix moisture contents. Some of the larger differences occurred with the Munster, Indiana mixes using higher water absorption aggregates and with the New York City mixes that contained 25% RAP, both of which may contribute to higher mix moisture contents.
Figure 1.148 shows the difference between the WMA and HMA optimum asphalt content for each project. Differ-ences may exist between the target gradation for the HMA and WMA. In six of 10 cases, the optimum asphalt content for the WMA was less than that for the HMA. The decrease ranged from -0.24% to -0.92%. The overall average difference (including the increases) was -0.27%. Table 1.218 shows both
the contractor’s optimum asphalt content based on the JMF and the laboratory-verified optimum asphalt content. In this case, six of 10 comparisons resulted in higher optimum asphalt contents for the WMA than what was reported on the JMF.
Coating
Conventional HMA mix designs use equiviscous mixing and compaction temperatures based on rotational viscosity tests. Most WMA technologies cannot be adequately evaluated using this method. The NCHRP Project 9-43 research team proposed using mixture tests as surrogates. These tests do not determine the appropriate mixing and compaction tempera-ture, but rather evaluate whether the proposed temperature is adequate. The test used to evaluate the suitability of the mixing temperature is based on coating the aggregates with asphalt binder following the normal laboratory mixing process.
Once the laboratory optimum asphalt content was deter-mined, mixture coating was evaluated using the AASHTO T 195 Ross Count procedure. Samples were mixed for 90 sec-onds as specified in the Appendix to AASHTO R 35. As noted previously, a more commonly available bucket mixer was used to prepare the samples rather than a planetary mixer. As can be seen in Table 1.219, this equipment generally pro-
Figure 1.146. Difference between voids of field-produced and laboratory-produced mixes.
-2.0
-1.5
-1.0
-0.5
0.0
0.5
1.0
1.5
2.0
Air V
oid
Diffe
renc
e, F
ield
- La
b (%
)
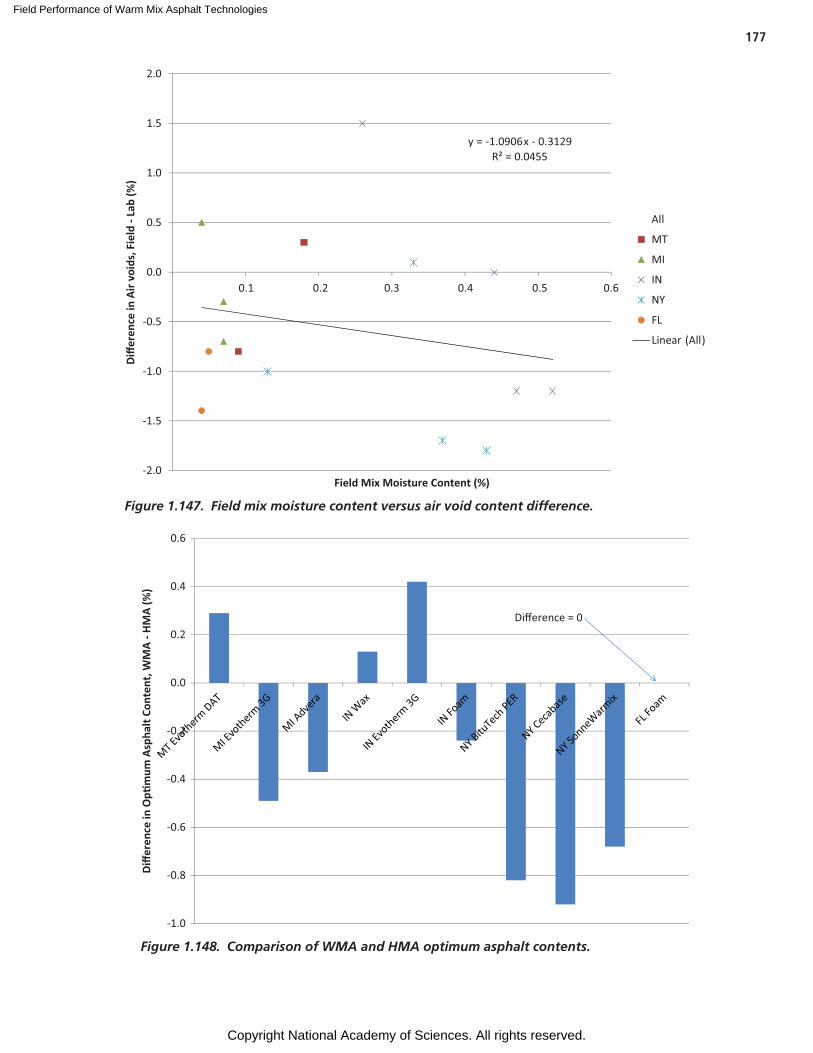
Field Performance of Warm Mix Asphalt Technologies
Copyright National Academy of Sciences. All rights reserved.
177
y = 1.0906x 0.3129R² = 0.0455
-2.0
-1.5
-1.0
-0.5
0.0
0.5
1.0
1.5
2.0
0.4 0.5 0.60.1 0.2 0.3
Diffe
renc
e in
Air
void
s, F
ield
- La
b (%
)
Field Mix Moisture Content (%)
All
MT
MI
IN
NY
FL
Linear (All)
Figure 1.147. Field mix moisture content versus air void content difference.
Figure 1.148. Comparison of WMA and HMA optimum asphalt contents.
-1.0
-0.8
-0.6
-0.4
-0.2
0.0
0.2
0.4
0.6
Diffe
renc
e in
Op�
mum
Asp
halt
Cont
ent,
WM
A - H
MA
(%)
Difference = 0
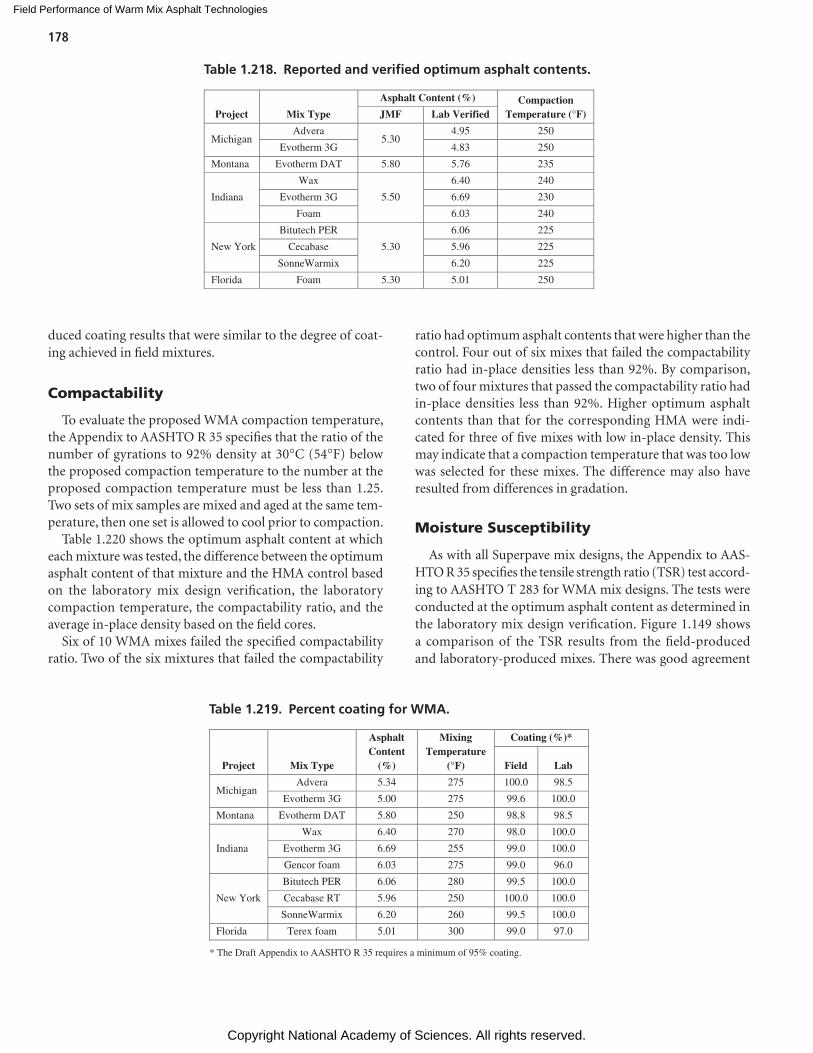
Field Performance of Warm Mix Asphalt Technologies
Copyright National Academy of Sciences. All rights reserved.
178
duced coating results that were similar to the degree of coat-ing achieved in field mixtures.
Compactability
To evaluate the proposed WMA compaction temperature, the Appendix to AASHTO R 35 specifies that the ratio of the number of gyrations to 92% density at 30°C (54°F) below the proposed compaction temperature to the number at the proposed compaction temperature must be less than 1.25. Two sets of mix samples are mixed and aged at the same tem-perature, then one set is allowed to cool prior to compaction.
Table 1.220 shows the optimum asphalt content at which each mixture was tested, the difference between the optimum asphalt content of that mixture and the HMA control based on the laboratory mix design verification, the laboratory compaction temperature, the compactability ratio, and the average in-place density based on the field cores.
Six of 10 WMA mixes failed the specified compactability ratio. Two of the six mixtures that failed the compactability
Project Mix Type
Asphalt Content (%) CompactionTemperature (°F)JMF Lab Verified
MichiganAdvera
5.304.95 250
Evotherm 3G 4.83 250
Montana Evotherm DAT 5.80 5.76 235
Indiana
Wax
5.50
6.40 240
Evotherm 3G 6.69 230
Foam 6.03 240
New York
Bitutech PER
5.30
6.06 225
Cecabase 5.96 225
SonneWarmix 6.20 225
Florida Foam 5.30 5.01 250
Table 1.218. Reported and verified optimum asphalt contents.
ratio had optimum asphalt contents that were higher than the control. Four out of six mixes that failed the compactability ratio had in-place densities less than 92%. By comparison, two of four mixtures that passed the compactability ratio had in-place densities less than 92%. Higher optimum asphalt contents than that for the corresponding HMA were indi-cated for three of five mixes with low in-place density. This may indicate that a compaction temperature that was too low was selected for these mixes. The difference may also have resulted from differences in gradation.
Moisture Susceptibility
As with all Superpave mix designs, the Appendix to AAS-HTO R 35 specifies the tensile strength ratio (TSR) test accord-ing to AASHTO T 283 for WMA mix designs. The tests were conducted at the optimum asphalt content as determined in the laboratory mix design verification. Figure 1.149 shows a comparison of the TSR results from the field-produced and laboratory-produced mixes. There was good agreement
Table 1.219. Percent coating for WMA.
Project Mix Type
Asphalt Content
(%)
MixingTemperature
(°F)
Coating (%)*
Field Lab
MichiganAdvera 5.34 275 100.0 98.5
Evotherm 3G 5.00 275 99.6 100.0
Montana Evotherm DAT 5.80 250 98.8 98.5
Indiana
Wax 6.40 270 98.0 100.0
Evotherm 3G 6.69 255 99.0 100.0
Gencor foam 6.03 275 99.0 96.0
New York
Bitutech PER 6.06 280 99.5 100.0
Cecabase RT 5.96 250 100.0 100.0
SonneWarmix 6.20 260 99.5 100.0
Florida Terex foam 5.01 300 99.0 97.0
* The Draft Appendix to AASHTO R 35 requires a minimum of 95% coating.
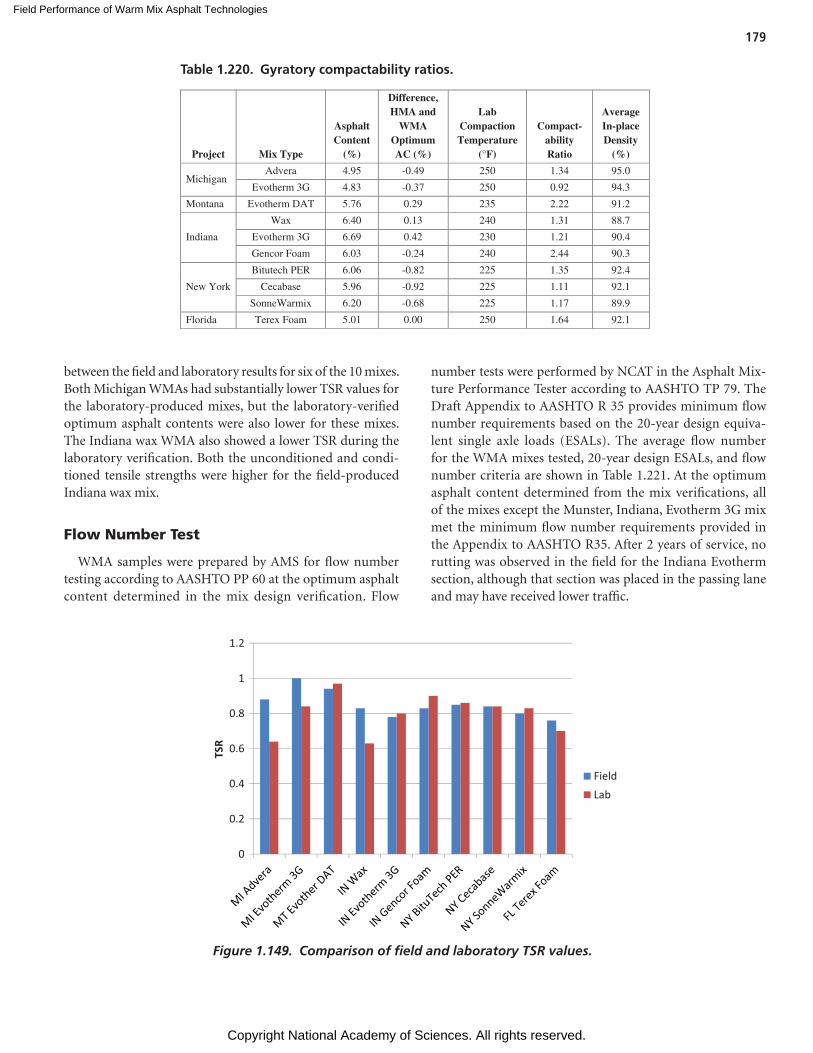
Field Performance of Warm Mix Asphalt Technologies
Copyright National Academy of Sciences. All rights reserved.
179
between the field and laboratory results for six of the 10 mixes. Both Michigan WMAs had substantially lower TSR values for the laboratory-produced mixes, but the laboratory-verified optimum asphalt contents were also lower for these mixes. The Indiana wax WMA also showed a lower TSR during the laboratory verification. Both the unconditioned and condi-tioned tensile strengths were higher for the field-produced Indiana wax mix.
Flow Number Test
WMA samples were prepared by AMS for flow number testing according to AASHTO PP 60 at the optimum asphalt content determined in the mix design verification. Flow
number tests were performed by NCAT in the Asphalt Mix-ture Performance Tester according to AASHTO TP 79. The Draft Appendix to AASHTO R 35 provides minimum flow number requirements based on the 20-year design equiva-lent single axle loads (ESALs). The average flow number for the WMA mixes tested, 20-year design ESALs, and flow number criteria are shown in Table 1.221. At the optimum asphalt content determined from the mix verifications, all of the mixes except the Munster, Indiana, Evotherm 3G mix met the minimum flow number requirements provided in the Appendix to AASHTO R35. After 2 years of service, no rutting was observed in the field for the Indiana Evotherm section, although that section was placed in the passing lane and may have received lower traffic.
Table 1.220. Gyratory compactability ratios.
Project Mix Type
Asphalt Content
(%)
Difference,HMA and
WMA Optimum AC (%)
Lab CompactionTemperature
(°F)
Compact-abilityRatio
Average In-place Density
(%)
MichiganAdvera 4.95 -0.49 250 1.34 95.0
Evotherm 3G 4.83 -0.37 250 0.92 94.3
Montana Evotherm DAT 5.76 0.29 235 2.22 91.2
Indiana
Wax 6.40 0.13 240 1.31 88.7
Evotherm 3G 6.69 0.42 230 1.21 90.4
Gencor Foam 6.03 -0.24 240 2.44 90.3
New York
Bitutech PER 6.06 -0.82 225 1.35 92.4
Cecabase 5.96 -0.92 225 1.11 92.1
SonneWarmix 6.20 -0.68 225 1.17 89.9
Florida Terex Foam 5.01 0.00 250 1.64 92.1
0
0.2
0.4
0.6
0.8
1
1.2
TSR
Field
Lab
Figure 1.149. Comparison of field and laboratory TSR values.
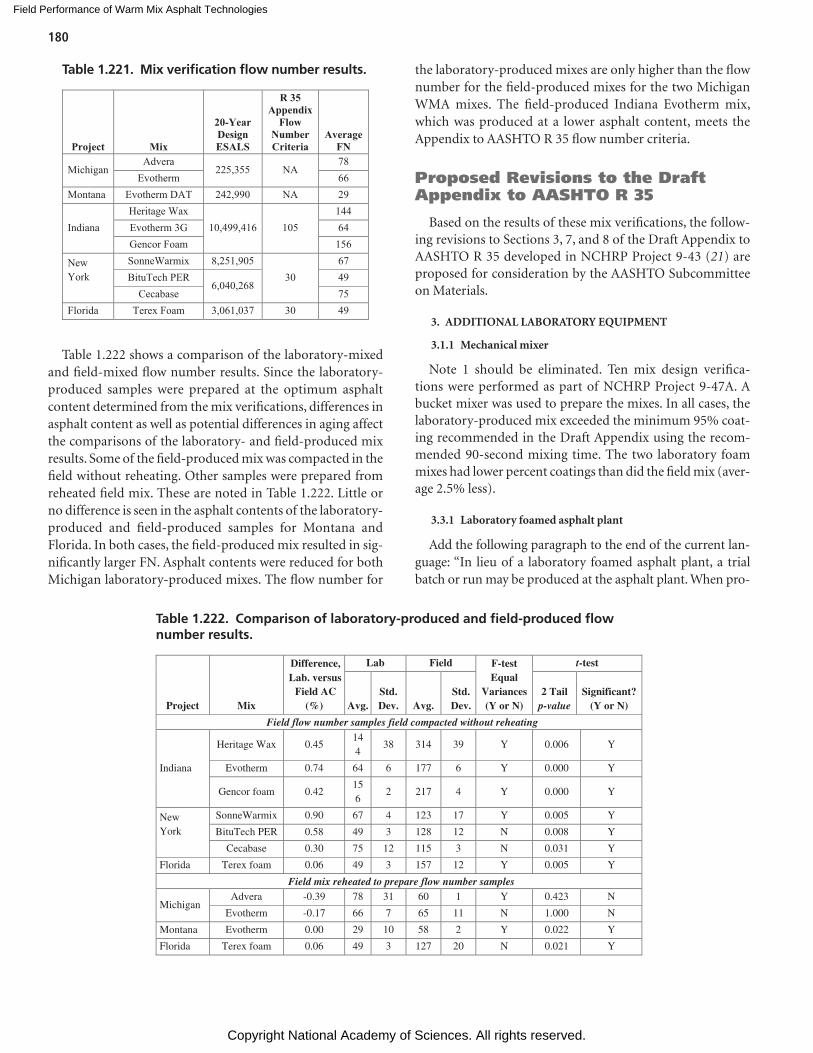
Field Performance of Warm Mix Asphalt Technologies
Copyright National Academy of Sciences. All rights reserved.
180
Table 1.222 shows a comparison of the laboratory-mixed and field-mixed flow number results. Since the laboratory-produced samples were prepared at the optimum asphalt content determined from the mix verifications, differences in asphalt content as well as potential differences in aging affect the comparisons of the laboratory- and field-produced mix results. Some of the field-produced mix was compacted in the field without reheating. Other samples were prepared from reheated field mix. These are noted in Table 1.222. Little or no difference is seen in the asphalt contents of the laboratory-produced and field-produced samples for Montana and Florida. In both cases, the field-produced mix resulted in sig-nificantly larger FN. Asphalt contents were reduced for both Michigan laboratory-produced mixes. The flow number for
the laboratory-produced mixes are only higher than the flow number for the field-produced mixes for the two Michigan WMA mixes. The field-produced Indiana Evotherm mix, which was produced at a lower asphalt content, meets the Appendix to AASHTO R 35 flow number criteria.
Proposed Revisions to the Draft Appendix to AASHTO R 35
Based on the results of these mix verifications, the follow-ing revisions to Sections 3, 7, and 8 of the Draft Appendix to AASHTO R 35 developed in NCHRP Project 9-43 (21) are proposed for consideration by the AASHTO Subcommittee on Materials.
3. ADDITIONAL LABORATORY EQUIPMENT
3.1.1 Mechanical mixer
Note 1 should be eliminated. Ten mix design verifica-tions were performed as part of NCHRP Project 9-47A. A bucket mixer was used to prepare the mixes. In all cases, the laboratory-produced mix exceeded the minimum 95% coat-ing recommended in the Draft Appendix using the recom-mended 90-second mixing time. The two laboratory foam mixes had lower percent coatings than did the field mix (aver-age 2.5% less).
3.3.1 Laboratory foamed asphalt plant
Add the following paragraph to the end of the current lan-guage: “In lieu of a laboratory foamed asphalt plant, a trial batch or run may be produced at the asphalt plant. When pro-
Table 1.221. Mix verification flow number results.
Project Mix
20-Year Design ESALS
R 35 Appendix
Flow Number Criteria
Average FN
MichiganAdvera
225,355 NA78
Evotherm 66Montana Evotherm DAT 242,990 NA 29
IndianaHeritage Wax
10,499,416 105144
Evotherm 3G 64Gencor Foam 156
New York
SonneWarmix 8,251,90530
67BituTech PER
6,040,26849
Cecabase 75Florida Terex Foam 3,061,037 30 49
Table 1.222. Comparison of laboratory-produced and field-produced flow number results.
Project Mix
Difference,Lab. versus
Field AC(%)
Lab Field F-test Equal
Variances (Y or N)
t-test
Avg. Std. Dev. Avg.
Std. Dev.
2 Tail p-value
Significant? (Y or N)
Field flow number samples field compacted without reheating
Indiana
Heritage Wax 0.45144
38 314 39 Y 0.006 Y
Evotherm 0.74 64 6 177 6 Y 0.000 Y
Gencor foam 0.42156
2 217 4 Y 0.000 Y
New York
SonneWarmix 0.90 67 4 123 17 Y 0.005 Y
BituTech PER 0.58 49 3 128 12 N 0.008 Y
Cecabase 0.30 75 12 115 3 N 0.031 Y
Florida Terex foam 0.06 49 3 157 12 Y 0.005 Y
Field mix reheated to prepare flow number samples
MichiganAdvera -0.39 78 31 60 1 Y 0.423 N
Evotherm -0.17 66 7 65 11 N 1.000 N
Montana Evotherm 0.00 29 10 58 2 Y 0.022 Y
Florida Terex foam 0.06 49 3 127 20 N 0.021 Y
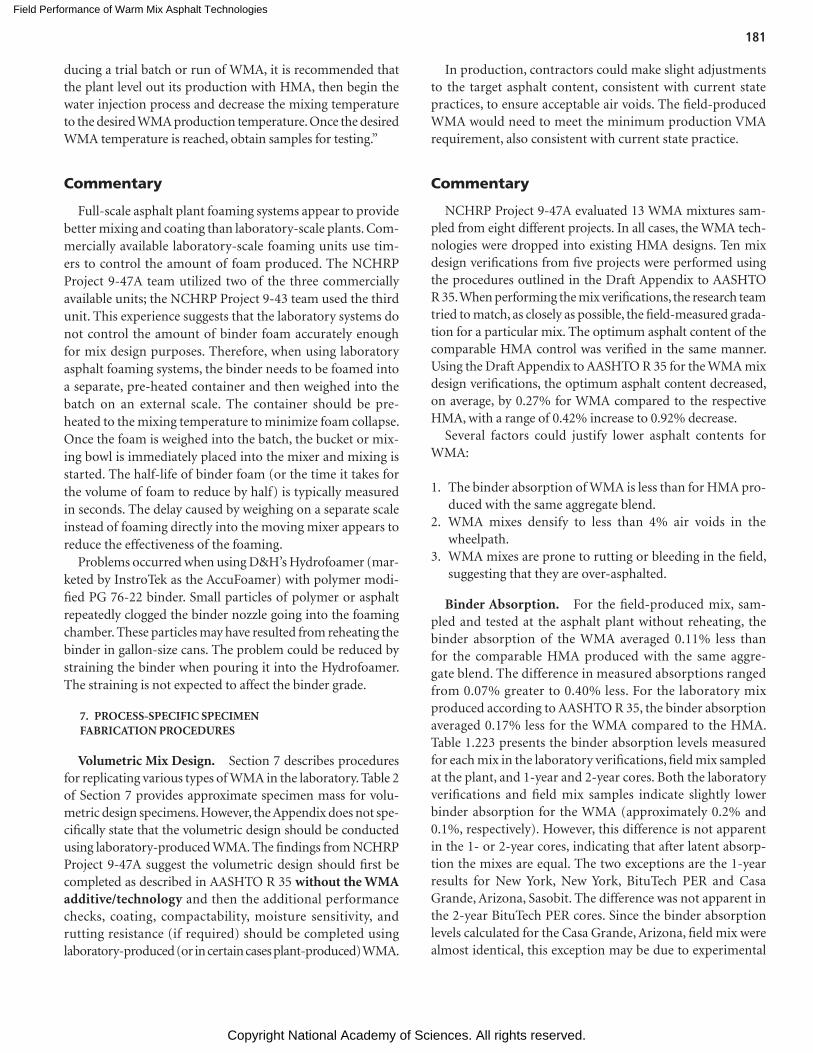
Field Performance of Warm Mix Asphalt Technologies
Copyright National Academy of Sciences. All rights reserved.
181
ducing a trial batch or run of WMA, it is recommended that the plant level out its production with HMA, then begin the water injection process and decrease the mixing temperature to the desired WMA production temperature. Once the desired WMA temperature is reached, obtain samples for testing.”
Commentary
Full-scale asphalt plant foaming systems appear to provide better mixing and coating than laboratory-scale plants. Com-mercially available laboratory-scale foaming units use tim-ers to control the amount of foam produced. The NCHRP Project 9-47A team utilized two of the three commercially available units; the NCHRP Project 9-43 team used the third unit. This experience suggests that the laboratory systems do not control the amount of binder foam accurately enough for mix design purposes. Therefore, when using laboratory asphalt foaming systems, the binder needs to be foamed into a separate, pre-heated container and then weighed into the batch on an external scale. The container should be pre-heated to the mixing temperature to minimize foam collapse. Once the foam is weighed into the batch, the bucket or mix-ing bowl is immediately placed into the mixer and mixing is started. The half-life of binder foam (or the time it takes for the volume of foam to reduce by half) is typically measured in seconds. The delay caused by weighing on a separate scale instead of foaming directly into the moving mixer appears to reduce the effectiveness of the foaming.
Problems occurred when using D&H’s Hydrofoamer (mar-keted by InstroTek as the AccuFoamer) with polymer modi-fied PG 76-22 binder. Small particles of polymer or asphalt repeatedly clogged the binder nozzle going into the foaming chamber. These particles may have resulted from reheating the binder in gallon-size cans. The problem could be reduced by straining the binder when pouring it into the Hydrofoamer. The straining is not expected to affect the binder grade.
7. PROCESS-SPECIFIC SPECIMEN FABRICATION PROCEDURES
Volumetric Mix Design. Section 7 describes procedures for replicating various types of WMA in the laboratory. Table 2 of Section 7 provides approximate specimen mass for volu-metric design specimens. How ever, the Appendix does not spe-cifically state that the volumetric design should be conducted using laboratory-produced WMA. The findings from NCHRP Project 9-47A suggest the volumetric design should first be completed as described in AASHTO R 35 without the WMA additive/technology and then the additional performance checks, coating, compactability, moisture sensitivity, and rutting resistance (if required) should be completed using laboratory-produced (or in certain cases plant-produced) WMA.
In production, contractors could make slight adjustments to the target asphalt content, consistent with current state practices, to ensure acceptable air voids. The field-produced WMA would need to meet the minimum production VMA requirement, also consistent with current state practice.
Commentary
NCHRP Project 9-47A evaluated 13 WMA mixtures sam-pled from eight different projects. In all cases, the WMA tech-nologies were dropped into existing HMA designs. Ten mix design verifications from five projects were performed using the procedures outlined in the Draft Appendix to AASHTO R 35. When performing the mix verifications, the research team tried to match, as closely as possible, the field-measured grada-tion for a particular mix. The optimum asphalt content of the comparable HMA control was verified in the same manner. Using the Draft Appendix to AASHTO R 35 for the WMA mix design verifications, the optimum asphalt content decreased, on average, by 0.27% for WMA compared to the respective HMA, with a range of 0.42% increase to 0.92% decrease.
Several factors could justify lower asphalt contents for WMA:
1. The binder absorption of WMA is less than for HMA pro-duced with the same aggregate blend.
2. WMA mixes densify to less than 4% air voids in the wheelpath.
3. WMA mixes are prone to rutting or bleeding in the field, suggesting that they are over-asphalted.
Binder Absorption. For the field-produced mix, sam-pled and tested at the asphalt plant without reheating, the binder absorption of the WMA averaged 0.11% less than for the comparable HMA produced with the same aggre-gate blend. The difference in measured absorptions ranged from 0.07% greater to 0.40% less. For the laboratory mix produced according to AASHTO R 35, the binder absorption averaged 0.17% less for the WMA compared to the HMA. Table 1.223 presents the binder absorption levels measured for each mix in the laboratory verifications, field mix sampled at the plant, and 1-year and 2-year cores. Both the laboratory verifications and field mix samples indicate slightly lower binder absorption for the WMA (approximately 0.2% and 0.1%, respectively). However, this difference is not apparent in the 1- or 2-year cores, indicating that after latent absorp-tion the mixes are equal. The two exceptions are the 1-year results for New York, New York, BituTech PER and Casa Grande, Arizona, Sasobit. The difference was not apparent in the 2-year BituTech PER cores. Since the binder absorption levels calculated for the Casa Grande, Arizona, field mix were almost identical, this exception may be due to experimental
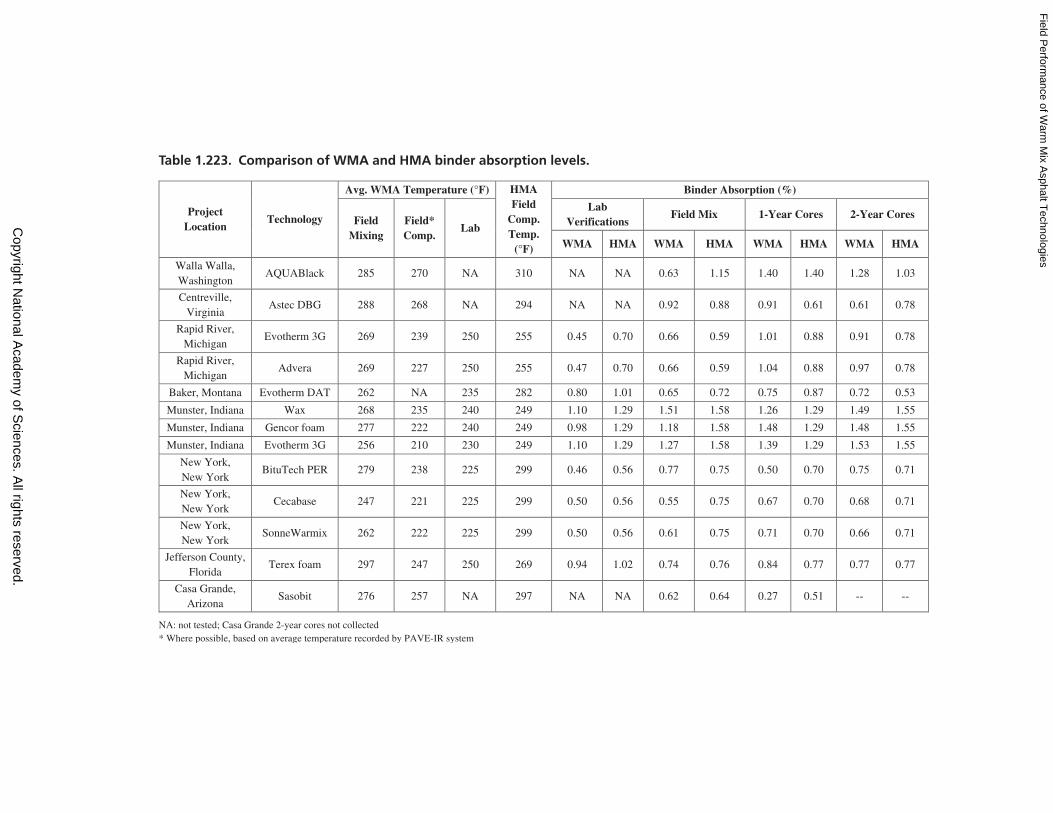
Field P
erformance of W
arm M
ix Asphalt T
echnologies
Copyright N
ational Academ
y of Sciences. A
ll rights reserved.
Project Location
Technology
Avg. WMA Temperature (°F) HMA Field
Comp. Temp.
(°F)
Binder Absorption (%)
Field Mixing
Field* Comp.
Lab
LabVerifications
Field Mix 1-Year Cores 2-Year Cores
WMA HMA WMA HMA WMA HMA WMA HMA
Walla Walla,Washington
AQUABlack 285 270 NA 310 NA NA 0.63 1.15 1.40 1.40 1.28 1.03
Centreville, Virginia
Astec DBG 288 268 NA 294 NA NA 0.92 0.88 0.91 0.61 0.61 0.78
Rapid River, Michigan
Evotherm 3G 269 239 250 255 0.45 0.70 0.66 0.59 1.01 0.88 0.91 0.78
Rapid River, Michigan
Advera 269 227 250 255 0.47 0.70 0.66 0.59 1.04 0.88 0.97 0.78
Baker, Montana Evotherm DAT 262 NA 235 282 0.80 1.01 0.65 0.72 0.75 0.87 0.72 0.53
Munster, Indiana Wax 268 235 240 249 1.10 1.29 1.51 1.58 1.26 1.29 1.49 1.55
Munster, Indiana Gencor foam 277 222 240 249 0.98 1.29 1.18 1.58 1.48 1.29 1.48 1.55
Munster, Indiana Evotherm 3G 256 210 230 249 1.10 1.29 1.27 1.58 1.39 1.29 1.53 1.55
New York, New York
BituTech PER 279 238 225 299 0.46 0.56 0.77 0.75 0.50 0.70 0.75 0.71
New York, New York
Cecabase 247 221 225 299 0.50 0.56 0.55 0.75 0.67 0.70 0.68 0.71
New York, New York
SonneWarmix 262 222 225 299 0.50 0.56 0.61 0.75 0.71 0.70 0.66 0.71
Jefferson County, Florida
Terex foam 297 247 250 269 0.94 1.02 0.74 0.76 0.84 0.77 0.77 0.77
Casa Grande, Arizona
Sasobit 276 257 NA 297 NA NA 0.62 0.64 0.27 0.51 -- --
NA: not tested; Casa Grande 2-year cores not collected* Where possible, based on average temperature recorded by PAVE-IR system
Table 1.223. Comparison of WMA and HMA binder absorption levels.
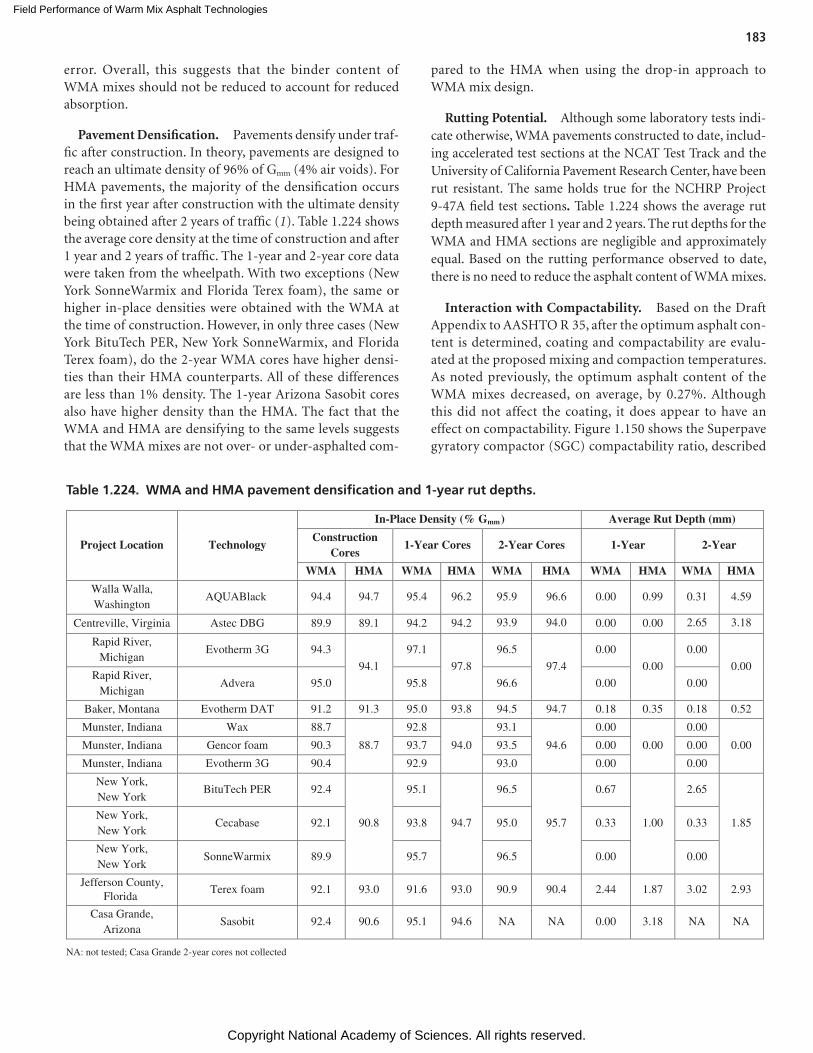
Field Performance of Warm Mix Asphalt Technologies
Copyright National Academy of Sciences. All rights reserved.
183
error. Overall, this suggests that the binder content of WMA mixes should not be reduced to account for reduced absorption.
Pavement Densification. Pavements densify under traf-fic after construction. In theory, pavements are designed to reach an ultimate density of 96% of Gmm (4% air voids). For HMA pavements, the majority of the densification occurs in the first year after construction with the ultimate density being obtained after 2 years of traffic (1). Table 1.224 shows the average core density at the time of construction and after 1 year and 2 years of traffic. The 1-year and 2-year core data were taken from the wheelpath. With two exceptions (New York SonneWarmix and Florida Terex foam), the same or higher in-place densities were obtained with the WMA at the time of construction. However, in only three cases (New York BituTech PER, New York SonneWarmix, and Florida Terex foam), do the 2-year WMA cores have higher densi-ties than their HMA counterparts. All of these differences are less than 1% density. The 1-year Arizona Sasobit cores also have higher density than the HMA. The fact that the WMA and HMA are densifying to the same levels suggests that the WMA mixes are not over- or under-asphalted com-
pared to the HMA when using the drop-in approach to WMA mix design.
Rutting Potential. Although some laboratory tests indi-cate otherwise, WMA pavements constructed to date, includ-ing accelerated test sections at the NCAT Test Track and the University of California Pavement Research Center, have been rut resistant. The same holds true for the NCHRP Project 9-47A field test sections. Table 1.224 shows the average rut depth measured after 1 year and 2 years. The rut depths for the WMA and HMA sections are negligible and approximately equal. Based on the rutting performance observed to date, there is no need to reduce the asphalt content of WMA mixes.
Interaction with Compactability. Based on the Draft Appendix to AASHTO R 35, after the optimum asphalt con-tent is determined, coating and compactability are evalu-ated at the proposed mixing and compaction temperatures. As noted previously, the optimum asphalt content of the WMA mixes decreased, on average, by 0.27%. Although this did not affect the coating, it does appear to have an effect on compactability. Figure 1.150 shows the Superpave gyratory compactor (SGC) compactability ratio, described
Project Location Technology
In-Place Density (% G )mm Average Rut Depth (mm)
Construction Cores
1-Year Cores 2-Year Cores 1-Year 2-Year
WMA HMA WMA HMA WMA HMA WMA HMA WMA HMA
Walla Walla, Washington
AQUABlack 94.4 94.7 95.4 96.2 95.9 96.6 0.00 0.99 0.31 4.59
Centreville, Virginia Astec DBG 89.9 89.1 94.2 94.2 93.9 94.0 0.00 0.00 2.65 3.18
Rapid River, Michigan
Evotherm 3G 94.3
94.1
97.1
97.8
96.5
97.4
0.00
0.00
0.00
0.00Rapid River,
MichiganAdvera 95.0 95.8 96.6 0.00 0.00
Baker, Montana Evotherm DAT 91.2 91.3 95.0 93.8 94.5 94.7 0.18 0.35 0.18 0.52
Munster, Indiana Wax 88.7
88.7
92.8
94.0
93.1
94.6
0.00
0.00
0.00
0.00Munster, Indiana Gencor foam 90.3 93.7 93.5 0.00 0.00
Munster, Indiana Evotherm 3G 90.4 92.9 93.0 0.00 0.00
New York, New York
BituTech PER 92.4
90.8
95.1
94.7
96.5
95.7
0.67
1.00
2.65
1.85New York, New York
Cecabase 92.1 93.8 95.0 0.33 0.33
New York, New York
SonneWarmix 89.9 95.7 96.5 0.00 0.00
Jefferson County,Florida
Terex foam 92.1 93.0 91.6 93.0 90.9 90.4 2.44 1.87 3.02 2.93
Casa Grande,Arizona
Sasobit 92.4 90.6 95.1 94.6 NA NA 0.00 3.18 NA NA
NA: not tested; Casa Grande 2-year cores not collected
Table 1.224. WMA and HMA pavement densification and 1-year rut depths.
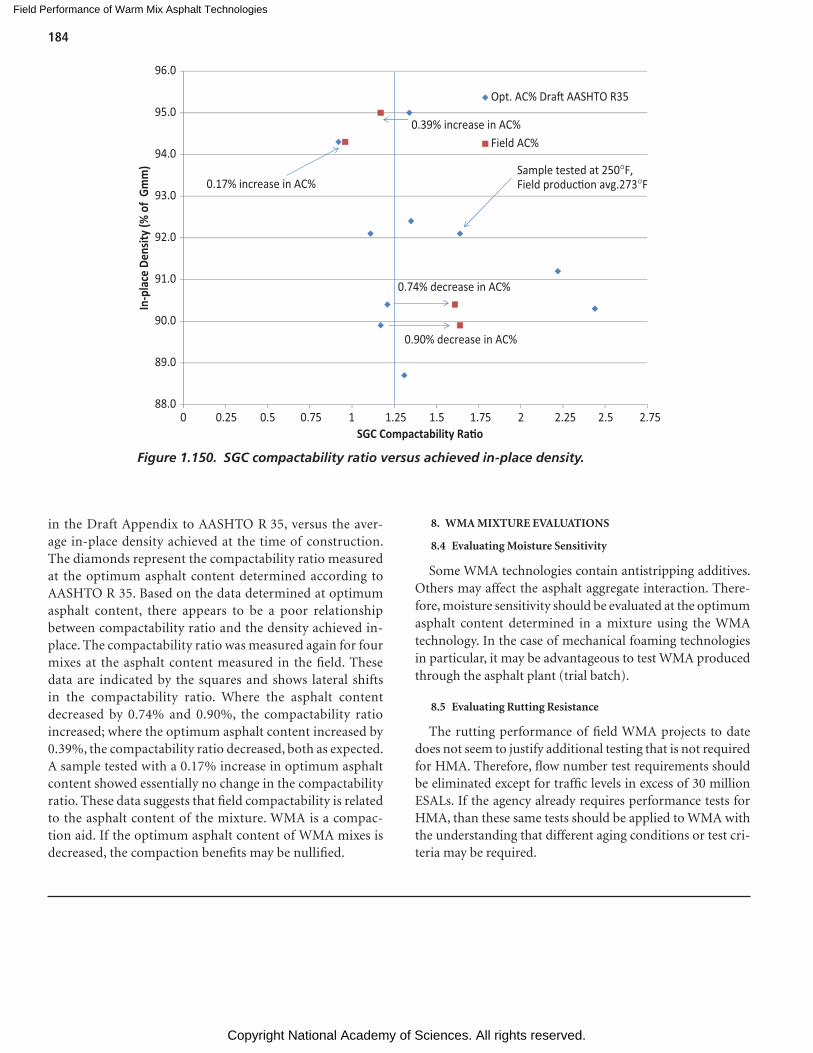
Field Performance of Warm Mix Asphalt Technologies
Copyright National Academy of Sciences. All rights reserved.
184
in the Draft Appendix to AASHTO R 35, versus the aver-age in-place density achieved at the time of construction. The diamonds represent the compactability ratio measured at the optimum asphalt content determined according to AASHTO R 35. Based on the data determined at optimum asphalt content, there appears to be a poor relationship between compactability ratio and the density achieved in-place. The compactability ratio was measured again for four mixes at the asphalt content measured in the field. These data are indicated by the squares and shows lateral shifts in the compactability ratio. Where the asphalt content decreased by 0.74% and 0.90%, the compactability ratio increased; where the optimum asphalt content increased by 0.39%, the compactability ratio decreased, both as expected. A sample tested with a 0.17% increase in optimum asphalt content showed essentially no change in the compactability ratio. These data suggests that field compactability is related to the asphalt content of the mixture. WMA is a compac-tion aid. If the optimum asphalt content of WMA mixes is decreased, the compaction benefits may be nullified.
Figure 1.150. SGC compactability ratio versus achieved in-place density.
88.0
89.0
90.0
91.0
92.0
93.0
94.0
95.0
96.0
0 0.25 0.5 0.75 1 1.25 1.5 21.75 2.25 2.5 2.75
In-p
lace
Den
sity (
% o
f Gm
m)
SGC Compactability Ra�o
Opt. AC% Dra� AASHTO R35
Field AC%
0.74% decrease in AC%
0.90% decrease in AC%
0.39% increase in AC%
0.17% increase in AC%Sample tested at 250°F,Field produc�on avg.273°F
8. WMA MIXTURE EVALUATIONS
8.4 Evaluating Moisture Sensitivity
Some WMA technologies contain antistripping additives. Others may affect the asphalt aggregate interaction. There-fore, moisture sensitivity should be evaluated at the optimum asphalt content determined in a mixture using the WMA technology. In the case of mechanical foaming technologies in particular, it may be advantageous to test WMA produced through the asphalt plant (trial batch).
8.5 Evaluating Rutting Resistance
The rutting performance of field WMA projects to date does not seem to justify additional testing that is not required for HMA. Therefore, flow number test requirements should be eliminated except for traffic levels in excess of 30 million ESALs. If the agency already requires performance tests for HMA, than these same tests should be applied to WMA with the understanding that different aging conditions or test cri-teria may be required.
Field Performance of Warm Mix Asphalt Technologies
Copyright National Academy of Sciences. All rights reserved.
185
Economics of a new technology like warm mix asphalt (WMA) often make up one of the principal factors that deter-mine its acceptance into mainstream practice. In a permissive specification environment, such as for WMA in most cases, it is probably the dominant factor. For the asphalt contracting industry, the use of WMA has certain costs and potentially some economic benefits. The costs of WMA depend primar-ily on the type of WMA technology that is used. Economic benefits may be related to energy reductions at the plant, the potential for higher unit payments resulting from achieving higher in-place densities or smoother pavements, extended paving seasons, and the possibility of eliminating antistripping additives for some WMA additives.
Of the WMA technology options, water-injection asphalt foaming systems typically have the lowest cost per ton. These systems require the installation of mechanical equipment and some modifications to the plant’s control system. The early water-injection foaming systems cost around $80,000. Other water-injection foaming systems that have entered the market-place in the last few years cost as little as $30,000 installed. Many contractors depreciate capital expenditures such as this over 5 to 7 years. Assuming an average yearly production for a plant, the cost of the equipment also can be figured on a per ton basis. For example, if the water-injection foaming system cost $50,000 and the plant produces an average of 120,000 tons per year, then depreciating the system over 5 years would add about 8¢/ton [$50,000/(5 × 120,000) = $0.08].
WMA additives are reported to increase mix costs by approximately $2.00 to $3.50/ton (33). Additive prices will also vary due to freight costs. WMA additive prices may have decreased some during the past few years as the addition of WMA additives at asphalt terminals has become more common.
Mix design costs are also likely to increase if the recom-mendations from NCHRP Report 691: Mix Design Practices for Warm Mix Asphalt are implemented. Adding the coating test, compactability test, and flow number test are estimated to increase mix design costs by $1,500 to $2,000.
As reported in Part 2, the energy audits for WMA projects in this study found energy savings for WMA production to be reasonably approximated by the following relationship:
Energy savings 1,100 Btu F ton 3( )= °
Although theoretical energy calculations indicate that the reduction should be less than the result determined from equation (3), the theoretical models do not appear to fully account for the energy transfer to heating the metal in the plant’s drier and ductwork.
In practice, WMA production temperatures when using water-injection foaming technologies are typically about 25°F lower than those for hot mix asphalt (HMA) using the same mix design. WMA produced with additives tends to have substantially lower mixing temperatures. For the pur-pose of estimating energy savings, a temperature difference of 50°F is assumed for additive-type WMA compared to HMA using the same mix design. Therefore, for water-injection type WMA, typical energy savings can be estimated to be 27,500 Btu/ton, and for additive-type WMA, the energy sav-ings can be estimated to be about 55,000 Btu/ton.
Most asphalt plants in the United States use either recycled fuel oil (RFO) or natural gas for burner fuel for drying and heating the aggregate. A typical energy density for RFO is 137,000 Btu/gal (34). Recent cost for RFO is about $2.00/gal (35). Therefore, as shown in equation (4), for a 25°F drop from HMA to WMA for typical water-injection systems, the energy savings when using RFO is estimated to be $0.39/ton of mix.
( )
× ×
=
27,500 Btu ton 1 gal of RFO 137,000 Btu $2.00 gal
$0.39 ton 4
Similarly, for a 50°F drop from HMA to WMA, the energy savings is estimated to be $0.79/ton of mix.
In 2013, natural gas prices ranged from approximately $4.30 to $5.25 per million Btu (36). Adding approximately
C H A P T E R 6
Cost Analysis of WMA
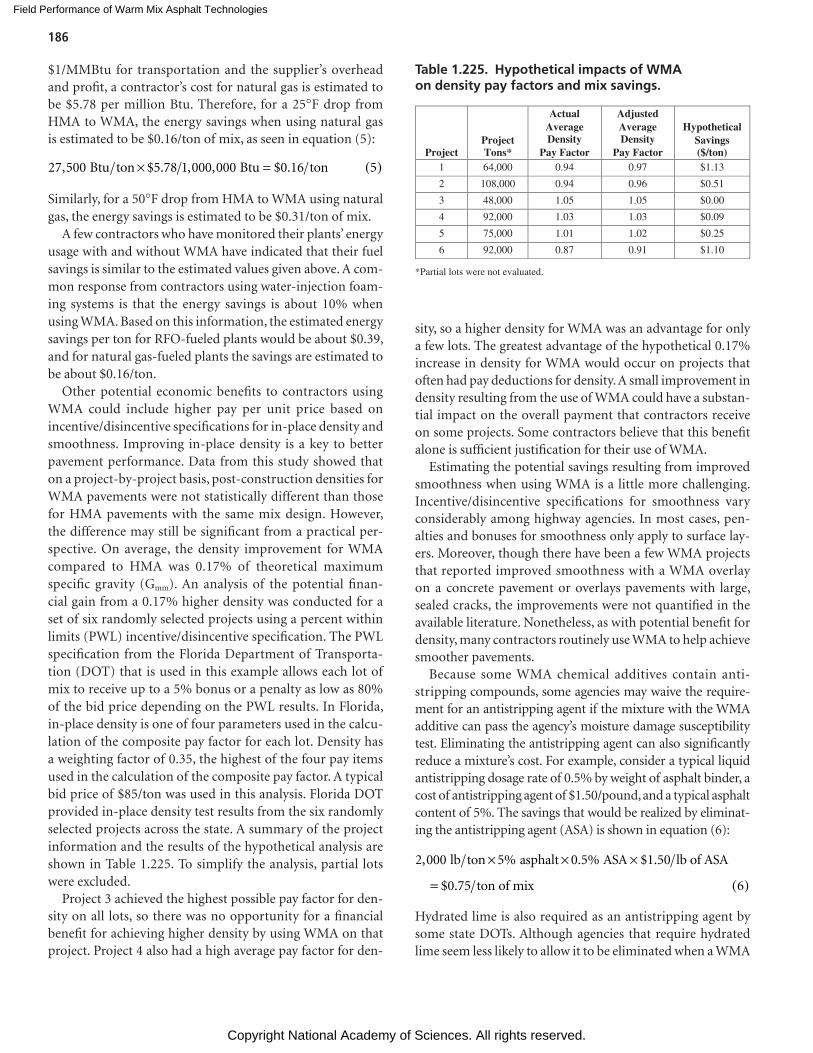
Field Performance of Warm Mix Asphalt Technologies
Copyright National Academy of Sciences. All rights reserved.
186
$1/MMBtu for transportation and the supplier’s overhead and profit, a contractor’s cost for natural gas is estimated to be $5.78 per million Btu. Therefore, for a 25°F drop from HMA to WMA, the energy savings when using natural gas is estimated to be $0.16/ton of mix, as seen in equation (5):
( )× =27,500 Btu ton $5.78 1,000,000 Btu $0.16 ton 5
Similarly, for a 50°F drop from HMA to WMA using natural gas, the energy savings is estimated to be $0.31/ton of mix.
A few contractors who have monitored their plants’ energy usage with and without WMA have indicated that their fuel savings is similar to the estimated values given above. A com-mon response from contractors using water-injection foam-ing systems is that the energy savings is about 10% when using WMA. Based on this information, the estimated energy savings per ton for RFO-fueled plants would be about $0.39, and for natural gas-fueled plants the savings are estimated to be about $0.16/ton.
Other potential economic benefits to contractors using WMA could include higher pay per unit price based on incentive/disincentive specifications for in-place density and smoothness. Improving in-place density is a key to better pavement performance. Data from this study showed that on a project-by-project basis, post-construction densities for WMA pavements were not statistically different than those for HMA pavements with the same mix design. However, the difference may still be significant from a practical per-spective. On average, the density improvement for WMA compared to HMA was 0.17% of theoretical maximum specific gravity (Gmm). An analysis of the potential finan-cial gain from a 0.17% higher density was conducted for a set of six randomly selected projects using a percent within limits (PWL) incentive/disincentive specification. The PWL specification from the Florida Department of Transporta-tion (DOT) that is used in this example allows each lot of mix to receive up to a 5% bonus or a penalty as low as 80% of the bid price depending on the PWL results. In Florida, in-place density is one of four parameters used in the calcu-lation of the composite pay factor for each lot. Density has a weighting factor of 0.35, the highest of the four pay items used in the calculation of the composite pay factor. A typical bid price of $85/ton was used in this analysis. Florida DOT provided in-place density test results from the six randomly selected projects across the state. A summary of the project information and the results of the hypothetical analysis are shown in Table 1.225. To simplify the analysis, partial lots were excluded.
Project 3 achieved the highest possible pay factor for den-sity on all lots, so there was no opportunity for a financial benefit for achieving higher density by using WMA on that project. Project 4 also had a high average pay factor for den-
sity, so a higher density for WMA was an advantage for only a few lots. The greatest advantage of the hypothetical 0.17% increase in density for WMA would occur on projects that often had pay deductions for density. A small improvement in density resulting from the use of WMA could have a substan-tial impact on the overall payment that contractors receive on some projects. Some contractors believe that this benefit alone is sufficient justification for their use of WMA.
Estimating the potential savings resulting from improved smoothness when using WMA is a little more challenging. Incentive/disincentive specifications for smoothness vary considerably among highway agencies. In most cases, pen-alties and bonuses for smoothness only apply to surface lay-ers. Moreover, though there have been a few WMA projects that reported improved smoothness with a WMA overlay on a concrete pavement or overlays pavements with large, sealed cracks, the improvements were not quantified in the available literature. Nonetheless, as with potential benefit for density, many contractors routinely use WMA to help achieve smoother pavements.
Because some WMA chemical additives contain anti-stripping compounds, some agencies may waive the require-ment for an antistripping agent if the mixture with the WMA additive can pass the agency’s moisture damage susceptibility test. Eliminating the antistripping agent can also significantly reduce a mixture’s cost. For example, consider a typical liquid antistripping dosage rate of 0.5% by weight of asphalt binder, a cost of antistripping agent of $1.50/pound, and a typical asphalt content of 5%. The savings that would be realized by eliminat-ing the antistripping agent (ASA) is shown in equation (6):
2,000 lb ton 5% asphalt 0.5% ASA $1.50 lb of ASA
$0.75 ton of mix 6( )
× × ×
=
Hydrated lime is also required as an antistripping agent by some state DOTs. Although agencies that require hydrated lime seem less likely to allow it to be eliminated when a WMA
Project Project Tons*
Actual Average Density
Pay Factor
Adjusted Average Density
Pay Factor
Hypothetical Savings ($/ton)
1 64,000 0.94 0.97 $1.13
2 108,000 0.94 0.96 $0.51
3 48,000 1.05 1.05 $0.00
4 92,000 1.03 1.03 $0.09
5 75,000 1.01 1.02 $0.25
6 92,000 0.87 0.91 $1.10
*Partial lots were not evaluated.
Table 1.225. Hypothetical impacts of WMA on density pay factors and mix savings.
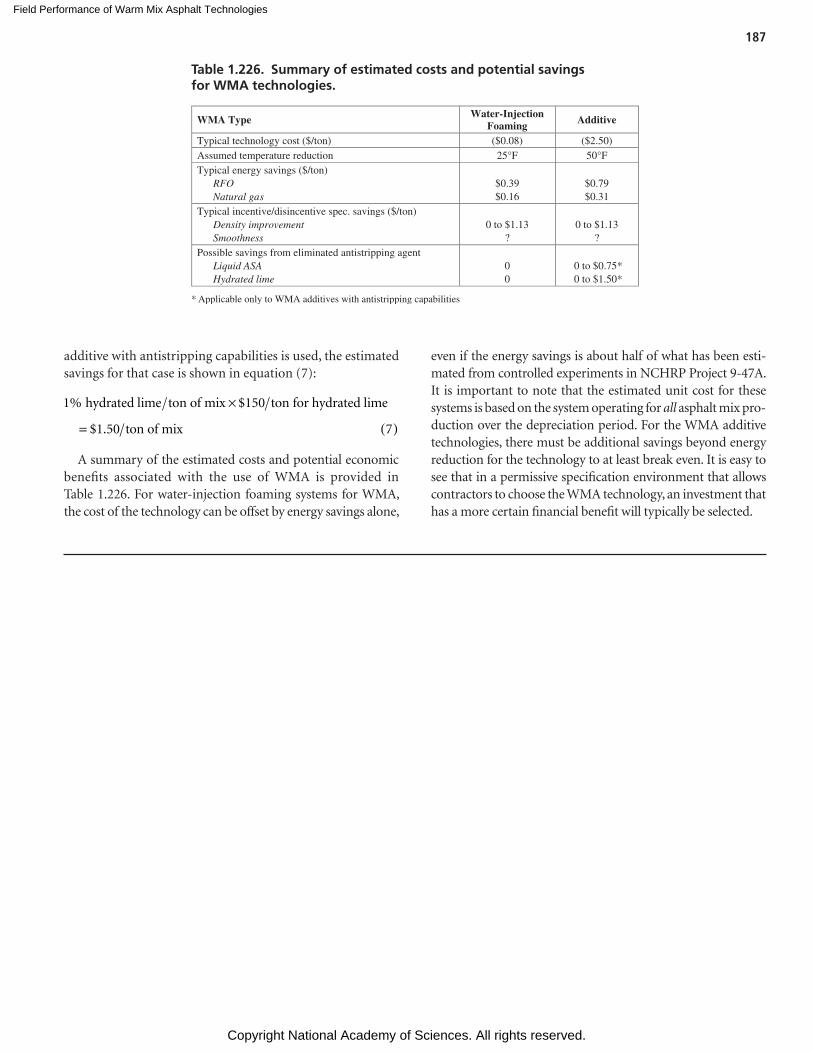
Field Performance of Warm Mix Asphalt Technologies
Copyright National Academy of Sciences. All rights reserved.
187
additive with antistripping capabilities is used, the estimated savings for that case is shown in equation (7):
( )
×
=
1% hydrated lime ton of mix $150 ton for hydrated lime
$1.50 ton of mix 7
A summary of the estimated costs and potential economic benefits associated with the use of WMA is provided in Table 1.226. For water-injection foaming systems for WMA, the cost of the technology can be offset by energy savings alone,
Table 1.226. Summary of estimated costs and potential savings for WMA technologies.
WMA Type Water-Injection Foaming Additive
Typical technology cost ($/ton) ($0.08) ($2.50) Assumed temperature reduction 25°F 50°F Typical energy savings ($/ton) RFO Natural gas
$0.39 $0.16
$0.79 $0.31
Typical incentive/disincentive spec. savings ($/ton) Density improvement Smoothness
0 to $1.13
?
0 to $1.13
? Possible savings from eliminated antistripping agent Liquid ASA Hydrated lime
0 0
0 to $0.75*
0 to $1.50*
* Applicable only to WMA additives with antistripping capabilities
even if the energy savings is about half of what has been esti-mated from controlled experiments in NCHRP Project 9-47A. It is important to note that the estimated unit cost for these systems is based on the system operating for all asphalt mix pro-duction over the depreciation period. For the WMA additive technologies, there must be additional savings beyond energy reduction for the technology to at least break even. It is easy to see that in a permissive specification environment that allows contractors to choose the WMA technology, an investment that has a more certain financial benefit will typically be selected.
Field Performance of Warm Mix Asphalt Technologies
Copyright National Academy of Sciences. All rights reserved.
188
Production and Construction of WMA
1. Lower mix production temperatures associated with warm mix asphalt (WMA) did not cause plant issues or construc-tion problems for any of the project sites evaluated in this study. Even with WMA mix temperatures that averaged 48°F (27°C) lower than corresponding hot mix asphalt (HMA) mixes, there were no problems with the burner, baghouse, motor amperage, or mix storage. Excellent coat-ing was achieved with all WMA technologies at the lower mix production temperatures.
2. In most cases, moisture contents of the WMA mixes were slightly higher than those in the corresponding HMA, but the differences were small and are believed to be inconse-quential. WMA that used water foaming process had similar moisture contents to mixes using other WMA technologies. Measured moisture contents for nearly all mixes were at or below the common specification limit of 0.5% moisture in asphalt mixes.
3. The mix designs were not altered for any of the WMA trial projects. Laboratory Superpave Gyratory Compactor (SGC) temperatures were set to be equal to the mat temperature at the start of rolling for all HMA and WMA mixes. In most cases, the SGC air void contents of the WMA mixes differed from the corresponding HMA mixes by more than 0.5%, but there were a similar number of cases where the WMA laboratory air void contents were higher and lower than the corresponding HMA. In short, other differences between WMA and HMA pairs, such as differences in asphalt con-tents and gradations, confounded the effects of mix tem-perature and WMA technology on laboratory-compacted air void contents.
4. There is evidence that WMA mixes had slightly less asphalt absorption (0.12%, on average) than corresponding HMA for mixes sampled after discharge from the plant. For the projects in this study, differences in asphalt absorption
between WMA and HMA ranged from essentially no dif-ference to as much as 0.5%. Such differences are likely attributed to interactions of mix production temperature, storage time, aggregate characteristics, and binder prop-erties. After about 1 year, the differences in absorption between WMA and HMA were not statistically significant.
5. In almost all cases, using the same roller patterns resulted in statistically equivalent as-constructed densities for WMA mixes compared to the corresponding HMA mixes, even at much lower temperatures for WMA. In only one of the 15 WMA to HMA comparisons was an as-constructed den-sity of the WMA section statistically higher than that of its corresponding HMA.
6. No difference was observed between the opening times to traffic of WMA and HMA after rolling. This dispels the concern that WMA would need to cool for a longer period of time before opening to traffic.
Energy and Emissions
1. Producing asphalt mixtures at lower temperatures saves energy. The data collected as part of this study show that decreasing the mix production temperature by an average of 48°F (27°C) resulted in an average burner fuel savings of 22%. The energy savings associated with WMA was found to be reasonably approximated by the following relationship:
( ) = ∆°1100Energy savings Btu BTU F ton
2. Reductions in carbon dioxide (CO2) emissions measured at asphalt plant stacks were directly proportional to reduc-tions in fuel usage. These data were consistent with results reported in other studies. However, other emissions, such as carbon monoxide (CO) and volatile organic com-pounds (VOC) depended more on fuel type and burner tuning than the use of WMA.
C H A P T E R 7
Findings
Field Performance of Warm Mix Asphalt Technologies
Copyright National Academy of Sciences. All rights reserved.
189
3. Worker exposures to respirable fumes during paving with WMA were significantly reduced. Measurements of total organic matter (TOM) in breathing zones of paving crews were obtained on two projects with six different WMA technologies and two HMA control sections. With one exception, the WMA mixtures resulted in at least a 33% reduction in TOM. The amount of emissions depends on characteristics of the asphalt binder and paving tempera-tures. All of the polycyclic aromatic compounds (PACs) from asphalt fumes reviewed by the International Agency for Research on Cancer (IARC) were below detectable limits on both projects.
Short-Term WMA Field Performance
1. WMA sections have performed the same as corresponding HMA sections with regard to rutting. All of the field proj-ects have less than 5 mm of rutting after 2 years of traffic. Evaluations of WMA at several accelerated pavement test-ing facilities have also demonstrated that WMA can hold up to heavy loading.
2. None of the field projects has had any evidence of moisture damage. Cores taken from the projects after 1 to 2 years of traffic were inspected for visual evidence of stripping. Even the experiment using saturated pavement sections tested under a Heavy Vehicle Simulator by the University of Cali-fornia, Davis, did not exhibit moisture damage.
3. The use of WMA did not appear to effect density changes under traffic compared to HMA. This observation was confounded by the fact that many of the WMA test sec-tions were constructed in different lanes from the HMA section.
4. Very little cracking of any type was observed in the field test sections monitored in this study. Transverse cracking was the most common type of cracking. Eight of the 14 proj-ects had minor amounts of transverse cracking, but many of these cracks were likely reflection cracks. Only two of the newer projects had any transverse cracking after about 2 years. Of the projects with transverse cracking, the WMA and HMA sections generally had similar amounts. Four of the 14 projects had minor non-wheelpath cracking, and only three projects had low-severity longitudinal wheel-path cracking. In most cases, WMA and HMA sections on these projects had similar amounts of cracking. In the few cases where one section had more cracking than its project companion(s), the section with more cracking also had a lower asphalt content.
5. All of the test sections had similar amounts of surface tex-ture and texture change after 2 or more years of traffic. Surface texture measurements were conducted with the sand patch test as an indicator of raveling. None of the test sections had significant amounts of raveling.
Engineering Properties of WMA
1. Testing of recovered binders from mixes obtained dur-ing construction generally showed that the WMA binders had aged slightly less than the corresponding HMA bind-ers. The average difference in the high critical temperatures between HMA and WMA binders recovered from plant-produced mixes was 2.3°C, and the average difference for the low critical temperatures was 1.3°C. Such small dif-ferences would not be expected to significantly impact pavement performance.
2. Testing of recovered binders from cores taken after approx-imately 1 to 2 years of service generally indicate that the true grades of HMA and WMA were not substantially dif-ferent. These test results also indicate that very little or no stiffening had occurred for the binders from the time of construction. The PAV conditioning of the recovered bind-ers as part of the performance grading process may mask the effects of the plant aging and short-term field aging.
3. Lower mixing temperatures for WMA can affect the amount of binder absorbed in the pores of the aggregate for mixes sampled immediately following production. Of the 13 WMA to HMA comparisons, the calculated asphalt absorption values were within 0.1% for eight of the com-parisons. The other five cases had slightly less absorp-tion for the WMA compared to its companion HMA. The amount of absorption in any mix will be affected by tem-perature, storage time, and aggregate properties. Tests on mix samples from cores after 1 to 2 years of service gener-ally indicate that asphalt absorption values are similar for WMA and HMA pavements.
4. Statistical analyses indicate that the dynamic moduli of WMA mixtures are lower than those of corresponding HMA mixtures in most cases. Eleven of the 13 WMA to HMA mix comparisons were found to have a lower E* for the WMA for at least one temperature and frequency used in the standard dynamic modulus test. On average, the E* of WMA mixes were about 12% lower than those of the corresponding HMA, but the differences ranged from about 5% stiffer to 40% less stiff.
5. Flow number test results for plant-produced WMA mixes were statistically lower than corresponding HMA mixes in more than 2/3 of the comparisons. The flow number criteria recommended in NCHRP Report 673 for HMA and NCHRP Report 691 for WMA seem appropriate for evaluating plant-produced mixes.
6. Indirect tensile strengths determined on cores obtained immediately after construction were not statistically dif-ferent in 12 of the 14 WMA to HMA comparisons from the “new” projects. In the majority of cases, the tensile strengths of WMA and HMA cores from the same project remained statistically equivalent through at least 2 years.
Field Performance of Warm Mix Asphalt Technologies
Copyright National Academy of Sciences. All rights reserved.
190
These tensile strength tests were conducted on the same cores used to determine and compare in-place densities.
7. Indirect tensile strengths determined on SGC-molded specimens using hot compacted samples from plant mix were statistically different for WMA and corresponding HMA mixes. In a little more than half of the comparisons, tensile strengths were statistically lower for WMA com-pared to HMA. On the other hand, 38% of the laboratory- molded WMA mixtures had higher tensile strengths compared to the companion HMA mixes. All of these laboratory-molded specimens had air void contents in the range of 7±0.5%. The contrast between the compari-sons of tensile strengths for cores and laboratory-molded specimens indicates that the method of compaction influences the properties of asphalt mixture specimens.
8. The tensile strength ratio (TSR) test was conducted in accordance with AASHTO T 283 on all of the plant-produced mixtures from existing and new projects evalu-ated in this study. Eighty-two percent of the mixes passed the standard 0.8 minimum TSR criterion. The six mixes that failed the criterion included four WMA and two HMA mixes. Only two mixes would have failed a mini-mum TSR limit of 0.75. Since all the field projects have performed well with no evidence of moisture damage, consideration should be given to adjusting the TSR cri-terion on plant mix samples to 0.75 to reduce the num-ber of false negatives with the test.
9. Hamburg wheel tracking tests were used to assess the rutting potential of the plant-produced mixtures as well as their resistance to moisture damage. As for the rutting comparisons, 59% of the WMA mixes had statistically equivalent Hamburg rut depths to their corresponding HMA mixes, and the other 41% of the WMA mixes had greater Hamburg rut depths than their companion HMA mixes. Since no nationally accepted criteria for Hamburg rutting have been established, results were evaluated using suggested criteria from the NCAT Test Track based on limited data with HMA mixtures. Four of the WMA mix-tures did not meet the suggested criteria for moderate trafficked pavements. However, as noted in the conclu-sions on short-term field performance, all of the WMA and HMA pavements have performed very well, indicat-ing that either the Hamburg rut depth criteria should be adjusted for WMA or conditioning of WMA mixtures should be changed to yield results consistent with field performance.
10. The Hamburg wheel tracking test also is used by a grow-ing number of state highway agencies to assess stripping potential. The Hamburg test currently lacks a precision statement, and there is no consensus regarding criteria for evaluating moisture damage. NCAT has used a mini-mum of 5,000 cycles for the stripping inflection point
(SIP) in a number of studies. Ten of the 34 mixes evalu-ated in this study failed that criterion, including nine of the 22 WMA mixes. These results indicate that the cur-rent Hamburg test method or the 5,000-cycle limit for SIP is too severe for evaluating WMA.
11. The uniaxial fatigue test, also called the simplified visco-elastic continuum damage (S-VECD) test, was conducted using the asphalt mixture performance tester (AMPT) on 11 plant-produced mixes in the study. Although the labo-ratory results indicate some differences in fatigue behavior among the mixes, without validation of the procedure in a well-controlled field experiment, drawing conclusions about the laboratory results is not appropriate.
12. The indirect tensile creep compliance and strength test was conducted on 13 plant-produced mixes from the study to evaluate their thermal cracking potential. Overall, the laboratory test results indicate that WMA mixtures would show a small improvement in low-temperature crack-ing compared to their control HMA mixtures. However, there was not enough observed thermal cracking in the actual pavements with these mixtures at the time of the last project inspections to validate the laboratory results.
Predicted Performance
1. The Mechanistic-Empirical Pavement Design Guide (MEPDG) predicted slightly more rutting for the WMA sections compared to the HMA sections, on the order of 0.2 mm. This predicted difference was consistent through 20-years of service. Statistically, the predicted differences were not significant. Further, comparisons with observed field performance over 1 to 2 years suggest the MEPDG over-prediction of rutting was greater for WMA as com-pared to HMA.
2. Short-term observed field and long-term predicted rut-ting performance indicate there is a discrepancy between laboratory and field rutting performance for WMA. Con-versely, HMA mixes, as measured by laboratory rutting tests, may be more rut-resistant than they need to be to provide adequate field performance.
3. The MEPDG performance predictions of top-down, longi-tudinal cracking after both 12 and 20 years of service were similar for both WMA and HMA. Numerically, slightly more cracking was predicted for the HMA compared to the WMA sections; statistically they were not different.
4. Using Level 1, low-temperature indirect tension (IDT) inputs, the MEPDG predicted less low-temperature crack-ing with time for the WMA sections compared to the HMA sections. The differences are not statistically significant.
5. Overall, the MEPDG predicted similar long-term perfor-mance for WMA and HMA mixes using the engineering properties measured from the field-produced mixes.
Field Performance of Warm Mix Asphalt Technologies
Copyright National Academy of Sciences. All rights reserved.
191
Mix Design Verification
1. For laboratory-produced mixes aged for 2 hours at the observed field compaction temperature, theoretical maxi-mum gravity and calculated binder absorption were gener-ally lower than for field-produced mixes. In all cases, the binder absorptions of laboratory-produced WMA were less than the binder absorptions of laboratory-produced HMA.
2. The methods described in the Appendix to AASHTO R 35 were followed to produce the laboratory WMA. The opti-mum asphalt contents were verified for 15 mixes (10 WMA and 5 HMA). In 6 of 10 cases, the optimum asphalt content for the WMA was less than for the HMA. Overall, the opti-mum asphalt contents for the WMA mixes averaged 0.27% less than the HMA.
3. A bucket mixer was used to produce the WMA mixes. After 90 seconds of mixing at optimum asphalt content, all 10 of the WMA mixes exceeded the 95% coating speci-fied in the Appendix to AASHTO R 35. Six of 10 mixes equaled or exceeded the observed field coating.
4. Six of 10 WMA mixes failed the compactability ratio of 1.25 recommended in the Appendix to AASHTO R 35. Four of six mixes that failed compactability had low in-place density in the field; however, the asphalt contents were the laboratory-verified optimum and not that mea-sured in the field.
5. Three of 10 TSR tests of laboratory-produced WMA were less than 0.8. The field-mixed, plant-compacted TSR on one of these mixes also failed. As noted previously, no moisture damage was observed in the field after 1 to 5 years of service.
6. Flow number tests were conducted on laboratory-produced mix at the optimum asphalt content determined from the mix verifications. Nine of 10 mixes met the Appendix to AASHTO R 35 flow number criteria. The mix that failed had 0.0 mm rutting after 2 years and therefore appears to be a false negative.
Suggestions for Modifying Practice
Mix Design
1. The drop-in approach for WMA mix designs has worked well and avoids the potential of designing mixes with lower asphalt contents when using WMA. Therefore, mix designs should be conducted without the WMA tech-nology to determine the optimum asphalt content for the mix. Coating, compactability, and TSR should be
confirmed using the proposed WMA technology and temperatures.
2. Based on the field and predicted performance of WMA, flow number testing should only be required for pave-ments with predicted traffic over 30 million ESALs.
3. The Appendix to AASHTO R 35 should be modified as described in this report.
4. TSR criteria for plant-produced HMA and WMA should be decreased to 0.75 to reduce the number of false nega-tives (failing results but good performance).
5. If the Hamburg test is used in the future to evaluate WMA mixes, two options may be considered to reduce the num-ber of rejected mixes that would likely provide good field performance. One option, used by the Texas Department of Transportation (DOT), is to extend the conditioning of WMA mixtures from 2 hours to 4 hours at 275°F (32). Another option is to consider adjusting the rut depth criteria similar to what has been done for the flow number criteria.
Production
1. Best practices should be used to minimize stockpile mois-ture contents in order to maximize fuel savings.
2. Best practices should be used to maintain adequate bag-house temperatures in order to prevent condensation.
3. Dryer burners should be tuned to maximize performance and minimize fuel usage and emissions. Plant manufac-turers should consider designs that will allow efficiency over a range of firing rates.
4. Handwork may require higher WMA production temperatures.
Other Research
NCHRP Report 763: Evaluation of the Moisture Susceptibil-ity of WMA Technologies presents the final report of another significant NCHRP study that has been recently completed. Readers are advised to review the findings of that report. Another major WMA-related project, NCHRP Project 9-49A, “Performance of WMA Technologies: Stage II—Long-Term Field Performance,” has issued an interim report that may be obtained on request from NCHRP. The long-term field performance monitoring aspect of that project continues through 2015; the final report is anticipated to be completed in 2016. Also, the Long-Term Pavement Performance (LTPP) program has initiated a new WMA experiment that will involve building and monitoring new test sections.
Field Performance of Warm Mix Asphalt Technologies
Copyright National Academy of Sciences. All rights reserved.
192
1. Hansen, K. R, and A. Copeland. Annual Asphalt Pavement Indus-try Survey on Recycled Materials and Warm Mix Asphalt Usage: 2009–2012, IS-138. National Asphalt Pavement Association, Lanham, MD, 2013.
2. Taylor, M. A., and N. P. Khosla. Stripping of Asphalt Pavements: State of the Art. Transportation Research Record 911, TRB, National Research Council, Washington, D.C., 1983, pp. 150–158.
3. WMA TWG. “Documenting Emissions and Energy Reductions of WMA and Conventional HMA,” August 2006. Accessed from www.warmmixasphalt.com.
4. West, R., D. Timm, R. Willis, B. Powell, N. Tran, D. Watson, M. Sakhaeifar, R. Brown, M. Robbins, A. Vargas-Nordcbeck, F. Leiva-Villacorta, X. Long, and J. Nelson. Phase IV NCAT Test Track Findings. NCAT Report No. 12-10, National Center for Asphalt Technology, Auburn University, 2012.
5. Prowell, B. D., G. C. Hurley, and E. Crews. Field Performance of Warm Mix Asphalt at the NCAT Test Track. Transportation Research Record: Journal of the Transportation Research Board, No. 1998, Trans-portation Research Board of the National Academies, Washington, D.C., 2007, pp. 96–102.
6. Priest, A. L. and D. H. Timm. Methodology and Calibration of Fatigue Transfer Functions for Mechanistic-Empirical Flexible Pavement Design. NCAT Report No. 06-03, National Center for Asphalt Technology, Auburn University, 2006.
7. Willis, J. R. and D. H. Timm. Field-Based Strain Thresholds for Flexible Perpetual Pavement Design. NCAT Report No. 09-09, National Center for Asphalt Technology, Auburn University, 2009.
8. Jones, D., R. Wu, B. Tsai, and J. T. Harvey. Warm Mix Asphalt Study: First-Level Analysis of Phase 2 HVS and Laboratory Testing and Phase 1 and Phase 2 Forensic Assessments. Research Report UCPRC-RR-2009-02, University of California Pavement Research Center, UC Davis, UC Berkley, July 2009.
9. Jones, D., R. Wu, B. Tsai, and J. T. Harvey. Warm Mix Asphalt Study: Test Track Construction and First-Level Analysis of Phase 3a HVS an Laboratory Testing (Rubberized Asphalt, Mix Design #1). Research Report: UCPRC-RR-2011-02, University of California Pavement Research Center, UC Davis, UC Berkley, July 2011.
10. Prowell, B. D., G. C. Hurley, and B. Frank. Warm Mix Asphalt: Best Practices; Quality Improvement Publication 125, 3rd ed., National Asphalt Pavement Association, 2012.
11. American Association of State Highway and Transportation Officials. AASHTO Guide for Design of Pavement Structures. American Asso-ciation of State Highway and Transportation Officials, Washington, D.C., 1993.
12. Miller, J., and W. Bellinger. Distress Identification Manual for the Long-Term Pavement Performance Program. Publication FHWA-RD-03-031. FHWA, U.S. Department of Transportation, 2003.
13. Bruinsma, J. E., J. M. Vandenbossche, K. Chatti, and K. D. Smith. Using Falling Weight Deflectometer Data with Mechanistic-Empirical Design and Analysis, Volume 2: Case Study Reports. Federal Highway Administration, Washington, D.C., 2010.
14. United States Department of Agriculture Natural Resources Con-servation Service. “Web Soil Survey.” Accessed from http://websoil survey.sc.egov.usda.gov/App/HomePage.htm. Accessed various dates in 2012 and 2013.
15. Pierce, L. M., J. E. Bruinsma, K. D. Smith, M. J. Wade, K. Chatti, and J. M. Vandenbossche. Using Falling Weight Deflectometer Data with Mechanical-Empirical Design and Analysis, Volume 3: Guidelines for Deflection Testing, Analysis, and Interpretation. Federal Highway Administration, Washington, D.C., 2010.
16. Hurley, G. C., and B. D. Prowell. Evaluation of Evotherm for Use in Warm Mix Asphalt. NCAT Report 06-02, National Center for Asphalt Technology, Auburn University, 2006.
17. Kvasnak, A. N., J. Moore, A. Taylor, B. Prowell. Preliminary Evalua-tion of Warm Mix Asphalt Field Demonstration: Franklin, Tennes-see. NCAT Report 10-01, National Center for Asphalt Technology, Auburn University, 2010.
18. Hou, T., B. S. Underwood, and Y. R. Kim. Fatigue Performance Pre-diction of North Carolina Mixtures Using the Simplified Viscoelas-tic Continuum Damage Model. Journal of Association of Asphalt Paving Technologists, 2010.
19. Hurley, G. C., B. D. Prowell, and A. N. Kvasnak. Michigan Field Trial of Warm Mix Asphalt Technologies: Construction Summary. NCAT Report 09-10, National Center for Asphalt Technology, Auburn University, 2009.
20. Mohseni, A. LTPPBind Version 3.1, Pavement Systems LLC, Devel-oped for the Federal Highway Administration, Turner-Fairbank Highway Research Center, September 2005.
21. Bonaquist, R. NCHRP Report 691: Mix Design Practices for Warm Mix Asphalt, Transportation Research Board of the National Acad-emies, Washington, D.C., 2011.
22. Leiva-Villacorta, F., and R. West. Relationships Between Laboratory Measured Characteristics of HMA and Field Compactability. Jour-nal of the Association of Asphalt Paving Technologists, Vol. 77, 2008.
23. Hurley, G. C., B. D. Prowell, and A. N. Kvasnak. Missouri Field Trial of Warm Mix Asphalt Technologies: Construction Summary. NCAT Report 10-02, National Center for Asphalt Technology, Auburn University, 2010.
References
Field Performance of Warm Mix Asphalt Technologies
Copyright National Academy of Sciences. All rights reserved.
193
24. Aschenbrener, T., B. Schiebel, and R. West. Three-Year Evaluation of the Colorado Department of Transportation’s Warm Mix Asphalt Experimental Feature on I-70 in Silverthorne, Colorado. NCAT Report 11-02, National Center for Asphalt Technology, Auburn Uni-versity, 2011.
25. Russell, M., J. Uhlmeyer, J. Weston, J. Roseburg, T. Moomaw, J. DeVol. Evaluation of Warm Mix Asphalt, WA-RD 723.1. Washing-ton State Department of Transportation Research Report 08-01, April 2009.
26. Whitehouse, D., and G. R. Hilsinger. Preliminary Pavement Design Report Transmittal; XL-Pend 501202Z SR-12, “Walla Walla to Wallula Planning Study,” MPs 307.30 to 335.90, July 28, 2003.
27. Young, T. J. “Saving Money Through Effective Plant Maintenance,” Hot Mix Asphalt Technology, Vol. 12, No. 6, November/December 2007, National Asphalt Pavement Association, Lanham, MD, pp. 12–15.
28. Azari, H. NCHRP Research Results Digest 351: Precision Statements for AASHTO Standard Methods of Test T 148, T 265, T 267, and T 283, Transportation Research Board of the National Academies, Washington, D.C., 2011.
29. Advanced Asphalt Technologies, LLC. NCHRP Report 673: A Man-ual for Design of Hot Mix Asphalt with Commentary, Transportation Research Board of the National Academies, Washington, D.C., 2011.
30. Timm, D., M. Robbins, R. Willis, N. Tran, and A. Taylor. Field and Laboratory Study of High Polymer Mixtures at the NCAT Test Track. NCAT Report 13-03, National Center for Asphalt Technol-ogy, Auburn University, 2013.
31. Willis, J. R., R. West, J. Nelson, A. Taylor, and K. Leatherman. Com-bining Warm MixAsphalt Technologies with Mixtures Contain-ing Reclaimed Asphalt Pavement. Presented at 2nd International Warm Mix Conference, St. Louis, Missouri, October 2011.
32. Estakhri, C. Laboratory and Field Performance Measurements to Support the Implementation of Warm Mix Asphalt in Texas. Texas Transportation Institute Report 5-5597-01-1, July 2012.
33. Bennert, T. “Evaluation of Warm Asphalt Technology—Feasibility Study.” New Jersey Department of Transportation Project 2008-01, Center for Advanced Infrastructure and Transportation (CAIT), Rutgers University, 2008.
34. The Fundamentals of the Operation and Maintenance of the Exhaust Gas System in a HMA Facility. IS-52, National Asphalt Pavement Association, Lanham, MD, 1987.
35. Recycler’s World. http://www.recycle.net/Liquids/petro/xv150100.html. Accessed February 28, 2014.
36. U.S. Energy Information Administration. Henry Hub Natural Gas Spot Price. http://www.eia.gov/dnav/ng/hist/rngwhhdm.htm. Accessed February 28, 2014.
Field Performance of Warm Mix Asphalt Technologies
Copyright National Academy of Sciences. All rights reserved.
194
Florida
The falling weight deflectometer (FWD) data were provided by the Florida Department of Transportation (DOT). The data were collected on January 17, 2005 by Applied Research Associ-ates, Inc. The testing was conducted on SR 30 from milepost 0 to 7.412. The testing was done on the eastbound lane. The highway was overlaid on October 6, 2010 with both hot-mix asphalt (HMA) and warm-mix asphalt (WMA). The WMA was a foaming technology by Terex Corporation. The WMA was paved in the eastbound lane, and the HMA was paved in the parallel westbound lane. The FWD data provided were only for the eastbound lane, so the analysis was performed only on the eastbound (WMA) section. The analysis was com-pleted using ModTag software developed by the Virginia DOT. According to global positioning satellite (GPS) readings taken at construction, the WMA section started at milepost 5.3 and ended at the Aucilla River. Cores were taken at both the 1-year and 2-year revisits. The surface lift was not considered in the analysis because it had yet to be placed when the FWD data were obtained. The cores heights, minus the surface lift, were aver-aged and that value was used as an input in ModTag. Inputs for ModTag are summarized at the top of Table 1.A.1. The struc-tural number effective (SNeff) of the pavement and the resilient modulus of the subgrade (Mr) are displayed in Figure 1.A.1. The Mr is labeled as Design Mr because it has been corrected by a factor of 0.33, according to the AASHTO standards.
Arizona
The FWD data were provided by Arizona DOT. The data were collected on May 26, 2010. The data were collected on SR 84 E between milepost 166.4 and 172.0. The overlay for the eastbound lane was a section from milepost 169.3 to 172.0. This section was paved with a WMA containing Sasobit®. This project also had an HMA and Advera® section; however they were both paved parallel to the Sasobit, in the westbound lane.
The Advera section was not tested as part of this project. The core data collected at the 1-year revisit were averaged to deter-mine a pavement height of the Sasobit section. The surface layer height was removed from the core height because the FWD data were collected before the overlay. The inputs for this data can be found in Table 1.A.1. The Sasobit section is clearly marked in Figure 1.A.2. The Mr changes significantly in the Sasobit section.
Indiana
The FWD data were collected by the National Center for Asphalt Technology (NCAT) on September 13, 2010. The test-ing was completed on the outside lanes prior to overlaying the pavement. According to the field notes, the inside lanes for both the north and southbound lanes were not tested due to dan-gerous traffic conditions. It was assumed that the inside lane would be equivalent to the outside lane. The HMA was placed in the outside southbound lanes, while one of the WMA technologies, Gencor foam, was placed over the north-bound outside lane. Since the FWD data were collected prior to the overlay, the surface lift height was removed from the overall core thickness. There were no available mileposts so the test locations were recorded every 500 feet from a known loca-tion. The southbound section began just north of the intersec-tion of Main Street and Calumet Avenue, while the northbound section began at the intersection of 45th Avenue and Calumet Avenue. The FWD analysis can be found in Figure 1.A.3 and Figure 1.A.4. The average SNeff are similar for the north- and southbound lanes, but the Mr is higher for the northbound lane.
Michigan
The FWD data were collected by NCAT on July 21, 2010. The HMA and the warm mix technology Advera were placed on the surface prior to testing. The Evotherm® section was tested on the intermediate layer. The surface lift height was
A P P E N D I X
Falling Weight Deflectometer Testing
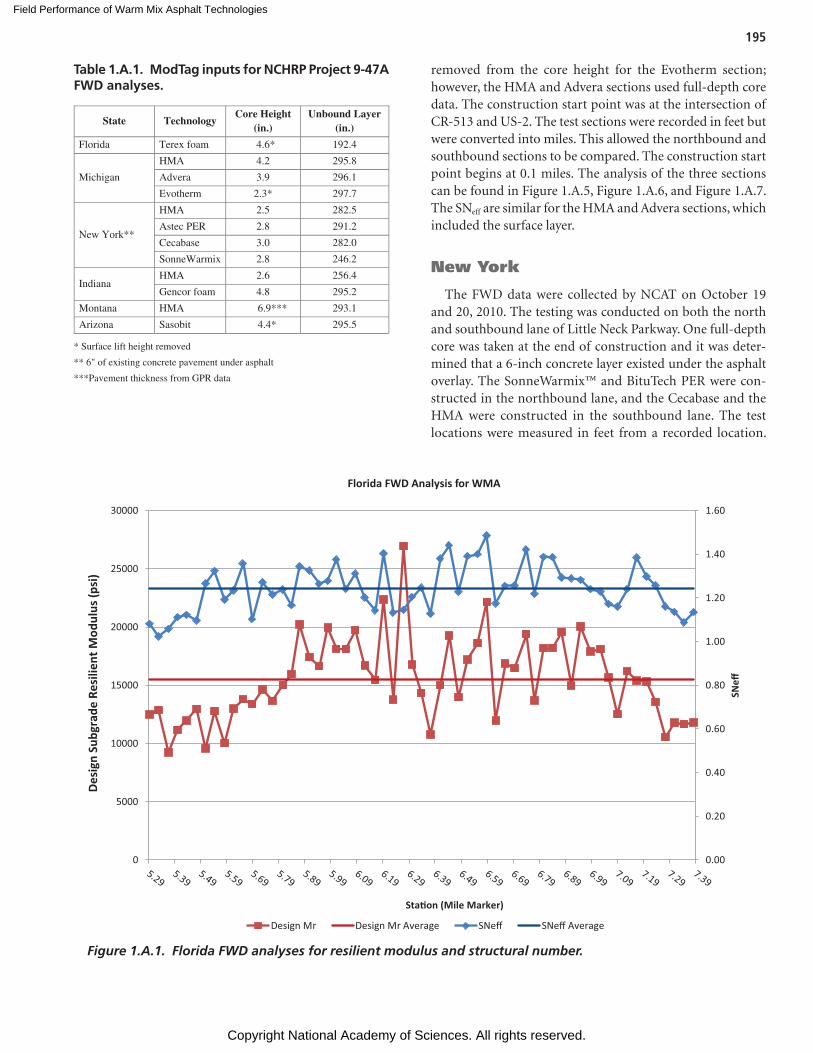
Field Performance of Warm Mix Asphalt Technologies
Copyright National Academy of Sciences. All rights reserved.
195
removed from the core height for the Evotherm section; however, the HMA and Advera sections used full-depth core data. The construction start point was at the intersection of CR-513 and US-2. The test sections were recorded in feet but were converted into miles. This allowed the northbound and southbound sections to be compared. The construction start point begins at 0.1 miles. The analysis of the three sections can be found in Figure 1.A.5, Figure 1.A.6, and Figure 1.A.7. The SNeff are similar for the HMA and Advera sections, which included the surface layer.
New York
The FWD data were collected by NCAT on October 19 and 20, 2010. The testing was conducted on both the north and southbound lane of Little Neck Parkway. One full-depth core was taken at the end of construction and it was deter-mined that a 6-inch concrete layer existed under the asphalt overlay. The SonneWarmix™ and BituTech PER were con-structed in the northbound lane, and the Cecabase and the HMA were constructed in the southbound lane. The test locations were measured in feet from a recorded location.
State Technology Core Height
(in.) Unbound Layer
(in.)
Florida Terex foam 4.6* 192.4
Michigan
HMA 4.2 295.8
Advera 3.9 296.1
Evotherm 2.3* 297.7
New York**
HMA 2.5 282.5
Astec PER 2.8 291.2
Cecabase 3.0 282.0
SonneWarmix 2.8 246.2
Indiana HMA 2.6 256.4
Gencor foam 4.8 295.2
Montana HMA 6.9*** 293.1
Arizona Sasobit 4.4* 295.5
* Surface lift height removed
** 6" of existing concrete pavement under asphalt
***Pavement thickness from GPR data
Table 1.A.1. ModTag inputs for NCHRP Project 9-47A FWD analyses.
0.00
0.20
0.40
0.60
0.80
1.00
1.20
1.40
1.60
0
5000
10000
15000
20000
25000
30000
SNeff
Desi
gn S
ubgr
ade
Resi
lient
Mod
ulus
(psi
)
Sta�on (Mile Marker)
Florida FWD Analysis for WMA
Design Mr Design Mr Average SNeff SNeff Average
Figure 1.A.1. Florida FWD analyses for resilient modulus and structural number.
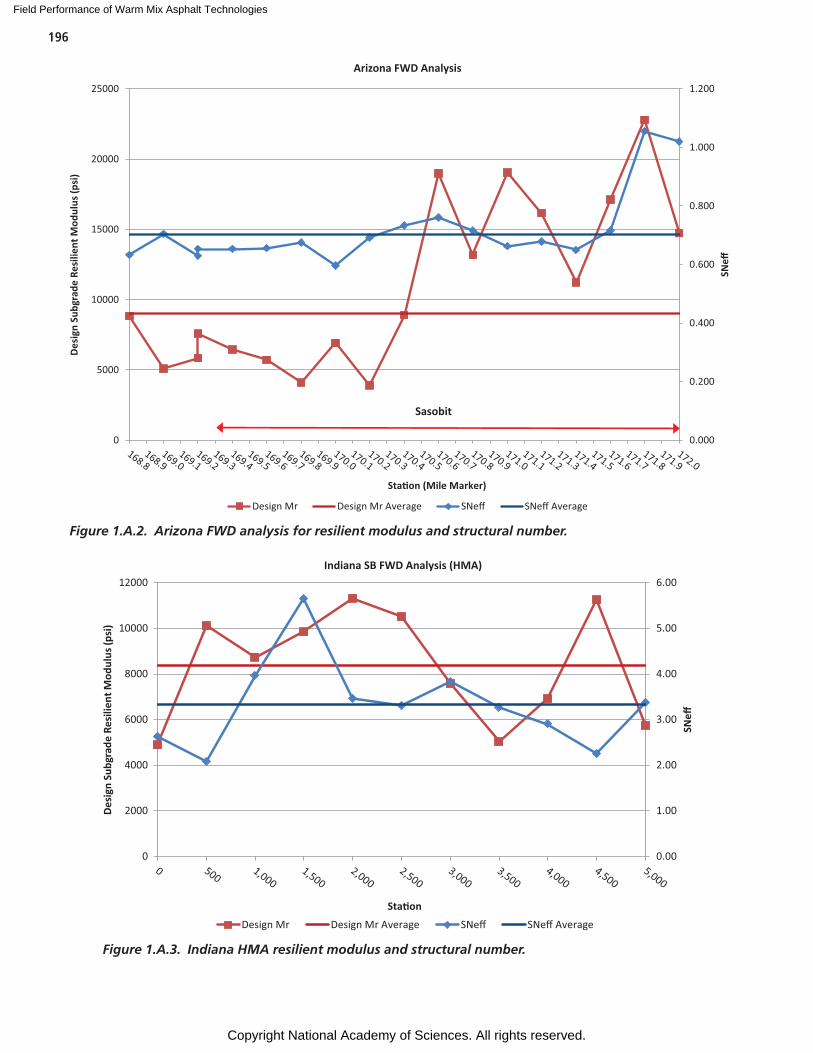
Field Performance of Warm Mix Asphalt Technologies
Copyright National Academy of Sciences. All rights reserved.
196
0.000
0.200
0.400
0.600
0.800
1.000
1.200
0
5000
10000
15000
20000
25000
SNeff
Desi
gn S
ubgr
ade
Resi
lient
Mod
ulus
(psi
)
Sta�on (Mile Marker)
Arizona FWD Analysis
Design Mr Design Mr Average SNeff SNeff Average
Sasobit
Figure 1.A.2. Arizona FWD analysis for resilient modulus and structural number.
0.00
1.00
2.00
3.00
4.00
5.00
6.00
0
2000
4000
6000
8000
10000
12000
SNeff
Desi
gn S
ubgr
ade
Resi
lient
Mod
ulus
(psi
)
Sta�on
Indiana SB FWD Analysis (HMA)
Design Mr Design Mr Average SNeff SNeff Average
Figure 1.A.3. Indiana HMA resilient modulus and structural number.
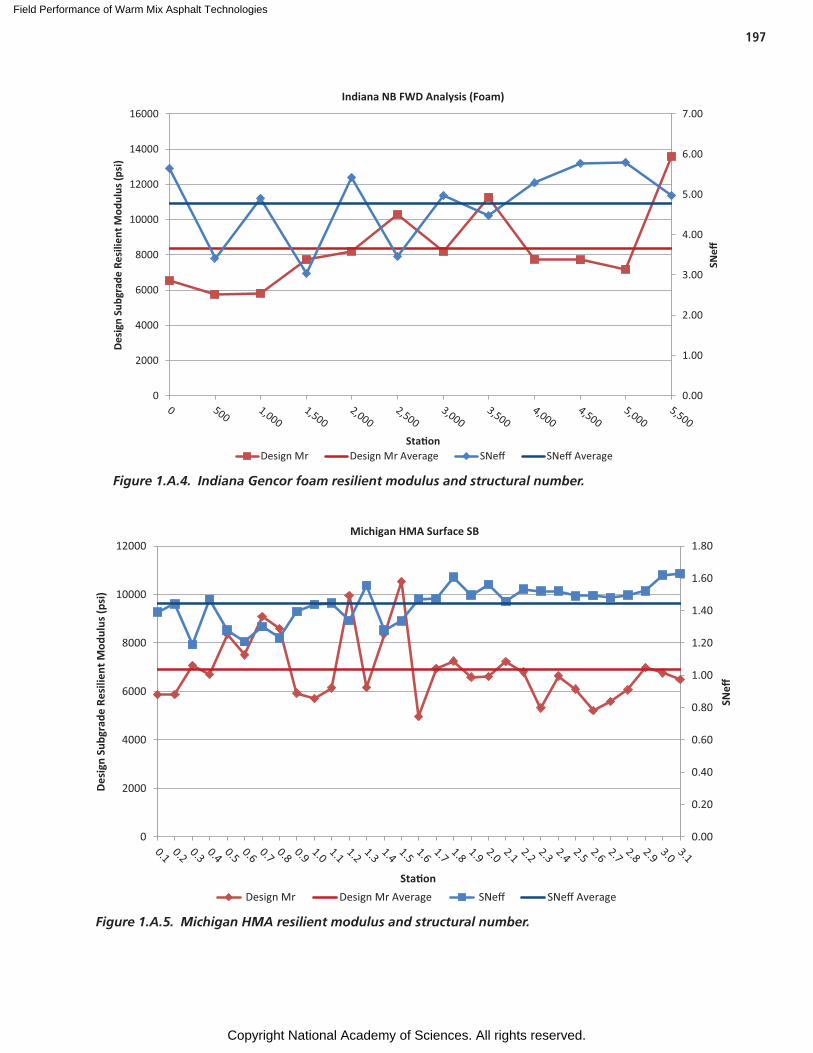
Field Performance of Warm Mix Asphalt Technologies
Copyright National Academy of Sciences. All rights reserved.
197
0.00
1.00
2.00
3.00
4.00
5.00
6.00
7.00
0
2000
4000
6000
8000
10000
12000
14000
16000
SNeff
Desi
gn S
ubgr
ade
Resi
lient
Mod
ulus
(psi
)
Sta�on
Indiana NB FWD Analysis (Foam)
Design Mr Design Mr Average SNeff SNeff Average
Figure 1.A.4. Indiana Gencor foam resilient modulus and structural number.
0.00
0.20
0.40
0.60
0.80
1.00
1.20
1.40
1.60
1.80
0
2000
4000
6000
8000
10000
12000
SNeff
Desi
gn S
ubgr
ade
Resi
lient
Mod
ulus
(psi
)
Sta�on
Michigan HMA Surface SB
Design Mr Design Mr Average SNeff SNeff Average
Figure 1.A.5. Michigan HMA resilient modulus and structural number.
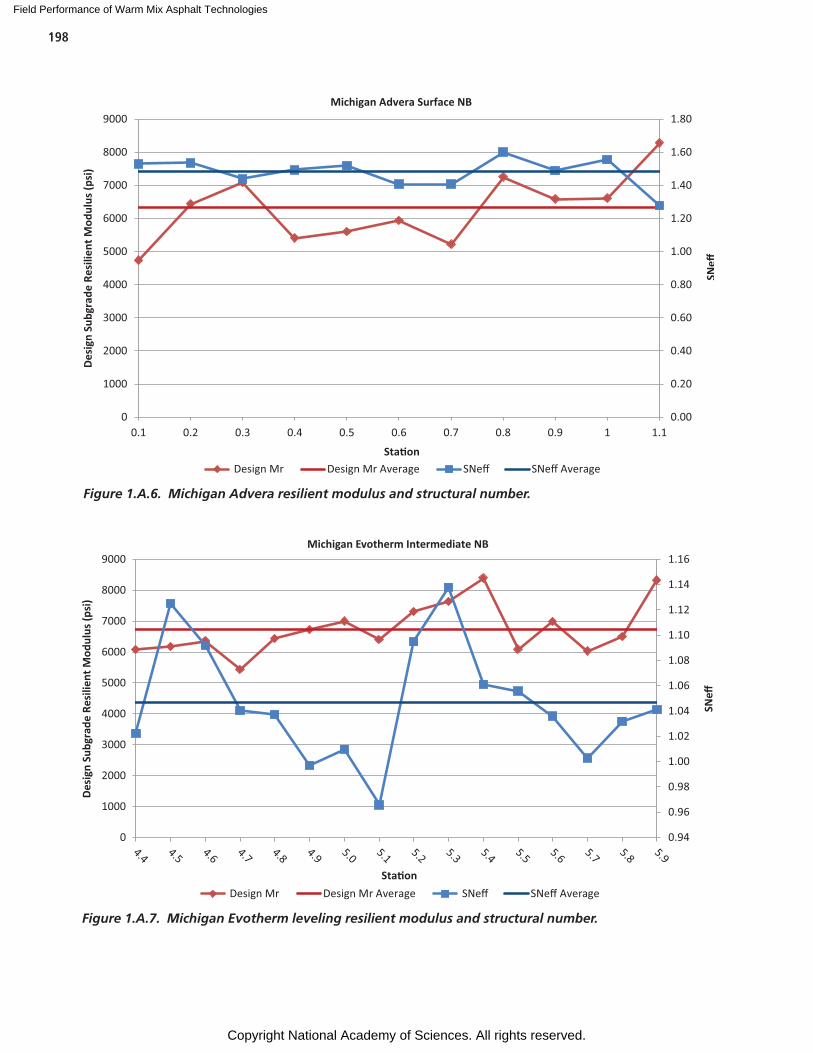
Field Performance of Warm Mix Asphalt Technologies
Copyright National Academy of Sciences. All rights reserved.
198
0.00
0.20
0.40
0.60
0.80
1.00
1.20
1.40
1.60
1.80
0
1000
2000
3000
4000
5000
6000
7000
8000
9000
0.1 0.2 0.3 0.4 0.5 0.6 0.7 0.8 0.9 1 1.1
SNeff
Desi
gn S
ubgr
ade
Resi
lient
Mod
ulus
(psi
)
Sta�on
Michigan Advera Surface NB
Design Mr Design Mr Average SNeff SNeff Average
Figure 1.A.6. Michigan Advera resilient modulus and structural number.
0.94
0.96
0.98
1.00
1.02
1.04
1.06
1.08
1.10
1.12
1.14
1.16
0
1000
2000
3000
4000
5000
6000
7000
8000
9000
SNeff
Desi
gn S
ubgr
ade
Resi
lient
Mod
ulus
(psi
)
Sta�on
Michigan Evotherm Intermediate NB
Design Mr Design Mr Average SNeff SNeff Average
Figure 1.A.7. Michigan Evotherm leveling resilient modulus and structural number.
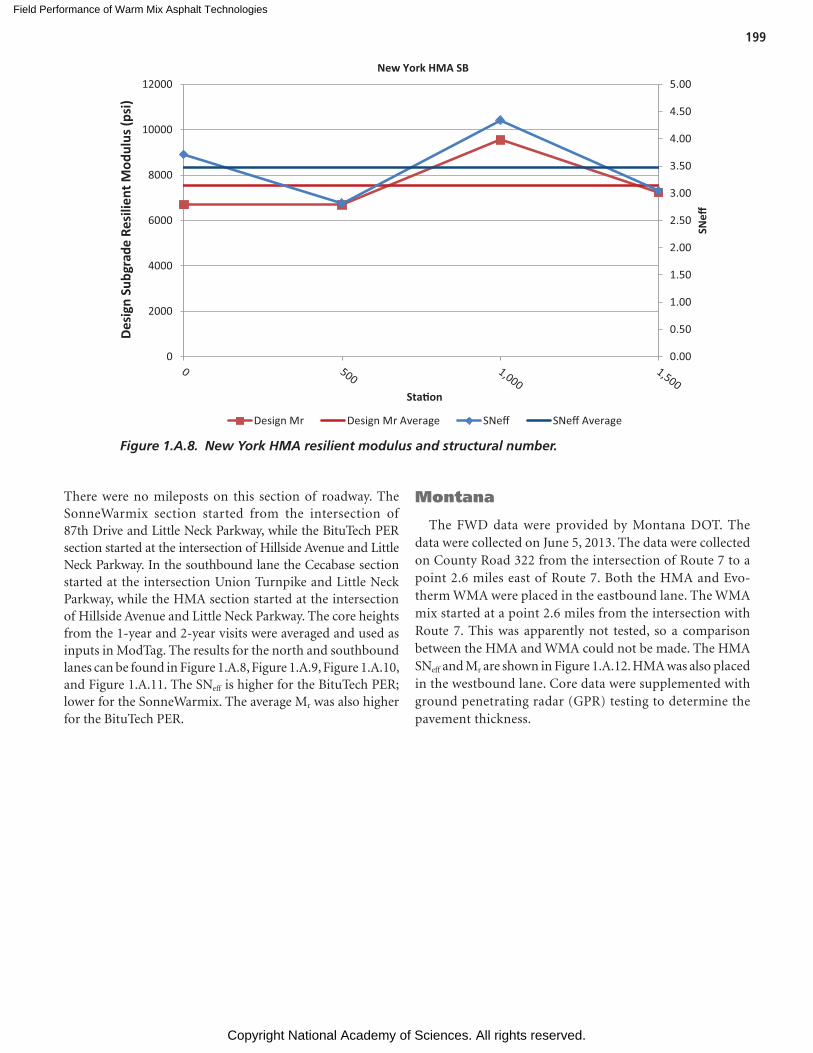
Field Performance of Warm Mix Asphalt Technologies
Copyright National Academy of Sciences. All rights reserved.
199
There were no mileposts on this section of roadway. The SonneWarmix section started from the intersection of 87th Drive and Little Neck Parkway, while the BituTech PER section started at the intersection of Hillside Avenue and Little Neck Parkway. In the southbound lane the Cecabase section started at the intersection Union Turnpike and Little Neck Parkway, while the HMA section started at the intersection of Hillside Avenue and Little Neck Parkway. The core heights from the 1-year and 2-year visits were averaged and used as inputs in ModTag. The results for the north and southbound lanes can be found in Figure 1.A.8, Figure 1.A.9, Figure 1.A.10, and Figure 1.A.11. The SNeff is higher for the BituTech PER; lower for the SonneWarmix. The average Mr was also higher for the BituTech PER.
Montana
The FWD data were provided by Montana DOT. The data were collected on June 5, 2013. The data were collected on County Road 322 from the intersection of Route 7 to a point 2.6 miles east of Route 7. Both the HMA and Evo-therm WMA were placed in the eastbound lane. The WMA mix started at a point 2.6 miles from the intersection with Route 7. This was apparently not tested, so a comparison between the HMA and WMA could not be made. The HMA SNeff and Mr are shown in Figure 1.A.12. HMA was also placed in the westbound lane. Core data were supplemented with ground penetrating radar (GPR) testing to determine the pavement thickness.
0.00
0.50
1.00
1.50
2.00
2.50
3.00
3.50
4.00
4.50
5.00
0
2000
4000
6000
8000
10000
12000
SNeff
Desi
gn S
ubgr
ade
Resi
lient
Mod
ulus
(psi
)
Sta�on
New York HMA SB
Design Mr Design Mr Average SNeff SNeff Average
Figure 1.A.8. New York HMA resilient modulus and structural number.
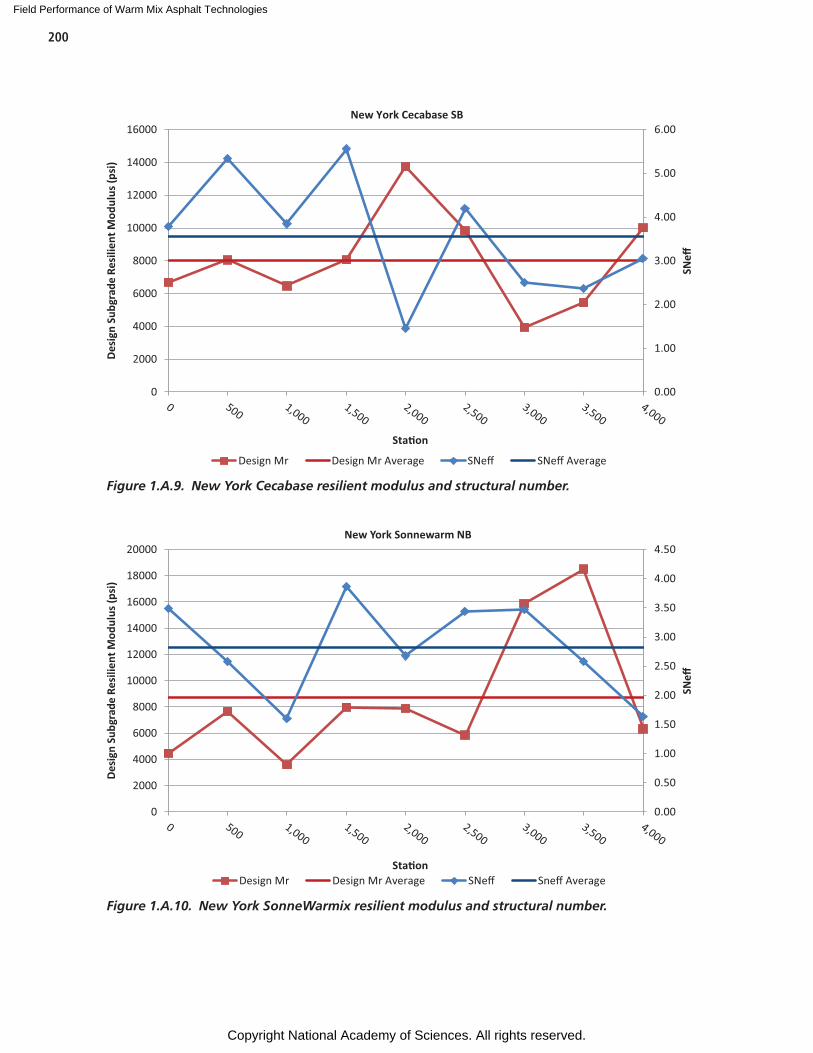
Field Performance of Warm Mix Asphalt Technologies
Copyright National Academy of Sciences. All rights reserved.
200
0.00
1.00
2.00
3.00
4.00
5.00
6.00
0
2000
4000
6000
8000
10000
12000
14000
16000
SNeff
Desi
gn S
ubgr
ade
Resi
lient
Mod
ulus
(psi
)
Sta�on
New York Cecabase SB
Design Mr Design Mr Average SNeff SNeff Average
Figure 1.A.9. New York Cecabase resilient modulus and structural number.
0.00
0.50
1.00
1.50
2.00
2.50
3.00
3.50
4.00
4.50
0
2000
4000
6000
8000
10000
12000
14000
16000
18000
20000
SNeff
Desi
gn S
ubgr
ade
Resi
lient
Mod
ulus
(psi
)
Sta�on
New York Sonnewarm NB
Design Mr Design Mr Average SNeff Sneff Average
Figure 1.A.10. New York SonneWarmix resilient modulus and structural number.
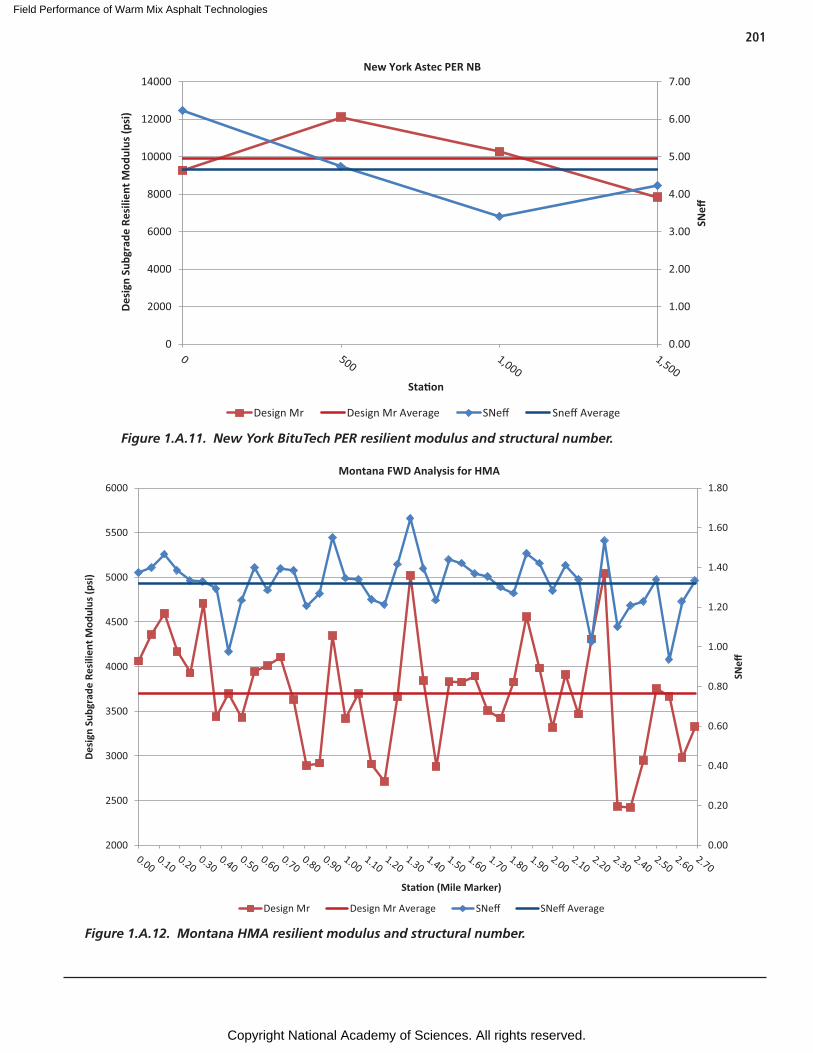
Field Performance of Warm Mix Asphalt Technologies
Copyright National Academy of Sciences. All rights reserved.
201
0.00
1.00
2.00
3.00
4.00
5.00
6.00
7.00
0
2000
4000
6000
8000
10000
12000
14000
SNeff
Desi
gn S
ubgr
ade
Resi
lient
Mod
ulus
(psi
)
Sta�on
New York Astec PER NB
Design Mr Design Mr Average SNeff Sneff Average
Figure 1.A.11. New York BituTech PER resilient modulus and structural number.
0.00
0.20
0.40
0.60
0.80
1.00
1.20
1.40
1.60
1.80
2000
2500
3000
3500
4000
4500
5000
5500
6000
SNeff
Desi
gn S
ubgr
ade
Resi
lient
Mod
ulus
(psi
)
Sta�on (Mile Marker)
Montana FWD Analysis for HMA
Design Mr Design Mr Average SNeff SNeff Average
Figure 1.A.12. Montana HMA resilient modulus and structural number.
Field Performance of Warm Mix Asphalt Technologies
Copyright National Academy of Sciences. All rights reserved.
Effects of WMA on Plant Energy and Emissions and Worker Exposures to Respirable Fumes
P A R T 2
Field Performance of Warm Mix Asphalt Technologies
Copyright National Academy of Sciences. All rights reserved.
205
Interest in the use of warm mix asphalt (WMA) has grown faster than any other new asphalt technology of the past sev-eral decades. WMA technologies allow the complete coating of aggregates, placement, and compaction at lower temperatures than conventional hot mix asphalt (HMA).
Although the reduction in temperature varies by technol-ogy, WMA is generally produced at temperatures ranging from 25°F lower than HMA to the approximate boiling point of water (212°F). Simply put, these technologies are work-ability and compaction aids.
Benefits of WMA may include reduced emissions, reduced fuel usage, reduced binder oxidation, and paving benefits such as the potential for increased densities, cool-weather paving, and longer haul distances. These purported benefits need to be better documented. Although most aspects of designing and constructing WMA are similar to HMA, lower produc-tion temperatures and binder modifications associated with some WMA technologies could result in differences in pave-ment performance relative to HMA. Regardless of the benefits of WMA, if WMA pavements do not perform as well as HMA, the benefits are likely negated.
Differences in material properties of WMA compared to HMA may indicate potential problems with field perfor-mance of WMA pavement. Reduced oxidation of the binder may improve the cracking resistance of a pavement but may reduce its moisture and rutting resistance. Reduced oxida-tion and better compactability of WMA may allow for higher percentages of reclaimed asphalt pavement (RAP); however, the lower mixing temperatures may not facilitate the initial extent of blending of the aged and virgin binder typically seen with HMA.
Additional guidance for producing and constructing WMA is needed. Numerous laboratory studies have attempted to demonstrate the extent to which mixing and compaction temperatures can be reduced. However, densification of the
mix at a lower temperature is not the only factor that should be considered when selecting production temperatures. Flow through the plant and associated motor amperage draws also need to be considered when selecting mixing temperatures. Properly tuned burners will affect fuel combustion and the resulting emissions at lower burner settings.
The first three objectives of NCHRP Project 09-47A are addressed in Part 1 of NCHRP Report 779. The fourth objective—to document the relative energy usage, emissions, and fume exposure for WMA compared to conventional HMA—is addressed in Part 2.
Experimental Plan
To collect the necessary data to satisfy Objective 4, the research team worked with several state highway agencies and contractors to identify appropriate field projects. The desire was to obtain plant energy, plant emissions, and field respirable fume data from several projects that included differences in plant configurations, environmental condi-tions, and WMA technologies. Three projects that included multiple WMA technologies and control HMA mixes were selected to allow for comparisons of the most important energy and emissions measurements without confounding of other factors. The three multiple WMA technology sites were located in Rapid River, Michigan, Munster, Indiana, and New York, New York. The Indiana and New York proj-ects were also used to collect data on the breathing-zone exposure to asphalt fumes for the paving crews. Limited energy usage audits were also conducted at three other WMA projects where a corresponding HMA control mix was also produced. For each project, the WMA mixes were produced with the same mix design as the corresponding HMA. Table 2.1 shows basic information for the projects used in this part of the study.
C H A P T E R 1
Background and Problem Statement

Field Performance of Warm Mix Asphalt Technologies
Copyright National Academy of Sciences. All rights reserved.
206
Date Project Location Plant Site and Description Mixes
July 19–21, 2010 County Road 513, Rapid River, Michigan
Escanaba, Michigan, uninsulated parallel-flow drum
HMA, Advera, Evotherm 3G
Sept. 14–15, 2010 Calumet Avenue, Munster, Indiana
Griffith, Indiana, insulated counter-flow dryer
HMA, Gencor Foam, Evotherm 3G, Heritage Wax
Oct. 19–22, 2010 Little Neck Parkway,New York City,
New York
New York City, New York, batch plant with mini drum
uninsulated dryer
HMA, Cecabase RT,SonneWarmix, BituTech PER
April 19–20, 2010 US-12 near Walla Walla, Washington
Walla Walla, Washington, portable plant, uninsulated
parallel-flow drum
HMA, Maxam Foam
June 21–22, 2010 I-66 eastbound, near Centreville, Virginia
Centreville, Virginia, double barrel, counter-flow
HMA, Astec Foam
Aug. 11–12, 2010 Montana Route 322,south of Baker, Montana
Baker, Montana, partially insulated parallel-flow drum
HMA, EvothermDAT
Table 2.1. Project information summary.
Field Performance of Warm Mix Asphalt Technologies
Copyright National Academy of Sciences. All rights reserved.
207
Background on Energy Used to Produce HMA and WMA
Asphalt mixtures are produced by drying aggregate particles and mixing the dry aggregate with an asphalt binder at a tem-perature sufficient to (1) coat the aggregates and (2) allow the mixture to be properly compacted after silo storage, haul, and placement. Aggregates start at ambient temperature with mois-ture contents that vary depending on how they are produced and stored, and on the local weather conditions. The aggregate is heated in the dryer drum for a batch plant or the beginning portion of the drum for a drum plant. The fine aggregate tends to be heated by convection while showering through the hot exhaust gases. The coarse aggregate is primarily heated by conduction from the fine aggregate while lying in the bottom of the dryer. A significant amount of energy is required to turn water into steam or otherwise dry the aggregate. Theoretically, the temperature of the aggregate cannot increase above 212°F (100°C) until the aggregate is dry. Particles of different sizes will dry at different rates because of differences in their spe-cific surface (smaller particles have more surface area per unit volume), so the temperature of the aggregate particles of dif-ferent sizes is unlikely to be uniform. Once the aggregate is dry, continued heating will bring the aggregate to the mixing temperature. The energy used to dry, and then heat, aggregate is illustrated in Figure 2.1.
Figure 2.2 shows a frequency distribution of fuel usage based on data collected by a member of the research team in the Mid-Atlantic states. Data were collected from both batch plants and drum plants. Fuel types include natu-ral gas, No. 2 fuel oil, and reclaimed oil. Two distributions are shown, one for data collected during stack emissions tests at 35 plants and another based on 2-year averages at the same plants. Typically, plants were operating at maxi-mum design capacity for the full 3 hours of stack emis-sion tests. The 2-year average values, however, include fuel used during plant warm-up, plant waste, for unsold mix,
and during cleanout. The stack test data indicate drying and heating fuel usage for hot mix asphalt (HMA) aver-age 0.233 MMBtu/ton (million British thermal units). By comparison, fuel usage based on year-end production totals averages 0.249 MMBtu/ton, indicating 6.9% waste compared to steady-state production. This inherent differ-ence between energy use during steady-state operation and historical averages demonstrates that comparisons between HMA and warm mix asphalt (WMA) must be based on identical time intervals to be meaningful.
Reduced fuel consumption saves natural resources and cost. Theoretical calculations indicate that a temperature reduction of 50°F (28°C) should result in a fuel savings of 11% (Cevarich 2007). Fuel savings reported from early European WMA projects ranged from 24% to 55% (Koenders et al. 2000, von Devivere et al. 2003, and Ventura et al. 2009), with typical values between 20% and 35% (D’Angelo et al. 2007).
Fuel savings and stack emissions data were collected from several North American studies. Reported fuel savings from fifteen WMA projects, representing six technologies, range from a 15.4% increase to a 77% reduction (Harder 2008, Davidson 2005a, Davidson 2005b, Lecomte et al. 2007, Chief Environmental Group N.D., ETE 2006, Powers 2009, Ventura et al. 2009, Davidson and Pedlow 2007, and Middle-ton and Forfylow 2009). The average fuel savings was 23%. The lone increase occurred at the Ohio WMA Open House with an emulsion technology that is no longer used. The mix was produced at 277°F (136°C), which is high for that technology considering considerable energy was required to vaporize the water in the emulsion. Larger fuel savings typi-cally occurred with technologies like Low Emission Asphalt (LEA), WAM-Foam (Warm Asphalt Mix), and in some cases Evotherm™ ET (Emulsion Technology), which tend to have the lowest production temperatures. LEA and WAM-Foam production temperatures are usually close to 212°F (100°C). Casing losses and other inefficiencies are believed to account
C H A P T E R 2
Energy Usage
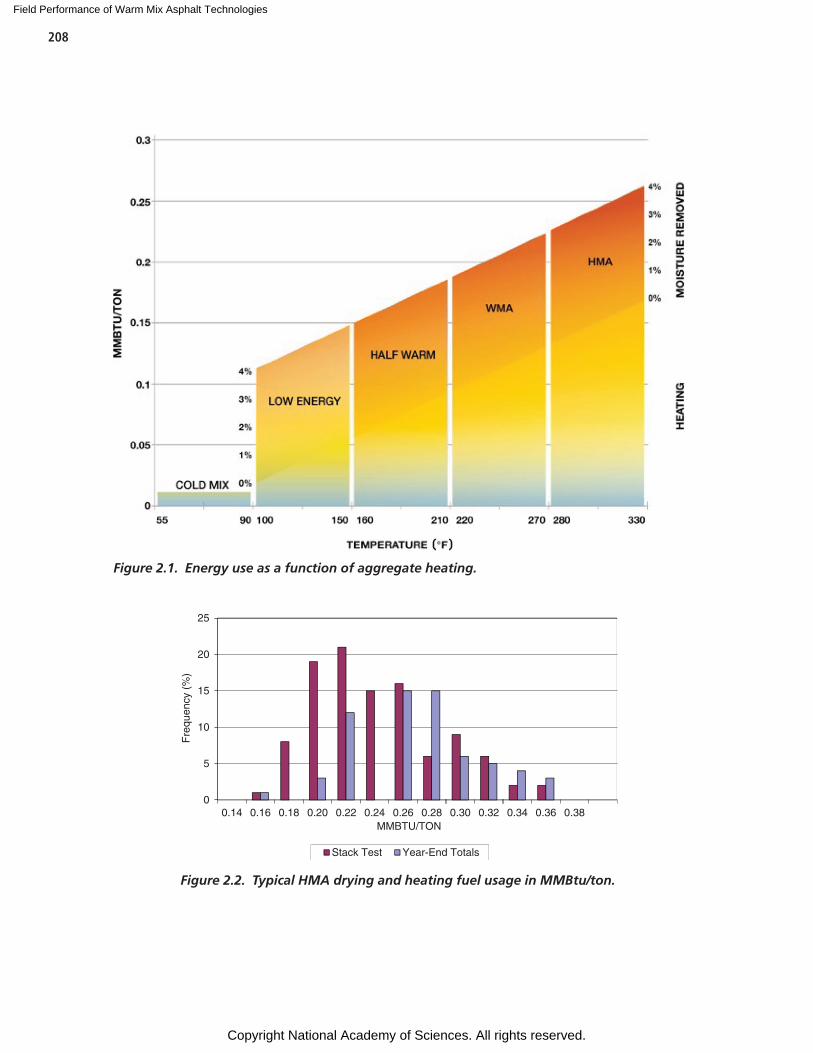
Field Performance of Warm Mix Asphalt Technologies
Copyright National Academy of Sciences. All rights reserved.
208
Figure 2.1. Energy use as a function of aggregate heating.
0
5
10
15
20
25
0.14 0.16 0.18 0.20 0.22 0.24 0.26 0.28 0.30 0.32 0.34 0.36 0.38
Fre
quen
cy (
%)
MMBTU/TON
Stack Test Year-End Totals
Figure 2.2. Typical HMA drying and heating fuel usage in MMBtu/ton.
Field Performance of Warm Mix Asphalt Technologies
Copyright National Academy of Sciences. All rights reserved.
209
for some of the difference between theoretical and observed fuel savings (Harder et al. 2008).
Asphalt plants use higher burner levels when producing HMA than when producing WMA. Improperly tuned burn-ers can result in incomplete combustion, thus wasting fuel. Elevated levels of carbon monoxide (CO) and volatile organic compounds (VOC) can be indications of incomplete combus-tion. Incomplete combustion, when using fuel oil or recycled oil, can lead to fuel contamination in the mix. Fuel contami-nation was suspected in at least two WMA projects (Hurley et al. 2010a, Hurley et al. 2010b). Fuel contamination may be less evident with HMA as compared to WMA because higher mix temperatures would tend to volatize the fuel prior to placement.
The moisture contents of aggregate and recycled materi-als stockpiles can have a significant effect on fuel consump-tion when producing WMA or HMA. This is evidenced by the higher fuel savings for WMA technologies, such as LEA, which only dry a portion of the aggregate. Fuel usage reportedly increases 10% for every 1% increase in stockpile moisture content (Prowell et al. 2012). Best practices, such as sloping stockpile areas away from the side that the loader obtains material to feed the plant or covering stockpiles to reduce the moisture content of materials being dried, are recommended for both HMA and WMA to reduce fuel consumption.
Research Approach
Fuel usage depends on a number of factors including, but not limited to, aggregate (and recycled materials, if used), mois-ture content, production rate, mix temperature, and excess air (damper setting). For NCHRP Project 9-47A, data collection forms were developed to collect information on plant energy usage, including the above factors, during production (see the appendix). As noted in the background information, energy usage will vary depending on whether measurements are taken over a steady-state operating period, such as during a stack emissions test, or over a longer period of operation such as a day, week, or year which includes energy spent for start-up, clean out, or waste.
The participating contractors were requested to tune their plants’ burners before producing asphalt for NCHRP Proj-ect 9-47A. For the three projects where stack emissions tests were performed, at Rapid River, Michigan, Griffith, Indiana, and New York, New York, burner tuning was conducted by a member of the project team with expertise in this topic. Most burners have an actuator motor that drives a mechanical link-age connected to dampers and modulating fuel valves. As the burner percentage is increased, dampers and fuel valves are opened to increase air and fuel for combustion. It can be dif-
ficult to properly adjust the burner to maintain the optimum fuel-to-air ratio over the whole firing range without appropri-ate gas analyzers. If excess fuel is introduced to increase pro-duction rate, incomplete combustion will occur, wasting fuel. One plant showed a 24.8% reduction in fuel usage for HMA after burner tuning.
Different plants use different fuels for heating and dry-ing aggregate. Natural gas was the most common fuel type; reclaimed fuel oil and liquid propane were also used. For plants using natural gas, data collection was based on gas meter readings. Cumulative production tonnage was collected at approximately the same time that the meter readings were taken. After collecting the data, it was found that commercial gas meters only update periodically and therefore cannot be used for accurate measurements of fuel usage over short-term periods (see further discussion in the chapter summary).
The Rapid River, Michigan, project used reclaimed motor oil as fuel. The Rapid River plant did not have a fuel meter, so fuel consumption was calculated using tank charts and tanks sticks at the beginning and end of production. The Baker, Montana, project used liquid propane (LP). Fuel usage for the LP was based on percent tank volume. The Griffith, Indi-ana, New York, New York, Centreville, Virginia, and Walla Walla, Washington, projects used natural gas as burner fuel. Measurements for those projects were made based on gas meter readings.
Unfortunately, precision of direct fuel measurements was questionable for a number of reasons and an alternative method to determine average heat input was investigated. Stack emission tests were conducted at Rapid River, Michi-gan, Griffith, Indiana, and New York, New York, sites with flow rate and composition of the exhaust gases measured continuously for two 1-hour runs on each WMA technology and HMA control. These stack gas data enabled backcalcula-tion of average heat input using the U.S. EPA’s Method 19 F factor. EPA developed F factors for commercially available fuels to calculate the stoichiometric volume of exhaust gases generated by burning one MMBtu of fuel. For example, burning 961 cubic feet of natural gas (1 MMBtu) results in 8,710 dry standard cubic feet of (exhaust) gas at 0% oxy-gen. Zero percent oxygen is what makes it a stoichiometric volume.
Stack gas velocity was measured according to EPA Method 2. Molecular weight of stack gas and water vapor in the gas stream were measured using EPA Methods 3 and 4, respectively. Carbon dioxide (CO2) and oxygen (O2) concentrations were also determined using EPA Method 3. Stack gas velocity was converted to dry volumetric flow rate at a standard temperature and pressure based on stack area and percent water vapor in exhaust gases. These calculations are typically provided in any stack test report.
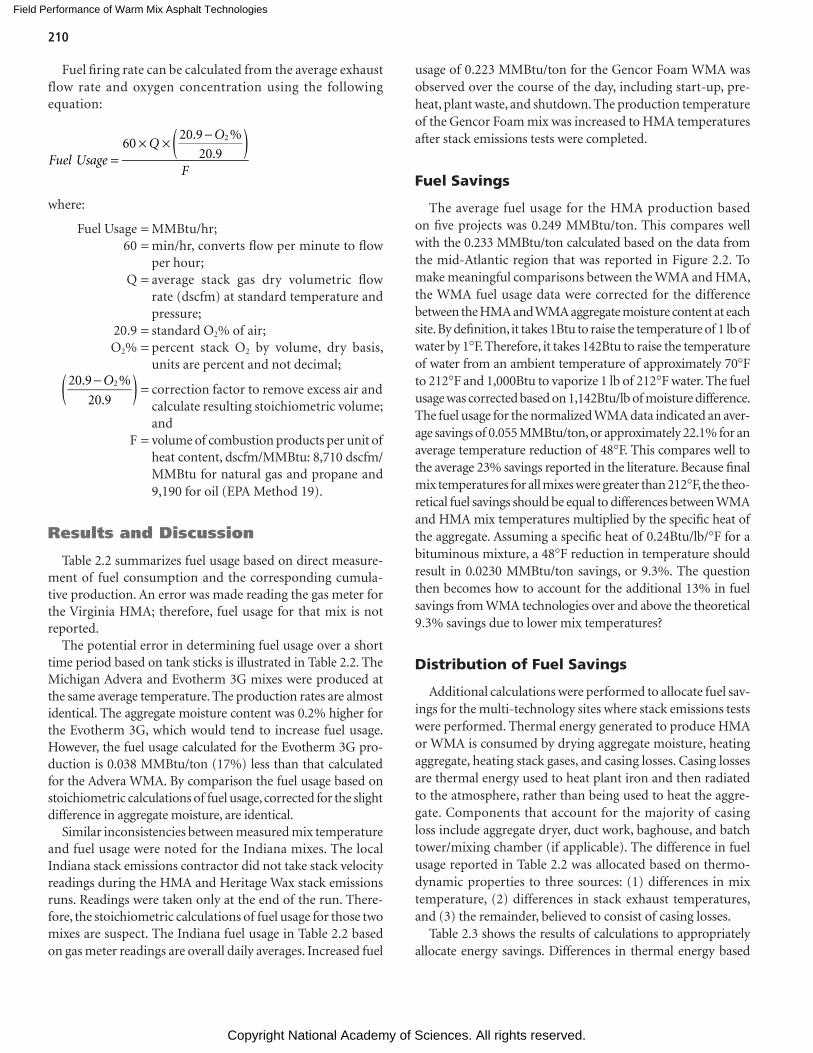
Field Performance of Warm Mix Asphalt Technologies
Copyright National Academy of Sciences. All rights reserved.
210
Fuel firing rate can be calculated from the average exhaust flow rate and oxygen concentration using the following equation:
( )=
× × −60
20.9 %
20.92
Fuel UsageQ
O
F
where:
Fuel Usage = MMBtu/hr; 60 = min/hr, converts flow per minute to flow
per hour; Q = average stack gas dry volumetric flow
rate (dscfm) at standard temperature and pressure;
20.9 = standard O2% of air; O2% = percent stack O2 by volume, dry basis,
units are percent and not decimal;
( )−20.9 %
20.92O
= correction factor to remove excess air and calculate resulting stoichiometric volume;
and F = volume of combustion products per unit of
heat content, dscfm/MMBtu: 8,710 dscfm/MMBtu for natural gas and propane and 9,190 for oil (EPA Method 19).
Results and Discussion
Table 2.2 summarizes fuel usage based on direct measure-ment of fuel consumption and the corresponding cumula-tive production. An error was made reading the gas meter for the Virginia HMA; therefore, fuel usage for that mix is not reported.
The potential error in determining fuel usage over a short time period based on tank sticks is illustrated in Table 2.2. The Michigan Advera and Evotherm 3G mixes were produced at the same average temperature. The production rates are almost identical. The aggregate moisture content was 0.2% higher for the Evotherm 3G, which would tend to increase fuel usage. However, the fuel usage calculated for the Evotherm 3G pro-duction is 0.038 MMBtu/ton (17%) less than that calculated for the Advera WMA. By comparison the fuel usage based on stoichiometric calculations of fuel usage, corrected for the slight difference in aggregate moisture, are identical.
Similar inconsistencies between measured mix temperature and fuel usage were noted for the Indiana mixes. The local Indiana stack emissions contractor did not take stack velocity readings during the HMA and Heritage Wax stack emissions runs. Readings were taken only at the end of the run. There-fore, the stoichiometric calculations of fuel usage for those two mixes are suspect. The Indiana fuel usage in Table 2.2 based on gas meter readings are overall daily averages. Increased fuel
usage of 0.223 MMBtu/ton for the Gencor Foam WMA was observed over the course of the day, including start-up, pre-heat, plant waste, and shutdown. The production temperature of the Gencor Foam mix was increased to HMA temperatures after stack emissions tests were completed.
Fuel Savings
The average fuel usage for the HMA production based on five projects was 0.249 MMBtu/ton. This compares well with the 0.233 MMBtu/ton calculated based on the data from the mid-Atlantic region that was reported in Figure 2.2. To make meaningful comparisons between the WMA and HMA, the WMA fuel usage data were corrected for the difference between the HMA and WMA aggregate moisture content at each site. By definition, it takes 1Btu to raise the temperature of 1 lb of water by 1°F. Therefore, it takes 142Btu to raise the temperature of water from an ambient temperature of approximately 70°F to 212°F and 1,000Btu to vaporize 1 lb of 212°F water. The fuel usage was corrected based on 1,142Btu/lb of moisture difference. The fuel usage for the normalized WMA data indicated an aver-age savings of 0.055 MMBtu/ton, or approximately 22.1% for an average temperature reduction of 48°F. This compares well to the average 23% savings reported in the literature. Because final mix temperatures for all mixes were greater than 212°F, the theo-retical fuel savings should be equal to differences between WMA and HMA mix temperatures multiplied by the specific heat of the aggregate. Assuming a specific heat of 0.24Btu/lb/°F for a bituminous mixture, a 48°F reduction in temperature should result in 0.0230 MMBtu/ton savings, or 9.3%. The question then becomes how to account for the additional 13% in fuel savings from WMA technologies over and above the theoretical 9.3% savings due to lower mix temperatures?
Distribution of Fuel Savings
Additional calculations were performed to allocate fuel sav-ings for the multi-technology sites where stack emissions tests were performed. Thermal energy generated to produce HMA or WMA is consumed by drying aggregate moisture, heating aggregate, heating stack gases, and casing losses. Casing losses are thermal energy used to heat plant iron and then radiated to the atmosphere, rather than being used to heat the aggre-gate. Components that account for the majority of casing loss include aggregate dryer, duct work, baghouse, and batch tower/mixing chamber (if applicable). The difference in fuel usage reported in Table 2.2 was allocated based on thermo-dynamic properties to three sources: (1) differences in mix temperature, (2) differences in stack exhaust temperatures, and (3) the remainder, believed to consist of casing losses.
Table 2.3 shows the results of calculations to appropriately allocate energy savings. Differences in thermal energy based
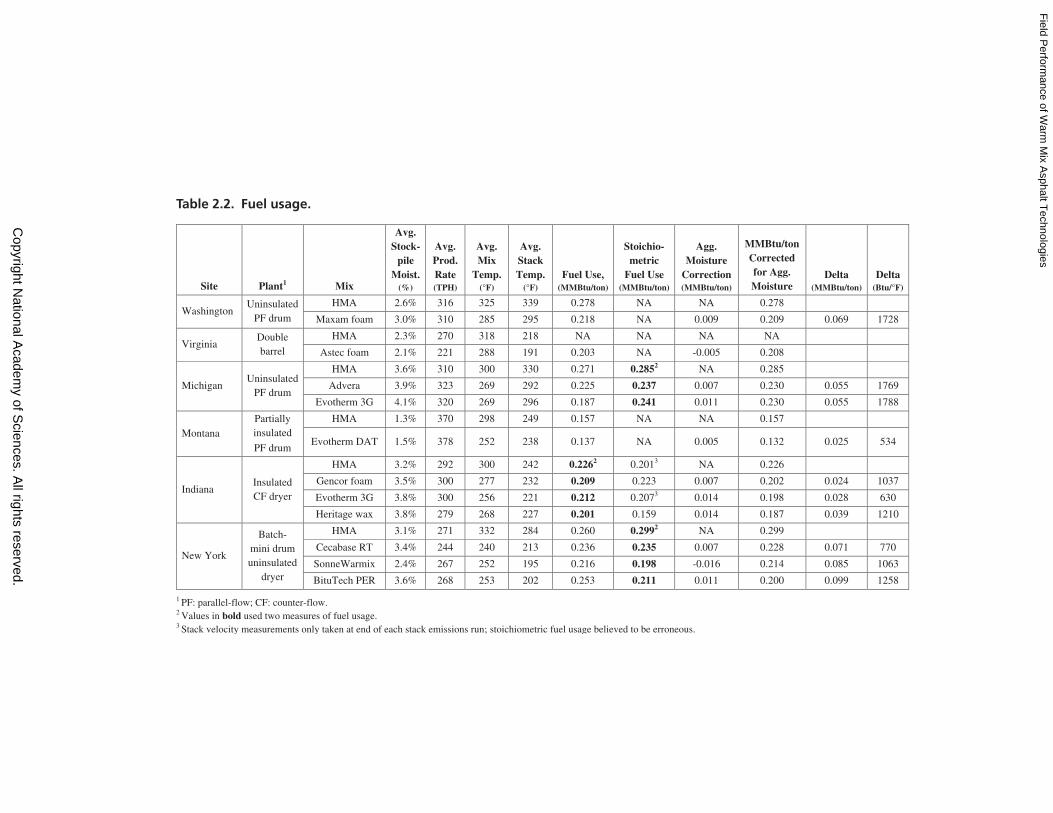
Field P
erformance of W
arm M
ix Asphalt T
echnologies
Copyright N
ational Academ
y of Sciences. A
ll rights reserved.
Site Plant1 Mix
Avg. Stock-
pile Moist.
(%)
Avg. Prod. Rate (TPH)
Avg. Mix
Temp. (°F)
Avg. Stack Temp.
(°F)Fuel Use,
(MMBtu/ton)
Stoichio- metric
Fuel Use(MMBtu/ton)
Agg. Moisture
Correction(MMBtu/ton)
MMBtu/tonCorrected for Agg. Moisture
Delta (MMBtu/ton)
Delta (Btu/°F)
WashingtonUninsulated
PF drum
HMA 2.6% 316 325 339 0.278 NA NA 0.278
Maxam foam 3.0% 310 285 295 0.218 NA 0.009 0.209 0.069 1728
VirginiaDouble barrel
HMA 2.3% 270 318 218 NA NA NA NA
Astec foam 2.1% 221 288 191 0.203 NA -0.005 0.208
MichiganUninsulated
PF drum
HMA 3.6% 310 300 330 0.271 0.2852 NA 0.285
Advera 3.9% 323 269 292 0.225 0.237 0.007 0.230 0.055 1769
Evotherm 3G 4.1% 320 269 296 0.187 0.241 0.011 0.230 0.055 1788
MontanaPartiallyinsulated
PF drum
HMA 1.3% 370 298 249 0.157 NA NA 0.157
Evotherm DAT 1.5% 378 252 238 0.137 NA 0.005 0.132 0.025 534
IndianaInsulated CF dryer
HMA 3.2% 292 300 242 0.2262 0.2013 NA 0.226
Gencor foam 3.5% 300 277 232 0.209 0.223 0.007 0.202 0.024 1037
Evotherm 3G 3.8% 300 256 221 0.212 0.2073 0.014 0.198 0.028 630
Heritage wax 3.8% 279 268 227 0.201 0.159 0.014 0.187 0.039 1210
New York
Batch- mini drumuninsulated
dryer
HMA 3.1% 271 332 284 0.260 0.2992 NA 0.299
Cecabase RT 3.4% 244 240 213 0.236 0.235 0.007 0.228 0.071 770
SonneWarmix 2.4% 267 252 195 0.216 0.198 -0.016 0.214 0.085 1063
BituTech PER 3.6% 268 253 202 0.253 0.211 0.011 0.200 0.099 1258
1 PF: parallel-flow; CF: counter-flow.2 Values in bold used two measures of fuel usage. 3 Stack velocity measurements only taken at end of each stack emissions run; stoichiometric fuel usage believed to be erroneous.
Table 2.2. Fuel usage.
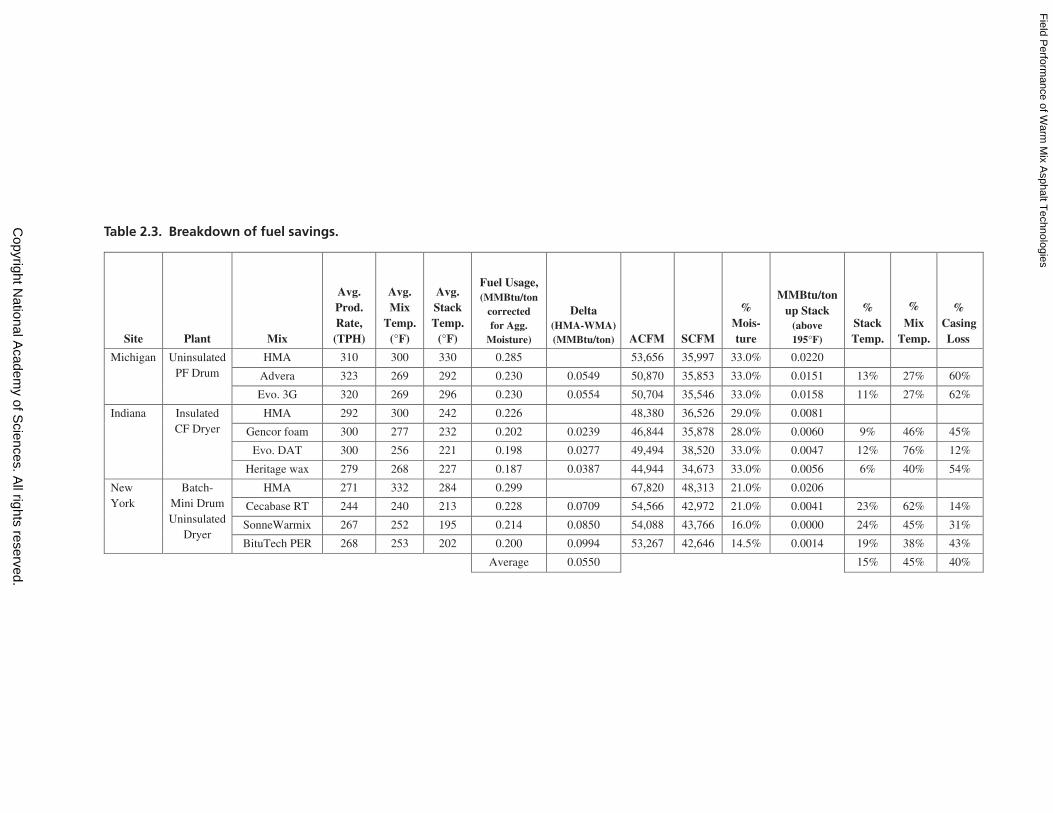
Field P
erformance of W
arm M
ix Asphalt T
echnologies
Copyright N
ational Academ
y of Sciences. A
ll rights reserved.
Site Plant Mix
Avg. Prod. Rate,(TPH)
Avg. Mix
Temp.(°F)
Avg. Stack Temp.
(°F)
Fuel Usage, (MMBtu/ton
corrected for Agg.
Moisture)
Delta (HMA-WMA) (MMBtu/ton) ACFM SCFM
% Mois-ture
MMBtu/ton up Stack
(above 195°F)
% Stack Temp.
% Mix
Temp.
% CasingLoss
Michigan Uninsulated PF Drum
HMA 310 300 330 0.285 53,656 35,997 33.0% 0.0220
Advera 323 269 292 0.230 0.0549 50,870 35,853 33.0% 0.0151 13% 27% 60%
Evo. 3G 320 269 296 0.230 0.0554 50,704 35,546 33.0% 0.0158 11% 27% 62%
Indiana Insulated CF Dryer
HMA 292 300 242 0.226 48,380 36,526 29.0% 0.0081
Gencor foam 300 277 232 0.202 0.0239 46,844 35,878 28.0% 0.0060 9% 46% 45%
Evo. DAT 300 256 221 0.198 0.0277 49,494 38,520 33.0% 0.0047 12% 76% 12%
Heritage wax 279 268 227 0.187 0.0387 44,944 34,673 33.0% 0.0056 6% 40% 54%
New York
Batch- Mini DrumUninsulated
Dryer
HMA 271 332 284 0.299 67,820 48,313 21.0% 0.0206
Cecabase RT 244 240 213 0.228 0.0709 54,566 42,972 21.0% 0.0041 23% 62% 14%
SonneWarmix 267 252 195 0.214 0.0850 54,088 43,766 16.0% 0.0000 24% 45% 31%
BituTech PER 268 253 202 0.200 0.0994 53,267 42,646 14.5% 0.0014 19% 38% 43%
Average 0.0550 15% 45% 40%
Table 2.3. Breakdown of fuel savings.
Field Performance of Warm Mix Asphalt Technologies
Copyright National Academy of Sciences. All rights reserved.
213
on mix temperature were calculated using a specific heat of 0.24Btu/lb/°F for the asphalt mixture. The difference in each pair of average HMA and WMA mix temperatures at each site was multiplied by 0.24Btu/lb/°F, converted to MMBtu, and expressed as a percentage of the difference (delta) in MMBtu/ton, corrected for aggregate moisture. Differences in mix tem-perature (% Mix Temp.) explained 27 to 76% of the fuel savings, with an average of 45%. Actual stack exhaust flow rates in cubic feet per minute (ACFM) were converted to standard conditions at 70°F (SCFM). The energy required to heat the air and mois-ture in the exhaust gas between the minimum observed stack gas temperature of 195°F and the average stack exhaust temper-atures was calculated for each mix (MMBtu/ton up stack). The average stack gas temperature for NY SonneWarmix was 195°F; therefore, its MMBtu/ton up the stack was 0.000. The calcula-tion used a specific heat of 0.44Btu/lb/°F for water vapor and 0.24Btu/lb/°F for dry air. Air at standard conditions has a mass of 0.0766 lb/cf. The difference between the HMA and WMA MMBtu/ton up the stack at a given site (relative to 195°F) was expressed as a percentage of the total delta in energy usage per ton (% Stack Temp.). The remaining unexplained differ-ences in the measured energy use are attributed to casing losses (% Casing Loss). These losses are heat lost through, for exam-ple, the shell of the drum and ductwork.
Harder et al. (2008) reported heat loss measurements at a batch plant producing 320°F mix at an ambient tempera-ture of 59°F of 3 kg fuel oil per metric ton (approximately 0.111 MMBtu/ton). Total fuel usage for HMA production was 7 kg fuel oil per metric ton (approximately 0.259 MMBtu/ton). Therefore, casing losses were 43% (3/7) of total fuel usage. This cannot be directly compared to the NCHRP Project 9-47A data, however, because the units are not identical. Harder’s 43% cas-ing loss factor is for total casing losses while the 40% factor deter-mined in this study is the percent of energy savings from the use of WMA production attributed to reduced casing loss. The two factors have different denominators. Also, the 4 kg of fuel per metric ton appears unrealistic as it represents 0.138 MMBtu/ton. It takes 0.125 MMBtu/ton to heat the aggregate from 59 to 320°F, leaving only 0.013 MMBtu/ton to dry moisture. 0.013 MMBtu/ton is only enough energy to dry 0.25% moisture.
Comparison of Measured and Predicted Fuel Savings
When analysis of the fuel usage data from this study was first presented, some plant manufacturers expressed concern that the calculated casing losses were higher than their theoretical calculations. Astec Industries developed a spreadsheet (Astec Fuel Calculate 3.0) to assist producers in evaluating efficiency of actual operations by calculating energy required to heat aggregate, evaporate stockpile moisture, and heat exhaust gases
from the thermodynamic properties of the materials involved. The Astec spreadsheet was shared with the NCHRP Proj-ect 9-47A team so that comparisons could be made between Astec’s thermodynamic model and empirical data obtained during NCHRP Project 9-47A. The Astec spreadsheet uses the following inputs: plant elevation, drum diameter, asphalt content, recycled (or reclaimed) asphalt pavement (RAP) content, RAP moisture content, burner fuel, burner type, production rate, ambient temperature, aggregate tempera-ture, RAP temperature, mix temperature, stack temperature, and drum type. The spreadsheet then calculates fuel usage for a range of aggregate moisture contents. The formulas used in Astec’s spreadsheet are hidden and password protected, how-ever the thermodynamic properties used in those calculations are well established and were used to back calculate actual casing loss from NCHRP Project 9-47A data.
Figure 2.3 shows a comparison between measured and cal-culated fuel usage for the three projects where stack emissions tests were conducted (Michigan, Indiana, and New York). In two cases out of three, the measured fuel usage, in terms of MMBtu/ton, exceeds Astec’s predicted fuel usage for the tem-peratures and moisture contents measured during production.
Analysis suggests that Astec assumes that 12% of total fuel usage is lost through the plant casing. Figure 2.4 shows a simi-lar comparison between Astec’s calculated fuel usage and the measured fuel usage from this study. However, Astec’s 12% cas-ing loss is replaced by actual backcalculated casing loss for each site. Figure 2.4 shows good agreement with the data when the casing loss is adjusted. It appears that the Astec model generally underestimates casing losses, especially for uninsulated aggre-gate dryers. It should be noted that casing losses will vary from plant to plant, depending on plant type (parallel-flow, counter-flow, double barrel, dual drum, etc.) and level of insulation. For the three plants where stack emission tests were performed, the double barrel type has the lowest casing lost, followed by the parallel-flow type. The counter-flow batch plant with bare steel dryer had the highest casing losses.
The significance of this exercise is that it demonstrates that the energy analysis used in NCHRP Project 9-47A agrees with the Astec thermodynamic model except for casing loss. Astec appears to use a uniform 12% factor to estimate casing loss. Although this appears to be a reasonable assumption for Astec double barrel plants, that factor may not be accurate for other plant types.
Influence of Aggregate Moisture Content
A recommended best practice for both HMA and WMA is to minimize aggregate moisture content. Average aggregate mois-ture content for the Montana project was 1.4%, 1.9% lower than the average moisture content at the other sites. Measured
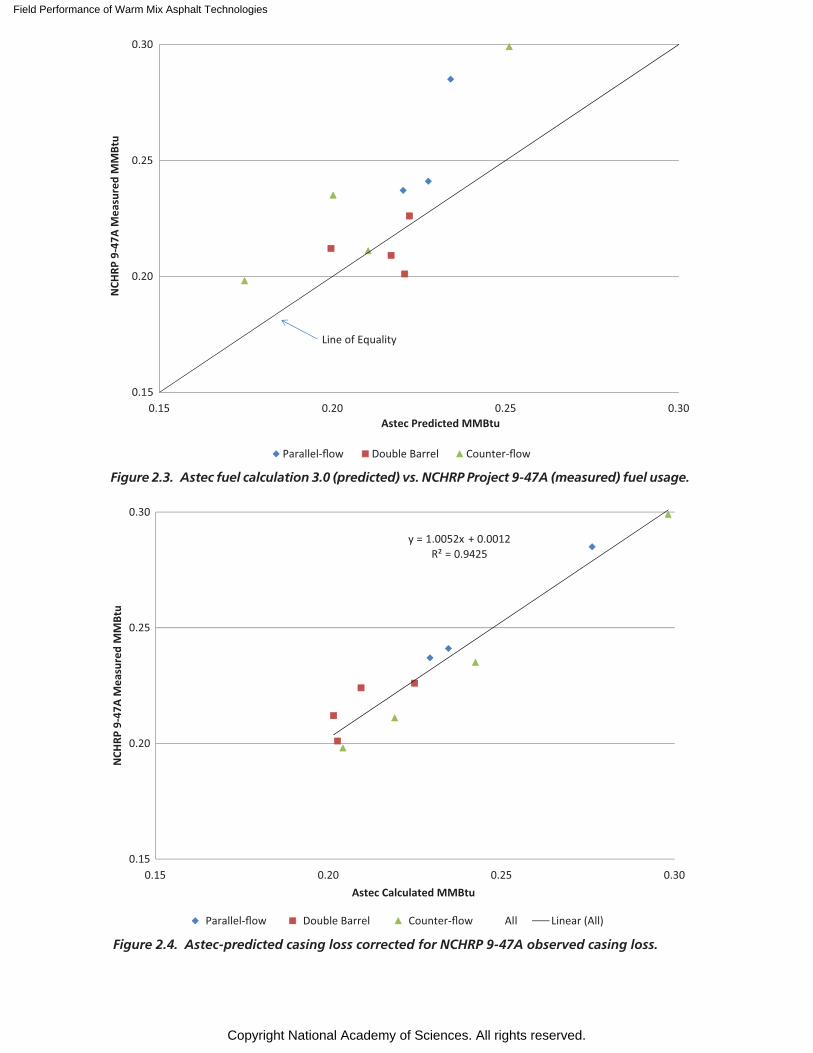
Field Performance of Warm Mix Asphalt Technologies
Copyright National Academy of Sciences. All rights reserved.
0.15
0.20
0.25
0.30
0.15 0.20 0.25 0.30
NCH
RP 9
-47A
Mea
sure
d M
MBt
u
Astec Predicted MMBtu
Parallel-flow Double Barrel Counter-flow
Line of Equality
Figure 2.3. Astec fuel calculation 3.0 (predicted) vs. NCHRP Project 9-47A (measured) fuel usage.
y = 1.0052x + 0.0012R² = 0.9425
0.15
0.20
0.25
0.30
0.15 0.20 0.25 0.30
NCH
RP 9
-47A
Mea
sure
d M
MBt
u
Astec Calculated MMBtu
Parallel-flow Double Barrel Counter-flow All Linear (All)
Figure 2.4. Astec-predicted casing loss corrected for NCHRP 9-47A observed casing loss.
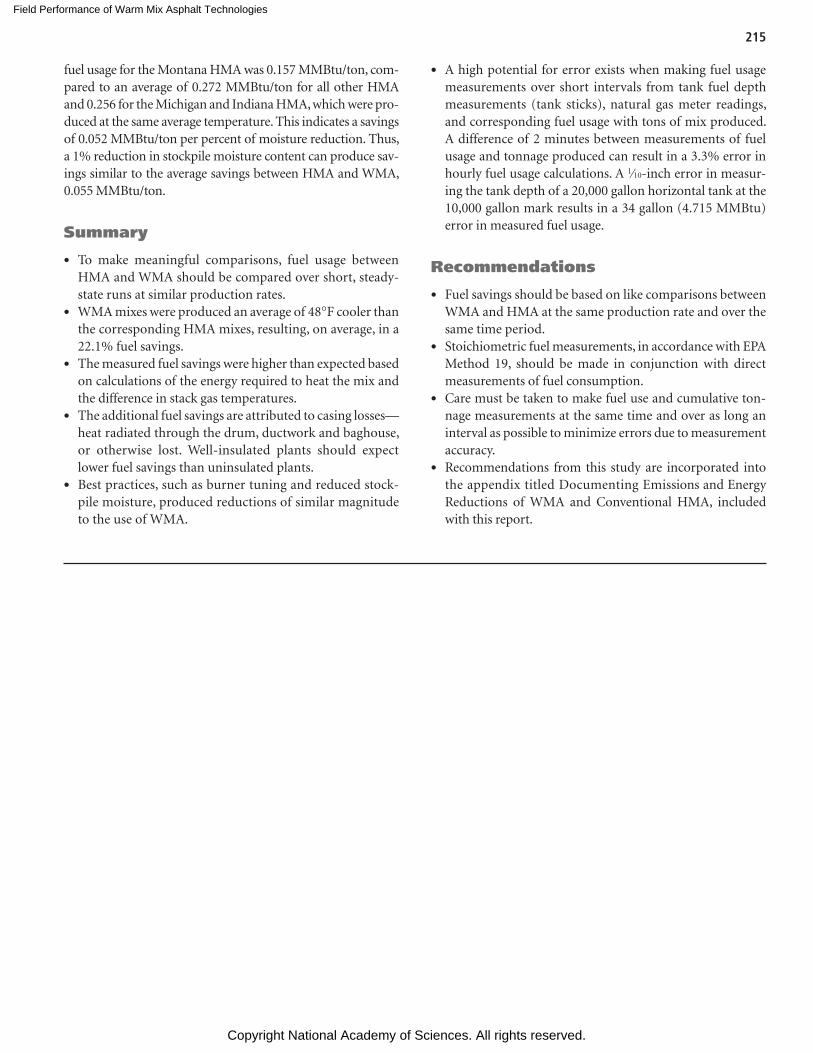
Field Performance of Warm Mix Asphalt Technologies
Copyright National Academy of Sciences. All rights reserved.
215
fuel usage for the Montana HMA was 0.157 MMBtu/ton, com-pared to an average of 0.272 MMBtu/ton for all other HMA and 0.256 for the Michigan and Indiana HMA, which were pro-duced at the same average temperature. This indicates a savings of 0.052 MMBtu/ton per percent of moisture reduction. Thus, a 1% reduction in stockpile moisture content can produce sav-ings similar to the average savings between HMA and WMA, 0.055 MMBtu/ton.
Summary
• To make meaningful comparisons, fuel usage between HMA and WMA should be compared over short, steady-state runs at similar production rates.
• WMA mixes were produced an average of 48°F cooler than the corresponding HMA mixes, resulting, on average, in a 22.1% fuel savings.
• The measured fuel savings were higher than expected based on calculations of the energy required to heat the mix and the difference in stack gas temperatures.
• The additional fuel savings are attributed to casing losses—heat radiated through the drum, ductwork and baghouse, or otherwise lost. Well-insulated plants should expect lower fuel savings than uninsulated plants.
• Best practices, such as burner tuning and reduced stock-pile moisture, produced reductions of similar magnitude to the use of WMA.
• A high potential for error exists when making fuel usage measurements over short intervals from tank fuel depth measurements (tank sticks), natural gas meter readings, and corresponding fuel usage with tons of mix produced. A difference of 2 minutes between measurements of fuel usage and tonnage produced can result in a 3.3% error in hourly fuel usage calculations. A 1⁄10-inch error in measur-ing the tank depth of a 20,000 gallon horizontal tank at the 10,000 gallon mark results in a 34 gallon (4.715 MMBtu) error in measured fuel usage.
Recommendations
• Fuel savings should be based on like comparisons between WMA and HMA at the same production rate and over the same time period.
• Stoichiometric fuel measurements, in accordance with EPA Method 19, should be made in conjunction with direct measurements of fuel consumption.
• Care must be taken to make fuel use and cumulative ton-nage measurements at the same time and over as long an interval as possible to minimize errors due to measurement accuracy.
• Recommendations from this study are incorporated into the appendix titled Documenting Emissions and Energy Reductions of WMA and Conventional HMA, included with this report.
Field Performance of Warm Mix Asphalt Technologies
Copyright National Academy of Sciences. All rights reserved.
216
Reported Emissions Reductions from WMA
Given that most pollutants of concern from asphalt plants result from combustion, they can be reduced simply by reducing fuel consumption through production of warm mix asphalt (WMA). WMA’s lower discharge temperatures should also reduce binder oxidation and volatilization loss during mixing with corresponding emission reductions. However, WMA’s ability to reduce emissions is poorly verified.
Stack emissions tests have been reported from 17 projects worldwide, representing six technologies (Ventura et al. 2009, Harder 2008, Davidson 2005b, Lecomte et al. 2007, Chief Environmental Group, N.D., ETE 2006, Powers 2009, Davidson and Pedlow 2007, and Middleton and Forfylow 2009). The majority of the stack tests completed to date indi-cate that WMA reduces carbon dioxide (CO2) emissions. The only case in which CO2 emissions increased (Chief Environ-mental Group N.D.) involved an emulsion that effectively increased the moisture content of the mix and required more heat to dry even at lower mix temperatures. Emis-sions of nitrogen oxides (NOx) were reduced in all cases. Sul-fur dioxide (SO2) emissions both increased and decreased. Two projects indicate increased volatile organic compounds (VOC) with the WMA production (Harder 2008, ETE 2006). In both cases, reports attributed that increase to poor burner tuning rather than to the WMA technology.
Pollutants have been reported in several different units ranging from stack concentration to pounds per hour, mak-ing meaningful comparisons of any kind difficult. Too fre-quently, reported emissions are simply uncorrected average (or worse, instantaneous) dry stack concentrations (parts per million by volume, dry; abbreviated ppmvd). Comparisons between WMA and hot mix asphalt (HMA) based on differ-ences in raw stack concentrations are suspect because of dilu-tion from excess air and may be unintentionally misleading. To make meaningful comparisons between tests or runs (e.g.,
to compare HMA and WMA), those results must be normal-ized to a uniform percent oxygen to correct for dilution. Reports by stack test contractors that include a mass emis-sion rate in pounds per hour, as recommended by the Warm Mix Asphalt Technical Working Group—WMA TWG (2006), still cannot be compared with other runs unless normalized for production rate and expressed as pounds pollutant per unit production.
Research Approach
Asphalt plant exhaust gas testing targeted emissions related to multiple areas of concern—greenhouse gases (carbon foot-print), ground-level ozone precursors, condensable particu-lates (PM-10)—and an emerging concern regarding hazardous air pollutants. Energy usage, stack emissions, and temperature reductions are interrelated but can be affected by multiple fac-tors, such as aggregate moisture, operator, plant configuration, fuel type, production rate, burner tuning, percent reclaimed asphalt pavement (RAP), ambient temperature, and so forth. Variations between mix design, fuel type, production rate, and aggregate moisture were minimized to the extent possible by testing the same mix over successive days for the same project.
At the three multi-technology projects (Michigan, Indiana, and New York), stack emission tests were conducted in accor-dance with the U.S. EPA’s Title 40 Code of Federal Regula-tions (CFR) Part 60, Appendix A, and generally followed the recommendations of the WMA TWG (2006). Reported stack emissions included CO2 to assess greenhouse gas produc-tion, VOC and NOx to assess the potential for ground-level ozone, carbon monoxide (CO) to assess burner tuning, SO2, condensed particulates (a component of PM-10), and form-aldehyde emissions. Results were analyzed and reported as pounds per unit production consistent with Federal AP-42 emission factors.
EPA Method 1 describes the location of sampling points to divide the cross-sectional area of the stack into a number
C H A P T E R 3
Stack Emissions
Field Performance of Warm Mix Asphalt Technologies
Copyright National Academy of Sciences. All rights reserved.
217
of equal areas, each of which will be sampled using a traverse point. The number of traverse points depends on the diam-eter of the stack and the distance of the sampling points from any obstructions that may cause turbulence in the stack gas flow. EPA Method 2 describes the measurement of the aver-age gas velocity in the stack. The gas velocity for each traverse point is calculated from the density of the gas and the aver-age velocity pressure measured with a Type S pitot tube. EPA Method 4 is used to determine the temperature and moisture content of the stack gas. The stack gas flow must be corrected for moisture to a dry basis because most gas analyzers operate at ambient temperature and require dry samples. Impingers are used to condense and collect water vapor from a metered gas sample drawn continuously during measurements of the stack emissions. The emission parameters evaluated and EPA test methods are shown in Table 2.4.
Local emission testing contractors experienced with these methods were used to minimize mobilization costs. The proj-ect team expert assessed their credentials and coordinated test-ing at each site to ensure that meaningful data were obtained. Because of the short notice at each project, testing contractor availability became a primary selection criterion.
As noted previously, burner tuning was conducted at each of the multiple technology sites prior to stack emissions tests. In two of three cases, burner tuning reduced CO emissions tenfold, while the largest WMA reduction measured was 59%. In both Michigan and Indiana, initial CO measure-ments exceeded 10,000 parts per million (ppm). In Michigan, increasing the air-to-fuel ratio dropped this level to approxi-mately 50 ppm; in Indiana, to approximately 1,000 ppm. Further reduction in CO in Indiana would have required the natural gas ports to be cleaned and the pre-mix nozzles to be replaced. Even so, the Indiana burner adjustments resulted in a 24.8% reduction in fuel use on the same mix with no other process changes.
Results and Discussion
Carbon Dioxide
Figure 2.5 shows average CO2 emissions for each of the mixes tested during the multi-technology projects. The shaded bars indicate the average of two tests; the whiskers show the individual test results. Similar to the fuel usage as reported in Table 2.2, CO2 production is reduced for all of the WMA mixes compared to their corresponding HMA mixtures. It was noted in Indiana that during the HMA and Heritage Wax WMA testing the local stack emissions con-tractor took stack velocity readings only at the end of the run, rather than concurrently with the other emission factor samples. Based on relatively accurate gas meter readings, this appears to have resulted in an under-reporting of the actual air-flow; hence the derived lb/ton CO2 production.
CO2 emissions primarily result from fuel combustion. As such, there is a linear relationship between fuel and CO2 reductions resulting from the use of WMA. Figure 2.6 pre-sents this relationship for both the data obtained from this study and the literature. The offset of any data point from the Line of Equality reflects an inaccuracy in at least one of the two measurements.
Carbon Monoxide and Volatile Organic Compounds
The formation of CO and VOC is affected by burner design, maintenance, and tuning. A burner that is improperly tuned or one that is poorly maintained may result in elevated levels of CO, VOC, or both. For most burners, elevated CO and VOC emissions are not a surrogate for efficiency because the energy potential of these emissions are several orders of magnitude smaller that energy loss due to excess air, high exhaust gas tem-perature, and casing radiation. Figure 2.7 and Figure 2.8 show
Table 2.4. Stack emission test parameters and methods.
Emission Parameter
Number of Test Runs per
TechnologySampling and Analytical
Methodology
Volumetric flow rate * EPA Methods 1 and 2
Oxygen (O2) and carbon dioxide (CO2) * EPA Method 3A
Moisture content * EPA Method 4
Sulfur dioxide (SO2) 2 EPA Method 6
Nitrogen oxides (NOx) 2 EPA Method 7E
Carbon monoxide (CO) 2 EPA Method 10
Total hydrocarbons (volatile organic compounds [VOC])
2 EPA Method 25A
Particulate matter/PM-10 2 EPA Methods 5/202
Formaldehyde 2 EPA Method 316
* Determined concurrently with all emission parameter
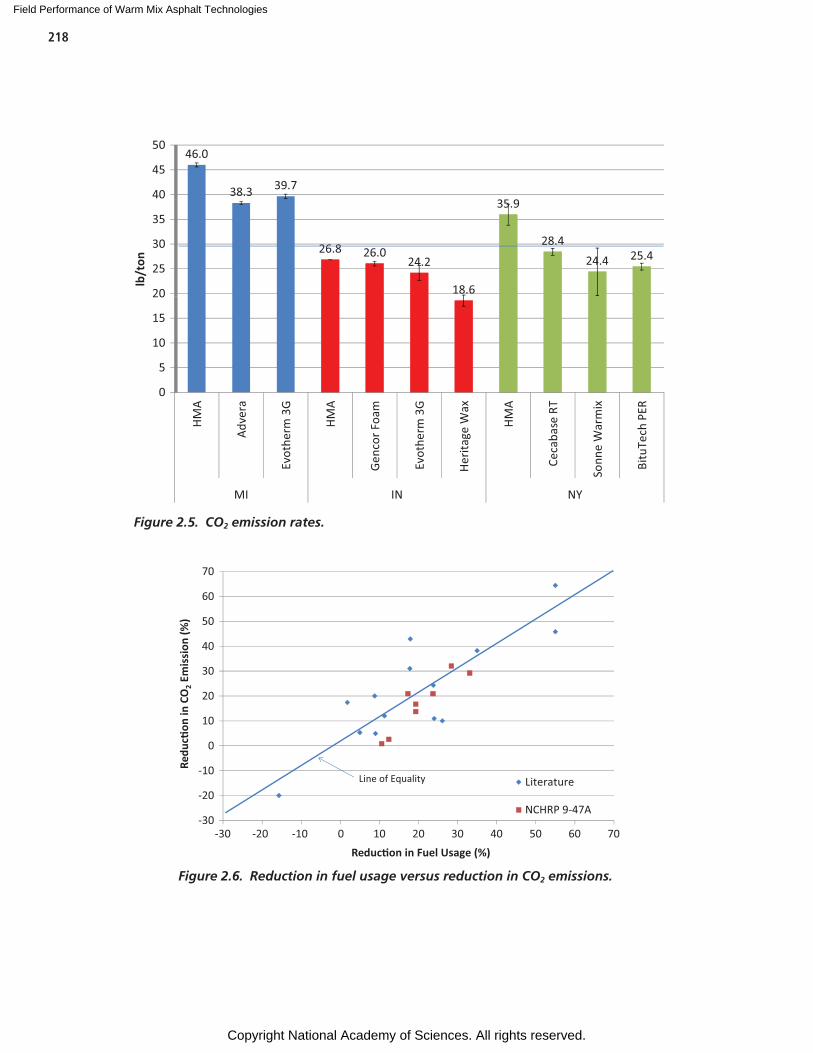
Field Performance of Warm Mix Asphalt Technologies
Copyright National Academy of Sciences. All rights reserved.
218
Figure 2.5. CO2 emission rates.
46.0
38.3 39.7
26.8 26.024.2
18.6
35.9
28.4
24.4 25.4
0
5
10
15
20
25
30
35
40
45
50
HM
A
Adv
era
Evot
herm
3G
HM
A
Gen
cor
Foam
Evot
herm
3G
Her
itage
Wax
HM
A
Ceca
base
RT
Sonn
eW
arm
ix
Bitu
Tech
PER
MI IN NY
lb/t
on
Figure 2.6. Reduction in fuel usage versus reduction in CO2 emissions.
-30
-20
-10
0
10
20
30
40
50
60
70
100-10-20-30 20 30 40 50 60 70
Redu
c�on
in C
O2
Emis
sion
(%)
Reduc�on in Fuel Usage (%)
Literature
NCHRP 9-47A
Line of Equality
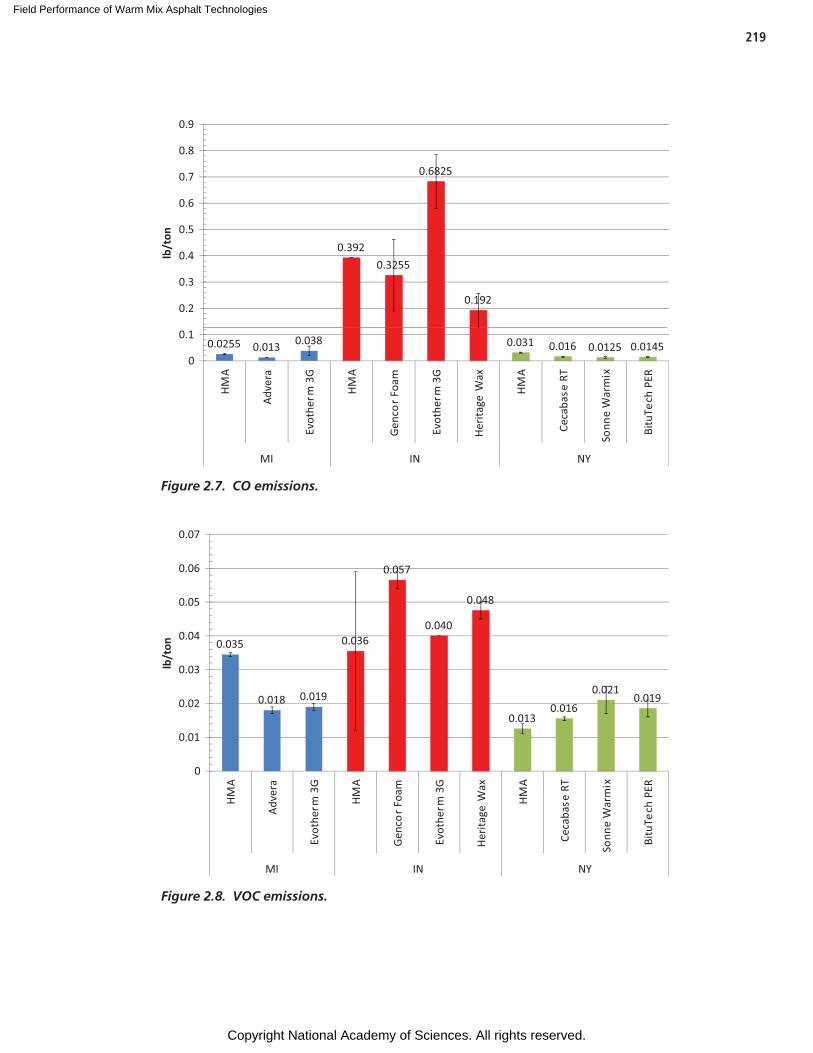
Field Performance of Warm Mix Asphalt Technologies
Copyright National Academy of Sciences. All rights reserved.
219
Figure 2.7. CO emissions.
0.0255 0.013 0.038
0.392
0.3255
0.6825
0.192
0.031 0.016 0.0125 0.01450
0.1
0.2
0.3
0.4
0.5
0.6
0.7
0.8
0.9
HM
A
Adv
era
Evot
herm
3G
HM
A
Gen
cor
Foam
Evot
herm
3G
Her
itage
Wax
HM
A
Ceca
base
RT
Sonn
eW
arm
ix
Bitu
Tech
PER
MI IN NY
lb/t
on
Figure 2.8. VOC emissions.
0.035
0.018 0.019
0.036
0.057
0.040
0.048
0.0130.016
0.0210.019
0
0.01
0.02
0.03
0.04
0.05
0.06
0.07
HM
A
Adv
era
Evot
herm
3G
HM
A
Gen
cor
Foam
Evot
herm
3G
Her
itage
Wax
HM
A
Ceca
base
RT
Sonn
eW
arm
ix
Bitu
Tech
PER
MI IN NY
lb/t
on
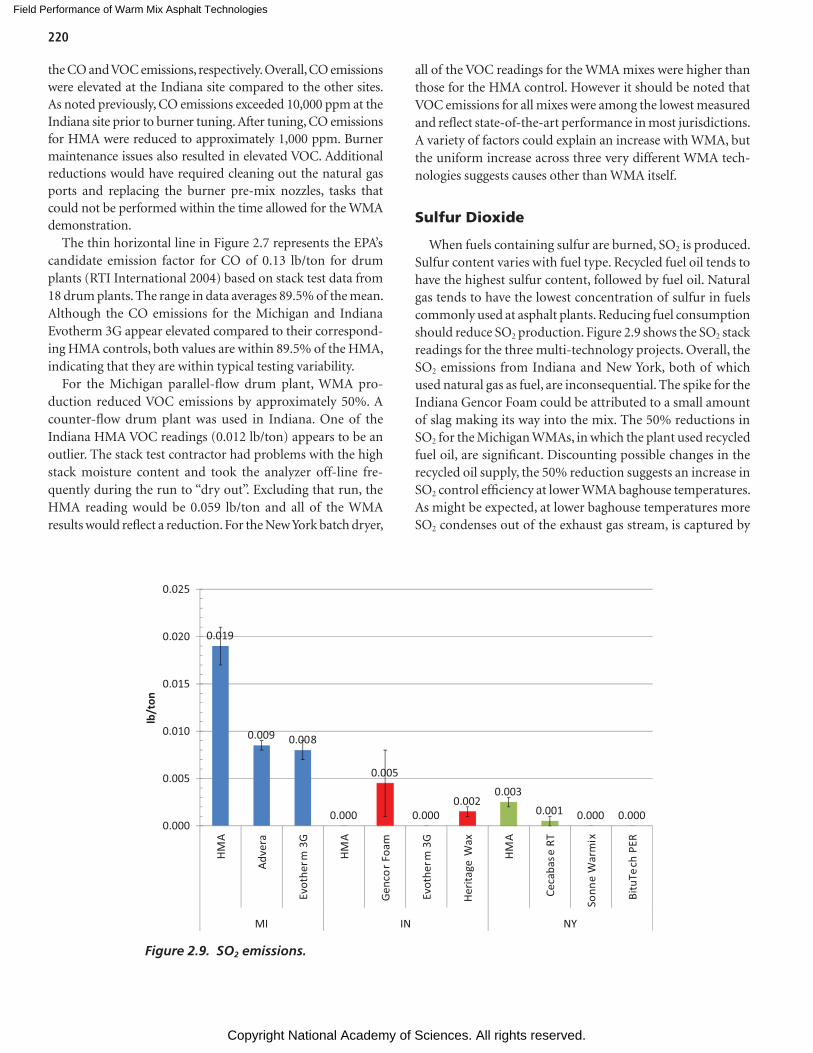
Field Performance of Warm Mix Asphalt Technologies
Copyright National Academy of Sciences. All rights reserved.
220
the CO and VOC emissions, respectively. Overall, CO emissions were elevated at the Indiana site compared to the other sites. As noted previously, CO emissions exceeded 10,000 ppm at the Indiana site prior to burner tuning. After tuning, CO emissions for HMA were reduced to approximately 1,000 ppm. Burner maintenance issues also resulted in elevated VOC. Additional reductions would have required cleaning out the natural gas ports and replacing the burner pre-mix nozzles, tasks that could not be performed within the time allowed for the WMA demonstration.
The thin horizontal line in Figure 2.7 represents the EPA’s candidate emission factor for CO of 0.13 lb/ton for drum plants (RTI International 2004) based on stack test data from 18 drum plants. The range in data averages 89.5% of the mean. Although the CO emissions for the Michigan and Indiana Evotherm 3G appear elevated compared to their correspond-ing HMA controls, both values are within 89.5% of the HMA, indicating that they are within typical testing variability.
For the Michigan parallel-flow drum plant, WMA pro-duction reduced VOC emissions by approximately 50%. A counter-flow drum plant was used in Indiana. One of the Indiana HMA VOC readings (0.012 lb/ton) appears to be an outlier. The stack test contractor had problems with the high stack moisture content and took the analyzer off-line fre-quently during the run to “dry out”. Excluding that run, the HMA reading would be 0.059 lb/ton and all of the WMA results would reflect a reduction. For the New York batch dryer,
all of the VOC readings for the WMA mixes were higher than those for the HMA control. However it should be noted that VOC emissions for all mixes were among the lowest measured and reflect state-of-the-art performance in most jurisdictions. A variety of factors could explain an increase with WMA, but the uniform increase across three very different WMA tech-nologies suggests causes other than WMA itself.
Sulfur Dioxide
When fuels containing sulfur are burned, SO2 is produced. Sulfur content varies with fuel type. Recycled fuel oil tends to have the highest sulfur content, followed by fuel oil. Natural gas tends to have the lowest concentration of sulfur in fuels commonly used at asphalt plants. Reducing fuel consumption should reduce SO2 production. Figure 2.9 shows the SO2 stack readings for the three multi-technology projects. Overall, the SO2 emissions from Indiana and New York, both of which used natural gas as fuel, are inconsequential. The spike for the Indiana Gencor Foam could be attributed to a small amount of slag making its way into the mix. The 50% reductions in SO2 for the Michigan WMAs, in which the plant used recycled fuel oil, are significant. Discounting possible changes in the recycled oil supply, the 50% reduction suggests an increase in SO2 control efficiency at lower WMA baghouse temperatures. As might be expected, at lower baghouse temperatures more SO2 condenses out of the exhaust gas stream, is captured by
0.019
0.009 0.008
0.000
0.005
0.0000.002
0.003
0.001 0.000 0.0000.000
0.005
0.010
0.015
0.020
0.025
HM
A
Adv
era
Evot
herm
3G
HM
A
Gen
cor
Foam
Evot
herm
3G
Her
itage
Wax
HM
A
Ceca
base
RT
Sonn
eW
arm
ix
Bitu
Tech
PER
MI IN NY
lb/t
on
Figure 2.9. SO2 emissions.
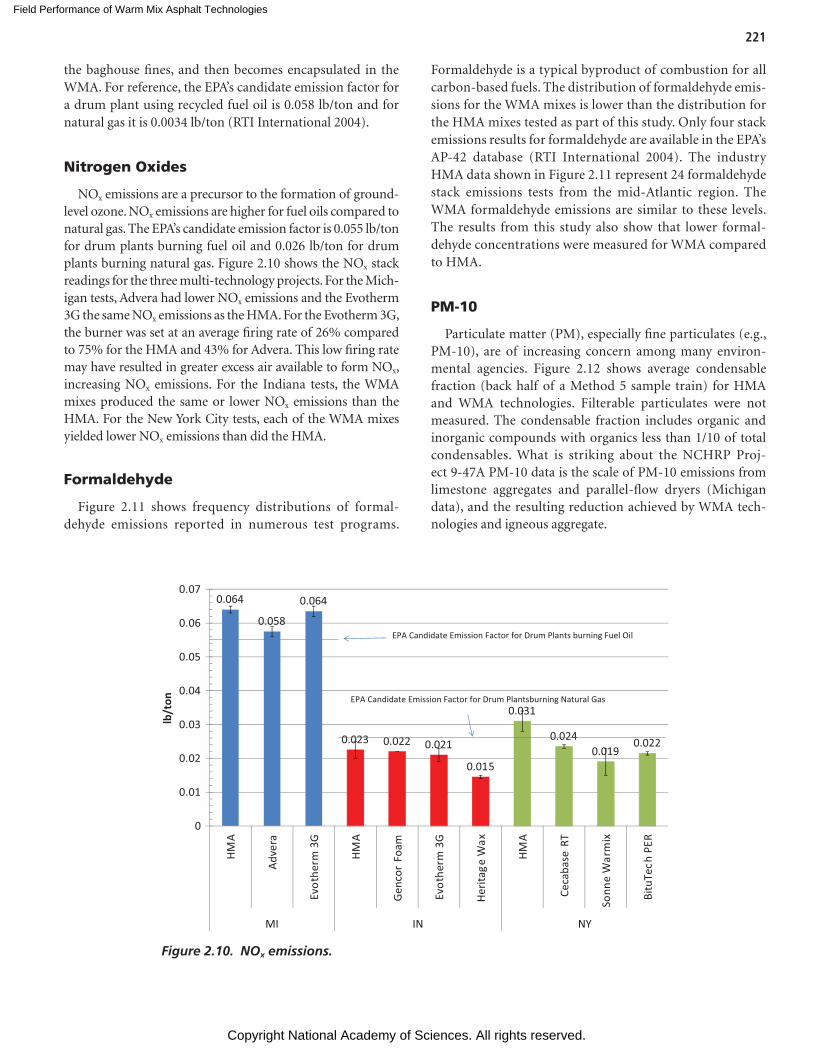
Field Performance of Warm Mix Asphalt Technologies
Copyright National Academy of Sciences. All rights reserved.
221
the baghouse fines, and then becomes encapsulated in the WMA. For reference, the EPA’s candidate emission factor for a drum plant using recycled fuel oil is 0.058 lb/ton and for natural gas it is 0.0034 lb/ton (RTI International 2004).
Nitrogen Oxides
NOx emissions are a precursor to the formation of ground-level ozone. NOx emissions are higher for fuel oils compared to natural gas. The EPA’s candidate emission factor is 0.055 lb/ton for drum plants burning fuel oil and 0.026 lb/ton for drum plants burning natural gas. Figure 2.10 shows the NOx stack readings for the three multi-technology projects. For the Mich-igan tests, Advera had lower NOx emissions and the Evotherm 3G the same NOx emissions as the HMA. For the Evotherm 3G, the burner was set at an average firing rate of 26% compared to 75% for the HMA and 43% for Advera. This low firing rate may have resulted in greater excess air available to form NOx, increasing NOx emissions. For the Indiana tests, the WMA mixes produced the same or lower NOx emissions than the HMA. For the New York City tests, each of the WMA mixes yielded lower NOx emissions than did the HMA.
Formaldehyde
Figure 2.11 shows frequency distributions of formal-dehyde emissions reported in numerous test programs.
Figure 2.10. NOx emissions.
0.064
0.058
0.064
0.023 0.022 0.021
0.015
0.031
0.0240.019
0.022
0
0.01
0.02
0.03
0.04
0.05
0.06
0.07
HM
A
Adv
era
Evo
ther
m3G
HM
A
Gen
cor
Foam
Evo
ther
m3G
Her
itag
eW
ax
HM
A
Ceca
base
RT
Sonn
eW
arm
ix
Bitu
Tech
PER
MI IN NY
lb/t
on EPA Candidate Emission Factor for Drum Plantsburning Natural Gas
EPA Candidate Emission Factor for Drum Plants burning Fuel Oil
Formaldehyde is a typical byproduct of combustion for all carbon-based fuels. The distribution of formaldehyde emis-sions for the WMA mixes is lower than the distribution for the HMA mixes tested as part of this study. Only four stack emissions results for formaldehyde are available in the EPA’s AP-42 database (RTI International 2004). The industry HMA data shown in Figure 2.11 represent 24 formaldehyde stack emissions tests from the mid-Atlantic region. The WMA formaldehyde emissions are similar to these levels. The results from this study also show that lower formal-dehyde concentrations were measured for WMA compared to HMA.
PM-10
Particulate matter (PM), especially fine particulates (e.g., PM-10), are of increasing concern among many environ-mental agencies. Figure 2.12 shows average condensable fraction (back half of a Method 5 sample train) for HMA and WMA technologies. Filterable particulates were not measured. The condensable fraction includes organic and inorganic compounds with organics less than 1/10 of total condensables. What is striking about the NCHRP Proj-ect 9-47A PM-10 data is the scale of PM-10 emissions from limestone aggregates and parallel-flow dryers (Michigan data), and the resulting reduction achieved by WMA tech-nologies and igneous aggregate.
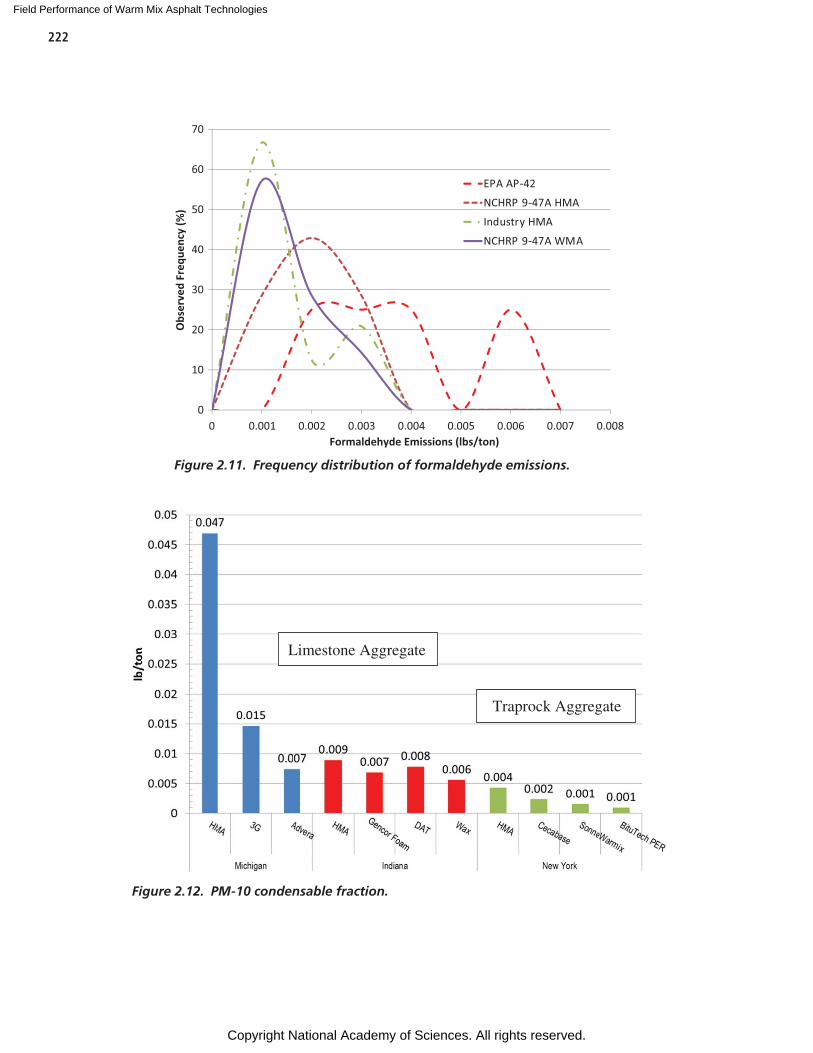
Field Performance of Warm Mix Asphalt Technologies
Copyright National Academy of Sciences. All rights reserved.
222
Figure 2.11. Frequency distribution of formaldehyde emissions.
EPA AP 42
NCHRP 9 47A HMA
Industry HMA
NCHRP 9 47A WMA
0
10
20
30
40
50
60
70
0.005 0.006 0.007 0.0080.0010 0.002 0.003 0.004
Obs
erve
d Fr
eque
ncy
(%)
Formaldehyde Emissions (lbs/ton)
Figure 2.12. PM-10 condensable fraction.
Traprock Aggregate
Limestone Aggregate
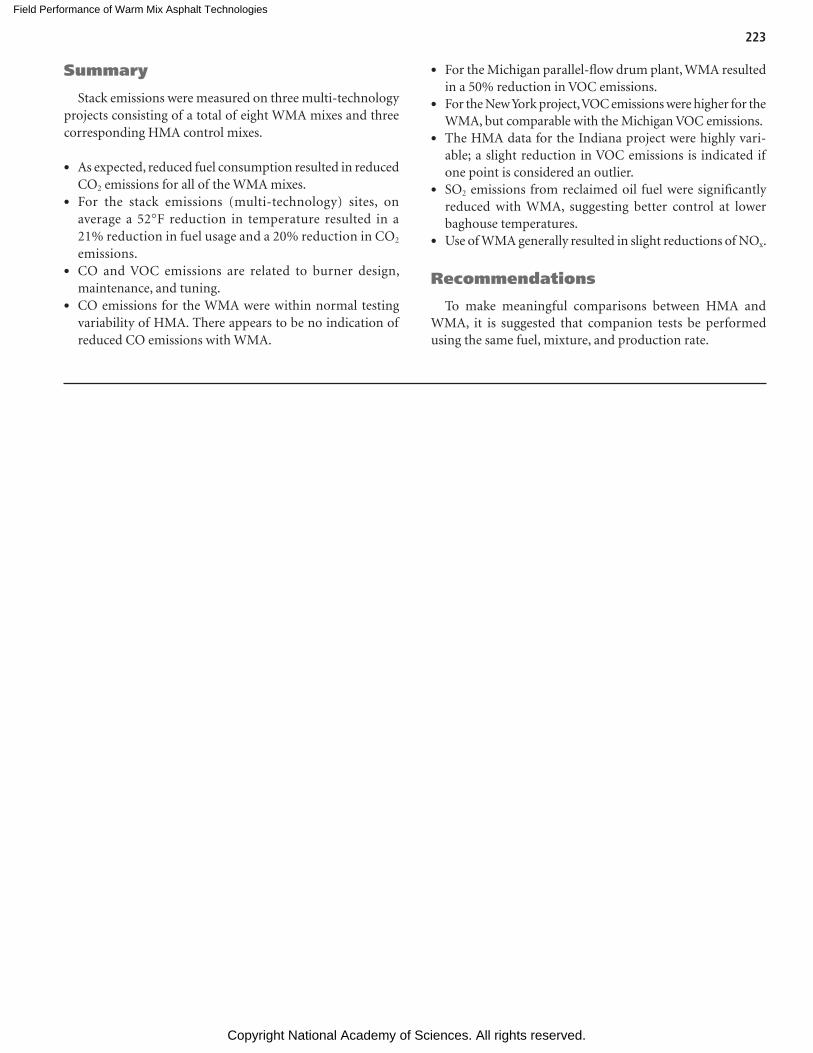
Field Performance of Warm Mix Asphalt Technologies
Copyright National Academy of Sciences. All rights reserved.
223
Summary
Stack emissions were measured on three multi-technology projects consisting of a total of eight WMA mixes and three corresponding HMA control mixes.
• As expected, reduced fuel consumption resulted in reduced CO2 emissions for all of the WMA mixes.
• For the stack emissions (multi-technology) sites, on average a 52°F reduction in temperature resulted in a 21% reduction in fuel usage and a 20% reduction in CO2 emissions.
• CO and VOC emissions are related to burner design, maintenance, and tuning.
• CO emissions for the WMA were within normal testing variability of HMA. There appears to be no indication of reduced CO emissions with WMA.
• For the Michigan parallel-flow drum plant, WMA resulted in a 50% reduction in VOC emissions.
• For the New York project, VOC emissions were higher for the WMA, but comparable with the Michigan VOC emissions.
• The HMA data for the Indiana project were highly vari-able; a slight reduction in VOC emissions is indicated if one point is considered an outlier.
• SO2 emissions from reclaimed oil fuel were significantly reduced with WMA, suggesting better control at lower baghouse temperatures.
• Use of WMA generally resulted in slight reductions of NOx.
Recommendations
To make meaningful comparisons between HMA and WMA, it is suggested that companion tests be performed using the same fuel, mixture, and production rate.
Field Performance of Warm Mix Asphalt Technologies
Copyright National Academy of Sciences. All rights reserved.
224
Background
The primary use of asphalt has been in paving mixes for roadway infrastructures. The United States and Europe com-bined employ about 400,000 workers in the asphalt paving industry (AI, EU 2011). Asphalt is the non-distillable frac-tion of crude oil. Small amounts of volatile and semi-volatile organic compounds are trapped in this highly viscous material (Clark et al. 2011). Heating asphalt above the softening point and agitating it facilitates the release of these emissions, consti-tuting the potential for worker exposure.
A large nested case control epidemiology study by Olsson et al. (2010) showed no consistent evidence of an association between indicators of either inhalation or dermal exposure to asphalt and lung cancer risk and attributed increased inci-dence in cancer to confounding issues like smoking, exposure to coal tar, and so forth.
A recent 2-year skin-painting study by Clark et al. (2011) confirmed the absence of tumorigenic effects in skin regions treated with paving asphalt fume condensate. Fuhst et al. (2007) conducted an inhalation study involving exposure of Wistar rats to asphalt fumes for 2 years. Results showed that asphalt fumes are not considered to be tumorigenic to rats via the inhalation route. Asphalt-related irritant effects were, however, observed in the nasal passages and in the lungs.
Despite the results of these recent studies, in October 2011, the International Agency for Research on Cancer con-cluded that “occupational exposures to straight-run bitumens (asphalts) and their emissions during road paving are ‘possibly carcinogenic to humans’ (Group 2B)” (Lauby-Secretan et al., 2011, IARC 2012).
Other studies have also shown an association with vari-ous health endpoints related to irritation. A recent German study in humans by Raulf-Heimsoth et al. (2011) detected potentially sub-chronic irritative inflammatory effects in the lower airways of bitumen-exposed workers. Tepper et al. (2006) reported throat symptoms that were statistically sig-
nificant compared to a control group. Similar symptoms are discussed in the Norseth et al. studies (1991) evaluating self-reported symptoms that included fatigue, reduced appetite, eye irritation, and laryngeal-pharyngeal irritation that was reported more frequently among workers exposed to asphalt fumes than among unexposed workers in a statistically sig-nificant manner.
These studies emphasize the need for reducing worker exposure to asphalt emissions. The National Institute for Occupational Safety and Health (NIOSH) has recommended use of engineering controls and good work practices to mini-mize worker exposure to asphalt fumes (NIOSH 2001), including reduction of the asphalt mix temperature. First developed in Europe during the late 1990s to address worker exposure concerns for Gussasphalt placed at high tempera-tures, warm mix asphalt (WMA) mixtures typically are pro-duced at lower temperatures than hot mix asphalt (HMA) mixtures (D’Angelo et al. 2007). Recent studies (Kriech et al. 2011) show that reduced asphalt application temperature is predictive of reduced inhalation exposures (Cavallari et al. 2011) along with a reduced total absorbed dose of poly cyclic aromatic hydrocarbons (PAHs) and polycyclic aromatic compound (PAC) metabolites (McClean et al. 2012).
Information currently in the public domain regarding worker exposure reduction using WMA technologies is often based on marketing or takes the form of presentations, confer-ence proceedings, or government reports. Few peer-reviewed publications specifically document this promoted benefit of WMA. D’Angelo et al. (2007) indicated 30%–50% reductions in asphalt aerosols/fumes and PAHs for WMA compared to HMA. Measurements by von Devivere et al. (2003) showed a reduction in fume emissions of 75% where zeolite had been added with an application temperature reduction of 26°C. In a study of WAM-Foam, exposure values were shown to be in the lower range when compared to exposure measure-ments conducted on paving HMA (Lecomte et al. 2007). The Ohio Department of Transportation (DOT), in conjunction
C H A P T E R 4
Worker Exposure
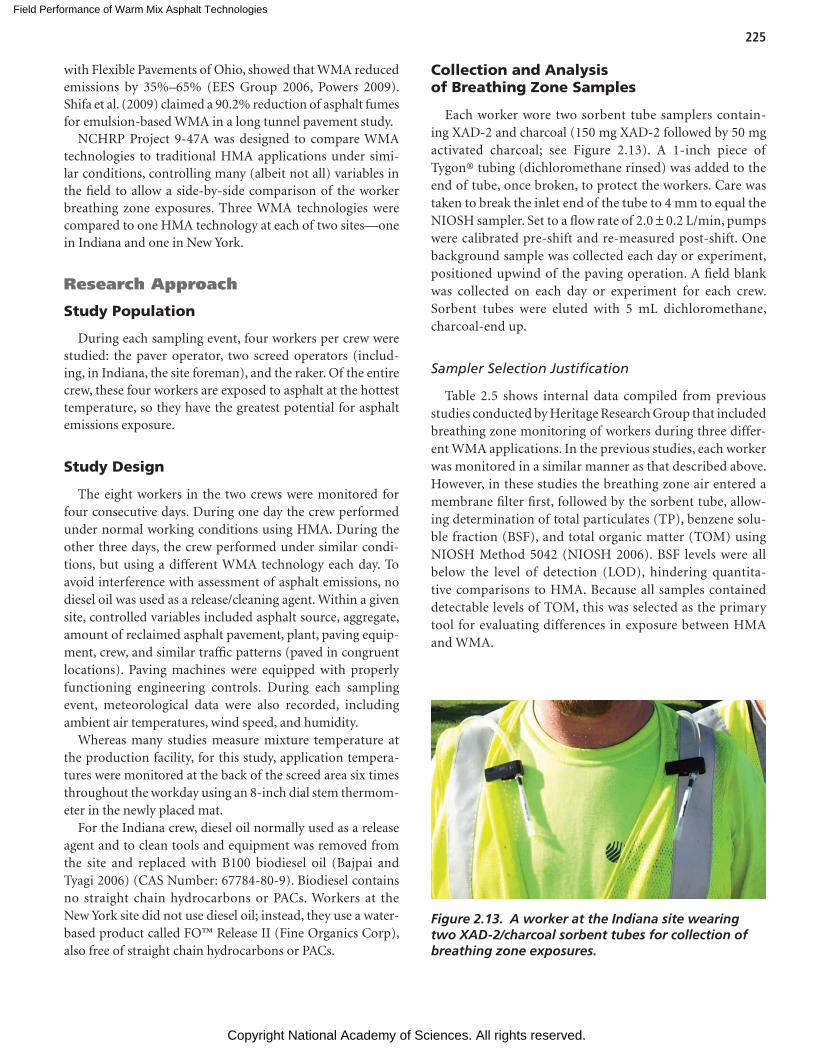
Field Performance of Warm Mix Asphalt Technologies
Copyright National Academy of Sciences. All rights reserved.
225
with Flexible Pavements of Ohio, showed that WMA reduced emissions by 35%–65% (EES Group 2006, Powers 2009). Shifa et al. (2009) claimed a 90.2% reduction of asphalt fumes for emulsion-based WMA in a long tunnel pavement study.
NCHRP Project 9-47A was designed to compare WMA technologies to traditional HMA applications under simi-lar conditions, controlling many (albeit not all) variables in the field to allow a side-by-side comparison of the worker breathing zone exposures. Three WMA technologies were compared to one HMA technology at each of two sites—one in Indiana and one in New York.
Research Approach
Study Population
During each sampling event, four workers per crew were studied: the paver operator, two screed operators (includ-ing, in Indiana, the site foreman), and the raker. Of the entire crew, these four workers are exposed to asphalt at the hottest temperature, so they have the greatest potential for asphalt emissions exposure.
Study Design
The eight workers in the two crews were monitored for four consecutive days. During one day the crew performed under normal working conditions using HMA. During the other three days, the crew performed under similar condi-tions, but using a different WMA technology each day. To avoid interference with assessment of asphalt emissions, no diesel oil was used as a release/cleaning agent. Within a given site, controlled variables included asphalt source, aggregate, amount of reclaimed asphalt pavement, plant, paving equip-ment, crew, and similar traffic patterns (paved in congruent locations). Paving machines were equipped with properly functioning engineering controls. During each sampling event, meteorological data were also recorded, including ambient air temperatures, wind speed, and humidity.
Whereas many studies measure mixture temperature at the production facility, for this study, application tempera-tures were monitored at the back of the screed area six times throughout the workday using an 8-inch dial stem thermom-eter in the newly placed mat.
For the Indiana crew, diesel oil normally used as a release agent and to clean tools and equipment was removed from the site and replaced with B100 biodiesel oil (Bajpai and Tyagi 2006) (CAS Number: 67784-80-9). Biodiesel contains no straight chain hydrocarbons or PACs. Workers at the New York site did not use diesel oil; instead, they use a water-based product called FO™ Release II (Fine Organics Corp), also free of straight chain hydrocarbons or PACs.
Collection and Analysis of Breathing Zone Samples
Each worker wore two sorbent tube samplers contain-ing XAD-2 and charcoal (150 mg XAD-2 followed by 50 mg activated charcoal; see Figure 2.13). A 1-inch piece of Tygon® tubing (dichloromethane rinsed) was added to the end of tube, once broken, to protect the workers. Care was taken to break the inlet end of the tube to 4 mm to equal the NIOSH sampler. Set to a flow rate of 2.0 ± 0.2 L/min, pumps were calibrated pre-shift and re-measured post-shift. One background sample was collected each day or experiment, positioned upwind of the paving operation. A field blank was collected on each day or experiment for each crew. Sorbent tubes were eluted with 5 mL dichloromethane, charcoal-end up.
Sampler Selection Justification
Table 2.5 shows internal data compiled from previous studies conducted by Heritage Research Group that included breathing zone monitoring of workers during three differ-ent WMA applications. In the previous studies, each worker was monitored in a similar manner as that described above. However, in these studies the breathing zone air entered a membrane filter first, followed by the sorbent tube, allow-ing determination of total particulates (TP), benzene solu-ble fraction (BSF), and total organic matter (TOM) using NIOSH Method 5042 (NIOSH 2006). BSF levels were all below the level of detection (LOD), hindering quantita-tive comparisons to HMA. Because all samples contained detectable levels of TOM, this was selected as the primary tool for evaluating differences in exposure between HMA and WMA.
Figure 2.13. A worker at the Indiana site wearing two XAD-2/charcoal sorbent tubes for collection of breathing zone exposures.
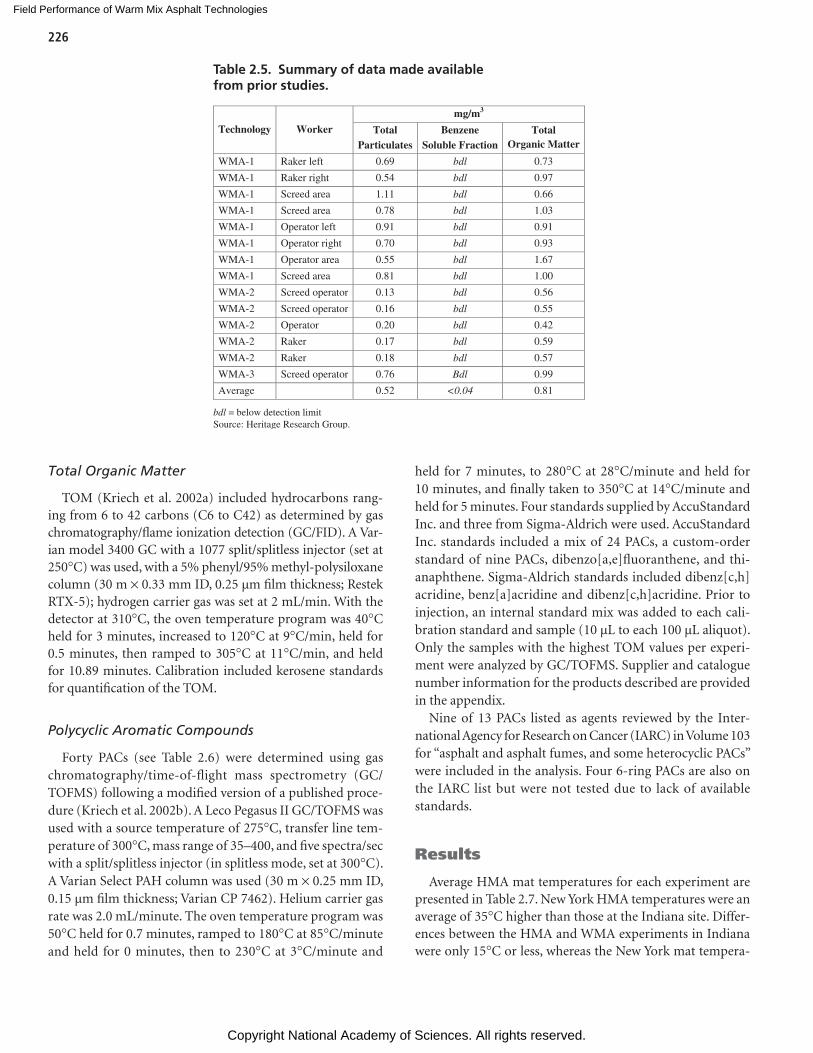
Field Performance of Warm Mix Asphalt Technologies
Copyright National Academy of Sciences. All rights reserved.
226
Total Organic Matter
TOM (Kriech et al. 2002a) included hydrocarbons rang-ing from 6 to 42 carbons (C6 to C42) as determined by gas chromatography/flame ionization detection (GC/FID). A Var-ian model 3400 GC with a 1077 split/splitless injector (set at 250°C) was used, with a 5% phenyl/95% methyl-polysiloxane column (30 m × 0.33 mm ID, 0.25 µm film thickness; Restek RTX-5); hydrogen carrier gas was set at 2 mL/min. With the detector at 310°C, the oven temperature program was 40°C held for 3 minutes, increased to 120°C at 9°C/min, held for 0.5 minutes, then ramped to 305°C at 11°C/min, and held for 10.89 minutes. Calibration included kerosene standards for quantification of the TOM.
Polycyclic Aromatic Compounds
Forty PACs (see Table 2.6) were determined using gas chromatography/time-of-flight mass spectrometry (GC/TOFMS) following a modified version of a published proce-dure (Kriech et al. 2002b). A Leco Pegasus II GC/TOFMS was used with a source temperature of 275°C, transfer line tem-perature of 300°C, mass range of 35–400, and five spectra/sec with a split/splitless injector (in splitless mode, set at 300°C). A Varian Select PAH column was used (30 m × 0.25 mm ID, 0.15 µm film thickness; Varian CP 7462). Helium carrier gas rate was 2.0 mL/minute. The oven temperature program was 50°C held for 0.7 minutes, ramped to 180°C at 85°C/minute and held for 0 minutes, then to 230°C at 3°C/minute and
held for 7 minutes, to 280°C at 28°C/minute and held for 10 minutes, and finally taken to 350°C at 14°C/minute and held for 5 minutes. Four standards supplied by AccuStandard Inc. and three from Sigma-Aldrich were used. AccuStandard Inc. standards included a mix of 24 PACs, a custom-order standard of nine PACs, dibenzo[a,e]fluoranthene, and thi-anaphthene. Sigma-Aldrich standards included dibenz[c,h]acridine, benz[a]acridine and dibenz[c,h]acridine. Prior to injection, an internal standard mix was added to each cali-bration standard and sample (10 µL to each 100 µL aliquot). Only the samples with the highest TOM values per experi-ment were analyzed by GC/TOFMS. Supplier and catalogue number information for the products described are provided in the appendix.
Nine of 13 PACs listed as agents reviewed by the Inter-national Agency for Research on Cancer (IARC) in Volume 103 for “asphalt and asphalt fumes, and some heterocyclic PACs” were included in the analysis. Four 6-ring PACs are also on the IARC list but were not tested due to lack of available standards.
Results
Average HMA mat temperatures for each experiment are presented in Table 2.7. New York HMA temperatures were an average of 35°C higher than those at the Indiana site. Differ-ences between the HMA and WMA experiments in Indiana were only 15°C or less, whereas the New York mat tempera-
Table 2.5. Summary of data made available from prior studies.
Technology Worker
mg/m3
Total Particulates
Benzene Soluble Fraction
Total Organic Matter
WMA-1 Raker left 0.69 bdl 0.73
WMA-1 Raker right 0.54 bdl 0.97
WMA-1 Screed area 1.11 bdl 0.66
WMA-1 Screed area 0.78 bdl 1.03
WMA-1 Operator left 0.91 bdl 0.91
WMA-1 Operator right 0.70 bdl 0.93
WMA-1 Operator area 0.55 bdl 1.67
WMA-1 Screed area 0.81 bdl 1.00
WMA-2 Screed operator 0.13 bdl 0.56
WMA-2 Screed operator 0.16 bdl 0.55
WMA-2 Operator 0.20 bdl 0.42
WMA-2 Raker 0.17 bdl 0.59
WMA-2 Raker 0.18 bdl 0.57
WMA-3 Screed operator 0.76 Bdl 0.99
Average 0.52 <0.04 0.81
bdl = below detection limit Source: Heritage Research Group.
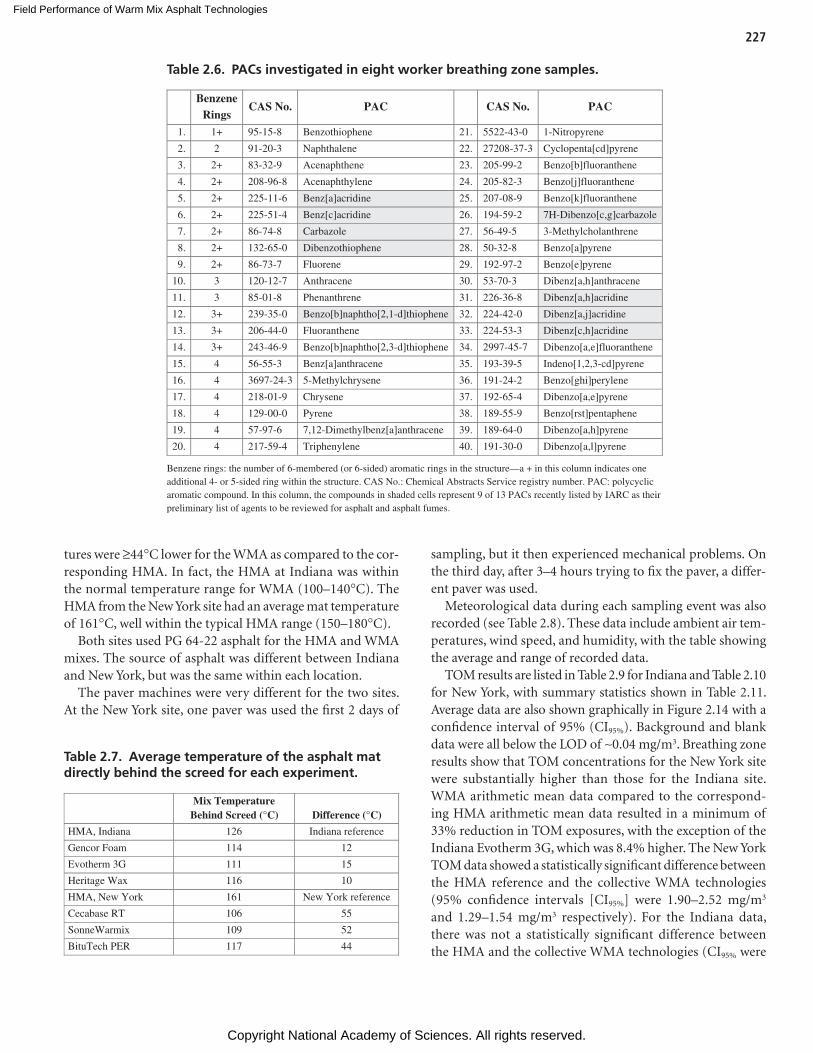
Field Performance of Warm Mix Asphalt Technologies
Copyright National Academy of Sciences. All rights reserved.
227
tures were ≥44°C lower for the WMA as compared to the cor-responding HMA. In fact, the HMA at Indiana was within the normal temperature range for WMA (100–140°C). The HMA from the New York site had an average mat temperature of 161°C, well within the typical HMA range (150–180°C).
Both sites used PG 64-22 asphalt for the HMA and WMA mixes. The source of asphalt was different between Indiana and New York, but was the same within each location.
The paver machines were very different for the two sites. At the New York site, one paver was used the first 2 days of
sampling, but it then experienced mechanical problems. On the third day, after 3–4 hours trying to fix the paver, a differ-ent paver was used.
Meteorological data during each sampling event was also recorded (see Table 2.8). These data include ambient air tem-peratures, wind speed, and humidity, with the table showing the average and range of recorded data.
TOM results are listed in Table 2.9 for Indiana and Table 2.10 for New York, with summary statistics shown in Table 2.11. Average data are also shown graphically in Figure 2.14 with a confidence interval of 95% (CI95%). Background and blank data were all below the LOD of ~0.04 mg/m3. Breathing zone results show that TOM concentrations for the New York site were substantially higher than those for the Indiana site. WMA arithmetic mean data compared to the correspond-ing HMA arithmetic mean data resulted in a minimum of 33% reduction in TOM exposures, with the exception of the Indiana Evotherm 3G, which was 8.4% higher. The New York TOM data showed a statistically significant difference between the HMA reference and the collective WMA technologies (95% confidence intervals [CI95%] were 1.90–2.52 mg/m3 and 1.29–1.54 mg/m3 respectively). For the Indiana data, there was not a statistically significant difference between the HMA and the collective WMA technologies (CI95% were
Table 2.6. PACs investigated in eight worker breathing zone samples.
Benzene Rings
CAS No. PAC
CAS No. PAC
1. 1+ 95-15-8 Benzothiophene 21. 5522-43-0 1-Nitropyrene
2. 2 91-20-3 Naphthalene 22. 27208-37-3 Cyclopenta[cd]pyrene
3. 2+ 83-32-9 Acenaphthene 23. 205-99-2 Benzo[b]fluoranthene
4. 2+ 208-96-8 Acenaphthylene 24. 205-82-3 Benzo[j]fluoranthene
5. 2+ 225-11-6 Benz[a]acridine 25. 207-08-9 Benzo[k]fluoranthene
6. 2+ 225-51-4 Benz[c]acridine 26. 194-59-2 7H-Dibenzo[c,g]carbazole
7. 2+ 86-74-8 Carbazole 27. 56-49-5 3-Methylcholanthrene
8. 2+ 132-65-0 Dibenzothiophene 28. 50-32-8 Benzo[a]pyrene
9. 2+ 86-73-7 Fluorene 29. 192-97-2 Benzo[e]pyrene
10. 3 120-12-7 Anthracene 30. 53-70-3 Dibenz[a,h]anthracene
11. 3 85-01-8 Phenanthrene 31. 226-36-8 Dibenz[a,h]acridine
12. 3+ 239-35-0 Benzo[b]naphtho[2,1-d]thiophene 32. 224-42-0 Dibenz[a,j]acridine
13. 3+ 206-44-0 Fluoranthene 33. 224-53-3 Dibenz[c,h]acridine
14. 3+ 243-46-9 Benzo[b]naphtho[2,3-d]thiophene 34. 2997-45-7 Dibenzo[a,e]fluoranthene
15. 4 56-55-3 Benz[a]anthracene 35. 193-39-5 Indeno[1,2,3-cd]pyrene
16. 4 3697-24-3 5-Methylchrysene 36. 191-24-2 Benzo[ghi]perylene
17. 4 218-01-9 Chrysene 37. 192-65-4 Dibenzo[a,e]pyrene
18. 4 129-00-0 Pyrene 38. 189-55-9 Benzo[rst]pentaphene
19. 4 57-97-6 7,12-Dimethylbenz[a]anthracene 39. 189-64-0 Dibenzo[a,h]pyrene
20. 4 217-59-4 Triphenylene 40. 191-30-0 Dibenzo[a,l]pyrene
Benzene rings: the number of 6-membered (or 6-sided) aromatic rings in the structure—a + in this column indicates one additional 4- or 5-sided ring within the structure. CAS No.: Chemical Abstracts Service registry number. PAC: polycyclic aromatic compound. In this column, the compounds in shaded cells represent 9 of 13 PACs recently listed by IARC as their preliminary list of agents to be reviewed for asphalt and asphalt fumes.
Table 2.7. Average temperature of the asphalt mat directly behind the screed for each experiment.
Mix Temperature Behind Screed (°C) Difference (°C)
HMA, Indiana 126 Indiana reference
Gencor Foam 114 12
Evotherm 3G 111 15
Heritage Wax 116 10
HMA, New York 161 New York reference
Cecabase RT 106 55
SonneWarmix 109 52
BituTech PER 117 44
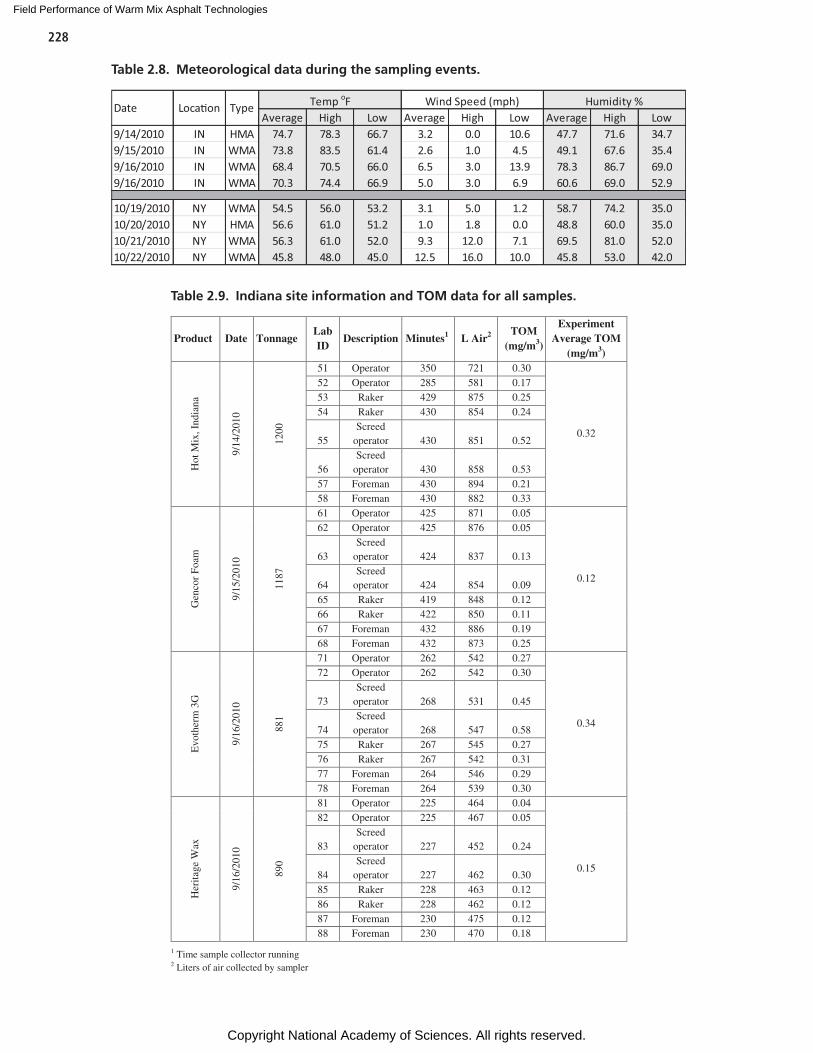
Field Performance of Warm Mix Asphalt Technologies
Copyright National Academy of Sciences. All rights reserved.
228
Average High Low Average High Low Average High Low9/14/2010 IN HMA 74.7 78.3 66.7 3.2 0.0 10.6 47.7 71.6 34.79/15/2010 IN WMA 73.8 83.5 61.4 2.6 1.0 4.5 49.1 67.6 35.49/16/2010 IN WMA 68.4 70.5 66.0 6.5 3.0 13.9 78.3 86.7 69.09/16/2010 IN WMA 70.3 74.4 66.9 5.0 3.0 6.9 60.6 69.0 52.9
10/19/2010 NY WMA 54.5 56.0 53.2 3.1 5.0 1.2 58.7 74.2 35.010/20/2010 NY HMA 56.6 61.0 51.2 1.0 1.8 0.0 48.8 60.0 35.010/21/2010 NY WMA 56.3 61.0 52.0 9.3 12.0 7.1 69.5 81.0 52.010/22/2010 NY WMA 45.8 48.0 45.0 12.5 16.0 10.0 45.8 53.0 42.0
Temp oF Wind Speed (mph) Humidity %Date Loca�on Type
Table 2.8. Meteorological data during the sampling events.
Product Date Tonnage Lab ID
Description Minutes1 L Air2 TOM (mg/m3)
Experiment Average TOM
(mg/m3)
Hot
Mix
, Ind
iana
9/14
/201
0
1200
51 Operator 350 721 0.30
0.32
52 Operator 285 581 0.17 53 Raker 429 875 0.25 54 Raker 430 854 0.24
55 Screed
operator 430 851 0.52
56 Screed
operator 430 858 0.53 57 Foreman 430 894 0.21 58 Foreman 430 882 0.33
Gen
cor
Foam
9/15
/201
0
1187
61 Operator 425 871 0.05
0.12
62 Operator 425 876 0.05
63 Screed
operator 424 837 0.13
64 Screed
operator 424 854 0.09 65 Raker 419 848 0.12 66 Raker 422 850 0.11 67 Foreman 432 886 0.19 68 Foreman 432 873 0.25
Evo
ther
m 3
G
9/16
/201
0
881
71 Operator 262 542 0.27
0.34
72 Operator 262 542 0.30
73 Screed
operator 268 531 0.45
74 Screed
operator 268 547 0.58 75 Raker 267 545 0.27 76 Raker 267 542 0.31 77 Foreman 264 546 0.29 78 Foreman 264 539 0.30
Her
itage
Wax
9/16
/201
0
890
81 Operator 225 464 0.04
0.15
82 Operator 225 467 0.05
83 Screed
operator 227 452 0.24
84 Screed
operator 227 462 0.30 85 Raker 228 463 0.12 86 Raker 228 462 0.12 87 Foreman 230 475 0.12 88 Foreman 230 470 0.18
1 Time sample collector running 2 Liters of air collected by sampler
Table 2.9. Indiana site information and TOM data for all samples.
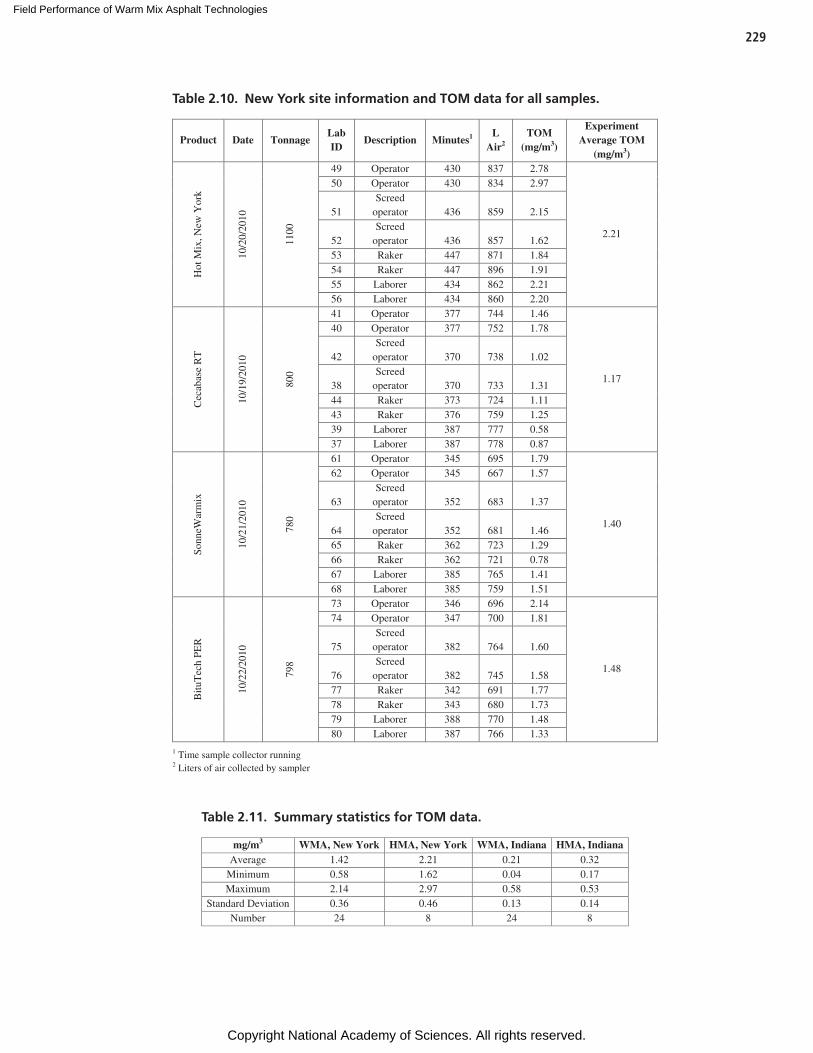
Field Performance of Warm Mix Asphalt Technologies
Copyright National Academy of Sciences. All rights reserved.
229
Product Date Tonnage Lab ID
Description Minutes1 L Air2
TOM (mg/m3)
Experiment Average TOM
(mg/m3)
Hot
Mix
, New
Yor
k
10/2
0/20
10
1100
49 Operator 430 837 2.78
2.21
50 Operator 430 834 2.97
51 Screed
operator 436 859 2.15
52 Screed
operator 436 857 1.62 53 Raker 447 871 1.84 54 Raker 447 896 1.91 55 Laborer 434 862 2.21 56 Laborer 434 860 2.20
Cec
abas
e R
T
10/1
9/20
10
800
41 Operator 377 744 1.46
1.17
40 Operator 377 752 1.78
42 Screed
operator 370 738 1.02
38 Screed
operator 370 733 1.31 44 Raker 373 724 1.11 43 Raker 376 759 1.25 39 Laborer 387 777 0.58 37 Laborer 387 778 0.87
Sonn
eWar
mix
10/2
1/20
10
780
61 Operator 345 695 1.79
1.40
62 Operator 345 667 1.57
63 Screed
operator 352 683 1.37
64 Screed
operator 352 681 1.46 65 Raker 362 723 1.29 66 Raker 362 721 0.78 67 Laborer 385 765 1.41 68 Laborer 385 759 1.51
Bitu
Tec
h PE
R
10/2
2/20
10
798
73 Operator 346 696 2.14
1.48
74 Operator 347 700 1.81
75 Screed
operator 382 764 1.60
76 Screed
operator 382 745 1.58 77 Raker 342 691 1.77 78 Raker 343 680 1.73 79 Laborer 388 770 1.48 80 Laborer 387 766 1.33
1 Time sample collector running 2 Liters of air collected by sampler
Table 2.10. New York site information and TOM data for all samples.
mg/m3 WMA, New York HMA, New York WMA, Indiana HMA, Indiana Average 1.42 2.21 0.21 0.32
Minimum 0.58 1.62 0.04 0.17 Maximum 2.14 2.97 0.58 0.53
Standard Deviation 0.36 0.46 0.13 0.14 Number 24 8 24 8
Table 2.11. Summary statistics for TOM data.
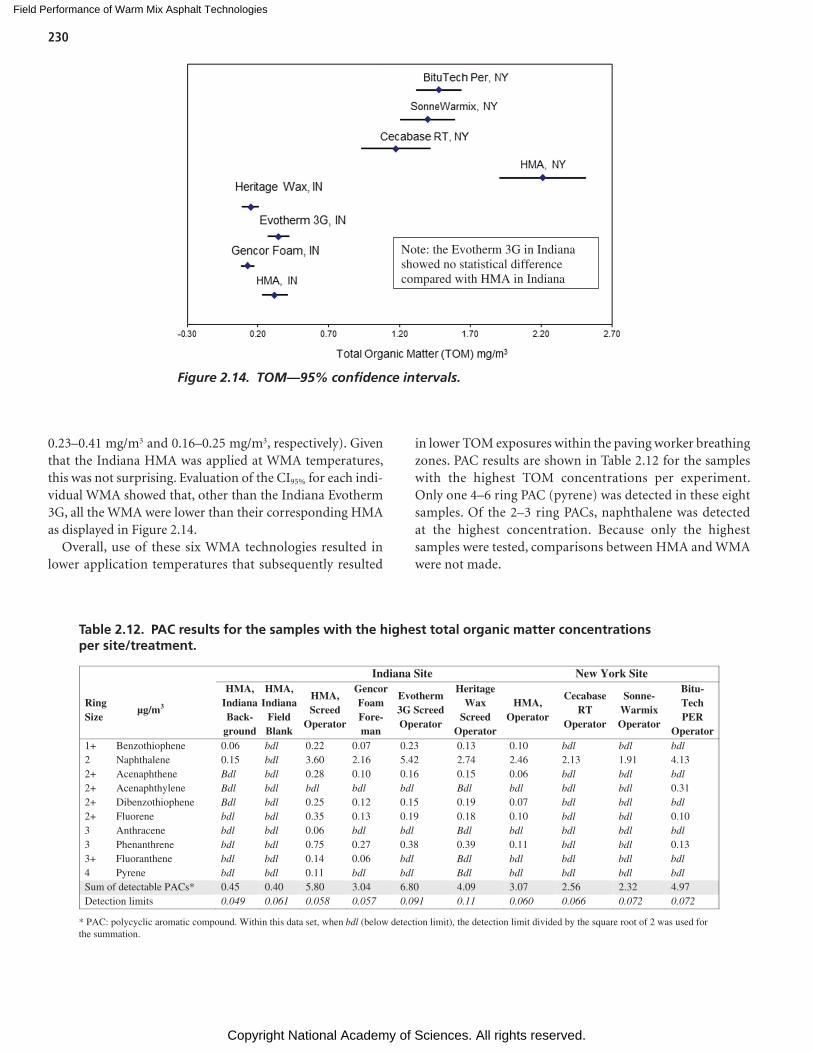
Field Performance of Warm Mix Asphalt Technologies
Copyright National Academy of Sciences. All rights reserved.
230
0.23–0.41 mg/m3 and 0.16–0.25 mg/m3, respectively). Given that the Indiana HMA was applied at WMA temperatures, this was not surprising. Evaluation of the CI95% for each indi-vidual WMA showed that, other than the Indiana Evotherm 3G, all the WMA were lower than their corresponding HMA as displayed in Figure 2.14.
Overall, use of these six WMA technologies resulted in lower application temperatures that subsequently resulted
in lower TOM exposures within the paving worker breathing zones. PAC results are shown in Table 2.12 for the samples with the highest TOM concentrations per experiment. Only one 4–6 ring PAC (pyrene) was detected in these eight samples. Of the 2–3 ring PACs, naphthalene was detected at the highest concentration. Because only the highest samples were tested, comparisons between HMA and WMA were not made.
Table 2.12. PAC results for the samples with the highest total organic matter concentrations per site/treatment.
Indiana Site New York Site
RingSize
µg/m3
HMA, Indiana Back-
ground
HMA, Indiana
Field Blank
HMA, Screed
Operator
Gencor Foam Fore-man
Evotherm3G ScreedOperator
Heritage Wax
Screed Operator
HMA, Operator
Cecabase RT
Operator
Sonne-Warmix Operator
Bitu-Tech PER
Operator1+ Benzothiophene 0.06 bdl 0.22 0.07 0.23 0.13 0.10 bdl bdl bdl2 Naphthalene 0.15 bdl 3.60 2.16 5.42 2.74 2.46 2.13 1.91 4.132+ Acenaphthene Bdl bdl 0.28 0.10 0.16 0.15 0.06 bdl bdl bdl2+ Acenaphthylene Bdl bdl bdl bdl bdl Bdl bdl bdl bdl 0.312+ Dibenzothiophene Bdl bdl 0.25 0.12 0.15 0.19 0.07 bdl bdl bdl2+ Fluorene bdl bdl 0.35 0.13 0.19 0.18 0.10 bdl bdl 0.103 Anthracene bdl bdl 0.06 bdl bdl Bdl bdl bdl bdl bdl3 Phenanthrene bdl bdl 0.75 0.27 0.38 0.39 0.11 bdl bdl 0.133+ Fluoranthene bdl bdl 0.14 0.06 bdl Bdl bdl bdl bdl bdl4 Pyrene bdl bdl 0.11 bdl bdl Bdl bdl bdl bdl bdlSum of detectable PACs* 0.45 0.40 5.80 3.04 6.80 4.09 3.07 2.56 2.32 4.97Detection limits 0.049 0.061 0.058 0.057 0.091 0.11 0.060 0.066 0.072 0.072
* PAC: polycyclic aromatic compound. Within this data set, when bdl (below detection limit), the detection limit divided by the square root of 2 was used for the summation.
Note: the Evotherm 3G in Indiana showed no statistical difference compared with HMA in Indiana
Figure 2.14. TOM—95% confidence intervals.
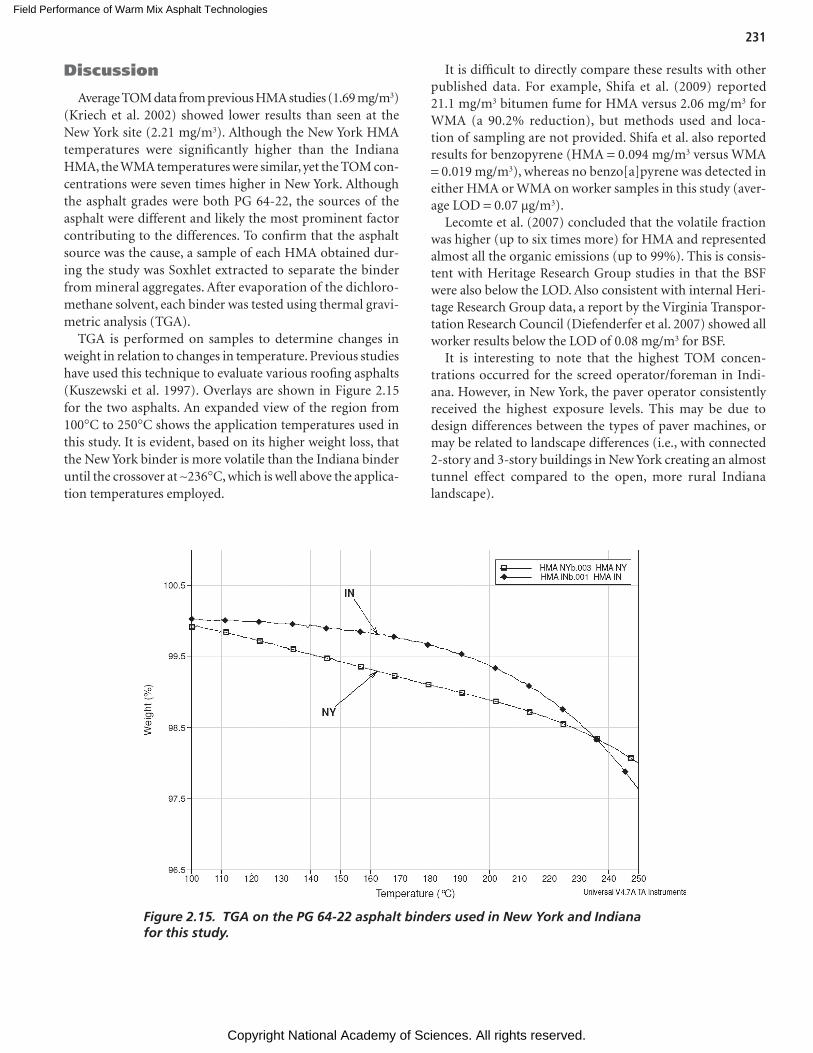
Field Performance of Warm Mix Asphalt Technologies
Copyright National Academy of Sciences. All rights reserved.
231
Figure 2.15. TGA on the PG 64-22 asphalt binders used in New York and Indiana for this study.
Discussion
Average TOM data from previous HMA studies (1.69 mg/m3) (Kriech et al. 2002) showed lower results than seen at the New York site (2.21 mg/m3). Although the New York HMA temperatures were significantly higher than the Indiana HMA, the WMA temperatures were similar, yet the TOM con-centrations were seven times higher in New York. Although the asphalt grades were both PG 64-22, the sources of the asphalt were different and likely the most prominent factor contributing to the differences. To confirm that the asphalt source was the cause, a sample of each HMA obtained dur-ing the study was Soxhlet extracted to separate the binder from mineral aggregates. After evaporation of the dichloro-methane solvent, each binder was tested using thermal gravi-metric analysis (TGA).
TGA is performed on samples to determine changes in weight in relation to changes in temperature. Previous studies have used this technique to evaluate various roofing asphalts (Kuszewski et al. 1997). Overlays are shown in Figure 2.15 for the two asphalts. An expanded view of the region from 100°C to 250°C shows the application temperatures used in this study. It is evident, based on its higher weight loss, that the New York binder is more volatile than the Indiana binder until the crossover at ~236°C, which is well above the applica-tion temperatures employed.
It is difficult to directly compare these results with other published data. For example, Shifa et al. (2009) reported 21.1 mg/m3 bitumen fume for HMA versus 2.06 mg/m3 for WMA (a 90.2% reduction), but methods used and loca-tion of sampling are not provided. Shifa et al. also reported results for benzopyrene (HMA = 0.094 mg/m3 versus WMA = 0.019 mg/m3), whereas no benzo[a]pyrene was detected in either HMA or WMA on worker samples in this study (aver-age LOD = 0.07 µg/m3).
Lecomte et al. (2007) concluded that the volatile fraction was higher (up to six times more) for HMA and represented almost all the organic emissions (up to 99%). This is consis-tent with Heritage Research Group studies in that the BSF were also below the LOD. Also consistent with internal Heri-tage Research Group data, a report by the Virginia Transpor-tation Research Council (Diefenderfer et al. 2007) showed all worker results below the LOD of 0.08 mg/m3 for BSF.
It is interesting to note that the highest TOM concen-trations occurred for the screed operator/foreman in Indi-ana. However, in New York, the paver operator consistently received the highest exposure levels. This may be due to design differences between the types of paver machines, or may be related to landscape differences (i.e., with connected 2-story and 3-story buildings in New York creating an almost tunnel effect compared to the open, more rural Indiana landscape).
Field Performance of Warm Mix Asphalt Technologies
Copyright National Academy of Sciences. All rights reserved.
232
All TOM results were above the LOD, demonstrating that it is a useful measure for assessing reductions in worker breathing zone exposures with the use of WMA. Results for these two sites appeared to bracket the high and low ends of the spectrum of asphalt paving worker breathing zone exposures.
Summary
• Overall, use of these six WMA technologies resulted in lower application temperatures compared to their corresponding HMA; yielding an average 36% reduc-tion in TOM exposures within the paving worker breath-ing zones.
• Exposures using WMA are not the same across technologies.
• Twenty-two of the 40 individual PACs tested were below the LOD for the eight samples tested.
– Naphthalene was detected at the highest concentration. – Only one 4–6 ring PAC (pyrene) was detected in any
of these worker breathing zone samples and it was in a HMA sample.
– The nine PACs tested that are part of the compounds IARC has reviewed for asphalt, asphalt fumes, and some heterocyclic PACs were all below the LOD.
– Since only one 4-ring PAC was detected, it is unlikely that the 6-ring compounds not included in this study were present.
– Not all asphalts are the same; in this study, the different sources resulted in significantly different breathing zone exposure levels.
Field Performance of Warm Mix Asphalt Technologies
Copyright National Academy of Sciences. All rights reserved.
233
Findings
An objective of NCHRP Project 9-47A was to provide rela-tive emissions measurements of warm mix asphalt (WMA) technologies as compared to conventional hot mix asphalt (HMA). NCHRP Report 779 addresses this objective in terms of fuel usage, plant stack emissions, and worker exposure. The research conducted under this portion of NCHRP Proj-ect 9-47A included the following actions:
1. Monitoring fuel usage for six of eight projects that con-sisted of seven HMA control mixtures and 11 WMA mixtures.
2. Measuring stack emissions of duplicate production runs at three projects that had a total of three HMA (control) and eight WMA mixtures (22 total measurements).
3. Refining procedures for collecting and analyzing worker exposure based on literature review and previous testing of HMA and WMA mixtures to use total organic matter (TOM) instead of benzene soluble fraction (BSF).
4. Collecting worker exposure during a production day to TOM at two multi-technology projects that consisted of two HMA controls and six WMA mixes.
5. Developing revised recommendations for monitoring fuel usage using stack emission data to evaluate perceived energy usage for asphalt mixture production using natural gas and reclaimed oil fuels.
Based on the study, the Test Framework for Documenting Emissions and Energy Reductions of WMA and Conventional HMA was revised.
Fuel Usage
Data were presented to show the importance of compar-ing the energy usage of new technologies, such as WMA, to HMA over similar, typically short, steady-state, time frames.
Historical fuel usage data, available for HMA, typically include fuel used for plant start-up, plant waste, and end of run cleanout. In NCHRP Project 9-47A, the average reduc-tion in mix temperature of 48°F (27°C) associated with WMA production resulted in average fuel savings of 22.1%. This was higher than predictions based on thermodynamic material properties. The increased fuel savings appear to result from larger than expected casing losses—heat radiated through the plant’s metal into the surrounding environment instead of being transferred to the mix for both HMA and WMA. Potential errors were identified for direct measures of fuel usage such as tank sticks and gas meter readings by comparing measured fuel usage to fuel usage calculated from stoichiometric plant stack emissions. Gas meters were found to update usage only after large time intervals, on the order of 30 minutes for some meters, inducing error. Best practices suggest using methodologies to reduce aggregate stockpile moisture, such as sloping stockpile areas away from plant, loading on high side of sloped surface, and covering stockpiles with high fines content to reduce fuel usage. Significant fuel savings were demonstrated for one project with low stockpile moisture contents. Another recommended best practice for improving plant fuel efficiency is to conduct routine burner maintenance including nozzle cleaning and tuning of linkages to achieve proper fuel to air ratios over the plant’s normal pro-duction rates. One plant in this study had a 24.8% reduction in fuel usage after burner tuning.
Stack Emissions
Greenhouse gas emissions such as carbon dioxide (CO2) decreased with reduced fuel usage. Carbon monoxide (CO) and volatile organic compound (VOC) measurements appear to be more related to burner maintenance and tuning and less related to reductions in fuel usage and consequently the use of WMA. One project, with a parallel-flow dryer using reclaimed oil as fuel, indicated a reduction in VOC when producing
C H A P T E R 5
Findings and Conclusions
Field Performance of Warm Mix Asphalt Technologies
Copyright National Academy of Sciences. All rights reserved.
234
WMA. Significant reductions in sulfur dioxide (SO2) were observed for the same project. The two other projects used natural gas as fuel, which has lower sulfur content. Nitrogen oxides (NOx) are a precursor to the formation of ground-level ozone. NOx emissions are also higher for fuel oils compared to natural gas. With one exception, small reductions in NOx were noted for WMA. For the exception, the burner was set at 26% of its firing rate for the WMA, compared to 75% for the corresponding HMA at the same production rate. This low firing rate may have resulted in extra excess air, con-tributing to NOx formation. Formaldehyde is classified as a hazardous air pollutant. It is a byproduct of the combustion of carbon-based fuels. The distribution of WMA formal-dehyde measurements was lower for WMA than for HMA and comparable to state-of-art performance observed in the mid-Atlantic states.
Worker Exposure
Worker exposure to asphalt fumes has typically been assessed by measuring BSF. In studies comparing worker exposure between HMA and WMA, most cases have found BSF below detectable limits. Thus, quantitative comparisons could not be made. For NCHRP Project 9-47A, Heritage Research Group utilized the newly developed TOM measure. Worker exposure was measured at two multi-technology sites. At one site, HMA temperatures behind the screed were within the expected temperature range for WMA; the WMA mixes were, on average, only 12°C cooler. At the other site, mat temperatures immediately behind the screed were, on average, 50°C cooler. With one exception, the WMA mixtures at both sites resulted in at least a 33% reduction in TOM; the one exception was an 8.4% increase at the site where the HMA was placed at WMA temperatures. The reduction for five of six mixes was statistically significant at the 95% con-
fidence level. The asphalt at one site showed higher overall emissions in the temperature range typically associated with asphalt production.
The sample with the highest overall TOM from each mix/site combination was tested for polycyclic aromatic hydrocarbons (PAHs). Naphthalene was detected in the highest concentra-tions. Only one non-carcinogenic 4–6 ring polycyclic aromatic compound (PAC), pyrene, was detected and it was from an HMA sample. All of the nine PACs listed by IARC for asphalt were below detectable limits.
Conclusions
WMA demonstrated reductions in fuel usage. These reduc-tions can help offset the cost of WMA technologies or equip-ment. Reductions in stack emissions of greenhouse gases corresponded to reductions in fuel usage. WMA should receive credit for reductions in greenhouse gases in life-cycle assess-ments. WMA also resulted in reductions in SO2 when using high-sulfur fuels such as reclaimed oil.
The following revisions are proposed to the Test Frame-work for Documenting Emissions and Energy Reductions of WMA and Conventional HMA:
• Corresponding WMA and HMA measurements should be made over similar time periods of steady-state production to compare fuel usage and stack emissions of WMA and HMA.
• Direct fuel measurements (e.g., tank sticks, fuel meter, or gas meter readings) should be supplemented with stoi-chiometric fuel measurements in accordance with EPA Method 19.
• Total organic matter (TOM) should replace benzene sol-uble fraction (BSF) for quantitative comparison of WMA and HMA worker exposure.
Field Performance of Warm Mix Asphalt Technologies
Copyright National Academy of Sciences. All rights reserved.
235
Asphalt Institute and Eurobitume. The Bitumen Industry—A Global Perspective, Production, Chemistry, Use, Specification, and Occu-pational Exposure. 2nd ed. (2011). Available electronically at: http://www.asphaltinstitute.org/public/IS230_2ndedition.pdf.
Bajpai D., and V. K. Tyagi. Biodiesel: Source, Production, Composition, Properties and Its Benefits. J Oleo Sci. 55(10), 2006, pp. 487–502.
Cavallari, J. M., L. V. Osborn, J. E. Snawder, A. J. Kriech, L. D. Olsen, R. F. Herrick, and M. D. McClean. Predictors of Airborne Exposures to Polycyclic Aromatic Compounds and Total Organic Matter among Hot-Mix Asphalt Paving Workers and Influence of Work Condi-tions and Practices. Ann Occup Hyg. 56(2), 2011, pp. 138–147.
Cervarich, M. Foaming the Asphalt: New Warm-Mix Technique Chal-lenges Conventional Wisdom. Hot Mix Asphalt Technology, 12(4), July/August 2007, National Asphalt Pavement Association, Lanham, MD, pp. 23–24, 42.
Chief Environmental Group, LTD. Emission Test Results for: Warm Mix Asphalt Trial Project Mar-Zane Materials, Inc. Asphalt Plant #13, Byesville, Ohio. No Date.
Clark, C. R., D. M. Burnett, C. M. Parker, E. W. Arp, M. S. Swanson, G. D. Minsavage, A. J. Kriech, L. V. Osborn, J. J. Freeman, R. A. Barter, P. E. Newton, and C. W. Stewart. Asphalt Fume Dermal Carcinogenicity Potential: I. Dermal Carcinogenicity Evaluation of Asphalt (Bitumen) Fume Condensates. Reg Tox Pharmacol, April 18, 2011 (e-pub).
D’Angelo, J., E. Harm, J. Bartoszek, G. Baumgardner, M. Corrigan, J. Cowsert, T. Harman, M. Jamshidi, W. Jones, D. Newcomb, B. D. Prowell (report facilitator), R. Sines, and B. Yeaton, Warm-Mix Asphalt: European Practice. International Technology Scanning Program, Federal Highway Administration, December 2007.
Davidson, J. K. Evotherm Trial in Aurora, Ontario, on August 8, 2005. McAsphalt Engineering Services, Toronto, Ontario. 2005a.
Davidson, J. K. Evotherm Trial, Ramara Township, Road 46. McAsphalt Engineering Services, Toronto, Ontario, December 2005b.
Davidson, J. K., and R. Pedlow. Reducing Paving Emissions Using Warm Mix Technology. Proc. of the 52nd Annual Conference of the Canadian Technical Asphalt Association, 2007, pp. 39–59.
Diefenderfer, S. D., K. K. McGhee, B. M. Donaldson. Installation of Warm Mix Asphalt Projects in Virginia. Virginia Transportation Research Council and U.S. Department of Transportation, Federal Highway Administration. VTRC 07-R25, April 2007.
EES Group Inc., Asphalt Emissions Study. Prepared for Shelly & Sands, Inc., October, 2006.
ETE. Warm Mix Stack Emission Test, Environmental Technology & Engineering Corporation, Elm Grove, WI, June, 20, 2006.
Fuhst, R., O. Creutzenberg, H. Ernst, T. Hansen, G. Pohlmann, A. Preiss, S. Rittinghausen. 24 Months Inhalation Carcinogenicity Study of Bitumen Fumes in Wistar (WU) Rats. J. Occup. Environ. Hyg. 4(S1), 2007, pp. 20–43.
Harder, G. A. LEA Half-Warm Mix Paving Report, 2007 Projects for NYSDOT. McConnaughay Technologies, Cortland, NY, 2008.
Harder, G., Y. Le Goff, A. Loustau, Y. Martineau, B. Heritier, and A. Romier. Energy and Environmental Gains of Warm and Half-Warm Asphalt Mix: Quantitative Approach. Paper #08-2456. Pre-sented at 87th Annual Meeting of the Transportation Research Board, Washington, D.C., 2008.
Hurley, G., B. Prowell, and A. Kvasnak. Missouri Field Trial of Warm Mix Asphalt Technologies: Construction Summary. NCAT Report No. 10-02. National Center for Asphalt Technology, Auburn, AL, June 2010a.
Hurley, G., B. Prowell, and A. Kvasnak. Wisconsin Field Trial of Warm Mix Asphalt Technologies: Construction Summary. NCAT Report No. 10-04. National Center for Asphalt Technology, Auburn, AL, November 2010b.
International Agency for Research on Cancer. IARC Monographs on the Evaluation of Carcinogenic Risks to Humans. Available online at: http://monographs.iarc.fr/. Accessed March 2012.
Koenders, B., D. Stoker, C. Bowen, P. de Groot, O. Larsen, D. Hardy, K. Wilms. Innovative Process in Asphalt Production and Placement to Obtain Lower Operating Temperatures. Presented at 2nd Eurasphalt & Eurobitume Congress, Barcelona, Spain, 2000.
Kriech A. J., J. T. Kurek, H. L. Wissel, L. V. Osborn, and G. R. Blackburn. Evaluation of Worker Exposure to Asphalt Paving Fumes Using Traditional and Nontraditional Techniques. AIHAJ 63(5), 2002a, pp. 628–635.
Kriech A. J., J. T. Kurek, L. V. Osborn, H. L. Wissel and B. J. Sweeney. Determination of Polycyclic Aromatic Compounds in Asphalt and in Corresponding Leachate Water. Polycycl Aromat Cmpd. 22(3–4), 2002b, pp. 517–535.
Kriech, A. J., J. E. Snawder, R. F. Herrick, L. D. Olsen, M. D. McClean, J. M. Cavallari, L. V. Osborn and G. R. Blackburn. Study Design and Methods to Investigate Inhalation and Dermal Exposure to Polycyclic Aromatic Compounds and Urinary Metabolites from Asphalt Paving Workers: Research Conducted Through Partner-ship. Polycycl Aromat Cmpd. 31(4), 2011, pp. 243–269.
Kuszewski, J. R., W. B. Gorman, and E. G. Kane. Characterization of Asphalt Volatility Using TGA and Iatroscan Analyses. Proceedings of the 4th International Symposium on Roofing Technology, NRCA, Rosemont, IL, 1997.
References
Field Performance of Warm Mix Asphalt Technologies
Copyright National Academy of Sciences. All rights reserved.
236
Lauby-Secretan, B., R. Baan, Y. Grosse, F. El Ghissassi, V. Bouvard, V. Benbrahim-Tallaa, et al. Bitumens and Bitumen Emissions, and Some Heterocyclic Polycyclic Aromatic Hydrocarbons. Lancet Oncol. 12(13), 2011, pp. 1190–1191.
Lecomte, M., F. Deygout, A. Menetti. Emission and Occupational Exposure at Lower Asphalt Production and Laying Temperatures. WAM Environmental Benefits of Reducing Asphalt Production and Laying Temperature, Shell Bitumen, 2007. Accessed from www.static.shell.com/static/bitumen/downloads/wam_field_test_results_italy.pdf. Accessed April 14, 2011.
McClean, M. D., L. V. Osborn, J. E. Snawder, L. D. Olsen, A. J. Kriech, A. Sjödin, Z. Li, J. P. Smith, D. L. Sammons, R. F. Herrick, and J. M. Cavallari. Using Urinary Biomarkers of Polycyclic Aromatic Compound Exposure to Guide Exposure-Reduction Strategies Among Asphalt Paving Workers. Ann Occup Hyg., September 20, 2012 (e-pub).
Middleton, B., and R. W. Forfylow. An Evaluation of Warm Mix Asphalt Produced With The Double Barrel Green Process. Transportation Research Record: Journal of the Transportation Research Board, Vol. 2126, Transportation Research Board of the National Acad-emies, 2009.
National Asphalt Pavement Association and European Asphalt Pave-ment Association. The Asphalt Paving Industry, A Global Perspective. GL 101, 2nd ed., 2011.
National Institute for Occupational Safety and Health. Benzene Solu-ble Fraction and Total Particulate (Asphalt Fume): Method 5042. In: Eller P. M., and M. E. Cassinelli, eds., NIOSH Manual of Ana-lytical Methods, 4th ed., 2nd supplement. DHHS (NIOSH) Pub-lication No. 98-119. Cincinnati, OH: U.S. Department of Health and Human Services, Public Health Service, Centers for Disease Control and Prevention, National Institute for Occupational Safety and Health, 1998.
National Institute for Occupational Safety and Health: Hazard Review: Health Effects of Occupational Exposure to Asphalt. DHHS (NIOSH) Publication No. 2001-110. U.S. Department of Health and Human Services, Public Health Service, Centers for Disease Control and Prevention, National Institute for Occupational Safety and Health, 2001.
Newcomb, D. An Introduction to Warm-Mix Asphalt. National Asphalt Pavement Association. Accessed from http://fs1.hotmix.org/mbc/Introduction_to_Warm-mix_Asphalt.pdf. Accessed August 8, 2007.
Norseth, T., J. Waage, and I. Dale. Acute Effects and Exposure to Organic Compounds in Road Maintenance Workers Exposed to Asphalt. Amer J Ind Med. 20, 1991, pp. 737–744.
Olsson, A., H. Kromhout, M. Agostini, J. Hansen, C. F. Lassen, C. Johansen, K. Kjaerheim, S. Langård, I. Stücker, W. Ahrens, T. Behrens, M. L. Lindbohm, P. Heikkilä, D. Heederik, L. Portengen, J. Shaham, G. Ferro, F. de Vocht, I. Burstyn, and P. Boffetta. A Case-Control Study of Lung Cancer Nested in a Cohort of European Asphalt Workers. Environ. Health Persp. 118, 2010, pp. 1418–1424.
Powers, D. Warm Mix Asphalt 2008 ODOT Field Trials. Presented at 2009 Ohio Asphalt Paving Conference, February 4, 2009.
Prowell, B. D., G. C. Hurley, and B. Frank, Warm Mix Asphalt: Best Prac-tices, 3rd ed. (2012). Quality Improvement Series 125, National Asphalt Pavement Association, Lanham, MD, 2012.
Raulf-Heimsoth, M., B. Pesch, B. Kendzia, A. Spickenheuer, R. Bramer, B. Marczynski, R. Merget, and T. Brüning. Irritative Effects of Vapours and Aerosols of Bitumen on the Airways Assessed by Non-Invasive Methods. Arch Toxicol. 1, 2011, pp. 41–52.
RTI International. Emission Factor Documentation for AO-42 Section 11.1 Hot Mix Asphalt Plants. Final Report. U.S. Environmental Protection Agency, February 2004.
Shell Bitumen. Asphalt Production and Laying Temperature. Accessed from www.static.shell.com/static/bitumen-en/ . . . /wrc/ . . . /wam_english.pdf.
Shifa, X., X. Liting, J. Jonathan, X. Yongquing. The Application of Emul-sion Warm Mix Asphalt in Long Tunnel Pavement. Geotechnical Special Publ., No. 193, 2009.
Tepper A. L., G. A. Burr, H. A. Feng, M. Singal, A. K. Miller, K. W. Hanley, and L. D. Olsen. Acute Symptoms Associated with Asphalt Fume Exposure Among Road Pavers. Am. J Ind Med. 49, 2006, pp. 728–739.
Ventura, A., P. Moneron, A. Jullien, P. Tamagny, F. Olard, and D. Zavan. Environmental Comparison at Industrial Scale of Hot and Half-Warm Mix Asphalt Manufacturing Processes. Paper #09-1274, presented at 88th Annual Meeting of the Transportation Research Board, Washington, D.C., 2009.
Von Devivere, M., W. Barthel, and J-P. Marchand. Warm Asphalt Mixes by Adding Aspha-min, a Synthetic Zeolite. XXIInd PIARC World Road Congress, Durban, South Africa, 2003.
WMA TWG. “Documenting Emissions and Energy Reductions of WMA and Conventional HMA.” August 2006. Accessed from www.warmmixasphalt.com. Accessed November 6, 2013.
Field Performance of Warm Mix Asphalt Technologies
Copyright National Academy of Sciences. All rights reserved.
237
A P P E N D I X
Documenting Emissions and Energy Reductions of WMA and Conventional HMA During Plant and Paving Operations
Field Performance of Warm Mix Asphalt Technologies
Copyright National Academy of Sciences. All rights reserved.
238
PROPOSED REVISION
Project Summary
Attached is a project summary data entry sheet for use in identifying warm mix asphalt (WMA) technologies and binder characteristics, aggregate, and plant type. As indicated on the project summary data entry sheet, recorded information will include:
WMA technology and binder characteristics, Reclaimed asphalt pavement (RAP) usage/rate (if applicable), Recycled asphalt shingle (RAS) usage/rate (if applicable),Aggregate type(s),Aggregate moisture content,Anti-stripping agent or other additives, and Plant type.
Plant Emissions Stack Testing and Energy Requirements
Introduction:Stack testing should include mass emissions rate measurement of NOx, CO2, and volatile organic compounds (VOC) to compare stack emissions from WMA technologies and conventional hot mix asphalt (HMA). It is suggested that stack emissions reporting be standardized as lbs. per ton (of mix produced) and include a recording and reporting of average production rate in tons HMA or WMA produced per hour, during each test period. Testing should be performed by a certified tester and should include either two (2) or three (3) 60-minute stack sampling runs per technology, if possible. The number of runs may have to be adjusted to the available run time using the WMA technology.Production rates should be recorded every 15 minutes during each test run and used to determineaverage production rate in tons mix produced per hour for each run. The data from all individual testruns during a test period (conventional HMA or WMA) should be averaged to determine the overallresults for each technology. Stack gas volumetric flow rate based on full traverse of stack cross section during hour run, moisture content, temperature, and a variety of other parameters should alsobe determined for each run, in accordance with United States Environmental Protection Agency (U.S. EPA) stack testing methodology.
In order to assess fossil fuel and energy use reductions, it is suggested that beginning and endfuel usage data be recorded for each test run. This may be accomplished with direct fuel usage meter readout, where available, or by tank gauging as appropriate. To validate accuracy of direct fuelmeasurements, stoichiometric fuel usage calculations should be made from stack gas flow rate inaccordance with U.S. EPA Method 19.
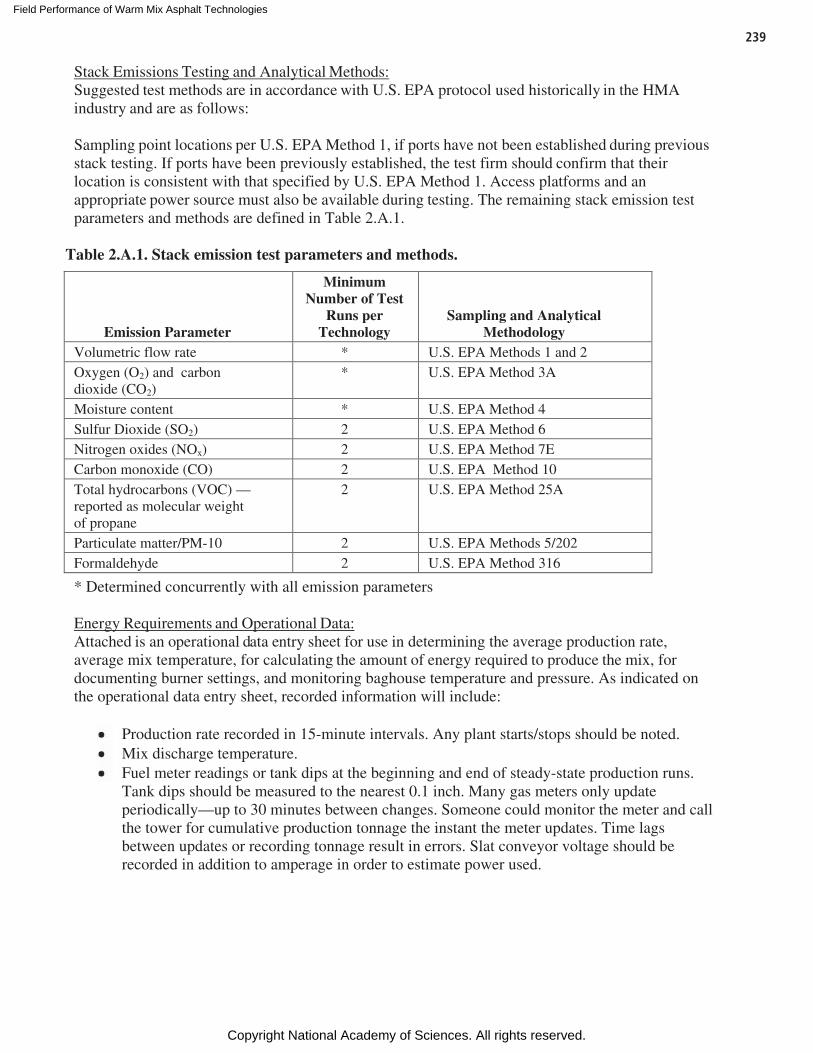
Field Performance of Warm Mix Asphalt Technologies
Copyright National Academy of Sciences. All rights reserved.
239
Stack Emissions Testing and Analytical Methods:Suggested test methods are in accordance with U.S. EPA protocol used historically in the HMAindustry and are as follows:
Sampling point locations per U.S. EPA Method 1, if ports have not been established during previousstack testing. If ports have been previously established, the test firm should confirm that theirlocation is consistent with that specified by U.S. EPA Method 1. Access platforms and anappropriate power source must also be available during testing. The remaining stack emission testparameters and methods are defined in Table 2.A.1.
Table 2.A.1. Stack emission test parameters and methods.
Emission Parameter
Minimum Number of Test
Runs per Technology
Sampling and Analytical Methodology
Volumetric flow rate * U.S. EPA Methods 1 and 2 Oxygen (O2) and carbondioxide (CO2)
* U.S. EPA Method 3A
Moisture content * U.S. EPA Method 4 Sulfur Dioxide (SO2) 2 U.S. EPA Method 6 Nitrogen oxides (NOx) 2 U.S. EPA Method 7ECarbon monoxide (CO) 2 U.S. EPA Method 10Total hydrocarbons (VOC) —reported as molecular weight of propane
2 U.S. EPA Method 25A
Particulate matter/PM-10 2 U.S. EPA Methods 5/202 Formaldehyde 2 U.S. EPA Method 316
* Determined concurrently with all emission parameters
Energy Requirements and Operational Data:Attached is an operational data entry sheet for use in determining the average production rate, average mix temperature, for calculating the amount of energy required to produce the mix, for documenting burner settings, and monitoring baghouse temperature and pressure. As indicated onthe operational data entry sheet, recorded information will include:
Production rate recorded in 15-minute intervals. Any plant starts/stops should be noted.Mix discharge temperature. Fuel meter readings or tank dips at the beginning and end of steady-state production runs. Tank dips should be measured to the nearest 0.1 inch. Many gas meters only updateperiodically—up to 30 minutes between changes. Someone could monitor the meter and call the tower for cumulative production tonnage the instant the meter updates. Time lags between updates or recording tonnage result in errors. Slat conveyor voltage should berecorded in addition to amperage in order to estimate power used.
Field Performance of Warm Mix Asphalt Technologies
Copyright National Academy of Sciences. All rights reserved.
240
Suggested Reporting of Stack Emissions and Energy Results:ggAverage mix production rate in tons/hour
- Conventional mix test period- WMA test period
Pounds of each pollutant per ton of mix produced - Carbon dioxide, nitrogen oxides, total hydrocarbons, carbon monoxide, sulfur oxides,
fine particulates (PM-10), and formaldehyde- Conventional test period (average all runs) - WMA test period (average all runs)
Fossil fuel usage—Gallons or cubic feet gas/ton mix - Type of fuel used (i.e., #2 oil, natural gas, other)- Conventional test period (average all runs) - WMA test period (average all runs) - Percent reduction corrected for differences in aggregate moisture content
Include appendix for field test data and calculations summary
Approximate Costs Associated with Stack Emissions Testing: Any travel costs, outside locality, are not included. Complex reporting of results will incur extra charges; this is not anticipated.Costs for developing test plans (test protocol) are not included; however, test plans are not anticipated to be needed.There are minimal differences in costs (+/- $300) associated with conducting either two orthree stack tests.Baseline costs are anticipated to be approximately $3,000–$5,000 per day.
- Multiple technologies (comparison with conventional HMA is an additionaltechnology) typically require a day per technology. Includes three stack tests.
- Includes simple reporting of results.- Formaldehyde, Sox, and PM-10 analysis add a small additional cost.- Costs are for a local company to conduct the emissions testing—travel costs would be
incurred for non-local companies.
Emissions Surrounding Laydown Operations
Introduction:Ideally, placement of each mix, conventional and WMA, would use the same paving equipment; material placed oneday apart, approximately during the same time-frame. To minimize variability,it is also recommended that the paving machines utilized are equipped with properly functioningengineering controls. The recommended test period, for field emissions, is between 3 and 4 hours. More detail follows.
Placement of Monitors:During the placement of each technology, conventional HMA and WMA, paving crew members willbe monitored for asphalt fume emissions. The purpose of this testing is to document, with somestatistical power, the reduction in field application emissions using WMA as compared with using conventional HMA. Monitoring four workers is recommended. The four workers with the greatest potential for asphalt emission exposure are: paver operator, screed operators, and raker. If diesel oil
Field Performance of Warm Mix Asphalt Technologies
Copyright National Academy of Sciences. All rights reserved.
241
is normally used as a release agent, a substitute such as B-100 (biodiesel) (CAS Number: 67784-80-9) should be used when monitoring laydown emissions.
Sampling and Analytical Method:Traditional gravimetric procedures used to quantify asphalt fume emissions such as National Institute for Occupational Safety and Health (NIOSH) Method 5042 measurements of total particulates (TP) and benzene soluble fraction (BSF) generally prevent quantitative comparisonsbetween HMA and WMA since most readings are below detectable limits. An alternate procedure to measure total organic matter (TOM) developed by Heritage Research Group, in conjunction with NIOSH Method 5042, is recommended.
Each worker to be monitored can be equipped with two samplers: the NIOSH 5042 sampler ifrequired, and a sorbent tube containing XAD-2 and charcoal (150 mg XAD-2 followed by 50 mgactivated charcoal). A 1-inch piece of Tygon® tubing (dichloromethane rinsed) is added to the end of the sorbent tube, once broken, to protect the workers. Care should be taken to break the inlet end of the tube to 4-mm to equal the NIOSH sampler. Set to a flow rate of 2.0 + 0.2 L/min., pumps should be calibrated pre-shift and re-measured post-shift. One background sample should be collected each day/experiment, positioned upwind of the paving operation. Sorbent tubes were eluted with 5 mL dichloromethane; charcoal end up.
A field blank should be collected on each day/experiment for each crew. If NIOSH 5042 is performed, this method requires five field blanks per day. Descriptive data should be collected on potential confounders from the site, e.g., construction dust and any other background interferences.One background sample per day, upwind of the paving operation, is highly recommended.
Keep completed samples dry and cold by placing them in a cooler with ice packs and protect themfrom light by wrapping them with foil. This allows further chemical-specific analysis, if warranted. Minimum field sampling collection times should be between 3 and 4 hours; 6 to 8 hours would be thepreferred sampling time using one single media cartridge.
TOM (Kriech et al. 2002) included hydrocarbons ranging from C6 to C42 as determined by gas chromatography/flame ionization detection (GC/FID). A Varian model 3400 GC with a 1077 split/splitless injector (set at 250°C) was used, with a 5% phenyl /95% methyl-polysiloxane column (30 m x 0.33 mm ID, 0.25 µm film thickness; Restek RTX-5); hydrogen carrier gas was set at2 mL/min. With detector at 310oC, the oven temperature program was 40°C held for 3 minutes, increased to 120oC at 9oC/min, held for 0.5 min, then ramped to 305oC at 11oC/min, and held for 10.89 min. Calibration should include kerosene standards for quantification of the TOM. The sample can also be tested for individual polycyclic aromatic compounds (PACs) and/or 4-6 ring PACs by Fluorescence spectroscopy (Osborn et al. 2001). A complete list of field equipment for monitoring lay down temperatures, collection of worker exposure samples, TOM testing, and PAC, testing (if desired), is shown in Table 2.A.2. Any equivalent or better instrumentation or supplies can be used; details are provided for convenience.
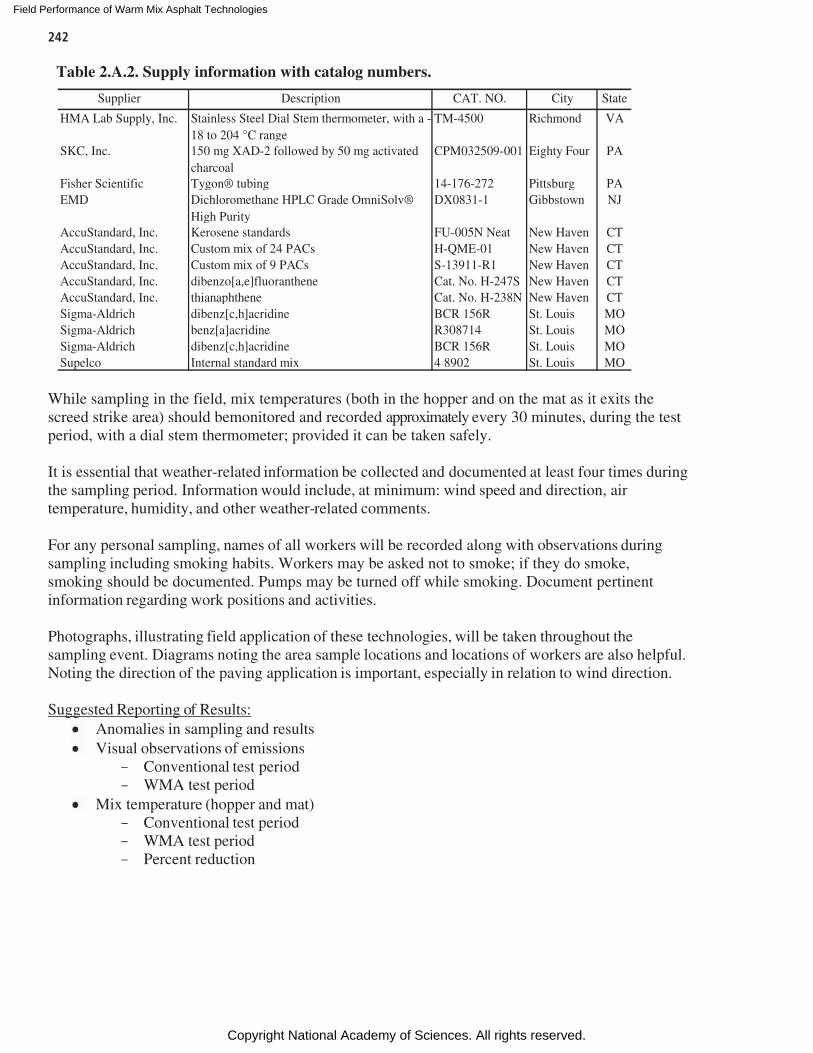
Field Performance of Warm Mix Asphalt Technologies
Copyright National Academy of Sciences. All rights reserved.
242
While sampling in the field, mix temperatures (both in the hopper and on the mat as it exits the screed strike area) should bemonitored and recorded approximately every 30 minutes, during the testperiod, with a dial stem thermometer; provided it can be taken safely.
It is essential that weather-related information be collected and documented at least four times duringthe sampling period. Information would include, at minimum: wind speed and direction, air temperature, humidity, and other weather-related comments.
For any personal sampling, names of all workers will be recorded along with observations duringsampling including smoking habits. Workers may be asked not to smoke; if they do smoke, smoking should be documented. Pumps may be turned off while smoking. Document pertinentinformation regarding work positions and activities.
Photographs, illustrating field application of these technologies, will be taken throughout thesampling event. Diagrams noting the area sample locations and locations of workers are also helpful.Noting the direction of the paving application is important, especially in relation to wind direction.
Suggested Reporting of Results:Anomalies in sampling and results Visual observations of emissions
- Conventional test period- WMA test period
Mix temperature (hopper and mat)- Conventional test period- WMA test period- Percent reduction
Supplier Description CAT. NO. City State
HMA Lab Supply, Inc. Stainless Steel Dial Stem thermometer, with a -18 to 204 °C range
TM-4500 Richmond VA
SKC, Inc. 150 mg XAD-2 followed by 50 mg activatedcharcoal
CPM032509-001 Eighty Four PA
Fisher Scientific Tygon® tubing 14-176-272 Pittsburg PAEMD Dichloromethane HPLC Grade OmniSolv®
High PurityDX0831-1 Gibbstown NJ
AccuStandard, Inc. Kerosene standards FU-005N Neat New Haven CTAccuStandard, Inc. Custom mix of 24 PACs H-QME-01 New Haven CTAccuStandard, Inc. Custom mix of 9 PACs S-13911-R1 New Haven CTAccuStandard, Inc. dibenzo[a,e]fluoranthene Cat. No. H-247S New Haven CTAccuStandard, Inc. thianaphthene Cat. No. H-238N New Haven CTSigma-Aldrich dibenz[c,h]acridine BCR 156R St. Louis MOSigma-Aldrich benz[a]acridine R308714 St. Louis MOSigma-Aldrich dibenz[c,h]acridine BCR 156R St. Louis MOSupelco Internal standard mix 4 8902 St. Louis MO
Table 2.A.2. Supply information with catalog numbers.

Field Performance of Warm Mix Asphalt Technologies
Copyright National Academy of Sciences. All rights reserved.
243
Weather data including ambient temperature and humidityWorker activitiesDiagrams and/or photographs documenting activities and sampling locationsNotation whether paver is equipped with functioning engineering (emission reduction) controls Background-corrected asphalt fume emissions (TP, BSF, and TOM) reportedin mg/m3
- Conventional test period (average all runs) - WMA test period (average all runs) - Percent reduction
Approximate Costs Associated with Occupational Hygiene Field Emissions Testing: Any travel costs, outside locality, are not included. Analytical costs are approximately $100 per sample (11 samples per 3–4 hourevent) x 2 events per day.Labor at approximately $110 per hour (10 hours) x 2 people. Report writing and miscellaneous at approximately $600.Baseline costs are anticipated to be approximately $5,000–$6,000.
- Per technology (comparison with conventional HMA is an additionaltechnology—i.e., a complete round of testing would be needed).
- Costs are for local hygienists to conduct the field monitoring—travel costs would be incurred for non-local hygienists.
- Monitoring equipment (pumps) may or may not be included in thelabor rates but should not substantially affect the estimated baselinecosts.

Field Performance of Warm Mix Asphalt Technologies
Copyright National Academy of Sciences. All rights reserved.
244
Data Collection FormsGeneral Plant Information
Project Identification: _______________________ Date: __________
Contractor: ______________________________________
Plant Location: __________________ GPS Coordinates: ______________
Plant Type: _______________________________________ (batch, counter-flow drum, parallel flow drum, or etc.)
Plant Manufacturer: _______________________________________________
Burner Model/Type: _______________________________________________
Fuel Type: __________________________ Fuel Temperature (if oil): ______
Describe any modifications for producing WMA: ______________________
________________________________________________________________
Binder, Aggregate, Additive Information
Binder Grade: _____________ Supplier: _____________
If modified, type of modification (e.g., polymer modified SBS): ____________
Anti-stripping Additive: ________________________ Dosage: _________
Warm Mix Asphalt Technology: _____________________________________
Aggregate Type(s): ________________________________________________(e.g., limestone, granite, or etc.)
RAP/RAS Usage/Rate: _____________________________________________
Aggregate Moisture ContentDate/Time Composite Moisture Content (%)
Truck Release Agent: ______________________________________________
Notes:

Field P
erformance of W
arm M
ix Asphalt T
echnologies
Copyright N
ational Academ
y of Sciences. A
ll rights reserved.
PROCESS DATA SHEET
HMA or WMA Technology: ___________________________ Date: ___________________ Page: ____
TimeProduction
Rate Burner % Mix Temp.
(°____)
AggregateTemp. (°____)
Stack Temp. (°____)
% Damper
Baghouse Delta
PressureTons
ProducedDrag
Amperage Comment
Fuel Reading Start of Run/Units/Time: _________________ Fuel Reading End of Run/Units/Time: _________________
Field Performance of Warm Mix Asphalt Technologies
Copyright National Academy of Sciences. All rights reserved.
Abbreviations and acronyms used without definitions in TRB publications:
A4A Airlines for AmericaAAAE American Association of Airport ExecutivesAASHO American Association of State Highway OfficialsAASHTO American Association of State Highway and Transportation OfficialsACI–NA Airports Council International–North AmericaACRP Airport Cooperative Research ProgramADA Americans with Disabilities ActAPTA American Public Transportation AssociationASCE American Society of Civil EngineersASME American Society of Mechanical EngineersASTM American Society for Testing and MaterialsATA American Trucking AssociationsCTAA Community Transportation Association of AmericaCTBSSP Commercial Truck and Bus Safety Synthesis ProgramDHS Department of Homeland SecurityDOE Department of EnergyEPA Environmental Protection AgencyFAA Federal Aviation AdministrationFHWA Federal Highway AdministrationFMCSA Federal Motor Carrier Safety AdministrationFRA Federal Railroad AdministrationFTA Federal Transit AdministrationHMCRP Hazardous Materials Cooperative Research ProgramIEEE Institute of Electrical and Electronics EngineersISTEA Intermodal Surface Transportation Efficiency Act of 1991ITE Institute of Transportation EngineersMAP-21 Moving Ahead for Progress in the 21st Century Act (2012)NASA National Aeronautics and Space AdministrationNASAO National Association of State Aviation OfficialsNCFRP National Cooperative Freight Research ProgramNCHRP National Cooperative Highway Research ProgramNHTSA National Highway Traffic Safety AdministrationNTSB National Transportation Safety BoardPHMSA Pipeline and Hazardous Materials Safety AdministrationRITA Research and Innovative Technology AdministrationSAE Society of Automotive EngineersSAFETEA-LU Safe, Accountable, Flexible, Efficient Transportation Equity Act: A Legacy for Users (2005)TCRP Transit Cooperative Research ProgramTEA-21 Transportation Equity Act for the 21st Century (1998)TRB Transportation Research BoardTSA Transportation Security AdministrationU.S.DOT United States Department of Transportation