harnessing digital technologies for inclusion in indonesia
TRANSCRIPT

Beyo
nd
Uni
corn
sHarnessing Digital Technologies for Inclusion in Indonesia
FULL REPORt
WORLD BANK INDONESIA FLAGSHIP REPORt
Pub
lic D
iscl
osur
e A
utho
rized
Pub
lic D
iscl
osur
e A
utho
rized
Pub
lic D
iscl
osur
e A
utho
rized
Pub
lic D
iscl
osur
e A
utho
rized


This work is a product of the staff of The World Bank. The findings, interpretations, and conclusions expressed in this work do not necessarily reflect the views of the Executive Directors of The World Bank or the governments they represent. The World Bank does not guarantee the accuracy of the data included in this work. The boundaries, colors, denominations, and other information shown on any map in this work do not imply any judgment on the part of The World Bank concerning the legal status of any territory or the endorsement or acceptance of such boundaries.
© 2021 THE WORLD BANK
1818 H STREET NW, WASHINGTON DC 20433 TELEPHONE: 202-473-1000; INTERNET: WWW.WORLDBANK.ORG
Some rights reserved
For information about the World Bank and its activities in Indonesia, please visit:
All photos in this report are from Unsplash.com and are royalty free.
↳ HELP.UNSPLASH.COM/EN/COLLECTIONS/1463188-UNSPLASH-LICENSE)
WWW.WORLDBANK.ORG/ID
@BANKDUNIA
BANKDUNIA
INSTAGRAM.COM/WORLDBANK
WWW.LINKEDIN.COM/COMPANY/THE-WORLD-BANK

ndonesia has seen a rapid rise in the number of people connected to the internet over the last decade. A vari-ety of sources – including new ones documented in this report – show that Indonesians connected to the in-ternet use it quite intensively, spend-ing as many as six hours a day on aver-age to communicate with each other, participate in social media, stream content for leisurely consumption and increasingly also engage in com-mercial activity. This growing base of consumers of internet and internet enabled services has made Indonesia the largest and the fastest growing digital economy in South East Asia. The country is home to many of the sub-region’s largest digital platforms that are not only attracting large vol-ume of investments into the country but are also providing new and inno-vative solutions that are increasingly transforming the economic and social lives of Indonesians.
Across the world, effective and smart use of digital technologies such as the internet and digital platforms, has emerged as a key marker of resilience for coping with the devasting impact of the COVID-19 pandemic on eco-nomic and social life. The same is true also for Indonesia. Firms have adopt-ed these technologies at unprece-dented rates to ensure the continuity of their operations. Households and individuals have increasingly relied on these technologies to work from home when they can, purchase con-sumer goods online, help children
Satu
Kah
kone
n� ICOUNTRY DIRECTOR
World Bank Indonesia & Timor Leste
IV
BEYO
ND U
NICO
RNS:
HAR
NESS
ING
DIGI
TAL
TECH
NOLO
GIES
FOR
INC
LUSI
ON I
N IN
DONE
SIA

stay connected with schoolwork and even carry out medical consultations remotely. Government agencies have used these technologies not only to try and address the public health chal-lenges associated with the pandemic but also to maintain the continuity of their services and, importantly, to channel social assistance and other support to those most affected.
As Indonesia’s economy recovers, the accelerated utilization of digital tech-nologies can have a big impact on the country’s development. Firms can become more productive, which can drive growth. Workers can be pro-ductive and see their earnings grow. The Government too could utilize these technologies in various ways to improve the quality and coverage of services it provides to its citizens, which would be instrumental in re-ducing inequality of opportunities. For instance, mechanisms established to identify, target and channel assis-tance to vulnerable citizens during the pandemic could become the ba-sis for a permanent digitally powered upgrade on social assistance targeting and delivery.
A growing digital economy does not necessarily imply an inclusive one. As this report shows, the benefits of the digital economy cannot be tak-en for granted by all segments of the population. Some will thrive, some may be left behind and some in fact may stand to lose as well. For exam-ple, the country has made remarkable
achievements in expanding digital connectivity. Yet, almost half of the adult population is still without inter-net access and, as such, automatically excluded from the country’s digital dividends. Even for the given level of connectivity, the quality of the inter-net experience in Indonesia is poorer than in neighboring countries, which makes it a shaky foundation for more productive, high bandwidth applica-tions, especially by firms but also by schools and medical facilities.
But digital divide does not have to be destiny. Taking stock of the current stage of digital technology adoption in Indonesia and identifying the var-ious dimensions along which these technologies could in fact widen gaps instead of closing them, the report identifies some crucial fronts on which policymakers could priori-tize action to ensure that the risks of these gaps could be mitigated. Uni-versalizing internet is a key starting point and should include interven-tions not just to address the hard infrastructure part, especially along the last mile, but also softer inter-ventions related to competition and sector regulation which have a major bearing on quality and affordabili-ty of internet. These would need to be complemented with policies and regulations that enable the digital economy to grow and active inter-ventions to ensure that the workers across the country are equipped with the skills they need to make the most of the opportunities.
All of this would also require the Government to lead from the front and not only become more digital itself but also put guardrails for a responsible digital economy. Taking a whole of government approach to digitally integrate and streamline systems and to create common and interoperable service platforms, especially for the use and re-use of data, could generate payoffs across the whole society. For instance, developing a digital identification framework to equip Indonesians with the ability to securely prove their identity when transacting on-line would boost trust in the digital economy, reduce fraud, and enable more public and private sector ser-vices to be delivered end-to-end remotely. This would allow any In-donesian with internet, no matter how far away from the nearest gov-ernment office or bank branch, to access such services. Similarly, the Government would benefit from strengthening safeguards for digital economy transactions and Indone-sian in cyberspace by putting in place strong regulations and independent enforcement regimes related to data privacy, cybersecurity, and consum-er protection.
Our hope is that this report will pres-ent a novel lens to look at this excit-ing landscape of digital technologies in Indonesia and inform a broader public dialogue, especially on what is needed to make the country’s digital future more inclusive.
Fore
wor
dV

VI
BEYO
ND U
NICO
RNS:
HAR
NESS
ING
DIGI
TAL
TECH
NOLO
GIES
FOR
INC
LUSI
ON I
N IN
DONE
SIA

eyond Unicorns was prepared by a World Bank team led by Sailesh Tiwari, Senior Economist in the Poverty and Equity Global Practice of the World Bank. The core team consisted of Rabia Ali, Erwin Ariadharma, I Gede Putra Arsana, Lamiaa Bennis, Natasha Beschorner, Prasetya Dwicahya, Jonathan Marskell, Ririn Salwa Pur-namasari, Laura Ralston, Jaffar al-Rikabi, Virgi Agita Sari, Imam Setiawan, Bambang Suharnoko Sjahrir, Muhammad Ajisatria Suleiman, Maria Monica Wihardja and Putu Sanjiwacika Wibis-ana. Other contributors included Arun Arya, Hamidah Alatas, Maarten Bosker, Massimiliano Cali, Aufa Doarest, Frederico Gil-Sander, Sean Hambali, Hanan Jacoby, Scott Minehane, Mo-chamad Pasha, Josefina Posadas, Abror Tegar Pradana, Ibrahim Rahman, Anissa Rahmawati, Jan van Rees, Mayla Safuro Putri, Husnul Rizal, Mark Roberts, Arya Swarnata, Michael Weber, Noah Yarrow, and Yongmei Zhou.
The work was conducted under Satu Kahkonen (Country Director, Indonesia and Timor Les-te) with overall guidance from Hassan Zaman (World Bank Regional Director, Equitable Growth, Finance and Institutions) and Car-olina Sanchez-Paramo (World Bank Global Director, Poverty and Equity Global Practice) and technical guidance from Aaditya Mattoo (Chief Economist, East Asia, and Pacific Re-gion), Rinku Murgai (Practice Manager, Pov-erty and Equity Global Practice) and Deepak Mishra (Practice Manager, Macroeconomics, Trade and Investments Global Practice).
We express our sincere gratitude to Tokope-dia, Bukalapak, GoJek and Halodoc for their collaboration and their generosity in sharing with us data that helped shed light on some key questions addressed in the report. The team also benefited from excellent guidance and ad-vice from the following peer reviewers at var-ious points in the report preparation process: Carlos Rodriguez Castelan (Lead Economist), Ana Paula Cusolito (Senior Economist), Na-talija Gelvanovska-Garcia (Senior Digital De-velopment Specialist), Tim Kelly (Lead Digital Development Specialist), Siddhartha Raja (Se-nior Digital Development Specialist), and Jane Treadwell (former Lead Digital Development Specialist). We thank them without implicat-ing them in any errors or omissions that may remain. Helpful suggestions provided by Vivi Alatas, Wendy Cunningham, Camilla Holme-mo, Andrew Mason, and Rolande Pryce, espe-cially in the early stages of the work, are also gratefully acknowledged.
Funding for the report was provided through the Partnership for Knowledge-based Poverty Re-duction and the Australia World Bank Indonesia Partnership (ABIP) by the Government of Aus-tralia’s Department of Foreign Affairs and Trade. Peter Milne edited the report, Muhammad Ka-mal and Indra Inrawan designed the layout and Dyah Nugraheni and Elisabeth Ekasari provided impeccable administrative support through all stages of report preparation.
Acknowledgements
B
VII
BEYO
ND U
NICO
RNS:
HAR
NESS
ING
DIGI
TAL
TECH
NOLO
GIES
FOR
INC
LUSI
ON I
N IN
DONE
SIA

Abbreviations & Acronyms2G Second Generation (basic mobile for SMS)3G Third Generation4G Fourth Generation5G Fifth Generation AI Artificial Intelligence ASEAN Association of South East Asian Nations ASN Indonesian Public Officials (Aparatur Sipil Negara)B2C Business-to-ConsumerBappenas Ministry of National Development Planning (Kementeri Perencanaan Pembangunan Nasional/Badan Perencanaan Pembangunan Nasional)BEPS Base Erosion and Profit ShiftingBIG Geospatial Information Agency (Badan Informasi Geospatial)BPNT Non-Cash Food Subsidy (Bantuan Pangan Non-Tunai)BPPT Agency for Assessment and Implementation of Technology (Badan Pengkajian dan Penerapan Teknologi)BSA Basic Saving AccountBSSN National Cyber and Crypto Agency (Badan Siber dan Sandi Negara)BTS Based Transceiver StationC2C Consumer-to-Consumer CDP Collection-and-Delivery PointCHIP Connect, Harness, Innovate and ProtectCIT Corporate Income Tax CMEA Coordinating Ministry for Economic AffairsCOVID-19 Coronavirus Disease 2019DEHS Digital Economy Household SurveyDFS Digital Financial ServicesDGT Directorate General of TaxesDKI Special Capital Region (Daerah Khusus Ibukota) DSL Digital Subscriber LineDTIA Digital Transformation Implementation AgencyDTKA Unified Social Welfare Database (Data Terpadu Kesejahteraan Sosial)DTT Digital Transformation TaskforceDukcapil Directorate General for Population and Civil Registration (Direktorat Jenderal Kependudukan dan Pencatatan Sipil)EdTech Education TechnologyEU European Union FSP Financial Service ProviderFTTH Fiber to the HomeG2P Government-to-PersonGB Giga ByteGDP Gross Domestic Product GMV Gross Merchandise ValueGNI Gross National Income GoI Government of Indonesia HealthTech Health Technology ICT Information and Communication Technology ID Identification IDR Indonesia Rupiah IIGF Indonesia Infrastructure Guarantee FundIMT International Mobile TelecommunicationsIoT Internet of Things Kabupaten DistrictKartu Pra Kerja Pre-Employment Card Kecamatan Subdistrict KK Family Card (Kartu Keluarga)Kota CityKPK Anti-Corruption Commission (Komisi Pemberantasan Korupsi)
VIII
BEYO
ND U
NICO
RNS:
HAR
NESS
ING
DIGI
TAL
TECH
NOLO
GIES
FOR
INC
LUSI
ON I
N IN
DONE
SIA
FRON
T PA
GES

KTP Indonesian Identity Card (Kartu Tanda Penduduk)KTP-el Indonesian Electronic Identity Card (Kartu Tanda Penduduk Eletronik)KYE Know-Your-CustomerLAN State Administration Institution (Lembaga Administrasi Negara)LKD Digital Financial Services (Layanan Keuangan Digital),LP Branchless Banking (Laku Pandai)LSP Logistics Service ProvidersLTE Long-Term EvolutionMbps Megabits Per SecondMenkominfo Ministry of Communications and InformationMenPAN-RB Ministry of Administrative and Bureaucratic Reform (Kementerian Pendayagunaan Aparatur Negara dan Reformasi Birokrasi)MHz Mega HertzMNE Multi-National EnterpriseMNO Mobile Network OperatorsMoEC Ministry of Education and CultureMoF Ministry of Finance MoHA Ministry of Home Affairs MOOCs Massive Open Online CoursesMRT Mass Rapid TransitMSME Micro, Small and Medium Enterprises NIK Unique Identity Number (Nomor Induk Kependudukan)O2O Online-to-OfflineOER Open Education ResourcesOKJ Financial Services Authority (Otoritas Jasa Keuangan)OTP One-Time PasswordPembina Data Data StewardPIT Personal Income Tax PKH Conditional Cash Transfer Program (Program Keluarga Harapan)PLN State-Owned Electricity Utility (Perusahan Listrik Nasional) PMO Project Management OfficePNG Papua New GuineaPPP Private-Public PartnershipPNS Civil Servant (Pegawai Negeri Sipil)PSTN Public Switched Telephone NetworkQoS Quality of ServiceR&D Research and Development RAN Rural Access NetworkRaskin Subsidized Rice Program (Beras Miskin)Ro-Ro Roll-on, Roll-offSAKERNAS Indonesia Labor Force Survey (Survei Angkatan Kerja Nasional)SEA-US Southeast Asia–United States SFH Studying from HomeSIAK National Population Registry System (Sistem Informasi Administrasi Kependudukan)SIM Subscriber Identification ModuleSislognas National Logistics System (Sistem Logistik Nasional)SME Small and Medium Enterprises SMPCS Sulawesi-Maluku-Papua Cable SystemSTEM Science, Technology, Engineering and MathematicsSUSENAS Indonesia Socioeconomic Survey (Survei Sosial Ekonomi Nasional)Tbps TeraBits Per Second, or Trillion Bytes per SecondTelco Telecommunications Service ProviderTVET Technical and Vocational Education and TrainingUNESCO United Nations Educational, Scientific and Cultural OrganizationUSO Universal Service Obligation FundVAT Value-Added Tax VoLTE Voice over LTEWali Data Data Custodian Warung Street food vendor WFH Working from Homeyoy Year-on-Year
IX
BEYO
ND U
NICO
RNS:
HAR
NESS
ING
DIGI
TAL
TECH
NOLO
GIES
FOR
INC
LUSI
ON I
N IN
DONE
SIA
FRON
T PA
GES

FOREWORD v
ACKNOWLEDGEMENT vi
ABBREVIATIONS AND ACRONYMS vii
EXECUTIVE SUMMARY 1
OVERVIEW 10
ACCESS TO THE MEDIUM 16
HARNESING THE MEDIUM TO BOOST INCOME 27
USING THE MEDIUM TO DELIVER BETTER SERVICES 44
POLICIES TO LEVERAGE DTs FOR GREATER INCLUSION 52
REFERENCES 68
CHAPTER 1: DIGITAL TECHNOLOGIES FOR INCLUSION – THE PROMISE AND THE CURRENT LANDSCAPE 74
1.1. INTRODUCTION 76
1.2. THE PROMISE AND AN ORGANIZING FRAMEWORK 78
1.3. DIGITAL TECHNOLOGY LANDSCAPE – WHAT IS THE STATE OF PLAY? 80
1.4. CONCLUSION 93
ANNEX 96
SPOTLIGHT 1: USE OF SOCIAL MEDIA IN INDONESIA AND IMPLICATIONS FOR INCLUSION 98
CHAPTER 2: AVAILABILITY, ACCESS AND ADOPTION: THE DRIVERS OF DIGITAL DIVIDE IN INDONESIA 104
2.1. INTRODUCTION 105
2.2. EVOLUTION AND THE STATE OF DIGITAL INFRASTRUCTURE 107
2.3. AFFORDABILITY AND QUALITY OF THE INTERNET EXPERIENCE 116
2.4. DRIVERS OF THE DIGITAL DIVIDE 120
2.5. CONCLUSION AND POLICY IMPLICATIONS 126
ANNEX 129
SPOTLIGHT 2: KEY FINDINGS FROM A MACROECONOMIC TAKE ON INDONESIA’S DIGITAL ECONOMY 130
Contents
X
BEYO
ND U
NICO
RNS:
HAR
NESS
ING
DIGI
TAL
TECH
NOLO
GIES
FOR
INC
LUSI
ON I
N IN
DONE
SIA
FRON
T PA
GES

CHAPTER 3: LEVERAGING DIGITAL TECHNOLOGIES FOR BETTER JOBS AND ECONOMIC OPPORTUNITIES 1343.1. INTRODUCTION 1353.2. DIGITAL ADOPTION BY FIRMS 1363.3. E-COMMERCE IN INDONESIA: PATTERNS, GROWTH AND THE BARRIERS TO ADOPTION 1393.4. JOBS IN THE GIG ECONOMY 1483.5. THREE DISTRIBUTIONAL TENSIONS AND A LOOK TO THE FUTURE 1503.6. CONCLUSION 154ANNEX 160SPOTLIGHT 3: EXPANDING THE REACH OF E-COMMERCE TO RURAL INDONESIA: LESSONS FROM TAOBAO VILLAGES IN CHINA 163
CHAPTER 4: DIGITAL TECHNOLOGIES FOR INCLUSIVE SERVICE DELIVERY 1684.1. INTRODUCTION 1694.2. EDTECH, HEALTHTECH AND THE ROLE OF DIGITAL TECHNOLOGIES IN EDUCATION AND HEALTH 1714.3. INTRODUCTION OF DIGITAL IDENTIFICATION 1764.4. DIGITAL TRANSFORMATION OF GOVERNMENT 1804.5. CONCLUSIONS 186SPOTLIGHT 4: THE LANDSCAPE OF INDONESIA’S PRIVATE EDTECH AND HEALTHTECH SECTOR 190
CHAPTER 5: HARNESSING DIGITAL TECHNOLOGIES FOR INCLUSION – WHAT CAN INDONESIA DO? 1965.1. IMPROVE DIGITAL CONNECTIVITY TO UNIVERSALIZE ACCESS 1985.2. MAKE THE DIGITAL ECONOMY WORK FOR ALL 2005.3. USE DIGITAL TECHNOLOGIES TO PROVIDE BETTER SERVICES AND UPGRADE CITIZEN-STATE
INTERACTIONS 208ANNEX 218
XI
BEYO
ND U
NICO
RNS:
HAR
NESS
ING
DIGI
TAL
TECH
NOLO
GIES
FOR
INC
LUSI
ON I
N IN
DONE
SIA
FRON
T PA
GES

LIST OF FIGURES
1.1 Harnessing digital technologies for greater inclusion – three pathways 791.2 Access to the internet has been increasing over the past decade 801.3 Some parts of the country are still lagging 811.4 Richer Indonesian’s have better access 811.5 Internet access is also higher among the younger, more educated and male segments of the population 811.6 Only 5 percent of population is connected to fixed broadband at home 821.7 Smartphone ownership rates have increased sharply over the years 821.8 Indonesians who are connected to the internet use it quite intensively 831.9 Communications, social media and leisure activities account for 80 percent of average time spent online 831.10 One-quarter of Indonesians use ride-hailing apps, and almost one-fifth use it for their daily commutes 841.11 Strong complementarity with public transportation suggests that these services fill a crucial gap in urban mobility 851.12 Digital ride-hailing has also brought other conveniences 861.13 E-commerce more prevalent in populous and affluent provinces 871.14 E-commerce prevalence also remains higher among…. 881.15 Price and convenience are the most dominant reasons for buying online… 891.16 Fiber optic arrival in the eastern provinces has boosted internet access, but has otherwise had a minimal influence on
the underlying structure of the economy90
1.17 Indonesia punches slightly above its weight on digital adoption index for the Government…. 921.18 …but the capability to provide digital public services is below its regional peers 922.1 Last mile connectivity challenges persist 1052.2 Java-Bali and Sumatra still have the highest number of Indonesians not connected 1062.3 Broadband infrastructure value chain 1072.4 Submarine cables connecting Indonesia to the main international routes 1082.5 Backbone networks are also sufficiently well deployed by service providers 1102.6 Palapa Ring project 1122.7 Mobile broadband access networks have also expanded 1132.8 Indonesia lags behind many ASEAN neighbors on fixed broadband penetration 1142.9 Fixed broadband penetration is also below countries at similar levels of development 1152.10 Overall internet affordability in Indonesia is on the lower side… 1162.11 …and the price of mobile broadband data is not the issue 1162.12 Fifty-five percent of adults who do not use internet-enabled devices cite cost as the primary barrier to adoption 1172.13 Affordability is a key barrier to the adoption of fixed broadband for many 1182.14 Both fixed and mobile broadband download speeds in Indonesia are among the lowest in the ASEAN region 1182.15 Quality of the internet experience varies significantly across the country 1192.16 While the mobile broadband space is competitive…. 1222.17 …the FTTH market is more concentrated, with Telkom dominating market share 1222.18 Core digital skills among internet-using adults in Indonesia 1242.19 Younger and more educated users have higher levels of digital skills 1253.1 Share of firms adjusting their business process due to COVID-19, by type of adjustments 1363.2 Share of firms reported adjusting in response to COVID-19 136
XII
BEYO
ND U
NICO
RNS:
HAR
NESS
ING
DIGI
TAL
TECH
NOLO
GIES
FOR
INC
LUSI
ON I
N IN
DONE
SIA
FRON
T PA
GES

3.3 Internet use by non-agricultural enterprises is still very low, with much higher incidence among medium and large enterprises
137
3.4 Internet adoption is much higher among richer household enterprises 1373.5 E-commerce has touched all parts of Indonesia but is still largely Java-centric 1413.6 Adoption of digital financial services is extremely low 1443.7 Access to and trust in digital financial transactions among the main reasons for not buying online 1453.8 Among those who buy online, a majority still prefer cash on delivery 1453.9 Not having accessed DFS is associated with lack of awareness and knowledge 1463.10 Top 1% of sellers capture almost half of the sales 1513.11 Market competition is the dominant concern for vendors in platforms… 1513.12 …with the crowded field being considered the most challenging aspect of market competition by over 60 percent 1513.13 Indonesian firms face a deep skills mismatch, particularly for managers and professionals. 1534.1 Better off households and those in Jakarta are more likely to do online learning during the COVID-19 pandemic 1724.2 Distribution of Halodoc transactions across regions 1724.3 Most EdTech services are concentrated in Jakarta 1734.4 Only around 10 percent of all schools are connected to fixed broadband 1754.5 Digital ID systems depend on having strong foundational ID systems in place 1774.6 The Principles on Identification for Sustainable Development provide a guiding framework on how countries can
realize the transformational potential of digital ID systems, while mitigating the risks178
4.7 Institutional structure of key e-government stakeholders in Indonesia 1814.8 UK Government’s cross-sectoral digital transformation governance structure 1824.9 Fragmented data and overly complex interdependence prevents BPJS Kesehatan from running efficiently 1844.10 One Data as an opportunity to address data fragmentation 1855.1 Transition from e-Government to digital transformation 2105.2 A comprehensive national digital transformation agenda would require adjustments to the governance structure of
ongoing digital government and policy initiatives211
S1.1 Most recent use of various social media platforms (share of internet users) 99S1.2 Profile of social media users in Indonesia (share of internet users) 99S1.3 The most common activities on social media 99S1.4 The most common topics in social media discussions 99
LIST OF TABLES
1.1 Greater internet access is benefiting higher-skilled workers more than the lower skilled ones 912.1 Current spectrum assignments for mobile services 1203.1 E-commerce activity rate is higher when a job is a secondary rather than a main job, especially among women 1403.2 E-commerce helps women return to work after giving birth 140S4.1 Description of EdTech products with selected examples 191S4.2 Description of HealthTech products with selected examples 192
XIII
BEYO
ND U
NICO
RNS:
HAR
NESS
ING
DIGI
TAL
TECH
NOLO
GIES
FOR
INC
LUSI
ON I
N IN
DONE
SIA
FRON
T PA
GES

Chapter ⬎
ESXIV
BEYO
ND U
NICO
RNS:
HAR
NESS
ING
DIGI
TAL
TECH
NOLO
GIES
FOR
INC
LUSI
ON I
N IN
DONE
SIA
EXEC
UTIV
E SU
MMAR
Y

Executive Summary
imilar to many other countries around the world, the COVID-19 pandemic has hit Indonesia hard. Latest estimates suggest that about 5.1 million people—equivalent to 2.4 percent of the work-ing-age population—have lost their jobs, while an additional 24 million have had to work reduced hours due to the pandemic. As many as 50 per-cent of workers have experienced a reduction in earnings. The impact on living standards has been devastating, with more than 2.2 million Indone-sians estimated to have been pushed into COVID-19-induced poverty in 2020.
One unexpected silver lining from the crisis, however, has been the turbo-charged adoption
of digital technologies. Businesses, both large and small, have flocked to digital technologies to try to ensure the continuity of their opera-tions. School closures have forced students and teachers to adapt and explore digitally enabled remote learning options, including the adoption of a variety of EdTech solutions. HealthTech apps enabling remote consultations and the delivery of medicine have seen unprecedented growth in adoption rates. Confined at home due to mobili-ty restrictions, Indonesians have switched to the internet for their entertainment and social needs, driving sharp growth in the usage of digital media (music and video streaming) and communica-tions applications.
S1
BEYO
ND U
NICO
RNS:
HAR
NESS
ING
DIGI
TAL
TECH
NOLO
GIES
FOR
INC
LUSI
ON I
N IN
DONE
SIA
EXEC
UTIV
E SU
MMAR
Y

2.2
MIL.
Indonesians estimated to have been pushed into COVID-19-induced poverty
experienced a reduction in earnings
50%
Indonesian have lost their jobs
Had to work reduced hours
5.1 mil.
24 mil.
“Indonesia has made rapid progress in internet connectivity over the past decade, but half of the adult population is still without access”
2020
With this pandemic-induced flight to digital ex-pected to be permanent to a large extent, there is excitement about an even greater acceleration in what was already the fastest growing digital economy in Southeast Asia. But at the same time questions have also emerged about the possibil-ity of the differential access to and adoption of digital technologies compounding existing in-equalities. For a country that considers achieving balanced development one of its key priorities, this is an important new challenge.
This report conducts an in-depth assessment of digital technologies in Indonesia, examining the scale and extent of their current applications. Focusing specifically on how these technologies are touching, shaping and influencing the lives of Indonesians, the report also identifies some policies that the Government of Indonesia (GoI) could adopt to ride the momentum of digital adoption generated by the pandemic, not only to power economic recovery in the short run but also to bring about greater inclusion and resil-ience in the medium run.
Indonesia has made rapid progress in internet connectivity over the past decade but, despite this, half of the adult population is still without access. Moreover, the inequality in access to the digital medium mirrors existing dimensions of inequality—across groups, regions and income classes. While Indonesia compares well with its regional peers on mobile broadband penetration (at slower speeds), it is significantly behind on 4G/LTE and fixed broadband rollout. Issues of availability and affordability constrain the adop-tion of fixed broadband, while network conges-tion impinges on the quality of available mobile broadband. Limited spectrum, unavailability of specific bands—particularly the 700mHz digital dividend band—limited regulatory clarity on in-frastructure sharing and the lack of competition, especially in the provision of fixed broadband services, are the main barriers to universalizing access to good-quality internet throughout In-donesia.
Indonesians who are connected to the internet use it intensively, with communication, social media and leisure applications dominating us-age. On average, Indonesians spend around 6 hours a day online, with the younger and more educated segments more digitally engaged than the relatively older and less educated demo-graphic. Intensity of internet engagement is highest for the 16 to 25 age group, which on average spends 9.7 hours a day online. Digital ride-hailing services provided by companies such as Gojek—Indonesia’s homegrown de-cacorn that epitomizes the country’s digital potential for policy makers—and its regional competitor, Grab, are commonly used. And not only for their mobility services to connect the otherwise fragmented labor markets in Indo-nesia’s large and sprawling metropolitan areas, but also for several other conveniences, such as food delivery and logistics. Buying and selling online is also growing and, while still only prev-alent among a small share of the population, it is already enhancing consumer welfare by pro-viding cheaper options, and greater product variety and convenience.
In addition to consumers, these technologies are also beginning to reshape the economic opportunity landscape for workers, generating newer forms of jobs in some cases and enhancing productivity of existing jobs in others. Howev-er, not all workers are positioned to capitalize on these opportunities. For example, the higher skilled workers, who as a group were already better rewarded in the labor market have edged further ahead relative to lower skilled workers. One of the reasons for this is that, despite the pandemic-induced increase in the adoption of digital technologies, the overall level of digital adoption by firms remains low and of limited intensity, which has naturally limited produc-tivity gains for most workers. Another reason is that, while low-skill biased applications of digi-tal technologies such as e-commerce and digital gig work are enabling certain segments of the workforce to boost income, their reach is also
2
BEYO
ND U
NICO
RNS:
HAR
NESS
ING
DIGI
TAL
TECH
NOLO
GIES
FOR
INC
LUSI
ON I
N IN
DONE
SIA

↳ Indonesians who are connected to the internet use it quite intensively, with communication, social media and leisure applications dominating usage.⬎
limited. Digital gig work is largely concentrated among urban men. E-commerce is providing an income diversification pathway, particularly for women temporarily dislocated from labor markets and youth. However, e-commerce pen-etration and intensity are both constrained by issues of trust in online transactions and pay-ments, logistics and internet connectivity.
The ability of governments around the world to harness digital technologies to deliver services is perhaps one area on which the COVID-19 pan-demic has focused the strongest spotlight. Just as people and businesses have had to adapt to various measures taken to contain the spread of the virus, so too have governments. And the ability to use digital technologies to curb and manage the pandemic, as well as to ensure the continuity of essential services, has emerged as a key marker of resilience.
Indonesia’s nascent EdTech and HealthTech scene has received a major boost and, though these applications have clearly filled a void during the pandemic, their overall reach is limited to the more affluent clientele in urban centers, mostly within Java. Specifically, on ed-ucation, the lack of complementary inputs such as supporting ICT devices (smartphones and computers), and limited access to good-quality internet has limited the ability of students to access online learning during the pandemic. Ex-periences from around the world suggest that while some of these digital innovations help en-rich the menu of available solutions, the truly transformative impact can only come from the Government experimenting with, internalizing and eventually adopting some of these innova-tions at scale to enhance the delivery of services. In addition to the low connectivity in key ser-vice delivery nodes (e.g., schools and hospitals), two key challenges that Indonesia faces on this front are: (i) the absence of an officially-recog-nized and universally accessible digital ID for online transactions; and (ii) transitioning from a siloed structure of multiple, incompatible government information and data management systems to a platform-based whole-of-govern-ment approach to digital transformation, which has emerged as best practice in many economies globally.
What can Indonesia do to address these chal-lenges and effectively leverage digital technol-ogies to achieve greater inclusion? The report emphasizes three key priorities for policy.
3
BEYO
ND U
NICO
RNS:
HAR
NESS
ING
DIGI
TAL
TECH
NOLO
GIES
FOR
INC
LUSI
ON I
N IN
DONE
SIA
EXEC
UTIV
E SU
MMAR
Y

The critical first priority is improv-ing digital connectivity and univer-salizing access to the digital medium. This will require better management of the telecom spectrum, regulato-ry clarity on passive infrastructure sharing and improved competition in the fixed broadband space. Under recently enacted Law No. 11/2020 on Job Creation (the so-called “Omni-bus Law”), reform of spectrum man-agement is on the right track for the optimization of spectrum allocation. The Omnibus Law also imposes a mandatory two-year plan to convert analog television to digital television, in order to secure a digital dividend in the 700 MHz spectrum band. This measure would be crucial in lowering capital costs require to provide afford-able connectivity to remote parts of the country. Release of the 2.6 GHz band, currently used for satellite TV, would add capacity in urban centers and alleviate congestion. The Minis-try of Communication and Informa-tion (Kominfo) should consider accel-erating its plans for the reallocation of this band from satellite broadcasting to mobile broadband by the end of 2024.
The Omnibus Law also mandates passive infrastructure sharing and the next step for the GoI in this regard is to create an implementing regula-tion. This will require effective lead-ership to coordinate the government agencies involved, including, among others, Kominfo, the Ministry of Home Affairs, the Ministry of Public Works and Housing, and local gov-ernment agencies. Indonesia should also consider transitioning toward the unified licensing of service pro-viders to enable each one to deliver a larger portfolio of services. A fixed broadband provider should be able to deliver a full portfolio of services, not only broadband internet but also te-lephony, TV, and other value-added services. Appointing an independent regulator is critical to improving the overall competitiveness in the sector.
The second priority is ensuring that the digital economy works for all. This
will require investing in and facilitat-ing key enablers of the digital econo-my while at the same time unlocking citizen capabilities to seize the oppor-tunities that are generated. To achieve this, Indonesia will need to make progress on financial inclusion, facil-itate trust to promote greater take-up of digital payment services, improve logistics and scale up investment in digital skills as well as a broader set of skills to thrive in the digital economy. The variety of efforts underway to im-prove financial inclusion remain im-portant entry-points. One promising digital solution is the reduction in ver-ification costs that could come from widespread availability of an e-KYC option underpinned by a strong and reliable digital ID system. For those already banked, including some of the more sophisticated users, trust in on-line transactions and issues related to data privacy, cyber security and finan-cial integrity represent another barri-er that needs to be overcome. In this regard, the passing of the draft Law on Personal Data Protection will be critical for promoting the adoption of digital financial services in Indonesia.
On citizen skills, modern tertiary ed-ucation needs to cultivate in students a minimum threshold of foundation-al “transferable” higher-order skills for the 21st century digital econo-my, even in STEM fields. Technol-ogy and integration have increased the demand for higher-order gener-al cognitive skills—such as complex problem-solving, critical thinking, and advanced communication—that are transferable across jobs. Incorpo-rating more general education in ter-tiary programs is one way to do this. An additional year of general edu-cation was added to undergraduate programs in Hong Kong and China in 2012 to focus on problem-solving, critical thinking, communication, leadership, and life-long learning skills and that seems to have yielded some positive results.1 Another way is through innovative pedagogy that adopts learning strategies, including open-ended assessments, feedback opportunities, and a progressive
THREE KEY PRIORITIES
Improve Digital Connectivity & Universalize Access
1
Make the Digital Economy Work for All
2
Adopt Digital Technologies to Upgrade Citizen-State Interactions
3
4
BEYO
ND U
NICO
RNS:
HAR
NESS
ING
DIGI
TAL
TECH
NOLO
GIES
FOR
INC
LUSI
ON I
N IN
DONE
SIA
EXEC
UTIV
E SU
MMAR
Y

↳ Indonesia’s digital economy is growing and beginning to reshape how Indonesians work, consume goods and services and interact with each other.⬎
curriculum that balances academic challenges with student support.
The third policy priority is harness-ing the medium to provide better services and upgrade the quality of citizen-state interactions. This will re-quire, among others, a whole-of-econ-omy national digital ID initiative and a whole-of-government approach to digital transformation driven by an agency sufficiently empowered to re-solve crucial inter-agency coordina-tion challenges. A national digital ID initiative would enhance and harness the existing strong national ID system managed by the Ministry of Home Af-fairs to introduce an official digital ID for online transactions and could rec-ognize other forms of digital IDs, such as those issued by the private sector, for interoperability purposes. In order to boost trust in online transactions and digital government, the passage of the draft Law on Personal Data Pro-tection would be important to provide safeguards and accountability for the collection, use and sharing of personal data, as well as formalizing the rights of data subjects. An essential feature for the credibility and strength of such a law would be independent oversight, similar to the Office of the Australian Information Commissioner and the Singaporean Personal Data Protec-tion Commission.
Beyond digital IDs, Indonesia could also consider reorienting from a narrow focus on e-government to a comprehensive national digital trans-formation agenda. Given the com-plexities, this can be implemented in phases. Strengthening the role of the Ministry of State Apparatus and Bu-reaucratic Reform (MenPAN-RB) to orchestrate and deliver on the existing mandate on e-government could be coupled with parallel efforts to cre-ate an institutional and regulatory framework or apparatus necessary for a more integrated and centrally managed transformation agenda. This could be in the form of an agency that has multi-ministerial oversight and is attached to the Office of the President. Such an agency could be tasked with
the articulation of the vision as well as the formulation and implementation of policies to drive the transformation agenda in an integrated manner. The Government Digital Service, or GDS in the United Kingdom and GovTech in Singapore are successful examples of this model. There could be oth-er models as well but success in this transformative agenda will rest cru-cially on the adoption of a coordinat-ed whole-of-government strategy as opposed to a siloed one.
In addition to these three fronts there is a crucial fourth area that should not be forgotten. In order to truly make the digital economy more inclusive, efforts to universalize the digital medium and stimulate digital innovations must be embedded in a broader ‘bricks-and-mortar’ reform agenda that includes greater openness and competitiveness, stronger regulations, more compre-hensive social protection and invest-ments in skills for the future. The long-standing non-digital challenges that Indonesia has faced in its efforts to make growth inclusive continue to remain important constraints on how effectively Indonesia is able to harness the digital dividends for its poor. For example, the high cost of logistics, which has always prevented far flung markets in eastern Indonesia from being integrated with thicker mar-kets in Java, is precisely also one of the key binding constraints on growth of e-commerce in these areas. Digitiza-tion of the logistics sector itself can, and indeed is, already beginning to chip away at this. But a bigger challenge lies in the analog domain and relates to the large deficit of connectivity infra-structure and the regulatory environ-ment that keeps transit times long and costs high.
Likewise, a whole host of other factors that are binding constraints on the overall productivity of the economy are also relevant. It has been well doc-umented elsewhere, for example, that restrictive trade policies limit access to key inputs and markets, restrictions on investments depress commercial performance, a weak competition
framework shields incumbents from potentially more productive market entrants, while the unpredictable reg-ulatory environment further weakens the business environment, inhibiting competition and depressing invest-ments. The super-efficiencies asso-ciated with digital technologies in an economic environment in which do-mestic firms, both large and small, are shackled in this manner, and workers lack the skills required to thrive in the second industrial revolution, let alone the fourth, could potentially amplify distortions and accentuate inequali-ties. Thus, doubling down on reforms to strengthen the analog foundations of the digital economy will be equally critical in ensuring that digital divi-dends benefit all Indonesians.
5
BEYO
ND U
NICO
RNS:
HAR
NESS
ING
DIGI
TAL
TECH
NOLO
GIES
FOR
INC
LUSI
ON I
N IN
DONE
SIA
EXEC
UTIV
E SU
MMAR
Y

What can Indonesia do to ensure an inclusive digital future for all?
Optimize spectrum allocation for mobile broadband
Strengthen competition along the broadband value chain
Strengthen mechanisms to ensure sharing of active and passive infrastructure
→ Implement the “Analogue Switch Off” by the end of 2022 in accordance with the Omnibus Law so as to free up the 700MHz band for greater rural connectivity using 4G and future 5G networks
RESPONSIBLE AGENCIES:
Kominfo
→ Update the Telecom Law, PP 52/53, to allow for sharing of active infrastructure on a B2B basis
RESPONSIBLE AGENCIES:
Kominfo
→ Review current licensing regime and transition toward international best practice of single/unified licensing to allow a larger number of providers to deliver the full portfolio of services
RESPONSIBLE AGENCIES:
Kominfo
→ Optimize the higher frequency capacity bands, starting with the freeing up of the 2.6 GHz band, followed by the 3.4-3.8 GHz band and potentially the broader 3.3-4.2 GHz band to facilitate 5G deployment in urban areas. Consideration should be given to the release of the mmWave spectrum bands for 5G in urban areas
RESPONSIBLE AGENCIES:
Kominfo
→ Implement through regulations the passive infrastructure sharing mandated under the Omnibus Law
RESPONSIBLE AGENCIES:
Kominfo
MoHA
Ministry of Public Works
→ Appoint an independent regulatory body for the telecom sector consistent with exemplar practice and Indonesia’s RCEP commitments
RESPONSIBLE AGENCIES:
Kominfo
1
3
2
Improve Digital Connectivity to Universalize Access
PRIORITY OBJECTIVE
I
6
BEYO
ND U
NICO
RNS:
HAR
NESS
ING
DIGI
TAL
TECH
NOLO
GIES
FOR
INC
LUSI
ON I
N IN
DONE
SIA
EXEC
UTIV
E SU
MMAR
Y

Support the development of logistics
Nurture digital skills and skills for the 21st century digital economy
→ Align non-formal education services and lifelong learning with needs of the working-age adult population, adopting a modular approach to course offerings with an emphasis on soft skills in addition to technical digital skills, incorporating employment-specific digital skills relevant for Indonesia, emphasizing a mindset of continuous learning, and offering opportunities to practice “self-managed” learning
RESPONSIBLE AGENCIES:
Ministry of Education and Culture
Ministry of Manpower
→ Ensure that tertiary education offers a minimum threshold of foundational “transferable” higher-order skills such as critical thinking, problem-solving and communication, even in STEM fields
RESPONSIBLE AGENCIES:
Ministry of Education and Culture
→ Incentivize employers to offer internships and off-campus learning to students
RESPONSIBLE AGENCIES:
Ministry of Education and Culture/Ministry of Manpower
→ Continue to develop data systems that allow for identification of occupations and skills in demand, monitor educational institutions’ compliance with quality standards, and ensure that information on employability of individuals with various degrees, wage profiles, and occupation-specific courses is available to jobseekers and workers
RESPONSIBLE AGENCIES:
Ministry of Education and Culture/Ministry of Manpower
→ Build partnerships between tertiary institutions and the private sector to train vocational students in high-tech areas using practice-based curricula, practitioner-led instruction, and professional certification
RESPONSIBLE AGENCIES:
Ministry of Education and Culture/Private Sector
→ Deepen reforms to reduce entry barriers to logistics and transportation services and build long-term investor confidence, to expand warehousing outside of large metropolitan areas
RESPONSIBLE AGENCIES:
Ministry of Transport, with support from Ministries of Trade and Finance and the Coordinating Ministry of Maritime Affairs and Investments
→ Continue to develop basic physical infrastructure to improve connectivity through strengthened and/or rehabilitated infrastructure (roads, ports, and electricity), leveraging private sector capital and expertise as appropriate through PPPs
RESPONSIBLE AGENCIES:
Ministry of Transport
Directorate General of Highways
Ministry of Public Works and Housing
→ Continue to modernize the National Post Service; standardize addresses and postcodes
RESPONSIBLE AGENCIES:
Ministry of Communication and Informatics
1 2
Make the Digital Economy Work for All
PRIORITY OBJECTIVE
II
7
BEYO
ND U
NICO
RNS:
HAR
NESS
ING
DIGI
TAL
TECH
NOLO
GIES
FOR
INC
LUSI
ON I
N IN
DONE
SIA
EXEC
UTIV
E SU
MMAR
Y

Promote supply of DFS/digital payment solutions that cater to the unbanked and the underbanked
Use tax policy instruments to ensure a level playing field
3
4
→ Streamline the licensing and registration processes required to become a provider of digital financial services
RESPONSIBLE AGENCIES:
Bank Indonesia
OJK
→ Standardize rules and procedures to enable interoperability of payment schemes
RESPONSIBLE AGENCIES:
Bank Indonesia
→ Incentivize the private sector to innovate and develop new DFS products that cater to the rural population
RESPONSIBLE AGENCIES:
Bank Indonesia
Directorate General of Taxes
→ Complete the design of measures to reform tax policy and modernize tax administration in relation to DE transactions, ensuring adoption and communication of consistent rules, institution of efficient IT systems to administer registration, filing, payment and use of digital transaction data with other third-party data and taxpayer data for strengthened compliance risk management
RESPONSIBLE AGENCIES:
Ministry of Finance (Directorate General of Taxes, Directorate General of Customs and Excise, and Fiscal Policy Agency)
→ Increase use cases of DFS products in the delivery of government services (including Government-to-person payment) to sustain the commercial viability of DFS agents
RESPONSIBLE AGENCIES:
CMEA (Financial Inclusion Council)
Ministry of Social Affairs
→ Strengthen the legal and regulatory framework for managing risks related to data governance and privacy, cyber security and operational risk, and financial integrity, in order to build consumer trust in DFS products
RESPONSIBLE AGENCIES:
Bank Indonesia
OJK
→ Lower the overly generous VAT threshold to expand the digital economy tax base
RESPONSIBLE AGENCIES:
Ministry of Finance (Directorate General of Taxes, Directorate General of Customs and Excise, and Fiscal Policy Agency)
Make the Digital Economy Work for All CONTD.
PRIORITY OBJECTIVE
II
8
BEYO
ND U
NICO
RNS:
HAR
NESS
ING
DIGI
TAL
TECH
NOLO
GIES
FOR
INC
LUSI
ON I
N IN
DONE
SIA
EXEC
UTIV
E SU
MMAR
Y

Use Digital Technologies to Provide Better Services and Upgrade Citizen-
State Interactions
Develop a national digital ID framework
Reorient from a narrow focus on e-Government to a comprehensive national digital transformation agenda
Implement a whole-of-government data management policy
1
2 3
→ Pass the draft Law on Personal Data Protection
RESPONSIBLE AGENCIES:
Kominfo
MoHA
→ Strengthen the political and bureaucratic influence needed to move the agenda by placing a central government authority like the Office of the President in the driving seat
RESPONSIBLE AGENCIES:
Office of the President
→ Implement the One Data Policy comprehensively, in priority sectors relevant for managing the post pandemic recovery (e.g., education, health, social protection or MSMEs).
RESPONSIBLE AGENCIES:
Bappenas
BPS
and other line agencies
→ Build alliances with key institutions such as MenPAN-RB,Kominfo, and MoHA to instill One Data principles into the implementation of the digital government and digital ID initiatives.
RESPONSIBLE AGENCIES:
Bappenas
BPS
and other line agencies
→ Adopt a whole-of-government approach to digital transformation, coordinated and spearheaded by an agency that has multi-ministry oversight.
RESPONSIBLE AGENCIES:
Office of the President
→ Launch a whole-of-economy national digital ID initiative to define the optimal model for Indonesia, bringing together government, private sector and civil society
RESPONSIBLE AGENCIES:
Office of the President
MoHA
Kominfo
→ Close the coverage gaps in the national population registry database (SIAK), streamline the new registration and update processes, and introduce biometric-based e-KYC processes
RESPONSIBLE AGENCIES:
MoHA
→ Introduce a national digital ID system or federated ecosystem fit-for-purpose for online transactions in the Indonesia context, building on the SIAK
RESPONSIBLE AGENCIES:
Office of the President
MoHA
Kominfo
PRIORITY OBJECTIVE
III
9
BEYO
ND U
NICO
RNS:
HAR
NESS
ING
DIGI
TAL
TECH
NOLO
GIES
FOR
INC
LUSI
ON I
N IN
DONE
SIA
EXEC
UTIV
E SU
MMAR
Y

Overview1.1
Access to the Medium: Who is connected, who is not and why?
1.2
HARNESSING THE MEDIUM TO BOOST INCOME: Who is winning, who is behind, and why?
1.3
USING THE MEDIUM TO DELIVER BETTER SERVICES: What holds Indonesia back?
1.4
POLICIES TO LEVERAGE DTS FOR GREATER INCLUSION: What can Indonesia do?

Overview
11
BEYO
ND U
NICO
RNS:
HAR
NESS
ING
DIGI
TAL
TECH
NOLO
GIES
FOR
INC
LUSI
ON I
N IN
DONE
SIA

experienced a reduction in earnings
50%
Indonesian have lost their jobs
Had to work reduced hours
5.1 mil.
24 mil.
2.2 MIL.
Indonesians estimated to have been pushed into COVID-19-induced poverty
↳Indonesia has made rapid progress in expanding internet access over the past decade, but half of the adult population is still without access→
“
S
2020
12
imilar to many other countries around the world, the COVID-19 pandem-ic has hit Indonesia hard. The global slowdown in economic activity, com-bined with domestic measures to con-tain the spread of the virus, dragged down the economy, which is estimated to have shrunk by around 2.2 percent in 2020. Latest estimates suggest that
about 5.1 million people—equivalent to 2.4 per-cent of the working-age population—have lost their jobs, while an additional 24 million have had to work reduced hours due to the pandemic. As many as 50 percent of workers have experi-enced a reduction in earnings. The impact on living standards has been devastating, with more than 2.2 million Indonesians estimated to have been pushed into COVID-19-induced poverty in 2020.
One unexpected silver lining from the crisis, how-ever, has been the turbo-charged adoption of dig-ital technologies. Businesses, both large and small, have flocked to digital technologies to try to en-sure the continuity of their operations. Adoption of e-commerce has soared, with online purchases proving a viable way of securing uninterrupted access to essential consumer goods, including even basic groceries. School closures have forced students and teachers to adapt and explore dig-itally-enabled remote learning options, includ-ing by adopting a variety of EdTech solutions. HealthTech apps enabling remote consultations and the delivery of medicine have seen unprec-edented growth in adoption rates. Confined at home due to mobility restrictions, Indonesians
have switched to the internet for their enter-tainment and social needs, driving sharp growth in the usage of digital media (music and video streaming) and communications applications. A recent industry estimate shows that 37 percent of all digital service consumers in Indonesia in 2020 were new COVID-induced users and more than half (56 percent) were from conventionally weaker markets such as non-metro areas.2
This digital pivot is expected to be permanent and, as such, promises to provide a major boost to what is already the largest and the fastest growing digital economy in Southeast Asia. The behavioral change that has accompanied this accelerated adoption of digital technolo-gies can be expected to be enduring. Estimates from industry indicate that 93 percent of new adoptees expect to stay with at least one of the new digital services post-COVID-19. If true, this would imply a major boost to Indonesia’s internet economy which, at an estimated US$44 billion in gross merchandise value, is not only the largest in Southeast Asia, but also the fastest growing.3
At the same time, the pandemic has also fo-cused a spotlight on Indonesia’s inequalities. One enduring challenge of Indonesia’s develop-ment experience over the past two decades has been making economic growth more inclusive. While remarkable progress has been made in terms of poverty reduction, persistent welfare disparities remain across regions, and growth in living standards experienced by those in the bottom 40 percent of the income distribution has persistently lagged average growth.4 By dis-
12
BEYO
ND U
NICO
RNS:
HAR
NESS
ING
DIGI
TAL
TECH
NOLO
GIES
FOR
INC
LUSI
ON I
N IN
DONE
SIA

40%
60%
↳ Growth in living standards experienced by those in the bottom 40 percent of the income distribution has persistently lagged average growth
↪ As school closures pushed students toward remote learning, around 60 percent of students were found to be unable to participate in online classes due to the lack of reliable internet and limited ownership of internet-enabled devices
BOTTOMproportionately hitting the poor and the vulner-able harder, the pandemic threatens to widen these inequalities. Meanwhile, the susceptibility to infection, and the burden of disease among the poor and vulnerable in the most directly af-fected urban areas have been more intense than among the non-poor, likely due to risk factors such as poorer diets, lower access to quality health services, higher prevalence of smoking, poorer hygiene and sanitation practices, and the inability to afford inputs to preventive behaviors (e.g., masks, hand sanitizers, etc.). At the same time, sectors and forms of work that have been most affected, especially in urban areas of the country, are also the ones in which the poorer and less skilled segments of the population are more likely to be working. As a result, while the pandemic has affected everyone, uninsured in-come and welfare losses in the bottom parts of the income distribution have been the highest.5
Differential access to and adoption of digital technologies could compound these inequalities. Digital solutions to achieve resilience during this crisis have not been available to all. For exam-ple, compared with 88 percent of government jobs and 40 percent of jobs in manufacturing, less than 10 percent of jobs in hotels and restau-rants, construction, wholesale, and agriculture were found amenable to being done remotely. Similarly, just 11 to 12 percent of casual and own-account work could be performed from home (compared with 42 percent of wage work). While 84 percent of high-skilled work could be done from home, 85 percent of work done by low-skilled workers required physical presence in their place of work.6
Similarly, as school closures pushed students toward remote learning, around 60 percent of students were found to be unable to participate in online classes due to the lack of reliable inter-net and limited ownership of internet-enabled devices. A remedial measure was introduced in the form of an IDR 7.2 trillion data package for students and teachers. But, given how costly mobile broadband data is for high bandwidth applications such as video streaming, this is like-ly to only be a stop-gap solution to the real prob-lem: namely, that only 10 percent of Indonesian public schools are connected to fixed broadband internet and around half of the population is still not connected to any kind of internet.
The pandemic has also put a spotlight on the importance of digitized, integrated and interop-erable data systems in achieving resilience. With quarantines and the scaling-down or shutdown of many government and commercial opera-tions, countries have had to try rapidly shifting services to digital channels in order to keep them going. Countries that had, for instance, invest-ed in and built strong digital identification (ID) systems before the pandemic were by and large better able to do this than those countries that had not. For example, Estonia, Singapore, the United Kingdom, and other digitally advanced countries were able to reduce disruption for their public service delivery, as well as enable the private sector to shift to trusted online transac-tions. But the difference was particularly telling in terms of whether countries were able to deploy quick, accurate and effective social protection measures to mitigate shocks and safeguard liveli-hoods, including being able to reach populations
13
BEYO
ND U
NICO
RNS:
HAR
NESS
ING
DIGI
TAL
TECH
NOLO
GIES
FOR
INC
LUSI
ON I
N IN
DONE
SIA
OVER
VIEW

such as informal workers. These workers were especially difficult to target because they were not present in either databases of people living in poverty or databases of people contributing to social security.
Thailand, for example, built a website to al-low informal workers to apply for emergency payments online, using its national ID system to verify the identity of applicants, establish their uniqueness and determine their eligibil-ity by cross-checking government databases. Since national IDs were already linked to bank and mobile money accounts, there was added assurance that cash transfers would reach the intended beneficiaries. Within just a few weeks, more than 28 million Thai citizens had applied, with 15 million deemed to be eligible. Payments began for some within days of applying. In Chile and Peru, social registries were used to expand existing social assistance programs and citizens could use their digital ID to access a portal that allowed them to check if they were included. In contrast, although Indonesia introduced signif-icant fiscal measures, there were critical delays in getting a couple of similar programs off the ground on account of challenges related to the updating and cross-checking of databases and the verification of identities.
Looking ahead, one key question policymakers in Indonesia are facing is how to ride the momen-tum of digital adoption generated by the pan-demic not only to power the recovery in the short term but to also bring about greater inclusion and resilience in the economy in the medium term. The crisis is clearly far from over, but some signs of economic recovery are beginning to ap-pear on the horizon. As the economy rebounds and adjusts gradually to the new post-pandemic equilibrium, questions about ways in which In-donesia could leverage digital technologies to better prepare for similar shocks in the future and address some of its long-term development challenges have become highly pertinent.
The promise exists. Digital technologies signifi-cantly reduce economic costs related to search, replication, transportation, tracking and verifi-cation.7 Lower costs for finding and comparing information can help reduce price dispersion, improve matching, boost efficiency, and deepen financial, labor and retail markets. The non-rival nature of information (one person’s consumption does not lower the amount available for consump-tion by another) encoded digitally lowers the rep-lication cost; once the upfront cost of developing
an application has been incurred and the product tested, it is costless to replicate it as many times as needed. Digital technologies also render moot place-based constraints on economic activities. Near costless transmission of information and digital services helps unlock opportunities for buyers and sellers anywhere in the country, lead-ing to both the deepening, as well as the stronger integration, of markets. Lower tracking costs, or costs of connecting individuals with information about them, facilitates the design and delivery of services better customized to personal needs (e.g., government-to-person payments, credit provid-ed based on information on consumer behavior, etc.). Finally, by lowering verification costs, digi-tal technologies can enable individuals and firms to build up reputations and trust and participate in markets assured of reasonable contestability. Evidence, primarily from high-income countries, suggests that the efficiency gains brought about by the adoption of these technologies can boost aggregate productivity and growth.8
But there are risks as well. Without strong laws on personal data and consumer protection, the lowering of tracking and verification costs could lead to price discrimination, fraud and violations of privacy. The lack of trust in government insti-tutions and regulations to protect and safeguard citizen interests could retard the adoption of dig-ital technologies. Furthermore, the introduction of digital super-efficiency in an environment in which there are significant structural ineffi-ciencies in the bricks-and-mortar world could potentially accentuate inequalities. This could play out in several ways. First, failure to univer-salize access to reliable and good-quality inter-net could result in the benefits of digitization being concentrated among a small segment of the population, while a significant share gets left behind. Skill premia may rise, and labor markets could get polarized. Access to digitally enhanced learning experiences and opportunities may be limited to students of certain backgrounds, fur-ther widening intergenerational inequalities.
Second, distributional tensions could arise also among online and offline domains on the one hand, and domestic and foreign players on the other, with gains for one coming at the expense of the other. Or between larger players and smaller ones, and between owners of capital and owners of labor. Most platform-based applications of these technologies are often propelled by strong network effects (or demand-side economies of scale); the larger the number of users, the greater the value of the product for the users. This posi-
14
BEYO
ND U
NICO
RNS:
HAR
NESS
ING
DIGI
TAL
TECH
NOLO
GIES
FOR
INC
LUSI
ON I
N IN
DONE
SIA
OVER
VIEW

↳ Digital technologies significantly reduce economic costs related to search, replication, transportation, tracking and verification⬎
tive feedback loop generates advantages for the first mover and can accord significant market power to the incumbent by making it difficult even for more productive newcomers to enter the market. As the market begins to mature, this concentration of some firms within an industry can slow down innovation, hurt consumers and workers, and lead to the redistribution of rents to the platforms themselves.
This report conducts an in-depth diagnostic of digital technologies, and the scale and extent of their current applications in Indonesia. Fully exploiting Indonesia’s rich data landscape, new survey data collected specifically for this report, as well as anonymized data shared with the World Bank in confidence by some of the major
digital platforms in the country, this report: (i) investigates the key challenges that Indonesia faces in maximizing its digital dividends in an inclusive manner; and (ii) identifies some ac-tionable entry-points for investments and pol-icies. The report is fundamentally about how digital technologies touch, shape and influence the economic and social lives of people, and the diagnostic as well as policy thrust of the report is organized around three main dimensions along which the risks of ‘digital exclusion’ are the most pronounced: (i) access to the medium (digital technologies); (ii) ability to harness the medium in private capacity to enhance incomes; and (iii) ability to benefit from public sector adoption of the medium to provide services more effectively and efficiently.
15
BEYO
ND U
NICO
RNS:
HAR
NESS
ING
DIGI
TAL
TECH
NOLO
GIES
FOR
INC
LUSI
ON I
N IN
DONE
SIA
OVER
VIEW

Access to the Medium→Who is connected, who is not and why?
Indonesia has made rapid progress on internet connectivity, but about half of the adult population is still without access and the inequality in the access to the internet mirrors patterns of other inequalities between demographic groups, regions and income classes
16
BEYO
ND U
NICO
RNS:
HAR
NESS
ING
DIGI
TAL
TECH
NOLO
GIES
FOR
INC
LUSI
ON I
N IN
DONE
SIA

Over the past decade, Indonesia has sustained steady growth in internet connectivity, driven primarily by rapid invest-ment in network infrastructure by the private sector. The share of the adult population connected to the internet increased almost four-fold, from 13 percent in 2011 to 51 percent in 2019.9 This impressive growth notwithstand-ing, 49 percent of Indonesian adults are still not connect-ed to the internet and a significant digital divide persists across various spatial, economic and social dimensions. For example, the urban-rural divide in connectivity is large and appears to have been increasing over the years. In 2019, 62 percent of Indonesian adults in urban areas were connected compared with just 36 percent in rural areas. Urban and rural internet connectivity was 20 and 6 percent, respectively, in 2011 (Figure O. 1).
The Government of Indonesia (GoI) has made major efforts to close the digital divide, most notably with the implementation of the Palapa Ring project, which aimed to extend the fiber-optic backbone infrastructure of the country to the outer eastern islands. With the completion of the Palapa Ring project in 2019, all of Indonesia’s 514 kota/kabupaten (cities/districts) are now connected to the national backbone. This has led to a remarkable increase in the proportion of adults connected to the internet in all major island regions of the country. But there are still size-able gaps across regions. For example, only about one-third of the adult population in Papua is connected, compared with about 55 percent in Java-Bali (Figure O. 2). At the same time, the fact that almost half of the population, even in regions with relatively better infrastructure, remains without internet access points to major challenges in the middle and last mile connectivity segments.
Income gaps in access are similarly huge. Adults in fam-ilies in the top decile of the income distribution are over five times more likely to be connected to the internet than adults in the poorest decile, only 14 percent of whom are connected (Figure O. 3). This sharp income gradient points to a possible affordability constraint in the access to internet. Likewise, there is also a sharp generational, education and gender divide. Younger adults are signifi-cantly more likely to be connected, as are adults who are better educated. Men are 8 percentage points more likely to be connected than women, suggesting possible inequal-ities in device ownership within households.
Section ⬎
117
BEYO
ND U
NICO
RNS:
HAR
NESS
ING
DIGI
TAL
TECH
NOLO
GIES
FOR
INC
LUSI
ON I
N IN
DONE
SIA
OVER
VIEW

FIGURE O.2 FIGURE O.3
Some parts of the country are still lagging
Richer Indonesians have better access
PROPORTION OF ADULTS WITH ACCESS TO THE INTERNET, BY ISLAND REGIONS IN 2011 AND 2019
PROPORTION OF ADULTS WITH ACCESS TO THE INTERNET IN 2019, BY DECILE OF PER CAPITA CONSUMPTION
Source: World Bank staff calculations based on various years of Susenas. Note: Connection to the internet is defined based on whether adults reported having access to the internet in the past three months (including accessing social media apps such as Facebook, YouTube, Instagram, Twitter, and WhatsApp).
FIGURE O.1
The share of the adult population with access to the internet has been increasing over the past decade
PROPORTION OF INDIVIDUALS 15+ WITH ACCESS TO THE INTERNET
Urban
LEGEND
National
Rural
18
BEYO
ND U
NICO
RNS:
HAR
NESS
ING
DIGI
TAL
TECH
NOLO
GIES
FOR
INC
LUSI
ON I
N IN
DONE
SIA
OVER
VIEW

Population
LEGEND
Household
Source: Telegeography (2020).
Most Indonesians connect to the internet using mobile devices, and private sector investment growth in mobile broadband infrastructure has powered the increase in internet connectivity over the past decade. Major players, such as Tel-komsel, Indosat, XL Axiata, Tri and SmartFren, have accelerated the deployment of base stations focusing increasingly on 4G/LTE stations. An estimated 95 percent of the population lives with-in reach of the fastest, i.e., 4G/LTE networks, though the number of actual 4G/LTE subscrib-ers with access to those networks is significantly lower ( just over 50 percent). Moreover, fixed broadband, or fiber-to-the-home (FTTH) ser-vice—particularly important for large volumes of data usage, for instance by schools, medical facilities, government offices and businesses—is used by a very small segment of the population. Latest estimates from the industry put the total estimated number of fixed broadband subscrib-ers at about 9.7 million. This translates to fixed broadband penetration of just 4 percent of the population, or 16 percent of households. Thus, while Indonesia performs relatively well com-pared with some of the regional peers in terms of mobile broadband penetration (particularly at slower speeds), it performs distinctly more poorly compared with some of the regional peers such as Singapore, Malaysia, Thailand and Vietnam on the fastest mobile broadband (4G/LTE) and fixed broadband rollout (Figure O. 4).
onnecting people is not just about network coverage. Internet must be affordable as well, especially for the poorer and less affluent seg-ments of the population to be able to access and adopt
it. Indonesia ranked 61st out of 100 countries analyzed by the Economist Intelligence Unit’s annual Inclusive Internet Index in 2020. Com-pared with its regional peers, Indonesia outper-forms Cambodia and the Philippines, but lags Thailand, Singapore, Malaysia and Vietnam in terms of overall internet affordability.
→ Adults in fam ilies in the top decile of the income distribution are over five times more likely to be connected to the internet than adults in the poorest decile
C
FIGURE O.4
Relative to other countries in the region Indonesia does well enough on mobile broadband penetration, but is lagging severely on fixed broadband
MOBILE BROADBAND PENETRATION
FIXED BROADBAND PENETRATION
4G/LTE
LEGEND
3G GSM
19
BEYO
ND U
NICO
RNS:
HAR
NESS
ING
DIGI
TAL
TECH
NOLO
GIES
FOR
INC
LUSI
ON I
N IN
DONE
SIA
OVER
VIEW

131st
Affordability of mobile data is not a major con-cern, particularly for relatively small volumes of data use. While mobile service providers in In-donesia adopt differential tariff-pricing to cover higher service provision costs in more sparsely populated and geographically challenging areas, there is a wide range of mobile data packages for different budgets and needs, making internet mo-bile data relatively affordable for every segment of the population. Even for poor households, the average price per GB in a mobile data plan of US$0.64 is less than 1 percent of their monthly per capita expenditure, suggesting that mobile data costs should not prevent Indonesians from connecting to the internet. The price of mobile prepaid data in Indonesia—1GB at an average of 0.95 percent of GNI per capita—is lower than the ASEAN average of 1.4 percent and the global av-erage of 5.5 percent. This is also well within the affordability criteria set out by ITU-UNESCO (1GB at 0.95 percent of GNI per capita).
In contrast to mobile broadband, setting up a fixed broadband service entails a wide array of costs that can include the cost of modem rental, an installation fee and the monthly subscription fee. In Indonesia, the price of a monthly broadband subscription cur-rently ranges from IDR 250,000 to IDR 800,000 (US$20 to US$55). The cost of installation and the first-month subscription of a fixed-line inter-net connection using even the cheapest internet package is estimated to be equivalent to around 1.2 times the monthly per capita expenditure of a typi-cal poor household. Indeed, Indonesia ranked 131st out of the 200 countries in the 2019 ITU rankings on fixed-line subscription fees, suggesting that cost could be a clear binding constraint for the adoption of fixed broadband.
Data from a survey conducted specifically for this report confirm this. Over 40 percent of house-holds reported fixed broadband subscription costs to be prohibitive. This is distinctly higher than the proportion of households whose reasons for non-adoption were the use of mobile broadband as substitutes for fixed broadband (24 percent) and the proportion of households that reported not having access to a provider (14 percent) (Fig-ure O. 5). From a regional perspective, cost is the most salient barrier to adoption in places such as Sumatra, Sulawesi and Maluku, while availability of services is the bigger barrier in Papua and West and East Nusa Tenggara. In contrast, Java-Bali stands out with the highest proportion of house-holds that treat mobile broadband as a satisfactory enough substitute for the fixed broadband inter-net experience (Figure O. 5).
LEGEND
Source: Digital Economy Household Survey, 2020.
Indonesia ranking out of the 200 countries in the 2019 ITU rankings on fixed-line subscription fees
FIGURE O.5
Fixed broadband subscriptions are prohibitive for many
REASONS FOR NOT SUBSCRIBING TO FIXED BROADBAND, BROKEN DOWN BY ISLAND REGIONS
20
BEYO
ND U
NICO
RNS:
HAR
NESS
ING
DIGI
TAL
TECH
NOLO
GIES
FOR
INC
LUSI
ON I
N IN
DONE
SIA
OVER
VIEW
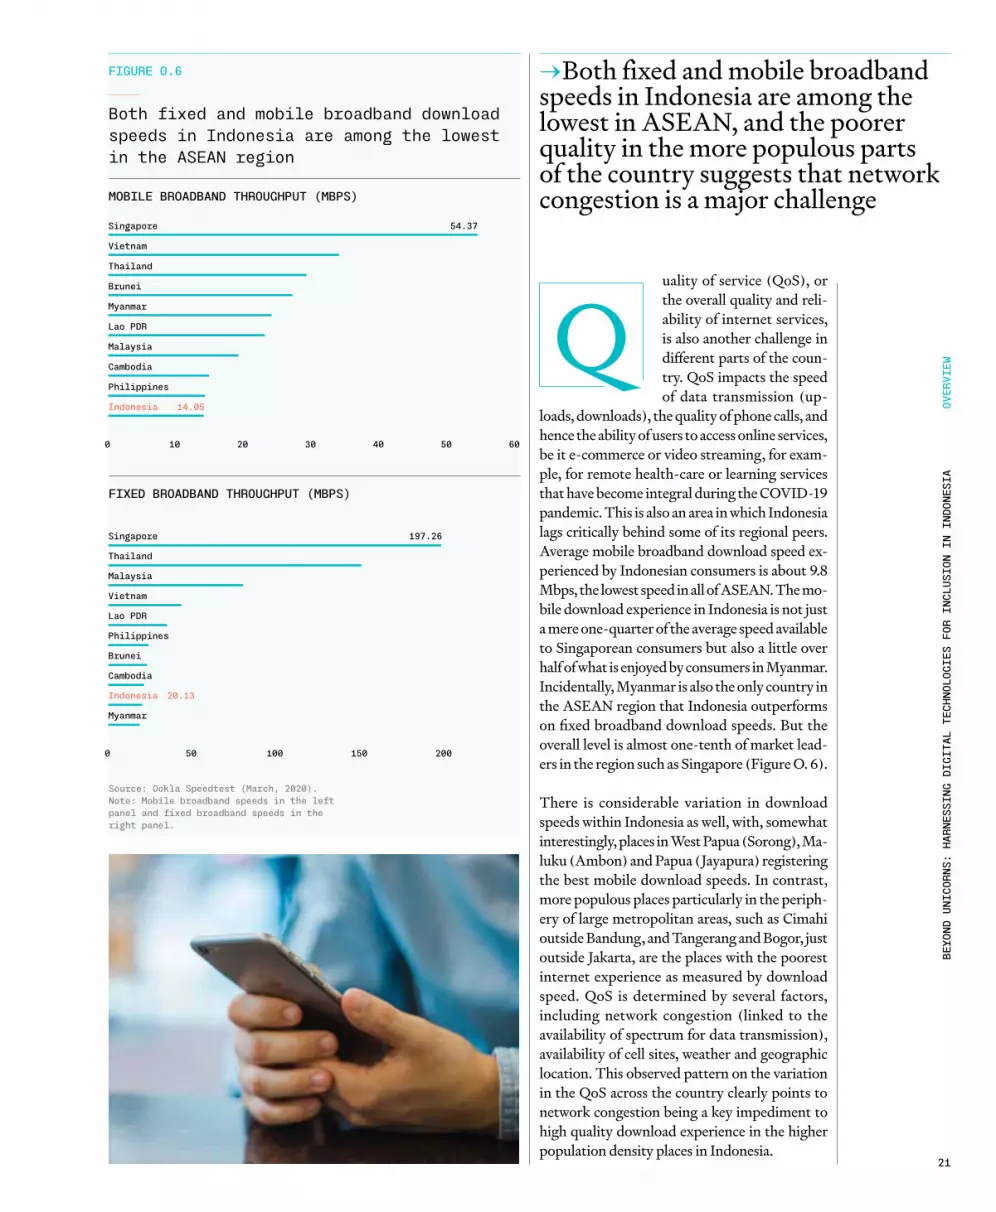
uality of service (QoS), or the overall quality and reli-ability of internet services, is also another challenge in different parts of the coun-try. QoS impacts the speed of data transmission (up-
loads, downloads), the quality of phone calls, and hence the ability of users to access online services, be it e-commerce or video streaming, for exam-ple, for remote health-care or learning services that have become integral during the COVID-19 pandemic. This is also an area in which Indonesia lags critically behind some of its regional peers. Average mobile broadband download speed ex-perienced by Indonesian consumers is about 9.8 Mbps, the lowest speed in all of ASEAN. The mo-bile download experience in Indonesia is not just a mere one-quarter of the average speed available to Singaporean consumers but also a little over half of what is enjoyed by consumers in Myanmar. Incidentally, Myanmar is also the only country in the ASEAN region that Indonesia outperforms on fixed broadband download speeds. But the overall level is almost one-tenth of market lead-ers in the region such as Singapore (Figure O. 6).
There is considerable variation in download speeds within Indonesia as well, with, somewhat interestingly, places in West Papua (Sorong), Ma-luku (Ambon) and Papua (Jayapura) registering the best mobile download speeds. In contrast, more populous places particularly in the periph-ery of large metropolitan areas, such as Cimahi outside Bandung, and Tangerang and Bogor, just outside Jakarta, are the places with the poorest internet experience as measured by download speed. QoS is determined by several factors, including network congestion (linked to the availability of spectrum for data transmission), availability of cell sites, weather and geographic location. This observed pattern on the variation in the QoS across the country clearly points to network congestion being a key impediment to high quality download experience in the higher population density places in Indonesia.
FIXED BROADBAND THROUGHPUT (MBPS)
→Both fixed and mobile broadband speeds in Indonesia are among the lowest in ASEAN, and the poorer quality in the more populous parts of the country suggests that network congestion is a major challenge
Q
FIGURE O.6
Both fixed and mobile broadband download speeds in Indonesia are among the lowest in the ASEAN region
MOBILE BROADBAND THROUGHPUT (MBPS)
Source: Ookla Speedtest (March, 2020). Note: Mobile broadband speeds in the left panel and fixed broadband speeds in the right panel.
21
BEYO
ND U
NICO
RNS:
HAR
NESS
ING
DIGI
TAL
TECH
NOLO
GIES
FOR
INC
LUSI
ON I
N IN
DONE
SIA
OVER
VIEW

→Limited spectrum, unavailability of specific bands, limited regulatory clarity on infrastructure sharing and lack of competition, especially in the provision of fixed broadband services, are the main drivers of limited access to good quality internet in Indonesia
22
BEYO
ND U
NICO
RNS:
HAR
NESS
ING
DIGI
TAL
TECH
NOLO
GIES
FOR
INC
LUSI
ON I
N IN
DONE
SIA

ll Mobile Network Op-erators (MNOs) need a spectrum portfolio, and the availability and overall quality of mobile broad-band hinges crucially on
having adequate spectrum. Currently, Indonesia has allocated a total of 467 MHz in total IMT spectrum to its active MNOs. In global and re-gional terms, this quantum of available spectrum in Indonesian is low and has not increased for some time except for some small additional spec-trum being made available in the 2.3 GHz band. Before the introduction of 5G services, 100-150 MHz in total IMT spectrum may have been enough for a successful MNO. However, this is unlikely to remain the case in the future. Poten-tially, MNOs will need more than 1,000 MHz of spectrum (including 3.5 GHz and mmWave spectrum), although prices for spectrum cannot increase by that same factor as this would crowd out investment. Three Indonesian MNOs do not have enough spectrum to be viable in the long term, with Hutchison (Tri) having no low band spectrum at all.
At about 1.71 MHz per million people, Indone-sia’s total IMT spectrum allocation is on the low-er side compared with other emerging countries. This lack of useable IMT spectrum available to the MNOs has a direct negative impact on the quality of mobile internet services in Indonesia. This manifests itself in a number of ways, such as poor latency, call drops, inability to do voice over LTE (VoLTE), etc. However, the most import-ant way is how it negatively affects broadband speeds as discussed above, especially download speeds as traffic to consumer mobile devices is typically asymmetrical. Higher spectrum pric-es also result in less capital being available for MNOs to invest in the network. With height-ened additional demands for bandwidth due to larger share of population working from home (WFH) and studying from home (SFH) due to the COVID-19 pandemic, the need for further useable spectrum is more acute.
In addition to quality issues, this spectrum scarcity also contributes directly to the digital divide by constraining further rollout of mobile broadband. The crucial 700 MHz band, which has propagation characteristics that are par-ticularly well suited for remote connectivity, is currently occupied by analog television. If the 700 MHz spectrum were to be made available to the MNOs in Indonesia, then 4G and/or 5G10 services could be provided to remote commu-
nities at significantly lower capital cost and therefore with lower ongoing operating costs. This would result in more affordable services to Indonesian consumers.
While the unavailability of low-frequency bands limits coverage expansion, the unavailability of specific high-frequency capacity bands retards the preparation for 5G rollout. Indonesia has recently made the 2,100 MHz and the 2,300 MHz bands available through an auction pro-cess. But the continued unavailability of high-er-frequency capacity spectrum, including par-ticularly the 2.6 GHz and the 3.5 GHz bands, has meant that the MNOs have been doing their best with their existing spectrum allocations. Arguably, they are over-investing in additional cell sites for 4G/LTE services when they could be investing in new 5G technology.
As 5G is more efficient, it offers a much lower cost per unit (and higher speed, better QoS and can be used for other innovations, such as 5G IoT), instead of continued capacity growth on current 4G/LTE systems. The sector needs clarity, perhaps in the form of a spectrum road-map, in order to be better able to plan and direct investment in the network in the most optimal way. Without such clarity, investment becomes significantly less efficient, and does not result in improved broadband speeds and lower latency offerings to Indonesian consumers. In addition, it is necessary to consider the future switch-off of legacy 2G and 3G networks as other Asian and ASEAN markets are doing or have done in order to free up legacy spectrum for 4G and 5G services.11 For example, Singapore’s 2G services are already switched off, Malaysia’s 3G networks are scheduled to be switched off by the end of 2021, and Vietnam is scheduled to switch off legacy 2G services in early 2022.12
Major investment is required to expand fixed broadband rollout in Indonesia. However, typically 70 to 80 percent of the investment in fixed broadband is in the form of passive infra-structure, such as ducts, poles, rights of way, and civil works. Mobile broadband deployment across Indonesia has relied instrumentally on tower-sharing, which has been well-established since the 2009 Regulation on Tower Sharing. Independent tower-sharing companies have brought efficiency to tower deployments. Cross-sectoral passive infrastructure sharing between (rail)roads and fiber-optic and elec-tricity poles has also occurred to some extent. But sharing between the telecom operators is
A
80%
↳ Passive infrastructure such as ducts, poles and rights of way account for up to 80 percent of the investment in fixed broadband rollout
UPWARD OF
23
BEYO
ND U
NICO
RNS:
HAR
NESS
ING
DIGI
TAL
TECH
NOLO
GIES
FOR
INC
LUSI
ON I
N IN
DONE
SIA
OVER
VIEW

not yet well established and lacks regulation. Duplication of passive infrastructure is costly and unnecessary, and therefore making reg-ulatory provisions to avoid such duplication would be a significant step toward expanding fixed broadband access networks.
Sharing of active network will also increase competition in mobile broadband in rural ar-eas. This takes the sharing a step beyond the current (passive) tower-sharing arrangements. The more remote areas of the country often have a single provider while, if active rural ac-cess network (RAN) sharing were to be allowed, this would create more options for competi-
tion. This could be in the form of a single shared RAN in the most remote areas, or two compet-ing RANs in rural areas that, through sharing, enable three or more mobile providers to offer services without requiring a fully duplicated RAN rollout.
Unlike the mobile broadband market, the fixed broadband market is very concentrated, with the current FTTH rollout dominated by PT Telkom (IndiHome), with some smaller pro-viders such as Biznet, MNC, My Republic, etc. in some major cities (Figure O. 7 and Figure O. 8). In most places there is no real competition for fixed broadband. This lack of competition
46% 87%
million homes passed by PLN
million homes passed by Telkom
65 mil.
30 mil.
FIGURE O.7 FIGURE O.8
While the mobile broadband space is competitive…
…the FTTH market is more concentrated, with Telkom dominating market share
SUBSCRIPTION SHARES OF VARIOUS PROVIDERS
Telkom Telkom
SUBSCRIPTION SHARES OF VARIOUS PROVIDERS
Source: Subscription data various sources.
24
BEYO
ND U
NICO
RNS:
HAR
NESS
ING
DIGI
TAL
TECH
NOLO
GIES
FOR
INC
LUSI
ON I
N IN
DONE
SIA
OVER
VIEW

in the fixed broadband space constrains rollout and affects the quality of services, as well as the affordability of tariffs, as it limits the incentive to upgrade networks in a timely manner and remain competitive in terms of pricing.
A fixed broadband provider should be able to deliver a full portfolio of services, not only broadband internet but also telephony, TV and many other value-added services. However, the current regulatory regime limits this by requir-ing providers to bid for service-specific licenses instead of a single uniform license for all ser-vices. Local telephone licenses are still formally limited to Telkom, Indosat and Batam-Bintan Telekomunikasi, with Telkom effectively be-ing the only provider outside a specific area of Batam-Bintan. This is a major hurdle for fixed broadband competition since customers are
forced to keep a Telkom connection to maintain their telephony service. Number portability is another issue. Even if another provider were to be allowed to offer fixed telephony services over the broadband connection, customers would have to change telephone number to migrate to another provider. Not being able to take their numbers to another provider locks in users with Telkom, as changing numbers can be a disin-centive, especially for institutional users (such as schools and businesses).
Although (fixed) telephony is a service under pressure, the restrictive licensing regime re-duces the competitiveness in the broadband market and limits entry for other providers, since they cannot offer a full-service proposi-tion to customers who remain locked in with the incumbent provider.
“The lack of competition in thefixed broadband space not only constrains rollout but also affects quality and affordability of internetas the incentive to upgrade networksand remain competitive in terms of pricing is limited”
25
BEYO
ND U
NICO
RNS:
HAR
NESS
ING
DIGI
TAL
TECH
NOLO
GIES
FOR
INC
LUSI
ON I
N IN
DONE
SIA
OVER
VIEW

Section ⬎
226
BEYO
ND U
NICO
RNS:
HAR
NESS
ING
DIGI
TAL
TECH
NOLO
GIES
FOR
INC
LUSI
ON I
N IN
DONE
SIA

HARN
ESSI
NG T
HE M
EDIU
M
Harnessing the Medium to Boost Income →Who is winning, who is behind, & why?Indonesians who are connected to the internet use it quite intensively, with communication, social media and leisure applications dominating usage
n average, Indonesians spend around six hours on-line, with the younger and more educated segments more digitally engaged than the relatively older and less educated demographic. In-tensity of internet engage-ment is highest for the 16 to
25 age group, which on average spends 9.7 hours a day online. There are no significant differences between men and women in terms of intensity of internet use. Among the various online activ-ities, communication, social media and leisure dominate usage (Figure O. 9). According to in-dustry estimates, Indonesia is the fifth most in-ternet engaged country in the world, behind the Philippines, Brazil, Thailand and Colombia. The average intensity of internet usage in Indonesia is 28 percent above the global average, making it an attractive market for content developers and ad-vertisers.13 Another industry estimate suggests that daily time spent on the internet in Indone-sia could have spiked by 31 percent during the peak of the pandemic and leveled off at around 20 percent more than pre-pandemic levels more recently, suggesting that as Indonesia emerges from the crisis its population could have become even more intensively engaged on the internet.14
Being an internet user in Indonesia is almost synonymous with being a social media user. Over 85 percent of internet users were also users of social media, with the most popular platforms being WhatsApp, Facebook and Instagram. WhatsApp is principally used for communi-cation and sharing information while on other platforms (Facebook, Instagram and Twitter), users are active in seeking out news and infor-mation. Social media platforms are increasingly also important for commerce in Indonesia, with a sizeable proportion of users (about 20 percent) using Facebook, Instagram and WhatsApp for buying and selling. The most common topics of discussion across all platforms relate to hobbies and lifestyles. However, religion, public policy and politics are also widely discussed, highlight-ing the importance of social media as a channel of communication and influence on these topics.
Though seemingly unproductive, social media and other digital applications used for leisure also generate value and can be stepping-stones to more sophisticated and ‘productive’ uses. A key question that is often asked is whether the consumption of these largely free digital ser-vices generates any value to the users, or are the
O
5thAccording to industry estimates, Indonesia is the fifth most internet engaged country in the world, behind the Philippines, Brazil, Thailand and Colombia.
27
BEYO
ND U
NICO
RNS:
HAR
NESS
ING
DIGI
TAL
TECH
NOLO
GIES
FOR
INC
LUSI
ON I
N IN
DONE
SIA

hours spent browsing pictures of friends on In-stagram and watching cat videos on YouTube simply time away from other more productive endeavors. If there is value generated, it is not clear how this value can be measured. There-fore, these benefits are often also not captured in statistics on national accounts. Yet, the fact that so many consumers voluntarily choose to spend so much time consuming these services must imply that there is some consumer surplus that they derive from it. There have been some efforts, primarily in advanced economies, to try to estimate the value of this consumer surplus and, depending on the methodology used, the numbers range from 3 to 25 percent of income in one estimate, and close to US$100 billion over the 2007–11 period in another.15 Using one of the approaches from the literature, we estimate that consumer surplus of free internet services in Indonesia averages around 19 to 21 percent of per capita income for users.16
FIGURE O.9
Communications, social media and leisure activities account for 80 percent of average time spent online
SHARE OF TIME SPENT ONLINE
Communications Social Media
Leisure
BrowsingBuying & Selling
Others
36% 21% 21%
11% 7%
3%Source: World Bank staff calculations using data from the Digital Economy Household Survey (2020). Note: Communication includes time spent on online texting and email. Leisure consists of time spent streaming content (audio and video), as well as playing online games. Social media includes time spent on Twitter, Facebook, and Instagram. Others consist of e-travel reservation, e-gig jobs, e-finance, ordering ride-hailing for transportation and food, and creating or downloading digital content.
↳ Though seemingly unproductive, social media and other digital applications used for leisure also generate value and can be stepping-stones to more sophisticated and ‘productive’ uses
28
BEYO
ND U
NICO
RNS:
HAR
NESS
ING
DIGI
TAL
TECH
NOLO
GIES
FOR
INC
LUSI
ON I
N IN
DONE
SIA
OVER
VIEW

igital ride-hailing services provided by companies such as Gojek—Indonesia’s homegrown decacorn that epitomizes the country’s digital potential for policy
makers—and its regional competitor, Grab, are potentially among the most frequently experienced digital transactions for many In-donesians. The green jackets worn by the mo-tor-cycle taxi drivers of both companies are a distinctive feature of almost all Indonesian cities. And this is not without reason: these platforms not only provide efficient mobility services to connect the otherwise fragmented labor markets in Indonesia’s large and sprawling metropolitan areas, but also offer several other conveniences such as food delivery and logistics. While the pandemic and the associated decline in mobility has temporarily hit this segment hard, one-quarter of all Indonesians and around
36.5 percent of urban dwellers reported using the ride-hailing service provided by these com-panies before the pandemic.17 A striking 18.4 percent of users of these ride-hailing services used them for their daily commutes. Other reasons for use included circumstances when private vehicles could not be used (52 percent), a travel option for odd hours (41 percent), and to travel to areas where public transportation services are not available (26.6 percent). With-out the availability of these digital ride-hailing options, journey times would be longer for 55 percent of users but travel costs higher for a negligible 1.9 percent of users. In addition to ride-hailing services, these companies have also been providing a whole host of other services through their apps. Chief among these is food delivery through their complementary Go-Food and Grab-Food services. Survey results show that around 21 percent of the urban pop-ulation ordered food using these apps.
D21
%↳ of the urban population ordered food using the digital ride-hailing app
of users of these ride-hailing services used them for their daily commutes
18%
→ Digital ride hailing is commonly used and not only provides mobility services to connect the otherwise fragmented labor markets in Indonesia’s large and sprawling metropolitan areas, but also offers several other conveniences
HARN
ESSI
NG T
HE M
EDIU
M
29
BEYO
ND U
NICO
RNS:
HAR
NESS
ING
DIGI
TAL
TECH
NOLO
GIES
FOR
INC
LUSI
ON I
N IN
DONE
SIA

-commerce is one of the largest components of In-donesia’s digital economy and has also been one of the major drivers of its growth during the pandemic. In-
dustry estimates suggest that the gross merchan-dise value (GMV) of e-commerce in Indonesia is likely to have increased by 54 percent yoy, from US$21 billion in 2019 to US$32 billion in 2020. This more than offsets the decline in travel over the same period, which contracted from US$10 billion to US$3 billion.18 The industry is buoyant about the stickiness of pandemic-driven adop-tion from both the buyer and seller sides, and the possibility of this growth potentially setting off e-commerce on a different trajectory. In 2019, the proportion of internet-using households that reported buying and selling online was 12.8 and 5.1 percent, respectively. As a share of the overall population, e-commerce-engaged households (those who buy or sell) only account-ed for around 7 percent. A rough back-of-the-envelope calculation using industry estimates on the adoption of digital services during the pan-demic and their anticipated stickiness suggests that this could grow by up to 10 to 11 percent of the population as Indonesia begins entering the economic recovery phase.
Indonesians who use e-commerce appear to be benefiting from it. Price and convenience are the most frequently cited reasons for online pur-chases (Figure O. 10). Looking across regions, other factors also come up in specific geogra-phies. For example, in Papua, local non-avail-
ability of products drives 40 percent of online purchases. In Bali, the reasons for buying online are roughly split equally among price, conve-nience and local non-availability of the goods that are purchased. In DKI Jakarta, however, online purchases are driven almost exclusively by price- and convenience-related factors. In addition to lower prices, being able to consume goods that were previously unavailable, having a greater variety of the same products to choose from and being able to conveniently procure are welfare enhancing and Indonesian consumers who have adopted e-commerce are realizing some of these benefits.19
In addition to making cheaper goods available to those who buy online, greater penetration of e-commerce into a geography can also have an impact on the prices of similar goods sold offline, helping to lower overall inflation for the benefit of the larger community. This can happen be-cause, with cheaper options online, including from sellers in other parts of the country, buyers, especially in remote places, can essentially arbi-trage away price differentials across geographies. Indeed, we find that price inflation of commodi-ties likely to be traded relatively more intensively online was 0.8 of a percentage point lower in high e-commerce penetration provinces relative to provinces with lower e-commerce penetration. A similar impact does not exist for commodities less likely to be traded online. In other words, greater penetration of e-commerce in a geogra-phy may be contributing to a broader slowdown in inflation of a class of commodities more likely to be traded online with greater intensity.
E
→ Buying and selling online is growing, and while still only prevalent among a small share of the population, it is already enhancing consumer welfare by providing cheaper options, greater product variety and convenience
30
BEYO
ND U
NICO
RNS:
HAR
NESS
ING
DIGI
TAL
TECH
NOLO
GIES
FOR
INC
LUSI
ON I
N IN
DONE
SIA
OVER
VIEW

FIGURE O.10
Price and convenience are the most dominant reasons for buying online…
…FOR THE COUNTRY AS A WHOLE
…AND, WITH SOME HETEROGENEITY, FOR THE MAIN ISLAND REGIONS AS WELL
LEGEND
Source: World Bank staff calculations based on data from the Digital Economy Household Survey (2020).
40%of e-commerce transactions in Papua entail purchase of goods not available in lower markets
HARN
ESSI
NG T
HE M
EDIU
M
31
BEYO
ND U
NICO
RNS:
HAR
NESS
ING
DIGI
TAL
TECH
NOLO
GIES
FOR
INC
LUSI
ON I
N IN
DONE
SIA

→While most workers have benefited from digital technologies, the more educated ones have benefited more than others
32
BEYO
ND U
NICO
RNS:
HAR
NESS
ING
DIGI
TAL
TECH
NOLO
GIES
FOR
INC
LUSI
ON I
N IN
DONE
SIA

rowth of the digital economy has clearly generated some benefits for the Indonesian consumers who are connected and able to avail themselves of these services. A key ques-tion of interest is whether the applications of these technol-ogies can also bolster income-earning opportunities. This can be both at the extensive margin by creating more jobs of a certain type, and at the intensive margin by enhancing the returns to labor in the form of higher wages and salaries. Greater availability and access to fast internet has been found in the literature to have a positive impact on broad-er employment outcomes, including increased (female) labor force participation and employment rates, net firm entries and improved productivity.20 There is also evidence from Nigeria to suggest that increased mobile broadband coverage has led to an increase in labor force participation and employment, particularly among women, and this has enabled households to realize higher income and attain higher living standards. Greater mobile broadband pen-etration is associated with lower aggregate poverty rates.
The evidence from Indonesia, however, is somewhat mixed. In a sample of districts that were not connected to the fiber optic backbone until 2010 - 33 percent of all districts and ones disproportionately outside of Java-Bali and Sumatra - being connected to the national backbone infrastructure in-creased the number of internet users but did not fundamen-tally alter the structure of the economy. Patterns of overall labor force participation, female labor force participation, total employment and youth employment were similar be-fore and after the arrival of the fiber optic links. It is true that a dominant share of Indonesia’s industrial activity is concen-trated in Java-Bali. Close to 90 percent of jobs in manufac-turing, and 84 percent of all jobs in high-value or modern services, for example, are in Java-Bali and Sumatra, while the more recently connected parts of the country remain more dependent on agriculture and natural resources, etc.
Yet, evidence suggests that specific applications of digital technologies are benefiting some population sub-groups. For example, e-commerce provides a viable pathway for Indonesian women re-entering the labor market after leaving jobs due to pregnancy/maternity or domestic work. Similarly, digital gig jobs, including those in the ride-hailing industry, are providing economic oppor-tunities that appear slightly better than other informal options, especially to young, relatively better educated, male adults in urban areas.
In an aggregate sense, however, we find that higher skilled workers have perhaps benefited more than the lower skilled ones from the expansion in internet access that Indonesia has experienced in recent years. Specifically, over the 15-year period between 2005 and 2019, educated Indonesians have consistently enjoyed higher earnings relative to their less educated peers. For example, aver-age earnings for the most educated group (those with a college or university degree) have been almost 80 percent higher than those for the uneducated group (less than six years of schooling) (Table O. 1).21 Looking at the differen-tial impact of internet penetration on these skill premia, we see that while greater internet penetration benefits all types of workers except the very low educated, the benefits are higher for the more skilled. The magnitude of the coefficients implies that, if internet penetration (measured by the proportion of individuals having access to internet at home) increases by 10 percentage points in a particular district, the earnings premium enjoyed by a college educated worker will, on average, go up by 6 percentage points.22 Thus by benefiting higher-skilled workers more relative to lower-skilled ones, the pattern of diffusion of digital technologies in Indonesia is potentially contributing to an increase in overall inequality.
GHA
RNES
SING
THE
MED
IUM
33
BEYO
ND U
NICO
RNS:
HAR
NESS
ING
DIGI
TAL
TECH
NOLO
GIES
FOR
INC
LUSI
ON I
N IN
DONE
SIA

RETURN TO EDUCATION W.R.T. <6 YEARS OF SCHOOLING
ADDITIONAL AVERAGE RETURN OF 1 PERCENTAGE POINT INCREASE IN
INTERNET PENETRATION
PRIMARY SCHOOL 18.50% 0.00%
LOWER SECONDARY SCHOOL 32.80% 0.10%
HIGHER SECONDARY SCHOOL 49.70% 0.30%
COLLEGE/UNIVERSITY DEGREE OR HIGHER 79.40% 0.60%NON-PRODUCTION WORKERS (RELATIVE TO PRODUCTION WORKERS) IN MANUFACTURING 12.70% 0.20%
TABLE O.1
Greater internet access is benefiting higher-skilled workers more than the lower skilled ones
Source: Jacoby et al. forthcoming.Note: Reported marginal returns to internet are coefficients on the interactions between education levels of individual workers and average internet connectivity within a district in fixed-effect panel data models that also control for all relevant individual characteristics, level of urbanization and economic development of the districts, as well as year effects to capture secular trends in returns to skills. A separate specification is used for the non-production worker result. The analysis uses data from Sakernas (Indonesia Labor Force Survey) (1990–2019), Susenas (Indonesia Socioeconomic Survey) (1990–2019) and the Medium and Large Manufacturing Survey (1995–2015). The unit of the analysis is individual worker (production/non-production worker by sector-district in the case of the Manufacturing Survey
→ One of the reasons for this is that despite the pandemic induced increase in the adoption of digital technologies, overall digital adoption by firms and workers is still quite low
he need to ensure business continuity in a period of limited mobility during the COVID-19 crisis has forced many Indonesian firms to initiate and intensify their
digital transformation. A survey conducted by the World Bank in June 2020 showed that only 36 percent of firms had managed to re-main continuously open since March 2020. The same survey also showed that only about 40 percent of firms had temporarily closed but had reopened by June 2020, while roughly one in
five firms had closed and continued to remain temporarily closed. Of the 46 percent of firms that reported having to make some adjustments in their business processes to either remain open or to reopen after a hiatus, 42 percent re-ported adoption of the internet, social media, specialized apps or digital platforms as having been the main coping strategy (Figure O. 11). The pandemic induced uptake of digital tech-nologies was found to be higher among larger firms (90 percent), but also not entirely neg-ligible for SMEs (58 percent) and micro firms (32 percent) (Figure O. 12).23
T
34
BEYO
ND U
NICO
RNS:
HAR
NESS
ING
DIGI
TAL
TECH
NOLO
GIES
FOR
INC
LUSI
ON I
N IN
DONE
SIA

In addition to general business administration, marketing and sales have been the functions that have seen the strongest pivot to digital. Larger and more formal firms with a more conducive en-abling environment (e.g., access to internet, dig-ital knowhow) would have certainly been better positioned to take advantage of these opportuni-ties. Businesses that were already online before the pandemic also intensified their online activities. For example, digital merchants with an online and offline presence were found to increase their online activities during the pandemic.24 Indus-try estimates suggest that e-commerce volumes soared by as much as a factor of 2.1 during the pandemic and are expected to settle at around 1.7 times the levels relative to pre-pandemic levels.25 This soaring of demand can naturally be expected to draw more suppliers into the digital ecosystem.
However, any increase in digital adoption that the pandemic brings will be from a very low base, es-pecially for micro and small enterprises. Though somewhat dated now, the economic census from 2016 reveals that only 5 percent of all Indonesian non-agricultural enterprises used the internet, with significant heterogeneity by firm size. Larger establishments were significantly more likely to have adopted the internet (67 percent) to buy and sell, as well as to conduct other activities over the internet, while the adoption rate among micro-enterprises was significantly lower (4 per-cent) (Figure O. 13). More recent data suggest that internet adoption, especially by household enterprises, could have increased to about 11.1 percent in 2018 and 12.8 percent in 2020.26 How-ever, even among household enterprises, the rich-er ones exhibit a much higher level of adoption relative to the poorest ones (Figure O. 14).
The low level of internet adoption by enterpris-es—especially micro and small enterprises—also translates into low adoption among workers. This is especially true given the fact that these micro and small enterprises jointly account for almost 75.3 percent of Indonesia’s non-agricultural em-ployment. In 2019, only 27.2 percent of all work-ers reported using the internet at their work. This was the highest among tertiary educated workers (78.1 percent), followed by much lower use among workers with just lower secondary education (17.7 percent).27 Thus, on the one hand, the overall level of internet adoption among workers and firms is low. On the other hand, there are sharp hetero-geneities in adoption between different types of workers and firms, with the higher skilled work-ers, and larger and more formal establishments having greater adoption rates.
LEGEND
MICRO FIRMS
FIGURE O.11
FIGURE O.12
SHARE OF FIRMS ADJUSTING THEIR BUSINESS PROCESS DUE TO COVID-19, BY TYPE OF ADJUSTMENTS
SHARE OF FIRMS THAT REPORTED ADJUSTING IN RESPONSE TO COVID-19
Source: World Bank Survey.
Source: World Bank Survey.
HARN
ESSI
NG T
HE M
EDIU
M
Pandemic induced uptake of digital technologies
LARGE FIRMS SMALL FIRMS
90% 58%MICRO FIRMS
32%35
BEYO
ND U
NICO
RNS:
HAR
NESS
ING
DIGI
TAL
TECH
NOLO
GIES
FOR
INC
LUSI
ON I
N IN
DONE
SIA

FIGURE O.14
Internet adoption is far higher among richer household enterprises
FIGURE O.13
Internet use by non-agricultural enterprises is still very low, with much higher incidence among medium and large enterprises
LEFT AXIS SHARE OF NON-AGRICULTURAL ENTERPRISES THAT USE THE INTERNET, BY SIZE
RIGHT AXIS THE SHARE OF ENTERPRISES OUT OF TOTAL NUMBER OF ENTERPRISES (DOT)
SHARE OF HOUSEHOLDS WITH ENTERPRISES WHO USE THE INTERNET FOR THEIR BUSINESS OPERATIONS, BY INCOME STATUS
Source: Economic Census 2016, WB staff calculations. Source: DEHS 2020, WB staff calculations.
→ Another reason is that while low-skill biased applications of digital technologies such as e-commerce and digital gig-work are enabling certain segments of the workforce to boost income, their reach is limited. Digital gig work is largely concentrated among urban men and e-commerce growth is severely constrained by issues of trust, logistics and internet connectivity
nlike the narrative surrounding digital economy jobs in more industrialized countries, we see that digital gig jobs in Indonesia are, on average, relatively better paying than many informal jobs, though certainly not as well-paying as
wage jobs. For example, internet-using gig workers make 6.2 percent more per hour in earnings than otherwise identical informal workers in the same sector of employment. But they also work the longest hours among all other types of workers. Indonesians work 39 hours a week on average and informal workers typically work 38 hours a week. In con-trast, digital gig workers average 49 hours a week. About 33 percent of digital gig jobs were being performed by workers for whom this was their first ever job, suggesting that these were new opportunities being created by the digital econ-
omy. Among the low-skilled workers who had a job before, “unsatisfactory income” was the most common reason for switching to digital gigs. However, these opportunities are largely limited to select demographic: men (85 percent of all digital gig workers), living in urban areas (87 percent) and working in the transportation, storage and communi-cations sector (69 percent). In sum, digital gig workers in Indonesia work significantly harder than all other workers but earn slightly better on average in comparison to informal workers. Digital gigs are also a stepping-stone into the labor market and a perceived ticket to higher incomes for many, but these opportunities are concentrated among a specific sub-group of the population.
E-commerce is another promising source of employment and income. In 2019, around 13.2 million out of a total of
U
36
BEYO
ND U
NICO
RNS:
HAR
NESS
ING
DIGI
TAL
TECH
NOLO
GIES
FOR
INC
LUSI
ON I
N IN
DONE
SIA
OVER
VIEW

around 127 million employed workers (10.4 percent) in Indonesia were engaged in e-commerce activities as either their primary or secondary job.28 In terms of its contribu-tion to overall employment, this number is higher than in China, where e-commerce accounts for 5 percent of total employment.29 A peculiar aspect of e-commerce in Indo-nesia is the dominance of social media and chat apps in the e-commerce landscape. Among those engaged in e-com-merce, about 71 percent reported selling exclusively via so-cial media and chat messaging apps, 3 percent sell via a plat-form only, while 26 percent use a blend of the two.30 This means that e-commerce in Indonesia remains dominated by consumer-to-consumer (or C2C in industry parlance) business, which makes it more similar to TaoBao Market-place, as opposed to the business-to-business (B2B) eco-system similar to Alibaba, or even a business-to-consumer (B2C) one, such as TMall. These C2C digital merchants are generally regarded as more casual market participants than the B2B or B2C ones. They also operate on a smaller scale and potentially also at a lower level of productivity.
Although Indonesian men are almost twice as likely to be us-ing the internet at work, internet-using women are slightly more likely than men to be engaged in e-commerce activ-ities. Among women who use the internet at work in their primary jobs, 37.8 percent of them are active online sellers (as opposed to 34.8 percent of men). E-commerce is more common as a secondary job, suggesting that it plays a useful role in supplementing family income, especially by women and youth. Among all women, e-commerce engagement (selling) is highest especially among those who are primarily engaged in housework. Moreover, e-commerce also appears to be providing a pathway for women re-entering the labor market by providing opportunities to those who may not be in their previous jobs for a variety of reasons. About 58.1 percent of internet-using women who had to leave their previous jobs because of pregnancy/maternity or to return to domestic work were engaged in e-commerce, suggesting that e-commerce provides one avenue for women to stay productively engaged, given that they exit other forms of work to take on greater responsibilities at home.
The female labor force participation rate in Indonesia has been persistently low, hovering at around 50 percent for the past three decades. This has been identified as one of the key challenges in meeting Indonesia’s development aspirations of becoming a high-income country.31 By expanding oppor-tunities for women in the labor market, e-commerce could help Indonesia to at least partially address this challenge.
However, the opportunity to engage in and benefit from e-commerce is not currently available to all Indonesians. While e-commerce has increased and spread to all parts, its intensity remains concentrated in more populous and affluent parts of the country (Figure O.16). Analyzing the spatial and temporal evolution of e-commerce over the past five years, we find that, in addition to income and popula-
38%
85%
↳ Among women who use the internet at work in their primary jobs, 37.8 percent of them are active online sellers (as opposed to 34.8 percent of men)
↳ 85 percent of all digital gig workers are men and and 87 percent of them live in urban areas
HARN
ESSI
NG T
HE M
EDIU
M
37
BEYO
ND U
NICO
RNS:
HAR
NESS
ING
DIGI
TAL
TECH
NOLO
GIES
FOR
INC
LUSI
ON I
N IN
DONE
SIA

FIGURE O.15
E-commerce is more prevalent in populous and affluent provinces
PROPORTION OF HOUSEHOLDS WITH ACCESS TO INTERNET ENGAGED IN E-COMMERCE, BY PROVINCE
tion, internet connectivity and the cost of logistics have also played an important role in explaining e-commerce growth. E-commerce penetration (the proportion of buyers and sellers in the popu-lation) has increased more rapidly in provinces in which internet access expanded and the cost of lo-gistics declined over this period. E-commerce in-tensity (value and volume of transaction per buy-er and seller), on the other hand, is constrained more significantly by the cost of logistics. In other words, while expanding internet access has drawn more people into the ecosystem, the cost and ease of logistics constrain how intensively they are able to buy and sell online.
Logistics as a bottleneck for e-commerce is con-sistent with the broader challenges that Indo-nesia faces in moving goods and commodities across its far-flung geography. The availability and reliability of transport infrastructure is the first, and perhaps the major, impediment to a smooth logistics chain. There are considerable imbalances of land, sea and air connectivity, for example, between well-developed cities around Jakarta, Surabaya, Medan and Denpasar (Bali), and to secondary, tertiary and rural areas, result-ing in high variability in logistics costs. A 2017 World Bank survey of manufacturers on logistics performance in Indonesia showed that compa-nies located in the Jabodetabek area (Greater Jakarta) managed to receive their goods in full and in good condition, and to maintain logistics costs at around 12 percent of the cost of sales, whereas companies in Kalimantan incurred up to 30 percent of cost of sales in logistics costs. In addition to direct logistics costs, delays in receiv-ing or sending products are another source of indirect logistics cost for manufacturers.
Indonesia’s entire logistics performance is ham-pered by bottlenecks from the first to the last mile. In addition to weaknesses in transport in-frastructure, the availability and competitiveness of logistics service providers (LSPs) is a chal-lenge, especially outside of the main economic areas.32 On maritime connectivity, the lack of regular inter-island maritime routes affects the timeliness of goods transit, with domestic ship-ping lines channeling regular calls mostly on the most lucrative shipping lanes (between the main ports) and the development of roll-on roll-off shipping (ro-ro), which has proven cost effective in several maritime countries, being constrained. On air connectivity, airlines usually give priority to passengers rather than goods, which reduces the likelihood of goods being delivered on time to the next destination. On land connectivity,
Source: World Bank staff calculations using data from SUSENAS 2019Note: Households are considered engaged in e-commerce if they report buying or selling online
38
BEYO
ND U
NICO
RNS:
HAR
NESS
ING
DIGI
TAL
TECH
NOLO
GIES
FOR
INC
LUSI
ON I
N IN
DONE
SIA
OVER
VIEW

FIGURE O.16
Adoption of digital financial services is extremely low
the lack of temperature-controlled trucks and quality warehousing services across Indonesia prevents expansion to secondary and tertiary cities, especially for perishable goods. More specifically on the last mile, a key challenge is also the lack of standard addresses and precise postcodes in Indonesia. This prevents the implementation of productiv-ity enhancement tools, such as the automation of sorting facilities to speed up routing of goods, and the utilization of route optimization software to map the most efficient routes for the courier. A complex regulatory framework on logistics services and an uneven distribution of population across the archipelago drive these logistics challenges.
Another key bottleneck in the expansion of e-commerce and the digital economy more broadly in Indonesia is the lack of trust in digital transactions and the consequent low adoption of digital financial services (DFS). Trust can have multiple dimensions and can, specifically in the context of e-commerce, also include issues related to whether a
purchased item will be delivered in good condition and whether a return will be accepted in case the customer is not satisfied. Trust could also relate to having to make on-line payments, and often in advance of the package being received. The general lack of trust in online transactions is among the most frequently cited reasons for not engaging in digital transactions in Indonesia. Even among those who buy online, 50 percent still prefer to pay cash on delivery. Lack of access to bank account is a binding constraint to participation in the digital economy for those in the bot-tom 20 percent of the distribution. With only 52 percent of all households having access to a bank account, financial inclusion is a recognized challenge in Indonesia (Figure O. 16). While 9 percent of households are users of DFS (which we define here as having access to online banking and mobile money services), a much smaller proportion of households (0.5 percent) are users of more advanced DFS products, which would include credit, remittances, insurance, etc.33
All HHs
48% 9% 34%
52%43%
9% 0.5%
Financially excluded
Access others' account
Only have bank
account
With access to account
Personally own account
DFS Users
Advanced users of
DFS
Source: World Bank staff calculations based on data from the Digital Economy Household Survey (2020).
50%↳ Even among those who buy online, 50 percent still prefer to pay cash on delivery.
HARN
ESSI
NG T
HE M
EDIU
M
39
BEYO
ND U
NICO
RNS:
HAR
NESS
ING
DIGI
TAL
TECH
NOLO
GIES
FOR
INC
LUSI
ON I
N IN
DONE
SIA

For more sophisticated would-be users, issues of trust could also be rooted in the understanding of the risks related to data governance and privacy, cyber security and operational risk, financial in-tegrity, and several others.34 Concerns regarding unauthorized data disclosure by any of the several entities involved could discourage this segment from adopting DFS. And these are not entirely misplaced concerns; complaints coming from fi-nancial consumers, as well as the banking sector itself, on these breaches have been increasing late-ly. While Indonesia’s Financial Services Authority (Otoritas Jasa Keuangan, OJK) has been trying to develop a stronger legal and regulatory frame-work for this, consumers still regard the disclo-sure of personal ID to financial service providers as a major risk. Provision of a legal basis, such as passing the current draft of the Law on Personal Data Protection in the legislature is necessary to promote DFS adoption in Indonesia.
There is a significant knowledge and awareness deficit which, somewhat surprisingly, is almost as prevalent among the financially excluded as it is among traditional bank account users. Roughly half of banked, as well as unbanked, households report not fully understanding the benefits of DFS, or not knowing how to use them, or more surprisingly, especially for those already with bank accounts, never even having heard of these services. This highlights the key role for agent networks in helping to reach the unbanked, as the face-to-face personal interac-tions are ideally suited to overcome the trust and knowledge gaps.
→ Striking the right balance between promoting innovation and growth without according undue advantages to first movers in the new economy is critical from the perspective of equity
n addition to universal-izing the medium by ex-panding access to reliable and high-quality internet at affordable prices to all Indonesians, maximizing economic inclusion benefits
of digital technologies will also require enabling the population—especially those at the lower parts of the income distribution or living in less populous and prosperous parts of the country—to harness the medium to boost their incomes. Some of these efforts could be purely in the dig-ital domain. For example, officially recognized digital IDs backed by strong consumer and pri-vacy protection mechanisms to foster greater trust in digital transactions, greater adoption of digital payments and other digital financial services.
But if the objective is to not just promote the digi-tal economy for its own sake but to also maximize its impact on the population, then these efforts must be nested in a broader reform agenda that includes the analog, or the conventional bricks-and-mortar parts of the economy as well. Logis-tics is one example. Though there are several digi-tal innovations disrupting the logistics landscape, the bigger challenges of logistics in Indonesia are the ones related to the fundamental difficulty of moving physical goods and commodities across the vast sprawling archipelago. These relate to the availability and quality of transportation in-frastructure (air, land and sea), as well as the or-ganization of these markets, which has a bearing on the cost structure. But a whole host of other factors that are binding constraints on the overall productivity of the economy are also relevant. It has been well documented elsewhere, for example,
I↳ Concerns regarding unauthorized data disclosure by any of the several entities involved could discourage the more sophisticated would be-users from adopting DFS
52%
↳ only 52 percent of households have access to a bank account
40
BEYO
ND U
NICO
RNS:
HAR
NESS
ING
DIGI
TAL
TECH
NOLO
GIES
FOR
INC
LUSI
ON I
N IN
DONE
SIA
OVER
VIEW

that restrictive trade policies limit access to key inputs and markets, restrictions on investments depress commercial performance, a weak compe-tition framework shields incumbents from poten-tially more productive market entrants, while the unpredictable regulatory environment further weakens the business environment, inhibiting competition and depressing investments. The introduction of super-efficiencies associated with digital technologies in an economic environment in which domestic firms, both large and small, are heavily shackled in this manner could amplify existing distortions and accentuate inequalities.
One concrete example is cross-border trade on e-commerce which, in the current business en-vironment, could make importing significantly easier than exporting. Consumers would benefit from cheaper consumer goods from abroad en-tering the domestic market. But if the econom-ic landscape forces domestic firms—especially the smaller ones—to compete effectively with a hand tied behind their backs then this could end up eroding the country’s manufacturing base and compounding inequalities. Indeed, with inbound e-commerce transactions increasing more than eight-fold from 6.1 million to 49 mil-lion in just two years between 2017 and 2019, this is an area that the Government is acutely con-cerned about. And there has been some effort to address the issue as well. For example, Minister of Finance Decree No. 199/2019, effective as of January 2020, lowered the taxable threshold on inbound shipments from US$75 to US$3 per consignment, significantly increasing taxes on commodities such as foreign-produced textiles, apparel, bags, and shoes.35 Lowering the de mini-mis threshold to deal with low-value shipments puts Indonesia in the company of other early movers in this reform space.36 However, anoth-er complementary approach could be doubling down on addressing some the critical issues that constrain the productivity of Indonesian firms.37
Another relevant distributional tension is the one between online and offline players. If not all online purchases are catering to new demand, digital transactions will be displacing analog ones. More goods bought online necessarily implies fewer goods are bought from bricks-and-mortar stores.38 A comprehensive welfare calculus needs to consider not only the benefits for consumers and producers who can partake in these digital transactions but also the potential losses incurred by the bricks-and-mortar sell-ers who are slower to adapt. Ensuring that the policy and regulatory environment strikes the
right balance between not according undue ad-vantages to the first movers in the new economy, while at the same time also not stymying inno-vation, is an important consideration from the perspective of equity. Policy makers in Indonesia are cognizant of this issue and have recently put in regulation on e-commerce requiring digital merchants active on platforms to be eligible for value-added tax. However, Indonesia’s overly generous VAT threshold also needs to be re-viewed, not only to expand the digital tax base, but also to make this an effective instrument for leveling the playing field.39
Finally, the third distributional tension is be-tween workers and firms. Business models that rely on platforms characterized by network ef-fects essentially generate value by matching cus-tomers with complementary needs. The value of the platform to the marginal customer depends on the number of vendors and service providers already on board. Similarly, the value of the plat-form to a marginal vendor also depends on the number of customers already on board. Thus, to grow and become successful, platforms need to build a critical mass on both sides of the market. But once a platform becomes dominant, it could become too large for potential competitors to dislodge, giving rise to a winner-takes-all market structure. In developed countries, this network effect has given rise to giant technology compa-nies, such as Google, Facebook, Apple, Amazon, Uber and Airbnb, where just a few firms capture a dominant part of the market.
The large amount of data these digital business-es collect, and the increasing use of automated machine-learning and artificial-intelligence (AI) driven analytics to power continuous improve-ments in the products and services that they provide, on pricing, personalization, and the targeting of ads, could further entrench their position. Data collection and sharing across platforms belonging to the same company could give rise to an exponentially higher benefit to the company compared with those companies operating only under one platform. And once this is established, there is a risk that they could exploit monopsonist power vis-à-vis vendors to extract a larger share of value added of the product. This increase in market concentration may lead to greater inequality, as labor receives a smaller share of value added in these segments.40 Some have found these consequences of the dig-ital economy to be the most important reason behind the recent increase in inequality in the United States.41
HARN
ESSI
NG T
HE M
EDIU
M
41
BEYO
ND U
NICO
RNS:
HAR
NESS
ING
DIGI
TAL
TECH
NOLO
GIES
FOR
INC
LUSI
ON I
N IN
DONE
SIA
The level of digitization in Indonesia has per-haps not reached levels where these effects would begin to manifest themselves and more work will be required specifically in the Indonesian context to see how these dynamics play out as the digital economy grows. Nonetheless, it is a potential risk with consequential distributional implications and a front to already start acting on. Boosting digital entrepreneurship, including by addressing the glaring gaps in high-end digi-tal talent (developers, AI and machine-learning specialists), leveling the uneven playing field for innovation and preempting policies that protect players, while not being too restrictive on the growth of what is still a nascent digital economy, can be some elements of strategies to address this issue. Similarly, Indonesia does not current-ly regulate working conditions and contracts of digital platforms and their workers and the platforms themselves set working conditions through their terms of service agreements. How-ever, as the digital economy grows, and more and more workers enter these work arrangements, Indonesia may need to regulate this form of work to provide workers the protection they need.
Finally, digital innovations can generate oppor-tunities, but the extent to which workers can grasp these opportunities to move up the eco-nomic ladder will ultimately depend on worker skills; digital skills specifically, as well as a broad-er set of skills necessary to survive and thrive in the digital economy. Indonesian firms routinely identify the shortage of specialized professionals and managers in the local labor market as one of the most important bottlenecks in fostering innovation within firms. The share of firms re-porting inadequate skills as the top constraint in hiring professionals and managers is the highest in the ASEAN region. A shortage of qualified talent to develop new products and services has prompted well-funded digital platforms to look elsewhere for R&D capabilities. For example, Gojek has established an off-shore R&D division by acquiring three Indian tech companies, and its regional rival, Grab, has also set up an R&D center in India for similar reasons.42
This skill gap not only stunts innovation but also represents a major lost opportunity; these are good jobs going unfilled in a labor market in which millions are looking for a pathway to the middle class. It also explains the digital technology-induced widening of the skill premia discussed above (Table O.1). But just as a nation filled with smartphone-wielding micro-entre-preneurs all selling their wares through digital
platforms is far from a realistic portrayal of the inclusive digital future Indonesia wants, so is a nation filled with data scientists, cloud-solution architects and AI experts. Thus, in addition to low digital literacy and the severe shortage of digital talent at the high end, investments in skills for a digital future should also include a broader-based effort to develop a pipeline of workers who are generally better at prob-lem-solving, communication, teamwork and adaptability (i.e., high-order cognitive and so-cial skills).
↳ digital innovations can generate opportunities, but the extent to which workers can grasp these opportunities to move up the economic ladder will ultimately depend on worker skills; digital skills specifically as well as a broader set of skills necessary to survive and thrive in the digital economy
42
BEYO
ND U
NICO
RNS:
HAR
NESS
ING
DIGI
TAL
TECH
NOLO
GIES
FOR
INC
LUSI
ON I
N IN
DONE
SIA
OVER
VIEW

“In addition to low digital literacy and the severe shortage of digital talent at the high end, investments in skills for a digital future should also include a broader-based effort to develop a pipeline of workers who are generally better at problem-solving, communication, teamwork and adaptability.”
HARN
ESSI
NG T
HE M
EDIU
M
43
BEYO
ND U
NICO
RNS:
HAR
NESS
ING
DIGI
TAL
TECH
NOLO
GIES
FOR
INC
LUSI
ON I
N IN
DONE
SIA

Using the Medium to Deliver Better Services →What holds Indonesia back?
44
BEYO
ND U
NICO
RNS:
HAR
NESS
ING
DIGI
TAL
TECH
NOLO
GIES
FOR
INC
LUSI
ON I
N IN
DONE
SIA
OVER
VIEW

he ability of governments around the world to har-ness digital technologies to deliver services is per-haps one area on which the COVID-19 pandemic has focused the strongest spotlight. Just as people and businesses have had to adapt to various measures taken to contain the spread of the virus, so too have
governments. And the ability to use digital tech-nologies to curb and manage the pandemic, as well as to ensure the continuity of essential ser-vices, has emerged as a key marker of resilience. Digital technologies have also been useful in the rapid deployment of social assistance respons-es. In countries with extensive mobile phone or internet penetration, as well as strong existing social protection systems, digital technologies related to digital ID and digital financial services have helped to facilitate the identification and registration of benefit recipients. Since it is the poorer segments of the population that have been most affected by the pandemic—by job losses and income reductions, as well as by the disruption of education—countries that have been able to better harness digital technologies in this manner have also been successful in laying a more robust foundation for inclusive recovery.
For Indonesia, the pandemic has laid bare the lack of readiness to fully capitalize on these dig-ital opportunities. Over 530,000 schools had to be closed, affecting 68 million students from pre-primary through tertiary levels. While all students still reported engaging in some form of learning activities at home, 64 percent of them faced critical constraints related to the lack of reliable connections and supporting devices. In the early stages of the pandemic, Indone-sia also struggled to obtain consistent data of COVID-19 cases due to challenges in integrating information systems across the various tiers of government, slowing down the response.43 The lack of digital and other alternatives caused widespread disruptions in non-COVID health care across the country.44 Some emergency so-cial assistance that was approved by the Govern-ment, such as Kartu Prakerja (pre-employment card, repurposed as temporary cash assistance to unemployed workers), faced critical delays in deployment due to difficulties in verifying the identities of recipients. More recently, efforts to accelerate vaccine rollout have also been ham-strung by lack of reliable data.
T
>530,000
↪ Over 530,000 schools had to be closed, affecting 68 million students from pre-primary through tertiary levels
Section ⬎
3
45
USIN
G TH
E ME
DIUM
45
BEYO
ND U
NICO
RNS:
HAR
NESS
ING
DIGI
TAL
TECH
NOLO
GIES
FOR
INC
LUSI
ON I
N IN
DONE
SIA

→ Indonesia’s nascent EdTech and HealthTech scene has received a major boost and though these apps have clearly filled a void during the pandemic, their overall reach is limited to the more affluent clientele in urban centers, mostly within Java. For digital technologies to make a dent on the root causes of long-term inequalities, they need to be adopted and applied at scale by the Government.
iscussions about the role of digital technologies in sectors such as education and health often begin and end with overwhelming optimism about the pow-er of these technologies to
inspire a disjunctive break with the past. In the context of developing countries that typically face complex and deep-rooted challenges in delivering quality services, the “disruptive” promise of these technologies can be especially appealing. Indonesia is no different and, over the years, as the digital economy has grown, so has the number of new entrants in the EdTech and HealthTech scene. A World Bank study estimated that close to 160 EdTech startups in Indonesia mostly established in the 2013–18 period. Of these, 60 companies were still op-erational and offering a variety of products and services before the pandemic struck.45 Similarly, the Indonesian HealthTech Association reports that around 250 registered firms are operating in the HealthTech space.46
Indonesian EdTech companies provide a range of services and products: (i) targeted at students to help them with learning and upskilling; (ii) tar-geted at educators to assist them with student management, communication and teaching; and (iii) targeted at educational institutions to help them with administration. For example, com-panies such as Ruangguru, Zenius and Quipper develop and provide self e-learning content, in-teractive learning platforms and study tools that help K-12 students expedite the learning process, along with interactive online services that help students with their assignments and test prepa-ration. Companies such as Arsa Kids, Digikids and Educa Studio develop game-based and blend-ed-learning experiences, including interactive storybooks and educational mobile apps, to help improve early childhood educators’ effectiveness. These products and services are typically dissemi-nated using several approaches, such as web-based and mobile-based applications.
On the HealthTech side, innovative products and services are geared toward providing health
services remotely (telemedicine) through apps and websites, as well as cloud-based solutions for hospital information management systems. While telemedicine generally covers various health services, including consultations with doctors, the provision of diagnosis, treatment and preventive care, telemedicine in Indonesia is relatively new and still limited primarily to teleconsultation. For example, companies such as Halodoc and Alodokter—considered the most well-funded firms in the market—con-nect patients to medical doctors to do online consultations.47 Hospital information manage-ment systems have traditionally been offered by software developers and vendors catering for tailored solutions for hospitals. However, more recently, new firms such as Medico and Perik-sa.id have started to offer cloud-based services (software-as-a-service).
The interest in these applications has soared after the COVID-19 outbreak. In the second quarter of 2020, the number of new users on Zenius jumped 12-fold over the previous year.48 Ruangguru, which had been growing steadily even before the pandemic, reported a jump in web-hits from around an average of 7.5 mil-lion to over 11 million per month. Industry estimates suggest that the usage of telemedi-cine apps in Southeast Asia increased by a fac-tor of 4.5 in March 2020 (at the peak of the COVID-19 outbreak) compared with January 2020 usage. The number is consistent with growth seen by some of the prominent players in Indonesia. Halodoc reported its monthly ac-tive users increasing by a factor of 10 during the pandemic compared with the fourth quarter of 2019, while Alodokter claimed to have experi-enced a 1.5-times increase compared with the pre-COVID-19-outbreak period.49
However, while these apps have clearly filled a void during the pandemic, their overall reach is limited to the more affluent clientele in urban centers, mostly within Java and usage is higher among the relatively better off. According to a nationally representative survey conducted a few months after the pandemic outbreak, more than 83 percent of households in Jakarta were found
D
↪ …while (EdTech) apps have clearly filled a void during the pandemic, their overall reach is limited to the more affluent clientele in urban centers, mostly within Java and usage is higher among the relatively better off
46
BEYO
ND U
NICO
RNS:
HAR
NESS
ING
DIGI
TAL
TECH
NOLO
GIES
FOR
INC
LUSI
ON I
N IN
DONE
SIA

83%
↳ more than 83 percent of households in Jakarta were found to be providing some form of learning activities using mobile apps and/or online learning to their children
to be providing some form of learning activities using mobile apps and/or online learning to their children.50 The number was significantly low-er in other parts of Java (43 percent), and even lower outside of Java (38 percent). While on av-erage 54 percent of all Indonesian families took up some form of digital learning to minimize the disruption in the education of their children, the option was available to only 38 percent of families in the bottom 40 percent of the income distribution. Lack of complementary inputs such as supporting ICT devices (smartphones, computers) and limited access to good-quality internet were reported to be the main reasons behind this observed pattern.
One interesting trend that has been observed throughout the world is how even with the wide-spread pivot toward online education induced by the pandemic, the specific technologies that have been adopted for the purpose have sought to replicate the classroom environment instead of deviating from it. Relatively better endowed schools have taken to Zoom-classrooms, while across the country WhatsApp has provided a medium for student-teacher interactions. Even as education has moved online, the pandemic has ended up underscoring the inherent irre-placeability of student-teacher interactions.51 Likewise, in health, in-depth interviews with some doctors providing teleconsultations reveal that telemedicine is likely to be most useful for early-stage diagnosis and educating patients. It is also likely to be useful for certain areas of medicine (e.g., mental health) that car-ry a certain stigma in Indonesia and on which patients may feel more comfortable discussing matters through the digital medium. But for a broad range of other medical consultations, doctors regard being able to physically examine patients as an indispensable part of the diag-nostic process.
The EdTech and HealthTech sectors in Indo-nesia face several challenges to their growth. These include difficulties with financing, lack of digital talent in the marketplace, and poor regulatory clarity, including on sensitive topics such as consumer protection and personal data
protection, etc. However, as experience from the more developed parts of the world shows, and Indonesia's own recent experiences con-firm, these innovations should not be thought of as tools to displace the traditional modes of service delivery, but ones to help enhance them.52 Especially from the perspective of using digital technologies to reduce intergenerational inequalities, bigger gains will come from the Government’s readiness to experiment with and internalize some of these digital solutions to chip away at bricks-and-mortar challenges to enhance service delivery. In fact, given the differential adoption of digital technologies in-duced by the pandemic in sectors such as educa-tion, with wealthier children in better endowed schools having leapfrogged their peers from less affluent backgrounds, it has become even more urgent for the Government to catch up. In that sense, a vibrant innovation ecosystem that ex-tends the frontiers of these solutions is some-thing Indonesia should certainly strive for as these innovations expand the menu of options available for the Government to experiment with broader applications.53
A key challenge with all these efforts is to move away from ad-hoc solutions to a more compre-hensively thought out whole-of-government approach to the broader digital transformation of government and service delivery. Another foundational challenge is connectivity. As dis-cussed above, fixed broadband penetration in Indonesia is very low compared with regional peers. This is an especially binding constraint for institutional users such as schools, hospitals, and other health facilities, which may want to intensify their use of digital technologies to en-hance service delivery. For example, of all the 219,000 schools under the Ministry of Educa-tion and Culture (MoEC), just 10 percent had access to fixed broadband connections in 2019, 42 percent had some form of mobile broadband connectivity, while a significantly large share (45 percent) was not connected at all. Closing these connectivity gaps, not just in schools but also in other important service delivery nodes, will be a crucial step in harnessing digital technologies for greater inclusion in post-pandemic Indonesia.
Other parts of Java
Outside of Java
43%
38%
USIN
G TH
E ME
DIUM
47
BEYO
ND U
NICO
RNS:
HAR
NESS
ING
DIGI
TAL
TECH
NOLO
GIES
FOR
INC
LUSI
ON I
N IN
DONE
SIA

or people to be able to ful-ly participate in the digital economy and carry out of-ficial and high-value trans-actions online, countries need to introduce digital
ID systems—a need that has been accentuated by the COVID-19 pandemic. Digital ID systems for online transactions are a natural progression from national ID systems, which have been used predominately for in-person transactions, in-cluding in Indonesia, because a physical ID card cannot be used remotely over the internet.
Digital IDs make use of technologies such as smart-phones and cryptography to provide such security and assurance for remote interactions. They can be issued by a single entity (centralized) or by multi-ple entities in an ecosystem (federation). Emerging standards are also creating opportunities for de-centralized models where the digital ID is stored on a personal device or digital wallet.
Well-designed and implemented digital ID sys-tems can unlock an enormous amount of econom-ic value for countries, estimated by the McKinsey Global Institute to be between 3 and 13 percent of GDP by 2030.54 The largest gains will be ex-perienced in the digital economy. First, digital ID systems can promote inclusion when they are uni-versally accessible and useable because they allow all people to do transactions, whether that means opening a bank account or applying for a social protection benefit, online.55 Second, they enable services to be expanded through online channels and made more efficient. Third, they are part of a ‘digital stack’ of platforms that promote innova-tion and value added services, such as electronic signatures, digital payments, and allowing people to exercise control over their personal data. Fourth, they facilitate cross-border digital transactions. In the European Union, for example, the eIDAS reg-ulation and proposed regulation for decentralized digital identity wallets enable a digital ID issued by one member state to be used in others, without needing to be physically present.
But there are also risks related to digital ID. Ex-clusion prevents people not just from register-ing for a digital ID but also using a digital ID,
such as by using technologies or processes that are not compatible with the local context. Data protection and privacy breaches require a dual approach of developing comprehensive legal frameworks that ensure accountability, includ-ing independent oversight. Vendor and technol-ogy lock-in can be mitigated somewhat through the adoption of open standards and open-source software, competitive procurement, and strong contract and vendor management.
While Indonesia does not yet have an official digital ID system or ecosystem that would allow Indonesians to securely verify their legal identity online, the existing national ID system is an asset could be leveraged to create one relatively easily. The national ID system, which is managed by the Directorate General for Population and Civil Reg-istration (Direktorat Jenderal Kependudukan dan Pencatatan Sipil, Dukcapil), is well-established, its database (Sistem Informasi Administrasi Kepen-dudukan, SIAK) has been digitized, and nearly the entire population has a unique identity numbers (Nomor Induk Kependudukan, NIK). In 2011, a new ID card (Kartu Tanda Penduduk Elektronik, KTP-el) was introduced and biometric recognition (fingerprint, iris and faces) was added to assist with removing duplicates in the SIAK, as well as to enable identity verification. The national ID sys-tem offers a strong foundation on which an official digital ID system or ecosystem should be built on. Therefore, digital ID is a ‘low hanging fruit’ for Indonesia to make services more inclusive, to promote trust in the digital economy and society, and to create new drivers of economic growth. Doing so will also allow Indonesia to join all its fellow middle and high income ASEAN Mem-ber States who have launched whole-of-economy digital ID frameworks.
Both the Ministry of Home Affairs and Ministry of Communications and Information (Kominfo) have expressed strong interest in designing and launching an official digital ID system or ecosys-tem. In the absence of such a system, online ser-vice providers are using unreliable and insecure mechanisms to verify the identity of Indonesians online, such as requesting customers to take self-ies holding the national ID card (KTP-el). While this is a practical workaround, some fintech pro-
→ Indonesia does not yet have any officially-recognized digital IDs, but has a relatively strong national ID system that represents a significant asset on which to build a national digital ID ecosystem
FFor people to be able to fully participate in the digital economy and carry out official and high-value transactions online, countries need to introduce digital ID systems—a need that has been accentuated by the COVID-19 pandemic
48
BEYO
ND U
NICO
RNS:
HAR
NESS
ING
DIGI
TAL
TECH
NOLO
GIES
FOR
INC
LUSI
ON I
N IN
DONE
SIA
OVER
VIEW

viders have reported that as many as 60 percent of customers provide selfies that are unreadable or require manual intervention, such as a video call, creating unnecessary expense and challenges. More recently, licensed e-signature providers have begun offering basic digital ID authentication ser-vices (i.e., going lower in their value chain), but these are based on commercial relationships with the service providers and require the charging of higher fees in order to make a profit. Other third parties have emerged offering ID authentication services, but again these charge substantial fees. For example, the Kartu Prakerja website had to purchase facial recognition services from a private company when it rolled out applications during the COVID-19 pandemic. Similar constraints exist for face-to-face transactions, as Dukcapil has not yet launched biometric authentication or electronic know-your-customer (e-KYC) services at a national scale.
There is substantial demand for digital ID in Indonesia across the public and private sectors. E-KYC and digital ID remains one of the priority issues for the financial sector, from banks to fin-tech companies. Likewise, government agencies such as BPJS Employment and BPJS Health are trying to transform the way they offer services to citizens, including by shifting to online channels, but are hampered by the absence of an acces-sible and affordable digital ID system. At the regional level, there is an opportunity for mutual recognition arrangements to enable cross-bor-der transactions as a stepping-stone toward a broader ASEAN-level arrangement, as has been alluded to in the ASEAN Digital Masterplan for 2025. Beyond ASEAN, there is also an opportu-nity for mutual recognition arrangements with the European Union (eIDAS), Australia, the United States and Canada, among others.
↪ Digital ID is a ‘low hanging fruit’ for Indonesia to make services more inclusive, to promote trust in the digital economy and society, and to create new drivers of economic growth. Doing so will also allow Indonesia to join all its fellow middle and high income ASEAN Member States who have launched whole-of-economy digital ID frameworks
INDONESIA
SINGAPORE
MALAYSIA
THAILAND
CAMBODIAVIETNAM
PHILIPPINES
BRUNEI
LAO P.D.RMYANMAR
USIN
G TH
E ME
DIUM
TIMOR LESTE
49
BEYO
ND U
NICO
RNS:
HAR
NESS
ING
DIGI
TAL
TECH
NOLO
GIES
FOR
INC
LUSI
ON I
N IN
DONE
SIA

→ Digital upgrade of government can fundamentally transform the quality of citizen-state interactions
nother important and broader pathway to har-nessing digital technolo-gies for greater inclusion is by enabling these tech-nologies to fundamentally
transform the quality of citizen-state interac-tions. This could be for specific services, such as education, health and social protection as dis-cussed above, but also for a whole host of other services that could be improved significantly by a broader digital transformation of govern-ment. The key challenge will be to transition from the current siloed structure of multiple, incompatible government information and data management systems to a whole-of-gov-ernment, platform-based approach, which has emerged as best practice in many economies globally. Related to that is the need to establish clear leadership and coordination for govern-ment digital services.
Over the years, the Government has made several efforts to digitize government services. While some of these first-generation efforts have been moderately successful in their re-spective objectives, they have been limited in terms of their scope and often ad hoc in nature. These attempts to digitalize, often at the be-hest of an agency-head or a subnational entity lead championing the effort, have resulted in a proliferation of information systems, websites, apps and platforms that have very limited in-teroperability at the front end and create sig-nificant duplication of effort and investment at the back end.
In the past two years, the Government has made efforts to address these digital government is-sues. One concrete step in this direction is the issuance of Presidential Regulation No. 95/2018 on e-Government and Presidential Regulation No. 39/2019 on One Data. The objective of the regulation on e-government is to imple-ment an integrated e-government system by, among others, getting all government agencies to adopt a common and interlinked enterprise architecture, co-using IT systems and establish-ing a national coordination team. The thinking on digital transformation as embodied in the e-government initiative focuses to a large extent on the digitization of existing internal govern-ment processes. However, the journeys taken by countries such as the UK and Singapore, among others, suggest a fundamental reimagination of processes, procedures and structures consider-
ing what digital technologies make possible may be needed for transformation to be realized.
Global experience also shows that digital trans-formation of government is a complex under-taking involving multiple stakeholders. In Indo-nesia the public sector’s institutional structure is particularly complex and highly fragmented with multiple agencies having overlapping man-dates. This fragmentation naturally also makes coordination a major challenge, which increases the complexity of completing even the simplest of tasks that require cooperation among differ-ent stakeholders. For example, in more than two years since the e-Government Regulation was promulgated, the e-government coordination team, which consists of seven-line agencies with MenPAN-RB in the coordinating role, has been unable to convene and agree upon the shared vision of e-government implementation. In the absence of coordinating body such as the Gov-ernment Digital Service (GDS) in the UK or GovTech in Singapore with authority over all relevant stakeholders to overcome these coor-dination challenges, the digital transformation agenda in Indonesia has not been able to take any concrete shape and form, much less gather any real momentum.
Similarly, Indonesia does not have a clear whole-of-government data management poli-cy. Presidential Regulation No. 39/2019 on One Data goes some of the way toward addressing this, but fragmentation remains an issue and several implementation challenges remain to be worked out. Each sector is responsible for its own data management, and guidance on cross-sectoral data sharing and utilization is often missing. The One Data regulation grants Bappenas greater authority to regulate, mon-itor, and enforce data governance across all government agencies. Recently issued imple-menting regulations also shed some light on the intersectionality of this regulation with other initiatives, such as the Regulation on E-Govern-ment/Digital Government (Presidential Regu-lation No. 95/2018), the Electronic Transaction Law and its implementing regulation (PP No. 82/2012 and its revision PP No. 71/2019), the forthcoming Personal Data Protection Law,56 the Population Administration Law, the Digital Payment Regulation, and the Omnibus Law.57 However, some of the key strategic datasets are maintained by various government institutions and the One Data regulation is ambiguous on the role of these administrative entities.58
A
50
BEYO
ND U
NICO
RNS:
HAR
NESS
ING
DIGI
TAL
TECH
NOLO
GIES
FOR
INC
LUSI
ON I
N IN
DONE
SIA

“Presidential Regulation No. 39/2019 on One Data goes some ways in strengthening Indonesia’s data management policy, but fragmentation remains an issue and several implementation challenges remain to be worked out”
USIN
G TH
E ME
DIUM
51
BEYO
ND U
NICO
RNS:
HAR
NESS
ING
DIGI
TAL
TECH
NOLO
GIES
FOR
INC
LUSI
ON I
N IN
DONE
SIA

Section ⬎
4Policies to Leverage DTs for Greater Inclusion →What can Indonesia do?
52
BEYO
ND U
NICO
RNS:
HAR
NESS
ING
DIGI
TAL
TECH
NOLO
GIES
FOR
INC
LUSI
ON I
N IN
DONE
SIA

he analysis presented in this report points to three key policy principles to en-sure that no one is left be-hind: (i) improving digital connectivity and universal-izing access; (ii) enabling the medium to generate economic opportunities
for all and unlocking citizen capabilities to seize these opportunities; and (iii) harnessing the medium to upgrade the quality of citizen-state interactions and improve service delivery. Some specific and actionable reforms to implement these principles are discussed below.
T
50%
FIGURE O.17
What can Indonesia Do? policy priorities3
Make the Digital Economy Work for All
Improve Digital Connectivity & Universalize Access
Adopt Digital Technologies to Upgrade Citizen-State Interactions
21 3
↪ Roughly half of the adult population is still not connected to the internet
POLI
CIES
TO
LEVE
RAGE
DTS
53
BEYO
ND U
NICO
RNS:
HAR
NESS
ING
DIGI
TAL
TECH
NOLO
GIES
FOR
INC
LUSI
ON I
N IN
DONE
SIA

1ddressing the digital divide and making affordable and high-quality internet avail-able to all Indonesians will require regulatory reform in three key areas: (i) spec-trum management, specifi-cally sequential freeing up of spectrum in specific bands; (ii) greater regulatory clari-
ty on provisions for active and passive infrastruc-ture sharing; and (iii) greater competitiveness and regulation of the telecom industry more broadly.
Optimize spectrum allocation for mobile broadband.Under the recently enacted Omnibus Law on Job Creation No. 11/2020, reform of spectrum management is on the right track for optimiza-tion of spectrum allocation. The law also impos-es a mandatory two-year plan to convert analog television to digital television in order to secure digital dividend in the 700 MHz spectrum band. Release of the 2.6 GHz band, currently used for satellite TV, would add capacity in urban centers and alleviate network congestion. Menkominfo should consider accelerating its plans for reallo-cation of this band from satellite broadcasting to mobile broadband before the current end of the spectrum license in 2024. Securing 3.5 GHz band spectrum will require consultation with current C-Band satellite users. Over time, some form of sharing should be considered with use of this band for mobile services in urban centers and for satellite services in those rural areas that still require C-band connectivity. This would add further capacity and enable introduction of 5G. Finally, the GoI should prepare to make available the mmWave spectrum in the 24-29 GHz band to enable immediate deployment as soon as the industry is ready for 5G mmWave services.
Consistent with International Telecommunica-tions Union (ITU) recommendations, Indone-sia should endorse an overall target for available IMT spectrum of at least 840 MHz plus alloca-tions of mmWave spectrum as soon as possible59 and certainly no later than 2024. Such alloca-tions should be made in larger contiguous blocks in accordance with future best practice. MNOs should also have the flexibility to use their allo-cated IMT spectrum for mobile broadband and/or fixed wireless access (FWA) services. High speed FWA services using 4G/5G technologies are proving globally to be a very competitive product with fixed broadband services.60
Strengthen mechanisms to ensure sharing of active and passive infrastructure.Tower sharing for mobile broadband networks was mandated in 2009 and has been deployed at a large scale but sharing other passive infra-structure, such as ducts, poles, etc. (required for fiber optic networks) between provid-ers will likely remain limited without further regulatory reform. The 2009 Tower Sharing Regulation brought efficiency improvements to deployment of towers with some sharing of passive infrastructure across sectors, between (rail)roads and fiber optic, and electricity poles and fiber optic. But sharing between telecom operators lags behind, despite a joint letter is-sued by Menkominfo and MoHA in 2018. The Omnibus Law mandates passive infrastructure sharing through a change to the Telecom Law Article 34A and B, but implementation of the associated provisions will require inter-agency coordination among national agencies and local governments. Separately, active infrastructure sharing would promote competition in mobile broadband services in rural/remote areas but is currently not allowed under Telecom Law PP 52/53. The Law requires in many cases separate
A
IMPROVE DIGITAL CONNECTIVITY & UNIVERSALIZE ACCESS
54
BEYO
ND U
NICO
RNS:
HAR
NESS
ING
DIGI
TAL
TECH
NOLO
GIES
FOR
INC
LUSI
ON I
N IN
DONE
SIA

2deployment of (mobile) infrastructure by each and every telecom operator. The Omnibus Law does include a change to Article 34B that opens up the possibility of active infrastructure shar-ing, although that could have been made more explicit. Telecom Law PP 52/53 would have to be updated to allow for sharing of active infra-structure on a B2B basis.
Strengthen competition along the broadband value chain.To improve the competitiveness of service pro-viders, Indonesia should consider transitioning toward the unified licensing of service provid-ers to enable each to deliver a larger portfolio of services. The current regulatory regime restricts the ability of operators to provide a full range of services by requiring them to ap-ply for and maintain specific service licenses, instead of a single uniform license for all ser-vices. This limits the issuance of telephony ser-vice licenses and the portability of telephone numbers, etc. To address these issues, it is rec-ommended that the GoI reviews the current licensing regime and considers transitioning toward a single/unified license to deliver the full portfolio of services to a larger number of service providers, so that effective competition for dual-play and triple-play fixed broadband services will emerge. This should be comple-mented by regulations enabling portability of telephone numbers across providers. Neither the Telecommunication Law nor its amend-ments in the Omnibus Law addresses these is-sues. Telecommunications-related regulatory commitments in the Regional Comprehensive Economic Partnership (RCEP) and the ASE-AN Digital Masterplan (ADM 2025),61 which was launched in January 2021 at the 1st ASEAN Digital Ministers’ Meeting,62 should also guide further regulatory reforms.
everal crucial interventions will be required to make the digital economy work for all.
Support the development of logistics.
Reducing the cost of logistics to enable an ef-ficient and cost-effective movement of goods across the archipelago will enhance the impact e-commerce can have on boosting the produc-tivity of small and micro-entrepreneurs, espe-cially those in the lagging places of the country. Continuing to develop basic physical infrastruc-ture to improve connectivity through strength-ened and/or rehabilitated infrastructure such as roads, ports and electricity will remain a crucial foundation of this effort. This may also require leveraging private sector capital and expertise, as appropriate through public-private partner-ships. Separately, fostering an innovation envi-ronment that is conducive to the scaling of the several e-logistics that are emerging to provide customized solutions to connect enterprises to market will also be important.
Nurture digital skills and skills for the 21st century.Institutional action and policies also need to recognize that digital skills are a subset of a broader skillset needed for the 21st century digital economy. The exponential pace of tech-nological change today makes it hard to antic-ipate which job-specific technical, digital and other skills will thrive and which will become obsolete in the near future. As a result, the abil-ity to adapt quickly to changes is increasingly valued by the labor market.63 As such, the most sought-after trait globally is adaptability—the ability to respond to unexpected circumstances and to unlearn and relearn quickly. This trait requires a combination of certain cognitive skills (critical thinking, problem-solving) and
S
MAKE THE DIGITAL ECONOMY WORK FOR ALL
POLI
CIES
TO
LEVE
RAGE
DTS
55
BEYO
ND U
NICO
RNS:
HAR
NESS
ING
DIGI
TAL
TECH
NOLO
GIES
FOR
INC
LUSI
ON I
N IN
DONE
SIA

socio-behavioral skills (curiosity, creativity). Indeed, the top five skills and skill groups that executives in Indonesia’s largest companies see as rising in prominence in the lead-up to 2025 are creativity, originality and initiative, complex problem-solving, active learning and learning strategies, emotional intelligence, and analytical thinking and innovation.64
Modern tertiary education needs to cultivate in students a minimum threshold of foundational “transferable” higher-order skills for the 21st century digital economy, even in STEM fields. Technology and integration have increased the demand for higher-order general cognitive skills—such as complex problem-solving, crit-ical thinking, and advanced communication—that are transferable across jobs. Therefore, the combination of general and technical skills is becoming highly valued (World Bank 2019). Tertiary education systems should therefore guarantee a minimum threshold of transferable cognitive skills, which are also the best inocu-lation against job uncertainty. Incorporating more general education in tertiary programs is one way to do this. An additional year of general education was added in 2012 to undergraduate programs in Hong Kong and China, focusing on problem-solving, critical thinking, communi-cation, leadership, and life-long learning skills and with early assessments showing positive results.65 Another way is through innovative pedagogy. The Faculty of Architecture and Environmental Design at the College of Sci-ence and Technology, University of Rwanda, has promoted learning strategies that include open-ended assessments, feedback opportuni-ties, and a progressive curriculum that balanc-es academic challenges with student support. These approaches have improved the criti-cal-thinking skills of students. Forward-look-ing universities are finding ways for adult stu-dents to acquire a broad set of socio-behavioral skills. Vocational colleges in the Netherlands are providing entrepreneurial courses aimed at improving noncognitive skills such as teamwork and self-confidence. Tunisia has introduced an entrepreneurship track that combines business
training with personal coaching to reshape the behavioral skills of university students.66
Close collaboration between industry and ter-tiary education is critical. The low quality of TVET and tertiary education in Indonesia has been linked to, among other factors, lack of com-petency frameworks developed in consultation with the private sector. Inadequate labor-market information and intermediation make it hard to align curricula and teaching with the occupations and skills that are most needed. Private sector participation in tertiary education planning and policy is thus a requisite both at a strategic and technical, curricular level. In China, for exam-ple, Lenovo is working with tertiary institutes to train vocational students in high-tech areas, such as cloud computing, that feature practice-based curricula, practitioner-led instruction, and pro-fessional certification.67 The GoI also needs to incentivize employers to offer internships and off-campus learning to students. Second, fill-ing in information gaps during the job-search process enables students to make better choic-es between and within different paths. Chile is establishing online platforms where students can access information on the employability of individuals with various degrees, wage profiles, and courses to take for certain occupations. Colombia’s Jóvenes en Acción (Youth in Action) program combines classroom instruction with on-the-job training at private companies. Indo-nesia needs to continue to develop data systems that allow for the identification of occupations and skills that are most in demand, monitor ed-ucational institutions’ compliance with quality standards, and ensure that the information on employability of degrees, wage profiles, and occupation-specific courses is available to both jobseekers and workers.
Promote the use of digital financial services/payments, including among the unbanked and the underbanked.
2
56
BEYO
ND U
NICO
RNS:
HAR
NESS
ING
DIGI
TAL
TECH
NOLO
GIES
FOR
INC
LUSI
ON I
N IN
DONE
SIA

Financial exclusion and low uptake of digital payments impedes the growth of the digital economy and locks out a significant proportion of the population from participating and bene-fiting from it. For many Indonesians, especially those in the lower parts of the distribution, not having a bank account is already a major setback. The variety of efforts underway to improve the supply of digital payments and a broader suite of financial services remain im-portant entry-points. One promising digital solution is the reduction in verification costs that could come from widespread availabili-ty of e-KYC option and a strong and reliable digital ID system. Second, for those already banked, including some of the more sophis-ticated users, trust in online transactions and issues related to data privacy, cyber securi-ty and financial integrity represent another barrier that needs to be overcome. While the Financial Services Authority (Otoritas Jasa Keuangan, OJK) has been trying to strengthen the legal and regulatory framework for DFS, consumers still regard the disclosure of per-sonal ID to service providers as a major risk. In this regard, the passing of the draft Law on Personal Data Protection will be critical for promoting the adoption of DFS in Indone-sia. Third, improving the interoperability of payment systems can stimulate use cases and increase transactions volume. An incidental benefit of this could also be an improvement in the viability of the agent-based model, which is crucial to expanding DFS access, especial-ly among the underserved demographic for whom this model has shown to help overcome knowledge and trust deficits. Finally, invest-ments in financial literacy programs should continue to remain shared responsibilities of the regulator as well as market participants and should cover material on the variety of fi-nancial products and services but also of the risks: financial risks such as online fraud, dig-ital footprint, overborrowing; digital financial risks associated with protection of personal information; and consumer risks and associ-ated redress procedures.
Use tax policy instruments to ensure level playing field. A well-designed system of taxation for the dig-ital economy can help level the tax playing field between conventional and online businesses; within online businesses, between goods and services; and between resident and non-resident businesses. This will reduce the distortive impact taxation may have on the economy, helping to ensure that sales, profits, and investment deci-sions in the digital sector are driven by market dynamics and efficiency improvements, and not by advantages gained through uneven taxation policy or taxpayer avoidance. In the Indonesian context, two incidental benefits are equally rele-vant. First, taxation of the digital economy will bring in a small but growing amount of revenue as digitalization accelerates within the Indonesian economy,68 especially in the context of COVID-19 pandemic. E-commerce in Indonesia, for exam-ple, is projected to have grown by 54 percent during 2020, reaching US$32 billion, at a time when private consumption in the overall economy has suffered, falling by an estimated 2.7 percent overall.69 Second, taxation of the digital economy presents Indonesia with a unique opportunity to boost formalization of businesses, particularly that of MSMEs. Registered businesses will enjoy the benefits of having easier access to credit from the financial system, and of potential future fiscal support from the Government.
Indonesia is taking measures to reform its tax policy and modernize its tax administration to deal with the challenge of intangible trans-actions for VAT. Indonesia’s broad policy po-sition was reflected in Law No. 2/2020, which provided the legal umbrella for imposing VAT on digital goods and services provided by for-eign suppliers. Minister of Finance Regulation No. 48/ PMK.03/2020 (hereafter PMK-48) and DGT Regulation PER-12/PJ/2020 (hereafter PER-12) provided the next levels of policy and implementation details. They applied the ex-isting VAT statutory rate of 10 percent on all
POLI
CIES
TO
LEVE
RAGE
DTS
57
BEYO
ND U
NICO
RNS:
HAR
NESS
ING
DIGI
TAL
TECH
NOLO
GIES
FOR
INC
LUSI
ON I
N IN
DONE
SIA

intangible taxable goods and all taxable services that are provided by foreign suppliers through an electronic system. Both foreign and domestic digital platforms are required to collect the VAT on behalf of foreign suppliers, subject to being appointed as “VAT Collectors” by the DGT. To date, companies that have been asked by the DGT to serve in this capacity include Amazon, Facebook, Google, LinkedIn, McAfee, Netflix, Skype, Spotify, Twitter, and Zoom.70 The qual-ifying criteria for being appointed a VAT Col-lector are based on: (i) annual sales volumes of at least IDR 600 million for digital goods and services in Indonesia (or IDR 50 million in a month); or (ii) online traffic volumes involv-ing at least 12,000 users within Indonesia in 12 months, or 1,000 users in one month. To sup-port compliance with the reforms, the DGT has introduced several administrative measures.71
Likewise, to deal with the challenge of low-val-ue shipments Indonesia has lowered its mini-mum threshold from US$75 to US$3. In so doing, Indonesia has become an early mover in this reform space, following on from Australia, which was the first to slash its GST threshold from AU$1,000 to zero from July 2018.72 The EU has followed suit, with its previous exemp-tion of consignments of less than €22 abolished from January 2021 onwards.73 To allow VAT to be levied, all imports into the EU now must be declared using an electronic customs declara-tion. To ease the implementation burden, the EU has also introduced a simplified customs declaration form for all declarations of goods up to €150.74 In Indonesia, implementing the new rules without overwhelming the customs administration or creating unnecessary burdens on business will be more challenging, requiring effective risk management.75 Experience from Australia and the EU may provide the GoI with some useful lessons.
The effectiveness of these instruments—in gen-erating additional revenue, as well as in leveling the playing field—will depend on its ability to effectively manage compliance with the new requirements. Two measures can help in this
regard. First, the GoI will need to ensure adop-tion and communication of consistent rules, leverage an efficient IT system to administer registration, filing, and payment, and combine digital transaction data with other third-party data and taxpayer data to enhance compliance risk management. Second, Indonesia’s overly generous VAT threshold needs to be reviewed to expand the digital economy tax base. Indo-nesia’s VAT threshold of IDR 4.8 billion stands out in international comparisons of VAT thresh-olds to GDP per capita, a metric commonly used to compare the generosity of VAT thresholds worldwide. Less-developed economies tend to have higher thresholds, in part because of weak-nesses in tax administration and in part because they have larger informal economies.76 However, even when compared against low-income econo-mies, Indonesia’s VAT ratio stands out as being too generous.77 A high threshold means that a vast share of businesses whose annual turnover is below the VAT threshold are excluded from the VAT system, narrowing the base and distorting the tax. This distortion is even greater when the threshold is applied to e-commerce in Indonesia, which is characterized by a large share of small companies.78
Overall, design and implementation of digital economy taxation reform must be geared around the core principles of equity, efficiency, and sim-plicity, so that Indonesia’s economy and society can share in the benefits of digitalization. Over time, as digitalization expands, the demarcation between the digital economy and the economy at large will become increasingly blurred and eventually dissolve. This evolving reality makes it ever more important that the GoI gets tax-ation reform right. This means ensuring that tax policy and administration meet the princi-ples of good taxation. Create an uneven playing field of taxation, for example, by having different tax rates on online and offline businesses, or by enforcing rules on cross-border businesses but not on domestic ones, and Indonesia will end up with a tax system that detracts from the organic, healthy growth of the digital economy. Revenue lost to special incentives that favor the select few
2
58
BEYO
ND U
NICO
RNS:
HAR
NESS
ING
DIGI
TAL
TECH
NOLO
GIES
FOR
INC
LUSI
ON I
N IN
DONE
SIA

will mean less financing for the critical public investments need to enable inclusive growth of digitalization. Ultimately, taxation must not dis-tort business decisions on how to operate, and it should not alter consumer choice on what and where to buy—whether it be from a supermar-ket or a hypermarket, an online marketplace or via an online social media app. Taxes imposed must be fair and equal, and administered with a minimum burden on all.
his can start with a (i) concerted push on a whole-of-economy nation-al digital ID initiative; (ii) a thorough re-imagination of
whole-of-government approach to digital trans-formation driven by an agency empowered to resolve interagency coordination challenges; and (iii) a special recognition and focus on the question of data integration which is an essen-tial bedrock of any effort to digitally modernize government functions and services.
Develop a national digital ID framework.
Indonesia needs to launch a national digital ID initiative, bringing together various government stakeholders, the private sector and civil society to chart out the optimal path for Indonesians to be able to prove their identity over the internet and thus carry out trusted online transactions. The status quo constrains growth of the digital econ-omy and introduces additional costs and risks for service providers interacting with customers over the internet, including identity fraud. Thailand offers a useful example: its National Digital ID ini-tiative was born out of the National Digital Econ-omy Committee chaired by the Prime Minister. Similar digital ID initiatives have been launched out of agencies attached to heads of government, such as SingPass by the Singapore Government Technology Agency (GovTech) and United King-dom’s Verify by the Government Digital Service (GDS). An initiative in Indonesia would ideally be spearheaded by the Kantor Staf Presiden (KSP)
↪ Overall, design and implementation of digital economy taxation reform must be geared around the core principles of equity, efficiency, and simplicity, so that Indonesia’s economy and society can share in the benefits of digitalization
3 USE DIGITAL TECHNOLOGIES TO PROVIDE BETTER SERVICES AND UPGRADE CITIZEN-STATE INTERACTIONS
T
59
BEYO
ND U
NICO
RNS:
HAR
NESS
ING
DIGI
TAL
TECH
NOLO
GIES
FOR
INC
LUSI
ON I
N IN
DONE
SIA

with central roles for the Ministry of Home Af-fairs as the authority responsible for population data (i.e., the legal identity of Indonesians), and the Menkominfo as the authority responsible for regulating electronic transactions, and also in-volving the Ministry of National Development Planning (Bappenas), the Coordinating Ministry for Economic Affairs, Bank Indonesia and OJK.
Improvements to the national ID system will cre-ate a strong base on which to introduce a digital ID system or ecosystem. It contains the popula-tion data on which digital IDs can be issued— by the Government and/or the private sector—with high levels of assurance. This seamless onboard-ing simplifies and significantly reduces the costs of introducing digital IDs in Indonesia. For the national ID system to realize its full potential to support service delivery and underpin a new digital ID system throughout Indonesia, the GoI will need to decide whether to build a central-ized digital ID system implemented exclusive-ly by the GoI (likely Dukcapil), or a federated, multi-stakeholder ecosystem implemented by multiple digital ID providers but still regulated by the Government through a trust framework of laws, rules and standards, with the possibility of limiting public sector transactions to a digital ID issued by Dukcapil.
One area that requires urgent attention is that Indonesia does not yet have a comprehensive data protection law with general applicability. This undermines trust in any kind of collection, processing and sharing of personal data, which are core functions of a digital ID system, as well as the digital economy more broadly. A draft Law on Personal Data Protection was submitted by the President to Parliament at the end of 2019—a bill that was largely modelled on the EU’s General Data Protection Regulation (GDPR). An essen-tial feature for the credibility and strength of such a law would be an independent oversight entity, similar to the Office of the Australian Informa-tion Commissioner and the Singaporean Personal Data Protection Commission. Such a law will help to ensure public trust and confidence in the exist-ing national ID system, as well as any future digital
ID system and the digital economy more broadly, by providing safeguards and accountability for the collection, use and sharing of personal data, as well as formalizing the rights of data subjects.
Reorient from a narrow focus on e-Government to a comprehensive national digital transformation agenda.
The GoI is strongly recommended to consider a fundamental transition from the current nar-row focus on e-government to a comprehensive National Digital Transformation agenda. Given the complexities, this can be implemented in phases. The current e-government initiative that is chaired by the Ministry of Administrative and Bureaucratic Reform (MenPAN-RB) focuses on the digitization of internal government process-es. Looking at the scope in the e-Government regulation, the role fits the main duties and re-sponsibilities of MenPAN-RB, which includes the management of government business processes. However, if the GoI aims to achieve truly com-prehensive digital transformation of the nation, it will need to shift the paradigm towards digital government and rearrange its vision, governance, and delivery model to better suit that aspiration. Such a commitment would reorient Indonesia in the same direction as that taken by digitally advanced countries, such as Singapore, the Unit-ed Kingdom, Australia, Estonia, the Republic of Korea and Canada.79 The digital government platforms would serve as the foundation of digital services in the economy such that both public sec-tor institutions and private enterprises can take advantage of these platforms to deliver services to every citizen.
A short-term priority may be to continue to strengthen the role of MenPAN-RB in orches-trating and delivering the existing e-government mandate. However, in parallel, Indonesia needs to create the regulatory and institutional frame-works necessary to imagine, articulate and imple-
3
Doubling down on reforms related to the analogue foundations of the digital economy is crucial to ensuring that digital technologies do not end up accentuating existing inequalities
60
BEYO
ND U
NICO
RNS:
HAR
NESS
ING
DIGI
TAL
TECH
NOLO
GIES
FOR
INC
LUSI
ON I
N IN
DONE
SIA

ment a comprehensive transformation agenda. To start with, a presidential regulation could be prepared to mandate: (i) the development of a National Digital Transformation strategy; (ii) the establishment of a policy-making entity; and (iii) the establishment of an implementation entity. The policy-making entity—a Digital Transfor-mation Taskforce (DTT)—would ideally be at-tached to the Office of the President, overseeing and, if possible, consolidating and streamlining the governance structure of existing digital ini-tiatives, such as the e-Government agenda led by MenPAN-RB, One Data led by Bappenas, Online Single Submission, and the One-Map Policy led by CMEA. This would reduce the fragmentation that characterizes the governance structure of these initiatives, which has led to ineffective and unnecessarily complex implementation at a high cost to coordination. Finally, the implementation arm of the DTT would be a Digital Transforma-tion Implementation Agency (DTIA), similar to agencies in Singapore (GovTech) and the United Kingdom (GDS). DTIA would be responsible for delivery of cross-sectoral digital services, i.e., platforms and supporting technologies for sec-toral ministries to host and operate their digi-tal services. It would also serve as the ecosystem builder for the delivery of sector-specific digital services, coaching and assisting sectoral minis-tries to develop quality, and standardized digital services for citizens. Both DTT and DTIA need not be newly established entities. Existing enti-ties within the public sector could be empowered to play the role. Irrespective of the model that is chosen, the most crucial part of the reform would be to ensure that the institutional arrangement facilitates a whole-of-government approach and eliminates fragmentation.
Transition towards a whole-of-government data management policy. To this end, Bappenas could strategize to ef-fectively to develop and implement subsidiary regulations and also rally support for the One Data agenda. Specifically, Bappenas could apply
the One-Data policy comprehensively in priori-ty sectors relevant in managing the COVID-19 pandemic and revitalizing the economy (edu-cation, health, MSMEs, and social protection). Appointing a data steward in each sector, assisting the stewards to develop a master data reference for each sector and data standards, and to enforce the standards, and assisting policy makers in these sectors to draw insights from improved data man-agement, which can then be used for expansion to other sectors could be some concrete steps . Building alliances with key institutions such as MenPAN-RB, Menkominfo and MoHA, to in-still One-Data principles into implementation of the Digital Government and Digital ID initia-tives could be other measures. Bappenas could also work closely with MoF during the execution of shared planning and budgetary roles to identify and/or filter out programs and activities that lead to duplication or inefficient production of data.
Finally, doubling down on reforms related to the analogue foundations of the digital economy is crucial to ensuring that digital technologies do not end up accentuating existing inequalities. A key finding of the report is that inequality in access to the digital medium and the ability to benefit from this medium mirrors existing di-mensions of inequality—across groups, regions, income classes and skill levels. This implies that the non-digital structural constraints that have long been realized as key barriers to inclusive development continue to remain important de-terminants of how effectively Indonesia is able to harness the digital dividends for its poor. Invest-ments and reforms directed toward a stronger economic integration of the country, reforms related to trade, competitiveness and the overall business environment, investments to improve the quality of Indonesia’s human capital, reforms to improve the effectiveness of the state will not only enhance Indonesia’s digital dividends but also ensure that these are shared equitably across the population, In that sense, digital technologies should not be seen as tools that can be used to leapfrog and circumvent conventional develop-ment challenges, but rather as complementary tools to effectively address some of them.
POLI
CIES
TO
LEVE
RAGE
DTS
61
BEYO
ND U
NICO
RNS:
HAR
NESS
ING
DIGI
TAL
TECH
NOLO
GIES
FOR
INC
LUSI
ON I
N IN
DONE
SIA

The digital divide does not have to be Indonesia’s destiny.
62
BEYO
ND U
NICO
RNS:
HAR
NESS
ING
DIGI
TAL
TECH
NOLO
GIES
FOR
INC
LUSI
ON I
N IN
DONE
SIA

The digital divide does not have to be Indonesia’s destiny.
POLI
CIES
TO
LEVE
RAGE
DTS
63
BEYO
ND U
NICO
RNS:
HAR
NESS
ING
DIGI
TAL
TECH
NOLO
GIES
FOR
INC
LUSI
ON I
N IN
DONE
SIA

Summary of Policy Recommendations�
Optimize spectrum allocation for mobile broadband
Strengthen competition along the broadband value chain
Strengthen mechanisms to ensure sharing of active and passive infrastructure
→ Implement the “Analogue Switch Off” by the end of 2022 in accordance with the Omnibus Law so as to free up the 700MHz band for greater rural connectivity using 4G and future 5G networks
RESPONSIBLE AGENCIES:
Kominfo
→ Update the Telecom Law, PP 52/53, to allow for sharing of active infrastructure on a B2B basis
RESPONSIBLE AGENCIES:
Kominfo
→ Review current licensing regime and transition toward international best practice of single/unified licensing to allow a larger number of providers to deliver the full portfolio of services
RESPONSIBLE AGENCIES:
Kominfo
→ Optimize the higher frequency capacity bands, starting with the freeing up of the 2.6 GHz band, followed by the 3.4-3.8 GHz band and potentially the broader 3.3-4.2 GHz band to facilitate 5G deployment in urban areas. Consideration should be given to the release of the mmWave spectrum bands for 5G in urban areas
RESPONSIBLE AGENCIES:
Kominfo
→ Implement through regulations the passive infrastructure sharing mandated under the Omnibus Law
RESPONSIBLE AGENCIES:
Kominfo
MoHA
Ministry of Public Works
→ Appoint an independent regulatory body for the telecom sector consistent with exemplar practice and Indonesia’s RCEP commitments
RESPONSIBLE AGENCIES:
Kominfo
1
3
2
Improve Digital Connectivity to Universalize Access
PRIORITY OBJECTIVE
I
64
BEYO
ND U
NICO
RNS:
HAR
NESS
ING
DIGI
TAL
TECH
NOLO
GIES
FOR
INC
LUSI
ON I
N IN
DONE
SIA

Support the development of logistics
Nurture digital skills and skills for the 21st century digital economy
→ Align non-formal education services and lifelong learning with needs of the working-age adult population, adopting a modular approach to course offerings with an emphasis on soft skills in addition to technical digital skills, incorporating employment-specific digital skills relevant for Indonesia, emphasizing a mindset of continuous learning, and offering opportunities to practice “self-managed” learning
RESPONSIBLE AGENCIES:
Ministry of Education and Culture
Ministry of Manpower
→ Ensure that tertiary education offers a minimum threshold of foundational “transferable” higher-order skills such as critical thinking, problem-solving and communication, even in STEM fields
RESPONSIBLE AGENCIES:
Ministry of Education and Culture
→ Incentivize employers to offer internships and off-campus learning to students
RESPONSIBLE AGENCIES:
Ministry of Education and Culture/Ministry of Manpower
→ Continue to develop data systems that allow for identification of occupations and skills in demand, monitor educational institutions’ compliance with quality standards, and ensure that information on employability of individuals with various degrees, wage profiles, and occupation-specific courses is available to jobseekers and workers
RESPONSIBLE AGENCIES:
Ministry of Education and Culture/Ministry of Manpower
→ Build partnerships between tertiary institutions and the private sector to train vocational students in high-tech areas using practice-based curricula, practitioner-led instruction, and professional certification
RESPONSIBLE AGENCIES:
Ministry of Education and Culture/Private Sector
→ Deepen reforms to reduce entry barriers to logistics and transportation services and build long-term investor confidence, to expand warehousing outside of large metropolitan areas
RESPONSIBLE AGENCIES:
Ministry of Transport, with support from Ministries of Trade and Finance and the Coordinating Ministry of Maritime Affairs and Investments
→ Continue to develop basic physical infrastructure to improve connectivity through strengthened and/or rehabilitated infrastructure (roads, ports, and electricity), leveraging private sector capital and expertise as appropriate through PPPs
RESPONSIBLE AGENCIES:
Ministry of Transport
Directorate General of Highways
Ministry of Public Works and Housing
→ Continue to modernize the National Post Service; standardize addresses and postcodes
RESPONSIBLE AGENCIES:
Ministry of Communication and Informatics
1 2
Make the Digital Economy Work for All
PRIORITY OBJECTIVE
II
POLI
CIES
TO
LEVE
RAGE
DTS
65
BEYO
ND U
NICO
RNS:
HAR
NESS
ING
DIGI
TAL
TECH
NOLO
GIES
FOR
INC
LUSI
ON I
N IN
DONE
SIA

Promote supply of DFS/digital payment solutions that cater to the unbanked and the underbanked
Use tax policy instruments to ensure a level playing field
3
4
→ Streamline the licensing and registration processes required to become a provider of digital financial services
RESPONSIBLE AGENCIES:
Bank Indonesia
OJK
→ Standardize rules and procedures to enable interoperability of payment schemes
RESPONSIBLE AGENCIES:
Bank Indonesia
→ Incentivize the private sector to innovate and develop new DFS products that cater to the rural population
RESPONSIBLE AGENCIES:
Bank Indonesia
Directorate General of Taxes
→ Complete the design of measures to reform tax policy and modernize tax administration in relation to DE transactions, ensuring adoption and communication of consistent rules, institution of efficient IT systems to administer registration, filing, payment and use of digital transaction data with other third-party data and taxpayer data for strengthened compliance risk management
RESPONSIBLE AGENCIES:
Ministry of Finance (Directorate General of Taxes, Directorate General of Customs and Excise, and Fiscal Policy Agency)
→ Increase use cases of DFS products in the delivery of government services (including Government-to-person payment) to sustain the commercial viability of DFS agents
RESPONSIBLE AGENCIES:
CMEA (Financial Inclusion Council)
Ministry of Social Affairs
→ Strengthen the legal and regulatory framework for managing risks related to data governance and privacy, cyber security and operational risk, and financial integrity, in order to build consumer trust in DFS products
RESPONSIBLE AGENCIES:
Bank Indonesia
OJK
→ Lower the overly generous VAT threshold to expand the digital economy tax base
RESPONSIBLE AGENCIES:
Ministry of Finance (Directorate General of Taxes, Directorate General of Customs and Excise, and Fiscal Policy Agency)
Make the Digital Economy Work for All
PRIORITY OBJECTIVE
II —CONTD.
66
BEYO
ND U
NICO
RNS:
HAR
NESS
ING
DIGI
TAL
TECH
NOLO
GIES
FOR
INC
LUSI
ON I
N IN
DONE
SIA

Use Digital Technologies to Provide Better Services and Upgrade Citizen-
State Interactions
Develop a national digital ID framework
Reorient from a narrow focus on e-Government to a comprehensive national digital transformation agenda
Implement a whole-of-government data management policy
1
2 3
→ Pass the draft Law on Personal Data Protection
RESPONSIBLE AGENCIES:
Kominfo
MoHA
→ Strengthen the political and bureaucratic influence needed to move the agenda by placing a central government authority like the Office of the President in the driving seat
RESPONSIBLE AGENCIES:
Office of the President
→ Implement the One Data Policy comprehensively, in priority sectors relevant for managing the post pandemic recovery (e.g., education, health, social protection or MSMEs).
RESPONSIBLE AGENCIES:
Bappenas
BPS
and other line agencies
→ Build alliances with key institutions such as MenPAN-RB,Kominfo, and MoHA to instill One Data principles into the implementation of the digital government and digital ID initiatives.
RESPONSIBLE AGENCIES:
Bappenas
BPS
and other line agencies
→ Adopt a whole-of-government approach to digital transformation, coordinated and spearheaded by an agency that has multi-ministry oversight.
RESPONSIBLE AGENCIES:
Office of the President
→ Launch a whole-of-economy national digital ID initiative to define the optimal model for Indonesia, bringing together government, private sector and civil society
RESPONSIBLE AGENCIES:
Office of the President
MoHA
Kominfo
→ Close the coverage gaps in the national population registry database (SIAK), streamline the new registration and update processes, and introduce biometric-based e-KYC processes
RESPONSIBLE AGENCIES:
MoHA
→ Introduce a national digital ID system or federated ecosystem fit-for-purpose for online transactions in the Indonesia context, building on the SIAK
RESPONSIBLE AGENCIES:
Office of the President
MoHA
Kominfo
PRIORITY OBJECTIVE
III
POLI
CIES
TO
LEVE
RAGE
DTS
67
BEYO
ND U
NICO
RNS:
HAR
NESS
ING
DIGI
TAL
TECH
NOLO
GIES
FOR
INC
LUSI
ON I
N IN
DONE
SIA

1 Alibaba Group and World Bank. 2019. E-commerce Development: Experience from China (English). Washington, DC: World Bank Group.
2 Al-Rikabi, Jaffar, Khalil Rohman, and Hambali. 2021. “On the Macroeconomics of the Digital Economy in Indonesia”, Working Paper, World Bank. Forthcoming.
3 Annur, Cindy Mutia. 2020b. “Layanan Telemedicine Diprediksi Tetap Berkibar Usai Pandemi Berakhir.” Katadata. Retrieved from: https://katadata.co.id/ameidyonasution/digital/5f45270a9ad78/layanan-telemedicine-diprediksi-tetap-berkibar-usai-pandemi-berakhir (accessed November 16, 2020).
4 ASEAN and Plum Consulting. 2021. “ASEAN Digital Masterplan 2025”. Retrieved from https://asean.org/storage/ASEAN-Digital-Masterplan-2025.pdf (accessed March 25, 2021).
5 ASEAN. 2021. “Joint Media Statement of the 1st ASEAN Digital Ministers’ Meeting and Related Meetings”. Retrieved from https://asean.org/joint-media-statement-1st-asean-digital-ministers-meeting-related-meetings/ (accessed March 25, 2021).
6 Asosiasi Healthtech Indonesia. 2020. “About.” Asosiasi Healthtech Indonesia, accessed November 16, 2020, https://healthtech.id/about/
7 Australian Taxation Office. 2019. “Who charges GST”. Retrieved from: https://www.ato.gov.au/Business/International-tax-for-business/GST-on-low-value-imported-goods/Who-charges-GST/ (accessed November 16, 2020).
8 Autor, David, Dorn, David, Katz, Lawrence, Patterson, Christina, and Van Reenen, Jon. 2017. “Concentrating on the Fall of the Labor Share.” American Economic Review 107(5): 180–85.
9 Bahia, Kalvin, Pau Castells, Genaro Cruz, Takaaki Masaki, Xavier Pedrós, Tobias Pfutze, Carlos Rodríguez-Castelán and Hernan Winkler. 2020. “Welfare Effects of Mobile Broadband Internet: Evidence from Nigeria” World Bank Policy Research Working Paper #9230. Washington DC: World Bank.
10 Banerjee, Abhijit V. and Esther Duflo. 2019. Good Economics for Hard Times. Allen Lane, United Kingdom.
11 Bhardwaj, Riaz; Yarrow, Noah; Cali, Massimiliano. 2020. “EdTech in Indonesia: Ready for Take-off ?”. World Bank, Washington, DC.
12 Brynjolfsson, Eric, Yu (Jeffrey) Hu, and Michael D. Smith. 2003. “Consumer Surplus in the Digital Economy: Estimating the Value of Increased Product Variety at Online Booksellers”. Management Science, 49(11):1580–1596.
13 Brynjolfsson, Erik, and JooHee Oh. 2012. “The Attention Economy: Measuring the Value of Free Digital Services on the Internet” Thirty Third International Conference on Information Systems, Orlando.
14 Burhan, Fahmi Ahmad. 2020a. “Strategi Anyar Ruangguru hingga Zenius Gaet Pengguna saat Pandemi,” Katadata. Retrieved from: https://katadata.co.id/desysetyowati/digital/5f6de371e728a/strategi-anyar-ruangguru-hingga-zenius-gaet-pengguna-saat-pandemi (accessed November 16, 2020).
15 Council of the European Union. 2017. “VAT on electronic commerce: new rules adopted”, Press Release, Council of the EU. Retrieved from: https://www.consilium.europa.eu/en/press/press-releases/2017/12/05/vat-on-electronic-commerce-new-rules-adopted/ (accessed November 16, 2020).
16 Dolfen, Paul, Liran Einav, Peter J. Klenow, Benjamin Klopack, Jonathan D. Levin, Laurence Levin, and Wayne Best. 2017. “Assessing the Gains from E-Commerce”. Stanford University, mimeo.
17 European Commission. 2021. “New form of customs declaration for low value consignment”. Retrieved from: https://ec.europa.eu/taxation_customs/news/new-form-customs-declaration-low-value-consignments_en (accessed November 16, 2020).
18 Frank, Morgan R., David Autor, James E. Bessen, Erik Brynjolfsson, Manuel Cebrian, David J. Deming, Maryann Feldman et al. 2019. “Toward understanding the impact of artificial intelligence on labor”. Proceedings of the National Academy of Sciences, 116(14):6531-6539.
19 Global Mobile Suppliers Association. 2021. “4G-5G FWA Company Directory-2: Device Ecosystem – March 2021”. Retrieved from https://gsacom.com/paper/4g-5g-fwa-company-directory-2/ (accessed November 16, 2020).
20 Goldfarb, Avi and Catherine Tucker. 2019. “Digital Economics”. Journal of Economic Literature, 57(1):3-43.
21 Google, Temasek and Bain. 2020. “e-Conomy SEA 2020 – At Full Velocity: Resilient and Racing Ahead”.
22 Goolsbee, Austan, and Peter J. Klenow. 2006. “Valuing Consumer Products by the Time Spent Using Them: An Application to the Internet”, American Economic Review 96(2):108-113.
23 Hjort, Jonas, and Jonas Poulsen. 2019. “The Arrival of Fast Internet and Employment in Africa.” American Economic Review 109(3):1032-1079.
24 Hootsuite and We Are Social. 2019. Indonesian Digital Report 2019. Retrieved from https://datareportal.com/reports/digital-2019-indonesia (accessed November 16, 2020).
References
68
BEYO
ND U
NICO
RNS:
HAR
NESS
ING
DIGI
TAL
TECH
NOLO
GIES
FOR
INC
LUSI
ON I
N IN
DONE
SIA
REFE
RENC
ES &
END
NOTE
S

25 International Telecommunication Union. 2019. “Digital Infrastructure Policy and Regulation in the Asia-Pacific Region”. Retrieved from https://www.itu.int/en/ITU-D/Regional-Presence/AsiaPacific/SiteAssets/Pages/Events/2019/RRITP2019/ASP/ITU_2019_Digital_Infrastructure_5Sep2019FNL.pdf
26 Kop, Rita. 2020. “The challenges to connectivist learning on open online networks: Learning experiences during a massive open online course.” The International Review of Research in Open and Distributed Learning 12:19–38.
27 Minges, Michael. 2016. “Exploring the relationship between broadband and economic growth” World Development Report background papers. Washington DC: World Bank.
28 Pazarbasioglu, Ceyla, Alfonso Garcia Mora, Mahesh Uttamchandani, Harish Natarajan, Erik Feyen, and Matthew Saal. 2020. Digital Financial Services. World Bank, Washington, DC.
29 Reuters. 2020. “Indonesia adds Twitter, Zoom to tech companies that must pay 10% VAT”. Reuters. Retrieved from: https://www.reuters.com/article/us-indonesia-tax-digital-idUSKBN25Z2CU (accessed March 25, 2021).
30 Tiwari, Sailesh, Virgi Sari, Imam Setiawan and Juul Pinxten. 2020. “Pandemic, Poverty and Policy: Ex Ante Poverty and Distributional Impact of the COVID-19 Pandemic” World Bank Policy Research Working Paper, forthcoming.
31 Tracxn. 2019. “EdTech Startups in Indonesia”. Retrieved from: https://tracxn.com/explore/EdTech-Startups-in-Indonesia (accessed March 12, 2021)
32 Wayan Purnomo. 2020. “Example of data fragmentation problems in Indonesia,” Tempo. Retrieved from: https://majalah.tempo.co/read/nasional/160237/mengapa-data-korban-covid-19-pemerintah-pusat-dan-daerah-berbeda (Accessed November 16, 2020).
33 Weil, David. 2014. The Fissured Workplace. Why Work Became So Bad for So Many and What Can Be Done to Improve It. Harvard University Press, Cambridge, Massachusetts, London, England.
34 White, Olivia, Anu Madgavkar, James Manyika, Deepa Mahajan, Jacques Bughin, Mike McCarthy, and Owen Sperling. 2020. “Digital identification: A key to inclusive growth.” McKinsey Global Institute. Retrieved from: https://www.mckinsey.com/business-functions/mckinsey-digital/our-insights/digital-identification-a-key-to-inclusive-growth
35 World Bank. 2018. March 2018 Indonesia Economic Quarterly: Towards inclusive growth. Retrieved from: https://www.worldbank.org/en/country/indonesia/publication/indonesia-economic-quarterly-march-2018 (accessed November 16, 2020).
36 World Bank. 2019. World Development Report 2019. Washington DC: World Bank Group. Retrieved from: https://www.worldbank.org/en/publication/wdr2019 (accessed March 25, 2021).
37 World Bank. 2020a. Indonesia Economic Prospects: The Long Road to Recovery. Jakarta: World Bank.
38 World Bank. 2020a. “How Covid-19 is affecting firms in Indonesia: Results from the 1st round of the Covid-19 Business Pulse Survey.” Policy Brief. World Bank.
39 World Bank. 2020c. Indonesia Systematic Country Diagnostic: Eliminating Poverty, Bringing Economic Security to All. World Bank Washington, DC.
40 World Bank. 2020b. “Impacts on Digital Merchants: Insights from the Bukalapak-World Bank Survey.” Policy Brief. World Bank.
41 World Bank. 2021a. Macro Poverty Outlook. Washington DC: World Bank Group. Retrieved from: https://www.worldbank.org/en/publication/macro-poverty-outlook (accessed March 25, 2021).
69
BEYO
ND U
NICO
RNS:
HAR
NESS
ING
DIGI
TAL
TECH
NOLO
GIES
FOR
INC
LUSI
ON I
N IN
DONE
SIA
REFE
RENC
ES &
END
NOTE
S

1 World Bank (2019)
2 Google, Temasek and Bain (2020). The same report also shows that two segments that have been affected negatively are online travel and transport, and ride-hailing services.
3 Indonesia’s internet economy measured by this metric grew five-fold between 2015 and 2019—a pace unmatched by any other country in the region. The estimated size of this economy, at US$44 billion in 2020, is roughly four times as large as Malaysia and five times as large as the Philippines and Singapore.
4 World Bank (2020a).
5 Tiwari et al. (2020).
6 World Bank (2020b).
7 Goldfarb and Tucker (2019).
8 Minges (2016).
9 There are various other statistics on the overall level of connectivity in Indonesia. Most estimates from the industry tend to rely on mobile and fixed-line subscription data coming from GSMA and ITU. Although there is some effort made to identify multiple connections, multiple SIM cards, etc., arriving at this statistic from subscription data alone appears quite challenging. For example, the January 2020 edition of Hootsuite reports internet penetration at 64 percent of the population. The data used here and throughout the report are based on what is perhaps the most comprehensive socioeconomic survey Indonesia conducts on an annual basis, interviewing around 300,000 households across the country for each round.
10 This is a decision open to the MNOs, as all IMT spectrum is now technology neutral. Indonesia’s neighbors Malaysia and Singapore will use the 700 MHz band for 5G services.
11 Refer to www.gsma.com/spectrum/resources/legacy-mobile-network-rationalisation/
12 Refer to https://vietnamnet.vn/en/sci-tech-environment/no-new-2g-3g-phones-in-vietnam-from-july-1-708163.html and https://mic.gov.vn/Upload_Moi/VanBan/43TT.PDF (in Vietnamese).
13 Hootsuite We Are Social (2019).
14 Google, Temasek and Bain (2020) “e-Conomy SEA 2020”.
15 Goolsbee and Klenow (2006) and Brynjolfsson and Oh (2012).
16 The methodology essentially entails using the time value of leisure to estimate the opportunity cost and value of internet use. We use data from Indonesia’s labor force survey to estimate the earnings function and the time spent on the internet from the Digital Economy Household Survey conducted for this report.
17 Ride hailing suffered in the early days of the pandemic, but as social distancing also intensified e-commerce and food delivery services, some of the “ride-partners” in these platforms adapted by switching to delivery.
18 Google, Temasek and Bain (2020).
19 See Brynjolfsson et al. (2003) and Dolfen et al. (2017), for example.
20 Hjort and Poulsen (2018); Bahia et al. (2020).
21 Income-earners include wage employees, casual workers and self-employers whose income data are available. Income data are not available for employers with workers and unpaid workers.
22 Note that this is just the average increase for all workers for that type. The actual increase based on other worker characteristics, such as the industry, occupation, and whether the worker herself also uses the internet at work, could be much higher.
23 World Bank (2020a). The first round of the World Bank COVID-19 Business Pulse Survey (COV-BPS) was conducted in June 15 to 23 with phone interviews on a nationally representative sample of 850 formal sector firms.
24 World Bank (2020b). This is based on data from the first round of the World Bank-Bukalapak Digital Merchants Survey conducted between May 20 and June 27, 2020, with a total sample of 1,020 respondents.
25 Google, Temasek and Bain (2020).
26 The 2018 number is based on the national labor force survey of that year, while the 2020 number is based on the Digital Economy Household Survey, a special purpose survey conducted specifically for this report during February and March 2020.
27 SAKERNAS (2019).
28 Around 12.2 million workers alone were engaged in e-commerce activities as their primary job (SAKERNAS 2019). However, Indonesia’s National Social-Economic Survey 2019 (SUSENAS 2019) shows only 5.9 million online sellers (SUSENAS, March 2019).
29 Alibaba Group and World Bank (2019).
Endnotes
70
BEYO
ND U
NICO
RNS:
HAR
NESS
ING
DIGI
TAL
TECH
NOLO
GIES
FOR
INC
LUSI
ON I
N IN
DONE
SIA
REFE
RENC
ES &
END
NOTE
S

30 SAKERNAS (2019).
31 World Bank (2020c).
32 LSPs include transportation companies (shipping lines, ferry lines, airlines, trucking companies), as well as third-party logistics companies that coordinate multiple transportation modes, together with warehousing and other value-added activities such as packaging and sorting.
33 There are other measures of financial inclusion, including in Indonesia. These numbers from the World Bank Digital Economy Household Survey appear to align well with these numbers. For example, the Global Findex Database, 2017 found that 49 percent of Indonesian adults had transaction accounts. Similarly, the Financial Inclusion Insight (FII) Survey in 2018 found that 56 percent adults were owners of a bank account. Likewise, the Global Findex Database also showed that 3 percent of Indonesian adults owned mobile money accounts and there were at least 7 percent of adults who used some form of mobile banking. The numbers from the DEHS—which are based on households—appear to be in a reasonable ballpark of these numbers and, as such, provides a useful updated triangulation on the picture of financial access in Indonesia.
34 Pazarbasioglu et al. (2020).
35 Under this new regulation, foreign-produced textiles, clothes, bags, and shoes that cost a minimum of US$3 will be subject to a range of taxes and import duties with a total rate of 32.5 to 50 percent of their value. For other products worth at least US$3, the taxes and import duties will be lowered from 27.5 to 37.5 percent of their value to 17.5 percent. Goods worth below US$3 will be exempted from import duties but still be subject to some other taxes, such as value-added tax.
36 Australia was the first to slash its GST threshold from AUD1,000 to zero from July 2018. The EU is set to follow suit, with its current exemption of consignments of less than euro 22 to be abolished from 2021 onwards. Indonesia is among the early movers in this space. But implementing these new rules without overwhelming the customs administration or creating unnecessary burdens on business will also be challenging and require effective risk management.
37 Existing roadmaps on e-commerce recognize the need to promote local products, catered both to the domestic as well as overseas market. However, currently these efforts are limited to co-branded promotion campaigns by the Government in partnerships with e-marketplaces to encourage Indonesians to buy local.
38 For example, data from the Digital Economy Household Survey show that 77 percent of app-based food deliveries in Indonesia are found to be substituting physical restaurant experiences. This was a survey that was done before the onset of the pandemic in March 2020.
39 Indonesia’s VAT threshold of IDR 4.8 billion stands out in international comparisons of VAT thresholds to GDP per capita, a metric commonly used to compare the generosity of VAT thresholds worldwide. Less-developed economies tend to have higher thresholds, in part because of weaknesses in tax administration and in part because they have larger informal economies. However, even when compared against low-income economies, Indonesia’s VAT ratio stands out as being too generous. A high threshold means that a vast share of businesses whose annual turnover is below the VAT threshold are excluded from the VAT system, narrowing the base and distorting the tax.
40 Frank et al. (2019), Banerjee and Duflo (2019).
41 Autor et al. (2017). See also Weil (2018), p.9: “Where lead companies once shared gains with their internal workforce, fissuring leads to growing inequality in how the value created in the economy is distributed.” And Banerjee and Duflo (2019) p.242: “The increase in concentration (among superstar firms) thus helps explains a part of why wages are not keeping pace with GDP. The rise of superstar firms also offers an explanation for why overall wage inequality has been rising…”
42 The human capital gap is magnified by restrictive government policy in hiring foreign workers, limiting the ability of employers to fill the skills gap with global talent in areas where local skills are in short supply. The recently promulgated Law on Job Creation (the “Omnibus Law”) includes a provision to relax this.
43 Tempo (2020).
44 Between April and May 2020, almost 80 percent of Posyandu (integrated maternal and child health and nutrition posts at the village level) were closed. Community-based outreach activities also reported significant disruptions with more than XXX percent ceasing operation. It is also reported that 86 percent of child growth monitoring activities, 55 percent of immunization services, 46 percent of Vitamin A distribution and ante-natal services were suspended or ceased due to these health posts closing down.
45 Bhardwaj, Yarrow, and Cali (2020).
46 Asosiasi Healthtech Indonesia (2020)
47 The most updated data on health-tech funding was prepared in September 2019 by Tracxn. (https://tracxn.com/explore/HealthTech-Startups-in-Indonesia). Since then, there has not been any major announcement of health-tech funding, except for Alodokter’s follow-on funding by MDI Ventures in November ’20 (https://theinsiderstories.com/indonesias-alodokter-raises-series-c-funding-from-mdi-ventures/) . In October 2019, Grab and Ping An announced a joint venture to launch Grab Health / Good Doctors Indonesia, but the value of the investment to Indonesia was never disclosed.
71
BEYO
ND U
NICO
RNS:
HAR
NESS
ING
DIGI
TAL
TECH
NOLO
GIES
FOR
INC
LUSI
ON I
N IN
DONE
SIA
REFE
RENC
ES &
END
NOTE
S

48 Katadata (2020a).
49 Katadata (2020b).
50 World Bank conducted mobile phone based high frequency survey of households to track the evolving impact of the COVID-19 pandemic.
51 Education experts and practitioners argue that online learning cannot replace offline face-to-face learning. To avail of it one requires sufficient means and technology, which can be exclusive in some countries, and there are psychological and social factors that prevent online interactions from being as effective as offline (Dhawan 2020).
52 The experience of massive-open-online-courses (MOOCs) provides one illustrative example. Once regarded as one of the groundbreaking educational innovations of the past decade, they have had very limited success. Completion rates have remained below 5 percent for many years now, with lack of coordination and direction considered to be among the main contributing factors (Kop, 2020).
53 Indeed, the Government has been experimenting with several of these efforts in both education and health. Portal Rumah Belajar is an online learning platform equipped with complete multimedia education content managed by MoEC. Universitas Terbuka, a state university focused on distance learning also offers extensive open education resources. Similarly, in health, Sehatpedia is a Government tele-consultation platform.
54 McKinsey (2020).
55 Aadhar, India’s digital ID system, contributed to significantly expanding financial inclusion (from 35 percent in 2011 to 80 percent in 2017), by making it cheaper and easier for people to satisfy know-your-customer (KYC) requirements for bank account opening.
56 Although the law does not significantly affect One Data, it will provide guidance to data stewards in particular when managing personal information. Bappenas as the coordinator of One-Data implementation is expected to monitor closely the development and incorporate elements of the Personal Data Protection Law in the One-Data technical implementation guidance.
57 Although there is no specific mention of One Data in the Omnibus Law, there are several provisions regarding data that are relevant. For example, the decision on wages for MSMEs is mandated to be based on consumption aggregates calculated by BPS. This means that data published by one GoI agency, BPS, will be used to set wages. Lack of clarity on due process and transparency in data production may weaken the legitimacy of official statistics and leave them vulnerable to being politicized.
58 For example, institutions such as the Directorate General of Civil Registry of MoHA and the Directorate General of Tax of MoF traditionally control and establish relatively more mature data management for civil registry and taxpayer datasets.
59 ITU (2019).
60 Global Mobile Suppliers Association (2021).
61 ASEAN and Plum Consulting (2021).
62 ASEAN (2021).
63 World Bank (2019).
64 World Economic Forum (2020).
65 World Bank (2019)
66 Ibid
67 Ibid
68 The indirect revenue gains are potentially much greater, as data from the digital economy can be combined with other third-party data and used by the revenue authority, the Directorate General of Taxes (DGT), to boost compliance and raise higher revenues across Indonesia’s main taxes, i.e., value-added tax (VAT), corporate income tax (CIT) and personal income tax (PIT).
69 World Bank (2021a).
70 For some of the companies covered, see: “Indonesia adds Twitter, Zoom to tech companies that must pay 10% VAT”, Reuters (September 8, 2020), accessed online at: https://www.reuters.com/article/us-indonesia-tax-digital-idUSKBN25Z2CU
72
BEYO
ND U
NICO
RNS:
HAR
NESS
ING
DIGI
TAL
TECH
NOLO
GIES
FOR
INC
LUSI
ON I
N IN
DONE
SIA
REFE
RENC
ES &
END
NOTE
S

71 The newly appointed VAT Collectors are provided with a VAT Collector ID and a tax registration letter. These VAT Collector are required to create VAT collection slips providing information on VAT collection and payment, which can take the form of a commercial invoice, billing, or order receipt to ease the burden of complying. VAT payment is made electronically using a billing code that is provided by the DGT, and can be made using IDR, USD dollar, or all other foreign currencies accepted by the DGT system. VAT Collectors are required to file quarterly reports, with at minimum data on: (i) number of users in Indonesia; (ii) amount of payments (excluding the VAT); (iii) amount of VAT collected; and (iv) amount of VAT settled to the government. The DGT is permitted to request further detailed filings on an annual basis with transaction-level data.
72 Australian Taxation Office (2019).
73 Council of the European Union (2017).
74 European Commission (2021).
75 The large number of ‘informal’ MSMEs, not registered with government entities, and/or entrepreneurial households increasingly active on e-commerce represent significant challenges in the Indonesia context. Data from digital platforms can be a very powerful enabler of enhanced risk management when combined with customs data. Indonesia’s Directorate General of Customs is looking to do this, with an ongoing pilot involving several digital platforms focused on using e-commerce transactions data to tackle compliance risks including under-invoicing and missed declarations.
76 Revenue authorities with limited capacity to handle large numbers of monthly VAT filings (e.g., because they remain reliant on manual filing, and/or have limited ICT capacities to manage VAT e-filing nationwide) may set a higher VAT threshold so that fewer companies would need to register and file. An informal economy may be defined as one with characterized by firms that are not registered, and/or whose employees work without a formal contract. Informal companies have been traditionally hard to tax, since they are often ‘hidden’ from government reach.
77 “Box B.1: Why is Indonesia’s tax-to-GDP ratio so low?” in The Indonesia Economic Quarterly: Towards Inclusive Growth” (March 2018), pp. 50.
78 Al-Rikabi, Khalil Rohman, and Hambali, “On the Macroeconomics of the Digital Economy in Indonesia”, Working Paper, World Bank (forthcoming, 2021).
79 The group of leading digital nationals: https://leadingdigitalgovs.org/
73
BEYO
ND U
NICO
RNS:
HAR
NESS
ING
DIGI
TAL
TECH
NOLO
GIES
FOR
INC
LUSI
ON I
N IN
DONE
SIA
REFE
RENC
ES &
END
NOTE
S

Chapter ⬎
174
BEYO
ND U
NICO
RNS:
HAR
NESS
ING
DIGI
TAL
TECH
NOLO
GIES
FOR
INC
LUSI
ON I
N IN
DONE
SIA
CHAP
TER
— 01

Digital Technologies for Inclusion→The Promise and the Current Landscape
75
BEYO
ND U
NICO
RNS:
HAR
NESS
ING
DIGI
TAL
TECH
NOLO
GIES
FOR
INC
LUSI
ON I
N IN
DONE
SIA
CHAP
TER
— 01

imilar to many other coun-tries around the world, the COVID-19 pandemic has hit Indonesia hard. The global slowdown in eco-nomic activity combined with domestic measures to contain the spread of the virus dragged down the economy, which is estimat-
ed to have shrunk by around 2.2 percent in 2020. Latest estimates suggest that an estimated 5.1 million people—equivalent to 2.4 percent of the working age population—lost their jobs, while an additional 24 million have had to work reduced hours due to the pandemic. As many as 50 percent of workers experienced a reduction in earnings. The impact on living standards has been devastating, with more than 2.2 million Indonesians estimated to have been pushed into COVID-19-induced poverty in 2020.
One unexpected silver lining of the crisis, however, has been the turbo-charged adoption of digital technologies. Businesses small and large have flocked to digital technolo-gies to ensure the continuity of their operations. Adoption of e-commerce has soared, with online purchases proving a viable way of securing uninterrupted access to essential consumer goods, including basic groceries. School closures have forced students and teachers to adapt and explore digitally enabled remote learning options, including by adopting a variety of EdTech solutions. HealthTech apps enabling remote consultations and the delivery of medi-cine have seen unprecedented growth in adoption rates. Confined at home due to mobility restrictions, people have switched to the internet for their entertainment and social needs, driving sharp growth in the usage of digital media (music and video streaming) and communications appli-cations. A recent industry estimate shows that 37 percent of all digital service consumers in Indonesia in 2020 were new COVID-19-induced users and more than half (56 percent) were from conventionally weaker markets such as non-metro areas.1
This digital pivot is expected to be permanent and, as such, promises to provide a major boost to what is already
the largest and the fastest growing digital economy in the sub-region. The behavioral change that has accompanied this accelerated adoption of digital technologies can be expected to be permanent. Estimates from industry in-dicate that 93 percent of new adoptees expect to stick by at least one of the new digital services post-COVID-19. If true, this would imply a major boost to Indonesia’s in-ternet economy which, at an estimated US$44 billion in gross merchandise value, is not only the largest in South East Asia, but also the fastest growing.2
At the same time, the pandemic has also put a spotlight on Indonesia’s inequalities. One enduring challenge of Indonesia’s development experience over the past two decades has been making growth more inclusive. While remarkable progress has been made on poverty reduction, persistent welfare disparities remain across regions, and growth in living standards experienced by those in the bottom 40 percent of the income distribution has per-sistently lagged average growth.3 By disproportionately hitting the poor and the vulnerable harder, the pandemic threatens to widen these inequalities. On the one hand, susceptibility to infection and burden of disease for the poor and vulnerable in directly affected urban areas have been more intense than among the non-poor, due to risk factors such as poorer diets, lower access to quality health services, higher prevalence of smoking, poorer hygiene and sanitation practices, and inability to afford inputs to preventive behaviors (e.g., masks, hand sanitizers, etc.). On the other hand, sectors and forms of work that have been most affected are also the ones in which the poorer and less skilled segments of the population are more likely to be in. As a result, while the pandemic has been affected everyone, income and welfare losses at the bottom parts of the income distribution have been the highest.4
Differential access to and adoption of digital technologies could compound these inequalities. Digital solutions to achieve resilience during this crisis have not been available to all. For example, in comparison to 88 percent of gov-ernment jobs and 40 percent of jobs in manufacturing, less than 10 percent of jobs in hotels and restaurants, con-struction, wholesale or agriculture were found amenable to be done remotely. Similarly, just 11 to 12 percent of
1.1. Introduction
S
76
BEYO
ND U
NICO
RNS:
HAR
NESS
ING
DIGI
TAL
TECH
NOLO
GIES
FOR
INC
LUSI
ON I
N IN
DONE
SIA
CHAP
TER
— 01

casual and own-account work could be done performed from home (compared with 42 percent of wage work). While 84 percent of high-skilled work could be done from home, 85 percent of work done by low-skilled workers required physical presence in their place of work.5
Similarly, as school closures pushed students toward re-mote learning, around 60 percent of students were found to be unable to participate in online classes due to lack of reliable internet and limited ownership of internet-en-abled devices. A remedial measure was introduced in the form of an IDR 7.2 trillion data package for students and teachers.6 But, given how costly mobile broadband data is for high bandwidth applications such as video streaming, this is likely to be a stop-gap solution to the real problem: only 10 percent of Indonesian public schools are con-nected to fixed broadband internet and about half of the population is still not connected to any kind of internet.
The pandemic has also laid bare the Government’s own lack of readiness, especially with digitized, integrated, and interoperable data systems in achieving resilience. With quarantines and the scale-down or shutdown of many gov-ernment and commercial operations, countries had to try to rapidly shift services to digital channels to keep them go-ing. Countries that had invested, for instance, in and built strong digital ID systems before the pandemic were by and large better able to do this than those countries that had not. Estonia, Singapore, the United Kingdom and other digitally advanced countries were able to reduce disruption for their public service delivery. But the difference was par-ticularly telling in terms of whether countries were able to deploy quick, accurate and effective social protection mea-sures to mitigate the shocks and to safeguard livelihoods, including to reach populations such as informal workers who were difficult to target because they were not present in either databases of people living in poverty or databases of people contributing to social security.
Thailand, for example, built a website to allow informal workers to apply for emergency payments online, using its national ID system to verify the identity of applicants, es-tablish their uniqueness and determine their eligibility by cross-checking government databases. Since national IDs
were already linked to bank and mobile money accounts, there was added assurance that the cash transfers would reach their intended beneficiaries. In a few weeks, more than 28 million citizens applied with 15 million deemed to be eligible. Payments began for some within days of applying. In Chile and Peru, social registries were used to expand existing social assistance programs and citizens could use their digital ID to access a portal that allowed them to check if they were included. In contrast, even though Indonesia introduced significant fiscal measures, there were critical delays getting a couple of similar pro-grams off the ground on account of challenges related to updating of databases, and verification of identities.
Looking ahead, one key question that policy makers in Indonesia are facing is how to ride the momentum of digital adoption generated by the pandemic, not only to power the recovery in the short term but also to bring about greater inclusion and resilience in the economy in the medium term. The crisis is clearly far from over, but some signs of economic recovery are beginning to appear on the horizon. As the economy rebounds and adjusts gradually to the new post-pandemic equilibrium, questions about ways in which Indonesia could leverage digital technologies to better prepare for similar shocks in the future and address some of its long-term development challenges have become highly pertinent.
This report conducts an in-depth diagnostic of digital technologies, and the scale and extent of their current applications in Indonesia. Fully exploiting Indonesia’s rich data landscape, new survey data collected specifically for this report, as well as data shared with the World Bank in confidence by some of the major digital platforms in the country, this report: (i) investigates the key challenges that Indonesia faces in maximizing its digital dividends in an inclusive manner; and (ii) identifies some action-able entry points for investments and policies. The rest of this introductory chapter: (i) describes the mechanisms through which digital technologies can boost inclusion and focuses on three main pathways along which the re-port is organized; and (ii) presents some stylized facts on the current state of digital technology applications in Indonesia to set the stage for the report.
77
BEYO
ND U
NICO
RNS:
HAR
NESS
ING
DIGI
TAL
TECH
NOLO
GIES
FOR
INC
LUSI
ON I
N IN
DONE
SIA
CHAP
TER
— 01

To delineate the outer boundary of the topics that this report covers, it is important to first define what we mean by the terms “digital economy” and “digital technologies”. Digital economy, an economy powered by digital technol-ogies, is often defined either too narrowly or too broadly. Narrow definitions tend to equate the digital economy to the “technology sector” or the “ICT sector”, missing entirely the broader applications of these technologies in other traditional sectors. One estimate, for example, shows that while the ICT sector value-added in GDP is around 7 percent up to 75 percent of the economic impact of the internet—the key enabler of the technology sec-tor—comes through conventional firms harnessing this technology to improve productivity.7 On the other hand, loose definitions tend to equate the digital economy with fast-growing technology companies, such as Facebook, Google or Amazon, and in the context of Indonesia, uni-corns such as Go-Jek, Grab and Tokopedia.
This report adopts the definition of digital technologies as technologies that enable the “representation of infor-mation in bits and significantly reduce the cost of storage, computation and transmission of data”.8 All applications of this technology that mediate how individuals interact with marketplaces, interact with the Government and in-teract with themselves are relevant. This definition encap-sulates broader applications of the internet and the ICT sector, such as social media and e-commerce, and includes the adoption of these technologies by the Government to strengthen accountability and service delivery. Given our focus on the low level of digitization in industrial activ-ities, especially manufacturing, higher-end applications of digital technologies, such as automation, robotics, IoT etc., that are drivers of IR4.0 are not topics of central focus for the report.9 Clearly, enabling Indonesian firms to innovate and adopt these technologies is extremely im-portant for the country to become more productive and grow at a higher speed. These technologies can also have profound impact on inequality in the future by, among others, fundamentally altering the labor market land-scape. However, in this report we focus to a greater extent on lower-skilled biased applications of these technologies as they are currently being experienced by a significantly larger segment of the population.
What promise do digital technologies hold? Most of the benefits of these technologies come in the form of a re-duction in five key economic costs: search, replication,
transportation, tracking and verification.10 Lower costs of finding and comparing information can help reduce price dispersion, improve matching in financial, labor and retail markets and help deepen these markets. The non-rival nature of information (one person’s consumption does not lower the amount available for by consumption of another) encoded digitally lowers the replication cost; once the upfront cost of developing an application has been incurred and the product tested, it is costless to rep-licate it as many times as needed. Digital technologies also render moot place-based constraints on economic activities. Near costless transmission of information and digital services help unlock opportunities for buyers and sellers anywhere in the country, leading to both the deep-ening, as well as stronger integration, of markets. Lower tracking costs, or costs of connecting individuals with information about them facilitates the design and delivery of services better customized to personal needs (e.g., G2P payments, credit provided based on information on con-sumer behavior). Finally, by lowering verification costs, digital technologies can enable individuals and firms to build up reputation and trust and participate in markets assured of reasonable contestability.
Evidence, primarily from high-income countries, suggests that the efficiency gains brought about by the adoption of these technologies can boost aggregate productivity and growth.11 What is of interest for this report, however, is how these aggregate benefits accrue to people at different parts of the income distribution, to workers who might be traditionally excluded, especially women and youth, workers at the lower end of the distribution of skills, and to citizens in different parts of the country. The main channels through which these benefits could accrue to people would be through: (i) enhanced labor income, depending on how digital technologies alter the labor market landscape ex-panding the economic opportunities in the form of more and better paying jobs; (ii) capital income, for micro-scale entrepreneurs who may be able to capitalize on opportu-nities to innovate and grow; (iii) consumer surplus that could be realized through lower prices, greater variety of consumer goods, etc.; and (iv) stronger delivery of public services, such as education, health and social protection programs, which could be enhanced by greater account-ability, as well as improved government effectiveness in generating tax and non-tax revenues to fund these pro-grams, better identification of targeted beneficiaries and a wholesale digital transformation of government.
1.2. The Promise and an Organizing Framework
78
BEYO
ND U
NICO
RNS:
HAR
NESS
ING
DIGI
TAL
TECH
NOLO
GIES
FOR
INC
LUSI
ON I
N IN
DONE
SIA
CHAP
TER
— 01

The report is fundamentally about how digital technologies touch, shape and influence the economic and social lives of the people. As such, the diagnostic, as well as policy, thrust of the report is organized around three main dimensions along which the risks of ‘digital exclusion’ are the most pro-nounced: (i) access to the medium (digital technologies); (ii) ability to harness the medium in a private capacity to enhance incomes; and (iii) ability to benefit from public sector adoption of the medium to provide services more effectively and efficiently (Figure 1.1).
Digital technologies pose significant downside risks as well. Most applications of these technologies are often propelled by strong network effects (or demand-side economies of
scale); the larger the number of users, the greater the value of the product for the users. This positive feedback loop generates advantages for the first mover, according signifi-cant market power to the incumbent and making it difficult even for more productive newcomers to enter the market. As the market begins to mature, this concentration of some firms within an industry can slow down innovation, hurt consumers and lead to the redistribution of rents to the platforms themselves. Second, without strong laws on per-sonal data and consumer protection, lowering of tracking and verification costs could lead to price discrimination, fraud, and violation of privacy. A discussion of these risks and the measures that need to be taken to address these appropriately is included throughout the report.
79
BEYO
ND U
NICO
RNS:
HAR
NESS
ING
DIGI
TAL
TECH
NOLO
GIES
FOR
INC
LUSI
ON I
N IN
DONE
SIA
CHAP
TER
— 01
Expand access to the medium1
2
3
Enhance citizen capabilities to harness the medium to boost incomes
Accelerate government adoption of the medium to enhance services
FIGURE 1.1
Harnessing digital technologies for greater inclusion – three pathways

To set the stage for the report, we start out first by de-scribing the current state of play on the adoption of digital technologies in Indonesia. How are these technologies currently touching the lives of the people in Indonesia? Who is connected and who is not? How are these technol-ogies shaping economic opportunities for those who have been able to plug in? What benefits are accruing to the broader society? This section provides a few key stylized facts on what we know about digital technologies, the level of adoption of these technologies and their imprint on Indonesian economy and society.
→ Indonesia has made rapid progress in internet connectivity over the past decade, but half of the adult population is still without accessOver the past decade, Indonesia has sustained steady growth in internet connectivity driven primarily by the rapid investment in network infrastructure by the private sector. The share of the adult population connected to the internet increased almost four-fold from 13 percent of the adult population in 2011 to 51 percent in 2019.12 This im-pressive growth notwithstanding, 49 percent of Indone-sian adults are still not connected to the internet. and a significant digital divide persists across various spatial, eco-nomic and social dimensions. First, the urban-rural divide in connectivity is large and appears to have been increasing over the years. In 2019, 62 percent of Indonesian adults in urban areas were connected compared with just 36 percent in rural areas. The urban and rural internet connectivity was 20 and 6 percent, respectively, in 2011 (Figure 1.2).
The Government of Indonesia has made major efforts to close the digital divide, most notably with the implemen-tation of the Palapa Ring project, which aimed to extend the fiber-optic backbone infrastructure of the country to the outer islands in eastern Indonesia. With the comple-tion of the Palapa Ring project in 2019, all of Indonesia’s 514 kota/kabupaten (cities/districts) are now connected to the national backbone. This has led to a notable increase in the proportion of adults connected to the internet in all major island-regions of the country. But there are still sizeable gaps across regions. For example, only about one-third of the adult population in Papua is connected com-pared with around 55 percent in Java-Bali (Figure 1.3). At
1.3. Digital Technology Landscape–What Is the State of Play?
FIGURE 1.2
Access to the internet has been increasing over the past decade
PROPORTION OF INDIVIDUALS 15+ WITH ACCESS TO THE INTERNET
LEGEND
Urban National Rural
Source: World Bank staff calculations based on various years of SUSENAS.Note: Connection to the internet is defined based on whether adults reported having access to the internet in the past three months (including accessing social media apps such as Facebook, YouTube, Instagram, Twitter, and WhatsApp).
the same time, the fact that almost half of the population, even in regions with relatively better infrastructure, re-mains without internet points to major challenges in the middle and last mile connectivity segments.
Income gaps in access are similarly large. Adults in families in the top decile of the income distribution are more than five times more likely to be connected to the internet than adults in the poorest decile, only 14 percent of whom are connected (Figure 1.4). This sharp income gradient points to a possible affordability constraint in accessing the inter-net. Likewise, there is also a sharp generational, education and gender divide in access to the internet. Younger adults are significantly more likely to be connected, as are adults who are more educated. Men are 8 percentage points more likely to be connected than women, suggesting possible in-equality in device ownership within households (Figure 1.5).
80
BEYO
ND U
NICO
RNS:
HAR
NESS
ING
DIGI
TAL
TECH
NOLO
GIES
FOR
INC
LUSI
ON I
N IN
DONE
SIA
CHAP
TER
— 01

FIGURE 1.3
Some parts of the country are still lagging
PROPORTION OF ADULTS WITH ACCESS TO THE INTERNET, BY ISLAND REGIONS IN 2011 AND 2019
FIGURE 1.4
Richer Indonesian’s have better access
PROPORTION OF ADULTS WITH ACCESS TO THE INTERNET IN 2019
Source: World Bank staff calculations based on various years of SUSENAS.
FIGURE 1.5
Internet access is also higher among the younger, more educated and male segments of the population
PROPORTION OF ADULTS WITH ACCESS TO THE INTERNET
Source: Source: World Bank staff calculations based on various years of SUSENAS.Note: Connection to the internet is defined based on whether adults reported having access to the internet in the past three months (including accessing social media apps such as Facebook, YouTube, Instagram, Twitter, and WhatsApp).
BY AGE GROUP
BY EDUCATIONAL ATTAINMENT
BY GENDER
81
BEYO
ND U
NICO
RNS:
HAR
NESS
ING
DIGI
TAL
TECH
NOLO
GIES
FOR
INC
LUSI
ON I
N IN
DONE
SIA
CHAP
TER
— 01

→ Mobile phones are the predominant mode of internet connectivity in Indonesia; very few Indonesians are connected through fixed broadband at home
Most Indonesians connect to the internet using mobile broadband and growth in mobile broad-band infrastructure is what has powered the in-crease in internet connectivity over the past de-cade. Only about 5 percent of the population is connected to fixed broadband at home (Figure 1.6). This is reflected also in the sharp increase in the ownership of 3G/4G enabled handsets and the corresponding decline in the ownership of 2G handsets. Ownership of ICT devices such as computers that are common mediums for the use of fixed broadband internet at home have remained surprisingly level at 20 percent over the past decade (Figure 1.7). So, while the wide availability of mobile broadband has expanded access, it has probably not unlocked productive capabilities to the same extent, as it does not deliver the same capacity, and quality of ser-vice, and is not cost-efficient enough for high bandwidth applications as fixed broadband. The pandemic has laid this bare as millions of students and teachers across Indonesia found their mobile data plans inadequate and cost-ly when it came to deal with high bandwidths needed for remote learning arrangements. The challenges associated with universalizing access to affordable and high-quality internet are dis-cussed in Chapter 2.
→ Indonesians who are connected to the internet use it quite intensively, with communication, social media and leisure applications dominating usage
On average, Indonesians spend around 6 hours online, with younger and more educated seg-ments more digitally engaged than the rela-tively older and less educated demographic.13
FIGURE 1.6
Only 5 percent of population is connected to fixed broadband at home
PROPORTION OF POPULATION WITH FIXED BROADBAND CONNECTION AT HOME
Source: World Bank staff calculations based on various years of SUSENAS.
FIGURE 1.7
Smartphone ownership rates have increased sharply over the years
ICT DEVICE OWNERSHIP RATE
Source: World Bank staff calculations using data from SUSENAS.Note: 3G/4G connection share is estimated as share of adults that access the internet using their phone, among adults with cellular phone ownership. 2G connection share is estimated as share of adults with cellular phone ownership that not accessing the internet via their cellular phone. The 2018 figure is interpolated value.
82
BEYO
ND U
NICO
RNS:
HAR
NESS
ING
DIGI
TAL
TECH
NOLO
GIES
FOR
INC
LUSI
ON I
N IN
DONE
SIA
CHAP
TER
— 01

Intensity of internet engagement is highest for the 16 to 25 age group, which on average spends as much as 9.7 hours a day online. There are no significant differences between men and women on the intensity of internet use (Figure 1.8). Among the various online activities, communi-cation, social media, and leisure dominate usage (Figure 1.9). According to estimates from the industry, Indonesia is the fifth most internet engaged country in the world, behind the Phil-ippines, Brazil, Thailand and Colombia. The average intensity of internet use in Indonesia is 28 percent above global average, making it an attractive market for content developers and advertisers.14 Another estimate from the industry suggests that daily time spent on the internet in Indonesia could have spiked by 31 percent during the peak of the pandemic and leveled off at around 20 percent of pre-pan-demic levels more recently, suggesting that as Indonesia emerges from the crisis its popula-tion could have become even more intensively engaged on the internet.15
The social media result is also not surprising. Being an internet user in Indonesia is almost synonymous with being a social media user. Over 85 percent of internet users were also us-ers of social media with the most popular plat-forms being WhatsApp, Facebook and Insta-gram. WhatsApp appears to be used principally for communication and sharing information, while on other platforms such as Facebook, In-stagram and Twitter, users are active in seek-ing out news and information. Social media platforms are also important for commerce in Indonesia, with a sizeable proportion of users (about 20 percent) using Facebook, Instagram and WhatsApp for buying and selling. The most common topics of discussions across all platforms relate to hobbies and lifestyles. How-ever, religion, public policy and politics are also widely discussed, highlighting the importance of social media as a channel of communication and influence on these topics (see Spotlight 1 for more details on the patterns of social media use and some potential downside risks associ-ated with it).
These free digital services generate sizeable consumer surplus for users. A key question that is often asked is whether the consumption of these largely free digital services generates any value to the users or are the hours spent browsing pictures of friends on Instagram and watching cat videos on YouTube simply time away from other productive endeavors. If there
FIGURE 1.8
Indonesians who are connected to the internet use it quite intensively
HOURS PER DAY SPENT ONLINE
Source: World Bank Digital Economy Household Survey, 2020.
FIGURE 1.9
Communications, social media and leisure activities account for 80 percent of average time spent online
SHARE OF TIME SPENT ONLINE
Source: World Bank Digital Economy Household Survey, 2020.Note: Communication includes time spent on online texting & email. Leisure consists of time spent streaming content (audio and video) as well as playing online games. Social media includes time spent on Twitter, Facebook , and Instagram. Others consist of e-travel reservation, e-gig-jobs, e-finance, ordering ride- hailing for transportation and food, and creating or downloading digital content.
Communications Social Media
Leisure
BrowsingBuying& Selling
Others
36% 21% 21%
11% 7%
3%
BY AGE GROUP
BY EDUCATIONAL ATTAINMENT
BY GENDER
83
BEYO
ND U
NICO
RNS:
HAR
NESS
ING
DIGI
TAL
TECH
NOLO
GIES
FOR
INC
LUSI
ON I
N IN
DONE
SIA
CHAP
TER
— 01

is value generated, it is not clear how this value would be measured. Therefore, these benefits are often also not captured in statistics on na-tional accounts. Yet, the fact that so many con-sumers voluntarily choose to spend so much time consuming these services must imply that there is some consumer surplus they derive from it. There have been some efforts, primarily in the United States, to try and estimate the val-ue of this consumer surplus and depending on the methodology used, the numbers range from 3 percent of income to 25 percent of income in one estimate and close to US$100 billion over the 2007–11 period in another.16 Using one of the approaches from the literature, we estimate the consumer surplus of free internet services in Indonesia to average around 19 to 21 percent of per capita income for users.17
→ Digital ride hailing is commonly used and not only provides mobility services to connect the otherwise fragmented labor markets in Indonesia’s large and sprawling metropolitan areas, but also offers several other conveniences
Digital ride hailing services provided by compa-nies, such as Go-Jek—Indonesia’s homegrown decacorn that epitomizes the country’s digital potential for policy makers—and its regional competitor Grab, are potentially among the most frequently experienced digital transactions for many Indonesians. The green-jackets worn by the motor-cycle taxi drivers of both compa-nies are a distinctive feature of almost all Indo-nesian cities. And this is not for no reason. While the pandemic and the associated decline in mo-bility has temporarily hit this segment hard, one-quarter of all Indonesians and around 36.5 percent of urban dwellers reported using the ride hailing service provided by these companies be-fore the pandemic (Figure 1.10). A striking 18.4 percent of users of these ride-hailing services used it for their daily commutes. Other reasons for use included circumstances when private vehicles could not be used (52 percent), a travel option for odd hours (41 percent) and to travel
FIGURE 1.10
One-quarter of Indonesians use ride-hailing apps, and almost one-fifth use it for their daily commutes
RIDE-HAILING APPS USAGE
REASONS FOR USE
Source: World Bank Digital Economy Household Survey, 2020.
WITHOUT RIDE-HAILING APPS I WOULD…
84
BEYO
ND U
NICO
RNS:
HAR
NESS
ING
DIGI
TAL
TECH
NOLO
GIES
FOR
INC
LUSI
ON I
N IN
DONE
SIA
CHAP
TER
— 01

to areas where public transportation services are not available (26.6 percent). Without the availability of these digital ride hailing options, journey times would be longer for 55 percent of users, but travel cost higher for a negligible 1.9 percent of users.
Recent work by the World Bank has shown that the lack of within-city transportation options in Indonesia is one of the primary reasons the country is struggling to realize the poten-tial of its cities to generate greater prosperity and inclusion.18 By providing commuting options for a sizeable segment of the population, helping reduce travel times and providing services in otherwise neglected parts of cities, these services appear to be playing a useful function of connecting people to jobs. However, one potential negative externality of these services could be the congestion and pollution that is inevita-bly associated with an increase in ridership volume.19 On the other hand, large public transportation systems such as metros in many developing countries are often not supported very well by complementary feeder systems, potentially depressing transit ridership. If by filling in this crucial “first mile” void, digital ride hailing services end up boosting transit ridership, then the improved social efficiency of public transit would be a positive externality. From a public policy perspective, evalu-ating the magnitude of these externalities would be important
to obtain the full picture on the social benefits of digital ride hailing. One key question that underpins this discussion thus is the interplay between these digital services and the available network of public transportation options. If these services complement—as opposed to substituting for—available public transportation options, then the cost of the congestion and pollution externalities could potentially be counterbalanced by the positive externality on transit usership.
The opening of the Jakarta MRT in April 2019 provides a unique opportunity to investigate this question in one of the largest and most mature markets for digital ride hailing in Indonesia. If the availability of the public transit option ended up depressing ridership volumes around locations that even-tually became MRT stations, then it could be inferred that these services substitute for public transit. However, if rider-ship volumes increase in these locations, then the two services likely complement each other. Relative to certain other parts of the city that had characteristics similar to locations that were eventually chosen to become metro stations for this MRT, Go-Jek pickups increased, peaked and eventually stabilized at an average of 64 percent within three months of the opening of the MRT (Figure 1.11). The impact on drop-offs similarly was an overall increase of 58 percent over the same period. This
FIGURE 1.11
Strong complementarity with public transportation suggests that these services fill a crucial gap in urban mobility
IMPACT OF THE OPENING OF JAKARTA MRT ON GO-JEK DROP-OFFS, CHANGE IN DROP-OFF VOLUMES AROUND THE EVENT
Source: Bosker, Roberts, Tiwari, Wihardja and Wibisana, 2021 (forthcoming). Note: The plotted values are coefficients of an event study model that looks at the impact of the opening of the Jakarta MRT on ridership volume. The MRT locations are treated locations while a number of other locations with similar characteristics: (i) between two adjacent stations; and (ii) beyond the current MRT line where an extension is planned for the future are taken as control locations. The plotted figure shows that relative to these control locations, ridership volumes jump quite discontinuously in the treated locations after the event.
85
BEYO
ND U
NICO
RNS:
HAR
NESS
ING
DIGI
TAL
TECH
NOLO
GIES
FOR
INC
LUSI
ON I
N IN
DONE
SIA
CHAP
TER
— 01

suggests that Go-Jek ride hailing services are strong comple-ments of the new MRT service that has been introduced and are probably playing an important role in filling the void on the first and last mile connectivity.20
In addition to ride-hailing, these companies have also been providing a whole host of other services through their apps. Chief among these is food delivery through their comple-mentary Go-Food and Grab-Food services. Survey results show that around 21 percent of the urban population ordered food using these apps (Figure 1.12). While home delivery of food is clearly a convenience that enhances utility for those who avail themselves of this service, the aggregate benefits could depend on the extent to which these services help ex-pand markets by increasing the proportion of population opting to dine out, for example. In Indonesia, only about 23 percent of those who order food using these services report a behavioral shift away from home-cooked meals (correspond-ing increase in restaurant food). An overwhelming majority (77 percent) appear to use deliveries simply as substitutes for physical restaurant experiences. Even if the overall mar-ket size has not increased by much, these platforms could help expand opportunities for specific vendors and warung that build a reputation within the system for consistently delivering high-quality products. The drivers or “ride-part-ners”, as they are regarded by the platforms, could also find delivery and ride services attractive employment options. To what extent are these platforms enhancing productivity of micro-scale enterprises? Are these digital ride and delivery services new jobs or existing ones in new form? How do they compare with other forms of informal work? These questions will be explored in depth in Chapter 3.
FIGURE 1.12
Source: World Bank Digital Economy Household Survey, 2020.
Digital ride-hailing has also brought other conveniences
A SIZEABLE SHARE OF THE POPULATION PARTAKES IN FOOD DELIVERED AT HOME… (% OF POPULATION WHO ORDERED FOOD VIA GO-FOOD OR GRAB-FOOD SERVICES)
…THOUGH DELIVERED FOOD IS A STRONGER SUBSTITUTE FOR RESTAURANT FOOD THAN HOME COOKED MEALS
86
BEYO
ND U
NICO
RNS:
HAR
NESS
ING
DIGI
TAL
TECH
NOLO
GIES
FOR
INC
LUSI
ON I
N IN
DONE
SIA
CHAP
TER
— 01

→ Buying and selling online is growing but, though prevalent among only a small share of the population, it is already enhancing consumer welfare by providing cheaper options, greater product variety and convenience
E-commerce is one of the largest components of Indonesia’s digital economy and has also been one of the major drivers of its growth during the pandemic. Industry estimates suggest that the gross merchandise value of e-commerce in Indonesia is expected to have increased by 54 percent yoy from US$21 billion in 2019 to US$32 billion in 2020. This more than off-sets the decline in travel from US$10 billion to US$3 billion.21 While the industry is buoy-ant about the stickiness of pandemic-driven adoption from both the buyer and seller side driving growth during and post recovery, a sobering reality check on the transformative potential of this sector for the larger economy is the fact that, despite recent increases, the overall take-up rates still remain low. In 2019, the proportion of internet-using households that reported buying and selling online was 12.8 and 5.1 percent, respectively. As a share of the overall population, e-commerce engaged households (those who buy or sell) was only around 7 percent. A rough back-of-the-enve-lope calculation using industry estimates on the adoption of digital services during the pandem-ic and their anticipated stickiness suggests that as this could grow up to 10 to 11 percent of the population, as Indonesia begins entering the economic recovery phase.
Moreover, there is significant heterogeneity, with e-commerce prevalence higher in more urbanized provinces and wealthier households. Large metropolitan provinces of Yogyakarta and Jakarta lead with over 20 percent of the inter-net-using population engaged in some form of buying and selling activity online, while the east-ern provinces of East Nusa Tenggara and Papua have more limited e-commerce reach (Figure 1.13). Urban areas, and especially metro cores, have higher e-commerce activity compared with rural domains, which include rural peripheries
FIGURE 1.13
E-commerce more prevalent in populous and affluent provinces
PROPORTION OF HOUSEHOLDS WITH ACCESS TO INTERNET ENGAGED IN E-COMMERCE, BY PROVINCE
Source: World Bank staff calculations using data from SUSENAS 2019Note: Households are considered engaged in e-commerce if they report buying or selling online
87
BEYO
ND U
NICO
RNS:
HAR
NESS
ING
DIGI
TAL
TECH
NOLO
GIES
FOR
INC
LUSI
ON I
N IN
DONE
SIA
CHAP
TER
— 01

FIGURE 1.14
E-commerce prevalence also remains higher among….
…HOUSEHOLDS IN URBAN AREAS (PROPORTION OF HOUSEHOLDS WITH THE INTERNET ENGAGED IN E-COMMERCE ALONG THE URBAN GRADATION)
…AND IN THE UPPER PARTS OF THE INCOME DISTRIBUTION (PROPORTION OF HOUSEHOLDS WITH THE INTERNET ENGAGED IN E-COMMERCE, BY DECILES OF PER CAPITA CONSUMPTION)
Source: World Bank staff calculations using data from SUSENAS 2019. Note: Households are considered engaged in e-commerce if they report buying or selling online.
of larger cities. At the same time, there is also a distinct income gradient, with households in the top decile of the income distribution five times more likely to be engaged in e-commerce than those at the bottom decile (Figure 1.14).
Recognizing the potential that e-commerce holds to boost the productivity of micro and small enterprises in smaller and more remote parts of the country by expanding markets and helping achieve economies of scale, policy makers around the world have started getting interested in policies to push e-commerce into rural areas. China has taken this up as a national priority.22 The Ministry of Electronics and IT and India Post have been tasked with the job of pushing this agenda in India as part the ‘Digital India’ strategy.23 Other countries such as Viet-nam and Egypt have also prepared roadmaps and vision documents where this mission is ar-ticulated. Indonesia’s own e-commerce road-map (2017–2020) included a concerted effort to unlock the key enablers of e-commerce to grow the sector to US$130 billion in valuation by the end of 2020.24
What are the benefits of e-commerce and where is Indonesia in terms of realizing these benefits? The most robustly done analysis on the topic, especially in the context of developing coun-tries, has been done in China and it finds that there is little evidence of income gains to rural workers and producers. Instead, the paper finds most of the benefits of e-commerce to come from the consumption side: ‘gains from e-com-merce are driven by a reduction in local house-hold cost of living that is mainly due to the di-rect gains from access to the new e-commerce shopping option for local households. These gains are in the order of a 5 percent reduction in the cost of living for retail consumption among users, and about a 1 percent reduction for the average household living in these villages. For durable goods consumption, the estimated re-duction in the local cost of living is 17 percent among users and on average 3 percent among all households.’25
The data context does not permit a rigorous ex-amination of the impact of e-commerce on rural incomes in Indonesia, but there is some sugges-tive evidence that e-commerce might already be generating consumer surplus by lowering prices, providing greater product choice and convenience to buyers in Indonesia. Price and convenience are the most frequently cited rea-sons for online purchases (Figure 1.15). Look-
88
BEYO
ND U
NICO
RNS:
HAR
NESS
ING
DIGI
TAL
TECH
NOLO
GIES
FOR
INC
LUSI
ON I
N IN
DONE
SIA
CHAP
TER
— 01

FIGURE 1.15
Price and convenience are the most dominant reasons for buying online…
…FOR THE COUNTRY AS A WHOLE
…AND, WITH SOME HETEROGENEITY, FOR THE MAIN ISLAND REGIONS AS WELL
LEGEND
Source: World Bank Digital Economy Household Survey, 2020.
ing across regions, other factors also come up in specific geographies. For example, in Papua, local non-availability of products drives 40 per-cent of online purchases. In Bali, the reasons for buying online are roughly equally split among price, convenience and local non-availability of the goods that are purchased. In DKI Jakarta, however, online purchases are driven almost exclusively by price and convenience related factors. The literature suggests that, in addition to lower prices, being able to consume goods that were previously unavailable and being able to conveniently procure these goods generates sizeable welfare gains.26
In addition to making cheaper goods available to those who buy online, the penetration of e-commerce into a geography can have an im-pact also on the prices of similar goods sold of-fline, helping lower overall inflation for the ben-efit of the larger community. This can happen because with cheaper options online, including from sellers in other parts of the country, buy-ers, especially in remote places, could essen-tially arbitrage away price differentials across geographies. Indeed, we find that price inflation of commodities likely to be traded relatively more intensively online was 0.8 of a percent-age point lower in high-e-commerce penetra-tion provinces relative to provinces with lower e-commerce penetration. A similar impact does not exist for commodities less likely to be trad-ed online (see Annex 1.A for details).
So far, we have looked at a few specific appli-cations of digital technologies in the economy. Here we zoom out and ask a broader question: what is all of this adding up to? Has the in-creased availability and use of digital technol-ogies begun to fundamentally alter the econom-ic landscape in Indonesia, especially the most lagging regions, in a way that it might start showing up in aggregate statistics? Greater availability and access to fast internet has been found in the literature to have a positive impact on broader employment outcomes, including increased (female) labor force participation and employment rates, net firm entries and improved productivity.27 There is also some evidence from Nigeria that suggests that mobile broadband coverage has had large and positive impacts on household consumption levels and reduced the proportion of households below the poverty line. These effects were found to be at least partially due to an increase in labor force participation and employment, particu-larly among women.
→ Digital technologies are beginning to bring about subtle shifts in the labor market, but skilled workers appear to be better positioned to capitalize on the gains
89
BEYO
ND U
NICO
RNS:
HAR
NESS
ING
DIGI
TAL
TECH
NOLO
GIES
FOR
INC
LUSI
ON I
N IN
DONE
SIA
CHAP
TER
— 01

A causal analysis of this kind must often contend with the po-tential confounding effect of reverse-causality: we would like to examine the impact of internet on economic activity, but very often, the internet tends to be more prevalent precisely in places that already hold greater economic promise. Using a panel event-study design and exploiting the staggered fiber optic rollout in parts of Indonesia that were not already con-nected in 2010, we examine the impact of increased internet connectivity on several variables capturing the labor market characteristics of these places.28 Since large parts of Java and Sumatra were already connected to the fiber optic backbone in 2010, the analysis is done on 33 percent of districts largely in the lagging eastern parts of the country. The findings suggest that, while being connected to the national backbone infra-
structure increased internet access among the population, it translated into little else by way of broader labor market out-comes (Figure 1.16). Changes in non-agricultural employment, youth employment and female labor force participation rates were practically indistinguishable before and after the arrival of the internet. It is not shown here, but the results for other indicators such as total employment and total labor force par-ticipation rates are also largely similar.
These results from the parts of the country that were largely the last to be connected to the fiber optic backbone may not necessarily generalize to the whole country. In fact, given that a dominant share of Indonesia’s industrial activity is concen-trated in Java-Bali, these results may in fact be understating the
FIGURE 1.16
Fiber optic arrival in the Eastern provinces has boosted internet access, but has otherwise had a minimal influence on the underlying structure of the economy
INTERNET ACCESS
Source: Jacoby, Swarnata, Tiwari, Wihardja (2021) forthcomingNote: FE = district fixed effect; IV2SLS: 2SLS method proposed by Freyaldenhoven, Hansen, and Shapiro, 2019. Population density is a proxy of the confound variable. The closest lead of fiber optic deployment is the excluded instrument.
FEMALE LABOR FORCE PARTICIPATION
YOUTH EMPLOYMENT NON-AGRICULTURAL EMPLOYMENT
90
BEYO
ND U
NICO
RNS:
HAR
NESS
ING
DIGI
TAL
TECH
NOLO
GIES
FOR
INC
LUSI
ON I
N IN
DONE
SIA
CHAP
TER
— 01

true impact. Close to 90 percent of jobs in manufacturing, and 84 percent of all jobs in high-value or modern ser-vices, for example, are in Java-Bali and Sumatra, while the recently connected parts of the country remain more de-pendent on agriculture and natural resources, etc. Indeed, a national level analysis of the relationship between digital technology penetration and wage premia confirms this.
On average, over a 15-year period between 2005 and 2019, educated Indonesians have consistently enjoyed higher earnings relative to less educated Indonesians. For exam-ple, average earnings for the most educated group (those with a college or university degree, or higher) have been almost 80 percent higher than those for the uneducated group (less than six years of schooling) (Table 1.1).9 Ex-ploiting the spatial and temporal variation in the rollout of the internet at the district level over this period, we can examine the differential impact of internet penetration on these skill premia. While greater internet penetration benefits all types of workers relative to the uneducated group, except the very low educated with only primary education, the benefits are higher for the more skilled. The magnitude of the coefficients implies that, if internet penetration (measured by the proportion of individuals having access to internet at home) increases by 10 per-centage points in a particular district, the earnings premi-um enjoyed by a college-educated worker will, on average, go up by 6 percentage points, while the earnings premium only went up by 3 percentage points for higher-secondary graduates and 1 percentage point for lower-secondary graduates (Table 1.1).10
These results suggest that the current pattern of digi-tal technology diffusion is potentially widening, instead of narrowing, development gap. They also foreshadow topics such as affordability of the internet, penetration of mobile vs. fixed broadband, the quality and reliability of mobile broadband, digital skills and skills required to thrive in the digital economy that are discussed in some detail in the subsequent chapters.
→ Even though Indonesia punches slightly above its economic weight on the digital adoption index of the Government, capability to provide digital public services is below regional peers and comparator countries
Digital technologies also present a great opportunity for the Government to transform the way it provides ser-vices and interacts with its citizens. These technologies can unlock innovative solutions in services such social protection, education, health and other citizen needs, such as registration of life events, tax filing and payment, etc. How much has Indonesia taken advantage of these opportunities? Based on an international benchmark-
RETURN TO EDUCATION W.R.T. <6 YEARS OF SCHOOLING
ADDITIONAL AVERAGE RETURN OF 1 PERCENTAGE POINT INCREASE IN INTERNET PENETRATION
PRIMARY SCHOOL 18.5% 0.0%
LOWER SECONDARY SCHOOL 32.8% 0.1%
HIGHER SECONDARY SCHOOL 49.7% 0.3%
COLLEGE/UNIVERSITY DEGREE OR HIGHER 79.4% 0.6%
NON-PRODUCTION WORKERS (RELATIVE TO PRODUCTION WORKERS) IN MANUFACTURING
12.7% 0.2%
TABLE 1.1
Greater internet access is benefiting higher-skilled workers more than the lower skilled ones
Source: Jacoby et al. forthcoming.Note: Reported marginal returns to internet are coefficients on the interactions between education levels of individual workers and average internet connectivity within a district in fixed-effect panel data models that also control for all relevant individual characteristics, level of urbanization and economic development of the districts, as well as year effects to capture secular trends in returns to skills. A separate specification is used for the non-production worker result. The analysis uses data from Sakernas (Indonesia Labor Force Survey) (1990–2019), Susenas (Indonesia Socioeconomic Survey) (1990–2019) and the Medium and Large Manufacturing Survey (1995–2015). The unit of the analysis is individual worker (production/non-production worker by sector-district in the case of the Manufacturing Survey
91
BEYO
ND U
NICO
RNS:
HAR
NESS
ING
DIGI
TAL
TECH
NOLO
GIES
FOR
INC
LUSI
ON I
N IN
DONE
SIA
CHAP
TER
— 01

ing of overall adoption of digital technologies by governments around the world, Indonesia appears to punch slightly above its economic weight (Fig-ure 1.17). But in terms of providing some of these services digitally, Indonesia is well behind some of its regional peers such as Singapore, Malaysia, Vietnam and Thailand, and also behind countries such as India and Mexico (Figure 1.18).
There has been some increase in the supply of services provided by the Government using dig-ital technologies in the past decade. For example, most districts and all provinces in Indonesia now have a website that provides information on local investment opportunities, e-procurement, one-stop shops for local permits, and tourism potential. However, these websites are typically information-al and carry minimal interactivity. Big cities such as Jakarta, Surabaya, Bandung and Makassar have selectively adopted several smart city concepts, such as the utilization of sensor networks (internet of things/IoT) and analytics to better manage their resources and infrastructure, and to become more responsive to their citizens’ needs. The Directorate General of Taxes launched e-filing and e-billing in 2014, which enabled taxpayers to submit their tax reports online. Payments to beneficiaries of social assistance programs such as the conditional cash transfer (Program Keluarga Harapan, PKH) and food assistance (Bantuan Pangan Non Tunai, BPNT) have been digitized since 2017.
But most of these fragmented and somewhat ad hoc initiatives at digitization have undermined what ought to be a whole-of-government inte-grated approach. Meanwhile, the pandemic has exposed critical weaknesses as the Government has struggled to mitigate disruptions of key services and roll out assistance to the affected population. The lack of digitized, integrated and interoper-able data systems, for example, made reaching households outside of the bottom 40 that are not covered in the country’s unified database diffi-cult. Specific programs such as Kartu Pra Kerja, that were repurposed to address the needs of this group, faced critical implementation delays due to issues related to identify verification.
There are several significant challenges that need to be overcome for digital transformation of the Government to take off at scale. Some of the foundational elements of these challenges, such as integration of digital ID, cloud-first policy, government digital payment gateway, governance and institutional arrangements, are discussed in Chapter 4.
FIGURE 1.17
Indonesia punches slightly above its weight on digital adoption index for the Government….
(DAI GOVERNMENT SUB-INDEX)
FIGURE 1.18
…but the capability to provide digital public services is below its regional peers
(ONLINE SERVICE INDEX 2018)
Source: World Bank 2018.
Source: UN e-Government Survey 2018. 92
BEYO
ND U
NICO
RNS:
HAR
NESS
ING
DIGI
TAL
TECH
NOLO
GIES
FOR
INC
LUSI
ON I
N IN
DONE
SIA
CHAP
TER
— 01

1.4. Conclusion
This introductory chapter has described the overall mo-tivation of this report, highlighting the various channels and mechanisms through which digital technologies could be useful for Indonesia to achieve greater inclusion and presenting an organizing framework to think about relevant policies. The chapter has also presented some stylized facts on the current state of adoption of digital technologies in Indonesia, emphasizing particularly the state of play on how these technologies and their various applications in the economy are touching and shaping the lives of Indonesians. Despite rapid progress achieved in recent years on connecting its citizens, Indonesia still faces a gaping digital divide, with 49 percent of adults still not connected to the internet. Specific digital tech-nology applications such as e-commerce and digital ride hailing have clearly begun to generate value in the form of consumer surplus, not just to for those who use them but potentially also to others around them. But the level of adoption, and perhaps more importantly the geographic extent of these applications, have not reached levels that enable them to catalyze a more fundamental shift in the underlying structure of the economy and bring about transformative impact on the population. Recent expe-riences related to delays in getting some critical elements of pandemic response off the ground suggest that the po-tential for a broader digital transformation of government is largely unrealized.
Overall, the stylized facts presented in the chapter suggest that the potential for digital technologies to bring about inclusion in Indonesia is largely unrealized in Indonesia. What constrains it and what can the Government do to eliminate these constraints? This question is the focus of the rest of the report. Chapter 2 examines the driv-ers of digital divide, looking at recent progress in digital infrastructure availability and identifying the barriers to making reliable and affordable internet accessible to all. Chapter 3 focuses on jobs and economic opportuni-ties that are currently being generated by applications of digital technologies in the labor market and diagnose the challenges that prevent these opportunities from be-ing available to more Indonesians. Chapter 4 looks at issues of digital adoption within the Government and identifies challenges related to digital ID, and factors that
hold back a whole-of-government approach to digital transformation. Finally, Chapter 5 presents a detailed discussion of specific policy recommendations to address these challenges.
In addition to these chapters, the report also includes four Spotlights that complement the overall narrative by presenting in-depth material on a selection of top-ics. Spotlight 1 is on the pattern of social media use and some of the risks associated with it. Spotlight 2 presents a summary of China’s e-commerce experience focusing specifically on the rural revitalization aspects of the Tao-bao program. Spotlight 3 looks at innovations in digital financial services in Indonesia and their potential to sup-port inclusion. Finally, Spotlight 4 presents a brief picture of the EdTech and HealthTech landscape in the country.
93
BEYO
ND U
NICO
RNS:
HAR
NESS
ING
DIGI
TAL
TECH
NOLO
GIES
FOR
INC
LUSI
ON I
N IN
DONE
SIA
CHAP
TER
— 01

1 Google, Temasek and Bain 2020. The same report also shows that two sectors that have been affected nega-tively are the online travel and transport and ride hail-ing services.
2 Indonesia’s internet economy measured by this met-ric grew five-fold between 2015 and 2019, a pace un-matched by any other country in the region. The esti-mated size of this economy of US$44 billion in 2020 is roughly four times as large as Malaysia and five times as large as the Philippines and Singapore.
3 World Bank 2020a.
4 Tiwari et al. 2020.
5 World Bank 2020b.
6 The program was initially for the September to De-cember 2020 period and is discussed in further detail in subsequent chapters.
7 World Bank 2016.
8 Goldfarb and Tucker 2019.
9 This is confirmed in recent work that shows, for exam-ple, that only 6 percent of manufacturing firms in Indo-nesia are using new technologies or other emerging dig-itally enabled applications; for 64 percent of the firms’ spreadsheets and emails represent the frontiers of digital technologies. ADB 2020. “Innovate Indonesia: Unlock-ing Growth through Technological Innovation”
10 Goldfarb and Tucker 2019.
11 Minges, Michael 2016.
12 There are various other statistics on the overall level of connectivity in the country. Most estimates from the industry tend to rely on mobile and fixed line sub-scription data coming from GSMA and ITU. Although there is some effort made to identify multiple connec-tions, multiple SIM-cards etc., arriving at this statistic from subscription data alone appears quite challenging. For example, the January 2020 edition of Hootsuite reports internet penetration at 64 percent of the pop-ulation. The data that are used here and throughout the report are based on what is perhaps the most com-prehensive socioeconomic survey Indonesia does on an annual basis interviewing around 300,000 households across the country for each round.
13 The gradient on education, which can be expected to largely mimic the gradient on income is noteworthy. This is because in many other, especially higher income settings, it has been found that higher income individu-als adopt internet quicker but conditional on adoption the intensity of use (measured by time spent online) is actually higher for the low-income groups. In Indone-sia, it appears that the it is the high-income groups that are also spending more time online. See Godfarb and Prince (2008) for example.
14 Hootsuite We Are Social 2019.
15 Google, Temasek and Bain, 2020.
16 Goolsbee and Klneow 2006; and Brynjolfsson and Oh 2012.
17 The methodology essentially entails using the time val-ue of leisure to estimate the opportunity cost and val-ue of internet use. We use data from Indonesia’s labor force to estimate the earnings function and the time spent on internet from the Digital Economy House-hold Survey conducted for this report.
18 Roberts, Gil Sander and Tiwari 2019.
19 Though evidence in Figure 1.10 suggests that this may be less of an issue in Indonesia with significant proportion of users of digital ride hailing services us-ing the services as substitutes for private vehicles. Ja-karta for example has an even-odd policy. As a result, many households with either only even- or odd-num-ber-plated vehicle cannot use their private vehicle to commute half of the total working days.
20 Planned future work will attempt to look at the ex-tent to which the increase in ridership volumes around metro stations is evidence of shifting commuting pat-terns—which would imply corresponding decrease in ridership in other parts of the city—or whether the in-troduction of the metro together with the complemen-tary first and last mile service offered by digital ride hailing have managed to lure in new users.
21 Google, Temasek and Bain 2020.
22 Expansion of e-commerce in the countryside has reg-ularly featured in the so-called “Number One Central Document” that lays out annual priorities for the coun-try.
23 MEITY. 2016. Digital India: Driving e-commerce in rural and semi urban India. Ministry of Electronics and IT Report
24 The Government of Indonesia issued the 14th Eco-nomic Policy Package on the Road Map for the Na-tional Electronic-Based Trade System (SPNBE) or the Road Map for e-Commerce in November 2016, which was later stipulated into Presidential Regulation No. 74 of 2017 on the E-Commerce Roadmap. The roadmap aims to build a more efficient commercial institution and ecosystem through seven steps, namely: (i) sim-plifying and expanding access to finance; (ii) providing tax incentives; (iii) provide consumer protection; (iv) increasing human resource capabilities; (v) improving the national logistics system (Sislognas); (vi) accelerat-ing the development of communication infrastructure; and (vii) improving cybersecurity. Through ecosystem development, it is targeted to create 1,000 technopre-neurs with a business valuation of US$10 billion and an e-commerce value of US$130 billion by 2020
25 Couture et al. 2020.
26 See Brynjolfsson et al. 2003; and Dolfen et al. 2017, for example
27 Hjort and Poulsen 2018; Bahia et al. 2020.
28 The methodology closely follows Freyaldenhoven et al. 2019.
Endnotes
94
BEYO
ND U
NICO
RNS:
HAR
NESS
ING
DIGI
TAL
TECH
NOLO
GIES
FOR
INC
LUSI
ON I
N IN
DONE
SIA
CHAP
TER
— 01

References1 Asian Development Bank. 2020. Innovate Indonesia: Unlocking Growth through Technological Transformation. Asian Development
Bank: Manila. Retrieved from: https://dx.doi.org/10.22617/SGP200085-2 (accessed November 16, 2020)
2 Bahia, Kalvin, Pau Castells, Genaro Cruz, Takaaki Masaki, Xavier Pedrós, Tobias Pfutze, Carlos Rodríguez-Castelán and Hernan Winkler. 2020. “Welfare Effects of Mobile Broadband Internet: Evidence from Nigeria” World Bank Policy Research Working Paper #9230. Washington DC: World Bank.
3 Bosker, Maarten, Mark Roberts, Sailesh Tiwari, Monica Wihardja and Putu Sanjiwacika Wibisana. 2021. “Complements or Substitutes? Insights from the Impacts of the Opening of the Jakarta MRT on Go-Jek Ridership” Background Paper for the Digital Economy and Inclusion Flagship report.
4 Brynjolfsson, Eric, Yu (Jeffrey) Hu, and Michael D. Smith. 2003. “Consumer Surplus in the Digital Economy: Estimating the Value of Increased Product Variety at Online Booksellers”. Management Science, 49(11):1580–1596.
5 Brynjolfsson, Erik, and JooHee Oh. 2012. “The Attention Economy: Measuring the Value of Free Digital Services on the Internet” Thirty Third International Conference on Information Systems, Orlando.
6 Couture, Victor, Benjamin Farber, Yizhen Gu and Lizhi Lu. 2020. “Connecting the Countryside Via E-Commerce: Evidence from China” American Economic Review: Insights, forthcoming.
7 Dolfen, Paul, Liran Einav, Peter J. Klenow, Benjamin Klopack, Jonathan D. Levin, Laurence Levin, and Wayne Best. 2017. “Assessing the Gains from E-Commerce”. Stanford University, mimeo.
8 Freyaldenhoven, Simon, Christian Hansen, and Jesse M. Shapiro. 2019. “Pre-Event Trends in the Panel Event-Study Design.” American Economic Review, 109(9):3307-3338.
9 Google, Temasek and Bain. 2020. e-Conomy SEA 2020 – At Full Velocity: Resilient and Racing Ahead. Retrieved from: https://www.thinkwithgoogle.com/_qs/documents/10614/e-Conomy_SEA_2020_At_full_velocity__Resilient_and_racing_ahead_bMmKO5b.pdf (accessed November 16, 2020)
10 Goolsbee, Austan, and Peter J. Klenow. 2006. “Valuing Consumer Products by the Time Spent Using Them: An Application to the Internet”, American Economic Review 96(2):108-113.
11 Goldfarb, Avi, and Jeff Prince. 2008. “Internet Adoption and Usage Patterns are Different: Implications for the Digital Divide”, Information Economics and Policy, 20(1):2-15.
12 Goldfarb, Avi and Catherine Tucker. 2019. “Digital Economics”. Journal of Economic Literature, 57(1):3-43.
13 Hjort, Jonas, and Jonas Poulsen. 2019. “The Arrival of Fast Internet and Employment in Africa.” American Economic Review 109(3):1032-1079.
14 Hootsuite and We Are Social. 2019. Indonesian Digital Report 2019. Retrieved from https://datareportal.com/reports/digital-2019-indonesia (accessed November 16, 2020).
15 Jacoby, Hanan, Arya Swarnata, Sailesh Tiwari, and Maria M. Wihardja. 2020. “Welfare Impacts of Digital Infrastructure Development and Skill-Biased Technological Change in Indonesia.” Background Note for the Digital Economy and Inclusion Flagship report.
16 Ministry of Electronics and Information Technology, India. 2016. Digital India: Driving e-commerce in rural and semi urban India. Ministry of Electronics and IT Report.
17 Minges, Michael. 2016. “Exploring the relationship between broadband and economic growth” World Development Report background papers. Washington DC: World Bank.
18 Roberts, Mark, Frederico Gil Sander and Sailesh Tiwari. 2019. Time to ACT: Realizing Indonesia’s Urban Potential. Washington DC: World Bank.
19 Tiwari, Sailesh, Virgi Sari, Imam Setiawan and Juul Pinxten. 2020. “Pandemic, Poverty and Policy: Ex Ante Poverty and Distributional Impact of the COVID-19 Pandemic” World Bank Policy Research Working Paper, forthcoming.
20 World Bank. 2016. Digital Dividend: World Development Report. Washington DC: World Bank.
21 World Bank. 2020a. Indonesia Systematic Country Diagnostic Update. Washington DC: World Bank.
22 World Bank. 2020b. Indonesia Economic Prospects: The Long Road to Recovery. Jakarta: World Bank.
95
BEYO
ND U
NICO
RNS:
HAR
NESS
ING
DIGI
TAL
TECH
NOLO
GIES
FOR
INC
LUSI
ON I
N IN
DONE
SIA
CHAP
TER
— 01

Annex.ANNEX 1.A
Impact of e-commerce on prices of high and low-intensity commodities
PANEL A: LOW-INTENSITY E-COMMERCE COMMODITIES
VARIABLES D1. LOG (PRICE)
POST 2015 (= 1)0.0143*** 0.0149***
-0.00345 -0.00368
HIGH E-COMMERCE PENETRATION IN 2019 (=1)0.0204 0.018
-0.0181 -0.0172
POST 2015 (D=1) X HIGH E-COMMERCE PENETRATION IN 2019 (=1)-0.0342 -0.0344
-0.03 -0.0308
CONSTANT0.0318*** 0.156*
-0.00295 -0.0764
ADDITIONAL CONTROLS NO YES
OBSERVATIONS 214 214
R-SQUARED 0.012 0.014
PANEL B: HIGH-INTENSITY E-COMMERCE COMMODITIES
VARIABLES D1. LOG (PRICE)
POST 2015 (= 1)0.000459 0.000459
-0.00319 -0.00267
HIGH E-COMMERCE PENETRATION IN 2019 (=1)0.00686** -0.0018
-0.00283 -0.00404
POST 2015 (D=1) X HIGH E-COMMERCE PENETRATION IN 2019 (=1)-0.00829* -0.00825*
-0.00424 -0.00429
CONSTANT0.0416*** 0.175*
-0.00188 -0.0916
ADDITIONAL CONTROLS NO YES
OBSERVATIONS 217 217
R-SQUARED 0.022 0.094
Source: Authors’ estimation using data on prices from CEIC and e-commerce penetration data from platforms (Tokopedia and Bukalapak). Note: High e-commerce penetration are provinces that were in the top 40 percent in terms of the proportion of buyers in 2019 while low e-commerce penetration provinces are those in the bottom 40; low-intensity e-commerce commodities include items such as staple food, meats, processed foods, animal produce, vegetables and fruits; higher-intensity e-commerce commodities include building materials, household wares, clothes, convenience goods, and automotive spare parts; additional controls include province level logistics cost, per capita GDP, and the level of urbanization. Standard errors are clustered at the province level.
96
BEYO
ND U
NICO
RNS:
HAR
NESS
ING
DIGI
TAL
TECH
NOLO
GIES
FOR
INC
LUSI
ON I
N IN
DONE
SIA
CHAP
TER
— 01

97
BEYO
ND U
NICO
RNS:
HAR
NESS
ING
DIGI
TAL
TECH
NOLO
GIES
FOR
INC
LUSI
ON I
N IN
DONE
SIA
CHAP
TER
— 01

→ What are Indonesians doing on social media?Being an internet user in Indonesia is almost synonymous with being a social media user, as the use of social media is pervasive in the online population. Over 85 percent of internet users in the digital economy household survey (a nationally representative survey that was conducted for this report) were also users of social media, with the most popular platforms being WhatsApp, Facebook and Instagram (Figure S1. 1).
There are some gender differences, with females being more avid social media users than males (93 percent fe-males accessed social media in the last week vs. 88 percent of males surveyed) and particularly stronger users of the Instagram platform (32 percent females accessed Insta-gram in the last week vs. 22 percent of males). There is also an age dimension with social media use increasing among younger cohorts (Figure S1. 2), particularly on certain platforms. For example, Instagram and Line are far more widely used by young adults aged between 15 and 29, while the use of Facebook and WhatsApp is wide-spread across all age groups. Indonesians of all education levels are using social media, although there is more regu-lar use among those with tertiary education (97 percent) compared with those with primary education (83 percent accessed in the last week). Overall, use of social media is intensive, at over 25 hours per week, or 3.5 hours a day, spent on average using social media. This ranks Indonesia fifth in the world in terms of daily time spent using social media. Intensity of social media use has a significant age dimension to it, with younger cohorts of adults spending significantly more time on social media. For example, adults aged between 15 and 24 spend 5.6 hours per day on average, while adults aged between 35 and 50 spend 2.7 hours per day.
The popularity of social media may reflect the predilec-tion of Indonesians to socialize and discuss. On the most popular platform, WhatsApp, this certainly appears to be the case, as users are principally using it for communica-tion and sharing information (Figure S1. 3). Likewise, on other platforms (Facebook, Instagram and Twitter), users are active in seeking out news and information. However, social media platforms are also important for commerce in Indonesia, with a sizeable proportion of users (about 20 percent) using Facebook, Instagram and WhatsApp for buying and selling.
The most common topics of discussion across all plat-forms relate to hobbies and lifestyles (Figure S1. 4). However, religion, public policy and politics are also widely discussed, highlighting the importance of social media as a channel of communication and influence on these topics. Relatedly, religious leaders are the most followed public figure (38 percent of respondents follow a religious leader on social media), followed by celeb-rities (30 percent), political leaders (21 percent) and government officials (18 percent). The level of trust in the information received varies across platforms, although over 90 percent of social media users across all platforms indicate at least sometimes trusting the information they receive. Information shared through WhatsApp is considered most trustworthy, with 44 per-cent always or often trusting the materials they receive, while Facebook is considered a more uncertain source of information, with around 21 percent always or often trusting the materials they receive.
Spotlight 1.Use of Social Media in Indonesia and Implications for Inclusion
98
BEYO
ND U
NICO
RNS:
HAR
NESS
ING
DIGI
TAL
TECH
NOLO
GIES
FOR
INC
LUSI
ON I
N IN
DONE
SIA
CHAP
TER
— 01

FIGURE S1.1
Most recent use of various social media platforms (share of internet users)
FIGURE S1.3
The most common activities on social media
Source: World Bank Digital Economy Household Survey, 2020. Source: World Bank Digital Economy Household Survey, 2020
FIGURE S1.2
Profile of social media users in Indonesia (share of internet users)
FIGURE S1.4
The most common topics in social media discussions
Source: World Bank Digital Economy Household Survey, 2020 Source: World Bank Digital Economy Household Survey, 2020
99

→ What does the level of adoption and pattern of use of social media imply for economic and social inclusion? This is an emerging research space and significant learn-ing remains to be done. But a couple of implications have started to crystalize based on evidence from around the world. One strand of research points to the potential coordination effects of social media, which can increase voter participation, as well as coordinate citizens to ad-vocate for social and political changes, and influence decision-making processes. A large-scale randomized controlled trial (RCT) in the United States found that messaging that encouraged citizens to “get out the vote” shared through Facebook was effective in increasing voter turnout in the 2010 congressional elections, for voters of both major parties.29 Likewise, cross-sectional survey analysis finds that social media usage coincides with in-creased civic participation (examples include voluntary work for nonpolitical groups, raising money for charity, attending a meeting to discuss neighborhood problems, (not) purchasing products (mis-)aligned with personal social values), as well as political participation.30
Evidence of these coordination effects is visible within Indonesia. Over 55 percent of survey respondents indi-cated that they participated in civic engagement activi-ties (such as non-electoral and community organizations, fund raising, village and community meetings), with 67 percent saying that social media had helped increase their participation. Likewise, 43 percent reported that social media had helped increase their participation in polit-ical processes, such as voting, joining demonstrations and making financial contributions. While better access to information is cited as the most common reason for this impact (75 and 77 percent, respectively, for civic and political participation), the next most common reason is because it allows social media users to find people with the same beliefs as them (47 and 36 percent, respectively).
One recent piece of evidence from Indonesia also suggests that, in addition to the coordination function, social me-dia and, especially social media actors with a following within platforms who are known in the industry parlance as “influencers”, also have significant power to change offline beliefs and behaviors. For example, in an informa-tion campaign on immunization in Indonesia, celebrity endorsement of the campaign had significant impact on offline knowledge about immunization among the popu-lation exposed to it and greater take up of immunization among friends, neighbors and families of respondents who had been exposed to this content. Oddly, citing a credible source of information in the endorsement mes-sage had an adverse effect on information diffusion. This
effect was found not only to be driven by the mechanical fact that influencers were likely to be connected to more people, but also “because subsequent individuals are con-siderably more likely to respond to the message when it is sent by influential agents.”31 This suggests that social media may generate opportunities to harness the brand value of influential celebrities to try and change offline beliefs and actions of large segments of the population to boost inclusion outcomes.
A flipside to all of these is a potential risk of misinfor-mation and polarization. By design, social media expos-es users to unstructured information flows whereby the information received is influenced by who is in your net-work, the information they share, as well as algorithmic predictions of what is expected to interest you most. By doing this, there is a risk that social media may create ideological “echo-chambers” and “filter bubbles”. In the echo-chamber phenomenon, individuals are exposed only to information from like-minded individuals or people with the same ideology.32 Meanwhile, the “filter bubble” conditions users only to see content that is selected by algorithms according to a viewer’s previous behaviors. These two conditions can amplify existing divisions in society and cause further polarization.33 A second risk of how social media usage can cause polarization is through the emergence of fake news or misinformation. The in-creasing number of available sources for news and infor-mation can deepen ideological differences, particular-ly when users end up trusting unreliable ideologically aligned sources more than accurate neutral sources due to overconfidence in their own feedback.34
Empirically, there are a few studies providing evidence of these risks, although primarily in the United States. For example, in an RCT in the United States, temporary Face-book deactivation reduced political polarization through lowering exposure to news from the political party Face-book users were already most aligned with.35 However, this same study also found users had a high willingness to pay for social media access and quickly returned to prior levels of adoption at the end of the study, suggesting that user-directed moderation of content consumption is not likely to have sustainable depolarizing impacts. A more severe consequence of polarization is manifestations of conflict, and some evidence highlights the risks that are becoming apparent even in Indonesia. Conflicts within villages increased on average by 0.6 percentage points relative to a baseline rate of 2.8 percent in villages that “received” BTS towers, communication technology that provides internet and cellular network access with this effect greater in more religiously polarized areas.36
Another emerging concern around the use of social media is on physical and mental health effects. Over 50 percent of survey respondents indicate some emotional attach-ment to being online, with 25 percent reporting they
100
BEYO
ND U
NICO
RNS:
HAR
NESS
ING
DIGI
TAL
TECH
NOLO
GIES
FOR
INC
LUSI
ON I
N IN
DONE
SIA
CHAP
TER
— 01

feel worried depressed, lonely, and 29 percent reporting they feel like they might be missing out on something, but it was “not a big deal”, when they were not online or able to use their phone for a day or more. Around 23 per-cent report making comparisons of their life with others through social media, while 43 percent indicate it has affected their family relationships, but mostly in a positive way (82 percent felt it brought family members closer together). Headaches and eye strain (44 percent), thumb/wrist/hand/neck/shoulder pain (28 percent), insomnia (22 percent), and forgetting to eat (21 percent) or exercise (18 percent) were the most common ailments that users experienced. Little research has been done globally on the public health costs of internet and social media use, so it is hard to extrapolate out the welfare implications of these findings.
A final rising concern surrounding social media and broader internet access relates to exposure among chil-dren. Thirty-two percent of survey respondents did not monitor their children’s online activities, while the remaining respondents with children were highly con-cerned with their children’s online activities. The biggest concerns of parents were risk of negative content expo-sure (86 percent), interrupting study habits (59 percent), the risk of exploitation by other social media users (40 percent) and teaching anti-social behavior, such as an inability to communicate face-to-face (28 percent). The main means parents chose to guard against excessive use of social media or online activities was through limiting access to ICT devices (85 percent) and directly monitor-ing their online accounts and browser history (46 per-cent). A minority resorted to installing software to mon-itor (8 percent) and block (4 percent) online activities.
→ What does this evidence and these findings of social media usage imply for policy?
Social media is a tool for coordination. This can catalyze greater civic participation, which can in turn strengthen accountability at all levels. However, there are fast-chang-ing dynamics of public opinion on current affairs given the ease of spreading information through social me-dia. When this information turns more into the realm of misinformation, gossip or simply polarizing content, there is a heightened risk of greater social divisions and public sentiment evolving based on inaccurate or biased information. This can be used to the advantage or dis-advantage of policy makers, and may call for stronger oversight and regulation. Such oversight would need to address when to correct “mistruths” and how, with tools such as de-bunking websites, correcting beliefs through building new narratives on social media, norm setting by social media influencers and religious leaders, politi-cians speaking out against misinformation and not using negative smear approaches in their own campaigns, to more severe forms such as controlling content or direct censorship and strengthening laws around the spread of false or misinformation. This would also call for policies and investments to boost the overall digital literacy of the internet-using population to enable them to discern better the veracity of the online information they con-sume through social media. Similarly, addressing health risks, particularly to children, relatively little is known regarding the public health risks, but these will need to be studied and closely monitored in the future.
101
BEYO
ND U
NICO
RNS:
HAR
NESS
ING
DIGI
TAL
TECH
NOLO
GIES
FOR
INC
LUSI
ON I
N IN
DONE
SIA
CHAP
TER
— 01

29 Bond et al., 2012.
30 Gil De Zuniga et al., 2019.
31 Alatas et al. 2019.
32 Sunstein, 2018; Baumann et al. 2019.
33 Bakshy, 2011.
34 Gentzkow, Wong, and Zhang, 2018.
35 Alcott et al., 2019.
36 Boxell and Ralston, 2020.
Endnotes
102
BEYO
ND U
NICO
RNS:
HAR
NESS
ING
DIGI
TAL
TECH
NOLO
GIES
FOR
INC
LUSI
ON I
N IN
DONE
SIA
CHAP
TER
— 01

1 Alatas, Vivi, Arun G. Chandrasekhar, Markus Mobius, Benjamin A. Olken, and Cindy Paladines. 2019. When celebrities speak: A nationwide twitter experiment promoting vaccination in Indonesia (No. w25589). National Bureau of Economic Research.
2 Allcott, Hunt, Luca Braghieri, Sarah Eichmeyer, and Matthew Gentzkow. 2019. The welfare effects of social media (No. w25514). National Bureau of Economic Research.
3 Bakshy, Eytan, Solomon Messing, and Lada A. Adamic. 2015. “Exposure to ideologically diverse news and opinion on Facebook.” Science, 348(6239):1130-1132.
4 Baumann, Fabian, Philipp Lorenz-Spreen, Igor M. Sokolov, and Michele Starnini. 2020. “Modeling echo chambers and polarization dynamics in social networks.” Physical Review Letters, 124(4):048301.
5 Bond, Robert M., Christopher J. Fariss, Jason J. Jones, Adam DI Kramer, Cameron Marlow, Jaime E. Settle, and James H. Fowler. 2012. “A 61-million-person experiment in social influence and political mobilization.” Nature, 489(7415): 295-298.
6 Boxell, Levi. and Laura Ralston. 2020. “Information Technology and Social Development in Indonesia”. Working Paper.
7 Gentzkow, Matthew, Michael B. Wong, and Allen T. Zhang. 2018. “Ideological bias and trust in information sources.” Working Paper.
8 Gil de Zúñiga, Homero, Nakwon Jung, and Sebastián Valenzuela. 2012. “Social media use for news and individuals’ social capital, civic engagement and political participation.” Journal of computer-mediated communication, 17(3): 319-336.
9 Sunstein, Cass R. 2018. # Republic: Divided democracy in the age of social media. Princeton University Press.
References
103
BEYO
ND U
NICO
RNS:
HAR
NESS
ING
DIGI
TAL
TECH
NOLO
GIES
FOR
INC
LUSI
ON I
N IN
DONE
SIA
CHAP
TER
— 01

Chapter ⬎
2
Availability, Access and Adoption→The Drivers of Digital Divide in Indonesia
104
BEYO
ND U
NICO
RNS:
HAR
NESS
ING
DIGI
TAL
TECH
NOLO
GIES
FOR
INC
LUSI
ON I
N IN
DONE
SIA
CHAP
TER
— 02

s discussed in Chapter 1, being connected to high-quality internet is a pre-requisite to directly benefiting from the digital economy. The COVID-19 pandemic has further reinforced this by pushing work, education, and other es-sential social and economic interactions online. As also pointed out in Chapter 1, despite rapid progress over the past decade or so, Indonesia faces several challenges in uni-versalizing access to the internet. In fact, reliable, fast and high-quality internet remains a luxury for many Indone-
sians. Although by now connectivity infrastructure (network cov-erage) has reached almost all parts of the country, nearly 94 million Indonesians—more than one-third of total population—are still not plugged in. More than 60 percent of adults living in Nusa Tenggara, Maluku and Papua remain without internet (Figure 2.1). Even in Java-Bali, 45 percent of the adults are not connected to the internet.
2.1. Introduction
FIGURE 2.1
Last mile connectivity challenges persists
Source: SUSENAS, August 2019.
PROPORTION OF INDIVIDUALS 15+ WITHOUT ACCESS TO INTERNET, BY REGION
A
105
BEYO
ND U
NICO
RNS:
HAR
NESS
ING
DIGI
TAL
TECH
NOLO
GIES
FOR
INC
LUSI
ON I
N IN
DONE
SIA
CHAP
TER
— 02

Moreover, owing to their large population size, the other-wise relatively better-connected regions such as Java-Bali and Sumatra account for a total of 77 percent of all In-donesians who are not connected to the internet (Figure 2.2). As pointed out in Chapter 1, 58 percent of those who are not connected live in rural areas. These stylized facts suggest that, while there is still work to be done to boost connectivity in parts of the archipelago where distance and low population density make investments costly and demand relatively weak, there is a significant amount of work to be done also on going the last mile in places such as Java-Bali and Sumatra.
There is heterogeneity in access even within places with the same level of internet availability, with socio-de-mographic factors playing a key role. Offline adults in Indonesia are more likely to be female, relatively older, have lower levels of education, and lower overall living standards. Younger adults (16 to 25) in the same local-ity are ten times more likely to be connected than older Indonesians, while those with tertiary education are five times more likely to be connected than those with junior secondary school education. Individuals belonging to the top 20 percent of the income distribution are three times more likely to be connected than individuals from poor households. This is consistent with regional/global trends.
The objective of this chapter is to diagnose the drivers of the various facets of the digital divide in Indonesia. Linking the supply- and demand-sides of connectivity, the chapter investigates the factors that hold back the universalization of internet access in the country. Reaping the full potential of digital transformation is not only about the availability and accessibility of the hard infrastructure, but also about having the necessary knowledge and skills to fully exploit the opportunities that digital technologies generate in a safe and secure manner. Thus, in addition to the constraints on the broader availability of digital infrastructure and household level barriers to adoption of these technolo-gies, the chapter also utilizes a novel dataset from a survey implemented specifically for this report to describe and characterize the level of digital skills in the population.
The chapter is organized in the following way: Section 2 describes the evolution and current state of digital infra-structure in the country, benchmarking Indonesia with other regional peers where relevant. Section 3 discusses issues related to cost, affordability and the quality of the internet experience. Section 4 carries out a deeper di-agnosis of the main drivers of the digital divide. It also proposes a framework for measuring core digital skills and describes the level of skills among internet using In-donesian adults. Finally, Section 5 concludes with a brief discussion of potential entry points for policy.
FIGURE 2.2
Java-Bali and Sumatra still have the highest number of Indonesians not connected
PROPORTION OF INDIVIDUALS 15+ WITHOUT ACCESS TO INTERNET, BY REGION
Source: SUSENAS, August 2019. 106
BEYO
ND U
NICO
RNS:
HAR
NESS
ING
DIGI
TAL
TECH
NOLO
GIES
FOR
INC
LUSI
ON I
N IN
DONE
SIA
CHAP
TER
— 02

Indonesia’s digital connectivity infrastructure comprises the following layers: the cross-border network or inter-national fiber optic connectivity (submarine cables); the national fiber optic backbone consisting of terrestrial and submarine cables to the main cities; the middle mile net-work that brings the internet to a point in a community in the form of fixed and mobile broadband fiber network, and in the form of satellite links, and occasionally short-wave radio in very remote locations; and finally the last mile distribution to individual homes and businesses in the form of fiber, DSL and COAX cables, and other wire-less methods (Figure 2.3).
Indonesia’s digital connectivity has been improving steadi-ly over the past decade, driven primarily by private invest-ment in telecommunications/internet services by the ma-jor telecommunications service providers (telcos). Mobile network coverage is near-universal, almost all Indonesians have access to at least basic mobile (2G) and text messaging (SMS) services, including in some of the remotest parts of the country. Over the past five years, the telcos have also invested heavily in mobile broadband (3G and faster 4G) infrastructure and services, and increasingly in fixed broad-band, notably fiber to the home (FTTH). The following sections review the current status of digital connectivity in Indonesia, and analyze critical access and quality gaps.
2.2. Evolution and the State of Digital Infrastructure
FIGURE 2.3
Broadband infrastructure value chain
Source: World Bank, 2018.
FIBER
DSL
COAX
LAST MILE (ACCESS)
FIBER OR MICROWAVE
SATELLITE LINK
WIRELESS
WIFI, LTE,TV WHITE SPACE
FIBER
SATELLITE LINK (DTH)
WIRELESS
BALLOONS
& DRONES
MIDDLE MILE NETWORK (DISTRIBUTION)
NATIONAL BACKBONE (CORE NETWORK)
CROSS BROADER NETWORK (INTERNATIONAL LINKS)
Distributing Internet from the middle mile in the community to individual homes & business
Bringing Internet to a point in a community for broader distribution
Connecting bigger cities together and routing data to the service centers
Connecting the service centers to the world wide internet
TERRESTRIAL FIBER
SUBSEA CABLE
Technologies
Purpose
Typical distance
1000s KM 100s-1000s KM <1-5s KM100s-100s KM
107
BEYO
ND U
NICO
RNS:
HAR
NESS
ING
DIGI
TAL
TECH
NOLO
GIES
FOR
INC
LUSI
ON I
N IN
DONE
SIA
CHAP
TER
— 02

Jakarta
Makassar
kupang
sorong
jayapuraambon
denpasar
samarinda
banda aceh
→ Though further cable builds could be useful in improving resilience in some parts of the country, Indonesia has adequate international bandwidth to service current and medium-term demandIndonesia is connected to global telecommunications networks via multiple international submarine cables, such as Medan (2), Dumai (5), Batam (at least 4 routes), Bintan (1), Jakarta (at least 12 routes), Pontianak (1), Manado (1) and Jayapura (1). International bandwidth availability is adequate for current and medium-term demand given the very high capacity of each submarine cable route (for example, the cable from Manado to the United States has a design capacity of 10 Tbps and initially just activated less than 10 percent of this capacity, while ded-icated submarine cables to Malaysia and Singapore can carry very high traffic and capacity that is just lit-on as needed) and comparable to regional benchmarks. Indonesia also has access
to more direct international submarine cables than Vietnam, Thailand and the Philippines, though there may be opportu-nities for further cable builds in eastern Indonesia to provide redundancy/restoration in those regions. The two furthest destinations on the Sulawesi-Maluku-Papua Cable System (SMPCS) are Jayapura and Merauke. These end-tails of the domestic submarine infrastructure do not have an alternative route since an overland cable between them is not yet possible due to mountainous terrain and lack of roads. Further interna-tional extensions could be used to improve resilience. Jayapura has recently been connected to PNG, which opens the option of an alternative route. Merauke would also benefit from an onward international connection to PNG and/or Australia.
Figure 2.4 below shows the large number of international submarine cables passing through the Singapore Straits be-tween Singapore and Batam. Most of Indonesia’s international connectivity comes from Singapore and Malaysia though the SEA-US cable from Manado to the United States, and provides a high level of geographical diversity. Indonesian telecom pro-viders also have capacity on various consortium cable systems running directly to the United States and Europe.
FIGURE 2.4
Submarine cables connecting Indonesia to the main international routess
Source: https://www.submarinecablemap.com/Note: Only some domestic cables shown in the map.
108
BEYO
ND U
NICO
RNS:
HAR
NESS
ING
DIGI
TAL
TECH
NOLO
GIES
FOR
INC
LUSI
ON I
N IN
DONE
SIA
CHAP
TER
— 02

Jakarta
Makassar
kupang
sorong
jayapuraambon
denpasar
samarinda
banda aceh
“Backbone networks are also sufficiently well deployed, and with the completion of the Palapa Ring project, all of Indonesia’s 514 districts are connected to the domestic backbone network.”
109
BEYO
ND U
NICO
RNS:
HAR
NESS
ING
DIGI
TAL
TECH
NOLO
GIES
FOR
INC
LUSI
ON I
N IN
DONE
SIA
CHAP
TER
— 02

FIGURE 2.5
Backbone networks are also sufficiently well deployed by service providers
Source: Respective service providers. Note: In addition to the four providers shown here, XL and Indosat operate their own backbone networks across Java, Bali, Lombok, Sumbawa, Sumatra, Kalimantan and Sulawesi.
TELKOM
BIZNET
JakartaMakassar
kupang
sorong
jayapura
ambon
denpasar
samarinda
banda aceh
Jakarta Makassar
kupang
sorong
jayapuraambon
denpasar
samarinda
banda aceh
110
BEYO
ND U
NICO
RNS:
HAR
NESS
ING
DIGI
TAL
TECH
NOLO
GIES
FOR
INC
LUSI
ON I
N IN
DONE
SIA
CHAP
TER
— 02

Jakarta Makassar
kupang
sorong
jayapuraambon
denpasar
samarinda
banda aceh
Jakarta Makassar
kupang
sorong
jayapuraambon
denpasar
samarinda
banda aceh
FIGURE 2.5
MORATELINDO
ICON +
JakartaMakassar
kupang
sorong
jayapura
ambon
denpasar
samarinda
banda aceh
Jakarta Makassar
kupang
sorong
jayapuraambon
denpasar
samarinda
banda aceh
111
BEYO
ND U
NICO
RNS:
HAR
NESS
ING
DIGI
TAL
TECH
NOLO
GIES
FOR
INC
LUSI
ON I
N IN
DONE
SIA
CHAP
TER
— 02

JakartaMakassar
kupang
sorongjayapura
ambon
denpasar
samarinda
banda aceh
Telcos have invested significantly in the domestic backbone, as well as in middle mile networks that connect Indonesia’s main population centers. Figure 2.4 illustrates the backbone net-works deployed by different service providers. As of end-2019, 457 kabupaten/kota had been connected to high-speed optical fiber backbone networks through private sector investments. Of all the providers, the Telkom domestic backbone is the most extensive (100,069 km at end-2019), but Indosat, XL, ICON+, Moratelindo and Biznet also have extensive fiber optic backbones on Java-Bali and Sumatra, with some extensions to Sulawesi and Kalimantan (Figure 2.5).
The Palapa Ring project, a private-public partnership (PPP) led by the Ministry of Communications and Information Technolo-gy (Kominfo) and implemented during 2015–19, has succeeded in extending the domestic backbone to the entire country. The original Palapa Ring project was divided into a commercially feasible part and a commercially non-feasible part. The com-mercially feasible part (457 districts/cities) was undertaken by the private sector and included the routes from Lombok to Kupang, SMPCS (Sulawesi-Maluku-Papua-Cable-System) up to Jayapura and Merauke, and several smaller cable projects. The commercially non-feasible part of Palapa Ring (57 districts) was financed through the USO Fund (financed by a levy on the net revenues of the telcos) and was also deployed in 2015–19. The business model is based on an availability payment (for about
15 years) provided by the USO Fund (BP3TI, now called BAK-TI) to the three consortia that deployed the Palapa Ring proj-ects. The consortia obtained financing construction loans that were backed by guarantees from the Indonesia Infrastructure Guarantee Fund (IIGF). The users (telecom providers leasing backbone capacity) pay for the services and these revenues flow back into the USO Fund.
With the completion of the full Palapa Ring system, all 514 kabupaten/kota have been connected. Almost all are on the fiber optic network, except for locations in the interior of Papua province where microwave was the only feasible connectivity option. Since the completion of the Palapa Ring backbone, there have been subsequent private sector investments in mo-bile broadband (LTE) and fixed broadband (FTTH) access networks, and users in many of these more remote districts have been able to avail themselves of broadband services sim-ilar in performance to many urban centers. Nonetheless, fur-ther extension of some middle mile and access networks to smaller population centers and villages within the districts is required. Linking the 514 kabupaten/kota on the main national backbone to the 7,246 kecamatan (subdistricts) and further to 75,436 villages still has gaps. On Java-Bali and Sumatra most kecamatan have been connected by middle mile connectivity, mostly fiber optic and, in some cases, still through microwave links, while in eastern Indonesia there is still significant middle
FIGURE 2.6
Palapa Ring project
Source: Kominfo Note: This map is not fully up to date since the cable system to Merauke is already in operation as well. In Central Sulawesi also, the route from Bitung to Liwuk is already in operation and in Sumatra the islands to the west, such as Sabana-Aceh, Simeuleu-Bakongan, and Sibolga-Nias have already been connected
Districts/Cities
57
Total lenght
13,000 Km
Interconnecting Cities
28
EXISTING OPERATORS’ FIBER OPTIC
PLANNED OPERATORS’ FIBER OPTIC
EXISTING PALAPA RING (FIBER OPTIC)
PLANNED PALAPA RING (OPEN TECHNOLOGY)
112
BEYO
ND U
NICO
RNS:
HAR
NESS
ING
DIGI
TAL
TECH
NOLO
GIES
FOR
INC
LUSI
ON I
N IN
DONE
SIA
CHAP
TER
— 02

mile connectivity to be improved. Some kabupaten are large and middle mile distances of up to 100+ km are not uncommon in rural areas.
→ Mobile broadband access networks have also expanded rapidly to near universal coverage of 4G/LTE services, but fixed broadband is lagging
Access networks—the digital equivalents of feeder roads—are what connect the digital highways (fiber optic backbone) to end users in the last mile. They can take the form of fixed broadband (ADSL or copper, and increasingly, optical fiber) and mobile broadband networks (3G, 4G/LTE).
Access networks for mobile broadband have expanded rap-idly over the past decade, with investments by some of the major players, such as Telkomsel, Indosat, XL Axiata, Tri and SmartFren, driving this progress. Over the past decade or so, the deployment of base stations has accelerated rapidly, driven mainly by 3G and 4G/LTE stations (Figure 2.7). An estimated 95 percent of the population lives within reach of the fastest,
i.e., 4G/LTE networks (end of 2019; noticing major rollout in 2020, this should be higher now), while over 98 percent are within 2G network range. The 3G layer is estimated at over 95 percent but, as mobile operators migrate 3G radios by software upgrade to LTE, a decline in the number of 3G cell sites has become visible over the course of 2020. The latest available data from telcos, as well as public sources such as Telegeogra-phy (GSMA), put total mobile broadband (3G and 4G/LTE) subscriptions in Indonesia at about 255 million (allowing for multiple SIM card ownership). Of these, about 157 million are 4G subscribers (mid-2020), so 4G mobile broadband pene-tration is around 58 percent of the population.
A relatively small (1.3 percent) share of the population in very remote locations has no mobile network access and re-lies entirely on satellite connectivity. The main project to close this remaining gap is the 5000 BTS blank spot program managed by BAKTI which, as mentioned earlier, is also the entity in charge of the Universal Service Obligation (USO) Fund under Kominfo.
Telkom, the largest provider of fixed broadband or fiber-to-the-home (FTTH) services in Indonesia, has been deploying ADSL services over the PSTN copper lines to provide basic broadband services. In 2014, Telkom launched IndiHome, a triple play fiber optic proposition and, by December 2017, about 3 million out of
FIGURE 2.7
Mobile broadband access networks have also expanded
(BASE STATION DEPLOYMENT OVER TIME)
Source: Respective company disclosures.
TELKOMSEL INDOSAT XL
113
BEYO
ND U
NICO
RNS:
HAR
NESS
ING
DIGI
TAL
TECH
NOLO
GIES
FOR
INC
LUSI
ON I
N IN
DONE
SIA
CHAP
TER
— 02

the 5.3 million fixed broadband customers were connected to FTTH. As of Q3 2020, Telkom had about 30 million homes passed (i.e., po-tentially connected, as optical fiber cables have been deployed in the area) and 7.8 million homes connected.37 Other providers have also been ac-tive in this space. Linknet (the main cable TV provider in Jakarta) reported 2 million homes passed, while MNC Play also reported 1.2 million homes passed. Biznet offers services in 100+ cit-ies but the extent of the access network in those places is limited, with a total number of reported homes passed at 450,000. As a new player PLN, through ICON+, has launched Stroomnet pro-vided jointly with electricity services.
Considering the FTTH services provided by all these market players, the total estimated num-ber of fixed broadband subscribers is about 9.7 million. This translates to fixed broadband pen-etration of just 4 percent of the population, or 16 percent of households. Thus, while Indonesia performs relatively well compared with some of the regional peers in terms of mobile broad-band penetration, it performs distinctly less well compared with some of the regional peers, such as Singapore, Malaysia, Thailand and Vietnam, on fixed broadband rollout (Figure 2.8). From a more global perspective and relative to its level of development, Indonesia is behind on fixed broadband penetration (Figure 2.9).
Fixed broadband access is essential for data-in-tensive transactions and very important for businesses, government, schools and health-care facilities, and limited progress in this is a key driver of the digital divide in Indonesia. Though mobile broadband coverage is near universal, and access to relatively high (as doc-umented in Chapter 1), the quality of service is highly variable, as discussed in the following sub-section. This imposes challenges on house-holds and businesses, particularly SMEs, which are compelled to rely on mobile broadband to support more sophisticated applications.
FIGURE 2.8
Indonesia lags behind many ASEAN neighbors on fixed broadband penetration
MOBILE BROADBAND PENETRATION
FIXED BROADBAND PENETRATION
4G/LTE
LEGEND
3G GSM
Population
LEGEND
Household
Source: Telegeography (2020). 114
BEYO
ND U
NICO
RNS:
HAR
NESS
ING
DIGI
TAL
TECH
NOLO
GIES
FOR
INC
LUSI
ON I
N IN
DONE
SIA
CHAP
TER
— 02

FIGURE 2.9
Fixed broadband penetration is also below countries at similar levels of development
Source: World Development Indicators and ITU, 2020.
115
BEYO
ND U
NICO
RNS:
HAR
NESS
ING
DIGI
TAL
TECH
NOLO
GIES
FOR
INC
LUSI
ON I
N IN
DONE
SIA
CHAP
TER
— 02

Connecting people is not just about network coverage. As discussed above, mobile broad-band (4G) network coverage now extends to about 95 percent of the population. However, actual mobile broadband penetration (mea-sured in terms of subscriptions) is only about 55 percent of the population. Similarly, for fixed broadband, actual subscription is often just a fraction of the number of homes passed. For example, for PT Telkom, the actual number of subscribers is just 26 percent of the number of homes passed. So improved network coverage does not necessarily lead to increased adoption/uptake of services. We examine two key drivers of adoption decisions, namely cost and afford-ability, and the overall quality of service.
→ Mobile broadband data is affordable but the high cost of fixed broadband subscription weighs heavily on overall internet affordability in IndonesiaIn terms of overall affordability of internet, Indonesia ranked 61st out of 100 countries analyzed by the Economist Intelligence Unit’s annual Inclusive Internet Index in 2020. In com-parison to its regional peers, Indonesia outper-forms Cambodia and the Philippines, but lags Thailand, Singapore, Malaysia and Vietnam on overall internet affordability (Figure 2.10).
Affordability of mobile data is not a major con-cern, since it is well within the affordability criteria (0.95 percent of GDP/capita versus the ITU-UNESCO target of below 2 percent). Al-though mobile service providers in Indonesia adopt differential tariff-pricing to cover higher service provision costs in more sparsely populat-ed and geographically challenging areas, there is a wide range of mobile data packages for differ-ent budgets and needs, making internet mobile data relatively affordable for all segments of the population. Even for poor households, the aver-
2.3. Affordability and Quality of the Internet Experience
116
BEYO
ND U
NICO
RNS:
HAR
NESS
ING
DIGI
TAL
TECH
NOLO
GIES
FOR
INC
LUSI
ON I
N IN
DONE
SIA
CHAP
TER
— 02
FIGURE 2.10
Overall internet affordability in Indonesia is on the lower side…
EIU AFFORDABILITY SCORE, 2020
Source: EIU, Internet Inclusivity Index, 2020. Note: Scores are 0–100, with higher score representing greater affordability.
Source: ITU 2017.
FIGURE 2.11
…and the price of mobile broadband data is not the issue
PRICE OF MOBILE BROADBAND (1GB, PREPAID), AS % OF GNI ON 2017

age price per GB in a mobile data plan of US$0.64 is less than 1 percent of their monthly per capita expenditure, suggesting that mobile data costs should not prevent Indonesians from connecting to the internet. From a regional perspective as well, the price of mobile prepaid data in Indonesia—1GB at average of 0.95 percent of GNI—is lower than the ASEAN average of 1.4 percent and the global average of 5.5 percent.
Affordability of mobile handsets, particularly internet-enabled ones, appears to be somewhat an issue. Although mobile phone penetration and smartphone ownership have been increasing at a significant pace over the past decade, many Indonesians still either do not have a mobile phone or own only a basic phone that lacks the necessary functionality to connect to the internet. Around 55 percent of adults who do not own and op-erate internet-enabled mobile phones cite cost as the primary impediment (Figure 2.12).
A variety of smartphones can be found at relatively low prices in Indonesia. Handsets prices start at around IDR 450,000 (about US$31), or equivalent to 11 percent of average monthly household expenditure. But for the poor, even these entry level devices can account for anywhere between 20 and 35 percent of their monthly household expenditure, depending on where they live. Setting aside such an amount for a one-time purchase may not always be feasible. While credit schemes are increas-ingly being offered for the purchase of ICT devices, availing of these schemes requires ID (KTP) and a bank account. With
only 17 percent of poor households having the required ID and a bank account, this credit facility is unlikely to be helpful for this segment. Inability to afford internet-enabled devices is one of the main reasons some of the poorest in Indonesia are unable to connect to the internet, despite near universal coverage of mobile broadband.
In contrast to mobile broadband, setting up a fixed broadband service entails a wide array of costs that can include the cost of modem rental, installment fee and the monthly subscription fee. Indonesia ranked 131 out of the 200 countries in the 2019 ITU rankings on fixed line subscription fees, suggesting that cost could be a clear binding constraint for the adoption of fixed broadband relative to countries around the world. Data from a survey conducted specifically for this report confirm this. Over 40 percent of households reported fixed broad-band subscription costs to be prohibitive. This is distinctly higher than the proportion of households whose reasons for non-adoption were the use of mobile broadband as substi-tutes for fixed broadband (24 percent) and the proportion of households that reported not having coverage (14 percent) (Figure 2.13). From a regional perspective, cost is the most salient barrier to adoption in places such as Sumatra, Sulawesi and Maluku, while availability of services is the bigger barrier in Papua and Nusa Tenggara. In contrast, Java-Bali stands out with the highest proportion of households that treat mobile broadband as a satisfactory enough substitute for the fixed broadband internet experience (Figure 2.13).
FIGURE 2.12
Fifty-five percent of adults who do not use internet-enabled devices cite cost as the primary barrier to adoption
Source: World Bank Digital Economy Household Survey, 2020
117
BEYO
ND U
NICO
RNS:
HAR
NESS
ING
DIGI
TAL
TECH
NOLO
GIES
FOR
INC
LUSI
ON I
N IN
DONE
SIA
CHAP
TER
— 02
INTERNET ACCESS FOR THE POPULATION AGE 15 OR OVER

→ Both fixed and mobile broadband speeds in Indonesia are among the lowest in ASEAN, and the poorer quality in the more populous parts of the country suggests that network congestion is a major challenge
Quality of service (QoS), or the overall quality and re-liability of internet services, is also another challenge in different parts of the country. QoS impacts the speed of data transmission (uploads, downloads), the quality of phone calls, and hence the ability of users to access on-line services, be it e-commerce or video streaming, for example, for remote health-care or learning services that have become integral during the COVID-19 pandemic.
This is also an area in which Indonesia lags critical-ly behind some of its regional peers. Average mobile broadband download speed experienced by Indonesian consumers is about 9.8 Mbps, the lowest speed in all of ASEAN. The mobile download experience in Indonesia is not just a mere one-quarter of the average speed available to Singaporean consumers but also a little over one-half of that enjoyed by consumers in Myanmar. Incidentally, Myanmar is also the only country in the ASEAN region that Indonesia outperforms on fixed broadband download speeds. But the overall level is almost one-tenth of market leaders in the region, such as Singapore. (Figure 2.14)
FIGURE 2.13
Affordability is a key barrier to the adoption of fixed broadband for many
REASONS FOR NOT SUBSCRIBING TO FIXED BROADBAND, BROKEN DOWN BY ISLAND REGIONS
LEGEND
FIXED BROADBAND THROUGHPUT (MBPS)
Source: Ookla Speedtest (March, 2020). Note: Mobile broadband speeds in the left panel and fixed broadband speeds in the right panel.
Both fixed and mobile broadband download speeds in Indonesia are among the lowest in the ASEAN region
MOBILE BROADBAND THROUGHPUT (MBPS)
FIGURE 2.14
118
BEYO
ND U
NICO
RNS:
HAR
NESS
ING
DIGI
TAL
TECH
NOLO
GIES
FOR
INC
LUSI
ON I
N IN
DONE
SIA
CHAP
TER
— 02
Source: World Bank Digital Economy Household Survey, 2020

There is also considerable variation in download speeds within Indonesia with, somewhat interestingly, places in West Papua (Sorong), Maluku (Ambon) and Papua (Jayapura) registering the best mobile download speeds (Figure 2.15). In contrast, more populous places particu-larly in the periphery of large metropolitan areas, such as Cimahi outside Bandung and Tangerang and Bogor, just outside Jakarta, are the places with the poorest internet experience as measured by download speed. QoS is deter-mined by several factors, including network congestion (linked to availability of spectrum for data transmission), the availability of cell sites, weather and geographic lo-cation. This observed pattern on the variation in the QoS across the country clearly points to network congestion be-ing a key impediment to high-quality download experience in the higher population density places in Indonesia. This issue is examined more closely in the following section.
FIGURE 2.15
Quality of the internet experience varies significantly across the country
MOBILE BROADBAND THROUGHPUT (MBPS)
Source: Ookla Speedtest (March, 2020). 119
BEYO
ND U
NICO
RNS:
HAR
NESS
ING
DIGI
TAL
TECH
NOLO
GIES
FOR
INC
LUSI
ON I
N IN
DONE
SIA
CHAP
TER
— 02

OPERATOR450 MHz / 850 MHz 900 MHz SUB TOTAL 1800 MHz 2100 MHz 2300 MHz SUB TOTAL
TOTALSPECTRUM
NO OFSUBSCRIBERS
Telkomsel - 2 x 15 30 MHz 2 x 22.5 2 x 15 30 105MHz 135 MHz 171.1 Million
Indosat - 2 x 12.5 25 MHz 2 x 20 2 x 15 - 70MHz 95 MHz 59.3 Million
XL - 2 x 7.5 15 MHz 2 x 22.5 2 x 15 - 75MHz 90 MHz 56.7 Million
Hutchison - - 2 x 10 2 x 15 - 50MHz 50 MHz 30.4 Million
Smartfren* 2 x 11 - 22 MHz - - 30 30MHz 52 MHz 13.3 Million
Sampoerna 2 x 7.5 - 15 MHz - - - OMHz 15 MHz 0.2 Million
Source: SDPPI, August 2020. Note: Coverage spectrum is below 1GHz and capacity spectrum is above 1GHz. As of April 2021, the SDPPI was running a spectrum acution for certain 2.3 GHz spectrum bands. Results have not been publicly announced as of this writing.
2.4. Drivers of the Digital Divide
This chapter has so far established several key challenges related to internet connectivity in Indonesia. First, fixed broadband access is insufficient to meet rapidly growing de-mand for high-bandwidth applications, particularly for in-stitutional users. Second, mobile broadband is more widely available but does not deliver the same capacity, or QoS, and is not cost-efficient enough for high bandwidth appli-cations. Third, adoption of fixed broadband is constrained by the availability of access networks, as well as the afford-ability of the subscription plans. A sizeable proportion of the population, particularly in Java-Bali, also appears to regard mobile broadband as a satisfactory substitute to fixed broadband. Finally, the overall quality of the available internet service in Indonesia is significantly poorer than its regional peers and varies substantially across the coun-try, with strong evidence of mobile network congestion, especially in greater Jakarta and the larger urban centers.
This section goes deeper to examine the sectoral drivers of these challenges. Three key issues are discussed: spec-trum and the unavailability of specific international mobile telecommunications (IMT) bands used to support mobile broadband; infrastructure sharing as a constraint on invest-ments in fixed broadband access network; and the lack of competition, especially in the fixed broadband segment, which keeps costs high.
→ Spectrum and unavailability of specific bands
All Mobile Network Operators (MNOs) need a spectrum portfolio, and the availability and overall quality of mobile broadband hinge crucially on having adequate spectrum. Currently, Indonesia has allocated a total of 467 MHz in total IMT spectrum to its active MNOs (Table 2.1). In glob-al and regional terms, this quantum of available spectrum in Indonesian is low and has not increased for some time except for some small additional spectrum being made available in the 2.3 GHz band. Before the introduction of 5G services, 100-150 MHz in total IMT spectrum may have been enough for a successful MNO. However, this is unlikely to remain the case in the future. Potentially, MNOs will need more than 1,000 MHz of spectrum (in-cluding 3.5 GHz and mmWave spectrum), although prices for spectrum cannot increase by that same factor as this would crowd out investment. Three Indonesian MNOs do not have enough spectrum to be viable in the long term, with Hutchison (Tri) having no low band spectrum at all.
At about 1.71 MHz per million people, Indonesia’s total IMT spectrum allocation is on the lower side in compar-ison to other emerging countries. (See Annex 2.A). This lack of useable IMT spectrum available to the MNOs has a direct negative impact on the quality of mobile inter-
TABLE 2.1
Current spectrum assignments for mobile services
120
BEYO
ND U
NICO
RNS:
HAR
NESS
ING
DIGI
TAL
TECH
NOLO
GIES
FOR
INC
LUSI
ON I
N IN
DONE
SIA
CHAP
TER
— 02

net services in Indonesia. This manifests itself in a number of ways, such as poor latency, call drops, inability to do voice over LTE (VoLTE), etc. However, the most important way is how it negatively affects broadband speeds as discussed above, espe-cially download speeds as traffic to consumer mobile devices is typically asymmetrical. Higher spectrum prices also results in less capital being available for MNOs to invest in the network. With heightened additional demands for bandwidth due to larger share of population working from home (WFH) and studying from home (SFH) due to the COVID-19 pandemic, the need for further useable spectrum is more acute.
With the market move to 4G and future 5G services, the lack of available IMT spectrum in Indonesia is also putting pressure on Indonesian MNOs to (i) merge or be acquired because their service offering is no longer competitive against the market leader and/or (ii) merge in order to ‘bulk up’ their IMT spec-trum holdings in order to be able to provide a competitive service offering – namely higher speed broadband services. Knowing that there will be sufficient spectrum in the future to support 4G and 5G Service offerings, MNOs can confi-dently make the necessary long-term investments in digital infrastructure.
In addition to quality, this IMT spectrum scarcity also con-tributes directly to the digital divide by constraining further rollout of mobile broadband. Harmonized spectrum below 1 GHz, especially the 700 MHz frequency band, is particularly useful. This is because the propagation characteristics of this so-called digital dividend band provides greater geographic reach/coverage and better in-building penetration relative to higher IMT spectrum bands. With greater reach the num-ber of cell sites needed to serve an area is significantly lower than if higher frequencies such as 1800 or 2300 MHz are used, and this makes investments in rural rollout more attractive to MNOs. With just over 90 MHz in sub-1 GHz spectrum allo-cated to IMT purposes in Indonesia, insufficient spectrum is allocated for coverage purposes in the country. This crucial 700 MHz band is currently occupied by legacy analogue television.
If the 700 MHz spectrum were to be made available to the MNOs in Indonesia, then 4G and/or 5G38 services could be provided to remote communities at significantly lower capital cost and therefore with lower ongoing operating costs. This would result in more affordable services to Indonesian con-sumers. The use of 700 MHz would materially assist coverage in rural areas. This is irrespective of the current use of LTE900 because the coverage area (-100 dBm) for 900 MHz is materi-ally smaller, namely 116.6 km² versus 161.7 km² for 700 MHz,39 albeit under theoretical and optimal deployment conditions.
While the unavailability of low frequency bands limits cov-erage expansion, the unavailability of specific high frequency capacity bands retards preparation for 5G rollout. Indonesia has recently made the 2100 MHz and the 2300 MHz bands available through an auction process. But the continued un-availability of higher frequency capacity spectrum, including
particularly the 2.6 GHz and the 3.5 GHz bands, has meant that the MNOs have been doing their best with their exist-ing spectrum allocations. Arguably they are over-investing in additional cell sites for 4G/LTE services when they could be investing in new 5G technology.
As 5G is a more efficient technology, it offers a much lower cost per unit (and higher speed, better QoS and can be used for other innovations such as 5G IoT), instead of continued capacity growth on current 4G/LTE systems. The sector needs clarity, perhaps in the form of an IMT spectrum roadmap, to be better able plan and direct investments in the network in an optimal way. Without such clarity the investment becomes significantly less efficient, and does not result in improved broadband speeds and lower latency offerings to Indonesian consumers. In addition, it is necessary to consider the future switch-off of legacy 2G and 3G networks as other Asian and ASEAN markets are doing or have done in order to free up legacy spectrum for 4G and 5G services.40 For example, Sin-gapore’s 2G services are already switched off, Malaysia’s 3G networks are scheduled to be switched off by the end of 2021 and Vietnam is scheduled to switch off legacy 2G services in early 2022.41
The recently enacted Omnibus Law on Job Creation (No. 11/2020) includes a mandatory plan to implement the “Ana-logue Television Switch Off (ASO)” policy within a two-year timeframe. If successfully implemented, this would be a crucial step in securing the 700MHz spectrum band. The law also in-troduces reforms to optimize spectrum allocations and to allow spectrum to be allocated to its most productive use. The actual implementation of these provisions in the law, however, will require significant inter-agency coordination and coordination also among the various tiers of government.
→ Infrastructure sharing, competition and regulation
Major investment is required to expand fixed broadband rollout in Indonesia. However, typically between 70 and 80 percent of the investment in fixed broadband is in passive in-frastructure, such as ducts, poles, rights of way and civil works. Mobile broadband deployment across Indonesia has relied instrumentally on tower-sharing, which has been well-estab-lished since the 2009 tower-sharing regulation. Independent tower-sharing companies have brought efficiency to the tower deployments. Cross-sectoral passive infrastructure sharing (between (rail)roads and fiber optic and electricity poles and fiber optic) has also occurred to some extent.42 But sharing between the telecom operators is not yet well established and lacks regulation. In fact, the Telecom Law (PP No. 52/53) pro-hibited infrastructure sharing until recently. Duplication of passive infrastructure is costly and unnecessary and, therefore, making regulatory provisions to avoid this would be a signifi-cant step toward expanding fixed broadband access networks.
121
BEYO
ND U
NICO
RNS:
HAR
NESS
ING
DIGI
TAL
TECH
NOLO
GIES
FOR
INC
LUSI
ON I
N IN
DONE
SIA
CHAP
TER
— 02

The dominance of an incumbent telecom operator (PT Telekom), together with the lack of regulation, until re-cently, to enforce sharing of ducts, poles and other passive infrastructure on fair, cost-based and non-discriminatory conditions, is a major factor in the lack of passive infra-structure sharing among telecom operators. There are multiple fiber optic backbones across the main populated islands such as Java-Bali and Sumatra, as well as subma-rine cables to Kalimantan and Sulawesi. While the fiber optic backbone deployed by the USO Fund in the 57 most remote districts is accessible for all telecom operators, the same is not true for the fiber optic networks owned by PT Telkom. Lack of affordable access to those sections of the fiber optic backbone, including many districts in eastern Indonesia but also in rural parts of Sumatra, is a key challenge for the newer telecom operators, and is also a key impediment to the expansion of fixed broadband services in the country.
Sharing of active network will also increase competition on mobile broadband in rural areas. This takes the sharing a step beyond the current (passive) tower-sharing ar-rangements. The more remote areas of the country often have a single provider, while if active rural access network (RAN) sharing were to be allowed, that would create more options for competition. This could be in the form of a single shared RAN in the most remote areas or two com-
peting RANs in rural areas which, through sharing, enable three or more mobile providers to offer services without requiring a fully duplicated RAN network rollout.
Providers who want to overcome this by attempting to lay their own cables face additional challenges related to rights of way and local permits with local jurisdictions. Local governments in Indonesia often view telecom ser-vice providers as a source of local revenues as opposed to the providers of an important service that can drive local development by providing broadband connectivity. This is one of the major challenges, especially in going the last mile on connectivity.
In addition to constraining rollout and keeping access low, limited competition also affects other aspects of ser-vice delivery by limiting market contestability. Unlike the mobile broadband space, the fixed broadband mar-ket is very concentrated with the current FTTH rollout dominated by PT Telkom (Indihome), with some smaller providers such as Biznet, MNC, My Republic, etc. in some major cities (Figure 2.16 and Figure 2.17). But for mobile broadband too, there are often just single providers in many areas. This lack of competition limits incentives to upgrade networks in a timely manner, and to remain competitive in terms of pricing affecting quality and af-fordability of services.
FIGURE 2.16 FIGURE 2.17
While the mobile broadband space is competitive…
…the FTTH market is more concentrated, with Telkom dominating market share
SUBSCRIPTION SHARES OF VARIOUS PROVIDERS SUBSCRIPTION SHARES OF VARIOUS PROVIDERS
Source: Subscription data various sources. Source: Subscription data various sources.
122
BEYO
ND U
NICO
RNS:
HAR
NESS
ING
DIGI
TAL
TECH
NOLO
GIES
FOR
INC
LUSI
ON I
N IN
DONE
SIA
CHAP
TER
— 02

Although (fixed) telephony is generally a service under pres-sure, the restrictive licensing regime contributes to reducing competitiveness in the broadband market and limits entry. A fixed broadband provider should be able to deliver a full portfolio of services, not only broadband internet but also telephony, TV and many other value-added services. How-ever, the current regulatory regime limits this by requiring providers to bid for service specific licenses instead of a single uniform license for all services. Local telephone licenses are still formally limited to Telkom, Indosat and Batam-Bintan Telekomunikasi, with Telkom effectively being the only pro-vider outside a specific area of Batam-Bintan. This is a major hurdle for fixed broadband competition, since customers are forced to keep a Telkom connection to maintain their tele-phony service. Number portability is another issue. Even if another provider were to be allowed to offer fixed telephony services over the broadband connection, customers would have to change telephone number to migrate to another provider which is a major disincentive, especially for institutional users (e.g., schools, hospitals, businesses).
Finally, all of this is fundamentally linked also to the regulatory structure of telecom sector. The telecom sector in Indone-sia used be regulated by the Indonesian Telecommunication Regulatory Agency (Badan Regulasi Telekounikasi Indonesia, or BRTI) set up by a 2003 ministerial decree. Even though the Ministry of ICT did play a role, this was considered to be a somewhat independent telecom regulator. In November 2020, however, the Government decided to dismantle BRTI and the establish this role within the Ministry of ICT. Post ratification, it is possible that this decision will need to be revisited or fur-ther institutional changes made given the commitment by Indonesia as a signatory to the Regional Comprehensive Eco-nomic Partnership (RCEP) in late 2020 to inter alia support competition in the provision of telecommunications services, support access and use, competitive safeguards, and have an independent telecommunications regulatory body.43 This will be crucial also from the perspective of recent legislative chang-es that allow for up to 100 percent foreign investment in tower business which was previously not possible.44
→ Digital Literacy and Skills
In addition to the challenges related to hard infrastructure discussed above, another crucial dimension of the digital divide is digital literacy and skills. One can be plugged in and con-nected to the internet, but how effectively one can benefit from it could depend crucially on the capacity for safe, secure and productive use of the internet, and all the digital opportunities it can unlock. A detailed discussion of jobs and economic trans-formation in the digital economy space, and the opportunities it has generated in Indonesia is presented in the next chapter. Here, we use data from a survey conducted specifically for this report to characterize the level of basic digital skills among the internet-using population in Indonesia.
Despite a growing literature on the topic, a consensus is yet to emerge on the conceptualization and measurement of dig-ital skills. Earlier literature tended to define digital skills in a rather limited way as the ability to effectively use and navigate the internet.45 More recent work has expanded this domain to include elements that go beyond basic navigation skills, emphasizing, for example, the ability to understand and gen-erate content.46 Others have added the ability to communicate and collaborate into the mix. UNESCO (2018) articulates a more holistic view of digital skills, defining it as the “ability to access, manage, understand, integrate, communicate, evaluate, and create information safely through digital technologies for employ-ment, decent jobs and entrepreneurship.’ In order to operationalize this definition, it also proposes six distinct competency areas: information and data literacy, communication and collabo-ration, digital content creation, safety, problem solving, and career-related competencies. Similarly, the EU defines digital skills more broadly and includes more than basic or opera-tional skills of ICT devices and argues that digital skills have to encapsulate “the confident and critical use of information society technology:” for work, leisure, learning, and communication.47
In this report we adopt a measure of digital skills that draws on both the UNESCO and EU frameworks and adapts it to
123
BEYO
ND U
NICO
RNS:
HAR
NESS
ING
DIGI
TAL
TECH
NOLO
GIES
FOR
INC
LUSI
ON I
N IN
DONE
SIA
CHAP
TER
— 02

the Indonesian context. It covers six components of core dig-ital skills: basic operation of ICT devices, applications and internet, information and data literacy, communication and collaboration, digital content creation, digital security and safety, and problem solving. Within each of these areas, we assess skill at varying level of competency, going from basic ones to more advanced capabilities.
Having defined digital skills in this way, we use a survey-based method to assess the level of skills among the internet-using population in Indonesia.48 Figure 2.18 summarizes the findings from this survey. Starting with operation of ICT devices, almost all internet-using adults in Indonesia are comfortable operating some kind of ICT device, and over 80 percent are also able to connect their devices to the internet, and to operate the brows-ers and other applications to use the internet. A slightly lower share (72 percent) is also comfortable installing applications and software on their ICT devices. Again, given the preponderance of mobile broadband users among internet-using adults, it is reasonable to assume that most respondents are considering mobile applications in responding to these questions.
The next competency related to information and data literacy captures the ability of the users of digital technology to articu-late their information needs, search, use and share information with a sense of judgement and responsibility. A little over four in five internet-using adults appear comfortable using search
applications, while only about two in three can compare in-formation from different sources and discern the quality of information. Similarly, on communications, nearly all inter-net users are comfortable in communicating through instant messaging, but only one-half of the users reported being able to communicate via email and a little over one-third of the population has the more advanced competency of collaborat-ing through cloud sharing.
Digital content creation, which covers not only the skill to generate original local content and improve existing bodies of knowledge but also awareness of and good practice in applying copyrights and licenses, is a crucial dimension of digital skill. It also captures the ability to avoid fraudulent use of online content such as plagiarism. Among all internet-using adult respondents, around two-thirds know how to copy and forward information, while only about 46 percent know how to edit information from online sources. Consistent with the near-ubiquitous use of social media, around 81 percent of the internet-using adults reported knowing how to compose and upload media (video, photos, etc.) on the internet. In contrast, only one in five has advanced skills in the creation of original digital content, such as developing a website, putting in a watermark, etc.
Using digital technology and the internet comes with certain risks, such as the fraudulent use of personal information and breaches of data privacy and can potentially lead to many forms
FIGURE 2.18
Core digital skills among internet-using adults in Indonesia
Source: World Bank Digital Economy Household Survey, 2020
124
BEYO
ND U
NICO
RNS:
HAR
NESS
ING
DIGI
TAL
TECH
NOLO
GIES
FOR
INC
LUSI
ON I
N IN
DONE
SIA
CHAP
TER
— 02

of cybercrimes. Indeed, concerns about digital safety, security and privacy are not just hurdles to digital technology adoption but also a key risk for all types of users. Indonesia has seen an increasing number of cases involving breaches of data and cyber-attacks. During January to April 2020, there were 88.4 million hacker attacks on Indonesian internet users49, a six-fold increase over same period last year.50 A recent high-profile case involved a security breach that led to the hacking and subsequent leaking of the personal addresses and financial in-formation of 15 million users of Tokopedia (one of the leading e-commerce platforms in the country). Similarly, in mid-2020, a hacker claimed to have breached the COVID-19 database and stolen the COVID-19 patient data from various hospitals.51
Awareness of these evolving cyber risks and the ability to maintain basic ‘digital hygiene’ to protect and safeguard one’s information and technology against these risks is also a key digital competency. This could include maintaining strong passwords, using antivirus programs and firewalls to protect against scams and viruses, being aware of trustworthy web-sites and able to identify scams or phishing emails and other kinds of malware. About 70 percent of internet-using adults in Indonesia reported being able to restrict access to personal information on their personal devices, and roughly the same proportion also reported being able to identify and discern phishing emails. This suggests that a sizeable share of the in-ternet-using adult demographic is either unaware of these risks
or unable to take the necessary actions to protect themselves against them. For example, around 35 percent of respondents reported not reading data privacy policies when installing ap-plications and opening social media accounts. A much higher share of social media users (75 percent) reported that they were not well-informed about the terms and conditions of the social media platforms they were using, with roughly half of the users not being particularly concerned about it either.
Digital literacy and skills also vary across different demograph-ic groups. Gender differences are not as large across all dimen-sions, except setting strong passwords, on which men were 10 percentage points more likely than women to be able to do so. Differences across socioeconomic status too were relatively less pronounced, with individuals from wealthier households slightly better able to search for information online, use email and also be aware of data privacy issues. Education and age pro-files, however, show a starker difference in literacy and digital skills, with younger and more educated internet-using adults being more digitally savvy than the relatively older and less educated demographic (Figure 2.19). Even though the com-plementarity between level of education and digital skills has to be interpreted with caution, as it could be mediated by the differences in the kinds of work people do (with the tertiary ed-ucated more likely to be in white-collar office environments), it also points to a potential opportunity to include digital skills as part of the formal school curriculum.
FIGURE 2.19
Younger and more educated users have higher levels of digital skills
Source: World Bank Digital Economy Household Survey, 2020
125
BEYO
ND U
NICO
RNS:
HAR
NESS
ING
DIGI
TAL
TECH
NOLO
GIES
FOR
INC
LUSI
ON I
N IN
DONE
SIA
CHAP
TER
— 02

2.5. Conclusion and Policy Implications
This chapter has analyzed the underlying drivers of the digital divide in Indonesia. The main findings of the chapter are that, while investments in backbone infra-structure in recent years have translated into a remarkable improvement in internet connectivity, a sizeable digital divide still persists, with a significant share of the adult population yet to have the basic wherewithal to connect to and benefit from the digital economy. The chapter also finds that the lingering challenges on middle and last mile connectivity are related to spectrum scarcity/allocation, limited sharing of active and passive infrastructure, and the lack of competition and regulation of the sector, which affects not just access but also cost, affordability and the quality of the internet.
In recent years, the coverage of fiber optic network and mobile broadband has expanded significantly reaching nearly all districts in Indonesia. However, fixed broad-band penetration is insufficient to meet rapidly growing demand for high-bandwidth applications. Mobile broad-band is more widely available but does not deliver the same capacity, and QoS, and is not cost-efficient enough for high bandwidth applications. While part of the chal-lenge is boosting investment in network deployment in high cost, low population density parts of the country (including those areas where reliable electricity may be an issue), the inability to secure the digital dividend band (700 MHz) with the transition from analog to digital tele-vision remains a critical bottleneck in expanding coverage and access to rural and lagging areas. Spectrum scarcity also impinges on the quality of internet services for those already connected. The chapter reports measurable dif-ferences in quality of experience, with strong evidence of mobile network congestion in the larger urban centers. This reflects not only the need for additional investment in network infrastructure but also addressing spectrum constraints. More spectrum below 1 GHz for cost-effi-cient LTE coverage in rural areas and more spectrum above 1 GHz for cost-efficient LTE capacity would help simultaneously address the challenges of broadening the internet base and enhance the quality of the internet ex-perience of those already connected.
Similarly, putting in place regulations to facilitate the shar-ing of passive and active infrastructure among market play-
ers, which accounts for as much as 80 percent of the invest-ment in fixed broadband access networks, would provide a significant boost to fixed broadband rollout. This would be critical support stable, good quality, and low latency fiber optic connections, which are crucial for high bandwidth applications such as large-scale high-quality video, online education, business applications, school use and increasing use of cloud-based solutions. These are all applications whose relevance has soared during the pandemic and is likely to remain high as Indonesia recovers and rebounds. The recently enacted Omnibus Law on Job Creation (No. 11/2020) includes a stipulation to implement passive and active infrastructure sharing.
Also, the recently enacted Omnibus Law on Job Cre-ation includes a stipulation to implement the so called “Analogue Switch-Off ”, which would be a crucial step in securing the 700MHz spectrum band. It also intro-duces reforms to optimize spectrum allocations and to allow spectrum to be allocated to its most productive use. Similarly, the newly enacted law also introduces provi-sions for infrastructure sharing. Speedy implementation of the provisions of this law needs to be supported by correct implementing regulations, and the provisions on infrastructure sharing are likely to require significant inter-agency coordination and coordination also among the various tiers of government.
Finally, in addition to hard infrastructure, the chapter has also presented some novel data on digital skills to highlight how the low level of digital literacy and skills constrain the ability of citizens who are connected from fully reaping the benefits of digital technologies in a safe, secure and productive manner. Core digital skills related to the basic operation of ICT devices, software and the in-ternet, data and information literacy, digital hygiene, etc., are low among the internet-using adult population, and highly correlated with educational attainment and overall socioeconomic status. This suggests that they represent a critical and complementary frontier on closing the digital divide and leveraging digital technologies for post-pan-demic recovery and addressing Indonesia’s medium run development challenge in an inclusive manner. Detailed policy recommendations on digital infrastructure and digital skills are presented in Chapter 5.
126
BEYO
ND U
NICO
RNS:
HAR
NESS
ING
DIGI
TAL
TECH
NOLO
GIES
FOR
INC
LUSI
ON I
N IN
DONE
SIA
CHAP
TER
— 02

37 Bisnis.com, 2019.
38 This is a decision open to the MNOs as all IMT spectrum is now technology neutral. Indonesia’s neighboring countries in Malaysia and Singapore will use the 700 MHz band for 5G services. Thailand has already launched 5G services utilizing the 700MHz spectrum band.
39 Refer to https://halberdbastion.com/technology/cellular/4g-lte/lte-frequency-bands/b8-900-mhz and https://halberdbas-tion.com/technology/cellular/4g-lte/lte-frequency-bands/b28-700-mhz
40 GSMA, 2020.
41 Vietnam.net, 2021.
42 Sharing of the utility poles of PLN is of critical importance since PLN has a passive infrastructure of utility poles and electrifi-cation is over 98 percent. This implies the utility poles of PLN have over 65 million homes passed compared to Telkom which has about 30 million homes passed on fiber optic. This gap of about 35 million homes with access to electricity but beyond reach of the fixed broadband infrastructure can potentially be closed by sharing the utility poles of PLN. PLN has also entered the telecom market.
43 Refer to Chapter 8/Annex 8B of the RCEP, available at www.dfat.gov.au/trade/agreements/not-yet-in-force/rcep/rcep-text-and-associated- documents
44 Following the approval of the Omnibus Law, Presidential Regulation No. 10 of 2021 included provisions to eliminate the tele-com sector from the negative investment list (DNI). This is likely open up the sector to a range of new industry stakeholders able to invest in the sector, including deploying the digital infrastructure needed for 5G.
45 See examples at Krueger, 2006; Hargittai and Hsieh, 2012.
46 Van Deursen et al., 2014.
47 European Union, 2014.
48 There are some obvious limitations in this approach as it relies on the self-assessment of respondents. Ideally, these skills would be measured based on the actual testing of specific competencies. But implementing such tests would be expensive for the national scale in which we attempt this exercise here.
49 Indonesia State cyber and code agency (BSSN), 2020.
50 CNN Indonesia, April 2020.
51 Kompas, 2020.
Endnotes
127
BEYO
ND U
NICO
RNS:
HAR
NESS
ING
DIGI
TAL
TECH
NOLO
GIES
FOR
INC
LUSI
ON I
N IN
DONE
SIA
CHAP
TER
— 02

References1 Australian Department of Foreign Affairs and Trade. 2020. “Regional Comprehensive Economic Partnership (RCEP)
text, Chapter 8/Annex8B”. Retrieved from https://www.dfat.gov.au/trade/agreements/not-yet-in-force/rcep/rcep-text (Accessed: 03 December 2020).
2 BSSN. 2020. “Rekap Serang Siber (Januari – April 2020)”. Jakarta, Indonesia: Badan Siber dan Sandi Negara (Indonesia State cyber and code agency) (BSSN). Retrieved from: https://bssn.go.id/rekap-serangan-siber-januari-april-2020/ (Accessed: 03 December 2020).
3 CNN Indonesia. 2020. “BSSN: Serangan Siber di RI selama Corona Naik 6 Kali Lipat”. Jakarta, Indonesia: CNN Indonesia. Retrieved from: https://www.cnnindonesia.com/teknologi/20200423160048-185-496626/bssn-serangan-siber-di-ri-selama-corona-naik-6-kali-lipat (Accessed: 03 December 2020).
4 European Union. 2014. “Measuring Digital Skills across the EU: EU wide indicators of Digital Competence”. Retrieved from: https://ec.europa.eu/digital-single-market/en/news/measuring-digital-skills-across-eu-eu-wide-indicators-digital-competence (Accessed: 03 December 2020).
5 GSMA. 2020. “Network rationalisation – lessons from 2G and 3G migrations”. Retrieved from: https://www.gsma.com/spectrum/resources/legacy-mobile-network-rationalisation/ (Accessed: 03 December 2020).
6 Halberd Bastion Radiofrequency Technologies. 2020. “4G LTE Frequency Bands”. Retrieved from: https://halberdbastion.com/technology/cellular/4g-lte/4g-lte-frequency-bands (Accessed: 03 December 2020).
7 Hargittai, Eszter, and Yuli Patrick Hsieh. 2012. “Succinct survey measures of web-use skills.” Social Science Computer Review, 30(1), pp.95-107.
8 ITU. 2020. ICT Price Basket. Retrieved from https://www.itu.int/net4/itu-d/ipb/ (Accessed: 03 December 2020).
9 Bisnis.com Jatmiko, Leo Dwi. 2019. “The Next IndiHome Luncurkan Digital Movement #WujudkanDariRumah”. Jakarta, Indonesia: Bisnis.com. Retrieved from: https://teknologi.bisnis.com/read/20190326/101/904302/the-next-indihome-luncurkan-digital-movement-wujudkandarirumah (Accessed: 03 December 2020).
10 Krueger, Brian S., 2006. “A comparison of conventional and Internet political mobilization”. American Politics Research, 34(6), pp.759-776.
11 Prabowo, Dani. 2020. “Data Pasien Covid-19, Dirahasiakan Pemerintah, Diduga Dijual Hacker...” Jakarta, Indonesia: Kompas.com. Retrieved from: https://nasional.kompas.com/read/2020/06/22/13191301/data-pasien-covid-19-dirahasiakan-pemerintah-diduga-dijual-hacker?page=all (Accessed: 03 December 2020).
12 Se, Chia. 2021. “No new 2G, 3G phones in Vietnam from July 1”. Vietnam.net. Retrieved from: https://vietnamnet.vn/en/sci-tech-environment/no-new-2g-3g-phones-in-vietnam-from-july-1-708163.html (Accessed: 03 December 2020).
13 The Economist Inteligence Unit. 2020. The Inclusive Internet Index. London, United Kingdom: The Economist.
14 UNESCO. 2018. “A Global Framework of Reference on Digital Literacy Skills for Indicators”. Retrieved from: http://uis.unesco.org/sites/default/files/documents/ip51-global-framework-reference-digital-literacy-skills-2018-en.pdf (Accessed: 03 December 2020).
15 van Deursen, Alexander J.A.M., Helsper, Ellen and Eynon, Rebecca. 2014. “Measuring digital skills: from digital skills to tangible outcomes”. Oxford, UK: Oxford Internet Institute, University of Oxford.
16 World Bank Group. 2018. Innovative Business Models for Expanding Fiber-Optic Networks and Closing the Access Gaps. World Bank, Washington, DC
128
BEYO
ND U
NICO
RNS:
HAR
NESS
ING
DIGI
TAL
TECH
NOLO
GIES
FOR
INC
LUSI
ON I
N IN
DONE
SIA
CHAP
TER
— 02

COUNTRYPOPULATION
(M)
TOTAL IMT SPECTRUM ESTIMATE
MHz/ MILLION
POPULATION COMMENTS AND PLANNED IMT SPECTRUM RELEASES
India 1380 690 0.50March 2021 spectrum offered additional spectrum but not taken up due to high reserve prices. Only 37 percent of spectrum offered at the auction sold
China 1439.3 1237 0.86 Allocated 700, 2600, 3500 and 4800 MHz in late 2018 for 5G. Planning future release of mmWave spectrum.
Pakistan 220.9 256 1.16 World Bank project on 5G Readiness including spectrum roadmap. Auction of vacant 1800/2100 MHz in 2021.
Indonesia 273.5 467 1.71 Legislation to make 700 MHz available has passed Parliament. Negotiations to clear 2.6 and 3.5 GHz bands.
Bangladesh 164.7 453 2.75 Plans to allocate spectrum in 3.5 GHz and vacant spectrum in 2.3 and 2.6 GHz bands to support 5G in 2021
DR Congo 89.5 250 2.79 Not known
Brazil 212.6 670 3.15 Spectrum auction for 3.5 GHz band scheduled for June 2021. The 2.3, 3.5 GHz and mmWave bands are to be made available.
Ethiopia 114.9 370 3.22 Liberalisation of telecoms market with 2 new operators delayed due to COVID-19. Now scheduled for 2021
Vietnam 97.3 340 3.49 Significant delays in releasing the 700, 2300 and 2600 MHz bands which are vacant and ready for use.
Nigeria 206.1 820 3.98 5G consultancy for the NCC recommends the release of additional IMT spectrum to support deployment.
Egypt 102.3 590 4.59 2.6 GHz band was auctioned in November 2020. Plans exist for the future release of 3.5 GHz band for 5G.
Russia 145.9 720 4.93mmWave auction was postponed in 2020 – but 400 MHz allocated as shared spectrum. 3.5 GHz is not available but 4.8 GHz band will be available for 5G.
Iran 83.9 420 5.01 Currently preparing to auction 3.5 GHz band for 5G.
Mexico 128.9 800 6.21An auction of 800MHz, 1.9GHz, 2.5GHz and AWS-3 bands is planned for September 2021. While 600 MHz (70 MHz) and 3.5 GHz (150 MHz) are available for 5G.
Turkey 84.3 570 6.76 Undertaking 5G tests in the 3.5 GHz and mmWave bands.
USA 331.0 2780 8.40After previously auctioning 600 MHz, mmWave etc, a successful auction for 3.5 GHz band was held in January 2021. Further spectrum releases are planned
Philippines 109.5 985 9.00 Third operator commenced March 2021. Plans for future IMT spectrum reforms with World Bank support
Germany 83.7 1000 11.95 A successful 5G spectrum auction of 420 MHz (2.0 and 3.5 GHz bands) was held in June 2019.
UK 67.8 1090 16.08 Successful spectrum auction for 700 MHz and 3.6 GHz bands for 5G took place in March 2021.
France 65.2 1100 16.87 Successful 3.5 GHz reserved allocation and spectrum auction undertaken in October 2020
Japan 126.4 2800 22.15 Has already assigned 5G spectrum via way of a beauty contest in 2019
Italy 60.4 2000 33.11 Auctioned 5G spectrum bands in 2018
Thailand 69.8 3400 48.71 Successful 700, 2600 MHz and mmWave auctions in February 2020.
Annex.ANNEX 2.A
Indonesia in an International Comparison of Total IMT Spectrum Allocations
129
BEYO
ND U
NICO
RNS:
HAR
NESS
ING
DIGI
TAL
TECH
NOLO
GIES
FOR
INC
LUSI
ON I
N IN
DONE
SIA
CHAP
TER
— 02

Spotlight 2.Key Findings from a MacroeconomicTake on Indonesia’s Digital Economy
To assess the macroeconomics of the digital economy in Indonesia, a definition is first required. Consistent with international approaches52, we focus our analysis on the ‘core’ of the digital economy, the digital sector, which includes: production of ICT consumer goods such as computer hardware; the design, production, market-ing of packaged and customized ICT software; digital infrastructure, including 3G and 4G internet and other telecommunications; and ICT services including consult-ing and training. Next, given their relative importance in Indonesia and the availability of data, we look at two components of the ‘digitalizing’ economy: digital media and e-commerce. The macroeconomic impact of other aspects of the digitalizing economy, including industry 4.0 and precision agriculture are outside the scope of our analysis.
The contribution of the digital sector to the supply-side of the economy is estimated using input-output data. This analysis, which is underpinned by a growth-ac-counting framework approach, looks at the ‘producers’ of digital economy goods and services. On average, we find that the digital sector in Indonesia is slightly smaller than that of advanced countries in the EU. Depending on the input-output data source used and its breadth of coverage53, we estimate the production side of the digital sector’s value-added was approximately in the range of 2.6-3.5 percent of GDP from 1998-2015. These Indo-nesia estimates are about 1 percentage point lower than for the EU average. Compared to middle-income peers, Indonesia’s ratio of digital sector value-added to GDP is approximately three fifths of the same ratio in China and India in 2014, and comparable to Brazil’s ratio54. Kenya, hosting one of the largest ICT sectors in Sub-Saharan Africa, provides another interesting case: value-added of ICT services including telecommunications reached 3.4 percent of GDP in 2013 (World Bank, 2015).
The digital sector’s contribution to value-added has been shaped by the contribution of ICT manufacturing. While the intensity of telecommunications (share of value-add-ed to GDP) has remained largely flat from 1974-2015, a rise in the intensity of ICT manufacturing in the 1990s was the main driver in the increase in the value-added of
the digital sector as a whole for that decade. Since 2008, however, ICT manufacturing has seen a declining or flat performance, dragging on the performance of the digital sector at large. As a result, Indonesia’s ICT manufacturing is smaller than in many Asian peers, particularly in China, Japan, and Korea.
The contributions to value-added from digital media and e-commerce are found to be smaller than that of the dig-ital sector but are growing over time. Using input-output data, value-added from digital media is estimated to have added in the range of 0.3-0.7 percent of GDP from 2000-2015. Using a blend of firm-level survey-data, consumer survey data, and input-output data55, value-added from e-commerce is estimated to have added somewhere in the range of 0.3-0.5 percent of GDP in 2015, rising to 1.0-1.8 percent in 2019. This steady growth is projected to continue over the medium-term with the rapid expansion of e-commerce during and post the Covid-19 pandemic.
Looking at the demand-side, Indonesia has made im-pressive progress on digital adoption. At the turn of the 21st century, ICT represented less than 1 percent of the value of intermediate inputs of Indonesian businesses on average, approximately a seventh of that of India, South Korea, and Japan, and even lower compared to China and Taiwan. While the digital economy’s production side re-mained flat as a share of GDP, Indonesia’s digitalization on the use-side grew seven folds from 2000-2010, reach-ing 7 percent of the value of total intermediate inputs. This share was higher than that of India, Japan, and Korea, at part with China, but still lower than Taiwan. However, progress has recently stalled, with Indonesia’s share de-clining in 2011, 2012, and 2014.
Indonesia’s strong digital adoption relative to peers is driven by a few unique factors. In contrast to Asian peers, Indonesia’s digitalization has been driven by ICT telecommunications, with ICT manufacturing playing a relatively much smaller role. Input-output data shows that large investments in telecommunications were made in Indonesia at a later stage than in Asian countries like India, Japan, and Korea, hence driving up Indonesia’s dig-ital sector contribution. Other factors, including a higher
130
BEYO
ND U
NICO
RNS:
HAR
NESS
ING
DIGI
TAL
TECH
NOLO
GIES
FOR
INC
LUSI
ON I
N IN
DONE
SIA
CHAP
TER
— 02

share of ICT imports in Indonesia, likely also drove up the digital sector’s share of total intermediate inputs56.
Economy-wide productivity-gains from digital adoption have been lower in Indonesia than in peer countries, due to both the characteristics of Indonesia’s digitalization journey to-date and its concentration in a narrow set of sectors and provinces. Input-output analysis shows that investment in telecommunications is typically associated with lower output growth effects than investment in ICT manufacturing or computer services. Thus, Indonesia’s relatively higher share of telecommunications has result-ed in lower economy-wide output gains from the digital sector. Moreover, adoption of ICT telecommunications (and the even lower adoption of ICT manufacturing and of computer services) has been heavily concentrated within a small number of ‘digital leaders’ at the sector level. Here, there is clear evidence of a persistent de-marcation between digital leaders and laggards, with Information and Communications, Finance, and Profes-sional Services, typically representing the leading digital adopters. Indonesia’s digital economy similarly reflects a great degree of concentration geographically. At the top, ICT-use in DKI-Jakarta, Riau, D.I. Yogyakarta, East Kalimantan, and Banten, has been consistently higher than in other provinces. Firm-level evidence is similarly striking. Data from The Statik Industri surveys reveal that just 1.2 percent of manufacturing firms in the sam-ple engage in ICT manufacturing from the supply-side, and only 1.3 percent of manufacturing firms use ICT inputs in their production processes. These digitalized
firms remain concentrated in West Java and Riau islands, as measured both in terms of number of firms and the share of total ICT output.
Econometric analysis finds strong cross-country evidence of the productivity gains from the digital economy, but our Indonesian findings are more equivocal. There is some evidence that phone ownership at the household level is positively linked to GDP, GDP per capita, and GDP per worker, but no statistically significant relationships for other measures of digital economy adoption, including teledensity (percent of PTSN-owning households), share of internet users, and share of computer users. At the firm level, ICT manufacturing firms perform more strongly than non-ICT manufacturing firms, recording substan-tially larger output, value-added, value-added-per-work-er, and wages. However, ICT firms are also much more likely to be foreign-owned and/or attract foreign invest-ment. Once a set of firm characteristics are controlled for – in particular, the link with foreign ownership and investment – ICT firms are no longer robustly associated with improved economic performance. Unfortunately, the limited availability of data (including small number of ICT firms) precludes applying an experimental de-sign to derive causal findings and makes it challenging to statistically isolate the productivity impacts of foreign knowhow and investment from the productivity impacts of digital technology. These data limitations do not imply that digitalization has not benefited the early adopters, only that more research is needed with a larger sample of firms to isolate the magnitude of potential impact.
131
BEYO
ND U
NICO
RNS:
HAR
NESS
ING
DIGI
TAL
TECH
NOLO
GIES
FOR
INC
LUSI
ON I
N IN
DONE
SIA
CHAP
TER
— 02

Analysis of top-performing e-commerce firms provides sim-ilarly mixed evidence of the impact of digitalization on pro-ductivity. Data from a recent World Bank-led survey of e-com-merce merchants that sold some of the most popular products in 2016-18 is used to compare performance of e-commerce firms against those firms surveyed in the World Bank Enter-prise Survey (WBES) of 2015. On the one hand, the results show that the group of high-performing e-commerce firms enjoyed higher profit-to-sales ratios than the average WBES firm and had higher export share of sales, despite being young-er on average. There is evidence of a declining labor-cost share of total-costs, and of growing productivity, as measured by val-ue-added-per-worker. Older firm groups are more productive over time, and on average are more productive compared to younger firms. However, other findings from the survey call for a more nuanced understanding of the role e-commerce was playing in the Indonesian economy prior to the Covid-19 crisis. The median value-added-per work estimated in the e-com-merce sample in 2018 is lower than the median for the WBES firm in 2015. E-commerce sales, profits, and employment in the survey were all highly concentrated in a small number of medium-sized firms that are mostly found in DKI Jakarta. These firms are older, have higher sales and profit growth, and combine high sales both online and offline, illustrating that a sharp dichotomy between online and offline commerce does not exist at the top. Indeed, the analysis finds that being fully digitalized, defined as only buying inputs and only selling out-puts online, is associated with lower levels of sales and profits, while being larger (by employee size) and being older (years since first established), is associated with a greater likelihood to innovate, greater reliance on digital payments, a greater
likelihood of selling both online and offline, and higher total sales and profits.
Reviving the role of ICT manufacturing in the production-side, expanding digitalization across a broader set of sectors from the use-side, and investing in expanded national statistics emerge as some of the main implications of this research. The growth in digital media and e-commerce, accelerated by the Covid-19 pandemic, will add to the size of the broader digital economy in Indonesia. But if the GOI seeks to enhance pro-ductivity and output growth from the supply-side, historical Indonesian and cross-country experience to-date suggests that ICT manufacturing within the core digital sector can play a significant role. From the use-side, accelerating digital adoption within a broader set of sectors, a larger number of firms, and across a wider geographic reach than West Java and Riau Islands, is critical for carrying Indonesia’s digital journey forward. The current Covid-19 crisis represents a unique op-portunity in this respect, helping to illustrate the potential gains from digital adoption in sectors such as education and health that have previously been reluctant to adopt technology. Finally, upgrading Indonesia’s national statistics is critical to better monitoring and evaluating the size and contribution of the digital sector and the broader digitalizing economy. Here, Indonesia can benefit from a range of international, regional, and national efforts that are focused on this agenda.57
This spotlight draws on: Al-Rikabi, Jaffar, Ibrahim Khalil Rohman, and Sean Hambali, “The Digital Economy in Indonesia: A Macro-economic Perspective.” The World Bank (forthcoming, 2021).
132
BEYO
ND U
NICO
RNS:
HAR
NESS
ING
DIGI
TAL
TECH
NOLO
GIES
FOR
INC
LUSI
ON I
N IN
DONE
SIA
CHAP
TER
— 02

52 The European Commission, the US Bureau of Eco-nomic Analysis, and the OECD estimate the ‘size’ of the digital economy through a focus on the digital sec-tor, which is also referred to as ‘the ICT-sector’, ‘digi-tally-enabled infrastructure’, and other similar termi-nology. These definitions are supported by academic research, for example by Bukht and Heeks (2017).
53 Our analysis uses three sources of input-output data for Indonesia: official statistics produced by the na-tional statistics office, BPS; World Input-Output Data 2016; and EORA input output data produced by Len-zen, Kanemoto, Moran and Geschke (2012, 2013). Each of these three data sources bring different advan-tages and disadvantages. For example, official statistics have a long coverage (1971 to 2010) and include data on the digital sector and digital media, but the tables pro-duced are not consistent across years, making analysis of historical trends difficult.
54 We present the size of the digital sector of China, India, and Brazil based on the EC’s PREDICT database using the operational definition which is comparable to the definition we use for our Indonesia estimate. In 2015, the average share of the digital sectors value-added in each of these countries was 4.8%, 5.3%, and 2.8%, re-spectively.
55 Estimated of the output of e-commerce were tak-en from market data estimates provided by Statista, E-Marketer, and Google-Temasek. Estimates of the value-added of e-commerce firms are drawn from the World Bank 2019 e-commerce survey and cov-er 2016-2018 data. Given the survey sample design, which focused on e-commerce firms selling the most popular products on some of the largest Indonesian e-commerce platforms, this value-added estimate was taken to represent a ‘high’ scenario of the ratio of val-ue-added to output of the sector as a whole. Alterna-tive ‘low’ and ‘medium’ scenarios were estimated using input-output data on sectors relevant to e-commerce. The average range of value-added estimates included draws on these low, medium, and high scenarios, and represents an imperfect approximation of the sector’s contribution that nevertheless provides a useful start-ing point to understanding the size of e-commerce within the Indonesian economy as a whole.
56 Given Indonesia has one of the highest logistics costs in the region, importing a higher share of ICT intermedi-ate inputs than peers may have resulted in higher costs, driving up the share of ICT to intermediate inputs. Limits to current national account statistics may also be playing a role in these figures. For example, while physical investments in the core digital sector goods such as telecommunications are well-captured by sta-tistical agencies, other aspects of the digital economy including ICT intangibles are difficult to measure and so fall foul of ‘noise’ in the statistics. Since Indonesia’s digitalization journey has thus far had a higher share of telecommunications than peers, the mismeasurement problem arguably effects it less than in those other countries.
57 For example, in close collaboration with the OECD and other organizations, the G20 has produced a Toolkit for Measuring the Digital Economy, which outlines a measurement agenda for the digital economy, high-lights statistical gaps, and suggests actions for im-provement. At the regional level, notable initiatives in-clude the EU’s digital scoreboard, the Digital Economy and Society Index, and the Monitoring Framework for the Digital Economy and Society, and in Latin America and the Caribbean, The CAF Digital Ecosystem Obser-vatory.
Endnotes
133
BEYO
ND U
NICO
RNS:
HAR
NESS
ING
DIGI
TAL
TECH
NOLO
GIES
FOR
INC
LUSI
ON I
N IN
DONE
SIA
CHAP
TER
— 02

Chapter ⬎
3134
BEYO
ND U
NICO
RNS:
HAR
NESS
ING
DIGI
TAL
TECH
NOLO
GIES
FOR
INC
LUSI
ON I
N IN
DONE
SIA
CHAP
TER
— 03

n Chapter 1 we saw how some applications of digital technol-ogies, particularly e-commerce and digital ride-hailing services, are already beginning to gener-ate notable consumer surpluses in Indonesia. A key question of interest is whether and how the applications of these technolo-gies are changing labor markets
and bolstering income-earning opportunities. This can be at the extensive margin by creating more jobs, and at the intensive margin by enhancing the returns to labor in the form of higher wages and salaries. Of particular interest is how these opportu-nities may differ for different segments of the population and how these forces may be compounding inequalities. We also already saw in Chapter 1 how, at the aggregate level, greater internet penetration is beginning to widen the skill premia, by rewarding higher educated workers while leaving behind workers who are less well educated. This chapter delves more deeply into the topic to examine the underlying drivers of this phenomenon, and examine the existing and future barriers that will need to be overcome to enable the adoption of digital technologies to bring about economic transformation that is truly inclusive.
The potential clearly exists. Digital technologies can make business processes more efficient, and can boost the produc-tivity of firms and the workers that work in these firms. Digital technology applications such as e-commerce can, in principle, also increase the productivity of household enterprises, which account for a lion’s share of overall employment in Indonesia and are crucial new frontiers in expanding the middle class. In more urban areas, digital technologies can also help create more flexible forms of work that can activate vulnerable and traditionally excluded workers such as women and youth. More
generally digital technologies can lower the cost of informa-tion and coordination, allowing firms and sectors to naturally extend the boundaries of the workplace, which is especially common in sectors that create intellectual capital such as cre-ative industries.58
A recent World Bank study in China shows that e-commerce has boosted income-earning opportunities for traditional-ly excluded workers such as youth, the semi-skilled, women and the disabled. Imagine a homemaker selling pisang goreng madu (honey-coated friend banana) out of a small kiosk in one of Jakarta’s peripheries and reaching markets that she never imagined through one of the food delivery platforms. Or a cluster of poor women weaving traditional bamboo baskets in Indonesia’s eastern island of Flores who successfully brand their products and sell them online at scale in Jakarta with the help of a social enterprise. Think of a low-skilled migrant who manages to use just his motorbike to gain a crucial foothold in the urban labor market as a driver for one of Indonesia’s on-de-mand ride-hailing companies. Or a young family in Ubud who succeeds in maintaining year-long occupancy in their apart-ment through digital applications such as Airbnb. These are precisely also the kinds of micro-scale transformations ev-eryone, including policy makers in Indonesia, often have in mind when thinking about the role of digital technologies in fostering greater inclusion.
This chapter looks at this landscape in depth, starting first by examining the level of adoption of digital technologies by different types of firms, then homing in on two specific appli-cations (e-commerce and gig jobs). This is followed by some evidence and reflections on the winner-takes-all characteristic of digital marketplaces and the implication that this may have for the realization of the promise of digital technologies, espe-cially in the low-skilled segments of the population. The final section summarizes and concludes with reflections on policies.
3.1. Introduction
Leveraging Digital Technologies for Better Jobs and Economic Opportunities
I
135
BEYO
ND U
NICO
RNS:
HAR
NESS
ING
DIGI
TAL
TECH
NOLO
GIES
FOR
INC
LUSI
ON I
N IN
DONE
SIA
CHAP
TER
— 03

→ The pandemic has accelerated the adoption of digital technologies, though from a negligible base for small and micro firms59
The need to ensure business continuity during the period of limited mobility during the COVID-19 crisis forced many Indonesian firms to initiate and intensify their digital trans-formation. A survey conducted by the World Bank in June 2020 showed that only 36 percent of firms had managed to remain continuously open since March 2020. The same survey also showed that only about 40 percent of firms had temporarily closed but had reopened by June 2020, while roughly one in five firms had closed and continued to remain temporarily closed. Of the 46 percent of firms that reported having to make some adjustments in their business pro-cesses to either remain open or to reopen after a hiatus, 42 percent reported that adoption of the internet, social media, specialized apps or digital platforms had been their main coping strategy (Figure 3.1).
The uptake of digital technologies was found to be higher among larger firms (90 percent), but also not entirely negligible for small to medium (58 percent) and micro firms (32 per-cent) (Figure 3.2 Figure 3.1).60 The same survey conducted in October 2020 shows that micro firms had begun to catch up with larger firms on digital adoption.61 The share of micro firms that used, started to use, or increased the use of internet, social media, specialized apps, or digital platforms increased by 25 percentage points (pp), compared with 21 pp for small and medium firms, and 16 pp for large firms. How-ever, across both rounds of the survey, firms in low value-added services generally had a lower level of adoption relative to firms in higher val-ue-added services and in manufacturing.
3.2. Digital Adoption by Firms
FIGURE 3.1
FIGURE 3.2
Share of firms adjusting their business process due to COVID-19, by type of adjustments
Share of firms that reported adjusting in response to COVID-19
Source: World Bank Survey.
Source: World Bank Survey.
LEGEND
136
BEYO
ND U
NICO
RNS:
HAR
NESS
ING
DIGI
TAL
TECH
NOLO
GIES
FOR
INC
LUSI
ON I
N IN
DONE
SIA
CHAP
TER
— 03

FIGURE 3.3
Internet use by non-agricultural enterprises is still very low, with much higher incidence among medium and large enterprises
LEFT AXIS SHARE OF NON-AGRICULTURAL ENTERPRISES THAT USE THE INTERNET, BY SIZE
RIGHT AXIS THE SHARE OF ENTERPRISES OUT OF TOTAL NUMBER OF ENTERPRISES (DOT)
Source: Economic Census 2016, WB staff calculations.
Part of this is likely to be driven simply by working from home arrangements. Workers in larger and more formal firms with a more conducive enabling environment (e.g., access to internet, digital knowhow) would have certainly been better positioned to take advantage of these oppor-tunities. However, evidence suggests that, among the firms that intensified their digital footprints during the pandem-ic, many also used these technologies directly in marketing (82 percent), sales (75 percent), business administration (51 percent), payments (42 percent), supply chain manage-ment (33 percent) and other core business functions. Just on sales, for example, digital merchants with both an online and offline presence significantly intensified their online activities during the height of the pandemic.62 Industry estimates suggest that e-commerce volumes soared by as much as a factor of 2.1 during the pandemic and are expect-ed to settle at around 1.7 times of pre-pandemic levels. 63 This rising of demand can naturally be expected to draw more suppliers into the digital ecosystem.
However, any increase in digital adoption that the pan-demic brings will be from a very low base, especially for micro and small enterprises. Though somewhat dated now, the economic census from 2016 revealed that only 5 per-
cent of all Indonesian non-agricultural enterprises used internet, with significant heterogeneity by firm size. Larg-er establishments were significantly more likely to have adopted the internet (67 percent) to buy and sell, as well as to conduct other activities over the internet, while the adoption rate among micro-enterprises was significantly lower (4 percent). (Figure 3.3) More recent data suggest that internet adoption, especially by household enterpris-es, could have increased to about 11.1 percent in 2018 and 12.8 percent in 2020.64 However, even among household enterprises, the richer ones exhibit a much higher level of adoption relative to the poorest ones (Figure 3.4).
What determines technology adoption by firms? And how do these drivers vary across firms of different type? These questions are relevant for policy, especially when we think about the aggregate productivity benefits that these technologies might bring. Findings from a recent survey show that, among household enterprises that have access to ICT devices to connect to the internet, a lack of aware-ness about the perceived benefits from using the internet and a lack of digital skills are the most prominent reasons for not actually doing so.65 This is true also for more spe-cific forms of digital technologies such as e-commerce, as
FIGURE 3.4
Internet adoption is far higher among richer household enterprises
SHARE OF HOUSEHOLDS WITH ENTERPRISES WHO USE THE INTERNET FOR THEIR BUSINESS OPERATIONS, BY INCOME STATUS
Source: World Bank Digital Economy Household Survey, 2020
137
BEYO
ND U
NICO
RNS:
HAR
NESS
ING
DIGI
TAL
TECH
NOLO
GIES
FOR
INC
LUSI
ON I
N IN
DONE
SIA
CHAP
TER
— 03

discussed later in the chapter. The constraints faced by medium and large firms on the other hand may be entirely different, and could relate to, for example, the dynamism of the innovation ecosystem, management practices, the availability of talent and skills in local markets, and the broader business environment in which these firms may be embedded.66 A careful assessment of these is left for future work to tackle, but a macro-level analysis conduct-ed for this report shows that aggregate productivity gains from digitalizing have been fairly limited in Indonesia due to particular aspects of the country’s digitalization jour-ney, including its concentration within a narrow set of sec-tors (see Spotlight 2 for key findings from this analysis).
But, on the whole, the low level of internet adoption by enterprises, especially the micro and small enterprises, also translates into low adoption among workers. This is especially true given the fact that these micro and small enterprises jointly account for almost 75.3 percent of In-donesia’s non-agricultural employment. In 2019, only 27.2 percent of all workers reported using internet at their work. This was the highest among tertiary educat-ed workers (78.1 percent), followed by much lower use among workers with just lower secondary education (17.7 percent).67 Thus, on the one hand, the overall level of internet adoption among workers and firms is low. On the other hand, there are sharp heterogeneities in adop-tion among different types of workers and firms, with
the higher-skilled workers and larger and more formal establishments having greater adoption rates.
Overall, this observed pattern of digital technology adop-tion by firms is one of the key reasons behind the stylized fact noted in Chapter 1 that higher-skilled workers are perhaps benefiting more relative to workers with low-er-level skills. As such, this pattern of diffusion of digital technologies in Indonesia could potentially be contribut-ing to an increase in overall inequality. This also reinforces the messages underscored in Chapter 2 on the need to address the critical challenges in making affordable and reliable internet available to all Indonesians. But it also raises important questions on the barriers to broader application and utilization of these technologies in pro-ductive endeavors. Technologies such as e-commerce, digital financial services, and the portfolio of other ser-vices (ride-hailing, food delivery, etc.) offered by plat-forms such as Go-Jek and Grab, do not require advanced reading and numeracy, as well as high-order cognitive skills. As such, these low-skill-biased worker-enhancing technologies should be amenable to greater adoption by market-size-constrained micro and small enterprises and less-skilled workers everywhere in the country. What constrains these enterprises and workers from adopting and benefiting from these technologies? The rest of the chapter examines the specific case of e-commerce and gig jobs in Indonesia.
Placeholder for Photo or Pull quote
138
BEYO
ND U
NICO
RNS:
HAR
NESS
ING
DIGI
TAL
TECH
NOLO
GIES
FOR
INC
LUSI
ON I
N IN
DONE
SIA
CHAP
TER
— 03

As we saw in Chapter 1, some welfare benefits from e-com-merce are already starting to be realized, primarily through the consumption channel. Consumption baskets have expanded with heterogeneous product varieties made available by e-com-merce and, not only are consumers who buy online directly able to avail themselves of better prices relative to their offline options, but greater e-commerce intensity is also beginning to affect price growth of more intensively traded commodities differentially. Ideally, the next step would be to examine the extent to which this new digital economy also enhances welfare through the income channel. But as we also saw in Chapter 1, not only is e-commerce intensity higher in more prosperous parts of the country, but both buying and selling are also more prevalent among the relatively better-off segments of the in-come distribution. Careful direct identification of the impact of e-commerce on household income and consumption would require parsing out the confounding effect of higher incomes driving e-commerce growth.
Instead of following this direct route, here we present a de-scriptive analysis of some of the more salient aspects of e-com-merce in Indonesia to highlight some suggestive evidence of how it could be benefiting different types of workers. In addi-tion, we also identify the key barriers to growth of e-commerce across Indonesia, and adoption by micro and small enterprises.
→ E-selling is much more commonly done through social media and chat applications than e-marketplaces, providing a useful source of supplemental income, especially for women and youth, and a useful pathway for women re-entering the labor market
In 2019, around 13.2 million out of a total of around 127 million employed workers (10.4 percent) in Indonesia were engaged in e-commerce activities as either their primary or secondary job.68 In terms of contributions to overall employment, this number is higher than in China, where e-commerce accounts for 5 per-cent of total employment.69 A peculiar aspect of e-commerce in Indonesia is the dominance of social media and chat apps in the
e-commerce landscape. Among those engaged in e-commerce, about 71 percent reported selling exclusively via social media and chat messaging apps, 3 percent sell via platform only, while 26 percent use a blend of the two.70 This means that e-commerce in Indonesia remains dominated by consumer-to-consumer (or C2C in industry parlance) business, which makes it more similar to TaoBao Marketplace, as opposed to the business-to-business (B2B) ecosystem similar to Alibaba or even the business-to-con-sumer (B2C) one as TMall. These C2C digital merchants are generally regarded as more casual market participants compared with the B2C or B2B ones. They also operate at a smaller scale and potentially also at a lower level of productivity.
Although Indonesian men are almost twice as likely to use inter-net at work, internet-using women are slightly more likely than men to be engaged in e-commerce activities. Among women who use internet at work in their primary jobs, 37.8 percent of them are active online sellers (as opposed to 34.8 percent of men) (Table 3.1). E-commerce is more common as a secondary job, suggesting that it plays a useful role in supplementing family income, especially by women and youth. E-commerce incidence is higher when it is a secondary job (50.4 percent), rather than when it is the main one (35.8 percent), especially for women (57.7 vs. 46.8 percent for men in the secondary job) and youth below age 25 (58.6 vs. 49.5 percent for those above 25 in the second-ary job) (Table 3.1). Interestingly, e-commerce engagement in social media is higher for the part-time/underemployed, while e-commerce engagement in platforms is higher for the full-time, confirming the fact that perhaps the more serious sellers prefer to operate through platforms. In a recent survey, 65 percent of merchants selling exclusively through social media cited its ease of use as the main attraction. In the same survey, limited understanding of digital marketing strategies and reservations regarding regulatory compliance71 were cited as the main reasons for not joining the e-marketplaces by 39 and 33 percent of social media sellers, respectively.72
The female labor force participation rate in Indonesia has re-mained persistently low, hovering at around 50 percent for the past three decades. It has also been identified as one of the key challenges to meeting Indonesia’s development aspirations of becoming a high-income country.73 By expanding opportunities for women in the labor market, e-commerce could be helping Indonesia at least partially address this challenge. Evidence sug-gests that, among all women, e-commerce engagement (selling)
3.3. E-Commerce in Indonesia: Patterns, Growth and the Barriers to Adoption
139
BEYO
ND U
NICO
RNS:
HAR
NESS
ING
DIGI
TAL
TECH
NOLO
GIES
FOR
INC
LUSI
ON I
N IN
DONE
SIA
CHAP
TER
— 03

TABLE 3.1
E-commerce activity rate is higher when a job is a secondary rather than a main job, especially among women
Source: SAKERNAS, August 2019, World Bank staff calculations. Note: Samples are workers who use internet in their current respective job.
MAIN JOB SECONDARY JOB
N SELLING VIA PLATFORM
ONLY
SELLING VIA SOCIAL MEDIA ONLY
SELLING VIA BOTH
N SELLING VIA PLATFORM
ONLY
SELLING VIA SOCIAL MEDIA ONLY
SELLING VIABOTH
All Sample 34,113,645 1.2% 25.4% 9.3% 3,167,860 1.6% 37.5% 11.4%
GENDER
Female 12,562,412 1% 27.2% 9.6% 1,057,224 0.8% 43.4% 13.5%
Male 21,551,233 1.3% 24.4% 9.1% 2,110,636 2% 34.5% 10.3%
AGE GROUP
15-24 years old 5,914,634 1.2% 25.2% 11.6% 349,548 1.4% 41.6% 15.6%
25 years old and above 28,199,011 1.1% 25.5% 8.8% 2,818,312 1.6% 37.0% 10.9%
LOCATION
Urban 25,997,782 1.3% 26.3% 10.6% 2,231,513 1.8% 39.4% 13%
Non-urban 8,115,863 0.8% 22.8% 5.1% 936,347 1.2% 32.9% 7.7%
WORKING HOURS
Less than 20 hours per week 2,941,743 0.7% 32.2% 7.4% 2,523,141 1.2% 37.6% 10.8%
20 - 40 hours per week 12,471,051 0.9% 23.4% 8.1% 609,026 2.9% 37.1% 14.1%
More than 40 hours per week 18,700,851 1.4% 25.7% 10.4% 35,693 5.6% 33.1% 8.7%
PERCENTAGE OF WORKERS WHO USE THE INTERNET AND SELL VIA SOCIAL MEDIA/PLATFORM BY MAIN/SECONDARY JOB AND BY GENDER, AGE, LOCATION
TABLE 3.2
E-commerce helps women return to work after giving birth
Source: SAKERNAS, August 2019, World Bank staff calculations. Note: Samples are workers who are not in their previous main job within the past one year and use the internet in their current respective job.
PERCENTAGE OF WORKERS WHO USE THE INTERNET AND SELL VIA SOCIAL MEDIA/PLATFORM BY REASONS OF QUITTING
REASON OF QUITTING WORK
MAIN JOB SECONDARY JOB
N SELLING VIA PLATFORM
ONLY
SELLING VIA SOCIAL MEDIA ONLY
SELLING VIA BOTH
N SELLING VIA PLATFORM
ONLY
SELLING VIA SOCIAL MEDIA ONLY
SELLING VIABOTH
WORK TERMINATION 104,062 2.9% 29.5% 5.4% 5,398 0.0% 71.7% 0.0%
BANKRUPTCY 50,579 4.1% 23.7% 6.8% 6,557 11.5% 61.4% 4.5%
UNSATISFACTORY INCOME 464,977 2.8% 29.6% 9.8% 51,286 2.8% 41.9% 12.0%
UNSETTLED WITH WORKPLACE 282,299 1.2% 30.6% 12.2% 25,029 3.6% 32.4% 9.4%
EXPIRED CONTRACT 341,104 1.5% 23.9% 11.8% 27,311 2.5% 26.7% 20.3%
UNMATCHED SKILLS 49,065 1.8% 19.8% 4.6% 2,820 0.0% 70.1% 9.2%
PREGNANCY/MATERNITY 14,160 1.3% 42.2% 14.6% 86 0.0% 0.0% 100.0%
DOMESTIC WORK 47,414 4.5% 41.2% 14.6% 4,213 0.0% 45.4% 13.1%
OTHERS 209,274 1.6% 29.9% 8.2% 23,614 3.1% 41.6% 20.5%
140
BEYO
ND U
NICO
RNS:
HAR
NESS
ING
DIGI
TAL
TECH
NOLO
GIES
FOR
INC
LUSI
ON I
N IN
DONE
SIA
CHAP
TER
— 03

is highest especially among those who are primarily engaged in housework. Moreover, e-commerce also appears to be provid-ing a viable pathway for women re-entering the labor market by providing opportunities to those who may not be in their previous jobs for a variety of reasons. About one-third of women who were not working and who experienced a job termination in 2018 attributed their labor market exit to domestic work, and a further 13 percent suggested pregnancy was the main reason.74 As such, ensuring those women with a labor market connection at some point in their lives stay engaged is a key policy entry point. About 58.1 percent of internet-using women who had to leave their previous jobs because of pregnancy/maternity or to return to domestic work were engaged in e-commerce, sug-gesting that e-commerce provides one avenue for women to stay productively engaged as they exit other forms of jobs to take on greater responsibilities at home (Table 3.2).75
→ The geographic spread of e-commerce in Indonesia is constrained largely by internet connectivity and challenges related to logistics
While e-commerce has spread to all parts of the country, it remains Java-centric to a large extent. As discussed above, the proportion of e-sellers using social media and chat messaging apps is much higher than that of digital platforms consistently across all parts of the country (Figure 3.5). Focusing specifical-ly on the size and volume of transactions that occur through digital platforms, we examine the question of what determines the evolution of e-commerce penetration and intensity in the
FIGURE 3.5
E-commerce has touched all parts of Indonesia but is still largely Java-centric
PERCENTAGE SHARE OF E-COMMERCE MERCHANTS IN THE POPULATION WHO SELL IN SOCIAL MEDIA/CHAT MESSAGING APPS AND PLATFORMS, AS THEIR MAIN JOB
A. SOCIAL MEDIA
B. PLATFORM
Source: SAKERNAS, August 2019, World Bank staff calculations
141
BEYO
ND U
NICO
RNS:
HAR
NESS
ING
DIGI
TAL
TECH
NOLO
GIES
FOR
INC
LUSI
ON I
N IN
DONE
SIA
CHAP
TER
— 03

country, over time as well as across space. We do this using data made available to the World Bank by two of Indonesia’s largest e-commerce platforms, which allow for the construction of several measures that capture both the penetration and the intensity of e-commerce, such as the number of buyers (or sellers) per capita, number of purchases (or sales) per buyer (or seller), the gross merchandise value per buyer (or seller) and the gross merchandise value per purchase (or sale).
Based on some of the stylized facts already presented in Chap-ter 1 and re-affirmed by Figure 3.5, one hypothesis is that the more populous and prosperous provinces of Indonesia are the places where e-commerce penetration and intensity are higher. A related hypothesis is whether this relationship is indepen-dent or mediated through other relevant characteristics of places such as internet access and connectivity, which would be associated with, among others, the cost of logistics to move goods, human capital, etc. In other words, is it a question of demand (which is a function of population size and average income levels), or is it a question of other factors, which could be correlated with income and population size?
Full results of this analysis are presented in Annex Tables 3A-3B76. Here we summarize just the main findings. First, e-commerce penetration is clearly positively correlated with both income and population; provinces with higher per capita consumption levels and those with larger populations have higher proportion of buyers and sellers in the population. However, when we account for other factors, such as access to the level of internet, electricity, cost of logistics, and average human capital level of the population, the role of income disap-pears. This suggests that it is not income levels per se but other digital as well as analog enablers also correlated with income that drive e-commerce penetration. Furthermore, when we look within provinces to see what explains the observed growth in e-commerce penetration, we find that level of internet access among the population and the cost of logistics play decisive roles. In other words, e-commerce penetration increased more rapidly in provinces in which internet access expanded and the cost of logistics declined over this period.
Second, the e-commerce intensity measures broadly follow the same pattern with some differences. While logistics still emerge as important for measures such as gross merchandise value (GMV) per buyer (and seller), the association with changes in internet access is less pronounced. This suggests that, while expanding internet can draw more people into e-commerce at the extensive margin, it may not have a similarly strong effect at the intensive margin. Other factors might be important in expanding the number of sellers in an area. Also, population size has a much stronger positive effect on all except one in-tensity measures (GMV per order) related to sellers, poten-tially reflecting the fact that a bulk of the demand remains concentrated in the more populous areas. Interestingly, GMV per order for both buyers and sellers is smaller in the more
populous places, suggesting that e-commerce transactions may be smaller and more frequent in places better plugged into the ecosystem where the logistics are both cost and time efficient. Consumers in less populous (contentiously, more remote) places tend to ‘bundle’ or ‘bunch’ their purchases to save travel time and delivery costs, or to order higher-value products so that the delivery costs will be small in comparison to the value of the products.
Logistics as a bottleneck for e-commerce is consistent with the broader challenges that Indonesia faces in moving goods and commodities across its far-flung geography. The availability and reliability of transport infrastructure is the first and per-haps the major impediment to a smooth logistics chain. There are considerable imbalances of land, sea and air connectivity, for example, between well-developed cities around Jakarta, Surabaya, Medan and Denpasar (Bali), and to secondary, ter-tiary and rural areas, resulting in high variability in logistics costs. A 2017 World Bank survey of manufacturers on logistics performance in Indonesia showed that companies located in Jabodetabek area (greater Jakarta) managed to receive their goods in full and in good condition, and to maintain logistics costs at around 12 percent of the costs of sales, whereas com-panies in Kalimantan incurred up 30 percent sales in logistics costs. In addition to direct logistics costs, delays in receiving or sending products are another source of indirect logistics costs for manufacturers.
All of the Indonesia’s logistics performance is hampered by bottlenecks, from the first to the last mile. In addition to weaknesses in transport infrastructure, the availability and competitiveness of logistics service providers (LSPs)77 is a key challenge, especially outside of the main economic areas. On maritime connectivity, the lack of regular inter-island mari-time routes affects timeliness of goods transit, with domestic shipping lines channeling regular calls mostly on the most lucrative shipping lanes (between the main ports) and devel-opment of roll-on roll-off shipping (RoRo), which has proven cost effective in several maritime countries, being constrained. On air connectivity, airlines usually give priority to passengers compared with goods, which reduces the likelihood of goods being delivered on time to the next destination. On land con-nectivity, the lack of temperature-controlled trucks and quality warehousing services across Indonesia prevents expansion to secondary and tertiary cities, especially for perishable goods.
More specifically on the last mile, a key challenge is also the lack of standard addresses and precise postcodes, which pre-vents implementation of productivity enhancement tools, such as automation of sorting facilities to speed up routing of goods, and utilization of route optimization software to map the most efficient route for the courier. A complex regu-latory framework on logistics services combined with uneven distribution of population across the archipelago drive these logistics challenges.
142
BEYO
ND U
NICO
RNS:
HAR
NESS
ING
DIGI
TAL
TECH
NOLO
GIES
FOR
INC
LUSI
ON I
N IN
DONE
SIA
CHAP
TER
— 03

→ Digital technologies are also beginning to disrupt the logistics business to overcome some of these challenges, but these innovative efforts are largely limited to large urban areas and their peripheries
The proliferation of C2C and B2C e-commerce in Indonesia has given birth to a new type of “consumers” of logistic services, with no expertise in logistics themselves. Many of this new type of consumers are MSMEs. E-commerce buyers and sellers are increasingly ready to pay more for quicker deliveries.78 The quicker the delivery reaches the buyer, the quicker the payment is received, and the faster the business can grow. The challenge of low cost, with fast and reliable last mile delivery, is increasing the pressures on conventional brick-and-mortar logistics compa-nies. The increasing number of small-sized, non-standard parcel shapes, the variety of pick-up and drop-off points, and the low accessibility of such points have led to higher cost per parcel. All of these have led to new logistics business models and strate-gies, with the emergence of specialized e-logistics companies, an adaptation of conventional freight-forwarding companies and express services to capture a share of the e-commerce market.
By adopting strategies such as the Uber-like model and the 4th Party Milk Run, e-logistics companies are beginning to offer low-cost, same-day and next-day delivery services within and across metropolitan cities. According to a survey under-taken by an e-logistics company, Paxel, of its own merchants,
consisting of mostly homemakers and micro enterprises, the availability of same-day delivery has helped sellers significantly increase their gross merchandise values by 30 percent, and increase their productivity and returns-on-investment by up to four times. 70 percent of Paxel customers have switched to same-day delivery. The same-day delivery between cities is also providing a boost to ready-made food shipments between major cities. The increasing availability of temperature-con-trolled transportation and storage enables sellers to expand their markets, going beyond their district to other districts in a metropolis and to other cities.
Some of these e-logistics solutions are being developed by the platforms themselves. A case in point is Mitra Bukalapak, the online-to-offline (O2O) arm of the e-marketplace Bukalapak. Mitra Bukalapak is pitched as a dedicated solution to support warung (mom-and-pop stores/eateries) and provides a suite of integrated services that includes sourcing directly from brand owners, storage, and other added-value services to support cash-flow management, including utility bill payments. A key aspect of this support to warung owners is facilitating next-day delivery, which is crucial for these small establishments operating on tight budgets and for whom one day’s revenue determines the next day’s production capacity. While the exact percentage of successful next-day deliveries is not available, Bukalapak reports that its e-logistics solutions have led to a substantial reduction of the rate of late deliveries. Not only has the evolution of e-logistics empowered MSMEs, but it has also empowered farmers (see Box 3.1). The next milestones for e-logistics companies are to continue improving their ef-ficiency, expand to same-day delivery, at the same cost across Java, and further reduce delivery time outside of the Java-Su-matra-Bali.
BOX 3.1
E-Logistics for Farmers: The Case of TaniSupply and TaniHub
TaniHub, a leading agricultural start-up, enables farmers to connect directly to buyers and supports them by providing key services such as access to finance and managing their supply chain (by managing their orders and handling their logistics). Its subsidiary, TaniSupply, handles the logistics side, collecting, storing, packing and delivering products from 30,000 small-holder farmers across Java-Bali. Tani-Supply is developing several key success factors influencing the supply chain efficiency. First is the ability to handle temperature-controlled products across the supply chain to reduce the loss from the farm to the final buyer. This
requires temperature-controlled assets covering trucks, warehouses and other temporary storage areas. This is es-pecially time-critical for fishery and livestock products. TaniHub is planning to expand beyond Java,79 but the lack of LSPs across the archipelago will lead it to open its own warehouse and sorting facilities. Second, a fast distribution of products to the consumer is needed to ensure the fresh products arrive on time and in good condition. Earlier in 2020, TaniHub Group announced an MOU with FastPOS, an e-logistics startup subsidiary of Pos Indonesia.
143
BEYO
ND U
NICO
RNS:
HAR
NESS
ING
DIGI
TAL
TECH
NOLO
GIES
FOR
INC
LUSI
ON I
N IN
DONE
SIA
CHAP
TER
— 03

Another key bottleneck in the expansion of e-commerce in Indonesia is the low level of adoption of digital financial services (DFS) among households. To begin with, financial exclusion is a major issue, with only 52 percent of households having access to a bank account (Figure 3.6). Only 43 percent of all households have a personal bank account and, while 9 per-cent in total are users of DFS (which we define here as online banking and mobile money ser-vices), 34 percent are exclusive users of offline banking services. Only one in five households in the bottom 40 percent of the socioeconomic distribution are users of DFS. Half of those in the bottom 40 percent are unbanked. Overall, only 0.5 percent of households are users of more advanced DFS products, such as credit, remit-tances, insurance, etc.80
Access to and trust in digital transactions ap-pear to be among the main reasons that Indo-nesians are hesitant to get on board with e-com-merce. Consistent with our discussion above, a sizeable share cites the hassle of return (which is related to the ease of logistics) and not having used the internet enough as the main reasons for not buying online (Figure 3.7). But not hav-ing a bank account, especially among those in the bottom 20 percent, and the lack of trust in online transactions also show up as important barriers. While trust can have multiple dimen-sions, including whether a purchased item will be delivered in good condition and whether a return will be accepted in case the customer is not satisfied, a bulk of it could also relate to having to make online payments, and often in advance of the package being received. This is certainly confirmed in the finding that over 50 percent of those who buy online still prefer to pay cash on delivery (Figure 3.8).
For more sophisticated would-be users, issues of trust could also be rooted in the understanding of risks related to data governance and privacy, cyber security and operational risk, financial in-tegrity, and several others.81 Concerns regard-ing unauthorized data disclosure by any of the several entities involved could discourage this segment from adopting DFS. And these are not
All HHs
48%
9%
34%
52%
43%
9%
0.5%
Financially excluded
Access others' account
Only have bank account
With access to account
Personally own account
DFS Users
Advanced users of DFS
Source: World Bank Digital Economy Household Survey, 2020
→ Low adoption of digital payments, which is constrained on the demand side by issues of awareness and trust, and on the supply side by regulatory hurdles, lack of appropriate infrastructure and small margins for providers, is also another important factor limiting growth of e-commerce
FIGURE 3.6
Adoption of digital financial services is extremely low
144
BEYO
ND U
NICO
RNS:
HAR
NESS
ING
DIGI
TAL
TECH
NOLO
GIES
FOR
INC
LUSI
ON I
N IN
DONE
SIA
CHAP
TER
— 03

entirely misplaced; complaints coming from financial consumers, as well as banking sector itself, on these breaches have been increasing lately. While the Financial Services Author-ity of Indonesia has been trying to develop a stronger legal and regulatory framework for this, consumers still regard the disclosure of personal ID to financial service providers as a major risk. Provision of a legal basis, such as passing the current draft of the Personal Data Protection Policy Law in the legislature, is nec-essary to promote DFS adoption in Indonesia.
In addition to the issue of trust, there is a sig-nificant knowledge and awareness deficit which, somewhat surprisingly, is almost as prevalent among the financially excluded as it is among the traditional bank account users. Roughly half of the banked, as well as unbanked, households report not fully understanding the benefits of DFS, or not knowing how to use it, or more surprisingly, especially for those already with bank accounts, never even having heard of these services. This highlights the key role for agents in helping reach the unbanked as the face-to-face personal interactions are ideally suited to overcome the trust and knowledge gaps.
There has been significant growth of agent net-works in Indonesia, with more than 4 million agents contracted under banks or e-money institution providing financial services access to the majority of population.82 The agents of Laku Pandai (LP, or branchless banking) and Layanan Keuangan Digital (LKD, or dig-ital financial services) have played a signifi-cant role in facilitating financial access to the underserved population, especially those on low incomes and/or residing in remote areas. These agents have contributed to some 27 mil-lion basic saving accounts (BSA) opening at LP agents and more than 12 million mobile money accounts registered at LKD agents, suggesting that these networks could have played a major role in expanding financial access, especially to the unbanked.
While the use of agents has indeed great po-tential in boosting furthermore the adoption of DFS in Indonesia, there are several challenges in realizing the expected outcome. The first challenge is the small profits caused by low de-mand of DFS transactions. The large expansion of agent network is not automatically accom-panied with high transaction volume. The me-dian of one agent’s transactions per day is only four in Indonesia. This is very low compared
FIGURE 3.7
Access to and trust in digital financial transactions among the main reasons for not buying online
PERCENTAGE SHARE OF HOUSEHOLD HEADS WHO DO NOT BUY ONLINE
Source: World Bank Digital Economy Household Survey, 2020.Note: Figure 3.7: Lack of trust in online transaction category can be further broken down into three categories: (i) discomfort with the concept of paying goods before receiving it; (ii) discomfort associated with handing financial information; and (iii) discomfort rising from handing any personal private information.
FIGURE 3.8
Among those who buy online, a majority still prefer cash on delivery
PERCENTAGE SHARE OF HOUSEHOLDS WHO BUY ONLINE
145
BEYO
ND U
NICO
RNS:
HAR
NESS
ING
DIGI
TAL
TECH
NOLO
GIES
FOR
INC
LUSI
ON I
N IN
DONE
SIA
CHAP
TER
— 03

FIGURE 3.9
Not having accessed DFS is associated with lack of awareness and knowledge
Source: World Bank Digital Economy Household Survey, 2020.
PERCENTAGE SHARE OF HOUSEHOLDS THAT DO NOT USE DFS
with other countries, which record a range 15 to 35 transactions per day. Low transaction volume generates low profits to agents. The median of agent’s monthly profit in Indonesia was US$15 for the Jabodetabek area and only US$5 for other rural and other urban areas. According to the same survey, Tanzania and Bangladesh had the highest median at US$70 and US$57, respectively.83 The low volume of DFS transactions in agents shows low demand for DFS. A 2016 survey highlighted that the low demand of DFS agent services was caused by a lack of awareness of the agent services and location (40 percent), difficulty of use (21 percent), and the lack of relevant use cases (18 percent).
Another challenge in expanding agent networks in Indonesia is related to infrastructure. The suboptimal infrastructure includes inadequate physical and ICT infrastructure, as well as limited in-teroperability of payment schemes. While DFS providers could have a strategic rationale to provide access to rural areas, the operational and economic challenges might deter them. Bank-led agent net-works might be interested in expanding to rural areas with a lower cost distribution and corporate social responsibility mindset, but they still require proximity to an existing branch network to be able to manage the agents. Under the current setup of the agent-bank partnership, the bank is required to directly manage its agents. Banks are still not allowed to have a third-party service to manage their agents. The non-bank e-money issuers such as e-commerce platforms would like to also have customer acquisition and eco-system expansion, but view the operational challenges, especially connectivity, as being too great for deep rural growth.
146
BEYO
ND U
NICO
RNS:
HAR
NESS
ING
DIGI
TAL
TECH
NOLO
GIES
FOR
INC
LUSI
ON I
N IN
DONE
SIA
CHAP
TER
— 03

The third challenge is the legal and regulatory frame-work that constrains the growth environment. While the current regulation has enabled new players and new approaches to offer DFS, several restrictive require-ments exist. For example, Bank Indonesia Regulation No. 20/2018 regarding Electronic Money places an ex-plicit restriction on legal individuals becoming agents of non-bank financial service providers (FSPs). Lifting this restriction could contribute significantly to the number of LKD agents, since half of the registered FSPs for LKD are non-bank. Financial Services Authority Regulation No. 10/2014 on Branchless Banking is also considered too detailed and overly restrictive for the BSA requirements, as well as agent operations. For instance, the distinction of seven different categories of agent could be simplified to avoid fragmenting the market and limiting business autonomy. Also, the provisions for BSA are too detailed (both regarding what is permitted and what is prohibit-ed), with the result that banks are left with very limited autonomy to compete effectively in offering it, and find it unattractive as a profit-making business.
Finally, the licensing and reporting requirements for LKD and LP agents are too complex and convoluted. Currently, the applicants of both LKD and LP must undergo two different and usually repeated administrative process-es. During the process, applicants were asked to provide different documentations and reports without consistent guidance from the two authorities. Moreover, there is un-certainty on the timeframes for licensing individual and legal entities. There needs to be an effort to harmonize the regulations of agents of LKD and LP, which fall under the jurisdiction of the Bank Indonesia and the Financial Services Authority (Otoriti Jasa Keuangan, OJK).
→ To harness the potential of e-commerce to boost inclusion, a greater emphasis is required on developing and implementing innovative solutions to identify and promote local products, boost the productivity of small and medium enterprises and also strengthen their ability to connect to the ecosystem
In response to the rapid development of e-commerce, the Government issued the 14th Economic Policy Package on the Road Map for the National Electronic-Based Trade System (SPNBE) or the Road Map for e-Commerce in
November 2016, which was later stipulated in Presidential Regulation No. 74/2017 on the E-Commerce Roadmap. The roadmap aimed to build a more efficient commercial institution and ecosystem in seven steps, namely: (i) sim-plifying and expanding access to finance; (ii) providing tax incentives; (iii) providing consumer protection; (iv) increasing human resource capabilities; (v) improving the national logistics system (Sislognas); (vi) accelerating the development of communication infrastructure; and (vii) improving cybersecurity. Through ecosystem de-velopment, the roadmap targeted the creation of “1,000 technopreneurs with a business valuation of US$10 billion and an e-commerce value of US$130 billion by 2020.” That objective clearly was not met but, as the analysis in this chapter so far points out, some of the pathways to grow and develop e-commerce in Indonesia identified by the roadmap, namely boosting internet connectivity, re-ducing the cost of logistics, expanding access to DFS and putting in strong consumer protection, data protection and cybersecurity laws to build trust in the ecosystem, remain just as valid.
The roadmap further highlighted more recent policy con-versations on e-commerce in Indonesia concerning prod-ucts dominated by cross-border transactions, and equal treatment of foreign and domestic actors. The Govern-ment is rightly concerned about e-commerce becoming the gateway for cheap foreign goods, flooding the domes-tic market and crowding out domestic producers. The number of inbound e-commerce consignments increased more than eight-fold from 6.1 million in 2017 to 49.7 mil-lion on 2019. Recently promulgated Minister of Finance Decree No. 199/2019, effective from January 2020, lowers the taxable threshold on inbound shipments from US$75 to just US$3 per consignment to address this issue.84 This is a an important reform that needs robust implementa-tion, as it helps to level the playing field but, as Govern-ment Regulation No. 80/2019 concerning Trade through Electronic Systems (“GR E-Commerce”) also points out, greater effort is also required in identifying and promot-ing local products, catered to the domestic as well as overseas markets. Currently, these efforts are limited to public-private joint co-branded promotion campaigns to encourage Indonesians to buy local, but more can be done by the Government, collaborating with the e-mar-ketplaces to identify and nurture clusters of productivity, and provide training, coordination and a market linkages function to enable more MSMEs to be able to produce and sell online. As China’s experience shows, while the first wave of e-commerce developed somewhat spontaneously and did so in places that were already well endowed with the digital and analog enablers, the Chinese Government played a crucial role in the subsequent phases to ensure that e-commerce expanded opportunities for producers in rural and less well-endowed parts of the country (see Spotlight 2 on China’s e-commerce experience and some lessons for Indonesia).
147
BEYO
ND U
NICO
RNS:
HAR
NESS
ING
DIGI
TAL
TECH
NOLO
GIES
FOR
INC
LUSI
ON I
N IN
DONE
SIA
CHAP
TER
— 03

After the in-depth examination the factors that constrain the ability of e-commerce to support greater inclusion, we turn next to another avenue through which digital technologies can bring about micro-transformations in the labor market. Instead of goods, we look at the pro-duction or delivery of a range of services specifically using online platforms or, as these jobs are typically known, “digital gig jobs”. The concept of “gig economy” is broadly defined as the portion of the economy accounted for by jobs with no long-term connection to a business by work-ers employed for a particular task or defined time. Gig workers are typically hired as “independent contractors”, often defined as a natural person, business, or corporation that provides goods or services to another entity under terms specified in a contract or within a verbal agreement. Unlike an employee, an independent contractor does not work regularly for an employer but works as and when demanded, during which time he or she may be subject to legal provisions. Contractors often work through a limit-ed company or franchise, which they themselves own, or may work through an umbrella company.85
As noted in Chapter 1, the ubiquitous green jackets worn by drivers of the homegrown ride-hailing decacorn Go-Jek and its regional competitor Grab are perhaps the most visible emblems of Indonesia’s digital economy. In addition to ride-hailing and delivery services, before the pandemic they provided a suite of other services such as cleaning, home repair, and massage. While the analysis of gig work in Indonesia has often tended to begin and end with the study of workers in the ecosystem of these mega-players, we zoom out and, exploiting nationally representative data that was collected for the first time in the national labor force survey in 2019, analyze this land-scape in a more general way.86 Who are the gig workers in Indonesia? How do they fare in the labor market, relative to other formal and informal workers in the country, in terms of earnings and overall job quality?
→ Internet-using gig workers in Indonesia are young, mostly male, live in urban areas, are much better educated than the
typical informal worker, and mostly in the transport, storage and communications sectors We distinguish between two types of gig workers: those who use internet for their work and those who do not. We find that internet-using gig workers are, on average, younger (35) than typical workers (41), mostly men (85 percent), and operate predominantly in urban areas (87 percent). They are also much better educated than oth-er informal workers, with 60 percent having completed upper secondary (compared with 25 percent for informal workers) and around 11 percent with some tertiary ed-ucation. Internet-using gig workers are less likely to be underemployed (20 percent) relative to other informal workers (35 percent) and the average worker of any type generally (29 percent). Only wage workers have lower rates of underemployment (14 percent). Around 68.5 percent of these workers are in the transportation, storage and communications sectors, while another 16.7 percent are in the wholesale, retail, restaurants and hotels. Finally, digital gig workers work the longest hours. On average, Indonesians work 39 hours a week. Informal workers typi-cally work a 38-hour week. In contrast, digital gig workers clock in 49 hours a week (see Annex 3.C for a detailed profile of gig workers).
→ Digital gigs in Indonesia are a stepping-stone into the labor market for many Job flexibility is among the most touted attributes of a gig job. Workers enjoy temporal flexibility, with platforms seemingly giving them full control over how to split their time between working hours and leisure.87 Uber drivers benefit significantly from real-time flexibility, earning more than twice the surplus without flexible arrange-ments.88 Uber drivers in London reported a higher level of life satisfaction than other workers, despite remaining at the lower end of the London income distribution.89 These drivers have turned to the gig economy not due to the absence of jobs in the conventional labor market. In fact, a vast majority of them were employed either full-
3.4. Jobs in the Gig Economy
148
BEYO
ND U
NICO
RNS:
HAR
NESS
ING
DIGI
TAL
TECH
NOLO
GIES
FOR
INC
LUSI
ON I
N IN
DONE
SIA
CHAP
TER
— 03

(64 percent) or part-time (23 percent) prior to partner-ing with Uber, while 80 percent of them perceived their previous job as a permanent job (until they left it, got fired or laid off ).90 This reflected their preference for flexibility and the autonomy that the platform offered. Indeed, two surveys on Grab and Gojek drivers in Indonesia show that the top reason for drivers partnering with the platform was flexibility of work.91
Besides providing flexible jobs, digital gig economy has also often been lauded for creating jobs, especially in cit-ies. In 2019, while around two-thirds of internet-using gig workers had a job before, while digital gigs were the first jobs for the remaining third. In other words, for around 33 percent of all internet-using gig workers in Indonesia (of 1.2 million workers), 69 percent of whom were in the transport and logistics sectors, their digital gigs were the first stepping-stone into the labor market. This number is very close to the findings from a 2019 study, which re-ported that 38 percent of GrabBike and 33 percent of GrabCar drivers did not earn an income before joining the platform.92 Among those gig workers who had a job/business before and left the previous job in the past one year, 80 percent joined the transport and logistics sectors. Looking more closely into the reasons for leaving their last job in order to join digital gigs, we find “unsatisfac-tory income” was the most common reason among low-er-educated workers (lower secondary school graduates or below), while “unsatisfactory working environment” and other involuntary factors such as “work termination” and “out of contract/work arrangement” were the most common reasons among higher-educated workers. This suggests that, while digital gig jobs are a fallback option for the higher educated who may be temporarily dislo-cated from their existing jobs, they are potentially a step up for the relatively lower-educated aspiring to boost incomes.
→ Digital gig workers earn more than otherwise similar informal workers, and are less likely to be supplementing incomes with a second job
Do digital gig workers end up earning more relative to other informal workers? Various studies on online ride-hailing drivers show that, on average, drivers’ in-come increased after they joined the platform.93 For ex-ample, a study on GrabBike drivers in five Indonesian cities shows that, on average, drivers experienced an 87 percent increase of their (total) income compared with their previous jobs after joining the platform, although some drivers never left their previous jobs (hence, the stated income is a combination of their old and new in-
comes). A study on Uber drivers in London found that 45 percent of them self-reportedly said that their income increased “a little” or “a lot”, while only 19 percent of them said their incomes decreased.94 A key challenge in interpreting results on income from these studies is that they do not account for the possible increase in working hours. In the case of gig workers working on digital plat-forms, collecting data on working hours of these workers is difficult because it is not possible to distinguish, for example, between a driver “waiting for consumers” and “not working” (taking a break) when she/he is shown to be active but not serving any customer.
Again, applying a multi-variate regression technique on the same labor force survey data, we find that monthly earnings for digital gig workers are 15.8 percent higher than other informal workers. This is after conditioning on location, sector of employment, age, gender, educa-tion, internet use, and hours worked. In terms of earnings per hour of reported work, digital gig workers earn 6.2 percent higher than other informal workers. As noted above, however, these workers put in longer hours than the average informal worker.
Second, are gig workers more likely to have another job to diversify their earnings portfolio or to try and supple-ment income? Many drivers on platforms such as Uber in the United States who had full- or part-time jobs prior to joining continued in those positions, which makes the flexibility of working hours more valuable.95 Uber drivers also used their earning as drivers to smooth fluctuations in their income. We find that in Indonesia, digital gig workers who are self-employed are less likely to have a secondary job compared with other informal workers. Indeed, a study on GrabBike drivers shows that only 25 percent of drivers have other secondary job(s), while the labor force survey 2019 reports that 11 percent of inter-net-using gig workers have other secondary job(s). In any case, these numbers are much lower than those of Uber driver-partners, one-third of whom had a part-time job and another one-third of whom had a full-time job, in addition to partnering with Uber.96 Finally, we also find that digital gig workers are no more or less likely than other informal workers to experience a high degree of job churning.
Overall, unlike some of the narrative around digital econ-omy jobs in more industrialized countries around the world, we see that gig jobs in Indonesia are, on average, relatively better than many informal jobs, though certain-ly not better than wage jobs. Internet-using gig workers earn relatively higher monthly income and income per hour, and they are less likely to need a second job to sup-plement their income. While these jobs are also the first jobs for many, they are available predominantly to urban men. Finally, digital gig workers also work the longest hours among all other types of workers in Indonesia.
149
BEYO
ND U
NICO
RNS:
HAR
NESS
ING
DIGI
TAL
TECH
NOLO
GIES
FOR
INC
LUSI
ON I
N IN
DONE
SIA
CHAP
TER
— 03

3.5. Three Distributional Tensions and a Look to the Future
So far, this chapter has looked at two important applica-tions of digital technologies (e-commerce and the digital gig-economy) from the lens of economic opportunities that they represent for Indonesians to improve their in-comes. The focus has been on the individual experience of the workers or e-sellers active on these platforms, how they interact with the market, what constraints they face coming on board, and what kind of gains they make once they are on board. But do gains accruing from the adoption of digital technologies to one set of actors in the economy come at the cost of losses to others? If they do, is there a need then to calibrate our views regarding these technologies? More importantly, how should policy makers respond? In this section we take a slightly broader, ecosystem-wide view and identify a few additional con-siderations that are uniquely important for the digital economy, especially from a distributional perspective.
→ Not everyone is a winnerLimiting ourselves entirely to the realm of digital plat-forms, as has been our focus throughout the chapter, we identify three potential distributional tensions: (i) online vs offline; (ii) among online market participants within the same platform; and (iii) at a higher level of aggrega-tion, more generally between workers and firms. Given its level of digitization, some of these distributional tensions may look less relevant to Indonesia now than others, but all three are important considerations for policy makers to be aware of as they shape the digital economy landscape in the coming decades.
The first distributional tension is between online and of-fline domains. As e-commerce grows and more and more people start buying through digital marketplaces, offline sellers (including the mom-and-pop stores) and the local economies they reside in could be adversely affected. A prominent example of this in the context of the United States is the disruption Amazon brought about in the brick-and-mortar book industry, driving many local booksellers out of business. Some of this could be the classic Schumpeterian creative destruction at play, with inefficient firms being displaced by more efficient digital ones but, as has been noted in the literature, Amazon’s aggressive growth strategy that sacrificed profits in favor
of market expansion, especially in its early years, caused large-scale disruptions in the market, wiping out not just the inefficient players. Consumers ended up better off, but the losses, which were often localized, did not enter the aggregate welfare calculus.
As the digital economy expands in Indonesia and plat-form affiliations generate opportunities for places and small enterprises with the digital and analog readiness to capitalize on these opportunities, this will inevitably affect offline sellers. As we show in Chapter 1, consumers are already benefiting in the form of greater convenience, a broader range of product choices and better prices. A more vibrant digital economy is likely to further enhance these benefits. But as we also show in the case of digital food delivery market, only about 22 percent of all con-sumers who order food are ‘new customers’ who are tak-ing fewer home-cooked meals. The rest are simply using deliveries to substitute for physical restaurant experienc-es. What this implies for the broader digital economy is that not all digital transactions are likely to be new de-mand resulting in the growth of the aggregate market. There is a limit to this growth and some, and perhaps a significantly larger parts, of digital transactions will be displacing existing offline ones. Indonesia has recognized this issue and has initiated some measures to level the playing field between online and offline actors. The new regulation on e-commerce takes a few concrete steps on leveling the playing field by requiring digital merchants active on platforms to be eligible for VAT. More on this is discussed in Chapter 5.
The second distributional tension is among merchants within platform ecosystems. One of the defining char-acteristics of commercial activities conducted through digital platforms is that they make an incredible amount of information available to consumers. Not only can consumers learn everything there is to learn about the product of their interest, but they can also compare pric-es offered by a multitude of other sellers offering the same product, often in the same platform. What is more, consumers can also learn about the online reputations built by these sellers in the form of rating systems, as well as written feedback provided by others who the sellers may have interacted with in the past. The availability of this type of information allows marginally superior products and marginally superior vendors to essentially
150
BEYO
ND U
NICO
RNS:
HAR
NESS
ING
DIGI
TAL
TECH
NOLO
GIES
FOR
INC
LUSI
ON I
N IN
DONE
SIA
CHAP
TER
— 03

capture a large share of the market, creating a winner-takes-all type of dynamic within the marketplace.97 This is not just within e-com-merce, but any type of platform that relies on network effects.
An e-commerce vendor survey conducted by the World Bank in 2019 provides some sugges-tive evidence confirming this. Among the thou-sand or so respondents of this online survey of vendors in multiple platforms, the top 1 percent of sellers accounted for almost half of the total sales (46.7 percent), while the top 10 percent accounted for almost 80 percent of all sales (Figure 3.10). The share of sales for the entire bottom half of the sample was just 4 percent of the total. In the same survey, vendors were also asked to identify their top challenge for devel-oping e-commerce in Indonesia. In addition to other issues that we have discussed in the chap-ter, such as societal trust in digital transactions (11 percent), payments and financing (10 per-cent), and the state of development of the ICT infrastructure (7 percent), an overwhelming 60 percent of the respondents identified market competition as the key challenge (Figure 3.11). Specifically, when asked about what aspect of competition they were most worried about, over 70 percent of respondents singled out the fact that there were simply too many players in the industry (Figure 3.12). This fact that the ecosystems within platforms are crowded fields and marginally superior vendors/sellers can command a large share of the market has implications for the gains that a marginal ven-dor can expect to make by joining.
Finally, the third distributional tension is be-tween workers and firms. The “winner-takes-all” characteristic of the digital economy at the mer-chant level could play out also at a more macro, industry level.98 Business models that rely on multi-sided platforms essentially generate val-ue by matching customers with complementary needs. The value of the platform to the marginal customer depends on the number of vendors and service providers already on board. Similarly, the value of the platform to a marginal vendor also depends on the number of customers already on board. Thus, in order to grow and be success-ful, platforms need to build a critical mass on both sides of the market. But once a platform becomes dominant, it could become too large for potential competitors to dislodge giving rise to a winner-takes-all market structure. In devel-oped countries, this network effect has given rise to giant technology companies, such as Google,
FIGURE 3.10
Top 1% of sellers capture almost half of the sales
% OF TOTAL SALES REVENUE ACCOUNTED FOR BY THE TOP 1%, THE NEXT 9%, THE NEXT 40% AND THE BOTTOM 50%
FIGURE 3.11
Market competition is the dominant concern for vendors in platforms…
FIGURE 3.12
…with the crowded field being considered the most challenging aspect of market competition by over 70 percent
Source: World Bank staff calculations based on data from the E-Commerce Survey, 2019.Note: The survey was implemented as an online survey and included modules on company characteristics, customer reach, sales and innovation, challenges and opportunities and other relevant information. A total of 1073 vendors/merchants responded to the survey.
151
BEYO
ND U
NICO
RNS:
HAR
NESS
ING
DIGI
TAL
TECH
NOLO
GIES
FOR
INC
LUSI
ON I
N IN
DONE
SIA
CHAP
TER
— 03

Facebook, Apple, Amazon, Uber and Airbnb, where a few firms capture a dominant part of the market.
Given the large amount of data these digital businesses col-lect, and the increasing use of automated machine learning and AI-driven analytics to drive continuous improvements in products and the services they provide, on pricing and person-alization, so targeting of ads could further entrench their po-sition. Data collection and sharing across platforms belonging to the same company could give rise to an exponentially higher benefit to the company compared with those companies oper-ating only under one platform. And, once this is established, there is a risk that they could exploit monopsonist power vis-à-vis vendors to extract a larger share of value added of the prod-uct. This increase in market concentration may lead to greater inequality as labor receives a smaller share of value added in these segments.99 Some have found these consequences of the digital economy to be the most important reason behind the recent increase in inequality in the United States.100
The level of digitization in Indonesia has perhaps not reached levels where these effects would begin to manifest themselves and more work will be required specifically in the Indone-sian context to see how these dynamics play out as the digital economy grows. Nonetheless, it is a potential risk with con-sequential distributional implications and space that needs to be closely monitored. Boosting digital entrepreneurship, including by addressing the glaring gaps in high-end digital talent (developers, AI and machine-learning specialists), lev-eling the playing field for innovation and preempting policies that protect players, while not being too restrictive on the growth of what is still a nascent digital economy can be some elements of strategies to address this issue.
→ Between a nation full of smartphone wielding micro-entrepreneurs and AI whiz kids So, what do these distributional tensions at the aggregate level imply for the potential of digital technologies to bring about transformative changes in the jobs and economic opportunities landscape in Indonesia? In this chapter, and indeed this entire report, the focus has been on low-skilled biased elements of digital technologies, which might be more relevant to the low-skilled Indonesian workforce, 60 percent of which has educa-tion below secondary level (Indonesia’s education profile in 2018 is similar to that of the United States in 1940).101 There is evidence that the digital economy is already providing bet-ter opportunities to the workers who have been able to enter the growing gig economy and, likewise, e-commerce is also helping to boost productivity, especially by activating women and youth in the labor market. Given the barriers to entry and adoption related to affordable and good-quality internet con-nectivity discussed in Chapter 2, and other constraints related to logistics, digital payments and access to finance, as well as
on-boarding issues (awareness, knowledge and trust) discussed here, significant room may still exist for digital technologies to further boost the productivity of Indonesia’s low-skilled and low-productivity workers and small-scale household enterpris-es, 75 percent of whom reported being growth oriented. How-ever, given the winner-takes-all dynamics that are inherent to platform-based business models, even if Indonesia is able to digitally on-board all of the lower segment of the workforce, it may not be enough to catapult the 115 million aspirants into the middle class.
This puts the spotlight back on quality wage jobs that have been identified as the most viable pathway to the middle class for most Indonesians in the long term.102 The challenges that Indonesia faces in generating quality jobs, including stable and protected wage jobs, at scale have been well recorded in other recent World Bank publications and they will not be repeat-ed here.103 However, with broader digital adoption by firms, and increased sophistication and automation of production technologies, the landscape of jobs could also begin to shift fundamentally in the medium and longer term. More research is required on the topic, but preliminary analysis shows that this shift may already be underway. Digital tasks—or tasks that require the ability to work with computers and electronics used on the job—have been the fastest growing task-content of jobs relative to others since 2007.104 These have also grown fastest in sectors that are relatively more productive to begin with, namely manufacturing and high value-added services. The second fastest growing task-content of jobs is (routine and non-routine) cognitive tasks, while (routine and non-routine) manual task-content is in decline, albeit still dominating the labor market at the moment. Executives in Indonesia’s largest companies increasingly list data analysts and scientists, big data specialists, AI and machine learning specialists, and digital marketing and strategy specialists among leading positions in growing demand, as well as job roles such as process automa-tion specialists and IoT specialists.
How ready are Indonesian workers to embrace these changes and thrive in the modern economy? Not so much, based on available evidence. The quality of the labor force has been a major hinderance even for the brick-and-mortar economy; and without significant investments to bridge the human capital gap and boost skill levels, it is likely to be so also for the digital econ-omy. Indonesian firms have identified the shortage of specialized professionals and managers in the local labor market as one of the most important bottlenecks in fostering innovation within firms. The share of firms reporting inadequate skills as the top constraint in hiring professionals and managers is the highest in the region (Figure 3.13). A 2018 joint assessment by the Gov-ernment of Indonesian and the World Bank highlights critical shortages of skills in dozens of managerial and professional po-sitions critical to technology innovation, such as cloud-solution architects and UI/UX designers. Shortage of qualified talent to develop new products and services has prompted well-funded digital platforms to look elsewhere for R&D capabilities. For example, Go-Jek has established an off-shore R&D division
152
BEYO
ND U
NICO
RNS:
HAR
NESS
ING
DIGI
TAL
TECH
NOLO
GIES
FOR
INC
LUSI
ON I
N IN
DONE
SIA
CHAP
TER
— 03

by acquiring three Indian tech companies and its regional rival, Grab, has also set up an R&D center in India for similar reasons.105
This skill gap not only stunts innovation, but it also represents a lost opportunity; these are good jobs going unfilled in a labor market in which millions are looking for a pathway to the middle class. It also explains the skill premium and the digital technology-induced widening of the skill premium discussed earlier in the chapter. But just as a nation filled with smart-phone-wielding micro-entrepreneurs all selling their wares through digital platforms is far from a realistic portrayal of the inclusive digital fu-ture that Indonesia wants, so is a nation filled with data scientists, cloud-solution architects and AI experts. Thus, in addition to low digital literacy and the severe shortage of digital talent at the high end, investments in skills for a dig-ital future should also include a broader-based effort to develop a pipeline of workers that are generally better at problem-solving, com-munication, teamwork and adaptability (i.e., high-order cognitive and social skills).
FIGURE 3.13
Indonesian firms face a deep skills mismatch, particularly for managers and professionals
SHARE OF FIRMS THAT CITED INADEQUATE SKILLS AS THE KEY BARRIER TO HIRING EACH TYPE OF WORKER, PERCENTAGE
Source: Gomez-Mera and Hollweg, 2018 based on WBES data.
153
BEYO
ND U
NICO
RNS:
HAR
NESS
ING
DIGI
TAL
TECH
NOLO
GIES
FOR
INC
LUSI
ON I
N IN
DONE
SIA
CHAP
TER
— 03

3.6. Conclusion
This chapter has analyzed some aspects of jobs and eco-nomic opportunities in Indonesia’s digital economy. Four key findings emerge from the analysis. First, despite the accelerated adoption induced by the pandemic, the use of digital technologies among the small and micro firms, as well as low-skilled workers, remains highly limited. As a result, at the aggregate level, the increased availabili-ty of and access to the internet has benefited the bigger firms and higher skilled workers more than the smaller and lower skilled ones. Second, e-commerce—a specific application of digital technologies in the economy—is an important source of not only primary but also supple-mental income, especially for women and youth, and a useful pathway for women re-entering the labor market. Third, internet access and challenges related to logistics are major impediments to the expansion of the geographic extent of e-commerce with logistics, in particular, stand-ing out as a binding constraint also on the intensity of these transactions. Low adoption of digital payments, which are constrained on the demand side by issues of awareness, knowledge and trust, and on the supply side by regulatory hurdles, a lack of appropriate infrastructure and small margins for providers, is also another important factor limiting the growth of e-commerce in Indonesia.
The chapter also presents some novel evidence showing that digitally-enabled gig jobs in Indonesia are not only a stepping-stone into the labor market and offering flexible work hours for many, but they also pay better than other informal jobs. However, these opportunities are available primarily to urban men and digital gig workers work on average 10 hours a week more than every other type of worker in Indonesia.
These findings suggest that, in addition to expanding access to affordable and reliable internet to almost half of the country’s population that is not yet connected, addressing challenges related to logistics and the greater adoption of digital payments, as well as the on-boarding issues of awareness, knowledge and trust, could have sig-nificant payoffs in terms of the growth of e-commerce in Indonesia. Specifically, from the perspective of enhancing the impact of e-commerce on inclusion, the findings of the chapter point to the need for a stronger partnership
between the Government (central, as well as local) and digital marketplaces to identify, nurture and support pockets of growth-oriented micro and small enterpris-es. This could take the form of outreach and training, as well as the provision of complementary services, to enable them to better harness opportunities presented by e-commerce. Beyond e-commerce and micro-enter-prises, major investments will also be required to boost the overall skill levels of Indonesian workers to prepare them for the opportunities and challenges as a result of the broader application of digital technologies by larger and more sophisticated firms. Some concrete recommen-dations for policy makers are summarized in Chapter 5.
Finally, by highlighting some distributional tensions that could arise as inevitable upshots of platform-based busi-ness models, the chapter also flags the importance of tax policies to ensure a level playing field for online and offline actors, and policies and regulations related to competition and innovation that ensure a level field for incumbents and innovators. Just as important are worker protection policies. Currently, there is no government regulation on digital gig economy platforms and their workers. Rather the platforms themselves set working conditions through their terms of service agreements. As the digital economy deepens and platforms start seeking profitability, it will be important to ensure that the welfare of workers in the digital economy is protected.
154
BEYO
ND U
NICO
RNS:
HAR
NESS
ING
DIGI
TAL
TECH
NOLO
GIES
FOR
INC
LUSI
ON I
N IN
DONE
SIA
CHAP
TER
— 03

155
BEYO
ND U
NICO
RNS:
HAR
NESS
ING
DIGI
TAL
TECH
NOLO
GIES
FOR
INC
LUSI
ON I
N IN
DONE
SIA
CHAP
TER
— 03

58 Weil, 2014.
59 Also see Box 1.3, p.28-29, World Bank, 2021.
60 World Bank, 2020a. The first round of the World Bank COVID-19 Business Pulse Survey (COV-BPS) was conducted in June 15-23 with phone interviews on 850 representative firms.
61 The second round of the World Bank COVID-19 Busi-ness Pulse Survey (COV-BPS) conducted in October 2020. The percentage point differences already reflect the lower attrition rate in the second round of the sur-vey.
62 World Bank, 2020b & 2021b. This is based on data from the World Bank-Bukalapak Digital Merchants Survey conducted between May 20 and June 27, 2020, with a total sample of 1,020 respondents and World Bank-Shopee Digital Merchants Survey conducted between December 21-25 2020 with a total sample of 15,238 respondents.
63 Google, Temasek and Bain, 2020.
64 The 2018 number is based on the national labor force survey of that year while the 2020 number is based on the Digital Economy Household Survey, a special purpose survey conducted specifically for this report during February and March 2020.
65 “Do not need it” is a more common reason for house-holds in the highest quintile (69 percent) reporting not to use internet compared with households in the low-est quintile (15 percent). This difference is statistically significant at 95 percent ci. Meanwhile, “do not know how to use the internet/lack of knowledge and skills” is a more common reason for households in the lowest quintile (86 percent) compared with households in the richest quintile (40 percent), although this difference is not significantly significant at 95 percent ci.
66 This is consistent with findings from in-depth inter-views conducted by the World Bank with some of the larger digital economy players in Indonesia.
67 SAKERNAS, August 2019.
68 Around 12.2 million workers alone were engaged in e-commerce activities as their primary job (SAKER-NAS 2019). However, Indonesia’s National Social-Eco-nomic Survey 2019 (SUSENAS 2019) shows only 5.9 million online sellers (SUSENAS March 2019).
69 Alibaba Group and World Bank, 2019.
70 SAKERNAS, August 2019.
71 “Regulatory compliance issue” category includes “will have to pay tax” and “will have to comply with some regulations”. If we break down “regulatory compli-ance”, “will have to pay tax” alone does not seem to be the reason for not joining digital platforms, contrary to the assertation that social media and chat messaging apps are used to avoid taxes. This has policy implica-tion in regard to digital taxation, as the main reason the government has been hesitant to tax merchants on digital platforms is because digital platforms have ar-gued that imposing tax on merchants who are on dig-ital platforms will deter those who want to join digital platforms from joining. This reason seems to be un-grounded based on this finding.
72 Digital Economy Household Survey (DEHS) done by the World Bank during February and March of 2020.
73 World Bank, 2020c.
74 Lain, Alatas and Setyonaluri, 2020.
75 The same survey also finds that e-commerce is found to help the disabled graduated from the disability spe-cial schools to be economically active. Having a severe disability reduces engagement in the labor force (Wi-hardja and Cunningham, forthcoming). Although peo-ple with a moderate disability represent a greater share labor force (6.9 percent) and workers (7.1 percent) than expected given that they are only 6.2 percent of the working age population, in contrast, those with a severe disability represent 0.9 percent of the working population but only 0.3 percent of labor force partici-pants or workers. The e-commerce incidence of those graduating from the upper-secondary-level disability special school is highest (61.4 percent) among workers with any educational background.
76 Tiwari, Wibisana and Wihardja, 2020.
77 LSPs include transportation companies (shipping lines, ferry lines, airlines, trucking companies), as well as third party logistics companies that coordinate mul-tiple transportation modes together with warehousing and other value-added activities such as packaging and sorting.
78 Paxel, 2019.
79 TaniSupply has warehouses outside of Jakarta, such as Bogor and Surabaya, and is planning to open another ones in Jabodetabek areas, Bali, Kalimantan and Su-lawesi.
Endnotes
156
BEYO
ND U
NICO
RNS:
HAR
NESS
ING
DIGI
TAL
TECH
NOLO
GIES
FOR
INC
LUSI
ON I
N IN
DONE
SIA
CHAP
TER
— 03

80 There are other measures of financial inclusion, includ-ing in Indonesia. These numbers from the new World Bank survey appear to align well with these numbers. For example, the Global Findex Database, 2017 found that 49 percent of Indonesian adults had transaction accounts. Similarly, the Financial Inclusion Insight (FII) Survey in 2018 found that 56 percent adults were owners of a bank account. Likewise, the Global Fin-dex Database also showed that 3 percent of Indonesian adults owned mobile money accounts and there were at least 7 percent of adults who used some form of mo-bile banking. The numbers from the DEHS—which are based on households—appear to be in a reasonable ballpark of these numbers and, as such, provides a use-ful updated triangulation on the picture of financial ac-cess in Indonesia.
81 Pazarbasioglu et al., 2020.
82 CICO Economics in Indonesia, BCG, 2019.
83 Agent Network Accelerator (ANA) Research, Indone-sia Country Report: December 2017.
84 Under this new regulation, foreign-produced textiles, clothes, bags, and shoes that cost a minimum of US$3 will be subject to a range of taxes and import duties with a total rate of 32.5 to 50 percent of their value. For other products worth at least US$3, the taxes and import duties will be lowered from 27.5 to 37.5 percent of their value to 17.5 percent. Goods worth below US$3 will be exempted from import duties as well as val-ue-added tax.
85 Berg, 2016.
86 The labor force survey defines a ‘gig worker’ as a worker who is either self-employed or an employer with tem-porary/family/unpaid workers, but does not have a full control of his/her business because of several things related to his/her business activities, namely having a third party (individual/business/firm) regulate the price/tariff of goods and services, control the raw ma-terials/machine and tools/capital goods OR control the access to market/clients. This definition may exclude other types of gig workers, such as contract firm work-ers (outsourced workers), on-call workers and fixed-term or temporary workers.
87 See Hall and Krueger, 2016; McGuire, 2018.
88 Chen et al., 2016.
89 Berger et al., 2018.
90 Ibid.
91 CSIS and Tenggara Strategics, 2019; Puskakom, 2017.
92 CSIS and Tenggara Strategics, 2019.
93 CSIS and Tenggara Strategics, 2019; Puskakom, 2017.
94 Berger et al., 2018.
95 Hall and Krueger 2016.
96 Ibid.
97 See for example Guellec and Paunov, 2018.
98 See, for example, Banerjee and Duflo, 2019, p.241.
99 Frank et al., 2019; Banerjee and Duflo, 2019.
100 Autor et al., 2017. See also Weil, 2018, p.9: “Where lead companies once shared gains with their internal workforce, fissuring leads to growing inequality in how the value created in the economy is distributed.” And Banerjee and Duflo 2019, p.242: “The increase in con-centration (among superstar firms) thus helps explains a part of why wages are not keeping pace with GDP. The rise of superstar firms also offers an explanation for why overall wage inequality has been rising…”
101 Wihardja and Cunningham, forthcoming.
102 World Bank, 2019.
103 See World Bank, 2020c; World Bank, 2019.
104 Wihardja and Pradana, 2020.
105 The human capital gap is magnified by restrictive gov-ernment policy on the hiring of foreign workers, lim-iting the ability of employers to fill the skills gap with global talent in areas where local skills are in short sup-ply. The recently promulgated Omnibus Law on Job Creation includes a provision to relax this.
157
BEYO
ND U
NICO
RNS:
HAR
NESS
ING
DIGI
TAL
TECH
NOLO
GIES
FOR
INC
LUSI
ON I
N IN
DONE
SIA
CHAP
TER
— 03

References1 Alibaba Group and World Bank. 2019. “E-commerce Development: Experience from China” (English). Washington, DC:
World Bank Group. Available at: http://documents1.worldbank.org/curated/en/823771574361853775/pdf/Overview.pdf (accessed on December 14, 2020).
2 Autor, David, Dorn, David, Katz, Lawrence, Patterson, Christina, and Van Reenen, Jon. 2017. “Concentrating on the Fall of the Labor Share.” American Economic Review 107(5): 180–85.
3 Banerjee, Abhijit V. and Esther Duflo. 2019. Good Economics for Hard Times. Allen Lane, United Kingdom.
4 Berg, Janine. 2016. “Income Security In the On-Demand Economy : Findings and Policy Lessons from a Survey of Crowdworkers.” Comparative Labour Law and Policy Journal 37(3).
5 Berger, Thor, Carl Benedikt Frey, Guy Levin, Santosh Rao Danda. 2018. “Uber Happy? Work and Well-being in the ‘Gig Economy’.” Presented at the 68th Economic Policy Panel Meeting, October 4-5, Vienna.
6 Boston Consulting Group, MicroSave Consulting. 2019. “CICO Economics in Indonesia”. Available at: https://connect.bcg.com/cicoeconomics/6-cico-economics-in-indonesia_aug-2019-2/ (accessed on December 14, 2020).
7 Centre for Strategic and International Studies (CSIS) and Tenggara Strategics. 2019. “Economic Research: How GRAB help increase the potential of the informal sector in Indonesia”. Slide presentation.
8 Chen, Cecilia, and Marcus Haymon. 2016. “Realizing the Potential of Digital Job-Seeking Platforms.” Brookings Institute. A paper prepared for the 2016 Brookings Blum Roundtable. Available at: https://www.brookings.edu/wp-content/uploads/2016/07/Global_20160720_Blum_ChenHaymon.pdf
9 Frank, Morgan R., David Autor, James E. Bessen, Erik Brynjolfsson, Manuel Cebrian, David J. Deming, Maryann Feldman et al. 2019. “Toward understanding the impact of artificial intelligence on labor”. Proceedings of the National Academy of Sciences, 116(14):6531-6539.
10 Google, Temasek and Bain. 2020. “e-Conomy SEA 2020 – At Full Velocity: Resilient and Racing Ahead”.
11 Gomez-Mera, L. and C. Hollweg. 2018. “Firm Performance and Constraints in Indonesia.” Mimeo. World Bank.
12 Guellec, Dominique, and Caroline Paunov. 2018. “Innovation policies in the digital age.” OECD Working Paper Series.
13 Hall, Jonathan V., and Alan B. Krueger. 2016. “An Analysis of the Labor Market for Uber’s Driver-Partners in the United States,” NBER Working Paper Series 22843.
14 Kapoor, Raunak, Alfa Pelupessy, Linggo Kusuma, Vera Bersudskaya, Sidra Mughal, Grace Retnowati and Aakash Mehrotra. 2017. Agent Network Accelerator Research: Indonesia Country Report 2017. MicroSave Consulting. Available at: https://www.microsave.net/2017/12/04/agent-network-accelerator-research-indonesia-country-report-2017/ (accessed on December 14, 2020).
15 Lain, Jonathan, Hamidah Alatas, and Diahhadi Setyonaluri. 2020. “Women at Work in Indonesia.” Background paper to Indonesia’s Jobs Report: Pathways to Middle-Class Jobs Indonesia.
16 McGuire, Robert. 2018. “Ultimate Guide to Gig Economy Data: A Summary of Every Freelance Survey We Can Find”. Nation 1099. Available at: https://nation1099.com/gig-economy-datafreelancer-study/.
17 Paxel. 2019. “Introduction Paxel”. Presentation at the World Bank’s Digital Economy BBL on December 4, 2020, at World Bank Office Jakarta, Indonesia.
18 Pazarbasioglu, Ceyla, Alfonso Garcia Mora, Mahesh Uttamchandani, Harish Natarajan, Erik Feyen, and Matthew Saal. 2020. Digital Financial Services. World Bank, Washington, DC.
19 Puskakom (Pusat Kajian Komunikasi Universitas Indonesia). 2017. “Research findings on the social benefit of on-demand applications: Case Study on Gojek Indonesia.” A slide presentation.
20 Tiwari, Sailesh, Putu Sanjiwacika Wibisana and Maria Monica Wihardja. 2020. “Drivers and Welfare Impacts of E-Commerce Growth in Indonesia: Analyses Using Digital Platform Data.” Background Note for the Digital Economy and Inclusion Flagship report.
21 Weil, David. 2014. The Fissured Workplace. Why Work Became So Bad for So Many and What Can Be Done to Improve It. Harvard University Press, Cambridge, Massachusetts, London, England.
22 Wihardja, Maria Monica and Abror Tegar Pradana. 2020. “Digital Skills and Occupation in Indonesia.” Background study for Indonesia’s Digital Economy and Inclusion Flagship report.
23 Wihardja, Maria Monica, and Wendy Cunningham. Forthcoming. Indonesia’s Jobs Report: Pathways to Middle-Class Jobs in Indonesia. World Bank.
24 World Bank. 2019. Indonesia’s Aspiring Middle: Expanding the Middle Class. World Bank, Washington, DC.
25 World Bank. 2020a. “How Covid-19 is affecting firms in Indonesia: Results from the 1st round of the Covid-19 Business Pulse Survey.” Policy Brief. World Bank.
158
BEYO
ND U
NICO
RNS:
HAR
NESS
ING
DIGI
TAL
TECH
NOLO
GIES
FOR
INC
LUSI
ON I
N IN
DONE
SIA
CHAP
TER
— 03

26 World Bank. 2020b. “Impacts on Digital Merchants: Insights from the Bukalapak-World Bank Survey.” Policy Brief. World Bank.
27 World Bank. 2020c. Indonesia Systematic Country Diagnostic: Eliminating Poverty, Bringing Economic Security to All. World Bank Washington, DC.
28 World Bank. 2021. “Uneven Recovery”. East Asia and Pacific Economic Update (April), World Bank, Washington, DC. Doi: 10.1596/978-1-4648-1702-1. License: Creative Commons Attribution CC BY 3.0 IGO
159
BEYO
ND U
NICO
RNS:
HAR
NESS
ING
DIGI
TAL
TECH
NOLO
GIES
FOR
INC
LUSI
ON I
N IN
DONE
SIA
CHAP
TER
— 03

Annex.ANNEX 3.A
Drivers of E-commerce Growth (Buyers’ Side)
DEPENDENT VARIABLE PERCENTAGE OF BUYERS IN THE POPULATION
NUMBER OF PURCHASES PER BUYER (LN)
NUMBER OF PURCHASES PER POPULATION (LN)
(1) (2) (3) (1) (2) (3) (1) (2) (3)
Real per capital consumption (ln)11.10*** 2.984 -1.612 1.277*** -0.609* -0.166 5.070*** -0.298 0.186
(3.819) (2.524) (2.874) (0.278) (0.307) (0.256) (0.705) (0.624) (0.545)
Population (ln)2.533** 1.564** 0.413 0.008 0.145 0.054 0.393** 0.295 0.163
(1.086) (0.645) (0.425) (0.052) (0.089) (0.057) (0.155) (0.189) (0.125)
Internet access0.454*** 0.291* 0.159*** 0.011 0.350*** 0.071*
(0.127) (0.165) (0.016) (0.018) (0.028) (0.037)
Share of Urban Population (p.p)0.058** 0.018 -0.016*** 0.002 -0.012** 0.016***
(0.028) (0.022) (0.003) (0.002) (0.005) (0.005)
Cost of logistics-1.834** -2.168** 0.196* -0.081* 0.144 -0.220**
(0.860) (0.945) (0.098) (0.046) (0.147) (0.086)
Additional controls: Schooling years + electricity access NO YES YES NO YES YES NO YES YES
Island-region + Year effects NO NO YES NO NO YES NO NO YES
Observations 170 170 170 170 170 170 170 170 170
R-squared 0.359 0.635 0.782 0.122 0.547 0.895 0.449 0.839 0.959
*Significant at the 10 percent level; ** Significant at the 5 percent level; *** significant at the 1 percent level.Note: The analysis exploits province-year level variation using data on e-commerce volumes and intensity provided by e-commerce platforms and other data from SUSENAS. Internet access is measured by proportion of adults with access to internet.
DEPENDENT VARIABLEGMV OF PURCHASED GOODS PER
POPULATION (LN) GMV PER PURCHASE (LN) GMV PER BUYER (LN)
(1) (2) (3) (1) (2) (3) (1) (2) (3)
Real per capital consumption (ln)4.538*** 0.208 0.309 -0.532** 0.506 0.123 0.744*** -0.104 -0.044
(0.585) (0.457) (0.563) (0.250) (0.346) (0.295) (0.236) (0.293) (0.313)
Population (ln)0.357** 0.118 0.036 -0.035 -0.178*** -0.127** -0.027 -0.033 -0.073
(0.144) (0.149) (0.130) (0.052) (0.065) (0.055) (0.048) (0.060) (0.060)
Internet access0.281*** 0.086** -0.069*** 0.015 0.090*** 0.026
(0.023) (0.041) (0.012) (0.030) (0.013) (0.028)
Share of Urban Population (p.p)-0.005 0.015** 0.006** -0.002 -0.010*** 0.000
(0.005) (0.005) (0.003) (0.004) (0.003) (0.003)
Cost of logistics-0.329* -0.557*** -0.473*** -0.337*** -0.276*** -0.418***
(0.164) (0.153) (0.113) (0.103) (0.100) (0.097)
Additional controls: Schooling years + electricity access No Yes Yes No Yes Yes No Yes Yes
Island-region + Year effects No No Yes No No Yes No No Yes
Observations 170 170 170 170 170 170 170 170 170
R-squared 0.463 0.805 0.908 0.043 0.295 0.647 0.069 0.392 0.522
*Significant at the 10 percent level; ** Significant at the 5 percent level; *** significant at the 1 percent level.Note: The analysis exploits province-year level variation using data on e-commerce volumes and intensity provided by e-commerce platforms and other data from SUSENAS. Internet access is measured by proportion of adults with access to internet.
160
BEYO
ND U
NICO
RNS:
HAR
NESS
ING
DIGI
TAL
TECH
NOLO
GIES
FOR
INC
LUSI
ON I
N IN
DONE
SIA
CHAP
TER
— 03

ANNEX 3.B
Drivers of E-commerce Growth (Sellers’ Side)
DEPENDENT VARIABLE PERCENTAGE OF SELLERS IN THE POPULATION NUMBER OF ORDERS PER SELLER (LN) NUMBER OF ORDERS PER POPULATION
(LN)
(1) (2) (3) (1) (2) (3) (1) (2) (3)
Real per capital consumption (ln)1.476* 0.478 -0.474 -0.023 -1.685* -0.184 4.171*** -2.865** 0.775
(0.774) (0.514) (0.595) (0.652) (0.912) (1.037) (1.490) (1.400) (1.340)
Population (ln)0.471* 0.273* -0.023 1.112*** 0.816*** 0.817*** 2.386*** 1.326*** 1.224***
(0.235) (0.138) (0.051) (0.112) (0.155) (0.210) (0.278) (0.294) (0.336)
Internet access0.044 0.038 0.0586** -0.00803 0.281*** 0.115
(0.027) (0.029) (0.0260) (0.0493) (0.040) (0.083)
Share of Urban Population (p.p)0.015*** 0.002 0.0175* 0.0207 0.038** 0.037*
(0.005) (0.005) (0.00928) (0.0129) (0.016) (0.020)
Cost of logistics-0.378* -0.429** -0.0281 0.0412 -0.714** -0.520**
(0.191) (0.205) (0.168) (0.162) (0.290) (0.239)
Additional controls: Schooling years + electricity access No Yes Yes No Yes Yes No Yes Yes
Island-region + Year effects No No Yes No No Yes No No Yes
Observations 170 170 170 170 170 170 170 170 170
R-squared 0.262 0.527 0.737 0.596 0.670 0.735 0.668 0.850 0.914
*Significant at the 10 percent level; ** Significant at the 5 percent level; *** significant at the 1 percent level.Note: The analysis exploits province-year level variation using data on e-commerce volumes and intensity provided by e-commerce platforms and other data from SUSENAS. Internet access is measured by proportion of adults with access to internet.
DEPENDENT VARIABLE
GMV OF ORDERED GOODS PER POPULATION (LN) GMV PER ORDER (LN) GMV PER SELLER (LN)
(1) (2) (3) (1) (2) (3) (1) (2) (3)
Real per capital consumption (ln)4.972*** -2.247 0.951 0.801** 0.618 0.175 0.779 -1.068 -0.009
(1.382) (1.441) (1.458) (0.362) (0.501) (0.547) (0.611) (0.962) (1.051)
Population (ln)1.908*** 1.066*** 1.004*** -0.478*** -0.260*** -0.220** 0.633*** 0.556*** 0.597**
(0.287) (0.300) (0.342) (0.067) (0.084) (0.093) (0.129) (0.181) (0.230)
Internet access0.364*** 0.157* 0.083*** 0.042 0.142*** 0.034
(0.046) (0.085) (0.021) (0.029) (0.031) (0.050)
Share of Urban Population (p.p)0.015 0.028 -0.023*** -0.010 -0.005 0.011
(0.019) (0.023) (0.005) (0.006) (0.012) (0.016)
Cost of logistics-0.882*** -0.999*** -0.168 -0.478*** -0.196 -0.437**
(0.291) (0.256) (0.128) (0.113) (0.197) (0.180)
Additional controls: Schooling years + electricity access No Yes Yes No Yes Yes No Yes Yes
Island-region + Year effects No No Yes No No Yes No No Yes
Observations 170 170 170 170 170 170 170 170 170
R-squared 0.607 0.832 0.892 0.252 0.465 0.672 0.336 0.502 0.623
*Significant at the 10 percent level; ** Significant at the 5 percent level; *** significant at the 1 percent level.Note: The analysis exploits province-year level variation using data on e-commerce volumes and intensity provided by e-commerce platforms and other data from SUSENAS. Internet access is measured by proportion of adults with access to internet.
161
BEYO
ND U
NICO
RNS:
HAR
NESS
ING
DIGI
TAL
TECH
NOLO
GIES
FOR
INC
LUSI
ON I
N IN
DONE
SIA
CHAP
TER
— 03

GIG WORKERS
All
Employ-er with Temp.
Workers Only
Self-Em-
ployed Only
Non-Inter-net User
Inter-net User
Allinfor-mal
workers
All workers
AGE 39 46 38 44 35 42 41
GENDER (1=MALE) 76% 74% 76% 65% 85% 61% 61%
LOCATION (1=URBAN) 71% 46% 77% 52% 87% 48% 55%
EDUCATION
Primary education, lower 31% 52% 26% 56% 10% 51% 40%
Lower secondary education 19% 20% 19% 23% 16% 21% 18%
Upper secondary education 41% 22% 45% 20% 59% 25% 30%
Diploma I/II/III 3% 1% 3% 1% 4% 1% 3%
University/Diploma IV or greater 7% 5% 7% 1% 11% 3% 10%
Underemployed 25% 27% 25% 32% 20% 35% 29%
SECTOR OF EMPLOYMENT
Agriculture, forestry, livestock and fishing 12% 39% 7% 25% 2% 35% 27%
Mining and quarrying 1% 1% 1% 1% 0% 1% 1%
Manufacturing 15% 18% 15% 27% 6% 12% 15%
Electricity, gas, and water supply 1% 1% 1% 1% 0% 0% 1%
Construction 2% 3% 1% 3% 1% 8% 7%
Wholesale and retail trade, restaurants and hotels 20% 32% 18% 25% 17% 29% 25%
Transportation, storage and communications 43% 2% 51% 11% 69% 5% 5%
Finance, insurance, real estate and business services 2% 2% 2% 1% 2% 1% 3%
Community, social and personal services 4% 2% 4% 5% 3% 7% 15%
WORKING HOURS PER WEEK 44 39 45 38 49 38 39
HAS SECONDARY JOB? 16% 30% 13% 21% 11% 19% 17%
STOPPED WORKING IN THE PAST 1 YEAR? 9% 4% 10% 4% 13% 4% 4%
Source: SAKERNAS 2019, World Bank staff calculations.
ANNEX 3.C
Profiles of Gig-Workers Indonesia
162
BEYO
ND U
NICO
RNS:
HAR
NESS
ING
DIGI
TAL
TECH
NOLO
GIES
FOR
INC
LUSI
ON I
N IN
DONE
SIA
CHAP
TER
— 03

E-commerce has grown rapidly in China. The Chinese e-commerce market alone accounts for 45.8 percent of the global market share. This is larger than the combined markets of North America, Europe, Latin America, Mid-dle East, and Africa. Total e-commerce trade volume in-creased from less than ¥1,000 billion (US$120.8 billion) in 2004 to nearly ¥30,000 billion (US$4.44 trillion) in 2017. Against the backdrop of this impressive growth, online retail sales in rural areas have grown faster than the national average. From 2014 to 2017, online retail sales in rural China increased from ¥180 billion to ¥1.24 trillion, a compound annual growth rate (CAGR) of 91 percent, compared with 35 percent nationally.106
The expansion of e-commerce in the rural parts of the China can serve as a useful reference for Indonesia’s own pursuit of expanding the reach of the digital economy to more rural parts of the country. Rapid growth of rural e-commerce in China can be attributed, in large part, to the rise of Alibaba’s Taobao Villages. Taobao Villag-es are rural villages in China where e-commerce is most developed or concentrated. A village will automatical-ly be labeled as a Taobao village if at least 10 percent of the households actively engage in e-commerce, or where there are at least 100 active e-shops, with annual online sales of at least ¥10 million (or US$1.5 million). A Tao-bao Town is a town that consists of at least three Taobao Villages. The number of Taobao Villages grew from just 20 in 2013 to 3,202 in 2018, and as Taobao Villages ex-panded they clustered into Taobao Towns. The number of Taobao Towns grew from 19 in 2014 to 363 in 2018.107
→ What are the characteristics of Taobao Villages?
Taobao villages were mostly developed in clusters. Clus-tering mainly occurred initially in places where there was a well-developed industrial base and with rapid develop-ment of e-commerce related services.108 There was also a significant demonstration as the success of one Tao-bao Village attracted its surrounding village to also start online businesses and become a Taobao Village. Local
government incentives and investments in incubation parks and the creation of e-commerce specialty towns also helped, generating spillover effects in surrounding towns and villages.
Clustering also occurred in terms of product specializa-tion. For example, more industrialized Taobao Villages along or closer to the eastern coastline have tended to focus on manufactured goods, such as clothing, furni-ture, and shoes. Meanwhile, more rural villages in the west have specialized in local products, such as matrimo-ny vine (Lycium barbarum, the source of goji berries) in Ningxia, preserved meat in Guizhou, and black bee honey in Xinjiang. In 2018, more than 100 Taobao Villages sold locally produced agricultural products online. Flowers from Shuyang, pecans from Lin’an, tea from Anxi, apples from Yantai, and Longjing tea from Hangzhou are exam-ples of products with unique local characteristics. The same also applies to handicrafts, such as peony painting in Henan, Xuan paper in Anhui, birdcages in Shandong, and silverware in Yunnan.
This has led to a higher intensity of online activities also within Taobao Villages. For example, the number of active online shops in Taobao Villages has seen a sharp increase in recent years. Taobao Villages had about 70,000 active online shops in 2014 and more than 660,000 in 2018, a CAGR of 75 percent. The number of active online shops ranges between 100 and 300 in most Taobao Villages, though a few have more than 1,000 or even 10,000. While connectivity infrastructure, logistics, and broadband internet have driven growth, Taobao Villages have also taken advantage of the skills and enterprise of workers, many of whom were returnee migrants, who established successful e-commerce businesses, created role models for fellow villagers, and shared knowledge within circles of friends and relatives.109
Overall, numerous studies show that Taobao Villages have vitalized China’s rural economy and e-commerce in general and has made people better off. According to the Taobao Village Survey,110 online shop workers (other than the self-employed shop-owners) in Taobao Villages have wage levels equal to or higher than workers in ur-
Spotlight 3.Expanding the Reach of e-Commerce to Rural Indonesia: Lessons from Taobao Villages in China
163
BEYO
ND U
NICO
RNS:
HAR
NESS
ING
DIGI
TAL
TECH
NOLO
GIES
FOR
INC
LUSI
ON I
N IN
DONE
SIA
CHAP
TER
— 03
ban private industries. The average monthly wage workers in online shops ranged from some ¥3,800 for unskilled workers to nearly ¥6,800 for technicians, compared with the nation-al average of ¥3,569 for urban workers in private industries. The most popular jobs in these shops are non-technical, such as customer service, marketing and promotion, or product supplier and delivery. Rural e-commerce development also increased household consumption growth, which stemmed from lower search costs and transaction costs that resulted in lower prices. Couture et al. (2018) show that the expansion of e-commerce to the Chinese countryside is associated with lower costs of living, and for the goods that are available at both the Rural Taobao online terminal and in the village, the median price from the online terminal is 15 percent cheaper. The same study also shows that 62 percent of goods bought through Alibaba’s Rural Taobao platform were not available in the village.111
Despite the positive impact, firms, and workers in Taobao Vil-lages still face many challenges, most notably from their small size. The Taobao Village Survey finds that 64 percent of e-shop owners are self-employed without employees, 30 percent have fewer than five workers, 3 percent have five to nine workers, and only 3 percent have 10 workers or more. When an owner starts hiring employees, 56 percent of the employees are family members. While this allows flexibility of production and may make it easier to change products to meet evolving demand, it limits the ability to scale up or upgrade the technology when demand surges.
Another challenge faced by the online shops is the fact that most end up selling the same or similar products within their market. Under the framework of “One Village One Product” campaign, enterprises within one village may produce and sell similar products. This replication can result in low-end competition within the same village or with an adjacent village, driving down profit margins or leading to disputes where there are conflicting ownership rights for products, or where the process innovations are unclear.
→ What were the drivers of Taobao Villages?
In general, the formation of Taobao Villages proceeded through three broad stages. The first stage entailed grassroots development, whereby villagers who were often returned mi-grants with entrepreneurial skills, led the establishment of online businesses and created models for other villagers to follow. In the second stage, the Government provided direct support for infrastructure, e-commerce training, and finance. The third stage was characterized by the involvement of spe-cialized e-commerce service providers in areas where the in-dustrial base is weaker and human capital is more limited (i.e., in central or western areas of China). These consulting firms were subsidized by local governments to foster the digital eco-
system, offer tailored support to villagers, and link the local merchants to e-commerce platforms.
Well-developed express delivery services played a key catalytic role. The Taobao Village Survey finds that nearly all Taobao Villages have package pickup and express delivery services, with a wide range of logistics service providers. Forty-eight percent had logistics centers in the village at the time of the survey in 2018, compared with about 25 percent of villages in China that had e-commerce logistic service distribution sites in 2016. Sixty-two percent of Taobao Villages have more than five logistics or express delivery companies providing services and 27 percent have more than 10 companies; all large Taobao Villages (where GMV larger than ¥197 million) receive logis-tics services from at least three companies.
But the Government has also played a key role by providing various incentives and support to promote e-commerce in less developed areas. Important components of government support in China have included collaboration with e-platform companies and logistics companies and subsidizing logistic costs for packages to and from targeted poor areas. The Gov-ernment has also provided subsidies and incentives to house-holds and individuals, including free or subsidized e-commerce training, and free or subsidized e-commerce post-training support through e-commerce service firms, as well as awards for high volume of online sales.
In addition, the Government has also launched integrated “demonstration programs” to target specific areas. The Rural E-commerce Demonstration Program, launched jointly by the Ministry of Finance and Ministry of Commerce in 2014, aims to contribute to poverty reduction and the modernization of rural areas. Its main activities consist of establishing and improving rural e-commerce public service, fostering rural e-commerce supply chains, promoting connectivity between agriculture and commerce, and enhancing e-commerce train-ing. The program grew quickly and, by 2018, had supported 1,016 demonstration counties, covering 737 poverty-stricken counties (89 percent of the total), including 137 counties with extreme poverty (41 percent of the total). According to Min-istry of Commerce, the program had created 120,000 jobs for poor households by the end of 2016. The number of online stores registered in rural areas increased from 8.2 million in 2016 to 9.9 million in 2017 and resulted in employment for 28 million people. At least 15 e-commerce companies have joined the effort to reduce poverty in rural areas.112
In some cases, the Government also partnered with the private sector to accelerate digital adoption in rural areas. In 2014, the Alibaba Group, in collaboration with the Government, launched the Alibaba Rural Taobao Program (which is differ-ent from the general Taobao Villages, which developed organi-cally without government intervention) to help give rural resi-dents greater access to a broader variety of goods and services, and help farmers earn more by selling agricultural products directly to urban consumers in online platforms. The activi-
164
BEYO
ND U
NICO
RNS:
HAR
NESS
ING
DIGI
TAL
TECH
NOLO
GIES
FOR
INC
LUSI
ON I
N IN
DONE
SIA
CHAP
TER
— 03

ties under this partnership include: setting up an e-commerce service network in counties and villages; improving logistical connections for villages through shipping packages between county centers and villages; providing training in e-commerce and promoting entrepreneurship; and finally, developing rural financial services through the Ant-Financial subsidiary of Al-ibaba. The Rural Taobao Program expanded from 212 villages in 12 counties in 2014 to more than 30,000 villages in 1,000 counties in 2018, spreading from the coast inland.113
→ What are the lessons for Indonesia?
To a large extent, the success of Taobao Villages can be at-tributed to the right blend of a natural progression along the existing value chain and the right government interventions to make e-commerce more inclusive by helping it spread to more rural parts of the country. In the initial stages, Taobao Villages shared certain characteristics of market proximity, connec-tivity, and a pool of returned migrants with the necessary en-trepreneurial skills provided the spark. Digital technologies were the enablers that accelerated online commerce in these areas. Naturally, areas with more solid connectivity, better market access, and stronger industrial base, as those in the coastal areas, were the first to reap the digital dividends. In the later stages, government interventions stepped in to provide additional support for scaling up. Government interventions ranging from infrastructure provision to value-chain support and entrepreneurial education were useful accelerators, with some e-commerce activities already in place. This support enabled the “winners” selected by the market to continue their expansion by upgrading products, exploring new clusters and agglomerations to achieve economies of scale, and innovating.
The public and private sectors in Indonesia have been seeking inspiration from the success of Taobao Villages to drive rural e-commerce in the country. Some existing rural economic re-vitalization plans already include efforts to encourage village enterprises to adopt digital technologies on a larger scale. Local agencies at subdistrict and village levels, supported by the na-tional ministry of villages and disadvantageous regions, have initiated “digital villages” program through internet broad-band installation in villages, and the introduction to digital technologies through training and knowledge exchange. There are several success stories where the villages managed to sell their local products at the national marketplaces, or where local farmers deployed automated smart sensors to manage their fish farms. More notable achievements came from villages that successfully turned social media to promote their local tourism sites and attract local visitors
However, overall, the uptake remains small; only around 10 percent of the total 74,957 villages in Indonesia have been registered in the Ministry of Village’s information system (Sistem Informasi Desa dan Kawasan, SIDeKa). While more ad-vanced villages have started utilizing social media platforms to promote their local products and services, most villages that have registered have just some basic information about their locality online. Meanwhile, some of the larger e-com-merce platforms have also started opening branches or dis-tribution centers in rural areas to expand their market reach. Though these efforts are still in their infancy, opportunities exist for governments—both central and local—to collabo-rate with some of these platforms to provide complementary services, such as training, branding, value-chain support, etc., to enable small and medium enterprises in rural and more remote places to capitalize on the opportunities generated by digital technologies.
165
BEYO
ND U
NICO
RNS:
HAR
NESS
ING
DIGI
TAL
TECH
NOLO
GIES
FOR
INC
LUSI
ON I
N IN
DONE
SIA
CHAP
TER
— 03

106 Mofcom China, 2018.
107 World Bank and Alibaba Group, 2019.
108 AliResearch, 2016.
109 Zhang et al., 2015.
110 Taobao Village Survey is a between the World Bank, Alibaba Group, and Peking University and Nankai University joint re-search team that focuses on rural e-commerce clusters. It is representative for the universe of 2,118 Taobao Villages in 2017, conducted between August and September 2018.
111 Couture, Faber, Gu, and Liu, 2018.
112 World Bank and Alibaba Group, 2019.
113 For discussion on public-private partnerships for e-commerce development, see Xubei Luo. 2019. E-commerce for poverty alleviation in rural China: from grassroots development to public-private partnerships. https://blogs.worldbank.org/easta-siapacific/e-commerce-poverty-alleviation-rural-china-grassroots-development-public-private-partnerships
Endnotes
166
BEYO
ND U
NICO
RNS:
HAR
NESS
ING
DIGI
TAL
TECH
NOLO
GIES
FOR
INC
LUSI
ON I
N IN
DONE
SIA
CHAP
TER
— 03

References1 AliResearch. 2016. China Taobao Village Report 2016 (中国淘宝村研究报告 2016).
2 Couture, Victor, Benjamin Faber, Yizhen Gu, and Lizhi Liu. 2018. “E-Ccommerce Iintegration and Eeconomic Ddevelopment: Evidence from China.” National Bureau of Economic Research.
3 Ministry of Commerce, People’s Republic of China. 2018. “Regular Press Conference of the Ministry of Commerce (January 25, 2018)”. Retrieved from: http://english.mofcom.gov.cn/article/pressconferenceinyears/2018/201802/20180202708848.shtml
4 World Bank and Alibaba Group. 2019. “E-commerce Development: Experience from China” Vol.2 (English). Washington, DC: World Bank Group. Retrieved from: http://documents.worldbank.org/curated/en/552791574361533437/E-commerce-Development-Experience-from-China
5 Xubei Luo. 2019. “E-commerce for poverty alleviation in rural China: from grassroots development to public-private partnerships.” World Bank Group. Retrieved from: https://blogs.worldbank.org/eastasiapacific/e-commerce-poverty-alleviation-rural-china-grassroots-development-public-private-partnerships
6 Zhang, Xiaobo, and Wu Zhu. 2015. “The spatial patterns of e-commerce in China.” Paper presented at the annual Allied Social Science Associations, January 3:5.
167
BEYO
ND U
NICO
RNS:
HAR
NESS
ING
DIGI
TAL
TECH
NOLO
GIES
FOR
INC
LUSI
ON I
N IN
DONE
SIA
CHAP
TER
— 03

Chapter ⬎
4
Digital Technologies for Inclusive Service Delivery
168
BEYO
ND U
NICO
RNS:
HAR
NESS
ING
DIGI
TAL
TECH
NOLO
GIES
FOR
INC
LUSI
ON I
N IN
DONE
SIA
CHAP
TER
— 04

he ability of governments around the world to harness digital technologies to deliver services is perhaps an area on which the COVID-19 pan-demic has focused the strongest spotlight. Just as people and businesses have had to adapt to the various measures taken to contain the spread of the virus, so too have governments. The ability to use digital technologies in an effort to curb and manage the pandemic, as well as to ensure
the continuity of essential services, has emerged as a key marker of resilience, along with capacity and political will. Countries such as the Republic of Korea, Singapore, Ger-many, Australia and Malaysia have been at the forefront, using these technologies not only to track the disease in real time, to conduct contact tracing and to implement quarantines as necessary, but they have also made use of digital technologies to coordinate and manage data, and organize their policy response. For example, the Rep. of Korea moved 470,000 classrooms into the digital space, enabling almost 4 million users, both teachers and stu-dents, to continue learning activities during the pandemic. Malaysia launched a digital-learning platform for teachers, students and educators that, by October 2020, had 1.7 mil-lion monthly active users, with 10,000 schools, 370,000 teachers and 2.5 million students in the system.114
Digital technologies have also been useful in the rapid deployment of social assistance responses. In countries with extensive mobile phone or internet penetration, as well as strong existing social protection systems, digital technologies related to digital ID and digital financial services have helped to facilitate the identification and registration of benefit recipients. For example, Brazil enabled workers not already registered in the national social protection registry to register through a website or phone application and start receiving emergency benefits for those who had become unemployed.115 Because Thai-land has enabled people to link their national ID to bank and e-money accounts through the highly interoperable PromptPay system, greater assurance was achieved that payments to beneficiaries who registered over the internet were indeed the right ones, and payments could be made more quickly and with higher confidence. Likewise, Chile
4.1. Introduction
T
169
BEYO
ND U
NICO
RNS:
HAR
NESS
ING
DIGI
TAL
TECH
NOLO
GIES
FOR
INC
LUSI
ON I
N IN
DONE
SIA
CHAP
TER
— 04

leveraged the ID-linked basic account, Cuenta-Rut, to deliver emergency relief.
At the same time, COVID-19-related disruptions have laid bare the lack of readiness on the part of Indonesia to fully capitalize on these digital opportunities. Early ef-forts by the Ministry of Education and Culture to deploy educational TV, as well as online resources, along with efforts from the Ministry of Religious Affairs and indi-vidual teachers, meant that all students reported engaging in some form of learning activities at home.117 Important challenges remain, however, with 64 percent of students reporting critical constraints related to the lack of reli-able connections and supporting devices.118 Similar to many other countries, Indonesia also struggled to obtain consistent data on COVID-19 cases due to challenges in integrating information systems across the various tiers of government, slowing down the response.119 The lack of digital and other alternatives has caused widespread dis-ruptions in non-COVID health care across the country.120 Some emergency social assistance that was approved by the Government, such as Kartu Prakerja (pre-employ-ment card, repurposed as temporary cash assistance to unemployed workers), faced critical delays in deployment due to difficulties in verifying the identities of recipients.
Indonesia has taken some measures to apply digital tech-nologies to deal with the crisis at hand, but opportunities exist to further accelerate the adoption not just to build resilience for future shocks but also to strengthen the Government’s ability to support a more inclusive future. For example, to support students likely to fall behind in their learning due to limited connectivity, the Gov-ernment introduced internet data packages (“airtime subsidy”) for students and teachers to support online learning tools. However, these subsidies do not appear to have had an impact on the share of students using mo-
bile learning apps and/or online schooling for distance learning.121 Other countries are using this opportunity to do far more. For example, Singapore, already one of the global leaders in this area, has ramped up its spend-ing on digital technologies focusing on the development of new technology tools to respond to the COVID-19 pandemic, the development of citizen- and business-cen-tric digital services, system development on the cloud, modernization of government ICT infrastructure, and the advanced use of digital analytics, AI and IoT sensors within the public sector122 Vietnam is digitalizing two of its important national databases to enable e-identification and authentication.123 Brazil has laid out an ambitious digital government transformation strategy for the next two years, which includes, among other things, plans to: (i) strengthen digital identification with a target of is-suing 40 million identities by 2022; (ii) complete the consolidation of 1,500 government websites onto a sin-gle portal; and (iii) develop cloud adoption and provide broader access to open government data.124
Since it is the poorer segments of the population that have been most affected by the pandemic—by job loss-es and income reductions, as well as by the disruption of education—countries that have been able to better harness digital technologies in this manner have also been successful in laying a more robust foundation for inclusive recovery. This chapter examines the landscape on digital technology adoption by the Government of Indonesia, looking at specific service delivery areas such as education and health, which have become more salient during the pandemic, as well as cross-cutting foundation-al areas such as the introduction of digital IDs for online transactions and more wholesale digital transformation of government. The focus is on identifying transformative opportunities and diagnosing some of the key challenges that need to be addressed to realize these opportunities.
170
BEYO
ND U
NICO
RNS:
HAR
NESS
ING
DIGI
TAL
TECH
NOLO
GIES
FOR
INC
LUSI
ON I
N IN
DONE
SIA
CHAP
TER
— 04

→ Indonesia’s nascent EdTech and HealthTech scene has received a major boost during the pandemic
In some policy circles, conversations regarding the role of digital technologies in sectors such as education and health often begin and end with overwhelming optimism about the power of these technologies to inspire a dis-junctive break with the past. In the context of developing countries that typically face complex and deep-rooted challenges in delivering quality services, the “disruptive” promise of these technologies can be especially appealing. Indonesia is no different and, over the years, as the digital economy has grown, so has the number of new entrants in the EdTech and HealthTech scene. According to an online analytics portal125 (Tracxn) there are about 195 EdTech startups in Indonesia mostly established during the 2013–19 period. Of these, 60 companies were still operational and offering a variety of products and services before the pandemic struck.126 Similarly, the Indonesian HealthTech Association reports that around 250 reg-istered firms are operating in the HealthTech space. 127
Indonesian EdTech companies provide a range of services and products: (i) targeted at students to help them with learning and upskilling; (ii) targeted at educators to as-sist them with student management, communication and teaching; and (iii) targeted at educational institutions to help them with administration. For example, companies such as Ruangguru, Zenius and Quipper develop and provide self e-learning content, interactive learning plat-forms and study tools that help K-12 students expedite the learning process, along with interactive online services that help students with their assignments and test preparation. Companies such as Arsa Kids, Digikids and Educa Studio develop game-based and blended-learning experiences, including interactive storybooks and educational mobile apps, to help improve early childhood educators’ effec-tiveness. These products and services are typically dissem-inated using several approaches, such as web-based and mobile-based applications. As a response to elevated digital
adoption by educational institutions during the pandemic, the Government and some EdTech companies have also created teacher-training modules to help teachers upskill by covering pedagogical and professional subjects, such as classroom management, implementing project-based learning, tracking student performance, etc.128
On the HealthTech side, innovative products and ser-vices are geared toward providing health services remote-ly (telemedicine) through apps and websites, as well as cloud-based solutions for hospital information manage-ment systems. While telemedicine generally covers vari-ous health services, including consultations with doctors, the provision of diagnosis, treatment and preventive care, telemedicine in Indonesia is relatively new and still lim-ited primarily to teleconsultation. For example, companies such as Halodoc and Alodokter—considered the most well-funded firms in the market—connect patients to medical doctors to do online consultations.129 Hospital information management systems have traditionally been offered by software developers and vendors catering for tailored solutions for hospitals. However, more recently, new firms such as Medico and Periksa.id have started to offer cloud-based services (software-as-a-service).
The interest in these applications soared after the COVID-19 outbreak. In Q2 2020, the number of new users on Zenius jumped twelve-fold over the previous year.130 Ruangguru, which had been growing steadily even before the pandemic, reported a jump in web-hits from around an average of 7.5 million to over 11 million per month. Industry estimates suggest that the usage of telemedicine apps in Southeast Asia increased by a factor of 4.5 in March 2020 (at the peak of the COVID-19 out-break) compared with January 2020 usage. The number is consistent with growth seen by some of the prominent players in Indonesia. Halodoc reported its monthly active users increasing by a factor of 10 during the pandemic compared with the fourth quarter of 2019, while Alo-dokter claimed to have experienced a 1.5 times increase compared with the pre-COVID-19-outbreak period.131 Some of the larger digital platforms previously not en-gaged in the space have also expanded their offerings to include health services (e.g., Grab-Health).
4.2. EdTech, HealthTech and the Role of Digital Technologies in Education and Health
171
BEYO
ND U
NICO
RNS:
HAR
NESS
ING
DIGI
TAL
TECH
NOLO
GIES
FOR
INC
LUSI
ON I
N IN
DONE
SIA
CHAP
TER
— 04

→ While these apps have clearly filled a void during the pandemic, their overall reach is limited to the more affluent clientele in urban centers, mostly within Java
In addition to an increase in volume, there have also been changes in the way people have started using some of these apps. For exam-ple, whereas respiratory issues accounted for just 24.5 percent of all consultations through Halodoc before the pandemic, these now ac-count for half of all consultations, suggesting that pandemic-related health issues themselves, as well as possible fear of exposure during a physical visit to health facilities, have driven this growth. Growth in EdTech apps has also been driven by teachers and schools increas-ingly experimenting with various products to try and figure out remote learning tools that work for them.
While these services are clearly filling an im-portant gap, especially during the pandemic, the reach of these digital solutions remains highly urban and Java-centric, and usage is higher among the relatively better off. The pandemic has exposed a digital divide that limits the penetration of the EdTech products and their potential to complement tradition-al teaching methods. This digital divide has been widening the education gap in Indone-sia, since many students from lower socioeco-nomic groups not only lack the resources to access online learning solutions but also lack supportive home environments.132 According to a nationally representative survey conduct-ed a few months after the pandemic outbreak, more than 83 percent of households in Jakarta were found to be providing some form of learn-ing activities using mobile apps and/or online learning to their children. The number was sig-nificantly lower in other parts of Java (43 per-cent), and even lower outside of Java (38 per-cent) (Figure 4.1). While on average 54 percent of all Indonesian families took up some form of digital learning to minimize the disruption in the education of their children, the option was available to only 38 percent of families in the bottom 40 percent of the income distribution. Lack of complementary inputs such as support-ing ICT devices (smartphones, computers) and
FIGURE 4.1
Better off households and those in Jakarta are more likely to do online learning during the COVID-19 pandemic
SHARE (%) OF HOUSEHOLDS ENGAGED IN LEARNING ACTIVITIES WITH MOBILE LEARNING APPS AND/OR ONLINE SCHOOLING
Source: World Bank Round 2 HiFy Household Survey 2020, World Bank staff calculations.Note: Samples are households with students who had been engaged in learning activities at home since March 2020.
FIGURE 4.2
Distribution of Halodoc transactions across regions
Source: World Bank staff calculations based on Halodoc data.Note: Pre-COVID refers to three months before the first COVID-19 case was identified in Indonesia (i.e., November to January 2020); Post-COVID refers to three months after the first COVID-19 case was identified (i.e., February to April 2020).
172
BEYO
ND U
NICO
RNS:
HAR
NESS
ING
DIGI
TAL
TECH
NOLO
GIES
FOR
INC
LUSI
ON I
N IN
DONE
SIA
CHAP
TER
— 04

limited access to good-quality internet are re-ported to be the main reasons behind this ob-served pattern. To avoid widening this educa-tion gap further, the Ministry of Education and Culture (MoEC) needs to create differentiated solutions for students and teachers with limited access to digital infrastructure during the pan-demic. For example, it could invest in teacher training modules to help teachers adapt to new learning methods, deliver support and guidance for parents to provide more a supportive learn-ing environment at home, and establish more open-air schools or schedule regular teacher visits.133 Following the pandemic, connecting all schools to reliable, high-speed internet is both possible and essential.134
The regional breakdown of all Halodoc trans-actions before and after the pandemic shows a similarly limited geographic reach. Before the pandemic, around half of all transactions were accounted for by Jakarta and West Java. With the exception of Sumatra, which accounted for about 11 percent of all transactions, only a small proportion of transactions were in islands off-Java (Figure 4.2). Similarly, most EdTech services are also largely concentrated on Java, with Jakarta being the largest market (Figure 4.3). As large population centers with higher levels of aggregate human capital, cities in Java also have large concentrations of high school students who are among the demographic most likely to be users of EdTech products to, among others, prepare for university entrance exams. Given that they live in the relatively more af-fluent parts of the country, the willingness to pay for these products is also higher in these places.135
→ Digital innovations led by the private sector help enrich the menu of options, but the truly transformative impact, specifically from the perspective of inclusion, is likely to come from the Government experimenting with and internalizing some of these innovations to enhance service delivery
FIGURE 4.3
Most EdTech services are concentrated in Jakarta
DISTRIBUTION OF FIRMS BY GEOGRAPHIC PENETRATION OF THEIR PRODUCTS (PERCENT OF SURVEY RESPONDENTS)
Source: World Bank EdTech Report 2020.173
BEYO
ND U
NICO
RNS:
HAR
NESS
ING
DIGI
TAL
TECH
NOLO
GIES
FOR
INC
LUSI
ON I
N IN
DONE
SIA
CHAP
TER
— 04

Massive-open-online-courses (MOOCs), once regarded as one of the groundbreaking educational innovations of the past decade, have had limited success. Completion rates have remained below 5 percent for many years now, with lack of coordination and direction considered to be among the main contributing factors.136 Even with the widespread pivot toward online education induced by the pandemic, an interesting trend that has been observed throughout the world is how the specific technologies that have been adopted for the purpose have sought to replicate the classroom environment instead of deviating from it or improving upon it. Relatively better endowed schools, even in Indonesia, have taken to Zoom-classrooms, while across the country WhatsApp has provided a medium for student-teacher interactions. Even as education has moved online, the pandemic has ended up underscoring the inherent irreplaceability of student-teacher interac-tions.137 Despite the potential promise of adaptive and personalized learning, one of the hurdles that EdTech firms need to overcome in the short term is to come up with solutions that help to replicate/substitute/comple-ment the classroom experience.
The EdTech and HealthTech sectors in Indonesia face several challenges to their growth. These include difficul-
ties with financing, lack of digital talent in the market-place, and poor regulatory clarity, including on sensitive topics such as consumer protection and personal data protection, etc. A vibrant innovation ecosystem that ex-tends the frontiers of these solutions is something Indo-nesia should certainly strive for. However, as experience from the more developed parts of the world shows, as well as the current level of coverage and usage of these private sector-led initiatives within Indonesia indicate, digital technologies should perhaps not be thought of as tools to displace the traditional modes of service delivery, but ones to help enhance them. So, rather than a multitude of options with EdTech and HealthTech initiatives bringing about disruptive transformations in these sectors, bigger gains are likely to come from the Government’s readiness to experiment with and internalize some of these digital solutions to chip away at brick-and-mortar challenges.
Similarly, in health, in-depth interviews with some doc-tors providing teleconsultations reveal that telemedicine is likely to be most useful for early-stage diagnosis and educating patients. It is also likely to be useful for certain areas of medicine, such as mental health issues, that carry a certain stigma in Indonesia and where patients may feel more comfortable discussing matters through the digital
174
BEYO
ND U
NICO
RNS:
HAR
NESS
ING
DIGI
TAL
TECH
NOLO
GIES
FOR
INC
LUSI
ON I
N IN
DONE
SIA
CHAP
TER
— 04

medium. But for a broad range of other medical consul-tations, doctors regard being able to physically examine patients as an indispensable part of the diagnostic process.
The Government has already been experimenting with some of these technologies. In education, there have been multiple efforts to make material available online. Portal Rumah Belajar is an online learning platform equipped with complete multimedia education content managed by MoEC. Universitas Terbuka, a state university focusing on distance learning, also offers extensive open educa-tion resources (OER). More recently, the Government has begun thinking about a back-office online tool for schools to manage procurement, self-learning modules for teachers, and modularized online curricula to enable teachers to teach children to the right level of competency. Similarly, in 2018, the Ministry of Health launched its own teleconsultation platform, called Sehatpedia. BPJS Health, which manages Indonesia’s national health insur-ance scheme, launched its own smartphone application, JKN Mobile, in 2017, which initially served as a mem-ber management tool to help all citizens manage their membership, including for invoicing, payment, and the verification of claims. Another example is district-based
health-care services, such as the one introduced by Kota Makassar in 2015, which provides 24-hour homecare and tele-medicine services to its residents.
A key challenge with all these efforts—and a theme we will return to at the end of this chapter—is to move away from ad-hoc piecemeal solutions to a more comprehen-sively thought out whole-of-government approach to the broader digital transformation of government and service delivery. Another foundational challenge is connectivity. As discussed in Chapter 2, fixed broadband penetration in Indonesia is very low compared with Indonesia’s regional peers. This is an especially binding constraint for insti-tutional users such as schools, hospitals and other health facilities, which may want to intensify their use of digital technologies to enhance service delivery. For example, of all the 219,000 schools under MoEC, just 10 percent had access to fixed broadband connections in 2019, 42 percent had some form of mobile broadband connectivity, while a significantly large share (45 percent) was not connected at all (Figure 4.4). Closing these connectivity gaps, not just in schools but also in other important service delivery nodes, will be a crucial step in harnessing digital technol-ogies for greater inclusion in post-pandemic Indonesia.
FIGURE 4.4
Only around 10 percent of all schools are connected to fixed broadband
SCHOOLS CONNECTION BY TYPE, % OF SCHOOLS
Source: Dapodik, MoEC 2019.
175
BEYO
ND U
NICO
RNS:
HAR
NESS
ING
DIGI
TAL
TECH
NOLO
GIES
FOR
INC
LUSI
ON I
N IN
DONE
SIA
CHAP
TER
— 04

→ For people to be able to fully participate in the digital economy, and carry out official and high-value transactions online, countries need to introduce digital ID systems—a need that has been accentuated by the COVID-19 pandemic
The ability of a person to verify her/his legal identity is often a prerequisite to their ability to access services and exercise many rights. A service provider expects to have trust that the person in front of them is indeed who she/he claims to be. New mechanisms known as digital ID systems138 are needed to enable people to establish and verify their legal identity in a reliable, secure, privacy-preserving and remote manner, without the need for a physical intervention, such as having to go to an office or posting a document. Digital ID systems for online transactions are a natural progression from national ID systems, which have been used predominately for in-person transactions, including in Indonesia, because a physical ID card cannot be used remotely over the internet.
Digital IDs make use of technologies such as smartphones and cryptography to provide such security and assurance for remote interactions. They can be issued by a single entity (cen-tralized) or by multiple entities in an ecosystem (federation). Emerging standards are also creating opportunities for decen-tralized models where the digital ID is stored on a personal device or digital wallet.
Well-designed and implemented digital ID systems can unlock an enormous amount of economic value, estimated by the McK-insey Global Institute to be between 3 and 13 percent of GDP by 2030.139 The benefits of digital ID can be described as follows:
• Promoting inclusion: Digital ID systems can facilitate inclusion when they are universally accessible and usable. Aadhaar, India’s digital ID system, contributed to increas-ing financial inclusion from 35 percent in 2011 to 80 per-cent in 2017, by making it cheaper and easier for people to satisfy know-your-customer (KYC) requirements for bank account opening.
• Shifting services to digital channels: A person with in-ternet access and an officially recognized digital ID should
be able to access all available services online. Citizens and e-residents of Estonia can use a digital ID combined with electronic signature capabilities to carry out more than 99 percent of government transactions completely on-line, without visiting an office or using any paperwork. For many developing countries, this can be a key cost-efficient strategy for making services available to more people, es-pecially those in remote and underserved communities.
• A platform for other digital economy transactions: Be-cause they identify people, digital IDs can be the basis of dependent value-added functions, such as electronic signatures for entering into contracts, digital payments, and allowing people to exercise control over their personal data. Singapore’s MyInfo service, which allows citizens and residents to manage and share their personal data from trusted government sources, is built on the national digital ID system, SingPass, to link a person to their own data and to allow them to provide consent for its use and re-use.
• Enabling cross-border transactions: Digital IDs can be recognized across borders for doing business. In the Eu-ropean Union, the eIDAS regulation and proposed reg-ulation for decentralized digital identity wallets govern a framework in which a digital ID issued by one member state is recognized for all official transactions in other member states, meaning that trade and business can be carried out without needing to be physically present in another country.
→ The COVID-19 pandemic has revealed that digital ID systems stand alongside accessible and affordable internet connectivity as a core national infrastructure, and are central to achieving resilienceWith quarantines and the scaling-down or shutdown of many government and commercial operations, countries had to try to rapidly shift services to digital channels to keep them going. Countries that had invested in and built strong digital ID sys-tems before the pandemic were by and large better able to do this than countries that had not. Estonia, Singapore, the United Kingdom and other digitally advanced countries were able to reduce disruption for their public service delivery. But the differ-ence was particularly telling in terms of whether countries were able to deploy quick, accurate and effective social protection measures to mitigate the shocks and to safeguard livelihoods.
4.3. Introduction of Digital Identification
176
BEYO
ND U
NICO
RNS:
HAR
NESS
ING
DIGI
TAL
TECH
NOLO
GIES
FOR
INC
LUSI
ON I
N IN
DONE
SIA
CHAP
TER
— 04

This most critically included reaching populations such as in-formal workers who were difficult to target because they were not present in either databases of people living in poverty or databases of people contributing to social security.
Thailand, for example, built a website to allow informal work-ers to apply for emergency payments online, using its national ID system to verify the identities of applicants, establish their uniqueness and determine their eligibility by cross-checking government databases. Since national IDs were already linked to bank and mobile money accounts, there was added assurance that the cash transfers would reach their intended beneficiaries. Over a few weeks, more than 28 million citizens applied, with more than 15 million deemed to be eligible. Payments began for some within days of applying. In Chile and Peru, social registries were used to expand existing social assistance programs and citizens could use their digital ID to access a portal that allowed them to check to see if they were included.
→ Digital ID systems can provide enormous benefits, but they are not easy to build. If not well-designed and implemented, they come with risks that include exclusion and privacy breaches
While many countries have introduced digital ID systems, there has been mixed success in terms of realizing systems that are truly inclusive and trusted. Success comes in the form of widespread adoption by the population and by service pro-viders, and impacts such as enhanced access to services, cost savings and productivity gains. Low- and middle-income econ-omies have a great opportunity to introduce digital ID systems, since they have fewer legacy systems to overcome, which have constrained the development of digital ID systems in some high-income countries.
The challenge is that country experience will vary, but there are some commonalities. First, issues around identity and ID systems often antagonize social, cultural, political, econom-ic and legal fault lines. It is therefore crucial that design and implementation reflect the local context, and are informed by meaningful consultations with a wide set of stakeholders, including civil society, and that ‘analog’ enablers, such as a comprehensive legal framework for the digital ID system and data protection more broadly, are in place. Second, since digital ID systems are ‘new’ and may be replacing existing systems or processes, including potentially previously failed digital ID system projects, there can be inertia or legacy challenges. Third, the absence of compelling use cases across both the pub-lic and private sectors will lead to weak demand from the pop-ulation, and thus low adoption and impact. Fourth, the system design, including chosen technologies, may not be compatible with the local context. For example, a country that has low rates of smartphone ownership should not expect widespread
FIGURE 4.5
Digital ID systems depend on having strong foundational ID systems in place
Source: Analysis by the World Bank Group’s Identification for Development (ID4D) Initiative.
177
BEYO
ND U
NICO
RNS:
HAR
NESS
ING
DIGI
TAL
TECH
NOLO
GIES
FOR
INC
LUSI
ON I
N IN
DONE
SIA
CHAP
TER
— 04

adoption of a digital ID that depends on such devices. Fifth, a country may not have the pre-requisites of trusted identity data and mechanisms to verify those data (Figure 4.5), and may instead need to focus on building those. Finally, the knowledge asymmetry that sometimes exists between governments and technology vendors can lead to unfavorable contracts and PPPs that may have long-term consequences.
The three most common risks related to digital ID systems are: (i) exclusion; (ii) data protection and privacy breaches; and (iii) vendor and technology lock-in. Exclusion refers to preventing people not just from registering for a digital ID but also using a digital ID, such as by using technologies or processes that are not compatible with the local context, as described above. Data protection and privacy breaches require a dual approach of developing comprehensive legal frame-works that ensure accountability, including independent oversight. Vendor and technology lock-in comes in various forms, such as the use of proprietary data formats or depen-dence on a technology provider to maintain a system without knowledge transfer. This can be mitigated somewhat through the adoption of open standards, open-source software where appropriate, competitive procurement, and strong contract and vendor management. The ten Principles on Identification for
Sustainable Development (Figure 4.6), which have been endorsed by 25 international organizations, offer a guiding framework on how these risks can be mitigated and how the full benefits of digital ID systems can be realized.
→ While Indonesia does not yet have an official digital ID system or ecosystem that would allow Indonesians to securely verify their legal identity online, the existing national ID system is an asset could be leveraged to create one relatively easily
The Ministry of Home Affairs and the Ministry of Commu-nications and Information have expressed strong interest in designing and launching an official digital ID system. In the absence of such a system, online service providers are using unreliable and insecure mechanisms to verify the identity of Indonesians online, such as requesting customers to take sel-
FIGURE 4.6
The Principles on Identification for Sustainable Development provide a guiding framework on how countries can realize the transformational potential of digital ID systems, while mitigating the risks
Source: World Bank Group’s Identification for Development (ID4D) Initiative 2021.
1. Ensure universal access for individuals, free from discrimination
2. Remove barriers to access and use.
INCLUSION
DESIGN
GOVERNANCE
3. Establish a trusted—unique, secure, and accurate—identity.4. Create a responsive and interoperable platform.5. Use open standards and prevent vendor and technology lock-
in.6. Protect privacy and agency through system design.7. Plan for financial and operational sustainability
8. Protect personal data, maintain cybersecurity, and safeguard people’s rights through a comprehensive legal and regulatory framework.
9. Establish clear institutional mandates and accountability. 10. Enforce legal and trust frameworks through independent
oversight and adjudication of grievances.
178
BEYO
ND U
NICO
RNS:
HAR
NESS
ING
DIGI
TAL
TECH
NOLO
GIES
FOR
INC
LUSI
ON I
N IN
DONE
SIA
CHAP
TER
— 04

fies holding the national ID card (KTP-el). While this is a practical workaround, some fintech providers have reported that as many as 60 percent of customers provide selfies that are unreadable or require manual intervention, such as a video call, creating unnecessary expense and challenges. More recently, licensed e-signature provid-ers have begun offering basic digital ID authentication services (i.e., going lower in their value chain), but these are based on commercial relationships with the service providers and require the charging of higher fees in order to make a profit. Other third parties have emerged of-fering ID authentication services, but again these charge substantial fees. For example, the Kartu Prakerja web-site had to purchase facial recognition services from a private company when it rolled out applications during the COVID-19 pandemic. Similar constraints exist for face-to-face transactions as, despite some pilots, the Directorate General for Population and Civil Registra-tion (Direktorat Jenderal Kependudukan dan Pencatatan Sipil, Dukcapil) under the Ministry of Home Affairs has not yet launched biometric authentication or electronic know-your-customer (e-KYC) services nationwide.
There is substantial demand for digital ID in Indonesia across the public and private sectors. E-KYC and digi-tal ID remains one of the priority issues for the financial sector, from banks to fintech companies. Likewise, gov-ernment agencies such as BPJS Employment and BPJS Health are trying to transform the way they offer services to citizens, including by shifting to online channels, but are hampered by the absence of an accessible and afford-able digital ID system. At the regional level, there is an opportunity for mutual recognition arrangements to en-able cross-border transactions as a stepping-stone toward a broader ASEAN-level arrangement, which has been called for in the ASEAN 2025 Digital Masterplan. Beyond ASEAN, there is also an opportunity for mutual recog-nition arrangements with the European Union (eIDAS), Australia, the United States and Canada, among others.
Indonesia’s national ID system, which is managed by Dukcapil, is well-established and provides a strong basis for introducing a digital ID system or framework of sys-tems. It builds on a long tradition of civil registration—the recording of births, deaths, and marriages—that was introduced in various ways during the colonial period and continued after independence in 1945. The most re-cent modernization was a large IT project that started in 2011 and launched the new KTP with an electronic chip (KTP-el), which was provided free of charge to citizens, introduced biometrics (fingerprint, iris and facial rec-ognition), and enhanced the population registry (Sistem Informasi Administrasi Kependudukan, SIAK) and other Dukcapil functions. The biometrics system was able to assist with removing duplicates in the SIAK, as well as to enable identity verification.
Coverage of the existing national ID system is high at the national level, with some geographic disparities and gaps in registering the births of children. According to the 2017 ID4D-Findex survey, 96 percent of Indonesians aged 16 and over have a KTP or a KTP-el. The 2018 SUSENAS found that 94 percent of Indonesians have an ID number (Nomor Induk Kependudukan, NIK), but with coverage gaps in Papua (where only 52 percent of the population have a NIK) and among children (of which only 75 percent have a NIK). Notwithstanding these gaps, which Dukcapil has committed to swiftly close, achieving this high level of coverage is a considerable accomplishment, considering the population size, diversity and geography of Indonesia.
→ Digital ID is a ‘low hanging fruit’ for Indonesia to make services more inclusive, to promote trust in the digital economy and society, and to create new drivers of economic growth. Doing so will also allow Indonesia to join all its fellow middle and high income ASEAN Member States who have launched whole-of-economy digital ID frameworks.
179
BEYO
ND U
NICO
RNS:
HAR
NESS
ING
DIGI
TAL
TECH
NOLO
GIES
FOR
INC
LUSI
ON I
N IN
DONE
SIA
CHAP
TER
— 04

In addition to digital ID, another important and broader pathway to harnessing digital technologies for greater in-clusion is by enabling these technologies to fundamentally transform the quality of citizen-state interactions. This could be for specific services, such as education, health and social protection, but also for a whole host of other services that could be improved significantly by a broader digital transformation of government. As discussed in Chapter 1, Indonesia is behind regional peers and compar-ator countries in terms of its readiness to provide effective digital services to its citizens. There are many challenges hindering government digitalization and, as discussed in Chapter 2, limited connectivity, particularly to fixed broadband, is chief among them. Connectivity in public facilities such as schools, health posts and government agencies at the central and local levels is low, and mak-ing progress on this is a crucial necessary step. The key challenge will be to transition from the current siloed structure of multiple, incompatible government infor-mation and data management systems to a whole-of-gov-ernment, platform-based approach, which has emerged as best practice in many economies globally. Related to that is the need to establish clear leadership and coordination for government digital services.
→ The Government has taken some concrete policy measures in recent years to advance its digital transformation agendaOver the years, the Government has made several efforts to digitize government services. Among some of these first-generation efforts, Lapor! and e-Filing are probably the most well-known. Lapor! (which translates to the word “report” in English) is a complaints-handling sys-tem that allows the public to submit reports and complain about any services. Initially developed in 2011 by the Pres-ident’s Delivery Unit, it is now operated by the Ministry of Administrative and Bureaucratic Reform (MenPAN-RB) with support from the Office of the President. Meanwhile, e-Filing is a system to file annual income tax returns on-line managed by the Directorate General of Taxes (DGT) under the Ministry of Finance. It was officially launched in 2015 to make the reporting process simpler for taxpayers. In 2019, 10.6 million, or roughly 97 percent of all annual
income tax reports submitted, were made through the e-Filing system.140 Lapor!, which has now been integrated within 623 government institutions (including 34 minis-tries, 74 line agencies and 515 subnational governments), also has 790,000 registered users and has been receiving around 560 daily reports over the past two years, spiking to 600 during the pandemic.141
There have also been several attempts by local governments to harness digital technologies in their respective domains and for specific purposes. For example, West Java has en-abled motor-vehicle tax payment through an e-commerce platform. Similarly, the province of Jakarta has developed an app (Alpukat Jakarta) that purports to help citizens obtain civil registration documents. While some of these first-generation efforts have been moderately successful in their respective objectives, they have been fairly limited in terms of their scope and often ad-hoc in nature. These agency and subnational entity level attempts to digitalize have resulted in a proliferation of information systems, websites, apps and platforms that have very limited in-teroperability at the front end and create significant du-plication of effort and investment at the back end.
In the past two years, the Government has made a strong effort to address these digital government issues. Two concrete steps to back up this commitment have been the issuance of Presidential Regulation No. 95/2018 on e-Government and Presidential Regulation No. 39/2019 on One Data. The objective of the regulation on e-gov-ernment is to implement an integrated e-government sys-tem by, among others, getting all government agencies to adopt a common and interlinked enterprise architecture, co-using IT systems and establishing a national coordina-tion team to resolve common issues. The One Data regu-lation seeks to facilitate the production and dissemination of high-quality data with a high degree of integrity by requiring agencies to adhere to data governance standards (e.g., standardized metadata, interoperable formats, etc.). In addition, the President recently announced five direc-tives to accelerate digital transformation that included, among others, the preparation of sectoral digital trans-formation roadmaps and accelerating the development of a National Data Center.142 These regulations and the presidential directives set a firm foundation for Indonesia to get started on its digital transformation agenda.
4.4. Digital Transformation of Government
180
BEYO
ND U
NICO
RNS:
HAR
NESS
ING
DIGI
TAL
TECH
NOLO
GIES
FOR
INC
LUSI
ON I
N IN
DONE
SIA
CHAP
TER
— 04

This is a vast landscape and there are several challenges related to common standards, policies and an interoperable framework for core back-office information systems, a government cloud (for sensitive data), a government cloud-first policy to enable the use of commercial cloud solutions for non-sensitive data, a government digital payments platform, and technology acqui-sition and financing. But learning from efforts to implement the e-government and One Data regulations, this chapter fo-cuses on just three high-level issues, namely: (i) leadership and coordination; (ii) digital talent within government; and (iii) the fragmentation of government data. Each of these is a foun-dational challenge that needs to be overcome for Indonesia to further crystallize and realize its digital transformation vision.
Global experience shows that digital transformation of gov-ernment is a complex undertaking and involves multiple stake-holders. In Indonesia, the public sector’s institutional structure
is particularly complex and highly fragmented with multiple agencies having overlapping mandates. (Figure 4.7) This has several adverse implications. First, resources to deliver digital services are thinly spread across the various agencies, with each agency having an incentive to underspend on foundational, in-teroperable common platforms and overspend on agency spe-cific applications. This leads to a waste of resources, as some of the back-end functionalities are likely to be duplicated across the various agencies.
Second, fragmentation naturally also makes coordination a major challenge, which increases the complexity of completing even the simplest of tasks that require cooperation among different stakeholders. For example, MenPAN-RB must work with at least three different deputy ministers within Bappe-nas when discussing and formulating e-government policies. MenPAN-RB must communicate with the Directorate of State
→ Experience in implementing the e-government regulation highlights severe challenges related to the fragmentation and coordination of institutions, stakeholders with overlapping mandates, and the lack of central leadership with the authority to drive the agenda
FIGURE 4.7
Institutional structure of key e-government stakeholders in Indonesia
Source: World Bank analysis, BAKTI, BCG experience, BCG analysis.
POLICYSetting of policies & standards
RESPONSIBLEExecute & complete activities
MEN PAN RB
STRATEGYDefine priorities & roadmap
PROCUREMENTPurchase of project needs
PLANNINGScope & write business cases
OPERATIONSOperate & maintain systems
FUNDINGReview & approve funding
DELIVERYDesign, test & implement
KOMINFO
MEN PAN RB
KOMINFO
BAPPENAS
MEN PAN RB
MOHA
KOMINFOMOF
COORDINATION TEAM
Men PAN RBKOMINFOBAPPENASMOHAMOFBSSNBPPT
KOMINFO
WANTIKNAS, KSP, KPK, BPKand rest of the Government
BPK
LKPP
BPPT
BSNN
BPKP
AGENCIES / MINISTRIES / SNGs
Rest of Government (as and when required)INFORMEDInformed ofactivity & progress
181
BEYO
ND U
NICO
RNS:
HAR
NESS
ING
DIGI
TAL
TECH
NOLO
GIES
FOR
INC
LUSI
ON I
N IN
DONE
SIA
CHAP
TER
— 04

Apparatus to talk about overall planning and budgeting of e-government, with the Directorate of Systems and Procedure to talk about the integration of planning and budgeting, and with the Directorate for Monitoring and Evaluation when dis-cussing the design of national data architecture.
Countries that have made good progress on digital transfor-mation of government have significantly simpler institutional structures. The UK model, for example, is designed to stream-line decision-making processes for major digital government initiatives. (Figure 4.8) The institutional arrangement grants the Government Digital Service (GDS) the autonomy to scru-tinize and assess digital service initiatives that are above cer-tain threshold in terms of financial value. GDS also plays a role in implementation, especially on digital services that cut across multiple sectors and agencies such as Gov.UK (one-stop service), Gov.uk Pay (payment service), Gov.uk Verify (ID service), and Government Cloud. In addition to policy and im-plementation roles, GDS is also responsible for managing the digital, data and technology (DDaT) stream for professionals within the civil service. As the primary agency responsible for driving the digital transformation, GDS has the authority to streamline and simplify the deployment of digital public ser-vices across the entire government machinery. Other countries such as Singapore, the United States, Australia, Canada, and
Italy have some variant of a similar model. Japan is currently discussing a proposal to establish a similar digital service unit within its parliament.143
A coordinating body, such as the GDS in the UK, with au-thority over all relevant stakeholders is necessary to overcome these challenges and drive the agenda. In the absence of such an agency, the digital transformation agenda in Indonesia has not been able to garner any real momentum. One of the integral first steps in the deployment of coordinated digital services as envisioned in the e-government regulation is the streamlining and integration of various applications related to the planning, budgeting and archiving functions used by various agencies. In addition to the planning and budgeting application used at the national level, there are more than 50 planning and budgeting applications that are used by subna-tional governments. More than two years since the regulation was promulgated, the e-government coordination team, which consists of seven line ministries and agencies (Menkominfo, MenPAN-RB, Bappenas, MoF, MoHA, the Agency for As-sessment and Implementation of Technology [Badan Pengka-jian dan Penerapan Teknologi, BPPT] and the National Cyber and Crypto Agency [Badan Siber dan Sandi Negara, BSSN], with MenPAN-RB in the coordinator role) has been unable to convene and agree upon the shared vision of e-government
FIGURE 4.8
UK Government’s cross-sectoral digital transformation governance structure
Source: World Bank analysis, BAKTI, BCG experience, BCG analysis.
POLICYSetting of policies & standards
RESPONSIBLEExecute & complete
activities
GOVERNMENT DIGITAL SERVICES(GDS)
STRATEGYDefine priorities & roadmap
PROCUREMENTPurchase of project needs
PLANNINGScope & write business cases
OPERATIONSOperate & maintain systems
FUNDINGReview & approve funding
DELIVERYDesign, test & implement
CROWN COMMERCIAL SERVICES (CCS)HM
TREASURY
GDS
Rest of Government AGENCIES / MINISTRIES
CABINET OFFICE
AGENCIES / MINISTRIES INVOLVED
AGENCIES / MINISTRIES INVOLVED
INFORMEDInformed ofactivity &
progress
GDS
GDS
ACCOUNTABLEsign off & approve activities
182
BEYO
ND U
NICO
RNS:
HAR
NESS
ING
DIGI
TAL
TECH
NOLO
GIES
FOR
INC
LUSI
ON I
N IN
DONE
SIA
CHAP
TER
— 04

implementation. While this could be partially attributed to the limited capacity to produce alternative solutions and service standards for planning and budgeting applica-tions, lack of leadership plays a key role as well. This kind of integration requires visionary leadership that possesses strong technical knowledge but also political influence to drive change.
The current thinking on digital transformation as embod-ied in the e-government initiative focuses to a large extent on the digitization of internal government processes. Dig-ital transformation should be limited not just to this, but a fundamental reimagination of processes, procedures and structures considering what digital technologies make possible. Looking at the scope in the regulation, the role fits the main duties and responsibilities of MenPAN-RB, which includes the management of government business processes. However, if the Government aims to have a comprehensive digital transformation of the nation, it has to gradually depart from e-government and slowly rearrange its vision, governance, and delivery model to better suit that aspiration. Such a commitment would reorient Indonesia in the same direction as that taken by digitally advanced countries, such as Singapore, the United Kingdom, Australia, Estonia, the Rep. of Korea and Canada.144 The digital government platforms would serve as the foundation of digital services in the economy, so that both public sector institutions and private enter-prises can take advantage of these platforms to deliver
services to every citizen. Examples of a common data exchange platform in Estonia,145 digital single sign on ID in Singapore,146 and digital payments in the United Kingdom147 show how pivotal digital government plat-forms can be in allowing nations to operate effectively in the digital space and to stimulate innovations in the market. The reform would need to be spearheaded by a central government authority such as the Office of the President, to strengthen the political and bureaucratic influence needed for such far-reaching reforms.
If the Government were to consider taking concrete steps in this direction, another key challenge that may emerge would be the level of digital skills within the civil service. Currently, there are around 4 million civil servants (pegawai negeri sipil, PNS) in Indonesia, with over 50 percent com-prising specialist or functional roles (such as teachers). ICT specialists account for just 0.17 percent of the total civil servants. This small number of ICT specialists indicates that the Government has been relying largely on external resources, such as contract workers or third-party vendors, to deliver ICT solutions. While collaboration with external parties is to be expected and welcomed, without strong in-house capability, the sustainability of ICT initiatives remains at risk. Going beyond ICT specialists, if a broad-er digital transformation strategy is to be conceived and implemented, the Government may need to nurture an entirely new cadre of programmers, software developers and data scientists to support these efforts.
183
BEYO
ND U
NICO
RNS:
HAR
NESS
ING
DIGI
TAL
TECH
NOLO
GIES
FOR
INC
LUSI
ON I
N IN
DONE
SIA
CHAP
TER
— 04

→ Fragmentation of government data is another important challenge that needs to be overcome to bring about digital transformation
Data are foundational. Data fragmentation keeps govern-ment institutions from functioning efficiently and impinges on their ability to deliver effective services. The COVID-19 pandemic has focused a spotlight on this issue.148 A case in point is the national health insurance system managed by BPJS Health. The Government needs to link BPJS Health participants with their national ID number (NIK), which is issued and managed by the Ministry of Home Affairs. For those who are poor and eligible for social assistance, the database of BPJS Health also needs to be linked with
the Unified Social Welfare Database (Data Terpadu Kese-jahteraan Sosial, DTKA) of the Ministry of Social Affairs. Furthermore, to ensure compliance, BPJS Health needs to be connected to the tax ID system of the Ministry of Finance. To verify enrolment, the system must also have interconnectivity with health facilities and health records. This does not necessarily mean that the Government needs to unify everything. What it could do is ensure a minimum level of inter-connectedness and interoperability of these data systems (Figure 4.9). The use of digital technologies can facilitate this process and, indeed, digitally intercon-nected and interoperable data systems are a cornerstone of digital transformation of government.
The presidential regulation on One Data aims to address the challenges of data fragmentation across government agencies by regulating agencies to comply with data gov-ernance, ensuring data adhere to standards, standardized
FIGURE 4.9
Fragmented data and overly complex interdependence prevents BPJS Kesehatan from running efficiently
Source: World Bank analysis,
184
BEYO
ND U
NICO
RNS:
HAR
NESS
ING
DIGI
TAL
TECH
NOLO
GIES
FOR
INC
LUSI
ON I
N IN
DONE
SIA
CHAP
TER
— 04

FIGURE 4.10
One Data as an opportunity to address data fragmentation
Source: KSP 2019.
metadata, and interoperability format. One Data follows in-ternational practices in data management and establishes the high-level institutional arrangement and division of roles among institutions in relation to government data management. The regulation also specifies a governance structure that includes a One Data steering committee, data stewards, data custodians, and data producers (Figure 4.10). The steering committee, chaired by Bappenas, is responsible for laying out the broader data policy, while data stewards (pembina data) are tasked to work as business owners of the data, and responsible for defining and enforcing data standards in their respective sectors. The regulation identifies three data stewards: BPS for statistical data, MoF for financial data, and the Geospatial Information Agency (Badan Informasi Geospatial) for geospatial data. Data custodians (wali data) are supposed to be technical custodians and the focal points for data-sharing and exchange. Finally, data producers are the frontline of data collection in their respective agencies, and are responsible for collecting the data in accordance with
the standards that are defined by the data stewards. As head of the steering committee, Bappenas is tasked with the regulation, monitoring and enforcement across the entire government.
While the One Data regulation has laid the necessary foun-dations to enable better data governance, several challenges have emerged in its implementation. First, One Data appears silent on the role of administrative data, which is an important omission given the foundational nature of these kind of data generated by government agencies in a variety of relevant sec-tors. Second, the intersectionality of the One Data regulation with other relevant initiatives, such as e-Government/Digital Government (Presidential Regulation No. 95/2018), the Elec-tronic Transaction Law and its implementing regulation (PP No. 82/2012 and its revision PP No. 71/2019), the forthcoming Personal Data Protection Law149, the Civil Registry Law, the Digital Payment Regulation, and the Omnibus Law is another area that requires further clarity.150
INDONESIA
DATASTEWARD
SECRETARIAT
ONEDATA
STREERING COMMITTEESTEWARD FOR
STATISTICAL DATASTEWARD FOR
FINANCIAL DATASTEWARD FOR
GEOSPATIAL DATA
DATA CUSTODIAN K/L/DDATA CUSTODIAN K/L/D
DATA PRODUCER K/L/DDATA PRODUCER K/L/D
185
BEYO
ND U
NICO
RNS:
HAR
NESS
ING
DIGI
TAL
TECH
NOLO
GIES
FOR
INC
LUSI
ON I
N IN
DONE
SIA
CHAP
TER
— 04

4.5. Conclusions
This chapter has looked at the opportunities and chal-lenges that Indonesia faces in using digital technologies to deliver better services to its citizens. Unlike many other countries around the world that have been able to utilize digital technologies to deal with the public health aspects of the pandemic, as well as provide rapid economic re-lief to the affected population, Indonesia has not had the digital readiness to do so as effectively as it could. The increased adoption of digital technologies and lessons learned from the pandemic create a great opportunity for Indonesia to invest in the foundational elements of a broader digital transformation of government, not only to build resilience for future shocks, but also to address the fundamental challenge of economic and social inclusion in the medium term.
On critical services such as education and health, the na-scent EdTech and HealthTech sectors have seen an ex-plosion of interest, which has also been followed by an infusion of new capital. However, this chapter finds that the reach of these innovative solutions from the private sector remains limited, as they cater primarily to the rel-atively more affluent households in the more prosperous places within the country that have more access to digital infrastructure. Even as learning has moved online and the fear of exposure has led many health-care seekers to take up teleconsultations, the pandemic has in a way also underscored the fundamental irreplaceability of the face-to-face interactions in the delivery of key services such as education and health. What this implies for policy is that, while the challenges in the innovation ecosystem should be addressed to continue to foster an environment for
the private sector to come up with innovative tools, true transformation will ultimately depend on the extent to which the Government itself can experiment with and adopt some of these tools to bring about incremental improvements in efficiency. One barrier to doing this is limited internet connectivity, especially the more robust connectivity that comes in the form of fixed broadband, in key service delivery nodes.
The chapter also identifies the adoption of robust, reli-able and highly interoperable digital IDs as a potential game-changer in the way the Government and the pri-vate sector provide a broader set of services to its people. Assessing progress on the recent the government regu-lation on e-government, the chapter identifies coordi-nation across a variety of fragmentated initiatives and stakeholders with overlapping mandates, a lack of digital skills and awareness within the bureaucracy, and the lim-ited integration and interoperability of government data systems to be key bottlenecks for progress. Rather than a heterogeneous agency-by-agency approach to digitaliz-ing government, the chapter calls for a ‘whole-of-gov-ernment’ approach that establishes common standards, practices, and interoperability across a variety of use cases. Assessing the current institutional landscape, the chap-ter also concludes that the coordination and leadership required to embark on such an ambitious agenda would need to come from a higher-level authority, and propos-es a digital transformation agency, potentially reporting directly to the President. Details on what this agency might look like and other recommendations for policies are presented in Chapter 5.
186
BEYO
ND U
NICO
RNS:
HAR
NESS
ING
DIGI
TAL
TECH
NOLO
GIES
FOR
INC
LUSI
ON I
N IN
DONE
SIA
CHAP
TER
— 04

114 Open Gov Asia, 2020.
115 ILO, 2020.
116 Rutkowski, et.al., 2020.
117 Yarrow et al. 2020.
118 Indonesia High Frequency Monitoring of Covid-19 Impacts Round 4, World Bank 2021.
119 Tempo, 2020.
120 Between April and May 2020, almost 80 percent of Posyandu (integrated maternal and child health and nutrition posts at the village level) were closed. Community-based outreach activities also report-ed significant disruptions with more than 40 per-cent ceasing operation. It is also reported that 86 percent of child growth monitoring activities, 55 percent of immunization services, 46 percent of Vitamin A distribution and ante-natal services were suspended or ceased due to these health posts closing down.
121 Indonesia High Frequency of Monitoring of Covid-19 Impacts Round 4, World Bank 2021
122 W Media, 2020.
123 Vietnam News, 2020.
124 Forbes, 2020.
125 Tracxn, 2019.
126 Bhardwaj, Yarrow, and Cali, 2020.
127 Asosiasi Healthtech Indonesia, 2020.
128 KrAsia, 2020.
129 The most updated data on health-tech funding was prepared in September 2019 by Tracxn. (https://tracxn.com/explore/HealthTech-Startups-in-In-donesia). Since then, there has not been any ma-jor announcement of health-tech funding, except for Alodokter’s follow-on funding by MDI Ven-tures in November ’20 (https://theinsiderstories.com/indonesias-alodokter-raises-series-c-fund-ing-from-mdi-ventures/) . In October 2019, Grab and Ping An announced a joint venture to launch Grab Health / Good Doctors Indonesia, but the value of the investment to Indonesia was never dis-closed.
130 Katadata, 2020a.
131 Katadata, 2020b.
132 East Asia Forum, 2020.
133 ibid.
134 World Bank, 2020.
135 Bhardwaj, Yarrow, and Cali, 2020.
136 Rita Kop, 2019.
137 Education experts and practitioners argue that online learning cannot replace offline face-to-face learning. To avail of it one requires sufficient means and technology, which can be exclusive in some countries, and there are psychological and social factors that prevent online interactions from being as effective as offline (Dhawan 2020).
138 For brevity, the term “digital ID system” is used to describe both a single system and an ecosystem/framework that may comprise multiple digital ID systems (e.g., a federation of digital ID systems). See more on White et al, 2020.
139 White et al, 2020.
140 This is nevertheless just one-quarter of all regis-tered taxpayers, highlighting the larger problem of tax compliance in the country.
141 Lapor! statistics indicate that in 2019, out of 196,437 complaints, 28,773 (14 percent) were from Java, followed by Sumatra (2 percent). Only around 0.15 and 0.12 percent of the total complaints came from Papua and Maluku. Most complaints came from men (87 percent), moderately well educated (60 percent with more than nine years of educa-tion), and those in the private sector (47 percent).
142 The other three directives relate to expanding dig-ital connectivity, preparing and nurturing digital talent and mobilizing financing to commence dig-ital transformation.
143 Japan Times, 2020.
144 The group of leading digital nationals: https://leadingdigitalgovs.org/
145 Estonia’s Data Exchange Platform or widely known as X-Road: https://e-estonia.com/solutions/in-teroperability-services/x-road/
146 Singapore ID Service or Singpass: https://www.sing-pass.gov.sg/spauth/login/loginpage?URL=%2F&-TAM_OP=login
147 UK Payment Service Platform: https://www.pay-ments.service.gov.uk/
148 Christy Pettey. 2019.
149 Bisnis.com, 2020.
150 For example, data residency and data sovereignty related issues in the Personal Data Protection Law are likely to have implications for implementation regulations for One Data.
Endnotes
187
BEYO
ND U
NICO
RNS:
HAR
NESS
ING
DIGI
TAL
TECH
NOLO
GIES
FOR
INC
LUSI
ON I
N IN
DONE
SIA
CHAP
TER
— 04

References1 Alifia, Ulfah. 2020. “COVID-19 is widening Indonesia’s education gap”. East Asia Forum. Retrieved from: https://www.
eastasiaforum.org/2020/10/22/covid-19-is-widening-indonesias-education-gap/ (accessed November 16, 2020).
2 Annur, Cindy Mutia. 2020b. “Layanan Telemedicine Diprediksi Tetap Berkibar Usai Pandemi Berakhir.” Jakarta, Indonesia: Katadata. Retrieved from: https://katadata.co.id/ameidyonasution/digital/5f45270a9ad78/layanan-telemedicine-diprediksi-tetap-berkibar-usai-pandemi-berakhir (accessed November 16, 2020).
3 Asosiasi Healthtech Indonesia. 2020. “About.” Asosiasi Healthtech Indonesia, accessed November 16, 2020, https://healthtech.id/about/
4 Bhardwaj, Riaz, Noah Yarrow, and Massimiliano Cali. 2020. “EdTech in Indonesia: Ready for Take-off ?” Jakarta: World Bank.
5 Burhan, Fahmi Ahmad. 2020a. “Strategi Anyar Ruangguru hingga Zenius Gaet Pengguna saat Pandemi,” Jakarta, Indonesia: Katadata. Retrieved from: https://katadata.co.id/desysetyowati/digital/5f6de371e728a/strategi-anyar-ruangguru-hingga-zenius-gaet-pengguna-saat-pandemi (accessed November 16, 2020).
6 Crowley, Stuart. 2020. “Singapore Government looks to accelerate digitalisation and tackle COVID-19 with $3.5 billion ICT spend increase,” Singapore, Singapore: W Media. Retrieved from: https://w.media/news/singapore-accelerate-digitalisation-covid-19-3-5-billion-ict-spend/ (accessed November 16, 2020).
7 Dhawan, Shivangi. 2020. “Online Learning: A Panacea in the Time of COVID-19 Crisis.” Journal of Educational Technology Systems, 49(1):5-22.
8 Evandio, Akbar. 2020. “RUU PDP Wajib Rampung di November Ini.” Jakarta, Indonesia: Bisnis.com. Retrieved from: https://teknologi.bisnis.com/read/20200921/84/1294235/ruu-pdp-wajib-rampung-di-november-ini (accessed November 16, 2020).
9 ILO. 2020. “Social protection responses to the COVID-19 pandemic in developing countries: Strengthening resilience by building universal social protection.” Geneva: ILO.
10 Japan Times. 2020. “Japan to speed up work to launch digital agency”. Tokyo, Japan: Japan Times. Retrieved from: https://www.japantimes.co.jp/news/2020/09/18/national/japan-speeds-digital-agency/ (accessed at November 16, 2020).
11 Kop, Rita. 2020. “The challenges to connectivist learning on open online networks: Learning experiences during a massive open online course.” The International Review of Research in Open and Distributed Learning 12:19–38.
12 Lapor. 2019. “Laporan Tahunan Pengelolaan SP4N-Lapor! Tahun 2019”. Yearly Report.
13 Mari, Angelica. 2020. “The Brazil Tech and Innovation Round-Up: Tech Sector Develops Immunity Passport, Government Digital Strategy Launched, Data Protection Regulations Postponed”, New Jersey, United States: Forbes. Retrieved from: https://www.forbes.com/sites/angelicamarideoliveira/2020/05/01/the-brazil-tech-and-innovation-round-up-tech-sector-develops-immunity-passport-government-digital-strategy-launched-data-protection-regulations-p-ostponed/?sh=52fc93b62881 (accessed November 16, 2020).
188
BEYO
ND U
NICO
RNS:
HAR
NESS
ING
DIGI
TAL
TECH
NOLO
GIES
FOR
INC
LUSI
ON I
N IN
DONE
SIA
CHAP
TER
— 04

14 Mulia, Khamila, 2020. “Edtech platforms step up while Indonesia shuts downs schools in major cities”, Singapore, Singapore: KrAsia, Retrieved from: https://kr-asia.com/edtech-platforms-step-up-while-indonesia-shuts-downs-schools-in-major-cities (accessed March 12, 2021).
15 Pettey, Christy. 2019. “Why Data and Analytics Are Key to Digital Transformation.” Retrieved from: https://www.gartner.com/smarterwithgartner/why-data-and-analytics-are-key-to-digital-transformation/ (accessed November 16, 2020).
16 Purnomo, Wayan. 2020. “Example of data fragmentation problems in Indonesia,” Jakarta, Indonesia: Tempo. Retrieved from: https://majalah.tempo.co/read/nasional/160237/mengapa-data-korban-covid-19-pemerintah-pusat-dan-daerah-berbeda (Accessed November 16, 2020).
17 Rutkowski, Michael, Alfonso Garcia Mora, Greta L. Bull, Boutheina Guermazi, Caren Grown. 2020. “Responding to crisis with digital payments for social protection: Short-term measures with long-term benefits.” World Bank Blog. Retrieved from: https://blogs.worldbank.org/voices/responding-crisis-digital-payments-social-protection-short-term-measures-long-term-benefits (accessed November 16, 2020).
18 Sharon, Alita. 2020. “Malaysia Sets New Digital Learning Ambitions.” Open Gov Asia. Retrieved from: https://opengovasia.com/malaysia-sets-new-digital-learning-ambitions/ (accessed November 5, 2020).
19 Tracxn. 2019. “EdTech Startups in Indonesia”. Retrieved from: https://tracxn.com/explore/EdTech-Startups-in-Indonesia (accessed March 12, 2021)
20 Vietnam News. 2020. “50 million citizen identification cards to be granted,” Retrieved from: https://vietnamnews.vn/society/772149/50-million-citizen-identification-cards-to-be-granted.html (accessed November 16, 2020).
21 White, Olivia, Anu Madgavkar, James Manyika, Deepa Mahajan, Jacques Bughin, Mike McCarthy, and Owen Sperling. 2020. “Digital identification: A key to inclusive growth.” McKinsey Global Institute. Retrieved from: https://www.mckinsey.com/business-functions/mckinsey-digital/our-insights/digital-identification-a-key-to-inclusive-growth
22 World Bank. 2020. “Indonesia High Frequency Monitoring of Covid-19 Impacts Round 4”. Jakarta: World Bank.
23 World Bank. 2020. “The Promise of Education in Indonesia”. World Bank. Retrieved from: http://documents1.worldbank.org/curated/en/658151605203420126/pdf/The-Promise-of-Education-in-Indonesia.pdf (Accessed November 16, 2020).
24 Yarrow, Noah; Masood, Eema; Afkar, Rythia. 2020. “Estimated Impacts of COVID-19 on Learning and Earning in Indonesia: How to Turn the Tide”. Jakarta: World Bank.
189
BEYO
ND U
NICO
RNS:
HAR
NESS
ING
DIGI
TAL
TECH
NOLO
GIES
FOR
INC
LUSI
ON I
N IN
DONE
SIA
CHAP
TER
— 04

Improving access to quality health-care and education services is essential in expanding opportunities for all citizens. In addition to key reforms in the public edu-cation and health-care systems, the use of information, communications and technology (ICT) for education (EdTech) and for health (HealthTech) provision by the private sector holds considerable promise in improving educational and health outcomes.
In line with growing internet penetration and the trend toward increasing private investment in Indonesia’s digital economy,151 the number of new entrants in both EdTech and HealthTech has grown significantly during the past six years. According to an online analytics plat-form,152 there are about 181 EdTech startups in Indonesia. The majority of these firms were established in the period of 2013–19, which follows the trend of increased internet penetration in Indonesia.153 The number of HealthTech firms are slightly higher. According to the Indonesian HealthTech Association around 250 firms have been reg-istered with the organization since its inception in 2018.
Although HealthTech and EdTech have been around for several years, the COVID-19 pandemic has accelerated the adoption of HealthTech and EdTech products, while also facilitating increased private sector investment in these two sectors. In the pre-COVID-19 era, EdTech and HealthTech firms were not prioritized by the ma-jority of private investors in Indonesia, such as venture capital firms, private equity firms, etc. However, more recently, especially following the forced surge in demand for HealthTech and EdTech products, both sectors have started to attract higher investments in more mature, later-stage funding rounds. In EdTech, the most notable deal was Ruangguru’s reported Series C investment of US$150 million in December 2019,154 while in HealthTech Halodoc completed a funding round close to US$100 million in July 2019 from strategic investors such as Pru-dential, Allianz, UOB Venture Management, and the Bill and Melinda Gates Foundation.155 Other notable deals in-clude Zenius’ US$20 million investment in EdTech,156 and Alodokter’s US$33 million investment in HealthTech.157
EdTech and HealthTech firms in Indonesia are very di-verse, with most of them offering more than one product or service, so that they can offer more comprehensive support to their target groups. EdTech firms in Indonesia offer a wide variety of products and services, targeting different users, including parents, educators, students, educational institutions’ managements and corporations. A focus on comprehensive support provision was clear-ly evident soon after it became clear that COVID-19-induced lockdowns would be in place for an extended period of time. School closures due to the COVID-19 crisis pushed students to adopt online learning tools and pushed schools to adopt digital solutions to deliver edu-cation services. To improve online learning experiences, in addition to creating solutions for students, it was im-perative for EdTech firms to enable teachers and parents to understand, utilize and adopt digital solutions effec-tively. Therefore, EdTech companies such as Ruangguru and Zenius went beyond offering solutions exclusively for students to extending support and providing training for parents and teachers to be able to participate in the digital transformation of the education sector.158 Despite the fact that the digital-adoption learning curve has been harder for teachers and parents than students, the pandemic has boosted digital literacy because adopting technology now is a ‘need’ versus merely a luxury.
For the most part, Indonesian EdTech products aim to help students with learning and upskilling, educators with student management, communication and teach-ing, and educational institutions with administration. For example, some of the core products that companies such as Ruangguru, Zenius and Quipper develop and provide are e-learning content, interactive learning platforms and study tools that help K-12 students expedite the learning process, along with interactive online services that help students with their assignments and test preparation. Companies such as Arsa Kids, Digikids and Educa Stu-dio offer game-based and blended learning experiences, including interactive storybooks and educational mo-bile apps, to help improve early childhood educators’ effectiveness. These products and services are typically
Spotlight 4.EdTech and HealthTech Landscape
190
BEYO
ND U
NICO
RNS:
HAR
NESS
ING
DIGI
TAL
TECH
NOLO
GIES
FOR
INC
LUSI
ON I
N IN
DONE
SIA
CHAP
TER
— 04

TABLE S4.1
Description of EdTech products with selected examples159
PRODUCTS / SERVICES DESCRIPTION SELECTED EXAMPLES
Classroom tools Help teachers to implement interactive teaching methods, offering features such as live lectures, discussion forums, cloud-based student response tools and other classroom communication tools.
Google Classroom, Microsoft Teams, Circledoo
Learning Management System
Improve parent-teacher-student communications, monitor student performance and progress, track assignments, share educational content, help teacher auto-generate reports and provide facilities for collaboration amongst teachers and students.
Quintal, Sikad, Codemi, Scola
Online Learning (Broad, mainly Higher Education/ Vocational Courses)
The most common and largest in terms of products in Indonesia, providing educational content across diverse subjects ranging from traditional subjects (math, science, IT, business) to more vocational subjects (such as photography, entrepreneurship, music), through massively open online content—MOOCs, and MOOC-based OPM (online program management) models.
Kelaskita, IndonesiaX, HarukaEDU. HarukaEDU is one of the largest OPM providers that supports universities to convert their offline courses into online learning.
Online Learning (specific to K-12)
Develop and provide content, multiple products and learning material for K-12 students, including self-learning content, interactive learning platforms and study tools that help students expedite the learning process and interactive online services that help students with their assignments. Many companies also place special focus on providing exam preparation solutions for students to prepare for standardized exams, such as national exams (UN and SNMPTN) and entrance exams for state universities.
Ruangguru, Zenius, Quipper, Wardaya College
Digital books / interactive content
convert textbooks and print books into digital books. PesonaEdu (oldest edutech in Indonesia)
Education events marketplace
Provide tickets and information about various events (such as seminars, trainings, competitions, etc.) around university and other educational institution campuses.
Ngampooz
Hardware Provide low-cost digital devices (such as laptops, notebooks, etc.) or enabling hardware technology solutions with built in educational tools.
Google Chromebook, Endless Computer
Language learning Facilitate language learning for non-native speakers either by providing pre-developed content or by connecting the learners with native speakers. Such platforms cater to learners across the age spectrum, whether they are in school or adults looking to develop new language skills.
Cakap by Squline, Bahaso, Kelas Bahasa
Early childhood education
Create educational games and educational toys for children, including interactive storybooks and educational mobile apps.
Arsa Kids, Digikids, Educa Studio, Rabbit Hole
Technology learning offline and online learning solutions that cater specifically to teaching programming and other engineering disciplines.
Hactiv8, Inspira. Academy, Koding Next, Bali Cipta Innovator
Learning Application for Special Needs Children
Provide digital learning solutions and educational content for students with special needs.
Lexipal (learning platform for children with reading difficulties.
Offline-to-online (O2O) Platforms for learners or students to find face-to-face or online tutoring, classes or workshops.
Maubelajarapa, Sukawu, Ngampooz
School Administration Simplify the administrative tasks of schools, such as digitizing transcripts, school fee management and online payments, facilitating school-wide communication, online examination and assignments and admissions support and application tracking.
InfraDigital Nusantara, edConnect, 7Pagi
Social/ Collaborative Learning Platform
Social media-like features to improve peer-to-peer (P2P) communication and collaboration both during class and outside class.
Kelase, UtakAtikOtak
Career Planning and Counselling
Career planning and counselling tools to help students find the relevant universities and majors based on their personality.
Rencanamu (formerly Youthmanual), Ikigai
Student Loans and Finance
Provide lending platforms to offer affordable loans for students to fund their tertiary education and training.
Danacita, DANAdidik, Pintek
Technology Adoption Consulting
Provide support educational institutions to adopt and integrate with available digital solutions to become more productive.
Websis, PesonaEdu
191
BEYO
ND U
NICO
RNS:
HAR
NESS
ING
DIGI
TAL
TECH
NOLO
GIES
FOR
INC
LUSI
ON I
N IN
DONE
SIA
CHAP
TER
— 04

disseminated using several approaches, such as web-based and mobile-based applications (see Table S4. 1 for complete products and services).
As for HealthTech, innovative products and services are geared toward providing distant communications of health-care services (tele-medicine), while firms that offer hospital information management systems gradually shift to cloud-based systems. For example, companies such as Halodoc and Alodokter, considered the most well-funded firms based on the publicly available data, connect patients to health-care professionals (medical doctors) to receive consultations and may lead to drug prescription. Hospital information man-agement systems have been traditionally offered by software developers/vendors that built tailored solutions for hospitals. Recently, new firms such as Medico or Periksa.id have started to offer cloud-based services (software-as-a-service), but strict practices on the management and transfer of medical records
could prevent this type of services to scale (see Table S4. 2 for complete products and services).
Both EdTech and HealthTech sectors are still in their infancy, with the majority of firms engaging in product/market exper-imentation, while responding to changing market needs and digital environment. Ninety percent of EdTech firms surveyed by the World Bank have changed their original business mod-els after identifying new gaps in the sector and/or to achieve greater cost efficiency. In addition, most Indonesian EdTech and HealthTech firms initially offer some features or content for free (freemium pricing model), to attract more users, better understand the market needs and experiment with differential pricing.
The COVID-19 pandemic has propelled many schools, especial-ly those located in urban areas with better internet connections, along with the support of MoEC’s free internet quota, to adopt
PRODUCTS / SERVICES DESCRIPTION SELECTED EXAMPLES
Hospital Information System (Patient data management/ administration)
Help clinic or hospital process and integrate more seamless service flow and delivery (often cloud based), including for document management, record, claim management, and medical record management.
Medico, Periksa.id, trustmedis, doktersiaga.com, klinikgo, sisfomedika
Healthcare marketplace Help the general public to discover and select services from the available healthcare providers
Kuponsehat, Klikhospital, Planetmedika
Tele-consultation The most common and largest in terms of products in Indonesia, offer consultation by remote communication, generally for the purpose of diagnosis or treatment of a patient at a site remote from the patient or primary physician.
Halodoc, Alodokter, Good Doctor, SehatQ, medis sehat
On-demand healthcare Help patients arrange house call / home visit from healthcare professionals (i.e., doctors, nurses, midwives, lab test officers).
Prosehat, perawat.id, Homecare24, Medicall
Health media and community
Provides general health news and information to the public to facilitate the promotion of healthy lifestyle, and often peer exchange.
Pasienia, Klikdokter
Health education Provide online learning tools for the general public or aspiring healthcare professionals on health / medical subjects (content is more in-depth than popular articles).
Jago Preventif, Docquity
AI, IoT, bio-medics Implement ICT and bioinformatics support for healthcare stakeholders. Nalagenetics, Neurabots
Clinical decision support facilities
Health information technology (installed at healthcare worker or patient side) designed to provide health care professionals with clinical decision support.
Sehati - Tele-CTG
Tele-pharmacy and e-prescribing
Delivery of pharmaceutical care via telecommunications to patients in locations where they may not have direct contact with a pharmacist, and through the use of electronic prescriptions.
Halodoc, Klik24
Mobile health (wearable devices)
Smart electronic devices that can be worn on the body as implants or accessories.
Fitbit, Samsung Gear, Apple Watch
Appointment scheduling Application that helps patients to manage appointment across clinics and health-care professionals.
RSPI Mobile
Pharmacy network Facilitates supply and outreach in the pharmaceutical sector among pharmacies, pharmacists and health-care professionals.
mClinica
Financial support (loan, insurance)
Support patients or healthcare facilities with financial offerings, from claim/insurance management to credit/loan options
Qoala
TABLE S4.2
Description of HealthTech products with selected examples
192
BEYO
ND U
NICO
RNS:
HAR
NESS
ING
DIGI
TAL
TECH
NOLO
GIES
FOR
INC
LUSI
ON I
N IN
DONE
SIA
CHAP
TER
— 04

global tools such as Google Classroom or Microsoft Teams. In April 2020, 31.6 percent of teachers reported using learning management platform, including MoEC’s virtual class in Rumah Belajar platform, Quipper School, Quiziz, Google Classroom or Microsoft Teams, or schools own platforms.160 Wearable tech-nologies in health care (smart devices) have also been dominated by global brands such as Fitbit, Samsung, and Apple.
Understanding the importance and potential of EdTech and HealthTech, many government agencies have also created free products. For instance, Portal Rumah Belajar is an online learn-ing platform equipped with complete multimedia education content managed by The Ministry of Education and Culture (MoEC) since 2011. Universitas Terbuka, a state university focusing on distance learning, also offers extensive open educa-tion resources (OER). MoEC has a specialized unit, the Center for Data and Information Technology (Pusat Data dan Teknologi Informasi, Pusdatin) that develops and manages ICT for edu-cation programs, such as the provision of ICT infrastructure and facilities, ICT-based learning content, development of knowledge management systems to facilitate the sharing of information and knowledge among learners and educators, development of ICT-based learning resource centers in ele-mentary and secondary education, and increasing human re-source capacity to support the efficient use of ICT at the central and local levels. The Government is also active in introducing technology solutions for the health sector. The Ministry of Health in 2018 launched its own tele-consultation platform called Sehatpedia. BPJS-Health, which manages Indonesia’s single national health insurance scheme, launched its own smartphone application, JKN Mobile, in 2017. This initially served as a member management tool to help all citizens (who are enrolled in a mandatory scheme) manage their member-ship, including for invoicing, payment, and claim verification. Another example is district-based health-care services, such as the case of Makassar, which launched a 24-hour homecare and
tele-medicine service in 2015 to enable health-care services for home visits to Makassar residents.
The fast-tracked digital transformation in various sectors due to the COVID-19 pandemic has exposed a digital divide across various socioeconomic groups. Low-income students, as well as students outside the Jakarta Metropolitan and Bali region, lack the required infrastructure to fully utilize the digital prod-ucts offered by the various EdTech and HealthTech firms. To address this digital divide, many EdTech firms, such as Zenius, Quipper school, and Ruangguru, have partnered with govern-ment and telecommunication providers to provide free services and free data packages so that students can easily access the programs and products on their platforms.
To ensure efficient allocation of resources between the public and private sectors, and to minimize the digital divide across Indonesia and maximize the benefits of EdTech and HealthTech products, both parties need to engage with each other more ef-fectively. Government, education providers, the telecom sector and EdTech/HealthTech firms need to collaborate to ensure that the digital divide is minimized161 and that digital products are easily accessible. Private firms need to better understand the needs of teachers, schools and parents, while the public sector needs to become more effective at engaging with the private sector, clarifying its governance structure and promoting pub-lic-private partnerships (PPPs) for product development.
As a final recommendation, the Government should continue to invest in improving digital infrastructure and connectivi-ty, particularly in underdeveloped areas and for underserved communities. The inequalities in access to online learning and online health services mean that those without connec-tivity have fewer opportunities to learn, or to receive health treatment. The situation has become more acute due to the COVID-19 outbreak.
Placeholder for Photo or Pull quote
193
BEYO
ND U
NICO
RNS:
HAR
NESS
ING
DIGI
TAL
TECH
NOLO
GIES
FOR
INC
LUSI
ON I
N IN
DONE
SIA
CHAP
TER
— 04

151 Google, Temasek, Bain & Company, 2019.
152 Tracxn (https://tracxn.com/) is an online analytics platform that tracks startups and private companies
153 Bhardwaj, Yarrow and Cali, 2020.
154 Ruangguru, 2019.
155 Halodoc, 2019.
156 TechInAsia, 2020.
157 Mobi Health News, 2019.
158 Credit Suisse, 2021.
159 Bhardwaj, Yarrow and Cali, 2020.
160 MoEC, 2020.
161 Credit Suisse, 2021.
Endnotes
194
BEYO
ND U
NICO
RNS:
HAR
NESS
ING
DIGI
TAL
TECH
NOLO
GIES
FOR
INC
LUSI
ON I
N IN
DONE
SIA
CHAP
TER
— 04

References1 Bhardwaj, Riaz; Yarrow, Noah; Cali, Massimiliano. 2020. “EdTech in Indonesia: Ready for Take-off ?”. World Bank,
Washington, DC.
2 Credit Suisse. 2021. “Education Technology. Coronavirus and Beyond”. Available at: https://www.credit-suisse.com/media/assets/microsite/docs/responsibleinvesting/cs-education-technology-spread.pdf (accessed March 12, 2021)
3 Google, Temasek, Bain & Company. 2019. “e-Conomy SEA 2019: Swipe up and to the Right: Southeast Asia’s $100 billion Internet Economy”. Available at: https://www.blog.google/documents/47/SEA_Internet_Economy_Report_2019.pdf (accessed December 14, 2020).
4 Halodoc. 2019. “Halodoc Completes Strategic Funding Round as it Continues to Expand its Portfolio of Services”. Available at: https://www.halodoc.com/media/press-release-halodoc-completes-strategic-funding-as-it-continues-to-expand (accessed December 14, 2020).
5 Koh, Dean. 2019. “Indonesia’s healthcare superapp Alodokter raises $33M in Series C funding”. Mobi Health News. Available at: https://www.mobihealthnews.com/news/asia-pacific/indonesia-s-healthcare-superapp-alodokter-raises-33m-series-c-funding (accessed December 14, 2020).
6 MoEC. 2020. “Analisis Survei Cepat: Pembelajaran dari Rumah dalam Masa Pencegahan COVID-19”. Available at: https://puslitjakdikbud.kemdikbud.go.id/assets_front/images/produk/1-gtk/buku/1__Hasil_Survey_Cepat_BDR-Kepala_Sekolah_dan_Guru_(1).pdf
7 Ruangguru. 2019. “Ruangguru Completes $150M Series C Transaction Led by General Atlantic and GGV Capital”. Ruangguru Press Release. Available at: https://blog.ruangguru.com/ruangguru-completes-150m-series-c-transaction (accessed December 14, 2020).
8 Tracxn. 2019. “EdTech Startups in Indonesia”. Available at: https://tracxn.com/explore/EdTech-Startups-in-Indonesia (accessed March 12, 2021)
10 Yu, Doris. 2020. “Indonesia’s Zenius bags $20m, appoints former Gojek exec as CEO”. TechInAsia. Available at: https://www.techinasia.com/zenius-bags-20m-appoints-ceo (accessed December 14, 2020).
195
BEYO
ND U
NICO
RNS:
HAR
NESS
ING
DIGI
TAL
TECH
NOLO
GIES
FOR
INC
LUSI
ON I
N IN
DONE
SIA
CHAP
TER
— 04

Chapter ⬎
5
Harnessing Digital Technologies for Inclusion→What Can Indonesia Do?
196
BEYO
ND U
NICO
RNS:
HAR
NESS
ING
DIGI
TAL
TECH
NOLO
GIES
FOR
INC
LUSI
ON I
N IN
DONE
SIA
CHAP
TER
— 05

his report has documented how the COVID-19 pandemic turbo-charged the adoption of digital technologies and e-commerce among business-es and consumers. School closures forced stu-dents and teachers to adapt and explore digital-ly enabled remote learning options. HealthTech apps enabling remote consultations and the de-livery of medicine saw unprecedented growth. At the same time, this report has argued that the potential for digital technologies to bring
about inclusion in Indonesia has remained largely unrealized. Despite rapid progress achieved in the years prior to the pandemic in connecting its citizens to the internet, the country faces a gaping digital divide, with just under half of adults still not connected. The level of adoption and geographic reach of applications such as those used for e-commerce and digital ride-hailing have not reached levels needed for catalyzing a fundamental shift in the underlying structure of the economy or its inclusiveness to bring about a transformative impact on the population. The ongoing pandemic demonstrates the power-ful role that digital technologies can play in mitigating impacts of crises and building resilience, reducing disruption of critical services, and delivering quick and well-targeted social and health system responses to impacted pop-ulations. But with low adoption and low digital readiness at the start of the pandemic, even the rapid growth documented in this report was not sufficient to allow the GoI to take full advantage of digital technologies in its pandemic response, evident in delays in deployment of response measures.
To accelerate the diffusion of digital technologies and their use for productive purposes in an inclusive Indonesian economy, this report identifies constraints that need to be lifted in three broad areas. First, despite improvements in connectivity over the past decade, a sizeable digital divide persists because of lingering challenges in middle and last mile connectivity. The divide con-strains the adoption and use of digital technologies for e-commerce, as well as for the provision of efficient, quality government services to Indonesian citizens. Second, harnessing the potential of digital technologies to generate economic opportunities for all and unlocking citizen capabilities to seize these opportunities will require greater financial inclusion, nurturing of trust to promote uptake of digital payment services, and investing in skills needed for the 21st century digital economy. Third, the potential of digital technologies to improve the efficiency of government administration and the quality of services to all citizens cannot be realized until the fragmentation of regula-tions, policies and their implementation across government institutions is resolved through stronger leadership and a clear vision for comprehensive whole-of-government digital transformation. This chapter describes the key regulatory and program reforms needed to lift the constraints in each of these areas.
T
197
BEYO
ND U
NICO
RNS:
HAR
NESS
ING
DIGI
TAL
TECH
NOLO
GIES
FOR
INC
LUSI
ON I
N IN
DONE
SIA
CHAP
TER
— 05

Despite improvements in connectivity over the past de-cade, a sizeable digital divide persists in Indonesia as a result of lingering challenges on middle and last mile con-nectivity. Fixed broadband penetration is insufficient to meet rapidly growing demand for high-bandwidth appli-cations. Mobile broadband is more widely available but does not deliver the same capacity or quality of service, nor is it cost-efficient for high-bandwidth applications. The divide constrains the adoption and use of digital tech-nologies for e-commerce and its enablers such as e-logis-tics services that require last mile connectivity for services such as tracking and tracing. Low internet penetration in schools, hospitals and health posts threatens to widen human capital disparities as large segments of the popu-lation get left behind, with learning and health-care deliv-ery migrating online for some but not all. Addressing the digital divide will require universalizing access to reliable and good quality internet as a first step.
As identified in Chapter 2, there are three key regulatory bottlenecks that are holding Indonesia back: (i) spectrum management, specifically unavailability of spectrum in specific IMT spectrum bands; (ii) the lack of regulatory mechanisms to facilitate active and passive infrastructure sharing;and (iii) limited competitiveness among service providers. Thus, optimizing spectrum allocation for mo-bile broadband and strengthening mechanisms to ensure the sharing of active and passive infrastructure among market participants, and streamlining licensing proce-dures to support greater market contestability, are among the most important policy measures that can be taken to universalizing internet access and use in Indonesia.
→ Optimize spectrum allocation for mobile broadbandThe freeing-up of additional spectrum would reduce network congestion in urban areas and facilitate more widespread rollout in rural areas. Mobile broadband is highly dependent upon sufficient spectrum, both below
the 1 GHz band for cost-effective coverage in rural areas and above the 1 GHz band for large spectrum assignments for cost-efficient capacity. The main bands that are not yet available for mobile broadband (4G and, in the future, 5G) in Indonesia are the 700 MHz and 2.6 and 3.5 GHz bands. Release of the 700 MHz band requires the digital TV migration to be completed. This band will enable cost-efficient rollout of (4G/LTE and beyond) mobile broadband services in rural areas. Under the recently en-acted Omnibus Law on Job Creation No. 11/2020, reform of spectrum management is on the right track for optimi-zation of spectrum allocation. Omnibus Law No. 11/2020 also imposes a mandatory two-year plan to convert analog television to digital television to secure the digital divi-dend in the 700 MHz spectrum band. Release of the 2.6 GHz band, currently used for satellite TV, would add capacity in urban centers and alleviate network conges-tion. Kominfo should consider accelerating its plans for the reallocation of this band from satellite broadcasting to mobile broadband before the end of the current spectrum license in 2024. Securing the 3.5 GHz band spectrum will require consultation with current C-Band satellite users. Over time, some form of sharing should be considered with the use of this band for mobile services in urban cen-ters and for satellite services in those rural areas that still require C-band connectivity. This would add further ca-pacity and enable the introduction of 5G. Finally, the GoI should prepare to make available the mmWave spectrum in the 24-29 GHz band to enable immediate deployment as soon as the industry is ready for 5G mmWave services.
Consistent with ITU recommendations, Indonesia should endorse an overall target for available IMT spectrum of at least 840 MHz plus allocations of mmWave spectrum as soon as possible,162 and certainly no later than 2024. Such allocations should be made in larger contiguous blocks in accordance with future best practice. MNOs should also have the flexibility to use their allocated IMT spectrum for mobile broadband and/or fixed wireless access (FWA) services. High-speed FWA services using 4G/5G technol-ogies are proving globally to be a very competitive product with fixed broadband services.163
5.1. Improve Digital Connectivityand Universalize Access
198
BEYO
ND U
NICO
RNS:
HAR
NESS
ING
DIGI
TAL
TECH
NOLO
GIES
FOR
INC
LUSI
ON I
N IN
DONE
SIA
CHAP
TER
— 05

→ Strengthen mechanisms to ensure the sharing of active and passive infrastructure As noted in Chapter 2, between 70 and 80 percent of the cost of fixed broadband is typically accounted for by passive infrastructure such as ducts, poles, rights of way and civil works, and the limited provisions for active and passive infrastructure sharing make the costs of investment in fixed broadband prohibitive. Infrastructure sharing would bring benefits in terms of reduced capital expenditure and op-erating expenditure, increased competition between pro-viders, lower prices and, as a result, increased take-up and connectivity. Sharing is also necessary for the extension of optical fiber networks down to the kecamatan level, and to improve access among households and businesses (“fiber to the home” or FTTH). FTTH is currently dominated by PT Telkom (IndiHome) across Indonesia, and some smaller providers such as Biznet, MyRepublic, MNC and Oxygen (Moratelindo) in some cities. The recent entry of the electricity service provider, PLN, into the FTTH market could potentially alter the low competition status quo, as PLN has passive infrastructure to each house with an electrical grid connection.164
Omnibus Law No. 11/2020 mandates passive infrastruc-ture sharing and the next step for the GoI is to create an implementing regulation. This will require effective lead-ership to coordinate the government agencies involved, including, among others, the Ministry of Communication and Information, the Ministry of Home Affairs, the Min-istry of Public Works, and local government agencies. The GoI will need to modify infrastructure planning approval procedures to include obligations for the sharing of pas-sive infrastructure (e.g., ducts, free space for an additional network operator, poles, rights of way, and civil works) for deployment of fiber-optic networks, include in the licens-ing process clear guidelines for network sharing, create a single entity responsible for setting tariffs for passive infrastructure sharing, and establish a rapid and effective dispute resolution mechanism. A planning database con-taining detailed information on infrastructure available for sharing at the national and kota/kabupaten levels also needs to be created. Local governments would contribute by deploying passive infrastructure for shared use, for ex-ample, ducts along roads and streets during routine civil works. Operators should be required to publish relevant information for infrastructure sharing, while those bene-fiting from the Universal Service Obligation (USO) fund should be required to share subsidized infrastructure. Changes arising from the Omnibus Law now allow up to 100 percent foreign investment in the tower and trans-mission business, which was previously on the negative investment list (DNI). As a result, there will be a range of new industry stakeholders able to invest in the sector,
including deploying the digital infrastructure needed for high quality 4G services and future 5G services.
Tower sharing for mobile broadband networks was man-dated in 2009 and has been deployed on a large scale, but the sharing of other passive infrastructure, such as ducts, poles, etc. (required for fiber-optic networks) between telecom operators lags behind, despite a joint letter is-sued by the Ministry of ICT and the Ministry of Home Affairs in 2018. The Omnibus Law mandates passive in-frastructure sharing through a change to Telecom Law Article 34A and B, but implementation of the associated provisions will require inter-agency coordination among national agencies and local governments. Separately, ac-tive infrastructure sharing would promote competition in mobile broadband services in rural/remote areas but is currently not allowed under Telecom Law PP No. 52/53. This law requires in many cases separate deployment of (mobile) infrastructure by each and every telecom op-erator. The Omnibus Law does include a change to Law Article 34B that opens up the possibility of active infra-structure sharing, although this could have been made more explicit. Telecom Law PP No. 52/53 will have to be updated to allow for the sharing of active infrastructure on a B2B basis.
→ Strengthen competition along the broadband value chainTo improve the competitiveness of service providers, In-donesia should consider transitioning toward the unified licensing of service providers to enable each to deliver a larger portfolio of services. As noted in Chapter 2, the current regulatory regime restricts the ability of operators to provide a full range of services by requiring them to apply for and maintain specific service licenses, instead of a single uniform license for all services. This limits the issuance of telephony service licenses and the portability of telephone numbers, etc. To address these issues, it is recommended that the GoI reviews the current licens-ing regime and considers transitioning toward a single/unified license to deliver the full portfolio of services to a larger number of service providers, so that effective com-petition for dual-play and triple-play fixed broadband services will emerge. This should be complemented by regulations enabling portability of telephone numbers across providers. Neither the Telecommunication Law nor its amendments in the Omnibus Law addresses these issues. Telecommunications-related regulatory commit-ments in the Regional Comprehensive Economic Partner-ship (RCEP) and the ASEAN Digital Masterplan (ADM 2025),165 which was launched in January 2021 at the 1st ASEAN Digital Ministers’ Meeting,166 should also guide further regulatory reforms.
199
BEYO
ND U
NICO
RNS:
HAR
NESS
ING
DIGI
TAL
TECH
NOLO
GIES
FOR
INC
LUSI
ON I
N IN
DONE
SIA
CHAP
TER
— 05

Indonesians who are connected to the internet tend to use it intensively, but largely for communication, social media and leisure, as opposed to economically productive purposes (Chapter 1). Digital technology adoption in the workplace by household enterprises and among low-edu-cated individual workers is still very limited, while returns to internet use at work are higher for the better educat-ed, leaving the less- and least-educated workers further behind than they already were. While e-commerce has grown and micro and small merchants could, in principle, benefit from its growth, including by opening jobs and economic opportunities for otherwise-vulnerable women and youth workers, its reach is constrained by uneven internet access, high logistics costs, and poor digital skills. Finally, taxation of the digital economy would support in-clusive growth by providing revenues for public spending, reducing some of the distortive impact of taxation on the economy, and encouraging formalization of businesses.
→ Support development of logistics
Development of physical infrastructure to improve con-nectivity in and outside urban areas needs to be continued. A strong transport and logistics infrastructure network (roads and electricity) in and outside of urban areas is a key enabler of e-logistics. UNCTAD’s Rapid e-Trade Readiness Assessments of Least Developed Countries recommends the rehabilitation of physical infrastructure as central to support e-trade. Areas in China that are well connected by road and other key infrastructure (electrical, telecom-munications) have benefited most from the e-commerce ecosystem and have developed the most.167 Public-private partnerships (PPPs) with local and international investors have been shown to speed up infrastructure development and improve efficiency. These are urgently needed in Indo-nesia, where growth in infrastructure developed has lagged behind growth in GDP.168 The e-logistics ecosystem is also held back by low efficiency of airports and ports, and limitations in the services they provide. Measures such as the development of temperature-controlled facilities and improvements in the risk management capacity of airport personnel would help to improve turnaround times and support a smooth e-logistics chain.
Deepening of reforms to address entry barriers to logistics and transportation services would lower costs, decrease transit times and improve reliability of e-logistics ser-vices. Entry barriers to logistics and transportation ser-vices in Indonesia include the fragmentation of licensing requirements, limits to foreign equity investment, min-imum capital requirements, barriers to development of inter-island shipping (port tariffs, roll-on roll-off regula-tions, cabotage), barriers to development of inter-modal logistics and the cost of red tape (licensing, regulated agents in airports, etc.). The GoI has issued several reg-ulations to reduce these barriers, but additional reform is needed and should be covered in the implementing regulations being designed for the recently passed Om-nibus Law.169 Removal of barriers to reverse logistics, in particular the restrictions on re-export, would help to provide certainty over unsold or deficient stocks, especial-ly for cross-border e-logistics. Attracting private sector investment in warehousing outside of Indonesia’s large metropolitan areas would be more efficient than the status quo where traders set up warehouses and distribution centers for their own use, paying a high cost to ensure compliance and meet licensing requirements. Building investor confidence in turn requires a minimum level of demand for handling products, reliable electrical supply and skilled labor. Fragmentation in licensing discourages investors from moving outward beyond the Jakarta-Sura-baya-Medan-Bali network.
Modernization of PT Pos Indonesia, the national postal service, should be continued. The national postal service has unused capacity available linked to a sharp decline in mail traffic. In addition to adapting the sorting facilities to efficiently handle packages, there is potential for postal facilities to be transformed into collection-and-delivery points (CDPs) to support the e-commerce supply chain. In Estonia, for example, the National Post Omniva has already well running locker points across the country to enable any user to drop or collect a parcel using SMS mes-saging. Elsewhere, PPPs have been developed between the national postal services and private sector e-logistics companies, such as the Cainao network in China (Alib-aba’s logistics arm). Finally, standardized addresses and postcodes would enable the automation of parcel sorting and route optimization in delivery, reducing handling costs per parcel, the damage rate, and delivery times.
5.2. Make the Digital Economy Work for All
200
BEYO
ND U
NICO
RNS:
HAR
NESS
ING
DIGI
TAL
TECH
NOLO
GIES
FOR
INC
LUSI
ON I
N IN
DONE
SIA
CHAP
TER
— 05

E-logistics can be leveraged to unlock the economic potential of micro, small and medium enterprises (MS-MEs), as well as agricultural smallholders. The MSME sector continues to underperform relative to its poten-tial and suffers from consistently low productivity. The general recommendations described above would bene-fit MSMEs by making logistics service providers (LSPs) more competitive and PT Pos Indonesia more efficient. Reduced transit times and logistics costs support MS-MEs’ cashflows and increase their profitability, including through an expanded customer base. More targeted sup-port could include training on logistics and supply chain management, such as inventory and order management. Warung entrepreneurs, for example, lack these skills and rely on same-day sales to estimate input orders for the next day, leading to out-of-stock products (missed sales) or obsolete inventory (wasted cash). The GoI could: (i) partner with the private sector to support entrepreneur access to e-logistics solutions offered by initiatives such as Warung Pintar and Mitra Bukalapak170 in large cit-ies like Jakarta and Surabaya, including data analytics to support small entrepreneurs in decision-making when placing orders171 and same day/next day deliveries; (ii) facilitate partnerships between marketplaces, the national post, and private sector logistics companies to create a sustainable logistics ecosystem such as Cainiao in China’s Taobao rural program that supports distribution between cities and rural areas;172 (iii) support basic training via vocational training programs at the local level and offer incentives to encourage entrepreneurs to get trained; and (iv) explore supporting e-logistics services that aim to improve village-to-city connectivity, such as the farm-to-table startups creating marketplaces connecting farmers to buyers (SayurBox, TaniHub) and financing raising funds to support smallholders (CROWDE).
→ Nurture digital skills and skills for the 21st century digital economyThis report’s findings that core digital skills in the adult population are low, limiting the ability of Indonesians from participating in the digital economy safely, se-curely and productively, align with a broad literature that concludes that skill levels in the workforce have not kept up with employer demand, that there is a mismatch between skills needed and those supplied, and that the workforce lacks the core skills needed for 21st century jobs. Shortages of workers qualified in engineering and ICT professions, and those with general computer skills, are particularly acute. Poor digital skills constrain many of the enablers of the digital economy examined in this report, and they also constrain the expansion of e-logis-tics services outside Indonesia’s metropolitan areas and the adoption of digital financial payments, in particular.
They also limit the development of EdTech and Health Tech initiatives and the utilization of services that do exist in these sectors, and they stand in the way of efforts to digitize government for improved delivery of services across a whole swath of sectors.
Interventions to nurture digital skills need to be contex-tualized in an environment of rapid changes in the nature of jobs, even in Indonesia. Worldwide, automation—and the adoption of technology more generally—is making some jobs obsolete at the same time as innovation is cre-ating new ones (World Bank 2019). E-commerce in Indo-nesia has a long way to go before it can catch up with other economies, but change is already here: executives in Indo-nesia’s largest companies list data analysts and scientists, big data specialists, AI and machine-learning specialists, digital marketing and strategy specialists, among leading positions in growing demand, as well as job roles such as process automation specialists and Internet-of-Things specialists (World Economic Forum 2020). The emer-gence of these roles reflects the acceleration of automa-tion, as well as the resurgence of cybersecurity risks.173,174 The COVID-19 pandemic may accelerate structural shifts in the economy that exacerbate the digital skills deficit, if it leads to permanent changes in the nature of work due to accelerated adoption of technologies, greater reliance on home-based work and online meetings, or changes in global value chains resulting in rebalancing of economic sectors.
Institutional action and policies need to recognize that digital skills are a subset of a broader skillset needed for the 21st century digital economy. The exponential pace of technological change today makes it hard to anticipate which job-specific technical, digital and other skills will thrive and which will become obsolete in the near future. As a result, the ability to adapt quickly to changes is in-creasingly valued by the labor market.175 The sought-after trait globally is adaptability—the ability to respond to unexpected circumstances, and to unlearn and relearn quickly. This trait requires a combination of certain cog-nitive skills (critical thinking, problem-solving) and so-cio-behavioral skills (curiosity, creativity). Indeed, the top five skills and skill groups that executives in Indone-sia’s largest companies see as rising in prominence in the run-up to 2025 are creativity, originality and initiative, complex problem-solving, active learning and learning strategies, emotional intelligence and analytical thinking and innovation (World Economic Forum 2020).
→ The working-age populationDigital skills training needs to be embedded in non-for-mal education services and lifelong learning tailored to the needs of the working-age adult population, the majority of which is either informally employed or in self-employ-
201
BEYO
ND U
NICO
RNS:
HAR
NESS
ING
DIGI
TAL
TECH
NOLO
GIES
FOR
INC
LUSI
ON I
N IN
DONE
SIA
CHAP
TER
— 05
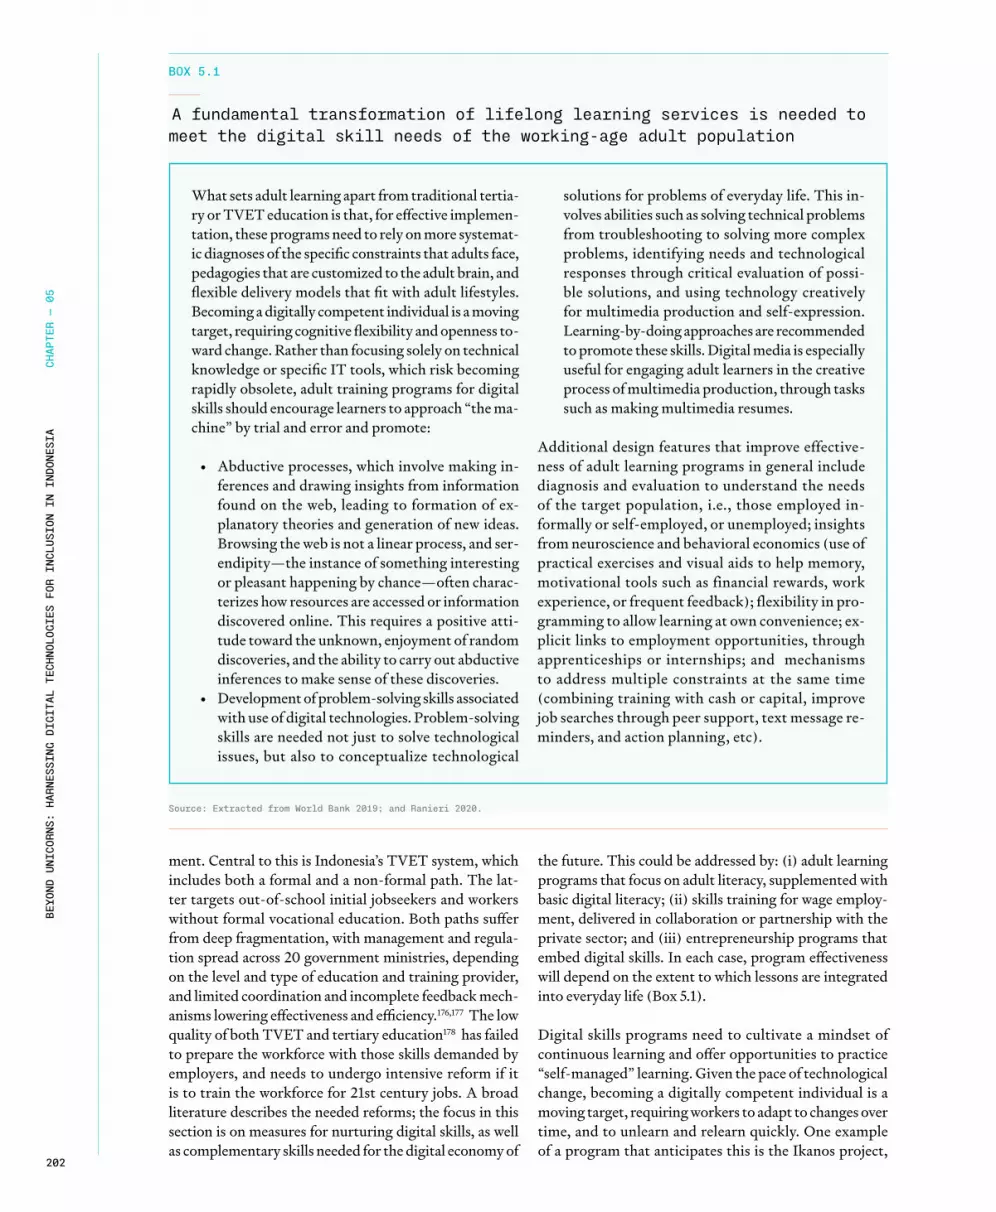
ment. Central to this is Indonesia’s TVET system, which includes both a formal and a non-formal path. The lat-ter targets out-of-school initial jobseekers and workers without formal vocational education. Both paths suffer from deep fragmentation, with management and regula-tion spread across 20 government ministries, depending on the level and type of education and training provider, and limited coordination and incomplete feedback mech-anisms lowering effectiveness and efficiency.176,177 The low quality of both TVET and tertiary education178 has failed to prepare the workforce with those skills demanded by employers, and needs to undergo intensive reform if it is to train the workforce for 21st century jobs. A broad literature describes the needed reforms; the focus in this section is on measures for nurturing digital skills, as well as complementary skills needed for the digital economy of
the future. This could be addressed by: (i) adult learning programs that focus on adult literacy, supplemented with basic digital literacy; (ii) skills training for wage employ-ment, delivered in collaboration or partnership with the private sector; and (iii) entrepreneurship programs that embed digital skills. In each case, program effectiveness will depend on the extent to which lessons are integrated into everyday life (Box 5.1).
Digital skills programs need to cultivate a mindset of continuous learning and offer opportunities to practice “self-managed” learning. Given the pace of technological change, becoming a digitally competent individual is a moving target, requiring workers to adapt to changes over time, and to unlearn and relearn quickly. One example of a program that anticipates this is the Ikanos project,
BOX 5.1
A fundamental transformation of lifelong learning services is needed to meet the digital skill needs of the working-age adult population
What sets adult learning apart from traditional tertia-ry or TVET education is that, for effective implemen-tation, these programs need to rely on more systemat-ic diagnoses of the specific constraints that adults face, pedagogies that are customized to the adult brain, and flexible delivery models that fit with adult lifestyles. Becoming a digitally competent individual is a moving target, requiring cognitive flexibility and openness to-ward change. Rather than focusing solely on technical knowledge or specific IT tools, which risk becoming rapidly obsolete, adult training programs for digital skills should encourage learners to approach “the ma-chine” by trial and error and promote:
• Abductive processes, which involve making in-ferences and drawing insights from information found on the web, leading to formation of ex-planatory theories and generation of new ideas. Browsing the web is not a linear process, and ser-endipity—the instance of something interesting or pleasant happening by chance—often charac-terizes how resources are accessed or information discovered online. This requires a positive atti-tude toward the unknown, enjoyment of random discoveries, and the ability to carry out abductive inferences to make sense of these discoveries.
• Development of problem-solving skills associated with use of digital technologies. Problem-solving skills are needed not just to solve technological issues, but also to conceptualize technological
solutions for problems of everyday life. This in-volves abilities such as solving technical problems from troubleshooting to solving more complex problems, identifying needs and technological responses through critical evaluation of possi-ble solutions, and using technology creatively for multimedia production and self-expression. Learning-by-doing approaches are recommended to promote these skills. Digital media is especially useful for engaging adult learners in the creative process of multimedia production, through tasks such as making multimedia resumes.
Additional design features that improve effective-ness of adult learning programs in general include diagnosis and evaluation to understand the needs of the target population, i.e., those employed in-formally or self-employed, or unemployed; insights from neuroscience and behavioral economics (use of practical exercises and visual aids to help memory, motivational tools such as financial rewards, work experience, or frequent feedback); flexibility in pro-gramming to allow learning at own convenience; ex-plicit links to employment opportunities, through apprenticeships or internships; and mechanisms to address multiple constraints at the same time (combining training with cash or capital, improve job searches through peer support, text message re-minders, and action planning, etc).
Source: Extracted from World Bank 2019; and Ranieri 2020.
202
BEYO
ND U
NICO
RNS:
HAR
NESS
ING
DIGI
TAL
TECH
NOLO
GIES
FOR
INC
LUSI
ON I
N IN
DONE
SIA
CHAP
TER
— 05

promoted in 2012 by the Basque Country Government to build a learning support platform for the digital com-petence needs of citizens, employed and/or unemployed people (Kluzer et al. 2020). In addition to a self-assess-ment tool for career and training guidance, as well as to increase the employability of unemployed people, a Personal Learning Environment (PLE) was developed to help “learners take control of and manage their own learning”. This included providing support to set own learning goals, manage own learning, and communicate with others in the process of learning, and managing both the content and process to achieve learning goals. Import-ant concepts in PLEs include integration of formal and informal learning episodes into a single experience, use of social networks that can cross institutional boundar-ies, and use of networking protocols (peer-to-peer, web services, syndication) to connect a range of resources and systems within a personally-managed space.
In addition to focusing on the priority knowledge and skill gaps identified in this report, the content of digital skills programs will need to recognize Indonesia’s em-ployment-specific needs. Priority areas include: (i) basic digital hygiene on issues related to data privacy, such as identification of phishing, social engineering, and access to personal information on devices; (ii) digital financial services and their use to promote consumer trust and confidence in online financial tools; (iii) entrepreneurship training that includes topics such as digital marketing strategies, taxation and regulation of the digital economy, and operations in integrated e-commerce ecosystems that include payment, logistics and insurance services; and (iv) e-logistics, in particular knowledge, standards and skills needed for warehouse operations. Second, the content for digital skills programs will need to be based on a frame-work that recognizes employment-specific differences in skills relevant for Indonesia. An example is the EU Digital Competence Framework.179
As formal sector employment grows over time, improved incentives for employers to provide on-the-job training will become critical for nurturing digital skills among workers. A mere 5 percent of Indonesians in the labor force receive training beyond the formal school system.180 The only financial incentive offered by the GoI to employ-ers to provide skills training is the recently adopted “super tax deduction” that allows firms to deduct from taxes twice the amount spent on training, but only large firms can benefit from this provision.181 The share of workers in formal sector employment will grow over time, albeit slowly, and the GoI should plan to partner with the pri-vate sector in re- and upskilling workers, especially for nurturing of digital skills. The experience of several com-panies demonstrates the potential of the private sector in this regard. Telecommunication company AT&T has worked with Udacity to create 50 training programs, the “T University”, to prepare individuals for the technical
careers relevant to AT&T’s future workforce and digi-tal strategies, including web and mobile development, data science and machine learning.182 To date, AT&T has spent over US$200 million annually to design the curriculum and has already achieved over 4,200 career pivots with 70 percent of jobs filled internally by those who were reskilled. Similarly, Shell launched an online education effort titled the Shell.ai Development Program, which focuses on teaching AI skills to its employees. Both programs have created customized versions of Udacity’s Nanodegree programs to reskill and upskill employees with hard-to-source, in-demand skill sets. Another ex-ample is Coursera for Government. In order to respond to the surge in unemployment during the COVID-19 pandemic, governments in over 100 countries provided access to the platform to citizens looking to gain new skills and credentials to re-enter the workforce. The programs connected graduates directly with local companies who agreed to accept those credentials as the basis for hiring. Since April, the program has reached 650,000 unem-ployed workers who enrolled in over 2.5 million courses that provide the skills needed for fast-growing jobs in IT, health care and business.183
Many countries have developed innovative funding mechanisms to finance the reskilling of workers, with ad-ditional provisions to mitigate the adverse impacts of the COVID-19 pandemic. Globally, reskilling and upskilling policies that have been utilized to date span the condi-tionality of unemployment benefits on taking up new re-skilling and up-skilling, providing wage subsidies to companies that extend reskilling and upskilling to work-ers, providing online learning accounts to citizens, and starting to fund online learning in addition to university degrees, TVET and school tuition. Singapore recently complemented its pioneering “Skills Future Initiative” through the deployment of Enhanced Training Support Package to support workers and organizations in sus-taining investment in reskilling and upskilling during the COVID-19 pandemic. The package includes a signif-icant increase in funding for Absentee Payroll Support and Course Fee Support among industries severely hit by the pandemic. At the end of 2019, France created an individual skills account with an integrated mobile application dedicated to vocational training and life-long learning. Under the “moncompteformation.gouv.fr” (“MySkillsAccount”) scheme, 28 million eligible full- and part-time workers will receive €500 annually directly into their skills account to spend on upskilling and continuous learning, with low-skilled workers and those with special needs receiving up to €800 annually, capped at a total of €5,000 and €8,000, respectively. The Danish Ministry of Employment has introduced measures aimed at providing additional opportunities for upskilling and job-focused education for workers furloughed during the pandemic. First, both skilled and unskilled workers who pursue a vocational education
203
BEYO
ND U
NICO
RNS:
HAR
NESS
ING
DIGI
TAL
TECH
NOLO
GIES
FOR
INC
LUSI
ON I
N IN
DONE
SIA
CHAP
TER
— 05

are being provided with 110 percent of their usual un-employment benefits. In addition, the Danish Govern-ment expanded the scope of its current apprenticeship scheme, at the same time as prolonging its job rotation scheme, making it possible for more unskilled workers to have access to upskilling and reskilling opportunities.
→ Future entrants to the workforce
Education technology (EdTech) initiatives at all edu-cation levels need to be mobilized via partnerships with the private sector, complementing public sector online learning resources. Embedding ICT into the learning experience in schools and universities serves not only to enhance teaching, learning and assessment, and optimize learning processes, but also to expose students to digital technologies from an early age, easing the transition to picking up occupation-specific digital skills later on in life. In addition to improving digital infrastructure and connectivity in schools, particularly in underserved com-munities, this will require: (i) reforming of curricula to nurture the aforementioned 21st century skills needed for Industry 4.0, including digital skills, taught early on and reinforced throughout the lifelong learning process; and (ii) training existing teachers and future entrants to the profession on use of ICT to enhance teaching and preparing them for effective delivery of the new curricular content.184 A clear vision is needed for deployment of curriculum-aligned EdTech with a focus on lower-income and rural, remote areas based on evaluations that iden-tify cost-effective approaches for use at scale. Additional measures needed include: (i) development of standards for data privacy and security related to EdTech products; (ii) partnerships between EdTech firms, academia and government to establish clear standards for performance and cost-effectiveness, and to transparently and rigorous-ly evaluate the leading products; (iii) support to EdTech startups through use of startup assistance organizations and promotion of PPPs for product development; and (iv) partnerships with EdTech firms to improve teachers’ ability to deliver technology-focused content.185
Modern tertiary education needs to cultivate in students a minimum threshold of foundational “transferable” high-er-order skills for the digital 21st century economy, even in STEM fields. Technology and integration have increased demand for higher-order general cognitive skills—com-plex problem-solving, critical thinking, and advanced communication—that are transferable across jobs. As a consequence, the combination of general and techni-cal skills is becoming highly valued (World Bank 2019). Tertiary education systems should therefore guarantee a minimum threshold of transferable cognitive skills, which are also the best inoculation against job uncertainty. In-
corporating more general education in tertiary programs is one way to do this. An additional year of general edu-cation was added in 2012 to undergraduate programs in Hong Kong SAR, China, focusing on problem-solving, critical thinking, communication, leadership, and life-long learning skills. Another way is through innovative pedagogy. The Faculty of Architecture and Environmen-tal Design at the College of Science and Technology, the University of Rwanda, has promoted learning strategies that include open-ended assessment, feedback opportu-nities, and a progressive curriculum that balances aca-demic challenge with student support. These approaches have improved the critical-thinking skills of students. Forward-looking universities are finding ways for adult students to acquire a broad set of socio-behavioral skills. Dutch vocational colleges are providing entrepreneurial courses aimed at improving noncognitive skills, such as teamwork and self-confidence. Tunisia introduced an entrepreneurship track that combines business training with personal coaching to reshape the behavioral skills of university students. In China, a combination of coop-erative learning and role play enhanced self-educational abilities and communication skills among undergraduate students in pharmacology classes.
Close collaboration between industry and tertiary edu-cation is critical. The low quality of TVET and tertiary education in Indonesia has been linked to, among other factors, a lack of competency frameworks developed in consultation with the private sector. Inadequate labor market information and intermediation makes it hard to align curricula and teaching with occupations and skills needed. Private sector participation in tertiary education planning and policy is thus a requisite both at a strategic and technical, curricular level. In China, for example, Le-novo is working with tertiary institutes to train vocational students in high-tech areas, such as cloud computing, that feature practice-based curricula, practitioner-led instruction, and professional certification (World Bank 2019). First, the GoI also needs to incentivize employ-ers to offer internships and off-campus learning to stu-dents. Second, filling in information gaps during the job search process enables students to make choices between and within different paths. Chile is establishing online platforms where students can access information on the employability of individuals with various degrees, wage profiles, and courses to take for certain occupations. Co-lombia’s Jóvenes en Acción (Youth in Action) program combines classroom instruction with on-the-job training at private companies. Third, Indonesia needs to continue to develop data systems that allow for identification of occupations and skills in demand, monitor educational institutions’ compliance with quality standards, and en-sure that information on the employability of degrees, wage profiles, and occupation-specific courses is available to both jobseekers and workers.
204
BEYO
ND U
NICO
RNS:
HAR
NESS
ING
DIGI
TAL
TECH
NOLO
GIES
FOR
INC
LUSI
ON I
N IN
DONE
SIA
CHAP
TER
— 05

→ Promote the use of digital financial services and payment solutions, including among the unbanked and the underbanked
Incentive schemes can be introduced for the private sec-tor to innovate and develop new digital financial services (DFS) products that cater for wider group populations, especially the rural population. The underserved and un-banked population is mostly located in rural areas. The regulators could provide a new enabling environment designed only for rural areas. While DFS can be provided via channels and instruments from various types of insti-tutions, including bank and non-bank payment service providers, agent banking services are particularly promis-ing for reaching Indonesia’s largely unbanked population. Allowing non-bank e-money provider to recruit indi-vidual agents has the potential to create new rural access points with a full suite of e-money services, including (cash-in-cash-out) CICO access points. The regulator can also permit third-party agent network managers for efficient agent services across segments. This will then ease the operational challenge faced by DFS providers, while at the same time improve the customer services of the agents. Another change in regulation that could bring more income for agents is by allowing non-exclusivity in ‘frontier’ rural areas. A non-exclusive model has brought 40 percent higher income for agents in Bangladesh and Kenya. Subsidies and other tax inducements have also been introduced by several countries to encourage both businesses and consumers to adopt DFS. For example, Uruguay provided the subsidies for digital payments accepted by small businesses, while reducing tax with-holding requirements for firms and lowering value-added taxes for consumers. The Republic of Korea also allows wage earners to claim tax deductions for purchases made using digital payments. Early research suggests the re-forms have helped increase the number of digital payment transactions.
The GoI can also play a role in sustaining the commercial viability of current DFS agents by maintaining transac-tion volumes at scale. Increase use cases or transaction volume is essential so that prices are more aligned with cost to serve. Improving the interoperability of the pay-ment system can result in higher use cases or transaction volume. The GoI could increase demand for DFS through various government programs. This has been started with the digitization of the conditional cash transfer program of Program Keluarga Harapan (PKH). PKH alone has brought more than 10 million people to the formal fi-nancial services. However, the use cases of DFS among the beneficiaries are still low, with most of the beneficia-ries still cashing out all the money. The agent network is
not benefiting from the G2P digitization due to profit and liquidity challenges faced by agents when serving PKH beneficiaries. The GoI is recommended to revise the G2P model to drive sustainable provider revenue and incentivize expansion. The digitization of private sector wage needs also has significant potential to foster DFS adoption. In Indonesia, 30 million banked adults receive private wages in cash, 72 percent of whom have a mobile. Moreover, another 15 million unbanked adults receive private wages in cash.
Stronger legal and regulatory frameworks for managing risks related to data privacy, cyber security and finan-cial integrity are needed to build consumer trust in DFS products. Lack of consumer trust stems from perceptions of risks, including risks related to data governance and privacy, cyber security and operational risk, and the in-tegrity of financial transactions. Concerns revolve around unauthorized data disclosure by the various entities in-volved, and are reflected in the growing number of com-plaints registered by consumers in Indonesia, including in the banking sector. While Indonesia’s Financial Ser-vices Authority (Otoritas Jasa Keuangan, OJK) has been trying to strengthen the legal and regulatory framework for DFS, consumers still regard the disclosure of personal ID to service providers as a major risk. In this regard, the passing of the draft Personal Data Protection Policy Law will be critical for promoting the adoption of DFS in Indonesia.
→ Use tax policy instruments to ensure level playing field for all
A well-designed system of taxation for the digital econ-omy can help level the tax playing field between conven-tional and online businesses; within online businesses, between goods and services; and between resident and non-resident businesses. This will reduce the distortive impact taxation may have on the economy, helping to ensure that sales, profits, and investment decisions in the digital sector are driven by market dynamics and efficien-cy improvements, and not by advantages gained through uneven taxation policy or taxpayer avoidance. In the In-donesian context, two incidental benefits are equally rel-evant. First, taxation of the digital economy will bring in a small but growing amount of revenue as digitalization accelerates within the Indonesian economy,186 especially in the context of COVID-19 pandemic. E-commerce in Indonesia, for example, is projected to have grown by 54 percent during 2020, reaching US$32 billion, at a time when private consumption in the overall economy has suffered, falling by an estimated 2.7 percent overall.187 Second, taxation of the digital economy presents Indo-nesia with a unique opportunity to boost formalization of businesses, particularly that of MSMEs. Registered
205
BEYO
ND U
NICO
RNS:
HAR
NESS
ING
DIGI
TAL
TECH
NOLO
GIES
FOR
INC
LUSI
ON I
N IN
DONE
SIA
CHAP
TER
— 05

businesses will enjoy the benefits of having easier access to credit from the financial system, and of potential future fiscal support from the Government.
But the digital economy also creates special challenges for tax-ation. For direct taxation (CIT), the main challenge relates to the mismatch between the intangibility of value-drivers within the digital economy and traditional taxation rules’ reliance on tangible features of a business to determine taxing rights and profit allocation (World Bank 2021).188 For indirect taxation (VAT), three main issues have attracted policy attention: (i) the intangibility of transactions that relate to the consumption of online media and other digital goods and services; (ii) the digital economy enabling a very sharp increase (in 2019, of a reported 254 percent yoy189) in imported e-commerce parcels, the majority of which are low-value shipments that fall below the traditional minimum threshold;190 and (iii) the business landscape of the digital economy featuring a large amount of businesses below the VAT threshold, making the current threshold increasingly less suitable.191
A long-term solution to the challenge of direct taxation on the digital economy requires a global consensus, but this is thus far lacking. Negotiations on reforming international taxation rules are taking place under the leadership of the Inclusive Framework (IF)192 on Base Erosion and Profit Shifting (BEPS) and could increase global corporate income tax revenues by up to 4 percent, equaling US$100 billion annually.193 However, these negotiations are proving to be politically contentious and agreement has been delayed. In the absence of a consen-sus, countries including Indonesia, are considering interim measures. These rely on a simple measure of gross revenue to define the tax base for multi-national enterprises (MNEs). For example, they could include the gross revenue arising from the sale of advertising or data to Indonesian businesses, or the amounts collected from Indonesian users for provision of a ser-vice, regardless of the physical presence of the MNE providing such goods and services (WDR 2021).194 While continuing to participate in international consensus-building on direct taxation of the digital economy, the next step is for the GoI to complete the design of its proposed interim measures.
As part of its COVID-19 fiscal response, the GoI passed Law No. 2/2020 claimed taxing rights on non-resident firms with a “significant economic presence” in Indonesia and this is set to rely on a simple measure of gross revenue as the tax base. The interim measure is described only in broad terms, with the Ministry of Finance given powers to define its parameters. Issues still to be worked out include: (i) the scope of revenues, namely whether to limit the scope to B2B transactions (as is the case in the interim measures proposed by Austria and Hungary, and those implemented by India), or to encompass B2C transactions as well (as Chile proposes); (ii) incorporating a minimum provision (often linked to the sales revenue of the worldwide group, and/or sales in the domestic market); (iii) rate of levy (e.g., 2 percent for the United Kingdom, 3 percent for Italy, and 5 percent for Austria); and (iv) defining the col-
lection mechanisms for the new tax.195 The United States has reacted strongly against these unilateral measures. In January 2021, the US Trade Representative (USTR) announced that investigations into digital services taxes adopted by Austria, India, Italy, Spain, Turkey, and the United Kingdom were sub-ject to “possible trade actions” under Section 301, “because they discriminated against U.S. digital companies, were incon-sistent with principles of international taxation, and burdened U.S. companies.”196 Indonesia, Brazil, the Czech Republic, and the European Union were dropped from this investigation, the USTR noted, only because they “have not adopted or not implemented the DSTs under consideration when the investi-gations were initiated.”197 In response, the Indonesian Ministry of Finance has clarified that its priority is indirect taxation and, while maintaining its right to impose direct taxes, it has delayed implementing this policy in the hope that a global solution can be found.198
Indonesia is taking measures to reform its tax policy and modernize its tax administration to deal with the challenge of intangible transactions for VAT. Indonesia’s broad policy position was reflected in Law No. 2/2020, which provided the legal umbrella for imposing VAT on digital goods and services provided by foreign suppliers. Minister of Finance Regulation No. 48/ PMK.03/2020 (hereafter PMK-48) and DGT Regu-lation PER-12/PJ/2020 (hereafter PER-12) provided the next levels of policy and implementation details. They applied the existing VAT statutory rate of 10 percent on all intangible taxable goods and all taxable services that are provided by foreign suppliers through an electronic system. Both foreign and domestic digital platforms are required to collect the VAT on behalf of foreign suppliers, subject to being appointed as “VAT Collectors” by the DGT. To date, companies that have been asked by the DGT to serve in this capacity include Am-azon, Facebook, Google, LinkedIn, McAfee, Netflix, Skype, Spotify, Twitter, and Zoom.199 The qualifying criteria for being appointed a VAT Collector are based on: (i) annual sales vol-umes of at least IDR 600 million for digital goods and services in Indonesia (or IDR 50 million in a month); or (ii) online traffic volumes involving at least 12,000 users within Indo-nesia in 12 months, or 1,000 users in one month. To support compliance with the reforms, the DGT has introduced several administrative measures.200
As discussed in Chapter 3, to deal with the challenge of low-val-ue shipments Indonesia has lowered its minimum threshold from US$75 to US$3. In so doing, Indonesia has become an early mover in this reform space, following on from Australia, which was the first to slash its GST threshold from AU$1,000 to zero from July 2018.201 The EU has followed suit, with its previous exemption of consignments of less than €22 abolished from January 2021 onwards.202 To allow VAT to be levied, all imports into the EU now must be declared using an electronic customs declaration. To ease the implementation burden, the EU has also introduced a simplified customs declaration form for all declarations of goods up to €150.203 In Indonesia, imple-menting the new rules without overwhelming the customs ad-
206
BEYO
ND U
NICO
RNS:
HAR
NESS
ING
DIGI
TAL
TECH
NOLO
GIES
FOR
INC
LUSI
ON I
N IN
DONE
SIA
CHAP
TER
— 05
ministration or creating unnecessary burdens on business will be more challenging, requiring effective risk management.204 Experience from Australia and the EU may provide the GoI with some useful lessons.
The amount of revenue the Government is successful in col-lecting will depend on its ability to effectively manage com-pliance with the new requirements. Two measures can help in this regard. First, the GoI will need to ensure adoption and communication of consistent rules, leverage an efficient IT system to administer registration, filing, and payment, and combine digital transaction data with other third-party data and taxpayer data to enhance compliance risk management. Second, Indonesia’s overly generous VAT threshold needs to be reviewed to expand the digital economy tax base. Indonesia’s VAT threshold of IDR 4.8 billion stands out in international comparisons of VAT thresholds to GDP per capita, a metric commonly used to compare the generosity of VAT thresholds worldwide. Less-developed economies tend to have higher thresholds, in part because of weaknesses in tax administration and in part because they have larger informal economies.205 However, even when compared against low-income economies, Indonesia’s VAT ratio stands out as being too generous.206 A high threshold means that a vast share of businesses whose annual turnover is below the VAT threshold are excluded from the VAT system, narrowing the base and distorting the tax. This distortion is even greater when the threshold is applied
to e-commerce in Indonesia, which is characterized by a large share of small companies (Al-Rikabi et al. 2021).207
Overall, design and implementation of digital economy taxa-tion reform must be geared around the core principles of equi-ty, efficiency, and simplicity, so that Indonesia’s economy and society can altogether share in the benefits of digitalization. Over time, as digitalization expands, the demarcation between the digital economy and the economy at large will become increasingly blurred and eventually dissolve. This evolving reality makes it ever more important that the GoI gets taxation reform right. This means ensuring that tax policy and admin-istration meet the sound principles of good taxation. Create an uneven playing field of taxation, for example, by having differ-ent tax rates on online and offline businesses, or by enforcing rules on cross-border businesses but not on domestic ones, and Indonesia will end up with a tax system that detracts from the organic, healthy growth of the digital economy. Revenue lost to special incentives that favor the select few will mean less financ-ing for the critical public investments need to enable inclusive growth of digitalization. Ultimately, taxation must not distort business decisions on how to operate, and it should not alter consumer choice on what and where to buy—whether it be from a supermarket or a hypermarket, an online marketplace or via an online social media app. Taxes imposed must be fair and equal, and administered with a minimum burden on all.
Placeholder for Photo or Pull quote
207
BEYO
ND U
NICO
RNS:
HAR
NESS
ING
DIGI
TAL
TECH
NOLO
GIES
FOR
INC
LUSI
ON I
N IN
DONE
SIA
CHAP
TER
— 05

5.3. Use Digital Technologies to Provide Better Services and Upgrade Citizen-State Interactions
The COVID-19 pandemic has laid bare the low level of “digital readiness” on the part of the GoI to deliver ser-vices online and in a paperless manner. Governments around the world are adapting rapidly to use digital tech-nologies to cope with the crisis and ensure business conti-nuity, curb and manage the health contagion, and target economic and social relief programs to vulnerable popu-lation sub-groups. The GoI, in contrast, has struggled to mitigate disruptions of services due to low and unequal utilization of digital technologies across sectors, despite an increasing variety of online services provided in both the public and private sectors, particularly for education and health. In addition to limitations in connectivity, the absence of a national digital ID system and a comprehen-sive digital government system are the key factors under-mining Indonesia’s response to the COVID-19 pandemic.
→ Develop a national digital ID framework
Indonesia needs to launch a national digital ID initiative, bringing together various government stakeholders, the private sector and civil society, among others, to create a framework that would allow Indonesians to securely prove their identity online. Although there is a relatively strong national ID system managed by Dukcapil, Indonesia currently lacks an official digital ID system or framework to bring coherence to a myriad of systems to be officially
recognized, yet there is substantial demand and significant opportunities (see Chapter 4). However, Dukcapil is devel-oping prototypes and pilots for a mobile ID equivalent of the national ID card. A key question is the optimal model for the Indonesian context (i.e., centralized or federat-ed), building on the national ID system (Box 5.3). The status quo constrains growth of the digital economy and introduces additional costs and risks for service providers interacting with customers over the internet, as evidenced by increased fraud. It will therefore be critical that such a national digital ID initiative is a whole-of-country effort that links with other relevant initiatives, such as the BI Payment Systems Roadmap and Satu Data. Thailand offers a useful example: its National Digital ID initiative was born out of the National Digital Economy Committee chaired by the Prime Minister. Similar digital ID initiatives have been launched out of agencies attached to the head of gov-ernment, such as SingPass by the Singapore Government Technology Agency (GovTech) and the Australian Trusted Digital Identity Framework by the Digital Transformation Agency (DTA). An initiative in Indonesia would ideally be spearheaded by the President’s Office (KSP) with central roles for the Ministry of Home Affairs as the authority responsible for population data and the Ministry of Com-munications and Information as the authority responsible for regulating electronic transactions.
Improvements to the national ID system will create a strong base on which to introduce a digital ID system or framework. It offers population data that would allow an
208
BEYO
ND U
NICO
RNS:
HAR
NESS
ING
DIGI
TAL
TECH
NOLO
GIES
FOR
INC
LUSI
ON I
N IN
DONE
SIA
CHAP
TER
— 05

BOX 5.2
Designing Indonesia’s Digital ID system: Centralized or federated?
A centralized system involves government developing and implementing the digital ID system, commonly built as a feature of an existing national ID system or a layer on top. A famous example of this is Estonia’s system, which leverages the national ID smartcard and making widely available card readers that can plug into personal computers, as well as complementing that with mobile phone versions. Singapore’s Sing-Pass is similar. Centralized systems may be simpler to launch, especially when there is an existing national ID system, but can be quite rigid, and require substantial capital and sustained operating investment by govern-ment. A smartphone application or digital credential could be introduced as a natural centralized extension of the NIK and KTP-el. Integrating digital credentials on the KTP-el is another possibility. However, con-sidering the requirement for specialized readers and the costs of upgrading all KTP-els in circulation, this likely could be burdensome and would unlikely have a high return on investment.
Federated models are where multiple digital ID provid-ers that can come from the public and/or private sec-tors are governed by a trust framework and supervised by government. The trust framework includes laws, rules and standards for how the digital ID providers can access trusted data when people register to create a digital ID, and how service providers interface with the digital ID providers to verify the identity of their clients. There may be a central hub that links the var-ious components: people, digital ID providers, trust-ed data sources, and relying parties. Federations have been adopted by the United Kingdom, France (France Connect), Australia (Trusted Digital Identity Frame-work), Canada (Pan-Canadian Trust Framework) and Thailand (National Digital ID). Singapore is also ex-
ploring a shift to a federated approach that would build on the existing SingPass. A key benefit of federations is that: (i) they can leverage a dynamic private sector and multiple public sector actors; (ii) they provide people with choice; and (iii) they should promote innovation through competition between digital ID providers. However, they can be more complex, as the trust frame-work has to account for multiple actors and require institutional capacity to effectively regulate and super-vise the participants. Indonesia would not necessarily have to recreate the wheel and leverage documentation from some of the examples mentioned above. Dukcapil would play an essential role in any federation, not only as the trusted source of population data but also poten-tially as a digital ID provider (e.g., through a mobile ID equivalent to the national ID card).
Either approach has merits in the local context. A centralized system could be straightforwardly built on top of, or as part of, the existing national ID system, but the rigidity might limit use cases and adoption. A federated system could also be relatively easily be developed to leverage the national ID system, while also harnessing Indonesia’s dynamic private sector, but would need substantial work to develop the ca-pacity needed to effectively regulate and supervise the federation. A federated approach would provide more flexibility and opportunities for innovation. Im-portantly, a government-issued digital ID would not be excluded in a federated model and could even be the exclusive credential used for government trans-actions. The optimal model for Indonesia requires further study by a cross-governmental national digital ID initiative, taking into account the unique circum-stances of Indonesia, global lessons and examples, and the national and cross-border use cases to be pursued.
official digital ID system (managed by the Government) or officially-recognized digital ID system (managed by the private sector but regulated by the Government) with high levels of assurance. This onboarding process simplifies and significantly reduces the costs of introduc-ing digital IDs in Indonesia. For the national ID system to realize the full potential to support service delivery and underpin a digital ID system in Indonesia, two gaps will need to be addressed. First, coverage of the national ID system, including continuous registration of births, deaths and marriages, will need to be universal. Second, the utilization of the national ID system needs to be en-
hanced in terms of policies, processes and scalability, in-cluding to introduce national-scale biometric verification. Dukcapil has piloted one-to-one authentication, such as through biometric verification or one-time passwords (OTP), and an e-KYC service that shares selected data after a successful authentication, and these need to be scaled up nationwide. Finally, the GoI will need to decide on whether to build a centralized digital ID system im-plemented as a single system by the GoI, or a federated one implemented by multiple digital ID providers from the public and private sectors and regulated by the Gov-ernment (Box 5.2).
209
BEYO
ND U
NICO
RNS:
HAR
NESS
ING
DIGI
TAL
TECH
NOLO
GIES
FOR
INC
LUSI
ON I
N IN
DONE
SIA
CHAP
TER
— 05

Passage of a draft Personal Data Protection Law is a criti-cal next step. One area that will need particular attention is that Indonesia does not yet have a comprehensive data protection law with general applicability. This under-mines trust in any kind of collection, processing and shar-ing of personal data, which are core functions of digital ID systems. However, a draft Personal Data Protection Law was submitted by the President to parliament at the end of 2019, and this draft law was largely modelled on the EU’s General Data Protection Regulation (GDPR). An essential feature for the credibility and strength of such a law would be independent oversight, similar to the Office of the Australian Information Commissioner, Philippines National Privacy Commission, and the Sin-gaporean Personal Data Protection Commission. Such a law will ensure public trust and confidence in the existing national ID system, as well as any future digital ID sys-tem, and the digital economy more broadly by providing safeguards and accountability for the collection, use and sharing of personal data, as well as formalizing the rights of data subjects.
→ Reorient from a narrow focus on e-Government to a comprehensive national digital transformation agendaThe GoI could consider committing to a transition from the current narrow focus on e-Government to a compre-hensive National Digital Transformation agenda. The current e-Government initiative that is chaired by Men-Pan-RB focuses on the computerization of government internal processes. Looking at the scope in the regulation, the role fits the main duties and responsibilities of Men-Pan-RB, which includes the management of government business processes. However, if the GoI aims to achieve comprehensive digital transformation of the nation, it has to gradually depart from e-Government and slowly rearrange its vision, governance, and delivery model to better suit that aspiration as depicted in Figure 5.1. Such a commitment would reorient Indonesia in the same di-rection as that taken by digitally advanced countries, such as Singapore, the United Kingdom, Australia, Estonia, the Rep. of Korea and Canada.208 The digital government platforms would serve as the foundation of digital services in the economy, so that both public sector institutions and private sector enterprises can take advantage of these plat-
FIGURE 5.1
Transition from e-Government to digital transformation
From focusing oneGovernment only..
Providing tech platform and
governance to improve government initiated
services
Ministry responsible overseeing government
business processes and organizations
(currently MenpanRB)
Cross-government agency platform
integration (e.g.: performance-based
budgeting)
...to embracingNational Digital Transformation
Providing tech platform and governance to improve government, public and private services
Centre of Government (Office of hte President)
Tech-platform for multi-stakeholders use (e.g.: payment gateway, digital ID, public-private data exchange, etc)
How re-aligning the vision address identified problems
Attaining high level political leadership which is currently absent due to the limited e-Government scope
Wider digital transformation not only will unlock true potentials of tech, but also strengthen the current eGovernment agenda
Objectives
Ideal Coordinator
Typical initiatives
210
BEYO
ND U
NICO
RNS:
HAR
NESS
ING
DIGI
TAL
TECH
NOLO
GIES
FOR
INC
LUSI
ON I
N IN
DONE
SIA
CHAP
TER
— 05

forms to deliver services to every citizen. Examples of a common data exchange platform in Estonia,209 digital sin-gle sign on ID in Singapore,210 and digital payment in the United Kingdom211 show how pivotal digital government platforms can be to allow nations to operate effectively in digital space and to stimulate innovations in the market. The reform would need to be spearheaded by a central gov-ernment authority, for example, the Office of the President, to provide the political and bureaucratic influence needed for such far-reaching reforms.
At the same time, a short-term priority is to strength-en the role of MenPan-RB in orchestrating and deliv-ering the existing e-Government mandate. This could be achieved by setting up a Project Management Office (PMO) under the institution that could help address the disconnects and administrative burdens that currently exist in governance of the e-Government initiative. The disconnects stem from ineffective communication be-tween the various institutions involved and disconnected escalation/delegation processes between technical and leadership actors. The practice of setting up a PMO is not unprecedented. Strong PMOs have played import-ant roles in several national strategic programs, such as the delivery of the One Map policy by the Coordinating Ministry for Economic Affairs (CMEA).212 The associ-
ated regulation mandates government agencies to deliver geospatial data from over 80 sectors across 34 provinces within four years. Given the heavy coordination work required, CMEA decided to establish a PMO and staff it with top talent. Foreseeing that the required talent may not exist yet in the civil service, CMEA drew on the ser-vices of an external consulting firm to manage the PMO. CMEA successfully achieved the milestones in the One Map policy action plan in a timely manner.
In parallel, creation of regulatory and institutional frameworks necessary for the comprehensive digital transformation agenda can commence. To start with, a presidential regulation could be prepared to mandate: (i) the development of a national digital transformation strategy; (ii) the establishment of a policy-making entity; and (iii) the establishment of an implementation entity. The policy-making entity, a Digital Transformation Task Force (DTT), would ideally be attached to the Office of the President, overseeing and, if possible, consolidating and streamlining the governance structure of existing digital initiatives such as the e-Government agenda led by MenPan-RB, One Data led by Bappenas, Online Single Submission, and the One Map policy led by CMEA (Fig-ure 5.2). This would reduce the fragmentation that char-acterizes the governance structure of these initiativies,
FIGURE 5.2
A comprehensive national digital transformation agenda would require adjustments to the governance structure of ongoing digital government and policy initiatives
NATIONAL DIGITAL TRANSFORMATION
Digital Transformation taskforce (DTT)
(Office of The President)
Additional Notes on National Digital Transformation Governance
• DTT to be led by the Office of The President to provide strategic directions on national digital transformation agenda
• DTT will consolidate the work of various government digital related initiatives aside from eGovernment, such as Satu Data, OSS, One Map policy, etc.
• Implementation agency to be formend as an Independent Agency, with the option of being a BLU (Public Service Agency)
• Issue new PR on Digital Transformation Agenda replacing PR 95/2018
• Establishing DIgital Transformation Taskforce (DTT), led by the Office of the President
• Establish Digital Transformation Implementation Agency (DTIA)
• Consolidate government digital transformation initiatives under DTT
eGOVERNMENT
• Strengthen eGovernment implementation by equipping the eGovernment Coordination team with a PMO function
• Prepare and implement the transition strategy and plan
eGovernment Coordination Team
AGENDA FOCUS
ENABLERS
INSTITUTIONAL SETUP
AGENCIES
SNGs
AGENCIES
SNGs
PMO
GOVERNANCE STRUCTURE TO ALIGN WITH TRANSFORMATION AGENDA
Policy, strategy and directives
Implementation
Digital Transformation Implementation Agency (DTIA)
Existing functions(s) New functions(s) to establish
211
BEYO
ND U
NICO
RNS:
HAR
NESS
ING
DIGI
TAL
TECH
NOLO
GIES
FOR
INC
LUSI
ON I
N IN
DONE
SIA
CHAP
TER
— 05

and that leads to ineffective and unnecessarily complex implementation at a high cost of coordination. Finally, the implementation arm of the DDT would be a Digital Transformation Implementation Agency (DTIA), sim-ilar to agencies in Singapore (GovTech) and the United Kingdom (GDS). DTIA would be responsible for deliv-ery of cross-sectoral digital services, i.e., platforms and supporting technologies for sectoral ministries to host and operate their digital services. It would also serve as the ecosystem builder for delivery of sector-specific dig-ital services, coaching and assisting sectoral ministries to develop quality, standardized digital services for citizens. Both DTT and DTIA need not be newly established en-tities. Existing entities within the public sector could be empowered to play the role. Irrespective of the model that is chosen, the most crucial part of the reform would be to ensure that the institutional arrangement facili-tates a whole-of-government approach and eliminates fragmentation.
→ Transition toward a whole-of-government data management policy to undergird digital transformation
The One Data Presidential Regulation strengthens somewhat Indonesia’s data management policy, but fragmentation remains an issue and several implemen-tation challenges need to be worked out. Until recently, Indonesia did not have a clear whole-of-government data management policy. Each sector was responsible for its own data management, and guidance on cross-sectoral data-sharing and utilization was missing. Presidential Regulation No. 39/2019 on One Data issued in 2019 and its subsidiary implementing regulations try to ad-dress these fragmentation issues by granting Bappenas greater authority to regulate, monitor, and enforce data governance across government agencies. However, the associated implementing regulations not only need to specify the implementation sequence but also address the intersectionality of the regulation with other initiatives such as e-Government/Digital Government (Presidential Regulation No. 95/2018), the Electronic Transaction Law and its implementing regulation (PP No. 82/2012 and its revision PP No. 71/2019), the forthcoming Personal Data Protection Law,213 the Civil Registry Law, the Digital
Payment regulation, and Omnibus Law No. 11/2020.214 One of the recently issued One Data implementing reg-ulations, Permen Bappenas No. 16/2020, has addressed the relations between One Data and e-Government. The regulation outlines key elements of data management in view of e-Government, such as: (i) data architecture; (ii) master data and reference data; (iii) databases; and (iv) data quality. If well implemented, this can significantly improve government data governance in Indonesia. The master data and reference data management principles in the regulation are critical to reducing duplications, improving quality, and enabling access of key datasets, es-pecially the key datasets that are traditionally maintained by government institutions that administer important service.215 However, it is must be noted that the access to these key datasets must observe the other prevailing regulations such as privacy and the data protection law. Therefore, Bappenas, in its role as the leading ministry for the One Data policy, needs to strategize how to assert its leadership to effectively implement these subsidiary regulations by rallying support for the new government data management policy.
In a politically challenging environment, Bappenas needs to not only strategize the implementation of One Data subsidiary regulations, but also to rally support for the One Data policy. Specifically, Bappenas can: (i) Apply the One Data policy comprehensively in priority sectors relevant for managing the COVID-19 pandemic and re-vitalizing the economy (education, health, MSME, and social protection). Bappenas could do this by appointing a data steward in each sector, assisting stewards in devel-oping a master data reference for each sector and data standards and in enforcing the standards, and assisting policy makers in these sectors to draw insights from im-proved data management, which can then be used for expansion to other sectors; (ii) Build alliances with key institutions such as MenPan-RB, Kominfo and Dukcapil to slowly instill One Data principles into implementa-tion of the digital government and digital ID initiatives; and (iii) Work closely with MoF during the execution of shared planning and budgetary roles to identify and/or filter out programs and activities that lead to duplication or inefficient production of data. Bappenas and MoF can promote evidence-based and accountable policy-making by requiring program/activity proposals from line min-istries to meet certain standards of cost-benefit analysis that use reliable data. This could encourage line ministries to actively use data for policy-making and invest in their data systems.
212
BEYO
ND U
NICO
RNS:
HAR
NESS
ING
DIGI
TAL
TECH
NOLO
GIES
FOR
INC
LUSI
ON I
N IN
DONE
SIA
CHAP
TER
— 05

Placeholder for Photo or Pull quote
213
BEYO
ND U
NICO
RNS:
HAR
NESS
ING
DIGI
TAL
TECH
NOLO
GIES
FOR
INC
LUSI
ON I
N IN
DONE
SIA
CHAP
TER
— 05

162 Refer to Recommendation 6 on Releasing More IMT Spectrum for Wireless Broadband and 5G Deployment as contained in the ITU White Paper, Digital Infrastructure Policy and Regulation in the Asia-Pacific Region, September 2019.
163 Global Mobile Suppliers Association, 2021.
164 PLN has 67 million homes passed with the power utility (mostly poles) while the largest FTTH network, Telkom, reaches only about 30 million homes passed.
165 ASEAN and Plum Consulting, 2021.
166 ASEAN, 2021.
167 Alibaba Group and World Bank. 2019.
168 Draft. The World Bank Group. 2019. Indonesia’s Infrastructure Sector Assessment Program (InfraSAP).
169 With regard to transportation sectors, the law includes broad provisions to reduce or remove foreign equity restrictions, sim-plify licensing processes by transitioning from specific licenses to general business licenses, and transferring licensing responsibili-ties from line ministries to the central government.
170 Bukalapak’s analysis of its own data shows that same day and next day delivery within cities have helped warung performance, leading to a substantial reduction of the rate of late deliveries and complaints (Bukalapak presentation November 2019). Similar-ly, Paxel’s analysis of its own data shows that same day and next day inter-city delivery is helping housewives turned female mi-cro-entrepreneurs producing food products expand their mar-ket to other big cities in Java.
171 Warung Pintar offers member warung owners with data analytics to support decision-making when placing orders, such as an inte-grated supply chain solution to manage their stock.
172 The arrangement drove down logistics costs and enabled next-day delivery to many secondary and tertiary cities. The model does carry the risk of monopolistic behavior stemming from a single marketplace and logistics ecosystem, and thus calls for strict reg-ulatory oversight by the government to protect MSME interests.
173 At the opposite end of the scale, the roles that are set to be in-creasingly redundant by 2025 include roles being displaced by new technologies: accounting and bookkeeping and payroll clerks, data entry clerks, and assembly and factory workers, and administrative and executive secretaries.
174 Elsewhere in low- and middle-income countries, many people are employed in jobs that did not exist three decades ago (World Bank 2019). India has nearly 4 million app developers; Uganda has over 400,000 internationally certified organic farmers; and China has 100,000 data labelers.
175 World Bank 2019.
176 See Table 1 of World Bank 2020.
177 Ibid.
178 Poor performance is linked to lack of qualified faculty members and infrastructure, low capacity and reach of accreditation sys-tems, limited number of certification providers, and lack of com-petency frameworks developed in consultation with the private sector. Inadequate labor market information and intermediation makes it hard to align curricula and teaching with occupations and skills needed. Workers find jobs through informal networks rather than through formal messaging boards, job announcements, or job matching services. Most TVET providers have no mechanisms to assess the labor market performance of their graduates.
179 The typology in the EU Digital Competence Framework, for ex-ample, recognizes four categories: (i) more or less broadly defined existing occupations such as administrative worker in the public administration, primary school and early childhood teacher etc.; (ii) generic business functions such as operations and industrial services, marketing and sales, etc.; (iii) generic work conditions such as entrepreneur, virtual office worker, employment services staff; and (iv) new IT-intensive jobs in different economic sectors (Industry 4.0 jobs in manufacturing, new digital jobs in muse-ums, etc.), and distinct from IT specialist job profiles.
180 Underlying factors include limited capacity among small firms to allocate resources for training, and talent poaching that per-petuates high turnover rates, especially among high-skilled and young workers (World Bank, 2020)
181 Regulation No.128, Ministry of Finance, 2019.
182 World Economic Forum, 2020.
183 In one example, the Government of Costa Rica has worked with local employers across the country to identify current job open-ings and skill demand and tailored the program offering to that local demand. Similar structures of collaboration have been es-tablished across local government in the United States, specifi-cally across a network of job centers.
184 World Bank, 2020.
185 Bhardwaj et al, 2020.
186 The indirect revenue gains are potentially much greater, as data from the digital economy can be combined with other third-par-ty data and used by the revenue authority, the Directorate Gen-eral of Taxes (DGT), to boost compliance and raise higher reve-nues across Indonesia’s main taxes, i.e., value-added tax (VAT), corporate income tax (CIT) and personal income tax (PIT).
187 World Bank, 2021a.
188 For example, a guiding principle for income taxation has tradi-tionally been the principle of ‘permanent establishment’, which looks at tangible features of a business including the location of staff and assets to determine taxing rights and profit alloca-tion. However,, digital companies can generate large sales in a country with little or no physical presence. The intangibility of value-drivers of digital businesses has facilitated aggressive tax avoidance, resulting in a much lower tax burden on digital busi-nesses compared to traditional businesses, and large revenue losses for governments. For a more comprehensive discussion, see “Chapter 7. Creating value in the data economy: the role of competition, trade, and tax policy.” World Bank, 2021b.
189 “Creating Fair Tax Treatment and Protecting Domestic Small and Medium Industries, Government Changes Provisions on Import of Shipments (E-Commerce)”, Ministry of Finance Press Release (December 23, 2019), accessed online at: https://www.ke-menkeu.go.id/publikasi/siaran-pers/siaran-pers-ciptakan-per-lakuan-perpajakan-yang-adil-dan-lindungi-industri-ke-cil-dan-menengah-dalam-negeri-pemerintah-ubah-ketentu-an-impor-barang-kiriman-e-commerce/
190 According to data from the Ministry of Finance, low-value ship-ments below the previous USD 100 de minimis threshold have increased significantly in recent years, accounting for 84.4 per-cent of total shipments in 2018 (as measured by looking at the number of consignment notes issued). According to Indonesia’s tax regulations, shipments that fall below the minimum thresh-old are exempt from import duties and import VAT. Thus, the expansion of the digital economy has resulted in a significant re-duction in tax potential for taxes collected at the border.
Endnotes
214
BEYO
ND U
NICO
RNS:
HAR
NESS
ING
DIGI
TAL
TECH
NOLO
GIES
FOR
INC
LUSI
ON I
N IN
DONE
SIA
CHAP
TER
— 05

191 Data from Indonesia’s economic census and several surveys show that the vast majority of businesses within Indonesia have sales below the current VAT threshold of IDR 4.8 billion. Analysis of Indonesia’s e-commerce landscape shows a similar pattern (Al-Rikabi 2020).
192 The IF has 130 country members (including all OECD members) and is housed at the OECD. International organizations such as the World Bank Group have an observer role.
193 See the OECD’s preliminary estimate on revenue impacts here: https://www.oecd.org/tax/beps/webcast-economic-analysis-im-pact-assessment-february-2020.htm
194 For example, India introduced a 6 percent charge on digital ser-vices linked to online advertising in 2016, which it considered an “equalization levy” charged as a proxy for corporate income tax on foreign suppliers that did not have a permanent establish-ment in the country. The list of countries that have announced that they plan to introduce interim measures include: Austria; France; Hungary; Italy; India; Indonesia; Kenya; Malaysia; Mex-ico; Pakistan; Singapore; Turkey; Uruguay; Vietnam; the United Kingdom; and Zimbabwe. See WDR 2021, Ibid.
195 “Indonesia: Direct Taxation of the Digital Economy”, Internal Note, The World Bank (April 2020)
196 The USTR announcement on the next steps into its Section 301 Digital Services Taxes Investigation can be found here: https://ustr.gov/about-us/policy-offices/press-office/press-releases/2021/march/ustr-announces-next-steps-section-301-digital-ser-vices-taxes-investigations. In addition to the US formal action, an opinion-editorial was published by the former US Ambassador to Indonesia which expressed similar sentiments, recalling the US import retaliatory action against “France’s discriminatory digital services tax which was targeted at US tech firms”, and advising that “Indonesia must tread carefully” or else “would likely invite similarly retaliatory action”. See The Jakarta Post, 2020. To read the original trade action from the Office of the United States Trade Representative, see: “Docket No. USTR-2020-0022. Initiation of Section 301 Investigations of Digital Services Taxes”.
197 See USTR announcement, Ibid.
198 Adrian Wail Akhlas and Eisya Eloksari, “Indonesia defends digital tax policy despite US scrutiny,” The Jakarta Post (June 16, 2020), accessed online at: https://www.thejakartapost.com/news/2020/06/16/indonesia-defends-digital-tax-policy-de-spite-us-scrutiny.html
199 For some of the companies covered, see: “Indonesia adds Twitter, Zoom to tech companies that must pay 10% VAT”, Reuters, 2020.
200 The newly appointed VAT Collectors are provided with a VAT Collector ID and a tax registration letter. These VAT Collector are required to create VAT collection slips providing informa-tion on VAT collection and payment, which can take the form of a commercial invoice, billing, or order receipt to ease the burden of complying. VAT payment is made electronically using a billing code that is provided by the DGT, and can be made using IDR, USD dollar, or all other foreign currencies accepted by the DGT system. VAT Collectors are required to file quarterly reports, with at minimum data on: (i) number of users in Indonesia; (ii) amount of payments (excluding the VAT); (iii) amount of VAT collected; and (iv) amount of VAT settled to the government. The DGT is permitted to request further detailed filings on an annual basis with transaction-level data.
201 For more on Australia’s GST, see: https://www.ato.gov.au/Busi-ness/International-tax-for-business/GST-on-low-value-im-ported-goods/Who-charges-GST/
202 Council of the European Union. 2017. “VAT on electronic com-merce: new rules adopted”, Press Release, Council of the EU (De-cember 5, 2017).
203 Taxation and Customs Union. “New form of customs declara-tion for low value consignments”, The European Commission, accessed online at: https://ec.europa.eu/taxation_customs/news/new-form-customs-declaration-low-value-consignments_en
204 The large number of ‘informal’ MSMEs, not registered with gov-ernment entities, and/or entrepreneurial households increasingly active on e-commerce represent significant challenges in the Indo-nesia context. Data from digital platforms can be a very powerful enabler of enhanced risk management when combined with cus-toms data. Indonesia’s Directorate General of Customs is looking to do this, with an ongoing pilot involving several digital platforms focused on using e-commerce transactions data to tackle compli-ance risks including under-invoicing and missed declarations.
205 Revenue authorities with limited capacity to handle large num-bers of monthly VAT filings (e.g., because they remain reliant on manual filing, and/or have limited ICT capacities to manage VAT e-filing nationwide) may set a higher VAT threshold so that fewer companies would need to register and file. An informal economy may be defined as one with characterized by firms that are not registered, and/or whose employees work without a for-mal contract. Informal companies have been traditionally hard to tax, since they are often ‘hidden’ from government reach.
206 “Box B.1: Why is Indonesia’s tax-to-GDP ratio so low?” in The Indonesia Economic Quarterly: Towards Inclusive Growth” (March 2018), pp. 50.
207 Al-Rikabi, Khalil Rohman, and Hambali, “On the Macroeco-nomics of the Digital Economy in Indonesia”, Working Paper, World Bank (forthcoming, 2021).
208 The group of leading digital nationals: https://leadingdigital-govs.org/
209 Estonia’s Data Exchange Platform or widely known as X-Road: https://e-estonia.com/solutions/interoperability-services/x-road/
210 Singapore ID Service or Singpass: https://www.singpass.gov.sg/spauth/login/loginpage?URL=%2F&TAM_OP=login
211 UK Payment Service Platform: https://www.payments.service.gov.uk/
212 Indonesia One Map Portal: https://portalksp.ina-sdi.or.id/
213 Although the law does not significantly affect the One Data pol-icy, it will provide guidance to data stewards in particular when managing personal information. Bappenas as the coordinator of One Data implementation is expected to monitor closely the de-velopment and incorporate elements of the Personal Data Pro-tection Law in the One Data technical implementation guidance.
214 Although there is no specific mention of One Data in the Om-nibus Law, there are several provisions regarding data that are relevant. For example, the decision on wages for MSME is man-dated to be based on consumption aggregates calculated by the Central Statistics Agency (BPS). This means that data published by one GoI agency, BPS, will be used to set wages. Lack of clarity on due process and transparency in data production may weaken the legitimacy of official statistics and leave them vulnerable to being politicized.
215 For example, institutions such as the Directorate General of Civ-il Registry of the Ministry of Home Affairs and the Directorate General of Tax of the Ministry of Finance traditionally control and establish relatively more mature data management for civil registry and taxpayer datasets.
215
BEYO
ND U
NICO
RNS:
HAR
NESS
ING
DIGI
TAL
TECH
NOLO
GIES
FOR
INC
LUSI
ON I
N IN
DONE
SIA
CHAP
TER
— 05

References1 Akhlas, Adrian Wail and Eisya Eloksari, 2020. “Indonesia defends digital tax policy despite US scrutiny,” Jakarta: The
Jakarta Post. Retrieved from: https://www.thejakartapost.com/news/2020/06/16/indonesia-defends-digital-tax-policy-despite-us-scrutiny.html (accessed March 25, 2021).
2 Alibaba Group and World Bank. 2019. E-commerce Development: Experience from China (English). Washington, DC: World Bank Group.
3 Al-Rikabi, Jaffar and Jan Loeprick. 2021. “Direct and indirect VAT revenue potential from taxing the digital economy in Indonesia”. The World Bank. Forthcoming.
4 Al-Rikabi, Jaffar, Khalil Rohman, and Hambali. 2021. “On the Macroeconomics of the Digital Economy in Indonesia”, Working Paper, World Bank. Forthcoming.
5 ASEAN and Plum Consulting. 2021. “ASEAN Digital Masterplan 2025”. Retrieved from https://asean.org/storage/ASEAN-Digital-Masterplan-2025.pdf (accessed March 25, 2021).
6 ASEAN. 2021. “Joint Media Statement of the 1st ASEAN Digital Ministers’ Meeting and Related Meetings”. Retrieved from https://asean.org/joint-media-statement-1st-asean-digital-ministers-meeting-related-meetings/ (accessed March 25, 2021).
7 Australian Taxation Office. 2019. “Who charges GST”. Retrieved from: https://www.ato.gov.au/Business/International-tax-for-business/GST-on-low-value-imported-goods/Who-charges-GST/ (accessed November 16, 2020).
8 Bhardwaj, Riaz; Yarrow, Noah; Cali, Massimiliano. 2020. “EdTech in Indonesia: Ready for Take-off ?”. World Bank, Washington, DC.
9 Blake, Robert. 2020. “Indonesia must tread carefully in considering new digital tax”. Jakarta: The Jakarta Post. Retrieved from: https://www.thejakartapost.com/academia/2020/05/06/indonesia-must-tread-carefully-in-considering-new-digital-tax.html (accessed March 25, 2021).
10 Council of the European Union. 2017. “VAT on electronic commerce: new rules adopted”, Press Release, Council of the EU. Retrieved from: https://www.consilium.europa.eu/en/press/press-releases/2017/12/05/vat-on-electronic-commerce-new-rules-adopted/ (accessed November 16, 2020).
11 European Commission. 2021. “New form of customs declaration for low value consignment”. Retrieved from: https://ec.europa.eu/taxation_customs/news/new-form-customs-declaration-low-value-consignments_en (accessed November 16, 2020).
12 Global Mobile Suppliers Association. 2021. “4G-5G FWA Company Directory-2: Device Ecosystem – March 2021”. Retrieved from https://gsacom.com/paper/4g-5g-fwa-company-directory-2/ (accessed November 16, 2020).
13 International Telecommunication Union. 2019. “Digital Infrastructure Policy and Regulation in the Asia-Pacific Region”. Retrieved from https://www.itu.int/en/ITU-D/Regional-Presence/AsiaPacific/SiteAssets/Pages/Events/2019/RRITP2019/ASP/ITU_2019_Digital_Infrastructure_5Sep2019FNL.pdf (accessed November 16, 2020).
216
BEYO
ND U
NICO
RNS:
HAR
NESS
ING
DIGI
TAL
TECH
NOLO
GIES
FOR
INC
LUSI
ON I
N IN
DONE
SIA
CHAP
TER
— 05

14 Ministry of Finance Press Release. 2019. “Creating Fair Tax Treatment and Protecting Domestic Small and Medium Industries, Government Changes Provisions on Import of Shipments (E-Commerce)”. Retrieved from: https://www.kemenkeu.go.id/publikasi/siaran-pers/siaran-pers-ciptakan-perlakuan-perpajakan-yang-adil-dan-lindungi-industri-kecil-dan-menengah-dalam-negeri-pemerintah-ubah-ketentuan-impor-barang-kiriman-e-commerce/ (accessed March 25, 2021).
15 Office of the United States Trade Representative. 2021. “USTR Announces Next Steps of Section 301 Digital Services Taxes Investigations”. Retrieved from: https://ustr.gov/about-us/policy-offices/press-office/press-releases/2021/march/ustr-announces-next-steps-section-301-digital-services-taxes-investigations (accessed March 25, 2021).
16 Organization for Economic Cooperation and Development webcast. 2020. “Webcast: Update on Economic Analysis and Impact Assessment”. Retrieved from: https://www.oecd.org/tax/beps/webcast-economic-analysis-impact-assessment-february-2020.htm (accessed March 25, 2021).
17 Reuters. 2020. “Indonesia adds Twitter, Zoom to tech companies that must pay 10% VAT”. Reuters. Retrieved from: https://www.reuters.com/article/us-indonesia-tax-digital-idUSKBN25Z2CU (accessed March 25, 2021).
18 World Bank. 2019. World Development Report 2019. Washington DC: World Bank Group. Retrieved from: https://www.worldbank.org/en/publication/wdr2019 (accessed March 25, 2021)
19 World Bank. 2018. March 2018 Indonesia Economic Quarterly: Towards inclusive growth. Retrieved from: https://www.worldbank.org/en/country/indonesia/publication/indonesia-economic-quarterly-march-2018 (accessed November 16, 2020).
20 World Bank. 2019. World Development Report 2019. Washington DC: World Bank Group. Retrieved from: https://www.worldbank.org/en/publication/wdr2019 (accessed March 25, 2021).
21 World Bank. 2020. Closing the Gap between Workforce Development and Labor Markets: An Assessment of Indonesia’s Workforce Development System Based on the SABER Tool. Washington DC: World Bank Group. Retrieved from: https://openknowledge.worldbank.org/handle/10986/35379?show=full&locale-attribute=en (accessed November 16, 2020).
22 World Bank. 2021a. Macro Poverty Outlook. Washington DC: World Bank Group. Retrieved from: https://www.worldbank.org/en/publication/macro-poverty-outlook (accessed March 25, 2021).
23 World Bank. 2021b. World Development Report 2021. Washington DC: World Bank Group. Retrieved from: https://www.worldbank.org/en/publication/wdr2021 (accessed March 25, 2021).
217
BEYO
ND U
NICO
RNS:
HAR
NESS
ING
DIGI
TAL
TECH
NOLO
GIES
FOR
INC
LUSI
ON I
N IN
DONE
SIA
CHAP
TER
— 05

RECOMMENDED POLICY DIRECTION – WHAT?
SOME PRIORITY ACTIONS – HOW?
RESPONSIBLE AGENCIES – WHO?
PRIORITY OBJECTIVE I: IMPROVE DIGITAL CONNECTIVITY TO UNIVERSALIZE ACCESS
OPTIMIZE SPECTRUM ALLOCATION FOR MOBILE BROADBAND
Implement the “Analogue Switch Off” by the end of 2022 in accordance with the Omnibus Law so as to free up the 700MHz band for greater rural connectivity using 4G and future 5G networks
KOMINFO
Optimize the higher frequency capacity bands, starting with the freeing up the 2.6 GHz band, followed by the 3.4-3.8 GHz band and potentially the broader 3.3-4.2 GHz band to facilitate 5G deployment in urban areas. Consideration should be had to the release of the mmWave spectrum bands for 5G in urban areas
STRENGTHEN MECHANISMS TO ENSURE SHARING OF ACTIVE AND PASSIVE INFRASTRUCTURE
Update the Telecom Law, PP 52/53, to allow for sharing of active infrastructure on a B2B basis
KOMINFO
Implement through regulations the passive infrastructure sharing mandated under the Omnibus Law
KOMINFO, MOHA, MINISTRY OF PUBLIC WORKS
Require service providers benefiting from Universal Service Obligation fund to share subsidized infrastructure, and create a single entity responsible setting tariffs for passive infrastructure sharing
KOMINFO
STRENGTHEN COMPETITION ALONG THE BROADBAND VALUE CHAIN
Review current licensing regime and transition toward international best practice of single/unified licensing to allow a larger number of providers to deliver the full portfolio of services
KOMINFO
Appoint an independent regulatory body for the telecom sector consistent with exemplar practice and Indonesia’s RCEP commitments
PRIORITY OBJECTIVE II: MAKE THE DIGITAL ECONOMY WORK FOR ALL
SUPPORT THE DEVELOPMENT OF LOGISTICS
Continue to develop basic physical infrastructure to improve connectivity through strengthened and/or rehabilitated infrastructure (roads, ports, and electricity), leveraging private sector capital and expertise as appropriate through PPPs
MINISTRY OF TRANSPORT, DIRECTORATE GENERAL OF HIGHWAYS, MINISTRY OF PUBLIC WORKS AND HOUSING
Deepen reforms to reduce entry barriers to logistics and transportation services and build long-term investor confidence, to expand warehousing outside of large metropolitan areas
MINISTRY OF TRANSPORT, WITH SUPPORT FROM MINISTRIES OF TRADE AND FINANCE AND THE COORDINATING MINISTRY OF MARITIME AFFAIRS AND INVESTMENTS
Continue to modernize the National Post Service; standardize addresses and postcodes
MINISTRY OF COMMUNICATION AND INFORMATICS
NURTURE DIGITAL SKILLS AND SKILLS FOR THE 21ST CENTURY DIGITAL ECONOMY
Align non-formal education services and lifelong learning with needs of the working-age adult population, adopting a modular approach to course offerings with an emphasis on soft skills in addition to technical digital skills, incorporating employment-specific digital skills relevant for Indonesia, emphasizing a mindset of continuous learning, and offering opportunities to practice “self-managed” learning
MINISTRY OF EDUCATION AND CULTURE AND MINISTRY OF MANPOWER
Build partnerships between tertiary institutions and the private sector to train vocational students in high-tech areas using practice-based curricula, practitioner-led instruction, and professional certification
MINISTRY OF EDUCATION AND CULTURE/PRIVATE SECTOR
Ensure that tertiary education offers a minimum threshold of foundational “transferable” higher-order skills such as critical thinking, problem-solving and communication, even in STEM fields
MINISTRY OF EDUCATION AND CULTURE
Incentivize employers to offer internships and off-campus learning to students
MINISTRY OF EDUCATION AND CULTURE/MINISTRY OF MANPOWER
Continue to develop data systems that allow for identification of occupations and skills in demand, monitor educational institutions’ compliance with quality standards, and ensure that information on employability of individuals with various degrees, wage profiles, and occupation-specific courses is available to jobseekers and workers
MINISTRY OF EDUCATION AND CULTURE/MINISTRY OF MANPOWER
Annex. Policy Recommendations
218
BEYO
ND U
NICO
RNS:
HAR
NESS
ING
DIGI
TAL
TECH
NOLO
GIES
FOR
INC
LUSI
ON I
N IN
DONE
SIA
CHAP
TER
— 05

RECOMMENDED POLICY DIRECTION – WHAT?
SOME PRIORITY ACTIONS – HOW?
RESPONSIBLE AGENCIES – WHO?
PROMOTE SUPPLY OF DFS/DIGITAL PAYMENT SOLUTIONS THAT CATER TO THE UNBANKED AND THE UNDERBANKED
Streamline the licensing and registration processes required to become a provider of digital financial services
BANK INDONESIA AND OJK
Standardize rules and procedures to enable interoperability of payment schemes
BANK INDONESIA
Incentivize the private sector to innovate and develop new DFS products that cater to the rural population
BANK INDONESIA AND DIRECTORATE GENERAL OF TAXES
Increase use cases of DFS products in the delivery of government services (including Government-to-person payment) to sustain the commercial viability of DFS agents
CMEA (FINANCIAL INCLUSION COUNCIL) AND MINISTRY OF SOCIAL AFFAIRS
Strengthen the legal and regulatory framework for managing risks related to data governance and privacy, cyber security and operational risk, and financial integrity, in order to build consumer trust in DFS products
BANK INDONESIA AND OJK
USE TAX POLICY INSTRUMENTS TO ENSURE A LEVEL PLAYING FIELD
Complete the design of measures to reform tax policy and modernize tax administration in relation to DE transactions, ensuring adoption and communication of consistent rules, institution of efficient IT systems to administer registration, filing, payment and use of digital transaction data with other third-party data and taxpayer data for strengthened compliance risk management
MINISTRY OF FINANCE (DIRECTORATE GENERAL OF TAXES, DIRECTORATE GENERAL OF CUSTOMS AND EXCISE, AND FISCAL POLICY AGENCY)
Lower the overly generous VAT threshold to expand the digital economy tax base
PRIORITY OBJECTIVE III: USE DIGITAL TECHNOLOGIES TO PROVIDE BETTER SERVICES AND UPGRADE CITIZEN-STATE INTERACTIONS
DEVELOP A NATIONAL DIGITAL ID FRAMEWORK
Pass the Personal Data Protection law KOMINFO
Launch a whole-of-economy national digital ID initiative to define the optimal model for Indonesia, bringing together government, private sector and civil society
OFFICE OF THE PRESIDENT, MOHA, AND KOMINFO
Close the coverage gaps in the national population registry database (SIAK), streamline the new registration and update processes, and introduce
MOHA
Introduce a national digital ID system or ecosystem fit-for-purpose in the Indonesia context
OFFICE OF THE PRESIDENT, MOHA, AND KOMINFO
REORIENT FROM A NARROW FOCUS ON E-GOVERNMENT TO A COMPREHENSIVE NATIONAL DIGITAL TRANSFORMATION AGENDA
Strengthen the political and bureaucratic influence needed to move the agenda by placing a central government authority like the Office of the President in the driving seat.
OFFICE OF THE PRESIDENT
Create an appropriate institutional structure in the form of a dedicated digital transformation implementation agency to consolidate various disparate initiatives and to drive the agenda in an integrated and coherent manner.
IMPLEMENT A WHOLE-OF-GOVERNMENT DATA MANAGEMENT POLICY
Implement the One Data Policy comprehensively, in priority sectors relevant for managing the post pandemic recovery (e.g., education, health, social protection or MSMEs)
BAPPENAS
Build alliances with key institutions such as MENPAN-RB, Kominfo, and MoHA to instill One Data principles into the implementation of the digital government and digital ID initiatives
BAPPENAS
219
BEYO
ND U
NICO
RNS:
HAR
NESS
ING
DIGI
TAL
TECH
NOLO
GIES
FOR
INC
LUSI
ON I
N IN
DONE
SIA
CHAP
TER
— 05


WORLD BANK INDONESIA FLAGSHIP REPORt