growth factors, glucose and insulin kinetics after low dose growth hormone therapy in...
TRANSCRIPT

Growth factors, glucose and insulin kineticsafter low dose growth hormone therapyin HIV-lipodystrophy
Steen B. Haugaarda,b,c,*, Ove Andersena,b, Allan Flyvbjergd,Hans Ørskovd, Sten Madsbadc, Johan Iversena
aDepartment of Infectious Diseases, Hvidovre University Hospital, DK-2650 Hvidovre,Copenhagen, DenmarkbClinical Research Unit, Hvidovre University Hospital, DK-2650 Hvidovre, Copenhagen, DenmarkcDepartment of Endocrinology and Internal Medicine, Hvidovre University Hospital,DK-2650 Hvidovre, Copenhagen, DenmarkdMedical Research Laboratories, Clinical Institute, Aarhus University Hospital, DK-8000 Aarhus, Denmark
Accepted 24 August 2005Available online 24 October 2005
01do
Co
KEYWORDSGrowth hormone;HIV-infection;Lipodystrophy;Glucose metabolism;IGF-I;Insulin secretion
63-4453/$30.00 Q 2006 The Britishi:10.1016/j.jinf.2005.08.025
* Corresponding author. Address: Cpenhagen, Denmark. Tel.: C45 363E-mail address: [email protected]
Summary Objectives: Low-dose growth hormone (GH) administration has beensuggested as a treatment for HIV-lipodystrophy.Methods: Postglucose GH-secretion, kinetics of insulin-like growth factors (IGFs),insulin, and glucose metabolism were examined in six male HIV-infectedlipodystrophic patients (two normal-weight patients with normal glucose-tolerance(NGT), two normal-weight with impaired glucose-tolerance (IGT), and two obesepatients with diabetes (DM)) during a 16 weeks open-labelled pilot-study of low-doseGH, 0.7 mg/day.Results: DM, compared to NGT and IGT, displayed an impaired rebound of GH duringa 5 h oral glucose-tolerance test. Near lower normal limits in all patients before GH-therapy, total and free IGF-I increased between 87 and 152% during the GH-therapy(P!0.001), approaching upper normal limits in all patients with the highestincremental percentages shown in DM. A slight and temporary reduction in insulinsensitivity was caused by a reduction in non-oxidative glucose metabolism (nZ5).GH-administration reduced hepatic extraction of insulin alleviating the demand forinsulin secretion (nZ5). No adverse effects of GH were detected.Conclusions: As judged from effects on circulating IGF-I, glucose metabolism, andinsulin kinetics, 0.7 mg/day of GH may be expedient for treatment of HIV-infectedmales with lipodystrophy. Whether the patients’ glucose metabolic status mattersfor the IGF-response to low-dose GH-therapy awaits further investigation.Q 2006 The British Infection Society. Published by Elsevier Ltd. All rights reserved.
Journal of Infection (2006) 52, 389–398
www.elsevierhealth.com/journals/jinf
Infection Society. Published by Elsevier Ltd. All rights reserved.
linical Research Unit, Hvidovre University Hospital, Kettegaards Alle, DK-2650 Hvidovre,26054; fax: C45 36474979.(S.B. Haugaard).

S.B. Haugaard et al.390
Introduction
During recent years a syndrome of fat redistributionhas been described in human immunodeficiency(HIV) infected patients on highly active antiretro-viral therapy (HAART).1,2 This lipodystrophic syn-drome is characterized by centrifugal loss of fat andcentral, primarily intraabdominal fat gain3 andassociated insulin resistance, glucose intoleranceand detrimental effects on b-cell function.1,4–8 AHIV-infected patient, who has received HAART formore than 12 months, exhibits a risk for lipodystro-phy of approximately 40%.2
Owing to its effect on body composition, growthhormone (GH) has been tested for treatment of HIV-lipodystrophy, showing reduction of abdominal fatafter high-dose GH regimens of 2–6 mg/day.9–11
However, these high-dose GH-regimens induceadverse effects and symptoms that resemblethose of patients with acromegaly including dia-betes mellitus (DM), joint pain, and fluid reten-tion.9–11 Recently, some studies have suggestedthat low-dose GH regimes are more suitable fortreatment of HIV-lipodystrophy than high-dose GHregimens.9,12 Low dose GH regimens of about1.0 mg/day appear to be almost without GH-relatedside effects.12
We have reported data from a study using a 30%lower dose (0.7 mg/day) of GH.13 We found thatinsulin-like growth factor I (IGF-I) levels increasedat least two-fold and that fat distribution tended toimprove following 16 weeks of treatment.13 In thepresent paper we extend these findings by present-ing dynamics of GH-secretion during a 5 h oralglucose tolerance test and by measuring thechanges in total and free IGF-I and -II at severaltimepoints throughout the 16 weeks study period inthe same patients. Additionally, we present basaland insulin stimulated glucose and lipid metabolismby indirect calorimetry in combination with ahyperinsulinemic euglycaemic clamp. The effectof GH treatment on hepatic extraction of insulinand posthepatic insulin clearance was also evalu-ated throughout the study period.
Methods
Subjects and study protocol
A detailed description of the patients included inthe present study has been given previously.13 Inbrief, six HIV-1 positive Caucasian males on stableHAART were included. They all reported stable
weight but changes in body composition consistentwith mixed type lipodystrophy, which was con-firmed by a physician.14 Patients were examinedclinically and asked to fill in a questionnaire ofknown adverse effects to GH administration atweeks 0, 6, and 16. Furthermore, patients wereinstructed not to change exercise and diet habits ormake any changes in medication throughout thestudy period. Finally, they were instructed toabstain from strenuous physical exercise within2 days before metabolic measurements. At baselinea 5 h oral glucose tolerance test (OGTT) was done. Aeuglycaemic hyperinsulinaemic clamp combinedwith indirect calorimetry was performed at weeks0, 6, and 16.
Dual energy X-ray absorptiometry (DEXA) scans(Norland Medical system XR-36, Inc., Fort Atkin-son, WI, U.S.A.) were performed to measure softtissue distribution at weeks 0, 6, and 16. At week 0and 16 a cyclo-ergometer (Siemens Ergoline,Erlangen, Germany) exercise test using a MegaCartsystem (Siemens, Solna, Sweden) applying loadstarting at 40 W and increasing continuously by20 W/min until exhaustion. A 4-day diet recordincluding 2 weekend days and 2 working days wasperformed just before start on GH treatment andat week 16 of treatment. A dietician providedindividual diet record instruction and the recordswere analysed using the Dankost 2000 softwareprogram (Dansk Catering Center A/S, Herlev,Denmark).
After baseline evaluation, patients were treatedby daily self-injection with GH (Novo-Nordisk A/S,Bagsvaerd, Denmark). The sc. dose of GH(0.7 mg/day) was administered between 1 and 3pm. At weeks 2 and 10 overnight fasting serum wasobtained to measure serum IGF-I and IGFBP-3. Theethical committee of Copenhagen, Denmarkapproved the study and written informed consentwas obtained.
Oral glucose tolerance test
A 5 h OGTT was performed after an overnightfast of 10 h including withdrawal of oral medi-cation to determine glucose tolerance status ofthe subjects (2 h plasma glucose)15 and post-glucose GH-secretion pattern.16 Baseline sampleswere drawn at K10, and 0 min. At 0 min, 75 gglucose dissolved in 300 ml water was takenorally by the patient. Venous blood was sampledat 30, 60, 90, 120, 150, 180, 210, 240, 270, and300 min for measurement of plasma glucose andserum GH.

GH-therapy, IGF-I and insulin kinetics in HIV-lipodystrophy 391
Hyperinsulinaemic euglycaemic clampand indirect calorimetry
Patients were admitted to the hospital at 08.00 hafter an overnight fast of 10 h including withdrawalof oral medication. A polyethylene catheter wasinserted into a wrist vein for blood sampling. Thishand was kept in a heated box throughout the test toobtain arterialized venous blood. Another polyethy-lene catheter was inserted into the contralateralantecubital vein for infusion of insulin and glucose.Baseline samples for glucose were obtained at K50,K40, K30, K20, K10, and 0 min, for insulin andC-peptide at K50, K40, K30 and 0 min and for freefatty acids (FFA), cholesterol and triglyceride atK50 and K40 min. Insulin infusion (Actrapid, NovoNordisk A/S, Bagsvaerd, Denmark) was started attime 0 for 120 min with a rate of 40 mU/m2/min.Plasma glucose concentration was maintained con-stant at 5 mM using a variable glucose infusion of 20%glucose.17 During the clamp, glucose level wasmonitored every 10 min. From K30 to 0 min (base-line) and from K90 to 120 min (clamp) an indirectcalorimetry was performed using a computerizedcanopy gas analyzer system (Deltatrac II MetabolicMonitor; Datex, Helsinki, Finland).
Laboratory measurements
Serum GH levels were determined by an immuno-fluorometric assay (Delfia, Wallac Oy, Turku, Fin-land) with a detection limit of 1 ng/l and an intra-and inter CV of approximately 5%. Serum total IGF-Iand total IGF-II were measured by an in-house non-competitive, time-resolved immunofluorometricassay after acid ethanol extraction of serum, aspreviously described.18 The within assay coefficientof variation (CV) of total IGF-I and IGF-II averagesless than 5%. Serum free IGF-I and free IGF-II weremeasured by ultrafiltration, as previouslydescribed.19 Including ultrafiltration and immu-noassay, the within assays CV averaged 18 and 12%for free IGF-I and -II, respectively. Serum concen-tration of IGFBP-3 was measured by immunoradio-metric assay (IRMA, Diagnostic SystemsLaboratories Inc., Webster, TX, U.S.A.). Plasmaglucose was measured in duplicate by a glucoseoxidase method with a glucose analyzer (BeckmanCoulter Inc. Instruments, Fullerton, CA, U.S.A.).Plasma insulin and C-peptide concentrations weredetermined by AutoDELPHIAe automatic fluoroim-munoassay system (Wallac Oy, Turku, Finland) asdescribed.4 Plasma free fatty acids were deter-mined using an enzymatic colorimetric method(Wako C test kit, Wako Chemicals GmbH, Neuss,
Germany) with an inter-assay CV of 5%. Total serumcholesterol and serum-triglycerides were deter-mined by reflection photometry (Ortho-ClinicalDiagnostics kit, NJ, U.S.A.). CD4 count determi-nation (flow cytometry, Becton-Dickinson FACscan,BD, NJ, U.S.A.) and viral load determination (RocheAmplicor Ultrasensitive assay with a detection limitof 20 copies/ml plasma, Roche, Basle, Switzerland)met the requirements for interlaboratory qualitycontrol.
Calculations
Insulin sensitivity (M/I) was defined as the averageglucose infusion rate (GIR) measured during the last30 min of the clamp divided by ambient insulinconcentration.17 Protein, non-protein glucose- andlipid oxidation rates at baseline and during the last30 min of the clamp were calculated as described.20
Non-oxidative glucose metabolism was calculatedas GIR minus insulin stimulated glucose oxidation.Prehepatic insulin secretion rates were calculatedby deconvolution of plasma C-peptide concen-trations as described.21 Homeostasis insulin resist-ance index (HOMA-IR) was calculated from fastingplasma glucose and insulin as described.22 Based onprehepatic insulin secretion rates, plasma insulinconcentrations, and insulin infusion rates hepaticextraction of insulin (HEXi) and posthepatic clear-ance of insulin were calculated.23
Statistics
Means are reported if not otherwise indicated. Toanalyse changes of distribution of data over timethe student t paired test was applied for compari-son between two timepoints. Given more than twotimepoints (i.e. comparison of data obtained atweeks 0, 6, 16) a two-way analysis of variance wasapplied. Calculations were performed using thestatistical package from SPSS (SPSS ver. 12.0.; SPSSInc., Chicago, IL, U.S.A.). P! 0.05 was consideredstatistically significant.
Results
As determined by an OGTT, two of the patientsexhibited normal glucose tolerance (NGT), twoexhibited impaired glucose tolerance (IGT), andtwo of the patients had DM (Table 1).15 Table 1 givesbaseline characterisation of the NGT, IGT, and DMgroups. It appeared that patients with DM wereobese, whereas patients with NGT and IGT werenormal-weight. The GH ‘postglucose suppression

Figure 1 GH dynamics during OGTT. Upper graph showsGH-secretion during a 5 h oral glucose tolerance test insubgroups of lipodystrophic HIV-infected patients, whodisplayed normal glucose tolerance (NGT, nZ2),impaired glucose tolerance (IGT, nZ2), and diabetesmellitus (DM, nZ2), respectively. Note the log trans-formation of GH concentrations at the y-axis. Lowergraph shows plasma glucose concentrations during thesame study period corresponding to the NGT, IGT, and DMsubgroups.
Table 1 Baseline characteristics of HIV-infectedpatients in groups defined by glucose tolerance status
NGT IGT DM
N 2 2 2Age (years) 44 51 51Body mass index (kg/m2) 24.0 23.1 29.9Trunk fat mass (kg) 7.7 7.6 15.8Limb fat mass (kg) 4.0 3.2 7.6Fs-total cholesterol(mmol/l)
5.5 5.9 5.6
Fs-triglyceride (mmol/l) 1.7 5.2 3.8Fp-free fatty acids(mmol/l)
320 560 590
Fp-glucose (mmol/l) 5.9 6.0 7.6Fp-insulin (pmol/l) 36 59 1322 h p-glucose (mmol/l) 5.8 8.4 13.2CD4 (cells/ml) 391 578 319HIV-RNA (copies/ml) 20 19 69Duration of HIV infection(years)
10 15 7
Duration of HAART(months)
51 34 33
NGT, normal glucose tolerance; IGT, impaired glucosetolerance; DM, diabetes mellitus; Fs, fasting serum; Fp,fasting plasma; HAART, highly active antiretroviral therapy.
S.B. Haugaard et al.392
test’ (Fig. 1) showed that patients with DMdisplayed a blunted rebound of GH-secretionfollowing oral glucose compared with patientswith NGT and IGT, who displayed a rebound 7–15-fold over baseline GH-concentrations. The relativeincrease in total and free IGF-I and IGFBP-3 after GHstimulation, were at least as great in patients withDM as in patients with NGT and IGT (Fig. 2). GH-sensitive total and free IGF-I and IGFBP-3 displayeda prompt increase within the first 2 weeks of GHtreatment (Fig. 3), whereas the less GH-sensitivetotal IGF-II showed a slight increase, and free IGF-IIdid not change throughout the study period. Theincrements of total and free IGF-I within the first 2weeks of GH-administration accomplished 73 and85% of the mean increments of these parameters ofweeks 6, 10, 16. From week 6 on, total and free IGF-I reached a plateau level. To investigate to whatextent variability in free IGF-I levels could beexplained by plasma concentrations of total IGF-Iwe did a scatter plot of total and free IGF-I (Fig. 3,panel (f)), which demonstrated that approximately50% of variation in free IGF-I was caused by levels oftotal IGF-I, both before and following GH-adminis-tration, which supports our previous observation inHIV-infected patients on HAART.24
Table 2 gives baseline values and changes offasting substrate oxidation rates and soft tissuemasses during the study period for all subjects.Fasting protein oxidation was significantly reduced,
whereas fasting glucose oxidation increased signifi-cantly and fasting lipid oxidation showed a trendtowards reduction. Slight increases were detectedin fasting plasma FFA (insignificantly) and glucose(significantly) during the study period. Energyexpenditure and work capacity did not changeduring study period, but food ingestion tended tobe increased. Total and limb lean body massesincreased significantly during the study period,whereas total fat mass was unchanged, however,as judged from the absolute values, limb fat massincreased and trunk fat mass showed a reduction.
The patient with the greatest BMI (32.2 kg/m2)and manifest DM did not reach a glucose concen-tration of 5 mmol/l during the last 30 min of theclamp (week 0: 5.7 mmol/l, week 6: 6.1 mmol/land week 16: 6.3 mmol/l), and the data from thispatient were, therefore, omitted from the clampcalculations. In contrast, the other five subjects
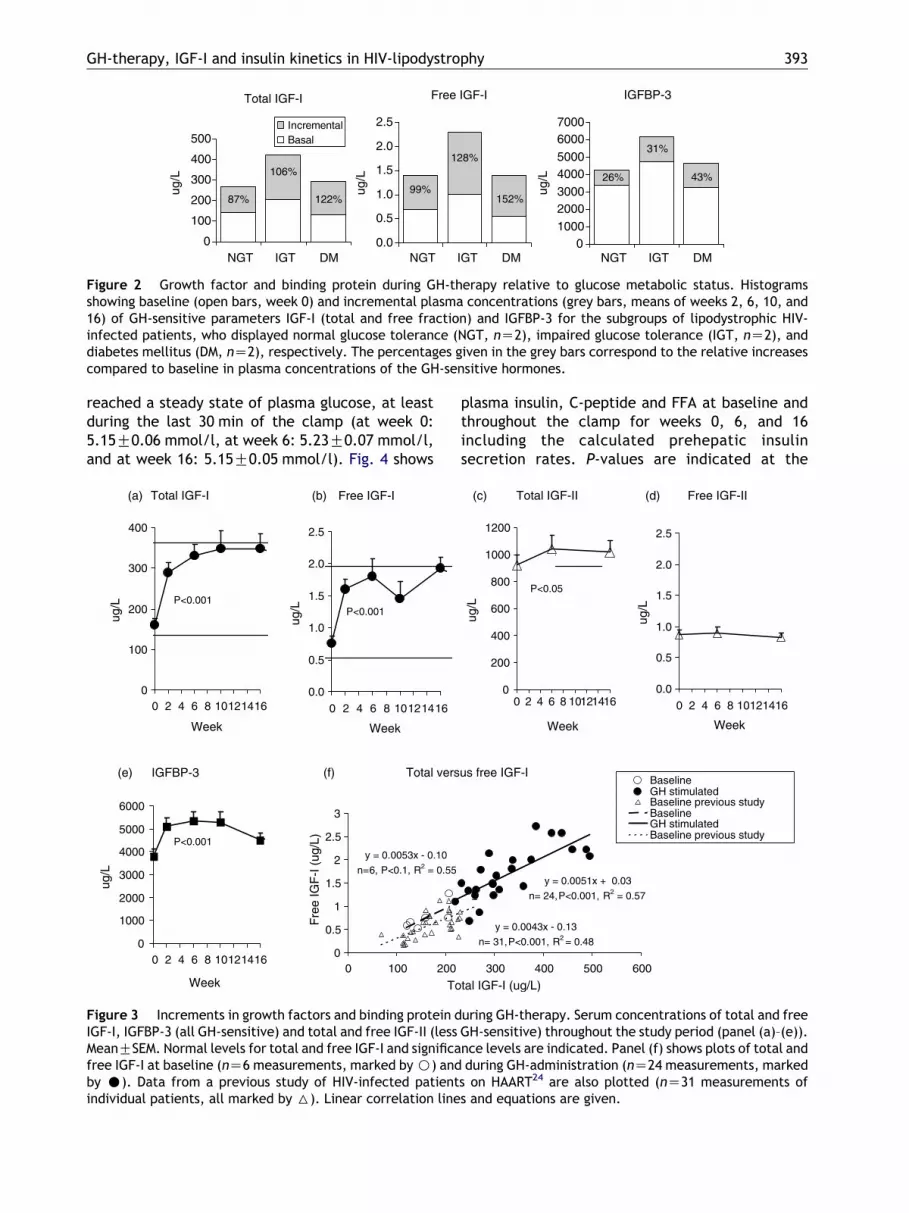
Figure 2 Growth factor and binding protein during GH-therapy relative to glucose metabolic status. Histogramsshowing baseline (open bars, week 0) and incremental plasma concentrations (grey bars, means of weeks 2, 6, 10, and16) of GH-sensitive parameters IGF-I (total and free fraction) and IGFBP-3 for the subgroups of lipodystrophic HIV-infected patients, who displayed normal glucose tolerance (NGT, nZ2), impaired glucose tolerance (IGT, nZ2), anddiabetes mellitus (DM, nZ2), respectively. The percentages given in the grey bars correspond to the relative increasescompared to baseline in plasma concentrations of the GH-sensitive hormones.
GH-therapy, IGF-I and insulin kinetics in HIV-lipodystrophy 393
reached a steady state of plasma glucose, at leastduring the last 30 min of the clamp (at week 0:5.15G0.06 mmol/l, at week 6: 5.23G0.07 mmol/l,and at week 16: 5.15G0.05 mmol/l). Fig. 4 shows
Figure 3 Increments in growth factors and binding protein dIGF-I, IGFBP-3 (all GH-sensitive) and total and free IGF-II (lessMeanGSEM. Normal levels for total and free IGF-I and significafree IGF-I at baseline (nZ6 measurements, marked by B) andby C). Data from a previous study of HIV-infected patientindividual patients, all marked by 6). Linear correlation line
plasma insulin, C-peptide and FFA at baseline andthroughout the clamp for weeks 0, 6, and 16including the calculated prehepatic insulinsecretion rates. P-values are indicated at the
uring GH-therapy. Serum concentrations of total and freeGH-sensitive) throughout the study period (panel (a)–(e)).nce levels are indicated. Panel (f) shows plots of total andduring GH-administration (nZ24 measurements, marked
s on HAART24 are also plotted (nZ31 measurements ofs and equations are given.
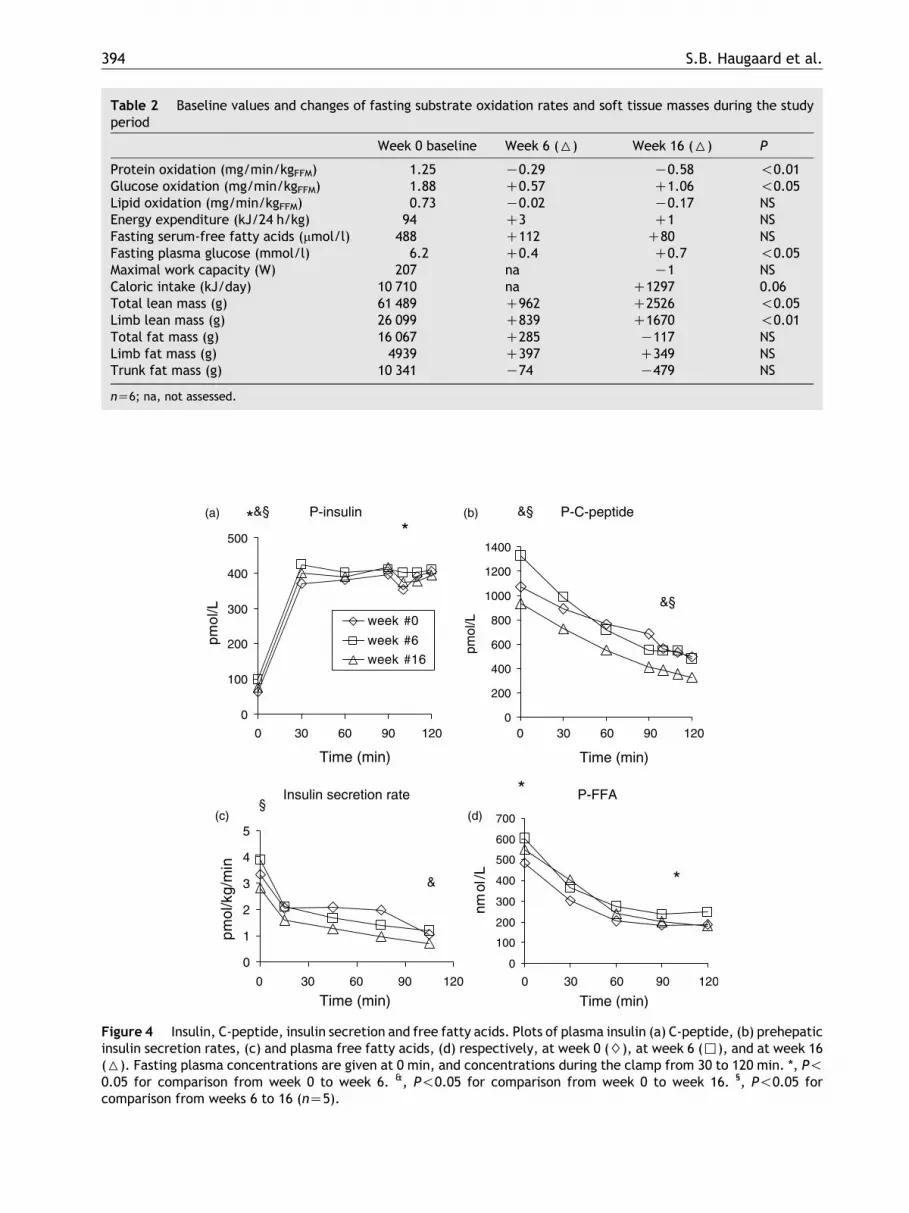
Table 2 Baseline values and changes of fasting substrate oxidation rates and soft tissue masses during the studyperiod
Week 0 baseline Week 6 (6) Week 16 (6) P
Protein oxidation (mg/min/kgFFM) 1.25 K0.29 K0.58 !0.01Glucose oxidation (mg/min/kgFFM) 1.88 C0.57 C1.06 !0.05Lipid oxidation (mg/min/kgFFM) 0.73 K0.02 K0.17 NSEnergy expenditure (kJ/24 h/kg) 94 C3 C1 NSFasting serum-free fatty acids (mmol/l) 488 C112 C80 NSFasting plasma glucose (mmol/l) 6.2 C0.4 C0.7 !0.05Maximal work capacity (W) 207 na K1 NSCaloric intake (kJ/day) 10 710 na C1297 0.06Total lean mass (g) 61 489 C962 C2526 !0.05Limb lean mass (g) 26 099 C839 C1670 !0.01Total fat mass (g) 16 067 C285 K117 NSLimb fat mass (g) 4939 C397 C349 NSTrunk fat mass (g) 10 341 K74 K479 NS
nZ6; na, not assessed.
Figure 4 Insulin, C-peptide, insulin secretion and free fatty acids. Plots of plasma insulin (a) C-peptide, (b) prehepaticinsulin secretion rates, (c) and plasma free fatty acids, (d) respectively, at week 0 ($), at week 6 (,), and at week 16(6). Fasting plasma concentrations are given at 0 min, and concentrations during the clamp from 30 to 120 min. *, P!0.05 for comparison from week 0 to week 6. &, P!0.05 for comparison from week 0 to week 16. §, P!0.05 forcomparison from weeks 6 to 16 (nZ5).
S.B. Haugaard et al.394

Figure 5 Glucose metabolism and insulin kinetics. Histogram (a) shows the distribution of glucose infusion rate (M-value) in oxidative glucose metabolism (open bars, GOX) and non-oxidative glucose metabolism (grey bars, NOGM)during clamp steady state period at weeks 0, 6, and 16. The relative contribution of NOGM to M-value is given in %.Histogram (b) shows the M-value normalised for plasma insulin concentrations during the clamp (M/I) at weeks 0, 6, and16. Histogram (c) gives the homeostasis model assessment insulin resistance index (HOMA-IR) at weeks 0, 6, and 16.Histogram (d) shows hepatic extraction of insulin at weeks 0, 6, and 16, indicating a reduction of hepatic insulinextraction at week 6. Histogram (e) gives posthepatic insulin clearance rates, which did not change during the studyperiod. nZ5.
GH-therapy, IGF-I and insulin kinetics in HIV-lipodystrophy 395
individual panels. Fasting plasma insulin wasincreased at weeks 6 and 16 compared to week 0.However, fasting insulin secretion was notincreased from week 0 on to week 6. The temporarytrend of reduction in glucose disposal at week 6 inthese patients could be explained fully by areduction in non-oxidative glucose disposal(Fig. 5, panel (a)), whereas insulin stimulatedglucose oxidation increased slightly throughoutthe study period (P!0.05). Also insulin sensitivitycalculated as M/I and HOMA-IR showed a trend fortemporary reduction at week 6 (Fig. 5, panel (b) and(c)). Hepatic extraction of insulin showed a border-line significant decrease (20%, PZ0.05) from week0 on to 6, whereas posthepatic insulin clearance didnot change (Fig. 5, panel (d) and (e)). Lipidoxidation during the clamp remained unchangedthroughout the study (week 0, 0.57 mg/min/kgFFM;week 6, 0.63 mg/min/kgFFM; week 16, 0.53 mg/min/kgFFM, PZNS).
None of the patients reported any adverseeffects during the study period.
Discussion
A major observation in this study of low-dose(0.7 mg/day) GH-administration in lipodystrophicHIV-infected patients was that GH induced similarincreases in total and free IGF-I independently ofbody weight, insulin sensitivity, and GH-secretionpattern during an OGTT. The present observationscomply with our previous findings in HIV-negativeobese individuals of normal to increased IGF-Iconcentrations despite blunted GH-secretion.25
Furthermore, the present findings are consistentwith two previous observations of ours. First,insulin resistant HIV-infected patients with lipody-strophy, who displayed blunted GH-secretion pat-tern during a glucose tolerance test, exhibitedsimilar or increased IGF-I as compared to insulinsensitive HIV-infected patients.26 Second, GH-binding protein, which may be a marker of GH-sensitivity,27 was shown to be increased in lipody-strophic HIV-infected patients and positively corre-lated with abdominal fat mass but inversely

S.B. Haugaard et al.396
correlated with fasting GH-levels.24 Therefore, therelative high IGF-I response to low-dose GH-administration of the two diabetic and obesesubjects might be valid, although this awaitsfurther investigation.
The postglucose GH-secretion pattern of normalweight lipodystrophic HIV-infected patients withimpaired and normal glucose tolerance in thepresent study was similar to what has been reportedfrom normal male subjects, who also exhibited GHrebounds greater than five-fold the baseline con-centrations of GH.16 The increased plasma glucoselevels during the OGTT in patients with DM maypartly explain the blunted rebound of GH in thesepatients.28 Interestingly, the free over total IGF-Iratio before and during GH-administration was veryclose to 0.5%, which corresponds exactly to theratio in moderate obese non-diabetic HIV-negativemales25 thus suggesting that total IGF-I is areasonably precise marker for free IGF-I also afterlow-dose GH-administration. The fact that serumconcentration of total and free IGF-I reached aplateau level near upper normal limits within 6weeks in all patients in the present study suggeststhat the GH-dose of 0.7 mg/day may be optimal.
Considering that GH is a protein-sparing hor-mone, which increases protein synthesis,29 thesignificant reduction in fasting protein oxidation inthe present study may in combination withincreased caloric intake and likely unchangedphysical activity account for the significant increasein lean body mass of the subjects. Also GH is alipolytic hormone30 and we observed an insignif-icant increase in plasma free fatty acids, whichmight serve as a marker of lipolytic flux, but fastinglipid oxidation decreased slightly. Given anincreased lipolytic flux in this setting, hepaticgluconeogenesis may have increased in ourpatients, which has been observed in lipodystrophicpatients treated with high-doses (3 mg/day) ofGH.31 Fasting plasma glucose levels showed a slightbut significant increase, and also fasting glucoseoxidation increased in our patients, which would beconsistent with an increased rate of fastinggluconeogenesis.
It is a novel observation that low-dose GH-administration may reduce hepatic insulin extrac-tion, which in turn could explain why plasmaconcentration of insulin increased, whereas pre-hepatic insulin secretion did not change during theinitial 6 week of the study. A reduction in hepaticinsulin extraction might be an indirect mechanismcaused by an induction of insulin resistance by GH,which would comply with our recent observation inlipodystrophic insulin resistant HIV-infectedpatients that hepatic insulin extraction is inversely
correlated to insulin resistance,23 which has alsobeen reported in HIV-negative subjects.32 Thus,hepatic insulin clearance may be reduced duringlow-dose GH-administration in lipodystrophic HIV-infected patients causing relative alleviation of theinsulin production, and, indirectly, less strain onthe b-cell.33
The changes in fat distributions towards an anti-lipodystrophic phenotype were insignificant. How-ever, the absolute gain in limb fat mass in thepresent study is comparable to what was achievedduring a study of 24 weeks (C390 g), which aimedto examine whether limb fat mass would increase inlipodystrophic HIV-infected patients after the lessmitochondrial toxic NRTI, abacavir was substitutedfor the more mitochondrial toxic NRTIs, zidovudineand stavudine.34 It has been postulated thatlipodystrophic patients might be rather resistantto reversal of the phenotype.35 Therefore, low-doseGH-administration probably should be carried onfor several months before significant reversal of thelipodystrophic phenotype might be observed.
The present study was an open labelled study of afew patients comprising the limitations inherited inthis design. However, our findings were consistent,but need testing in larger scaled studies. Judgedfrom the rise in circulating total and free IGF-Ilevels and effects on glucose metabolism andinsulin kinetics the chosen GH-dose in the presentstudy could be relevant to test in a randomizedplacebo controlled study for the treatment of HIV-lipodystrophy in male patients.
Acknowledgements
This study was supported by grants from the DanishMedical Research Council (#9700592), the NovoFoundation, The Nordic Insulin Foundation, The Evaand Henry Frænkels Memorial Foundation, and theAarhus University Novo-Nordisk Center for Researchin Growth and Regeneration (#9600822). We aregrateful to dietician Lise Hansen and laboratoryassistants Susanne Reimer, Karen Mathiassen andKirsten Nyborg for excellent technical assistance.We wish to express our appreciation to Ms A MKappelgaard, Novo-Nordisk A/S, Bagsvaerd, Den-mark for the generous gift of Novo-Nordisk humangrowth hormone.
References
1. Carr A, Samaras K, Thorisdottir A, Kaufmann GR,Chisholm DJ, Cooper DA. Diagnosis, prediction, and natural

GH-therapy, IGF-I and insulin kinetics in HIV-lipodystrophy 397
course of HIV-1 protease-inhibitor-associated lipodystrophy,hyperlipidaemia, and diabetes mellitus: a cohort study.Lancet 1999;353:2093–9.
2. Chen D, Misra A, Garg A. Clinical review 153: lipodystrophy inhuman immunodeficiency virus-infected patients. J ClinEndocrinol Metab 2002;87:4845–56.
3. Carr A, Emery S, Law M, Puls R, Lundgren JD, Powderly WG.An objective case definition of lipodystrophy in HIV-infectedadults: a case–control study. Lancet 2003;361:726–35.
4. Andersen O, Haugaard SB, Andersen UB, Friis-Moller N,Storgaard H, Volund A, et al. Lipodystrophy in humanimmunodeficiency virus patients impairs insulin action andinduces defects in beta-cell function. Metabolism 2003;52:1343–53.
5. Hadigan C, Meigs JB, Corcoran C, Rietschel P, Piecuch S,Basgoz N, et al. Metabolic abnormalities and cardiovasculardisease risk factors in adults with human immunodeficiencyvirus infection and lipodystrophy. Clin Infect Dis 2001;32:130–9.
6. Haugaard SB, Andersen O, Storgaard H, Dela F, Holst JJ,Iversen J, et al. Insulin secretion in lipodystrophic HIV-infected patients is associated with high levels of nonglucosesecretagogues and insulin resistance of {beta}-cells. AmJ Physiol Endocrinol Metab 2004;287:E677–E85.
7. Kosmiski LA, Kuritzkes DR, Lichtenstein KA, Glueck DH,Gourley PJ, Stamm ER, et al. Fat distribution and metabolicchanges are strongly correlated and energy expenditure isincreased in the HIV lipodystrophy syndrome. AIDS 2001;15:1993–2000.
8. Mynarcik DC, McNurlan MA, Steigbigel RT, Fuhrer J,Gelato MC. Association of severe insulin resistance withboth loss of limb fat and elevated serum tumor necrosisfactor receptor levels in HIV lipodystrophy. J Acquir ImmuneDefic Syndr 2000;25:312–21.
9. Engelson ES, Glesby MJ, Mendez D, Albu JB, Wang J,Heymsfield SB, et al. Effect of recombinant human growthhormone in the treatment of visceral fat accumulation in HIVinfection. J Acquir Immune Defic Syndr 2002;30:379–91.
10. Kotler DP, Muurahainen N, Grunfeld C, Wanke C,Thompson M, Saag M, et al. Effects of growth hormone onabnormal visceral adipose tissue accumulation and dyslipi-demia in HIV-infected patients. J Acquir Immune Defic Syndr2004;35:239–52.
11. Lo JC, Mulligan K, Noor MA, Schwarz JM, Halvorsen RA,Grunfeld C, et al. The effects of recombinant human growthhormone on body composition and glucose metabolism inHIV-infected patients with fat accumulation. J Clin Endo-crinol Metab 2001;86:3480–7.
12. Lo JC, Mulligan K, Noor MA, Lee GA, Schwarz JM, Grunfeld C,et al. The effects of low-dose growth hormone in HIV-infected men with fat accumulation: a pilot study. ClinInfect Dis 2004;39:732–5.
13. Andersen O, Haugaard SB, Flyvbjerg A, Andersen UB,Orskov H, Madsbad S, et al. Low-dose growth hormone andhuman immunodeficiency virus-associated lipodystrophysyndrome: a pilot study. Eur J Clin Invest 2004;34:561–8.
14. Martinez E, Mocroft A, Garcia-Viejo MA, Perez-Cuevas JB,Blanco JL, Mallolas J, et al. Risk of lipodystrophy in HIV-1-infected patients treated with protease inhibitors: aprospective cohort study. Lancet 2001;357:592–8.
15. Puavilai G, Chanprasertyotin S, Sriphrapradaeng A. Diag-nostic criteria for diabetes mellitus and other categories ofglucose intolerance: 1997 criteria by the Expert Committeeon the Diagnosis and Classification of Diabetes Mellitus(ADA), 1998 WHO consultation criteria, and 1985 WHOcriteria. World Health Organization. Diabetes Res ClinPract 1999;44:21–6.
16. Chapman IM, Hartman ML, Straume M, Johnson ML,Veldhuis JD, Thorner MO. Enhanced sensitivity growthhormone (GH) chemiluminescence assay reveals lowerpostglucose nadir GH concentrations in men than women.J Clin Endocrinol Metab 1994;78:1312–9.
17. DeFronzo RA, Tobin JD, Andres R. Glucose clamp technique:a method for quantifying insulin secretion and resistance.Am J Physiol 1979;237:E214–E23.
18. Frystyk J, Dinesen B, Orskov H. Non-competitive time-resolved immunofluorometric assays for determination ofhuman insulin-like growth factor I and II. Growth Regul 1995;5:169–76.
19. Frystyk J, Skjaerbaek C, Dinesen B, Orskov H. Free insulin-like growth factors (IGF-I and IGF-II) in human serum. FEBSLett 1994;348:185–91.
20. Frayn KN. Calculation of substrate oxidation rates in vivofrom gaseous exchange. J Appl Physiol 1983;55:628–34.
21. Hovorka R, Soons PA, Young MA. ISEC: a program to calculateinsulin secretion. Comput Methods Programs Biomed 1996;50:253–64.
22. Matthews DR, Hosker JP, Rudenski AS, Naylor BA,Treacher DF, Turner RC. Homeostasis model assessment:insulin resistance and beta-cell function from fasting plasmaglucose and insulin concentrations in man. Diabetologia1985;28:412–9.
23. Haugaard SB, Andersen O, Hansen BR, Andersen UB,Volund A, Iversen J, et al. In nondiabetic, human immuno-deficiency virus-infected patients with lipodystrophy, hepa-tic insulin extraction and posthepatic insulin clearance rateare decreased in proportion to insulin resistance. Metab-olism 2005;54:171–9.
24. Haugaard SB, Andersen O, Hansen BR, Orskov H,Andersen UB, Madsbad S, et al. Insulin-like growth factors,insulin-like growth factor-binding proteins, insulin-likegrowth factor-binding protein-3 protease, and growthhormone-binding protein in lipodystrophic human immuno-deficiency virus-infected patients. Metabolism 2004;53:1565–73.
25. Frystyk J, Vestbo E, Skjaerbaek C, Mogensen CE, Orskov H.Free insulin-like growth factors in human obesity. Metab-olism 1995;44:37–44.
26. Andersen O, Haugaard SB, Hansen BR, Orskov H,Andersen UB, Madsbad S, et al. Different growth hormonesensitivity of target tissues and growth hormone response toglucose in hiv-infected patients with and without lipody-strophy. Scand J Infect Dis 2004;36:832–9.
27. Amit T, Youdim MB, Hochberg Z. Clinical review 112: doesserum growth hormone (GH) binding protein reflect humanGH receptor function? J Clin Endocrinol Metab 2000;85:927–32.
28. Christensen NJ, Orskov H, Hansen AP. Significance of glucoseload in oral glucose tolerance tests. Blood glucose, seruminsulin, growth hormone and free fatty acids. Acta MedScand 1972;192:337–42.
29. Moller N, Norrelund H. The role of growth hormone in theregulation of protein metabolism with particular referenceto conditions of fasting. Horm Res 2003;59(Suppl 1):62–8.
30. Norrelund H, Nair KS, Nielsen S, Frystyk J, Ivarsen P,Jorgensen JO, et al. The decisive role of free fatty acidsfor protein conservation during fasting in humans with andwithout growth hormone. J Clin Endocrinol Metab 2003;88:4371–8.
31. Schwarz JM, Mulligan K, Lee J, Lo JC, Wen M, Noor MA, et al.Effects of recombinant human growth hormone on hepaticlipid and carbohydrate metabolism in HIV-infected patientswith fat accumulation. J Clin Endocrinol Metab 2002;87:942.

S.B. Haugaard et al.398
32. Rossell R, Gomis R, Casamitjana R, Segura R, Vilardell E,Rivera F. Reduced hepatic insulin extraction in obesity:relationship with plasma insulin levels. J Clin EndocrinolMetab 1983;56:608–11.
33. Kahn SE. The relative contributions of insulin resistance andbeta-cell dysfunction to the pathophysiology of type 2diabetes. Diabetologia 2003;46:3–19.
34. Carr A, Workman C, Smith DE, Hoy J, Hudson J, Doong N, et al.Abacavir substitution for nucleoside analogs in patients withHIV lipoatrophy: a randomized trial. JAMA 2002;288:207–15.
35. Martin A, Smith DE, Carr A, Ringland C, Amin J, Emery S,et al. Reversibility of lipoatrophy in HIV-infected patients 2years after switching from a thymidine analogue to abacavir:the MITOX Extension Study. AIDS 2004;18:1029–36.