ground information and selection of tbm for the thessaloniki
TRANSCRIPT
Ground Information and Selection of TBM for the
Thessaloniki Metro, Greece
P. G. MARINOS
National Technical University of Athens, Iroon Politexneiou 9, 15780 Zografou,Athens, Greece
M. NOVACK
Attiko Metro S.A., 191-193 Mesogeion Avenue, 115 25 Athens, Greece
M. BENISSI
Attiko Metro S.A., 191-193 Mesogeion Avenue, 115 25 Athens, Greece
M. PANTELIADOU
Hydrogeologist MSC, 12 Dodekanissou Street, 15235, Vrilissia, Greece
D. PAPOULI
Hydrogeologist MSC, 8 Delfon Street, 18755, Keratsini, Piraeus, Greece
G. STOUMPOS
Hydrogeologist MSC, Attiko Metro S.A., 191-193 Mesogeion Avenue, 115 25Athens, Greece
V. MARINOS
National Technical University of Athens, Iroon Politexneiou 9, 15780 Zografou,Athens, Greece
K. KORKARIS
Attiko Metro S.A., 191-193 Mesogeion Avenue, 115 25 Athens, Greece
Key Terms: Tunnels, TBM Selection, EPBM, SiteInvestigation, In Situ Tests, Urban Geology
ABSTRACT
The Thessaloniki Metropolitan Railway is currentlyat its primary construction stage. The railway iscomposed of two separate ,6-m-diameter paralleltunnels, each of which is ,8 km long and has 13stations. The span between the tunnel axes is approx-imately 12 m, and the depth of the red line (track level)varies from 15 m to 30 m. The geology of the urbanarea of Thessaloniki is characterized by the presence ofNeogene and Quaternary deposits. The base formationfor the study area is a very stiff to hard red clay, datingto Upper Miocene–Pliocene time. On top of thisformation, Quaternary sediments have been deposited,
most of which consist of sand and/or gravel in a clay-silt–dominated matrix, covered in places by anthropo-genic fill. Ground investigation campaigns have incor-porated a significant number of sampling boreholesand in situ and laboratory testing. In this study,data from borehole loggings, particle-size analyses,natural moisture content, Atterberg limits,permeability tests, pressure-meter tests, cone penetra-tion tests (CPT), and standard penetration tests(SPT) were analyzed in order to obtain a bettergeological understanding, a geotechnical zonation,and a classification of the ground with respect tomechanized tunneling. The characteristics and param-eters of the soils and the hydrogeological regimeindicate that an EPBM (Earth Pressure BalanceMachine) rather than a slurry TBM (TunnelBoring Machine) should be used for the tunnelconstruction.
Environmental & Engineering Geoscience, Vol. XIV, No. 1, February 2008, pp. 17–30 17
INTRODUCTION
Thessaloniki, in Macedonia, northern Greece, is thesecond largest urban area after Athens, and it has apopulation of approximately 1 million. Traffic prob-lems are common in the city center, and, therefore, theconstruction of an underground railway system hadbeen under consideration for a number of years.
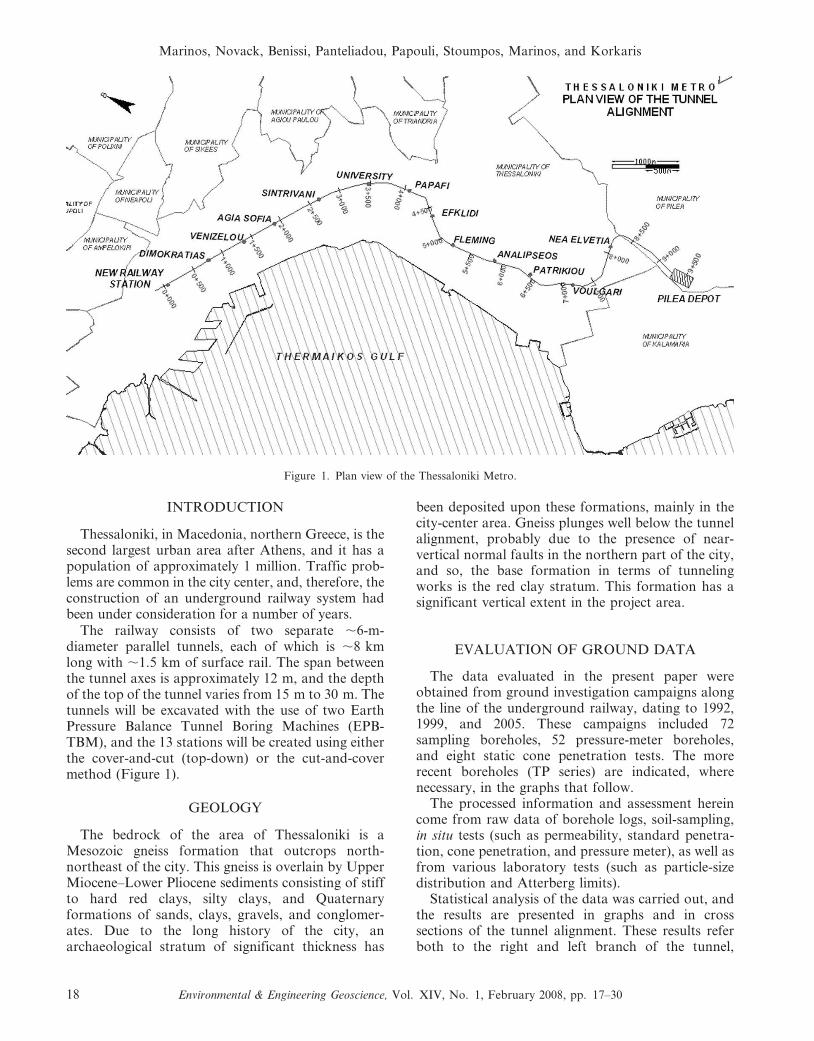
The railway consists of two separate ,6-m-diameter parallel tunnels, each of which is ,8 kmlong with ,1.5 km of surface rail. The span betweenthe tunnel axes is approximately 12 m, and the depthof the top of the tunnel varies from 15 m to 30 m. Thetunnels will be excavated with the use of two EarthPressure Balance Tunnel Boring Machines (EPB-TBM), and the 13 stations will be created using eitherthe cover-and-cut (top-down) or the cut-and-covermethod (Figure 1).
GEOLOGY
The bedrock of the area of Thessaloniki is aMesozoic gneiss formation that outcrops north-northeast of the city. This gneiss is overlain by UpperMiocene–Lower Pliocene sediments consisting of stiffto hard red clays, silty clays, and Quaternaryformations of sands, clays, gravels, and conglomer-ates. Due to the long history of the city, anarchaeological stratum of significant thickness has
been deposited upon these formations, mainly in thecity-center area. Gneiss plunges well below the tunnelalignment, probably due to the presence of near-vertical normal faults in the northern part of the city,and so, the base formation in terms of tunnelingworks is the red clay stratum. This formation has asignificant vertical extent in the project area.
EVALUATION OF GROUND DATA
The data evaluated in the present paper wereobtained from ground investigation campaigns alongthe line of the underground railway, dating to 1992,1999, and 2005. These campaigns included 72sampling boreholes, 52 pressure-meter boreholes,and eight static cone penetration tests. The morerecent boreholes (TP series) are indicated, wherenecessary, in the graphs that follow.
The processed information and assessment hereincome from raw data of borehole logs, soil-sampling,in situ tests (such as permeability, standard penetra-tion, cone penetration, and pressure meter), as well asfrom various laboratory tests (such as particle-sizedistribution and Atterberg limits).
Statistical analysis of the data was carried out, andthe results are presented in graphs and in crosssections of the tunnel alignment. These results referboth to the right and left branch of the tunnel,
Figure 1. Plan view of the Thessaloniki Metro.
Marinos, Novack, Benissi, Panteliadou, Papouli, Stoumpos, Marinos, and Korkaris
18 Environmental & Engineering Geoscience, Vol. XIV, No. 1, February 2008, pp. 17–30
though, for practical reasons, the right branch (southbranch) is projected in the cross sections.
Analysis of the information and data led to theconsideration that the tunnel alignment can bedivided in four areas with respect to the geologicaland geotechnical conditions that may be encounteredduring the construction of the tunnel. This geologi-cally based zonation was adopted in order to promotea better understanding of the processed data. Thesefour zones are:
N From chainage 20+300 (new railway station) to1+000 (between Dimokratias and Venizelou Sta-tion). The area consists of a variety of recentsediments with vertical and lateral transitions.
N From chainage 1+000 (between Dimokratias andVenizelou Station) to 4+500 (near Efklidi Station),where stiff and hard clay formations are predom-inant.
N From chainage 4+500 (near Efklidi Station) to7+000 (near Voulgari Station). The area is com-posed of a variety of recent sediments with verticaland lateral transitions that extend well below thetunnel invert.
N From chainage 7+000 (near Voulgari Station) to7+900 (near Nea Elvetia Station), where stiff clay isprevalent.
Classification Tests
Particle-Size Analysis
Classification tests were performed on soil samplesobtained from investigation boreholes using sieveand/or hydrometer analysis. The sieve analysis wasconducted according to the American Unified SoilsClassification System (AUSCS). The soil samplescollected for that purpose were numerous and asrepresentative as possible of the actual conditionsalong the alignment area. On the other hand,hydrometer analysis tests corresponded to 15 percentof the sieve analysis tests (1992 and 1999 campaigns),and they were not performed on all soil samples.
The majority of the tests indicated that, at tunneldepths, the percentage of the samples passing theNo. 200 sieve (0.074 mm, limit between fines andcoarse grain size according to the AUSCS) was
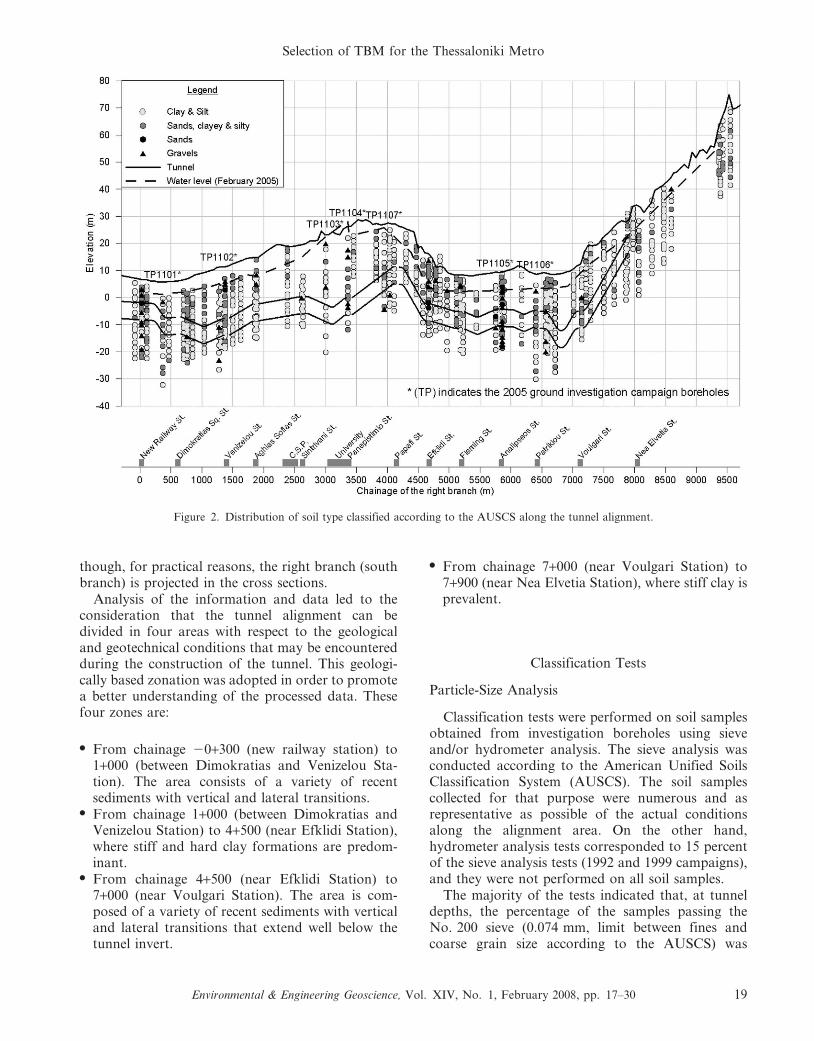
Figure 2. Distribution of soil type classified according to the AUSCS along the tunnel alignment.
Selection of TBM for the Thessaloniki Metro
Environmental & Engineering Geoscience, Vol. XIV, No. 1, February 2008, pp. 17–30 19
greater than 40–50 percent, denoting that fine-grainedmaterials are dominant along the tunnel alignment.
Figure 2 presents the spatial distribution graphalong the area of the alignment (chainage [ch.]20+300 to 9+700), which shows the soil classificationaccording to the AUSCS. It is clear from Figure 2that the fine-grained fraction is predominant alongthe alignment area, yet there are restricted areaswhere deposits with coarser particle size (sand, gravel)and low percentage of fines might be encountered.
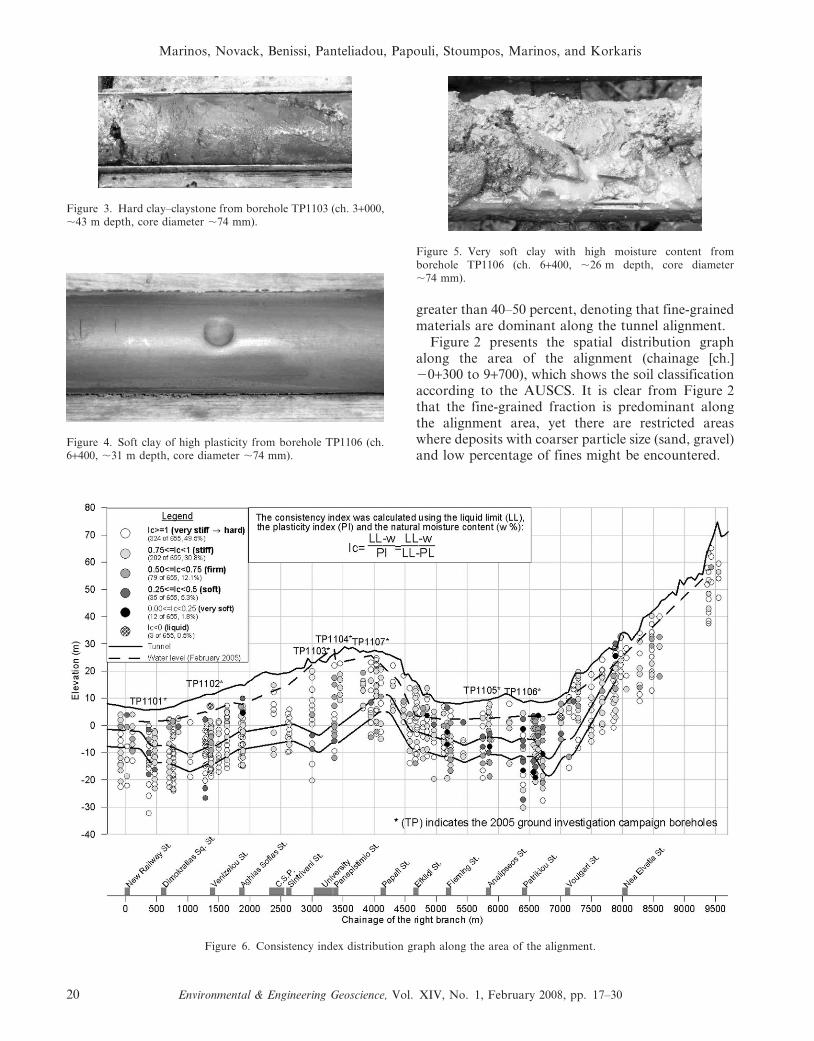
Figure 3. Hard clay–claystone from borehole TP1103 (ch. 3+000,,43 m depth, core diameter ,74 mm).
Figure 4. Soft clay of high plasticity from borehole TP1106 (ch.6+400, ,31 m depth, core diameter ,74 mm).
Figure 5. Very soft clay with high moisture content fromborehole TP1106 (ch. 6+400, ,26 m depth, core diameter,74 mm).
Figure 6. Consistency index distribution graph along the area of the alignment.
Marinos, Novack, Benissi, Panteliadou, Papouli, Stoumpos, Marinos, and Korkaris
20 Environmental & Engineering Geoscience, Vol. XIV, No. 1, February 2008, pp. 17–30
Atterberg Limits and Consistency Index
In terms of liquid limit (LL), the test results weredivided in four categories (Bell, 2000): lean/silty (LL, 35), intermediate (35 , LL , 50), fat–very fat (50, LL , 90), and extra fat (LL . 90). Most of thesamples were classified as lean/silty or intermediate,and they appear to be, more or less, distributed alongthe whole alignment. Fat–very fat samples arelocalized, whilst extra-fat samples occur occasionallybut not at tunnel depths.
The tests results for the plasticity index (PI) weredivided in four categories (after Anonymous, 1979):non-plastic to slightly plastic (PI , 7), moderatelyplastic (7 , PI , 17), highly plastic (17 , PI , 35),and extremely plastic (PI . 35). Most of the sampleswere classified as highly plastic, though moderatelyplastic samples are clearly present along the tunnelalignment. Extremely plastic samples are localized.Non-plastic to slightly plastic samples mainly appearin the overburden.
The consistency index (IC) was calculated using theliquid limit (LL), plastic limit (PL), plasticity index(PI), and natural moisture content (w [percent]) (Bell,
2000):
IC~LL{w
LL{PL~
LL{w
PI
Six categories were considered concerning the consis-tency index of cohesive soils (Bell, 2000): very stiff tohard (IC $ 1) (Figure 3), stiff (1 , IC # 0.75), firm(0.75 , IC # 0.50), soft (0.50 , IC # 0.25) (Figure 4),very soft (0.25 , IC # 0.00) (Figure 5), and liquid (IC
, 0.00). Stiff and very stiff to hard conditions arepredominant in the overburden and at tunnel depthsalong the alignment. However, in the area betweenchainages 5+800 and 6+800, samples of lowerconsistency were indicated. Figure 6 shows thedistribution of consistency index along the area ofthe tunnel alignment for all samples.
‘‘Sticky Behavior’’ of Cohesive Soils
Some types of cohesive soils, especially thoseconsisting of highly plastic clays, have the tendencyto develop sticky behavior (adhesion of clay particlesto metal surfaces and/or cohesion of clay particles,
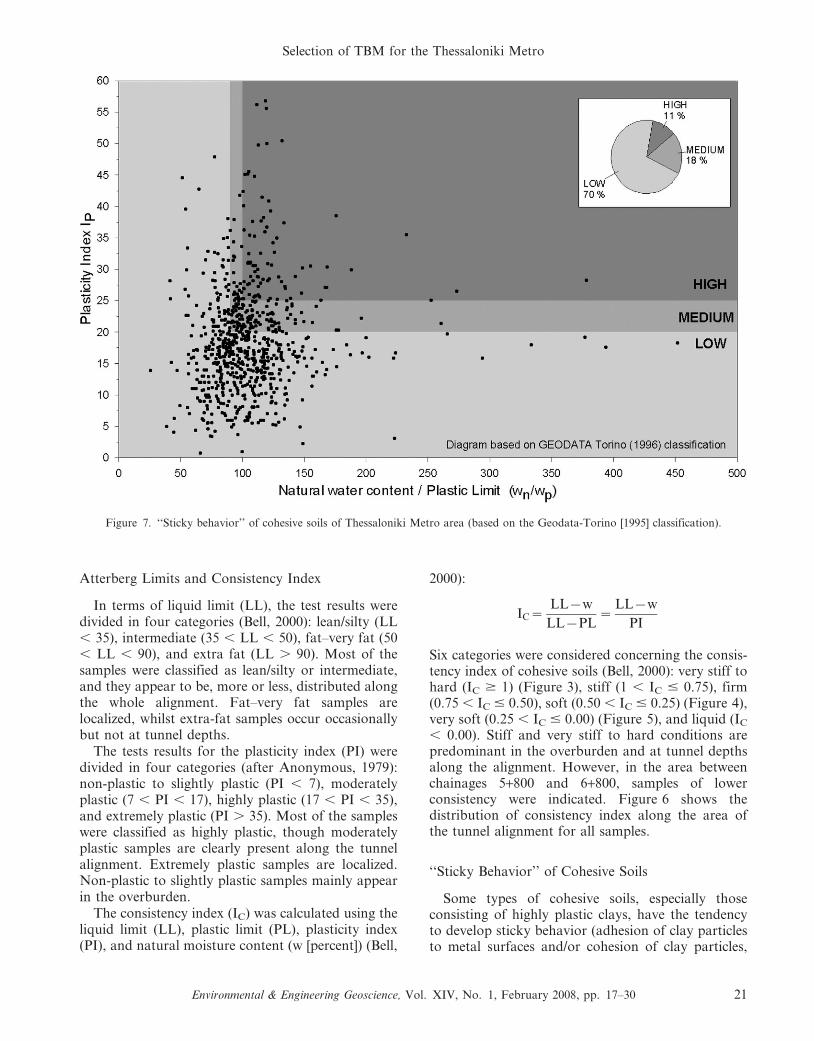
Figure 7. ‘‘Sticky behavior’’ of cohesive soils of Thessaloniki Metro area (based on the Geodata-Torino [1995] classification).
Selection of TBM for the Thessaloniki Metro
Environmental & Engineering Geoscience, Vol. XIV, No. 1, February 2008, pp. 17–30 21
sticking to each other), which may lead to clogging inthe cutterhead, working chamber, and screw convey-or of an EPBM and induce ‘‘balling’’ problems in thepipes and at the separation plant of a slurry TBM orobstruct the shield advance due to friction. Thisphenomenon affects all types of closed-face TBMs,and despite the fact that it is not a basic selectioncriterion, the tendency of the soils to stickiness hasto be considered. In this section, potential cloggingrisks during Thessaloniki Metro construction arediscussed with respect to criteria mentioned in variouspapers.
Geodata-Torino (1995) studied the sticky behaviorof cohesive materials for the Athens Metro Line 3extension and proposed the criteria and conditionsshown in Figure 7. This graph shows the relationshipbetween the ratio of natural moisture content toplastic limit, the plasticity index, and the categoriesfor clogging risk. The data points suggest that thecohesive soils encountered in Thessaloniki Metro areahave low to medium tendency to ‘‘sticky behavior.’’
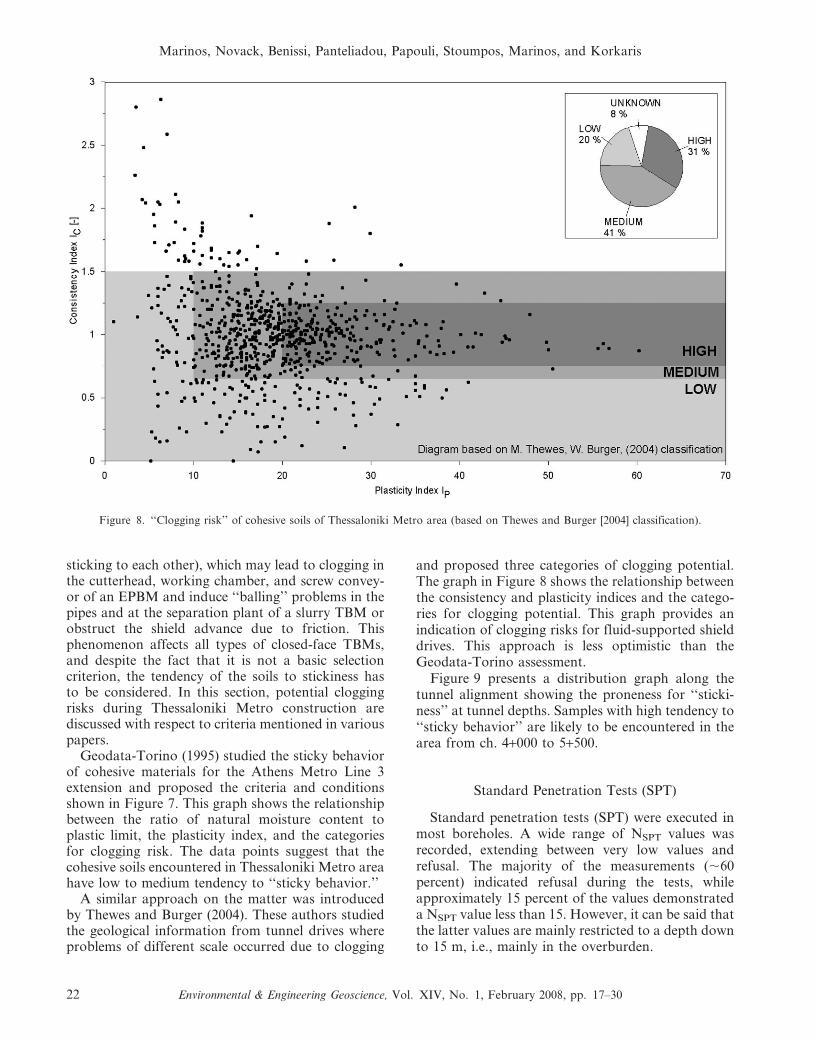
A similar approach on the matter was introducedby Thewes and Burger (2004). These authors studiedthe geological information from tunnel drives whereproblems of different scale occurred due to clogging
and proposed three categories of clogging potential.The graph in Figure 8 shows the relationship betweenthe consistency and plasticity indices and the catego-ries for clogging potential. This graph provides anindication of clogging risks for fluid-supported shielddrives. This approach is less optimistic than theGeodata-Torino assessment.
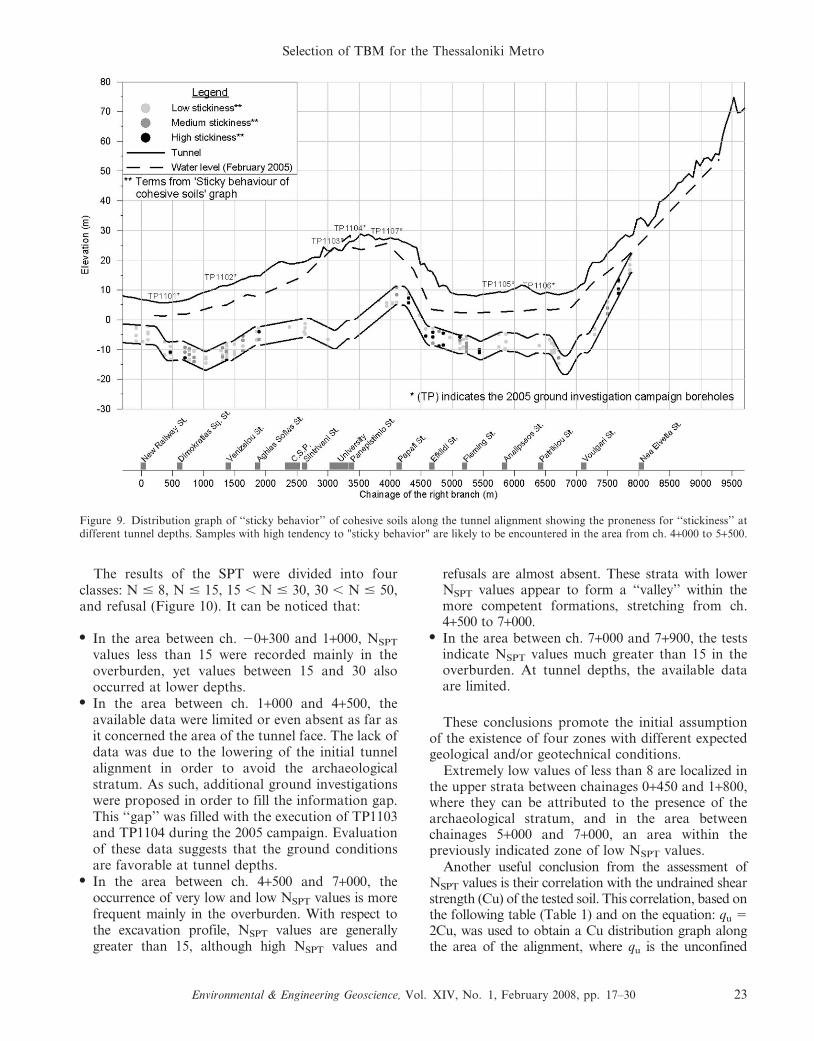
Figure 9 presents a distribution graph along thetunnel alignment showing the proneness for ‘‘sticki-ness’’ at tunnel depths. Samples with high tendency to‘‘sticky behavior’’ are likely to be encountered in thearea from ch. 4+000 to 5+500.
Standard Penetration Tests (SPT)
Standard penetration tests (SPT) were executed inmost boreholes. A wide range of NSPT values wasrecorded, extending between very low values andrefusal. The majority of the measurements (,60percent) indicated refusal during the tests, whileapproximately 15 percent of the values demonstrateda NSPT value less than 15. However, it can be said thatthe latter values are mainly restricted to a depth downto 15 m, i.e., mainly in the overburden.
Figure 8. ‘‘Clogging risk’’ of cohesive soils of Thessaloniki Metro area (based on Thewes and Burger [2004] classification).
Marinos, Novack, Benissi, Panteliadou, Papouli, Stoumpos, Marinos, and Korkaris
22 Environmental & Engineering Geoscience, Vol. XIV, No. 1, February 2008, pp. 17–30
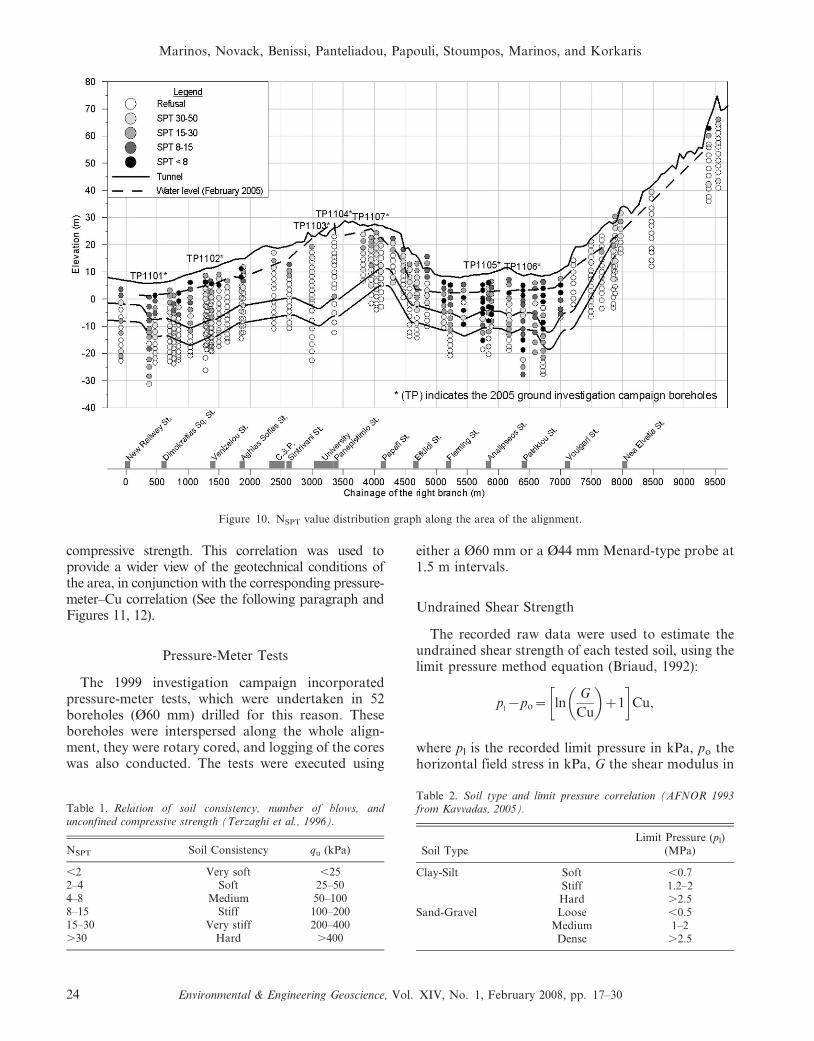
The results of the SPT were divided into fourclasses: N # 8, N # 15, 15 , N # 30, 30 , N # 50,and refusal (Figure 10). It can be noticed that:
N In the area between ch. 20+300 and 1+000, NSPT
values less than 15 were recorded mainly in theoverburden, yet values between 15 and 30 alsooccurred at lower depths.
N In the area between ch. 1+000 and 4+500, theavailable data were limited or even absent as far asit concerned the area of the tunnel face. The lack ofdata was due to the lowering of the initial tunnelalignment in order to avoid the archaeologicalstratum. As such, additional ground investigationswere proposed in order to fill the information gap.This ‘‘gap’’ was filled with the execution of TP1103and TP1104 during the 2005 campaign. Evaluationof these data suggests that the ground conditionsare favorable at tunnel depths.
N In the area between ch. 4+500 and 7+000, theoccurrence of very low and low NSPT values is morefrequent mainly in the overburden. With respect tothe excavation profile, NSPT values are generallygreater than 15, although high NSPT values and
refusals are almost absent. These strata with lowerNSPT values appear to form a ‘‘valley’’ within themore competent formations, stretching from ch.4+500 to 7+000.
N In the area between ch. 7+000 and 7+900, the testsindicate NSPT values much greater than 15 in theoverburden. At tunnel depths, the available dataare limited.
These conclusions promote the initial assumptionof the existence of four zones with different expectedgeological and/or geotechnical conditions.
Extremely low values of less than 8 are localized inthe upper strata between chainages 0+450 and 1+800,where they can be attributed to the presence of thearchaeological stratum, and in the area betweenchainages 5+000 and 7+000, an area within thepreviously indicated zone of low NSPT values.
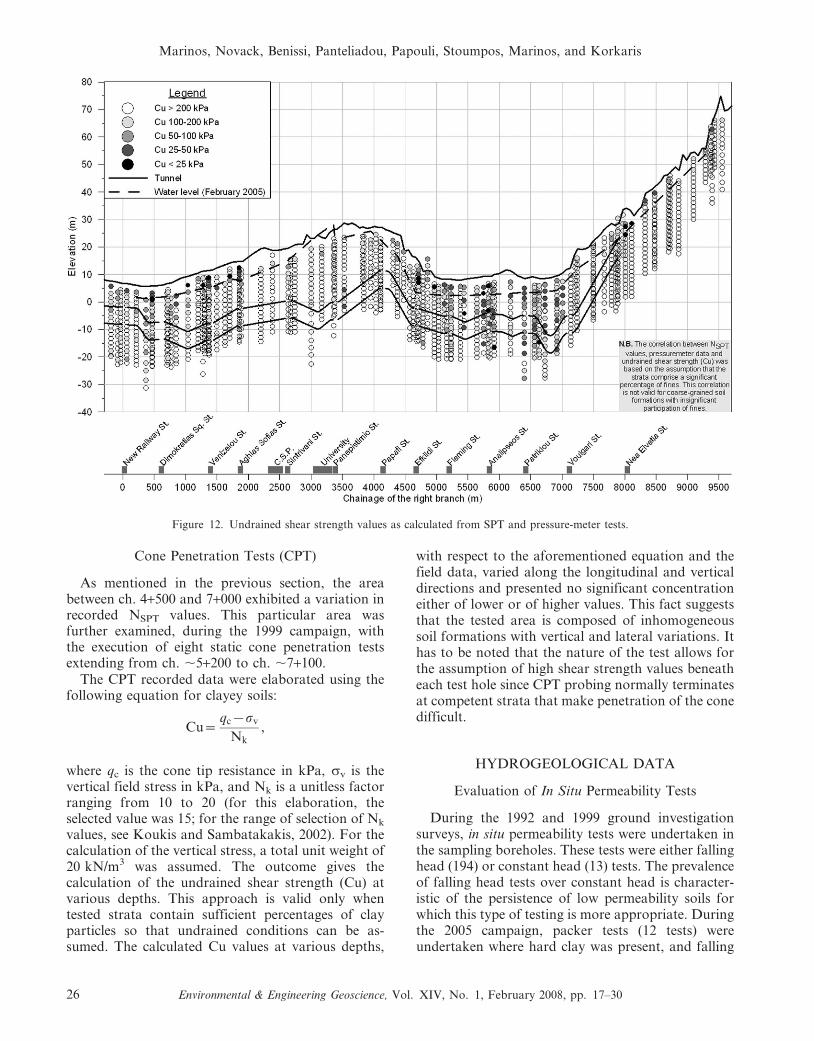
Another useful conclusion from the assessment ofNSPT values is their correlation with the undrained shearstrength (Cu) of the tested soil. This correlation, based onthe following table (Table 1) and on the equation: qu 5
2Cu, was used to obtain a Cu distribution graph alongthe area of the alignment, where qu is the unconfined
Figure 9. Distribution graph of ‘‘sticky behavior’’ of cohesive soils along the tunnel alignment showing the proneness for ‘‘stickiness’’ atdifferent tunnel depths. Samples with high tendency to "sticky behavior" are likely to be encountered in the area from ch. 4+000 to 5+500.
Selection of TBM for the Thessaloniki Metro
Environmental & Engineering Geoscience, Vol. XIV, No. 1, February 2008, pp. 17–30 23
compressive strength. This correlation was used toprovide a wider view of the geotechnical conditions ofthe area, in conjunction with the corresponding pressure-meter–Cu correlation (See the following paragraph andFigures 11, 12).
Pressure-Meter Tests
The 1999 investigation campaign incorporatedpressure-meter tests, which were undertaken in 52boreholes (Ø60 mm) drilled for this reason. Theseboreholes were interspersed along the whole align-ment, they were rotary cored, and logging of the coreswas also conducted. The tests were executed using
either a Ø60 mm or a Ø44 mm Menard-type probe at1.5 m intervals.
Undrained Shear Strength
The recorded raw data were used to estimate theundrained shear strength of each tested soil, using thelimit pressure method equation (Briaud, 1992):
pl{po~ ln
G
Cu
� �z1
� �Cu,
where pl is the recorded limit pressure in kPa, po thehorizontal field stress in kPa, G the shear modulus in
Figure 10. NSPT value distribution graph along the area of the alignment.
Table 1. Relation of soil consistency, number of blows, andunconfined compressive strength (Terzaghi et al., 1996).
NSPT Soil Consistency qu (kPa)
,2 Very soft ,252–4 Soft 25–504–8 Medium 50–1008–15 Stiff 100–20015–30 Very stiff 200–400.30 Hard .400
Table 2. Soil type and limit pressure correlation (AFNOR 1993from Kavvadas, 2005).
Soil TypeLimit Pressure (pl)
(MPa)
Clay-Silt Soft ,0.7Stiff 1.2–2Hard .2.5
Sand-Gravel Loose ,0.5Medium 1–2Dense .2.5
Marinos, Novack, Benissi, Panteliadou, Papouli, Stoumpos, Marinos, and Korkaris
24 Environmental & Engineering Geoscience, Vol. XIV, No. 1, February 2008, pp. 17–30
kPa, and Cu is the undrained shear strength in kPa.This approach does not require any assumption forthe Poisson’s ratio (n) value, and, as such, it isconsidered to be more reliable.
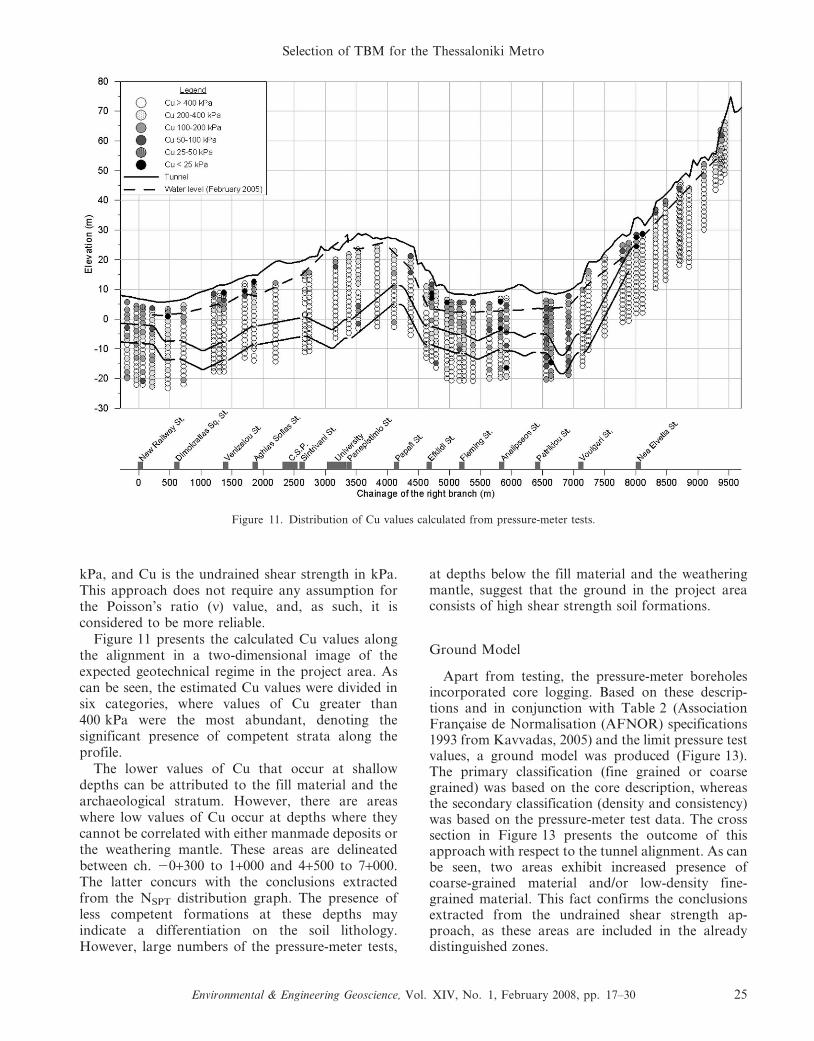
Figure 11 presents the calculated Cu values alongthe alignment in a two-dimensional image of theexpected geotechnical regime in the project area. Ascan be seen, the estimated Cu values were divided insix categories, where values of Cu greater than400 kPa were the most abundant, denoting thesignificant presence of competent strata along theprofile.
The lower values of Cu that occur at shallowdepths can be attributed to the fill material and thearchaeological stratum. However, there are areaswhere low values of Cu occur at depths where theycannot be correlated with either manmade deposits orthe weathering mantle. These areas are delineatedbetween ch. 20+300 to 1+000 and 4+500 to 7+000.The latter concurs with the conclusions extractedfrom the NSPT distribution graph. The presence ofless competent formations at these depths mayindicate a differentiation on the soil lithology.However, large numbers of the pressure-meter tests,
at depths below the fill material and the weatheringmantle, suggest that the ground in the project areaconsists of high shear strength soil formations.
Ground Model
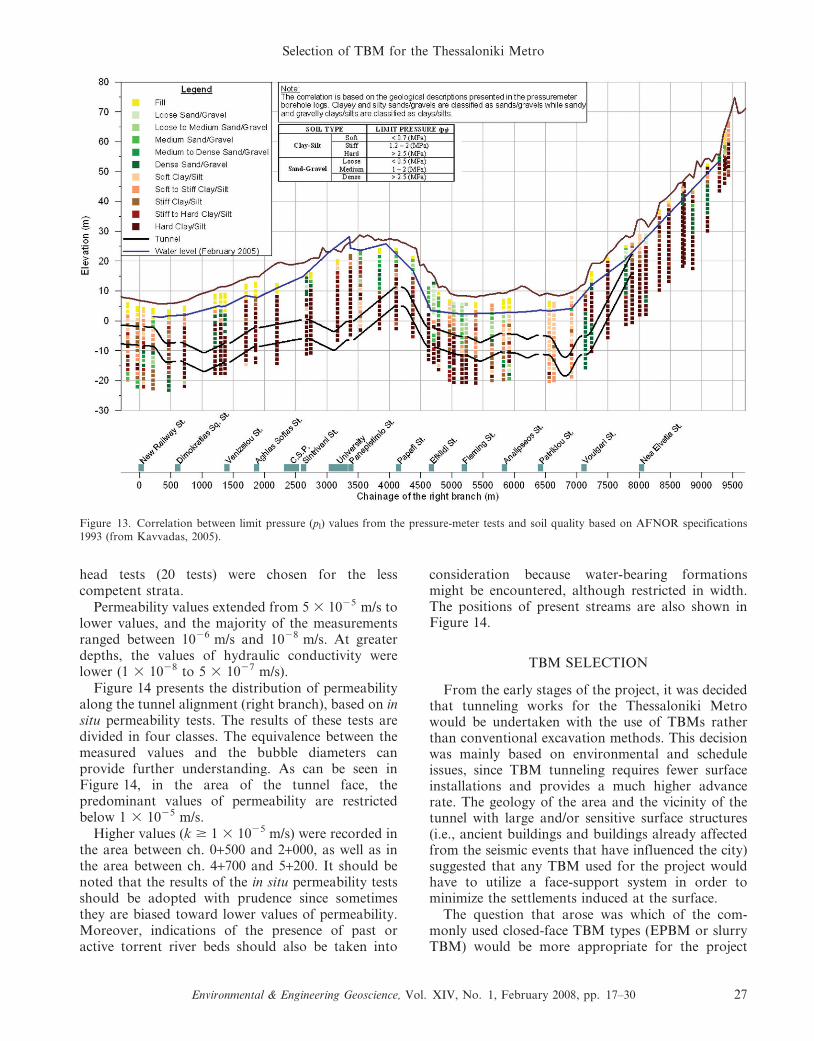
Apart from testing, the pressure-meter boreholesincorporated core logging. Based on these descrip-tions and in conjunction with Table 2 (AssociationFrancaise de Normalisation (AFNOR) specifications1993 from Kavvadas, 2005) and the limit pressure testvalues, a ground model was produced (Figure 13).The primary classification (fine grained or coarsegrained) was based on the core description, whereasthe secondary classification (density and consistency)was based on the pressure-meter test data. The crosssection in Figure 13 presents the outcome of thisapproach with respect to the tunnel alignment. As canbe seen, two areas exhibit increased presence ofcoarse-grained material and/or low-density fine-grained material. This fact confirms the conclusionsextracted from the undrained shear strength ap-proach, as these areas are included in the alreadydistinguished zones.
Figure 11. Distribution of Cu values calculated from pressure-meter tests.
Selection of TBM for the Thessaloniki Metro
Environmental & Engineering Geoscience, Vol. XIV, No. 1, February 2008, pp. 17–30 25
Cone Penetration Tests (CPT)
As mentioned in the previous section, the areabetween ch. 4+500 and 7+000 exhibited a variation inrecorded NSPT values. This particular area wasfurther examined, during the 1999 campaign, withthe execution of eight static cone penetration testsextending from ch. ,5+200 to ch. ,7+100.
The CPT recorded data were elaborated using thefollowing equation for clayey soils:
Cu~qc{sv
Nk
,
where qc is the cone tip resistance in kPa, sv is thevertical field stress in kPa, and Nk is a unitless factorranging from 10 to 20 (for this elaboration, theselected value was 15; for the range of selection of Nk
values, see Koukis and Sambatakakis, 2002). For thecalculation of the vertical stress, a total unit weight of20 kN/m3 was assumed. The outcome gives thecalculation of the undrained shear strength (Cu) atvarious depths. This approach is valid only whentested strata contain sufficient percentages of clayparticles so that undrained conditions can be as-sumed. The calculated Cu values at various depths,
with respect to the aforementioned equation and thefield data, varied along the longitudinal and verticaldirections and presented no significant concentrationeither of lower or of higher values. This fact suggeststhat the tested area is composed of inhomogeneoussoil formations with vertical and lateral variations. Ithas to be noted that the nature of the test allows forthe assumption of high shear strength values beneatheach test hole since CPT probing normally terminatesat competent strata that make penetration of the conedifficult.
HYDROGEOLOGICAL DATA
Evaluation of In Situ Permeability Tests
During the 1992 and 1999 ground investigationsurveys, in situ permeability tests were undertaken inthe sampling boreholes. These tests were either fallinghead (194) or constant head (13) tests. The prevalenceof falling head tests over constant head is character-istic of the persistence of low permeability soils forwhich this type of testing is more appropriate. Duringthe 2005 campaign, packer tests (12 tests) wereundertaken where hard clay was present, and falling
Figure 12. Undrained shear strength values as calculated from SPT and pressure-meter tests.
Marinos, Novack, Benissi, Panteliadou, Papouli, Stoumpos, Marinos, and Korkaris
26 Environmental & Engineering Geoscience, Vol. XIV, No. 1, February 2008, pp. 17–30
head tests (20 tests) were chosen for the lesscompetent strata.
Permeability values extended from 5 3 1025 m/s tolower values, and the majority of the measurementsranged between 1026 m/s and 1028 m/s. At greaterdepths, the values of hydraulic conductivity werelower (1 3 1028 to 5 3 1027 m/s).
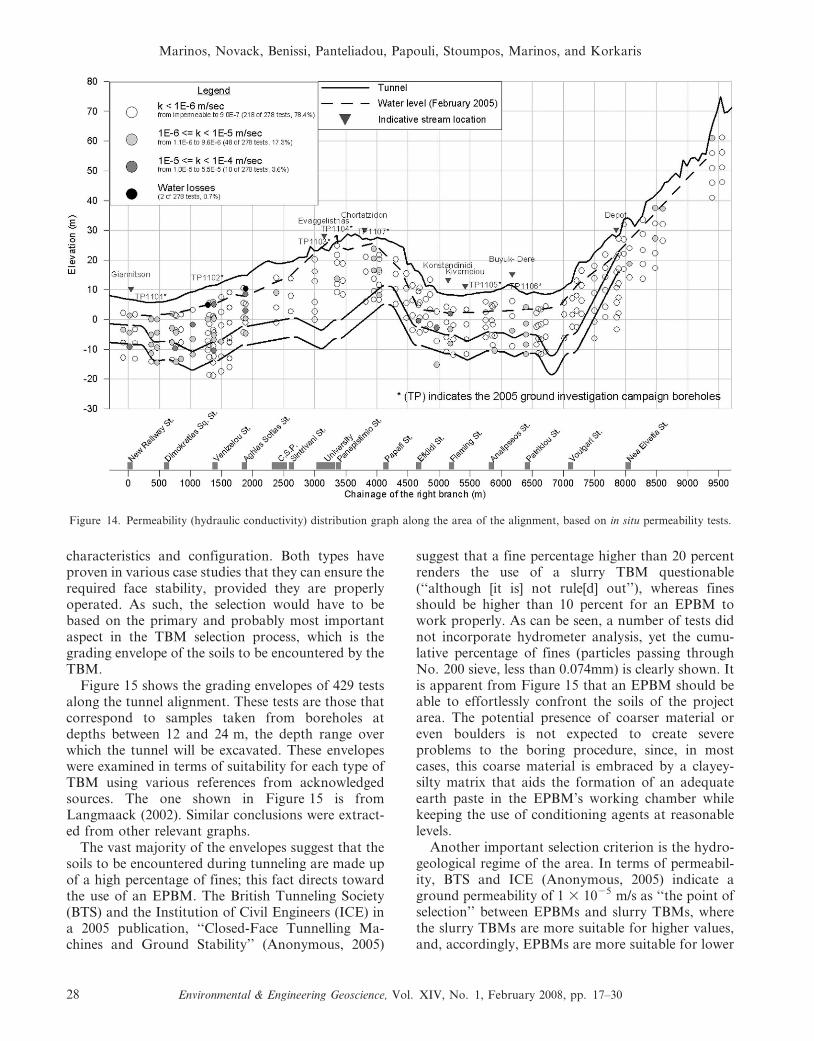
Figure 14 presents the distribution of permeabilityalong the tunnel alignment (right branch), based on insitu permeability tests. The results of these tests aredivided in four classes. The equivalence between themeasured values and the bubble diameters canprovide further understanding. As can be seen inFigure 14, in the area of the tunnel face, thepredominant values of permeability are restrictedbelow 1 3 1025 m/s.
Higher values (k $ 1 3 1025 m/s) were recorded inthe area between ch. 0+500 and 2+000, as well as inthe area between ch. 4+700 and 5+200. It should benoted that the results of the in situ permeability testsshould be adopted with prudence since sometimesthey are biased toward lower values of permeability.Moreover, indications of the presence of past oractive torrent river beds should also be taken into
consideration because water-bearing formationsmight be encountered, although restricted in width.The positions of present streams are also shown inFigure 14.
TBM SELECTION
From the early stages of the project, it was decidedthat tunneling works for the Thessaloniki Metrowould be undertaken with the use of TBMs ratherthan conventional excavation methods. This decisionwas mainly based on environmental and scheduleissues, since TBM tunneling requires fewer surfaceinstallations and provides a much higher advancerate. The geology of the area and the vicinity of thetunnel with large and/or sensitive surface structures(i.e., ancient buildings and buildings already affectedfrom the seismic events that have influenced the city)suggested that any TBM used for the project wouldhave to utilize a face-support system in order tominimize the settlements induced at the surface.
The question that arose was which of the com-monly used closed-face TBM types (EPBM or slurryTBM) would be more appropriate for the project
Figure 13. Correlation between limit pressure (pl) values from the pressure-meter tests and soil quality based on AFNOR specifications1993 (from Kavvadas, 2005).
Selection of TBM for the Thessaloniki Metro
Environmental & Engineering Geoscience, Vol. XIV, No. 1, February 2008, pp. 17–30 27
characteristics and configuration. Both types haveproven in various case studies that they can ensure therequired face stability, provided they are properlyoperated. As such, the selection would have to bebased on the primary and probably most importantaspect in the TBM selection process, which is thegrading envelope of the soils to be encountered by theTBM.
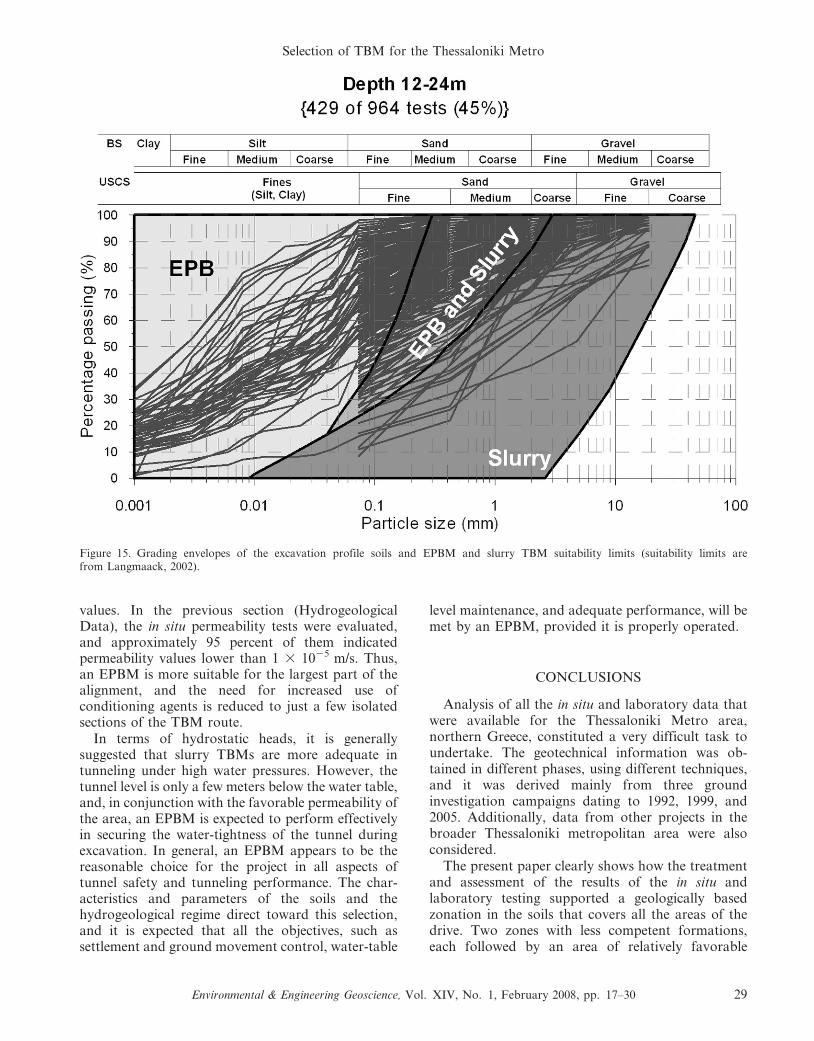
Figure 15 shows the grading envelopes of 429 testsalong the tunnel alignment. These tests are those thatcorrespond to samples taken from boreholes atdepths between 12 and 24 m, the depth range overwhich the tunnel will be excavated. These envelopeswere examined in terms of suitability for each type ofTBM using various references from acknowledgedsources. The one shown in Figure 15 is fromLangmaack (2002). Similar conclusions were extract-ed from other relevant graphs.
The vast majority of the envelopes suggest that thesoils to be encountered during tunneling are made upof a high percentage of fines; this fact directs towardthe use of an EPBM. The British Tunneling Society(BTS) and the Institution of Civil Engineers (ICE) ina 2005 publication, ‘‘Closed-Face Tunnelling Ma-chines and Ground Stability’’ (Anonymous, 2005)
suggest that a fine percentage higher than 20 percentrenders the use of a slurry TBM questionable(‘‘although [it is] not rule[d] out’’), whereas finesshould be higher than 10 percent for an EPBM towork properly. As can be seen, a number of tests didnot incorporate hydrometer analysis, yet the cumu-lative percentage of fines (particles passing throughNo. 200 sieve, less than 0.074mm) is clearly shown. Itis apparent from Figure 15 that an EPBM should beable to effortlessly confront the soils of the projectarea. The potential presence of coarser material oreven boulders is not expected to create severeproblems to the boring procedure, since, in mostcases, this coarse material is embraced by a clayey-silty matrix that aids the formation of an adequateearth paste in the EPBM’s working chamber whilekeeping the use of conditioning agents at reasonablelevels.
Another important selection criterion is the hydro-geological regime of the area. In terms of permeabil-ity, BTS and ICE (Anonymous, 2005) indicate aground permeability of 1 3 1025 m/s as ‘‘the point ofselection’’ between EPBMs and slurry TBMs, wherethe slurry TBMs are more suitable for higher values,and, accordingly, EPBMs are more suitable for lower
Figure 14. Permeability (hydraulic conductivity) distribution graph along the area of the alignment, based on in situ permeability tests.
Marinos, Novack, Benissi, Panteliadou, Papouli, Stoumpos, Marinos, and Korkaris
28 Environmental & Engineering Geoscience, Vol. XIV, No. 1, February 2008, pp. 17–30
values. In the previous section (HydrogeologicalData), the in situ permeability tests were evaluated,and approximately 95 percent of them indicatedpermeability values lower than 1 3 1025 m/s. Thus,an EPBM is more suitable for the largest part of thealignment, and the need for increased use ofconditioning agents is reduced to just a few isolatedsections of the TBM route.
In terms of hydrostatic heads, it is generallysuggested that slurry TBMs are more adequate intunneling under high water pressures. However, thetunnel level is only a few meters below the water table,and, in conjunction with the favorable permeability ofthe area, an EPBM is expected to perform effectivelyin securing the water-tightness of the tunnel duringexcavation. In general, an EPBM appears to be thereasonable choice for the project in all aspects oftunnel safety and tunneling performance. The char-acteristics and parameters of the soils and thehydrogeological regime direct toward this selection,and it is expected that all the objectives, such assettlement and ground movement control, water-table
level maintenance, and adequate performance, will bemet by an EPBM, provided it is properly operated.
CONCLUSIONS
Analysis of all the in situ and laboratory data thatwere available for the Thessaloniki Metro area,northern Greece, constituted a very difficult task toundertake. The geotechnical information was ob-tained in different phases, using different techniques,and it was derived mainly from three groundinvestigation campaigns dating to 1992, 1999, and2005. Additionally, data from other projects in thebroader Thessaloniki metropolitan area were alsoconsidered.
The present paper clearly shows how the treatmentand assessment of the results of the in situ andlaboratory testing supported a geologically basedzonation in the soils that covers all the areas of thedrive. Two zones with less competent formations,each followed by an area of relatively favorable
Figure 15. Grading envelopes of the excavation profile soils and EPBM and slurry TBM suitability limits (suitability limits arefrom Langmaack, 2002).
Selection of TBM for the Thessaloniki Metro
Environmental & Engineering Geoscience, Vol. XIV, No. 1, February 2008, pp. 17–30 29
geotechnical conditions, are expected to be encoun-tered during the Thessaloniki Metro construction.
These weak zones are distinguished by cleardifferences in all geotechnical aspects, such as NSPT
values, undrained shear strength, variability of thematerial as derived from the soil classificationaccording to the AUSCS, and also differences in thenature and the consistency of the soils. The morecompetent zones are generally formed by hard to stiffclays of ample geotechnical behavior.
The geotechnical characteristics and parameters, inconjunction with the low permeability, led to theselection of an EPBM rather than a slurry TBM. AnEPBM is expected to perform efficiently with low-rateconditioning in the largest part of the alignment. Inspecific areas, the presence of coarser materialscannot be ruled out; however, with the use ofappropriate conditioning, settlements and groundmovements can be sufficiently controlled. In all cases,the ground can be successfully bored with the use ofEPBMs.
ACKNOWLEDGMENTS
We would like to thank Attiko Metro S.A. for theirsupport and the permission to publish this paper.
REFERENCES
ANONYMOUS, 1979, Classification of rocks and soils for engineeringgeological mapping. Part I: Rock and soil materials: Bulletinof the International Association Engineering Geology, No. 19,pp. 364–371.
ANONYMOUS, 2005, Closed-Face Tunnelling Machines and GroundStability. British Tunnelling Society (Closed-Face WorkingGroup) in association with the Institution of Civil Engineers:Thomas Telford Publishing, London, 77 p.
BELL, F. G., 2000, Engineering Properties of Soils and Rocks:Blackwell Science Ltd., Oxford, 482 p.
BRIAUD, J. L., 1992, The Pressure Meter: A.A. Balkema,Rotterdam, 322 p.
GEODATA, S. P. A., 1995, Review of alternative constructionmethods and feasibility of proposed methods for constructingAttiko Metro Extension of Line 3 to Egaleo: Attiko MetroS.A., pp. 191–193.
KAVVADAS, M. J., 2005. personal communication, material for thelectures of the module ‘‘Foundations’’ (in Greek), NationalTechnical University of Athens, Iroon Politechniou 9, 15780Zografou, Greece.
KOUKIS, G. AND SAMBATAKAKIS, N., 2002, Engineering Geology (inGreek): A. Papasotiriou Publishing, Athens, 514 p.
LANGMAACK, L., 2002, Soil conditioning for TBM—Chances andlimits: Journees d’Etudes Internationales de Toulouse—Under-ground Works: Living Structures, Association Francaise desTunnels et de l’Espace Souterrain (AFTES).
TERZAGHI, K.; PECK, R. B.; AND MESRI, G., 1996, Soil Mechanics inEngineering Practice: John Wiley & Sons, New York, 549 p.
THEWES, M. AND BURGER, W., 2004, Clogging risks for TBM drivesin clay: Tunnels & Tunnelling International, June 2004,pp. 28–31.
Marinos, Novack, Benissi, Panteliadou, Papouli, Stoumpos, Marinos, and Korkaris
30 Environmental & Engineering Geoscience, Vol. XIV, No. 1, February 2008, pp. 17–30