grocery store beverage choices by participants in federal food assistance and nutrition programs
TRANSCRIPT
Grocery Store Beverage Choices byParticipants in Federal Food Assistance and
Nutrition ProgramsTatiana Andreyeva, PhD, Joerg Luedicke, MS, Kathryn E. Henderson, PhD,
Amanda S. Tripp, MPH
Background: Sugar-sweetened beverages are a target for reduction in the 2010 Dietary Guidelinesfor Americans. Concerns have been raised about sugar-sweetened beverages purchased with Supple-mental Nutrition Assistance Program (SNAP) benefıts.
Purpose: This paper describes purchases of non-alcoholic refreshment beverages among partici-pants in the U.S. Department of Agriculture’s Special Supplemental Nutrition Program forWomen,Infants, and Children (WIC) and SNAP.
Methods: Grocery store scanner data from a regional supermarket chain were used to assessrefreshment beverage purchases of 39,172 households in January–June 2011. The sample consisted offamilies with a history of WIC participation in 2009–2011; about half also participated in SNAP.Beverage spending and volume purchased were compared forWIC sampled households either usingSNAP benefıts (SNAP) or not (WIC-only). Analyses were completed in 2012.
Results: Refreshment beverages were a signifıcant contributor to expenditure on groceries bySNAP andWIC households. Sugar-sweetened beverages accounted for 58% of refreshment beveragepurchases made by SNAP households and 48% of purchases by WIC-only households. Soft drinkswere purchasedmost by all households. Fruit-based beverages weremainly 100% juice forWIC-onlyhouseholds and sugary fruit drinks for SNAP households. SNAP benefıts paid for 72% of thesugar-sweetened beverage purchases made by SNAP households. Nationwide, SNAP was estimatedto pay at least $1.7 to $2.1 billion annually for sugar-sweetened beverages purchased in grocery stores.
Conclusions: Considerable amounts of sugar-sweetened beverages are purchased by householdsparticipating inWIC and SNAP. The SNAP program pays for most of the sugar-sweetened beveragepurchases among SNAP households. The upcoming SNAP reauthorization could be a good time toreconsider the program priorities to align public funds with public health.(Am J Prev Med 2012;43(4):411–418) © 2012 American Journal of Preventive Medicine
esd
Introduction
Consumption of sugar-sweetened beverages amongAmericans increased dramatically in the 1980sand 1990s.1–3 A signifıcant source of empty calo-
ries,4,5 sugar-sweetened beverages are a target for reduc-tion in the 2010 Dietary Guidelines for Americans6 be-cause of evidence of the contribution of added sugars to arange of poor health outcomes, including obesity,7–13
From the Rudd Center for Food Policy and Obesity (Andreyeva, Luedicke,Henderson), Yale School of Public Health (Tripp), Yale University, NewHaven, Connecticut
Address correspondence to: Tatiana Andreyeva, PhD, Yale UniversityRudd Center for Food Policy and Obesity, 309 Edwards Street, NewHavenCT 06520-8369. E-mail: [email protected].
0749-3797/$36.00http://dx.doi.org/10.1016/j.amepre.2012.06.015
© 2012 American Journal of Preventive Medicine • Published by Elsev
diabetes,14–17 metabolic syndrome,14,17 vascular dis-ase,18–20 and dental caries.21,22 Added sugars and sugar-weetened beverages in particular have been shown toisplace other important nutrients in the diet.23 In light of
the broad negative impact of added sugars, many havecalled for policies restricting their consumption, with aparticular focus on sugar-sweetened beverages.3,24,25
Across the nation, public health campaigns to reducesugar-sweetened beverage consumption have emerged,26
whereas several state and town legislatures fıled bills (sofar unsuccessfully) to limit sugar-sweetened beverage in-take via fıscal policies, such as excise taxes on sugar-sweetened beverages.The Supplemental Nutrition Assistance Program
(SNAP) was designed to alleviate hunger and malnutri-
tion in low-income individuals and reduce commodityier Inc. Am J Prev Med 2012;43(4):411–418 411

mh�
Sf
focepaob
w(i
vUswicw
mjd
412 Andreyeva et al / Am J Prev Med 2012;43(4):411–418
surpluses.27 In 2011, every seventh American and 21.07illion households received SNAP benefıts.28 Almostalf of SNAP participants (47%) are children aged18 years.29 SNAP benefıts can be used to buy virtually
any foods and beverages, excluding alcohol, hot foods,and ready-made foods meant to be consumed within thestore.30 Unlike SNAP, the U.S. Department of Agricul-ture’s Special Supplemental Nutrition Program forWomen, Infants, and Children (WIC) provides a pre-scriptive set of key nutrient-dense foods to low-incomepregnant and postpartum women, and infants and chil-dren aged �5 years. WIC participation in 2011 was 8.96million,31 including 53% of the infants born in the U.S.32
Although SNAP has been successful in reducinghunger and food insecurity, its impact on diet quality isless clear.33 Compared to eligible nonparticipants,SNAP recipients are more likely to consume nutrition-ally poor diets.34,35 Concerns have been raised aboutNAP-paid purchases of energy-dense nutrient-pooroods, particularly sugar-sweetened beverages.New York City and several states have sought, thus
ar unsuccessfully, a waiver from the U.S. Departmentf Agriculture to allow restrictions on purchases ofertain foods and beverages with SNAP benefıts. Suchfforts have generated substantial controversy, withublic health advocates championing the position andnti-hunger advocates expressing concernver restrictions placed on the use ofenefıts.36–38 Scarcity of data on types of
foods and beverages purchased withSNAP benefıts has been a limitation in thisdebate. The current study describes su-permarket purchases of non-alcoholic re-freshment beverages among WIC- andSNAP-participating households, includ-ing the use of SNAP benefıts in thesepurchases.
MethodsScanner Data
The study is based on grocery store scanner data from a largesupermarket chain with stores in several New England states. Typ-ical of many chains, this grocer has a loyalty card system, whichallows customers to benefıt from store promotions, often availableonly to loyalty card users. At least 90% of transactions include theuse of a loyalty card. Purchases made without the use of loyaltycards cannot be tracked over time and are not part of this analysis.Each loyalty card is assumed to represent one household. Al-
though some households might have multiple cards, there is noinformation about households to enable linking such cards. Aunique feature is data on the source of funds used to pay for everypurchase. This includes SNAP benefıts, WIC benefıts, nonfood
rComm
Lath
electronic benefıt transfers (EBT), and personal funds (e.g., cash), p
ith the majority of purchases using one method of payment80.6%). A household’s use of benefıts indicates its program partic-pation at the time of the purchase.
Sample
The sample was conditioned on WIC participation to provide apolicy-relevant subset of low-income young families. Data werecollected for shoppers using WIC benefıts at least once at anygrocery store of the chain in January 2009–June 2011. Householdswith at least one WIC purchase in January 2009 were flagged asWIC and followed forward through June 2011, even if they nolonger used WIC. Each month, new households were identifıed asWIC and carried forward, but their purchases prior to joining thesample were unavailable. No data were collected for householdsthat never participated in WIC because of income ineligibility orself-selection into nonparticipation. About half of the sampledWIC households were also SNAP participants.A household was defıned as SNAP during a given month if at
least one purchase using SNAP benefıts was made during thatmonth.Householdswere permitted tomove in and/or out of SNAPfor purposes of analysis to represent typical purchasing behaviorwhile using SNAP. The majority of households either participatedin SNAP for all months in which they provided data or did notparticipate at all.The current study examines data for all grocery purchases of
39,172 households in themost recent period of January–June 2011.Each household’s purchases were aggregated at the monthly level;if a household made multiple purchases that month, they wereadded up. The panel is unbalanced, as many households did not
shop at the chain monthly. Only 11,923 house-holds made purchases in all 6 months (regularshoppers).
Beverage Identification and Catego-rization
Each product has a unique Universal ProductCode (UPC) and the store-provided product,department, category, and subcategory descrip-tion. The grocery store chain product list in-cluded 392,119 UPCs in 1974 grocery subcate-gories, of which 142 were selected for non-
alcoholic refreshment beverages (3726 UPCs). Hot tea and coffee,cocoa and milk additives, dairy beverages, baby food or formula,frozen juice pops, smoothie beverages, and alcoholic beverageswere excluded.To obtain data on each product size, nutrition facts panel, and
ingredient list, the selected beverage UPCs were merged with Glad-son’s Nutrition Database39 (Gladson; 64% match). To estimate theolume of purchased beverages, a package size was assessed for eachPC based on the size information in the product description, Glad-on, or Internet searches for UPCs or brand names. For beverages forhich none of these methods succeeded, prices were used to helpdentify a package size. For powdered drinks and 100% juice sold in aoncentrated form, the volume of a drink created after adding wateras used. All package size data were converted into ounces.All types of non-alcoholic, refreshment beverages in the U.S.arket were included: carbonated soft drinks, bottled water, 100%
uice, fruit drinks, energy drinks and shots, sports drinks, ready-to-rink tea, flavored/enhanced water, ready-to-drink coffee, and
eedtary by
insue.
Seelat
enraia
is is
owdered non-alcoholic drinks. Beverage type for each UPC was
www.ajpmonline.org
shpyocapb
Andreyeva et al / Am J Prev Med 2012;43(4):411–418 413
O
identifıed using the UPC description and subcategory description.Beverages were categorized also by type of sweetener (or lack ofone). The nutritional label from Gladson, product description andmanufacturers’websiteswereused to categorizebeverages as sugar-sweetened, diet, unsweetened, and less sweeteners added. Detailedinformation about beverage classifıcation by type and sweetener isin Appendix A (available online at www.ajpmonline.org). Twocoders independently performed cross-verifıcation of all beverageUPCs.
Outcomes
The volume purchased was assessed by beverage type and type ofsweetener. Ounces purchased were aggregated at the transactionlevel; all household purchases within each month were thensummed to construct a measure of beverage volume purchasedevery month that a household shopped at the grocery store chain.With the same approach, beverage spending and the proportion ofbeverage spending in total grocery expenditure were calculated.For each transaction, the percentage of groceries paid by SNAP,WIC, and personal funds was calculated.For households using SNAP, the proportion of beverage and
total grocery spending paid by the program was calculated. If theprogram paid for the entire purchase, all beverage spending in thattransactionwas used to calculate SNAP-paid beverage purchases. Ifbeverageswere purchased using only personal funds, SNAP spend-ing on beverages was zero. For purchases with mixed methods ofpayment (e.g., program benefıts and cash), the weighted averagepercentage of SNAP-eligible grocery items paid by the programwas estimated. For example, if 50% of expenditure on food andbeverages came from program benefıts and the rest from personalfunds, 50%of beverage spending in this transactionwas assumed tobe paid by SNAP.
Data Analysis
For each month of January–June 2011, the mean beverage volumeand spendingwere calculated for households using SNAP (referredto as SNAP households) and not using SNAP benefıts that month(referred to as WIC-only households). All households in the sam-ple were WIC benefıciaries at some point in January 2009–June2011; about half of them also participated in SNAP at some pointduring the analysis. As beverage purchases were assessed forJanuary–June 2011, SNAP status during these 6 months (ratherthan in previous years) was used to measure the effect of SNAPbenefıts use, assessed each month.Six monthly means were used to calculate the unweighted mean
for the entire study, which is reported. This approach is preferredto calculating the mean of all household-month observations.Households shopping more months also purchased more bever-ages, so using the mean across household-months and weighingsuch households more heavily would bias the results.Analyses were completed for all households and for house-
holds shopping every month (regular shoppers). Regressionanalyses estimated the proportion of refreshment beveragespending in total grocery expenditure and the share of refresh-ment beverage volume by type using a generalized linear modelfrom the binomial family with a logit link function. The modeland estimation results are presented in Appendix B (availableonline at www.ajpmonline.org). All analyses were carried out
using Stata, version 11.2, in 2012.ctober 2012
A back-of-the-envelope estimation was used to calculate SNAPpending on sugar-sweetened beverages among all SNAP house-olds in the U.S. Two assumptions were made that are likely toroduce conservative estimates. First, SNAP households withoung children in New England were assumed to be representativef all SNAP households in the U.S. and to mirror beverage pur-hases at grocery store chains elsewhere. Another conservativessumption was that the fırst 6 months of refreshment beverageurchases represented the entire year (the highest refreshmenteverage sales are usually in July and August).40 The average
monthly SNAP-funded spending on sugar-sweetened beveragesfor each SNAP household in the sample was estimated along withbootstrapped SEs in order to calculate bias-corrected CIs, account-
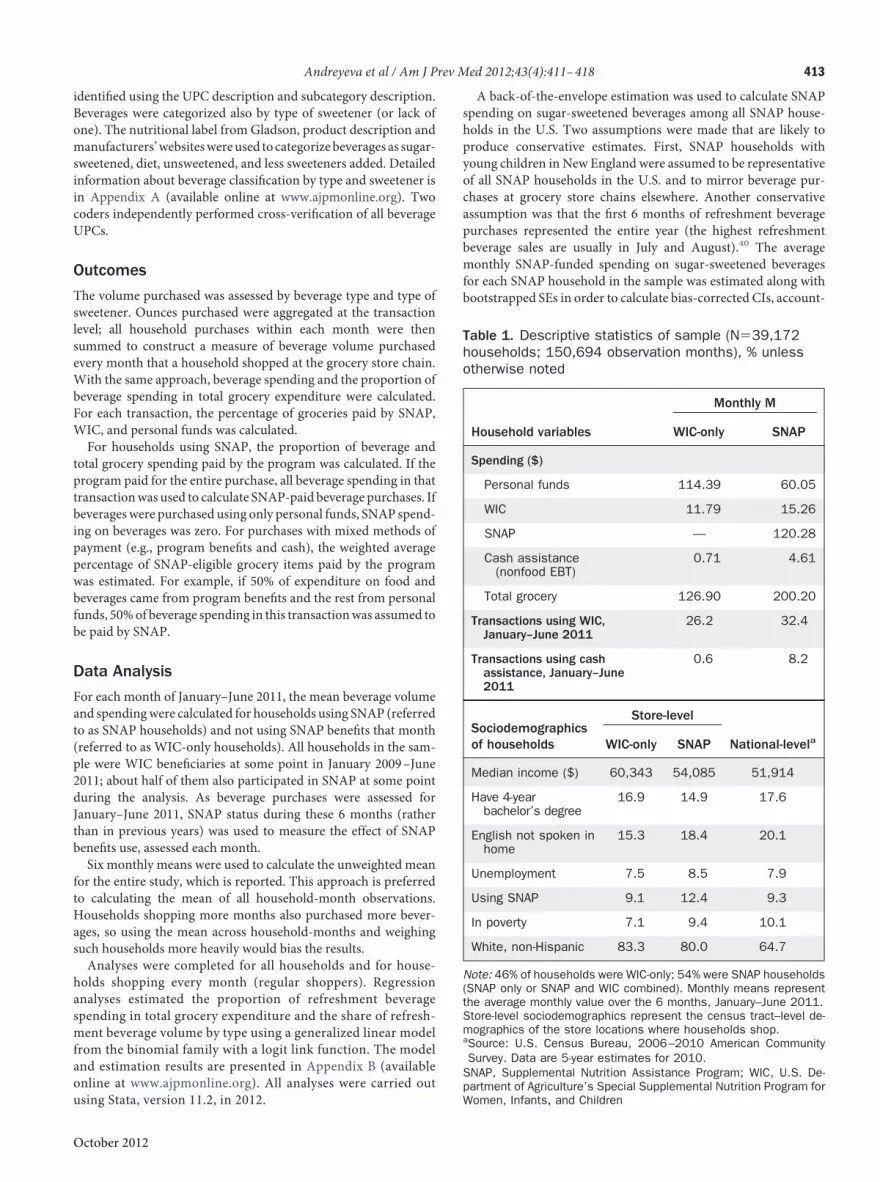
Table 1. Descriptive statistics of sample (N�39,172households; 150,694 observation months), % unlessotherwise noted
Household variables
Monthly M
WIC-only SNAP
Spending ($)
Personal funds 114.39 60.05
WIC 11.79 15.26
SNAP — 120.28
Cash assistance(nonfood EBT)
0.71 4.61
Total grocery 126.90 200.20
Transactions using WIC,January–June 2011
26.2 32.4
Transactions using cashassistance, January–June2011
0.6 8.2
Sociodemographicsof households
Store-level
National-levelaWIC-only SNAP
Median income ($) 60,343 54,085 51,914
Have 4-yearbachelor’s degree
16.9 14.9 17.6
English not spoken inhome
15.3 18.4 20.1
Unemployment 7.5 8.5 7.9
Using SNAP 9.1 12.4 9.3
In poverty 7.1 9.4 10.1
White, non-Hispanic 83.3 80.0 64.7
Note: 46% of households were WIC-only; 54% were SNAP households(SNAP only or SNAP and WIC combined). Monthly means representthe average monthly value over the 6 months, January–June 2011.Store-level sociodemographics represent the census tract–level de-mographics of the store locations where households shop.aSource: U.S. Census Bureau, 2006–2010 American CommunitySurvey. Data are 5-year estimates for 2010.
SNAP, Supplemental Nutrition Assistance Program; WIC, U.S. De-
partment of Agriculture’s Special Supplemental Nutrition Program forWomen, Infants, and Children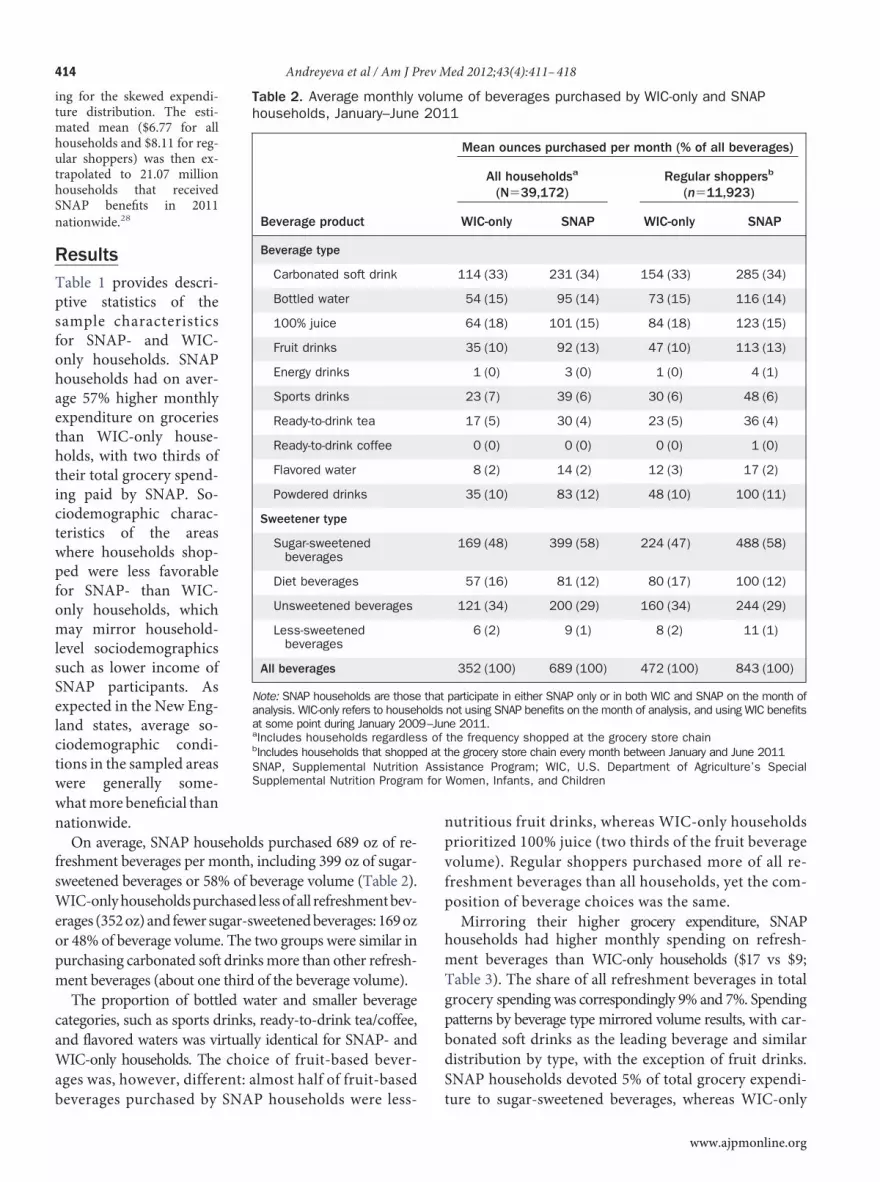
for
414 Andreyeva et al / Am J Prev Med 2012;43(4):411–418
ing for the skewed expendi-ture distribution. The esti-mated mean ($6.77 for allhouseholds and $8.11 for reg-ular shoppers) was then ex-trapolated to 21.07 millionhouseholds that receivedSNAP benefıts in 2011nationwide.28
ResultsTable 1 provides descri-ptive statistics of thesample characteristicsfor SNAP- and WIC-only households. SNAPhouseholds had on aver-age 57% higher monthlyexpenditure on groceriesthan WIC-only house-holds, with two thirds oftheir total grocery spend-ing paid by SNAP. So-ciodemographic charac-teristics of the areaswhere households shop-ped were less favorablefor SNAP- than WIC-only households, whichmay mirror household-level sociodemographicssuch as lower income ofSNAP participants. Asexpected in the New Eng-land states, average so-ciodemographic condi-tions in the sampled areaswere generally some-whatmore benefıcial thannationwide.On average, SNAP households purchased 689 oz of re-
freshment beverages per month, including 399 oz of sugar-sweetened beverages or 58% of beverage volume (Table 2).WIC-onlyhouseholdspurchased lessofall refreshmentbev-erages (352oz)and fewer sugar-sweetenedbeverages: 169ozor 48% of beverage volume. The two groups were similar inpurchasing carbonated soft drinksmore than other refresh-ment beverages (about one third of the beverage volume).The proportion of bottled water and smaller beverage
categories, such as sports drinks, ready-to-drink tea/coffee,and flavored waters was virtually identical for SNAP- andWIC-only households. The choice of fruit-based bever-ages was, however, different: almost half of fruit-based
Table 2. Average monthlyhouseholds, January–June
Beverage product
Beverage type
Carbonated soft drink
Bottled water
100% juice
Fruit drinks
Energy drinks
Sports drinks
Ready-to-drink tea
Ready-to-drink coffee
Flavored water
Powdered drinks
Sweetener type
Sugar-sweetenedbeverages
Diet beverages
Unsweetened beverages
Less-sweetenedbeverages
All beverages
Note: SNAP households are thoseanalysis. WIC-only refers to househat some point during January 200aIncludes households regardlesbIncludes households that shoppeSNAP, Supplemental NutritionSupplemental Nutrition Program
beverages purchased by SNAP households were less-
nutritious fruit drinks, whereas WIC-only householdsprioritized 100% juice (two thirds of the fruit beveragevolume). Regular shoppers purchased more of all re-freshment beverages than all households, yet the com-position of beverage choices was the same.Mirroring their higher grocery expenditure, SNAP
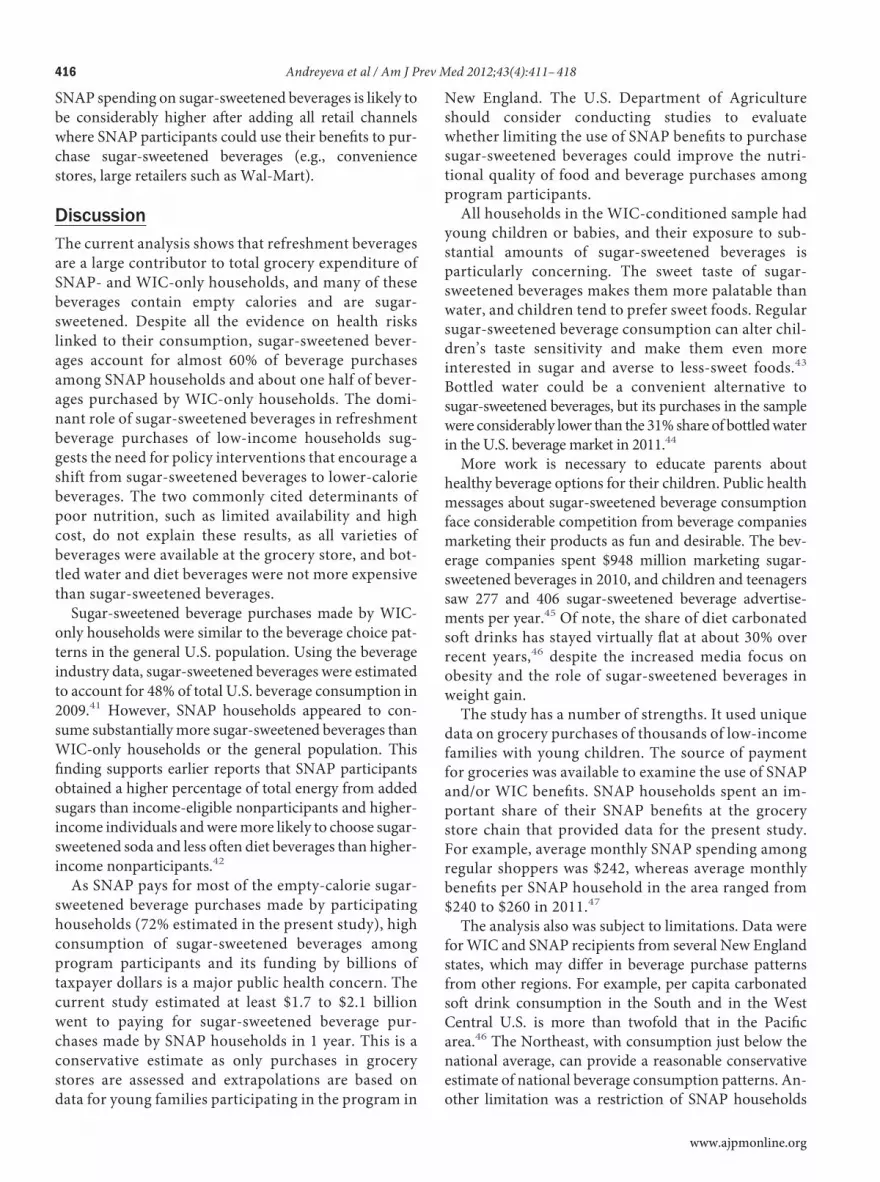
households had higher monthly spending on refresh-ment beverages than WIC-only households ($17 vs $9;Table 3). The share of all refreshment beverages in totalgrocery spendingwas correspondingly 9% and 7%. Spendingpatterns by beverage type mirrored volume results, with car-bonated soft drinks as the leading beverage and similardistribution by type, with the exception of fruit drinks.SNAP households devoted 5% of total grocery expendi-
e of beverages purchased by WIC-only and SNAP1
Mean ounces purchased per month (% of all beverages)
All householdsa
(N�39,172)Regular shoppersb
(n�11,923)
WIC-only SNAP WIC-only SNAP
114 (33) 231 (34) 154 (33) 285 (34)
54 (15) 95 (14) 73 (15) 116 (14)
64 (18) 101 (15) 84 (18) 123 (15)
35 (10) 92 (13) 47 (10) 113 (13)
1 (0) 3 (0) 1 (0) 4 (1)
23 (7) 39 (6) 30 (6) 48 (6)
17 (5) 30 (4) 23 (5) 36 (4)
0 (0) 0 (0) 0 (0) 1 (0)
8 (2) 14 (2) 12 (3) 17 (2)
35 (10) 83 (12) 48 (10) 100 (11)
169 (48) 399 (58) 224 (47) 488 (58)
57 (16) 81 (12) 80 (17) 100 (12)
121 (34) 200 (29) 160 (34) 244 (29)
6 (2) 9 (1) 8 (2) 11 (1)
352 (100) 689 (100) 472 (100) 843 (100)
participate in either SNAP only or in both WIC and SNAP on the month ofnot using SNAP benefits on the month of analysis, and using WIC benefitse 2011.the frequency shopped at the grocery store chainhe grocery store chain every month between January and June 2011istance Program; WIC, U.S. Department of Agriculture’s SpecialWomen, Infants, and Children
volum201
thatolds9–Juns ofd at tAss
ture to sugar-sweetened beverages, whereas WIC-only
www.ajpmonline.org

Andreyeva et al / Am J Prev Med 2012;43(4):411–418 415
O
households spent more on diet and unsweetened bever-ages (4%) than on sugar-sweetened beverages (3%). Lim-iting the sample to regular shoppers had no qualitativeeffect on the results.Percentage of refreshment beverage spending paid by
SNAPvaried bybeverage type from54% for juice to 85% forready-to-drinkcoffee,with themeanforallbeveragesat67%(Table 3).Overall, SNAPbenefıts paid for 63%of all groceryexpenditures at the chain among households using SNAPbenefıts.Total grocery expenditures ($200/month) includedall groceries, but the share of SNAP-ineligible items wassmall. SNAP benefıts were used to pay for 72% of sugar-sweetened beverage purchases by SNAP households—ahigher percentage than for all groceries (63%), diet (65%),
Table 3. Average monthly expenditures by WIC-only and S
Beverage product
Mean
All householdsa (N�
WIC-only SNAP
Beverage type
Carbonated soft drink 2.56 (2.0) 5.41 (2.7)
Bottled water 0.72 (0.6) 1.25 (0.6)
100% juice 2.79 (2.2) 4.48 (2.2)
Fruit drinks 1.18 (0.9) 2.91 (1.5)
Energy drinks 0.15 (0.1) 0.49 (0.2)
Sports drinks 0.39 (0.3) 0.70 (0.4)
Ready-to-drink tea 0.43 (0.3) 0.78 (0.4)
Ready-to-drink coffee 0.02 (0.0) 0.07 (0.0)
Flavored water 0.31 (0.2) 0.55 (0.3)
Powdered drinks 0.31 (0.2) 0.73 (0.4)
Sweetener type
Sugar-sweetenedbeverages
3.79 (3.0) 9.34 (4.7)
Diet beverages 1.25 (1.0) 1.74 (0.9)
Unsweetened beverages 3.65 (2.9) 6.00 (3.0)
Less-sweetenedbeverages
0.18 (0.1) 0.29 (0.1)
All beverages 8.87 (7.0) 17.37 (8.7)
All groceries 126.91 200.20
Note: SNAP households are those that participate in either SNAP onhouseholds not using SNAP benefits on the month of analysis, andaIncludes households regardless of the frequency shopped at the gbHouseholds that shopped at the grocery store chain every month bSNAP, Supplemental Nutrition Assistance Program; WIC, U.S. DepartInfants, and Children
and unsweetened beverages (59%).
ctober 2012
Spending ofWICbenefıts on 100% juice explains lowerSNAP spending on juice and unsweetened beveragesthan on other beverages. For example, WIC paid forabout 50% of juice purchased by households using SNAPandWIC benefıts. Regular shoppers using SNAP benefıtshad a slightly lower percentage of beverages paid bySNAP (66% for all beverages and 71% for sugar-sweetened beverages). Using data on purchases of allSNAP households, the SNAP program was estimated tospend annually $1.713 billion (bootstrapped 95%CI�1.689, 1.733) on sugar-sweetened beverage pur-chases at grocery store chains nationwide. Focusing onregular shoppers that may better represent total grocerystore purchases among SNAP participants, this estimate
households, January–June 2011
thly expenditure, $ (% of all groceries)
72) Regular shoppersb (n�11,923)
% paidby SNAP WIC-only SNAP
% paidby SNAP
68 3.45 (2.1) 6.65 (2.7) 67
70 0.96 (0.6) 1.52 (0.6) 69
54 3.63 (2.2) 5.43 (2.2) 54
75 1.61 (1.0) 3.58 (1.5) 73
79 0.21 (0.1) 0.61 (0.3) 80
72 0.55 (0.3) 0.85 (0.4) 71
70 0.57 (0.3) 0.95 (0.4) 68
85 0.02 (0.0) 0.08 (0.0) 83
69 0.45 (0.3) 0.66 (0.3) 68
75 0.42 (0.3) 0.88 (0.4) 73
72 5.09 (3.0) 11.44 (4.7) 71
65 1.76 (1.0) 2.15 (0.9) 62
59 4.78 (2.8) 7.27 (3.0) 58
69 0.25 (0.2) 0.35 (0.1) 67
67 11.88 (7.1) 21.21 (8.7) 66
63 167.82 242.49 62
in both WIC and SNAP on the month of analysis. WIC-only refers toWIC benefits at some point during January 2009–June 2011.
y store chainen January and June 2011of Agriculture’s Special Supplemental Nutrition Program for Women,
NAP
mon
39,1
ly orusingroceretwement
was $2.050 billion (95% CI�2.017, 2.084). The total
sWfosisi
ow
dffapsFrb$
416 Andreyeva et al / Am J Prev Med 2012;43(4):411–418
SNAP spending on sugar-sweetened beverages is likely tobe considerably higher after adding all retail channelswhere SNAP participants could use their benefıts to pur-chase sugar-sweetened beverages (e.g., conveniencestores, large retailers such as Wal-Mart).
DiscussionThe current analysis shows that refreshment beveragesare a large contributor to total grocery expenditure ofSNAP- and WIC-only households, and many of thesebeverages contain empty calories and are sugar-sweetened. Despite all the evidence on health riskslinked to their consumption, sugar-sweetened bever-ages account for almost 60% of beverage purchasesamong SNAP households and about one half of bever-ages purchased by WIC-only households. The domi-nant role of sugar-sweetened beverages in refreshmentbeverage purchases of low-income households sug-gests the need for policy interventions that encourage ashift from sugar-sweetened beverages to lower-caloriebeverages. The two commonly cited determinants ofpoor nutrition, such as limited availability and highcost, do not explain these results, as all varieties ofbeverages were available at the grocery store, and bot-tled water and diet beverages were not more expensivethan sugar-sweetened beverages.Sugar-sweetened beverage purchases made by WIC-
only households were similar to the beverage choice pat-terns in the general U.S. population. Using the beverageindustry data, sugar-sweetened beverages were estimatedto account for 48% of total U.S. beverage consumption in2009.41 However, SNAP households appeared to con-ume substantiallymore sugar-sweetened beverages thanIC-only households or the general population. This
ınding supports earlier reports that SNAP participantsbtained a higher percentage of total energy from addedugars than income-eligible nonparticipants and higher-ncome individuals andweremore likely to choose sugar-weetened soda and less often diet beverages than higher-ncome nonparticipants.42
As SNAP pays for most of the empty-calorie sugar-sweetened beverage purchases made by participatinghouseholds (72% estimated in the present study), highconsumption of sugar-sweetened beverages amongprogram participants and its funding by billions oftaxpayer dollars is a major public health concern. Thecurrent study estimated at least $1.7 to $2.1 billionwent to paying for sugar-sweetened beverage pur-chases made by SNAP households in 1 year. This is aconservative estimate as only purchases in grocerystores are assessed and extrapolations are based on
data for young families participating in the program inNew England. The U.S. Department of Agricultureshould consider conducting studies to evaluatewhether limiting the use of SNAP benefıts to purchasesugar-sweetened beverages could improve the nutri-tional quality of food and beverage purchases amongprogram participants.All households in the WIC-conditioned sample had
young children or babies, and their exposure to sub-stantial amounts of sugar-sweetened beverages isparticularly concerning. The sweet taste of sugar-sweetened beverages makes them more palatable thanwater, and children tend to prefer sweet foods. Regularsugar-sweetened beverage consumption can alter chil-dren’s taste sensitivity and make them even moreinterested in sugar and averse to less-sweet foods.43
Bottled water could be a convenient alternative tosugar-sweetened beverages, but its purchases in the samplewere considerably lower than the 31%share of bottledwaterin the U.S. beveragemarket in 2011.44
More work is necessary to educate parents abouthealthy beverage options for their children. Public healthmessages about sugar-sweetened beverage consumptionface considerable competition from beverage companiesmarketing their products as fun and desirable. The bev-erage companies spent $948 million marketing sugar-sweetened beverages in 2010, and children and teenagerssaw 277 and 406 sugar-sweetened beverage advertise-ments per year.45 Of note, the share of diet carbonatedsoft drinks has stayed virtually flat at about 30% overrecent years,46 despite the increased media focus onbesity and the role of sugar-sweetened beverages ineight gain.The study has a number of strengths. It used uniqueata on grocery purchases of thousands of low-incomeamilies with young children. The source of paymentor groceries was available to examine the use of SNAPnd/or WIC benefıts. SNAP households spent an im-ortant share of their SNAP benefıts at the grocerytore chain that provided data for the present study.or example, average monthly SNAP spending amongegular shoppers was $242, whereas average monthlyenefıts per SNAP household in the area ranged from240 to $260 in 2011.47
The analysis also was subject to limitations. Data wereforWIC and SNAP recipients from several New Englandstates, which may differ in beverage purchase patternsfrom other regions. For example, per capita carbonatedsoft drink consumption in the South and in the WestCentral U.S. is more than twofold that in the Pacifıcarea.46 The Northeast, with consumption just below thenational average, can provide a reasonable conservativeestimate of national beverage consumption patterns. An-
other limitation was a restriction of SNAP householdswww.ajpmonline.org
1
1
1
1
1
1
1
1
1
1
2
2
2
2
2
2
2
2
2
2
Andreyeva et al / Am J Prev Med 2012;43(4):411–418 417
O
with a history of recentWIC participation. Future studiesshould provide data on beverage purchases of all SNAPparticipants.
ConclusionSugar-sweetened beverage purchases are particularlyhigh among SNAP households, and the majority arebought using program benefıts. At least $1.7 to $2.1billion is spent in national SNAP funds annually to payfor beverages with no nutritional value. SNAP is thelargest federally funded food assistance program serv-ing millions of low-income families, including a highproportion of food-insecure households. SNAP bene-fıts are extremely important in helping these familiesput food on the table, and every effort should be madeto maintain the generous level of federal food assis-tance via SNAP. At the same time, allowing annual useof multibillions in SNAP benefıts to purchase productsthat are at the core of public health concerns aboutobesity and chronic illnesses appears misaligned withthe goals of helping low-income families live active,healthy lives. The upcoming SNAP reauthorization in2012 could be a good time to reconsider the programpriorities to align use of public funds with fosteringpublic health.
This study was funded by a grant from the Economic ResearchService at the U.S. Department of Agriculture. The authorsthank Victoria Zigmont for excellent research assistance. Spe-cial thanks go to the confıdential grocery store chain for sharingtheir data.No fınancial disclosures were reported by the authors of this
paper.
References1. Bleich SN,WangYC,WangY,Gortmaker SL. Increasing consumption
of sugar-sweetened beverages among U.S. adults: 1988-1994 to 1999-2004. Am J Clin Nutr 2009;89(1):372–81.
2. Ogden CL, Kit BK, Carroll MD, Park S. Consumption of sugar drinksin the U.S., 2005-2008. NCHS Data Brief 2011;(71):1–8.
3. Lasater G, Piernas C, Popkin BM. Beverage patterns and trends amongschool-aged children in the U.S., 1989 2008. Nutr J 2011;10:103.
4. Reedy J, Krebs-Smith SM. Dietary sources of energy, solid fats, andadded sugars among children and adolescents in the U.S. J Am DietAssoc 2010;110(10):1477–84.
5. Wang YC, Bleich SN, Gortmaker SL. Increasing caloric contribu-tion from sugar-sweetened beverages and 100% fruit juices amongU.S. children and adolescents, 1988 2004. Pediatrics 2008;121(6):E1604–E1614.
6. DietaryGuidelines forAmericans, 2010.WashingtonDC:U.S.Depart-ment of Agriculture and DHHS, 2010.
7. Chen LW, Appel LJ, Loria C, et al. Reduction in consumption ofsugar-sweetened beverages is associated with weight loss: the
PREMIER trial. Am J Clin Nutr 2009;89(5):1299–306.ctober 2012
8. Hu FB, Malik VS. Sugar-sweetened beverages and risk of obesityand type 2 diabetes: epidemiologic evidence. Physiol Behav2010;100(1):47–54.
9. Ludwig DS, Peterson KE, Gortmaker SL. Relation between consump-tion of sugar-sweetened drinks and childhood obesity: a prospective,observational analysis. Lancet 2001;357(9255):505–8.
0. Malik VS, Schulze MB, Hu FB. Intake of sugar-sweetened beverages andweight gain: a systematic review.AmJClinNutr 2006;84(2):274–88.
1. Striegel-Moore RH, Thompson D, Affenito SG, et al. Correlates of beverageintake in adolescent girls: The National Heart, Lung, and Blood InstituteGrowth andHealth Study. J Pediatr 2006;148(2):183–7.
2. Vartanian LR, Schwartz MB, Brownell KD. Effects of soft drink con-sumption on nutrition and health: a systematic review and meta-analysis. Am J Public Health 2007;97(4):667–75.
3. Woodward-Lopez G, Kao J, Ritchie L. To what extent have sweetenedbeverages contributed to the obesity epidemic? Public Health Nutr2011;14(3):499–509.
4. Malik VS, Popkin BM, Bray GA, Despres JP, Willett WC, Hu FB.Sugar-sweetened beverages and risk of metabolic syndrome and type 2diabetes. Diabetes Care 2010;33(11):2477–83.
5. Odegaard AO, Koh WP, Arakawa K, Yu MC, Pereira MA. Soft drinkand juice consumption and risk of physician-diagnosed incident type 2diabetes: the Singapore Chinese Health Study. Am J Epidemiol2010;171(6):701–8.
6. SchulzeMB,Manson JE, Ludwig DS, et al. Sugar-sweetened beverages,weight gain, and incidence of type 2 diabetes in young andmiddle-agedwomen. JAMA 2004;292(8):927–34.
7. Sturt J. Higher consumption of sugar-sweetened beverages is associ-ated with increased risk of developing type 2 diabetes or metabolicsyndrome. Evid Based Nurs 2011;14(2):35.
8. Gardener H, Rundek T,Markert M,Wright C, ElkindM, Sacco R. Dietsoft drink consumption is associated with an increased risk of vascularevents in the Northern Manhattan Study. J Gen Intern Med 2012;dOI:10.1007/s11606-011-1968-2.
9. Welsh JA, Sharma A, Abramson JL, Vaccarino V, Gillespie C, VosMB.Caloric sweetener consumption and dyslipidemia among U.S. adults.JAMA 2010;303(15):1490–7.
0. de Koning L, Malik VS, Kellogg MD, Rimm EB, Willett WC, Hu FB.Sweetened beverage consumption, incident coronary heart disease andbiomarkers of risk in men. Circulation 2012;125(14):1735–41.
1. Heller KE, Burt BA, Eklund SA. Sugared soda consumption and dentalcaries in the U.S. J Dent Res 2001;80(10):1949–53.
2. SohnW,Burt BA, SowersMR.Carbonated soft drinks anddental cariesin the primary dentition. J Dent Res 2006;85(3):262–6.
3. Kranz S, Smicklas-Wright H, Siega-Riz AM,Mitchell D. Adverse effectof high added sugar consumption on dietary intake in American pre-schoolers. J Pediatr 2005;146(1):105–11.
4. Lustig R, Schmidt L, Brindis C. Public health: the toxic truth aboutsugar. Nature 2012;482:27–9.
5. Johnson RK, Appel LJ, Brands M, et al. Dietary sugars intake andcardiovascular health: a scientifıc statement from the American HeartAssociation. Circulation 2009;120(11):1011–20.
6. The CDC guide to strategies for reducing the consumption of sugar-sweetened beverages. www.cdph.ca.gov/SiteCollectionDocuments/StratstoReduce_Sugar_Sweetened_Bevs.pdf.
7. Leftin J, Eslami E,Mark StrayerM. Trends in Supplemental Nutrition Assis-tance Program participation rates: fıscal year 2002 to fıscal year 2009. Math-ematica PolicyResearch,USDA, Food andNutrition Service, 2011.
8. U.S. Department of Agriculture, Food and Nutrition Service. SNAPmonthly data. 2012. www.fns.usda.gov/pd/34SNAPmonthly.htm.
9. U.S. Department of Agriculture, Food and Nutrition Service. Implica-tions of restricting the use of food stamp benefıts—summary. www.fns.usda.gov/ora/menu/Published/snap/FILES/ProgramOperations/
FSPFoodRestrictions.pdf.
418 Andreyeva et al / Am J Prev Med 2012;43(4):411–418
30. U.S. Department of Agriculture, Food and Nutrition Service. Supple-mental Nutrition Assistance Program: eligible food items. www.fns.usda.gov/snap/retailers/eligible.htm.
31. U.S. Department of Agriculture, Food and Nutrition Service. WIC pro-gram participation and costs. www.fns.usda.gov/pd/wisummary.htm.
32. Food and Nutrition Service, Offıce of Research and Analysis. WICeligibles and coverage—1994 to 2007: estimates of the population ofwomen, infants, and children eligible for WIC benefıts. 2009.
33. Guthrie J, Lin B-H,Ver PloegM, Frazao E. Can food stamps domore toimprove food choices? Econ Inform Bull 2007;29(1).
34. Fox M, Cole N. Nutrition and health characteristics of low-incomepopulations: Food Stamp Program participants and nonparticipants:E-FAN No. (04014-1) 2004.
35. Johnson FC, Hotchkiss DR, Mock NB, McCandless P, Karolak M. Theimpact of the AFDC and food stamp programs on child nutrition:empirical evidence from New Orleans. J Health Care Poor Under-served 1999;10(3):298–312.
36. Barnhill A. Impact and ethics of excluding sweetened beverages fromthe SNAP program. Am J Public Health 2011;101(11):2037–43.
37. Brownell KD, LudwigDS. The Supplemental NutritionAssistance Program,soda, andUSDApolicy:whobenefıts? JAMA2011;306(12):1370–1.
38. Cook J. Sugar-sweetened beverages in the Supplemental NutritionAssistance Program. JAMA 2011;306(24):2670; author reply.
39. Gladson. Nutrition database. 2011. www.gladson.com/SERVICES/NutritionDatabase/tabid/89/Default.aspx.
40. Beverage digest. April 21, 2011:3. Published by Beverage Digest Com-pany LLC. John Sicher, Editor and Publisher.
41. Andreyeva T, Chaloupka FJ, Brownell KD. Estimating the potential oftaxes on sugar-sweetened beverages to reduce consumption and gen-
erate reven42. Diet quality ofAmericans by food stampparticipation status: data fromthe National Health and Nutrition Examination Survey, 1999-2004.Alexandria VA: U.S. Department of Agriculture, 2008.
43. Brownell KD, Farley T, Willett WC, et al. The public health and eco-nomic benefıts of taxing sugar-sweetened beverages. N Engl J Med2009;361(16):1599–605.
44. State of the industry. Report 2012. Beverage World, Beverage World.May 15, 2012. p.p.27–32. www.nxtbook.com/nxtbooks/macfadden/bw0512/.
45. Harris J, Schwartz MB, Brownell KD, Javadizadeh J, Weinberg ME,Sarda V, et al. Sugary drink FACTS: evaluating sugary drink nutritionand marketing to youth. New Haven CT: Yale Rudd Center for FoodPolicy and Obesity, 2011.
46. Beverage Marketing Corporation. Carbonated soft drinks in the U.S.New York: Beverage Marketing Corporation, 2009.
47. U.S. Department of Agriculture, Food and Nutrition Service. SNAP:average monthly benefıt per household. 2012. www.fns.usda.gov/pd/19SNAPavg$HH.htm.
Appendix
Supplementary data
Supplementary data associated with this article can be found, inthe online version, at http://dx.doi.org/10.1016/j.amepre.2012.
ue. Prev Med 2011;52(6):413–6. 06.015
Did you know?According to the 2010 Journal Citation Report,
published by Thomson Reuters, the 2010 impactfactor for AJPM is 4.110, which ranks it in the
top 8% of PH and OEH journals, and in thetop 12% of GM and IM journals.
www.ajpmonline.org