glycogen accumulation underlies neurodegeneration and autophagy impairment in lafora disease
TRANSCRIPT

Journal: Human Molecular Genetics
Article DOI: ddu024
Article title: Glycogen accumulation underlies neurodegeneration and autophagyimpairment in Lafora disease
First Author: Jordi Duran
Corr. Author: Joan J. Guinovart
INSTRUCTIONS
1. Author groups: Please check that all names have been spelled correctly and appear in the correct order. Please also checkthat all initials are present. Please check that the author surnames (family name) have been correctly identified by a pinkbackground. If this is incorrect, please identify the full surname of the relevant authors. Occasionally, the distinctionbetween surnames and forenames can be ambiguous, and this is to ensure that the authors’ full surnames and forenamesare tagged correctly, for accurate indexing online. Please also check all author affiliations.
2. Figures: If applicable figures have been placed as close as possible to their first citation. Please check that they arecomplete and that the correct figure legend is present. Figures in the proof are low resolution versions that will be replacedwith high resolution versions when the journal is printed.
3. Missing elements: Please check that the text is complete and that all figures, tables and their legends are included.
4. Special characters: Please check that special characters, equations, dosages and units, if applicable, have beenreproduced accurately.
5. URLs: Please check that all web addresses cited in the text, footnotes and reference list are up-to-date, and please providea ‘last accessed’ date for each URL.
6. Funding: Please provide a Funding statement, detailing any funding received. Remember that any funding used whilecompleting this work should be highlighted in a separate Funding section. Please ensure that you use the full official nameof the funding body, and if your paper has received funding from any institution, such as NIH, please inform us of thegrant number to go into the funding section. We use the institution names to tag NIH-funded articles so they are depositedat PMC. If we already have this information, we will have tagged it and it will appear as coloured text in the fundingparagraph. Please check the information is correct.
7. Conflict of interest: All authors must make a formal statement indicating any potential conflict of interest that mightconstitute an embarrassment to any of the authors if it were not to be declared and were to emerge after publication. Suchconflicts might include, but are not limited to, shareholding in or receipt of a grant or consultancy fee from a companywhose product features in the submitted manuscript or which manufactures a competing product. The following statementhas been added to your proof: ‘Conflict of Interest: none declared’. If this is incorrect please supply the necessary text toidentify the conflict of interest.
8. Please note that there is a £350/$600 charge for each figure reproduced in colour. HMG does not offer colour online only,and if you do not ask for black and white images in your proofs the images will be in colour online and in print, and youwill be charged accordingly.

Journal: Human Molecular Genetics
Article DOI: ddu024
Article title: Glycogen accumulation underlies neurodegeneration and autophagy
impairment in Lafora disease
First Author: Jordi Duran
Corr. Author: Joan J. Guinovart
AUTHOR QUERIES - TO BE ANSWERED BY THE CORRESPONDING AUTHOR
The following queries have arisen during the typesetting of your manuscript. Please answer
these queries by marking the required corrections at the appropriate point in the text.
Query No. Nature of Query Author’s Response
Q1 Please provide acronym for ‘GFAP’.
Q2 Please update reference Pederson and Turnbull (2013).
Q3 Please note that we have relabelled this figure to ensure typographicalconsistency. Please check that the changes made are accurate.
Q4 Please note that there is a £350/$600 charge for each figure repro-duced in color in print. The print and online versions of thejournal must be identical—we therefore do not offer color onlineonly. If you have supplied color figures, please confirm that youaccept the charges. Alternatively, please let us know if you wouldprefer to have your figures reproduced in black and white at nocost. If this is the case, please ensure that the legend/text isworded to avoid using reference to color, or supply amendedimages. If we do not receive a response from you, we will assumethat figures supplied in color should be produced in color, and youwill be invoiced accordingly.
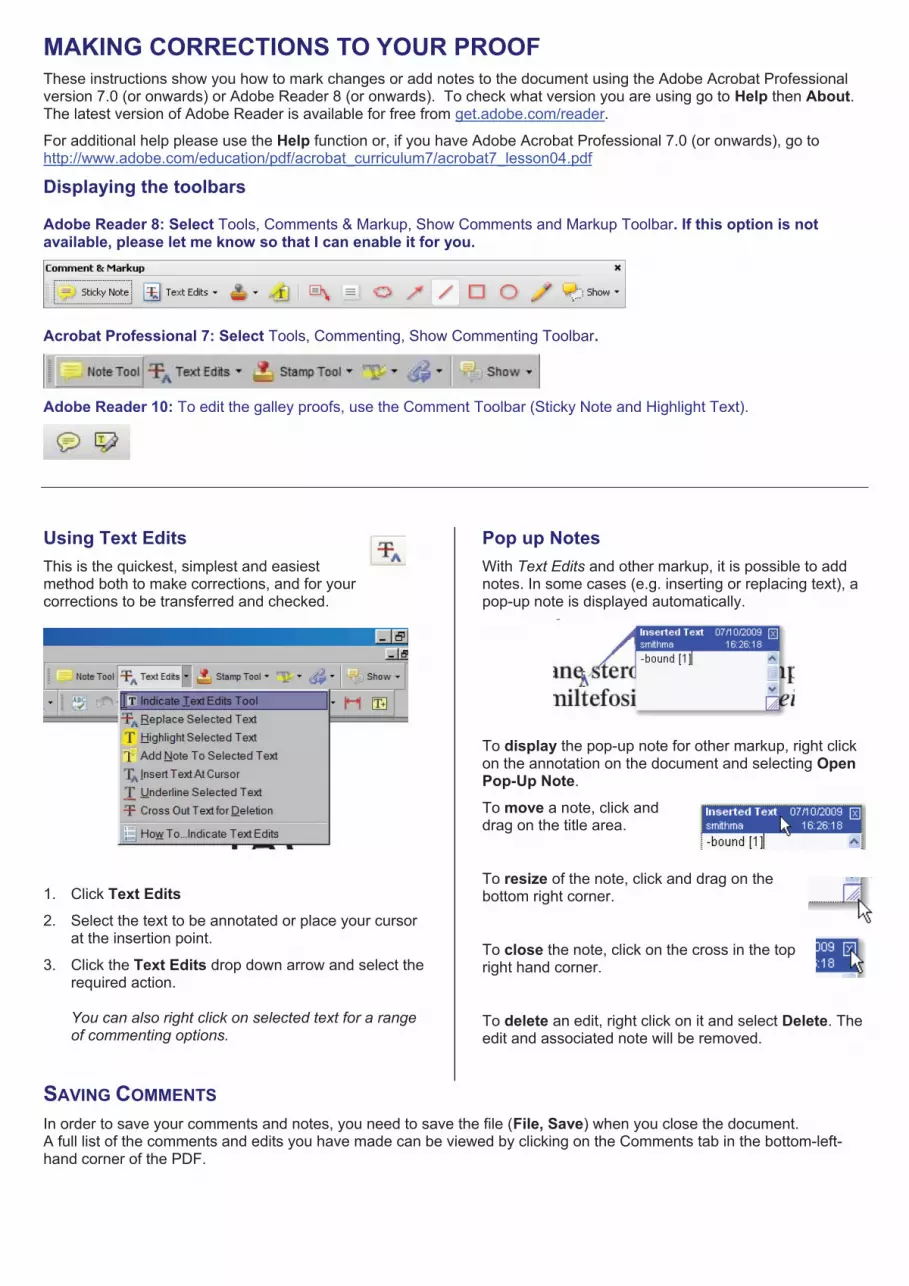
MAKING CORRECTIONS TO YOUR PROOF These instructions show you how to mark changes or add notes to the document using the Adobe Acrobat Professional version 7.0 (or onwards) or Adobe Reader 8 (or onwards). To check what version you are using go to Help then About.The latest version of Adobe Reader is available for free from get.adobe.com/reader.
For additional help please use the Help function or, if you have Adobe Acrobat Professional 7.0 (or onwards), go to http://www.adobe.com/education/pdf/acrobat_curriculum7/acrobat7_lesson04.pdf
Displaying the toolbars
Adobe Reader 8: Select Tools, Comments & Markup, Show Comments and Markup Toolbar. If this option is not available, please let me know so that I can enable it for you.
Acrobat Professional 7: Select Tools, Commenting, Show Commenting Toolbar.
Adobe Reader 10: To edit the galley proofs, use the Comment Toolbar (Sticky Note and Highlight Text).
Using Text EditsThis is the quickest, simplest and easiest method both to make corrections, and for your corrections to be transferred and checked.
1. Click Text Edits2. Select the text to be annotated or place your cursor
at the insertion point.
3. Click the Text Edits drop down arrow and select the required action.
You can also right click on selected text for a range of commenting options.
Pop up Notes With Text Edits and other markup, it is possible to add notes. In some cases (e.g. inserting or replacing text), a pop-up note is displayed automatically.
To display the pop-up note for other markup, right click on the annotation on the document and selecting Open Pop-Up Note.
To move a note, click and drag on the title area.
To resize of the note, click and drag on the bottom right corner.
To close the note, click on the cross in the top right hand corner.
To delete an edit, right click on it and select Delete. The edit and associated note will be removed.
SAVING COMMENTSIn order to save your comments and notes, you need to save the file (File, Save) when you close the document. A full list of the comments and edits you have made can be viewed by clicking on the Comments tab in the bottom-left-hand corner of the PDF.

Glycogen accumulation underliesneurodegeneration and autophagyimpairment in Lafora disease
Jordi Duran1,2, Agnes Gruart4,{, Mar Garcıa-Rocha1,{,
Jose M. Delgado-Garcıa4 and Joan J. Guinovart1,2,3,∗
1Institute for Research in Biomedicine (IRB Barcelona), Bacrcelona 08028, Spain 2Centro de Investigacion Biomedica en
Red de Diabetes y Enfermedades Metabolicas Asociadas (CIBERDEM), Barcelona 08017, Spain 3Department of
Biochemistry and Molecular Biology, University of Barcelona, Barcelona 08028, Spain 4Division of Neurosciences,
Pablo de Olavide University, Seville 41013, Spain
Received December 23, 2013; Revised January 16, 2014; Accepted January 19, 2014
Lafora disease is a fatal neurodegenerative condition characterized by the accumulation of abnormal glycogeninclusions known as Lafora bodies. It is an autosomal recessive disorder caused by mutations in either thelaforin or malin gene. To study whether glycogen is primarily responsible for the neurodegeneration in Laforadisease, we generated malin knockout mice with impaired (totally or partially) glycogen synthesis. These ani-mals did not show the increase in markers of neurodegeneration, the impairments in electrophysiological prop-erties of hippocampal synapses, nor the susceptibility to kainate-induced epilepsy seen in the malin knockoutmodel. Interestingly, the autophagy impairment that has been described in malin knockout animals was also res-cued in this double knockout model. Conversely, two other mouse models in which glycogen is over-accumu-lated in the brain independently of the lack of malin showed impairment in autophagy. Our findings revealthat glycogen accumulation accounts for the neurodegeneration and functional consequences seen in themalin knockout model, as well as the impaired autophagy. These results identify the regulation of glycogen syn-thesis as a key target for the treatment of Lafora disease.
INTRODUCTION
Glycogen is a branched polymer of glucose that constitutes thesole carbohydrate reserve in mammals. It is synthesized byglycogen synthase (GS), the only mammalian enzyme able topolymerize glucose. The most glycogenic tissues are the liverand the skeletal muscle, but essentially every other tissuestores some glycogen. Within the brain, glycogen is foundmainly in astrocytes (1), although neurons have the machineryfor its synthesis (2). However, glycogen synthesis in neuronshas to be tightly controlled, because an over-accumulation ofthis polysaccharide induces neuronal apoptosis (3).
Lafora disease (LD, OMIM #254780) is a fatal neurodegen-erative condition that starts as myoclonus epilepsy and proceedsto rapid cognitive deterioration and death. It is characterized bythe accumulation of aberrant glycogen, in the form of the
so-called Lafora bodies (LBs), in several cell types, includingneurons. LD is caused by mutations in two genes: NHLRC1,which encodes malin, an E3-ubiquitin ligase, and EPM2A,which encodes laforin, a serine-threonine phosphatase. Patientscarrying loss-of-function mutations in either of these two genesare indistinguishable. Both enzymes interact functionally topromote the degradation of GS and protein targeting to glycogen(PTG), a scaffolding molecule for protein phosphatase 1 (PP1),which promotes GS dephosphorylation and thus activation (2).
The causal role of glycogen accumulation in neurodegenera-tion in LD remains controversial, since the malin–laforincomplex has been described to have additional functions tothat of the regulation of glycogen synthesis. In this regard, ithas been proposed that the complex participates in the controlof autophagy, a process by which damaged components of the
Copy Edited by: S.H.Language used: UK/ize
†These authors equally contributed to this work.
∗To whom correspondence should be addressed at: Institute for Research in Biomedicine (IRB Barcelona), Parc Cientıfic de Barcelona, C/ Baldiri Reixac 10,08028 Barcelona, Spain. Tel: +34 934037111; Fax: +34 934037114; Email: [email protected]
# The Author 2014. Published by Oxford University Press. All rights reserved.For Permissions, please email: [email protected]
Human Molecular Genetics, 2014, Vol. 23, No. ? 1–10doi:10.1093/hmg/ddu024Advance Access published on xxx
5
10
15
20
25
30
35
40
45
50
55
60
65
70
75
80
85
90
95
100
105
110
115
120

cell are sequestered and degraded in the lysosome. In fact,knockouts (KO) of malin and laforin present autophagy impair-ment (4–6). Thus, this defect in autophagy could be at the basisof the neurodegeneration seen in LD, and therefore the accumu-lation of glycogen could be a mere epiphenomenon.
We had previously generated a malin KO mouse model(malinKO) that reproduces LD (7). To study whether the accumu-lation of glycogen is primarily responsible for the neurodegen-eration and autophagy seen in this mutant mouse (andtherefore, in LD), we have generated and studied malinKO
mice with impaired (totally or partially) glycogen synthesis. Inaddition, we have generated and examined several mousemodels in which we force glycogen over-accumulationwithout manipulating malin.
Our findings reveal that glycogen accumulation is responsiblefor the neurodegeneration and functional consequences seen inthe malinKO model, as well as for the impaired autophagy.These results identify the regulation of glycogen synthesis as akey target for the treatment of LD.
RESULTS
Generation of a malin and GS double KO model
LD is characterized by the accumulation of LBs in many tissuesand organs. However, the main manifestations of the disease areneurological. The isoform of GS that is expressed in the brain ismuscle glycogen synthase (MGS) (8, 9). In order to generate amalinKO that is unable to accumulate glycogen in the brain,and given that MGS constitutive KO shows high embryonic le-thality (10), we generated a double KO model in which malinis deleted in all tissues, while MGS is specifically deleted inthe brain (malinKO + MGSKO). For this purpose we took advan-tage of our MGS conditional KO model, which is based onCre-Lox technology (8). The ablation of MGS specifically inthe brain was achieved by expressing Cre Recombinase underthe control of a nestin promoter (11). This nestin–Cre showsgamete leakiness (12) and thus recombination in some casesalso took place in gametes, which resulted in the deletion ofthe conditional gene in these cells. As a result we also obtainedmalinKO animals that were heterozygous for MGS (MalinKO +MGShet).
All experiments were conducted with 11-month-old animals,the age at which we described the accumulation of LBs, neuro-degeneration and functional impairments in the malinKO
model (7).
Analysis of LB accumulation
As we previously described (7) malinKO mice accumulated LB inthe brain. As expected malinKO + MGSKO brains showed no LBaccumulation, since these animals cannot synthesize glycogen inthe brain (Fig. 1A). Interestingly, malinKO + MGShet brainsshowed much less accumulation of glycogen than the malinKO.We attribute this result to the fact that MGShet animals showedless MGS expression than the controls (Supplementary Material,Fig. S1), thus indicating that GYS1, the gene encoding MGS, ishaploinsufficient. Accordingly, glycogen content was less prom-inent in the malinKO + MGShet than in the malinKO brains, whilemalinKO + MGSKO brains were devoid of glycogen (Fig. 1B).
The accumulation of MGS and laforin, which is characteristicof malinKO models (7), was also reverted in the malinKO +MGSKO brains, and partially reverted in those of the malinKO +MGShet animals (Fig. 1C). As expected, total GS activity was notaltered in the malinKO animals (7), was halved in the malinKO +MGShet ones and was undetectable in malinKO + MGSKO group(Supplementary Material, Fig. S2).
Analysis of neurodegeneration
In the hippocampus, neuronal death/damage is accompanied bythe activation of astrocytes and microglia (13–15). Therefore, toanalyze whether the decrease in the accumulation of glycogenwas accompanied by a reversion in the neurodegenerativephenotype, we measured the extent of neurodegeneration inbrain slices by immunostaining for GFAP Q1, a marker of astro-cytes, and for Iba1, a marker of activated microglia. MalinKO
brains showed an increase in the staining for both markerswith respect to the controls, which was indicative of neurodegen-eration. However, the neurodegeneration was not present inmalinKO + MGSKO brains, since they showed a similar stainingto that of the controls. Furthermore, in the malinKO + MGShet
animals the increase in staining was more moderate than in themalinKO mice (Fig. 2), thus showing that a reduction of about50% of GS suffices to attenuate neurodegeneration.
Electrophysiological analyses
We next studied input/output curves and long-term potentiation(LTP) evoked at the hippocampal CA3–CA1 synapse of theanimal models, as we had previously shown that this parameteris altered in malinKO animals (7). However, since MGSKO
animals present impairment in the experimental induction ofLTP and other electrophysiological parameters (8), we excludedthe malinKO + MGSKO group from the analysis.
Animals were chronically implanted with stimulating electro-des in the hippocampal Schaffer collaterals and with a recordingelectrode in the ipsilateral pyramidal CA1 area (SupplementaryMaterial, Fig. S3). LTP was then analyzed in all the groups after ahigh-frequency stimulus (HFS). The LTP evoked in the controlgroup was similar to that previously reported in the same synapsein behaving mice (16). The malinKO animals presented a signifi-cantly larger LTP during the first recording session after HFSthan the control group, as previously described (7) (Fig. 3Aand B). Importantly, the malinKO + MGShet group presentedan LTP equivalent to that of the control group (Fig. 3C) indicat-ing that the alteration had been rescued in this model. Quantifi-cation of the records showed that malinKO animals presented alarger LTP than the other two groups (Fig. 3D).
Susceptibility to kainate-induced epilepsy
We then checked the susceptibility of the mouse models to asingle injection (8 mg/kg, i.p.) of kainic acid. We detected anoticeable difference in the percentage of animals presentingspontaneous seizures and in the intensity of the same. ThemalinKO animals presented the highest incidence of hippocam-pal seizures (84%), accompanied on occasions (two out of six)by myoclonus. The other groups showed seizures of verymuch lower amplitude and duration than those observed in the
2 Human Molecular Genetics, 2014, Vol. 23, No. ?
125
130
135
140
145
150
155
160
165
170
175
180
185
190
195
200
205
210
215
220
225
230
235
240

malinKO animals (control: 40%; malinKO + MGShet: 40%)(Fig. 4A), indicating again that impeding glycogen accumula-tion prevented neurological impairment.
Train stimulation of Schaffer collaterals evoked long-lastingafter-discharges in 100% of the malinKO mice. Again, the
other groups presented much milder seizure responses followingtrain stimulation of the CA3–CA1 synapse (control: 40%;malinKO + MGShet: 40%) (Fig. 4B).
On the whole, malinKO animals showed a large propensity togenerate hippocampal seizures, a feature that was not observed
Figure 1. Characterization of the accumulation of brain glycogen. LBs are absent in malinKO + MGSKO brains and greatly reduced in malinKO + MGShet brains.(A)Histological localization of LBs. Periodic acid-Schiff staining (PAS) is shown for the hippocampus and cerebellum of 11-month-old littermates from the differentgroups. Scale bar ¼ 100 mm. (B)Glycogen content. Q3Data are expressed as mean+S.E.M. ∗∗P , 0.01. ∗∗∗P , 0.001. ∗∗∗∗P , 0.0001 (n ¼ 4 animals per group).(C)Western blotting for MGS and laforin. Actin was used as loading control. Q4
Human Molecular Genetics, 2014, Vol. 23, No. ? 3
245
250
255
260
265
270
275
280
285
290
295
300
305
310
315
320
325
330
335
340
345
350
355
360

in malinKO + MGShet animals, indicating again that a reductionin glycogen accumulation prevented neurological impairment.
Analysis of autophagy
Glycogen accumulation in the malinKO model has been sug-gested to be caused by impaired autophagy (4). According tothis hypothesis, the lack of malin would lead to autophagy im-pairment, which would result in the accumulation of glycogen.However, it has also been proposed that autophagy impairmentin mouse models of LD is caused by the LBs themselves(6, 17). To address this controversy, we measured p62, a widelyused marker to study autophagic flux (18). Western blot revealedan increase in p62 in malinKO brains, indicating impaired autop-hagy (Fig. 5A). Remarkably, malinKO + MGSKO animals didnot show this increase. The impairment in autophagy was alsopartially rescued in the malinKO + MGShet brains. These obser-vations suggest that the autophagy impairment is a consequence
and not the cause of glycogen accumulation. Similar results wereobtained in western blots against NBR1, another marker ofautophagy flux (19, 20). These results were confirmed by immu-nostaining of p62 in the brains of the animal groups (Fig. 5B).
Analysis of autophagy in other models of glycogenaccumulation
To further analyze the causative effect of glycogen accumulationon impaired autophagy, we generated other mouse models inwhich glycogen is accumulated, independently of the lack ofmalin. In the first model, PTG is constitutively overexpressed inall tissues, including the brain (PTGOE). These animals showedthe accumulation of polyglucosan bodies in the brain, similar tobut less abundant than that observed in the malinKO group(Fig. 6). We also used our previously described model in whicha non-inactivatable form of MGS, 9A-MGS, is specifically over-expressed in the brain (9A-MGSOE). In this second model,
Figure 2. Analysis of neurodegeneration markers Iba1 and GFAP in brain slices. Neurodegeneration in the the malinKO + MGShet is greatly reduced when comparedwith the malinKO while it is absent in the malinKO + MGSKO. Hippocampal sections from the experimental groups were immunostained against Iba1 (a marker ofactivated microglia) or GFAP (a marker of astrocytes). Scale bar ¼ 100 mm.
4 Human Molecular Genetics, 2014, Vol. 23, No. ?
365
370
375
380
385
390
395
400
405
410
415
420
425
430
435
440
445
450
455
460
465
470
475
480

glycogen is dramatically over-accumulated in the brain (3).Western blot analyses showed accumulation of p62 in these twomodels (Fig. 7), indicating that the accumulation of glycogenper se can cause autophagy impairment.
Furthermore, we crossed the PTGOE with the malinKO strainsto generate a new model (malinKO + PTGOE) in which the accu-mulation of glycogen in the brain (Fig. 6), but also in the heartand skeletal muscle (Supplementary Material, Fig. S4), was dra-matically enhanced. The increase in p62 in the brains ofmalinKO + PTGOE mice was higher than that detected inmalinKO mice, in concordance with the higher accumulation ofglycogen in this organ (Fig. 7).
DISCUSSION
Our results settle the controversy regarding whether glycogen isthe direct cause of the neurodegeneration and functional impair-ments seen in LD. We show that glycogen accumulation is,indeed, the cause of both, since a malin-deficient mouse thatcannot synthesize glycogen in the brain did not show the increasein markers of neurodegeneration, the impairments in LTP of hip-pocampal synapses nor the susceptibility to kainate-induced epi-lepsy seen in the malinKO model. These results are inconcordance with our previous findings demonstrating thatglycogen accumulation per se drives neuronal death (3). Further-more, we also demonstrate that by only knocking out one of thealleles of the GYS1 gene the phenotype was partially rescued.This finding has important implications for the treatment ofLD, as it implies that partial inhibition of GS activity may be suf-ficient to prevent the progression of the disease.
This paper completes and extends two other recent reports ex-ploring the contribution of glycogen to the pathophysiology ofLD. In the first (21), it is demonstrated that the deletion ofPTG prevents the manifestation of LD in the malinKO model.These animals showed reduced glycogen accumulation;however, since PTG is a regulatory protein of PP1, which hasmany targets, it could not be excluded that the observed effectswere due to the dephosphorylation of other targets. The secondreport (22) shows that the double laforin-MGS KO animal isdevoid of LBs and also offers some hints that the neurologicalalterations inherent to LD are rescued. In the present study notonly do we show that the malin-MGS double KO is devoid ofLBs, but we have performed complete analyses that unequivo-cally demonstrate that neurodegeneration is rescued in theseanimals. Neurodegeneration markers are clearly decreased inmalinKO + MGShet and malinKO + MGSKO mice when com-pared with malinKO counterparts. With respect to the electro-physiological properties of hippocampal pyramidal synapsesin KO animals, of note is the observation of larger and longer-lasting LTP in these animals that is not present in the malinKO +MGShet group. Furthermore, in the kainate test malinKO micepresented a larger susceptibility to hippocampal seizures afterkainic acid administration, while the malinKO + MGShet groupshowed no difference from the control group. This observationthus indicates that the malinKO mice were rescued from theirneurological dysfunctions when GS was diminished.
Another relevant finding is that autophagy impairment isrescued in the malinKO + MGSKO animals, and partially rescuedin the malinKO + MGShet. These results demonstrate that the
Figure 3. Analyses of the LTP evoked at the hippocampal CA3–CA1 synapse.MalinKO animals show an increased LTP when compared with the othergroups. (A–C)The three graphs illustrate the time course of LTP evoked in theCA3–CA1 synapse (fEPSP mean+S.E.M.) following a HFS session forcontrol (A), malinKO (B) and malinKO + MGShet (C) groups. The HFS was pre-sented after 15 min of baseline recordings (dashed line). LTP evolution was fol-lowed for 5 days. The top of each graph illustrates representative examples of thefield excitatory postsynaptic potential (fEPSPs) collected at the times (B, 1–3)indicated in the bottom graphs. fEPSP slopes are given as a percentage offEPSP values collected during baseline recordings (100%). (D) Comparativeanalysis of LTP evoked in the three groups of mice. ∗∗∗P , 0.001. Experimentswere performed with 5–6 animals per group.
Human Molecular Genetics, 2014, Vol. 23, No. ? 5
485
490
495
500
505
510
515
520
525
530
535
540
545
550
555
560
565
570
575
580
585
590
595
600

accumulation of glycogen is not a consequence of autophagy im-pairment, but rather the cause of it, and thus provide an answerto whether autophagy precedes glycogen accumulation or viceversa. To reinforce this idea, we also show that other models ofglycogen accumulation in which malin levels have not been modi-fied (namely the 9A-MGSOE and the PTGOE models) showimpaired autophagy. A similar conclusion was reached by Puriet al. (6). These authors show that loss of laforin does not alterthe brain levels of key autophagy players, and thus conclude thatdefects in autophagic induction contribute only marginally to theincrease in p62 in this model. They propose that impairments atlater stages of the process, such as phagosome–lysosome fusion,are responsible for the increased levels of autophagic substratesdescribed in the LD mouse models. However, all together, wecannot exclude the possibility that the impaired autophagyinduced by the accumulation of glycogen is the cause of the neuro-degeneration in the malinKO animal. In fact, loss of autophagy hasbeen shown to cause neurodegeneration in mice (23, 24). Never-theless, we can conclude that without glycogen accumulationthere is no alteration of autophagy in LD.
Another interesting observation is that laforin does not accu-mulate in malinKO + MGSKO brains, in contrast to other modelsin which malin is unaltered but glycogen overaccumulates(PTGOE and 9A-MGSOE). According to these results, the
accumulation of laforin in the malinKO animal would resultfrom the accumulation of glycogen, and not because laforin isa direct target of malin, as previously suggested (25). The pres-ence of a carbohydrate binding domain in Laforin may explainthis behavior.
One of the most promising findings of this study is that themalinKO + MGShet animals are also largely freed from the neu-rodegeneration and functional impairments that characterize themalinKO mode, indicating that the impact of the disease could begreatly diminished by only partially decreasing the activity ofGS. These results might have implications for other diseases inwhich glycogen accumulates in the brain (i.e. adult polyglucosanbody disease, OMIM #263570). We therefore conclude that GSinhibition may provide a potential treatment for LD and otherglycogenoses.
MATERIALS AND METHODS
Chemicals and reagents
Antibodies against MGS (from Cell Signalling), actin (fromSigma), GFAP (from Dako), Iba1 (from Wako), p62 (fromProgen), NBR1 (from Abnova) and laforin (a gift from Dr San-tiago Rodrıguez de Cordoba) were used in this study.
Figure 4. Effects of kainic acid injection. MalinKO animals show a higher susceptibility to kainate-induced epilepsy than the other two models. (A) Representativehippocampal local field potential (LFP) recordings carried out 30 min after kainic acid injection (8 mg/kg, i.p.) and before train stimulation. The percentage (%) ofmice presenting seizures within each group is illustrated to the right of the LFP recordings. (B) Differential effects of train stimulation. Representative hippocampalLFP recordings after five 200 Hz, 100 ms trains of pulses at a rate of 1/s were applied to the CA3 area (St.) 1 h after kainic acid injection. The percentage (%) of mice ineach group presenting seizures following kainic acid administration and train stimulation of the CA3–CA1 synapse is illustrated in the histograms located to the rightof LTP recordings. Calibration in A is also for B. Experiments were performed with 5–6 animals per group.
6 Human Molecular Genetics, 2014, Vol. 23, No. ?
605
610
615
620
625
630
635
640
645
650
655
660
665
670
675
680
685
690
695
700
705
710
715
720

Generation of the animal models
For the generation of the malinKO + MGSKO model, malinKO
mice (7) were crossed with brain-specific MGSKO animals (8).
The descendants were genotyped for the three alleles involved(malin, MGS and Nestin Cre), and the suitable genotypes wereintercrossed to generate the double KO and the other experimen-tal groups. As the Nestin Cre shows gamete leakiness (12), we
Figure 5. Analysis of autophagy markers. Accumulation of p62 and NBR1 in the malinKO brains was dependent on the expression of MGS. (A) Brain extracts from11-month-old mice were analyzed by western blot with antibodies against p62 and NBR1. Actin was used as loading control. (B) Immunostaining with antibodiesagainst p62 of the hippocampus and cerebellum of 11-month-old littermates from the different groups. Hoechst (blue) was used for nuclear staining. Scalebar ¼ 100 mm.
Human Molecular Genetics, 2014, Vol. 23, No. ? 7
725
730
735
740
745
750
755
760
765
770
775
780
785
790
795
800
805
810
815
820
825
830
835
840

also obtained animals that were heterozygous for MGS(malinKO + MGShet). Animals overexpressing active MGS spe-cifically in the brain (9A-MGSOE) were generated as described in(3). Animals constitutively overexpressing PTG (PTGOE) weregenerated using a similar strategy. Briefly, the PTG cDNA wasplaced under the control of the ubiquitous CAG promoter. Thisexpression cassette was introduced into the Hprt locus in the Xchromosome by homologous recombination, thus avoiding theuncontrolled outcomes of random integration. This PTG-overexpressing model was mated with malinKO mice, and theresulting animals were crossed again with malinKO animals togenerate the malinKO + PTGOE model.
Animal studies
All procedures were approved by the Barcelona Science Park’sAnimal Experimentation Committee and were carried out in ac-cordance with the European Community Council Directive andNational Institutes of Health guidelines for the care and use of la-boratory animals. Mice were maintained on a 12/12 h light/dark
cycle under specific pathogen-free conditions and allowed freeaccess to a standard chow diet and water and in the Animal Re-search Center at the Barcelona Science Park. After weaning at 3weeks of age, tail clippings were taken for genotyping by qPCR(performed by Transnetyx).
Biochemical analysis
Mice were deeply anesthetized (sodium thiopental, 0.25 mg/g ofanimal) and decapitated with a guillotine. The brain was quicklyremoved and dropped in liquid nitrogen, this process taking,1 min. Whole brains were then pulverized in liquid nitrogen.Fractions of the powder were weighted and homogenated in 10volumes of ice-cold homogenization buffer containing 10 mM
Tris–HCl (pH 7), 150 mM KF, 15 mM EDTA, 15 mM
2-mercaptoethanol, 0.6 M sucrose, 25 nM okadaic acid, 1 mM
sodium orthovanadate, 10 mg/ml leupeptin, 10 mg/ml aprotinin,10 mg/ml pepstatin, 1 mM benzamidine and 1 mM phenylmetha-nesulfonyl fluoride. They were then homogenized (Polytron) at48C. Total homogenates were used for western blotting and thedetermination of GS activity. For glycogen measurements,frozen brain aliquots were boiled in 30% KOH for 15 min andglycogen was determined by an amyloglucosidase-based assayas described in (26). Due to the high turnover of glycogen post-mortem, part of the glycogen might have been degraded duringthe isolation process and thus the levels of glycogen of allgroups could be underestimated.
Histology
Animals were anesthetized and perfused transcardiacally withphosphate buffered saline (PBS) containing 4% of paraformal-dehyde (PF). Brains were removed, postfixed overnight withPBS 4% PF and either embedded in paraffin or cryoprotectedwith PBS 30% sucrose, and then frozen. To obtain sections of
Figure 6. Characterization of the accumulation of glycogen in PTGOE and malinKO + PTGOE brains. (A) Histological localization of LBs. PAS is shown for thehippocampus and cerebellum of 11-month-old littermates from PTGOE and malinKO + PTGOE brains. MalinKO is included as a reference. Scale bar ¼ 100 mm.(B) Glycogen content. Data are expressed as mean+S.E.M. ∗∗∗P , 0.001. ∗∗∗∗P , 0.0001 (n ¼ 4 animals per group).
Figure 7. Analysis of p62, MGS and laforin in glycogen-accumulating models.(A) Brain extracts from 11-month-old mice of the different groups were analyzedby western blot with antibodies against p62, MGS and laforin. Actin was used asloading control. The two images of each lane correspond to the same gel.(B) Brain extracts from 3-week-old 9A-MGSOE and littermate controls were ana-lyzed as in A.
8 Human Molecular Genetics, 2014, Vol. 23, No. ?
845
850
855
860
865
870
875
880
885
890
895
900
905
910
915
920
925
930
935
940
945
950
955
960

the frozen tissues, brains were sectioned coronally at 30 mm, dis-tributed in 10 series, and maintained at 2208C in PBS 30% gly-cerol 30% ethylene glycol for the free-floating processing. ForPAS staining, paraffin sections were cut at 5 mm. Images wereobtained with a Nikon Eclipse E800 microscope equippedwith an Olympus DP72 camera.
Immunohistochemistry
For the immunodetection of antigens, sections were blocked for2 h at RT with PBS containing 10% of normal goat serum (NGS)and 0.2% of gelatin. Primary antibodies were incubated over-night at 48C with PBS with 5% of NGS. Sequential incubationwith biotinylated secondary antibodies and streptavidin–HRPwas also performed in PBS 5% NGS. Antibodies were visualizedby reaction using 0.03% diaminobenzidine, 0.002% H2O2 and0.05% nickel ammonium sulfate. Sections were then dehydratedand mounted (Eukitt). For immunohistofluorescence, dye-labelled secondary antibodies and Hoechst 33342 were incu-bated for 2 h at RT in PBS-5% NGS and mounted in Mowiol.
Electrophysiological tests
Methodological information regarding the input/output curves,the electroencephalographic (EEG) recordings, the kainate in-jection and the recording of seizure activities can be found inSupporting Information Methods.
Statistical analysis
Data are expressed as mean+S.E.M. Statistical significancewas determined by the unpaired Student’s t-test using GraphPadPrism software (version 5; GraphPad Software, Inc.). Statisticalsignificance was assumed at P ≤ 0.05.
SUPPLEMENTARY MATERIAL
Supplementary Material is available at HMG online.
ACKNOWLEDGEMENTS
The authors thank Marıa Sanchez-Enciso, Natalia Plana, AnnaAdrover and Emma Veza for their technical assistance, IsabelSaez for critical review and Tanya Yates for correcting theEnglish version of the manuscript.
Conflict of Interest statement: None declared.
FUNDING
This work was supported by grants fromthe SpanishMinisterio deEconomıa y Competitividad (grant numbers BFU2011-29089,BFU2011-29286and BFU2011-30554) (to A.G., J.M.D.-G. andJ.J.G.); the Junta de Andalucıa (grant numbers BIO122, CVI2487 and P07-CVI-02686); the European Community’sSeventh Framework Program (FP7/2007-2013) under grantagreement n1 201714 (DEVANX) (to A.G. and J.M.D.-G.); theCIBER de Diabetes y Enfermedades Metabolicas Asociadas(ISCIII,MinisteriodeCienciae Innovacion); theHumanFrontiers
Science Program (RGP0027/2011) and the Fundacion RamonAreces (CIVP16A1862) (to J.J.G.).
REFERENCES
1. Cataldo, A.M. and Broadwell, R.D. (1986) Cytochemical identification ofcerebral glycogen and glucose-6-phosphatase activity under normal andexperimental conditions. II. Choroid plexus and ependymal epithelia,endothelia and pericytes. J. Neurocytol., 15, 511–524.
2. Vilchez, D., Ros, S., Cifuentes, D., Pujadas, L., Valles, J., Garcia-Fojeda, B.,Criado-Garcia, O., Fernandez-Sanchez, E., Medrano-Fernandez, I.,Dominguez, J. et al. (2007) Mechanism suppressing glycogen synthesis inneurons and its demise in progressive myoclonus epilepsy. Nat. Neurosci.,10, 1407–1413.
3. Duran, J., Tevy, M.F., Garcia-Rocha, M., Calbo, J., Milan, M. andGuinovart, J.J. (2012) Deleterious effects of neuronal accumulation ofglycogen in flies and mice. EMBO Mol. Med., 4, 719–729.
4. Criado, O., Aguado, C., Gayarre, J., Duran-Trio, L., Garcia-Cabrero, A.M.,Vernia, S., San Millan, B., Heredia, M., Roma-Mateo, C., Mouron, S. et al.(2012) Lafora bodies and neurological defects in malin-deficient micecorrelate with impaired autophagy. Hum. Mol. Genet., 21, 1521–1533.
5. Aguado, C., Sarkar, S., Korolchuk, V.I., Criado, O., Vernia, S., Boya, P.,Sanz, P., de Cordoba, S.R., Knecht, E. and Rubinsztein, D.C. (2010) Laforin,the most common protein mutated in Lafora disease, regulates autophagy.Hum. Mol. Genet., 19, 2867–2876.
6. Puri, R., Suzuki, T., Yamakawa, K. and Ganesh, S. (2012) Dysfunctions inendosomal–lysosomal and autophagy pathways underlie neuropathology ina mouse model for Lafora disease. Hum. Mol. Genet., 21, 175–184.
7. Valles-Ortega, J., Duran, J., Garcia-Rocha, M., Bosch, C., Saez, I., Pujadas,L., Serafin, A., Canas, X., Soriano, E., Delgado-Garcia, J.M. et al. (2011)Neurodegeneration and functional impairments associated with glycogensynthase accumulation in a mouse model of Lafora disease. EMBO Mol.Med., 3, 667–681.
8. Duran, J., Saez, I., Gruart, A., Guinovart, J.J. and Delgado-Garcia, J.M.(2013) Impairment in long-term memory formation and learning-dependentsynaptic plasticity in mice lacking glycogen synthase in the brain. J. Cereb.Blood Flow Metab., 33, 550–556.
9. Pellegri, G., Rossier, C., Magistretti, P.J. and Martin, J.L. (1996) Cloning,localization and induction of mouse brain glycogen synthase. Brain Res.Mol. Brain. Res., 38, 191–199.
10. Pederson, B.A., Chen, H., Schroeder, J.M., Shou, W., DePaoli-Roach, A.A.and Roach, P.J. (2004) Abnormal cardiac development in the absence ofheart glycogen. Mol. Cell. Biol., 24, 7179–7187.
11. Tronche, F., Kellendonk, C., Kretz, O., Gass, P., Anlag, K., Orban, P.C.,Bock, R., Klein, R. and Schutz, G. (1999) Disruption of the glucocorticoidreceptor gene in the nervous system results in reduced anxiety. Nat. Genet.,23, 99–103.
12. Knoepfler, P.S., Zhang, X.Y., Cheng, P.F., Gafken, P.R., McMahon, S.B.and Eisenman, R.N. (2006) Myc influences global chromatin structure.EMBO J., 25, 2723–2734.
13. Giulian, D. and Vaca, K. (1993) Inflammatory glia mediate delayed neuronaldamage after ischemia in the central nervous system. Stroke, 24, I84–I90.
14. Zhang, D., Hu, X., Qian, L., O’Callaghan, J.P. and Hong, J.S. (2010)Astrogliosis in CNS pathologies: is there a role for microglia? Mol.Neurobiol., 41, 232–241.
15. Lee, J.C., Ahn, J.H., Lee, D.H., Yan, B.C., Park, J.H., Kim, I.H., Cho, G.S.,Kim, Y.M., Lee, B., Park, C.W. et al. (2013) Neuronal damage and gliosis inthe somatosensory cortex induced by various durations of transient cerebralischemia in gerbils. Brain Res., 1510, 78–88.
16. Gruart, A., Munoz, M.D. and Delgado-Garcia, J.M. (2006) Involvement ofthe CA3–CA1 synapse in the acquisition of associative learning in behavingmice. J. Neurosci., 26, 1077–1087.
17. Puri, R. and Ganesh, S. (2012) Autophagy defects in Lafora disease: cause orconsequence? Autophagy, 8, 289–290.
18. Rue, L., Lopez-Soop, G., Gelpi, E., Martinez-Vicente, M., Alberch, J. andPerez-Navarro, E. (2013) Brain region- and age-dependent dysregulation ofp62 and NBR1 in a mouse model of Huntington’s disease. Neurobiol. Dis.,52, 219–228.
19. Kirkin, V., Lamark, T., Johansen, T. and Dikic, I. (2009) NBR1 cooperateswith p62 in selective autophagy of ubiquitinated targets. Autophagy, 5,732–733.
Human Molecular Genetics, 2014, Vol. 23, No. ? 9
965
970
975
980
985
990
995
1000
1005
1010
1015
1020
1025
1030
1035
1040
1045
1050
1055
1060
1065
1070
1075
1080

20. Lamark, T., Kirkin, V., Dikic, I. and Johansen, T. (2009) NBR1 and p62 ascargo receptors for selective autophagy of ubiquitinated targets. Cell Cycle,8, 1986–1990.
21. Turnbull, J., DePaoli-Roach, A.A., Zhao, X., Cortez, M.A., Pencea, N.,Tiberia, E., Piliguian, M., Roach, P.J., Wang, P., Ackerley, C.A. et al. (2011)PTG depletion removes Lafora bodies and rescues the fatal epilepsy ofLafora disease. PLoS Genet., 7, e1002037.
22. Pederson, B.A., Turnbull, J., Epp, J.R., Weaver, S.A., Zhao, X., Pencea, N.,Roach, P.J., Frankland, P., Ackerley, C.A. and Minassian, B.A. (2013)Inhibiting glycogen synthesis prevents lafora disease in a mouse model. Ann.Neurol., in press.Q2
23. Komatsu, M., Waguri, S., Chiba, T., Murata, S., Iwata, J., Tanida, I., Ueno,T., Koike, M., Uchiyama, Y., Kominami, E. et al. (2006) Loss of autophagy
in the central nervous system causes neurodegeneration in mice. Nature,441, 880–884.
24. Hara, T., Nakamura, K., Matsui, M., Yamamoto, A., Nakahara, Y.,Suzuki-Migishima, R., Yokoyama, M., Mishima, K., Saito, I., Okano, H.et al. (2006) Suppression of basal autophagy in neural cells causesneurodegenerative disease in mice. Nature, 441, 885–889.
25. DePaoli-Roach, A.A., Tagliabracci, V.S., Segvich, D.M., Meyer, C.M.,Irimia, J.M. and Roach, P.J. (2010) Genetic depletion of the malin E3ubiquitin ligase in mice leads to lafora bodies and the accumulation ofinsoluble laforin. J. Biol. Chem., 285, 25372–25381.
26. Chan, T.M. and Exton, J.H. (1976) A rapid method for the determination ofglycogen content and radioactivity in small quantities of tissue or isolatedhepatocytes. Anal. Biochem., 71, 96–105.
10 Human Molecular Genetics, 2014, Vol. 23, No. ?
1085
1090
1095
1100
1105
1110
1115
1120
1125
1130
1135
1140
1145
1150
1155
1160
1165
1170
1175
1180
1185
1190
1195
1200