global entrepreneurship monitor - pakistan report 2012
TRANSCRIPT

1 | P a g e
Global Entrepreneurship Monitor
PAKISTAN REPORT 2012
Authors: M. Shahid Qureshi, PhD, Co PI GEM Pakistan Team
Sarfraz A. Mian, PhD, Head & PI GEM Pakistan Team
Center for Entrepreneurial Development, IBA, Karachi, Pakistan

2 | P a g e
TABLE OF CONTENTS
Title Page No.
Foreword 5
Acknowledgements 6
Executive Summary 7
Chapter 1: Introduction and Background
1.1 Study Introduction 9
1.2 Overview of the GEM Program and Research Model 9
1.3 Entrepreneurship in Pakistan: Challenges and Opportunities 16
Chapter 2: Findings of GEM Pakistan 2012
2.1 Overview of the Research Results 19
2.2 Entrepreneurial Attitudes 21
2.3 Entrepreneurship Activity 29
2.4 Entrepreneurship Aspirations 47
2.5 The Environment for Entrepreneurship in 2012 52
Chapter 3: Conclusions and Implications 59
GEM Pakistan Team
Sarfraz A. Mian, PhD, Advisor, Center for Entrepreneurial Development IBA, Karachi 61
M. Shahid Qureshi, PhD, Program Director Center for Entrepreneurial Development IBA, Karachi 62
Appendices
Appendix 1: Glossary of GEM Measures and Terminology 63
Appendix 2: Charts describing changes in various entrepreneurial measures from 2010 to
2012
66
Appendix 3: GEM Pakistan 2012 Sampling and Weighting Methodology 79
Appendix 4: AMAN Center for Entrepreneurial Development (AMAN-CED) 81
References and Footnotes 84

3 | P a g e
LIST OF FIGURES Figure 1: The Entrepreneurship Process and GEM Operational Definitions 12
Figure 2: Characteristics of Economic Groups and Key Development Focus 13
Figure 3: The GEM Model 16
Figure 4: Sector Structure Total early-stage Entrepreneurial Activity (TEA) and Established Business
Activity
20
Figure 5: TEA rates of GEM 2011 participating countries 31
Figure 6: Total Early-Stage Entrepreneurial Activity Rates and Per Capita GDP 2012 31
Fig 7A and 7B: Composite indicators on entrepreneurship institutions 53
Figure 8A to 8C: Mean Scores Awarded by National Experts to Entrepreneurial Framework
Conditions in Pakistan as compared to innovation driven economies
54-55
Figure 9A to 9C: Mean Scores Awarded by National Experts to Entrepreneurial Framework
Conditions in Pakistan as compared to efficiency driven economies
55-56
Figure 10A to 10C: Mean Scores Awarded by National Experts to Entrepreneurial Framework
Conditions in Pakistan as compared to factor driven economies
57-58
Figure 11: Entrepreneurial attitudes in Pakistan (%age ALL respondents aged 18 -64 expressing an
opinion and agreeing with the statement)
66
Figure: 12 Entrepreneurial attitudes in Pakistan (%age MALE respondents aged 18 -64 expressing an
opinion and agreeing with the statement)
66
Figure 13: Entrepreneurial attitudes in Pakistan (%age FEMALE respondents aged 18 -64 expressing
an opinion and agreeing with the statement)
67
Figure 14: Perceptions of entrepreneurship among non-entrepreneurially active working age
population towards entrepreneurship in various provinces of Pakistan (Know someone personally
who started a business in the past 2 years.)
67
Figure 15: Perceptions of entrepreneurship among non-entrepreneurially active working age
population towards entrepreneurship in various provinces of Pakistan (Good start up opportunities in
the next six months)
68
Figure 16: Perceptions of entrepreneurship among non-entrepreneurially active working age
population towards entrepreneurship in various provinces of Pakistan (Have the knowledge, skill and
experience required to start a new business)
68
Figure 17: Perceptions of entrepreneurship among non-entrepreneurially active working age
population towards entrepreneurship in various provinces of Pakistan (Fear of failure Preventing
from starting a business)
69
Figure 18: Perceptions of entrepreneurship in various cities of Pakistan (Know someone personally
who started a business in the past 2 years.)
69
Figure 19: Perceptions of entrepreneurship in various cities of Pakistan (Good start up opportunities
in the next six months)
70
Figure 20: Perceptions of entrepreneurship in various cities of Pakistan (Have the knowledge, skill
and experience required to start a new business)
70
Figure 21: Perceptions of entrepreneurship in various cities of Pakistan (Fear of failure preventing
from starting a business)
71
Figure 22: Proportion of respondents by stage of entrepreneurial activity in Pakistan 71
Figure 23: Different measures of entrepreneurial activity in various regions of Pakistan (Expects to
start a business in the next 3 years (future))
72
Figure 24: Different measures of entrepreneurial activity in various regions of Pakistan (Nascent
Entrepreneurial Activity Rate (Actively involved in start-up effort, owner, no wages yet))
72
Figure 25: Different measures of entrepreneurial activity in various regions of Pakistan (New
Business Owner-Manager Rate (Manages a business that is up to 42 months old))
73

4 | P a g e
Figure 26: Different measures of entrepreneurial activity in various regions of Pakistan (Nascent +
New Business Owner Manager Rate)
73
Figure 27: Different measures of entrepreneurial activity in various regions of Pakistan (Established
Business Owners (>42 months))
74
Figure 28: Different measures of entrepreneurial activity in various regions of Pakistan (Business
Closure rate (Discontinued a business in the past 12 months))
74
Figure 29: Total early stage entrepreneurial activity in Pakistan 75
Figure 30: Early stage entrepreneurial activity in Pakistan, Male 75
Figure 31: Early stage entrepreneurial activity in Pakistan, Female 76
Figure 32: Total early stage Entrepreneurial Activity in Pakistan Regions based on opportunity
entrepreneurship, Male
76
Figure 33: Total early stage Entrepreneurial Activity in Pakistan Regions based on opportunity
entrepreneurship, Female
77
Figure 34: Total early stage Entrepreneurial Activity in Pakistan Regions based on necessity
entrepreneurship, Male
77
Figure 35: Total early stage Entrepreneurial Activity in Pakistan Regions based on necessity
entrepreneurship, Female
78
LIST OF TABLES Table 1-- GEM 2012 Participating Countries Classified by Economy and Geography 14
Table 2a-- Some general characteristics and entrepreneurship indicators of Pakistan 19
Table 2b-- Comparison of various entrepreneurial characteristics and framework conditions of
Pakistan with peer nations, 2012
20
Table 3--- Attitudes towards Entrepreneurship in participating GEM Countries in 2012 22
Table 4--- Entrepreneurial Attitude in Pakistan: Respondents expressing the opinion and agreeing
with the statement
25
Table 5A --- Perceptions of entrepreneurship among non-entrepreneurially active working age
population towards entrepreneurship in various provinces of Pakistan
27
Table 5B --- Perceptions of entrepreneurship among non-entrepreneurially active working age
population towards entrepreneurship in various provinces of Pakistan
27
Table 6A--- Perceptions of entrepreneurship in various cities of Pakistan 28
Table 6B --- Perceptions of entrepreneurship in various cities of Pakistan 28
Table 7 --- Total early stage Entrepreneurial Activity in GEM participating countries in 2012 29
Table 8--- Measurement of entrepreneurial activity in GEM participating countries. 33
Table 9 --- Proportion of respondents by stage of entrepreneurial activity in Pakistan 36
Table 10--- Opportunity and Necessity Entrepreneurship in GEM Participating countries 37
Table 11-- Total Early stage entrepreneurial activity by gender in Participating GEM Countries 39
Table 12-- Established business ownership by gender 42
Table 13-- Different measures of entrepreneurial activity in various regions of Pakistan 45
Table 14-- Total Early Stage Entrepreneurial Activity in Pakistani Regions in 2012 46
Table 15A - Male and Female Total early stage Entrepreneurial Activity in Pakistani Regions, 2012 46
Table 15B - Opportunity and Necessity Entrepreneurial Activity in Pakistani Regions, 2012 46
Table 16-- Male and Female Total early stage Entrepreneurial Activity in Pakistan Regions, 2012
based on opportunity entrepreneurship
47
Table 17-- Male and Female Total early stage Entrepreneurial Activity in Pakistan Regions, 2012
based on necessity entrepreneurship
47
Table 18-- Measures of entrepreneurial aspiration in GEM participating countries, 2012 49

5 | P a g e
Foreword
Pakistan's population in 2012 was over 179 million, making it the world's sixth most-populous country, behind Brazil and ahead of Nigeria. During 1950–2011, Pakistan's urban population expanded over sevenfold, while the total population increased by over fourfold. The structure of the population pyramid has changed a lot in the past decade as the base of the pyramid has become very heavy and about 80 million people are in the age bracket of 15 to 40 years.
With the intended shift towards creating an entrepreneurial economy and increased calls for public-private partnerships to achieve this goal, the role of the government, the private sector and the academic institutions is to create an ecosystem which favours and creates incentives for promoting entrepreneurial activity. Government’s role has to go beyond the traditional economic rational of relying on the existence of market failures and distortions, but rather, intervening so that these market failures and distortions do not negatively impact on an emerging entrepreneurial society. The academic institutions have to play the role of educating the youth and developing an entrepreneurial mindset.
The Pakistani nation has a God gifted ability to be entrepreneurial. In the national economy Small and Medium Enterprises (SMEs) constitute nearly 90% of all private firms; they employ 80% of the non-agricultural labor force; and their share in the annual GDP is 40%. The industrial clusters of Gujranwala and Sialkot are famous for their entrepreneurial spirit and contribution to the national economy. The textile based SMEs are the back bone of the economy. I consider entrepreneurship a panacea for a developing country such as Pakistan, which has one of the highest population growth rate particularly of youth population. It is high time that all the stakeholders join hands in promoting entrepreneurship.
IBA AMA-CED has been created to play a leading role in promoting entrepreneurship in the country. IBA, along with partner universities from all over the country, has embarked on a journey to promote entrepreneurship through various programs including:
- Agriculture entrepreneurship
- Technology entrepreneurship
- Women entrepreneurship
- Family businesses - Youth entrepreneurship
- All Pakistan business plan competition
IBA is also working with other local and global partners including KCCI, the World Bank, British Council, Babson College, SP Jain Business School, and Coventry University to develop an ecosystem to promote entrepreneurship in the country.
This GEM study by IBA Karachi carried out jointly with IBA Sukkur, UET Peshawar, NUST business school, and GIFT University has helped us to understand the state of entrepreneurship in the country and will greatly aid Pakistan in benchmarking with its peer nations.
I congratulate the GEM Pakistan Team on the completion of this third GEM research cycle. I am confident that the research findings will help our policy makers, researchers and educators in Pakistan to create awareness and enhance learning about entrepreneurship by improving support for the development of new and innovative business ventures.
Dr. Ishrat Husain Dean and Director IBA, Karachi

6 | P a g e
ACKNOWLEDGEMENTS While, we are celebrating the completion of our third consecutive cycle of GEM research, we are cognizant of the commitment of the Center for Entrepreneurial Development at IBA to promote entrepreneurship in the nation by sustaining this project of global significance. This year, under the guidance of Dr. Ishrat Husain, Dean and Director IBA, we expanded our partnerships to include other institutions of higher education in Pakistan: IBA Sukkur, NUST Islamabad, UET Peshawar, and GIFT Gujranwala. On behalf of the GEM Pakistan team, my special thanks go to Syed Ali Akbar Rizvi, Director Centre for Entrepreneurship, IBA Sukkur; Mr. Akhtar Ali Qureshi, General Manager Centre for Innovation & Entrepreneurship (CIE), NUST Islamabad; Mr. Asif Shah, Director Incubator UET Peshawar; and Mr. Nadeem Mustafa, Head of Business School, GIFT University Gujranwala. On the ground, the professionalism of our survey vendor and cooperation of the interviewees and survey respondents have been crucial for the success of this study. Therefore, I would like to thank all those national experts and adult survey respondents who spared their valuable time for interviews and answered our questions. Our vendor team from OASIS Insights played a key role in our APS data collection — their professionalism and timely completion of the survey is appreciated. For support in project supervision, fundraising, and report writing, I would like to take the opportunity to recognize my IBA-CED colleagues: Dr Qureshi, the CED Program Director supervised the Adult Population Survey, was responsible for data analysis and co-authored this report; Mr. Zafar Siddiqui of the IBA Alumni Office helped in providing fund raising leads; Mr. Moid Sultan and Mr. Jehanzeb of IBA’s Accounts and Finance Department were always available for help; Mr. Waleed Wasti and Mr. Shaheer Kazmi provided the necessary research assistance; they made the work easier and I thank them all for their contributions. Finally, I would like to express my appreciation to the Global GEM Project Management Team including Dr. Mike Herrington, Dr. Niels Bosma, Ms. Marcia Cole, Mr. Chris Aylett, Ms. Yana Litovsky, Dr. Alicia Coduras, Dr. Jeff Seaman and Ms. Ingrid Blake; their continued encouragement and support of our GEM Pakistan project. Sincerely, Sarfraz A. Mian, PhD Head and PI, GEM Pakistan Team

7 | P a g e
Executive Summary
1. In 2012, the Global Entrepreneurship Monitor (GEM) research consortium measured entrepreneurial activity of adult individuals in 69 member economies, making it the world’s most authoritative comparative study of entrepreneurial activity in the general population. Over, two thousand individuals aged 18-64 participated in the GEM Pakistan Survey in 2012.
2. This national study compares global entrepreneurship monitor (GEM) measures of various entrepreneurial characteristics (attitudes, aspirations, and activities) in Pakistan and other participating countries. It summarizes these entrepreneurial characteristics within various regions and cities of Pakistan. It also reports expert views on the environment for entrepreneurship in Pakistan and compares these with other GEM nations.
3. The number of people in Pakistan who have a positive attitude towards entrepreneurship is less than the average of its factor driven peer countries. However, it is higher than the average figures of innovation driven economies. Moreover, the male population has a more positive attitude towards entrepreneurship in Pakistan as compared to the female population.
4. Within Pakistan, the residents of Sindh and Khyber Pakhtoon Khuwa (KPK) have a relatively higher level of favorable attitude towards entrepreneurship and perceive more opportunities in the near future. Among the major cities, the residents of Quetta, Islamabad, and Hyderabad have a more positive perception of entrepreneurial opportunities in the future and perceive to have the highest level of skill set, knowledge and experience to start an entrepreneurial venture as compared to other major cities of Pakistan.
5. Total Early Stage Entrepreneurial Activity or TEA rate (the sum of the nascent entrepreneurship rate and the new business owner-manager rate) in Pakistan was 11.57%. This is significantly lower than the average TEA rates for the factor-driven economies (23.68%) and also lower than efficiency-driven economies (13.11%). However this is greater than the average TEA rate of Innovation-driven economies (7.09 %).
6. The TEA rate is classified into two types, i.e. opportunity based TEA rate and necessity based TEA rate. About 24% (of the 11.57%) of Pakistanis were involved in opportunity based early stage entrepreneurial activity (the rest 76% were need based). This opportunity based portion of the TEA rate for Pakistan is considerably lower than the average opportunity based TEA rate of factor- driven (42%) and efficiency- driven countries (46%).
7. The male TEA rate in Pakistan is more than seventeen times that of the female TEA rate. This gender gap in Pakistan is one of the highest in the world when compared with the rest of the world including its other factor-driven peer nations.
8. The Established Business Ownership (EBO) rate in Pakistan was 3.78 %. This is significantly lower than the average EBO rates for Pakistan’s peer factor driven

8 | P a g e
economies (11.43 %), as well as efficiency driven (7.79 %) and innovation driven (6.67 %) economies
9. The male Established Business Ownership (EBO) rate in Pakistan is more than 3 times that of female EBO rate. This shows that the gender gap in EBO is also very high when compared to other factor, efficiency and innovation driven countries.
10. When surveyed, 8.29% of the adult population in Pakistan was trying to start a business (nascent entrepreneurs), which was lower than the average of factor-driven economy nations (11.85%); it is 15.42% in Ghana, 14.67% in Peru and 14.68% in Chile.
11. According to the survey, Pakistani population’s new business ownership rate (owner managers of a business that was between 3 to 42 months old) was 3.42%. This rate is considerably less than the average of factor- driven countries (12.75 %), efficiency- driven countries (5.57%) but a bit higher than that of innovation driven- economies rate (3.04%)
12. Entrepreneurial activity in various Pakistani regions is found to be as follows: KPK has the highest rate of active involvement in the startup effort and at the same time has a high business closure rate. Sindh and KPK have the highest rate of established business owners (5.7%) and Sindh and Punjab have the highest rate of expectations to start a business in the next three years.
13. In Pakistan early stage entrepreneurs and new-business managers have relatively high aspirations to grow as compared to most other GEM participating countries. The proportion of early stage Pakistani entrepreneurs reporting new product/market combinations and with at least one fourth foreign customers is 22.96%, which is above the average of factor- driven countries.
14. In Pakistan 31.24% of the total working age population (including those who are entrepreneurially active) expressed opinion that the fear of failure would prevent them from starting a business. The fear of failure in the Pakistani population is higher than the average of the factor driven economies.
15. Experts on entrepreneurship in Pakistan generally rated their government support programs significantly lower than those of the innovation and efficiency driven countries. Cultural and social norms were also reported as more negative for entrepreneurship in Pakistan than in the other factor and efficiency driven countries.
9 | P a g e
Chapter 1: Introduction and Background 1.1 Study Introduction
After our second GEM Pakistan 2011 study, published in early 2013, this report provides the results of
Pakistan’s third national survey of various entrepreneurial characteristics studied under the Global
Entrepreneurship Monitor (GEM) program. This grass-roots research program is aimed at better
comprehending the dynamics of national/local entrepreneurship context by measuring attitudes,
activities and aspirations of adult individuals participating in different phases of entrepreneurship. There
is an ever increasing evidence of the use of GEM data and its research findings in policy making at all
levels of government and academia in order to promote entrepreneurship in member nations.
The GEM project is implemented through the collaborative efforts of participating national teams and is
coordinated by the Global GEM consortium. According to the research design, each GEM national team
conducts its adult population survey (APS) along with a national expert survey (NES) and the data are
harmonized allowing national comparisons of the key entrepreneurial dimensions. The last GEM 2012
Global Report summarizing this world-wide data gathering and research activity of 69 national teams
including Pakistan was released earlier in January 2013 (see www.gemconsortium.org).
Pakistan joined GEM in 2010 under the sponsorship of IBA Karachi and undertook its first GEM study in
the summer of 2010. The second study was conducted in the late summer of 2011 and the third in the
late summer of 2012. Every effort was made to ensure data quality and reliability of results, for which
necessary weights were calculated (see Appendix 2) to address representativeness of the sample along
gender and urban-rural lines. This report focuses on Pakistan specific findings providing necessary
analyses and benchmarking with the peer factor-driven and other (efficiency and innovation driven)
more advanced nations. The work is intended to create public awareness, promote research and aid
policymakers of Pakistan in identifying and helping to address the underlying issues impeding
entrepreneurial growth by formulating enabling policies and support programs to promote
entrepreneurship in the nation.
1.2 Overview of the GEM Program and Research Model1 Founded in late 1990s2, GEM program is administered by the Global Entrepreneurship Research Association (GERA), a not-for-profit body of academic researchers from prominent business schools across the globe. Over the last 14 years of its inception the program has experienced phenomenal growth to include over 80 countries most of whom conduct their national GEM surveys every year. GEM focuses on three main objectives: • To measure differences in entrepreneurial attitudes, activity and aspirations among nations. • To uncover factors determining the nature and level of national entrepreneurial activity. • To identify policy implications for enhancing entrepreneurship in an economy.

10 | P a g e
GEM is based on the following premises. First, an economy’s prosperity is highly dependent on a dynamic entrepreneurship sector. This is true across all stages of development. Yet the nature of this activity can vary in character and impact. Necessity-driven entrepreneurship, particularly in less developed regions or those experiencing job losses, can help an economy benefit from self-employment initiatives when there are fewer work options available. More developed economies, on the other hand, can leverage their wealth and innovation capacity, yet they also offer more employment options to attract those that might otherwise become entrepreneurs. In order to maintain their entrepreneurial dynamism they need to instill more opportunity-based motives. Second, an economy’s entrepreneurial capacity requires individuals with the ability and motivation to start businesses, and positive societal perceptions about entrepreneurship. Entrepreneurship should include participation from all groups in society, including women, a range of age groups and education levels and disadvantaged populations. Finally, high-growth entrepreneurship is a key contributor to new employment in an economy, and national competitiveness depends on innovative and cross-border entrepreneurial ventures. GEM Measures At the time of GEM’s founding, traditional analyses of economic growth and competitiveness had, for the most part, neglected the role played by new and small firms in national economies, due, in some measure, to the lack of good data on this sector. This information, when available, tended to be present in only those countries at the most advanced stages of economic development. Existing measures, such as self-employment rates, did not reflect the dynamic scope of entrepreneurship. And while most governments have long maintained records of formal business registrations, it wasn’t until GEM emerged that an accurate picture could be drawn of the entrepreneurially conscious people, and how many of them are actually involved in documented and undocumented businesses in different corners of the world. The main guiding purpose of GEM is to measure individual involvement in venture creation. This differentiates GEM from other data sets, most of which record firm-level data. A second aim of this research is to promote entrepreneurship as a process comprising different phases, from intending to start, to just starting, to running new or established enterprises and even discontinuing these.

11 | P a g e
Figure 1 summarizes the entrepreneurship process and GEM’s operational definitions. For more information on the GEM methodology, visit the website at www.gemconsortium.org. The most common operational variables and their definitions are outlined in Appendix 1.

12 | P a g e
Figure 1 — The Entrepreneurship Process and GEM Operational Definitions
Through the wealth of measures GEM tracks, we can understand which types of people are (and are not) participating in entrepreneurship. We capture both those formally registering their businesses and those running informal ones. These unregistered businesses, in fact, can compose as much as 80% of economic activity in developing countries.3 People launch businesses for a variety of reasons. They may be led into entrepreneurship out of necessity: the pursuit of self-employment when there are no better options for work. In contrast, their efforts may be powered by the desire to maintain or improve their income, or to increase their independence. GEM therefore assesses the motives of entrepreneurs. GEM additionally measures aspirations. These aspirations may be evident in innovative products or services or the pursuit of customers beyond national borders. They may also include high- growth ambitions, thereby contributing more markedly to new employment in their economies. Recognizing that entrepreneurs are driven not only by their own perceptions about starting a business, but the attitudes of those around them, GEM considers the attitudes representing the climate for entrepreneurship in a society. Entrepreneurs need to be willing to take risks and have positive beliefs about the availability of opportunities around them, their ability to start businesses and the value of doing so. At the same time, they need customers who are willing to buy from them, vendors willing to supply them and families and investors ready to support their efforts. Even positive societal perceptions about entrepreneurship may indirectly stimulate this activity. Economic Development Level and Entrepreneurship GEM’s harmonized dataset enables comparisons of entrepreneurship activity around the globe, and within and across geographic regions. This report additionally examines groups of economies at similar

13 | P a g e
development levels. Following a typology used by the World Economic Forum, GEM classifies the 69 GEM participants as “factor-driven,” “efficiency-driven” or “innovation-driven” economies4. Figure 2 illustrates the characteristics of these economic groups and the key development focus at each level. As an economy develops, productivity increases and, consequently, so does per capita income. This is often accompanied by the migration of labor across different economic sectors. For example, labor may move from agricultural and extractive sectors to manufacturing, and then eventually to services5. In their early stages of development, economies typically have a higher proportion of necessity-driven activities. Here, the demand for jobs in high-productivity sectors outpaces supply. As a result, many people must create their own source of income. With further development comes the growth of productive sectors. This increases employment capacity but leads to gradual declines in the level of necessity-driven entrepreneurship. At the same time, improvements in wealth and infrastructure stimulate opportunity-based businesses, shifting the nature of entrepreneurship activity. These ventures are more likely associated with greater aspirations for growth, innovation and internationalization. They rely, however, on the economic and financial institutions created during the developing phases. To the extent these institutions are able to accommodate and support opportunity-seeking entrepreneurship activity; innovative entrepreneurial firms may emerge as significant drivers of economic growth and wealth creation6. Figure 2 — Characteristics of Economic Groups and Key Development Focus
GEM additionally considers geographic factors, grouping countries into six geographic regions: sub-Saharan Africa, the Middle East and North Africa (MENA), Latin America and the Caribbean, European Union, Asia Pacific and South Asia, the United States, and the Non-European Union. With both economic and geographic groupings, we can compare economies across similar development levels and geographic locations. The GEM grouping of the 69 participating countries are shown in Table 1.

14 | P a g e
Table 1 — GEM 2012 Participating Countries Classified by Economy and Geography
Factor-Driven Efficiency-Driven Innovation-Driven
Sub-Saharan
Africa
Angola, Botswana,
Ethiopia, Ghana, Malawi,
Nigeria, Uganda, Zambia
Namibia, South Africa
Middle East &
North Africa
Algeria, Egypt, Iran,
Palestine
Tunisia Israel
Latin America
and Caribbean
Argentina, Barbados, Brazil,
Chile, Colombia, Costa
Rica, Ecuador, El Salvador,
Mexico, Panama, Peru,
Trinidad & Tobago,
Uruguay
Non-European
Union
Bosnia and Herzegovina,
Croatia, Macedonia, Russia,
Turkey
Norway, Switzerland
Asia Pacific &
South Asia
Pakistan China, Malaysia, Thailand Japan, Republic of Korea,
Singapore, Taiwan
European
Union
Estonia, Hungary, Latvia,
Lithuania, Poland, Romania
Austria, Belgium, Denmark,
Finland, France, Germany,
Greece, Ireland, Italy,
Netherlands, Portugal,
Slovakia, Slovenia, Spain,
Sweden, United Kingdom
United States United States
The GEM Model Figure 3 illustrates the GEM model, which shows, first, the relationship between the social, cultural and political context and three sets of framework conditions. These framework conditions are modeled as impacting the attitudes of a population toward entrepreneurship, and the activity and aspirations of entrepreneurs. In turn, entrepreneurship activity, as well as the growth of established firms in the primary economy influences economic growth.
15 | P a g e
As Figure 2 shows, the key imperative in factor-driven economies lies in building basic requirements such as primary education, healthcare, infrastructure and so forth. Later-stage factors like entrepreneurial finance and government entrepreneurship programs are unlikely to have substantial impact if, for instance, entrepreneurs don’t have good roads to transport goods or a sufficiently educated labor force from which they can recruit employees. In other words, investments in entrepreneurship-specific framework conditions may be less effective in enabling business creation if they are made at the expense of basic requirements. Entrepreneurs with high aspirations fare better in countries with a stable economic and political climate and well-developed institutions. This, in fact, may account for the activities of certain groups of immigrants into wealthier economies. At the same time, economic progress begets scale economies. Large firms are more efficient from a national perspective and, for many individuals, a more attractive employment alternative to necessity-based entrepreneurship. To replace the migration of necessity entrepreneurs toward employment in large companies, efficiency-driven economies must attract more opportunity-based entrepreneurship. The second set of framework conditions represents efficiency enhancers. These are directed toward ensuring that markets function properly. The nurturing of economies of scale can, in fact, be complemented by the emergence of growth- and technology-oriented entrepreneurs, expanding the scope of employment in a society. Advanced economies have a relatively sophisticated foundation of basic requirements and efficiency enhancers. While these factors are essential in sustaining necessity-based entrepreneurship, they may be insufficient drivers of opportunity-based behavior. Here, knowledge is prevalent but labor is expensive. Entrepreneurship-specific framework conditions become the levers that drive dynamic, innovation-oriented behavior, while the foundation of basic requirements and efficiency enhancers needs to be maintained. Figure 3 — The GEM Model

16 | P a g e
1.3 Entrepreneurship in Pakistan: Challenges and Opportunities
Historically, entrepreneurship, in the sense of its modern definition7 has remained very limited in Pakistan. The development of small-scale industrial sector measured through new firm entry rate, if taken as proxy to reflect entrepreneurial activity in Pakistan, shows the average annual firm entry rate in Pakistan lower than most regional averages around the world8. There is, however, a note of caution here that a large number of new firm entries remain unregistered in Pakistan’s significant small scale informal business sector. The Small and Medium Enterprise Development Authority (SMEDA) estimates that in Pakistan, small and medium enterprises (SMEs) with less than 100 employees constitute nearly 90% of all 3.5 million private firms that `employ 80% of the non-agricultural labor force; and their share in the annual GDP is 40%9. Their firm structure is dominated by sole proprietorship and most are family run businesses with no culture of taking it to the pubic (IPOs). A review of the past 6 decades of Pakistan’s development priorities reveals that entrepreneurship has never been the focus of economic development planners. All these years of government efforts clearly show a bias towards large scale industry and neglect of the small. The historical evidence clearly indicates that, in the context of Pakistan, when one talks about industrialization, for most people it implies large plants and factories run by machines and employing a large number of workers. It definitely comes as a surprise to people when they discover the reality; that it is actually the informal sector and the small scale business sector
17 | P a g e
that dominates the industrial landscape of Pakistan, which have been continuously ignored in the national economic policies.
As stated above, generally, the development of small-scale business sector reflected the characteristics of entrepreneurship, however, this sector had largely grown up as an informal sector. The informal small scale business sector has dominated employment in the construction, wholesale, retail trading, hotels, transport, communications and storage industries in urban areas. Some of the issues faced by the small and medium size firms located in different SME clusters in Pakistan are reported as follows10:
• Small businesses face a complex legal, tax and administrative environment in Pakistan
therefore most firms avoided the economic obligations associated with the registered
status.
• Entrepreneurs generally are not tuned to conducting R&D as they believed that the
high cost of production and narrow margins did not give them the leverage to go for
R&D. Major rationale behind the high cost included high utility prices and minimum
wage fixed by government. Another reason of lack of focus on R&D was the nature of
industry, which was skill based (imitation) rather than the knowledge based.
Nevertheless, research was being undertaken to explore new markets based on
personal visits of entrepreneurs either privately or in some cases in groups sent out by
the government organizations to promote trade.
• The small businessman, by and large, expected from the government to provide incentives and subsidies, given the rent-seeking culture that has now been established; businessmen, instead of focusing on their own innovation, expected help from the government most of the times.
• Businesses remained largely owner-operated by individuals/families and resistant to developing professional management, as the business growth was traditionally dependent on policy favors rather than on professional management and strategy. Moreover, in clusters, there was no expertise for providing practical advice on key areas such as project feasibility, business operations, brand establishment and marketing. Given the lack of market depth, input from research institutions, universities and other forms of specialized knowledge, knowledge spillovers remained narrow and imitative.
• Scarcity of skilled labor was considered a major constraint for the development of entrepreneurship. Like all less resourceful firms, the SMEs typically had skill deficiencies and were unable to compete with larger firms’ better-qualified manpower. Inter-firm transfer of skilled labor was a usual phenomenon directly influenced by relative wage levels. In this game, the larger firms had advantage over SMEs. Unfortunately, the

18 | P a g e
technical skills were not adequately rewarded by the employers. Even the society never respected people having blue-collared jobs.
• Over and above, lack of trust among the business community was a serious hindrance to growth, impeded cooperation among entrepreneurs to develop the existing or explore the new markets. The entrepreneurs in their attempts to hide business information used to maintain mailing address and banks in other cities. Another serious complaint was that the labor trained by one employer, either moved to another employer or opened up his own firm. Businesses remained owner-operated owing to lack of trust on professional employees within the business community as an employee who gained knowledge easily replicated with stolen business information.
• Small businessmen had little recourse to bank financing. They believed that the banks lent only to the big borrowers for non-commercial and political reasons. The biggest stumbling block was the State Bank of Pakistan’s Prudential Regulations and documentation requirements, which most SMEs were unable to meet. Cut-throat competition, willing to go for the solo flight, lack of attitude towards delegation, lack of corporate culture, lack of knowledge/proper homework and lack of relevant business development systems provision in the industry had knocked down the SMEs in Pakistan.
However, in recent years, with the increasing realization of entrepreneurship and innovation as engines of economic growth, there had been a rise in interest in Pakistan to review the country’s economic policies by placing emphasis on entrepreneurial growth11. Given the nation’s socio-economic challenges and perceived untapped potential, a more heightened realization has resulted in the adoption of a New Growth Framework by the National Economic Council in May 201112. Barring the forces of status-quo and vested interests of the elite groups which make up the distributional coalition and is content on their rent seeking behavior in the form of subsidies, protectionism and tax evasion, entrepreneurship offers an attractive opportunity driven merit-based option which is known to serve as equalizer in socio-economic development13. More recently, to operationalize this New Growth Framework, some studies have proposed the use of Expeditionary Economics 14to focus on the nuts-and-bolts implementation of these new entrepreneurially-led economic growth principles in Pakistan’s post-conflict settings. It has been noted that while poor infrastructure and weak governance are significant barriers, the nation has the making of a large and dynamic entrepreneurial class with the potential of facilitating country’s rise into the next levels of national economic groups15. Despite the challenges, the two key potential areas of opportunity where entrepreneurship can make significant contributions are: First, more than 2/3rd of Pakistan’s population is concentrated below the age of 30, which will change the age structure of working age population over the next few years. Majority of the youth entering the labor force over the next two decades will have little education and skills catering to market demand. Moreover, incessant shocks to the economy such as energy crisis, international commodity price shocks,

19 | P a g e
security issues, and flash floods of 2010/11 have left little resilience in the economy and absorption capacity for growing youth labor force. This required a rethinking about the sources of growth in Pakistan’s context and entrepreneurship has the greatest potential to fill this gap. Second, in the area of indigenous technology transfer, various researchers have underscored the need for establishing industry-university linkages. According to some estimates16 in eight years, between 1999 and 2007, Pakistan had increased R&D investment by 600% which stood at 0.7% of GDP or USD 1.176 billion. At the same time number of researchers in Pakistan has grown from 187 per million in 2005 to 310 in 2007. Though Pakistan suffered significant economic challenges in the following years17, there is still considerable R&D capacity in the nation’s universities and institutions, particularly in the science and technology focused programs18. This new capacity can be converted into new innovative entrepreneurship opportunities, economic growth and wealth creation by linking it with better trained young entrepreneurial minds. The above scenario leads us to believe that the country’s underdeveloped small business and entrepreneurial sector which is facing numerous economic challenges, can benefit from the available manpower resource opportunity if mobilized through an entrepreneurially oriented innovative development approach envisaged in the new entrepreneurially-led economic growth approach19, which is also the ultimate aim envisaged by the GEM project.
Chapter 2: Findings of GEM Pakistan 2012 2.1 Overview of the Research Results In this cycle Pakistan shows a mix of increase and decrease in many entrepreneurship activity
indicators. The people of Pakistan perceive more opportunities in the surrounding environment and
perceive to have more capabilities than many of its peer countries. The fear of failure is 31% which is a
bit higher than the last year but still lower than average of the factor driven countries. The TEA rate is
11.57, higher than that of last year. Nascent entrepreneurship rate has gone up from 7.5 to 8.29.
Necessity driven TEA rate has gone up from 4.3 to 6.1 indicating that people are being forced into
necessity entrepreneurship. There is a rise in new business manager rate from 1.7 to 3.42 and a decline
in established business owner rate from 4.1 to 3.78.
Table 2a: Some general characteristics and entrepreneurship indicators of Pakistan
General Characteristics* GEM 2012 Entrepreneurship Indicators* Population (x 1,000): 179,160
Perceived Opportunities 46
Area (x 1,000 km2): 771 Perceived Capabilities 49
Density (persons / km2): 232.4
Fear of Failure 31
GDP Per Capita (PPP): 2,891
Nascent Entrepreneurship Rate: 8.29
Global Happiness Index: 5 (81/156) Owner-Managers in New Businesses Rate: 3.42

20 | P a g e
Human Development Index: 0.5 (146/187) Owner-Managers in Established Businesses Rate: 3.78
Total early-stage Entrepreneurial Activity Rate (TEA): 11.57
Global Competitiveness Index: 3.41 (133/148) - Necessity-Driven TEA Rate: 6.1
Global Innovation Index: 23.33
(137/142)
- Medium-High Job Expectation Rate: (MHEA) 1.4
Doing Business Index: (107/185) Entrepreneurial Employee Activity Rate (EEA): 0.1
GEDI Index: 0.14 (104/118) - Private Sector EEA Rate (PEEA): 0.0
Classification Phase of Economic Development: Factor-Driven Economies
Classification Entrepreneurship Profile (Ch. 4): High non-ambitious entrepreneurship (SLEA) only * For definitions and sources of the indicators, see the Annex
Figure 4: Sector Structure Total early-stage Entrepreneurial Activity (TEA) and Established Business
Activity (EB)
Most of the early stage TEA in Pakistan is in the consumer oriented services followed by transforming and extractive sector. The early stage established business activity is the highest in the transforming sector followed by consumer and the extractive sector.
Table 2b: Comparison of various entrepreneurial characteristics and framework conditions of Pakistan with its Peer Nations, 2012
Pakistan Algeria Iran Turkey Malaysia
Entrepreneurial Characteristic
TEA Rate 11.57 8.75 10.79 12.22 6.99
Nascent Entrepreneurship rate
8.29 1.62 4.47 7.25 2.79
New Business Ownership rate 3.42 7.25 6.48 5.36 4.20
Necessity driven Entrepreneurship
52.95% 29.96% 41.96% 30.88% 13.32%
8
34
5
53
Extractive sector
Transforming sector
Business orientedservices
Consumer orientedservices
13
46 5
36
Extractive sector
Transforming sector
Business orientedservices
Consumer orientedservices

21 | P a g e
Female to male TEA ratio 1 to 17.6 1 to 2.2 1 to 2.7 1 to 2.6 1 to 1.3
Perceived capability to carry out Entrepreneurship
49% 54% 54% 49% 31%
Fear of failure 31% 35% 41% 30% 36%
Entrepreneurial Intentions 25% 21% 23% 15% 13%
Entrepreneurship as a good career choice
66% 79% 60% 67% 46%
2.2 Entrepreneurial attitudes According to GEM, entrepreneurial attitudes convey the feelings of a population group towards entrepreneurship in general. People who recognize the importance of entrepreneurship as it relates to the ability of individuals to deploy their competencies in order to exploit opportunities given a favorable or not so favorable environment tend to formulate certain views about entrepreneurship which are manifested in their attitudes towards this phenomenon. For this purpose GEM employs specific questions in the Adult Population Survey (APS) that measure these attitudes through various indicators. More importantly, the difference in entrepreneurial activity rates between countries can be explained by differences in attitudes of the population towards entrepreneurship. Table 3 provides the attitudinal estimates for all participating countries in the adult working age (18-64) population who are not entrepreneurially active20. The percentage of the responding adults in each participating country including Pakistan, who expressed an opinion and agreed with the four key indicators, is listed in the Table. The countries are divided into three groups i.e., innovation driven, efficiency driven and factor driven economies with the following salient findings.
In the innovation driven countries, the proportion of the non-entrepreneurial working age population who are aware of new entrepreneurial startups is the highest in Slovakia and Finland. The highest perception of good startup opportunities in the next six months is in Sweden and Norway. The skill, knowledge and experience perception is highest in the US followed by Slovenia. The people of Slovenia and Netherlands have the lowest fear of failure.
In the efficiency driven countries, the proportion of the non-entrepreneurial working age population who are aware of new entrepreneurial startups is the highest in Namibia and then China, who perceive good startup opportunities in the next six months are in Namibia and Colombia and the skill, knowledge and experience perception is the highest in Trinidad & Tobago. The Tunisian people have the lowest fear of failure.
In the factor driven countries, , the proportion of the non-entrepreneurial working age population who are aware of new entrepreneurial startups is highest in Zambia and Nigeria and the perception of good startup opportunities in the next six months and the
22 | P a g e
skill, knowledge and experience perception is the highest in Nigeria and Uganda. The Malawi population has the lowest fear of failure.
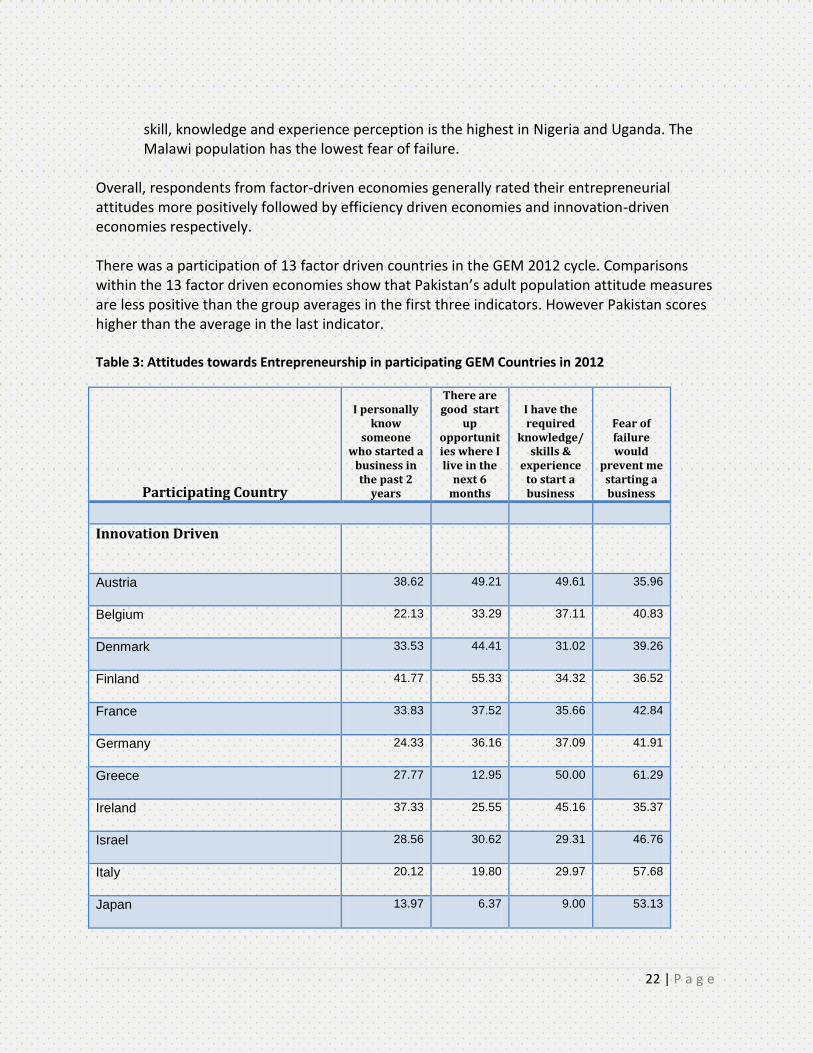
Overall, respondents from factor-driven economies generally rated their entrepreneurial attitudes more positively followed by efficiency driven economies and innovation-driven economies respectively. There was a participation of 13 factor driven countries in the GEM 2012 cycle. Comparisons within the 13 factor driven economies show that Pakistan’s adult population attitude measures are less positive than the group averages in the first three indicators. However Pakistan scores higher than the average in the last indicator. Table 3: Attitudes towards Entrepreneurship in participating GEM Countries in 2012
Participating Country
I personally know
someone who started a
business in the past 2
years
There are good start
up opportunities where I live in the
next 6 months
I have the required
knowledge/ skills &
experience to start a business
Fear of failure would
prevent me starting a business
Innovation Driven
Austria 38.62 49.21 49.61 35.96
Belgium 22.13 33.29 37.11 40.83
Denmark 33.53 44.41 31.02 39.26
Finland 41.77 55.33 34.32 36.52
France 33.83 37.52 35.66 42.84
Germany 24.33 36.16 37.09 41.91
Greece 27.77 12.95 50.00 61.29
Ireland 37.33 25.55 45.16 35.37
Israel 28.56 30.62 29.31 46.76
Italy 20.12 19.80 29.97 57.68
Japan 13.97 6.37 9.00 53.13

23 | P a g e
Korea 28.67 12.52 26.93 43.01
Netherlands 34.99 34.40 42.30 30.45
Norway 35.17 64.43 34.37 39.37
Portugal 25.29 16.19 46.80 42.30
Singapore 18.74 22.51 26.58 41.63
Slovakia 42.49 17.84 49.73 38.32
Slovenia 40.08 19.62 51.32 27.28
Spain 31.10 13.90 50.38 41.76
Sweden 41.04 66.48 36.99 32.61
Switzerland 32.34 35.67 37.34 32.29
Taiwan 31.31 38.55 26.38 37.60
United Kingdom 30.07 32.82 47.13 36.01
United States 28.95 43.49 55.88 32.32
Average 30.93 32.07 38.35 40.27
Efficiency-driven
Argentina 33.9 50.08 63.46 27.02
Barbados 31.49 47.01 69.86 17.27
Bosnia and Herzegovina 29.63 19.57 49.11 26.94
Brazil 33.63 52.40 53.94 31.05
Chile 41.85 64.91 59.91 27.99
China 52.42 32.24 37.60 35.82
Colombia 29.99 71.80 56.57 32.04
Costa Rica 40.51 47.14 63.26 35.26
Croatia 23.48 17.15 44.06 36.04
Ecuador 34.24 58.55 72.10 32.85

24 | P a g e
El Salvador 39.75 42.74 58.51 41.72
Estonia 37.51 45.24 43.19 34.49
Hungary 27.59 10.95 39.83 34.28
Latvia 32.34 33.05 43.56 36.74
Lithuania 32.91 29.99 39.83 35.78
Macedonia 31.34 30.79 55.11 39.43
Malaysia 45.99 35.69 30.82 36.34
Mexico 41.72 44.99 62.34 25.66
Namibia 66.4 75.22 74.00 35.15
Panama 30.8 38.48 43.34 16.67
Peru 45.94 56.99 65.47 30.36
Poland 40.95 20.42 53.89 43.45
Romania 30.36 36.73 38.34 40.87
Russia 33.75 20.08 23.50 46.51
South Africa 30.15 35.47 39.50 30.56
Thailand 34.74 44.61 45.97 50.06
Trinidad & Tobago 37.34 59.23 76.06 16.65
Tunisia 34.6 32.55 62.18 14.88
Turkey 34.06 39.88 49.44 30.38
Uruguay 35.57 51.03 57.81 27.18
Average 36.50 41.50 52.42 32.32
Factor-driven
Algeria 60.04 45.67 54.10 35.44
Angola 67.42 66.17 72.05 37.94
Botswana 48.27 66.70 70.59 24.79

25 | P a g e
Egypt 30.61 53.72 58.66 32.96
Ethiopia 56.05 64.89 69.10 32.66
Ghana 55.71 79.29 86.26 18.23
Iran 39.95 39.17 54.15 41.42
Malawi 74.82 74.29 84.53 12.37
Nigeria 76.72 82.19 87.93 20.96
Pakistan 37.9 46.48 48.74 31.24
Palestine 39.68 46.14 59.37 40.19
Uganda 68.8 80.69 87.69 15.25
Zambia 77.54 77.87 83.75 16.68
Average 56.42 63.33 70.53 27.70
Entrepreneurial Attitudes in Pakistan Table 4 shows estimates of the prevalence of attitudes towards entrepreneurship in Pakistan among the non-entrepreneurially active working age population by gender. Those successful at starting a new business have a high level of status and respect in society and most people consider starting a new business a good career choice. The Table shows that males tend to have more positive entrepreneurial attitude than females. The gap is particularly marked between the variables as follows. The male respondents are about three times more aware of someone who has started a business in the last two years, a proxy measure of networking with entrepreneurial individuals. The male respondents perceive a higher number of startup opportunities and feel better equipped with the knowledge, skill and experience to start a new business. The female respondents have less fear of failure to start a business however male respondents are more aware of stories about people starting successful new businesses in the media. Table 4: Entrepreneurial Attitude in Pakistan: Respondents expressing the opinion and agreeing with the statement (2012)
Statement All Male Female
I personally know someone who started a
business in the past 2 years 36.9% 53.6% 19.9%

26 | P a g e
There will be good startup opportunities
where I live in the next six months 45.5% 55.7% 34.9%
I have the knowledge, skill and experience
to start a new business 49.2% 61.2% 36.3%
Fear of failure would prevent me from
starting a business 29.2% 34.9% 22.9%
Most people in my country would prefer that
everyone had a similar standard of living 72.3% 71.5% 73.1%
Most people consider starting a new
business a desirable career choice. 66.9% 70.1% 63.6%
Those successful at starting a new business
have a high level of status and respect in
society 68.0% 65.0% 71.2%
You will often see stories about people
starting successful businesses in the media 50.7% 53.8% 47.2%
Entrepreneurial attitudes of the non-entrepreneurially active working age population in various provinces of Pakistan are presented in table 5. The key findings are as follows.
The people of Sindh and Baluchistan were more likely to agree with the statement “I personally know someone who has started a business in the last two years” which is a proxy for networking with entrepreneurs.
The people of Sindh and KPK had the highest proportion of the non-entrepreneurially active population reporting that there were good start-up opportunities in their local area in the next six months.
The people of Sindh and KPK were the most likely to agree with statement that “I have the knowledge, skill and experience required to start a new business”.
The people of Baluchistan had the lowest fear of failure to start a business. Table 5B reports that the people living in Sindh prefer an egalitarian standard of living for all followed by KPK. KPK residents gave the highest ratings to starting a new business a desirable career choice. The people of Sindh and Punjab have the highest perception that those successful at starting a new business have a high level of status and respect in society. Moreover Punjab has the highest number of people reporting that they have seen stories about people starting successful businesses in the media.

27 | P a g e
Table 5 A: Perceptions of entrepreneurship among non-entrepreneurially active working age population towards entrepreneurship in various provinces of Pakistan
Province
I personally know someone who
started a business in the
past 2 years
There will be good startup
opportunities where I live in the next six months
I have the knowledge,
skill and experience to
start a new business
Fear of failure would prevent me
from starting a business
Sindh 48.8% 57.6% 55.5% 18.6%
Punjab 32.7% 39.9% 47.1% 33.3%
Baluchistan 32.2% 39.5% 35.3% 32.5%
Khyber Pakhtoon Khowa 32.1% 47.3% 52.9% 33.9%
Table 5 B: Perceptions of entrepreneurship among non-entrepreneurially active working age population towards entrepreneurship in various provinces of Pakistan
Province Most people in my country
would prefer that everyone had a similar standard of
living
Most people consider starting a new
business a desirable career choice.
Those successful at starting a new business have a high level of
status and respect in
society
You will often see stories
about people starting
successful businesses in
the media
Sindh 86.7% 70.4% 70.3% 46.7%
Punjab 68.1% 67.1% 68.8% 55.3% Baluchistan 50.0% 42.4% 61.3% 29.2%
Khyber Pakhtoon Khowa 71.0% 71.6% 61.7% 47.1%
The self-reporting of attitudes of the non-entrepreneurially active working age population towards entrepreneurship in various cities of Pakistan is presented in table 6A.
The residents of Hyderabad and Karachi were more likely to agree with the item “I personally know someone who has started a business in the last two years than respondents in any other region.
The residents of Quetta, Islamabad, Hyderabad and Karachi had the highest proportion of the non-entrepreneurially active population reporting that there was good start up opportunities in their local areas in the next six months.
The people of Peshawar, Lahore and Hyderabad were the most likely to agree with statement that “I have the knowledge, skill and experience required to start a new business”.
28 | P a g e
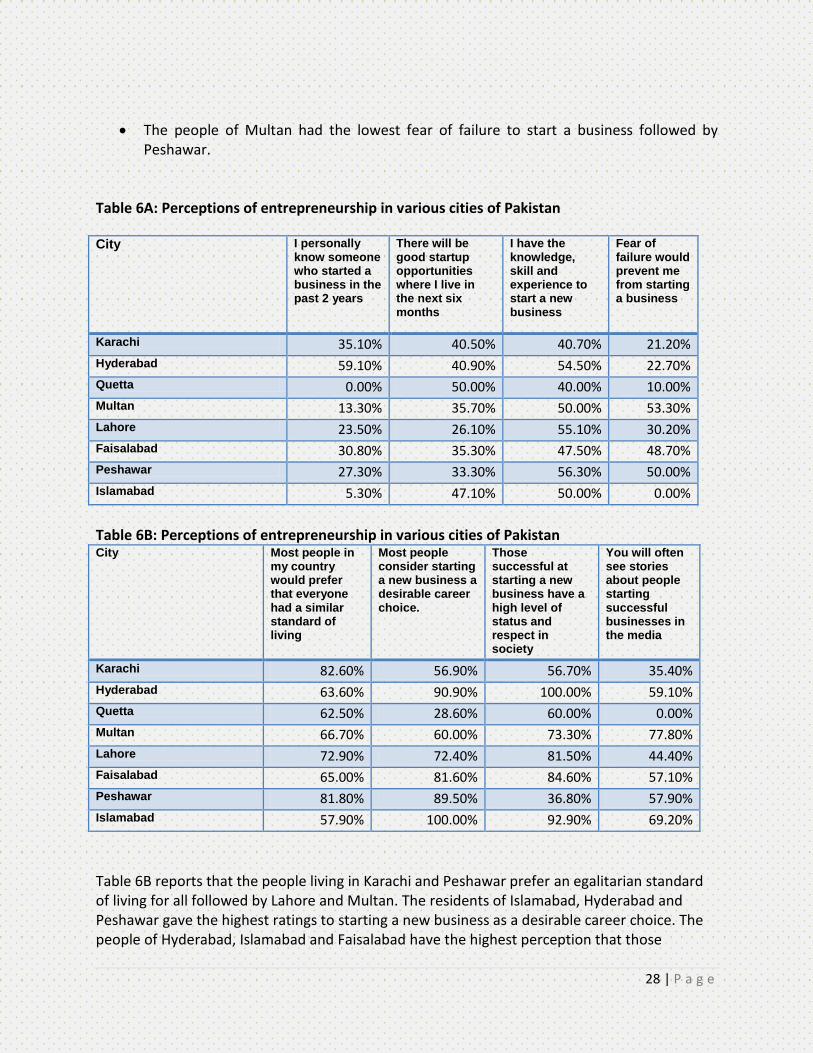
The people of Multan had the lowest fear of failure to start a business followed by Peshawar.
Table 6A: Perceptions of entrepreneurship in various cities of Pakistan City I personally
know someone who started a business in the past 2 years
There will be good startup opportunities where I live in the next six months
I have the knowledge, skill and experience to start a new business
Fear of failure would prevent me from starting a business
Karachi 35.10% 40.50% 40.70% 21.20%
Hyderabad 59.10% 40.90% 54.50% 22.70% Quetta 0.00% 50.00% 40.00% 10.00% Multan 13.30% 35.70% 50.00% 53.30%
Lahore 23.50% 26.10% 55.10% 30.20% Faisalabad 30.80% 35.30% 47.50% 48.70% Peshawar 27.30% 33.30% 56.30% 50.00%
Islamabad 5.30% 47.10% 50.00% 0.00%
Table 6B: Perceptions of entrepreneurship in various cities of Pakistan City Most people in
my country would prefer that everyone had a similar standard of living
Most people consider starting a new business a desirable career choice.
Those successful at starting a new business have a high level of status and respect in society
You will often see stories about people starting successful businesses in the media
Karachi 82.60% 56.90% 56.70% 35.40%
Hyderabad 63.60% 90.90% 100.00% 59.10%
Quetta 62.50% 28.60% 60.00% 0.00% Multan 66.70% 60.00% 73.30% 77.80%
Lahore 72.90% 72.40% 81.50% 44.40%
Faisalabad 65.00% 81.60% 84.60% 57.10%
Peshawar 81.80% 89.50% 36.80% 57.90%
Islamabad 57.90% 100.00% 92.90% 69.20%
Table 6B reports that the people living in Karachi and Peshawar prefer an egalitarian standard of living for all followed by Lahore and Multan. The residents of Islamabad, Hyderabad and Peshawar gave the highest ratings to starting a new business as a desirable career choice. The people of Hyderabad, Islamabad and Faisalabad have the highest perception that those

29 | P a g e
successful at starting a new business have a high level of status and respect in society. Moreover Multan, Islamabad and Hyderabad have the highest number of people reporting that they have seen stories about people starting successful businesses in the media. 2.3 Entrepreneurial Activity GEM considers entrepreneurship as a step-wise process in which individuals become increasingly engaged in this activity. Total Early-stage Entrepreneurial Activity (TEA) the key regional measure employed by GEM includes nascent entrepreneurs involved in setting up of businesses and those owning and running new businesses less than 3.5 years (42 months) old. Additionally, GEM assesses the rate and nature of business discontinuance as well as necessity based verses opportunity oriented entrepreneurship. Table 7 shows TEA rates in various GEM participating countries listed under three economic levels. On average, the highest TEA rates are found in factor-driven economies, followed by efficiency driven economies and they are lowest in innovation driven economies. The nature of these differences are explained primarily by the need for necessity verses opportunity motives given the development level of a country or region and is further articulated in the relevant sections below. Compared to Pakistan (11.57), Ghana had higher rate (36.52) in 2012. There are significant variations in the TEA rates of efficiency driven economies with Ecuador showing high rate (26.61), followed by South American countries like Chile and Peru. Among the innovation driven economies, US (12.84) and Singapore (11.56) have the highest rate followed by Netherlands, Slovakia and Austria. Italy and Japan had the lowest TEA rate among these nations. Table 7: Total early stage Entrepreneurial Activity in GEM participating countries in 2012
Country TEA Rate Country TEA Rate Country TEA Rate
Innovation Driven Efficiency Driven Thailand 18.94
Austria 9.58 Argentina 18.88 Trinidad &
Tobago 14.96
Belgium 5.20 Barbados 17.12 Tunisia 4.78
Denmark 5.36 Bosnia and
Herzegovina 7.78 Turkey 12.22
Finland 5.98 Brazil 15.44 Uruguay 14.63
France 5.17 Chile 22.58 Average
(unweighted) 13.11
Germany 5.34 China 12.83 Factor-Driven

30 | P a g e
Greece 6.51 Colombia 20.11 Algeria 8.75
Ireland 6.15 Costa Rica 15.04 Angola 32.39
Israel 6.53 Croatia 8.27 Botswana 27.66
Italy 4.32 Ecuador 26.61 Egypt 7.82
Japan 3.99 El Salvador 15.26 Ethiopia 14.73
Korea 6.64 Estonia 14.26 Ghana 36.52
Netherlands 10.31 Hungary 9.22 Iran 10.79
Norway 6.75 Latvia 13.39 Malawi 35.56
Portugal 7.67 Lithuania 6.69 Nigeria 35.04
Singapore 11.56 Macedonia 6.97 Pakistan 11.57
Slovakia 10.22 Malaysia 6.99 Palestine 9.84
Slovenia 5.42 Mexico 12.11 Uganda 35.76
Spain 5.70 Namibia 18.15 Zambia 41.46
Sweden 6.44 Panama 9.46 Average
(unweighted) 23.68
Switzerland 5.93 Peru 20.21
Taiwan 7.54 Poland 9.36
United Kingdom 8.98 Romania 9.22
United States 12.84 Russia 4.34
Average (unweighted) 7.09 South Africa 7.32
Figure 5 shows the TEA rates of the GEM 2012 participating countries. The countries are grouped according to economy type. It is evident that the factor and efficiency driven countries have a generally higher TEA as compared to Innovation driven countries.

31 | P a g e
Figure 5: TEA rates of GEM 2012 participating countries
Figure 6 — Total Early-Stage Entrepreneurial Activity Rates and Per Capita GDP 2012
0.0%5.0%
10.0%15.0%20.0%25.0%30.0%35.0%40.0%45.0%50.0%
Egyp
t
Pal
est
ine
Pak
ista
n
Bo
tsw
ana
Nig
eri
a
Uga
nd
a
Zam
bia
Tun
isia
Mac
ed
on
ia
Sou
th A
fric
a
Cro
atia
Ro
man
ia
Pan
ama
Turk
ey
Latv
ia
Uru
guay
Co
sta
Ric
a
Bra
zil
Nam
ibia
Thai
lan
d
Pe
ru
Ecu
ado
r
Ital
y
Be
lgiu
m
De
nm
ark
Spai
n
Fin
lan
d
Swed
en
Isra
el
No
rway
Po
rtu
gal
Au
stri
a
Net
her
lan
ds
Un
ite
d S
tate
s
Factor-driveneconomies
Efficiency-driven economies Innovation-driven economies
Pe
rce
nt
TEA
in a
du
lt p
op
ula
tio
n
(18
-64
ye
ars)

32 | P a g e
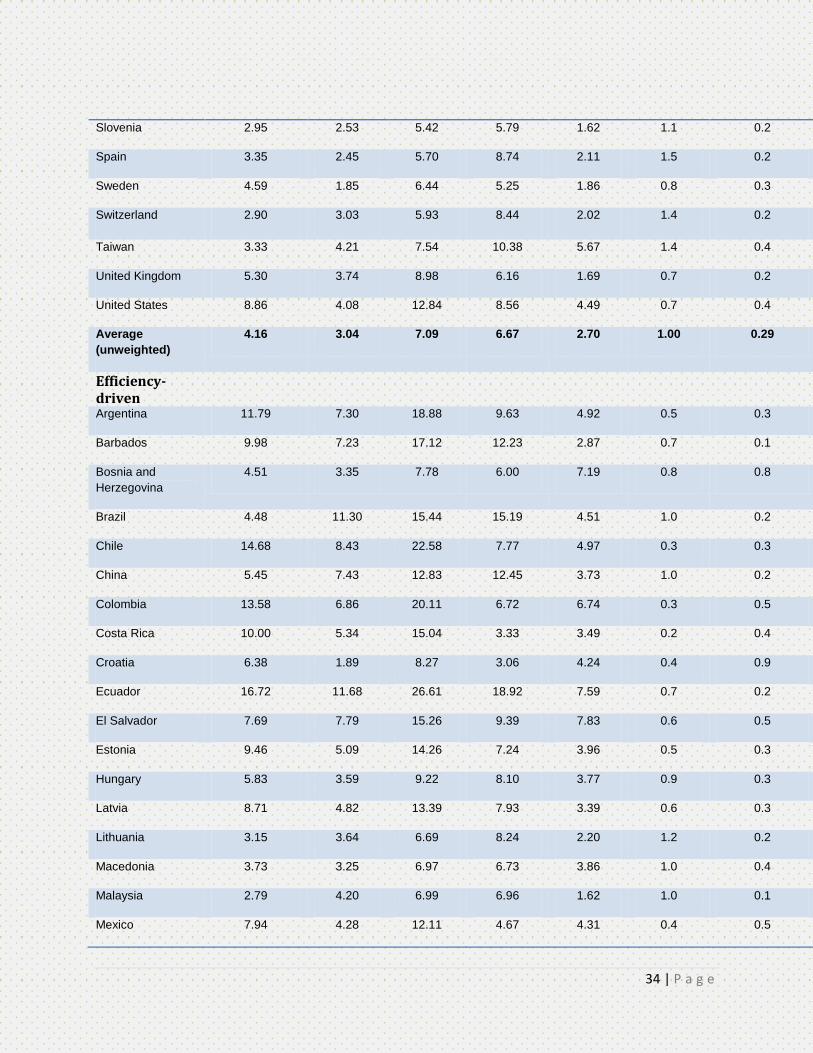
In addition to the TEA rate, GEM measures the proportion of established business owners-managers in the working age population (EBO). Established business owner managers have owned or managed a business for more than 42 months. Finally, GEM measures the proportion of individuals of working age population who closed down their businesses in the last 12 months, one that did not continue under a different form or ownership. The ratio of established business ownership to early stage entrepreneurship gives a proxy measure of transition rates from early stage entrepreneurship to established business ownership. This can be interpreted as a proxy survival measure. The ratio of closure to business ownership (new plus established) gives a proxy of entrepreneurial dynamism or “churn”. The 2012 results of the participating countries are given in Table 8. The GEM survey is a survey of individuals and not a survey of registered businesses. Therefore, the figures reported for business ownership will not necessarily tally with official statistics on the size of the registered businesses. The table presents some interesting summary points.
Among the innovation driven countries, the nascent entrepreneurial activity (NEA) is the highest in US followed by Singapore, Slovakia, Austria, UK, Sweden and Portugal. Japan, Italy, and Korea have the lowest rate of NEA. The highest total entrepreneurial activity (TEA) i.e. the sum of nascent entrepreneurship and the new business owner manager rate is reported to be the highest in US followed by Singapore, Netherlands, Slovakia, Austria and UK. Japan and Italy report the lowest level of total entrepreneurial activity. The highest number of established business units (for more than 42 months) is observed in Greece, Taiwan and Korea. Slovakia, US, and Greece report the highest number of business closures in the past 12 months.
Among the efficiency driven countries, the nascent entrepreneurial activity (NEA) is the highest in the South American countries of Ecuador, Chile, Peru, Colombia and Argentina followed by Namibia and Uruguay. On the other hand lowest level of NEA is reported in Tunisia, Russia and Malaysia. The highest total entrepreneurial activity (TEA) i.e. the sum of nascent entrepreneurship and the new business owner manager rate is reported to be the highest again in South American countries of Ecuador, Chile, Peru and Colombia followed Thailand and then Argentina. The highest number of established business units (for more than 42 months) is observed in Thailand, Ecuador, and Brazil. Namibia, El Salvador, and Ecuador report the highest number of business closures in the past 12 months.
In the Factor driven countries, the nascent entrepreneurial activity (NEA) is the highest in Zambia, Nigeria and Malawi. The lowest level of NEA is reported in Iran, Egypt and

33 | P a g e
Algeria. The highest total entrepreneurial activity (TEA) i.e. the sum of nascent entrepreneurship and the new business owner manager rate is reported to be the highest in Zambia, Ghana and Uganda. The lowest level of TEA is observed in Algeria and Egypt. The highest number of established business units (for more than 42 months) is observed in Ghana and Uganda. Palestine reports the lowest number of established business units.
Table 8: Measurement of entrepreneurial activity in GEM participating countries
Nascent Entrepreneurial
Activity rate
New Business Owner/
Manager Rate(4-42 months)
Nascent + New
Business Owner
Manager rate
Established Business Owners
(>42 months)
Business Closure
Rate (Business closed in
the last 12 months)
Proxy Early Stage
Business Survival
Rate Proxy Business
Churn Rate
Country NEA NBO TEA EBO BC EBO/TEA BC/(NBO+EBO) Innovation-
Driven
Austria 6.58 3.42 9.58 7.61 3.56 0.8 0.3
Belgium 3.32 1.95 5.20 5.12 2.39 1.0 0.3
Denmark 3.07 2.36 5.36 3.45 1.34 0.6 0.2
Finland 3.45 2.68 5.98 8.04 1.99 1.3 0.2
France 3.74 1.54 5.17 3.23 1.96 0.6 0.4
Germany 3.51 2.15 5.34 4.95 1.91 0.9 0.3
Greece 3.82 2.84 6.51 12.27 4.43 1.9 0.3
Ireland 3.91 2.28 6.15 8.32 1.74 1.4 0.2
Israel 3.50 3.03 6.53 3.78 4.04 0.6 0.6
Italy 2.47 1.92 4.32 3.32 2.43 0.8 0.5
Japan 2.26 1.72 3.99 6.11 1.12 1.5 0.1
Korea 2.56 4.08 6.64 9.57 3.17 1.4 0.2
Netherlands 4.08 6.26 10.31 9.49 2.17 0.9 0.1
Norway 3.70 3.15 6.75 5.75 1.45 0.9 0.2
Portugal 4.26 3.63 7.67 6.23 2.98 0.8 0.3
Singapore 7.60 4.18 11.56 3.10 3.88 0.3 0.5
Slovakia 6.65 3.91 10.22 6.38 4.69 0.6 0.5
34 | P a g e
Slovenia 2.95 2.53 5.42 5.79 1.62 1.1 0.2
Spain 3.35 2.45 5.70 8.74 2.11 1.5 0.2
Sweden 4.59 1.85 6.44 5.25 1.86 0.8 0.3
Switzerland 2.90 3.03 5.93 8.44 2.02 1.4 0.2
Taiwan 3.33 4.21 7.54 10.38 5.67 1.4 0.4
United Kingdom 5.30 3.74 8.98 6.16 1.69 0.7 0.2
United States 8.86 4.08 12.84 8.56 4.49 0.7 0.4
Average
(unweighted)
4.16 3.04 7.09 6.67 2.70 1.00 0.29
Efficiency-driven
Argentina 11.79 7.30 18.88 9.63 4.92 0.5 0.3
Barbados 9.98 7.23 17.12 12.23 2.87 0.7 0.1
Bosnia and
Herzegovina
4.51 3.35 7.78 6.00 7.19 0.8 0.8
Brazil 4.48 11.30 15.44 15.19 4.51 1.0 0.2
Chile 14.68 8.43 22.58 7.77 4.97 0.3 0.3
China 5.45 7.43 12.83 12.45 3.73 1.0 0.2
Colombia 13.58 6.86 20.11 6.72 6.74 0.3 0.5
Costa Rica 10.00 5.34 15.04 3.33 3.49 0.2 0.4
Croatia 6.38 1.89 8.27 3.06 4.24 0.4 0.9
Ecuador 16.72 11.68 26.61 18.92 7.59 0.7 0.2
El Salvador 7.69 7.79 15.26 9.39 7.83 0.6 0.5
Estonia 9.46 5.09 14.26 7.24 3.96 0.5 0.3
Hungary 5.83 3.59 9.22 8.10 3.77 0.9 0.3
Latvia 8.71 4.82 13.39 7.93 3.39 0.6 0.3
Lithuania 3.15 3.64 6.69 8.24 2.20 1.2 0.2
Macedonia 3.73 3.25 6.97 6.73 3.86 1.0 0.4
Malaysia 2.79 4.20 6.99 6.96 1.62 1.0 0.1
Mexico 7.94 4.28 12.11 4.67 4.31 0.4 0.5

35 | P a g e
Namibia 11.30 7.00 18.15 3.17 11.59 0.2 1.1
Panama 7.21 2.69 9.46 1.86 1.82 0.2 0.4
Peru 14.67 6.22 20.21 5.10 6.75 0.3 0.6
Poland 4.83 4.55 9.36 5.81 3.89 0.6 0.4
Romania 5.51 3.83 9.22 3.91 3.81 0.4 0.5
Russia 2.65 1.80 4.34 2.05 1.00 0.5 0.3
South Africa 4.30 3.08 7.32 2.32 5.03 0.3 0.9
Thailand 8.74 11.32 18.94 29.69 2.78 1.6 0.1
Trinidad & Tobago 8.76 6.52 14.96 7.19 4.50 0.5 0.3
Tunisia 2.38 2.48 4.78 4.37 3.98 0.9 0.6
Turkey 7.25 5.36 12.22 8.68 5.24 0.7 0.4
Uruguay 10.18 4.71 14.63 4.97 4.99 0.3 0.5
Average
(unweighted)
7.82 5.57 13.11 7.79 4.55 0.62 0.42
Factor-Driven
Algeria 1.62 7.25 8.75 3.32 6.93 0.4 0.7
Angola 14.89 18.88 32.39 9.06 25.86 0.3 0.9
Botswana 17.04 12.24 27.66 6.33 16.26 0.2 0.9
Egypt 3.10 4.87 7.82 4.15 5.28 0.5 0.6
Ethiopia 5.70 9.25 14.73 10.20 3.40 0.7 0.2
Ghana 15.42 22.78 36.52 37.74 16.24 1.0 0.3
Iran 4.47 6.48 10.79 9.53 5.05 0.9 0.3
Malawi 18.45 20.39 35.56 10.80 28.91 0.3 0.9
Nigeria 21.77 14.19 35.04 15.67 8.31 0.4 0.3
Pakistan 8.29 3.42 11.57 3.78 2.53 0.3 0.4
Palestine 6.22 3.81 9.84 2.98 7.73 0.3 1.1
Uganda 9.58 27.56 35.76 31.25 25.92 0.9 0.4
Zambia 27.50 14.57 41.46 3.84 20.23 0.1 1.1
Average (unweighted)
11.85 12.75 23.68 11.43 13.28 0.49 0.62

36 | P a g e
Entrepreneurial Activity by Stages in Pakistan Table 9 illustrates the proportion of respondents by stage of entrepreneurial activity in Pakistan. In Pakistan 42.7% of working age individuals were not engaged in entrepreneurial activity and had no intention of starting a business within the next three years. A further 27.5% expected to start a business in the next three years, but were not actively trying to start a business or running an existing business. A further 13.7% were nascent entrepreneurs and an additional 16.1% were new business owner/ managers. Table 9: Proportion of respondents by stage of entrepreneurial activity in Pakistan
2012 2011 2010
Are you, alone or with others, currently the owner of a business you help manage, self-employed, or selling any goods or services to others?
16.1% 16.7% 19.3%
Are you, alone or with others, currently trying to start a new business, including any self-employment or selling any goods or services to others?
13.7% 14.1% 18.0%
Are you, alone or with others, expecting to start a new business, including any type of self-employment, within the next three years?
27.5% 25.8% 32.2%
No Activity or intention 42.7% 43.4% 30.5%
Opportunity and Necessity Based Entrepreneurship Activity One way of distinguishing between different types of entrepreneurial activity is the extent to which the activity is based on necessity (i.e. there are no better alternatives for work) or opportunity (where entrepreneurs may be exploiting the potential for new market creation). From the GEM 2012 survey both opportunity motivated entrepreneurship rates (Opportunity TEA) and Necessity driven entrepreneurship rates (Necessity TEA) are presented side by side in Table 10. The Table shows that the levels of necessity entrepreneurship in 2012 are lower than levels of opportunity entrepreneurship in most participating countries except a few including Iran and Pakistan.

37 | P a g e
Table 10: Opportunity and Necessity Entrepreneurship (as a % of TEA) in GEM Participating countries
Opportunity TEA (% of
TEA)
Necessity TEA (% of
TEA)
Innovation Driven Economies
Austria 38 11
Belgium 62 18
Denmark 71 8
Finland 60 17
France 59 18
Germany 51 22
Greece 32 30
Ireland 41 28
Israel 46 19
Italy 22 16
Japan 66 21
Korea 46 35
Netherlands 66 8
Norway 70 7
Portugal 53 18
Singapore 54 15
Slovakia 43 36
Slovenia 64 7
Spain 33 26
Sweden 49 7
Switzerland 57 18
Taiwan 43 18
United Kingdom 43 18
United States 59 21
Average 51 18
Efficiency Driven Economies
Argentina 47 35
Barbados 63 12
Bosnia and Herzegovina 20 58
Brazil 59 30
Chile 69 17
China 39 37
Colombia 48 12
Costa Rica 48 20
Croatia 36 34
Ecuador 30 36
El Salvador 39 35

38 | P a g e
Estonia 49 18
Hungary 35 31
Latvia 46 25
Lithuania 51 25
Macedonia 29 52
Malaysia 61 13
Mexico 52 13
Namibia 37 37
Panama 57 19
Peru 53 23
Poland 30 41
Romania 38 24
Russia 31 36
South Africa 40 32
Thailand 67 17
Trinidad & Tobago 60 15
Tunisia 42 35
Turkey 55 31
Uruguay 40 18
Average 46 28
Factor Driven Economies
Algeria 47 30
Angola 38 24
Botswana 48 33
Egypt 23 34
Ethiopia 69 20
Ghana 51 28
Iran 36 42
Malawi 43 42
Nigeria 53 35
Pakistan 24 53
Palestine 27 42
Uganda 42 46
Zambia 46 32
Average 42 35
In the innovation driven countries the highest level of opportunity TEA is observed in the Denmark, Norway, Netherlands, and Japan. In the efficiency driven economies, the highest level of opportunity TEA is in Chile, Thailand, and Barbados. In the Factor driven economies, Ethiopia, Nigeria, and Ghana have the highest level of opportunity TEA. The data shows that generally, developing regions have higher numbers for necessity entrepreneurship than their developed region counterparts. This is obvious due to the lack of good job opportunities in most of the factor driven economies.

39 | P a g e
Male Verses Female Entrepreneurial Activity Women enter into entrepreneurship for many of the same reasons as men: to support themselves and families, to enrich their lives with careers and financial independence etc. Yet there may be special reasons for female entrepreneurial activity. The findings suggest that women’s participation in entrepreneurship varies significantly across economies, but is nearly always less than that of men. Table 11 presents a summary of Total early stage Entrepreneurial activity (TEA) rates by gender for all participating GEM countries including Pakistan. In some high income countries, men are around twice as likely to be entrepreneurially active as women, for example the gender gap is very high in countries like, Netherlands, Slovakia, UK, Korea, Norway, and Ireland. On the other hand a narrower gender gap was reported in US, Singapore, and Austria. In the efficiency driven countries, there is a high gender gap in Argentina, Uruguay, Costa Rica, Estonia, Latvia, and Turkey. A lower gender gap is observed in Chile, Peru, Columbia, and Namibia. Female TEA is higher than Male TEA in Ecuador, Thailand and Panama. In the factor driven countries, the lowest level of women participation can be found in Pakistan, Egypt and Palestine. Across the three development levels, the factor-driven and efficiency-driven groups are a bit similar on average with factor-driven higher of both male and female TEA rates, but the innovation-driven group has a much lower average proportion of women entrepreneurs.
Table 11: Total Early stage entrepreneurial activity by gender in Participating GEM Countries Male TEA
Rate Female
TEA Rate
Innovation Driven Economies
Austria 11.04 8.12
Belgium 7.73 2.64
Denmark 7.60 3.09
Finland 7.83 4.09
France 6.36 4.02
Germany 7.15 3.54
Greece 8.63 4.37
Ireland 8.29 3.95

40 | P a g e
Israel 7.62 5.46
Italy 5.73 2.91
Japan 5.88 2.07
Korea 10.83 2.28
Netherlands 13.90 6.68
Norway 9.83 3.56
Portugal 9.26 6.15
Singapore 13.15 10.01
Slovakia 13.72 6.73
Slovenia 8.09 2.59
Spain 7.36 4.00
Sweden 7.99 4.84
Switzerland 6.41 5.45
Taiwan 9.05 6.04
United Kingdom 11.63 6.30
United States 15.24 10.47
Average 9.18 4.97
Efficiency Driven
Economies
Argentina 23.98 14.16
Barbados 18.24 16.07
Bosnia and Herzegovina 10.44 5.08
Brazil 16.19 14.73
Chile 26.21 19.11
China 14.65 11.02
Colombia 22.82 17.57
Costa Rica 19.72 10.65
Croatia 11.77 4.85
Ecuador 25.71 27.43

41 | P a g e
El Salvador 16.40 14.34
Estonia 19.13 9.74
Hungary 12.76 5.77
Latvia 18.88 8.18
Lithuania 9.40 4.15
Macedonia 9.35 4.54
Malaysia 7.75 6.18
Mexico 12.17 12.05
Namibia 18.80 17.50
Panama 8.47 10.40
Peru 22.87 17.63
Poland 12.57 6.21
Romania 13.19 5.33
Russia 5.35 3.42
South Africa 8.89 5.72
Thailand 17.26 20.56
Trinidad & Tobago 16.71 13.18
Tunisia 6.75 2.87
Turkey 17.49 6.85
Uruguay 19.86 10.00
Average 15.46 10.84
Factor Driven Economies
Algeria 12.08 5.37
Angola 34.37 30.61
Botswana 30.00 25.44
Egypt 13.09 2.39
Ethiopia 16.63 12.90
Ghana 34.99 37.97

42 | P a g e
Iran 15.60 5.88
Malawi 39.29 32.10
Nigeria 34.47 35.60
Pakistan 21.27 1.21
Palestine 16.01 3.42
Uganda 36.04 35.51
Zambia 42.91 40.04
Average 26.67 20.65
Table 12 presents a summary of established business ownership by gender in GEM participating countries in 2012. The gender gap in participation rates appear to be wider among established business owner-managers than among early-stage entrepreneurs in innovation driven economies. In efficiency driven countries the gender gap is also more in established businesses as compared to early stage entrepreneurs with the exception of Mexico, Peru, South Africa and Russia. In the factor driven economies female EBO is much lower as compared to innovation and factor driven economies.
Table 12: Established business ownership by gender Male EBO Female EBO
Innovation Driven Economies
Austria 9.33 5.89
Belgium 6.73 3.51
Denmark 4.75 2.13
Finland 11.67 4.34
France 4.27 2.23
Germany 5.88 4.02
Greece 17.73 6.79
Ireland 11.82 4.74
Israel 4.71 2.87

43 | P a g e
Italy 5.01 1.63
Japan 7.96 4.24
Korea 15.14 3.77
Netherlands 13.04 5.90
Norway 7.67 3.77
Portugal 8.83 3.73
Singapore 4.37 1.85
Slovakia 9.15 3.63
Slovenia 8.54 2.87
Spain 11.07 6.36
Sweden 7.32 3.11
Switzerland 9.78 7.08
Taiwan 14.40 6.35
United Kingdom 8.82 3.49
United States 10.45 6.70
Average 9.10 4.21
Efficiency Driven Economies
Argentina 13.45 6.10
Barbados 16.82 7.93
Bosnia and
Herzegovina
7.67 4.31
Brazil 17.39 13.10
Chile 9.24 6.36
China 14.34 10.57
Colombia 9.01 4.57
Costa Rica 3.54 3.14
Croatia 3.67 2.48
Ecuador 23.50 14.76
El Salvador 10.41 8.56

44 | P a g e
Estonia 10.55 4.18
Hungary 12.04 4.27
Latvia 10.20 5.78
Lithuania 12.40 4.35
Macedonia 9.19 4.20
Malaysia 8.34 5.49
Mexico 6.03 3.42
Namibia 3.83 2.50
Panama 2.80 0.97
Peru 5.66 4.55
Poland 8.45 3.22
Romania 5.98 1.88
Russia 2.16 1.95
South Africa 2.79 1.83
Thailand 29.93 29.46
Trinidad & Tobago 9.46 4.88
Tunisia 7.21 1.61
Turkey 14.57 2.69
Uruguay 7.03 3.15
Average 9.92 5.74
Factor Driven Economies
Algeria 5.46 1.15
Angola 8.87 9.24
Botswana 7.96 4.80
Egypt 7.57 0.61
Ethiopia 10.26 10.13
Ghana 39.77 35.81
Iran 15.90 3.01
Malawi 12.60 9.14

45 | P a g e
Nigeria 15.95 15.41
Pakistan 5.81 1.60
Palestine 5.18 0.69
Uganda 33.82 28.94
Zambia 4.12 3.56
Average 13.33 9.55
Entrepreneurial Activity in Pakistani Provinces Table 13 displays different measures of entrepreneurial activity in various regions of Pakistan.
Table 13: Different measures of entrepreneurial activity in various regions of Pakistan
Province Expects to start a business in the next 3 years
(future)
Nascent Entrepreneuri
al Activity Rate
(Actively involved in
start-up effort, owner, no wages yet)
New Business Owner-
Manager Rate
(Manages a business
that is up to 42 months
old)
Nascent + New Business
Owner Manager Rate
Established Business
Owners (>42
months)
Business Closure
rate (Discontin
ued a business
in the past 12 months)
Proxy for Early stage
business survival
rate
Proxy for business churn Rate of Business Closure to Ownership
FUT NEA NBO
TEA= NEA+NBO
EBO BC EBO/TE
A BC/(NBO+EBO)
Sindh 31.20 6.40 2.60 9.30 5.70 2.50 0.61 0.30
Punjab 28.40 6.90 3.20 10.60 3.00 1.10 0.28 0.18
Baluchistan 17.90 7.80 6.30 14.10 1.60 0.00 0.11 0.00
Khyber Pakhtoon Khowa
18.40 19.30 0.90 19.70 5.70 1.50 0.29 0.23
In Sindh and Punjab, the number of people expected to start the business were highest as compared to the other provinces of Pakistan. Sindh, along with KPK, has the highest established business owner rate, has the highest early stage business survival rate and also the highest business closure rate. Surprisingly KPK reports the highest nascent entrepreneurial activity rate but also second highest business closure rate. Baluchistan reports the lowest business closure rate. The ratio of EBO to TEA, a proxy of early stage business survival is relatively high in Sindh. The rate of business closure to business ownership is the highest in Sindh and then KPK.

46 | P a g e
The total early stage entrepreneurial activity in the various provinces of Pakistan is presented in Table 14. The highest TEA rate is reported in KPK followed by Baluchistan, and then Punjab, and Sindh. Table 14: Total Early Stage Entrepreneurial Activity in Pakistani Regions in 2012
Sindh 9.30%
Punjab 10.60%
Baluchistan 14.10%
Khyber Pakhtoon Khowa 19.70%
Table 15 A, displays male and female early stage entrepreneurial activity (TEA) rates by region. It shows that KPK has the highest rate of Male TEA. The female TEA rate is the highest for Sindh followed by Punjab. Table 15 A: Male and Female Total early stage Entrepreneurial Activity in Pakistani Regions, 2012
Province Male Female
Sindh 14.60% 3.20%
Punjab 20.50% 0.90%
Baluchistan 30.50% -
Khyber Pakhtoon khowa 37.50% -
Table 15 B, displays the Opportunity and Necessity Entrepreneurial Activity in Pakistani Regions. The highest Opportunity based entrepreneurship is taking place in KPK followed by Baluchistan and Punjab. The highest Necessity based entrepreneurial activity is taking place in Baluchistan followed by KPK.
Table 15 B: Opportunity and Necessity Entrepreneurial Activity in Pakistani Regions, 2012
Province Opportunity TEA Necessity TEA
Sindh 3.20% 5.90%
Punjab 4.40% 5.90%
Baluchistan 4.70% 9.40%
Khyber Pakhtoon khowa 13.60% 6.10%
Table 16 and 17, display male and female early stage entrepreneurial activity based on opportunity and necessity entrepreneurship. KPK reports the highest Male TEA rates based on opportunity entrepreneurship followed by Baluchistan.

47 | P a g e
The highest Male TEA rates based on necessity entrepreneurship are reported in Baluchistan. Sindh reports highest Female TEA rates based on necessity entrepreneurship. Table 16: Male and Female Total early stage Entrepreneurial Activity in Pakistan Regions, 2012 based
on opportunity entrepreneurship
Province Opportunity TEA Male Female
Sindh 5.40% 0.80%
Punjab 8.70% 0.20%
Baluchistan 10.20% -
Khyber Pakhtoon khowa 25.80% -
Table 17: Male and Female Total early stage Entrepreneurial Activity in Pakistan Regions, 2012 based
on necessity entrepreneurship
Province Necessity TEA Male Female
Sindh 8.90% 2.40%
Punjab 11.50% 0.50%
Baluchistan 20.30% -
Khyber Pakhtoon khowa 11.70% -
2.4 Entrepreneurial Aspirations Research shows that higher levels of entrepreneurial aspirations such as for firm growth and/or job creation are likely to lead to positive results, which implies that efforts intended to increase growth aspirations and associated abilities will most likely succeed21. The potential of entrepreneurial activity to promote growth and new jobs also reflects the types of businesses being pursued such as in new industries and/or markets, which possess greater potentials. Across the world, the majority of businesses expect little or no growth. According to the 2009 GEM Global Report, expectations of high growth are rare among nascent and new entrepreneurs. Across 47 economies, only 70% of all start-up attempts expected any job creation at all. Only 14% of all start up attempts expected to create 20 or more jobs. To identify individuals who expected to create a relatively high number of jobs, GEM created a variable which measures the percentage of all early stage entrepreneurs who have created more than ten jobs and who expect more than 50% of growth in jobs in the next five years. The

48 | P a g e
results are illustrated in Table 18 for early stage entrepreneurs and established business owner managers. Among the innovation driven countries Singapore, Taiwan, Japan, Ireland, Korea, and France have the highest percentage of early stage entrepreneurs who have created more than ten jobs and who expect 50% growth in the next five years. Singapore, Slovenia, and Sweden have the highest number of established business managers who have the above mentioned attributes. In the efficiency driven countries, Latvia, Colombia, Romania, Lithuania, and Turkey have the highest percentage of early stage entrepreneurs who have created more than ten jobs and who expect 50% growth in the next five years. Romania, Namibia, and Latvia have the highest number of established business managers who have the above mentioned attributes. In the factor driven countries, Botswana, Egypt, and Pakistan have the highest percentage of early stage entrepreneurs who have created more than ten jobs and who expect 50% growth in the next five years. Nigeria, Botswana, and Egypt have the highest number of established business managers who have the above mentioned attributes. Table 18 also shows the proportion of early stage entrepreneurs and established business owner managers who state that they operate in new product markets. In the Innovation driven economies, European countries like France, Denmark, Slovenia, Ireland, and Belgium have the highest TEA who operate in new product markets. On the other hand Denmark, Italy, Greece, Slovenia, and United States have the highest EBO who operate in new product markets. In the efficiency driven economies, Chile, South Africa, Colombia, and Ecuador have the highest TEA who operate in new product markets. Chile, Namibia and South Africa have the highest EBO who operate in new product markets. In the factor driven economies, Malawi, Pakistan and Botswana have the highest TEA who operate in new product markets. Malawi, Botswana and Nigeria have the highest EBO who operate in new product markets. The third variable in Table 18 illustrates the percentage of early stage entrepreneurs and established business owner managers who were active in high or medium tech sectors. Slovenia, Italy, and Sweden have the highest percentage of TEA who are active in medium and high tech sectors. Sweden, Switzerland, Denmark, and Germany have the highest percentage of EBO who are active in medium and high tech sectors. Estonia, Lithuania, Latvia, and Argentina have the highest percent of TEA and Hungary, Uruguay and Estonia have the highest percent of EBO who are active in medium and high tech sectors among the efficiency driven economies. Algeria and Palestine have the highest percentage of TEA and Palestine and Pakistan have the highest percent EBO who are active in medium and high tech sector’s among the factor driven economies. The final variable shows the proportion of early stage entrepreneurs and established business owners who have more than 25% of their customers from outside the country. US, Singapore, Switzerland, and Belgium have the highest percentage of TEA and Singapore, US, Switzerland, and Portugal have the highest EBO who have more than 25% of their customers from outside the country among the innovation driven economies. Chile, Poland and Macedonia have the highest percentage of TEA and Chile, Estonia, and Latvia have the highest percentage of EBO who have more than 25% of their customers from outside the country among the efficiency

49 | P a g e
driven economies. Zambia and Botswana have the highest %age of TEA as well as the EBO who have more than 25% of their customers from outside the country among the factor driven economies. Table 18: Measures of entrepreneurial aspiration in GEM participating countries, 2012
Country Percentage of entrepreneurs who have created > 10
jobs and expect 50% growth in 5 years
Percentage of early stage entrepreneurs and
established business managers who operate in
new product markets
Percentage of early stage entrepreneurs and
established business managers active in
medium and high tech scores
Percentage of early stage entrepreneurs and
established business managers with one in
four foreign customers
TEA EBO TEA EBO TEA EBO TEA EBO
Innovation driven
Austria 7.58 1.45 33.55 14.79 10.32 9.67 39.06 47.06
Belgium 16.93 0.00 36.83 3.70 2.63 0.00 51.86 44.14
Denmark 17.73 3.48 44.41 36.63 9.87 11.18 21.09 49.16
Finland 14.11 3.17 28.49 11.78 7.49 4.35 24.07 33.41
France 21.88 0.13 44.90 13.38 10.88 8.76 28.72 36.13
Germany 21.69 4.22 31.77 9.63 8.17 10.06 44.01 49.30
Greece 7.62 0.74 23.33 20.13 5.39 2.10 28.07 31.54
Ireland 25.88 4.77 37.33 10.95 9.19 5.75 37.64 33.34
Israel 17.95 4.37 29.15 8.99 3.94 3.42 38.06 42.86
Italy 6.52 4.33 29.34 22.35 13.90 5.18 24.37 40.76
Japan 27.47 6.34 21.73 11.45 8.81 6.09 38.97 26.35
Korea 22.43 6.03 26.53 15.97 8.23 9.22 32.15 38.06
Netherlands 8.69 1.93 27.51 10.45 4.92 2.35 31.93 33.45
Norway 8.89 1.74 22.96 4.35 7.41 8.70 19.70 18.75
Portugal 16.13 0.69 31.57 9.73 3.82 1.58 48.82 55.18
Singapore 33.85 11.12 21.79 17.78 5.49 8.15 55.71 72.34
Slovakia 19.65 3.05 27.29 10.66 7.61 8.37 44.36 34.88
Slovenia 19.21 7.36 37.75 18.90 13.96 7.39 29.08 46.46
Spain 6.23 1.22 30.58 7.28 9.92 6.98 11.47 11.56

50 | P a g e
Sweden 9.73 6.61 21.15 16.79 11.96 16.24 18.37 24.87
Switzerland 8.56 2.98 31.89 17.16 10.65 11.95 52.36 61.85
Taiwan 31.77 5.80 18.85 13.04 7.40 6.97 35.03 34.94
United Kingdom 17.43 3.98 30.54 15.80 9.37 4.38 45.33 50.67
United States 21.12 5.10 34.10 18.02 8.96 8.63 62.49 62.68
Average 17.04 3.78 30.14 14.15 8.35 6.98 35.95 40.82
Efficiency Driven
Argentina 15.14 3.52 29.35 16.98 6.22 4.56 13.93 17.05
Barbados 10.49 3.25 13.37 9.33 0.48 2.92 39.16 40.80
Bosnia and
Herzegovina
19.44 8.48 13.25 10.40 2.63 2.00 25.27 26.61
Brazil 7.82 1.81 1.20 0.34 2.35 1.52 0.83 0.58
Chile 23.57 4.92 56.23 39.62 5.76 4.80 61.68 58.40
China 14.41 3.25 21.06 15.79 1.60 2.14 18.28 12.96
Colombia 36.25 13.69 41.63 27.29 6.22 4.29 36.54 37.56
Costa Rica 11.73 4.41 13.68 23.53 2.28 1.47 19.74 18.46
Croatia 22.73 4.15 22.58 8.19 2.50 3.12 33.53 40.07
Ecuador 4.88 1.85 40.15 23.75 1.31 1.06 7.74 11.38
El Salvador 17.44 2.59 29.45 26.71 1.39 0.93 12.09 6.64
Estonia 24.16 5.28 37.66 19.27 7.93 5.55 36.67 49.05
Hungary 22.55 2.45 20.76 11.39 5.64 7.62 37.73 43.92
Latvia 40.09 15.71 34.59 16.37 6.46 3.89 45.55 45.14
Lithuania 35.07 9.09 20.90 11.52 6.72 3.64 31.50 39.88
Macedonia 18.60 6.70 20.52 9.45 4.30 1.41 47.34 44.35
Malaysia 8.34 4.79 17.13 15.38 1.42 0.46 20.41 15.43
Mexico 12.11 6.77 21.62 17.80 5.27 1.71 10.61 18.30
Namibia 11.88 18.50 33.31 33.87 1.92 0.00 26.53 33.35
Panama 0.98 0.00 18.13 17.11 0.97 0.00 5.40 13.81

51 | P a g e
Peru 7.89 6.04 18.36 14.92 0.12 0.00 17.03 7.72
Poland 15.57 6.22 32.15 16.85 2.99 3.30 54.03 44.28
Romania 35.59 19.65 30.66 26.46 4.49 0.00 39.38 42.36
Russia 19.67 2.75 14.44 2.70 3.92 0.00 6.13 1.40
South Africa 18.93 14.06 42.92 29.25 1.47 2.20 30.95 25.57
Thailand 8.83 2.42 19.57 7.61 1.23 0.24 7.68 5.02
Trinidad & Tobago 13.46 5.58 14.74 11.61 2.07 5.50 24.69 25.16
Tunisia 13.65 9.44 25.56 18.33 4.08 3.18 14.36 25.03
Turkey 31.14 15.31 24.89 9.65 4.58 1.04 22.87 29.90
Uruguay 13.36 4.02 24.65 13.42 4.01 5.56 17.86 15.68
Average 17.86 6.89 25.15 16.83 3.41 2.47 25.52 26.53
Factor Driven Algeria 6.27 2.39 20.16 15.44 5.53 1.99 26.00 24.19
Angola 12.52 7.81 21.49 13.53 1.15 0.00 21.84 20.67
Botswana 25.04 10.33 22.72 17.31 2.29 0.00 35.67 29.77
Egypt 22.54 8.90 12.27 11.17 1.90 1.68 18.75 17.95
Ethiopia 8.69 4.40 13.72 6.91 0.75 0.69 4.22 4.00
Ghana 10.47 5.05 10.20 3.39 0.72 0.09 15.45 10.43
Iran 11.55 1.49 7.95 2.35 3.44 2.51 8.53 2.86
Malawi 0.63 0.56 36.61 30.03 0.65 0.00 2.91 5.48
Nigeria 13.44 11.05 19.86 15.88 1.30 0.45 23.26 20.79
Pakistan 19.49 2.52 28.49 7.92 2.02 2.74 22.96 25.10
Palestine 19.28 1.57 21.48 12.63 4.61 7.12 12.93 26.99
Uganda 2.41 2.94 9.53 4.47 0.28 0.27 12.41 11.04
Zambia 5.13 4.15 14.90 1.83 0.59 0.00 59.43 66.67
Average 12.11 4.86 18.41 10.99 1.94 1.35 20.34 20.46
There is some degree of overlap between these measures of aspiration. For example entrepreneurs with significant foreign trade are more likely to be engaged with new product-market combinations, and to have high job growth expectations. However there appears to be
52 | P a g e
no association between whether an entrepreneur was working in a high or medium technology sector and the other measures of aspiration in Table 18. Appendix 2 consists of various tables describing the change in various entrepreneurial measures from 2010 through to 2012. 2.5 The Environment for Entrepreneurship in 2012 In 2012, 57 experts in different aspects of the socio-economic environment for entrepreneurship were interviewed across Pakistan using a structured questionnaire. They were selected from different groups: knowledgeable practitioners, resource providers, academics and observers across nine different entrepreneurial framework conditions (EFCs), which serve as the key stakeholders for a well-functioning business environment. Experts were asked to rate various statements on a 5 point Likert scale that represent different aspects of each entrepreneurial framework conditions (EFCs). Factor Analysis of these expert inputs was conducted on the data to produce a measure of the strength of each underlying EFC. Figure 10A and 10B shows spider graphs of these conditions. It should be noted that three of the conditions (education, national policy and internal markets) each contain two sub-conditions, and these are broken out in Figure 10A and 10B. Education includes primary/secondary school and post-school training. National policy contains both general policy and regulatory policy. Internal markets refer to both dynamics (the level of change in markets from year to year) and openness (the extent to which new firms are free to enter existing markets). In general, experts in the innovation-driven economies rated the EFCs more highly. This trend is consistent with the fact that foundational factors (basic requirements and efficiency enhancers) are more developed in the innovation-driven economies and EFCs begin to have higher priority. Three entrepreneurship framework conditions stand out for their high ratings in the factor-driven economies: (1) national policy - regulation; (2) internal market dynamics; and (3) cultural and social norms for entrepreneurship. The latter is consistent with the GEM adult population survey’s report that individual and societal beliefs tend to be highest in the factor-driven economies.

53 | P a g e
-0.6-0.4-0.2
00.20.40.6
R&D transfer
Commercial & servicesinfrastructure
Internal market -dynamics
Internal market -openness
Physicalinfrastructures
Cultural and socialnorms
Factor driven economies Efficiency driven economies
Innovation driven economies
Fig 7AComposite indicators on entrepreneurship institutions
Fig 7B Composite indicators on entrepreneurship institutions
Figures 8 to 10 present the scores for each EFC for Pakistan and compares it with groups of
selected countries in the Innovation driven, efficiency driven and factor driven economies,
derived from the responses of experts in those countries
-0.4
-0.2
0
0.2
0.4Finance
National policy -General policy
National policy -Regulation
Government programs
Education - Primary andSecondary
Education - Post-school
Factor driven economies Efficiency driven economies
Innovation driven economies

54 | P a g e
Figure 8 A: Mean Scores Awarded by National Experts to Entrepreneurial Framework Conditions in
Pakistan as compared to innovation driven economies
Figure 8 B: Mean Scores Awarded by National Experts to Entrepreneurial Framework Conditions in
Pakistan as compared to Innovation driven economies
0.00 0.50 1.00 1.50 2.00 2.50 3.00 3.50 4.00 4.50
Financial environment
Government policies, priority and support
Government policies bureaucracy, taxes
Government programs
GERMANY USA SOUTH KOREA SINGAPORE PAKISTAN UK
0.00 0.50 1.00 1.50 2.00 2.50 3.00 3.50 4.00 4.50 5.00
R&D transfer
Professional and commercial infrastructure
Internal market dynamics
Internal market burdens
Physical infrastructures and services access
GERMANY USA SOUTH KOREA SINGAPORE PAKISTAN UK

55 | P a g e
Figure 8 C: Mean Scores Awarded by National Experts to Entrepreneurial Framework Conditions in
Pakistan as compared to Innovation driven economies
Figure 9 A: Mean Scores Awarded by National Experts to Entrepreneurial Framework Conditions in
Pakistan as compared to Efficiency driven economies
0.00 0.50 1.00 1.50 2.00 2.50 3.00 3.50 4.00 4.50
Entrepreneurial education in Primary and Secondary
Entrepreneurial education at Post-school
Cultural, social norms and society support
Opportunities existence perception
Skills and abilities to start up
GERMANY USA SOUTH KOREA SINGAPORE PAKISTAN UK
0.00 0.50 1.00 1.50 2.00 2.50 3.00 3.50 4.00
Financial environment
Government policies, priority and support
Government policies bureaucracy, taxes
Government programs
MALAYSIA MEXICO SOUTH AFRICA CHINA THAILAND PAKISTAN TURKEY

56 | P a g e
Figure 9 B: Mean Scores Awarded by National Experts to Entrepreneurial Framework Conditions in
Pakistan as compared to Efficiency driven economies
Figure 9 C: Mean Scores Awarded by National Experts to Entrepreneurial Framework Conditions in
Pakistan as compared to Efficiency driven economies
0.00 0.50 1.00 1.50 2.00 2.50 3.00 3.50 4.00 4.50 5.00
R&D transfer
Professional and commercial infrastructure
Internal market dynamics
Internal market burdens
Physical infrastructures and services access
MALAYSIA MEXICO SOUTH AFRICA CHINA THAILAND PAKISTAN TURKEY
0 0.5 1 1.5 2 2.5 3 3.5 4
Entrepreneurial education in Primary and Secondary
Entrepreneurial education at Post-school
Cultural, social norms and society support
Opportunities existence perception
Skills and abilities to start up
MALAYSIA MEXICO SOUTH AFRICA CHINA THAILAND PAKISTAN TURKEY

57 | P a g e
Figure 10 A: Mean Scores Awarded by National Experts to Entrepreneurial Framework Conditions in
Pakistan as compared to Factor driven economies
Figure 10 B: Mean Scores Awarded by National Experts to Entrepreneurial Framework Conditions in
Pakistan as compared to Factor driven economies
0.00 0.50 1.00 1.50 2.00 2.50 3.00 3.50
Financial environment
Government policies, priority and support
Government policies bureaucracy, taxes
Government programs
PALESTINE ALGERIA GHANA EGYPT PAKISTAN IRAN NIGERIA
0 0.5 1 1.5 2 2.5 3 3.5 4 4.5
R&D transfer
Professional and commercial infrastructure
Internal market dynamics
Internal market openness
Physical infrastructures and services access
PALESTINE ALGERIA GHANA EGYPT PAKISTAN IRAN NIGERIA

58 | P a g e
Figure 10 C: Mean Scores Awarded by National Experts to Entrepreneurial Framework Conditions in
Pakistan as compared to Factor driven economies
Key findings from these figures are as follows.
All countries including the developed ones do relatively poorly on entrepreneurship education in primary and secondary schools.
In the factor driven countries, Pakistan is compared with countries like Iran, Egypt and Algeria. Pakistan scores significantly higher on skills and abilities to startup, internal market openness and post school education. Algeria scores higher on internal market openness and dynamics, R&D transfer, skills and abilities to start up, cultural and social norms, primary and secondary and post-school education, governmental programs, government policies, taxes and government support, and financial environment. Egypt scores high on opportunities existence perception.
In the efficiency driven countries, Pakistan is compared with countries like, Turkey, Thailand, Malaysia and China. Malaysia scores higher on most parameters except entrepreneurial post-school education, internal market dynamics and openness, commercial infrastructure and physical infrastructure. Turkey scores reasonably high on cultural and social norms, and opportunities existence perception.
In innovation driven countries, Pakistan is compared with selected set of developed countries. Singapore scores high on government policies and taxes, priority and support, financial environment, physical infrastructure, R&D transfer, opportunities existence perception, post school and primary and secondary entrepreneurial education. Germany scores high on governmental programs and professional and commercial infrastructure. Interestingly, Pakistan scores respectable on professional and commercial infrastructure and the skills and abilities to start a new business.
0 0.5 1 1.5 2 2.5 3 3.5 4
Entrepreneurial education in Primary and Secondary
Entrepreneurial education at Post-school
Cultural, social norms and society support
Opportunities existence perception
Skills and abilities to start up
PALESTINE ALGERIA GHANA EGYPT PAKISTAN IRAN NIGERIA

59 | P a g e
Chapter 3: Conclusions and Implications
The GEM Pakistan 2012 results offer in-depth review of individual entrepreneurial characteristics of the adult (18-64) population along with the national environmental context in which entrepreneurship takes place. It is hoped that the GEM research report (the third study) would not only create awareness of the importance of entrepreneurship among the Pakistani youth, policy makers, academics and general public, but will also provide a solid basis to launch new academic and industrial research projects thereby significantly enriching our understanding of the state-of-entrepreneurship in the country and related challenges that need to be overcome. The GEM study results and data sets are now increasingly being employed for the purpose of:
Investigating changing environmental conditions for entrepreneurship over time
Assessing regional differences within Pakistan
Comparing conditions for entrepreneurship among peer countries
Institutional structures, human and social capital facilitating or blocking entrepreneurship
Linking GEM data to other data sources
Arrangement for funding new entrepreneurial venture, developing angle networks
Supporting nascent entrepreneurship and new business ownership
Encouraging corporate entrepreneurship The GEM Pakistan’s findings highlight the need to improve the national business climate and entrepreneurial environment by (a) emphasizing the role of government in ensuring security and establishing the rule of law (b) removing the instruments of rent-seeking (c) moving away from the current focus on government planning to a more market- driven approach. The new approach has to be aligned with globalization, creativity, innovation and the application of technology. However, a number of implications and lessons can be drawn from the GEM study results. Entrepreneurship awareness through Entrepreneurial Centers Academic beneficiaries belonging to universities and research organizations include centers of excellence in entrepreneurship, academic researchers in business and economics and other social scientists, doctoral and post graduate students. Additionally, business and civic organizations including local chambers of commerce and industry can equally benefit from this work. To promote this activity a consortium of universities comprising of IBA Karachi, IBA Sukkur, UET Peshawar, GIFT University Gujranwala who joined hands to conduct this research, plan to use its findings to create national awareness. Several Pakistani universities and institutes have initiated entrepreneurship centers to complement and promote entrepreneurial skills in their partner technological departments in

60 | P a g e
the past couple of years. Their objective is to nourish and prepare their graduates for the entrepreneurial journey. In Pakistan, IBA Karachi followed by NUST, Islamabad have already created entrepreneurship centers. This is followed by others including University of Central Punjab, UET Peshawar and IBA Sukkur. The entrepreneurial centers at Lahore University of Management Sciences (LUMS) and Baluchistan University of Information, Technology, Management and Sciences (BUITMS) are in the early phase of development. Entrepreneurship awareness through entrepreneurship education One of the key components of an entrepreneurial activity is to teach entrepreneurship while simultaneously developing an entrepreneurial mindset of the students. Pakistani universities have only recently started teaching entrepreneurship courses to their business and non-business students. Only a limited variety of courses are being taught with few universities offering a full portfolio of entrepreneurship courses i.e. entrepreneurial marketing, entrepreneurial finance and innovation and creativity. The GEM study can also provide useful global data and teaching material for this purpose. Some of the potential users of GEM Pakistan and other GEM Global and national reports are the government organizations such as Planning Commission of Pakistan, Ministry of Youth Affairs, Ministry of Economic Affairs, Ministry of Rural Development, SMEDA, National Productivity Organization, and the Export Promotion Bureau among others. Regional entrepreneurial policy support: There are 72 geographic districts in Pakistan and more than 50 percent of entrepreneurial ventures are concentrated in only 10 districts namely, Karachi, Lahore, Faisalabad, Multan, Hyderabad, Sialkot, Gujrat, Gujranwala, Quetta and Sheikhupura. Our GEM research reveals a widespread entrepreneurial propensity in various districts of Pakistan. Therefore, by improving the entrepreneurial framework conditions of each district and linking them to their respective manpower potential will lead to a country- wide entrepreneurial activity resulting in well-spread economic growth Youth entrepreneurship and employment: With a bulge in youth population and an urgent social need for job creation when viewed in light of several positive entrepreneurial and pro-business attributes of the population identified in this research, a new cadre of young entrepreneurs needs to be developed. On the basis of our GEM findings we advocate a strong need for entrepreneurship education programs starting from pre-high school and particularly in the engineering and science programs in the polytechnic institutes and universities of the country. Interestingly, specialized entrepreneurship courses have already been initiated in some engineering and agricultural universities of Pakistan, which need to be expanded to bring youth into self-employment and entrepreneurial business activities.

61 | P a g e
Facilitate necessity entrepreneurship and encourage opportunity entrepreneurship Pakistan scores high on perception of new opportunities and the skills and abilities to start a new business. However, there is a need to promote entrepreneurial mindset across the population at all levels. As a factor driven economy there is a huge scope in the area of agro based entrepreneurship i.e. in livestock agronomy, and forestry. Other important areas are: halal food business, value addition in the textile products and in the light and medium engineering sector. Pakistani universities are producing thousands of IT and engineering graduates and there is a great opportunity to follow the footsteps of Taiwan, India and China to promote IT based entrepreneurship among the graduating students by providing an enabling environment. Pakistan is country bestowed with a huge population and natural resources. Entrepreneurship can be used to tap the talent of the youth by inculcating an entrepreneurial mindset and promoting the youth to start their own ventures. The GEM findings will help the policy makers, educators, and the students in the long run to promote an entrepreneurial culture in the country.
GEM Pakistan Team
Dr. Sarfraz A. Mian, GEM Pakistan Head and Principal Investigator, is Professor of Entrepreneurship and
Management Policy, and Chair Marketing & Management Areas in the School of Business, State University of New
York- Oswego, USA. He obtained his MS in Management Sciences from Northwestern University, an MBA and PhD
from George Washington University. He has taught at University of Maryland, Osnabruck University, Germany,
LUMS Lahore, and lectured at universities in Europe, South America, and South Asia. He has served as Chair,
Institute for Operations Research & Management Sciences Technology Management area (2002-04) and was
Executive Officer of the Academy of Management TIM Division (2000-05). He is the co-founder and US
Coordinator of North American Innovation Research Network (NAIRNet). He has published more than 50 scholarly
articles and made 100 international conference presentations and invited speeches. He is the Associate Editor of
JSBM, and served as Guest Editor of Technovation, Journal of Technology Transfer, Small Business Economics. His
recent scholarly work includes: two books – ‘Building Knowledge Regions in North America” and ‘Science &
Technology Based Regional Entrepreneurship (Edward Elgar). Prof. Mian’s Journal of Business Venturing and

62 | P a g e
Research Policy articles on university business incubation are among the most cited. His published work was
ranked among top 13 worldwide in academic entrepreneurship by Rothaermel et al. Industrial & Corporate
Change, 2007, 16:4, pp 691-791. He has 30 years of experience with international bodies, governments, industry
and academia. He is currently advisor to the Center of Entrepreneurial Development (CED) at IBA (Email:
[email protected], Web: www.oswego.edu/~mian)
Dr. Shahid Qureshi, a GEM Pakistan Team Member, is Assistant Professor of Entrepreneurship and Associate
Director for the Centre of Entrepreneurial Development (CED) at IBA. Dr Qureshi is one of the founding members
of the GEM Pakistan initiative with Dr. Mian. He obtained his PhD in Marketing from Technical University Berlin,
Master’s in IE &MS from AIT Bangkok, and an MBA from LUMS, Lahore. His research interests are in the areas of
Entrepreneurship, Strategy and on the interface of Entrepreneurship and Marketing. He has recently published his
research on the Determinants of Marketing Capabilities in new technology based firms. He has taught courses in
the area of Entrepreneurship, Strategic Management, Entrepreneurial marketing and research methods. Dr.
Qureshi is a visiting faculty at Technical University, Berlin, Toulouse Business School France, Frankfurt School of
Business, Germany, Lahore University of Management Sciences (LUMS) Pakistan and at S.P. Jain Institute of
Management & Research (SPJIMR), in Dubai. He has presented papers and attended many national and
international conferences in Sweden, Germany, UK, USA, Poland, Pakistan and India. He has been a consultant to
various small and medium businesses and conducted training for various companies. (Email: [email protected])

63 | P a g e
Appendix 1: Glossary of GEM Measures and Terminology Measure Description
Entrepreneurial Attitudes and Perceptions
Perceived Opportunities
Percentage of 18–64 age group who see good opportunities to start a firm in the area where they live
Perceived Capabilities Percentage of 18–64 age group who believe to have the required skills and knowledge to start a business
Entrepreneurial Intention
Percentage of 18–64 age group (individuals involved in any stage of entrepreneurial activity excluded) who intend to start a business within three years
Fear of Failure Rate Percentage of 18–64 age group with positive perceived opportunities who indicate that fear of failure would prevent them from setting up a business
Entrepreneurship as Desirable Career Choice
Percentage of 18–64 age group who agree with the statement that in their country, most people consider starting a business as a desirable career choice
High-Status Successful Entrepreneurship
Percentage of 18–64 age group who agree with the statement that in their country, successful entrepreneurs receive high status
Media Attention for Entrepreneurship
Percentage of 18–64 age group who agree with the statement that in their country, they will often see stories in the public media about successful new businesses
Entrepreneurial Activity
Nascent Entrepreneurship Rate
Percentage of 18–64 age group who are currently a nascent entrepreneur, i.e., actively involved in setting up a business they will own or co-own; this business has not paid salaries, wages or any other payments to the owners for more than three months
New Business Ownership Rate
Percentage of 18–64 age group who are currently an owner-manager of a new business, i.e., owning and managing a running business that has paid salaries, wages or any other payments to the owners for more than three months, but not more than 42 months
Total Early-Stage Entrepreneurial Activity (TEA)
Percentage of 18–64 age group who are either a nascent entrepreneur or owner-manager of a new business (as defined above)
Established Business Ownership Rate
Percentage of 18–64 age group who are currently owner-manager of an established business, i.e., owning and managing a running business that has paid salaries, wages or any other payments to the owners for more than 42 months
Business Discontinuation Rate
Percentage of 18–64 age group who have, in the past 12 months, discontinued a business, either by selling, shutting down or otherwise discontinuing an owner/management relationship with the business. Note: This is not a measure of business failure rates.
Necessity-Driven Entrepreneurial Activity: Relative Prevalence
Percentage of those involved in total early-stage entrepreneurial activity (as defined above) who are involved in entrepreneurship because they had no other option for work
Improvement-Driven Opportunity Entrepreneurial Activity: Relative Prevalence
Percentage of those involved in total early-stage entrepreneurial activity (as defined above) who (i) claim to be driven by opportunity, as opposed to finding no other option for work; and (ii) who indicate the main driver for being involved in this opportunity is being independent or increasing their income, rather than just maintaining their income
Entrepreneurial Aspirations
High-Growth Expectation Early-Stage Entrepreneurial Activity: Relative Prevalence
Percentage of total early-stage entrepreneurs (as defined above) who expect to employ at least 20 employees five years from now Weak measure: expects at least five employees five years from now
New Product-Market Percentage of total early-stage entrepreneurs (as defined above) who indicate that

64 | P a g e
Oriented Early-Stage Entrepreneurial Activity: Relative Prevalence
their product or service is new to at least some customers and indicate that not many businesses offer the same product or service Weak measure: product is new or not many businesses offer the same product or service
International Orientation Entrepreneurial Activity with International Orientation
Percentage of total early-stage entrepreneurs (as defined above) with more than 25% of the customers coming from other countries Weak measure: more than 1% customers coming from other countries

65 | P a g e
Appendix 2: Charts describing changes in various entrepreneurial measures from 2010 to 2012. Figure 11: Entrepreneurial attitudes in Pakistan (%age ALL respondents aged 18 -64 expressing an opinion and agreeing with the statement)
Figure 12: Entrepreneurial attitudes in Pakistan (%age MALE respondents aged 18 -64 expressing an opinion and agreeing with the statement)
0%
10%
20%
30%
40%
50%
60%
70%
80%
90%
Knowsomeonepersonally
who started abusiness inthe past 2
years.
Good start upopportunitiesin the next six
months
Have theknowledge,
skill andexperiencerequired tostart a new
business
Fear of failurePreventing
from startinga business
Business as agood careerer
choice
Thosesuccessful at
starting a newbusiness havea high level of
status andrespect
Seen stories inthe public
media aboutsuccessful
newbusinesses
2010 2011 2012
0.0%
10.0%
20.0%
30.0%
40.0%
50.0%
60.0%
70.0%
80.0%
90.0%
Know someonepersonally who
started abusiness in the
past 2 years.
Good start upopportunitiesin the next six
months
Have theknowledge,
skill andexperiencerequired tostart a new
business
Fear of failurePreventing
from starting abusiness
Business as agood careerer
choice
Thosesuccessful at
starting a newbusiness have a
high level ofstatus and
respect
Seen stories inthe public
media aboutsuccessful new
businesses
2010 2011 2012

66 | P a g e
Figure 13: Entrepreneurial attitudes in Pakistan (%age FEMALE respondents aged 18 -64 expressing an opinion and agreeing with the statement)
Figure 14: Perceptions of entrepreneurship among non-entrepreneurially active working age population towards entrepreneurship in various provinces of Pakistan (Know someone personally who started a business in the past 2 years.)
0.0%
10.0%
20.0%
30.0%
40.0%
50.0%
60.0%
70.0%
80.0%
90.0%
Knowsomeone
personally whostarted a
business in thepast 2 years.
Good start upopportunitiesin the next six
months
Have theknowledge,
skill andexperiencerequired tostart a new
business
Fear of failurePreventing
from starting abusiness
Business as agood careerer
choice
Thosesuccessful at
starting a newbusiness havea high level of
status andrespect
Seen stories inthe public
media aboutsuccessful new
businesses
2010 2011 2012
.0%
10.0%
20.0%
30.0%
40.0%
50.0%
60.0%
Sindh Punjab Baluchistan Khyber Pakhtoonkhowa
2010 2011 2012
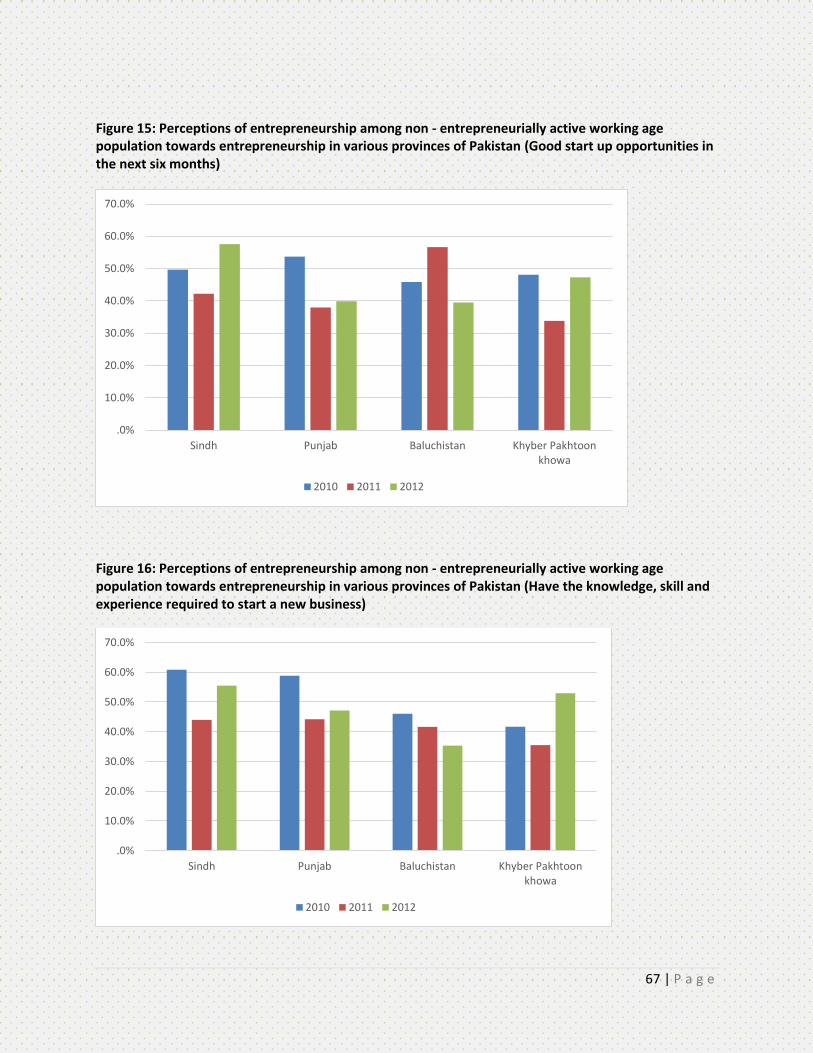
67 | P a g e
Figure 15: Perceptions of entrepreneurship among non - entrepreneurially active working age population towards entrepreneurship in various provinces of Pakistan (Good start up opportunities in the next six months)
Figure 16: Perceptions of entrepreneurship among non - entrepreneurially active working age population towards entrepreneurship in various provinces of Pakistan (Have the knowledge, skill and experience required to start a new business)
.0%
10.0%
20.0%
30.0%
40.0%
50.0%
60.0%
70.0%
Sindh Punjab Baluchistan Khyber Pakhtoonkhowa
2010 2011 2012
.0%
10.0%
20.0%
30.0%
40.0%
50.0%
60.0%
70.0%
Sindh Punjab Baluchistan Khyber Pakhtoonkhowa
2010 2011 2012

68 | P a g e
Figure 17: Perceptions of entrepreneurship among non-entrepreneurially active working age population towards entrepreneurship in various provinces of Pakistan (Fear of failure Preventing from starting a business)
Figure 18: Perceptions of entrepreneurship in various cities of Pakistan (Know someone personally who started a business in the past 2 years.)
.0%
5.0%
10.0%
15.0%
20.0%
25.0%
30.0%
35.0%
40.0%
45.0%
50.0%
Sindh Punjab Baluchistan Khyber Pakhtoonkhowa
2010 2011 2012
0.0%
10.0%
20.0%
30.0%
40.0%
50.0%
60.0%
70.0%
Karachi Hyderabad Quetta Multan Lahore Faisalabad Peshawar Islamabad
2010 2011 2012

69 | P a g e
Figure 19: Perceptions of entrepreneurship in various cities of Pakistan (Good start up opportunities in the next six months)
Figure 20: Perceptions of entrepreneurship in various cities of Pakistan (Have the knowledge, skill and experience required to start a new business)
0.0%
10.0%
20.0%
30.0%
40.0%
50.0%
60.0%
70.0%
80.0%
Karachi Hyderabad Quetta Multan Lahore Faisalabad Peshawar Islamabad
2010 2011 2012
0.0%
10.0%
20.0%
30.0%
40.0%
50.0%
60.0%
70.0%
80.0%
Karachi Hyderabad Quetta Multan Lahore Faisalabad Peshawar Islamabad
2010 2011 2012

70 | P a g e
Figure 21: Perceptions of entrepreneurship in various cities of Pakistan (Fear of failure preventing from starting a business)
Figure 22: Proportion of respondents by stage of entrepreneurial activity in Pakistan
0.0%
10.0%
20.0%
30.0%
40.0%
50.0%
60.0%
70.0%
Karachi Hyderabad Quetta Multan Lahore Faisalabad Peshawar Islamabad
2010 2011 2012
0.0%
5.0%
10.0%
15.0%
20.0%
25.0%
30.0%
35.0%
40.0%
45.0%
50.0%
Are you currentlyowner of a business?
Are you currently tryingto start a new
business?
Are you expecting tostart a new businesswithin the next three
years?
No Activity or intention
2010 2011 2012

71 | P a g e
Figure 23: Different measures of entrepreneurial activity in various regions of Pakistan (“Expects to start a business in the next 3 years (future)”)
Figure 24: Different measures of entrepreneurial activity in various regions of Pakistan (Nascent Entrepreneurial Activity Rate (Actively involved in start-up effort, owner, no wages yet))
0
5
10
15
20
25
30
35
40
45
Sindh Punjab Baluchistan Khyber PakhtoonKhowa
2010 2011 2012
0
5
10
15
20
25
30
Sindh Punjab Baluchistan Khyber PakhtoonKhowa
2010 2011 2012

72 | P a g e
Figure 25: Different measures of entrepreneurial activity in various regions of Pakistan (New Business Owner-Manager Rate (Manages a business that is up to 42 months old))
Figure 26: Different measures of entrepreneurial activity in various regions of Pakistan (Nascent + New Business Owner Manager Rate)
0
1
2
3
4
5
6
7
Sindh Punjab Baluchistan Khyber PakhtoonKhowa
2010 2011 2012
0
5
10
15
20
25
30
35
Sindh Punjab Baluchistan Khyber PakhtoonKhowa
2010 2011 2012

73 | P a g e
Figure 27: Different measures of entrepreneurial activity in various regions of Pakistan (Established Business Owners (>42 months))
Figure 28: Different measures of entrepreneurial activity in various regions of Pakistan (Business Closure rate (Discontinued a business in the past 12 months))
0
1
2
3
4
5
6
7
Sindh Punjab Baluchistan Khyber Pakhtoon Khowa
2010 2011 2012
0
2
4
6
8
10
12
Sindh Punjab Baluchistan Khyber PakhtoonKhowa
2010 2011 2012

74 | P a g e
Figure 29: Total early stage entrepreneurial activity in Pakistan
Figure 30: Early stage entrepreneurial activity in Pakistan, Male
0.0%
5.0%
10.0%
15.0%
20.0%
25.0%
30.0%
35.0%
Sindh Punjab Baluchistan Khyber Pakhtoonkhowa
2010 2011 2012
0%
10%
20%
30%
40%
50%
60%
70%
80%
Sindh Punjab Baluchistan Khyber Pakhtoonkhowa
2010 2011 2012

75 | P a g e
Figure 31: Early stage entrepreneurial activity in Pakistan, Female
Figure 32: Total early stage Entrepreneurial Activity in Pakistan Regions based on opportunity entrepreneurship, Male
0.0%
5.0%
10.0%
15.0%
20.0%
25.0%
30.0%
35.0%
40.0%
45.0%
Sindh Punjab Baluchistan Khyber PakhtoonKhowa
2010 2011 2012
0.0%
2.0%
4.0%
6.0%
8.0%
10.0%
12.0%
Sindh Punjab Baluchistan Khyber Pakhtoonkhowa
2010 2011 2012

76 | P a g e
Figure 33: Total early stage Entrepreneurial Activity in Pakistan Regions based on opportunity entrepreneurship, Female
Figure 34: Total early stage Entrepreneurial Activity in Pakistan Regions based on necessity entrepreneurship, Male
0.00%
0.50%
1.00%
1.50%
2.00%
2.50%
Sindh Punjab Baluchistan Khyber PakhtoonKhowa
2010 2011 2012
0.00%
5.00%
10.00%
15.00%
20.00%
25.00%
30.00%
Sindh Punjab Baluchistan Khyber PakhtoonKhowa
2010 2011 2012

77 | P a g e
Figure 35: Total early stage Entrepreneurial Activity in Pakistan Regions based on necessity entrepreneurship, Female
0.00%
2.00%
4.00%
6.00%
8.00%
10.00%
12.00%
Sindh Punjab Baluchistan Khyber Pakhtoon Khowa
2010 2011 2012

78 | P a g e
Appendix 3: GEM Pakistan 2012 Sampling and Weighting Methodology

79 | P a g e
Population
Male Female
2012 18-24 25-34 35-44 45-54 55-64 18-24 25-34 35-44 45-54 55-64 Total
Pakistan Urban 3345676 3482633 2388961 1590506 935163 2995832 2903214 2017348 1349833 772798 21781964
Pakistan Rural 5749262 5628159 3795752 2970230 1988339 5991340 5546795 3710033 2800919 1718062 39898891
Total 9094938 9110792 6184713 4560736 2923502 8987172 8450009 5727381 4150752 2490860 61680855
Population%
Male Female
2012 18-24 25-34 35-44 45-54 55-64 18-24 25-34 35-44 45-54 55-64 Total
Pakistan Urban 5.42% 5.65% 3.87% 2.58% 1.52% 4.86% 4.71% 3.27% 2.19% 1.25% 35.31%
Pakistan Rural 9.32% 9.12% 6.15% 4.82% 3.22% 9.71% 8.99% 6.01% 4.54% 2.79% 64.69%
Total 14.75% 14.77% 10.03% 7.39% 4.74% 14.57% 13.70% 9.29% 6.73% 4.04% 100.00%
Sample count
Male Female
2012 18-24 25-34 35-44 45-54 55-64 18-24 25-34 35-44 45-54 55-64 Total
Urban 132 150 109 72 55 135 141 116 68 36 1014
Rural 142 135 91 74 49 153 145 88 68 41 986
Total 274 285 200 146 104 288 286 204 136 77 2000
Sample %
Male Female
2012 18-24 25-34 35-44 45-54 55-64 18-24 25-34 35-44 45-54 55-64 Total
Urban 7% 8% 5% 4% 3% 7% 7% 6% 3% 2% 51%
Rural 7% 7% 5% 4% 2% 8% 7% 4% 3% 2% 49%
Total 14% 14% 10% 7% 5% 14% 14% 10% 7% 4% 100%
Weight Factors
Male Female
2012 18-24 25-34 35-44 45-54 55-64 18-24 25-34 35-44 45-54 55-64 Total
Urban 0.82 0.75 0.71 0.72 0.55 0.72 0.67 0.56 0.64 0.70 0.70
Rural 1.31 1.35 1.35 1.30 1.32 1.27 1.24 1.37 1.34 1.36 1.31
Total 1.08 1.04 1.00 1.01 0.91 1.01 0.96 0.91 0.99 1.05 1.00
Weighted Sample
Male Female
2012 18-24 25-34 35-44 45-54 55-64 18-24 25-34 35-44 45-54 55-64 Total
Urban 108 113 77 52 30 97 94 65 44 25 706
Rural 186 182 123 96 64 194 180 120 91 56 1294
Total 295 295 201 148 95 291 274 186 135 81 2000
80 | P a g e
Appendix 4:
AMAN Center for Entrepreneurial Development (AMAN-CED):
Introduction: The Centre for Entrepreneurial Development at IBA has been recently created to
promote entrepreneurship in the country. The objective of CED is to create wealth and value
for Pakistan by promoting entrepreneurship and helping entrepreneurs to build successful
businesses by helping them to develop the required entrepreneurial talent and skills and to
network with the right business leaders, mentors and investors. IBA CED has partnered with
Babson Business School, US for faculty development and exchange.
The CED at IBA aims to become a regional center of excellence to promote entrepreneurship
and foster a new culture of enterprise in Pakistan. The mission of CED is to be a leader in
training, nurturing, advocacy and research on entrepreneurship that advances the creation,
growth and success of new, innovative enterprises in Pakistan. The emphasis will be to enable
new generations of Pakistani entrepreneurs to translate their ideas into new business ventures.
The CED will be creating new companies that add substantial jobs, incomes and revenues to the
Pakistani economy. A new program, BBA in entrepreneurship has been initiated with the aim of
producing entrepreneurs and managers with an entrepreneurial mindset.
The various functional areas of CED are as follows:
Education and Training
The Education and Training component is focused on promotional seminars as well as efforts to
popularize entrepreneurship and reduce societal biases to promote entrepreneurship as a
career option. It will help build linkages and networks with stakeholders in the enterprise
ecosystem. Short duration workshops and training programs are being conducted in addition
to a full time BBA in Entrepreneurship Program which started in 2011, for example a 6-month
diploma in entrepreneurship. An M.Sc. in Entrepreneurship and Family Business is also on the
plan and will be offered in the coming months.
Research
The Research component is focused on developing case studies on Pakistani entrepreneurs and
investigating various challenges faced by them simultaneously studying key success factors
among the successful ventures. Various areas identified for research are as follow:

81 | P a g e
* Key success factors for Pakistani new businesses
* Family business: Issues and opportunities
* Agriculture business opportunities in Pakistan
* Technology Entrepreneurship
* Women entrepreneurship
* Social Entrepreneurship
Entrepreneurship Advisory Services
This component is focused on helping with business idea generation, support for
commercializing the ideas forming a company, obtaining intellectual property rights (IPR), and
facilitating advisory services such as access to finance. CED provides these services with the
help of existing service providers like the Small and Medium Enterprise Development Authority
(SMEDA), SME banks and other investors. CED has also established a business incubator to
support the young entrepreneurs.
The student entrepreneurs also work as individuals and teams to help local businesses to solve
their problems. This involves their engagement on as needed basis in areas like market analysis,
assessment of commercial potential for new technologies, new product launches and feasibility
studies. CED has also initiated nationwide student entrepreneurship promotion activities like
INVENT (business plan activity), startup weekend with the help of Kauffman foundation, SPARK,
Entrepreneurs Club, Guest speaker series and Women Entrepreneurs Club etc.
Women entrepreneurship is also an important area for the CED due to the low level of women
entrepreneurship in Pakistan. Women focused programs and CED activities on women's
entrepreneurship are also being conducted.
In addition to this CED IBA has partnered with universities from all over Pakistan to make a
consortium of universities to work together to promote entrepreneurship in Pakistan. The
partner universities are NED University of Engineering and Technology, KHI, Indus Valley School
of Arts, IBA Sukkur, GIFT University, Gujranwala, BUITMS, Baluchistan University of Information
Technology and Management Sciences, NUST, Islamabad and UET Peshawar.

82 | P a g e
Aman Center for Entrepreneurial Development at IBA, Karachi

83 | P a g e
REFERENCES AND FOOTNOTES www.gemconsortium.org 1 This section is excerpted from the GEM 2012 Global Report by Siri Roland Xavier et al, available at
www.gemconsortium.org 2 GEM was founded by Babson College, USA and London Business School, UK in 1997 and the first study was
conducted in 1999 with 10 member nations. 3The World Bank.Doing Business 2011. Washington, D.C.: The International Bank for Reconstruction and
Development/The World Bank, 2011. 4Porter, M.E., J.J. Sachs and J. McArthur. “Executive Summary: Competitiveness and Stages of Economic
Development.” In The Global Competitiveness Report 2001–2002, edited by M.E.Porter, J.J. Sachs, P.K. Cornelius, J.W. McArthur and K. Schwab, 16–25. New York, NY: Oxford University Press, 2002. 5Gries, T. and W. Naude. (2011). “Entrepreneurship and Structural Economic Transformation,” In Small Business
Economics, 34(1): 13–29. 6Ibid
7Entrepreneurship is the process of creating something new with value by devoting the necessary time and effort,
assuming the accompanying financial, psychic, and social risks, and receiving the resulting rewards of monetary and personal satisfaction and independence, see Hisrich et al (2013) Entrepreneurship” 9th Ed., McGraw-Hill /Irwin, NY.
8 A 2007 World Bank Group entrepreneurship survey that measured entrepreneurial activity in 84 developing and
industrial countries over the period 2003-2005 showed Pakistan’s new registrations of companies as a percentage of total lagged(previous year) registered businesses, was 7 % vs. 10.2 % over the same period in industrialized countries. The absolute entry rate per thousand working age adults was a dismal 0.04, which is 1/4
th of India (0.12)
and Egypt (0.13) according to the 2008 data. See, http://www.ifc.org/ifcext/sme.nsf/Content/Resources 9 See SMEDA web page at http://www.smeda.org, accessed 2012
10Fayyaz, A., Mian, S.A. and Khan, J.H. (2009) ‘State of Entrepreneurship and Globalization in Pakistan’, Int. J.
Business and Globalization, Vol. 3, No.3, 271-287 11
Framework for Economic Growth Pakistan, Planning Commission Government of Pakistan, May 2011 12
Haque, N. Ul (2011), ‘Developing a New Growth Strategy for Pakistan: New Growth Framework Approved’ in Najam, A., All Things Pakistan, May 29 13
Hisrich et al (2013), op. cit. 14
Schramm, C. (2010) ‘Expeditionary Economics,’ Foreign Affairs, May/June. 15
Looney, R. (2012). ‘Entrepreneurship and the Process of Development: A Framework for Applied Expeditionary Economics in Pakistan’. Kauffman Foundation Research Series on Expeditionary Economics, Kauffman Foundation, USA 16
Roundtable Report on Youth Development and Economic Growth, Planning Division Government of Pakistan, 25th
January, 2011, comments by Salman Ahmed of ‘Development Pool’. 17
According to the WEF’s Global Competitiveness Report 2009-2011 Pakistan failed to improve significantly on any of the basic determinants of its competitiveness over the past two years. To make things worse, the threat of terrorism bears heavily on the business community, according to the report.

84 | P a g e
18
Hasan, S. Z. (2011). Pakistan: Facing the Challenge of Science and Technology Driven Entrepreneurship Take-off, in Science and Technology Based Regional Entrepreneurship: Global Experience in Policy and Program Development, S. A. Mian (ed), Edward Elgar, MA: Northampton. 19
Looney, R. (2012). op. cit. 20
The data includes only those respondents who are not entrepreneurially active; they are neither already nascent entrepreneurs nor business owner / managers. It is intended to avoid pro-entrepreneurship biases of those who are already involved in some type of entrepreneurial activity. 21
Wicklund, J. and Shepherd, D (2003). “Aspiring for and achieving growth: The moderating role of resources and opportunities, Journal of Management Studies, 40 (8), 1919-1941. 17
18
Planning Commission of Pakistan, “A study of Entrepreneurship and Innovation: Creating a Place for the Future—Pakistan’s Framework for Economic Growth, “Draft Report, 2011.