gem 2013 tt final - global entrepreneurship monitor
TRANSCRIPT

i

ii
Contents Contents ........................................................................................................................................................ i
Executive Summary ..................................................................................................................................... vi
Acknowledgements ................................................................................................................................... viii
Introduction .................................................................................................................................................1
The Phases and Profile of Entrepreneurship................................................................................................3
Entrepreneurial Activity in Trinidad & Tobago.............................................................................................8
Total Early-‐Stage Entrepreneurial Activity (TEA) ....................................................................................15
Necessity versus Opportunity Entrepreneurship ...................................................................................16
Total Early-‐Stage Entrepreneurial Activity by Industry Sector ...............................................................17
Entrepreneurship by Gender, Age and Education (TEA) ........................................................................18
Business Discontinuance ........................................................................................................................21
Innovation ..............................................................................................................................................23
Entrepreneurial Aspirations ...................................................................................................................25
International Orientation .......................................................................................................................27
Entrepreneurship and Well-‐being ..........................................................................................................28
Entrepreneurship and Health.................................................................................................................29
National Expert Survey...............................................................................................................................33
Finance ...................................................................................................................................................35
Government Policy .................................................................................................................................36
Government Programmes......................................................................................................................37
High Growth Enterprises and Support for Such Enterprises ..................................................................38
Market Openness ...................................................................................................................................39
Education and Training...........................................................................................................................40
Interest in Innovation/Research and Development Transfer.................................................................41
Physical, Commercial & Services Infrastructure.....................................................................................43
Cultural and Social Norms/Motivation and Entrepreneurship as a Career Choice ................................44

iii
Well-‐being of Entrepreneurs ..................................................................................................................46
Entrepreneurial Opportunities in the Economy .....................................................................................47
Entrepreneurial Abilities and Knowledge to Facilitate New Venture Start-‐ups .....................................48
Women Entrepreneurship and Support .................................................................................................49
Youth/Young Adults and Entrepreneurship ...........................................................................................50
Agencies that Support Entrepreneurial Firms in Trinidad and Tobago ......................................................53
Recommendations .....................................................................................................................................60
Glossary of Terms.......................................................................................................................................63
References..................................................................................................................................................66
Appendix ....................................................................................................................................................67
Appendix 2. Author Biographies…………………………………………………………………………………………………………….68
List of Figures
Figure 1: The Institutional Context and Its Relationship to Entrepreneurship ............................... 2 Figure 2: The Entrepreneurship Process and GEM Operational Definitions ................................... 3 Figure 3: Economic Groups............................................................................................................. 5 Figure 4: Entrepreneurial Perceptions and Intentions by Stage of Economic Development .......... 7 Figure 5: The percentage of respondents answering ‘Yes’ to the question ‘In the next six months, will there be good opportunities for starting a business in the area where you live?’................... 9 Figure 6: The percentage of APS Respondents answering ‘Yes’ when asked if they were capable of starting and operating a new business ...................................................................................... 9 Figure 7: The percentage of respondents answering ‘Yes’ to the question ‘Would fear of failure prevent you from starting a new business?’ ................................................................................ 10 Figure 8: The percentage of respondents answering ‘Yes’ when asked if they agree with the statement: “In my country, most people consider starting a new business to be a desirable career choice” .............................................................................................................................. 10 Figure 9: The percentage of respondents answering ‘Yes’ when asked if they agree with the statement: “In my country, those successful at starting a new business have a high level of status and respect.” ..................................................................................................................... 11 Figure 10: The percentage of respondents answering ‘Yes’ when asked if they agree with the statement: “In my country, you will often see stories in the public media about successful new businesses.”.................................................................................................................................. 11 Figure 11: Entrepreneurial Intentions in Ascending Order Grouped by Region. .......................... 12

iv
Figure 12: Trends relating to attitudes and perceptions towards entrepreneurship for Trinidad and Tobago over the period 2010-‐2013....................................................................................... 14 Figure 13: Motive for Total Early-‐Stage Entrepreneurship Activity in T&T (% of TEA) ................. 16 Figure 14: Sector Distribution of Total Early-‐Stage Entrepreneurship Activity in T&T (% of TEA) for period 2010-‐2013 ................................................................................................................... 17 Figure 15: Percentage of Entrepreneurial Activity between males and females 2013................. 18 Figure 16a: Percentage of Entrepreneurial Activity among the different age groups 2013 ........ 19 Figure 16b: Age breakdown of TEA participants 2013................................................................. 19 Figure 17: Entrepreneurial Activity broken down by level of Education 2013.............................. 20 Figure 18: Business Discontinuance rate in Trinidad & Tobago 2010 -‐ 2013 ............................... 21 Figure 19: Reason for Exit (% Respondents who Discontinued Businesses) ................................. 22 Figure 20: Innovation in Total Early-‐Stage Entrepreneurship Trinidad and Tobago 2013 ........... 23 Figure 21: Innovation for Established Businesses Trinidad and Tobago 2013 ............................. 24 Figure 22: Current Job Creation for Early-‐Stage Entrepreneurial Activity 2013. (% of TEA Enterprises) .................................................................................................................................. 25 Figure 23: Job Growth Expectation for Early-‐Stage Entrepreneurial Activity 2013 within 5 years. (% of Adult Population) ................................................................................................................ 26 Figure 24: Percentage of Entrepreneurs with International Orientation (% of customers outside of home country).......................................................................................................................... 27 Figure 25: Quality of Life as Reported by Entrepreneurs and Employees..................................... 28 Figure 26: The 5 Dimensions of the EQ-‐5D-‐5L Descriptive System and their Levels. .................... 29 Figure 27: The Percentages of Respondents Reporting Any Problems of the EQ-‐5D Descriptive System Broken Down by Work Arrangements. ............................................................................ 30 Figure 28: Age Distributions of Full Time Employees and Entrepreneurs..................................... 31 Figure 29: Frequency of Problems on the EQ-‐5D AD Dimension by Level of Agreement with the Work-‐Related Stress Question form the Well-‐being Instrument (All working and Self-‐Employed APS Respondents Combined). ...................................................................................................... 32 Figure 30: Scores on Entrepreneurship Framework Conditions Rated by National Experts across Latin America and the Caribbean................................................................................................. 34 Figure 31: Perceptions of NES Respondents Concerning Finance................................................. 35 Figure 32: Perceptions of NES Respondents Concerning Policy.................................................... 36 Figure 33: Perceptions of NES Respondents Concerning Government Programmes.................... 37 Figure 34: NES Respondents’ Perceptions Regarding Support for Entrepreneurs ........................ 38 Figure 35: NES Respondents’ Perceptions Regarding Market Openness ..................................... 39 Figure 36: NES Respondents’ Perceptions Regarding Education.................................................. 40 Figure 37: Perceptions of NES Respondents Concerning Interest in Innovation........................... 41 Figure 38: Perceptions of NES Respondents Concerning R&D Transfer ....................................... 42 Figure 39: Perceptions of NES Respondents Concerning Physical Infrastructure ......................... 43

v
Figure 40: Perceptions of NES Respondents Concerning Commercial Infrastructure................... 44 Figure 41: Perceptions of NES Respondents Concerning Cultural and Social Norms.................... 45 Figure 42: NES Respondents’ Perceptions Regarding Entrepreneurship as a Career Choice........ 46 Figure 43: NES Respondents’ Perceptions Regarding the well-‐being of entrepreneurs. .............. 47 Figure 44: Perceptions of NES Respondents Concerning Opportunities. ...................................... 48 Figure 45: NES Respondents’ Perceptions Regarding Entrepreneurial Ability.............................. 49 Figure 46: NES Respondents’ Perceptions Concerning Gender .................................................... 50 Figure 47: Perceptions of NES Respondents Concerning Youth (14-‐20) ....................................... 51 Figure 48: Perceptions of NES Respondents Concerning Young Adults (21-‐34) ........................... 52 Figure 49. Agencies set up to Support Entrepreneurs and SME Firms. ........................................ 54
List of Tables
Table 1: GEM Economies by Geographic Region and Development Level in 2013......................... 6 Table 2: Entrepreneurial Attitudes and Perceptions – 2013 GEM Results for countries in Latin America and the Caribbean. ........................................................................................................ 13 Table 3: Total Early–Stage Entrepreneurial Activity (TEA) for Latin American and the Caribbean...................................................................................................................................................... 15

vi
Executive Summary The Global Entrepreneurship Monitor (GEM) is the largest global study of entrepreneurship and the entrepreneurial environment internationally. The GEM study now covers 75% of the world’s population and 90% of its GDP. The Arthur Lok Jack Graduate School of Business has conducted the GEM Study for Trinidad and Tobago each year since 2010. In 2013, a total of 2,036 adults aged 18 and over were interviewed in the Adult Population Survey (APS). Aside from the views of the general public, 45 ‘experts’ from various fields related to entrepreneurship were also interviewed in the National Expert Survey (NES), and an entrepreneurship environment scan was undertaken in which public documents relating to entrepreneurship were reviewed and policy makers were interviewed.
The perceptions and attitudes among adults in Trinidad and Tobago towards entrepreneurship continue to be favourable, but with a generally downward trend over the four year period 2010-‐2014.
The key indicator of GEM research is the rate of Total Entrepreneurial Activity (TEA). This is the percentage of adults who are operating or in the process of starting a new business. This includes employed people who are also in the process of starting or operating a new business. The Trinidad and Tobago TEA rate in 2012 was approximately 19.5%. The majority of these entrepreneurs were in the age group 25-‐34. The key demographics that were observed for these early entrepreneurs in Trinidad and Tobago were: in the age group 25-‐34, having completed secondary education, improvement rather than necessity driven, and more likely to be male than female. They were found to finance their businesses form personal savings rather than to access venture financing from banks and other financial institutions.
A well-‐being scale and the EQ-‐5D Self-‐Reported Health Instrument were also added to the survey in 2013. Entrepreneurs reported higher levels of satisfaction with life, and perceived well-‐being than employees, but entrepreneurs also reported higher levels of problems on the 5 dimensions of health in the EQ-‐5D instrument than employees.
The majority of the TEA activity was found to be replicative rather than innovative, and entrepreneurial firms in Trinidad and Tobago continue to perform at low levels in terms of growth expectations, innovation and export orientation: three dimensions of entrepreneurial performance that need to be strengthened and developed if the entrepreneurial sector is to contribute to diversification of the Trinidad and Tobago economy to reduce its dependence on the energy sector.
Some improvements were observed in the entrepreneurial framework conditions, particularly in the areas of access to finance for entrepreneurial firms and in certain types of support programmes such as business incubators.

vii
The 2013 GEM Study also included an overview of the key agencies that have been set up to provide support for entrepreneurs in Trinidad and Tobago. This is the first document that brings a profile of all of these agencies and programmes together. This allowed an evaluation of the programmes in terms of overlap among agencies and gaps in provision, which in turn produced recommendations for further research using future GEM surveys to gain insight that can be used to fine tune the operations of these agencies.

viii
Acknowledgements The authors are grateful to the GEM coordination team: Mr. Chris Aylett (Project Administrator), Ms. Yana Litovsky (Data Manager) and Ms. Alicia Coduras (NES coordinator) for their support through the GEM cycle. Dr. Rodrigo Varela and his team at Universidad ICESI continued to provide tremendous support, in so many ways, through the project as they have done in previous years. We also thank Carolina Robino, Lisa Burley, and the International Development Research Centre (IDRC) for their generous sponsorship. We are also grateful to researchers Stacy Charles and Tahirah David for their work on the agencies that support entrepreneurial firms in Trinidad and Tobago, and to Chris Harricharan for the cover design. Finally we thank Karen Lynch and SacodaServ Ltd for their data collection work. GEM reports would not be possible without the input of the respondents: including the entrepreneurs and experts from many fields who generously gave their time and expertise.

1
Introduction1 The Global Entrepreneurship Monitor (GEM) is a not-‐for-‐profit academic research consortium that has as its mission to contribute toward global economic development through entrepreneurship. To achieve this, GEM research seeks to deepen our understanding of entrepreneurship by conducting and disseminating research that: (1) measures the level and characteristics of entrepreneurial activity within and across countries; (2) identifies the principal factors which encourage or hinder entrepreneurial activity; and (3) provides guidance for the formulation of effective and targeted policies to foster the quality and quantity of entrepreneurial activity in each country. GEM is the largest single study of entrepreneurial activity in the world. Started as a partnership between London Business School and Babson College, it was initiated in 1999 with 10 countries, and has expanded to include 70 economies covering 75% of world population and 90% of world GDP by 2013. In 2013, the Arthur Lok Jack Graduate School of Business conducted the fourth annual survey of the rate and profile of entrepreneurial activity in Trinidad & Tobago. 2049 adults (aged 18 and older) were interviewed. Based on this survey, GEM estimated that 20% of the adult population was actively engaged in starting and running new businesses in 2013. Figure 1 illustrates the GEM conceptual framework. Two sets of conditions -‐ basic requirements and efficiency enhancers -‐ are foundation conditions that influence the way that a society functions and the well-‐being of its people. These have been adopted from the Global Competitiveness Report of the World Economic Forum (WEF). They form the general framework conditions that effect economic activity more broadly, but they are critical to entrepreneurship because without a solid institutional foundation, the entrepreneurship-‐specific conditions cannot function effectively.
Figure 1 also shows nine entrepreneurship framework conditions (EFC’s). The determinants of entrepreneurship are complex; the extent to which specific variables can be tied to the rate or profile of entrepreneurship in a particular economy are not well understood. The institutional environment is critical to the study of entrepreneurship however, because it creates conditions that entrepreneurs must navigate and that policy makers can address.
1 Adapted from Amoros, Jose and Bosna, Neils. (2014). Global Entrepreneurship Monitor (GEM) 2013 Annual Global Report. London: Global Entrepreneurship Research Association.

2
Figure 1: The Institutional Context and Its Relationship to Entrepreneurship
Source: 2012 GEM Global Report P.15.
The data used in the analysis are obtained through the two instruments of the GEM Study: the Adult Population Survey (APS) and the National Expert Survey (NES).
• The Adult Population Survey (APS) is administered to a representative national sample
of at least two thousand (2000) adults (18 and over). The sample includes those both in and out of the labor force e.g. employees, homemakers, retirees, and students. Only those people visiting the country, in institutions (prisons, mental institutions), group quarters or the military are excluded from the sample design.

3
• The National Expert Survey (NES) is used by GEM in order to study the views of experts
who are directly involved in delivering or assessing a major aspect of an entrepreneurial framework condition in their country. Experts are drawn from the various framework areas relating to the entrepreneurial environment.
The Phases and Profile of Entrepreneurship GEM recognizes that the prosperity of an economy depends greatly on a dynamic entrepreneurship sector. This is true across all stages of development. Entrepreneurship rates and profiles vary considerably between countries. Figure 2 illustrates the GEM measures across phases of entrepreneurial activity, with an added emphasis on profile factors.
Figure 2: The Entrepreneurship Process and GEM Operational Definitions
Adapted from 2013 GEM Global Report
The GEM model recognizes several phases of entrepreneurship, namely Potential Entrepreneurs, persons possessing Entrepreneurial Intent, as well as Nascent, New and Established Entrepreneurs. Due to the diversity, complexity and interdependence of the

4
conditions affecting entrepreneurship, it is difficult to establish that these phases are clear predictors of each other. For example, a society with many potential entrepreneurs may have a low rate of entrepreneurial activity due to particular environmental constraints. Similarly, there may exist a situation where high startup activity is accompanied by a relatively low number of established businesses which points either to a lack of sustainability among those startups or to environmental constraints that make it difficult to stay in business. As a result, in Figure 2, the arrows connecting the phases are uneven in order to illustrate that the relationship between the phases are not definitive.
The phases start out with potential entrepreneurs: those that see opportunities in their area and believe they have the capabilities to start businesses. Other factors include the extent to which individuals would not be deterred by fear of failure in pursuing opportunities. In addition, the broader society can influence the spread of entrepreneurship through perceptions about this activity as a career choice, the status of entrepreneurs in society and positive representation of entrepreneurs in the media.
The cycle continues: intent to start a business is followed by nascent activity, comprising entrepreneurs who are in the process of trying to start a new business. New business owners are former nascent entrepreneurs; they have been in business for more than three months, but less than three and a half years.
Together, nascent and new entrepreneurs compose total early-‐stage entrepreneurial activity (TEA).
Additional phases include established business ownership as well as business discontinuance, which can supply society with experienced entrepreneurs who may go on to start another business or to use their expertise and resources to benefit entrepreneurs in some way (through financing, advising, or other forms of support).
GEM emphasizes that it is not enough to study only the numbers of entrepreneurs and to compare numbers with other countries. The profiles of entrepreneurs–the characteristics of individuals who participate in this activity—differ considerably across countries. This is illustrated in the comparison of APS data between regions and countries.
This report reviews three profile factors: inclusiveness, industry, and impact. First, societies are more likely to realize the full potential of their entrepreneurial human resources when entrepreneurship is inclusive—that is, available to all people regardless of gender, age, ethnicity or other demographic grouping. Second, entrepreneurs will differ in the sectors in which they start businesses (consumer, extractive, manufacturing, business services); the mix of businesses in an economy may have particular implications. Finally, entrepreneurs impact their societies through their innovations, their international reach, and their growth ambitions.

5
GEM research links entrepreneurship to economic development by comparing the results of entrepreneurial activity across countries in different phases of economic development. For the purposes of classifying GEM countries according to their level of economic development, GEM uses the categories used by the World Economic Forum (WEF) in its Global Competitiveness Report, which identifies three phases of economic development based on GDP per capita and the share of exports comprising primary goods. The three economy groupings based on this categorization are: factor-‐driven, efficiency-‐driven, and innovation-‐driven, as outlined in Figure 3.
Figure 3: Economic Groups
Source: 2010 GEM Global Report.
Table 1 shows the countries that participated in the 2013 GEM project organized into geographic regions and development level. In 2013, Trinidad and Tobago was placed in the Innovation-‐Driven group. All of the other Latin American and Caribbean countries meet the criteria for Efficiency-‐Driven status in this model.

6
Table 1: GEM Economies by Geographic Region and Development Level in 2013
(Source: GEM 2013 Global Report).

7
Figure 4 shows patterns in the overall entrepreneurial perceptions and intentions among the countries that participated in the GEM research, by stage of economic development.
Figure 4: Entrepreneurial Perceptions and Intentions by Stage of Economic Development
*Fear of failure was assessed for those seeing opportunities. **Intentions were assessed among the non-‐entrepreneur population. In moving from factor-‐driven to innovation-‐driven economies, perceived opportunities show a decline. This is explained in the GEM Global Report (2012) as being linked to the type of business that a respondent has in mind when answering questions dealing with whether they perceive that the economy holds opportunities for new businesses. This in turn may be linked to the necessity versus opportunity motives which are discussed in the National Expert Survey section of this report. In moving from factor oriented economies towards more developed economies, the data suggest decreasing perceptions of respondents concerning their ability to operate a business along with an increasing fear of failure.
Factor-‐driven economies generally show relatively more favourable attitudes towards entrepreneurship compared to more developed economies, as well as markedly higher levels of entrepreneurial intentions.

8
Entrepreneurial Activity in Trinidad & Tobago The entrepreneurship process is a complex endeavour carried out by people living in specific cultural and social conditions. For this reason, the positive or negative perceptions that society holds about entrepreneurship can strongly influence the motivations of people to enter entrepreneurship. Societies benefit from people who are able to recognize business opportunities and who perceive they have the required skills to exploit them. If society has a positive attitude towards entrepreneurship, this can encourage cultural and social support, financial and business assistance, and networking benefits that will facilitate potential and existing entrepreneurs. The GEM survey includes the following indicators of attitudes towards starting a business:
Individual Self-‐perceptions • Awareness about good opportunities for starting a business in one’s area • Belief in one’s skills and experience to start a business • Attitude towards business failure Societal Impressions • Whether starting a business is considered to be a good career choice • The status of the entrepreneur • Positive or negative media attention for entrepreneurship
For perceived opportunities, Trinidad and Tobago ranks just above average and 6th highest among the Latin American and Caribbean economies, and 16th highest out of the 67 countries for which data for this item was collected in the 2013 APS. This is displayed in Figure 5 which shows all 67 countries grouped by region. Generally, the perceptions about opportunities offered by the local economy are relatively high in Latin America and the Caribbean – second only to Sub Saharan Africa as a region.
For perceptions about the ability to operate a business and fear of failure, Trinidad and Tobago is similar to the sub Saharan factor-‐driven economies with extremely high confidence on the part of APS respondents in their ability to operate a business and extremely low fear of failure. This is shown in Figures 6 and 7. This perception of high confidence among APS respondents in their ability in this regard has been a recurring and consistent finding for Trinidad and Tobago. This issue is taken up further in NES sections where the NES findings are discussed.

9
Figure 5: The percentage of respondents answering ‘Yes’ to the question ‘In the next six months, will there be good opportunities for starting a business in the area where you live?’.
Figure 6: The percentage of APS Respondents answering ‘Yes’ when asked if they were capable of starting and operating a new business

10
Figure 7: The percentage of respondents answering ‘Yes’ to the question ‘Would fear of failure prevent you from starting a new business?’
For perceptions about the image of the entrepreneur, Trinidad and Tobago ranks favourably relative to the other countries in the APS in 2012, ranking twelfth in terms of entrepreneurship as a ‘good career choice’ and in the top half in terms of favourable media attention and the status of the entrepreneur. The position of Trinidad and Tobago relative to other countries with regards to these questions are displayed in Figures 8 through 10.
Figure 8: The percentage of respondents answering ‘Yes’ when asked if they agree with the statement: “In my country, most people consider starting a new business to be a desirable career choice”

11
Figure 9: The percentage of respondents answering ‘Yes’ when asked if they agree with the statement: “In my country, those successful at starting a new business have a high level of status and respect.”
Figure 10: The percentage of respondents answering ‘Yes’ when asked if they agree with the statement: “In my country, you will often see stories in the public media about successful new businesses.”
While the rating given by the Trinidad and Tobago APS respondents has held relatively stable in the low 60’s, the position of Trinidad and Tobago has slipped as new countries (particularly in Sub-‐Saharan Africa) have joined the GEM study. At 61, Trinidad and Tobago is now next to the median position (60).
Figure 11 shows the levels of entrepreneurial intention reported by APS respondents for each country. Levels of entrepreneurial intent can change quickly at a national or regional level. In 2013, there were remarkable increases in this measure coming from the Middle East and North African countries, and some declines in Sub-‐Saharan Africa. The inclusion of new countries, declines in some Latin American countries and a decrease from 38 to 29 for Trinidad and Tobago repositioned Trinidad and Tobago from 6th to 8th highest position in Latin America and from to 15th to 20th highest worldwide on entrepreneurial intention.

12
Figure 11: Entrepreneurial Intentions in Ascending Order Grouped by Region

13
Table 2 shows the detailed scores for perceptions and attitudes towards entrepreneurship as captured in the Adult Population Survey for the Latin American and Caribbean countries that took part in the GEM Project in 2013. Table 2: Entrepreneurial Attitudes and Perceptions – 2013 GEM Results for countries in Latin America and the Caribbean
*Fear of failure was assessed for those seeing opportunities. **Intentions were assessed among the non-‐entrepreneur population.
Figure 12 shows the trends in Trinidad and Tobago over the period 2010-‐2013 in attitudes and perceptions towards entrepreneurship. In spite of the general fall in perceived opportunities, capabilities and image of entrepreneurship, and the increased concern with failure, there has been an increase in the perception of entrepreneurship as a good career choice. This suggests the existence of factors other than those in Figure 12 that play an important role in determining entrepreneurship as a good career within the Trinidad and Tobago population.

14
Figure 12: Trends relating to attitudes and perceptions towards entrepreneurship for Trinidad and Tobago over the period 2010-‐2013
15
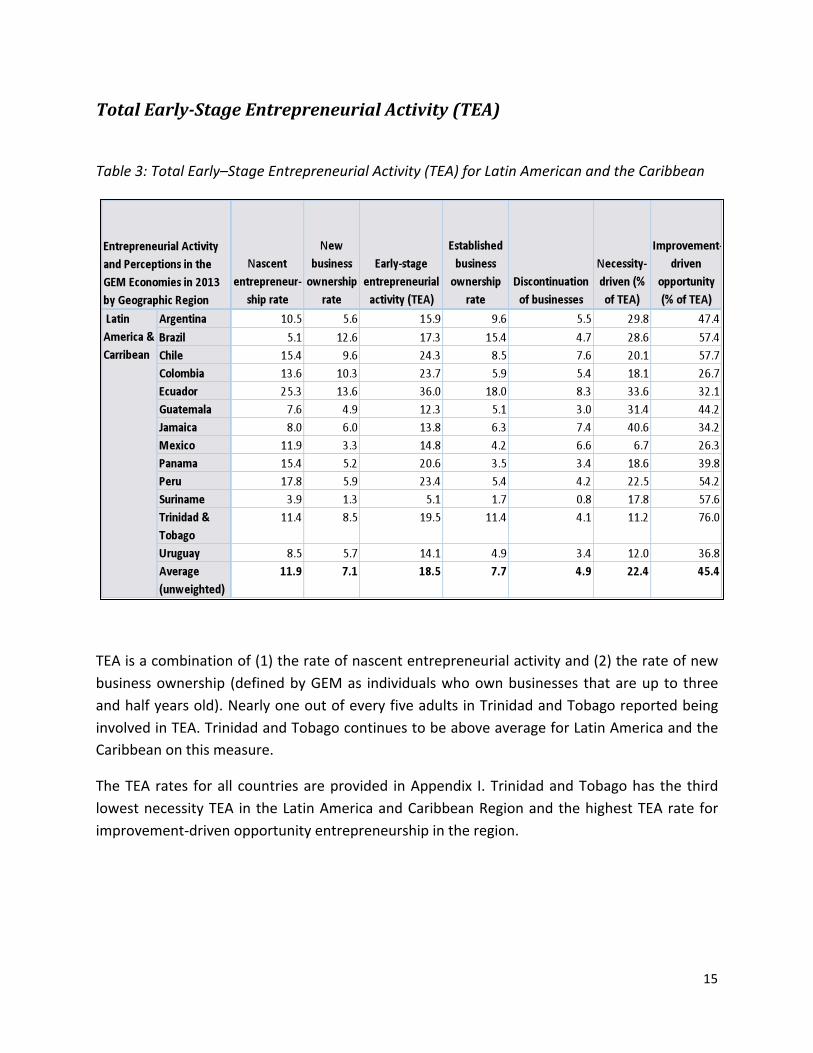
Total Early-Stage Entrepreneurial Activity (TEA)
Table 3: Total Early–Stage Entrepreneurial Activity (TEA) for Latin American and the Caribbean
TEA is a combination of (1) the rate of nascent entrepreneurial activity and (2) the rate of new business ownership (defined by GEM as individuals who own businesses that are up to three and half years old). Nearly one out of every five adults in Trinidad and Tobago reported being involved in TEA. Trinidad and Tobago continues to be above average for Latin America and the Caribbean on this measure.
The TEA rates for all countries are provided in Appendix I. Trinidad and Tobago has the third lowest necessity TEA in the Latin America and Caribbean Region and the highest TEA rate for improvement-‐driven opportunity entrepreneurship in the region.

16
Necessity versus Opportunity Entrepreneurship Figure 13: Motive for Total Early-‐Stage Entrepreneurship Activity in T&T (% of TEA)
GEM recognizes that entrepreneurs may have different motivations for starting a business: in essence, they may be pushed or pulled into entrepreneurship. Some people may be pushed into starting a business because they have no other work options and need a source of income. GEM classifies these entrepreneurs as necessity-‐driven. Others enter this activity primarily to pursue an opportunity; they are pulled into entrepreneurship by the prospect of opportunity. GEM identifies these as opportunity–driven entrepreneurs; furthermore, these individuals may desire greater independence in their work or seek to maintain or improve their income. GEM distinguishes those that pursue independence or increased income as improvement-‐driven opportunity entrepreneurs. The relative prevalence of opportunity-‐motivated versus necessity-‐motivated entrepreneurial activity can provide useful insights into the quality of early-‐stage entrepreneurial activity in a given economy. GEM research has consistently shown that the economic contribution of opportunity-‐motivated firms is higher than for necessity-‐driven enterprises. The GEM 2010 Global Report (Kelley et al., 2010) highlights a number of factors which can have a marked impact on the level of improvement-‐driven opportunity motivation within an economy. Figure 13 shows a trend of increased improvement-‐driven motivation for Trinidad and Tobago over the past 2 years.

17
Total Early-Stage Entrepreneurial Activity by Industry Sector
Figure 14: Sector Distribution of Total Early-‐Stage Entrepreneurship Activity in T&T (% of TEA) for period 2010-‐2013
GEM identifies four industry sectors: extractive, transforming, business services and consumer oriented services. Examples of the extractive sector are agriculture and mining businesses, whereas the transforming sector includes manufacturing and construction businesses. The business services sector is comprised of business support services such as accounting, marketing, and information technology and the consumer oriented consists mainly of retail businesses.
In factor-‐driven economies, the extractive sector tends to dominate TEA, whereas in innovation driven economies, the TEA has higher levels of transforming sector businesses and lower levels of extractive and consumer sector businesses.
Figure 14 shows that the composition of TEA in Trinidad and Tobago is gradually changing. Overall, in the period 2010 to 2013, there has been a decrease in contribution to Trinidad and Tobago’s TEA from consumer oriented services, and from the business services. There was also an increase in the contribution of transforming and extractive sector to TEA over the period 2011 to 2013.

18
Entrepreneurship by Gender, Age and Education (TEA) Figure 15: Percentage of Entrepreneurial Activity between males and females 2013
Globally the TEA tends to be higher among men than it is among women. As seen in Figure 15, Trinidad and Tobago continues to be consistent with the rest of the region in this regard with a male TEA rate of 23% and a female TEA rate of 16%.

19
Figure 16a: Percentage of Entrepreneurial Activity among the different age groups 2013
Figure 16b: Age breakdown of TEA participants 2013
Figure 16a indicates that 26.7% of respondents aged 25-‐34 years old are engaged in early-‐stage entrepreneurial activity followed by 23.8% of the age group 35-‐44 years and 17.1% of the age group 45-‐54 years old. Figure 16b shows the age breakdown of TEA participants. The age group with the highest percentage of TEA participants is the 25-‐34 group. The bell shaped profile of entrepreneurial activity across age groups is consistent with international data, with the highest

20
TEA rates generally occurring in among 25-‐34 year-‐olds, and the second highest in the 35-‐44 age group. However, the TEA rate among 18-‐24 year-‐olds in Trinidad and Tobago is approximately 10% which is lower than the average for Latin and Caribbean countries (14%). In Trinidad and Tobago, the combined age group 25-‐44 accounts for 62.4% of TEA participants and consequently consideration could be given to policies and programmes that would improve the capability of early-‐stage entrepreneurs to develop high growth innovative businesses.
Figure 17: Entrepreneurial Activity broken down by level of Education 2013
Figure 17 shows the highest level of education attained by TEA participants. 40.4% of the TEA entrepreneurs are formally educated up to the secondary level. In the entrepreneurship environmental scan, entrepreneurial education and training was observed to be concentrated in the tertiary education system, predominantly at the Masters level. 6.8% of entrepreneurs have attained tertiary stage 2 education, thus the capabilities that the TEA participants possess to develop and manage high growth innovative entrepreneurial ventures within Trinidad and Tobago may have been acquired informally such as mentorship. There may be some opportunities to develop informal entrepreneurial education programmes. Entrepreneurship in the education system is revisited in the APS, NES and the environmental scan sections of this report.

21
Business Discontinuance Figure 18: Business Discontinuance rate in Trinidad & Tobago 2010 -‐ 2013
The discontinuance rate is the percentage of the adult population that had sold, shut down, or otherwise discontinued a business that they owned and managed in the twelve months preceding the survey.
Trinidad and Tobago has a low rate of business discontinuance rate compared to the rest of the region. Figure 18 shows that this rate has declined even further in 2013.

22
Figure 19: Reason for Exit (% Respondents who Discontinued Businesses)
Figure 19 shows the main reasons for business discontinuance. In 2013 the main reason for business termination is ‘business not being profitable’. ‘Problems getting finance’ also emerged as an important reason for business discontinuation.
The main reasons for business discontinuance in Trinidad and Tobago should be investigated further by sector to understand whether there are any sectoral trends in profitability, availability of finance and business discontinuation.

23
Innovation GEM endeavours to gauge not only the quantity of entrepreneurial activity in a country but also the quality of the business ventures. One indicator that can be used as a measurement for the quality of a business is the level of innovation associated with the enterprises. Figure 20 shows that 83.4% of early-‐stage entrepreneurs in Trinidad and Tobago used no new technology, 82.6% reported that the product which they offered for sale was not new to any customers and 62.4% of individuals involved in TEA provided a product offering that were the same as many other businesses. Furthermore, none of the nascent and baby businesses were involved in the high or medium technological sectors.
Figure 20: Innovation in Total Early-‐Stage Entrepreneurship Trinidad and Tobago 2013
The low level of innovation is not limited to early-‐stage entrepreneurs but is observed among established businesses as well. The results in Figure 21 show that 93.6% of respondents indicated that no new technology was used, with 87.9% reporting that their product was not new to any customers and 71.5% reporting that many businesses offer the same product. None of the established businesses were involved in the high or medium technological sector. The striking similarity between the two groups suggests that the lack of innovation is widespread among businesses of different ages and types.

24
It is now widely recognized that Trinidad and Tobago needs to diversify its economy to reduce its dependence on the energy sector. Entrepreneurship is seen as having great potential in transforming the economy. The contribution of entrepreneurship to economic diversification will depend on the extent to which entrepreneurial firms are innovative, job-‐creating, have high growth potential and sell successfully in export markets.
Figure 21: Innovation for Established Businesses Trinidad and Tobago 2013

25
Entrepreneurial Aspirations Figure 22: Current Job Creation for Early-‐Stage Entrepreneurial Activity 2013. (% of TEA Enterprises)
Figure 22 shows the number of jobs created by TEA firms and established businesses in Trinidad and Tobago. 49% of TEA businesses have not created any jobs and 51% of TEA business created 1-‐5 jobs. Job creation is linked to the type and performance of a business. The factors driving the low levels of job creation by TEA businesses in Trinidad and Tobago should be investigated in future GEM studies.

26
Figure 23: Job Growth Expectation for Early-‐Stage Entrepreneurial Activity 2013 within 5 years (% of Adult Population)
Along with the low levels of actual job creation, TEA businesses in Trinidad and Tobago also show low levels of job growth expectations when compared with the rest of the region (Figure 23). This figure shows job creation expectations among entrepreneurs in each country. In the case of Trinidad and Tobago, 10% of the adult population expect to create 0-‐5 jobs, 4% expect to create 5-‐19 jobs and 2% expect to create 20 or more jobs. Further research should be undertaken in Trinidad and Tobago to investigate the differences between enterprises in the job creation bands of Figure 23. This insight can inform policy making to promote higher growth and higher job creation within entrepreneurial enterprises.

27
International Orientation The international orientation of the entrepreneur is another indicator used by GEM to determine the nature of entrepreneurial aspirations within a country. This measure provides some insight into the ambition of the entrepreneur with regard to gaining an international presence for their products and brands. Figure 24 shows that early stage entrepreneurs in Trinidad & Tobago do not explore international opportunities, thus limiting the potential of their businesses to the domestic market. Both the TEA and established businesses have relatively low levels of international orientation. 63% of TEA and 64% of established businesses have no customers outside of Trinidad and Tobago. 30% of TEA and 34% of established businesses have less than 25% of their customer base outside of Trinidad and Tobago. 5% of TEA and 2% of established businesses have more than 75% of their customer base outside of Trinidad and Tobago.
Figure 24: Percentage of Entrepreneurs with International Orientation (% of customers outside of home country)

28
Entrepreneurship and Well-being
Figure 25: Quality of Life as Reported by Entrepreneurs and Employees

29
Thirteen quality-‐of-‐life questions were included in the worldwide APS (Figure 25). This allows a comparison of quality of life as reported by employees and self-‐employed. On all 13 questions, entrepreneurs reported higher levels of agreement and lower levels of disagreement with the positive statements. Entrepreneurs generally reported higher levels of well-‐being than those who work for others.
Entrepreneurship and Health The EuroQol EQ-‐5D-‐5L Self Reported Health (SRH) instrument was added to the GEM Adult Population Survey (APS) for the participating countries. The EQ-‐5D-‐5L descriptive system comprises 5 dimensions of health, each of which has 5 levels. The dimensions and levels of EQ-‐5D-‐5L are displayed in Figure 26.
Figure 26: The 5 Dimensions of the EQ-‐5D-‐5L Descriptive System and their Levels.
The EQ-‐5D-‐5L questionnaire comprises 5 questions in which a respondent is asked to choose the one statement from each column that best describes their situation. Respondents are also asked to give an overall rating of their health on a scale of 0 (worst possible health) to 100 (best possible health). This is known as the Visual Analogue Scale (VAS) value. The EQ-‐5D instrument

30
is well known and widely used in health economics as a measure of health outcomes. However the application that is of interest here is its use in comparing the health status of different groups.
Figure 27 shows the percentages of the entrepreneurs, employees, and the unemployed who reported problems at any level (other than 1) for the 5 dimensions of the EQ-‐5D instrument. Entrepreneurs reported higher frequencies of problems than employees on the Mobility, Usual Activities, Pain/Discomfort and Anxiety/Depression dimensions. The difference in the VAS values between employees and entrepreneurs was not significant at the 5% level.
Figure 27: The Percentages of Respondents Reporting Any Problems of the EQ-‐5D Descriptive System Broken Down by Work Arrangements
Several factors were investigated in an effort to explain this finding—including demographic factors, and differences in private health insurance coverage. The age profiles of the two groups are the most likely cause for this difference. Figure 28 shows that comparing full time entrepreneurs with full time employees, employees dominate the younger age groups in Trinidad and Tobago, while entrepreneurs dominate the older age groups.

31
Figure 28: Age Distributions of Full Time Employees and Entrepreneurs
Figure 25 shows that for the statement “At my work, I am not exposed to excessive stress” a greater percentage of entrepreneurs agreed than the percentage of employees who agreed (both strongly and somewhat). However, in Figure 27, entrepreneurs reported a higher frequency of problems on the Anxiety/Depression dimension. Figure 29 shows the frequency of problems on the EQ-‐5D AD dimension for each level of agreement with the work-‐related stress question form the well-‐being instrument. This is presented for all working and self-‐employed APS respondents combined. Those who least agreed with the statement about not experiencing stress at work, also reported the highest frequency of level 2 problems on the EQ-‐5D AD dimension. For the other three levels on this dimension however, there is no clear pattern. This suggests that respondents distinguish between work-‐related stress and other causes or manifestations of health-‐related anxiety/depression. It may also point to an issue with the use of the word “excessive” in the stress question of the well-‐being instrument.

32
Figure 29: Frequency of Problems on the EQ-‐5D AD Dimension by Level of Agreement with the Work-‐Related Stress Question form the Well-‐being Instrument (All working and Self-‐Employed APS Respondents Combined).

33
National Expert Survey GEM assesses the state of the entrepreneurial framework conditions existing within a country through the use of the National Expert Survey (NES). This survey attempts to capture the expert opinion of individuals with over ten years experience working in nine social spheres:
• Finance: bankers, public managers of financial programmes or subsidies, venture capitalists, business angels, entrepreneurs, and business people in general.
• Policy Makers: public officers involved in economics, taxation, and development agencies.
• Public Program Administrators: personnel in government programmes, public agencies, business associations, development agencies, entrepreneurs and people to whom the programmes are addressed.
• Education: Professors, lecturers, teachers (school, college, university, professional or vocational education), and other personnel involved in education.
• R&D Transfer: personnel in industry, innovation, development and growth, public or private agencies, scientific parks personnel, university researchers, engineers, some technological and scientific entrepreneurs.
• Commercial and business services: lawyers, accountants, advisors economists, market analysts, and survey vendors.
• Market openness: market analysts, some researchers at universities or business schools, business associations, commerce chambers, governmental agencies involved with the economy and development.
• Physical infrastructure: personnel from businesses and enterprises that provide utilities (water, phone, electricity), engineering, real estate, governmental agencies related to infrastructure, industrial parks, etc.
• Cultural and social norms: business associations, press, media in general, customers, providers, sociologists, entrepreneurs, foundations, researchers, and trade unions.
A total of 36 experts were interviewed for the Trinidad and Tobago NES. In addition to providing an understanding of the entrepreneurial framework conditions, the NES facilitates the triangulation of the findings of the adult population survey. NES respondents are provided with a set of statements about the attitudes, perceptions, and aspirations of entrepreneurs that mirror questions asked of the general population in the Adult Population Survey (APS) and asked to express the extent of their agreement on a Likert scale. This allows for a direct

34
comparison of perceptions among the general public with the perceptions of experts. The following sections will include a more detailed examination of each of the conditions necessary to foster a healthy entrepreneurial environment.
Figure 30 shows the overall ratings that the NES respondents gave to main indicators for entrepreneurship framework conditions in the Latin America and Caribbean countries that took part in the GEM study in 2013.
Figure 30: Scores on Entrepreneurship Framework Conditions Rated by National Experts across Latin America and the Caribbean
Compared to the rest of the region, NES respondents in Trinidad and Tobago rated their country favourably in the areas of finance, commercial and physical infrastructure and cultural and social norms. Trinidad and Tobago received NES ratings that were less favourable than average ratings in the region for R&D transfer and internal market openness. Figure 30 shows the conditions necessary for a successful entrepreneurial environment. Accessibility to physical and commercial infrastructure and finance were rated satisfactorily. However, the transfer of research and development, internal market openness government policies and regulation and entrepreneurial education at the primary and secondary level remain among the top areas with room for improvement.

35
Finance Figure 31 shows that 76% of the experts in Trinidad and Tobago believed that there is sufficient equity funding and 77% of experts agreed that there was sufficient debt funding available for new and growing firms. Approximately 60% of the experts believed that there were sufficient government subsidies available for new and growing firms and only 57% believed that funding was available from the private sector. Venture capitalism and initial public offerings remain less popular sources of financing compared to the others mentioned previously as only 45% of experts and 46% of the experts considered these sources to be adequate.
The attention and effort that have been given to finance for entrepreneurial firms in Trinidad and Tobago over the past few years continue to produce improvements in the NES ratings dealing with this issue. The overall NES rating of the financial environment moved from 2.5 in 2012 to 3.1 in 2013. The percentage of respondents reporting all six statements in Figure 31 to be true increased in 2013 over 2012. The financial environment moved from the 5th highest entrepreneurial framework condition in 2012 to the second highest in 2013 for Trinidad and Tobago.
Figure 31: Perceptions of NES Respondents Concerning Finance

36
Government Policy One of the key roles of government is facilitate a stable business environment through the use of policy. Figure 32 shows that there is a widespread perception among experts (76%) that policy creation generally does not favour new and growing firms and 88% of experts agree that these firms find it difficult to cope with government bureaucracy and regulations. 87% of NES respondents also expressed that it is not possible for new firms to receive the requisite licenses and permits in a week. The majority of experts (76%) do not believe that new firms are sufficiently prioritized during the policy formulation process.
Figure 32: Perceptions of NES Respondents Concerning Policy
This pattern has remained consistent over the past few years. The biggest issues identified by NES respondents continue to be in the areas of regulatory requirements, licenses, etc. to set up and operate new businesses, and in policies and support towards new and growing firms. According to the NES respondents, government policy fears somewhat better in the areas of tax and regulatory predictability.

37
Government Programmes Further investigation into the availability of government programmes reveals that 82% of experts believe that new and growing firms are unable to get a wide range of services from a single agency. In Figure 33, 60% of the NES respondents felt that the programmes for new and growing businesses were inadequate and 65% of the experts expressed a difficulty for new and growing firms to get what they need from a government program. While 50% of the experts perceived that there were an adequate number of government programmes for new and growing businesses only 25% of experts were of the opinion that almost anyone who needed help from a government program can find what they need. Only 30%, of the experts believed that the government programmes were effective.
The 2013 NES showed an improvement in the opinions dealing with science parks and incubators. The percentage of NES respondents agreeing with the statement “Science parks and business incubators provide effective support for new and growing firms” increased from 21 % in 2012 to 36% in 2013. This reflects the efforts that have gone into the development of these programmes and investments in building awareness.
Figure 33: Perceptions of NES Respondents Concerning Government Programmes

38
High Growth Enterprises and Support for Such Enterprises In Figure 34, 61% of the experts reported that policy-‐makers are aware of the importance of high-‐growth entrepreneurial activity. However, 60% of experts were of the opinion that support initiatives targeted at high growth firms were not sufficient. Expert respondents were more or less equally divided in perception about how selective government programmes were when choosing recipients for entrepreneurship support and 55% reported that potential for rapid growth was used as a selection criterion.
Figure 34: NES Respondents’ Perceptions Regarding Support for Entrepreneurs

39
Market Openness Market openness refers to the degree to which barriers to entry exist or the ease with which new firms both local and international can enter the market. The NES respondents believed that issues of market openness present special challenges to new and growing firms. The most urgent issues in Figure 35 relate to enforcement of anti-‐trust legislation and retaliation by established firms. Cost and other entry barriers were also identified by NES respondents with less than 30% of them rating as “somewhat true”, the statements that new and growing firms can easily “afford the cost of entry” and “enter new markets”. No NES respondents rated these two statements as “completely true”.
Figure 35: NES Respondents’ Perceptions Regarding Market Openness

40
Education and Training
Investments in entrepreneurship education can promote entrepreneurial activity and improve entrepreneurial outcomes. Figure 36 shows the NES responses relating to education. More than 50% of the experts agree that the level of business and management education as well as the level of vocational professional and continuing education systems provide adequate preparation for starting up and growing new firms. However, only 17% of the experts believed that there was sufficient emphasis on providing entrepreneurial education at the primary and secondary level. According to just over 60% of the experts, the education offered at the primary and secondary level did not do enough to encourage creativity, self-‐sufficiency, and personal initiative nor provide the right foundation in market economic principles necessary for starting high growth firms.
Figure 36: NES Respondents’ Perceptions Regarding Education
The pattern in Figure 36 is one of NES respondents rating entrepreneurship education at the primary and secondary levels as being weak or inadequate, while expressing greater confidence

41
in efforts within the tertiary education sector. This pattern has continued over the recent GEM cycles, although some measures continue to be implemented such as the inclusion of Entrepreneurship as a Caribbean Advanced Proficiency Examination (CAPE) subject to be taught in high schools.
Interest in Innovation/Research and Development Transfer
Figure 37 shows that there is a perception among 83%, 92% and 77% of the experts respectively that consumers in Trinidad & Tobago place great value on innovative products and are very open to trying new products and services and are even open to buying these products and services from new entrepreneurial companies. However, a smaller percentage of the experts (60% and 53% respectively) agreed that companies placed a high value on innovation or were inclined to experiment with new technologies and new ways of doing things. According to 40% of the experts, established companies were fairly reluctant to using new entrepreneurial companies as suppliers.
Figure 37: Perceptions of NES Respondents Concerning Interest in Innovation

42
Improvements in innovation may be achieved through improved transfer in research and development. In Figure 38, 90% of the NES respondents believed that there was insufficient support available for engineers and scientists to commercialize their ideas and 82% were of the opinion that new and growing firms could not afford the latest technology. R&D transfer problems were thought to be derived from the lack of adequate subsidies for the cost of the latest technology by 76% of experts and the lack of a proper science and technology base to efficiently support the creation of world class new technology based products by 64% of experts. Overall only 25% of the experts thought that the transfer of technology, science and other knowledge to new and growing firms was not conducted in an efficient manner.
Figure 38: Perceptions of NES Respondents Concerning R&D Transfer

43
Physical, Commercial & Services Infrastructure Trinidad & Tobago has consistently been rated highly in the NES on the quality of physical infrastructure. In Figure 39, the majority of experts were in agreement with all the physical infrastructural indicators for new and growing firms. 92% felt that new firms could afford basic utilities and 75% of experts considered good access to communication was not too expensive while 78% were of the opinion that new or growing firms had good access to utilities.
Figure 39: Perceptions of NES Respondents Concerning Physical Infrastructure
The commercial infrastructure is also perceived to be in good shape as 60% of the experts found that there were enough subcontractors, suppliers and consultants to support new and growing firms (Figure 40). 67% of the experts considered it to be easy for new and growing firms to get good, professional legal and accounting services as well as good banking services (59%). The majority of experts (71%) however did not believe that the new and growing firms could afford the cost of using these services and the experts were equally divided on the issue of how easy these services can be accessed.

44
Figure 40: Perceptions of NES Respondents Concerning Commercial Infrastructure
Cultural and Social Norms/Motivation and Entrepreneurship as a Career Choice
In order for entrepreneurship to flourish, it is important that it becomes part of the national psyche and is considered part of the cultural and social norms within society. In Figure 41, according to 59% of the NES respondents, the national culture is highly supportive of individual efforts and 63% agree that it encourages innovativeness and creativity. Overall 58% of the experts described the culture as individualistic. However, the beliefs among the NES respondents regarding cultural and social norms and entrepreneurship appear to be mixed: 30% of the experts agreed that the national culture encourages risk taking or emphasizes self-‐sufficiency, autonomy and personal initiative.

45
Figure 41: Perceptions of NES Respondents Concerning Cultural and Social Norms
Although the national culture is generally not perceived to be one that encourages entrepreneurial risk taking 66% of experts see new ventures as an appropriate way to become rich and 81% of them consider successful entrepreneurs to have a high level of status and respect. There is also a perception among 64% of the experts that most people think of entrepreneurs as competent and resourceful individuals and that the media is also keen on portraying these individuals in this manner. However despite all the media attention and the positive perception of entrepreneurship the experts were fairly equally divided in opinion when asked about whether most people considered becoming an entrepreneur as a desirable career choice. The APS data show that the general public actually considers entrepreneurship much more favourably as a career choice than the NES respondents believe that they do.

46
Figure 42: NES Respondents’ Perceptions Regarding Entrepreneurship as a Career Choice
Well-being of Entrepreneurs
Entrepreneurial activity can be a liberating experience or an equally stressful undertaking that could be taxing to the personal health and wellness of the entrepreneur. Figure 43 shows that in Trinidad & Tobago 66% of the experts believed that entrepreneurs usually appear more satisfied with their personal life than non-‐entrepreneurs and 67% reported that entrepreneurs usually appear more satisfied with their working life than non-‐entrepreneurs. However, 53% of experts felt that the general conditions in the environment didn’t allow people to achieve a proper work life balance. These NES findings are consistent with those of the well-‐being findings of the APS.

47
Figure 43: NES Respondents’ Perceptions regarding the Well-‐being of entrepreneurs
Entrepreneurial Opportunities in the Economy
Figure 44 shows that there was a high level of optimism among 68% of the experts who indicated that there were many good opportunities for the creation of new firms. However, 49% were less optimistic about the prospect of creating truly high growth firms. The data suggests that there has been an upward trend in the proliferation of good opportunities over the past five years (55% of experts) and additionally 55% of the experts believe that individuals can easily pursue these opportunities.

48
Figure 44: Perceptions of NES Respondents Concerning Opportunities
Entrepreneurial Abilities and Knowledge to Facilitate New Venture Start-ups NES respondents generally did not perceive that the adult population to have the required knowledge and ability to start businesses particularly high growth firms. In Figure 45, 55% of the experts believed that many people know how to start and manage a small business. However, only 19% of the experts felt that many people knew how to start and manage a small business and 22% agreed that many people have the ability to organize the resources required for a new business. According to 60% of the experts the adult population of Trinidad and Tobago continues to lack experience in starting a new business and 55% were of the perception that many people have problems reacting quickly to good opportunities for a new business.

49
Figure 45: NES Respondents’ Perceptions Regarding Entrepreneurial Ability
The contrast between the high levels of self-‐perceived capability reported in the APS, and the low perception of entrepreneurial ability in the NES has persisted over the 4 GEM cycles for Trinidad and Tobago. The 2013 NES shows a further decline in the percentage of NES respondents who agree with the statement “many people know how to start and manage a small business”.
Women Entrepreneurship and Support
There has been a gender gap in entrepreneurship participation rates for the past few years. Figure 46 shows the NES responses relating to gender. In terms of attraction and readiness to participate in entrepreneurship, 60% of the experts perceived that starting a new business is a socially acceptable career option for women and 53% felt that men and women have the same level of knowledge and skills to start a new business. However, only 34% believe that women are encouraged to become self-‐employed or start a new business. Although most experts (42%) see men and women as having equal exposure to good opportunities to start a new business,

50
50% of experts believe that sufficient social services are not available for women to continue to work even after they start a family.
Figure 46: NES Respondents’ Perceptions Concerning Gender
Youth/Young Adults and Entrepreneurship
The 18-‐34 age group is an important demographic that can be a viable source of new entrepreneurs bringing fresh ideas that can increase the quality of firms being created. Special attention is paid to entrepreneurs in this age group in Trinidad and Tobago. Figure 47 shows that all of the NES respondents believed that young people have universal access to primary and secondary education, however 75% of the NES respondents believed that self-‐employed youth learn to develop their business activities largely through their own experience. According to 53% there are many good opportunities to develop micro business for youth. The data suggests that this group generally engages in entrepreneurial activity primarily to take advantage of these opportunities. 48% of the experts disagreed with the statement that youth are pushed into business out of necessity and 56% also disagreed that most youth have no other option but to work.

51
Figure 47: Perceptions of NES Respondents Concerning Youth (14-‐20)
The older group known as young adults were perceived by 87% of experts to favour work opportunities outside of the country in favour of local entrepreneurial activity. This may be related to the perception among 78% of experts that youth and young adults face greater constraints to entrepreneurship relative to the general adult population. Figure 48 shows that there is the belief among 78% of experts that young adults are not significantly involved in entrepreneurship and this may stem from the view of 71% of them that there is not a strong support system from family and friends for starting new business coupled with a lack of an adequate system of business incubators (55%) and insufficient access to finance through micro credit facilities and from more traditional financiers (67%).

52
Figure 48: Perceptions of NES Respondents Concerning Young Adults (21-‐34)

53
Agencies that Support Entrepreneurial Firms in Trinidad and Tobago
The Small and Micro Enterprise (SME) sector has long been recognised as having great potential for economic growth and for diversification of the Trinidad and Tobago economy. Many initiatives, studies and publications have been produced to help develop the SME sector. In particular, the Medium Term Policy Framework2 (MTPF) of the Ministry of Planning and Sustainable Development and the Enabling Competitive Business Sector Strategy3 (ECB) documents lay out specific initiatives that aim directly to develop the SME sector. There is also the Operational Plan of the National Business Incubation System authored by the Ministry of Labour, Small and Micro Enterprise. All of these documents point to the need to transform the SME sector into high value added activities that are innovative and export competitive. They also recognize the important role of SMEs in economy. This will be further crystallized by the SME Policy document that is currently before Parliament for approval.
There are now several agencies that provide services and support to SME firms and entrepreneurs in Trinidad and Tobago. These agencies and their areas of focus are listed in Figure 49 and now discussed in order to provide an overview of the support available to entrepreneurs. This outline of SME support is based on the public documents and websites of the organizations, and interviews with key personnel. Some recommendations on this support are presented in the Recommendations Section.
2 http://www.planning.gov.tt/mediacentre/documents/medium-‐term-‐policy-‐framework 3http://www.molsmed.gov.tt/Portals/0/Enterprise%20Development%20Division/Enabling%20Competitive%20Business%20(ECB)%20Strategy%20DOC.pdf

54
Figure 49. Agencies set up to Support Entrepreneurs and SME Firms
Category Institution Focus
1. Ministries and Government Agencies
• Ministry of Labour, Small and Micro Enterprise
• Ministry of Planning and
Sustainable Development (i2i)
• Ministry of Trade, Investment & Communications
• NEDCO • YTEPP • ExporTT
Community Incubation, training, development and support at the community level
and focus on local strengths in innovation
2. International and Regional agencies
• World Bank
• YBTT • CARIRI • Startup Weekend
Programmes for at-‐risk or
marginalized groups such as youth, women or specialized groups such as technology
entrepreneurs especially mobile technology.
3. University Incubators
• LokJack GSB BizBooster • UTT
• UWI
Commercial Incubation of high potential firms and support of
entrepreneurial students.
4. Chambers of Commerce
• AmCham • T&T Chamber of
Commerce
Mentorship of new firms and support of youth in
entrepreneurship
5. The Banking Sector
• Commercial Banks • Credit Unions • The Central Bank of
Trinidad and Tobago
Financial literacy, business advisory and the provision of SME tools

55
Ministry of Labour and Small and Micro Enterprise Development
All incubators in Trinidad and Tobago can be seen as part of the Integrated Business Incubation System (IBIS) 4. This concept is a joint initiative of the Ministry of Labour and Small and Microenterprise Development and NEDCO. The main vehicle for the implementation of this project is the public-‐private partnership. The Ministry engages financiers, training and service providers, mentors, rating agencies, educational and research institutions, professional organizations as well as NGOs to make this entrepreneurial dream a reality.
i2i Competition (Ministry of Planning and Sustainable Development )
Whereas agencies such as NEDCO were set up to support small businesses in general, the Ideas to Innovation programme (i2i) is set up to identify and help bring highly innovative-‐high potential ideas to fruition through grant funding, and business support services. The i2i programme is set up as a competition by the Ministry of Planning and Sustainable Development. In this competition applicants submit their ideas and winners of this preliminary stage move on to develop their ideas into businesses through the support of the programme. Over the past two years, over 100 entrepreneurs have qualified for support under the i2i programme.
Ministry of Trade, Investment and Communications
TT BizLink is an IT platform that has been established by the Ministry of Trade, Investment and Communications. It is set up as a single electronic window through which the various permits, forms, licenses, etc. required for foreign trade can be processed on-‐line. The aim is to reduce the bureaucratic burden for all firms including those in the SME sector.
National Entrepreneurship Development Company (NEDCO)
NEDCO was established in 2002 to support the SME sector – particularly in the areas of obtaining finance and setting up new businesses. With 10 branches, NEDCO offers the broadest range of support services for SME firms in Trinidad and Tobago. It focuses on running the Community Based Business Incubators (CBBIs). This programme is making a significant impact in the social entrepreneurship landscape of the country. It offers physical infrastructure, financing, operational support and networking to develop competitive and sustainable
4http://m.guardian.co.tt/business/2013-‐03-‐31/nedco-‐helps-‐small-‐man

56
businesses. In addition, to the established incubators, NEDCO has formed Entrepreneurial Institute and Incubation Centres (ETTIC) to provide business and entrepreneurship training to NEDCO customers. Collectively, these centres have trained more than 10,000 entrepreneurs in the country.
Youth Training and Employment Partnership (YTEPP)
Another programme that targets entrepreneurs and prospective entrepreneurs up to the age of thirty five is the Youth Training and Employment Partnership Programme. The support services offered by YTEPP to entrepreneurs up to age 35 centre around their 80+ training programmes (vocational and entrepreneurship programmes).
ExporTT
ExporTT, formerly the Business Development Company (BDC), is the National Export Facilitation Organization of Trinidad and Tobago. This organization’s mandate is to increase the international competitiveness of exporters while generating growth and diversification in the export sector. It provides many workshops to entrepreneurs to make them export ready5.
Youth Business of Trinidad and Tobago (YBTT)
Youth Business Trinidad and Tobago (YBTT) is an accredited programme of Youth Business International
which along with the business community helps young people get involved in the SME sector through mentorship and access to loan financing. YBTT targets entrepreneurs up to the age of 35. YBI was founded in 2000, it is a global non-‐for-‐profit organization, and is one of the Prince’s Charities presided
over by the Prince of Wales6.
Lok Jack GSB BizBooster
This incubator was launched in May 2012. It is a subsidiary of the Arthur Lok Jack Graduate School of Business. This organization was setup with the purpose of supporting the growth of SMEs in Trinidad and Tobago. It is a Commercial Business Incubator (CBI) with the mandate to
5http://www.exportt.co.tt/about 6http://www.youthbusiness.org/

57
incubate firms with high growth potential7. There is a strong focus on networking, B2B match-‐making and Investor matchmaking in this incubator. This incubator provides mentorship as well as training through its parent company. Entrepreneurs in the incubator also have use of the business school’s facilities including its computer lab and its library. The Lok Jack GSB, the parent company of this incubator, also offers an International Master of Business Development and Innovation and Business Development (IMBDI) as well as a Master of Small and Medium Enterprise Management (MSEM).
University of Trinidad and Tobago (UTT)
The UTT is in the process of setting up incubators that match the academic offerings of the university. For example, there is a specific incubator for fashion as well as animation. This is done with support of the private sector through signed MOUs. This plan will allow the University to fully support the entrepreneurial pursuits of its students. In addition, the University hosts a business plan competition on an annual basis.
University of the West Indies
The UWI has a NEDCO office on campus to facilitate the coaching of students with entrepreneurial aspirations. It also hosts an annual business bootcamp in partnership with NEDCO. There is also a minor in Entrepreneurship offered on the campus for undergraduate students as well as several electives in the area of Entrepreneurship. This university also offers a MA in Creative Design Entrepreneurship.
COSTAAT
This college is a service provider for programmes offered to entrepreneurs in NEDCO’s Community Based Business Incubators (CBBI). In addition, it offers a BBA in Entrepreneurship to undergraduate students under its Department of Management and Entrepreneurship8. There is a proposal to add an incubator to their offering but it has yet to be implemented. This institution has focused on train-‐the-‐trainer programmes in the area of Entrepreneurship. In this regard, they have partnered with Babson College, a college rated #1 for their impact in
7http://www.lokjackgsb.edu.tt/bizbooster 8http://www.costaatt.edu.tt/academics/school-‐of-‐business-‐and-‐information-‐technologies/department-‐of-‐entrepreneurship-‐and-‐management

58
Entrepreneurship. They have also collaborated with the Massachusetts of Technology (MIT) and Tufts University, USA to provide workshops for budding entrepreneurs.
CARIRI
The Caribbean Industrial Research Institute (CARIRI) is a research and technological organization. It has invested in a 20 million TT dollar Center for Enterprise Development (CED) to house their incubation programmes. There is a strong focus on technology and innovation in their incubation programme with a special focus on mobile app innovation9.
Start-‐up Weekend Trinidad and Tobago
The global network Start-‐up Weekend also operates in Trinidad and Tobago. Start-‐up Weekend hosts a weekend event that includes marketers, product developers, and entrepreneurs to develop a business idea in 54 hours. This provides a forum for those with business ideas to make a ‘pitch’ among a group of peers. Ideas that pass this first stage are then developed further through a workshop.
AmCham T&T
The incubator of the American Chamber incubates two to three firms a year. The incubator is a project of their Trade and Investment Committee. The Ministry of Labour, Small and Micro Enterprise drew on the experience of this Chamber in the formulation of the Integrated Business Incubation System (IBIS). They also collaborated on the establishment of CARIRI’s incubator10.
Chamber of Commerce
The Trinidad and Tobago Chamber of Commerce trains approximately 100 teens annually in the area of Entrepreneurship. This occurs under its JumpStart programme. This programme has
9http://www.guardian.co.tt/business-‐guardian/2013-‐07-‐11/cariri-‐launches-‐20m-‐centre-‐push-‐enterprise 10http://www.amchamtt.com/Downloads/2013%20AGM-‐%20President's%20Report%20(2).pdf

59
been in existence for over fifteen years and focuses on secondary students in 5th and 6th forms including secondary students from Tobago11.
The Banking Sector of Trinidad and Tobago
In addition to the agencies mentioned above, there are other initiatives that offer services through which SME firms can also benefit. There are some major initiatives in the banking sector. The Central Bank of Trinidad and Tobago offers a financial literacy programme which includes training on the setting up of a new business. The four major banks in Trinidad and Tobago all indicate that they have initiatives that target the SME sector. For example, Republic Bank offers a free SME tool kit available at no additional charge through its relationship with the International Finance Corporation. In addition, Scotiabank recently launched a SME fund to assist with the financing of capital equipment needs12.
Each implementing agency in the environment offers its own ‘brand’ of entrepreneurial support that leverages their core competencies. Despite the number of agencies involved, there is an attempt to pull them under one integrated umbrella, particularly in the area of incubation.
In addition to these organizations, there are other initiatives that offer services through which SME firms can also benefit. TT BizLink is an IT platform that has been set up as a single electronic window through which the various permits, forms, licenses, etc. required for foreign trade can be processed on-‐line. The aim is to reduce the bureaucratic burden for all firms including those in the SME sector.
11http://www.trinidadexpress.com/news/Jump_Start_graduates__urged__Never_stop_learning-‐168556086.html 12http://www.guardian.co.tt/news/2014-‐05-‐13/scotiabank-‐launches-‐sme-‐fund

60
Recommendations
The APS data show that Trinidad and Tobago continues to perform at least as well as the rest of the region in terms of the attitudes, image and aspirations towards entrepreneurship. While Trinidad and Tobago does not appear to face challenges in the attitudes and aspirations regarding entrepreneurship, the performance of entrepreneurial firms as a vehicle for economic transformation and development needs to be improved, if this sector is to contribute toward diversifying the Trinidad and Tobago economy to reduce the dependence on the energy sector. The performance of these firms on the dimensions of innovation, growth potential and export competitiveness needs to be addressed. The i2i initiative is a great step in this direction. Despite the existence of this initiative along with the business incubators and other services, the NES respondents also reported that not enough effort is put into developing high growth entrepreneurial firms. Consideration could be given to placing the development of innovative, export competitive, high-‐growth businesses prominently on the agendas of the other agencies that have been set up to provide support to the SME sector. Related to this is the issue of R&D transfer which was seen as the biggest area of concern by the NES respondents. Despite the support measures seen in Figure 48, the NES respondents believed that the support for engineers and scientists to commercialize their innovations is inadequate. The NES respondents also raised issues about access of new firms to new technologies. These issues should be investigated further. Similarly, in the area of commercial infrastructure, the NES respondents reported that new firms have problems accessing and affording subcontractors, consultants and other services. There may be a role for the agencies set up to support SME firms in this regard.
The pattern of low fear of failure and extremely high levels of perceived capabilities reported by APS respondents continued into the 2013 data, as did the contrasting view of the NES respondents who reported that generally, Trinidad and Tobago citizens do not possess the skills necessary to start a new business or operate a high-‐growth business. This finding may be linked to issues observed in the education system, in which most of the formal training in entrepreneurship is provided in the tertiary sector, with minimal effort at the primary and secondary levels. Fewer than 30% of the entrepreneurs in Trinidad and Tobago access tertiary education. In 2013 the deficiency at the secondary level was addressed by the introduction of Entrepreneurship as a subject in the Caribbean Advanced Proficiency Examinations (CAPE) syllabus. This is more of a step in the right direction, rather than a solution. CAPE is considered to be ‘post secondary education’ by the Ministry of Education13 with one quarter of the students who complete Caribbean Examination Council (CXC) exams going on to CAPE14. A
13 http://www.moe.gov.tt/spotlightPDFs/MOE_Stategic_Action_Plan_2011_2015.pdf 14 http://www.stte.gov.tt/Portals/0/Publications/Final%20Statistical%20Digest.pdf

61
closer look at the way in which entrepreneurship is being embraced by the education system undertaken as part of the environment scan revealed some possible opportunities for improvement. Despite the importance that entrepreneurship and the SME sector play in the MTPF, there is no evidence of any analysis into the ways in which entrepreneurship or skills that would be associated with entrepreneurship are included in the overall school curriculum. Such a study may open opportunities to further improve entrepreneurial outcomes among school leavers who do no access tertiary education. Some evidence of activity was found in this regard, e.g. some schools participate in the Junior Achievement programme, and the Eastern Credit Union has an outreach programme to take some basic financial planning and business teaching to primary schools. Such initiatives could be considered for wider adoption by primary and secondary schools.
In terms of developing instructors and teachers with the necessary training and tools to teach entrepreneurship, there is a COSTAAT-‐Babson initiative which will prepare teachers, however this could be supported by initiatives to in-‐service teachers at earlier stages of the education system, and by initiatives that would provide a forum for teachers of entrepreneurship and business skills to exchange experiences and information with each other.
The NES respondents identified government policy as an area of concern, particularly with regard to such issues as bureaucracy and licensing, and public procurement. There have been some attempts to improve processes using on-‐line tools such as ttgovconnect and TTbizLink. Such efforts should be pursued and similar initiatives to streamline and simplify such requirement should lead to improvements in this area. In terms of public procurement, the Fair Share initiative in the EBC document was set up to provide opportunities for SME firms to obtain business from the government. Some investigation could be undertaken to see how many SME firms have registered with this programme, and what the outcomes have been.
In terms of the available support for the start-‐up and early stage SME firms, considerable activity was observed in Figure 49. Several organizations operate in each category. This may allow overlap or direct competition among programmes for resources. Further, there is no information concerning awareness of or experience with these programmes. The 2014/2015 GEM cycle has included questions on this in the APS.
Given the potential for overlap and gaps in SME support, consideration could be given to developing mechanisms for collaboration and communication among the key agencies. Such coordination is especially important if SME support is to be configured in ways that encourage and nurture entrepreneurial firms that are export competitive, innovative and have high growth potential.

62
Several of the agencies in Figure 49 offer mentorship and business advisory services. There are no measures in place for the evaluation, training, and development of the professionals who provide these services, nor were any fora found at which such professionals can share information and experiences.
Entrepreneurs in Trinidad and Tobago were found to be on average older, and in poorer health than employees. As in many other countries, the over 60 age group represents a fast growing demographic. These citizens possess decades of work experience, along with other attributes that may be consistent with positive entrepreneurial outcomes (such as financing and networks). While there are agencies that target youth entrepreneurship, consideration could be given to developing programmes specifically targeting higher age groups. This may represent a gap in coverage of the agencies in Figure 49. Such an agenda may also include a mechanism to finance or provide health care for this group as part of the support package. Other organizations such as the Trinidad and Tobago Association of Retired Persons (TTARP) would be on hand to support and facilitate such initiatives.

63
Glossary of Terms
Adult Population Survey A survey that samples a portion of the non-‐institutionalized adult population; adults 18 years and over, both in and out of labour force from all geographic regions of the country about their perceptions, attitudes capabilities and awareness concerning the entrepreneurial environment in the country. Business Discontinuance Rate The percentage of adults (18 and older) who in the past 12 months have discontinued a business either by selling, shutting down operations or otherwise discontinuing an owner/manager relationship with the business. Entrepreneurial Aspirations The efforts of the early-‐stage entrepreneur to introduce new products and services, develop new production processes, penetrate foreign markets, substantially increase the number of firm employees, and finance the business with either formal or informal venture capital, or both. Entrepreneurship as a Desirable Career Choice The percentage of the population aged 18 and over, who agree with the statement that in their country, most people consider starting a business as a desirable career choice. Established Business Owners Individuals who are currently owner-‐managers of an operating business that has paid salaries, wages, or any other payment to the owners for more than 42 months. Fear of Failure The percentage of the population 18 and older, with positive perceived opportunities but indicate that the fear of failure would prevent them from actually starting a business. High-‐Growth Expectation The percentage of the early-‐stage entrepreneurs who expect to employ at least 20 employees in five years’ time.

64
High Status of Successful Entrepreneurs The percentage of the population aged 18 and over, who agree with the statement that in their country, successful entrepreneurs receive high status. International Orientation The percentage of the Early-‐Stage entrepreneurs with more than 25% of the customers coming from other countries. Media Attention for Entrepreneurship The percentage of the population 18 and over, who agree with the statement that in their country, stories about successful new businesses are often seen in the public media. Nascent Entrepreneurs Individuals who are currently actively involved in setting up a business they will own or co-‐own which has not yet paid salaries, wages or any other payment to the owners for more than three months. National Experts Survey A survey that studies the views of experts who are directly involved in delivering or assessing a major aspect of an entrepreneurial framework condition in their country. Necessity-‐Driven Entrepreneurship The percentage of those involved in Total Early-‐Stage entrepreneurial activity fwho are involved in entrepreneurship because they had no other option for work. New Business Owners The percentage of adults 18 and over, who are currently an owner-‐manager of a new business; that is owner-‐manager of an operating business that has paid salaries, wages, or any other payment to the owners for more than three months but not more than 42 months. New Product Market Oriented The percentage of the Early-‐Stage entrepreneurs who indicate that their product or service is new to at least some customers and indicate that not many businesses offer the same product or service. Opportunity-‐Driven Entrepreneurship The percentage of those involved in Total Early-‐Stage entrepreneurial activity (as defined above) who (i) claim to be driven by opportunity as against having no other option for work;

65
and (ii) who identify being independent or increasing their income rather than just maintaining their income as the main driver for being involved in the business. Perceived Opportunity The percentage of population 18 and over, who see good opportunities for entrepreneurship in the area where they live. Perceived Capability The percentage of population 18 and over, who believe they have the skills and knowledge required to start a business. Total Early-‐Stage Entrepreneurs Adults 18 and over, who are either nascent entrepreneurs or owner-‐managers of a new business.

66
References Badal, S., 2010. Nebraska Investment Fianance Authority. [Online] Available at: http://www.nifa.org/downloads/entrepreneurshipandjobcreation10711.pdf [Accessed 9 November 2013].
Bygrave, William D., Andrew Zacharakis, and William D. Bygrave. 2009. The Portable MBA in Entrepreneurship. Hoboken, N.J.: Wiley.
Edelman, L. & Yli-‐Renko, H., 2010. The Impact of Environment and Entrepreneurial Perceptions on Venture-‐Creation Efforts:Bridging the Discovery and Creation Views of Entrepreneurship, s.l.: Baylor University.
InterAmerican Development Bank, 2013. InterAmerican Development Bank/Topics/Competiveness, Technology and Innovation/Areas of Action/Entreprneurship. [Online] Available at: http://www.iadb.org/en/topics/competitiveness-‐technology-‐and-‐innovation/area-‐of-‐action-‐entrepreneurship,6276.html [Accessed 8 June 2013].
Wang, X., 2013. Reflection on Challenges and Countermeasure of Entrepreneurship Education in China. Cross Cultural Communication, 16 April, 9(2)(10.3968/j.ccc.1923670020130902.1140), pp. 18-‐22.
Women's World bank, n.d. Women's World Banking Product Innovation Insurance. [Online] Available at: http://www.womensworldbanking.org/product-‐innovation/insurance/ [Accessed 26 June 2013].

67
Appendix 1 – Entrepreneurial Activity in the Countries Participating in GEM in 2013.
Country
Nascent entrepreneur-
ship rate
New business
ownership rate
Early-stage entrepreneurial activity (TEA)
Established business
ownership rate
Discontinuation of businesses
Necessity-driven (% of TEA)
Improvement-driven
opportunity (% of TEA)
LATIN AMERICA & CARRIBEAN
Argentina 11.79 7.30 18.88 9.63 4.92 34.54 46.61
Barbados 9.98 7.23 17.12 12.23 2.87 12.42 62.68
Brazil 4.48 11.30 15.44 15.19 4.51 30.13 58.83
Chile 14.68 8.43 22.58 7.77 4.97 17.40 68.87
Colombia 13.58 6.86 20.11 6.72 6.74 12.42 47.83
Costa Rica 10.00 5.34 15.04 3.33 3.49 20.20 47.88
Ecuador 16.72 11.68 26.61 18.92 7.59 35.83 30.21
El Salvador 7.69 7.79 15.26 9.39 7.83 35.24 39.22
Mexico 7.94 4.28 12.11 4.67 4.31 13.44 51.82
Panama 7.21 2.69 9.46 1.86 1.82 19.49 56.76
Peru 14.67 6.22 20.21 5.10 6.75 23.42 53.13
Trinidad & Tobago 8.76 6.52 14.96 7.19 4.50 15.09 59.88
Uruguay 10.18 4.71 14.63 4.97 4.99 18.38 39.85
Average (unweighted) 10.59 6.95 17.11 8.23 5.02 22.15 51.04
MIDDLE EAST & NORTH AFRICA
Algeria 1.62 7.25 8.75 3.32 6.93 29.96 47.42
Egypt 3.10 4.87 7.82 4.15 5.28 33.58 22.90
Iran 4.47 6.48 10.79 9.53 5.05 41.96 36.20
Israel 3.50 3.03 6.53 3.78 4.04 19.17 46.13
Palestine 6.22 3.81 9.84 2.98 7.73 41.91 26.58
Tunisia 2.38 2.48 4.78 4.37 3.98 35.47 42.29
Average (unweighted) 3.55 4.65 8.09 4.69 5.50 33.67 36.92
SUB-SAHARAN AFRICA
Angola 14.89 18.88 32.39 9.06 25.86 23.75 38.26
Botswana 17.04 12.24 27.66 6.33 16.26 33.41 47.97
Ethiopia 5.70 9.25 14.73 10.20 3.40 20.35 69.22
Ghana 15.42 22.78 36.52 37.74 16.24 27.56 50.97
Malawi 18.45 20.39 35.56 10.80 28.91 41.92 42.87
Namibia 11.30 7.00 18.15 3.17 11.59 37.25 36.79

68
Country
Nascent entrepreneur-
ship rate
New business
ownership rate
Early-stage entrepreneurial activity (TEA)
Established business
ownership rate
Discontinuation of businesses
Necessity-driven (% of TEA)
Improvement-driven
opportunity (% of TEA)
Nigeria 21.77 14.19 35.04 15.67 8.31 34.54 53.22
South Africa 4.30 3.08 7.32 2.32 5.03 31.67 39.74
Uganda 9.58 27.56 35.76 31.25 25.92 46.00 42.11
Zambia 27.50 14.57 41.46 3.84 20.23 32.00 46.24
Average (unweighted) 14.59 14.99 28.46 13.04 16.17 32.85 46.74
ASIA PACIFIC & SOUTH ASIA
China 5.45 7.43 12.83 12.45 3.73 36.88 39.37
Japan 2.26 1.72 3.99 6.11 1.12 20.72 66.41
Korea 2.56 4.08 6.64 9.57 3.17 34.89 46.17
Malaysia 2.79 4.20 6.99 6.96 1.62 13.32 60.70
Pakistan 8.29 3.42 11.57 3.78 2.53 52.95 23.56
Singapore 7.60 4.18 11.56 3.10 3.88 14.77 54.45
Taiwan 3.33 4.21 7.54 10.38 5.67 17.93 42.60
Thailand 8.74 11.32 18.94 29.69 2.78 16.69 67.40
Average (unweighted) 5.13 5.07 10.01 10.25 3.06 26.02 50.08
EUROPEAN UNION
Austria 6.58 3.42 9.58 7.61 3.56 10.81 38.20
Belgium 3.32 1.95 5.20 5.12 2.39 17.91 61.56
Denmark 3.07 2.36 5.36 3.45 1.34 8.24 70.65
Estonia 9.46 5.09 14.26 7.24 3.96 18.22 49.10
Finland 3.45 2.68 5.98 8.04 1.99 17.10 59.88
France 3.74 1.54 5.17 3.23 1.96 18.14 58.94
Germany 3.51 2.15 5.34 4.95 1.91 21.68 50.74
Greece 3.82 2.84 6.51 12.27 4.43 29.94 32.11
Hungary 5.83 3.59 9.22 8.10 3.77 31.13 35.27
Ireland 3.91 2.28 6.15 8.32 1.74 28.14 40.52
Italy 2.47 1.92 4.32 3.32 2.43 15.74 22.30
Latvia 8.71 4.82 13.39 7.93 3.39 25.26 46.02
Lithuania 3.15 3.64 6.69 8.24 2.20 24.63 51.49
Netherlands 4.08 6.26 10.31 9.49 2.17 8.44 66.35
Poland 4.83 4.55 9.36 5.81 3.89 40.71 30.13
Portugal 4.26 3.63 7.67 6.23 2.98 17.86 53.08
Romania 5.51 3.83 9.22 3.91 3.81 24.19 37.70
Slovakia 6.65 3.91 10.22 6.38 4.69 35.57 42.88
Slovenia 2.95 2.53 5.42 5.79 1.62 7.36 64.02
Spain 3.35 2.45 5.70 8.74 2.11 25.59 32.51

69
Country
Nascent entrepreneur-
ship rate
New business
ownership rate
Early-stage entrepreneurial activity (TEA)
Established business
ownership rate
Discontinuation of businesses
Necessity-driven (% of TEA)
Improvement-driven
opportunity (% of TEA)
Sweden 4.59 1.85 6.44 5.25 1.86 6.84 48.59
United Kingdom 5.30 3.74 8.98 6.16 1.69 18.30 42.61
Average (unweighted) 4.66 3.23 7.75 6.62 2.72 20.54 47.03
NON-EUROPEAN UNION Bosnia and Herzegovina 4.51 3.35 7.78 6.00 7.19 58.33 20.14
Croatia 6.38 1.89 8.27 3.06 4.24 34.23 35.68
Macedonia 3.73 3.25 6.97 6.73 3.86 51.95 28.73
Norway 3.70 3.15 6.75 5.75 1.45 7.41 69.63
Russia 2.65 1.80 4.34 2.05 1.00 36.40 31.40
Switzerland 2.90 3.03 5.93 8.44 2.02 18.08 57.46
Turkey 7.25 5.36 12.22 8.68 5.24 30.88 54.57
Average (unweighted) 4.45 3.12 7.47 5.82 3.57 33.90 42.51
UNITED STATES United States 8.86 4.08 12.84 8.56 4.49 21.35 59.45
(Source: GEM Global Report 2013)

70
Appendix 2 - Author Biographies
Miguel Carrillo
Miguel Carrillo is one of the most sought after experts in the area of Strategy and Innovation by governments across all continents, multi-‐lateral agencies like World Bank, Inter American Development Bank and private sector organizations such as Ernst and Young, Coca Cola, CEMEX, Volkswagen, Novartis. He also generously gives his time, knowledge and expertise to non-‐profit and non-‐governmental organizations. He has lectured in over 15 countries and has been a visiting lecturer at MIT, University of Massachusetts, HEC Paris and University of Texas in Austin. He is the pioneer or champion of several nova research agendas for the region in the areas of Business Analytics, Cluster Mapping, Sustainable Innovation, and Governance, in addition to his involvement with GEM research in Chile, Trinidad and Tobago, and now Suriname. He holds a PhD in Strategy from the joint PhD. Program of Concordia and McGill University in Montreal, Canada. Prior positions include Dean, Adolfo Ibanez School of Management, Miami Campus; Dean, School of Business, Monterrey Institute of Technology, Mexico; Finance Manager, Hewlett Packard; Association Consultant, McKinsey & Company. In 2009, he assumed position as the Executive Director and Professor of Strategy Arthur Lok Jack Graduate School of Business.
Henry Bailey
Henry Bailey has lectured in Economics and Applied Economics courses at the Arthur Lok Jack Graduate School of Business since 2010. He holds a PhD in economics from the University of the West Indies, and an MBA from Brunel University. He also has BSc and MSc degrees in economics. He has published in several international journals in the areas of utility and preference construction, health economics and health outcomes research, and he has presented at various research forums in Health Economics and Development. He is a member of the EuroQol Research Foundation, and a founding member of the Global Health Delivery Network of Harvard University. In 2013 he received the Quality in Tertiary Education Award for Academic and Applied Research from the Accreditation Council of Trinidad and Tobago and in 2014 he received the NGC-‐UWI Award for the most Outstanding Researcher in the Social Sciences/Humanities/Arts at UWI. Prior to his career in academia, he worked for Johnson & Johnson for over 25 years in the pharmaceutical and medical device industries in the Caribbean and Central America.

71
Marvin Pacheco
Marvin Pacheco holds Bachelor’s and Master’s degrees in Management Studies from the University of the West Indies St. Augustine where he is presently pursuing a PhD in Business Administration. He is presently the Lead Researcher on several key projects with the Centre for Strategy and Competitiveness at the Arthur Lok Jack Graduate School of Business including an assessment of the Innovation System of Trinidad & Tobago, conducting a Baseline Study for the Small and Micro-‐Enterprise Sector and various Local and Regional Cluster Development Initiatives. Prior to this he previously held research and consultancy positions with the Centre for Social Responsibility, the Centre for Entrepreneurship and Innovation at the Arthur Lok Jack Graduate School of Business, and with the Inter-‐American Development Bank’s FINPYME Project. He is also a Part-‐Time Lecturer in Marketing at the University of the West Indies.
Stephanie Lezama-‐Rogers
Stephanie Lezama-‐Rogers holds a BSc degree in Sociology and Msc in Development Statistics from the University of the West Indies. She is a Researcher in the Department for Strategy and Competitiveness, Arthur Lok Jack Graduate School of Business, The University of The West Indies. Her areas of research include the Base of the Pyramid, informal economy, entrepreneurship, cluster development and innovation, and cluster mapping. Her previous lead roles include monitoring officer of the online survey site which generates the Global Competitiveness report, Lead Researcher for Competitiveness Analysis of South Western Peninsula Growth Pole Community and Survey Lead for the Assessment of the Base of the Pyramid Expenditure patterns using a Household Expenditure Survey.
Candace Braithwaite
Candace Brathwaite has spent over 20 years in academia related to entrepreneurship. She holds a BSc in Agribusiness Management and an MBA from Babson College, and has lectured in entrepreneurship at the Arthur Lok Lack Graduate School of business and on the St. Augustine campus of the University of the West Indies. She has worked in the United States, Latin America, the Caribbean and Europe with Mercedes-‐Benz, Lotus Development Corp, Kraft, Advanced Visual Systems, Work/Family Directions, the Cocoa and Coffee board of Trinidad and Tobago as well as the CARICOM Secretariat. She currently manages the BizBooster: the business incubator of the Arthur Lok Jack Graduate School of Business.

72