the journal of - gem-a
TRANSCRIPT
©2004 Gemmological Association and Gem Testing Laboratory of Great Britain
Gemmology2009 / Volume 31 / Nos. 5–8
The Journal of
ISSN: 1355-4565Designed and printed by DG3 (Europe) LtdCopyright © 2009
Contents
27 Greville Street, London EC1N 8TNT: +44 (0)20 7404 3334 F: +44 (0)20 7404 8843E: [email protected] W: www.gem-a.com
The Gemmological Association of Great Britain
Gemmology2009 / Volume 31 / Nos. 5–8
The Journal of Gem
mology - 2009 / Volum
e 31 / Nos. 5–8 / pp 153–328
The Journal of
The Gemmological Association of Great Britain
Cert no. TT-COC-002454
153 A signature for nephrite jade using its strontium isotopic composition: some Pacific Rim examples C.J. Adams and R.J. Beck
163 Jaspilite — the gemstone of Ukraine P. Baranov, S. Shevchenko, W. Heflik, L. Natkaniec-Nowak and M. Dumańska-Słowik
171 Ruby and sapphire from Marosely, Madagascar L.E. Cartier
181 Identification of dyed jadeite using visible reflection spectra Yan Liu, Taijin Lu, Manjun Wang, Hua Chen, Meidong Shen, Jie Ke and Beili Zhang
185 Jadeite jade from Myanmar: its texture and gemmological implications Guanghai Shi, Xia Wang, Bingbing Chu and Wenyuan Cui
196 A description and history of one of the largest nacreous pearls in the world J.C. Zwaan and H.A. Dommisse
203 Geographic typing of gem corundum: a test case from Australia F.L. Sutherland and A. Abduriyim
211 Dickite: a gem material for carving from Thailand S. Saminpanya, C. Dharmgrongartama and N. Susawee
226 Application of mineralogical methods to the investigation of some gem-quality corals L. Natkaniec-Nowak, M. Dumańska-Słowik, J. Fijał and A. Krawczyk
235 Colour-change garnets from Madagascar: variation of chemical, spectroscopic and colorimetric properties K. Schmetzer, H.-J. Bernhardt, G. Bosshart and T. Hainschwang
283 The characteristics of red andesine from the Himalaya Highland, Tibet A. Abduriyim
300 Abstracts
310 Book Reviews
312 Proceedings of The Gemmological Association of Great Britain and Notices
328 Gem-A Events 2010
Cover Picture: A large nacreous pearl (estimated weight 2385 grains) surrounded by golden ‘stamens’ decorated with ruby, sapphire and emerald beads, and mounted on a pedestal of lapis lazuli. Photo © Amsterdam Pearl Society. (See A description and history of one of the largest nacreous pearls in the world, page 196.)
The GemmoloGical associaTion of GreaT BriTain
Supercharge your career
New Open Distance Learning Courses in Gemmology
enrolling now
A strong knowledge of gemstones and diamonds will increase customer confidence and boost your sales. Gain that knowledge by studying with the world’s longest established educator in gemmology. Graduates may apply for Fellowship of the Association enabling them to use the initials FGA after their name.
Study gemmology from your own home or workplace with comprehensive course notes, and online coursework and study groups*. You will also receive a selection of instruments and stones to help you with your studies. Additional instruments and books can be purchased from Gem-A’s extensive range.* Access to a computer with an internet connection essential.
Foundation Certificate in Gemmology Start date: 15 March 2010 (nine-month programme) Course fees: £1500 (or £1800 to include the London practical workshop) payable in instalments
Diploma in Gemmology (open only to Foundation Certificate holders) Start date: 15 March 2010 (nine-month programme) Course fees: £1695 (or £2295 to include the London practical workshop) payable in instalments
Full details at www.gem-a.com/education.aspx or call 020 7404 3334
The Gemmological Association of Great Britain27 Greville Street (Saffron Hill entrance), London EC1N 8TNtel: 020 7404 3334 fax: 020 7404 8843 email: [email protected] UK Registered Charity No. 1109555
The Journal of Gemmology
Editor: Dr R.R. Harding
Assistant Editor: M.J. O’Donoghue
Associate Editors: Dr A.J. Allnutt (Chislehurst), Dr C.E.S. Arps (Leiden), G. Bosshart (Horgen), Prof. A.T. Collins (London), J. Finlayson (Stoke on Trent), Dr J.W. Harris (Glasgow), Prof. R.A. Howie (Derbyshire), E.A. Jobbins (Caterham), Dr J.M. Ogden (London), Prof. A.H. Rankin (Kingston upon Thames), Dr K. Schmetzer (Petershausen), Dr J.E. Shigley (Carlsbad), Prof. D.C. Smith (Paris), E. Stern (London), Prof. I. Sunagawa (Tokyo), Dr M. Superchi (Milan)
Production Editor: M.A. Burland
The Editor is glad to consider original articles shedding new light on subjects of gemmological interest for publication in The Journal of Gemmology. A Guide to the preparation of typescripts for publication in The Journal is given on our website, or contact the Production Editor at the Gemmological Association of Great Britain.
Any opinions expressed in The Journal of Gemmology are understood to be the views of the contributors and not necessarily of the publishers.
President: Prof. A.H. Rankin
Vice-Presidents: N.W. Deeks, R.A. Howie, E.A. Jobbins, M.J. O'Donoghue
Honorary Fellows: R.A. Howie, K. Nassau
Honorary Life Members: H. Bank, D.J. Callaghan, T.M.J. Davidson, J.S. Harris, E.A. Jobbins, J.I. Koivula, M.J. O'Donoghue, C.M. Ou Yang, I. Thomson, V.P. Watson, C.H. Winter
Chief Executive Officer: J.M. Ogden
Council: J. Riley – Chairman, A.T. Collins, S. Collins, B. Jackson, C.J.E. Oldershaw, E. Stern, J.F. Williams
Members’ Audit Committee: A.J. Allnutt, P. Dwyer-Hickey, J. Greatwood, G.M. Green, B. Jackson, J. Kalischer,
Branch Chairmen: Midlands – P. Phillips, North East – M. Houghton, North West – J. Riley, Scottish – B. Jackson, South East – V. Wetten, South West – R.M. Slater
The Gemmological Association of Great Britain
27 Greville Street, London EC1N 8TNT: +44 (0)20 7404 3334 F: +44 (0)20 7404 8843E: [email protected] W: www.gem-a.com
Registered Charity No. 1109555Registered office: Palladium House, 1-4 Argyll Street, London W1F 7LD
The Journal of Gemmology / 2009 / Volume 31 / No. 5–8
©2009 Gemmological Association of Great Britain
The Journal of Gemmology / 2009 / Volume 31 / No. 5–8
©2009 Gemmological Association of Great Britain Page 153
IntroductionJade is a gemstone associated with
ultramafic rocks in ophiolite complexes
and occasionally in metamorphosed
dolomites (Harlow and Sorensen, 2005). It
is an almost monomineralic rock, occurring
as a tremolite-amphibole type, nephrite (or
nephrite jade) or a pyroxene-type, jadeitite
(or jadeite jade). Although rare, deposits
of nephrite jade are present around the
world and especially in countries of the
Pacific Rim (New Zealand, Australia, New
Caledonia, China, Korea, Japan, Russia
(Siberia), USA (Alaska and California) and
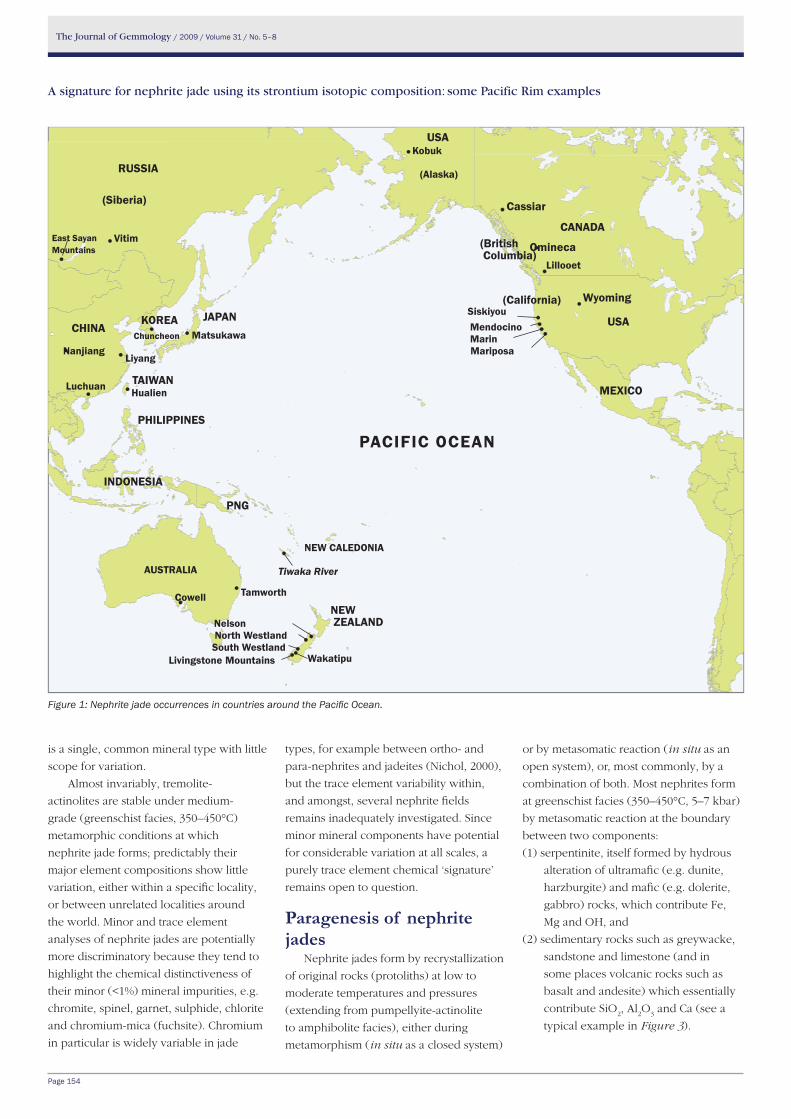
Canada (British Columbia)) (Figure 1).
Almost every culture in these countries
prized jade for its beauty and durability,
and so it was frequently traded or carried
between them, and into Pacific Ocean
islands where jade most probably does
not occur naturally. Not surprisingly,
considerable interest exists among
archaeologists and anthropologists in
tracking jade artefacts from place to place
and establishing their original source, using
mineralogical or chemical characteristics.
Unfortunately, such jade ‘signatures’
may not be completely distinctive, and
here we discuss an alternative technique
using radiogenic isotopic ratio patterns,
as applied to nephrite jades from several
Pacific Rim sources.
Characteristics of nephrite jade
Nephrite jade usually comprises
>99% microcrystalline amphibole of the
tremolite-actinolite series, with the highest
quality types close to tremolite [Ca2(Mg,Fe)
5
Si8O
22(OH)
2]. It is only moderately hard
(6–6.5), but exceedingly tough, and this
toughness arises from the development
of an interwoven ‘felted’ fabric of the
tremolite crystals. This toughness can vary
slightly with direction of the felted fabric.
The lustrous shades of green provide the
great beauties of jade and, together with
some mesoscopic markings (mm-scale),
are the most memorable characteristic.
The specialist can easily recognize
distinctive features in jades from different
sources around the world, for example in
terms of texture, colour and inclusions,
but doubts may remain that such features
are not entirely diagnostic (see a range
of nephrites in Figure 2). Attempts to
quantify these features more have included
Mossbauer spectroscopy (Wilkins et al.,
2003), major element composition and
trace element analysis (Nichol, 2000). All
these approaches encounter the same
problem that the principal jade component
A signature for nephrite jade using its strontium isotopic composition: some Pacific Rim examples Dr Christopher J. Adams and Russell J. Beck FGA
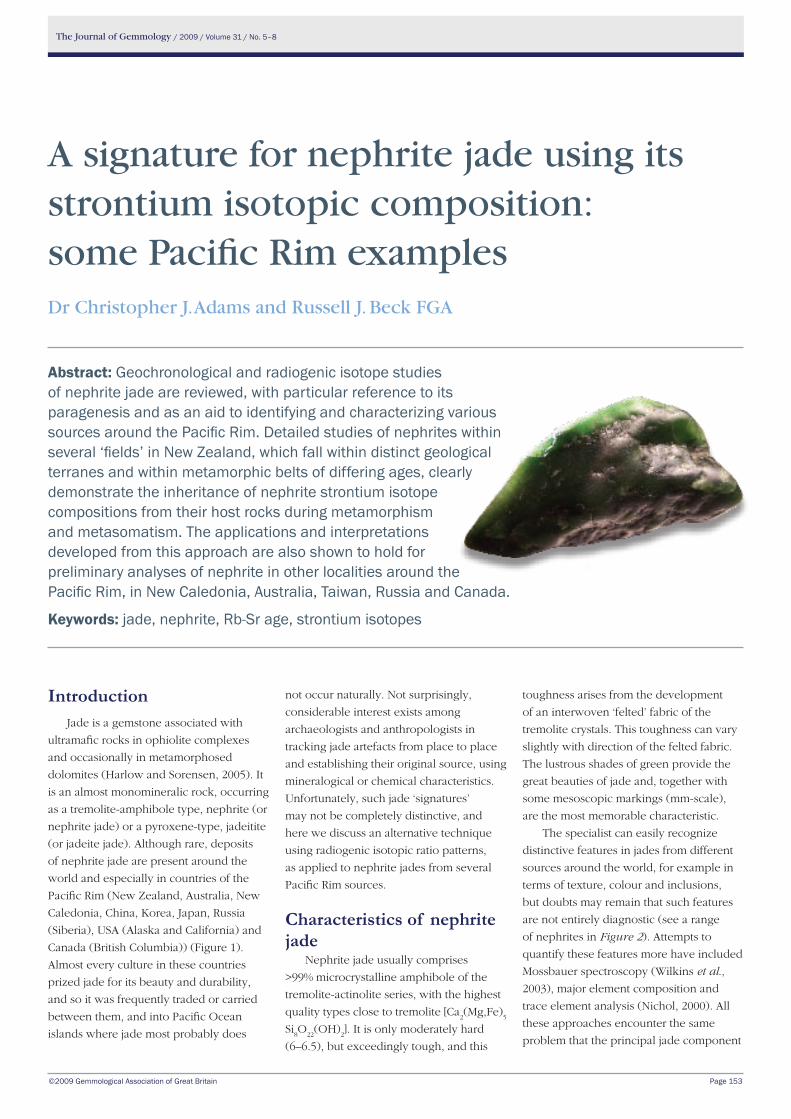
Abstract: Geochronological and radiogenic isotope studies of nephrite jade are reviewed, with particular reference to its paragenesis and as an aid to identifying and characterizing various sources around the Pacific Rim. Detailed studies of nephrites within several ‘fields’ in New Zealand, which fall within distinct geological terranes and within metamorphic belts of differing ages, clearly demonstrate the inheritance of nephrite strontium isotope compositions from their host rocks during metamorphism and metasomatism. The applications and interpretations developed from this approach are also shown to hold for preliminary analyses of nephrite in other localities around the Pacific Rim, in New Caledonia, Australia, Taiwan, Russia and Canada.
Keywords: jade, nephrite, Rb-Sr age, strontium isotopes
The Journal of Gemmology / 2009 / Volume 31 / No. 5–8
Page 154
is a single, common mineral type with little
scope for variation.
Almost invariably, tremolite-
actinolites are stable under medium-
grade (greenschist facies, 350–450°C)
metamorphic conditions at which
nephrite jade forms; predictably their
major element compositions show little
variation, either within a specific locality,
or between unrelated localities around
the world. Minor and trace element
analyses of nephrite jades are potentially
more discriminatory because they tend to
highlight the chemical distinctiveness of
their minor (<1%) mineral impurities, e.g.
chromite, spinel, garnet, sulphide, chlorite
and chromium-mica (fuchsite). Chromium
in particular is widely variable in jade
types, for example between ortho- and
para-nephrites and jadeites (Nichol, 2000),
but the trace element variability within,
and amongst, several nephrite fields
remains inadequately investigated. Since
minor mineral components have potential
for considerable variation at all scales, a
purely trace element chemical ‘signature’
remains open to question.
Paragenesis of nephrite jades
Nephrite jades form by recrystallization
of original rocks (protoliths) at low to
moderate temperatures and pressures
(extending from pumpellyite-actinolite
to amphibolite facies), either during
metamorphism (in situ as a closed system)
or by metasomatic reaction (in situ as an
open system), or, most commonly, by a
combination of both. Most nephrites form
at greenschist facies (350–450°C, 5–7 kbar)
by metasomatic reaction at the boundary
between two components:
(1) serpentinite, itself formed by hydrous
alteration of ultramafic (e.g. dunite,
harzburgite) and mafic (e.g. dolerite,
gabbro) rocks, which contribute Fe,
Mg and OH, and
(2) sedimentary rocks such as greywacke,
sandstone and limestone (and in
some places volcanic rocks such as
basalt and andesite) which essentially
contribute SiO2, Al
2O
3 and Ca (see a
typical example in Figure 3).
Figure 1: Nephrite jade occurrences in countries around the Pacific Ocean.
A signature for nephrite jade using its strontium isotopic composition: some Pacific Rim examples
PACIFIC OCEAN
NEW CALEDONIA
PNG
NEW ZEALAND
AUSTRALIA
CHINA
RUSSIA
KOREA JAPAN
PHILIPPINES
TAIWAN
INDONESIA
MEXICO
CANADA
USA
USA
(Alaska)
(British Columbia)
(California)
Kobuk
Cassiar
OminecaLillooet
Wyoming Siskiyou Mendocino Marin Mariposa
East Sayan Mountains
Vitim
Chuncheon MatsukawaNanjiang
Liyang
HualienLuchuan
Tiwaka River
TamworthCowell
Nelson North WestlandSouth Westland
WakatipuLivingstone Mountains
(Siberia)
The Journal of Gemmology / 2009 / Volume 31 / No. 5–8
Page 155
Metamorphic and metasomatic zones
are readily mapped in the field and typical
mineral assemblages are established
across several geological periods
(Coleman, 1966; Cooper and Reay, 1983).
For example, in New Zealand, classic,
low- to medium-grade metasedimentary
successions (Permian to Cretaceous) are
grouped into several tectonostratigraphic
terranes of differing ancestry, some of
which contain small (1–10 km scale)
‘fields’ of nephrite jade.
Each terrane may contain up to
four main metamorphic events: Triassic,
250–240; Jurassic, 210–190; Cretaceous,
150–120; and Miocene, 10–5 Ma (Adams
and Graham, 1996, 1997; Adams et al.,
1999; Adams and Maas, 2004).
For each terrane and metamorphic
event, the ages show a gradual variation,
approximately at the 100 m to km-scale,
in which mineral ages are inversely
related to their original metamorphic
crystallization temperature (depth of
burial) and the onset of their cooling in
response to post-metamorphic uplift.
Metamorphic ages within the nephrite
fields are therefore site-specific and are
to some extent predictable. This region
thus provides an excellent starting-point
from which to test whether the nephrite
jades do properly inherit the age (and
associated isotopic ancestry) of their
host rocks.
Dating of nephrite jadeWidely used to determine
metamorphic mineral ages, the potassium-
argon (K-Ar) dating method and the related 40Ar/39Ar technique rely on the long-lived
radioactive decay of isotope 40K to a rare
argon isotope 40Ar. Whilst commonly
applied to minerals with acceptable K
contents >0.5%, such as micas, feldspars
and hornblende, for jades with K contents
<0.2% the methods usually do not give
sufficiently precise ages to be useful.
The rubidium-strontium (Rb-Sr)
dating method also relies on a radioactive
decay with long half-life (c. 50.109
years), in this case 87Rb to 87Sr, and it
can be applied to a wide range of Rb-
bearing minerals (e.g. micas, feldspars)
and rocks. The isotopic composition of
strontium is thus variable because the
minor isotope, 87Sr, is radiogenic, i.e. it
is formed by radioactive decay, whilst
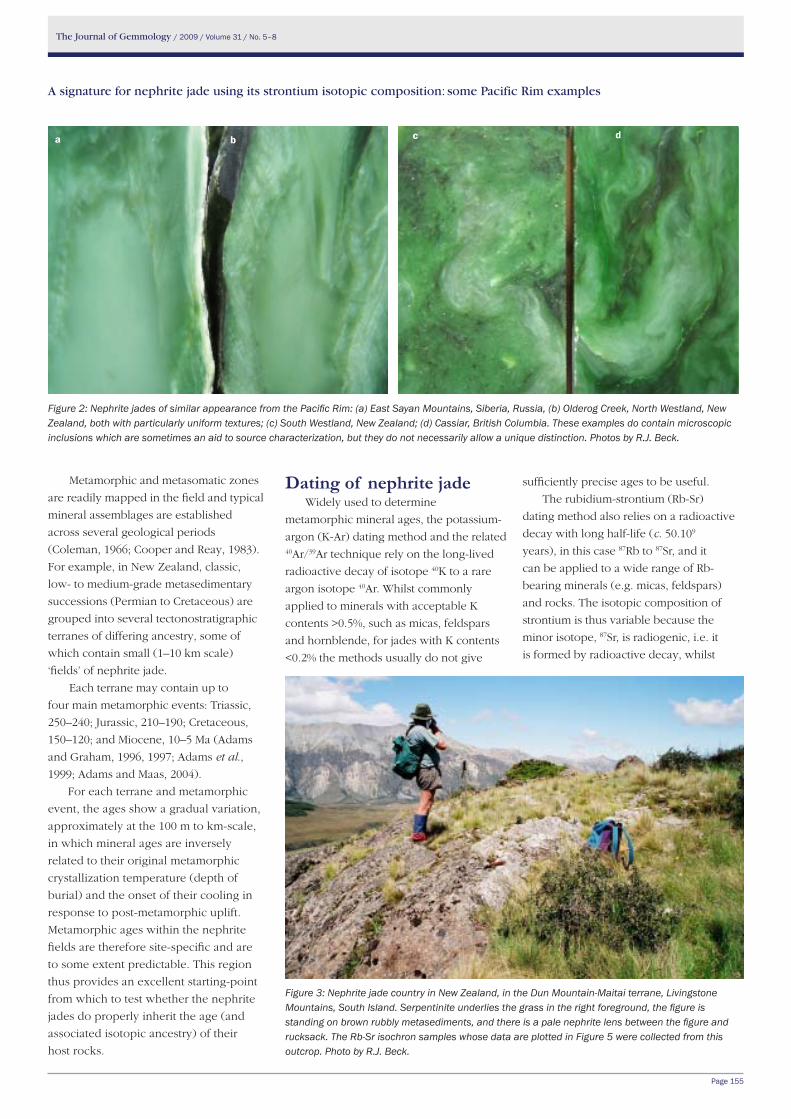
Figure 3: Nephrite jade country in New Zealand, in the Dun Mountain-Maitai terrane, Livingstone Mountains, South Island. Serpentinite underlies the grass in the right foreground, the figure is standing on brown rubbly metasediments, and there is a pale nephrite lens between the figure and rucksack. The Rb-Sr isochron samples whose data are plotted in Figure 5 were collected from this outcrop. Photo by R.J. Beck.
Figure 2: Nephrite jades of similar appearance from the Pacific Rim: (a) East Sayan Mountains, Siberia, Russia, (b) Olderog Creek, North Westland, New Zealand, both with particularly uniform textures; (c) South Westland, New Zealand; (d) Cassiar, British Columbia. These examples do contain microscopic inclusions which are sometimes an aid to source characterization, but they do not necessarily allow a unique distinction. Photos by R.J. Beck.
a b c d
A signature for nephrite jade using its strontium isotopic composition: some Pacific Rim examples
The Journal of Gemmology / 2009 / Volume 31 / No. 5–8
Page 156
its sister strontium isotopes, 88Sr, 86Sr and 84Sr, are all stable. The abundance of 87Sr
will thus be higher (as a percentage of
total Sr) in rocks and minerals that are
old, and/or have high Rb concentrations.
Since most minerals and rocks contain
some Sr (and thus 87Sr) at their time of
formation, then both the age and initial 87Sr present must be determined. This is
done using an isochron method, which
requires the analysis of several samples
of the mineral being dated which have
slightly different Rb and Sr contents, but
are nonetheless assumed to be coeval and
cogenetic. Upon this essential assumption,
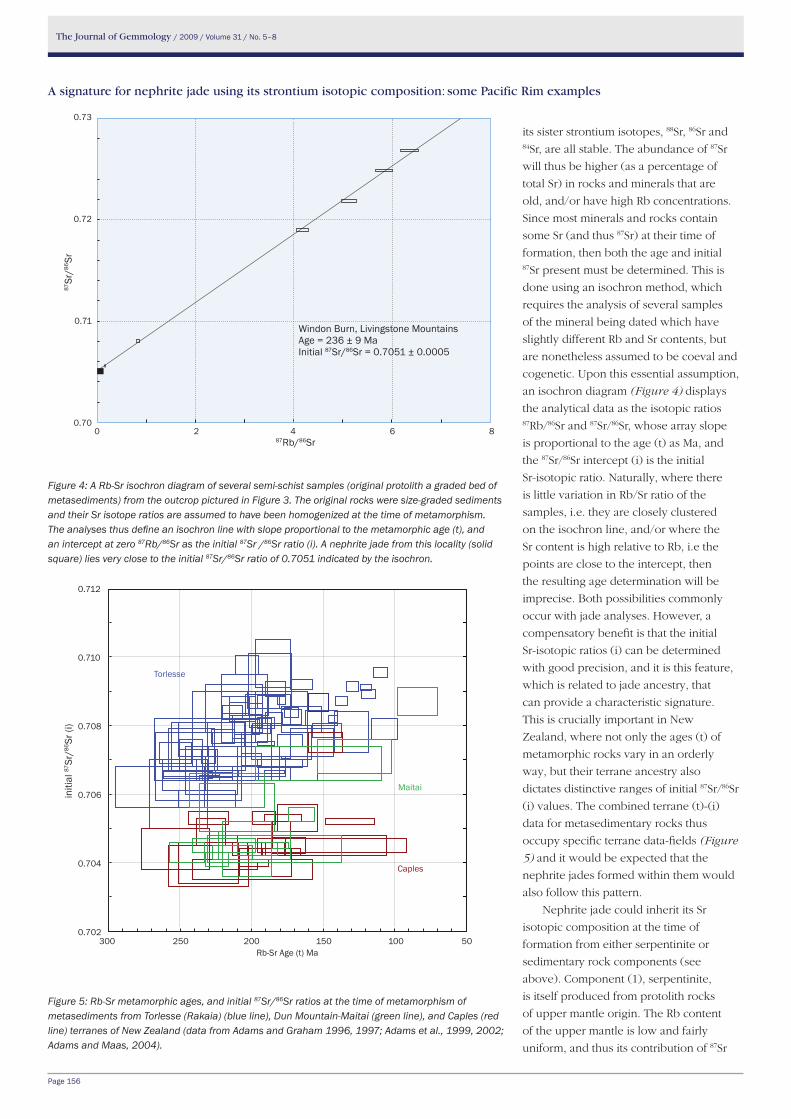
an isochron diagram (Figure 4) displays
the analytical data as the isotopic ratios 87Rb/86Sr and 87Sr/86Sr, whose array slope
is proportional to the age (t) as Ma, and
the 87Sr/86Sr intercept (i) is the initial
Sr-isotopic ratio. Naturally, where there
is little variation in Rb/Sr ratio of the
samples, i.e. they are closely clustered
on the isochron line, and/or where the
Sr content is high relative to Rb, i.e the
points are close to the intercept, then
the resulting age determination will be
imprecise. Both possibilities commonly
occur with jade analyses. However, a
compensatory benefit is that the initial
Sr-isotopic ratios (i) can be determined
with good precision, and it is this feature,
which is related to jade ancestry, that
can provide a characteristic signature.
This is crucially important in New
Zealand, where not only the ages (t) of
metamorphic rocks vary in an orderly
way, but their terrane ancestry also
dictates distinctive ranges of initial 87Sr/86Sr
(i) values. The combined terrane (t)-(i)
data for metasedimentary rocks thus
occupy specific terrane data-fields (Figure
5) and it would be expected that the
nephrite jades formed within them would
also follow this pattern.
Nephrite jade could inherit its Sr
isotopic composition at the time of
formation from either serpentinite or
sedimentary rock components (see
above). Component (1), serpentinite,
is itself produced from protolith rocks
of upper mantle origin. The Rb content
of the upper mantle is low and fairly
uniform, and thus its contribution of 87Sr
Figure 4: A Rb-Sr isochron diagram of several semi-schist samples (original protolith a graded bed of metasediments) from the outcrop pictured in Figure 3. The original rocks were size-graded sediments and their Sr isotope ratios are assumed to have been homogenized at the time of metamorphism. The analyses thus define an isochron line with slope proportional to the metamorphic age (t), and an intercept at zero 87Rb/86Sr as the initial 87Sr /86Sr ratio (i). A nephrite jade from this locality (solid square) lies very close to the initial 87Sr/86Sr ratio of 0.7051 indicated by the isochron.
Figure 5: Rb-Sr metamorphic ages, and initial 87Sr/86Sr ratios at the time of metamorphism of metasediments from Torlesse (Rakaia) (blue line), Dun Mountain-Maitai (green line), and Caples (red line) terranes of New Zealand (data from Adams and Graham 1996, 1997; Adams et al., 1999, 2002; Adams and Maas, 2004).
A signature for nephrite jade using its strontium isotopic composition: some Pacific Rim examples
0.73
0.72
0.71
0.708 6 4 2 0
87Rb/86Sr
87Sr
/86Sr
Windon Burn, Livingstone MountainsAge = 236 ± 9 MaInitial 87Sr/86Sr = 0.7051 ± 0.0005
0.712
0.710
0.708
0.706
0.704
0.702300 250 200 150 100 50
Rb-Sr Age (t) Ma
initi
al 87
Sr/86
Sr (i
)
Torlesse
Caples
Maitai
The Journal of Gemmology / 2009 / Volume 31 / No. 5–8
Page 157
over time has been low. Thus the isotopic
composition of Sr within the mantle
throughout Earth history has always been
‘primitive’ and it follows only a shallow
evolution curve (as expressed by the ratio 87Sr/86Sr) with time. Ultramafic and mafic
rocks formed in this region, commonly
with elevated Sr contents, 100–1000 ppm,
thus inherit similarly primitive Sr isotopic
compositions. However, when emplaced
into newly-formed lower oceanic crust
(e.g. as ophiolite complexes), the
common associated process of hydration
and serpentinization leads to major loss of
Ca, and greatly decreased Sr contents, to
1–10 ppm.
In contrast, the sedimentary rocks
of component (2) are overwhelmingly
produced by the erosion of continental
crust, itself a very complex mixture of
igneous (e.g. granite), metamorphic (e.g.
schist) and pre-existing sedimentary (e.g.
greywacke) rocks. These have widely
different ages, Sr contents e.g. 20–200
ppm, and isotopic compositions. Also
typically they have Rb contents 50–100
ppm, which are an order of magnitude
greater than mantle rocks. For these
reasons the Sr isotopic composition of
the continental crust, and the sedimentary
rocks derived from it, are much more
variable and ‘evolved’, and their 87Sr/86Sr
ratios are higher (more radiogenic).
The difference in Sr content between
serpentinite (< 1ppm) and sedimentary
rock (>100 ppm) components implies
that any nephrite tremolite formed in a
metasomatic reaction zone would acquire
Sr overwhelmingly from the latter, and
in doing so largely inherit its strontium
isotopic composition. This is well
illustrated in data from a New Zealand
locality (see Box A).
Strontium isotopes in nephrite jade
New ZealandRb-Sr and 87Sr/86Sr (present-day)
isotopic data for New Zealand nephrite
jades, summarized from the detailed study
of Adams et al.,(2007), are listed in Table
I and subdivided into the three geological
terrannes (Dun Mountain-Maitai, Caples
and Torlesse) that contain nephrite fields
(Beck, 2002). The great majority of these
data are from in situ jade occurrences, and
at many (but not all) of these localities, co-
existing host-rock age/isotopic data could
also be obtained. However, as discussed
above, several limitations frequently
preclude useful Rb-Sr nephrite and
host-rock age measurements, but rather,
since the Rb/Sr ratios are often very low
Box A. Nephrite in South Island, New ZealandAt an isolated nephrite jade locality in a serpentinite melange of the Dun
Mountain-Maitai terrane at Windon Burn, Livingstone Mountains, South Island,
New Zealand (Adams et al., 2007), a tectonic inclusion comprises dark grey, fine
metagreywacke and metasiltstones which define a Rb-Sr isochron age, 236±9 Ma
(Middle-Late Triassic), and initial 87Sr/86Sr 0.7051±0.0005 (Figure 4). These data
are characteristic of Late Permian, Maitai Group metasediments nearby to the
west (Adams et al., 2002). The metamorphism is coeval with a narrow (0.5 m)
metasomatic reaction zone at the metasediment/serpentinite boundary, where lenses
of nephrite jade have formed (Figure 3). The nephrite at this locality has a present-
day 87Sr/86Sr ratio 0.7057, and the initial 87Sr/86Sr ratio, calculated at 236 Ma, is 0.7056,
coincident with that of the metasediments. Crucially, these data support a model for
nephrite formation at a late stage. Its isotopic characteristics could not have been
acquired during serpentinization, with its associated metasomatic release of Ca, and
Sr of primitive Sr-isotopic composition (0.7032–0.7035), but rather later with the
metamorphism/shearing that created the tremolite fabric.
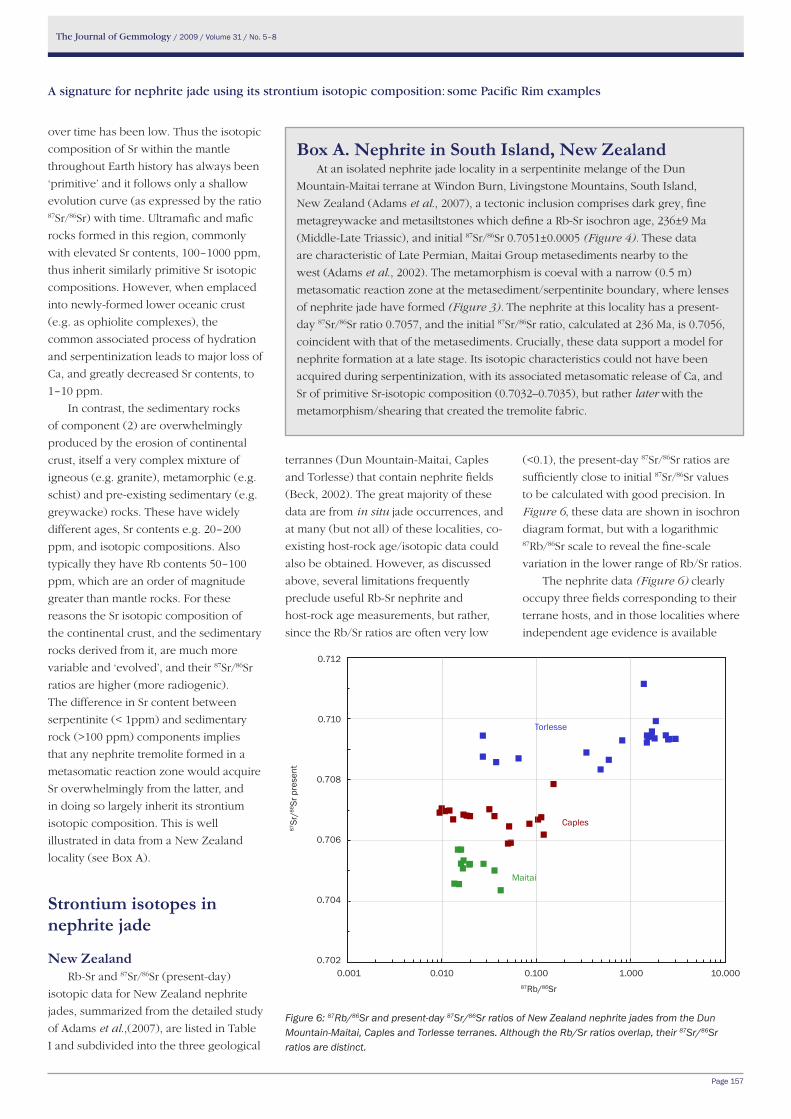
Figure 6: 87Rb/86Sr and present-day 87Sr/86Sr ratios of New Zealand nephrite jades from the Dun Mountain-Maitai, Caples and Torlesse terranes. Although the Rb/Sr ratios overlap, their 87Sr/86Sr ratios are distinct.
(<0.1), the present-day 87Sr/86Sr ratios are
sufficiently close to initial 87Sr/86Sr values
to be calculated with good precision. In
Figure 6, these data are shown in isochron
diagram format, but with a logarithmic 87Rb/86Sr scale to reveal the fine-scale
variation in the lower range of Rb/Sr ratios.
The nephrite data (Figure 6) clearly
occupy three fields corresponding to their
terrane hosts, and in those localities where
independent age evidence is available
A signature for nephrite jade using its strontium isotopic composition: some Pacific Rim examples
0.712
0.710
0.708
0.706
0.704
0.7020.001 0.010 0.100 1.000 10.000
87Rb/86Sr
87Sr
/86Sr
pre
sent
Torlesse
Caples
Maitai
The Journal of Gemmology / 2009 / Volume 31 / No. 5–8
Page 158
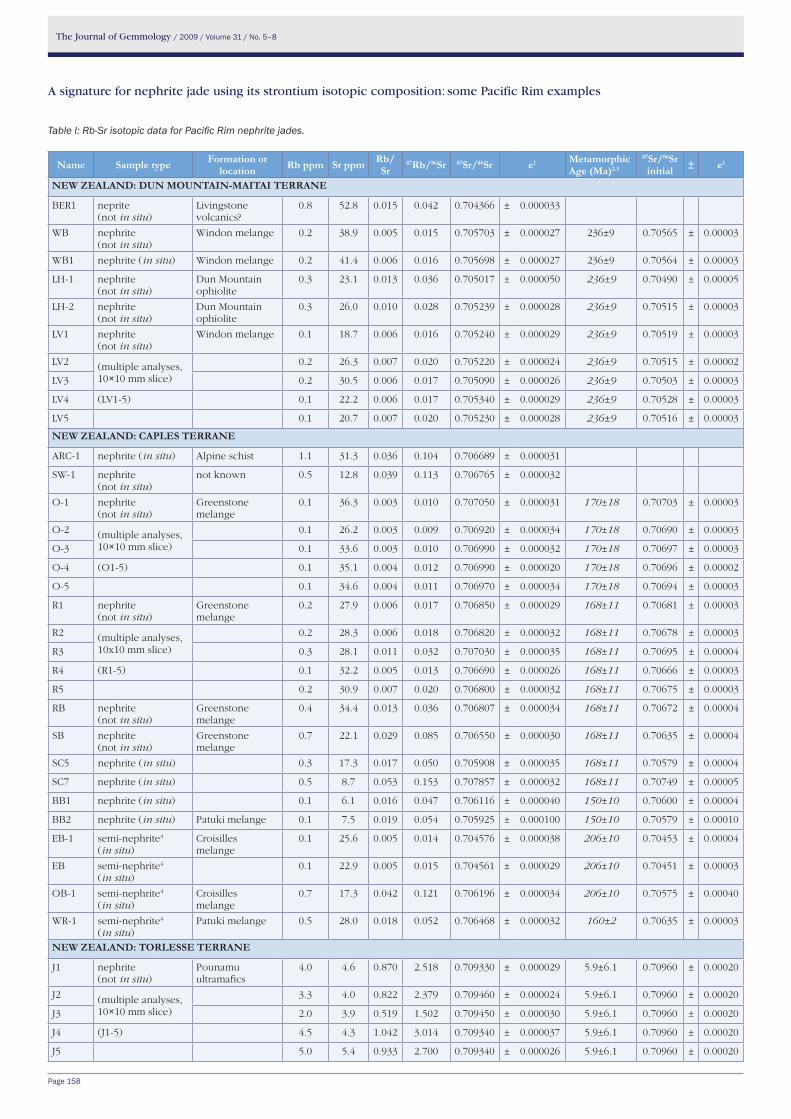
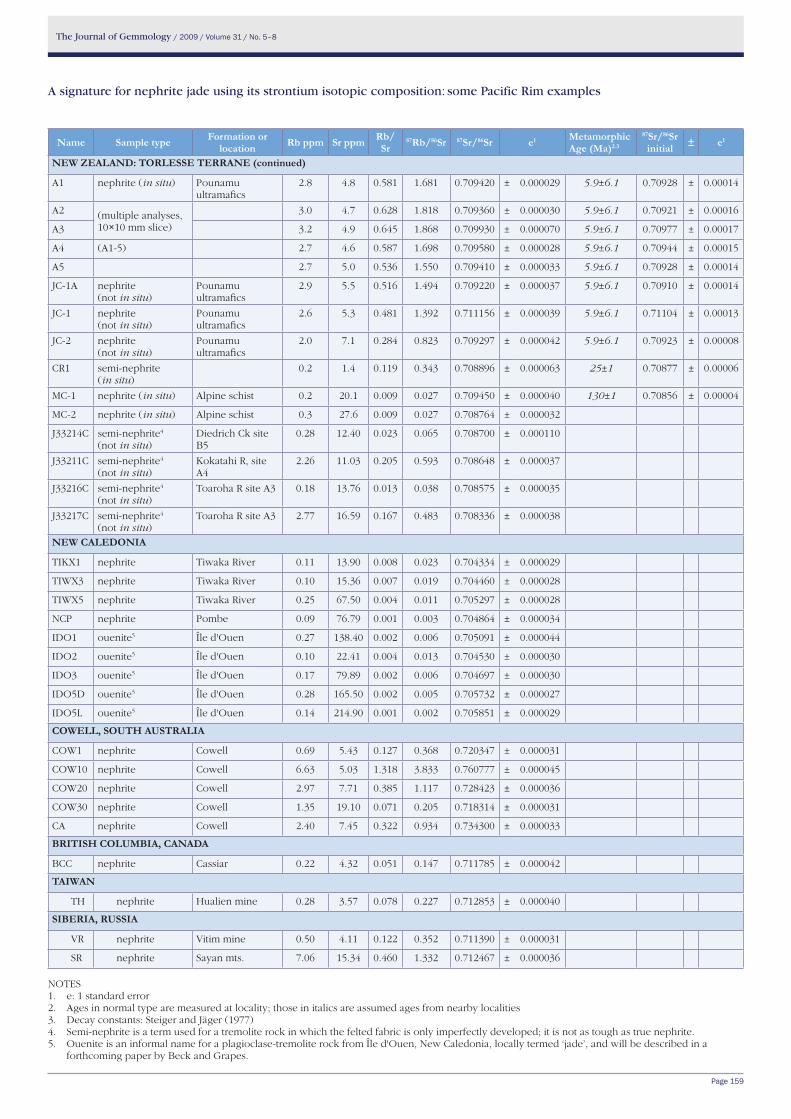
Table I: Rb-Sr isotopic data for Pacific Rim nephrite jades.
Name Sample type Formation or location Rb ppm Sr ppm Rb/
Sr87Rb/86Sr 87Sr/86Sr e1 Metamorphic
Age (Ma)2.3
87Sr/86Sr initial ± e1
New ZeAlAND: DuN MouNtAIN-MAItAI teRRANe
BER1 neprite (not in situ)
Livingstone volcanics?
0.8 52.8 0.015 0.042 0.704366 ± 0.000033
WB nephrite (not in situ)
Windon melange 0.2 38.9 0.005 0.015 0.705703 ± 0.000027 236±9 0.70565 ± 0.00003
WB1 nephrite (in situ) Windon melange 0.2 41.4 0.006 0.016 0.705698 ± 0.000027 236±9 0.70564 ± 0.00003
LH-1 nephrite (not in situ)
Dun Mountain ophiolite
0.3 23.1 0.013 0.036 0.705017 ± 0.000050 236±9 0.70490 ± 0.00005
LH-2 nephrite (not in situ)
Dun Mountain ophiolite
0.3 26.0 0.010 0.028 0.705239 ± 0.000028 236±9 0.70515 ± 0.00003
LV1 nephrite (not in situ)
Windon melange 0.1 18.7 0.006 0.016 0.705240 ± 0.000029 236±9 0.70519 ± 0.00003
LV2 (multiple analyses,10×10 mm slice)
0.2 26.3 0.007 0.020 0.705220 ± 0.000024 236±9 0.70515 ± 0.00002
LV3 0.2 30.5 0.006 0.017 0.705090 ± 0.000026 236±9 0.70503 ± 0.00003
LV4 (LV1-5) 0.1 22.2 0.006 0.017 0.705340 ± 0.000029 236±9 0.70528 ± 0.00003
LV5 0.1 20.7 0.007 0.020 0.705230 ± 0.000028 236±9 0.70516 ± 0.00003
New ZeAlAND: CAPleS teRRANe
ARC-1 nephrite (in situ) Alpine schist 1.1 31.3 0.036 0.104 0.706689 ± 0.000031
SW-1 nephrite (not in situ)
not known 0.5 12.8 0.039 0.113 0.706765 ± 0.000032
O-1 nephrite (not in situ)
Greenstone melange
0.1 36.3 0.003 0.010 0.707050 ± 0.000031 170±18 0.70703 ± 0.00003
O-2 (multiple analyses,10×10 mm slice)
0.1 26.2 0.003 0.009 0.706920 ± 0.000034 170±18 0.70690 ± 0.00003
O-3 0.1 33.6 0.003 0.010 0.706990 ± 0.000032 170±18 0.70697 ± 0.00003
O-4 (O1-5) 0.1 35.1 0.004 0.012 0.706990 ± 0.000020 170±18 0.70696 ± 0.00002
O-5 0.1 34.6 0.004 0.011 0.706970 ± 0.000034 170±18 0.70694 ± 0.00003
R1 nephrite (not in situ)
Greenstone melange
0.2 27.9 0.006 0.017 0.706850 ± 0.000029 168±11 0.70681 ± 0.00003
R2 (multiple analyses,10x10 mm slice)
0.2 28.3 0.006 0.018 0.706820 ± 0.000032 168±11 0.70678 ± 0.00003
R3 0.3 28.1 0.011 0.032 0.707030 ± 0.000035 168±11 0.70695 ± 0.00004
R4 (R1-5) 0.1 32.2 0.005 0.013 0.706690 ± 0.000026 168±11 0.70666 ± 0.00003
R5 0.2 30.9 0.007 0.020 0.706800 ± 0.000032 168±11 0.70675 ± 0.00003
RB nephrite (not in situ)
Greenstone melange
0.4 34.4 0.013 0.036 0.706807 ± 0.000034 168±11 0.70672 ± 0.00004
SB nephrite (not in situ)
Greenstone melange
0.7 22.1 0.029 0.085 0.706550 ± 0.000030 168±11 0.70635 ± 0.00004
SC5 nephrite (in situ) 0.3 17.3 0.017 0.050 0.705908 ± 0.000035 168±11 0.70579 ± 0.00004
SC7 nephrite (in situ) 0.5 8.7 0.053 0.153 0.707857 ± 0.000032 168±11 0.70749 ± 0.00005
BB1 nephrite (in situ) 0.1 6.1 0.016 0.047 0.706116 ± 0.000040 150±10 0.70600 ± 0.00004
BB2 nephrite (in situ) Patuki melange 0.1 7.5 0.019 0.054 0.705925 ± 0.000100 150±10 0.70579 ± 0.00010
EB-1 semi-nephrite4 (in situ)
Croisilles melange
0.1 25.6 0.005 0.014 0.704576 ± 0.000038 206±10 0.70453 ± 0.00004
EB semi-nephrite4 (in situ)
0.1 22.9 0.005 0.015 0.704561 ± 0.000029 206±10 0.70451 ± 0.00003
OB-1 semi-nephrite4 (in situ)
Croisilles melange
0.7 17.3 0.042 0.121 0.706196 ± 0.000034 206±10 0.70575 ± 0.00040
WR-1 semi-nephrite4 (in situ)
Patuki melange 0.5 28.0 0.018 0.052 0.706468 ± 0.000032 160±2 0.70635 ± 0.00003
New ZeAlAND: toRleSSe teRRANe
J1 nephrite (not in situ)
Pounamu ultramafics
4.0 4.6 0.870 2.518 0.709330 ± 0.000029 5.9±6.1 0.70960 ± 0.00020
J2 (multiple analyses,10×10 mm slice)
3.3 4.0 0.822 2.379 0.709460 ± 0.000024 5.9±6.1 0.70960 ± 0.00020
J3 2.0 3.9 0.519 1.502 0.709450 ± 0.000030 5.9±6.1 0.70960 ± 0.00020
J4 (J1-5) 4.5 4.3 1.042 3.014 0.709340 ± 0.000037 5.9±6.1 0.70960 ± 0.00020
J5 5.0 5.4 0.933 2.700 0.709340 ± 0.000026 5.9±6.1 0.70960 ± 0.00020
A signature for nephrite jade using its strontium isotopic composition: some Pacific Rim examples
The Journal of Gemmology / 2009 / Volume 31 / No. 5–8
Page 159
Table I: Rb-Sr isotopic data for Pacific Rim nephrite jades.
Name Sample type Formation or location Rb ppm Sr ppm Rb/
Sr87Rb/86Sr 87Sr/86Sr e1 Metamorphic
Age (Ma)2.3
87Sr/86Sr initial ± e1
New ZeAlAND: DuN MouNtAIN-MAItAI teRRANe
BER1 neprite (not in situ)
Livingstone volcanics?
0.8 52.8 0.015 0.042 0.704366 ± 0.000033
WB nephrite (not in situ)
Windon melange 0.2 38.9 0.005 0.015 0.705703 ± 0.000027 236±9 0.70565 ± 0.00003
WB1 nephrite (in situ) Windon melange 0.2 41.4 0.006 0.016 0.705698 ± 0.000027 236±9 0.70564 ± 0.00003
LH-1 nephrite (not in situ)
Dun Mountain ophiolite
0.3 23.1 0.013 0.036 0.705017 ± 0.000050 236±9 0.70490 ± 0.00005
LH-2 nephrite (not in situ)
Dun Mountain ophiolite
0.3 26.0 0.010 0.028 0.705239 ± 0.000028 236±9 0.70515 ± 0.00003
LV1 nephrite (not in situ)
Windon melange 0.1 18.7 0.006 0.016 0.705240 ± 0.000029 236±9 0.70519 ± 0.00003
LV2 (multiple analyses,10×10 mm slice)
0.2 26.3 0.007 0.020 0.705220 ± 0.000024 236±9 0.70515 ± 0.00002
LV3 0.2 30.5 0.006 0.017 0.705090 ± 0.000026 236±9 0.70503 ± 0.00003
LV4 (LV1-5) 0.1 22.2 0.006 0.017 0.705340 ± 0.000029 236±9 0.70528 ± 0.00003
LV5 0.1 20.7 0.007 0.020 0.705230 ± 0.000028 236±9 0.70516 ± 0.00003
New ZeAlAND: CAPleS teRRANe
ARC-1 nephrite (in situ) Alpine schist 1.1 31.3 0.036 0.104 0.706689 ± 0.000031
SW-1 nephrite (not in situ)
not known 0.5 12.8 0.039 0.113 0.706765 ± 0.000032
O-1 nephrite (not in situ)
Greenstone melange
0.1 36.3 0.003 0.010 0.707050 ± 0.000031 170±18 0.70703 ± 0.00003
O-2 (multiple analyses,10×10 mm slice)
0.1 26.2 0.003 0.009 0.706920 ± 0.000034 170±18 0.70690 ± 0.00003
O-3 0.1 33.6 0.003 0.010 0.706990 ± 0.000032 170±18 0.70697 ± 0.00003
O-4 (O1-5) 0.1 35.1 0.004 0.012 0.706990 ± 0.000020 170±18 0.70696 ± 0.00002
O-5 0.1 34.6 0.004 0.011 0.706970 ± 0.000034 170±18 0.70694 ± 0.00003
R1 nephrite (not in situ)
Greenstone melange
0.2 27.9 0.006 0.017 0.706850 ± 0.000029 168±11 0.70681 ± 0.00003
R2 (multiple analyses,10x10 mm slice)
0.2 28.3 0.006 0.018 0.706820 ± 0.000032 168±11 0.70678 ± 0.00003
R3 0.3 28.1 0.011 0.032 0.707030 ± 0.000035 168±11 0.70695 ± 0.00004
R4 (R1-5) 0.1 32.2 0.005 0.013 0.706690 ± 0.000026 168±11 0.70666 ± 0.00003
R5 0.2 30.9 0.007 0.020 0.706800 ± 0.000032 168±11 0.70675 ± 0.00003
RB nephrite (not in situ)
Greenstone melange
0.4 34.4 0.013 0.036 0.706807 ± 0.000034 168±11 0.70672 ± 0.00004
SB nephrite (not in situ)
Greenstone melange
0.7 22.1 0.029 0.085 0.706550 ± 0.000030 168±11 0.70635 ± 0.00004
SC5 nephrite (in situ) 0.3 17.3 0.017 0.050 0.705908 ± 0.000035 168±11 0.70579 ± 0.00004
SC7 nephrite (in situ) 0.5 8.7 0.053 0.153 0.707857 ± 0.000032 168±11 0.70749 ± 0.00005
BB1 nephrite (in situ) 0.1 6.1 0.016 0.047 0.706116 ± 0.000040 150±10 0.70600 ± 0.00004
BB2 nephrite (in situ) Patuki melange 0.1 7.5 0.019 0.054 0.705925 ± 0.000100 150±10 0.70579 ± 0.00010
EB-1 semi-nephrite4 (in situ)
Croisilles melange
0.1 25.6 0.005 0.014 0.704576 ± 0.000038 206±10 0.70453 ± 0.00004
EB semi-nephrite4 (in situ)
0.1 22.9 0.005 0.015 0.704561 ± 0.000029 206±10 0.70451 ± 0.00003
OB-1 semi-nephrite4 (in situ)
Croisilles melange
0.7 17.3 0.042 0.121 0.706196 ± 0.000034 206±10 0.70575 ± 0.00040
WR-1 semi-nephrite4 (in situ)
Patuki melange 0.5 28.0 0.018 0.052 0.706468 ± 0.000032 160±2 0.70635 ± 0.00003
New ZeAlAND: toRleSSe teRRANe
J1 nephrite (not in situ)
Pounamu ultramafics
4.0 4.6 0.870 2.518 0.709330 ± 0.000029 5.9±6.1 0.70960 ± 0.00020
J2 (multiple analyses,10×10 mm slice)
3.3 4.0 0.822 2.379 0.709460 ± 0.000024 5.9±6.1 0.70960 ± 0.00020
J3 2.0 3.9 0.519 1.502 0.709450 ± 0.000030 5.9±6.1 0.70960 ± 0.00020
J4 (J1-5) 4.5 4.3 1.042 3.014 0.709340 ± 0.000037 5.9±6.1 0.70960 ± 0.00020
J5 5.0 5.4 0.933 2.700 0.709340 ± 0.000026 5.9±6.1 0.70960 ± 0.00020
Name Sample type Formation or location Rb ppm Sr ppm Rb/
Sr87Rb/86Sr 87Sr/86Sr e1 Metamorphic
Age (Ma)2.3
87Sr/86Sr initial ± e1
New ZeAlAND: toRleSSe teRRANe (continued)
A1 nephrite (in situ) Pounamu ultramafics
2.8 4.8 0.581 1.681 0.709420 ± 0.000029 5.9±6.1 0.70928 ± 0.00014
A2 (multiple analyses,10×10 mm slice)
3.0 4.7 0.628 1.818 0.709360 ± 0.000030 5.9±6.1 0.70921 ± 0.00016
A3 3.2 4.9 0.645 1.868 0.709930 ± 0.000070 5.9±6.1 0.70977 ± 0.00017
A4 (A1-5) 2.7 4.6 0.587 1.698 0.709580 ± 0.000028 5.9±6.1 0.70944 ± 0.00015
A5 2.7 5.0 0.536 1.550 0.709410 ± 0.000033 5.9±6.1 0.70928 ± 0.00014
JC-1A nephrite (not in situ)
Pounamu ultramafics
2.9 5.5 0.516 1.494 0.709220 ± 0.000037 5.9±6.1 0.70910 ± 0.00014
JC-1 nephrite (not in situ)
Pounamu ultramafics
2.6 5.3 0.481 1.392 0.711156 ± 0.000039 5.9±6.1 0.71104 ± 0.00013
JC-2 nephrite (not in situ)
Pounamu ultramafics
2.0 7.1 0.284 0.823 0.709297 ± 0.000042 5.9±6.1 0.70923 ± 0.00008
CR1 semi-nephrite (in situ)
0.2 1.4 0.119 0.343 0.708896 ± 0.000063 25±1 0.70877 ± 0.00006
MC-1 nephrite (in situ) Alpine schist 0.2 20.1 0.009 0.027 0.709450 ± 0.000040 130±1 0.70856 ± 0.00004
MC-2 nephrite (in situ) Alpine schist 0.3 27.6 0.009 0.027 0.708764 ± 0.000032
J33214C semi-nephrite4 (not in situ)
Diedrich Ck site B5
0.28 12.40 0.023 0.065 0.708700 ± 0.000110
J33211C semi-nephrite4 (not in situ)
Kokatahi R, site A4
2.26 11.03 0.205 0.593 0.708648 ± 0.000037
J33216C semi-nephrite4 (not in situ)
Toaroha R site A3 0.18 13.76 0.013 0.038 0.708575 ± 0.000035
J33217C semi-nephrite4 (not in situ)
Toaroha R site A3 2.77 16.59 0.167 0.483 0.708336 ± 0.000038
New CAleDoNIA
TIKX1 nephrite Tiwaka River 0.11 13.90 0.008 0.023 0.704334 ± 0.000029
TIWX3 nephrite Tiwaka River 0.10 15.36 0.007 0.019 0.704460 ± 0.000028
TIWX5 nephrite Tiwaka River 0.25 67.50 0.004 0.011 0.705297 ± 0.000028
NCP nephrite Pombe 0.09 76.79 0.001 0.003 0.704864 ± 0.000034
IDO1 ouenite5 Île d'Ouen 0.27 138.40 0.002 0.006 0.705091 ± 0.000044
IDO2 ouenite5 Île d'Ouen 0.10 22.41 0.004 0.013 0.704530 ± 0.000030
IDO3 ouenite5 Île d'Ouen 0.17 79.89 0.002 0.006 0.704697 ± 0.000030
IDO5D ouenite5 Île d'Ouen 0.28 165.50 0.002 0.005 0.705732 ± 0.000027
IDO5L ouenite5 Île d'Ouen 0.14 214.90 0.001 0.002 0.705851 ± 0.000029
Cowell, South AuStRAlIA
COW1 nephrite Cowell 0.69 5.43 0.127 0.368 0.720347 ± 0.000031
COW10 nephrite Cowell 6.63 5.03 1.318 3.833 0.760777 ± 0.000045
COW20 nephrite Cowell 2.97 7.71 0.385 1.117 0.728423 ± 0.000036
COW30 nephrite Cowell 1.35 19.10 0.071 0.205 0.718314 ± 0.000031
CA nephrite Cowell 2.40 7.45 0.322 0.934 0.734300 ± 0.000033
BRItISh ColuMBIA, CANADA
BCC nephrite Cassiar 0.22 4.32 0.051 0.147 0.711785 ± 0.000042
tAIwAN
TH nephrite Hualien mine 0.28 3.57 0.078 0.227 0.712853 ± 0.000040
SIBeRIA, RuSSIA
VR nephrite Vitim mine 0.50 4.11 0.122 0.352 0.711390 ± 0.000031
SR nephrite Sayan mts. 7.06 15.34 0.460 1.332 0.712467 ± 0.000036
NOTES1. e: 1 standard error 2. Ages in normal type are measured at locality; those in italics are assumed ages from nearby localities 3. Decay constants: Steiger and Jäger (1977) 4. Semi-nephrite is a term used for a tremolite rock in which the felted fabric is only imperfectly developed; it is not as tough as true nephrite. 5. Ouenite is an informal name for a plagioclase-tremolite rock from Île d'Ouen, New Caledonia, locally termed ‘jade’, and will be described in a
forthcoming paper by Beck and Grapes.
A signature for nephrite jade using its strontium isotopic composition: some Pacific Rim examples
The Journal of Gemmology / 2009 / Volume 31 / No. 5–8
Page 160
(see Adams et al., 2007) to calculate the
nephrite initial Sr-isotopic composition,
then these fall within the data range
of their host-rock terranes as shown in
Figure 5.
The Torlesse terrane nephrites have
the highest and greatest range of Rb/Sr
ratios, a feature of the Torlesse terrane
host-rock schists also. They principally
form within a metamorphic zone (Alpine
Schist) at 5–10 Ma, much younger than
their other terrane counterparts, so that
the radiogenic strontium corrections
required for Sr-initial ratio determination
are trivial. The high present-day 87Sr/86Sr
ratios, 0.708-0.711 (Figure 6) of the
Torlesse terrane nephrites are thus
mainly a consequence of the high initial 87Sr/86Sr ratios (at time of metamorphism),
0.706–0.710, of their Torlesse Group
metasediment host-rocks (Figure 5).
Similarly, present-day 87Sr/86Sr ratios,
0.704–0.706, for Dun Mountain-Maitai
terrane nephrites (Figure 6) fall within
the initial 87Sr/86Sr range for Maitai Group
metasediments (Figure 5). In this case,
although the metamorphic ages of the
nephrites are much older, c. 220–250 Ma,
the Rb/Sr ratios, and their range, are 1–2
orders of magnitude lower, and thus the
radiogenic isotope correction to calculate
the initial 87Sr/86Sr ratios (at time of
metamorphism) remains minimal.
The Caples terrane nephrite present-
day 87Sr/86Sr data (c. 0.706–0.707) occupy
an intermediate position, between
those of Dun Mountain-Maitai and
Caples terranes (Figure 6). Here, the
metamorphic ages of most of the host
Caples Group metasediments are in the
range 140–180 Ma and, with 87Rb/86Sr
ratios considerably higher than Dun
Mountain-Maitai terrane examples, the
calculated nephrite initial 87Sr/86Sr ratios
are c. 0.705–0.706. These are significantly
lower than present-day values, but just
coinciding with uppermost values from
the host rocks, c. 0.7055 (Figure 5).
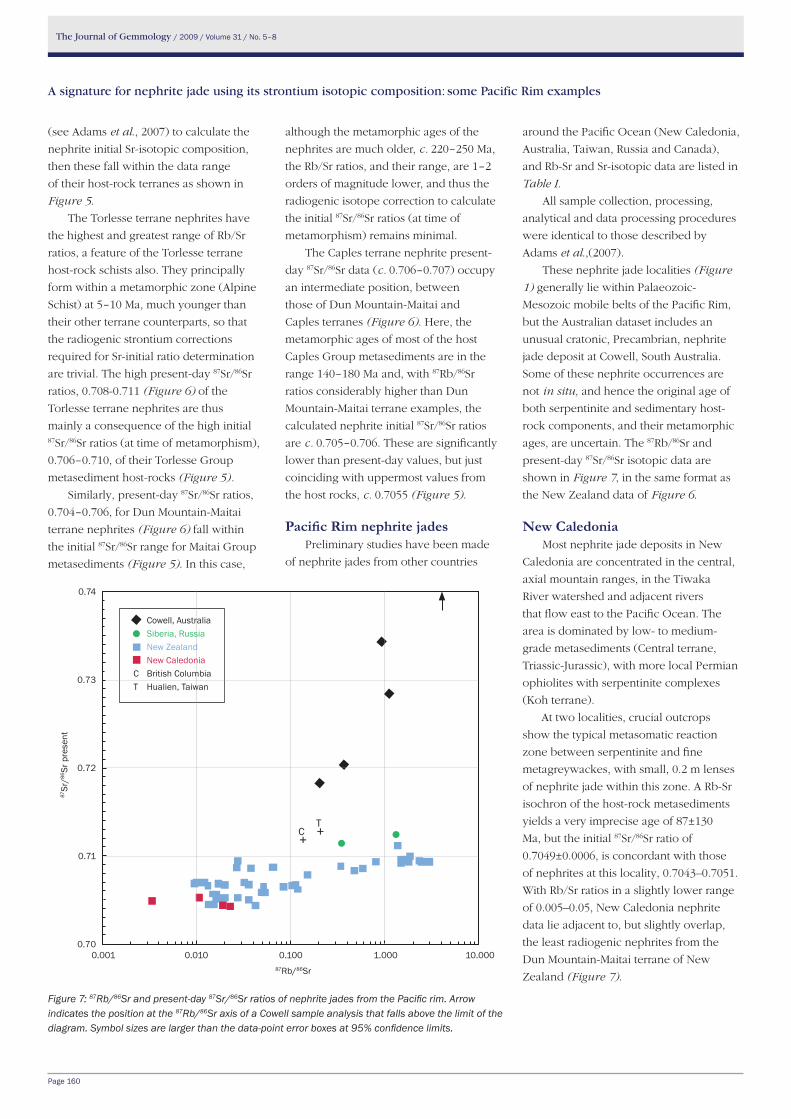
Pacific Rim nephrite jadesPreliminary studies have been made
of nephrite jades from other countries
around the Pacific Ocean (New Caledonia,
Australia, Taiwan, Russia and Canada),
and Rb-Sr and Sr-isotopic data are listed in
Table I.
All sample collection, processing,
analytical and data processing procedures
were identical to those described by
Adams et al.,(2007).
These nephrite jade localities (Figure
1) generally lie within Palaeozoic-
Mesozoic mobile belts of the Pacific Rim,
but the Australian dataset includes an
unusual cratonic, Precambrian, nephrite
jade deposit at Cowell, South Australia.
Some of these nephrite occurrences are
not in situ, and hence the original age of
both serpentinite and sedimentary host-
rock components, and their metamorphic
ages, are uncertain. The 87Rb/86Sr and
present-day 87Sr/86Sr isotopic data are
shown in Figure 7, in the same format as
the New Zealand data of Figure 6.
New CaledoniaMost nephrite jade deposits in New
Caledonia are concentrated in the central,
axial mountain ranges, in the Tiwaka
River watershed and adjacent rivers
that flow east to the Pacific Ocean. The
area is dominated by low- to medium-
grade metasediments (Central terrane,
Triassic-Jurassic), with more local Permian
ophiolites with serpentinite complexes
(Koh terrane).
At two localities, crucial outcrops
show the typical metasomatic reaction
zone between serpentinite and fine
metagreywackes, with small, 0.2 m lenses
of nephrite jade within this zone. A Rb-Sr
isochron of the host-rock metasediments
yields a very imprecise age of 87±130
Ma, but the initial 87Sr/86Sr ratio of
0.7049±0.0006, is concordant with those
of nephrites at this locality, 0.7043–0.7051.
With Rb/Sr ratios in a slightly lower range
of 0.005–0.05, New Caledonia nephrite
data lie adjacent to, but slightly overlap,
the least radiogenic nephrites from the
Dun Mountain-Maitai terrane of New
Zealand (Figure 7).
Figure 7: 87Rb/86Sr and present-day 87Sr/86Sr ratios of nephrite jades from the Pacific rim. Arrow indicates the position at the 87Rb/86Sr axis of a Cowell sample analysis that falls above the limit of the diagram. Symbol sizes are larger than the data-point error boxes at 95% confidence limits.
A signature for nephrite jade using its strontium isotopic composition: some Pacific Rim examples
C +
0.74
0.73
0.72
0.71
0.700.001 0.010 0.100 1.000 10.000
87Rb/86Sr
T +
87Sr
/86Sr
pre
sent
Cowell, Australia Siberia, Russia New Zealand New CaledoniaC British ColumbiaT Hualien, Taiwan
The Journal of Gemmology / 2009 / Volume 31 / No. 5–8
Page 161
Cowell, South AustraliaNephrite jade occurs west of Cowell,
South Australia, in an amphibolite
facies metamorphic complex (Cleve
Metamorphics) of late Palaeoproterozoic
age, c. 1600–1700 Ma. A dark green-
black jade forms massive (m-scale)
lenses in metasomatic reaction zones
between granite-gneisses and horizons
of metasediment, metavolcanics, talc-
schist, dolomitic marble and serpentine
marble (Nichol, 1974, 1977). The nephrite
jades (Table I, Figure 7) have distinctive,
high present-day 87Sr/86Sr ratios of
0.720–0.760, presumably reflecting their
Precambrian ancestry. Although the
several samples come from four separate
outcrops, the general slope of the Cowell
data array (Figure 7) reflects an Rb-Sr
isochron metamorphic age of c. 800 Ma
(Neoproterozoic), much younger than
elsewhere in the Cleve metamorphic
complex, but still with distinctively high
initial 87Sr/86Sr ratios of 0.715–0.720.
taiwanNephrite jade is well known in
Taiwan; it is found as boulders in several
rivers on the east coast of the island, and
formerly was mined in the Fengtien area,
near the city of Hualien. The Fengtien
in situ deposits lie within a 3 x 10 km
area, where massive jade lenses (m-scale)
and diopside-rock intervene between
greenschist facies, graphitic mica-schists
(Tananao Schist) and serpentinite, which
together form part of a late Palaeozoic-
Mesozoic basement metamorphic complex
(Li-Ping Tan et al., 1978). In Figure 7 the
isotopic data for a Fengtien nephrite jade
fall between the Cowell and New Zealand
data, and the high present-day 87Sr/86Sr
ratio, 0.7128, suggests that the radiogenic
strontium contribution to this nephrite
would originate from relatively old host-
rock metasediments. Unfortunately, their
age is not known and an initial 87Sr/86Sr
ratio cannot yet be calculated.
British Columbia, CanadaNumerous nephrite deposits occur
along a NW–SE trending belt, 50 km
wide, through central British Columbia
(Leaming, 1978). All are associated with
late Palaeozoic/early Mesozoic ophiolite
complexes, and are concentrated in
southern (Lillooet), central (Omineca)
and northern (Cassiar) fields. Much of the
nephrite is recovered from river and glacial
deposits, but in situ deposits exist within
the Late Devonian to Early Carboniferous
Cache Creek Group (ophiolites, chert,
argillite and volcanics), at Dease Lake
and Cassiar. In Figure 7, a single nephrite
analysis from Cassiar appears similar to
that of nephrite from Taiwan, and their
ages and calculated initial 87Sr/86Sr ratios
are also similar.
Siberia, RussiaTwo important nephrite jade fields
occur in Siberia. In the Vitim River
area nephrite forms at contacts of early
Palaeozoic leucocratic granitoids with
dolomitic marbles to form distinctive
greenish-white jade (Sekerin and Sekerina,
1986a, 1986b; Sekerina, 1992; Suturin and
Zamaletdinov, 1984). In the East Sayan
mountains, there is a major nephrite deposit
in Late Proterozoic (or possibly Cambrian)
ultramafic complexes of the Ospinsk-Kitoy
massif. The nephrite lies within metasomatic
reaction zones between serpentinite and
albitized gabbro and/or albitites (Kolensik,
1970; Prokhor 1991).
Again, the present-day Sr-isotopic
ratios of the Siberian nephrites,
0.7113–0.7125 (Figure 7), are similar to
those in the nephrites from Taiwan and
Canada, but the latter have significantly
higher Rb/Sr ratios. Since the host-rocks in
this region are probably early Palaeozoic
or older, their contents of radiogenic
strontium would be significant, and any
calculated initial 87Sr/86Sr ratios substantially
lower than these present-day values.
ConclusionsThe New Zealand nephrite jade
results (Figure 6) clearly show a strong
association with the age and isotopic
history of their host-rocks. The initial Sr-
isotope signatures of each South Island
jade field are diagnostic of its terrane and
distinctive at least on a 1–10 km scale. At
this level, they thus provide a trustworthy
characteristic for identification of nephrite
jade sources.
Our preliminary data for other jade
provinces around the Pacific Rim appear
equally distinctive (Figure 7), with only
slight overlap with the New Zealand
datafields. Although all the samples
are from (or very close to) in situ jade
occurrences, in many localities the
precise relationship to, and age of, the
host rocks are unknown or ambiguous,
and therefore the initial Sr-isotopic ratios
cannot be calculated with precision. Work
is now underway to obtain high-quality
Rb-Sr isochron age data from host-rock
horizons immediately adjacent to the
Tiwaka (New Caledonia), Tamworth and
Cowell (Australia), and Hualien (Taiwan)
jade deposits to improve these Sr-isotope
signatures, and to define real Sr-isotope
datafields with accuracies similar to those
of New Zealand. However, it is clear even
from our preliminary New Caledonia
nephrite data that the low Rb/Sr and
initial 87Sr/86Sr ratios reflect the relatively
young age (possible Late Jurassic) and
juvenile sediment material (active volcanic
arc) of their host-rocks. In contrast, the
much older (Precambrian) and evolved
(‘continental’) host-rocks at Cowell, South
Australia, bequeath their distinctively
higher radiogenic 87Sr/86Sr ratios on
nephrite jade from this locality.
AcknowledgementsWe thank our Ngai Tahu, Mawhera
Incorporation and GNS colleagues
(especially Simon Cox) in New Zealand,
Pierre Maurizot and Christophe Sand (New
Caledonia), Robin Offler and Mark Sekerin
(Australia), and Tzen-Fu Yui (Taiwan), for
sharing their local jade expertise with us.
CJA also much appreciates the technical
advice and practical assistance of Roland
Maas and Graeme Luther at the VIEPS
Radiogenic Isotope laboratory, La Trobe
University, Melbourne. Simon Cox is
also thanked for a preliminary review of
this manuscript.
A signature for nephrite jade using its strontium isotopic composition: some Pacific Rim examples
The Journal of Gemmology / 2009 / Volume 31 / No. 5–8
Page 162
ReferencesAdams, C.J., and Graham, I.J., 1996.
Metamorphic and tectonic
geochronology of the Torlesse
terrane, Wellington, New Zealand.
New Zealand Journal of Geology and
Geophysics, 39, 157–80
Adams, C.J., and Graham, I.J., 1997. Age
of metamorphism of Otago Schist in
eastern Otago and determination of
protoliths from initial strontium isotope
characteristics. New Zealand Journal
of Geology and Geophysics, 40, 275–86
Adams, C.J., and Maas, R., 2004. Rb–Sr age
and strontium isotopic characterisation
of the Torlesse Supergroup in
Canterbury, New Zealand, and
implications for the status of the Rakaia
terrane. New Zealand Journal of
Geology and Geophysics, 47, 201–18
Adams, C.J., Graham, I.J., and Johnston,
M.R., 1999. Age and isotopic
characterisation of geological terranes
in Marlborough Schist, Nelson/
Marlborough, New Zealand. New
Zealand Journal of Geology and
Geophysics, 42, 33–55
Adams, C.J., Barley, M.E., Maas, R.,and
Doyle, M.G., 2002. Provenance
of Permian-Triassic volcaniclastic
sedimentary terranes in New Zealand:
evidence from their radiogenic isotope
characteristics and detrital mineral
age patterns. New Zealand Journal of
Geology and Geophysics, 45, 221–42
Adams, C.J., Beck, R.J., and Campbell, H.J.,
2007. Characterisation and origin of
New Zealand nephrite jade using its
strontium isotopic signature. Lithos,
97, 307–22
Beck, R.J. (with Mason, M.), 2002. Mana
Pounamu - New Zealand Jade. Reed,
Auckland, 184 pp
Coleman, R.G., 1966. New serpentinites
and associated metasomatic rocks. New
Zealand Geological Survey Bulletin,
76, 1–102
Cooper, A.F., and Reay, A., 1983. Lithology,
field relations, and structure of the
Pounamu Ultramafics from the
Whitcombe and Hokitika Rivers,
Westland, New Zealand. New Zealand
Journal of Geology and Geophysics,
26, 359–79
Harlow, G.E., and Sorensen, S.S., 2005.
Jade (Nephrite and Jadeitite) and
serpentinite:metasomatic connections.
International Geology Review,
47, 113–46
Kolensik, Y.N., 1970. Nephrites of Siberia.
International Geology Review,
12, 1–107
Leaming, S.F., 1978. Jade in Canada.
Geological Survey of Canada Paper,
78/19
Li-Ping Tan, Chihming Wang Lee, Chi-
Chieu Chen, Pei-Lin Tien, Po-Chuan
Tsui and Tzen-Fu Yui, 1978. A
mineralogical study of the Fengtien
nephrite deposits of Hualien, Taiwan.
National Science Council (Taiwan)
Special Publication, 1, 1–81
Nichol, D., 1974. Nephrite jade deposits
near Cowell, South Australia.
Geological Survey Environment and
Resource Division, Department of
Mines, South Australia Report, 74/201
Nichol, D., 1977. Nephrite jade deposits
near Cowell. Mineral Resources Review
South Australia, 141, 11–26
Nichol, D., 2000. Two contrasting nephrite
jade types. Journal of Gemmology,
27(4), 193–200
Prokhor, S.A., 1991. The genesis of
nephrite and emplacement of the
nephrite-bearing ultramafic complexes
of East Sayan. International Geology
Review, 33, 290–300
Sekerin, A.P., and Sekerina, N.V., 1986a.
Genesis of leucocratic nephrites of
the central Vitim Highlands. Doklady
Akademii Nauk SSSR, 284, 103–5
Sekerin, A.P., and Sekerina, N.V., 1986b.
Petrology of granites in deposits of
light-coloured nephrite in the central
Vitim Highland country. Geologiya i
Geofisika, 27, 36–43
Sekerina, N.V., 1992. Main regularities of
nephrite formation. Russian Geology
and Geophysics, 33, 31–6
Steiger R.H., and Jäger, E., 1977.
Subcommission on Geochronology:
Convention on the use of
decay constants in geo- and
cosmochronology. Earth and
Planetary Science Letters, 36, 359–62
Suturin, A.N., and Zamaletdinov, R.S.,
1984. [Nephrites.] Nauka, Novosibirsk
(in Russian)
Wilkins, C.J., Craighead Tennant, W.,
Williamson, B.E., and McCammon,
C.A., 2003. Spectroscopic and
related evidence on the colouring
and constitution of New Zealand
jade. American Mineralogist,
88(8/9), 1336–44
the AuthorsDr Christopher J. AdamsGNS Science, P.O. Box 30368, Lower Hutt, New Zealand
email: [email protected]
Russell J. Beck FGA27 Chelmsford Street, Invercargill, New Zealand
email: [email protected]
A signature for nephrite jade using its strontium isotopic composition: some Pacific Rim examples
The Journal of Gemmology / 2009 / Volume 31 / No. 5–8
©2009 Gemmological Association of Great Britain Page 163
IntroductionJaspilites are iron- and silica-rich
metamorphic rocks of volcanic or
sedimentary origin, and only occur rarely
in nature. Worldwide they appear within
Precambrian complexes such as that in
the Hamersley Basin in the northwest of
Western Australia, Jasper Hill, Marquette
Iron Range, Michigan, and Diamond Hill,
Chittenden Co., Vermont, in the U.S.A.,
and the Krivoy Rog Basin, Dnepropetrovsk
region, in Ukraine (Trendall, 1975; Morris,
1980; Baranov, 2006; www.mindat.org/
min-26407.htm).
Ukrainian jaspilites are an important
strategic raw material for the metallurgical
industry in Krivoy Rog, Zaporozhe and
Komsomolsk (see Dumanska-Slowik et
al., 2007). Also many decorative types
can be distinguished among these rocks,
so some can be used in slab form as
facing stones on buildings, while others
are fine enough for jewellery (Heflik et
al., 2008). The industrial classification of
various jaspilite types was presented by
Baranov (2006), and the Gemmological
Centre of the National Mining University in
Dnepropetrovsk (Ukraine) has promoted
jaspilite as the prospective gemstone of
Ukraine for some years. The aim of the
latter is to show the natural beauty of
these stones and their potential use in
various contexts. However, the scope
of this promotion has been limited
since the majority of papers have been
published in Ukrainian and Russian (e.g.
Baranov, 2002, 2006; Baranov et al., 2006;
Heflik et al., 2008).
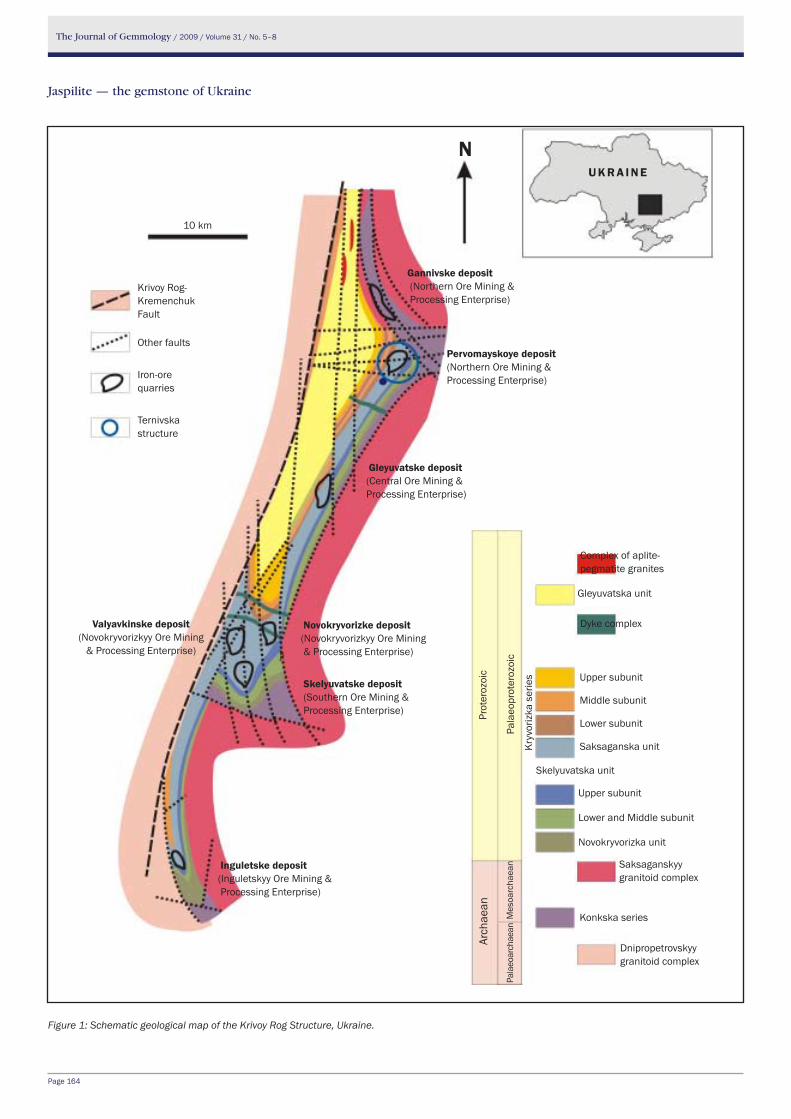
Geological settingOf 48 iron ore deposits in Ukraine,
only 25 are currently being exploited.
The Krivoy Rog iron-ore Basin is the main
mining centre and its main geological
features are shown in Figure 1. It is
ca. 100 km long by 2–7 km wide and
is elongate south–north. The Krivoy
Rog Basin is situated between two
large crustal blocks of different age: the
Ingulsky block built of Lower Proterozoic
granitoids and metamorphic rocks, and
the Srednepridneprovsky block containing
Archaean plagiogranites.
The Krivoy Rog Structure contains
complexes from both these blocks which
have been subjected to extensive and
strong folding and faulting. The jaspilites
occur within the Proterozoic sedimentary
and volcanic rocks (2.5–1.8 Ga) which
have been metamorphosed at greenschist
and amphibolite facies conditions. The
thicknesses of Fe-bearing rocks range
from 0.3 to 3.5 km.
Decorative jaspilite varieties Ukrainian jaspilites exhibit a wide
range of textures and colours, mainly
red with different tints from bright red to
deep-brown, yellow, orange and blue,
and some are grey with a metallic lustre.
Based on colour, six categories have been
distinguished:
• red-banded,
• orange-banded,
• yellow-banded,
Jaspilite — the gemstone of Ukraine
P. Baranov, S. Shevchenko, W. Heflik, L. Natkaniec-Nowak and M. Dumańska-Słowik
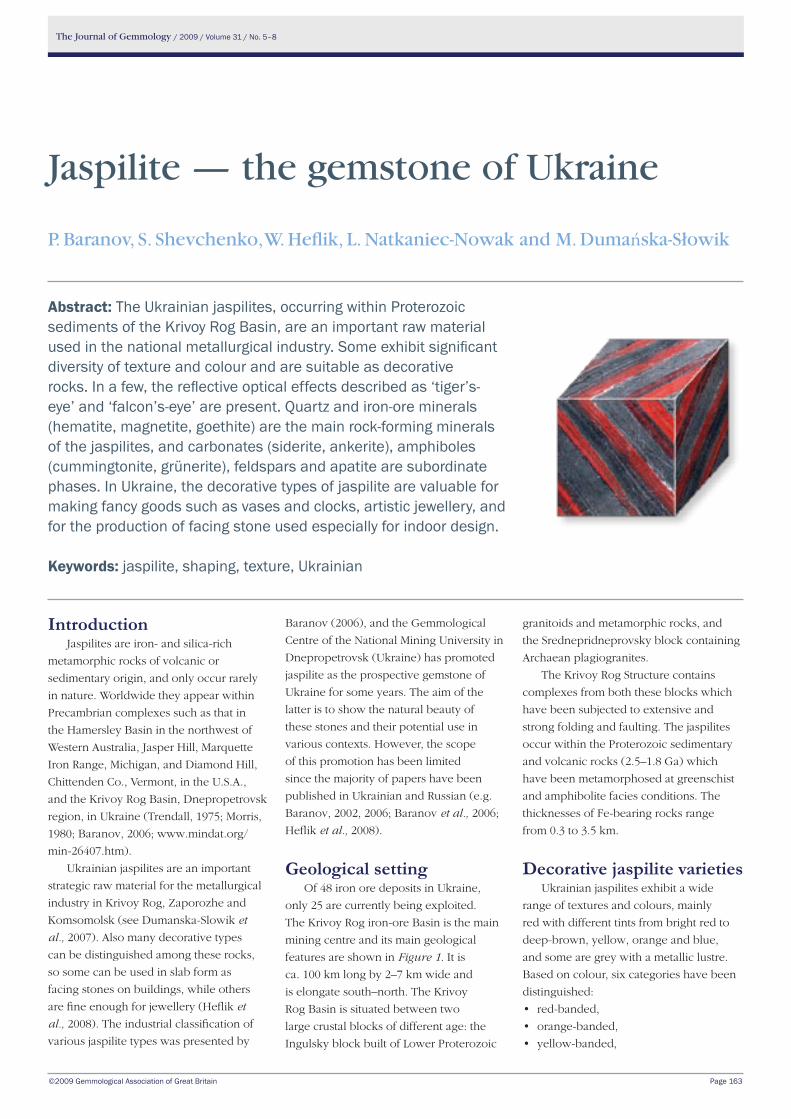
Abstract: The Ukrainian jaspilites, occurring within Proterozoic sediments of the Krivoy Rog Basin, are an important raw material used in the national metallurgical industry. Some exhibit significant diversity of texture and colour and are suitable as decorative rocks. In a few, the reflective optical effects described as ‘tiger’s-eye’ and ‘falcon’s-eye’ are present. Quartz and iron-ore minerals (hematite, magnetite, goethite) are the main rock-forming minerals of the jaspilites, and carbonates (siderite, ankerite), amphiboles (cummingtonite, grünerite), feldspars and apatite are subordinate phases. In Ukraine, the decorative types of jaspilite are valuable for making fancy goods such as vases and clocks, artistic jewellery, and for the production of facing stone used especially for indoor design.
Keywords: jaspilite, shaping, texture, Ukrainian
The Journal of Gemmology / 2009 / Volume 31 / No. 5–8
Page 164
Figure 1: Schematic geological map of the Krivoy Rog Structure, Ukraine.
Krivoy Rog-Kremenchuk Fault
Other faults
Iron-ore quarries
Ternivska structure
10 km
Valyavkinske deposit (Novokryvorizkyy Ore Mining
& Processing Enterprise)
Novokryvorizke deposit (Novokryvorizkyy Ore Mining & Processing Enterprise)
Skelyuvatske deposit (Southern Ore Mining & Processing Enterprise)
Inguletske deposit (Inguletskyy Ore Mining & Processing Enterprise)
U K R A I N E
Gleyuvatske deposit (Central Ore Mining & Processing Enterprise)
Pervomayskoye deposit (Northern Ore Mining & Processing Enterprise)
Gannivske deposit (Northern Ore Mining & Processing Enterprise)
Complex of aplite- pegmatite granites
Gleyuvatska unit
Dyke complex
Upper subunit
Middle subunit
Lower subunit
Saksaganska unit
Skelyuvatska unit
Upper subunit
Lower and Middle subunit
Novokryvorizka unit
Saksaganskyy granitoid complex
Konkska series
Dnipropetrovskyy granitoid complex
Arch
aean
Prot
eroz
oic
Pala
eoar
chae
anPa
laeo
prot
eroz
oic
Mes
oarc
haea
n
Kryv
oriz
ka s
erie
s
N
Jaspilite — the gemstone of Ukraine
The Journal of Gemmology / 2009 / Volume 31 / No. 5–8
Page 165
• yellow-banded with tiger’s-eye,
• blue-banded with falcon’s-eye and
• grey-banded.
In addition, the rich diversity of
texture has enabled five groups to be
distinguished and these are:
• parallel-striated
• wavy-striated
• intensely folded or crumpled on a small
scale (plicated),
• breccia-like and
• landscape varieties.
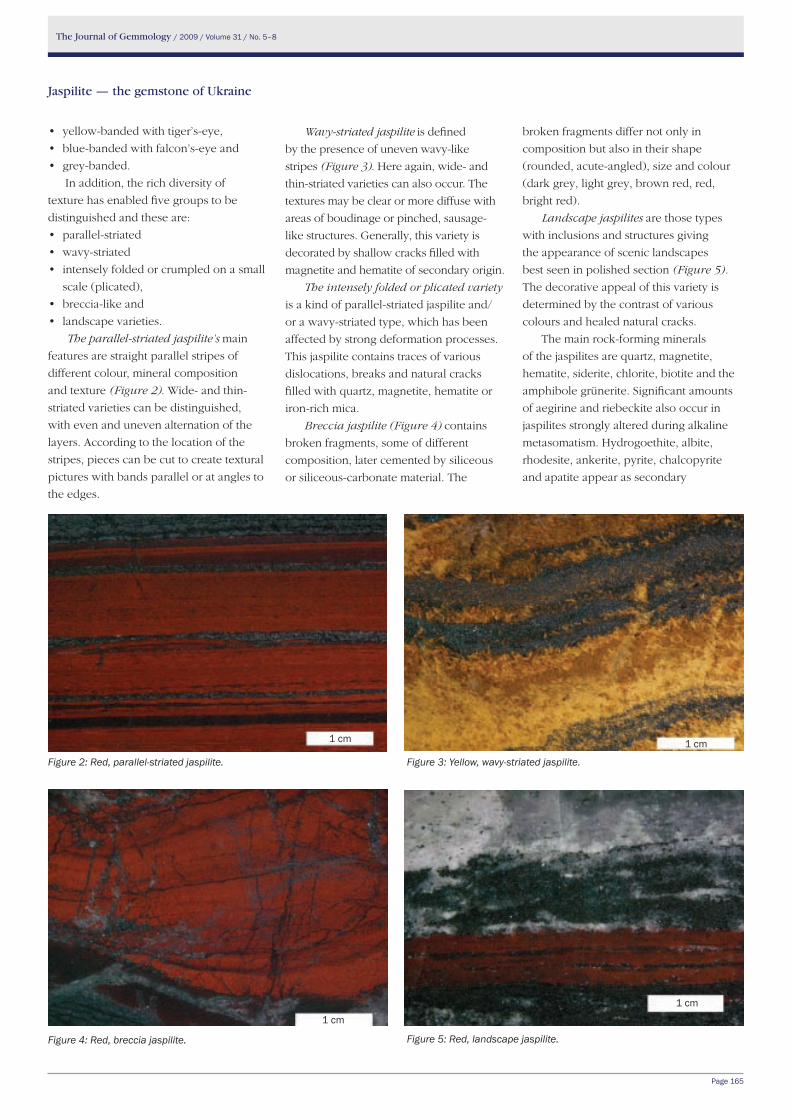
The parallel-striated jaspilite’s main
features are straight parallel stripes of
different colour, mineral composition
and texture (Figure 2). Wide- and thin-
striated varieties can be distinguished,
with even and uneven alternation of the
layers. According to the location of the
stripes, pieces can be cut to create textural
pictures with bands parallel or at angles to
the edges.
Wavy-striated jaspilite is defined
by the presence of uneven wavy-like
stripes (Figure 3). Here again, wide- and
thin-striated varieties can also occur. The
textures may be clear or more diffuse with
areas of boudinage or pinched, sausage-
like structures. Generally, this variety is
decorated by shallow cracks filled with
magnetite and hematite of secondary origin.
The intensely folded or plicated variety
is a kind of parallel-striated jaspilite and/
or a wavy-striated type, which has been
affected by strong deformation processes.
This jaspilite contains traces of various
dislocations, breaks and natural cracks
filled with quartz, magnetite, hematite or
iron-rich mica.
Breccia jaspilite (Figure 4) contains
broken fragments, some of different
composition, later cemented by siliceous
or siliceous-carbonate material. The
broken fragments differ not only in
composition but also in their shape
(rounded, acute-angled), size and colour
(dark grey, light grey, brown red, red,
bright red).
Landscape jaspilites are those types
with inclusions and structures giving
the appearance of scenic landscapes
best seen in polished section (Figure 5).
The decorative appeal of this variety is
determined by the contrast of various
colours and healed natural cracks.
The main rock-forming minerals
of the jaspilites are quartz, magnetite,
hematite, siderite, chlorite, biotite and the
amphibole grünerite. Significant amounts
of aegirine and riebeckite also occur in
jaspilites strongly altered during alkaline
metasomatism. Hydrogoethite, albite,
rhodesite, ankerite, pyrite, chalcopyrite
and apatite appear as secondary
Figure 2: Red, parallel-striated jaspilite. Figure 3: Yellow, wavy-striated jaspilite.
Figure 5: Red, landscape jaspilite.Figure 4: Red, breccia jaspilite.
1 cm 1 cm
1 cm1 cm
Jaspilite — the gemstone of Ukraine
The Journal of Gemmology / 2009 / Volume 31 / No. 5–8
Page 166
and accessory mineral components
(Dumanska-Slowik et al., 2007). All the
jaspilite varieties contain ≥ 15 wt.% Fe.
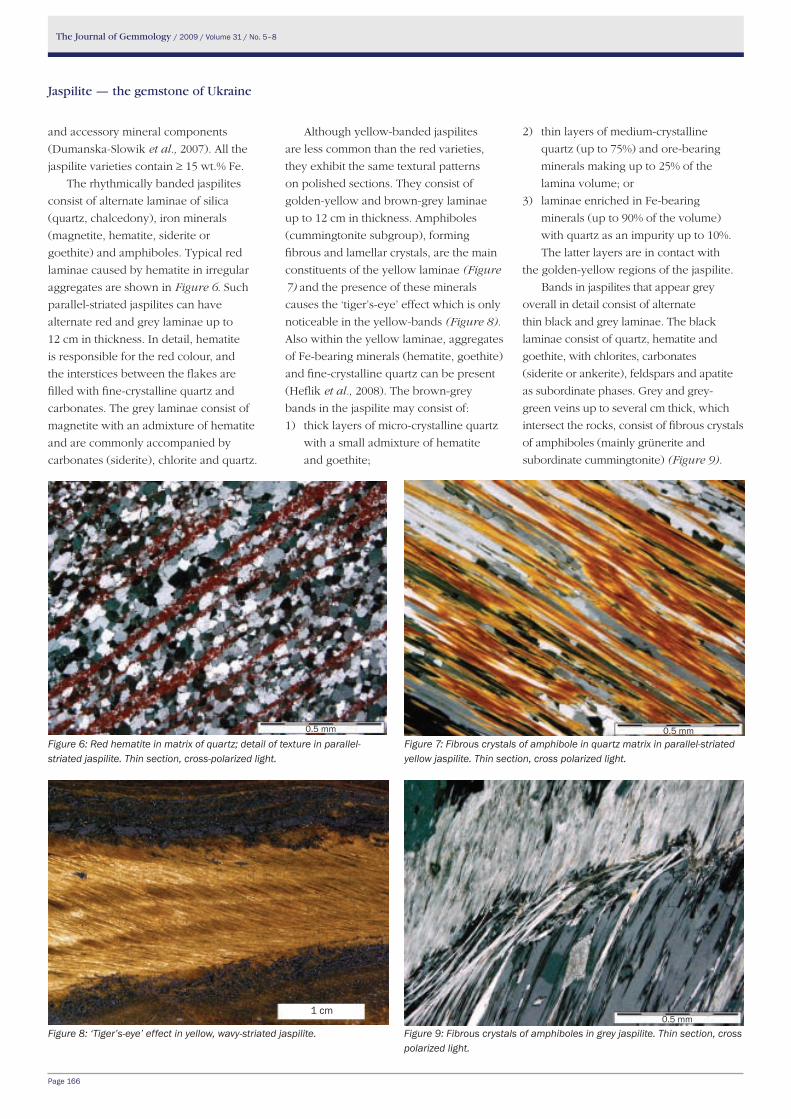
The rhythmically banded jaspilites
consist of alternate laminae of silica
(quartz, chalcedony), iron minerals
(magnetite, hematite, siderite or
goethite) and amphiboles. Typical red
laminae caused by hematite in irregular
aggregates are shown in Figure 6. Such
parallel-striated jaspilites can have
alternate red and grey laminae up to
12 cm in thickness. In detail, hematite
is responsible for the red colour, and
the interstices between the flakes are
filled with fine-crystalline quartz and
carbonates. The grey laminae consist of
magnetite with an admixture of hematite
and are commonly accompanied by
carbonates (siderite), chlorite and quartz.
Although yellow-banded jaspilites
are less common than the red varieties,
they exhibit the same textural patterns
on polished sections. They consist of
golden-yellow and brown-grey laminae
up to 12 cm in thickness. Amphiboles
(cummingtonite subgroup), forming
fibrous and lamellar crystals, are the main
constituents of the yellow laminae (Figure
7) and the presence of these minerals
causes the ‘tiger’s-eye’ effect which is only
noticeable in the yellow-bands (Figure 8).
Also within the yellow laminae, aggregates
of Fe-bearing minerals (hematite, goethite)
and fine-crystalline quartz can be present
(Heflik et al., 2008). The brown-grey
bands in the jaspilite may consist of:
1) thick layers of micro-crystalline quartz
with a small admixture of hematite
and goethite;
2) thin layers of medium-crystalline
quartz (up to 75%) and ore-bearing
minerals making up to 25% of the
lamina volume; or
3) laminae enriched in Fe-bearing
minerals (up to 90% of the volume)
with quartz as an impurity up to 10%.
The latter layers are in contact with
the golden-yellow regions of the jaspilite.
Bands in jaspilites that appear grey
overall in detail consist of alternate
thin black and grey laminae. The black
laminae consist of quartz, hematite and
goethite, with chlorites, carbonates
(siderite or ankerite), feldspars and apatite
as subordinate phases. Grey and grey-
green veins up to several cm thick, which
intersect the rocks, consist of fibrous crystals
of amphiboles (mainly grünerite and
subordinate cummingtonite) (Figure 9).
Figure 6: Red hematite in matrix of quartz; detail of texture in parallel-striated jaspilite. Thin section, cross-polarized light.
Figure 7: Fibrous crystals of amphibole in quartz matrix in parallel-striated yellow jaspilite. Thin section, cross polarized light.
Figure 8: ‘Tiger’s-eye’ effect in yellow, wavy-striated jaspilite. Figure 9: Fibrous crystals of amphiboles in grey jaspilite. Thin section, cross polarized light.
0.5 mm 0.5 mm
0.5 mm1 cm
Jaspilite — the gemstone of Ukraine
The Journal of Gemmology / 2009 / Volume 31 / No. 5–8
Page 167
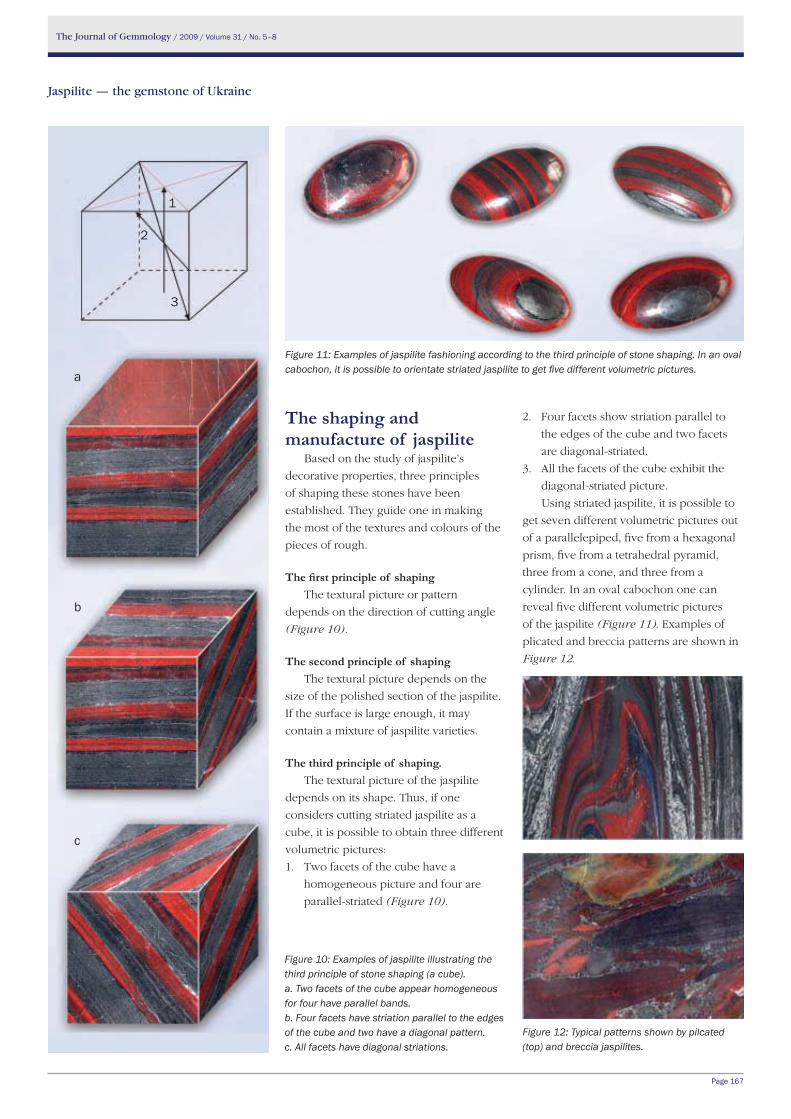
the shaping and manufacture of jaspilite
Based on the study of jaspilite’s
decorative properties, three principles
of shaping these stones have been
established. They guide one in making
the most of the textures and colours of the
pieces of rough.
The first principle of shaping The textural picture or pattern
depends on the direction of cutting angle
(Figure 10).
the second principle of shapingThe textural picture depends on the
size of the polished section of the jaspilite.
If the surface is large enough, it may
contain a mixture of jaspilite varieties.
the third principle of shaping. The textural picture of the jaspilite
depends on its shape. Thus, if one
considers cutting striated jaspilite as a
cube, it is possible to obtain three different
volumetric pictures:
1. Two facets of the cube have a
homogeneous picture and four are
parallel-striated (Figure 10).
2. Four facets show striation parallel to
the edges of the cube and two facets
are diagonal-striated.
3. All the facets of the cube exhibit the
diagonal-striated picture.
Using striated jaspilite, it is possible to
get seven different volumetric pictures out
of a parallelepiped, five from a hexagonal
prism, five from a tetrahedral pyramid,
three from a cone, and three from a
cylinder. In an oval cabochon one can
reveal five different volumetric pictures
of the jaspilite (Figure 11). Examples of
plicated and breccia patterns are shown in
Figure 12.
Figure 10: Examples of jaspilite illustrating the third principle of stone shaping (a cube).a. Two facets of the cube appear homogeneous for four have parallel bands.b. Four facets have striation parallel to the edges of the cube and two have a diagonal pattern.c. All facets have diagonal striations.
Figure 11: Examples of jaspilite fashioning according to the third principle of stone shaping. In an oval cabochon, it is possible to orientate striated jaspilite to get five different volumetric pictures.
Figure 12: Typical patterns shown by pilcated (top) and breccia jaspilites.
a
b
c
1
2
3
Jaspilite — the gemstone of Ukraine
The Journal of Gemmology / 2009 / Volume 31 / No. 5–8
Page 168
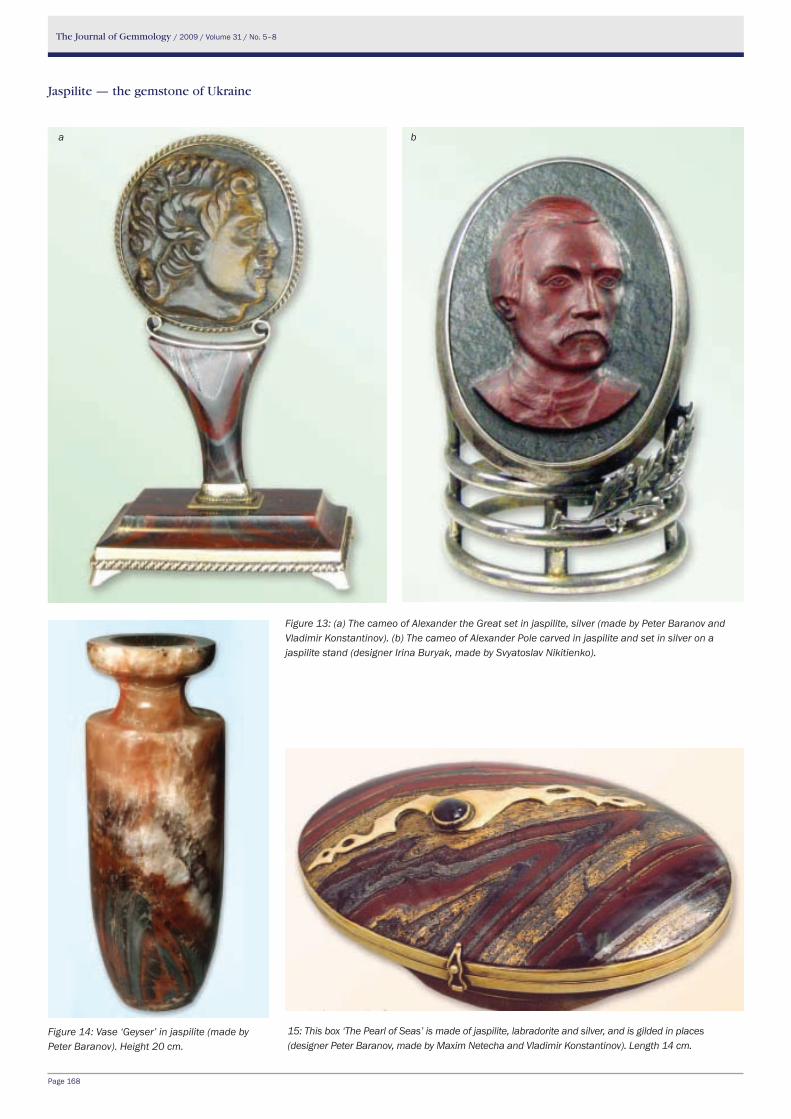
Figure 13: (a) The cameo of Alexander the Great set in jaspilite, silver (made by Peter Baranov and Vladimir Konstantinov). (b) The cameo of Alexander Pole carved in jaspilite and set in silver on a jaspilite stand (designer Irina Buryak, made by Svyatoslav Nikitienko).
15: This box ‘The Pearl of Seas’ is made of jaspilite, labradorite and silver, and is gilded in places (designer Peter Baranov, made by Maxim Netecha and Vladimir Konstantinov). Length 14 cm.
Figure 14: Vase ‘Geyser’ in jaspilite (made by Peter Baranov). Height 20 cm.
Jaspilite — the gemstone of Ukraine
a b
The Journal of Gemmology / 2009 / Volume 31 / No. 5–8
Page 169
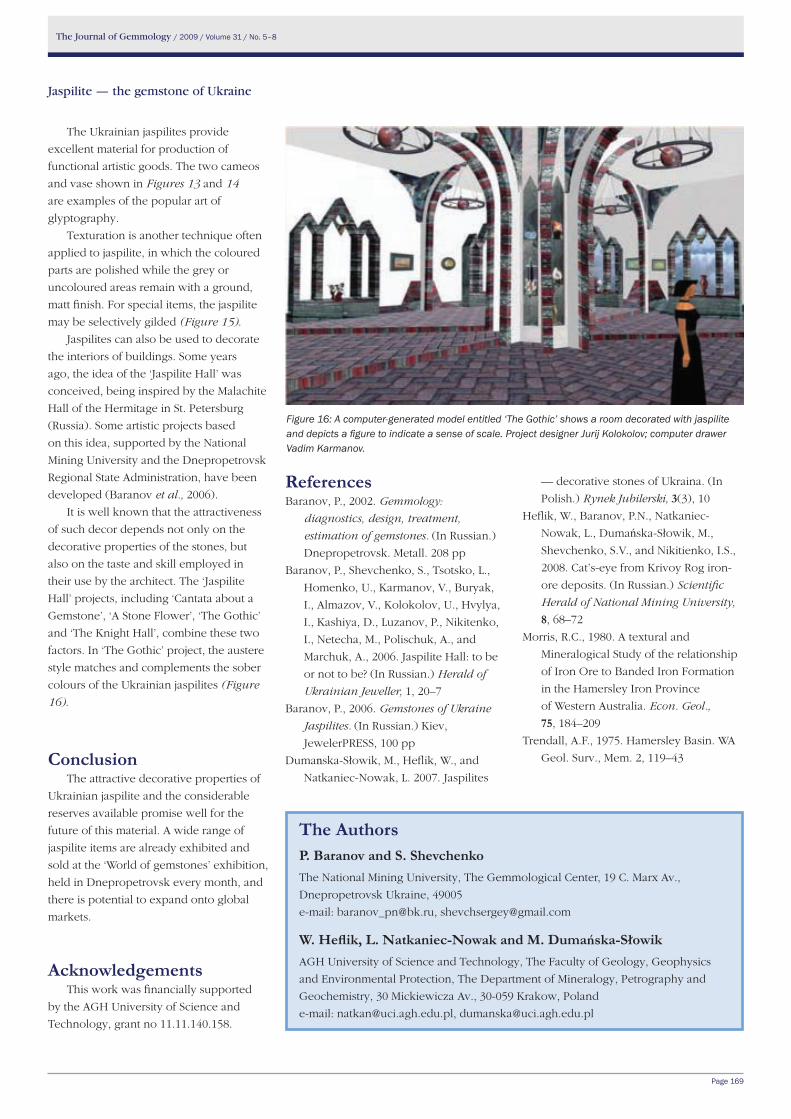
Figure 16: A computer-generated model entitled ‘The Gothic’ shows a room decorated with jaspilite and depicts a figure to indicate a sense of scale. Project designer Jurij Kolokolov; computer drawer Vadim Karmanov.
The Ukrainian jaspilites provide
excellent material for production of
functional artistic goods. The two cameos
and vase shown in Figures 13 and 14
are examples of the popular art of
glyptography.
Texturation is another technique often
applied to jaspilite, in which the coloured
parts are polished while the grey or
uncoloured areas remain with a ground,
matt finish. For special items, the jaspilite
may be selectively gilded (Figure 15).
Jaspilites can also be used to decorate
the interiors of buildings. Some years
ago, the idea of the ‘Jaspilite Hall’ was
conceived, being inspired by the Malachite
Hall of the Hermitage in St. Petersburg
(Russia). Some artistic projects based
on this idea, supported by the National
Mining University and the Dnepropetrovsk
Regional State Administration, have been
developed (Baranov et al., 2006).
It is well known that the attractiveness
of such decor depends not only on the
decorative properties of the stones, but
also on the taste and skill employed in
their use by the architect. The ‘Jaspilite
Hall’ projects, including ‘Cantata about a
Gemstone’, ‘A Stone Flower’, ‘The Gothic’
and ‘The Knight Hall’, combine these two
factors. In ‘The Gothic’ project, the austere
style matches and complements the sober
colours of the Ukrainian jaspilites (Figure
16).
ConclusionThe attractive decorative properties of
Ukrainian jaspilite and the considerable
reserves available promise well for the
future of this material. A wide range of
jaspilite items are already exhibited and
sold at the ‘World of gemstones’ exhibition,
held in Dnepropetrovsk every month, and
there is potential to expand onto global
markets.
AcknowledgementsThis work was financially supported
by the AGH University of Science and
Technology, grant no 11.11.140.158.
ReferencesBaranov, P., 2002. Gemmology:
diagnostics, design, treatment,
estimation of gemstones. (In Russian.)
Dnepropetrovsk. Metall. 208 pp
Baranov, P., Shevchenko, S., Tsotsko, L.,
Homenko, U., Karmanov, V., Buryak,
I., Almazov, V., Kolokolov, U., Hvylya,
I., Kashiya, D., Luzanov, P., Nikitenko,
I., Netecha, M., Polischuk, A., and
Marchuk, A., 2006. Jaspilite Hall: to be
or not to be? (In Russian.) Herald of
Ukrainian Jeweller, 1, 20–7
Baranov, P., 2006. Gemstones of Ukraine
Jaspilites. (In Russian.) Kiev,
JewelerPRESS, 100 pp
Dumanska-Słowik, M., Heflik, W., and
Natkaniec-Nowak, L. 2007. Jaspilites
— decorative stones of Ukraina. (In
Polish.) Rynek Jubilerski, 3(3), 10
Heflik, W., Baranov, P.N., Natkaniec-
Nowak, L., Dumańska-Słowik, M.,
Shevchenko, S.V., and Nikitienko, I.S.,
2008. Cat’s-eye from Krivoy Rog iron-
ore deposits. (In Russian.) Scientific
Herald of National Mining University,
8, 68–72
Morris, R.C., 1980. A textural and
Mineralogical Study of the relationship
of Iron Ore to Banded Iron Formation
in the Hamersley Iron Province
of Western Australia. Econ. Geol., 75, 184–209
Trendall, A.F., 1975. Hamersley Basin. WA
Geol. Surv., Mem. 2, 119–43
the AuthorsP. Baranov and S. Shevchenko The National Mining University, The Gemmological Center, 19 C. Marx Av.,
Dnepropetrovsk Ukraine, 49005
e-mail: [email protected], [email protected]
W. Heflik, L. Natkaniec-Nowak and M. Dumańska-Słowik
AGH University of Science and Technology, The Faculty of Geology, Geophysics
and Environmental Protection, The Department of Mineralogy, Petrography and
Geochemistry, 30 Mickiewicza Av., 30-059 Krakow, Poland
e-mail: [email protected], [email protected]
Jaspilite — the gemstone of Ukraine
the travelGem Microscope
• Fitted aluminium travel case
• Runs on 110 and 220 volts (built in transformer)
• 10x, 20x, 30x and 60x magnification
• Bright field, dark field and top lighting
• Stone holder and darkfield assembly can be removed to examine jewellery
PRICe: £325.00* (Gem-A members and Gem-A registered students £292.50*)* Prices exclude VAt and shipping
For further details or to order your TravelGem Microscope, contact the Gem-A shop at
[email protected] or call +44 (0)20 7404 3334.
The GemmoloGical associaTion
of GreaT BriTain
Gem-A
Designed for gemmologists,
this compact microscope
is ideal for students,
valuers and gem dealers.
The Journal of Gemmology / 2009 / Volume 31 / No. 5–8
©2009 Gemmological Association of Great Britain Page 171
IntroductionSince the discovery of Andranondambo
in 1993, Madagascar has become an
increasingly important source of gem
corundum for the world market. The past
decade and a half has brought about the
discovery of a significant number of both
large and small ruby and sapphire deposits
(Kiefert et al., 1996; Schwarz et al., 1996;
Pezzotta, 2001; Offant, 2005; Ralantoarison,
2006; Giuliani et al., 2007). Considering
that much of Madagascar has not yet been
thoroughly explored, it is certain that in
coming years many more deposits will be
found to provide the world market with
gem-quality ruby and sapphire (Schwarz et
al., 2000; Ramdohr and Milisenda, 2006).
The diversity of Madagascar’s geological
environment and its different types and
origins of corundum deposits (e.g. basaltic,
skarn, metasomatic) presents certain
challenges for origin determination of
corundum. This paper offers a detailed
examination of selected samples from
a lesser-known corundum deposit at
Marosely (Pezzotta, 2007; Cartier, 2008)
and is part of a comprehensive study.
The results from these natural untreated
corundum samples should improve
understanding about a range of current
gemmological issues such as detection of
heat treatment and origin determination.
The Marosely deposit is located in
the Ranotsara region (near 47°E, 23°S)
of south-central Madagascar and is
eluvial. Most of the corundum crystals
from this deposit are fragmental; no
euhedral crystals have been found,
and only a few specimens have crystal
faces. Metamorphic corundum deposits
have been reported in the region by
Ruby and sapphire from Marosely, MadagascarLaurent E. Cartier
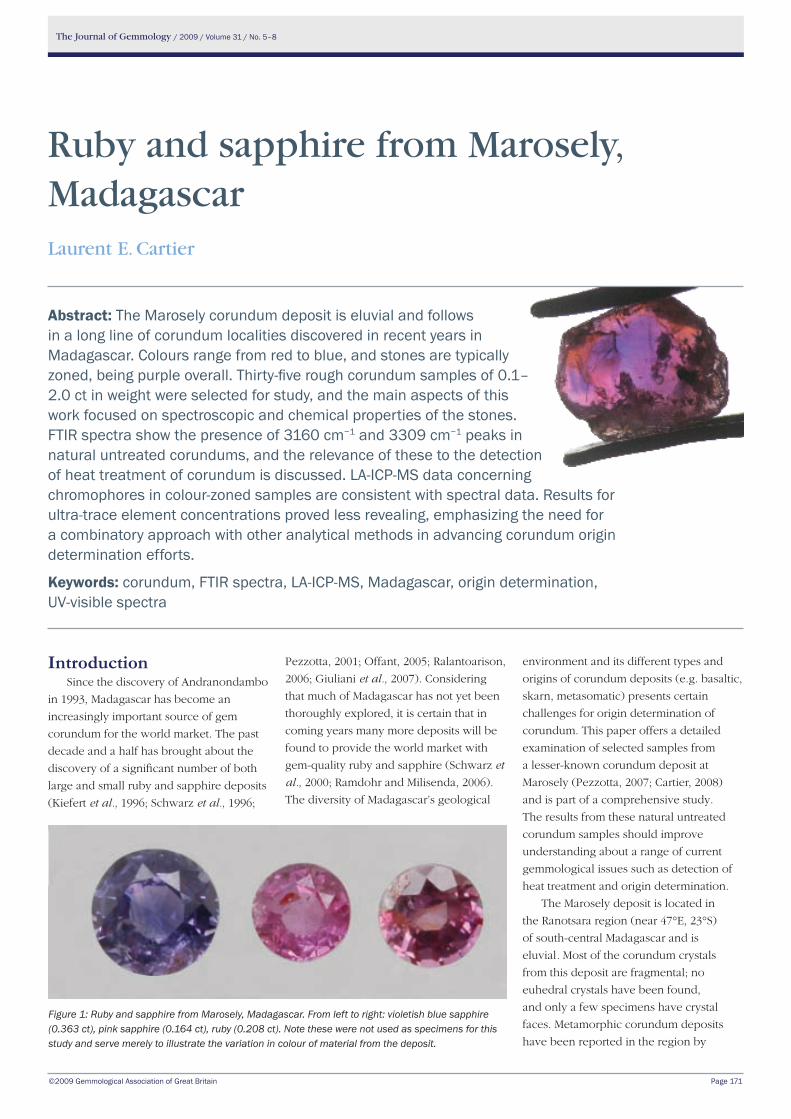
Abstract: The Marosely corundum deposit is eluvial and follows in a long line of corundum localities discovered in recent years in Madagascar. Colours range from red to blue, and stones are typically zoned, being purple overall. Thirty-five rough corundum samples of 0.1–2.0 ct in weight were selected for study, and the main aspects of this work focused on spectroscopic and chemical properties of the stones. FTIR spectra show the presence of 3160 cm−1 and 3309 cm−1 peaks in natural untreated corundums, and the relevance of these to the detection of heat treatment of corundum is discussed. LA-ICP-MS data concerning chromophores in colour-zoned samples are consistent with spectral data. Results for ultra-trace element concentrations proved less revealing, emphasizing the need for a combinatory approach with other analytical methods in advancing corundum origin determination efforts.
Keywords: corundum, FTIR spectra, LA-ICP-MS, Madagascar, origin determination, UV-visible spectra
Figure 1: Ruby and sapphire from Marosely, Madagascar. From left to right: violetish blue sapphire (0.363 ct), pink sapphire (0.164 ct), ruby (0.208 ct). Note these were not used as specimens for this study and serve merely to illustrate the variation in colour of material from the deposit.
The Journal of Gemmology / 2009 / Volume 31 / No. 5–8
Page 172
Offant (2005), Ralantoarison (2006)
and Ralantoarison et al. (2006), but the
high-metamorphic Marosely corundums
have probably experienced considerable
subsequent metasomatic alteration (Cartier
2008). Figure 1 shows three cut stones
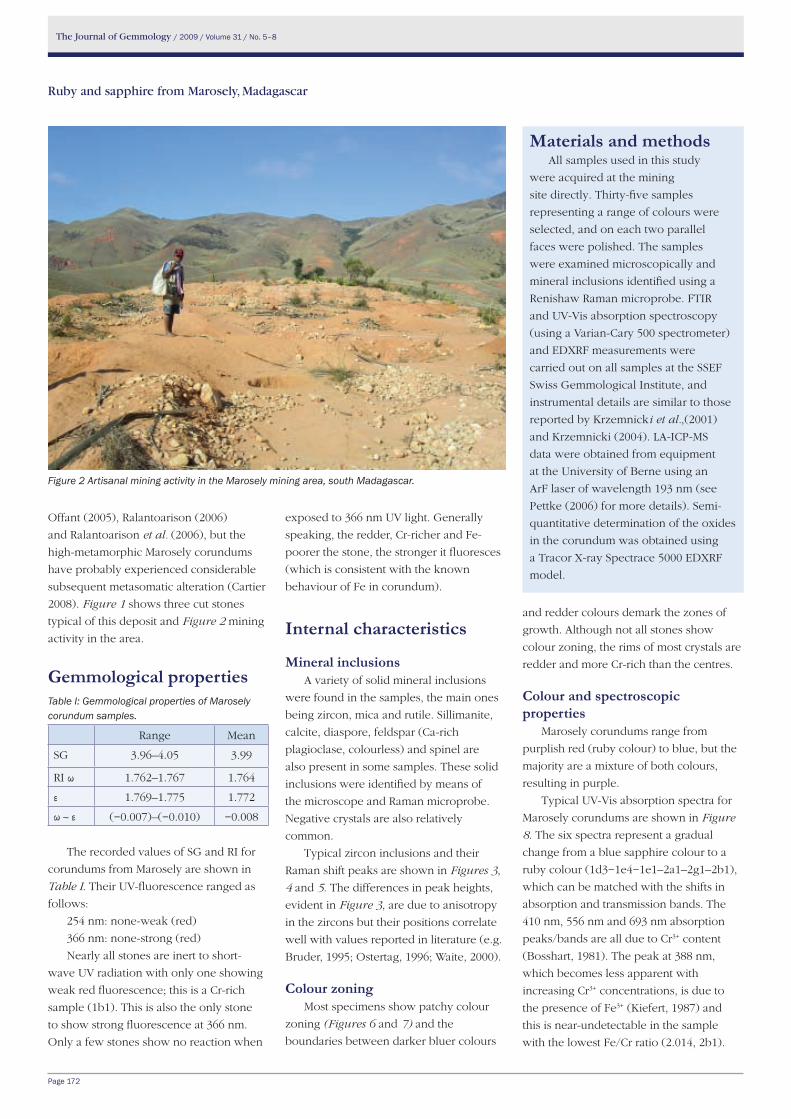
typical of this deposit and Figure 2 mining
activity in the area.
Gemmological propertiesTable I: Gemmological properties of Marosely corundum samples.
Range Mean
SG 3.96–4.05 3.99
RI ω 1.762–1.767 1.764
ε 1.769–1.775 1.772
ω – ε (−0.007)–(−0.010) −0.008
The recorded values of SG and RI for
corundums from Marosely are shown in
Table I. Their UV-fluorescence ranged as
follows:
254 nm: none-weak (red)
366 nm: none-strong (red)
Nearly all stones are inert to short-
wave UV radiation with only one showing
weak red fluorescence; this is a Cr-rich
sample (1b1). This is also the only stone
to show strong fluorescence at 366 nm.
Only a few stones show no reaction when
exposed to 366 nm UV light. Generally
speaking, the redder, Cr-richer and Fe-
poorer the stone, the stronger it fluoresces
(which is consistent with the known
behaviour of Fe in corundum).
Internal characteristics
Mineral inclusions A variety of solid mineral inclusions
were found in the samples, the main ones
being zircon, mica and rutile. Sillimanite,
calcite, diaspore, feldspar (Ca-rich
plagioclase, colourless) and spinel are
also present in some samples. These solid
inclusions were identified by means of
the microscope and Raman microprobe.
Negative crystals are also relatively
common.
Typical zircon inclusions and their
Raman shift peaks are shown in Figures 3,
4 and 5. The differences in peak heights,
evident in Figure 3, are due to anisotropy
in the zircons but their positions correlate
well with values reported in literature (e.g.
Bruder, 1995; Ostertag, 1996; Waite, 2000).
Colour zoningMost specimens show patchy colour
zoning (Figures 6 and 7) and the
boundaries between darker bluer colours
and redder colours demark the zones of
growth. Although not all stones show
colour zoning, the rims of most crystals are
redder and more Cr-rich than the centres.
Colour and spectroscopic properties
Marosely corundums range from
purplish red (ruby colour) to blue, but the
majority are a mixture of both colours,
resulting in purple.
Typical UV-Vis absorption spectra for
Marosely corundums are shown in Figure
8. The six spectra represent a gradual
change from a blue sapphire colour to a
ruby colour (1d3−1e4−1e1–2a1–2g1–2b1),
which can be matched with the shifts in
absorption and transmission bands. The
410 nm, 556 nm and 693 nm absorption
peaks/bands are all due to Cr3+ content
(Bosshart, 1981). The peak at 388 nm,
which becomes less apparent with
increasing Cr3+ concentrations, is due to
the presence of Fe3+ (Kiefert, 1987) and
this is near-undetectable in the sample
with the lowest Fe/Cr ratio (2.014, 2b1).
Materials and methodsAll samples used in this study
were acquired at the mining
site directly. Thirty-five samples
representing a range of colours were
selected, and on each two parallel
faces were polished. The samples
were examined microscopically and
mineral inclusions identified using a
Renishaw Raman microprobe. FTIR
and UV-Vis absorption spectroscopy
(using a Varian-Cary 500 spectrometer)
and EDXRF measurements were
carried out on all samples at the SSEF
Swiss Gemmological Institute, and
instrumental details are similar to those
reported by Krzemnicki et al.,(2001)
and Krzemnicki (2004). LA-ICP-MS
data were obtained from equipment
at the University of Berne using an
ArF laser of wavelength 193 nm (see
Pettke (2006) for more details). Semi-
quantitative determination of the oxides
in the corundum was obtained using
a Tracor X-ray Spectrace 5000 EDXRF
model.
Figure 2 Artisanal mining activity in the Marosely mining area, south Madagascar.
Ruby and sapphire from Marosely, Madagascar
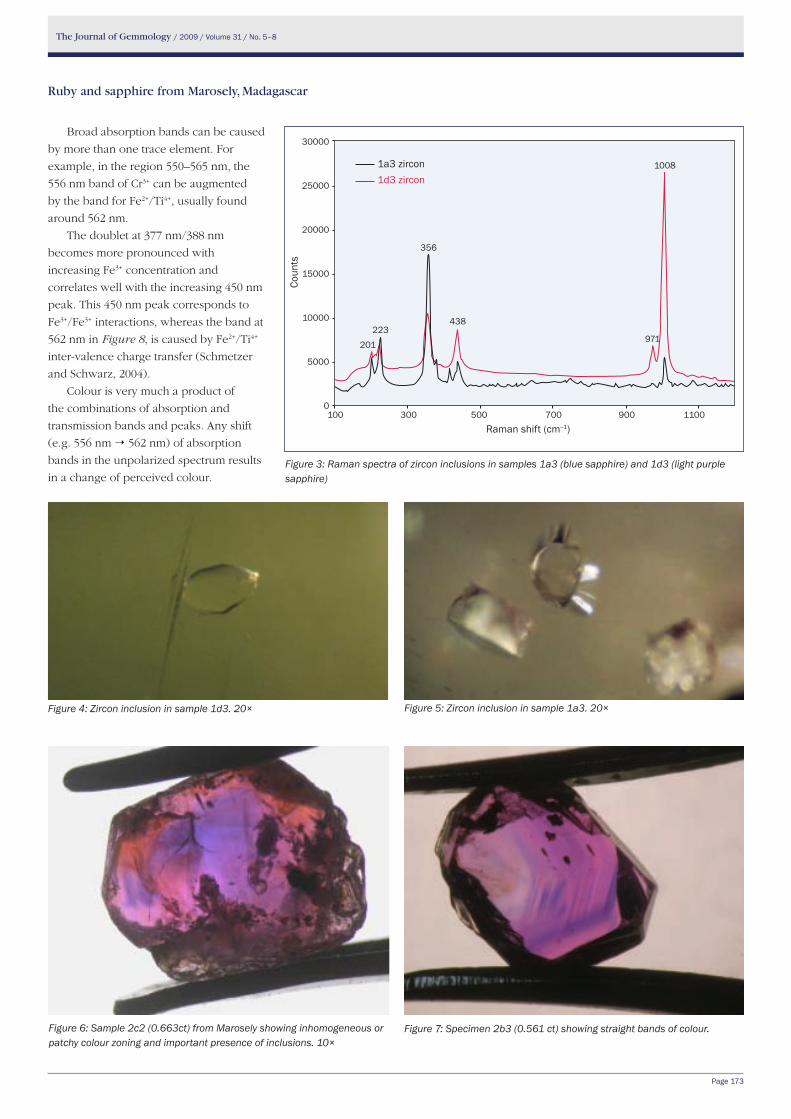
The Journal of Gemmology / 2009 / Volume 31 / No. 5–8
Page 173
Broad absorption bands can be caused
by more than one trace element. For
example, in the region 550–565 nm, the
556 nm band of Cr3+ can be augmented
by the band for Fe2+/Ti4+, usually found
around 562 nm.
The doublet at 377 nm/388 nm
becomes more pronounced with
increasing Fe3+ concentration and
correlates well with the increasing 450 nm
peak. This 450 nm peak corresponds to
Fe3+/Fe3+ interactions, whereas the band at
562 nm in Figure 8, is caused by Fe2+/Ti4+
inter-valence charge transfer (Schmetzer
and Schwarz, 2004).
Colour is very much a product of
the combinations of absorption and
transmission bands and peaks. Any shift
(e.g. 556 nm 562 nm) of absorption
bands in the unpolarized spectrum results
in a change of perceived colour.
Figure 5: Zircon inclusion in sample 1a3. 20×Figure 4: Zircon inclusion in sample 1d3. 20×
Figure 3: Raman spectra of zircon inclusions in samples 1a3 (blue sapphire) and 1d3 (light purple sapphire)
Figure 6: Sample 2c2 (0.663ct) from Marosely showing inhomogeneous or patchy colour zoning and important presence of inclusions. 10×
Figure 7: Specimen 2b3 (0.561 ct) showing straight bands of colour.
Ruby and sapphire from Marosely, Madagascar
Coun
ts
30000
25000
20000
15000
10000
5000
0100 300 500 700 900 1100
Raman shift (cm–1)
1a3 zircon1d3 zircon
201223
356
1008
971
438
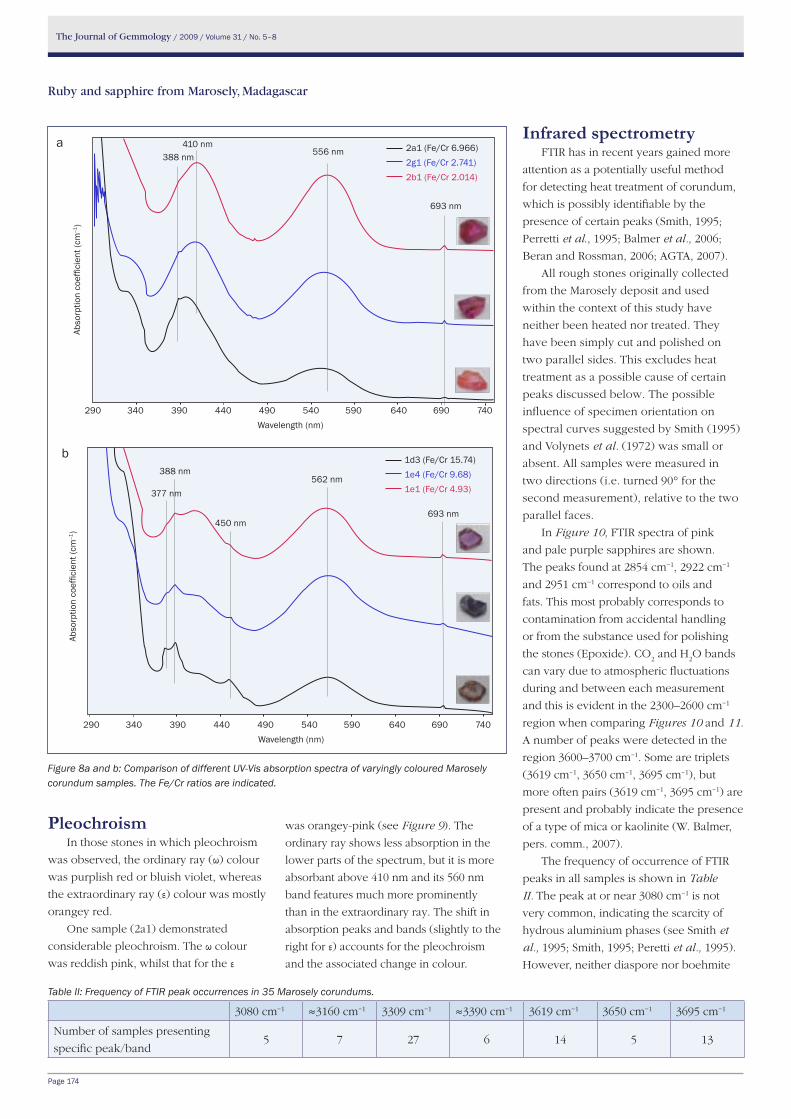
The Journal of Gemmology / 2009 / Volume 31 / No. 5–8
Page 174
Infrared spectrometryFTIR has in recent years gained more
attention as a potentially useful method
for detecting heat treatment of corundum,
which is possibly identifiable by the
presence of certain peaks (Smith, 1995;
Perretti et al., 1995; Balmer et al., 2006;
Beran and Rossman, 2006; AGTA, 2007).
All rough stones originally collected
from the Marosely deposit and used
within the context of this study have
neither been heated nor treated. They
have been simply cut and polished on
two parallel sides. This excludes heat
treatment as a possible cause of certain
peaks discussed below. The possible
influence of specimen orientation on
spectral curves suggested by Smith (1995)
and Volynets et al. (1972) was small or
absent. All samples were measured in
two directions (i.e. turned 90° for the
second measurement), relative to the two
parallel faces.
In Figure 10, FTIR spectra of pink
and pale purple sapphires are shown.
The peaks found at 2854 cm−1, 2922 cm−1
and 2951 cm−1 correspond to oils and
fats. This most probably corresponds to
contamination from accidental handling
or from the substance used for polishing
the stones (Epoxide). CO2 and H
2O bands
can vary due to atmospheric fluctuations
during and between each measurement
and this is evident in the 2300–2600 cm−1
region when comparing Figures 10 and 11.
A number of peaks were detected in the
region 3600–3700 cm−1. Some are triplets
(3619 cm−1, 3650 cm−1, 3695 cm−1), but
more often pairs (3619 cm−1, 3695 cm−1) are
present and probably indicate the presence
of a type of mica or kaolinite (W. Balmer,
pers. comm., 2007).
The frequency of occurrence of FTIR
peaks in all samples is shown in Table
II. The peak at or near 3080 cm−1 is not
very common, indicating the scarcity of
hydrous aluminium phases (see Smith et
al., 1995; Smith, 1995; Peretti et al., 1995).
However, neither diaspore nor boehmite
Table II: Frequency of FTIR peak occurrences in 35 Marosely corundums.
3080 cm−1 ≈3160 cm−1 3309 cm−1 ≈3390 cm−1 3619 cm−1 3650 cm−1 3695 cm−1
Number of samples presenting
specific peak/band5 7 27 6 14 5 13
PleochroismIn those stones in which pleochroism
was observed, the ordinary ray (ω) colour
was purplish red or bluish violet, whereas
the extraordinary ray (ε) colour was mostly
orangey red.
One sample (2a1) demonstrated
considerable pleochroism. The ω colour
was reddish pink, whilst that for the ε
was orangey-pink (see Figure 9). The
ordinary ray shows less absorption in the
lower parts of the spectrum, but it is more
absorbant above 410 nm and its 560 nm
band features much more prominently
than in the extraordinary ray. The shift in
absorption peaks and bands (slightly to the
right for ε) accounts for the pleochroism
and the associated change in colour.
Ruby and sapphire from Marosely, Madagascar
Figure 8a and b: Comparison of different UV-Vis absorption spectra of varyingly coloured Marosely corundum samples. The Fe/Cr ratios are indicated.
290 340 390 440 490 540 590 640 690 740Wavelength (nm)
a
693 nm
410 nm556 nm388 nm
2a1 (Fe/Cr 6.966)2g1 (Fe/Cr 2.741)2b1 (Fe/Cr 2.014)
Abso
rptio
n co
effic
ient
(cm
–1)
290 340 390 440 490 540 590 640 690 740Wavelength (nm)
Abso
rptio
n co
effic
ient
(cm
–1)
1d3 (Fe/Cr 15.74)1e4 (Fe/Cr 9.68)1e1 (Fe/Cr 4.93)
388 nm
450 nm
562 nm377 nm
693 nm
b
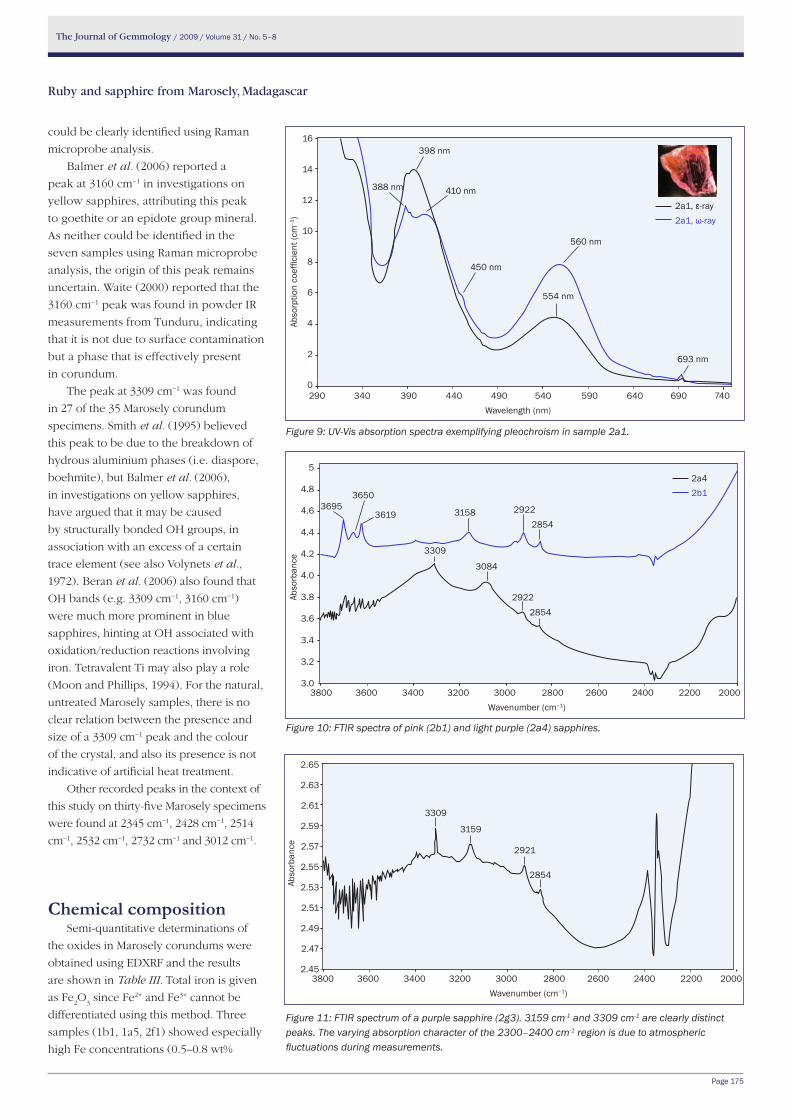
The Journal of Gemmology / 2009 / Volume 31 / No. 5–8
Page 175
could be clearly identified using Raman
microprobe analysis.
Balmer et al. (2006) reported a
peak at 3160 cm−1 in investigations on
yellow sapphires, attributing this peak
to goethite or an epidote group mineral.
As neither could be identified in the
seven samples using Raman microprobe
analysis, the origin of this peak remains
uncertain. Waite (2000) reported that the
3160 cm−1 peak was found in powder IR
measurements from Tunduru, indicating
that it is not due to surface contamination
but a phase that is effectively present
in corundum.
The peak at 3309 cm−1 was found
in 27 of the 35 Marosely corundum
specimens. Smith et al. (1995) believed
this peak to be due to the breakdown of
hydrous aluminium phases (i.e. diaspore,
boehmite), but Balmer et al. (2006),
in investigations on yellow sapphires,
have argued that it may be caused
by structurally bonded OH groups, in
association with an excess of a certain
trace element (see also Volynets et al.,
1972). Beran et al. (2006) also found that
OH bands (e.g. 3309 cm−1, 3160 cm−1)
were much more prominent in blue
sapphires, hinting at OH associated with
oxidation/reduction reactions involving
iron. Tetravalent Ti may also play a role
(Moon and Phillips, 1994). For the natural,
untreated Marosely samples, there is no
clear relation between the presence and
size of a 3309 cm−1 peak and the colour
of the crystal, and also its presence is not
indicative of artificial heat treatment.
Other recorded peaks in the context of
this study on thirty-five Marosely specimens
were found at 2345 cm−1, 2428 cm−1, 2514
cm−1, 2532 cm−1, 2732 cm−1 and 3012 cm−1.
Chemical compositionSemi-quantitative determinations of
the oxides in Marosely corundums were
obtained using EDXRF and the results
are shown in Table III. Total iron is given
as Fe2O
3 since Fe2+ and Fe3+ cannot be
differentiated using this method. Three
samples (1b1, 1a5, 2f1) showed especially
high Fe concentrations (0.5–0.8 wt%
Ruby and sapphire from Marosely, Madagascar
Figure 9: UV-Vis absorption spectra exemplifying pleochroism in sample 2a1.
Figure 10: FTIR spectra of pink (2b1) and light purple (2a4) sapphires.
Figure 11: FTIR spectrum of a purple sapphire (2g3). 3159 cm-1 and 3309 cm-1 are clearly distinct peaks. The varying absorption character of the 2300–2400 cm-1 region is due to atmospheric fluctuations during measurements.
398 nm
450 nm
388 nm
693 nm
290 340 390 440 490 540 590 640 690 740Wavelength (nm)
2a1, ε-ray2a1, ω-ray
Abso
rptio
n co
effic
ient
(cm
–1)
16
14
12
10
8
6
4
2
0
554 nm
410 nm
560 nm
3800 3600 3400 3200 3000 2800 2600 2400 2200 2000Wavenumber (cm–1)
Abso
rban
ce
2a42b1
3619 2922
28542922
36953650
2854
3084
3309
3158
5
4.8
4.6
4.4
4.2
4.0
3.8
3.6
3.4
3.2
3.0
3800 3600 3400 3200 3000 2800 2600 2400 2200 2000Wavenumber (cm–1)
Abso
rban
ce
2.65
2.63
2.61
2.59
2.57
2.55
2.53
2.51
2.49
2.47
2.45
3309
2854
2921
3159
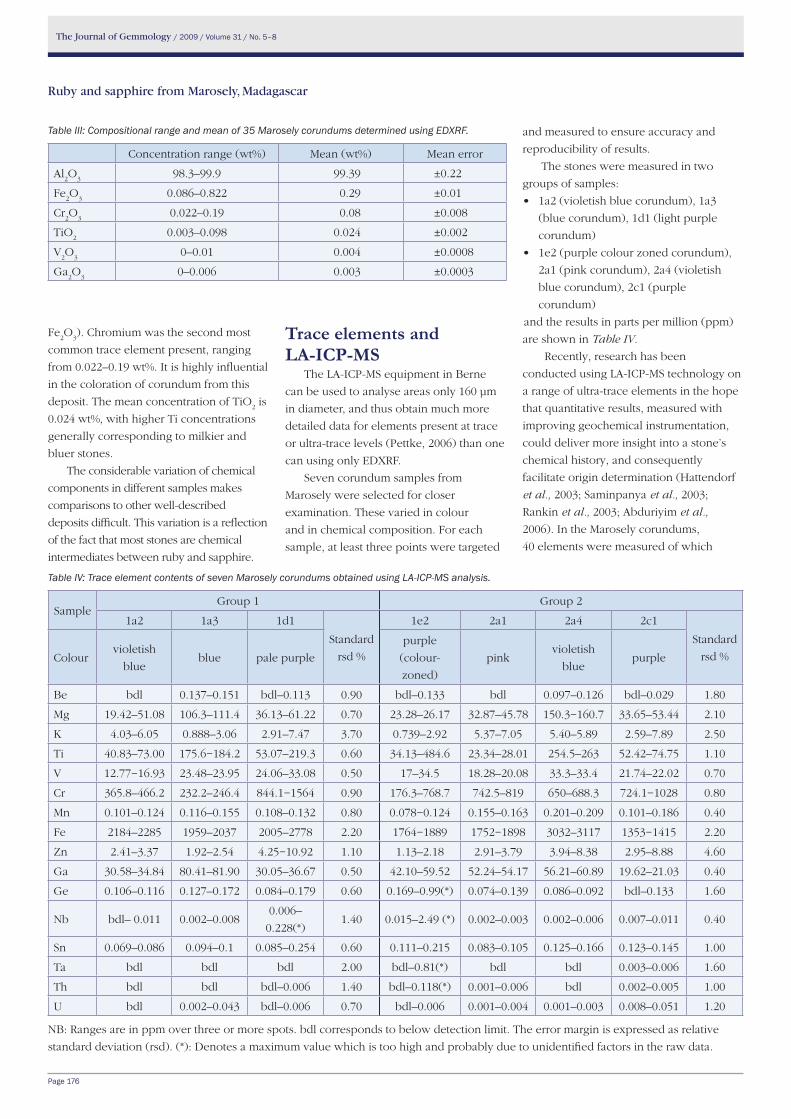
The Journal of Gemmology / 2009 / Volume 31 / No. 5–8
Page 176
Fe2O
3). Chromium was the second most
common trace element present, ranging
from 0.022–0.19 wt%. It is highly influential
in the coloration of corundum from this
deposit. The mean concentration of TiO2 is
0.024 wt%, with higher Ti concentrations
generally corresponding to milkier and
bluer stones.
The considerable variation of chemical
components in different samples makes
comparisons to other well-described
deposits difficult. This variation is a reflection
of the fact that most stones are chemical
intermediates between ruby and sapphire.
trace elements and lA-ICP-MS
The LA-ICP-MS equipment in Berne
can be used to analyse areas only 160 μm
in diameter, and thus obtain much more
detailed data for elements present at trace
or ultra-trace levels (Pettke, 2006) than one
can using only EDXRF.
Seven corundum samples from
Marosely were selected for closer
examination. These varied in colour
and in chemical composition. For each
sample, at least three points were targeted
and measured to ensure accuracy and
reproducibility of results.
The stones were measured in two
groups of samples:
• 1a2(violetishbluecorundum),1a3
(blue corundum), 1d1 (light purple
corundum)
• 1e2(purplecolourzonedcorundum),
2a1 (pink corundum), 2a4 (violetish
blue corundum), 2c1 (purple
corundum)
and the results in parts per million (ppm)
are shown in Table IV.
Recently, research has been
conducted using LA-ICP-MS technology on
a range of ultra-trace elements in the hope
that quantitative results, measured with
improving geochemical instrumentation,
could deliver more insight into a stone’s
chemical history, and consequently
facilitate origin determination (Hattendorf
et al., 2003; Saminpanya et al., 2003;
Rankin et al., 2003; Abduriyim et al.,
2006). In the Marosely corundums,
40 elements were measured of which
Table IV: Trace element contents of seven Marosely corundums obtained using LA-ICP-MS analysis.
SampleGroup 1 Group 2
1a2 1a3 1d1
Standard
rsd %
1e2 2a1 2a4 2c1
Standard
rsd %Colourvioletish
blueblue pale purple
purple
(colour-
zoned)
pinkvioletish
bluepurple
Be bdl 0.137–0.151 bdl–0.113 0.90 bdl–0.133 bdl 0.097–0.126 bdl–0.029 1.80
Mg 19.42–51.08 106.3–111.4 36.13–61.22 0.70 23.28–26.17 32.87–45.78 150.3−160.7 33.65–53.44 2.10
K 4.03–6.05 0.888–3.06 2.91–7.47 3.70 0.739–2.92 5.37–7.05 5.40–5.89 2.59–7.89 2.50
Ti 40.83–73.00 175.6−184.2 53.07–219.3 0.60 34.13–484.6 23.34–28.01 254.5–263 52.42–74.75 1.10
V 12.77−16.93 23.48–23.95 24.06–33.08 0.50 17–34.5 18.28–20.08 33.3–33.4 21.74–22.02 0.70
Cr 365.8–466.2 232.2–246.4 844.1−1564 0.90 176.3–768.7 742.5–819 650–688.3 724.1−1028 0.80
Mn 0.101–0.124 0.116–0.155 0.108–0.132 0.80 0.078−0.124 0.155–0.163 0.201–0.209 0.101–0.186 0.40
Fe 2184–2285 1959–2037 2005–2778 2.20 1764−1889 1752−1898 3032–3117 1353−1415 2.20
Zn 2.41–3.37 1.92–2.54 4.25−10.92 1.10 1.13–2.18 2.91–3.79 3.94–8.38 2.95–8.88 4.60
Ga 30.58–34.84 80.41–81.90 30.05–36.67 0.50 42.10–59.52 52.24–54.17 56.21–60.89 19.62–21.03 0.40
Ge 0.106–0.116 0.127–0.172 0.084–0.179 0.60 0.169–0.99(*) 0.074–0.139 0.086–0.092 bdl–0.133 1.60
Nb bdl– 0.011 0.002–0.0080.006–
0.228(*)1.40 0.015–2.49 (*) 0.002–0.003 0.002–0.006 0.007–0.011 0.40
Sn 0.069–0.086 0.094–0.1 0.085–0.254 0.60 0.111–0.215 0.083–0.105 0.125–0.166 0.123–0.145 1.00
Ta bdl bdl bdl 2.00 bdl–0.81(*) bdl bdl 0.003–0.006 1.60
Th bdl bdl bdl–0.006 1.40 bdl–0.118(*) 0.001–0.006 bdl 0.002–0.005 1.00
U bdl 0.002–0.043 bdl–0.006 0.70 bdl–0.006 0.001–0.004 0.001–0.003 0.008–0.051 1.20
NB: Ranges are in ppm over three or more spots. bdl corresponds to below detection limit. The error margin is expressed as relative
standard deviation (rsd). (*): Denotes a maximum value which is too high and probably due to unidentified factors in the raw data.
Table III: Compositional range and mean of 35 Marosely corundums determined using EDXRF.
Concentration range (wt%) Mean (wt%) Mean error
Al2O
398.3–99.9 99.39 ±0.22
Fe2O
30.086–0.822 0.29 ±0.01
Cr2O
30.022–0.19 0.08 ±0.008
TiO2
0.003–0.098 0.024 ±0.002
V2O
30–0.01 0.004 ±0.0008
Ga2O
30–0.006 0.003 ±0.0003
Ruby and sapphire from Marosely, Madagascar
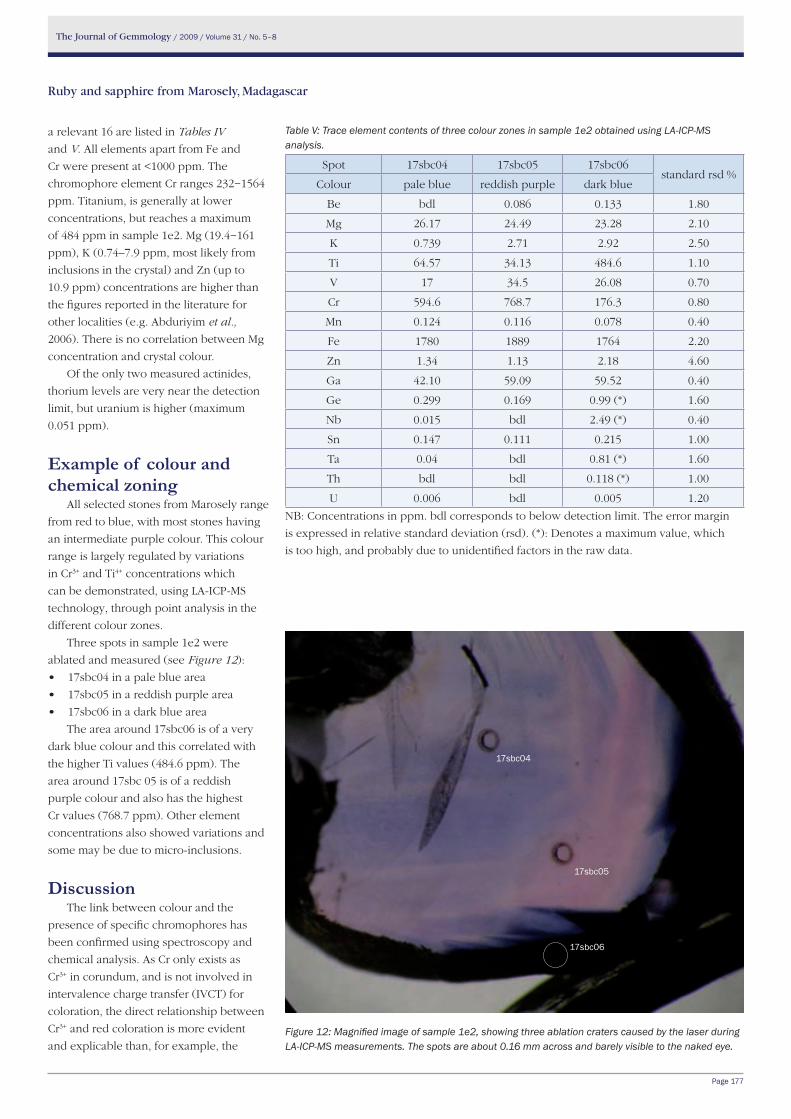
The Journal of Gemmology / 2009 / Volume 31 / No. 5–8
Page 177
a relevant 16 are listed in Tables IV
and V. All elements apart from Fe and
Cr were present at <1000 ppm. The
chromophore element Cr ranges 232−1564
ppm. Titanium, is generally at lower
concentrations, but reaches a maximum
of 484 ppm in sample 1e2. Mg (19.4−161
ppm), K (0.74–7.9 ppm, most likely from
inclusions in the crystal) and Zn (up to
10.9 ppm) concentrations are higher than
the figures reported in the literature for
other localities (e.g. Abduriyim et al.,
2006). There is no correlation between Mg
concentration and crystal colour.
Of the only two measured actinides,
thorium levels are very near the detection
limit, but uranium is higher (maximum
0.051 ppm).
example of colour and chemical zoning
All selected stones from Marosely range
from red to blue, with most stones having
an intermediate purple colour. This colour
range is largely regulated by variations
in Cr3+ and Ti4+ concentrations which
can be demonstrated, using LA-ICP-MS
technology, through point analysis in the
different colour zones.
Three spots in sample 1e2 were
ablated and measured (see Figure 12):
• 17sbc04inapalebluearea
• 17sbc05inareddishpurplearea
• 17sbc06inadarkbluearea
The area around 17sbc06 is of a very
dark blue colour and this correlated with
the higher Ti values (484.6 ppm). The
area around 17sbc 05 is of a reddish
purple colour and also has the highest
Cr values (768.7 ppm). Other element
concentrations also showed variations and
some may be due to micro-inclusions.
DiscussionThe link between colour and the
presence of specific chromophores has
been confirmed using spectroscopy and
chemical analysis. As Cr only exists as
Cr3+ in corundum, and is not involved in
intervalence charge transfer (IVCT) for
coloration, the direct relationship between
Cr3+ and red coloration is more evident
and explicable than, for example, the
Table V: Trace element contents of three colour zones in sample 1e2 obtained using LA-ICP-MS analysis.
Spot 17sbc04 17sbc05 17sbc06standard rsd %
Colour pale blue reddish purple dark blue
Be bdl 0.086 0.133 1.80
Mg 26.17 24.49 23.28 2.10
K 0.739 2.71 2.92 2.50
Ti 64.57 34.13 484.6 1.10
V 17 34.5 26.08 0.70
Cr 594.6 768.7 176.3 0.80
Mn 0.124 0.116 0.078 0.40
Fe 1780 1889 1764 2.20
Zn 1.34 1.13 2.18 4.60
Ga 42.10 59.09 59.52 0.40
Ge 0.299 0.169 0.99 (*) 1.60
Nb 0.015 bdl 2.49 (*) 0.40
Sn 0.147 0.111 0.215 1.00
Ta 0.04 bdl 0.81 (*) 1.60
Th bdl bdl 0.118 (*) 1.00
U 0.006 bdl 0.005 1.20
NB: Concentrations in ppm. bdl corresponds to below detection limit. The error margin
is expressed in relative standard deviation (rsd). (*): Denotes a maximum value, which
is too high, and probably due to unidentified factors in the raw data.
Figure 12: Magnified image of sample 1e2, showing three ablation craters caused by the laser during LA-ICP-MS measurements. The spots are about 0.16 mm across and barely visible to the naked eye.
17sbc04
17sbc05
17sbc06
Ruby and sapphire from Marosely, Madagascar
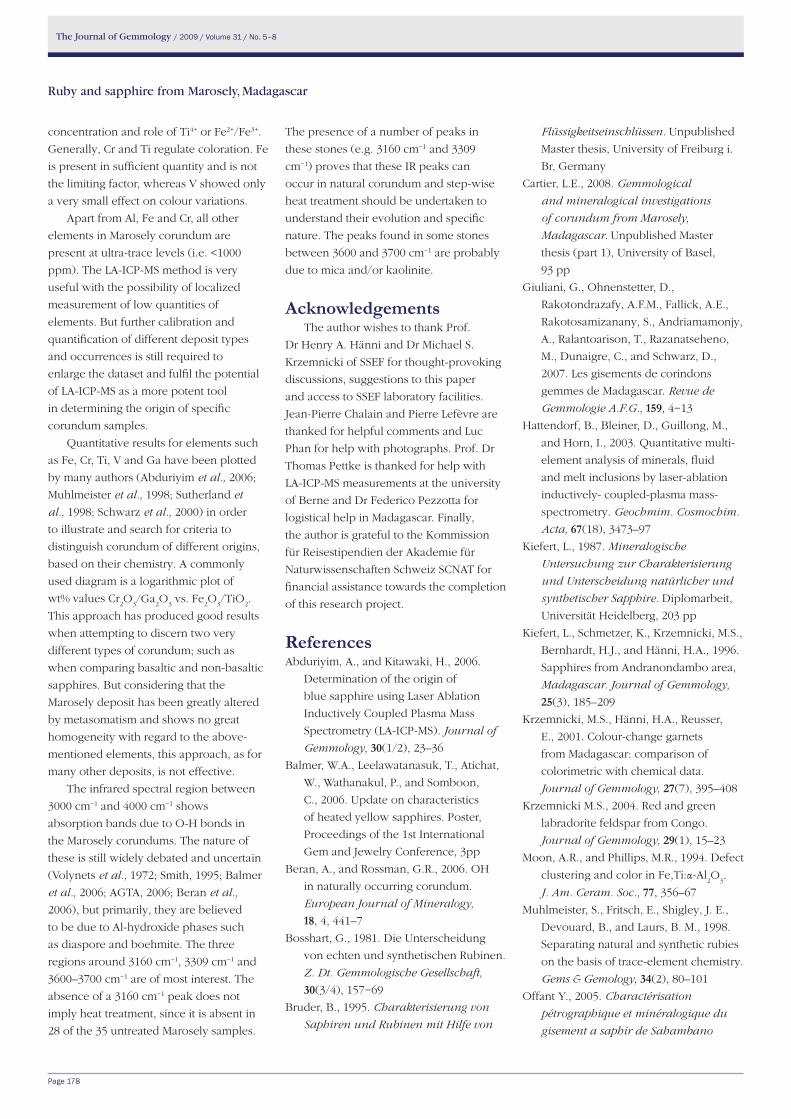
The Journal of Gemmology / 2009 / Volume 31 / No. 5–8
Page 178
concentration and role of Ti4+ or Fe2+/Fe3+.
Generally, Cr and Ti regulate coloration. Fe
is present in sufficient quantity and is not
the limiting factor, whereas V showed only
a very small effect on colour variations.
Apart from Al, Fe and Cr, all other
elements in Marosely corundum are
present at ultra-trace levels (i.e. <1000
ppm). The LA-ICP-MS method is very
useful with the possibility of localized
measurement of low quantities of
elements. But further calibration and
quantification of different deposit types
and occurrences is still required to
enlarge the dataset and fulfil the potential
of LA-ICP-MS as a more potent tool
in determining the origin of specific
corundum samples.
Quantitative results for elements such
as Fe, Cr, Ti, V and Ga have been plotted
by many authors (Abduriyim et al., 2006;
Muhlmeister et al., 1998; Sutherland et
al., 1998; Schwarz et al., 2000) in order
to illustrate and search for criteria to
distinguish corundum of different origins,
based on their chemistry. A commonly
used diagram is a logarithmic plot of
wt% values Cr2O
3/Ga
2O
3 vs. Fe
2O
3/TiO
2.
This approach has produced good results
when attempting to discern two very
different types of corundum; such as
when comparing basaltic and non-basaltic
sapphires. But considering that the
Marosely deposit has been greatly altered
by metasomatism and shows no great
homogeneity with regard to the above-
mentioned elements, this approach, as for
many other deposits, is not effective.
The infrared spectral region between
3000 cm−1 and 4000 cm−1 shows
absorption bands due to O-H bonds in
the Marosely corundums. The nature of
these is still widely debated and uncertain
(Volynets et al., 1972; Smith, 1995; Balmer
et al., 2006; AGTA, 2006; Beran et al.,
2006), but primarily, they are believed
to be due to Al-hydroxide phases such
as diaspore and boehmite. The three
regions around 3160 cm−1, 3309 cm−1 and
3600–3700 cm−1 are of most interest. The
absence of a 3160 cm−1 peak does not
imply heat treatment, since it is absent in
28 of the 35 untreated Marosely samples.
The presence of a number of peaks in
these stones (e.g. 3160 cm−1 and 3309
cm−1) proves that these IR peaks can
occur in natural corundum and step-wise
heat treatment should be undertaken to
understand their evolution and specific
nature. The peaks found in some stones
between 3600 and 3700 cm−1 are probably
due to mica and/or kaolinite.
AcknowledgementsThe author wishes to thank Prof.
Dr Henry A. Hänni and Dr Michael S.
Krzemnicki of SSEF for thought-provoking
discussions, suggestions to this paper
and access to SSEF laboratory facilities.
Jean-Pierre Chalain and Pierre Lefèvre are
thanked for helpful comments and Luc
Phan for help with photographs. Prof. Dr
Thomas Pettke is thanked for help with
LA-ICP-MS measurements at the university
of Berne and Dr Federico Pezzotta for
logistical help in Madagascar. Finally,
the author is grateful to the Kommission
für Reisestipendien der Akademie für
Naturwissenschaften Schweiz SCNAT for
financial assistance towards the completion
of this research project.
ReferencesAbduriyim, A., and Kitawaki, H., 2006.
Determination of the origin of
blue sapphire using Laser Ablation
Inductively Coupled Plasma Mass
Spectrometry (LA-ICP-MS). Journal of
Gemmology, 30(1/2), 23–36
Balmer, W.A., Leelawatanasuk, T., Atichat,
W., Wathanakul, P., and Somboon,
C., 2006. Update on characteristics
of heated yellow sapphires. Poster,
Proceedings of the 1st International
Gem and Jewelry Conference, 3pp
Beran, A., and Rossman, G.R., 2006. OH
in naturally occurring corundum.
European Journal of Mineralogy,
18, 4, 441–7
Bosshart, G., 1981. Die Unterscheidung
von echten und synthetischen Rubinen.
Z. Dt. Gemmologische Gesellschaft,
30(3/4), 157−69
Bruder, B., 1995. Charakterisierung von
Saphiren und Rubinen mit Hilfe von
Flüssigkeitseinschlüssen. Unpublished
Master thesis, University of Freiburg i.
Br, Germany
Cartier, L.E., 2008. Gemmological
and mineralogical investigations
of corundum from Marosely,
Madagascar. Unpublished Master
thesis (part 1), University of Basel,
93 pp
Giuliani, G., Ohnenstetter, D.,
Rakotondrazafy, A.F.M., Fallick, A.E.,
Rakotosamizanany, S., Andriamamonjy,
A., Ralantoarison, T., Razanatseheno,
M., Dunaigre, C., and Schwarz, D.,
2007. Les gisements de corindons
gemmes de Madagascar. Revue de
Gemmologie A.F.G., 159, 4−13
Hattendorf, B., Bleiner, D., Guillong, M.,
and Horn, I., 2003. Quantitative multi-
element analysis of minerals, fluid
and melt inclusions by laser-ablation
inductively- coupled-plasma mass-
spectrometry. Geochmim. Cosmochim.
Acta, 67(18), 3473–97
Kiefert, L., 1987. Mineralogische
Untersuchung zur Charakterisierung
und Unterscheidung natürlicher und
synthetischer Sapphire. Diplomarbeit,
Universität Heidelberg, 203 pp
Kiefert, L., Schmetzer, K., Krzemnicki, M.S.,
Bernhardt, H.J., and Hänni, H.A., 1996.
Sapphires from Andranondambo area,
Madagascar. Journal of Gemmology,
25(3), 185–209
Krzemnicki, M.S., Hänni, H.A., Reusser,
E., 2001. Colour-change garnets
from Madagascar: comparison of
colorimetric with chemical data.
Journal of Gemmology, 27(7), 395–408
Krzemnicki M.S., 2004. Red and green
labradorite feldspar from Congo.
Journal of Gemmology, 29(1), 15–23
Moon, A.R., and Phillips, M.R., 1994. Defect
clustering and color in Fe,Ti:α-Al2O
3.
J. Am. Ceram. Soc., 77, 356–67
Muhlmeister, S., Fritsch, E., Shigley, J. E.,
Devouard, B., and Laurs, B. M., 1998.
Separating natural and synthetic rubies
on the basis of trace-element chemistry.
Gems & Gemology, 34(2), 80–101
Offant Y., 2005. Charactérisation
pétrographique et minéralogique du
gisement a saphir de Sahambano
Ruby and sapphire from Marosely, Madagascar
The Journal of Gemmology / 2009 / Volume 31 / No. 5–8
Page 179
(Madagascar). Unpublished Master
Thesis, Université Paul Cézanne, Aix-en
Provence, France, 34 pp
Ostertag, T., 1996. Spezielle Anwendung
der Raman-Spektroskopie in den
Gebieten der Mineralogie, Petrologie
und Gemmologie. Unpublished Master
thesis, University of Freiburg i.Br,
Germany
Peretti, A., Schmetzer, K., Bernhardt, H.-J.,
and Mouawad, F., 1995. Rubies from
Mong-Hsu. Gems & Gemology,
31(1), 2–26
Pettke, T., 2006. In situ laser ablation-
ICP-MS chemical analysis of
melt inclusions and prospects for
constraining subduction zone
magmatism. Mineralogical Association
of Canada Short Course, 36, 51–80
Pezzotta, F., 2001. Madagascar. A Mineral
and Gemstone Paradise. Extra Lapis,
English No 1. Lapis International LLC,
East Hampton, CT, 100 pp
Ralantoarison, L. T., 2006. Les corindons
metamorphiques associés aux zones de
cisaillement du sud de Madagascar:
Le gisement de saphir de Sahambano
(Sud-Est d’Ihosy). Unpublished DEA
thesis, University of Antananarivo.
102 pp
Ralantoarison, T., Andriamamonjy, A.,
Offant, Y., Giuliani, G., Rakotondrazafy,
A.F.M, Ohnenstetter, D., Schwarz,
D., Dunaigre, C., Fallick, A.,
Razanatseheno, M., Rakotosamizanany,
S., Moine, B., and Baillot, P., 2006. Les
saphirs multicolores de Sahambano et
Zazafotsy, region granulitique d’Ihosy,
Madagascar. Revue de Gemmologie
A.F.G., 158, 4−13
Ramdohr, R., and Milisenda, C.C., 2006. A
new find of sapphire placer deposits
on Nosy-Bé, Madagascar. Journal of
Gemmology, 30(3/4), 144−54
Rankin, A.H., Greenwood, J., and
Hargreaves, D., 2003. Chemical
fingerprinting of some East African
gem rubies by laser ablation ICP-MS.
Journal of Gemmology, 28(8), 473–82
Saminpanya, S., Manning, D.A.C., Droop,
G.T.R., and Henderson, C.M.B.,
2003. Trace elements in Thai gem
corundums. Journal of Gemmology,
28(7), 399–415
Schmetzer, K., and Schwarz, D., 2004. The
causes of colour in untreated, heat
treated and diffusion treated orange
and pinkish orange sapphires- a
review. Journal of Gemmology,
29(3), 149−82
Schwarz, D., Petsch, E.J., and Kanis,
J., 1996. Sapphires from the
Andranondambo Region, Madagascar.
Gems & Gemology, 32(2), 80–99
Schwarz, D., Kanis, J., and Schmetzer,
K., 2000. Sapphires from Antsiranana
Province, Northern Madagascar. Gems
& Gemology, 36(3), 216–33
Smith, C. P., Kammerling, R.C., Keller, A.C.,
Peretti, A., Scarratt, K.V., Khoa, N.D.,
and Repetto, S., 1995. Sapphires from
southern Vietnam. Gems & Gemology,
31(3), 168−86
Smith, C.P., 1995. A contribution to
understanding the infrared spectra
of rubies from Mong Hsu, Myanmar.
Journal of Gemmology, 24(5), 321–35
Sutherland, F.L., Hoskin, P.W.O., Fanning,
C.M., and Coenraads, R.R., 1998.
Models of corundum origin from
alkali basalt terrains: a reappraisal.
Contributions to Mineralogy and
Petrology, 133, 356–72
Volynets, F.K., Vorob'ev, V.G., and
Stsepuro, N.A., 1972. Infrared
absorption bands in corundum crystals.
Journal of Applied Spectroscopy,
10, 981–4
Waite, K., 2000. Mineralogical and
gemmological analysis of corundum
from Tunduru and Songea, Southern
Tanzania. Unpublished Master thesis,
University of Basel, 74 pp
websitesAGTA Gemstone Update, 2007. FTIR
intrigue. http://www.agta.org/
gtc/20070227- ftir.html#ftir Accessed
10.07.2007
Pezzotta, F., 2007. New Gem
Localities in Madagascar. Accessed
16.10.2007 https://www.gia.edu/
gemsandgemology/34468/new_gem_
localities_in_madagascar.cfm
Ruby and sapphire from Marosely, Madagascar
the Authorlaurent e. Cartier
Department of Geosciences, University of Basel, Bernoullistrasse 30, 4056 Basel,
Switzerland
email: [email protected]
This three-day certificated course is taught by a grader with 25 years’ experience. Topics covered include:
Use of the microscope to clarity grade and plot • diamonds Colour grading and master stones • Fluorescence grading • Cut (measurements, proportions, symmetry and • polish)
Courses are held at the Gem-A headquarters in Central London. Next course:
Wednesday 21 to Friday 23 April 2010Fee: ₤680.00
For further information or to apply for the course, go to www.gem-a.com/education.aspx or contact Paveet Amrit on 020 7404 3334, email [email protected]. Applicants must hold either our Gem Diamond Diploma or our Diamond Practical Certificate.
Improve your grading skills by enrolling for the Gem-A
Advanced DIAMOND GRADING Course
The SCOTTISh GEMMOLOGy CONFeReNCe
Friday 30 April to Monday 3 May 2010
The Queen's Hotel, Perth
This popular event attracts speakers and participants from many corners of the world. The well-balanced
programme of lectures has something for anyone with an interest in gems.
Speakers will include:
Dr DieTMAr ScHwArz
MAriA AlFerovA
DAviD cAllAGHAN
GwyN GreeN
AlAN HoDGkiNSoN
Dr JAck oGDeN
Dr DoN Hoover
Sunday afternoon will be devoted to displays, workshops and demonstrations,
and a Field Trip will be held on the Monday morning.
Social events are held each evening, including the ceilidh (dinner/dance) on
the Saturday.
For further information or to book go to www.scotgem.co.uk or call Catriona McInnes on
+44 (0)131 667 2199
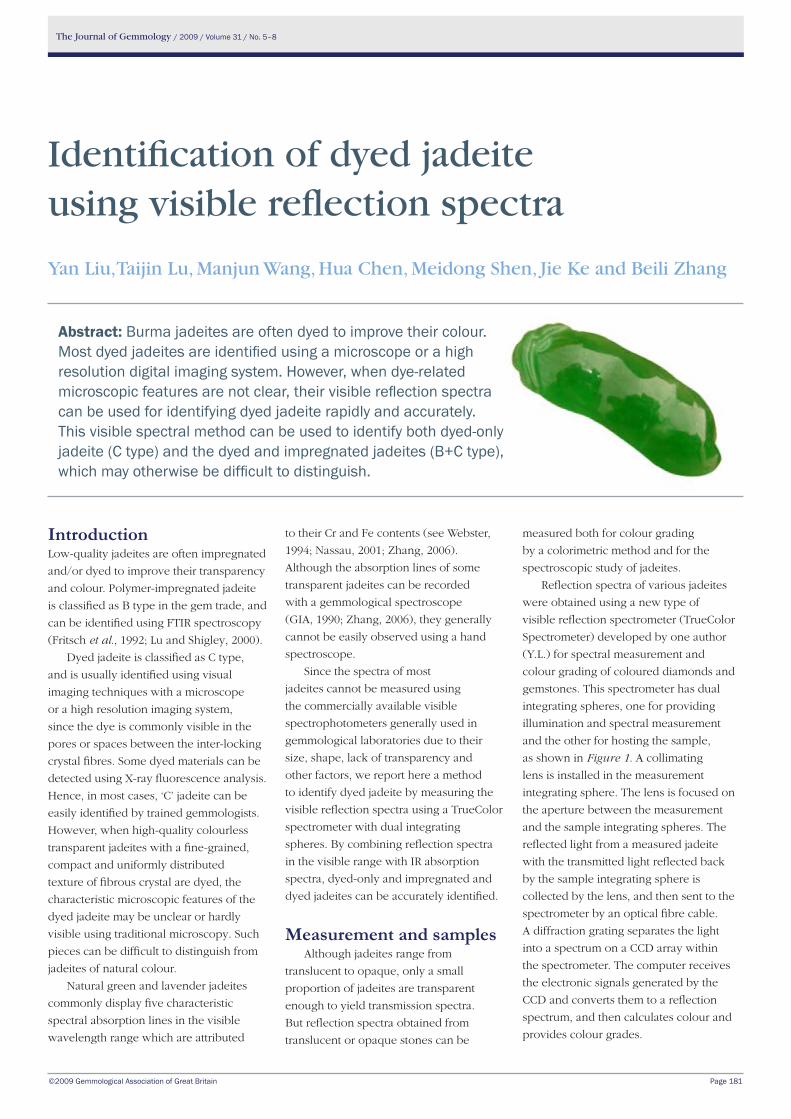
The Journal of Gemmology / 2009 / Volume 31 / No. 5–8
©2009 Gemmological Association of Great Britain Page 181
IntroductionLow-quality jadeites are often impregnated
and/or dyed to improve their transparency
and colour. Polymer-impregnated jadeite
is classified as B type in the gem trade, and
can be identified using FTIR spectroscopy
(Fritsch et al., 1992; Lu and Shigley, 2000).
Dyed jadeite is classified as C type,
and is usually identified using visual
imaging techniques with a microscope
or a high resolution imaging system,
since the dye is commonly visible in the
pores or spaces between the inter-locking
crystal fibres. Some dyed materials can be
detected using X-ray fluorescence analysis.
Hence, in most cases, ‘C’ jadeite can be
easily identified by trained gemmologists.
However, when high-quality colourless
transparent jadeites with a fine-grained,
compact and uniformly distributed
texture of fibrous crystal are dyed, the
characteristic microscopic features of the
dyed jadeite may be unclear or hardly
visible using traditional microscopy. Such
pieces can be difficult to distinguish from
jadeites of natural colour.
Natural green and lavender jadeites
commonly display five characteristic
spectral absorption lines in the visible
wavelength range which are attributed
to their Cr and Fe contents (see Webster,
1994; Nassau, 2001; Zhang, 2006).
Although the absorption lines of some
transparent jadeites can be recorded
with a gemmological spectroscope
(GIA, 1990; Zhang, 2006), they generally
cannot be easily observed using a hand
spectroscope.
Since the spectra of most
jadeites cannot be measured using
the commercially available visible
spectrophotometers generally used in
gemmological laboratories due to their
size, shape, lack of transparency and
other factors, we report here a method
to identify dyed jadeite by measuring the
visible reflection spectra using a TrueColor
spectrometer with dual integrating
spheres. By combining reflection spectra
in the visible range with IR absorption
spectra, dyed-only and impregnated and
dyed jadeites can be accurately identified.
Measurement and samplesAlthough jadeites range from
translucent to opaque, only a small
proportion of jadeites are transparent
enough to yield transmission spectra.
But reflection spectra obtained from
translucent or opaque stones can be
measured both for colour grading
by a colorimetric method and for the
spectroscopic study of jadeites.
Reflection spectra of various jadeites
were obtained using a new type of
visible reflection spectrometer (TrueColor
Spectrometer) developed by one author
(Y.L.) for spectral measurement and
colour grading of coloured diamonds and
gemstones. This spectrometer has dual
integrating spheres, one for providing
illumination and spectral measurement
and the other for hosting the sample,
as shown in Figure 1. A collimating
lens is installed in the measurement
integrating sphere. The lens is focused on
the aperture between the measurement
and the sample integrating spheres. The
reflected light from a measured jadeite
with the transmitted light reflected back
by the sample integrating sphere is
collected by the lens, and then sent to the
spectrometer by an optical fibre cable.
A diffraction grating separates the light
into a spectrum on a CCD array within
the spectrometer. The computer receives
the electronic signals generated by the
CCD and converts them to a reflection
spectrum, and then calculates colour and
provides colour grades.
Identification of dyed jadeite using visible reflection spectra
Yan Liu, Taijin Lu, Manjun Wang, Hua Chen, Meidong Shen, Jie Ke and Beili Zhang
Abstract: Burma jadeites are often dyed to improve their colour. Most dyed jadeites are identified using a microscope or a high resolution digital imaging system. however, when dye-related microscopic features are not clear, their visible reflection spectra can be used for identifying dyed jadeite rapidly and accurately. This visible spectral method can be used to identify both dyed-only jadeite (C type) and the dyed and impregnated jadeites (B+C type), which may otherwise be difficult to distinguish.
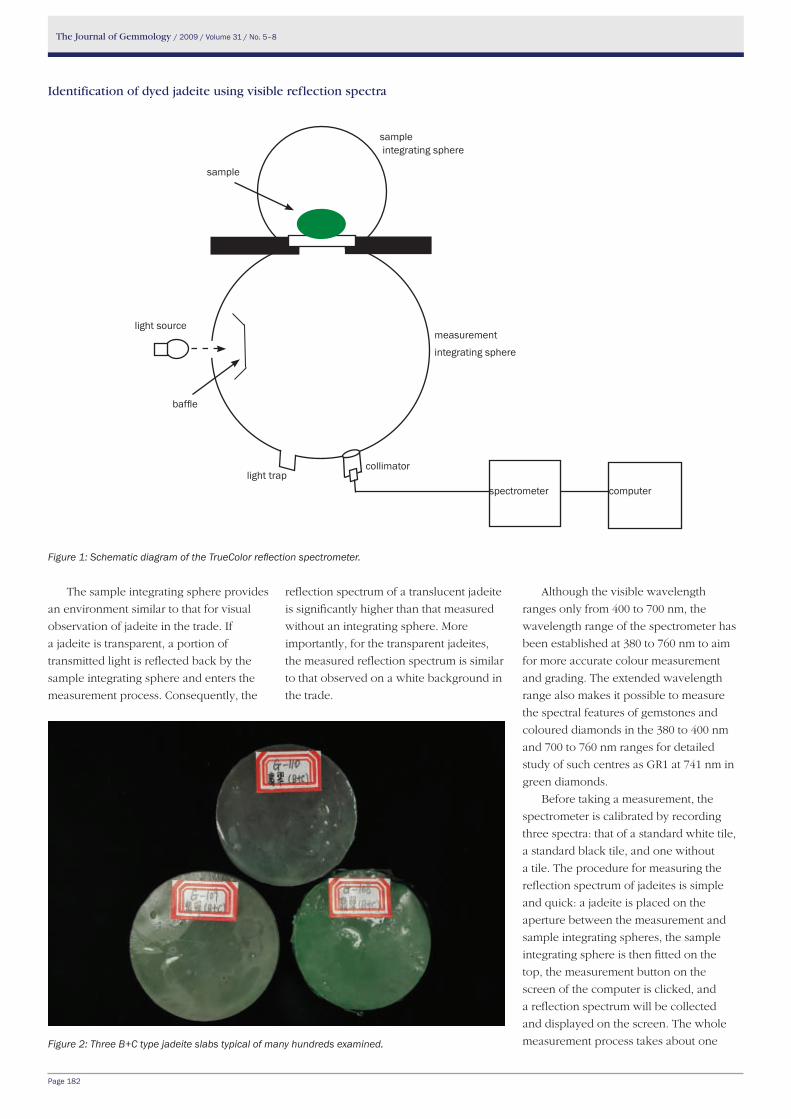
The Journal of Gemmology / 2009 / Volume 31 / No. 5–8
Page 182
The sample integrating sphere provides
an environment similar to that for visual
observation of jadeite in the trade. If
a jadeite is transparent, a portion of
transmitted light is reflected back by the
sample integrating sphere and enters the
measurement process. Consequently, the
reflection spectrum of a translucent jadeite
is significantly higher than that measured
without an integrating sphere. More
importantly, for the transparent jadeites,
the measured reflection spectrum is similar
to that observed on a white background in
the trade.
Although the visible wavelength
ranges only from 400 to 700 nm, the
wavelength range of the spectrometer has
been established at 380 to 760 nm to aim
for more accurate colour measurement
and grading. The extended wavelength
range also makes it possible to measure
the spectral features of gemstones and
coloured diamonds in the 380 to 400 nm
and 700 to 760 nm ranges for detailed
study of such centres as GR1 at 741 nm in
green diamonds.
Before taking a measurement, the
spectrometer is calibrated by recording
three spectra: that of a standard white tile,
a standard black tile, and one without
a tile. The procedure for measuring the
reflection spectrum of jadeites is simple
and quick: a jadeite is placed on the
aperture between the measurement and
sample integrating spheres, the sample
integrating sphere is then fitted on the
top, the measurement button on the
screen of the computer is clicked, and
a reflection spectrum will be collected
and displayed on the screen. The whole
measurement process takes about one
Figure 1: Schematic diagram of the TrueColor reflection spectrometer.
light source
baffle
sample
sample integrating sphere
measurement
integrating sphere
collimatorlight trap
computerspectrometer
Figure 2: Three B+C type jadeite slabs typical of many hundreds examined.
Identification of dyed jadeite using visible reflection spectra
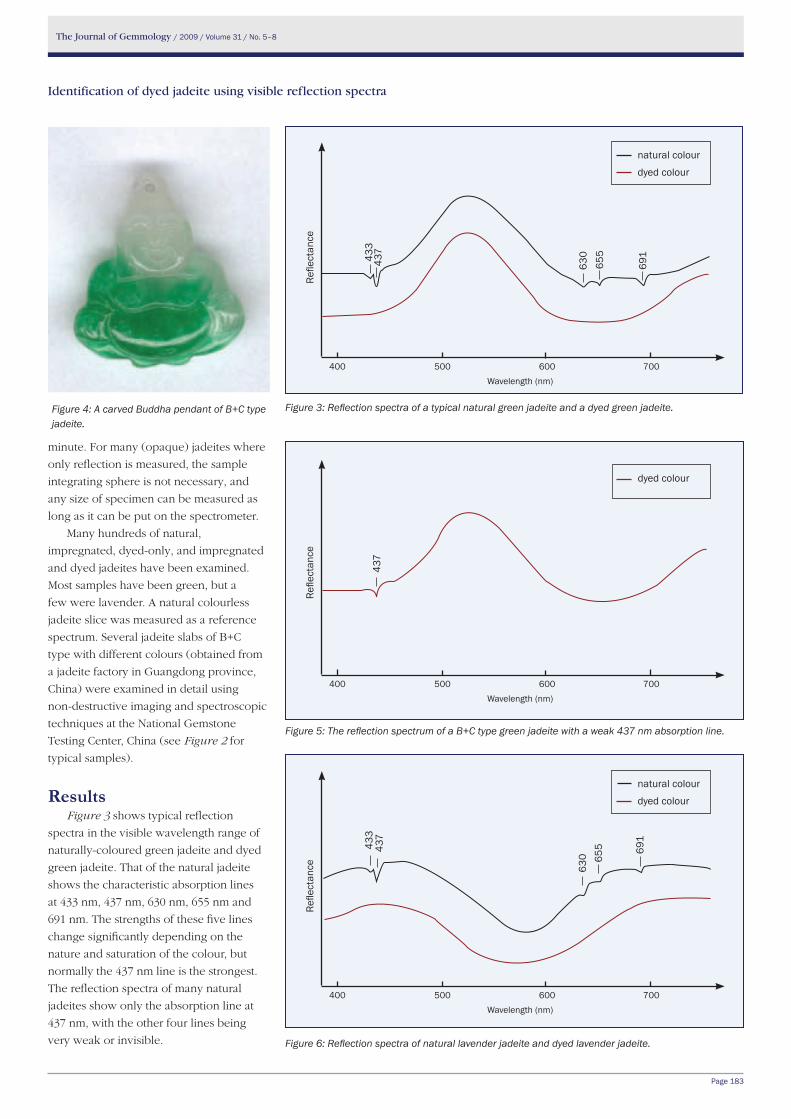
The Journal of Gemmology / 2009 / Volume 31 / No. 5–8
Page 183
minute. For many (opaque) jadeites where
only reflection is measured, the sample
integrating sphere is not necessary, and
any size of specimen can be measured as
long as it can be put on the spectrometer.
Many hundreds of natural,
impregnated, dyed-only, and impregnated
and dyed jadeites have been examined.
Most samples have been green, but a
few were lavender. A natural colourless
jadeite slice was measured as a reference
spectrum. Several jadeite slabs of B+C
type with different colours (obtained from
a jadeite factory in Guangdong province,
China) were examined in detail using
non-destructive imaging and spectroscopic
techniques at the National Gemstone
Testing Center, China (see Figure 2 for
typical samples).
ResultsFigure 3 shows typical reflection
spectra in the visible wavelength range of
naturally-coloured green jadeite and dyed
green jadeite. That of the natural jadeite
shows the characteristic absorption lines
at 433 nm, 437 nm, 630 nm, 655 nm and
691 nm. The strengths of these five lines
change significantly depending on the
nature and saturation of the colour, but
normally the 437 nm line is the strongest.
The reflection spectra of many natural
jadeites show only the absorption line at
437 nm, with the other four lines being
very weak or invisible.
Figure 3: Reflection spectra of a typical natural green jadeite and a dyed green jadeite.Figure 4: A carved Buddha pendant of B+C type jadeite.
400 500 600 700Wavelength (nm)
Refle
ctan
ce
437
dyed colour
Figure 5: The reflection spectrum of a B+C type green jadeite with a weak 437 nm absorption line.
400 500 600 700Wavelength (nm)
Refle
ctan
ce
natural colour
dyed colour
433
437
630 65
5 691
Figure 6: Reflection spectra of natural lavender jadeite and dyed lavender jadeite.
Identification of dyed jadeite using visible reflection spectra
400 500 600 700Wavelength (nm)
Refle
ctan
ce
natural colour
dyed colour
433
437
630
655
691
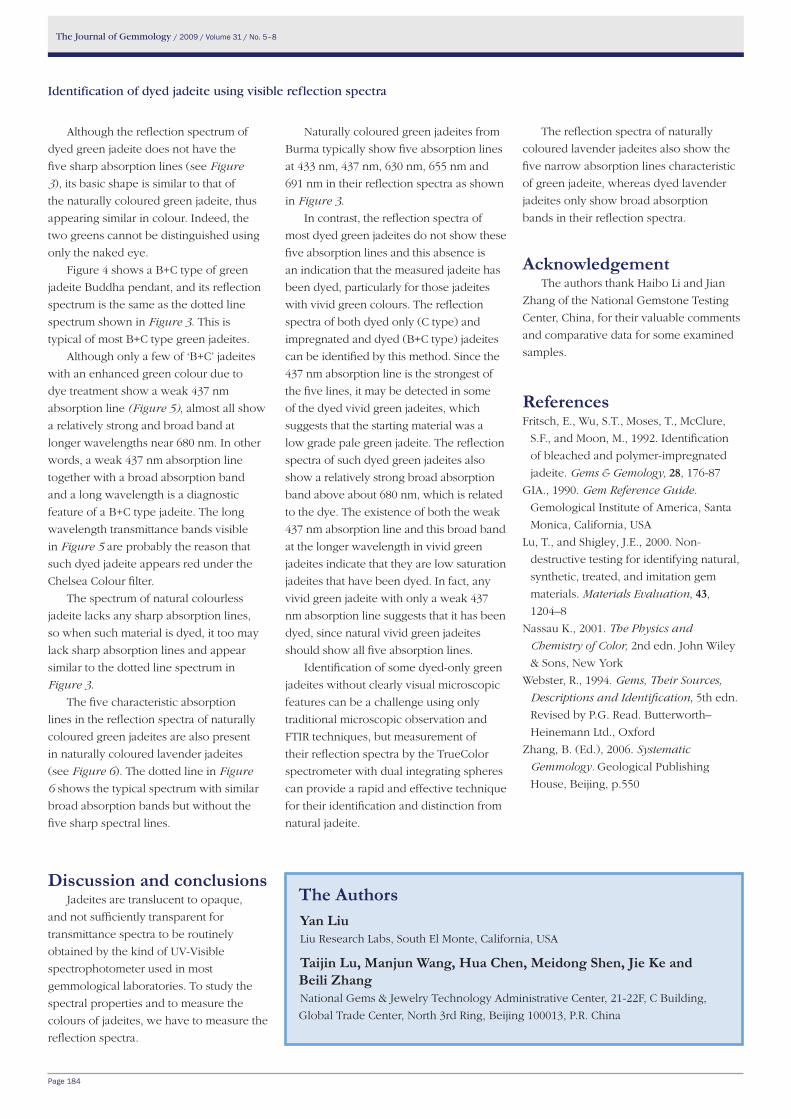
The Journal of Gemmology / 2009 / Volume 31 / No. 5–8
Page 184
Although the reflection spectrum of
dyed green jadeite does not have the
five sharp absorption lines (see Figure
3), its basic shape is similar to that of
the naturally coloured green jadeite, thus
appearing similar in colour. Indeed, the
two greens cannot be distinguished using
only the naked eye.
Figure 4 shows a B+C type of green
jadeite Buddha pendant, and its reflection
spectrum is the same as the dotted line
spectrum shown in Figure 3. This is
typical of most B+C type green jadeites.
Although only a few of ‘B+C’ jadeites
with an enhanced green colour due to
dye treatment show a weak 437 nm
absorption line (Figure 5), almost all show
a relatively strong and broad band at
longer wavelengths near 680 nm. In other
words, a weak 437 nm absorption line
together with a broad absorption band
and a long wavelength is a diagnostic
feature of a B+C type jadeite. The long
wavelength transmittance bands visible
in Figure 5 are probably the reason that
such dyed jadeite appears red under the
Chelsea Colour filter.
The spectrum of natural colourless
jadeite lacks any sharp absorption lines,
so when such material is dyed, it too may
lack sharp absorption lines and appear
similar to the dotted line spectrum in
Figure 3.
The five characteristic absorption
lines in the reflection spectra of naturally
coloured green jadeites are also present
in naturally coloured lavender jadeites
(see Figure 6). The dotted line in Figure
6 shows the typical spectrum with similar
broad absorption bands but without the
five sharp spectral lines.
Discussion and conclusionsJadeites are translucent to opaque,
and not sufficiently transparent for
transmittance spectra to be routinely
obtained by the kind of UV-Visible
spectrophotometer used in most
gemmological laboratories. To study the
spectral properties and to measure the
colours of jadeites, we have to measure the
reflection spectra.
Naturally coloured green jadeites from
Burma typically show five absorption lines
at 433 nm, 437 nm, 630 nm, 655 nm and
691 nm in their reflection spectra as shown
in Figure 3.
In contrast, the reflection spectra of
most dyed green jadeites do not show these
five absorption lines and this absence is
an indication that the measured jadeite has
been dyed, particularly for those jadeites
with vivid green colours. The reflection
spectra of both dyed only (C type) and
impregnated and dyed (B+C type) jadeites
can be identified by this method. Since the
437 nm absorption line is the strongest of
the five lines, it may be detected in some
of the dyed vivid green jadeites, which
suggests that the starting material was a
low grade pale green jadeite. The reflection
spectra of such dyed green jadeites also
show a relatively strong broad absorption
band above about 680 nm, which is related
to the dye. The existence of both the weak
437 nm absorption line and this broad band
at the longer wavelength in vivid green
jadeites indicate that they are low saturation
jadeites that have been dyed. In fact, any
vivid green jadeite with only a weak 437
nm absorption line suggests that it has been
dyed, since natural vivid green jadeites
should show all five absorption lines.
Identification of some dyed-only green
jadeites without clearly visual microscopic
features can be a challenge using only
traditional microscopic observation and
FTIR techniques, but measurement of
their reflection spectra by the TrueColor
spectrometer with dual integrating spheres
can provide a rapid and effective technique
for their identification and distinction from
natural jadeite.
The reflection spectra of naturally
coloured lavender jadeites also show the
five narrow absorption lines characteristic
of green jadeite, whereas dyed lavender
jadeites only show broad absorption
bands in their reflection spectra.
AcknowledgementThe authors thank Haibo Li and Jian
Zhang of the National Gemstone Testing
Center, China, for their valuable comments
and comparative data for some examined
samples.
ReferencesFritsch, E., Wu, S.T., Moses, T., McClure,
S.F., and Moon, M., 1992. Identification
of bleached and polymer-impregnated
jadeite. Gems & Gemology, 28, 176-87
GIA., 1990. Gem Reference Guide.
Gemological Institute of America, Santa
Monica, California, USA
Lu, T., and Shigley, J.E., 2000. Non-
destructive testing for identifying natural,
synthetic, treated, and imitation gem
materials. Materials Evaluation, 43,
1204–8
Nassau K., 2001. The Physics and
Chemistry of Color, 2nd edn. John Wiley
& Sons, New York
Webster, R., 1994. Gems, Their Sources,
Descriptions and Identification, 5th edn.
Revised by P.G. Read. Butterworth–
Heinemann Ltd., Oxford
Zhang, B. (Ed.), 2006. Systematic
Gemmology. Geological Publishing
House, Beijing, p.550
the AuthorsYan liuLiu Research Labs, South El Monte, California, USA
taijin lu, Manjun wang, hua Chen, Meidong Shen, Jie Ke and Beili ZhangNational Gems & Jewelry Technology Administrative Center, 21-22F, C Building,
Global Trade Center, North 3rd Ring, Beijing 100013, P.R. China
Identification of dyed jadeite using visible reflection spectra
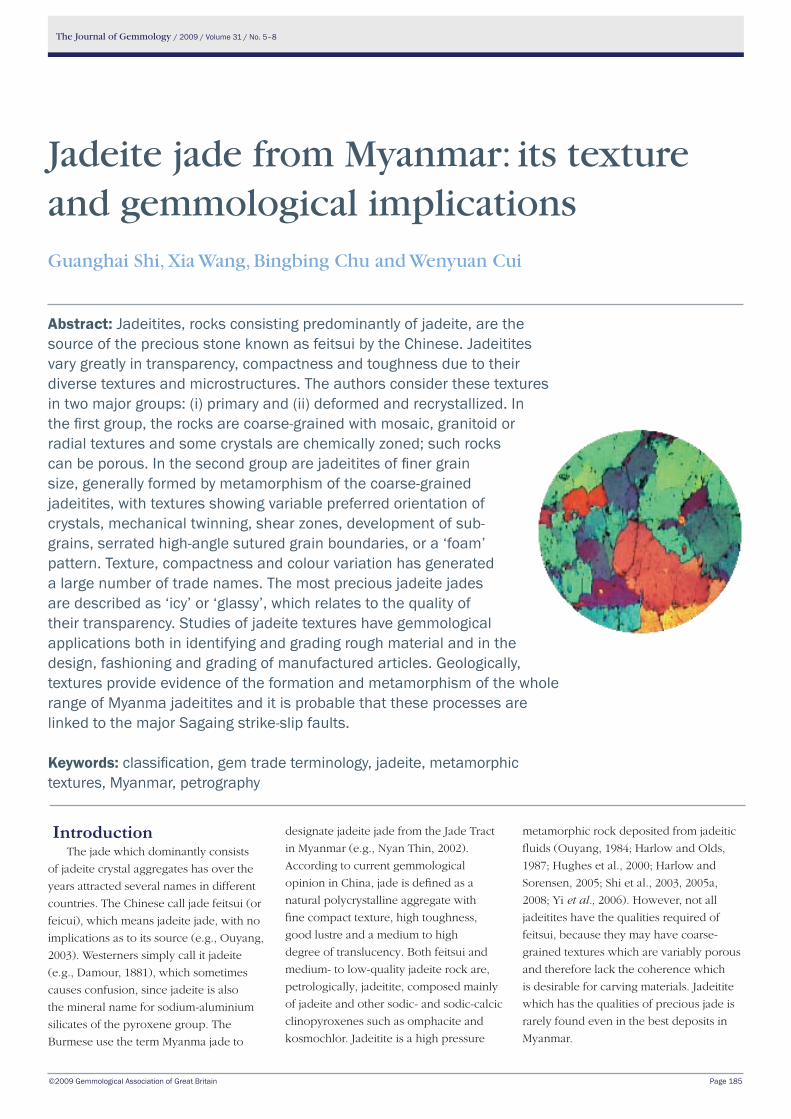
The Journal of Gemmology / 2009 / Volume 31 / No. 5–8
©2009 Gemmological Association of Great Britain Page 185
IntroductionThe jade which dominantly consists
of jadeite crystal aggregates has over the
years attracted several names in different
countries. The Chinese call jade feitsui (or
feicui), which means jadeite jade, with no
implications as to its source (e.g., Ouyang,
2003). Westerners simply call it jadeite
(e.g., Damour, 1881), which sometimes
causes confusion, since jadeite is also
the mineral name for sodium-aluminium
silicates of the pyroxene group. The
Burmese use the term Myanma jade to
designate jadeite jade from the Jade Tract
in Myanmar (e.g., Nyan Thin, 2002).
According to current gemmological
opinion in China, jade is defined as a
natural polycrystalline aggregate with
fine compact texture, high toughness,
good lustre and a medium to high
degree of translucency. Both feitsui and
medium- to low-quality jadeite rock are,
petrologically, jadeitite, composed mainly
of jadeite and other sodic- and sodic-calcic
clinopyroxenes such as omphacite and
kosmochlor. Jadeitite is a high pressure
metamorphic rock deposited from jadeitic
fluids (Ouyang, 1984; Harlow and Olds,
1987; Hughes et al., 2000; Harlow and
Sorensen, 2005; Shi et al., 2003, 2005a,
2008; Yi et al., 2006). However, not all
jadeitites have the qualities required of
feitsui, because they may have coarse-
grained textures which are variably porous
and therefore lack the coherence which
is desirable for carving materials. Jadeitite
which has the qualities of precious jade is
rarely found even in the best deposits in
Myanmar.
Jadeite jade from Myanmar: its texture and gemmological implications Guanghai Shi, Xia Wang, Bingbing Chu and Wenyuan Cui
Abstract: Jadeitites, rocks consisting predominantly of jadeite, are the source of the precious stone known as feitsui by the Chinese. Jadeitites vary greatly in transparency, compactness and toughness due to their diverse textures and microstructures. The authors consider these textures in two major groups: (i) primary and (ii) deformed and recrystallized. In the first group, the rocks are coarse-grained with mosaic, granitoid or radial textures and some crystals are chemically zoned; such rocks can be porous. In the second group are jadeitites of finer grain size, generally formed by metamorphism of the coarse-grained jadeitites, with textures showing variable preferred orientation of crystals, mechanical twinning, shear zones, development of sub-grains, serrated high-angle sutured grain boundaries, or a ‘foam’ pattern. Texture, compactness and colour variation has generated a large number of trade names. The most precious jadeite jades are described as ‘icy’ or ‘glassy’, which relates to the quality of their transparency. Studies of jadeite textures have gemmological applications both in identifying and grading rough material and in the design, fashioning and grading of manufactured articles. Geologically, textures provide evidence of the formation and metamorphism of the whole range of Myanma jadeitites and it is probable that these processes are linked to the major Sagaing strike-slip faults.
Keywords: classification, gem trade terminology, jadeite, metamorphic textures, Myanmar, petrography
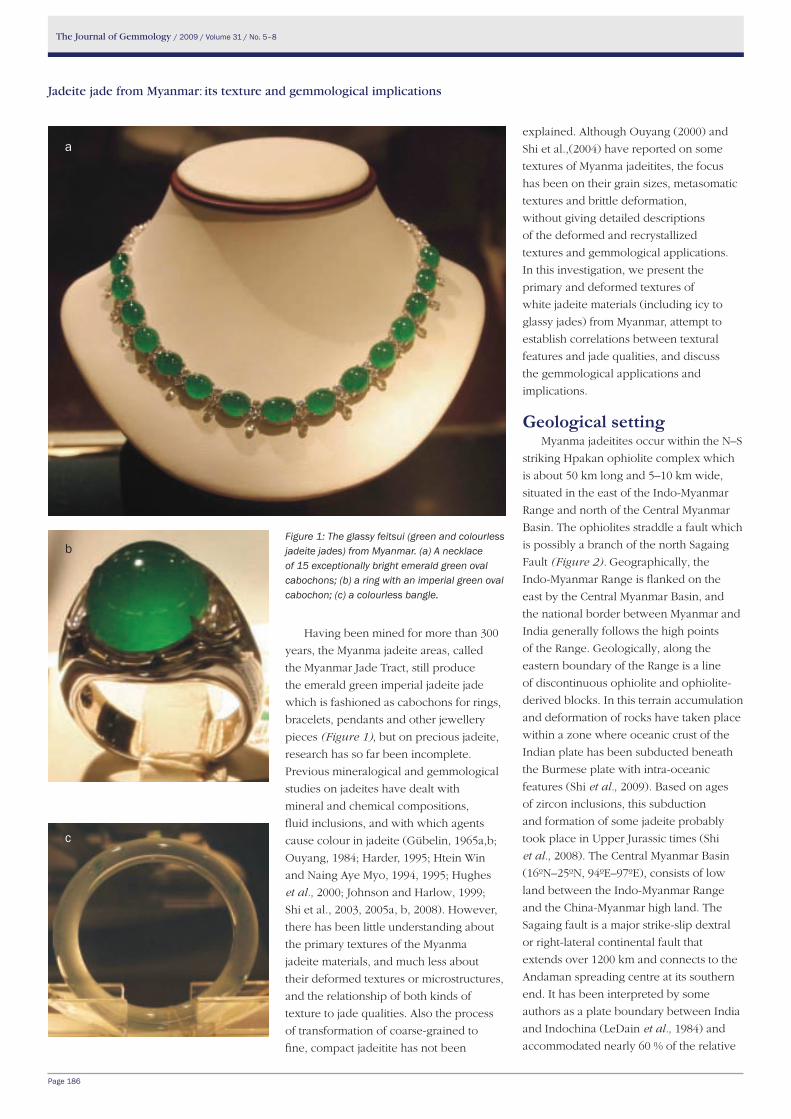
The Journal of Gemmology / 2009 / Volume 31 / No. 5–8
Page 186
Having been mined for more than 300
years, the Myanma jadeite areas, called
the Myanmar Jade Tract, still produce
the emerald green imperial jadeite jade
which is fashioned as cabochons for rings,
bracelets, pendants and other jewellery
pieces (Figure 1), but on precious jadeite,
research has so far been incomplete.
Previous mineralogical and gemmological
studies on jadeites have dealt with
mineral and chemical compositions,
fluid inclusions, and with which agents
cause colour in jadeite (Gübelin, 1965a,b;
Ouyang, 1984; Harder, 1995; Htein Win
and Naing Aye Myo, 1994, 1995; Hughes
et al., 2000; Johnson and Harlow, 1999;
Shi et al., 2003, 2005a, b, 2008). However,
there has been little understanding about
the primary textures of the Myanma
jadeite materials, and much less about
their deformed textures or microstructures,
and the relationship of both kinds of
texture to jade qualities. Also the process
of transformation of coarse-grained to
fine, compact jadeitite has not been
explained. Although Ouyang (2000) and
Shi et al.,(2004) have reported on some
textures of Myanma jadeitites, the focus
has been on their grain sizes, metasomatic
textures and brittle deformation,
without giving detailed descriptions
of the deformed and recrystallized
textures and gemmological applications.
In this investigation, we present the
primary and deformed textures of
white jadeite materials (including icy to
glassy jades) from Myanmar, attempt to
establish correlations between textural
features and jade qualities, and discuss
the gemmological applications and
implications.
Geological settingMyanma jadeitites occur within the N–S
striking Hpakan ophiolite complex which
is about 50 km long and 5–10 km wide,
situated in the east of the Indo-Myanmar
Range and north of the Central Myanmar
Basin. The ophiolites straddle a fault which
is possibly a branch of the north Sagaing
Fault (Figure 2). Geographically, the
Indo-Myanmar Range is flanked on the
east by the Central Myanmar Basin, and
the national border between Myanmar and
India generally follows the high points
of the Range. Geologically, along the
eastern boundary of the Range is a line
of discontinuous ophiolite and ophiolite-
derived blocks. In this terrain accumulation
and deformation of rocks have taken place
within a zone where oceanic crust of the
Indian plate has been subducted beneath
the Burmese plate with intra-oceanic
features (Shi et al., 2009). Based on ages
of zircon inclusions, this subduction
and formation of some jadeite probably
took place in Upper Jurassic times (Shi
et al., 2008). The Central Myanmar Basin
(16ºN–25ºN, 94ºE–97ºE), consists of low
land between the Indo-Myanmar Range
and the China-Myanmar high land. The
Sagaing fault is a major strike-slip dextral
or right-lateral continental fault that
extends over 1200 km and connects to the
Andaman spreading centre at its southern
end. It has been interpreted by some
authors as a plate boundary between India
and Indochina (LeDain et al., 1984) and
accommodated nearly 60 % of the relative
Figure 1: The glassy feitsui (green and colourless jadeite jades) from Myanmar. (a) A necklace of 15 exceptionally bright emerald green oval cabochons; (b) a ring with an imperial green oval cabochon; (c) a colourless bangle.
Jadeite jade from Myanmar: its texture and gemmological implications
a
c
b
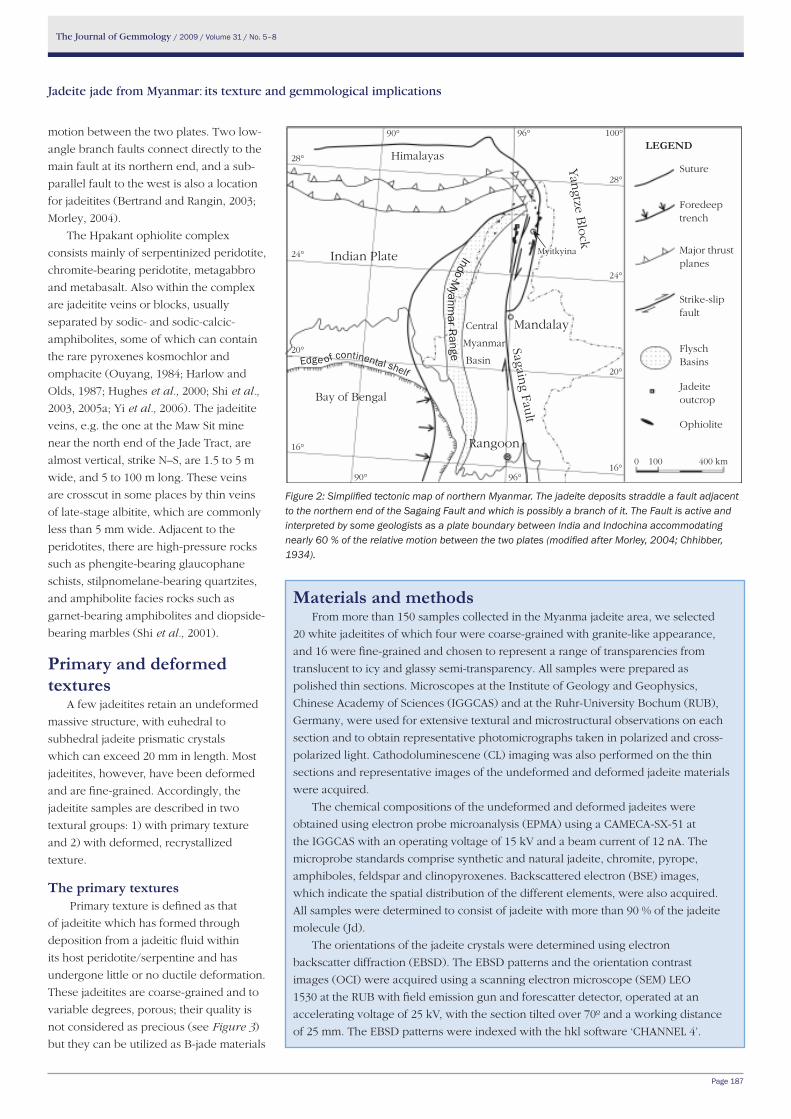
The Journal of Gemmology / 2009 / Volume 31 / No. 5–8
Page 187
motion between the two plates. Two low-
angle branch faults connect directly to the
main fault at its northern end, and a sub-
parallel fault to the west is also a location
for jadeitites (Bertrand and Rangin, 2003;
Morley, 2004).
The Hpakant ophiolite complex
consists mainly of serpentinized peridotite,
chromite-bearing peridotite, metagabbro
and metabasalt. Also within the complex
are jadeitite veins or blocks, usually
separated by sodic- and sodic-calcic-
amphibolites, some of which can contain
the rare pyroxenes kosmochlor and
omphacite (Ouyang, 1984; Harlow and
Olds, 1987; Hughes et al., 2000; Shi et al.,
2003, 2005a; Yi et al., 2006). The jadeitite
veins, e.g. the one at the Maw Sit mine
near the north end of the Jade Tract, are
almost vertical, strike N–S, are 1.5 to 5 m
wide, and 5 to 100 m long. These veins
are crosscut in some places by thin veins
of late-stage albitite, which are commonly
less than 5 mm wide. Adjacent to the
peridotites, there are high-pressure rocks
such as phengite-bearing glaucophane
schists, stilpnomelane-bearing quartzites,
and amphibolite facies rocks such as
garnet-bearing amphibolites and diopside-
bearing marbles (Shi et al., 2001).
Primary and deformed textures
A few jadeitites retain an undeformed
massive structure, with euhedral to
subhedral jadeite prismatic crystals
which can exceed 20 mm in length. Most
jadeitites, however, have been deformed
and are fine-grained. Accordingly, the
jadeitite samples are described in two
textural groups: 1) with primary texture
and 2) with deformed, recrystallized
texture.
the primary textures Primary texture is defined as that
of jadeitite which has formed through
deposition from a jadeitic fluid within
its host peridotite/serpentine and has
undergone little or no ductile deformation.
These jadeitites are coarse-grained and to
variable degrees, porous; their quality is
not considered as precious (see Figure 3)
but they can be utilized as B-jade materials
Materials and methodsFrom more than 150 samples collected in the Myanma jadeite area, we selected
20 white jadeitites of which four were coarse-grained with granite-like appearance,
and 16 were fine-grained and chosen to represent a range of transparencies from
translucent to icy and glassy semi-transparency. All samples were prepared as
polished thin sections. Microscopes at the Institute of Geology and Geophysics,
Chinese Academy of Sciences (IGGCAS) and at the Ruhr-University Bochum (RUB),
Germany, were used for extensive textural and microstructural observations on each
section and to obtain representative photomicrographs taken in polarized and cross-
polarized light. Cathodoluminescene (CL) imaging was also performed on the thin
sections and representative images of the undeformed and deformed jadeite materials
were acquired.
The chemical compositions of the undeformed and deformed jadeites were
obtained using electron probe microanalysis (EPMA) using a CAMECA-SX-51 at
the IGGCAS with an operating voltage of 15 kV and a beam current of 12 nA. The
microprobe standards comprise synthetic and natural jadeite, chromite, pyrope,
amphiboles, feldspar and clinopyroxenes. Backscattered electron (BSE) images,
which indicate the spatial distribution of the different elements, were also acquired.
All samples were determined to consist of jadeite with more than 90 % of the jadeite
molecule (Jd).
The orientations of the jadeite crystals were determined using electron
backscatter diffraction (EBSD). The EBSD patterns and the orientation contrast
images (OCI) were acquired using a scanning electron microscope (SEM) LEO
1530 at the RUB with field emission gun and forescatter detector, operated at an
accelerating voltage of 25 kV, with the section tilted over 70º and a working distance
of 25 mm. The EBSD patterns were indexed with the hkl software ‘CHANNEL 4’.
Figure 2: Simplified tectonic map of northern Myanmar. The jadeite deposits straddle a fault adjacent to the northern end of the Sagaing Fault and which is possibly a branch of it. The Fault is active and interpreted by some geologists as a plate boundary between India and Indochina accommodating nearly 60 % of the relative motion between the two plates (modified after Morley, 2004; Chhibber, 1934).
Jadeite jade from Myanmar: its texture and gemmological implications
Bay of Bengal
Suture
Foredeep trench
Major thrust planes
Strike-slip fault
Flysch Basins
Jadeite outcrop
Ophiolite
leGeND
Yangtze B
lock
Mandalay
Sagaing Fault
Rangoon
Central
Myanmar
Basin
Himalayas
Indian Plate
Edge of continental shelf
Indo-Myanm
ar Range
28°
24°
20°
16°
90° 96° 100°
28°
24°
20°
16°
90° 96°
0 100 400 km
Myitkyina
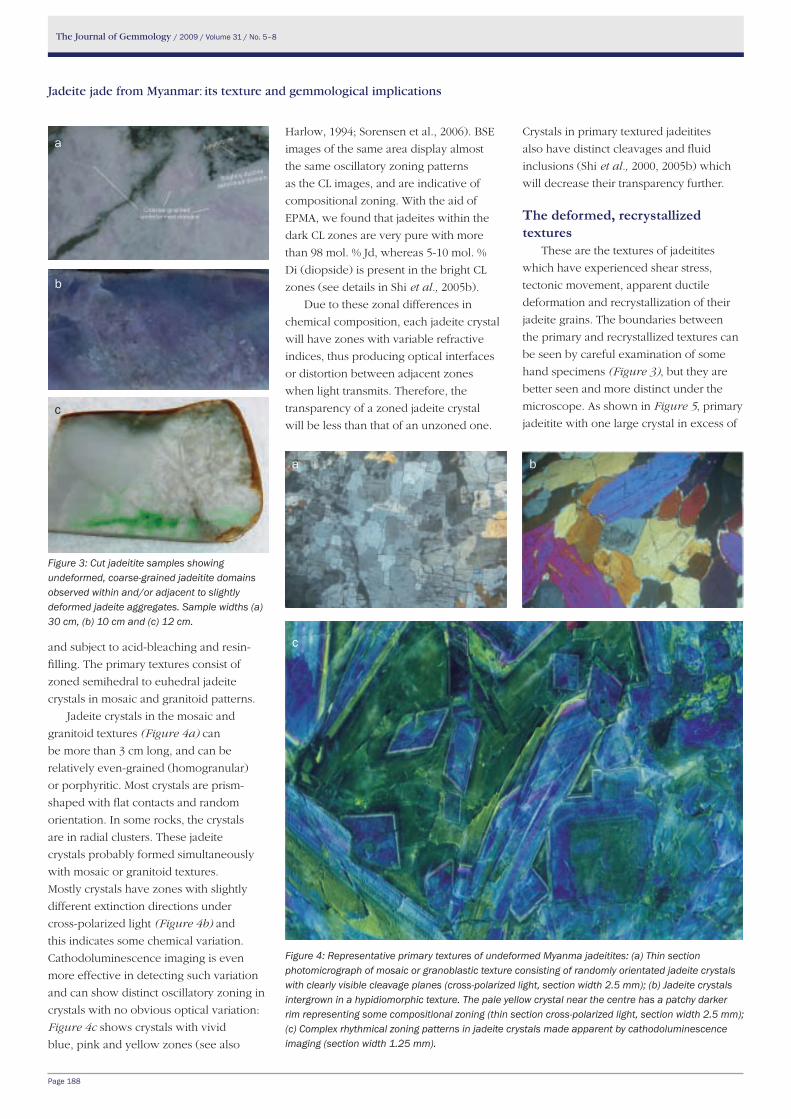
The Journal of Gemmology / 2009 / Volume 31 / No. 5–8
Page 188
and subject to acid-bleaching and resin-
filling. The primary textures consist of
zoned semihedral to euhedral jadeite
crystals in mosaic and granitoid patterns.
Jadeite crystals in the mosaic and
granitoid textures (Figure 4a) can
be more than 3 cm long, and can be
relatively even-grained (homogranular)
or porphyritic. Most crystals are prism-
shaped with flat contacts and random
orientation. In some rocks, the crystals
are in radial clusters. These jadeite
crystals probably formed simultaneously
with mosaic or granitoid textures.
Mostly crystals have zones with slightly
different extinction directions under
cross-polarized light (Figure 4b) and
this indicates some chemical variation.
Cathodoluminescence imaging is even
more effective in detecting such variation
and can show distinct oscillatory zoning in
crystals with no obvious optical variation:
Figure 4c shows crystals with vivid
blue, pink and yellow zones (see also
Harlow, 1994; Sorensen et al., 2006). BSE
images of the same area display almost
the same oscillatory zoning patterns
as the CL images, and are indicative of
compositional zoning. With the aid of
EPMA, we found that jadeites within the
dark CL zones are very pure with more
than 98 mol. % Jd, whereas 5-10 mol. %
Di (diopside) is present in the bright CL
zones (see details in Shi et al., 2005b).
Due to these zonal differences in
chemical composition, each jadeite crystal
will have zones with variable refractive
indices, thus producing optical interfaces
or distortion between adjacent zones
when light transmits. Therefore, the
transparency of a zoned jadeite crystal
will be less than that of an unzoned one.
Crystals in primary textured jadeitites
also have distinct cleavages and fluid
inclusions (Shi et al., 2000, 2005b) which
will decrease their transparency further.
the deformed, recrystallized textures
These are the textures of jadeitites
which have experienced shear stress,
tectonic movement, apparent ductile
deformation and recrystallization of their
jadeite grains. The boundaries between
the primary and recrystallized textures can
be seen by careful examination of some
hand specimens (Figure 3), but they are
better seen and more distinct under the
microscope. As shown in Figure 5, primary
jadeitite with one large crystal in excess of
Figure 4: Representative primary textures of undeformed Myanma jadeitites: (a) Thin section photomicrograph of mosaic or granoblastic texture consisting of randomly orientated jadeite crystals with clearly visible cleavage planes (cross-polarized light, section width 2.5 mm); (b) Jadeite crystals intergrown in a hypidiomorphic texture. The pale yellow crystal near the centre has a patchy darker rim representing some compositional zoning (thin section cross-polarized light, section width 2.5 mm); (c) Complex rhythmical zoning patterns in jadeite crystals made apparent by cathodoluminescence imaging (section width 1.25 mm).
c
ba
Jadeite jade from Myanmar: its texture and gemmological implications
Figure 3: Cut jadeitite samples showing undeformed, coarse-grained jadeitite domains observed within and/or adjacent to slightly deformed jadeite aggregates. Sample widths (a) 30 cm, (b) 10 cm and (c) 12 cm.
a
c
b
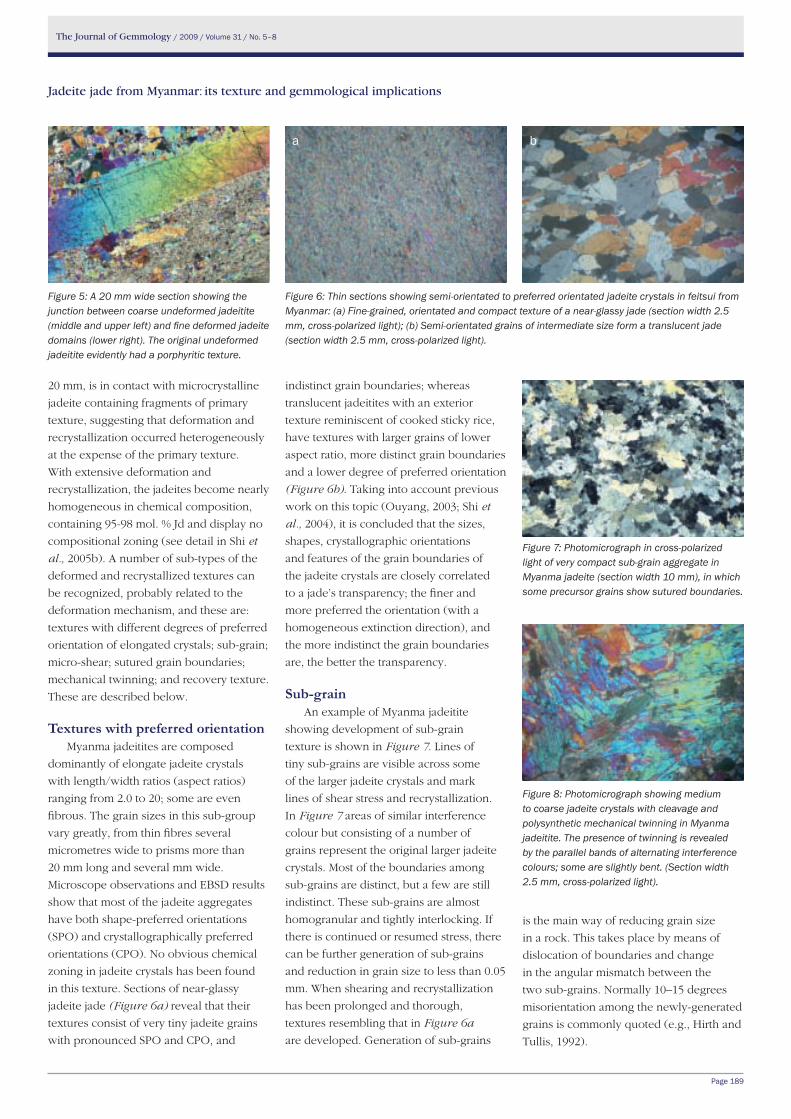
The Journal of Gemmology / 2009 / Volume 31 / No. 5–8
Page 189
20 mm, is in contact with microcrystalline
jadeite containing fragments of primary
texture, suggesting that deformation and
recrystallization occurred heterogeneously
at the expense of the primary texture.
With extensive deformation and
recrystallization, the jadeites become nearly
homogeneous in chemical composition,
containing 95-98 mol. % Jd and display no
compositional zoning (see detail in Shi et
al., 2005b). A number of sub-types of the
deformed and recrystallized textures can
be recognized, probably related to the
deformation mechanism, and these are:
textures with different degrees of preferred
orientation of elongated crystals; sub-grain;
micro-shear; sutured grain boundaries;
mechanical twinning; and recovery texture.
These are described below.
textures with preferred orientationMyanma jadeitites are composed
dominantly of elongate jadeite crystals
with length/width ratios (aspect ratios)
ranging from 2.0 to 20; some are even
fibrous. The grain sizes in this sub-group
vary greatly, from thin fibres several
micrometres wide to prisms more than
20 mm long and several mm wide.
Microscope observations and EBSD results
show that most of the jadeite aggregates
have both shape-preferred orientations
(SPO) and crystallographically preferred
orientations (CPO). No obvious chemical
zoning in jadeite crystals has been found
in this texture. Sections of near-glassy
jadeite jade (Figure 6a) reveal that their
textures consist of very tiny jadeite grains
with pronounced SPO and CPO, and
indistinct grain boundaries; whereas
translucent jadeitites with an exterior
texture reminiscent of cooked sticky rice,
have textures with larger grains of lower
aspect ratio, more distinct grain boundaries
and a lower degree of preferred orientation
(Figure 6b). Taking into account previous
work on this topic (Ouyang, 2003; Shi et
al., 2004), it is concluded that the sizes,
shapes, crystallographic orientations
and features of the grain boundaries of
the jadeite crystals are closely correlated
to a jade’s transparency; the finer and
more preferred the orientation (with a
homogeneous extinction direction), and
the more indistinct the grain boundaries
are, the better the transparency.
Sub-grain An example of Myanma jadeitite
showing development of sub-grain
texture is shown in Figure 7. Lines of
tiny sub-grains are visible across some
of the larger jadeite crystals and mark
lines of shear stress and recrystallization.
In Figure 7 areas of similar interference
colour but consisting of a number of
grains represent the original larger jadeite
crystals. Most of the boundaries among
sub-grains are distinct, but a few are still
indistinct. These sub-grains are almost
homogranular and tightly interlocking. If
there is continued or resumed stress, there
can be further generation of sub-grains
and reduction in grain size to less than 0.05
mm. When shearing and recrystallization
has been prolonged and thorough,
textures resembling that in Figure 6a
are developed. Generation of sub-grains
is the main way of reducing grain size
in a rock. This takes place by means of
dislocation of boundaries and change
in the angular mismatch between the
two sub-grains. Normally 10–15 degrees
misorientation among the newly-generated
grains is commonly quoted (e.g., Hirth and
Tullis, 1992).
Figure 5: A 20 mm wide section showing the junction between coarse undeformed jadeitite (middle and upper left) and fine deformed jadeite domains (lower right). The original undeformed jadeitite evidently had a porphyritic texture.
Figure 6: Thin sections showing semi-orientated to preferred orientated jadeite crystals in feitsui from Myanmar: (a) Fine-grained, orientated and compact texture of a near-glassy jade (section width 2.5 mm, cross-polarized light); (b) Semi-orientated grains of intermediate size form a translucent jade (section width 2.5 mm, cross-polarized light).
Figure 7: Photomicrograph in cross-polarized light of very compact sub-grain aggregate in Myanma jadeite (section width 10 mm), in which some precursor grains show sutured boundaries.
Figure 8: Photomicrograph showing medium to coarse jadeite crystals with cleavage and polysynthetic mechanical twinning in Myanma jadeitite. The presence of twinning is revealed by the parallel bands of alternating interference colours; some are slightly bent. (Section width 2.5 mm, cross-polarized light).
ba
Jadeite jade from Myanmar: its texture and gemmological implications
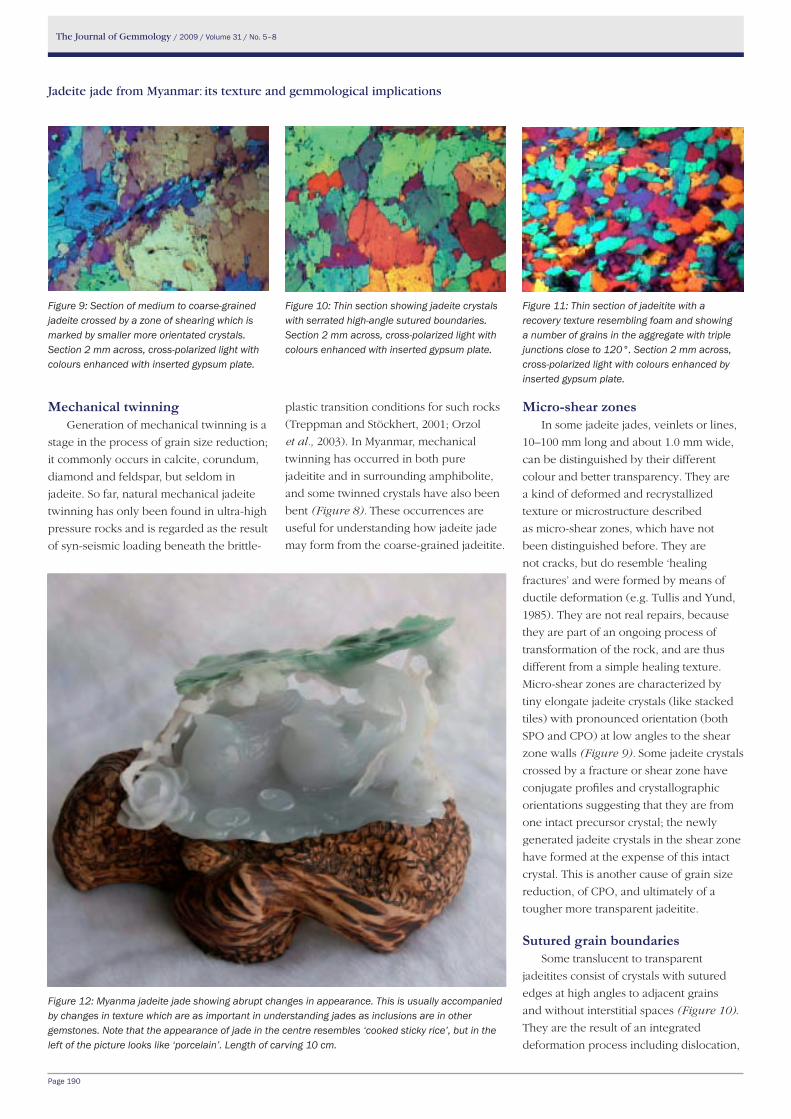
The Journal of Gemmology / 2009 / Volume 31 / No. 5–8
Page 190
Mechanical twinning Generation of mechanical twinning is a
stage in the process of grain size reduction;
it commonly occurs in calcite, corundum,
diamond and feldspar, but seldom in
jadeite. So far, natural mechanical jadeite
twinning has only been found in ultra-high
pressure rocks and is regarded as the result
of syn-seismic loading beneath the brittle-
plastic transition conditions for such rocks
(Treppman and Stöckhert, 2001; Orzol
et al., 2003). In Myanmar, mechanical
twinning has occurred in both pure
jadeitite and in surrounding amphibolite,
and some twinned crystals have also been
bent (Figure 8). These occurrences are
useful for understanding how jadeite jade
may form from the coarse-grained jadeitite.
Figure 10: Thin section showing jadeite crystals with serrated high-angle sutured boundaries. Section 2 mm across, cross-polarized light with colours enhanced with inserted gypsum plate.
Figure 11: Thin section of jadeitite with a recovery texture resembling foam and showing a number of grains in the aggregate with triple junctions close to 120°. Section 2 mm across, cross-polarized light with colours enhanced by inserted gypsum plate.
Figure 12: Myanma jadeite jade showing abrupt changes in appearance. This is usually accompanied by changes in texture which are as important in understanding jades as inclusions are in other gemstones. Note that the appearance of jade in the centre resembles ‘cooked sticky rice’, but in the left of the picture looks like ‘porcelain’. Length of carving 10 cm.
Jadeite jade from Myanmar: its texture and gemmological implications
Figure 9: Section of medium to coarse-grained jadeite crossed by a zone of shearing which is marked by smaller more orientated crystals. Section 2 mm across, cross-polarized light with colours enhanced with inserted gypsum plate.
Micro-shear zones In some jadeite jades, veinlets or lines,
10–100 mm long and about 1.0 mm wide,
can be distinguished by their different
colour and better transparency. They are
a kind of deformed and recrystallized
texture or microstructure described
as micro-shear zones, which have not
been distinguished before. They are
not cracks, but do resemble ‘healing
fractures’ and were formed by means of
ductile deformation (e.g. Tullis and Yund,
1985). They are not real repairs, because
they are part of an ongoing process of
transformation of the rock, and are thus
different from a simple healing texture.
Micro-shear zones are characterized by
tiny elongate jadeite crystals (like stacked
tiles) with pronounced orientation (both
SPO and CPO) at low angles to the shear
zone walls (Figure 9). Some jadeite crystals
crossed by a fracture or shear zone have
conjugate profiles and crystallographic
orientations suggesting that they are from
one intact precursor crystal; the newly
generated jadeite crystals in the shear zone
have formed at the expense of this intact
crystal. This is another cause of grain size
reduction, of CPO, and ultimately of a
tougher more transparent jadeitite.
Sutured grain boundaries Some translucent to transparent
jadeitites consist of crystals with sutured
edges at high angles to adjacent grains
and without interstitial spaces (Figure 10).
They are the result of an integrated
deformation process including dislocation,
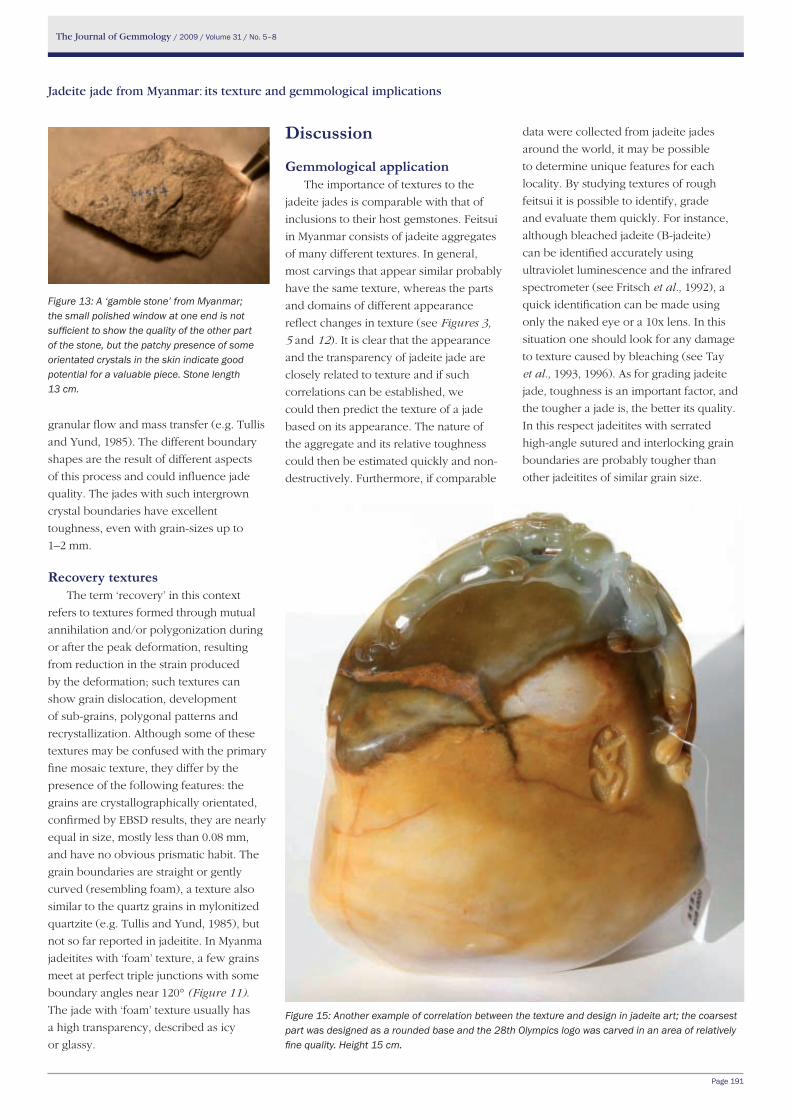
The Journal of Gemmology / 2009 / Volume 31 / No. 5–8
Page 191
granular flow and mass transfer (e.g. Tullis
and Yund, 1985). The different boundary
shapes are the result of different aspects
of this process and could influence jade
quality. The jades with such intergrown
crystal boundaries have excellent
toughness, even with grain-sizes up to
1–2 mm.
Recovery texturesThe term ‘recovery’ in this context
refers to textures formed through mutual
annihilation and/or polygonization during
or after the peak deformation, resulting
from reduction in the strain produced
by the deformation; such textures can
show grain dislocation, development
of sub-grains, polygonal patterns and
recrystallization. Although some of these
textures may be confused with the primary
fine mosaic texture, they differ by the
presence of the following features: the
grains are crystallographically orientated,
confirmed by EBSD results, they are nearly
equal in size, mostly less than 0.08 mm,
and have no obvious prismatic habit. The
grain boundaries are straight or gently
curved (resembling foam), a texture also
similar to the quartz grains in mylonitized
quartzite (e.g. Tullis and Yund, 1985), but
not so far reported in jadeitite. In Myanma
jadeitites with ‘foam’ texture, a few grains
meet at perfect triple junctions with some
boundary angles near 120° (Figure 11).
The jade with ‘foam’ texture usually has
a high transparency, described as icy
or glassy.
Discussion
Gemmological applicationThe importance of textures to the
jadeite jades is comparable with that of
inclusions to their host gemstones. Feitsui
in Myanmar consists of jadeite aggregates
of many different textures. In general,
most carvings that appear similar probably
have the same texture, whereas the parts
and domains of different appearance
reflect changes in texture (see Figures 3,
5 and 12). It is clear that the appearance
and the transparency of jadeite jade are
closely related to texture and if such
correlations can be established, we
could then predict the texture of a jade
based on its appearance. The nature of
the aggregate and its relative toughness
could then be estimated quickly and non-
destructively. Furthermore, if comparable
Figure 13: A ‘gamble stone’ from Myanmar; the small polished window at one end is not sufficient to show the quality of the other part of the stone, but the patchy presence of some orientated crystals in the skin indicate good potential for a valuable piece. Stone length 13 cm.
Figure 15: Another example of correlation between the texture and design in jadeite art; the coarsest part was designed as a rounded base and the 28th Olympics logo was carved in an area of relatively fine quality. Height 15 cm.
Jadeite jade from Myanmar: its texture and gemmological implications
data were collected from jadeite jades
around the world, it may be possible
to determine unique features for each
locality. By studying textures of rough
feitsui it is possible to identify, grade
and evaluate them quickly. For instance,
although bleached jadeite (B-jadeite)
can be identified accurately using
ultraviolet luminescence and the infrared
spectrometer (see Fritsch et al., 1992), a
quick identification can be made using
only the naked eye or a 10x lens. In this
situation one should look for any damage
to texture caused by bleaching (see Tay
et al., 1993, 1996). As for grading jadeite
jade, toughness is an important factor, and
the tougher a jade is, the better its quality.
In this respect jadeitites with serrated
high-angle sutured and interlocking grain
boundaries are probably tougher than
other jadeitites of similar grain size.
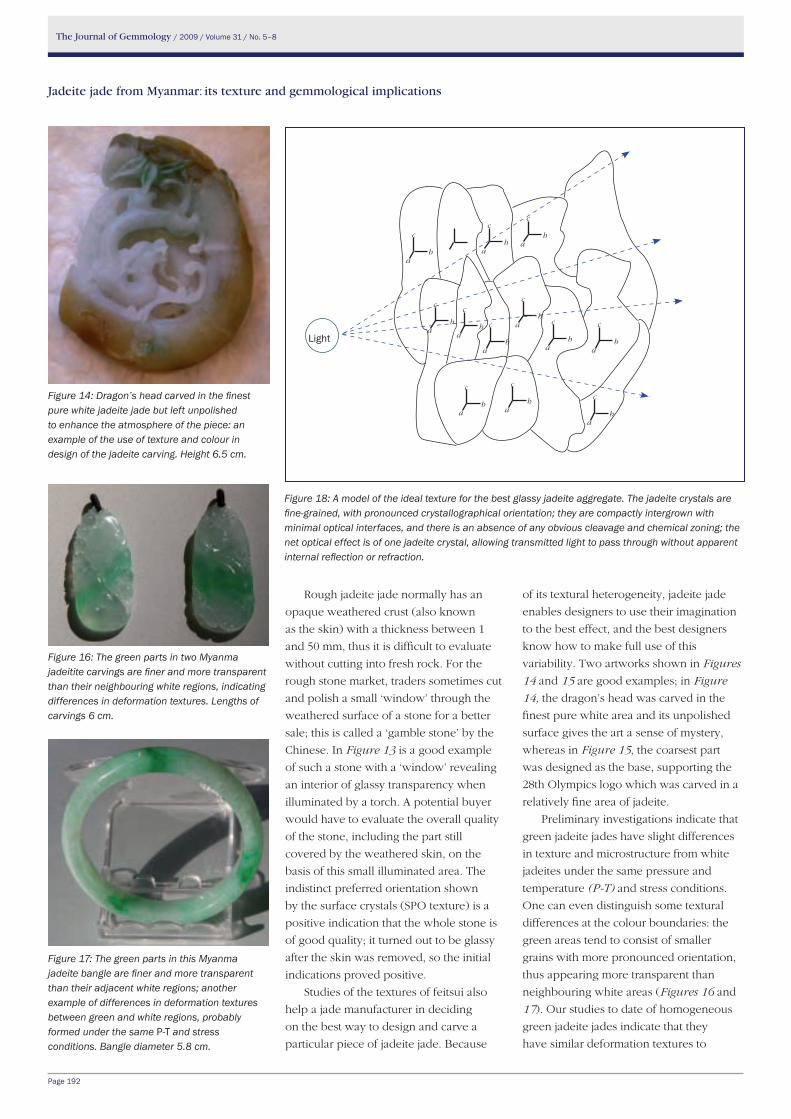
The Journal of Gemmology / 2009 / Volume 31 / No. 5–8
Page 192
Figure 18: A model of the ideal texture for the best glassy jadeite aggregate. The jadeite crystals are fine-grained, with pronounced crystallographical orientation; they are compactly intergrown with minimal optical interfaces, and there is an absence of any obvious cleavage and chemical zoning; the net optical effect is of one jadeite crystal, allowing transmitted light to pass through without apparent internal reflection or refraction.
Rough jadeite jade normally has an
opaque weathered crust (also known
as the skin) with a thickness between 1
and 50 mm, thus it is difficult to evaluate
without cutting into fresh rock. For the
rough stone market, traders sometimes cut
and polish a small ‘window’ through the
weathered surface of a stone for a better
sale; this is called a ‘gamble stone’ by the
Chinese. In Figure 13 is a good example
of such a stone with a ‘window’ revealing
an interior of glassy transparency when
illuminated by a torch. A potential buyer
would have to evaluate the overall quality
of the stone, including the part still
covered by the weathered skin, on the
basis of this small illuminated area. The
indistinct preferred orientation shown
by the surface crystals (SPO texture) is a
positive indication that the whole stone is
of good quality; it turned out to be glassy
after the skin was removed, so the initial
indications proved positive.
Studies of the textures of feitsui also
help a jade manufacturer in deciding
on the best way to design and carve a
particular piece of jadeite jade. Because
of its textural heterogeneity, jadeite jade
enables designers to use their imagination
to the best effect, and the best designers
know how to make full use of this
variability. Two artworks shown in Figures
14 and 15 are good examples; in Figure
14, the dragon’s head was carved in the
finest pure white area and its unpolished
surface gives the art a sense of mystery,
whereas in Figure 15, the coarsest part
was designed as the base, supporting the
28th Olympics logo which was carved in a
relatively fine area of jadeite.
Preliminary investigations indicate that
green jadeite jades have slight differences
in texture and microstructure from white
jadeites under the same pressure and
temperature (P-T) and stress conditions.
One can even distinguish some textural
differences at the colour boundaries: the
green areas tend to consist of smaller
grains with more pronounced orientation,
thus appearing more transparent than
neighbouring white areas (Figures 16 and
17). Our studies to date of homogeneous
green jadeite jades indicate that they
have similar deformation textures to
Jadeite jade from Myanmar: its texture and gemmological implications
Figure 14: Dragon’s head carved in the finest pure white jadeite jade but left unpolished to enhance the atmosphere of the piece: an example of the use of texture and colour in design of the jadeite carving. Height 6.5 cm.
Figure 16: The green parts in two Myanma jadeitite carvings are finer and more transparent than their neighbouring white regions, indicating differences in deformation textures. Lengths of carvings 6 cm.
Figure 17: The green parts in this Myanma jadeite bangle are finer and more transparent than their adjacent white regions; another example of differences in deformation textures between green and white regions, probably formed under the same P-T and stress conditions. Bangle diameter 5.8 cm.
ab
c
ab
c
ab
cab
c
ab
c
ab
c
ab
c
ab
c
ab
c
ab
c
ab
c
ab
c
Light
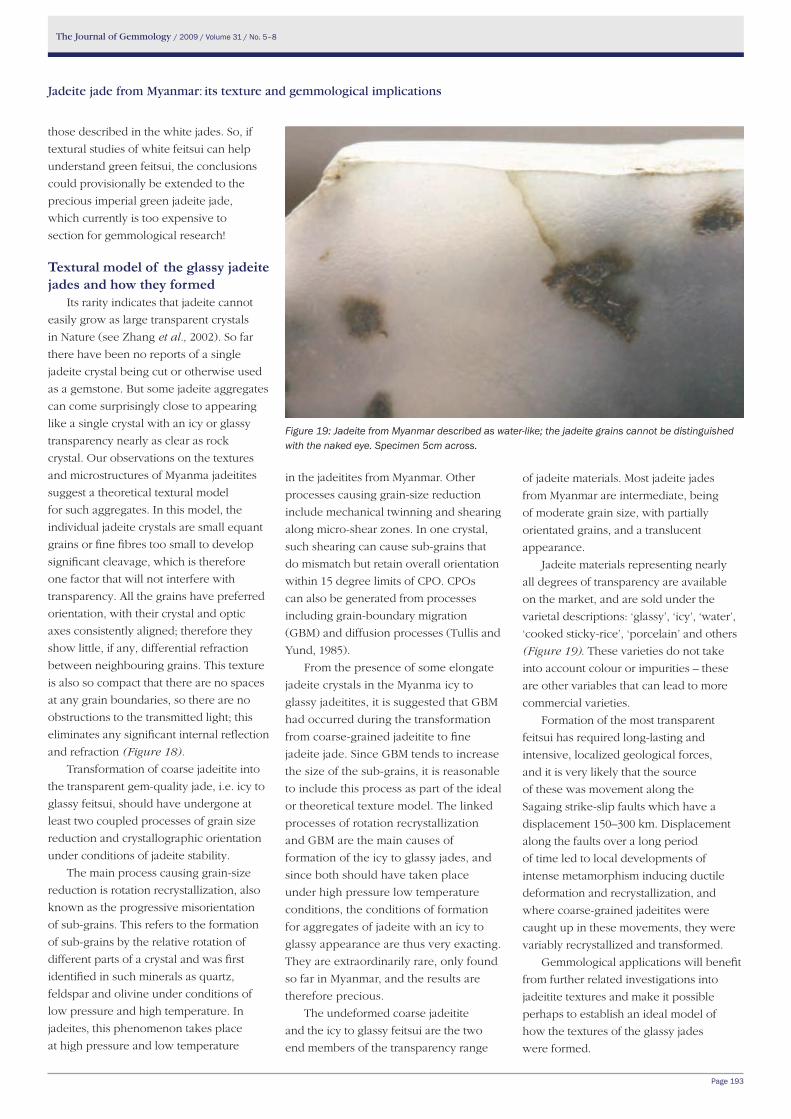
The Journal of Gemmology / 2009 / Volume 31 / No. 5–8
Page 193
those described in the white jades. So, if
textural studies of white feitsui can help
understand green feitsui, the conclusions
could provisionally be extended to the
precious imperial green jadeite jade,
which currently is too expensive to
section for gemmological research!
textural model of the glassy jadeite jades and how they formed
Its rarity indicates that jadeite cannot
easily grow as large transparent crystals
in Nature (see Zhang et al., 2002). So far
there have been no reports of a single
jadeite crystal being cut or otherwise used
as a gemstone. But some jadeite aggregates
can come surprisingly close to appearing
like a single crystal with an icy or glassy
transparency nearly as clear as rock
crystal. Our observations on the textures
and microstructures of Myanma jadeitites
suggest a theoretical textural model
for such aggregates. In this model, the
individual jadeite crystals are small equant
grains or fine fibres too small to develop
significant cleavage, which is therefore
one factor that will not interfere with
transparency. All the grains have preferred
orientation, with their crystal and optic
axes consistently aligned; therefore they
show little, if any, differential refraction
between neighbouring grains. This texture
is also so compact that there are no spaces
at any grain boundaries, so there are no
obstructions to the transmitted light; this
eliminates any significant internal reflection
and refraction (Figure 18).
Transformation of coarse jadeitite into
the transparent gem-quality jade, i.e. icy to
glassy feitsui, should have undergone at
least two coupled processes of grain size
reduction and crystallographic orientation
under conditions of jadeite stability.
The main process causing grain-size
reduction is rotation recrystallization, also
known as the progressive misorientation
of sub-grains. This refers to the formation
of sub-grains by the relative rotation of
different parts of a crystal and was first
identified in such minerals as quartz,
feldspar and olivine under conditions of
low pressure and high temperature. In
jadeites, this phenomenon takes place
at high pressure and low temperature
in the jadeitites from Myanmar. Other
processes causing grain-size reduction
include mechanical twinning and shearing
along micro-shear zones. In one crystal,
such shearing can cause sub-grains that
do mismatch but retain overall orientation
within 15 degree limits of CPO. CPOs
can also be generated from processes
including grain-boundary migration
(GBM) and diffusion processes (Tullis and
Yund, 1985).
From the presence of some elongate
jadeite crystals in the Myanma icy to
glassy jadeitites, it is suggested that GBM
had occurred during the transformation
from coarse-grained jadeitite to fine
jadeite jade. Since GBM tends to increase
the size of the sub-grains, it is reasonable
to include this process as part of the ideal
or theoretical texture model. The linked
processes of rotation recrystallization
and GBM are the main causes of
formation of the icy to glassy jades, and
since both should have taken place
under high pressure low temperature
conditions, the conditions of formation
for aggregates of jadeite with an icy to
glassy appearance are thus very exacting.
They are extraordinarily rare, only found
so far in Myanmar, and the results are
therefore precious.
The undeformed coarse jadeitite
and the icy to glassy feitsui are the two
end members of the transparency range
of jadeite materials. Most jadeite jades
from Myanmar are intermediate, being
of moderate grain size, with partially
orientated grains, and a translucent
appearance.
Jadeite materials representing nearly
all degrees of transparency are available
on the market, and are sold under the
varietal descriptions: ‘glassy’, ‘icy’, ‘water’,
‘cooked sticky-rice’, ‘porcelain’ and others
(Figure 19). These varieties do not take
into account colour or impurities – these
are other variables that can lead to more
commercial varieties.
Formation of the most transparent
feitsui has required long-lasting and
intensive, localized geological forces,
and it is very likely that the source
of these was movement along the
Sagaing strike-slip faults which have a
displacement 150–300 km. Displacement
along the faults over a long period
of time led to local developments of
intense metamorphism inducing ductile
deformation and recrystallization, and
where coarse-grained jadeitites were
caught up in these movements, they were
variably recrystallized and transformed.
Gemmological applications will benefit
from further related investigations into
jadeitite textures and make it possible
perhaps to establish an ideal model of
how the textures of the glassy jades
were formed.
Figure 19: Jadeite from Myanmar described as water-like; the jadeite grains cannot be distinguished with the naked eye. Specimen 5cm across.
Jadeite jade from Myanmar: its texture and gemmological implications
The Journal of Gemmology / 2009 / Volume 31 / No. 5–8
Page 194
ConclusionsJadeitites from Myanmar can be
considered in terms of two groups of
textures: primary, and deformed and
recrystallized. Those with primary textures
are coarse-grained, and have mosaic,
granitoid or radial textures consisting
of chemically zoned jadeite crystals;
they are porous to some degree, are
not transparent, and are not therefore
considered as being of gem quality.
The jadeitites which are deformed and
recrystallized developed at the expense
of primary textures, and are intermediate
to fine-grained, with semi-orientated
to preferred orientated crystals, some
mechanically twinned. They may also
contain micro-shear zones, sub-grains,
serrated high-angle sutured grain
boundaries, and ‘foam’ textures. These
rocks are compact, tough and translucent
to transparent, and have the most potential
as gems.
One model for the icy and glassy
jadeite jades might include the following
parameters: the crystals are very small
and compact with preferred orientation,
they lack obvious chemical zones and
cleavages, and the whole rock resembles
a single crystal optically. Most jade in the
gem market is classed as glassy or coarse.
These categories are further subdivided on
the basis of three variables: compactness,
orientation and grain size, so producing a
large number of jadeite varieties.
Studies of the textures have
gemmological applications not only in
identifying and grading the rough and
fashioned jadeite jades, but also in their
design and manufacture. Moreover, such
studies help understanding of the textural
model of the icy and glassy jadeite jades,
the textures and microstructures of green
and other coloured materials, and how
they are formed.
The movements of the Sagaing strike-
slip faults, which the Myanma jadeite
deposits straddle, are inferred as the main
cause of the formation of the feitsui.
Acknowledgements This investigation is financially
supported by Program for the New Century
Excellent Talents in China (NCET-07-0771)
and the National Science Foundation
of China (40672046). We thank Prof.
B. Stöckhert for assistance with EBSD
analyses. Constructive comments by Dr B.
Laurs helped to improve the manuscript.
ReferencesBertrand, G., and Rangin, C., 2003.
Tectonics of the western margin of
the Shan plateau (central Myanmar):
implication for the India–Indochina
oblique convergence since the
Oligocene. Journal of Asian Earth
Sciences, 21, 1139–57
Chhibber, H.L., 1934 The mineral
resources of Burma. Macmillan,
London, 320 pp
Damour, M.A., 1881. Nouvelles analyses
sur la jadeite et sur quelques roches
sodifères. Annales de Chimie et de
Physique, 5th ser., 24, 136–48
Fritsch, E., Wu S.T., Moses, T., McClure,
S.F., and Moon, M., 1992. Identification
of bleached and polymer impregnated
jadeite. Gems & Gemology, 28, 176–87
Gübelin, E.J., 1965a. Maw-sit-sit proves to
be jade-albite. Journal of Gemmology,
9, 372–9
Gübelin, E.J., 1965b. Maw-sit-sit: A new
decorative gemstone from Burma.
Gems & Gemology, 11, 227–38
Harder, H., 1995. Trace elements as
colouring agents in jadeites. Journal of
Gemmology, 24, 508–11
Harlow, G.E., and Olds, E.P., 1987.
Observations on terrestrial ureyite
and ureyitic pyroxene. American
Mineralogist, 72, 126–36
Harlow, G.E., 1994. Jadeitites, albitites
and related rocks from the Motagua
fault zone, Guatemala. Journal of
Metamorphic Geology, 12, 49–68
Harlow, G.E., and Sorensen, S.S., 2005.
Jade nephrite and jadeitite and
serpentinite: metasomatic connections.
International Geology Review,
47, 113–46
Hirth, G., Tullis, J., 1992. Dislocation creep
regimes in quartz aggregates. Journal
of Structural Geology, 14, 145–59
Hughes, R.W., Galibert, O., Bosshart, G.,
Ward, F., Oo, T., Smith, M., Tay, T.S.,
and Harlow, G.E., 2000. Burmese jade:
the inscrutable gem. Gems & Gemology,
36(1), 2–26
Johnson, C.A., and Harlow, G.E., 1999.
Guatemala jadeitites and albitites
were formed by deuterium-rich
serpentinizing fluids deep within
a subduction-channel. Geology,
27, 629–32
LeDain, A.Y., Tapponnier, P., and Molnar,
P., 1984. Active faulting and tectonics
of Burma and surrounding regions.
Journal of Geophysical Research,
89, 453–72
Morley, C.K., 2004. Nested strike-slip
duplexes, and other evidence for Late
Cretaceous- Palaeogene transpressional
tectonics before and during India–
Eurasia collision, in Thailand, Myanmar
and Malaysia. Journal of the Geological
Society, 161, 799–812
Nyan Thin, U., 2002. Myanmar jade.
Mandalay Gem Association, Myanmar,
149 pp
Orzol, J., Trepmann, C., Stöckhert, B., and
Shi, G.H., 2003. Critical shear stress for
mechanical twinning of jadeite — an
experimental study. Tectonophysics,
372, 135–45
Ouyang, C.M., 1984. A terrestrial source
of ureyite. American Mineralogist,
69, 1180–3
Ouyang, C.M., 2000. Texture types of
jadeite jade and its genetic implications.
Journal of Gems and Gemmology
(in Chinese), 2(2), 1–5
Ouyang, C.M., 2003. Jadeite jade: a
stone and a culture. The Hong Kong
Institute of Gemmology, Hong Kong.
184 pp
Shi, G.H., Cui, W.Y., Wang, C.Q., and
Zhang, W.H., 2000. The fluid inclusions
in jadeitite from Pharkant area,
Myanmar. Chinese Science Bulletin,
45, 1896–900
Shi, G.H., Cui, W.Y., Liu, J., and Yu, H.X.,
2001. The petrology of jadeite-bearing
serpentinized peridotite and its country
rocks from Northwestern Myanmar
(Burma). Acta Petrologica Sinica,
17, 483–90
Shi, G.H., Cui, W.Y., Tropper, P., Wang,
C.Q., Shu, G.M., and Yu, H.X., 2003.
The petrology of a complex sodic and
sodic–calcic amphibole association and
Jadeite jade from Myanmar: its texture and gemmological implications
The Journal of Gemmology / 2009 / Volume 31 / No. 5–8
Page 195
web listShi, G.H., Jiang, N., Liu, Y., Wang, X.,
Zhang, Z.Y., and Xu, Y. J., 2009. Zircon
Hf isotope signature of the depleted
mantle in the Myanmar jadeitite:
implications for Mesozoic intra-oceanic
subduction between the Eastern Indian
Plate and the Burmese Platelet. Lithos,
doi: 10.1016/j.lithos.2009.03.011
its implications for the metasomatic
processes in the jadeitite area in
northwestern Myanmar, formerly
Burma. Contributions to Mineralogy
and Petrology, 145, 355–76
Shi, G.H., and Cui, W.Y., 2004. Textures
and microstructures of the Myanmar
jadeitite: implications for formation of
jadeitic Feits’ui. Journal of Gems and
Gemmology (in Chinese), 6(3), 8–11
Shi, G.H. et al., 2009. See Web list
Shi, G.H., Stöckhert, B., and Cui, W.Y.,
2005a. Kosmochlor and chromian
jadeite aggregates from Myanmar area.
Mineralogical Magazine, 69, 1059–75
Shi, G.H., Tropper, P., Cui, W.Y., Tian, J.,
and Wang, C.Q., 2005b. Methane (CH4)-
bearing fluid inclusions in Myanmar
jadeites. Geochemical Journal,
39, 503–16
Shi, G.H., Cui, W.Y., Cao, S.M., Jiang, N.,
Jian, P., Liu, D.Y., Miao, L.C., and Chu,
B.B., 2008. Ion microprobe zircon U-Pb
age and geochemistry of the Myanmar
jadeitite. Journal of Geological Society,
165, 221–34
Sorensen, S., Harlow, G.E., and Rumble III,
D., 2006. The origin of jadeitite-forming
subduction-zone fluids: CL-guided
SIMS oxygen-isotope and trace-element
evidence. American Mineralogist,
91, 979–96
Tay, T.S., Liew, S.P., and Puah, C.M., 1996.
Scanning electron microscope studies
on bleaching jadeite. Australian
Gemmol., 19(7), 310–4
Tay, T.S., Paul, S., and Puah, C.M., 1993.
SEM studies of bleached and polymer-
impregnated jadeite. Australian
Gemmol., 18(8), 257–61
Trepmann, C., and Stöckhert, B., 2001.
Mechanical twinning of jadeite: an
indication of synseismic loading
beneath the brittle-plastic transition.
International Journal of Earth
Sciences, 90, 4–14
Tullis, J., and Yund, R.A., 1985. Dynamic
recrystallization of feldspar: A
mechanism for ductile shear zone
formation. Geology, 13, 238–41
the AuthorsProfessor Dr Guanghai Shi Laboratory Director at the School of Gemology, China University of Geosciences,
Beijing 100083. China. email [email protected]
Miss Xia wang and Miss Bingbing Chu
Postgraduates at the China University of Geosciences, Beijing 100083. China.
Professor wenyuan Cui School of Space and Earth Sciences, Peking University, Beijing 100871, China.
Win Htein and Aye Myo Naing, 1994.
Mineral and chemical composition of
jadeite jade of Myanmar. Journal of
Gemmology, 24, 269–76
Win Htein and Aye Myo Naing, 1995.
Studies on kosmochlor jadeite and
associated minerals in jade of Myanmar.
Journal of Gemmology, 24, 315–20
Yi, X., Shi, G.H., and He, M.Y., 2006.
Jadeitized omphacitite from Myanmar
jadeite area. Acta Petrologica Sinica,
22, 971–6
Zhang, L.F., Ellis, D.J., Williams, S., and
Jiang, W.B., 2002. Ultra-high pressure
metamorphism in western Tianshan,
China: Part II. Evidence from magnesite
in eclogite. American Mineralogist,
87, 861–6
All photos and photomicrographs by G.H.
Shi.
Jadeite jade from Myanmar: its texture and gemmological implications
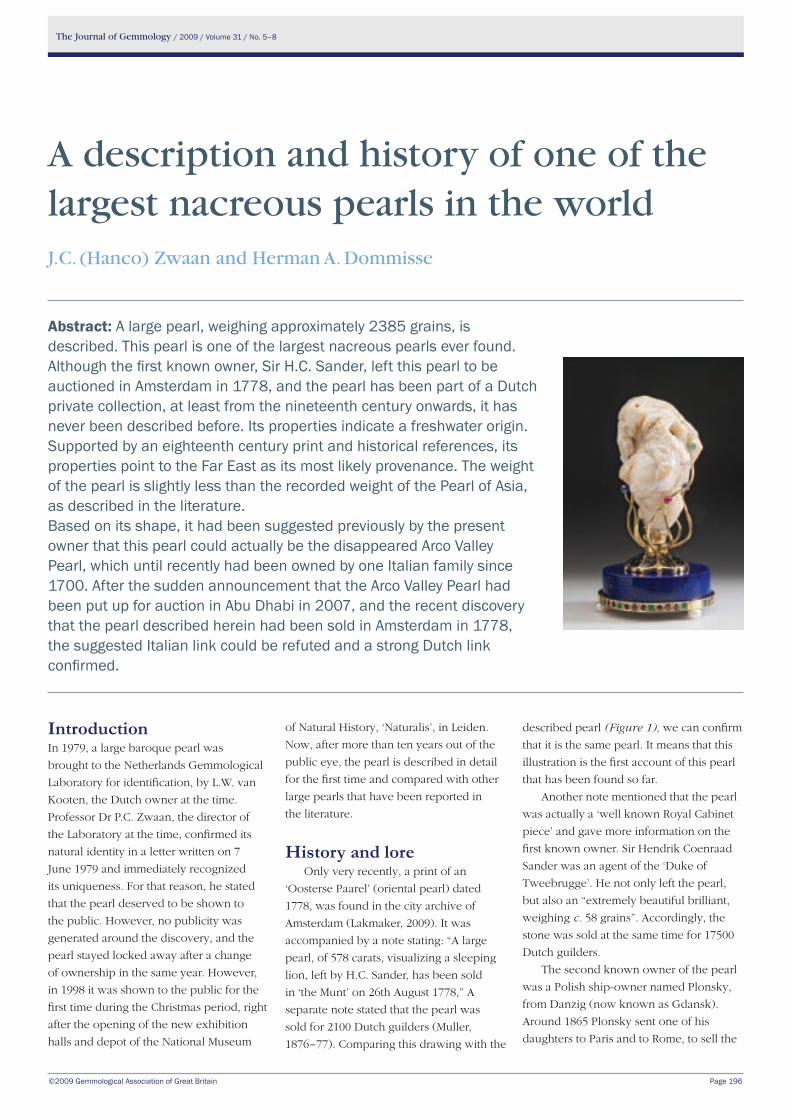
The Journal of Gemmology / 2009 / Volume 31 / No. 5–8
©2009 Gemmological Association of Great Britain Page 196
described pearl (Figure 1), we can confirm
that it is the same pearl. It means that this
illustration is the first account of this pearl
that has been found so far.
Another note mentioned that the pearl
was actually a ‘well known Royal Cabinet
piece’ and gave more information on the
first known owner. Sir Hendrik Coenraad
Sander was an agent of the ‘Duke of
Tweebrugge’. He not only left the pearl,
but also an “extremely beautiful brilliant,
weighing c. 58 grains”. Accordingly, the
stone was sold at the same time for 17500
Dutch guilders.
The second known owner of the pearl
was a Polish ship-owner named Plonsky,
from Danzig (now known as Gdansk).
Around 1865 Plonsky sent one of his
daughters to Paris and to Rome, to sell the
of Natural History, ‘Naturalis’, in Leiden.
Now, after more than ten years out of the
public eye, the pearl is described in detail
for the first time and compared with other
large pearls that have been reported in
the literature.
history and loreOnly very recently, a print of an
‘Oosterse Paarel’ (oriental pearl) dated
1778, was found in the city archive of
Amsterdam (Lakmaker, 2009). It was
accompanied by a note stating: “A large
pearl, of 578 carats, visualizing a sleeping
lion, left by H.C. Sander, has been sold
in ‘the Munt’ on 26th August 1778,” A
separate note stated that the pearl was
sold for 2100 Dutch guilders (Muller,
1876–77). Comparing this drawing with the
Introduction In 1979, a large baroque pearl was
brought to the Netherlands Gemmological
Laboratory for identification, by L.W. van
Kooten, the Dutch owner at the time.
Professor Dr P.C. Zwaan, the director of
the Laboratory at the time, confirmed its
natural identity in a letter written on 7
June 1979 and immediately recognized
its uniqueness. For that reason, he stated
that the pearl deserved to be shown to
the public. However, no publicity was
generated around the discovery, and the
pearl stayed locked away after a change
of ownership in the same year. However,
in 1998 it was shown to the public for the
first time during the Christmas period, right
after the opening of the new exhibition
halls and depot of the National Museum
A description and history of one of the largest nacreous pearls in the worldJ.C. (Hanco) Zwaan and Herman A. Dommisse
Abstract: A large pearl, weighing approximately 2385 grains, is described. This pearl is one of the largest nacreous pearls ever found. Although the first known owner, Sir h.C. Sander, left this pearl to be auctioned in Amsterdam in 1778, and the pearl has been part of a Dutch private collection, at least from the nineteenth century onwards, it has never been described before. Its properties indicate a freshwater origin. Supported by an eighteenth century print and historical references, its properties point to the Far East as its most likely provenance. The weight of the pearl is slightly less than the recorded weight of the Pearl of Asia, as described in the literature.Based on its shape, it had been suggested previously by the present owner that this pearl could actually be the disappeared Arco Valley Pearl, which until recently had been owned by one Italian family since 1700. After the sudden announcement that the Arco Valley Pearl had been put up for auction in Abu Dhabi in 2007, and the recent discovery that the pearl described herein had been sold in Amsterdam in 1778, the suggested Italian link could be refuted and a strong Dutch link confirmed.
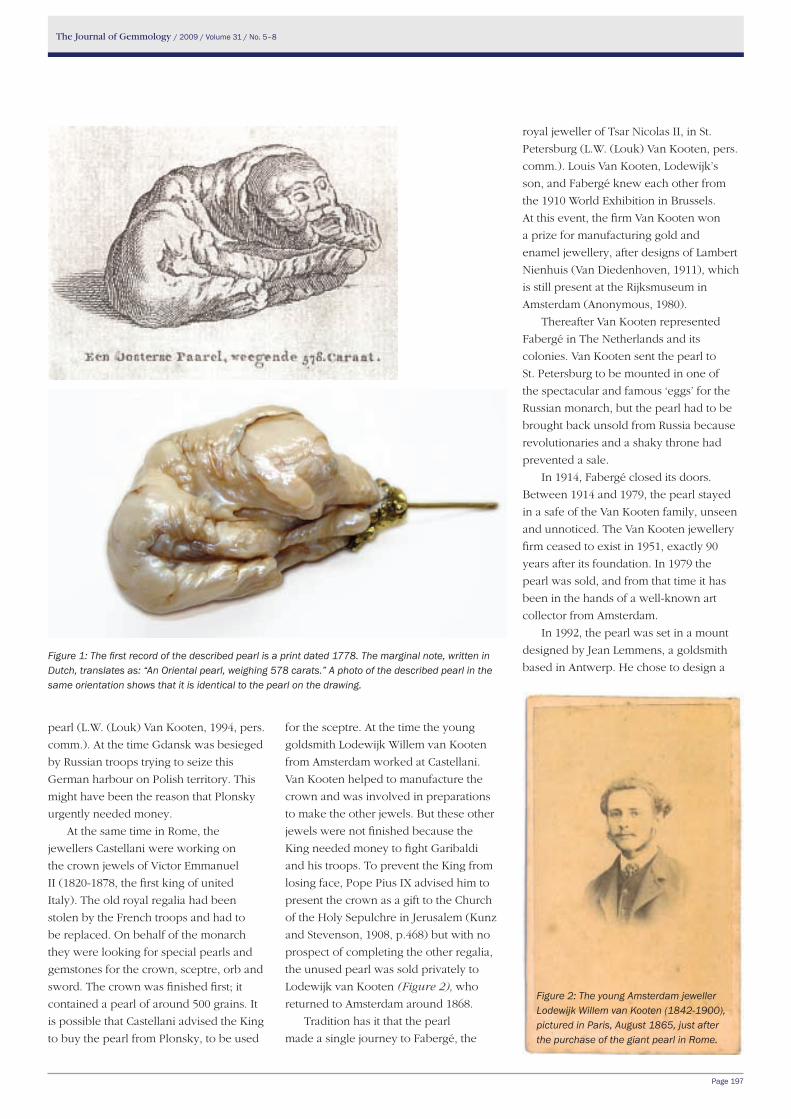
The Journal of Gemmology / 2009 / Volume 31 / No. 5–8
Page 197
pearl (L.W. (Louk) Van Kooten, 1994, pers.
comm.). At the time Gdansk was besieged
by Russian troops trying to seize this
German harbour on Polish territory. This
might have been the reason that Plonsky
urgently needed money.
At the same time in Rome, the
jewellers Castellani were working on
the crown jewels of Victor Emmanuel
II (1820-1878, the first king of united
Italy). The old royal regalia had been
stolen by the French troops and had to
be replaced. On behalf of the monarch
they were looking for special pearls and
gemstones for the crown, sceptre, orb and
sword. The crown was finished first; it
contained a pearl of around 500 grains. It
is possible that Castellani advised the King
to buy the pearl from Plonsky, to be used
for the sceptre. At the time the young
goldsmith Lodewijk Willem van Kooten
from Amsterdam worked at Castellani.
Van Kooten helped to manufacture the
crown and was involved in preparations
to make the other jewels. But these other
jewels were not finished because the
King needed money to fight Garibaldi
and his troops. To prevent the King from
losing face, Pope Pius IX advised him to
present the crown as a gift to the Church
of the Holy Sepulchre in Jerusalem (Kunz
and Stevenson, 1908, p.468) but with no
prospect of completing the other regalia,
the unused pearl was sold privately to
Lodewijk van Kooten (Figure 2), who
returned to Amsterdam around 1868.
Tradition has it that the pearl
made a single journey to Fabergé, the
royal jeweller of Tsar Nicolas II, in St.
Petersburg (L.W. (Louk) Van Kooten, pers.
comm.). Louis Van Kooten, Lodewijk’s
son, and Fabergé knew each other from
the 1910 World Exhibition in Brussels.
At this event, the firm Van Kooten won
a prize for manufacturing gold and
enamel jewellery, after designs of Lambert
Nienhuis (Van Diedenhoven, 1911), which
is still present at the Rijksmuseum in
Amsterdam (Anonymous, 1980).
Thereafter Van Kooten represented
Fabergé in The Netherlands and its
colonies. Van Kooten sent the pearl to
St. Petersburg to be mounted in one of
the spectacular and famous ‘eggs’ for the
Russian monarch, but the pearl had to be
brought back unsold from Russia because
revolutionaries and a shaky throne had
prevented a sale.
In 1914, Fabergé closed its doors.
Between 1914 and 1979, the pearl stayed
in a safe of the Van Kooten family, unseen
and unnoticed. The Van Kooten jewellery
firm ceased to exist in 1951, exactly 90
years after its foundation. In 1979 the
pearl was sold, and from that time it has
been in the hands of a well-known art
collector from Amsterdam.
In 1992, the pearl was set in a mount
designed by Jean Lemmens, a goldsmith
based in Antwerp. He chose to design a Figure 1: The first record of the described pearl is a print dated 1778. The marginal note, written in Dutch, translates as: “An Oriental pearl, weighing 578 carats.” A photo of the described pearl in the same orientation shows that it is identical to the pearl on the drawing.
Figure 2: The young Amsterdam jeweller Lodewijk Willem van Kooten (1842-1900), pictured in Paris, August 1865, just after the purchase of the giant pearl in Rome.
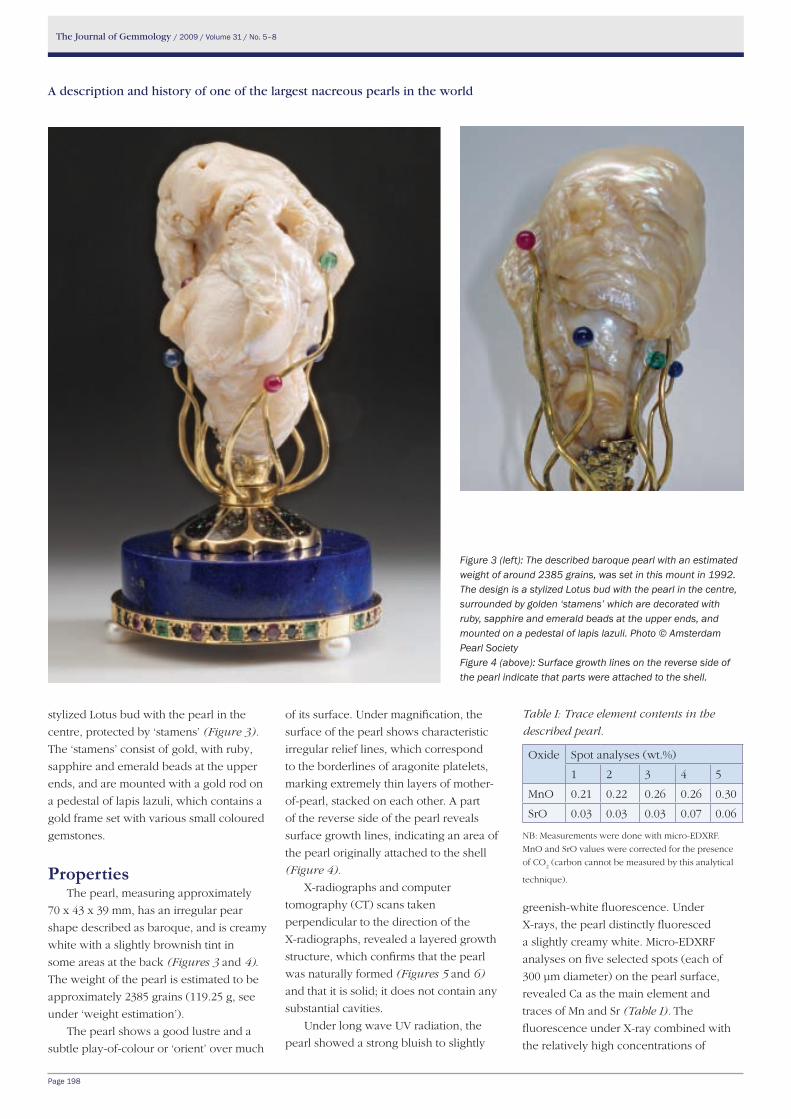
The Journal of Gemmology / 2009 / Volume 31 / No. 5–8
Page 198
stylized Lotus bud with the pearl in the
centre, protected by ‘stamens’ (Figure 3).
The ‘stamens’ consist of gold, with ruby,
sapphire and emerald beads at the upper
ends, and are mounted with a gold rod on
a pedestal of lapis lazuli, which contains a
gold frame set with various small coloured
gemstones.
PropertiesThe pearl, measuring approximately
70 x 43 x 39 mm, has an irregular pear
shape described as baroque, and is creamy
white with a slightly brownish tint in
some areas at the back (Figures 3 and 4).
The weight of the pearl is estimated to be
approximately 2385 grains (119.25 g, see
under ‘weight estimation’).
The pearl shows a good lustre and a
subtle play-of-colour or ‘orient’ over much
of its surface. Under magnification, the
surface of the pearl shows characteristic
irregular relief lines, which correspond
to the borderlines of aragonite platelets,
marking extremely thin layers of mother-
of-pearl, stacked on each other. A part
of the reverse side of the pearl reveals
surface growth lines, indicating an area of
the pearl originally attached to the shell
(Figure 4).
X-radiographs and computer
tomography (CT) scans taken
perpendicular to the direction of the
X-radiographs, revealed a layered growth
structure, which confirms that the pearl
was naturally formed (Figures 5 and 6)
and that it is solid; it does not contain any
substantial cavities.
Under long wave UV radiation, the
pearl showed a strong bluish to slightly
greenish-white fluorescence. Under
X-rays, the pearl distinctly fluoresced
a slightly creamy white. Micro-EDXRF
analyses on five selected spots (each of
300 μm diameter) on the pearl surface,
revealed Ca as the main element and
traces of Mn and Sr (Table I). The
fluorescence under X-ray combined with
the relatively high concentrations of
Figure 3 (left): The described baroque pearl with an estimated weight of around 2385 grains, was set in this mount in 1992. The design is a stylized Lotus bud with the pearl in the centre, surrounded by golden ‘stamens’ which are decorated with ruby, sapphire and emerald beads at the upper ends, and mounted on a pedestal of lapis lazuli. Photo © Amsterdam Pearl SocietyFigure 4 (above): Surface growth lines on the reverse side of the pearl indicate that parts were attached to the shell.
Table I: Trace element contents in the
described pearl.
Oxide Spot analyses (wt.%)
1 2 3 4 5
MnO 0.21 0.22 0.26 0.26 0.30
SrO 0.03 0.03 0.03 0.07 0.06
NB: Measurements were done with micro-EDXRF.
MnO and SrO values were corrected for the presence
of CO2 (carbon cannot be measured by this analytical
technique).
A description and history of one of the largest nacreous pearls in the world
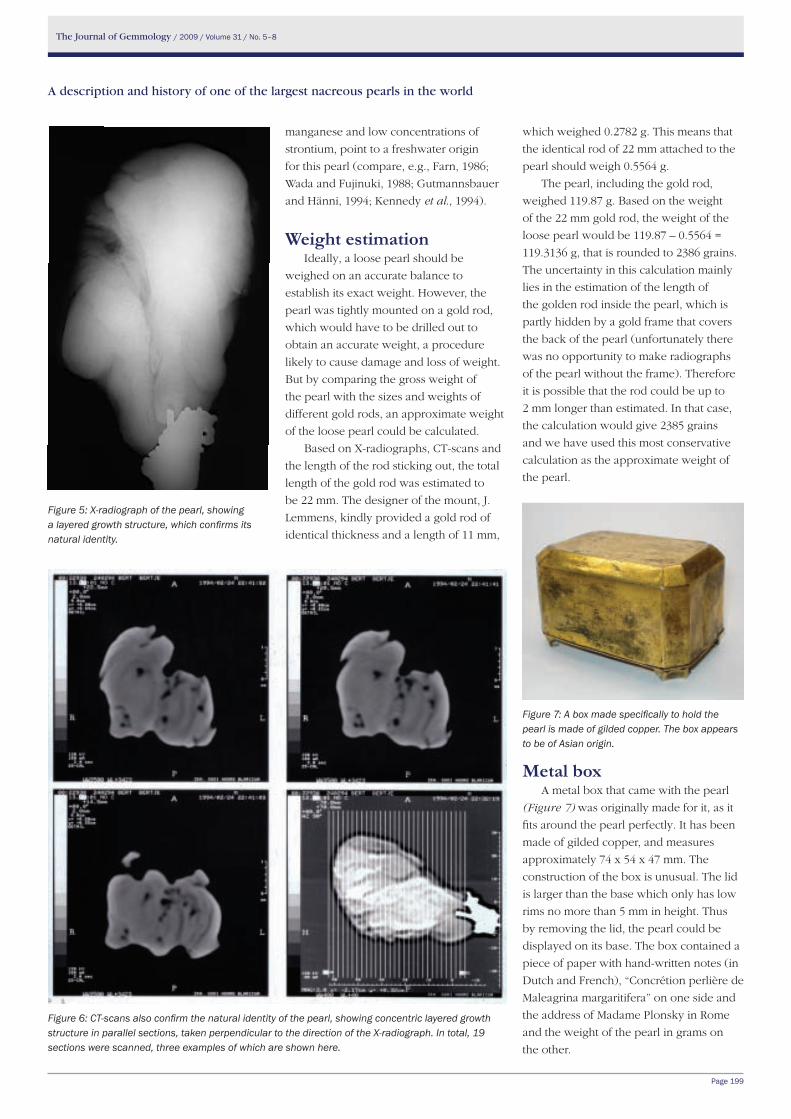
The Journal of Gemmology / 2009 / Volume 31 / No. 5–8
Page 199
manganese and low concentrations of
strontium, point to a freshwater origin
for this pearl (compare, e.g., Farn, 1986;
Wada and Fujinuki, 1988; Gutmannsbauer
and Hänni, 1994; Kennedy et al., 1994).
weight estimationIdeally, a loose pearl should be
weighed on an accurate balance to
establish its exact weight. However, the
pearl was tightly mounted on a gold rod,
which would have to be drilled out to
obtain an accurate weight, a procedure
likely to cause damage and loss of weight.
But by comparing the gross weight of
the pearl with the sizes and weights of
different gold rods, an approximate weight
of the loose pearl could be calculated.
Based on X-radiographs, CT-scans and
the length of the rod sticking out, the total
length of the gold rod was estimated to
be 22 mm. The designer of the mount, J.
Lemmens, kindly provided a gold rod of
identical thickness and a length of 11 mm,
which weighed 0.2782 g. This means that
the identical rod of 22 mm attached to the
pearl should weigh 0.5564 g.
The pearl, including the gold rod,
weighed 119.87 g. Based on the weight
of the 22 mm gold rod, the weight of the
loose pearl would be 119.87 – 0.5564 =
119.3136 g, that is rounded to 2386 grains.
The uncertainty in this calculation mainly
lies in the estimation of the length of
the golden rod inside the pearl, which is
partly hidden by a gold frame that covers
the back of the pearl (unfortunately there
was no opportunity to make radiographs
of the pearl without the frame). Therefore
it is possible that the rod could be up to
2 mm longer than estimated. In that case,
the calculation would give 2385 grains
and we have used this most conservative
calculation as the approximate weight of
the pearl.
Metal boxA metal box that came with the pearl
(Figure 7) was originally made for it, as it
fits around the pearl perfectly. It has been
made of gilded copper, and measures
approximately 74 x 54 x 47 mm. The
construction of the box is unusual. The lid
is larger than the base which only has low
rims no more than 5 mm in height. Thus
by removing the lid, the pearl could be
displayed on its base. The box contained a
piece of paper with hand-written notes (in
Dutch and French), “Concrétion perlière de
Maleagrina margaritifera” on one side and
the address of Madame Plonsky in Rome
and the weight of the pearl in grams on
the other.
Figure 5: X-radiograph of the pearl, showing a layered growth structure, which confirms its natural identity.
Figure 6: CT-scans also confirm the natural identity of the pearl, showing concentric layered growth structure in parallel sections, taken perpendicular to the direction of the X-radiograph. In total, 19 sections were scanned, three examples of which are shown here.
Figure 7: A box made specifically to hold the pearl is made of gilded copper. The box appears to be of Asian origin.
A description and history of one of the largest nacreous pearls in the world
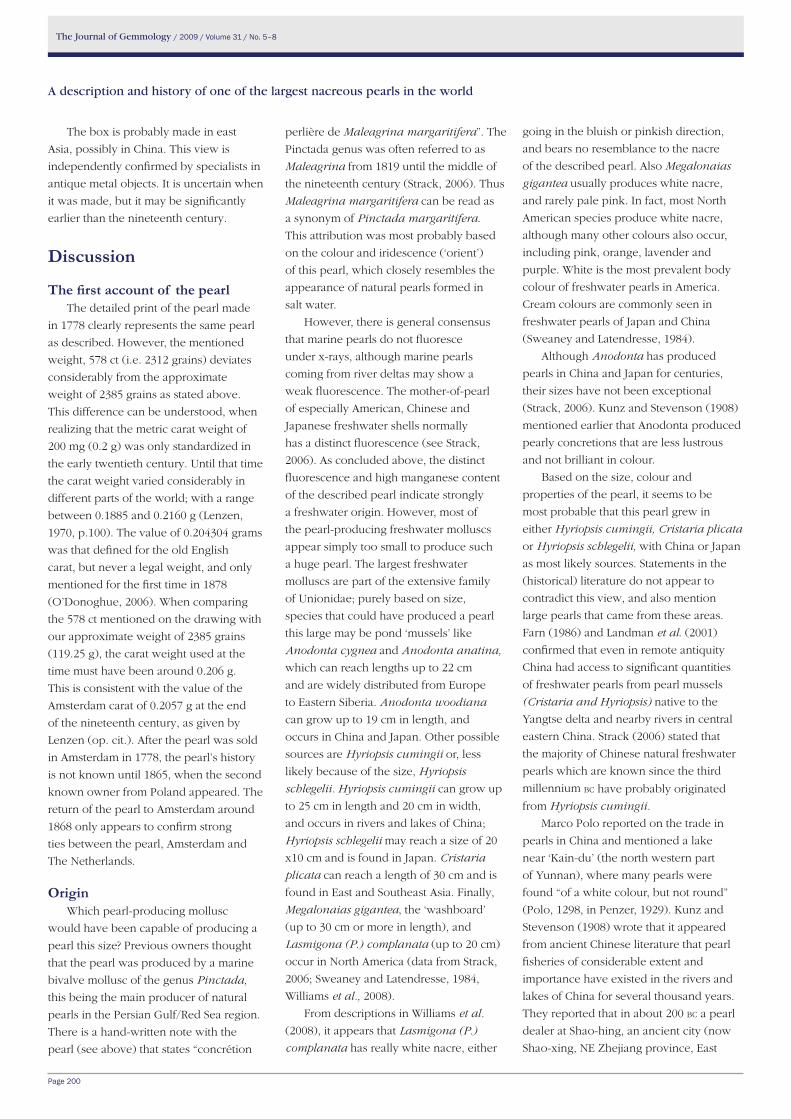
The Journal of Gemmology / 2009 / Volume 31 / No. 5–8
Page 200
The box is probably made in east
Asia, possibly in China. This view is
independently confirmed by specialists in
antique metal objects. It is uncertain when
it was made, but it may be significantly
earlier than the nineteenth century.
Discussion
The first account of the pearlThe detailed print of the pearl made
in 1778 clearly represents the same pearl
as described. However, the mentioned
weight, 578 ct (i.e. 2312 grains) deviates
considerably from the approximate
weight of 2385 grains as stated above.
This difference can be understood, when
realizing that the metric carat weight of
200 mg (0.2 g) was only standardized in
the early twentieth century. Until that time
the carat weight varied considerably in
different parts of the world; with a range
between 0.1885 and 0.2160 g (Lenzen,
1970, p.100). The value of 0.204304 grams
was that defined for the old English
carat, but never a legal weight, and only
mentioned for the first time in 1878
(O’Donoghue, 2006). When comparing
the 578 ct mentioned on the drawing with
our approximate weight of 2385 grains
(119.25 g), the carat weight used at the
time must have been around 0.206 g.
This is consistent with the value of the
Amsterdam carat of 0.2057 g at the end
of the nineteenth century, as given by
Lenzen (op. cit.). After the pearl was sold
in Amsterdam in 1778, the pearl’s history
is not known until 1865, when the second
known owner from Poland appeared. The
return of the pearl to Amsterdam around
1868 only appears to confirm strong
ties between the pearl, Amsterdam and
The Netherlands.
originWhich pearl-producing mollusc
would have been capable of producing a
pearl this size? Previous owners thought
that the pearl was produced by a marine
bivalve mollusc of the genus Pinctada,
this being the main producer of natural
pearls in the Persian Gulf/Red Sea region.
There is a hand-written note with the
pearl (see above) that states “concrétion
perlière de Maleagrina margaritifera”. The
Pinctada genus was often referred to as
Maleagrina from 1819 until the middle of
the nineteenth century (Strack, 2006). Thus
Maleagrina margaritifera can be read as
a synonym of Pinctada margaritifera.
This attribution was most probably based
on the colour and iridescence (‘orient’)
of this pearl, which closely resembles the
appearance of natural pearls formed in
salt water.
However, there is general consensus
that marine pearls do not fluoresce
under x-rays, although marine pearls
coming from river deltas may show a
weak fluorescence. The mother-of-pearl
of especially American, Chinese and
Japanese freshwater shells normally
has a distinct fluorescence (see Strack,
2006). As concluded above, the distinct
fluorescence and high manganese content
of the described pearl indicate strongly
a freshwater origin. However, most of
the pearl-producing freshwater molluscs
appear simply too small to produce such
a huge pearl. The largest freshwater
molluscs are part of the extensive family
of Unionidae; purely based on size,
species that could have produced a pearl
this large may be pond ‘mussels’ like
Anodonta cygnea and Anodonta anatina,
which can reach lengths up to 22 cm
and are widely distributed from Europe
to Eastern Siberia. Anodonta woodiana
can grow up to 19 cm in length, and
occurs in China and Japan. Other possible
sources are Hyriopsis cumingii or, less
likely because of the size, Hyriopsis
schlegelii. Hyriopsis cumingii can grow up
to 25 cm in length and 20 cm in width,
and occurs in rivers and lakes of China;
Hyriopsis schlegelii may reach a size of 20
x10 cm and is found in Japan. Cristaria
plicata can reach a length of 30 cm and is
found in East and Southeast Asia. Finally,
Megalonaias gigantea, the ‘washboard’
(up to 30 cm or more in length), and
Lasmigona (P.) complanata (up to 20 cm)
occur in North America (data from Strack,
2006; Sweaney and Latendresse, 1984,
Williams et al., 2008).
From descriptions in Williams et al.
(2008), it appears that Lasmigona (P.)
complanata has really white nacre, either
going in the bluish or pinkish direction,
and bears no resemblance to the nacre
of the described pearl. Also Megalonaias
gigantea usually produces white nacre,
and rarely pale pink. In fact, most North
American species produce white nacre,
although many other colours also occur,
including pink, orange, lavender and
purple. White is the most prevalent body
colour of freshwater pearls in America.
Cream colours are commonly seen in
freshwater pearls of Japan and China
(Sweaney and Latendresse, 1984).
Although Anodonta has produced
pearls in China and Japan for centuries,
their sizes have not been exceptional
(Strack, 2006). Kunz and Stevenson (1908)
mentioned earlier that Anodonta produced
pearly concretions that are less lustrous
and not brilliant in colour.
Based on the size, colour and
properties of the pearl, it seems to be
most probable that this pearl grew in
either Hyriopsis cumingii, Cristaria plicata
or Hyriopsis schlegelii, with China or Japan
as most likely sources. Statements in the
(historical) literature do not appear to
contradict this view, and also mention
large pearls that came from these areas.
Farn (1986) and Landman et al. (2001)
confirmed that even in remote antiquity
China had access to significant quantities
of freshwater pearls from pearl mussels
(Cristaria and Hyriopsis) native to the
Yangtse delta and nearby rivers in central
eastern China. Strack (2006) stated that
the majority of Chinese natural freshwater
pearls which are known since the third
millennium bc have probably originated
from Hyriopsis cumingii.
Marco Polo reported on the trade in
pearls in China and mentioned a lake
near ‘Kain-du’ (the north western part
of Yunnan), where many pearls were
found “of a white colour, but not round”
(Polo, 1298, in Penzer, 1929). Kunz and
Stevenson (1908) wrote that it appeared
from ancient Chinese literature that pearl
fisheries of considerable extent and
importance have existed in the rivers and
lakes of China for several thousand years.
They reported that in about 200 bc a pearl
dealer at Shao-hing, an ancient city (now
Shao-xing, NE Zhejiang province, East
A description and history of one of the largest nacreous pearls in the world
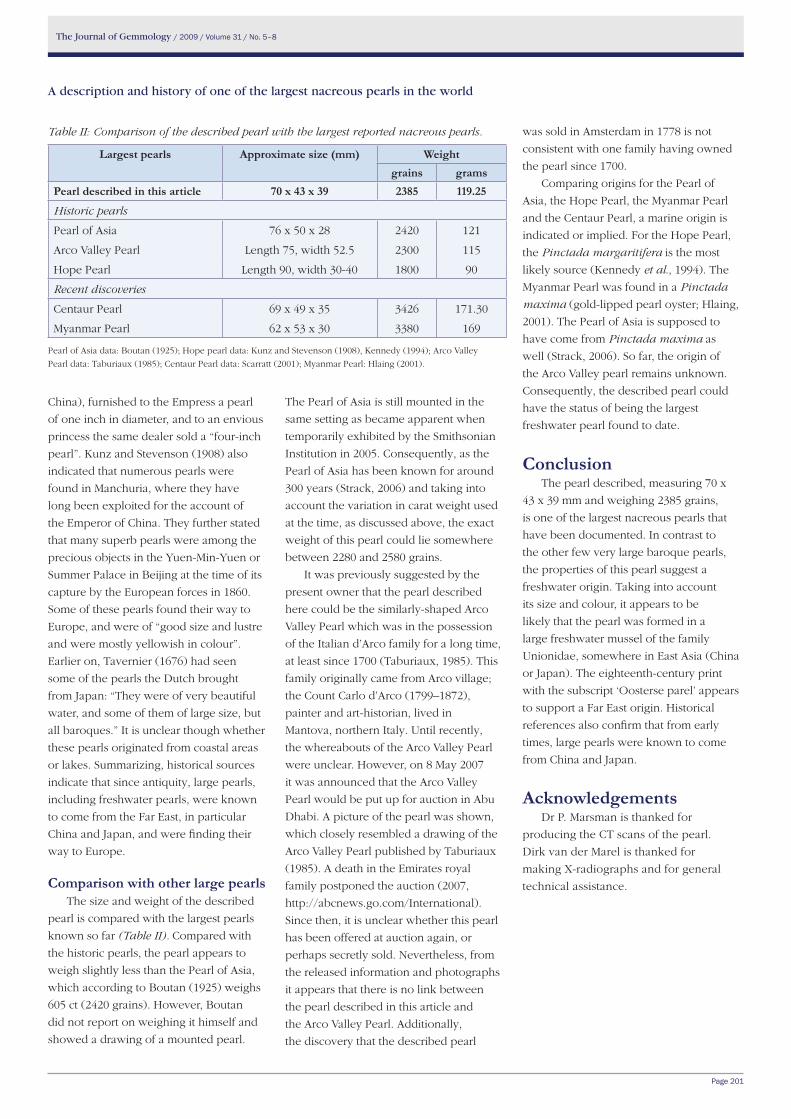
The Journal of Gemmology / 2009 / Volume 31 / No. 5–8
Page 201
Table II: Comparison of the described pearl with the largest reported nacreous pearls.
largest pearls Approximate size (mm) weight grains grams
Pearl described in this article 70 x 43 x 39 2385 119.25
Historic pearls
Pearl of Asia 76 x 50 x 28 2420 121
Arco Valley Pearl Length 75, width 52.5 2300 115
Hope Pearl Length 90, width 30-40 1800 90
Recent discoveries
Centaur Pearl 69 x 49 x 35 3426 171.30
Myanmar Pearl 62 x 53 x 30 3380 169
Pearl of Asia data: Boutan (1925); Hope pearl data: Kunz and Stevenson (1908), Kennedy (1994); Arco Valley
Pearl data: Taburiaux (1985); Centaur Pearl data: Scarratt (2001); Myanmar Pearl: Hlaing (2001).
China), furnished to the Empress a pearl
of one inch in diameter, and to an envious
princess the same dealer sold a “four-inch
pearl”. Kunz and Stevenson (1908) also
indicated that numerous pearls were
found in Manchuria, where they have
long been exploited for the account of
the Emperor of China. They further stated
that many superb pearls were among the
precious objects in the Yuen-Min-Yuen or
Summer Palace in Beijing at the time of its
capture by the European forces in 1860.
Some of these pearls found their way to
Europe, and were of “good size and lustre
and were mostly yellowish in colour”.
Earlier on, Tavernier (1676) had seen
some of the pearls the Dutch brought
from Japan: “They were of very beautiful
water, and some of them of large size, but
all baroques.” It is unclear though whether
these pearls originated from coastal areas
or lakes. Summarizing, historical sources
indicate that since antiquity, large pearls,
including freshwater pearls, were known
to come from the Far East, in particular
China and Japan, and were finding their
way to Europe.
Comparison with other large pearlsThe size and weight of the described
pearl is compared with the largest pearls
known so far (Table II). Compared with
the historic pearls, the pearl appears to
weigh slightly less than the Pearl of Asia,
which according to Boutan (1925) weighs
605 ct (2420 grains). However, Boutan
did not report on weighing it himself and
showed a drawing of a mounted pearl.
The Pearl of Asia is still mounted in the
same setting as became apparent when
temporarily exhibited by the Smithsonian
Institution in 2005. Consequently, as the
Pearl of Asia has been known for around
300 years (Strack, 2006) and taking into
account the variation in carat weight used
at the time, as discussed above, the exact
weight of this pearl could lie somewhere
between 2280 and 2580 grains.
It was previously suggested by the
present owner that the pearl described
here could be the similarly-shaped Arco
Valley Pearl which was in the possession
of the Italian d’Arco family for a long time,
at least since 1700 (Taburiaux, 1985). This
family originally came from Arco village;
the Count Carlo d’Arco (1799–1872),
painter and art-historian, lived in
Mantova, northern Italy. Until recently,
the whereabouts of the Arco Valley Pearl
were unclear. However, on 8 May 2007
it was announced that the Arco Valley
Pearl would be put up for auction in Abu
Dhabi. A picture of the pearl was shown,
which closely resembled a drawing of the
Arco Valley Pearl published by Taburiaux
(1985). A death in the Emirates royal
family postponed the auction (2007,
http://abcnews.go.com/International).
Since then, it is unclear whether this pearl
has been offered at auction again, or
perhaps secretly sold. Nevertheless, from
the released information and photographs
it appears that there is no link between
the pearl described in this article and
the Arco Valley Pearl. Additionally,
the discovery that the described pearl
was sold in Amsterdam in 1778 is not
consistent with one family having owned
the pearl since 1700.
Comparing origins for the Pearl of
Asia, the Hope Pearl, the Myanmar Pearl
and the Centaur Pearl, a marine origin is
indicated or implied. For the Hope Pearl,
the Pinctada margaritifera is the most
likely source (Kennedy et al., 1994). The
Myanmar Pearl was found in a Pinctada
maxima (gold-lipped pearl oyster; Hlaing,
2001). The Pearl of Asia is supposed to
have come from Pinctada maxima as
well (Strack, 2006). So far, the origin of
the Arco Valley pearl remains unknown.
Consequently, the described pearl could
have the status of being the largest
freshwater pearl found to date.
ConclusionThe pearl described, measuring 70 x
43 x 39 mm and weighing 2385 grains,
is one of the largest nacreous pearls that
have been documented. In contrast to
the other few very large baroque pearls,
the properties of this pearl suggest a
freshwater origin. Taking into account
its size and colour, it appears to be
likely that the pearl was formed in a
large freshwater mussel of the family
Unionidae, somewhere in East Asia (China
or Japan). The eighteenth-century print
with the subscript ‘Oosterse parel’ appears
to support a Far East origin. Historical
references also confirm that from early
times, large pearls were known to come
from China and Japan.
AcknowledgementsDr P. Marsman is thanked for
producing the CT scans of the pearl.
Dirk van der Marel is thanked for
making X-radiographs and for general
technical assistance.
A description and history of one of the largest nacreous pearls in the world
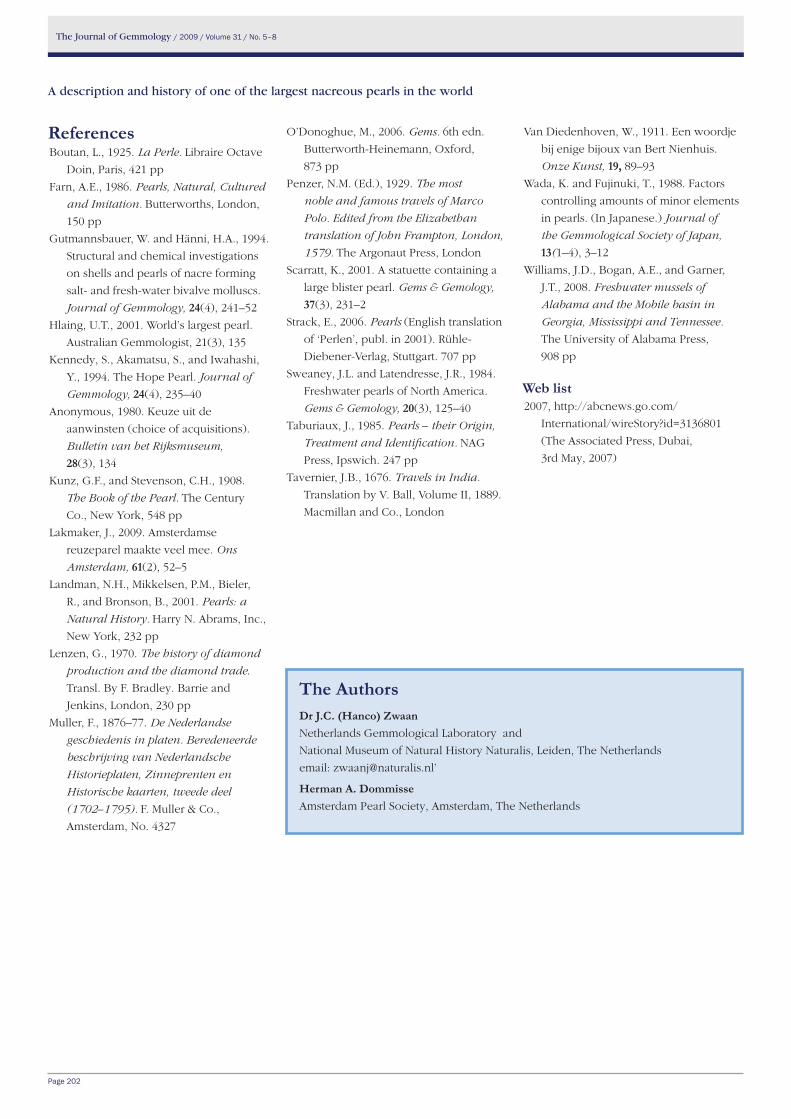
The Journal of Gemmology / 2009 / Volume 31 / No. 5–8
Page 202
ReferencesBoutan, L., 1925. La Perle. Libraire Octave
Doin, Paris, 421 pp
Farn, A.E., 1986. Pearls, Natural, Cultured
and Imitation. Butterworths, London,
150 pp
Gutmannsbauer, W. and Hänni, H.A., 1994.
Structural and chemical investigations
on shells and pearls of nacre forming
salt- and fresh-water bivalve molluscs.
Journal of Gemmology, 24(4), 241–52
Hlaing, U.T., 2001. World’s largest pearl.
Australian Gemmologist, 21(3), 135
Kennedy, S., Akamatsu, S., and Iwahashi,
Y., 1994. The Hope Pearl. Journal of
Gemmology, 24(4), 235–40
Anonymous, 1980. Keuze uit de
aanwinsten (choice of acquisitions).
Bulletin van het Rijksmuseum,
28(3), 134
Kunz, G.F., and Stevenson, C.H., 1908.
The Book of the Pearl. The Century
Co., New York, 548 pp
Lakmaker, J., 2009. Amsterdamse
reuzeparel maakte veel mee. Ons
Amsterdam, 61(2), 52–5
Landman, N.H., Mikkelsen, P.M., Bieler,
R., and Bronson, B., 2001. Pearls: a
Natural History. Harry N. Abrams, Inc.,
New York, 232 pp
Lenzen, G., 1970. The history of diamond
production and the diamond trade.
Transl. By F. Bradley. Barrie and
Jenkins, London, 230 pp
Muller, F., 1876–77. De Nederlandse
geschiedenis in platen. Beredeneerde
beschrijving van Nederlandsche
Historieplaten, Zinneprenten en
Historische kaarten, tweede deel
(1702–1795). F. Muller & Co.,
Amsterdam, No. 4327
A description and history of one of the largest nacreous pearls in the world
the AuthorsDr J.C. (hanco) Zwaan Netherlands Gemmological Laboratory and
National Museum of Natural History Naturalis, Leiden, The Netherlands
email: [email protected]’
herman A. DommisseAmsterdam Pearl Society, Amsterdam, The Netherlands
O’Donoghue, M., 2006. Gems. 6th edn.
Butterworth-Heinemann, Oxford,
873 pp
Penzer, N.M. (Ed.), 1929. The most
noble and famous travels of Marco
Polo. Edited from the Elizabethan
translation of John Frampton, London,
1579. The Argonaut Press, London
Scarratt, K., 2001. A statuette containing a
large blister pearl. Gems & Gemology,
37(3), 231–2
Strack, E., 2006. Pearls (English translation
of ‘Perlen’, publ. in 2001). Rühle-
Diebener-Verlag, Stuttgart. 707 pp
Sweaney, J.L. and Latendresse, J.R., 1984.
Freshwater pearls of North America.
Gems & Gemology, 20(3), 125–40
Taburiaux, J., 1985. Pearls – their Origin,
Treatment and Identification. NAG
Press, Ipswich. 247 pp
Tavernier, J.B., 1676. Travels in India.
Translation by V. Ball, Volume II, 1889.
Macmillan and Co., London
Van Diedenhoven, W., 1911. Een woordje
bij enige bijoux van Bert Nienhuis.
Onze Kunst, 19, 89–93
Wada, K. and Fujinuki, T., 1988. Factors
controlling amounts of minor elements
in pearls. (In Japanese.) Journal of
the Gemmological Society of Japan,
13(1–4), 3–12
Williams, J.D., Bogan, A.E., and Garner,
J.T., 2008. Freshwater mussels of
Alabama and the Mobile basin in
Georgia, Mississippi and Tennessee.
The University of Alabama Press,
908 pp
web list2007, http://abcnews.go.com/
International/wireStory?id=3136801
(The Associated Press, Dubai,
3rd May, 2007)
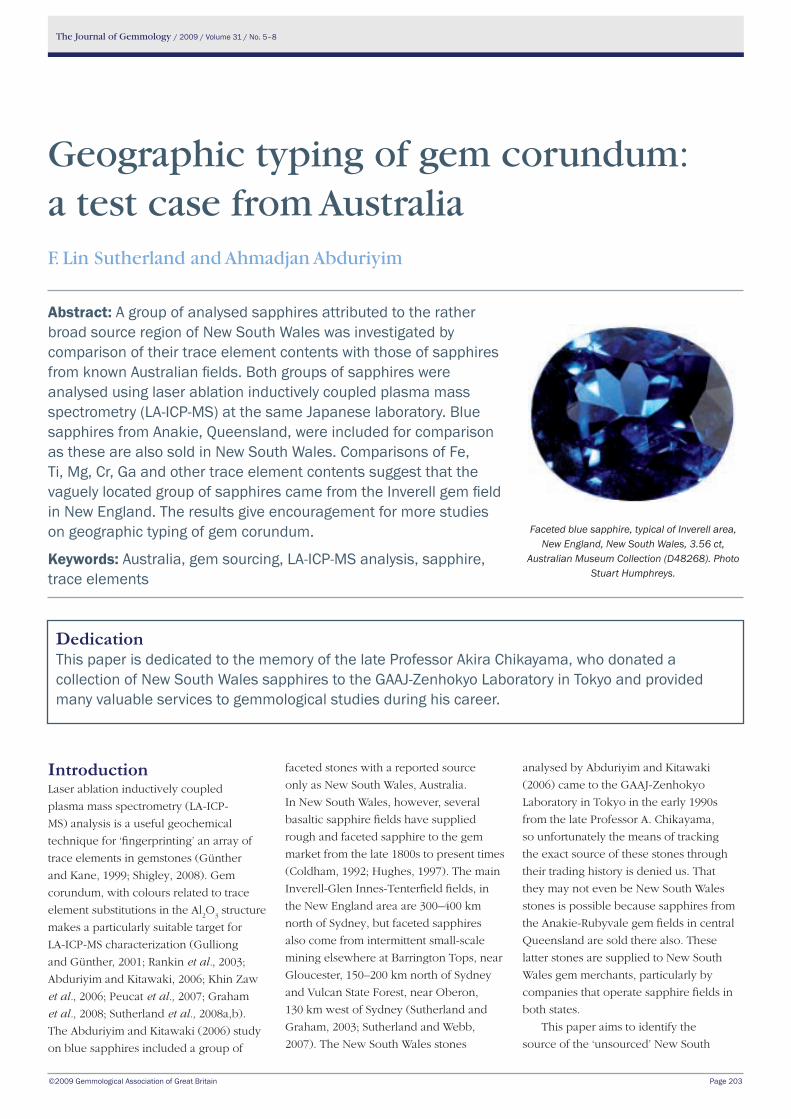
The Journal of Gemmology / 2009 / Volume 31 / No. 5–8
©2009 Gemmological Association of Great Britain Page 203
IntroductionLaser ablation inductively coupled
plasma mass spectrometry (LA-ICP-
MS) analysis is a useful geochemical
technique for ‘fingerprinting’ an array of
trace elements in gemstones (Günther
and Kane, 1999; Shigley, 2008). Gem
corundum, with colours related to trace
element substitutions in the Al2O
3 structure
makes a particularly suitable target for
LA-ICP-MS characterization (Gulliong
and Günther, 2001; Rankin et al., 2003;
Abduriyim and Kitawaki, 2006; Khin Zaw
et al., 2006; Peucat et al., 2007; Graham
et al., 2008; Sutherland et al., 2008a,b).
The Abduriyim and Kitawaki (2006) study
on blue sapphires included a group of
faceted stones with a reported source
only as New South Wales, Australia.
In New South Wales, however, several
basaltic sapphire fields have supplied
rough and faceted sapphire to the gem
market from the late 1800s to present times
(Coldham, 1992; Hughes, 1997). The main
Inverell-Glen Innes-Tenterfield fields, in
the New England area are 300–400 km
north of Sydney, but faceted sapphires
also come from intermittent small-scale
mining elsewhere at Barrington Tops, near
Gloucester, 150–200 km north of Sydney
and Vulcan State Forest, near Oberon,
130 km west of Sydney (Sutherland and
Graham, 2003; Sutherland and Webb,
2007). The New South Wales stones
analysed by Abduriyim and Kitawaki
(2006) came to the GAAJ-Zenhokyo
Laboratory in Tokyo in the early 1990s
from the late Professor A. Chikayama,
so unfortunately the means of tracking
the exact source of these stones through
their trading history is denied us. That
they may not even be New South Wales
stones is possible because sapphires from
the Anakie-Rubyvale gem fields in central
Queensland are sold there also. These
latter stones are supplied to New South
Wales gem merchants, particularly by
companies that operate sapphire fields in
both states.
This paper aims to identify the
source of the ‘unsourced’ New South
Geographic typing of gem corundum: a test case from AustraliaF. Lin Sutherland and Ahmadjan Abduriyim
Abstract: A group of analysed sapphires attributed to the rather broad source region of New South Wales was investigated by comparison of their trace element contents with those of sapphires from known Australian fields. Both groups of sapphires were analysed using laser ablation inductively coupled plasma mass spectrometry (LA-ICP-MS) at the same Japanese laboratory. Blue sapphires from Anakie, Queensland, were included for comparison as these are also sold in New South Wales. Comparisons of Fe, Ti, Mg, Cr, Ga and other trace element contents suggest that the vaguely located group of sapphires came from the Inverell gem field in New England. The results give encouragement for more studies on geographic typing of gem corundum.
Keywords: Australia, gem sourcing, LA-ICP-MS analysis, sapphire, trace elements
DedicationThis paper is dedicated to the memory of the late Professor Akira Chikayama, who donated a collection of New South Wales sapphires to the GAAJ-Zenhokyo Laboratory in Tokyo and provided many valuable services to gemmological studies during his career.
Faceted blue sapphire, typical of Inverell area, New England, New South Wales, 3.56 ct,
Australian Museum Collection (D48268). Photo Stuart Humphreys.

The Journal of Gemmology / 2009 / Volume 31 / No. 5–8
Page 204
Wales sapphires (termed here the
Unsourced NSW Group) by comparing
their previously published trace element
contents with similar LA-ICP-MS analyses
on sapphires of documented origin
from specific gemfields (made using the
same instruments in the same laboratory
Geographic typing of gem corundum: a test case from Australia
Figure 1: Sapphire-ruby fields, East Australia, including localities discussed in this study. The dash-dot line represents the western exposure of the New England Fold Belt.
and with the same operator). Recent
LA-ICP-MS analyses of gem corundum
from several New South Wales localities
were reported at a recent Applied
Mineralogy Congress (Sutherland et al.,
2008b) and these are incorporated with
new LA-ICP-MS analyses in this paper.
Few LA-ICP-MS analyses of sapphires
of known geographical origin from the
main commercial New South Wales and
Queensland fields have been available
prior to this study. Sapphires from
magmatic or metamorphic sources are
now readily distinguishable in most
cases using detailed trace element plots
(Abduriyim and Kitawaki, 2006; Peucat et
al., 2007; Sutherland et al., 2008b). The
distribution of the main gem corundum
fields in Australia including those used
in this study are shown in Figure 1 and
examples of faceted sapphires from the
main Australian gem fields are shown in
Figure 2. Geological settings and locations
for the analysed sapphire localities,
summarized from referenced descriptions
in Sutherland et al. (2009), are given in
Appendix I.
Materials and analytical methods The same methodology described by and
instrumentation illustrated by Abduriyim
and Kitawaki (2006) were used again in
this study. The documented sapphires
for this test case included faceted stones,
polished wafers and grains held in the
Australian Museum collection, viz:
•Twocutbluestones,andoneblueand
yellow, Inverell, NSW (0.984–1.022 ct,
D.A. Porter collection)
•Twocutgreenstones,Inverell,NSW
(1.890–2.229 ct, T. Coldham collection)
•Twocutpurplestones,NewEngland,
NSW (0.154–0.340 ct, D. Cupit
collection)
•Onecutgreen-bluestone,VulcanState
Forest, NSW (1.514 ct, I. Hall collection)
•Threecutbluestones,twopurpleand
one green, Barrington, NSW (0.10–0.16
ct, A. Chubb collection)
•Threecutbluestones,Anakie,Qld
(1.538–2.163 ct, A. Wirth collection)
Analyses were made using an Agilent
model ICP-MS 7500a with New Wave
UP-213 laser ablation sampling system
(Abduriyim and Kitawaki, 2006, pp
28–30). Two random sites on the table
facet of each stone were analysed using
a laser ablation spot 80 μm in diameter
and the data were processed using Al2O
3
Sapphire mining field
Sapphire
Ruby/fancy sapphire
leGeND
Nt
Qld
SA
NSw
Vic
tas
400 km
BRISBANE
SYDNEY
MELBoURNE
CANBERRA
ADELAIDE
HoBART
Rubyvale
Anakie
Lava Plains
Inverell Glen Innes
New England
Barrington Tops
Oberon
Cudgegong
Vulcan State Forest
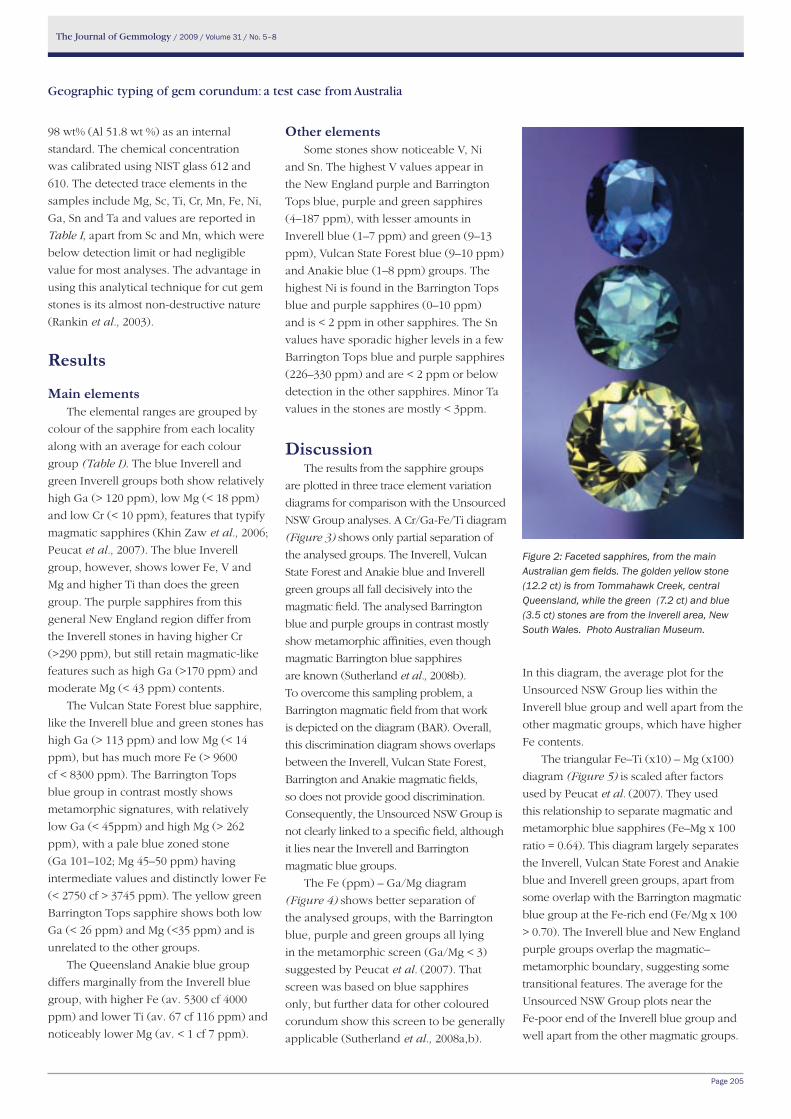
The Journal of Gemmology / 2009 / Volume 31 / No. 5–8
Page 205
Geographic typing of gem corundum: a test case from Australia
Figure 2: Faceted sapphires, from the main Australian gem fields. The golden yellow stone (12.2 ct) is from Tommahawk Creek, central Queensland, while the green (7.2 ct) and blue (3.5 ct) stones are from the Inverell area, New South Wales. Photo Australian Museum.
98 wt% (Al 51.8 wt %) as an internal
standard. The chemical concentration
was calibrated using NIST glass 612 and
610. The detected trace elements in the
samples include Mg, Sc, Ti, Cr, Mn, Fe, Ni,
Ga, Sn and Ta and values are reported in
Table I, apart from Sc and Mn, which were
below detection limit or had negligible
value for most analyses. The advantage in
using this analytical technique for cut gem
stones is its almost non-destructive nature
(Rankin et al., 2003).
Results
Main elementsThe elemental ranges are grouped by
colour of the sapphire from each locality
along with an average for each colour
group (Table I). The blue Inverell and
green Inverell groups both show relatively
high Ga (> 120 ppm), low Mg (< 18 ppm)
and low Cr (< 10 ppm), features that typify
magmatic sapphires (Khin Zaw et al., 2006;
Peucat et al., 2007). The blue Inverell
group, however, shows lower Fe, V and
Mg and higher Ti than does the green
group. The purple sapphires from this
general New England region differ from
the Inverell stones in having higher Cr
(>290 ppm), but still retain magmatic-like
features such as high Ga (>170 ppm) and
moderate Mg (< 43 ppm) contents.
The Vulcan State Forest blue sapphire,
like the Inverell blue and green stones has
high Ga (> 113 ppm) and low Mg (< 14
ppm), but has much more Fe (> 9600
cf < 8300 ppm). The Barrington Tops
blue group in contrast mostly shows
metamorphic signatures, with relatively
low Ga (< 45ppm) and high Mg (> 262
ppm), with a pale blue zoned stone
(Ga 101–102; Mg 45–50 ppm) having
intermediate values and distinctly lower Fe
(< 2750 cf > 3745 ppm). The yellow green
Barrington Tops sapphire shows both low
Ga (< 26 ppm) and Mg (<35 ppm) and is
unrelated to the other groups.
The Queensland Anakie blue group
differs marginally from the Inverell blue
group, with higher Fe (av. 5300 cf 4000
ppm) and lower Ti (av. 67 cf 116 ppm) and
noticeably lower Mg (av. < 1 cf 7 ppm).
other elementsSome stones show noticeable V, Ni
and Sn. The highest V values appear in
the New England purple and Barrington
Tops blue, purple and green sapphires
(4–187 ppm), with lesser amounts in
Inverell blue (1–7 ppm) and green (9–13
ppm), Vulcan State Forest blue (9–10 ppm)
and Anakie blue (1–8 ppm) groups. The
highest Ni is found in the Barrington Tops
blue and purple sapphires (0–10 ppm)
and is < 2 ppm in other sapphires. The Sn
values have sporadic higher levels in a few
Barrington Tops blue and purple sapphires
(226–330 ppm) and are < 2 ppm or below
detection in the other sapphires. Minor Ta
values in the stones are mostly < 3ppm.
DiscussionThe results from the sapphire groups
are plotted in three trace element variation
diagrams for comparison with the Unsourced
NSW Group analyses. A Cr/Ga-Fe/Ti diagram
(Figure 3) shows only partial separation of
the analysed groups. The Inverell, Vulcan
State Forest and Anakie blue and Inverell
green groups all fall decisively into the
magmatic field. The analysed Barrington
blue and purple groups in contrast mostly
show metamorphic affinities, even though
magmatic Barrington blue sapphires
are known (Sutherland et al., 2008b).
To overcome this sampling problem, a
Barrington magmatic field from that work
is depicted on the diagram (BAR). Overall,
this discrimination diagram shows overlaps
between the Inverell, Vulcan State Forest,
Barrington and Anakie magmatic fields,
so does not provide good discrimination.
Consequently, the Unsourced NSW Group is
not clearly linked to a specific field, although
it lies near the Inverell and Barrington
magmatic blue groups.
The Fe (ppm) – Ga/Mg diagram
(Figure 4) shows better separation of
the analysed groups, with the Barrington
blue, purple and green groups all lying
in the metamorphic screen (Ga/Mg < 3)
suggested by Peucat et al. (2007). That
screen was based on blue sapphires
only, but further data for other coloured
corundum show this screen to be generally
applicable (Sutherland et al., 2008a,b).
In this diagram, the average plot for the
Unsourced NSW Group lies within the
Inverell blue group and well apart from the
other magmatic groups, which have higher
Fe contents.
The triangular Fe–Ti (x10) – Mg (x100)
diagram (Figure 5) is scaled after factors
used by Peucat et al. (2007). They used
this relationship to separate magmatic and
metamorphic blue sapphires (Fe–Mg x 100
ratio = 0.64). This diagram largely separates
the Inverell, Vulcan State Forest and Anakie
blue and Inverell green groups, apart from
some overlap with the Barrington magmatic
blue group at the Fe-rich end (Fe/Mg x 100
> 0.70). The Inverell blue and New England
purple groups overlap the magmatic–
metamorphic boundary, suggesting some
transitional features. The average for the
Unsourced NSW Group plots near the
Fe-poor end of the Inverell blue group and
well apart from the other magmatic groups.
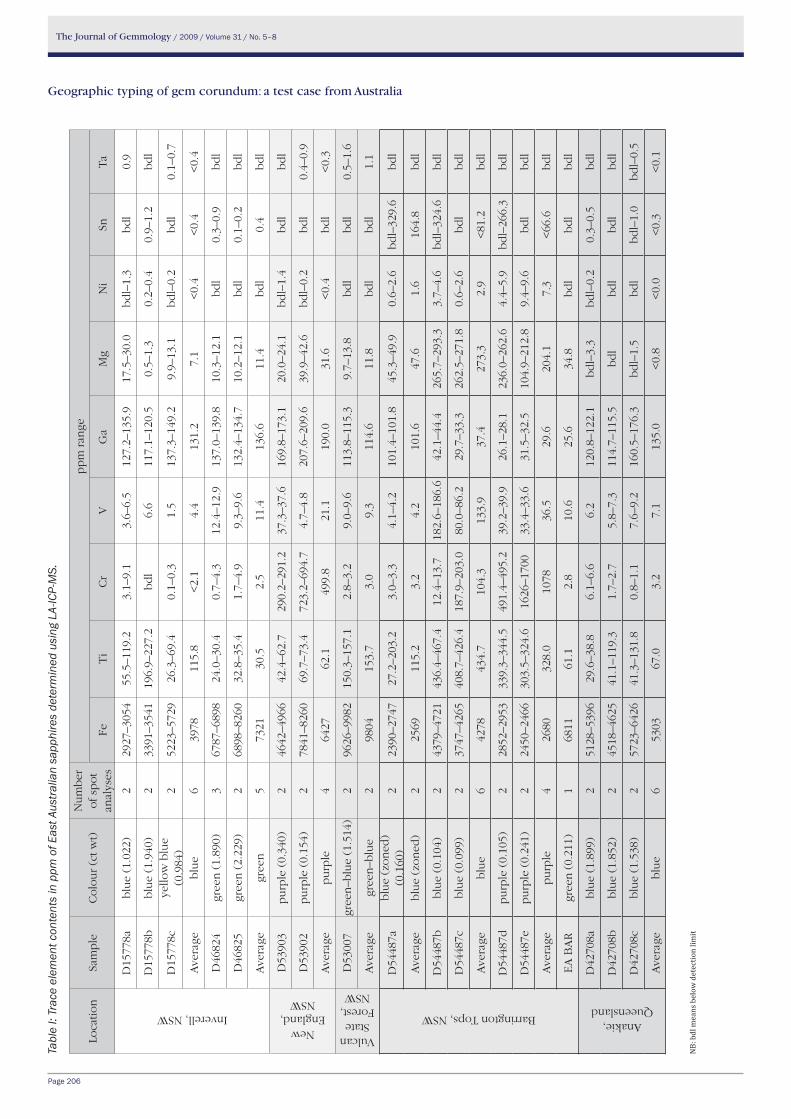
The Journal of Gemmology / 2009 / Volume 31 / No. 5–8
Page 206
Geographic typing of gem corundum: a test case from Australia
Tabl
e I:
Trac
e el
emen
t con
tent
s in
ppm
of E
ast A
ustr
alia
n sa
pphi
res
dete
rmin
ed u
sing
LA-
ICP-
MS.
Loca
tion
Sam
ple
Co
lou
r (c
t wt)
Nu
mb
er
of
spo
t an
alys
es
pp
m r
ange
FeT
iC
rV
Ga
Mg
Ni
SnTa
Inverell, NSW
D15
778a
blu
e (1
.022
)2
2927
–305
455
.5–1
19.2
3.1–
9.1
3.6–
6.5
127.
2–13
5.9
17.5
–30.
0b
dl–
1.3
bd
l0.
9
D15
778b
blu
e (1
.940
)2
3391
–354
119
6.9–
227.
2b
dl
6.6
117.
1–12
0.5
0.5–
1.3
0.2–
0.4
0.9–
1.2
bd
l
D15
778c
yello
w b
lue
(0.9
84)
252
23–5
729
26.3
–69.
40.
1–0.
31.
513
7.3–
149.
29.
9–13
.1b
dl–
0.2
bd
l0.
1–0.
7
Ave
rage
b
lue
639
7811
5.8
<2.
14.
413
1.2
7.1
<0.
4<
0.4
<0.
4
D46
824
gree
n (
1.89
0)3
6787
–689
824
.0–3
0.4
0.7–
4.3
12.4
–12.
913
7.0–
139.
810
.3–1
2.1
bd
l0.
3–0.
9b
dl
D46
825
gree
n (
2.22
9)2
6898
–826
032
.8–3
5.4
1.7–
4.9
9.3–
9.6
132.
4–13
4.7
10.2
–12.
1b
dl
0.1–
0.2
bd
l
Ave
rage
gr
een
573
2130
.52.
511
.413
6.6
11.4
bd
l0.
4b
dl
New England,
NSW
D53
903
pu
rple
(0.
340)
246
42–4
966
42.4
–62.
729
0.2–
291.
237
.3–3
7.6
169.
8–17
3.1
20.0
–24.
1b
dl–
1.4
bd
lb
dl
D53
902
pu
rple
(0.
154)
278
41–8
260
69.7
–73.
472
3.2–
694.
74.
7–4.
820
7.6–
209.
639
.9–4
2.6
bd
l–0.
2b
dl
0.4–
0.9
Ave
rage
p
urp
le4
6427
62.1
499.
821
.119
0.0
31.6
<0.
4b
dl
<0.
3
Vulcan State
Forest, NSW
D53
007
gree
n–b
lue
(1.5
14)
296
26–9
982
150.
3–15
7.1
2.8–
3.2
9.0–
9.6
113.
8–11
5.3
9.7–
13.8
bd
lb
dl
0.5–
1.6
Ave
rage
gr
een
–blu
e2
9804
153.
73.
09.
311
4.6
11.8
bd
lb
dl
1.1
Barrington Tops, NSW
D54
487a
blu
e (z
on
ed)
(0.1
60)
223
90–2
747
27.2
–203
.23.
0–3.
34.
1–4.
210
1.4–
101.
845
.3–4
9.9
0.6–
2.6
bd
l–32
9.6
bd
l
Ave
rage
b
lue
(zo
ned
)2
2569
115.
23.
24.
210
1.6
47.6
1.6
164.
8b
dl
D54
487b
blu
e (0
.104
)2
4379
–472
143
6.4–
467.
412
.4–1
3.7
182.
6–18
6.6
42.1
–44.
426
5.7–
293.
33.
7–4.
6b
dl–
324.
6b
dl
D54
487c
blu
e (0
.099
)2
3747
–426
540
8.7–
426.
418
7.9–
203.
080
.0–8
6.2
29.7
–33.
326
2.5–
271.
80.
6–2.
6b
dl
bd
l
Ave
rage
blu
e6
4278
434.
710
4.3
133.
937
.427
3.3
2.9
<81
.2b
dl
D54
487d
pu
rple
(0.
105)
228
52–2
953
339.
3–34
4.5
491.
4–49
5.2
39.2
–39.
926
.1–2
8.1
236.
0–26
2.6
4.4–
5.9
bd
l–26
6.3
bd
l
D54
487e
pu
rple
(0.
241)
224
50–2
466
303.
5–32
4.6
1626
–170
033
.4–3
3.6
31.5
–32.
510
4.9–
212.
89.
4–9.
6b
dl
bd
l
Ave
rage
p
urp
le4
2680
328.
010
7836
.529
.620
4.1
7.3
<66
.6b
dl
EA
BA
R
gree
n (
0.21
1)1
6811
61.1
2.8
10.6
25.6
34.8
bd
lb
dl
bd
l
Anakie, Queensland
D42
708a
blu
e (1
.899
)2
5128
–539
629
.6–3
8.8
6.1–
6.6
6.2
120.
8–12
2.1
bd
l–3.
3b
dl–
0.2
0.3–
0.5
bd
l
D42
708b
blu
e (1
.852
)2
4518
–462
541
.1–1
19.3
1.7–
2.7
5.8–
7.3
114.
7–11
5.5
bd
lb
dl
bd
lb
dl
D42
708c
blu
e (1
.538
)2
5723
–642
641
.3–1
31.8
0.8–
1.1
7.6–
9.2
160.
5–17
6.3
bd
l–1.
5b
dl
bd
l–1.
0b
dl–
0.5
Ave
rage
b
lue
653
0367
.03.
27.
113
5.0
<0.
8<
0.0
<0.
3<
0.1
NB:
bdl
mea
ns b
elow
det
ectio
n lim
it
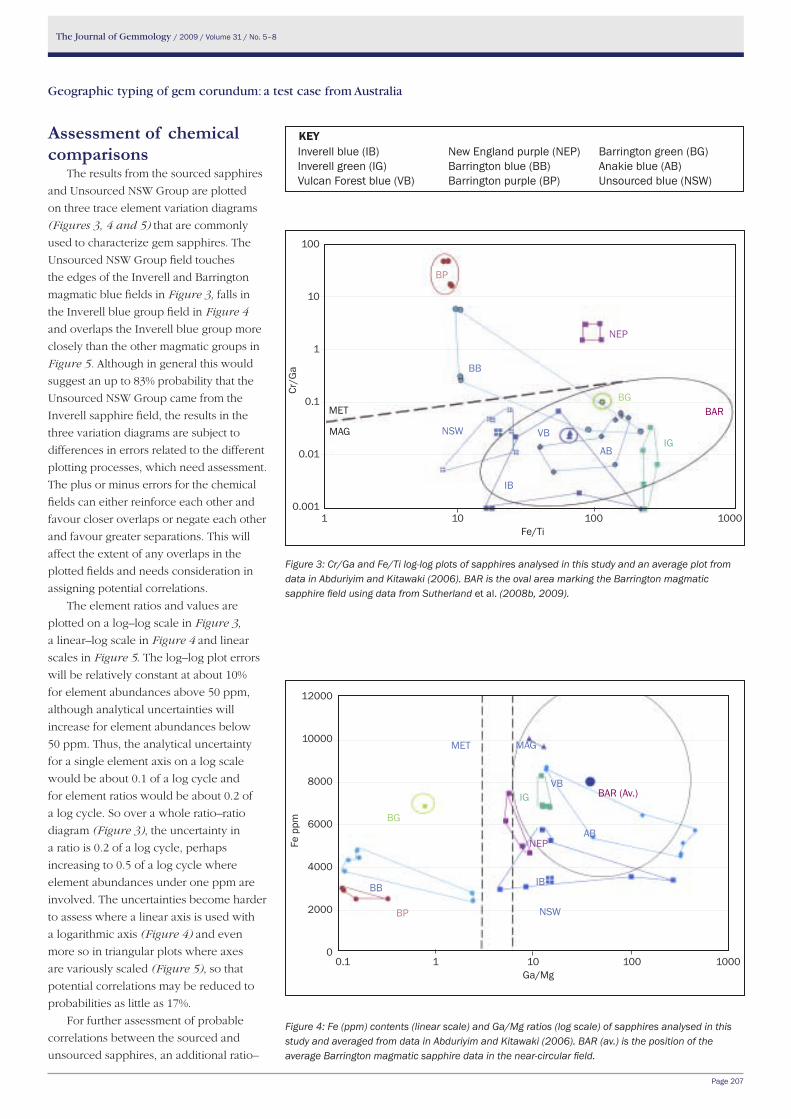
The Journal of Gemmology / 2009 / Volume 31 / No. 5–8
Page 207
Inverell blue (IB)Inverell green (IG)Vulcan Forest blue (VB)
New England purple (NEP)Barrington blue (BB)Barrington purple (BP)
Barrington green (BG)Anakie blue (AB)Unsourced blue (NSW)
Geographic typing of gem corundum: a test case from Australia
Figure 3: Cr/Ga and Fe/Ti log-log plots of sapphires analysed in this study and an average plot from data in Abduriyim and Kitawaki (2006). BAR is the oval area marking the Barrington magmatic sapphire field using data from Sutherland et al. (2008b, 2009).
Figure 4: Fe (ppm) contents (linear scale) and Ga/Mg ratios (log scale) of sapphires analysed in this study and averaged from data in Abduriyim and Kitawaki (2006). BAR (av.) is the position of the average Barrington magmatic sapphire data in the near-circular field.
Assessment of chemical comparisons
The results from the sourced sapphires
and Unsourced NSW Group are plotted
on three trace element variation diagrams
(Figures 3, 4 and 5) that are commonly
used to characterize gem sapphires. The
Unsourced NSW Group field touches
the edges of the Inverell and Barrington
magmatic blue fields in Figure 3, falls in
the Inverell blue group field in Figure 4
and overlaps the Inverell blue group more
closely than the other magmatic groups in
Figure 5. Although in general this would
suggest an up to 83% probability that the
Unsourced NSW Group came from the
Inverell sapphire field, the results in the
three variation diagrams are subject to
differences in errors related to the different
plotting processes, which need assessment.
The plus or minus errors for the chemical
fields can either reinforce each other and
favour closer overlaps or negate each other
and favour greater separations. This will
affect the extent of any overlaps in the
plotted fields and needs consideration in
assigning potential correlations.
The element ratios and values are
plotted on a log–log scale in Figure 3,
a linear–log scale in Figure 4 and linear
scales in Figure 5. The log–log plot errors
will be relatively constant at about 10%
for element abundances above 50 ppm,
although analytical uncertainties will
increase for element abundances below
50 ppm. Thus, the analytical uncertainty
for a single element axis on a log scale
would be about 0.1 of a log cycle and
for element ratios would be about 0.2 of
a log cycle. So over a whole ratio–ratio
diagram (Figure 3), the uncertainty in
a ratio is 0.2 of a log cycle, perhaps
increasing to 0.5 of a log cycle where
element abundances under one ppm are
involved. The uncertainties become harder
to assess where a linear axis is used with
a logarithmic axis (Figure 4) and even
more so in triangular plots where axes
are variously scaled (Figure 5), so that
potential correlations may be reduced to
probabilities as little as 17%.
For further assessment of probable
correlations between the sourced and
unsourced sapphires, an additional ratio–
KEY
NEP
BB
MET
MAG NSW
IB
VB
ABIG
BGBAR
100
10
1
0.1
0.01
0.001
Cr/G
a
1 10 100 1000Fe/Ti
12000
10000
8000
6000
4000
2000
0
NEP
BP
BB
MET MAG
NSW
IB
VB
AB
IG
BG
BAR (Av.)
Fe p
pm
0.1 1 10 100 1000Ga/Mg
BP
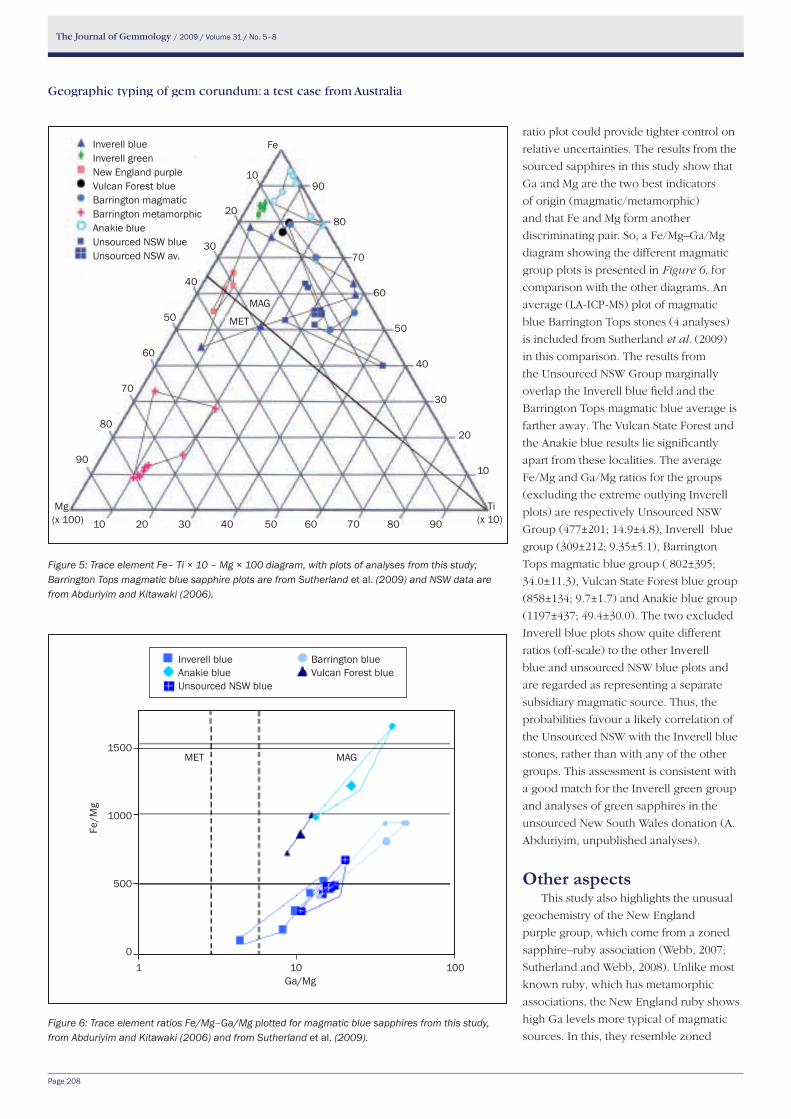
The Journal of Gemmology / 2009 / Volume 31 / No. 5–8
Page 208
Geographic typing of gem corundum: a test case from Australia
ratio plot could provide tighter control on
relative uncertainties. The results from the
sourced sapphires in this study show that
Ga and Mg are the two best indicators
of origin (magmatic/metamorphic)
and that Fe and Mg form another
discriminating pair. So, a Fe/Mg–Ga/Mg
diagram showing the different magmatic
group plots is presented in Figure 6, for
comparison with the other diagrams. An
average (LA-ICP-MS) plot of magmatic
blue Barrington Tops stones (4 analyses)
is included from Sutherland et al. (2009)
in this comparison. The results from
the Unsourced NSW Group marginally
overlap the Inverell blue field and the
Barrington Tops magmatic blue average is
farther away. The Vulcan State Forest and
the Anakie blue results lie significantly
apart from these localities. The average
Fe/Mg and Ga/Mg ratios for the groups
(excluding the extreme outlying Inverell
plots) are respectively Unsourced NSW
Group (477±201; 14.9±4.8), Inverell blue
group (309±212; 9.35±5.1), Barrington
Tops magmatic blue group ( 802±395;
34.0±11.3), Vulcan State Forest blue group
(858±134; 9.7±1.7) and Anakie blue group
(1197±437; 49.4±30.0). The two excluded
Inverell blue plots show quite different
ratios (off-scale) to the other Inverell
blue and unsourced NSW blue plots and
are regarded as representing a separate
subsidiary magmatic source. Thus, the
probabilities favour a likely correlation of
the Unsourced NSW with the Inverell blue
stones, rather than with any of the other
groups. This assessment is consistent with
a good match for the Inverell green group
and analyses of green sapphires in the
unsourced New South Wales donation (A.
Abduriyim, unpublished analyses).
other aspectsThis study also highlights the unusual
geochemistry of the New England
purple group, which come from a zoned
sapphire–ruby association (Webb, 2007;
Sutherland and Webb, 2008). Unlike most
known ruby, which has metamorphic
associations, the New England ruby shows
high Ga levels more typical of magmatic
sources. In this, they resemble zoned Figure 6: Trace element ratios Fe/Mg–Ga/Mg plotted for magmatic blue sapphires from this study, from Abduriyim and Kitawaki (2006) and from Sutherland et al. (2009).
Figure 5: Trace element Fe– Ti × 10 – Mg × 100 diagram, with plots of analyses from this study; Barrington Tops magmatic blue sapphire plots are from Sutherland et al. (2009) and NSW data are from Abduriyim and Kitawaki (2006).
Fe
10
20
30
40
50
60
70
80
90
Mg (x 100)
Inverell blueInverell greenNew England purpleVulcan Forest blueBarrington magmaticBarrington metamorphicAnakie blueUnsourced NSW blueUnsourced NSW av.
MET
MAG
90
80
70
60
50
40
30
20
10
Ti (x 10)10 20 30 40 50 60 70 80 90
Inverell blue Barrington blueAnakie blue Vulcan Forest blueUnsourced NSW blue
1500
1000
500
01 10 100
Ga/Mg
Fe/M
g
MET MAG
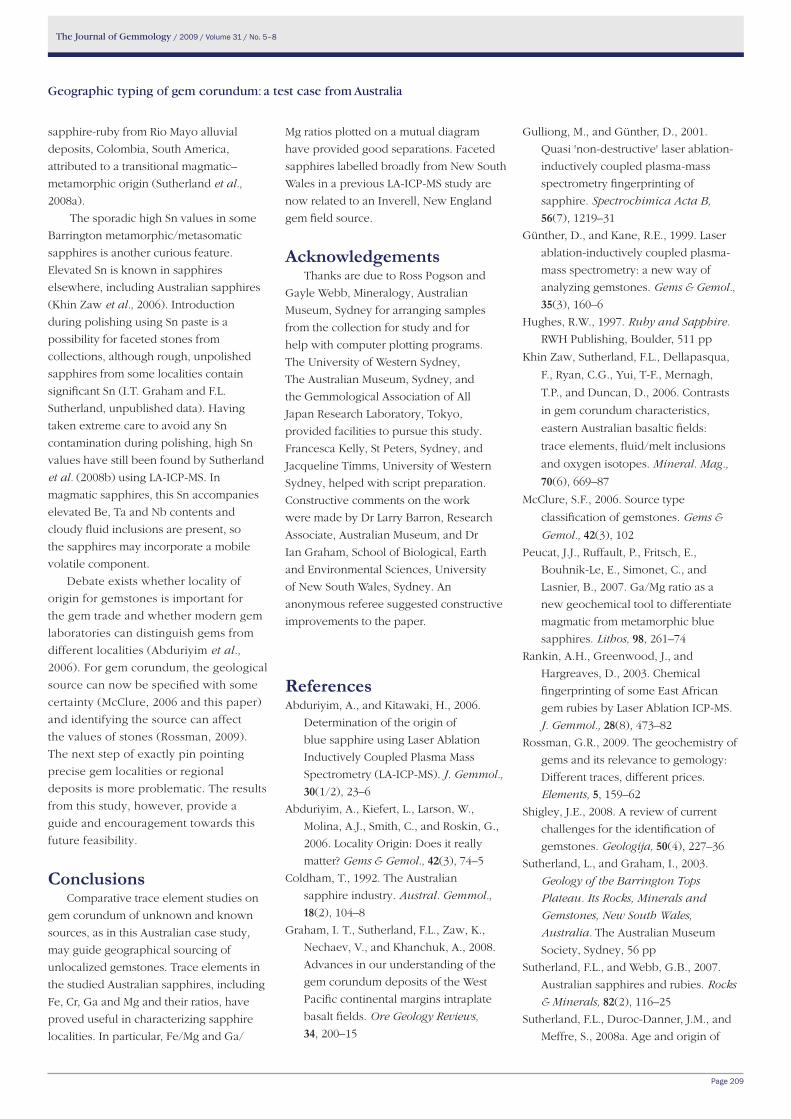
The Journal of Gemmology / 2009 / Volume 31 / No. 5–8
Page 209
sapphire-ruby from Rio Mayo alluvial
deposits, Colombia, South America,
attributed to a transitional magmatic–
metamorphic origin (Sutherland et al.,
2008a).
The sporadic high Sn values in some
Barrington metamorphic/metasomatic
sapphires is another curious feature.
Elevated Sn is known in sapphires
elsewhere, including Australian sapphires
(Khin Zaw et al., 2006). Introduction
during polishing using Sn paste is a
possibility for faceted stones from
collections, although rough, unpolished
sapphires from some localities contain
significant Sn (I.T. Graham and F.L.
Sutherland, unpublished data). Having
taken extreme care to avoid any Sn
contamination during polishing, high Sn
values have still been found by Sutherland
et al. (2008b) using LA-ICP-MS. In
magmatic sapphires, this Sn accompanies
elevated Be, Ta and Nb contents and
cloudy fluid inclusions are present, so
the sapphires may incorporate a mobile
volatile component.
Debate exists whether locality of
origin for gemstones is important for
the gem trade and whether modern gem
laboratories can distinguish gems from
different localities (Abduriyim et al.,
2006). For gem corundum, the geological
source can now be specified with some
certainty (McClure, 2006 and this paper)
and identifying the source can affect
the values of stones (Rossman, 2009).
The next step of exactly pin pointing
precise gem localities or regional
deposits is more problematic. The results
from this study, however, provide a
guide and encouragement towards this
future feasibility.
ConclusionsComparative trace element studies on
gem corundum of unknown and known
sources, as in this Australian case study,
may guide geographical sourcing of
unlocalized gemstones. Trace elements in
the studied Australian sapphires, including
Fe, Cr, Ga and Mg and their ratios, have
proved useful in characterizing sapphire
localities. In particular, Fe/Mg and Ga/
Mg ratios plotted on a mutual diagram
have provided good separations. Faceted
sapphires labelled broadly from New South
Wales in a previous LA-ICP-MS study are
now related to an Inverell, New England
gem field source.
AcknowledgementsThanks are due to Ross Pogson and
Gayle Webb, Mineralogy, Australian
Museum, Sydney for arranging samples
from the collection for study and for
help with computer plotting programs.
The University of Western Sydney,
The Australian Museum, Sydney, and
the Gemmological Association of All
Japan Research Laboratory, Tokyo,
provided facilities to pursue this study.
Francesca Kelly, St Peters, Sydney, and
Jacqueline Timms, University of Western
Sydney, helped with script preparation.
Constructive comments on the work
were made by Dr Larry Barron, Research
Associate, Australian Museum, and Dr
Ian Graham, School of Biological, Earth
and Environmental Sciences, University
of New South Wales, Sydney. An
anonymous referee suggested constructive
improvements to the paper.
References Abduriyim, A., and Kitawaki, H., 2006.
Determination of the origin of
blue sapphire using Laser Ablation
Inductively Coupled Plasma Mass
Spectrometry (LA-ICP-MS). J. Gemmol.,
30(1/2), 23–6
Abduriyim, A., Kiefert, L., Larson, W.,
Molina, A.J., Smith, C., and Roskin, G.,
2006. Locality Origin: Does it really
matter? Gems & Gemol., 42(3), 74–5
Coldham, T., 1992. The Australian
sapphire industry. Austral. Gemmol.,
18(2), 104–8
Graham, I. T., Sutherland, F.L., Zaw, K.,
Nechaev, V., and Khanchuk, A., 2008.
Advances in our understanding of the
gem corundum deposits of the West
Pacific continental margins intraplate
basalt fields. Ore Geology Reviews,
34, 200–15
Gulliong, M., and Günther, D., 2001.
Quasi 'non-destructive' laser ablation-
inductively coupled plasma-mass
spectrometry fingerprinting of
sapphire. Spectrochimica Acta B,
56(7), 1219–31
Günther, D., and Kane, R.E., 1999. Laser
ablation-inductively coupled plasma-
mass spectrometry: a new way of
analyzing gemstones. Gems & Gemol.,
35(3), 160–6
Hughes, R.W., 1997. Ruby and Sapphire.
RWH Publishing, Boulder, 511 pp
Khin Zaw, Sutherland, F.L., Dellapasqua,
F., Ryan, C.G., Yui, T-F., Mernagh,
T.P., and Duncan, D., 2006. Contrasts
in gem corundum characteristics,
eastern Australian basaltic fields:
trace elements, fluid/melt inclusions
and oxygen isotopes. Mineral. Mag.,
70(6), 669–87
McClure, S.F., 2006. Source type
classification of gemstones. Gems &
Gemol., 42(3), 102
Peucat, J.J., Ruffault, P., Fritsch, E.,
Bouhnik-Le, E., Simonet, C., and
Lasnier, B., 2007. Ga/Mg ratio as a
new geochemical tool to differentiate
magmatic from metamorphic blue
sapphires. Lithos, 98, 261–74
Rankin, A.H., Greenwood, J., and
Hargreaves, D., 2003. Chemical
fingerprinting of some East African
gem rubies by Laser Ablation ICP-MS.
J. Gemmol., 28(8), 473–82
Rossman, G.R., 2009. The geochemistry of
gems and its relevance to gemology:
Different traces, different prices.
Elements, 5, 159–62
Shigley, J.E., 2008. A review of current
challenges for the identification of
gemstones. Geologija, 50(4), 227–36
Sutherland, L., and Graham, I., 2003.
Geology of the Barrington Tops
Plateau. Its Rocks, Minerals and
Gemstones, New South Wales,
Australia. The Australian Museum
Society, Sydney, 56 pp
Sutherland, F.L., and Webb, G.B., 2007.
Australian sapphires and rubies. Rocks
& Minerals, 82(2), 116–25
Sutherland, F.L., Duroc-Danner, J.M., and
Meffre, S., 2008a. Age and origin of
Geographic typing of gem corundum: a test case from Australia
The Journal of Gemmology / 2009 / Volume 31 / No. 5–8
Page 210
gem corundum and zircon megacrysts
from the Mercaderes-Rio Mayo area,
South-west Colombia, South America.
Ore Geology Reviews, 34, 155–68
Sutherland, F.L., Zaw, K., Meffre, S.,
Giuliani, G., Fallick, A.E., and Graham,
I.T., 2008b. Applied mineralogy
in characterising origins of natural
Inverell field, New South WalesThis long established mining field
includes some of the highest grade
sapphire placer deposits known. It is
particularly renowned for its dark blue
sapphire, while ruby and fancy-coloured
sapphire are recovered as a minor
component. The sapphires are recovered
from basaltic volcaniclastic, sub-basaltic
palaeo-alluvial and recent alluvial deposits
associated with extensive alkali basaltic
eruptive rocks most of which are between
85 and 30 Ma old (from K-Ar whole-
rock basalt and reset zircon fission track
ages). The rocks overlie Devonian to
Carboniferous folded sequences and Late
Carboniferous to Early Permian granites
and volcanics that make up the New
England Orogen and are unconformably
overlain by less folded Permian to Triassic
beds of the Sydney Basin sequence.
Dating of syngenetic zircon included in the
sapphires suggest there were several ages
of gem-formation, particularly between 36
and 33 Ma.
Vulcan State Forest, New South wales
An intermittently mined sapphire
placer field in the Oberon area lies within
folded Silurian to Devonian sedimentary
and volcanic beds and Carboniferous
granites of the Lachlan Orogen, which are
overlain by Late Cenozoic alkali basalt
remnants. Associated zircon megacrysts in
the placers give fission track ages of 157 to
154, 24 to 20, 16 to 15 and 9 Ma and U-Pb
dating of these zircons indicates several
episodes of Late Cenozoic gem formation,
but no zircon included in sapphire is as
yet dated.
Anakie field, QueenslandThis major sapphire mining field is
made up of several alluvial fields lying
within an eroded alkali basaltic province
now largely represented by numerous
plugs and rare lavas (dated from 58 to
14 Ma). The sapphires are recovered
from multi-recycled alluvial deposits and
rare volcaniclastic remnants, while rare
sapphire xenocrysts and sapphire-bearing
syenite xenoliths are found in a few plugs.
The field is noted for its large yellow,
orange and black star sapphires among
the prevailing blue and green sapphires.
The basalts intruded the Anakie Inlier,
a basement feature that incorporates
Neoproterozoic to Early Palaeozoic
metamorphic rocks , a Middle Devonian
granite pluton and overlying Late Devonian
to Carboniferous sedimentary and volcanic
beds. Sapphire formation extends to ages at
least greater than 58 Ma.
Appendix I: Geological settings of analysed sapphire localities
sapphire and ruby. Ninth International
Congress for Applied Mineralogy
Proceedings, 8-10th September, 2008,
Brisbane. AUSIMM, Melbourne, 561–5
Sutherland, F.L., Zaw, K., Meffre, S.,
Giuliani, G., Fallick, A.E, Graham, I.T.,
and Webb, G.B., 2009. Gem corundum
megacrysts from East Australian basalt
fields: Trace elements, O isotopes
and origins. Austral. J. Earth Sci.,
56, 1003–20
Webb, G., 2007. Ruby suites from New
South Wales. Austral. Gemmol.,
23(3), 99–117
Barrington tops, New South wales This field is noted for near-equal
amounts of ruby, fancy coloured and blue
metamorphic sapphire and blue magmatic
sapphire. Recent mining, now ceased,
was in placers shed from the adjacent
basalt plateau, dominated by alkali basalts.
Dating of basalts, a rare gem-bearing
diatreme and associated zircon megacrysts
suggest multiple eruptive discharges of
gem materials between 61 and 4 Ma ago.
The underlying rocks consist of folded
Late Palaeozoic sequences, a Late Permian
granodiorite pluton and minor Early
Mesozoic dykes and tuffs within the New
England Orogen. At least two ages of
magmatic gem-formation are suggested
by U-Pb dating of separate zircon
megacryst types at 60 and 45 Ma, while
the metamorphic sapphire and ruby was
probably formed prior to initial basaltic
eruption.
the AuthorsDr F. lin Sutherland School of Natural Sciences, BCRI Campus, University of Western Sydney,
Locked Bag 1797, Penrith South DC, NSW 1797, Australia
Email: [email protected]
Mineralogy, Australian Museum, 6 College Street, NSW 2010, Australia
Dr Ahmadjan AbduriyimResearch Laboratory, Gemmological Association of All Japan (GAAJ)-ZENHOKYO,
5-25-11 Uneo Taitoku, Tokyo, 110-0005 Japan
Email: [email protected]
Geographic typing of gem corundum: a test case from Australia
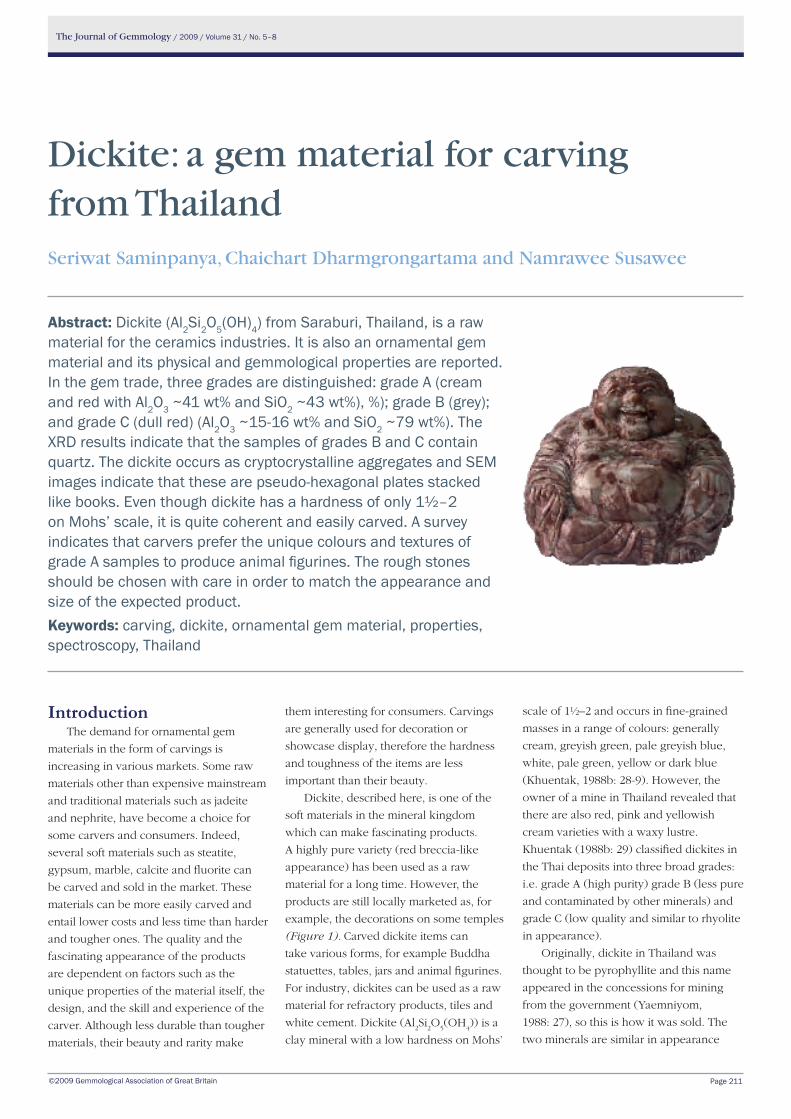
The Journal of Gemmology / 2009 / Volume 31 / No. 5–8
©2009 Gemmological Association of Great Britain Page 211
them interesting for consumers. Carvings
are generally used for decoration or
showcase display, therefore the hardness
and toughness of the items are less
important than their beauty.
Dickite, described here, is one of the
soft materials in the mineral kingdom
which can make fascinating products.
A highly pure variety (red breccia-like
appearance) has been used as a raw
material for a long time. However, the
products are still locally marketed as, for
example, the decorations on some temples
(Figure 1). Carved dickite items can
take various forms, for example Buddha
statuettes, tables, jars and animal figurines.
For industry, dickites can be used as a raw
material for refractory products, tiles and
white cement. Dickite (Al2Si
2O
5(OH
4)) is a
clay mineral with a low hardness on Mohs’
IntroductionThe demand for ornamental gem
materials in the form of carvings is
increasing in various markets. Some raw
materials other than expensive mainstream
and traditional materials such as jadeite
and nephrite, have become a choice for
some carvers and consumers. Indeed,
several soft materials such as steatite,
gypsum, marble, calcite and fluorite can
be carved and sold in the market. These
materials can be more easily carved and
entail lower costs and less time than harder
and tougher ones. The quality and the
fascinating appearance of the products
are dependent on factors such as the
unique properties of the material itself, the
design, and the skill and experience of the
carver. Although less durable than tougher
materials, their beauty and rarity make
scale of 1½–2 and occurs in fine-grained
masses in a range of colours: generally
cream, greyish green, pale greyish blue,
white, pale green, yellow or dark blue
(Khuentak, 1988b: 28-9). However, the
owner of a mine in Thailand revealed that
there are also red, pink and yellowish
cream varieties with a waxy lustre.
Khuentak (1988b: 29) classified dickites in
the Thai deposits into three broad grades:
i.e. grade A (high purity) grade B (less pure
and contaminated by other minerals) and
grade C (low quality and similar to rhyolite
in appearance).
Originally, dickite in Thailand was
thought to be pyrophyllite and this name
appeared in the concessions for mining
from the government (Yaemniyom,
1988: 27), so this is how it was sold. The
two minerals are similar in appearance
Dickite: a gem material for carving from ThailandSeriwat Saminpanya, Chaichart Dharmgrongartama and Namrawee Susawee
Abstract: Dickite (Al2Si2O5(OH)4) from Saraburi, Thailand, is a raw material for the ceramics industries. It is also an ornamental gem material and its physical and gemmological properties are reported. In the gem trade, three grades are distinguished: grade A (cream and red with Al2O3 ~41 wt% and SiO2 ~43 wt%), %); grade B (grey); and grade C (dull red) (Al2O3 ~15-16 wt% and SiO2 ~79 wt%). The XRD results indicate that the samples of grades B and C contain quartz. The dickite occurs as cryptocrystalline aggregates and SeM images indicate that these are pseudo-hexagonal plates stacked like books. Even though dickite has a hardness of only 1½–2 on Mohs’ scale, it is quite coherent and easily carved. A survey indicates that carvers prefer the unique colours and textures of grade A samples to produce animal figurines. The rough stones should be chosen with care in order to match the appearance and size of the expected product.Keywords: carving, dickite, ornamental gem material, properties, spectroscopy, Thailand
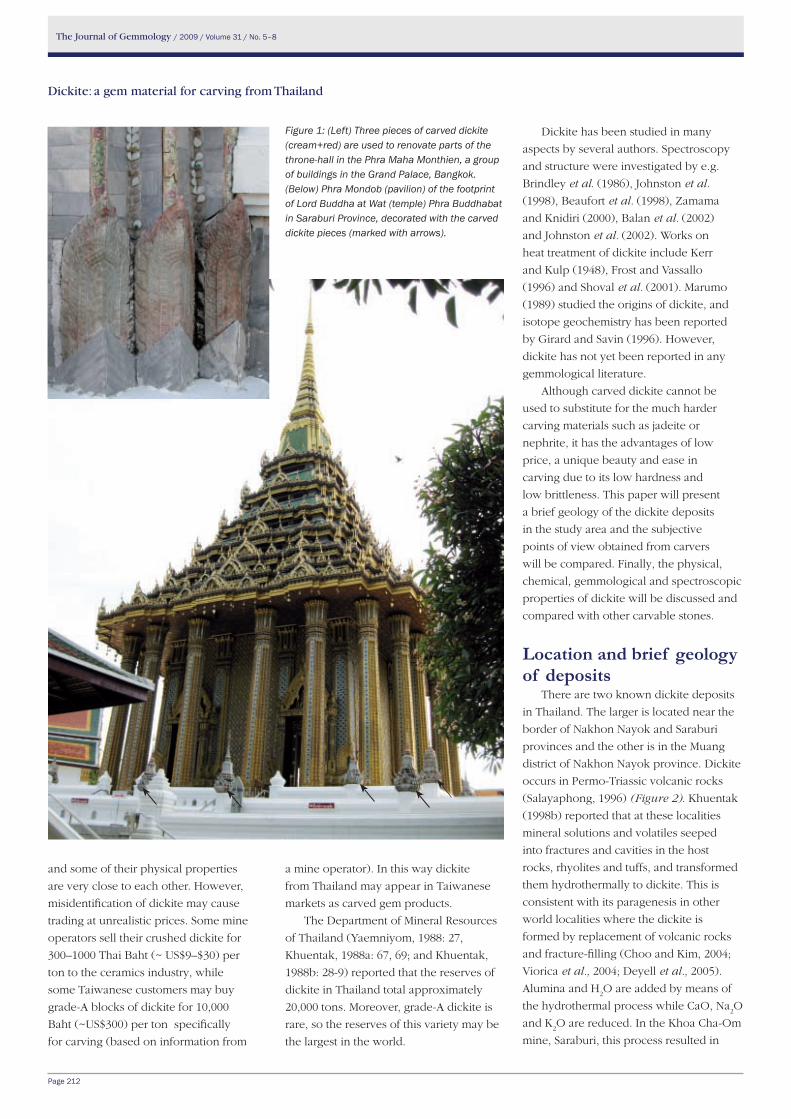
The Journal of Gemmology / 2009 / Volume 31 / No. 5–8
Page 212
and some of their physical properties
are very close to each other. However,
misidentification of dickite may cause
trading at unrealistic prices. Some mine
operators sell their crushed dickite for
300–1000 Thai Baht (~ US$9–$30) per
ton to the ceramics industry, while
some Taiwanese customers may buy
grade-A blocks of dickite for 10,000
Baht (~US$300) per ton specifically
for carving (based on information from
Figure 1: (Left) Three pieces of carved dickite (cream+red) are used to renovate parts of the throne-hall in the Phra Maha Monthien, a group of buildings in the Grand Palace, Bangkok. (Below) Phra Mondob (pavilion) of the footprint of Lord Buddha at Wat (temple) Phra Buddhabat in Saraburi Province, decorated with the carved dickite pieces (marked with arrows).
a mine operator). In this way dickite
from Thailand may appear in Taiwanese
markets as carved gem products.
The Department of Mineral Resources
of Thailand (Yaemniyom, 1988: 27,
Khuentak, 1988a: 67, 69; and Khuentak,
1988b: 28-9) reported that the reserves of
dickite in Thailand total approximately
20,000 tons. Moreover, grade-A dickite is
rare, so the reserves of this variety may be
the largest in the world.
Dickite has been studied in many
aspects by several authors. Spectroscopy
and structure were investigated by e.g.
Brindley et al. (1986), Johnston et al.
(1998), Beaufort et al. (1998), Zamama
and Knidiri (2000), Balan et al. (2002)
and Johnston et al. (2002). Works on
heat treatment of dickite include Kerr
and Kulp (1948), Frost and Vassallo
(1996) and Shoval et al. (2001). Marumo
(1989) studied the origins of dickite, and
isotope geochemistry has been reported
by Girard and Savin (1996). However,
dickite has not yet been reported in any
gemmological literature.
Although carved dickite cannot be
used to substitute for the much harder
carving materials such as jadeite or
nephrite, it has the advantages of low
price, a unique beauty and ease in
carving due to its low hardness and
low brittleness. This paper will present
a brief geology of the dickite deposits
in the study area and the subjective
points of view obtained from carvers
will be compared. Finally, the physical,
chemical, gemmological and spectroscopic
properties of dickite will be discussed and
compared with other carvable stones.
location and brief geology of deposits
There are two known dickite deposits
in Thailand. The larger is located near the
border of Nakhon Nayok and Saraburi
provinces and the other is in the Muang
district of Nakhon Nayok province. Dickite
occurs in Permo-Triassic volcanic rocks
(Salayaphong, 1996) (Figure 2). Khuentak
(1998b) reported that at these localities
mineral solutions and volatiles seeped
into fractures and cavities in the host
rocks, rhyolites and tuffs, and transformed
them hydrothermally to dickite. This is
consistent with its paragenesis in other
world localities where the dickite is
formed by replacement of volcanic rocks
and fracture-filling (Choo and Kim, 2004;
Viorica et al., 2004; Deyell et al., 2005).
Alumina and H2O are added by means of
the hydrothermal process while CaO, Na2O
and K2O are reduced. In the Khoa Cha-Om
mine, Saraburi, this process resulted in
Dickite: a gem material for carving from Thailand
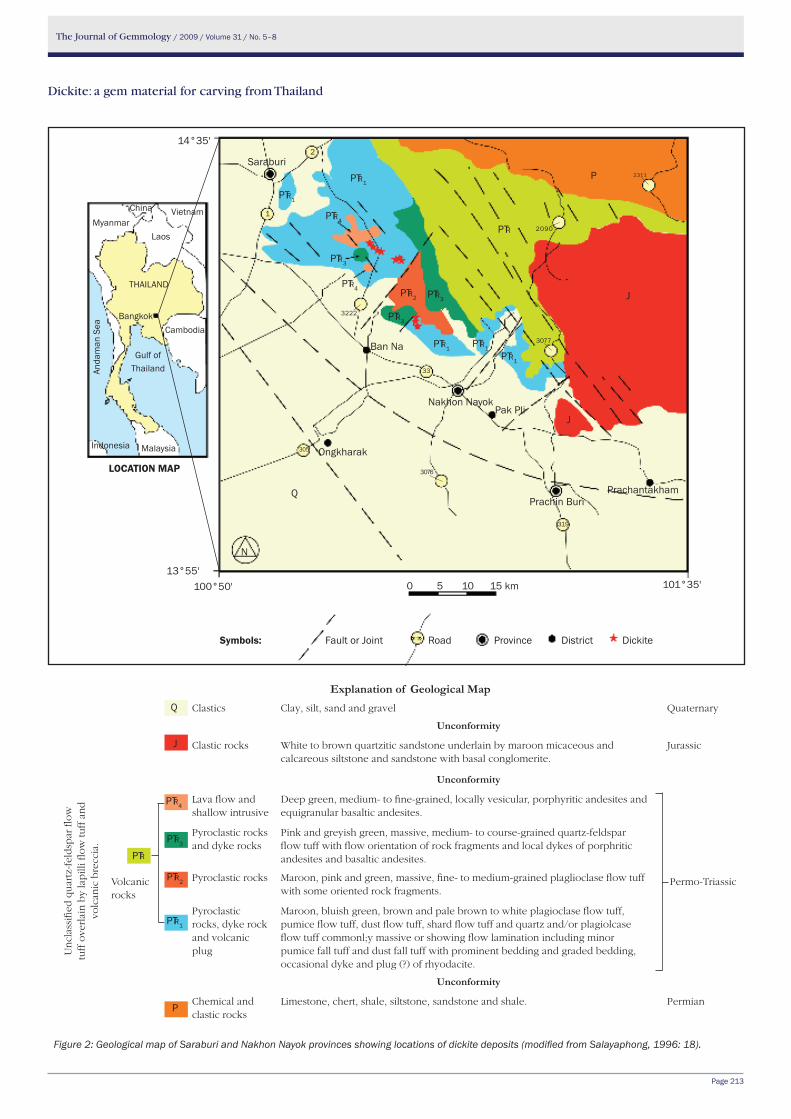
The Journal of Gemmology / 2009 / Volume 31 / No. 5–8
Page 213
Figure 2: Geological map of Saraburi and Nakhon Nayok provinces showing locations of dickite deposits (modified from Salayaphong, 1996: 18).
explanation of Geological MapClastics Clay, silt, sand and gravel Quaternary
unconformity
Clastic rocks White to brown quartzitic sandstone underlain by maroon micaceous and calcareous siltstone and sandstone with basal conglomerite.
Jurassic
unconformity
Un
clas
sifi
ed q
uar
tz-f
eld
spar
flo
w
tuff
ove
rlai
n b
y la
pill
i flo
w tu
ff a
nd
vo
lcan
ic b
recc
ia.
Volcanic rocks
Lava flow and shallow intrusive
Deep green, medium- to fine-grained, locally vesicular, porphyritic andesites and equigranular basaltic andesites.
Permo-Triassic
Pyroclastic rocks and dyke rocks
Pink and greyish green, massive, medium- to course-grained quartz-feldspar flow tuff with flow orientation of rock fragments and local dykes of porphritic andesites and basaltic andesites.
Pyroclastic rocks Maroon, pink and green, massive, fine- to medium-grained plaglioclase flow tuff with some oriented rock fragments.
Pyroclastic rocks, dyke rock and volcanic plug
Maroon, bluish green, brown and pale brown to white plagioclase flow tuff, pumice flow tuff, dust flow tuff, shard flow tuff and quartz and/or plagiolcase flow tuff commonl;y massive or showing flow lamination including minor pumice fall tuff and dust fall tuff with prominent bedding and graded bedding, occasional dyke and plug (?) of rhyodacite.
unconformity
Chemical and clastic rocks
Limestone, chert, shale, siltstone, sandstone and shale. Permian
LOCATION MAP
Symbols: Fault or Joint Road Province District Dickite
0 5 10 15 km 101°35'100°50'13°55'
14°35'
PTR4
PTR3
PTR2
PTR1
P
J
Q
PTR
PTR
PTR1
PTR1
PTR1
PTR1
PTR1
PTR2
PTR3
PTR3
PTR3
PTR4
2
PTR4
J
P
J
Q
N
Prachantakham
Indonesia
Bangkok
ThAILAND
MyanmarChina
Gulf of Thailand
Malaysia Ongkharak
Nakhon Nayok
Vietnam
Laos
Pak Pli
Saraburi
Ban Na
Prachin Buri
Anda
man
Sea Cambodia
33
319
1
3076
3222
3077
2090
2311
305
Dickite: a gem material for carving from Thailand
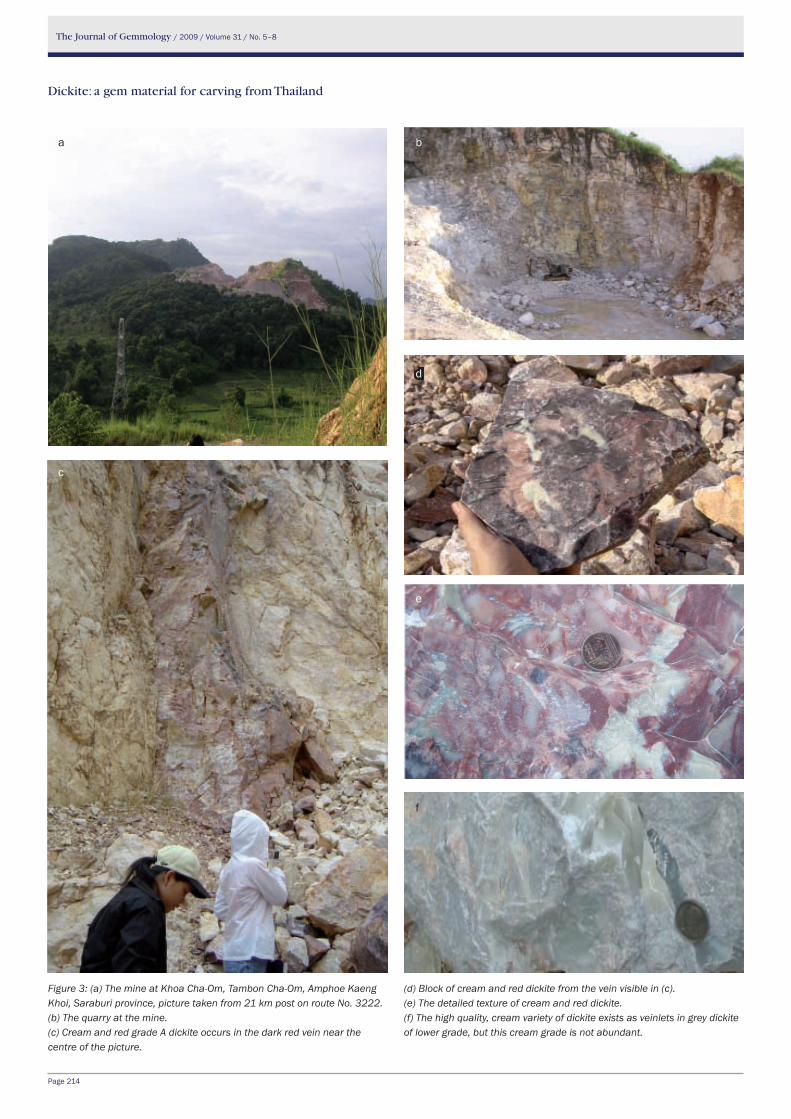
The Journal of Gemmology / 2009 / Volume 31 / No. 5–8
Page 214
Figure 3: (a) The mine at Khoa Cha-Om, Tambon Cha-Om, Amphoe Kaeng Khoi, Saraburi province, picture taken from 21 km post on route No. 3222. (b) The quarry at the mine.(c) Cream and red grade A dickite occurs in the dark red vein near the centre of the picture.
(d) Block of cream and red dickite from the vein visible in (c).(e) The detailed texture of cream and red dickite.(f) The high quality, cream variety of dickite exists as veinlets in grey dickite of lower grade, but this cream grade is not abundant.
b
c
d
f
Dickite: a gem material for carving from Thailand
e
a
f
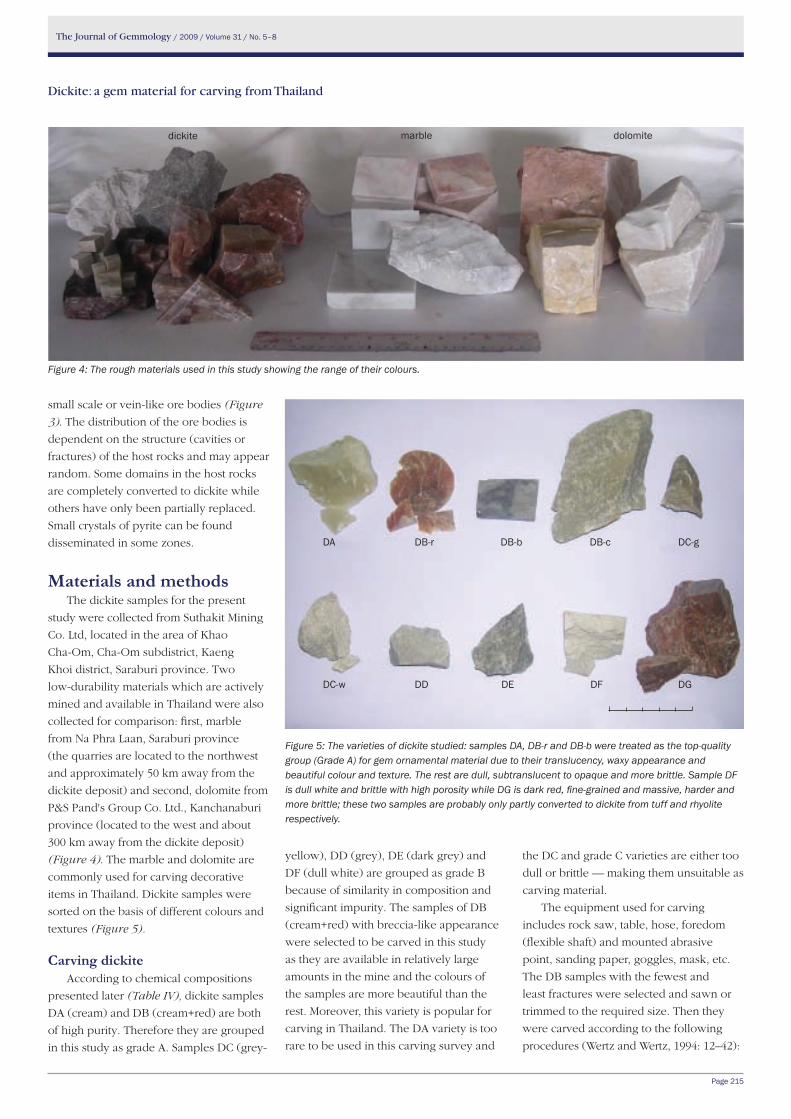
The Journal of Gemmology / 2009 / Volume 31 / No. 5–8
Page 215
small scale or vein-like ore bodies (Figure
3). The distribution of the ore bodies is
dependent on the structure (cavities or
fractures) of the host rocks and may appear
random. Some domains in the host rocks
are completely converted to dickite while
others have only been partially replaced.
Small crystals of pyrite can be found
disseminated in some zones.
Materials and methodsThe dickite samples for the present
study were collected from Suthakit Mining
Co. Ltd, located in the area of Khao
Cha-Om, Cha-Om subdistrict, Kaeng
Khoi district, Saraburi province. Two
low-durability materials which are actively
mined and available in Thailand were also
collected for comparison: first, marble
from Na Phra Laan, Saraburi province
(the quarries are located to the northwest
and approximately 50 km away from the
dickite deposit) and second, dolomite from
P&S Pand's Group Co. Ltd., Kanchanaburi
province (located to the west and about
300 km away from the dickite deposit)
(Figure 4). The marble and dolomite are
commonly used for carving decorative
items in Thailand. Dickite samples were
sorted on the basis of different colours and
textures (Figure 5).
Carving dickiteAccording to chemical compositions
presented later (Table IV), dickite samples
DA (cream) and DB (cream+red) are both
of high purity. Therefore they are grouped
in this study as grade A. Samples DC (grey-
yellow), DD (grey), DE (dark grey) and
DF (dull white) are grouped as grade B
because of similarity in composition and
significant impurity. The samples of DB
(cream+red) with breccia-like appearance
were selected to be carved in this study
as they are available in relatively large
amounts in the mine and the colours of
the samples are more beautiful than the
rest. Moreover, this variety is popular for
carving in Thailand. The DA variety is too
rare to be used in this carving survey and
the DC and grade C varieties are either too
dull or brittle — making them unsuitable as
carving material.
The equipment used for carving
includes rock saw, table, hose, foredom
(flexible shaft) and mounted abrasive
point, sanding paper, goggles, mask, etc.
The DB samples with the fewest and
least fractures were selected and sawn or
trimmed to the required size. Then they
were carved according to the following
procedures (Wertz and Wertz, 1994: 12–42):
Figure 4: The rough materials used in this study showing the range of their colours.
Figure 5: The varieties of dickite studied: samples DA, DB-r and DB-b were treated as the top-quality group (Grade A) for gem ornamental material due to their translucency, waxy appearance and beautiful colour and texture. The rest are dull, subtranslucent to opaque and more brittle. Sample DF is dull white and brittle with high porosity while DG is dark red, fine-grained and massive, harder and more brittle; these two samples are probably only partly converted to dickite from tuff and rhyolite respectively.
dickite dolomitemarble
0 1 2 3 4 5 cm
DB-rDA
DGDFDeDDDC-w
DC-gDB-cDB-b
Dickite: a gem material for carving from Thailand
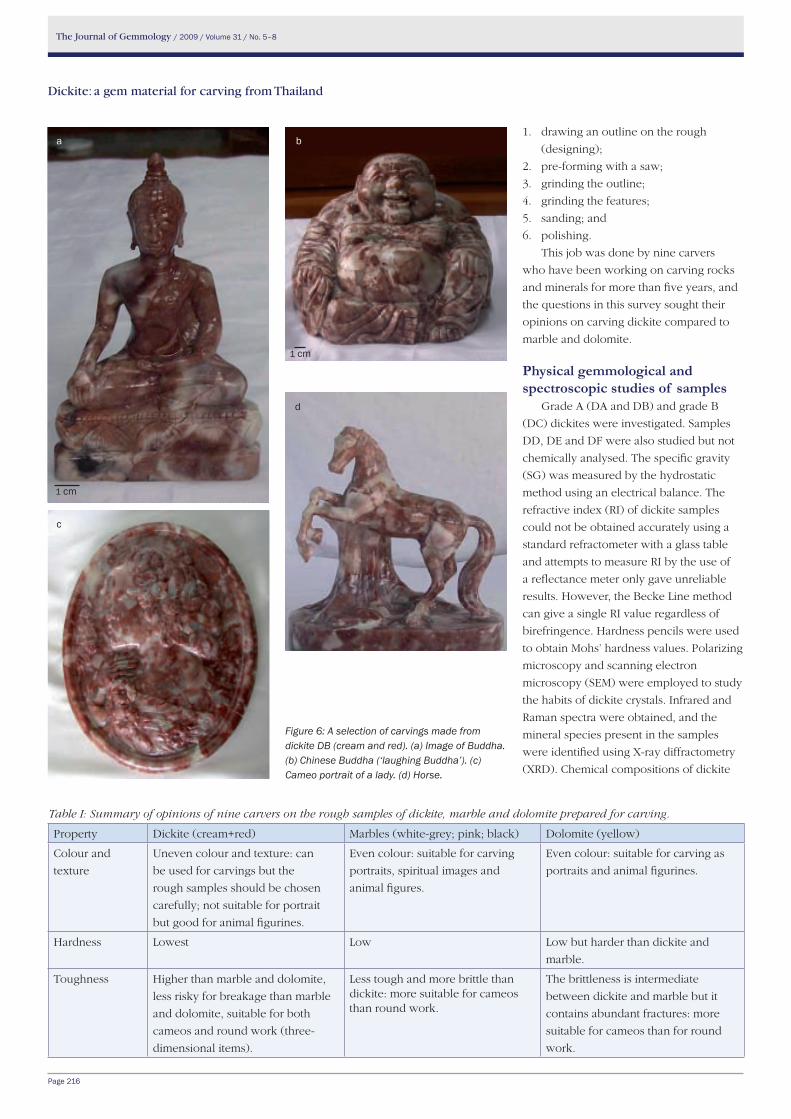
The Journal of Gemmology / 2009 / Volume 31 / No. 5–8
Page 216
Figure 6: A selection of carvings made from dickite DB (cream and red). (a) Image of Buddha. (b) Chinese Buddha (‘laughing Buddha’). (c) Cameo portrait of a lady. (d) Horse.
1. drawing an outline on the rough
(designing);
2. pre-forming with a saw;
3. grinding the outline;
4. grinding the features;
5. sanding; and
6. polishing.
This job was done by nine carvers
who have been working on carving rocks
and minerals for more than five years, and
the questions in this survey sought their
opinions on carving dickite compared to
marble and dolomite.
Physical gemmological and spectroscopic studies of samples
Grade A (DA and DB) and grade B
(DC) dickites were investigated. Samples
DD, DE and DF were also studied but not
chemically analysed. The specific gravity
(SG) was measured by the hydrostatic
method using an electrical balance. The
refractive index (RI) of dickite samples
could not be obtained accurately using a
standard refractometer with a glass table
and attempts to measure RI by the use of
a reflectance meter only gave unreliable
results. However, the Becke Line method
can give a single RI value regardless of
birefringence. Hardness pencils were used
to obtain Mohs’ hardness values. Polarizing
microscopy and scanning electron
microscopy (SEM) were employed to study
the habits of dickite crystals. Infrared and
Raman spectra were obtained, and the
mineral species present in the samples
were identified using X-ray diffractometry
(XRD). Chemical compositions of dickite
Table I: Summary of opinions of nine carvers on the rough samples of dickite, marble and dolomite prepared for carving.
Property Dickite (cream+red) Marbles (white-grey; pink; black) Dolomite (yellow)
Colour and
texture
Uneven colour and texture: can
be used for carvings but the
rough samples should be chosen
carefully; not suitable for portrait
but good for animal figurines.
Even colour: suitable for carving
portraits, spiritual images and
animal figures.
Even colour: suitable for carving as
portraits and animal figurines.
Hardness Lowest Low Low but harder than dickite and
marble.
Toughness Higher than marble and dolomite,
less risky for breakage than marble
and dolomite, suitable for both
cameos and round work (three-
dimensional items).
Less tough and more brittle than dickite: more suitable for cameos than round work.
The brittleness is intermediate
between dickite and marble but it
contains abundant fractures: more
suitable for cameos than for round
work.
1 cm
1 cm
a
d
c
b
Dickite: a gem material for carving from Thailand
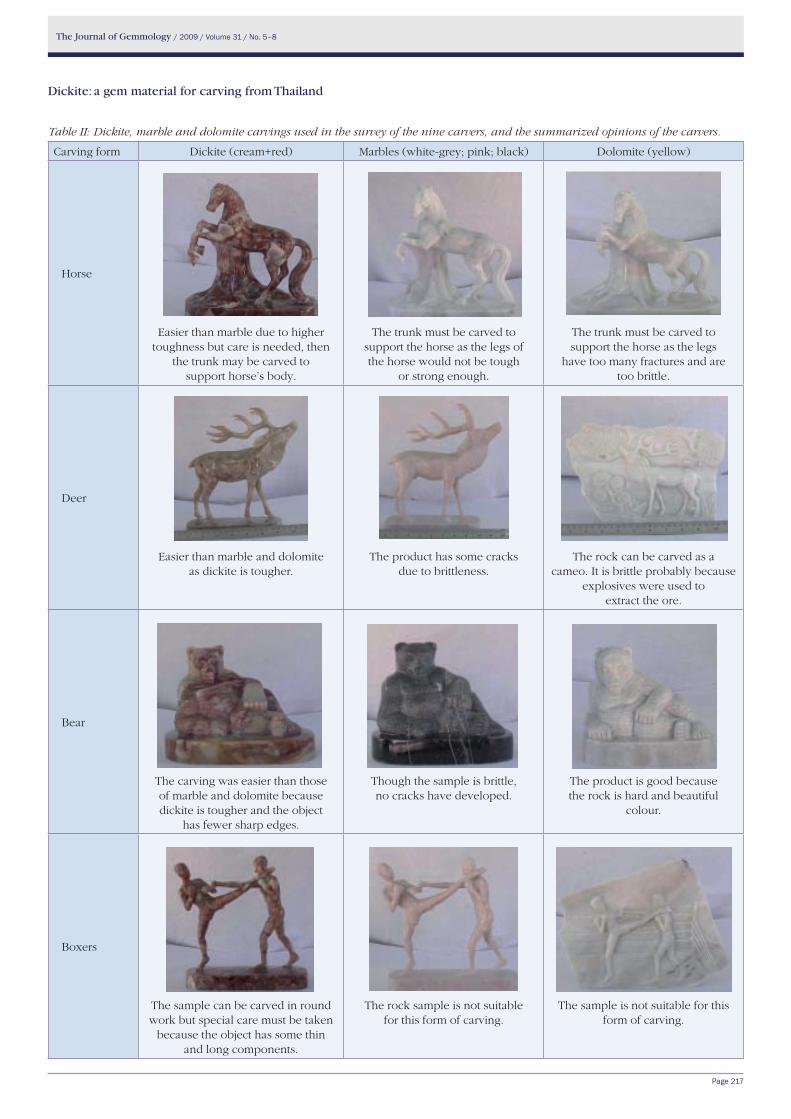
The Journal of Gemmology / 2009 / Volume 31 / No. 5–8
Page 217
Table II: Dickite, marble and dolomite carvings used in the survey of the nine carvers, and the summarized opinions of the carvers.
Carving form Dickite (cream+red) Marbles (white-grey; pink; black) Dolomite (yellow)
Horse
Easier than marble due to higher toughness but care is needed, then
the trunk may be carved to support horse’s body.
The trunk must be carved to support the horse as the legs of the horse would not be tough
or strong enough.
The trunk must be carved to support the horse as the legs
have too many fractures and are too brittle.
Deer
Easier than marble and dolomite as dickite is tougher.
The product has some cracks due to brittleness.
The rock can be carved as a cameo. It is brittle probably because
explosives were used to extract the ore.
Bear
The carving was easier than those of marble and dolomite because dickite is tougher and the object
has fewer sharp edges.
Though the sample is brittle, no cracks have developed.
The product is good because the rock is hard and beautiful
colour.
Boxers
The sample can be carved in round work but special care must be taken
because the object has some thin and long components.
The rock sample is not suitable for this form of carving.
The sample is not suitable for this form of carving.
Dickite: a gem material for carving from Thailand
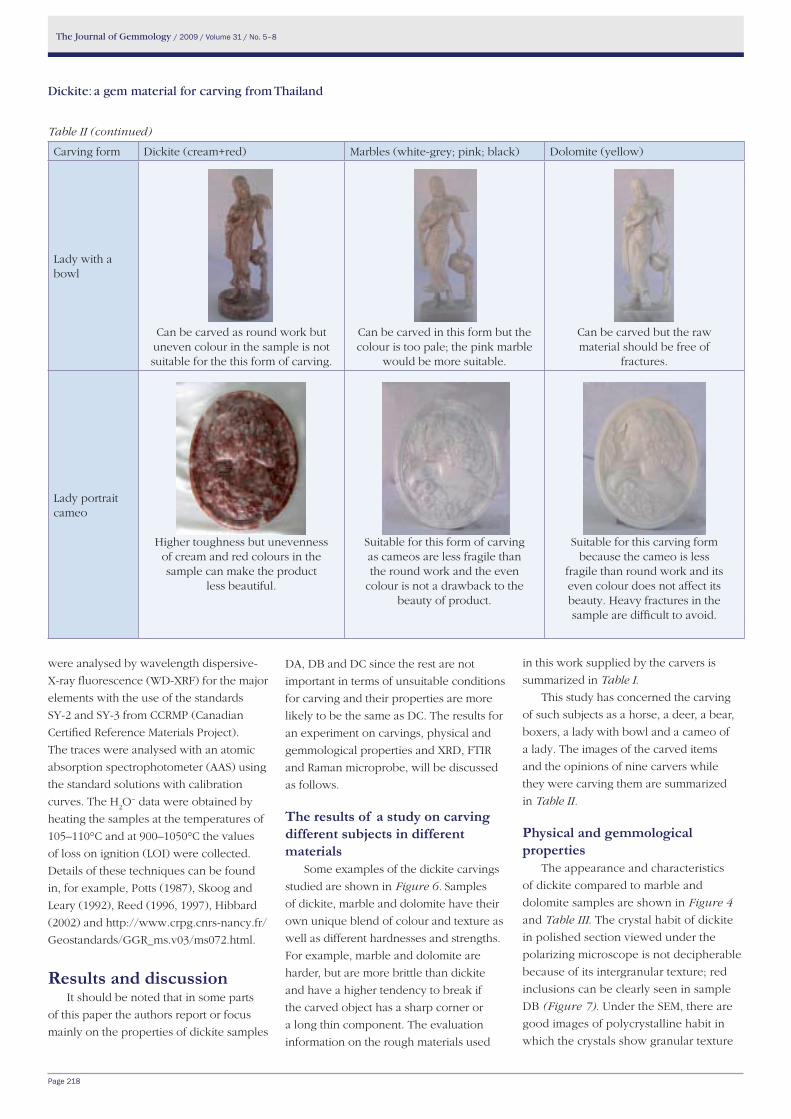
The Journal of Gemmology / 2009 / Volume 31 / No. 5–8
Page 218
were analysed by wavelength dispersive-
X-ray fluorescence (WD-XRF) for the major
elements with the use of the standards
SY-2 and SY-3 from CCRMP (Canadian
Certified Reference Materials Project).
The traces were analysed with an atomic
absorption spectrophotometer (AAS) using
the standard solutions with calibration
curves. The H2O− data were obtained by
heating the samples at the temperatures of
105–110°C and at 900–1050°C the values
of loss on ignition (LOI) were collected.
Details of these techniques can be found
in, for example, Potts (1987), Skoog and
Leary (1992), Reed (1996, 1997), Hibbard
(2002) and http://www.crpg.cnrs-nancy.fr/
Geostandards/GGR_ms.v03/ms072.html.
Results and discussionIt should be noted that in some parts
of this paper the authors report or focus
mainly on the properties of dickite samples
DA, DB and DC since the rest are not
important in terms of unsuitable conditions
for carving and their properties are more
likely to be the same as DC. The results for
an experiment on carvings, physical and
gemmological properties and XRD, FTIR
and Raman microprobe, will be discussed
as follows.
the results of a study on carving different subjects in different materials
Some examples of the dickite carvings
studied are shown in Figure 6. Samples
of dickite, marble and dolomite have their
own unique blend of colour and texture as
well as different hardnesses and strengths.
For example, marble and dolomite are
harder, but are more brittle than dickite
and have a higher tendency to break if
the carved object has a sharp corner or
a long thin component. The evaluation
information on the rough materials used
in this work supplied by the carvers is
summarized in Table I.
This study has concerned the carving
of such subjects as a horse, a deer, a bear,
boxers, a lady with bowl and a cameo of
a lady. The images of the carved items
and the opinions of nine carvers while
they were carving them are summarized
in Table II.
Physical and gemmological properties
The appearance and characteristics
of dickite compared to marble and
dolomite samples are shown in Figure 4
and Table III. The crystal habit of dickite
in polished section viewed under the
polarizing microscope is not decipherable
because of its intergranular texture; red
inclusions can be clearly seen in sample
DB (Figure 7). Under the SEM, there are
good images of polycrystalline habit in
which the crystals show granular texture
Table II (continued)
Carving form Dickite (cream+red) Marbles (white-grey; pink; black) Dolomite (yellow)
Lady with a bowl
Can be carved as round work but uneven colour in the sample is not suitable for the this form of carving.
Can be carved in this form but the colour is too pale; the pink marble
would be more suitable.
Can be carved but the raw material should be free of
fractures.
Lady portrait cameo
Higher toughness but unevenness of cream and red colours in the sample can make the product
less beautiful.
Suitable for this form of carving as cameos are less fragile than the round work and the even
colour is not a drawback to the beauty of product.
Suitable for this carving form because the cameo is less
fragile than round work and its even colour does not affect its beauty. Heavy fractures in the sample are difficult to avoid.
Dickite: a gem material for carving from Thailand
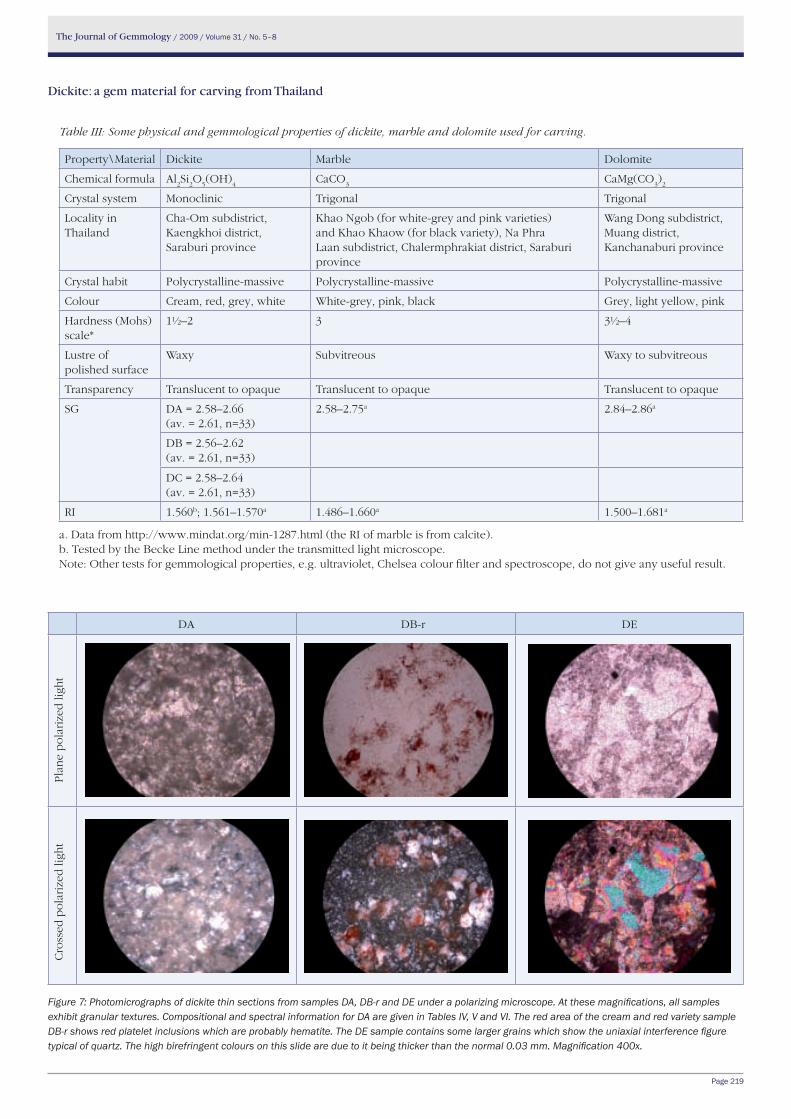
The Journal of Gemmology / 2009 / Volume 31 / No. 5–8
Page 219
Table III: Some physical and gemmological properties of dickite, marble and dolomite used for carving.
Property\Material Dickite Marble Dolomite
Chemical formula Al2Si
2O
5(OH)
4CaCO
3CaMg(CO
3)
2
Crystal system Monoclinic Trigonal Trigonal
Locality in Thailand
Cha-Om subdistrict, Kaengkhoi district, Saraburi province
Khao Ngob (for white-grey and pink varieties) and Khao Khaow (for black variety), Na Phra Laan subdistrict, Chalermphrakiat district, Saraburi province
Wang Dong subdistrict, Muang district, Kanchanaburi province
Crystal habit Polycrystalline-massive Polycrystalline-massive Polycrystalline-massive
Colour Cream, red, grey, white White-grey, pink, black Grey, light yellow, pink
Hardness (Mohs) scale*
1½–2 3 3½–4
Lustre of polished surface
Waxy Subvitreous Waxy to subvitreous
Transparency Translucent to opaque Translucent to opaque Translucent to opaque
SG DA = 2.58–2.66 (av. = 2.61, n=33)
2.58–2.75a 2.84–2.86a
DB = 2.56–2.62(av. = 2.61, n=33)
DC = 2.58–2.64(av. = 2.61, n=33)
RI 1.560b; 1.561–1.570a 1.486–1.660a 1.500–1.681a
a. Data from http://www.mindat.org/min-1287.html (the RI of marble is from calcite).b. Tested by the Becke Line method under the transmitted light microscope.Note: Other tests for gemmological properties, e.g. ultraviolet, Chelsea colour filter and spectroscope, do not give any useful result.
Figure 7: Photomicrographs of dickite thin sections from samples DA, DB-r and DE under a polarizing microscope. At these magnifications, all samples exhibit granular textures. Compositional and spectral information for DA are given in Tables IV, V and VI. The red area of the cream and red variety sample DB-r shows red platelet inclusions which are probably hematite. The DE sample contains some larger grains which show the uniaxial interference figure typical of quartz. The high birefringent colours on this slide are due to it being thicker than the normal 0.03 mm. Magnification 400x.
DA DB-r DE
Pla
ne
po
lari
zed
ligh
tC
ross
ed p
ola
rize
d li
ght
Dickite: a gem material for carving from Thailand
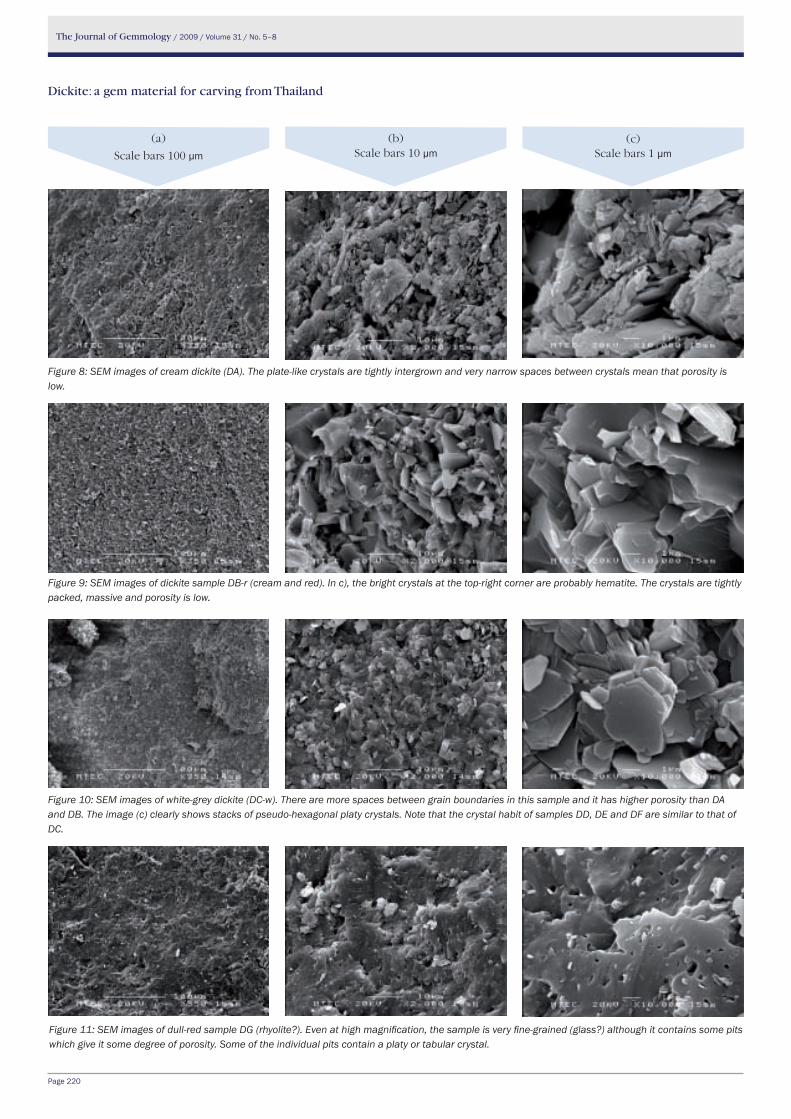
The Journal of Gemmology / 2009 / Volume 31 / No. 5–8
Page 220
Figure 10: SEM images of white-grey dickite (DC-w). There are more spaces between grain boundaries in this sample and it has higher porosity than DA and DB. The image (c) clearly shows stacks of pseudo-hexagonal platy crystals. Note that the crystal habit of samples DD, DE and DF are similar to that of DC.
Figure 11: SEM images of dull-red sample DG (rhyolite?). Even at high magnification, the sample is very fine-grained (glass?) although it contains some pits which give it some degree of porosity. Some of the individual pits contain a platy or tabular crystal.
Figure 8: SEM images of cream dickite (DA). The plate-like crystals are tightly intergrown and very narrow spaces between crystals mean that porosity is low.
Figure 9: SEM images of dickite sample DB-r (cream and red). In c), the bright crystals at the top-right corner are probably hematite. The crystals are tightly packed, massive and porosity is low.
(a)
Scale bars 100 μm
(b) Scale bars 10 μm
(c) Scale bars 1 μm
Dickite: a gem material for carving from Thailand
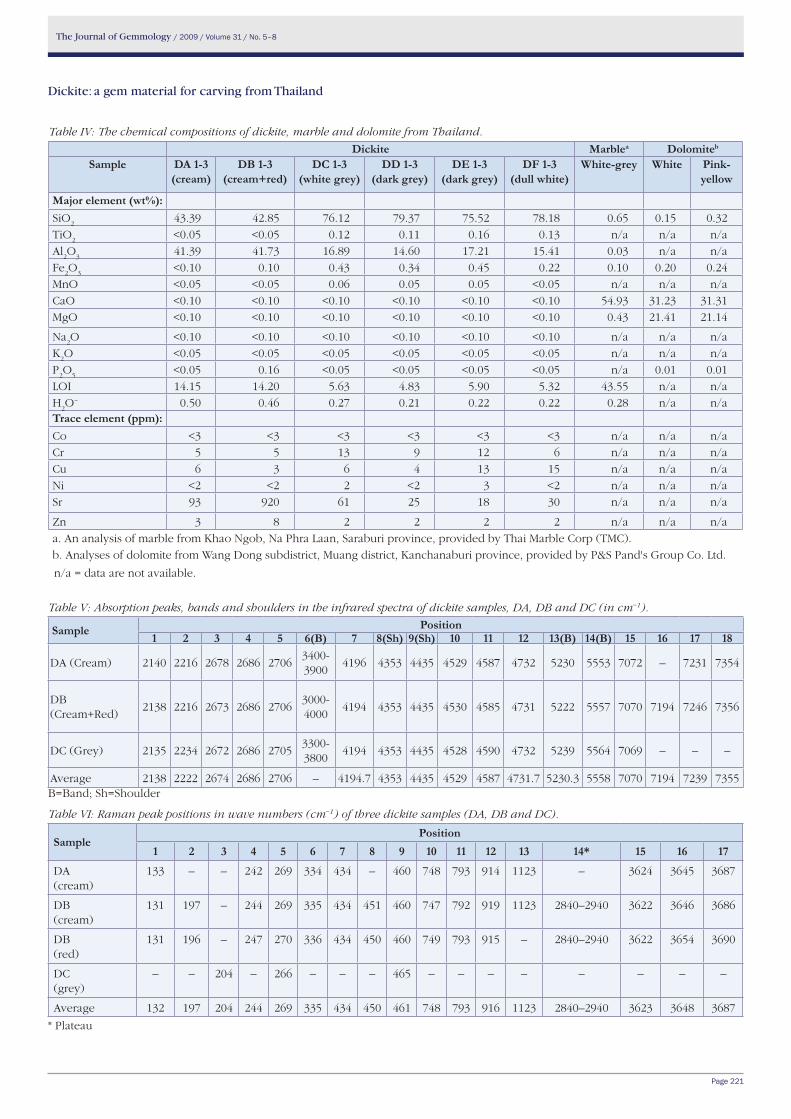
The Journal of Gemmology / 2009 / Volume 31 / No. 5–8
Page 221
Table V: Absorption peaks, bands and shoulders in the infrared spectra of dickite samples, DA, DB and DC (in cm−1).
Sample Position1 2 3 4 5 6(B) 7 8(Sh) 9(Sh) 10 11 12 13(B) 14(B) 15 16 17 18
DA (Cream) 2140 2216 2678 2686 27063400-3900
4196 4353 4435 4529 4587 4732 5230 5553 7072 – 7231 7354
DB(Cream+Red)
2138 2216 2673 2686 27063000-4000
4194 4353 4435 4530 4585 4731 5222 5557 7070 7194 7246 7356
DC (Grey) 2135 2234 2672 2686 27053300-3800
4194 4353 4435 4528 4590 4732 5239 5564 7069 – – –
Average 2138 2222 2674 2686 2706 – 4194.7 4353 4435 4529 4587 4731.7 5230.3 5558 7070 7194 7239 7355B=Band; Sh=Shoulder
Table VI: Raman peak positions in wave numbers (cm−1) of three dickite samples (DA, DB and DC).
SamplePosition
1 2 3 4 5 6 7 8 9 10 11 12 13 14* 15 16 17
DA(cream)
133 – – 242 269 334 434 – 460 748 793 914 1123 – 3624 3645 3687
DB(cream)
131 197 – 244 269 335 434 451 460 747 792 919 1123 2840–2940 3622 3646 3686
DB(red)
131 196 – 247 270 336 434 450 460 749 793 915 – 2840–2940 3622 3654 3690
DC(grey)
– – 204 – 266 – – – 465 – – – – – – – –
Average 132 197 204 244 269 335 434 450 461 748 793 916 1123 2840–2940 3623 3648 3687
* Plateau
Table IV: The chemical compositions of dickite, marble and dolomite from Thailand.
Dickite Marblea Dolomiteb
Sample DA 1-3 (cream)
DB 1-3 (cream+red)
DC 1-3 (white grey)
DD 1-3 (dark grey)
De 1-3 (dark grey)
DF 1-3 (dull white)
white-grey white Pink-yellow
Major element (wt%):SiO
243.39 42.85 76.12 79.37 75.52 78.18 0.65 0.15 0.32
TiO2
<0.05 <0.05 0.12 0.11 0.16 0.13 n/a n/a n/aAl
2O
341.39 41.73 16.89 14.60 17.21 15.41 0.03 n/a n/a
Fe2O
3<0.10 0.10 0.43 0.34 0.45 0.22 0.10 0.20 0.24
MnO <0.05 <0.05 0.06 0.05 0.05 <0.05 n/a n/a n/aCaO <0.10 <0.10 <0.10 <0.10 <0.10 <0.10 54.93 31.23 31.31MgO <0.10 <0.10 <0.10 <0.10 <0.10 <0.10 0.43 21.41 21.14
Na2O <0.10 <0.10 <0.10 <0.10 <0.10 <0.10 n/a n/a n/a
K2O <0.05 <0.05 <0.05 <0.05 <0.05 <0.05 n/a n/a n/a
P2O
5<0.05 0.16 <0.05 <0.05 <0.05 <0.05 n/a 0.01 0.01
LOI 14.15 14.20 5.63 4.83 5.90 5.32 43.55 n/a n/aH
2O− 0.50 0.46 0.27 0.21 0.22 0.22 0.28 n/a n/a
trace element (ppm):Co <3 <3 <3 <3 <3 <3 n/a n/a n/aCr 5 5 13 9 12 6 n/a n/a n/aCu 6 3 6 4 13 15 n/a n/a n/aNi <2 <2 2 <2 3 <2 n/a n/a n/aSr 93 920 61 25 18 30 n/a n/a n/a
Zn 3 8 2 2 2 2 n/a n/a n/aa. An analysis of marble from Khao Ngob, Na Phra Laan, Saraburi province, provided by Thai Marble Corp (TMC).b. Analyses of dolomite from Wang Dong subdistrict, Muang district, Kanchanaburi province, provided by P&S Pand's Group Co. Ltd.
n/a = data are not available.
Dickite: a gem material for carving from Thailand
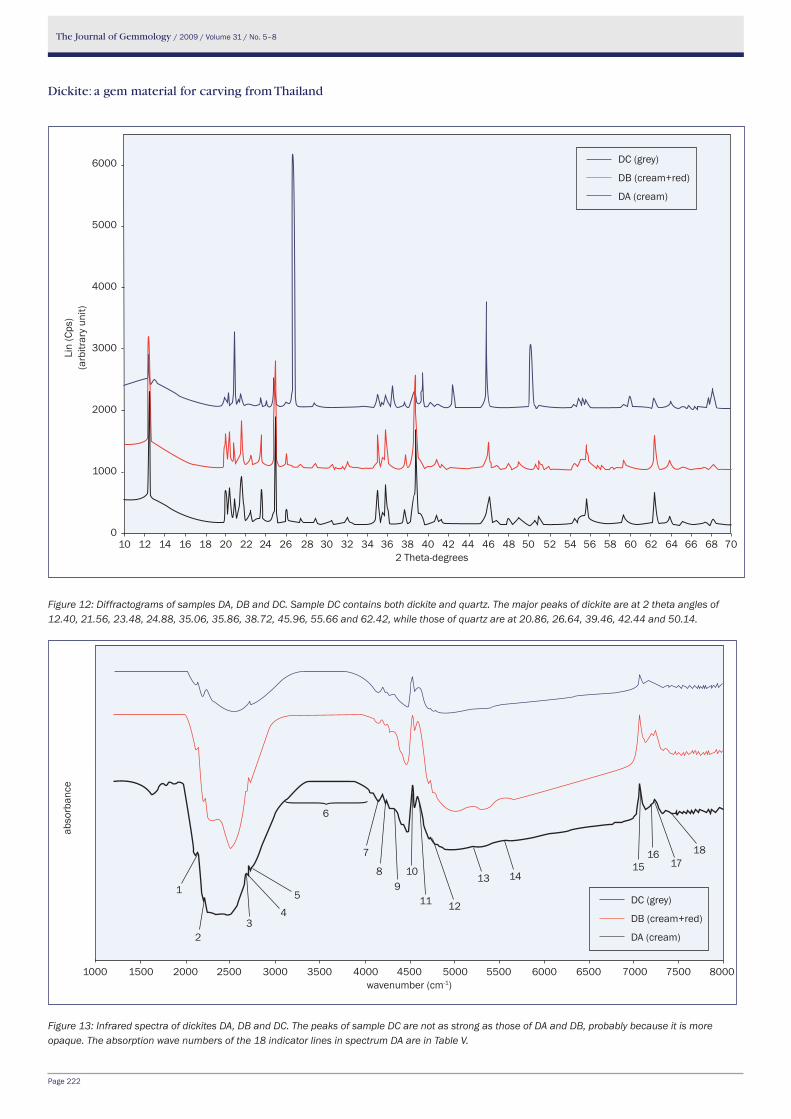
The Journal of Gemmology / 2009 / Volume 31 / No. 5–8
Page 222
Figure 13: Infrared spectra of dickites DA, DB and DC. The peaks of sample DC are not as strong as those of DA and DB, probably because it is more opaque. The absorption wave numbers of the 18 indicator lines in spectrum DA are in Table V.
Figure 12: Diffractograms of samples DA, DB and DC. Sample DC contains both dickite and quartz. The major peaks of dickite are at 2 theta angles of 12.40, 21.56, 23.48, 24.88, 35.06, 35.86, 38.72, 45.96, 55.66 and 62.42, while those of quartz are at 20.86, 26.64, 39.46, 42.44 and 50.14.
6000
5000
4000
3000
2000
1000
0
Lin
(Cps
)(a
rbitr
ary
unit)
10 12 14 16 18 20 22 24 26 28 30 32 34 36 38 40 42 44 46 48 50 52 54 56 58 60 62 64 66 68 702 Theta-degrees
DC (grey)
DB (cream+red)
DA (cream)
1000 1500 2000 2500 3000 3500 4000 4500 5000 5500 6000 6500 7000 7500 8000wavenumber (cm-1)
abso
rban
ce
DC (grey)
DB (cream+red)
DA (cream)
}
1
10
5
2
7
8
12
6
43
911
13
16
1417
1815
Dickite: a gem material for carving from Thailand
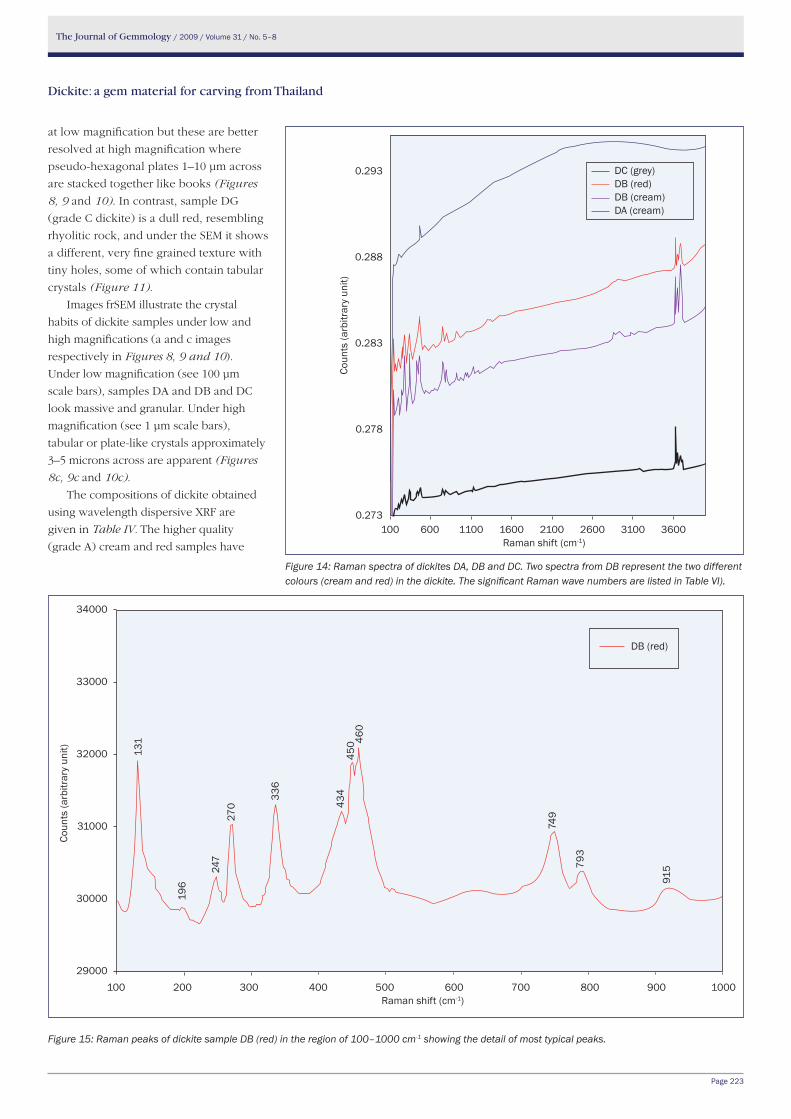
The Journal of Gemmology / 2009 / Volume 31 / No. 5–8
Page 223
at low magnification but these are better
resolved at high magnification where
pseudo-hexagonal plates 1–10 μm across
are stacked together like books (Figures
8, 9 and 10). In contrast, sample DG
(grade C dickite) is a dull red, resembling
rhyolitic rock, and under the SEM it shows
a different, very fine grained texture with
tiny holes, some of which contain tabular
crystals (Figure 11).
Images frSEM illustrate the crystal
habits of dickite samples under low and
high magnifications (a and c images
respectively in Figures 8, 9 and 10).
Under low magnification (see 100 μm
scale bars), samples DA and DB and DC
look massive and granular. Under high
magnification (see 1 μm scale bars),
tabular or plate-like crystals approximately
3–5 microns across are apparent (Figures
8c, 9c and 10c).
The compositions of dickite obtained
using wavelength dispersive XRF are
given in Table IV. The higher quality
(grade A) cream and red samples have
Figure 15: Raman peaks of dickite sample DB (red) in the region of 100–1000 cm-1 showing the detail of most typical peaks.
Figure 14: Raman spectra of dickites DA, DB and DC. Two spectra from DB represent the two different colours (cream and red) in the dickite. The significant Raman wave numbers are listed in Table VI).
100 600 1100 1600 2100 2600 3100 3600 Raman shift (cm-1)
DC (grey)DB (red)DB (cream)DA (cream)
0.293
0.288
0.283
0.278
0.273
Coun
ts (a
rbitr
ary
unit)
100 200 300 400 500 600 700 800 900 1000Raman shift (cm-1)
34000
33000
32000
31000
30000
29000
Coun
ts (a
rbitr
ary
unit) 13
1
196
450
247
270
336
915
460
749
793
434
DB (red)
Dickite: a gem material for carving from Thailand
The Journal of Gemmology / 2009 / Volume 31 / No. 5–8
Page 224
higher Al2O
3 contents (41.39–41.73 wt%)
and lower SiO2 contents (42.85–43.39
wt%) than the grade B samples (DC–DF).
Sample DB contains relatively high Sr (up
to 920 ppm) and P, but not Ca, so it may
contain unusual impurities.
The XRD results indicate that the DA
(cream) and DB (cream+red) samples
match the reference 72–1163 (Newnham
and Brindley, 1965) for dickite and the
major peak positions in terms of 2 theta
are shown in Figure 12. The strong peak
positions of DA and DB are at 2 theta
angles of 12.40, 21.56, 23.48, 24.88, 35.06,
35.86, 38.72, 45.96, 55.66 and 62.42. In the
DC (grey) sample, the presence of quartz
peaks particularly at 26.64 and 50.14 2
theta (reference 79–1906, Dubrovinskii
and Nozik, 1989) agrees well with the
results from chemical analysis which
indicate that this sample has nearly twice
as much SiO2 as DA or DB. The peak
patterns of DE, DF, and DG, not shown
here, are similar to that of DC.
Infrared absorption spectra of DA,
DB and DC are presented in Figure 13
and the positions of their most prominent
wave numbers listed in Table V. The
purest and most transparent dickite, DA,
gives the clearest and most pronounced
spectrum.
Raman spectra were collected from the
surface of each sample and the cream and
the red areas were measured separately
on the DB sample (Figure 14). The range
of 100–1000 cm−1 is enlarged to clarify the
peak positions in this region (Figure 15).
Brindley et al. (1986) and Balan et al.
(2002) studied phyllosilicate minerals and
found that the OH stretching vibrations
in dickite produced absorption bands at
3710, 3655 and 3620 cm-1. Unfortunately
our samples show only a single high and
broad absorption band from 3000–4000
cm-1 but in the Raman spectra, there are
three major peaks at 3623, 3648 and 3687
cm-1 (positions 15, 16 and 17 in Table VI).
ConclusionsDickite, marble and dolomite each
have their own unique colour, texture
hardness and toughness. Marble and
dolomite are harder but less tough than
dickite. In terms of brittleness, they have
a higher tendency to break if the carved
object has a sharp corner or thin or long
components. In comparison with marble
and dolomite, carvers believe that dickite
can be carved more easily and it can
also have a distinctive range of colours
and textures. For example, dickite with
an uneven red colour should be used to
carve animal figurines in the form of round
work. Such carvings should ideally be from
75 mm to 150 mm across for reasons of
packaging and transport but of course this
depends on the original size of the rough.
The dickite deposits in Thailand
are classed in three quality grades, A,
B and C. To maximize the potential
of the deposit, grade A dickite should
be extracted from the mine by sawing
without use of explosives, which can
cause severe strain and fractures in the
mineral. Dickite grades B and C, however,
can be removed from the mine using
explosives and then sold to the ceramics
industries.
Dickite samples in the present study
have a polycrystalline texture. Their
crystal form cannot be seen by the naked
eye and an optical microscope can help
resolve some textures. SEM images of
dickite show that it consists of pseudo-
hexagonal plates stacked together like
books.
However, standard gemmological
instruments may not be sufficient to
identify dickite. Advanced techniques may
be needed: especially WD-XRF, XRD, FTIR
and Raman spectroscopy. In particular, the
Raman microprobe can give useful results,
especially for grade A dickite.
AcknowledgementsThe authors would like to thank
Srinakharinwirot University for funding
this research, the mining companies
named in the text for providing samples,
the Department of Mineral Resources
for chemical analysis, and the Gem and
Jewelry Institute of Thailand for the Raman
microprobe analyses.
We are also indebted to Pornchalai
Maneeratpairoj, Angsana Himasuttidach,
Sermsuke Radreng, Pek Phaoduang,
Niphon Saminpanya, Ratthapol Thanaikit,
Khom Kannirand, Thasanu Kitchalong,
Patiwat Laemkhunawat, Phornthep
Punthavanit and Pitthayut Saminpanya for
their help, which ranged from collecting
samples to the analysis of samples and
reading the manuscript. Thanks also go to
Tom Sigurdson who proofed this article.
Finally, we thank the anonymous referee
for comments.
ReferencesBalan, E., Allard, T., Morin, G., and Calas
G., 2002. Incorporation of Cr3+ in
dickite: a spectroscopic study. Phys.
Chem. Miner., 29(4), 273–9
Beaufort, D., Cassagnabere, A., Petit,S.,
Lanson, B., Berger, G., Lacharpagne,
J.C., and Johansen, H., 1998. Kaolinite-
to-dickite reaction in sandstone
reservoirs. Clay Minerals, 33(2),
297–316
Brindley, G.W., Chih-Chun Kao, Harrison,
J.L., Lipsicas, M., and Raythatha, R.,
1986. Relation between structural
disorder and other characteristics of
kaolinites and dickites. Clays and Clay
Minerals, 34(3), 239–49
Chang Oh Choo and Soo Jin Kim, 2004.
Dickite and other kaolin polymorphs
from an Al-rich clay deposit formed in
volcanic tuff, southeastern Korea. Clays
and Clay Minerals, 52(6), 749–59
Deyell, C. L., Leonardson, R., Rye, R.O.,
Thompson, J.F.H., Bissig T., and Cooke,
D.R., 2005. Alunite in the Pascua-Lama
high-sulfidation deposit: Constraints
on alteration and ore deposition using
stable isotope geochemistry. Econ.
Geol., 100(1), 131–48
Dubrovinskii, L. S., and Nozik, Y.Z., 1989.
Calculation of the anisotropic thermal
parameters of the atoms of α-quartz.
Sov. Phys. Dokl., 34, 484–5
Frost, R.L., and Vassallo, M., 1996. The
dehydroxylation of the kaolinite clay
minerals using infrared emission
spectroscopy. Clays and Clay Minerals,
44(5), 635–51
Girard, J.P., and Savin, S. M., 1996.
Intracrystalline fractionation of oxygen
isotopes between hydroxyl and non-
Dickite: a gem material for carving from Thailand
The Journal of Gemmology / 2009 / Volume 31 / No. 5–8
Page 225
hydroxyl sites in kaolinite measured
by thermal dehydroxylation and partial
fluorination. Geochim. Cosmochim.
Acta, 60(3), 469–87
Hibbard, M.J., 2002. Mineralogy: a
geologist’s point of view. McGraw-Hill
Higher Education, Boston Burr Ridge.
562 pp
Johnston C.T., Wang, S.L., Bish, D.L., Dera,
P., Agnew, S.F., and Kenney III, J.W.,
2002. Novel pressure-induced phase
transformations in hydrous-layered
materials. Geophys. Res. Lett., 29(16),
1770
Johnston, C. T., Helsen, J., Schoonheydt,
R.A., Bish, D.L., and Agnew, A.F., 1998.
Single-crystal Raman spectroscopic
study of dickite. Am. Mineral., 83(1/2),
75–84
Kerr, P. F., and Kulp, J. L., 1948. Multiple
differential thermal analysis. Am.
Mineral., 33(7/8), 387–419
Khuentak, C., 1988a. Clay mineral deposits
in Thailand. Proceedings of annual
meeting of mining 1988. Mitrcharoen
Karnphim Partnership, Bangkok. 63–9
Khuentak, C., 1988b. Valuable resources:
The sources of minerals and rocks
for industries. In: Treasures in soils
of Saraburi. Department of Mineral
Resources, Bangkok. 23–9
Marumo, K., 1989. Genesis of kaolin
minerals and pyrophyllite in kuroko
deposits of Japan; implication for the
origins of the hydrothermal fluids from
mineralogical and stable isotope data.
Geochim. Cosmochim. Acta, 53(11),
2915–24
Newnham, R.E., and Brindley, G.W.,
1956. The crystal structure of dickite.
Acta Crystallogr., Sect. A: Found.
Crystallogr., 9(9), 759–64
Potts, P.J., 1987. A handbook of silicate
rock analysis. Blackie, London. 621 pp
Reed, S.J.B., 1996. Electron microprobe
analysis and scanning electron
microscopy in geology. Cambridge
University Press, Cambridge. 201 pp
Reed, S.J.B., 1997. Electron microprobe
analysis, 2nd edn. Cambridge
University Press, Cambridge. 326 pp
Salayaphong, S., 1996. Rocks in Nakhon
Nayok and vicinity. In: Environmental
geology of Changwat Nakhon Nayok
the AuthorsSeriwat Saminpanya* and Chaichart DharmgrongartamaDepartment of General Science, Faculty of Science, Srinakharinwirot University,
Sukhumvit 23, Watthana, Bangkok 10110, Thailand.
E-mails: [email protected]; [email protected]
Namrawee SusaweeThe Gem and Jewelry Institute of Thailand (Public Organization), Gemmological
Research and Testing Building, Faculty of Science, Chulalongkorn University,
Phayathai Road, Patumwan, Bangkok 10330, Thailand
* Corresponding author
and vicinity. Samaphan Publishing Co.
Ltd, Bangkok. 15–37
Shoval, S., Boudeulle, M., Yariv, S.,
Lapides, I., and Panczer, G., 2001.
Micro-Raman and FT-IR spectroscopy
study of the thermal transformations of
St. Claire dickite. Opt. Mater., 16(1/2),
319–27
Skoog, D.A. and Leary, J.J., 1992.
Principles of instrumental analysis.
4th edn. Saunders College Pub, Fort
Worth. 700 pp
Viorica, M., Jean-Pierre, M., and Jacques,
L., 2004. Rosia Poieni copper deposit,
Apuseni Mountains, Romania: advanced
argillic overprint of a porphyry system.
Miner. Deposita, 39(2), 173–88
Wertz, E., and Wertz, L., 1994. Handbook
of gemstone carving. Gems Guides
Book Company, Suite F Baldwin Park,
CA. 47 pp
Yaemniyom, 1988. Mineral resources
in Thailand. A document of the
Department of Mineral Resources.
Prachachon Co. Ltd, Bangkok. 51 pp
Zamama, M., and Knidiri, M., 2000. IR
study of dickite-formamide intercalate,
Al2Si
2O
5(OH)
4 – H
2NCOH. Spectrochim.
Acta, Part A, 56(6), 1139–47
web http://www.crpg.cnrs-nancy.fr/
Geostandards/GGR_ms.v03/ms072.
html (accessed on 20 May 2007)
http://www.mindat.org/min-1287.html
(accessed on 11 May 2008)
Dickite: a gem material for carving from Thailand
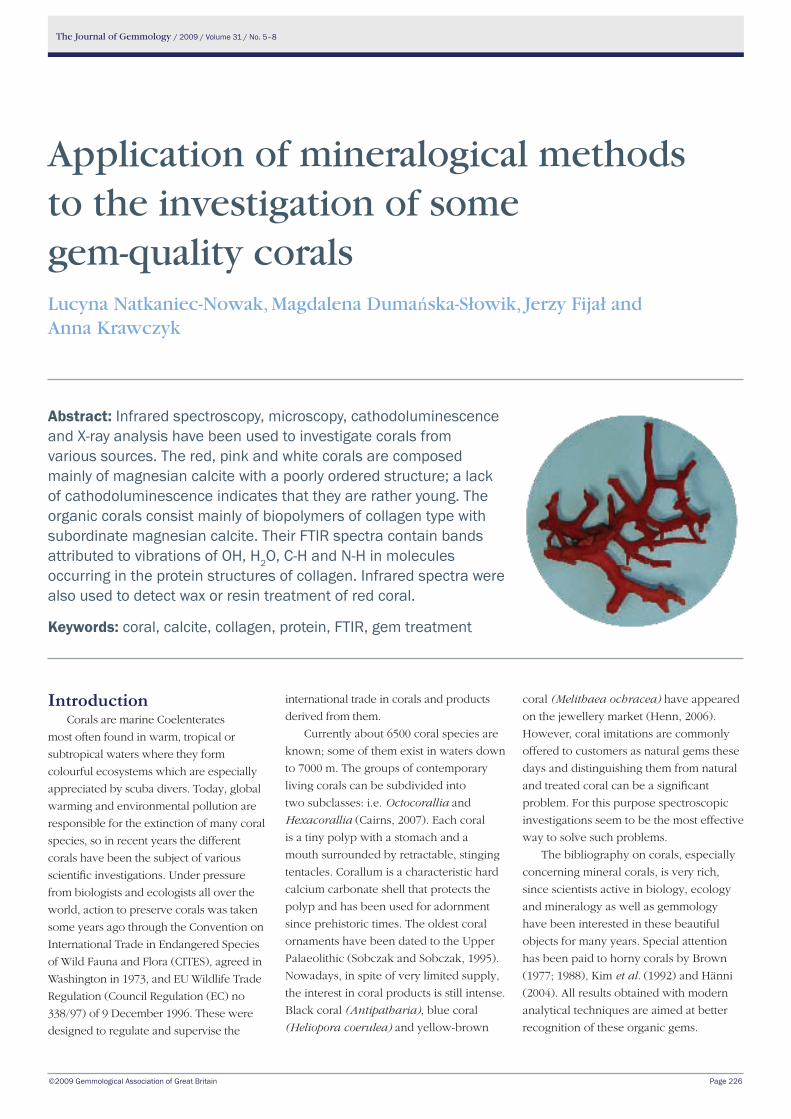
The Journal of Gemmology / 2009 / Volume 31 / No. 5–8
©2009 Gemmological Association of Great Britain Page 226
IntroductionCorals are marine Coelenterates
most often found in warm, tropical or
subtropical waters where they form
colourful ecosystems which are especially
appreciated by scuba divers. Today, global
warming and environmental pollution are
responsible for the extinction of many coral
species, so in recent years the different
corals have been the subject of various
scientific investigations. Under pressure
from biologists and ecologists all over the
world, action to preserve corals was taken
some years ago through the Convention on
International Trade in Endangered Species
of Wild Fauna and Flora (CITES), agreed in
Washington in 1973, and EU Wildlife Trade
Regulation (Council Regulation (EC) no
338/97) of 9 December 1996. These were
designed to regulate and supervise the
international trade in corals and products
derived from them.
Currently about 6500 coral species are
known; some of them exist in waters down
to 7000 m. The groups of contemporary
living corals can be subdivided into
two subclasses: i.e. Octocorallia and
Hexacorallia (Cairns, 2007). Each coral
is a tiny polyp with a stomach and a
mouth surrounded by retractable, stinging
tentacles. Corallum is a characteristic hard
calcium carbonate shell that protects the
polyp and has been used for adornment
since prehistoric times. The oldest coral
ornaments have been dated to the Upper
Palaeolithic (Sobczak and Sobczak, 1995).
Nowadays, in spite of very limited supply,
the interest in coral products is still intense.
Black coral (Antipatharia), blue coral
(Heliopora coerulea) and yellow-brown
coral (Melithaea ochracea) have appeared
on the jewellery market (Henn, 2006).
However, coral imitations are commonly
offered to customers as natural gems these
days and distinguishing them from natural
and treated coral can be a significant
problem. For this purpose spectroscopic
investigations seem to be the most effective
way to solve such problems.
The bibliography on corals, especially
concerning mineral corals, is very rich,
since scientists active in biology, ecology
and mineralogy as well as gemmology
have been interested in these beautiful
objects for many years. Special attention
has been paid to horny corals by Brown
(1977; 1988), Kim et al. (1992) and Hänni
(2004). All results obtained with modern
analytical techniques are aimed at better
recognition of these organic gems.
Application of mineralogical methods to the investigation of some gem-quality coralsLucyna Natkaniec-Nowak, Magdalena Dumańska-Słowik, Jerzy Fijał and Anna Krawczyk
Abstract: Infrared spectroscopy, microscopy, cathodoluminescence and X-ray analysis have been used to investigate corals from various sources. The red, pink and white corals are composed mainly of magnesian calcite with a poorly ordered structure; a lack of cathodoluminescence indicates that they are rather young. The organic corals consist mainly of biopolymers of collagen type with subordinate magnesian calcite. Their FTIR spectra contain bands attributed to vibrations of OH, H2O, C-h and N-h in molecules occurring in the protein structures of collagen. Infrared spectra were also used to detect wax or resin treatment of red coral.
Keywords: coral, calcite, collagen, protein, FTIR, gem treatment
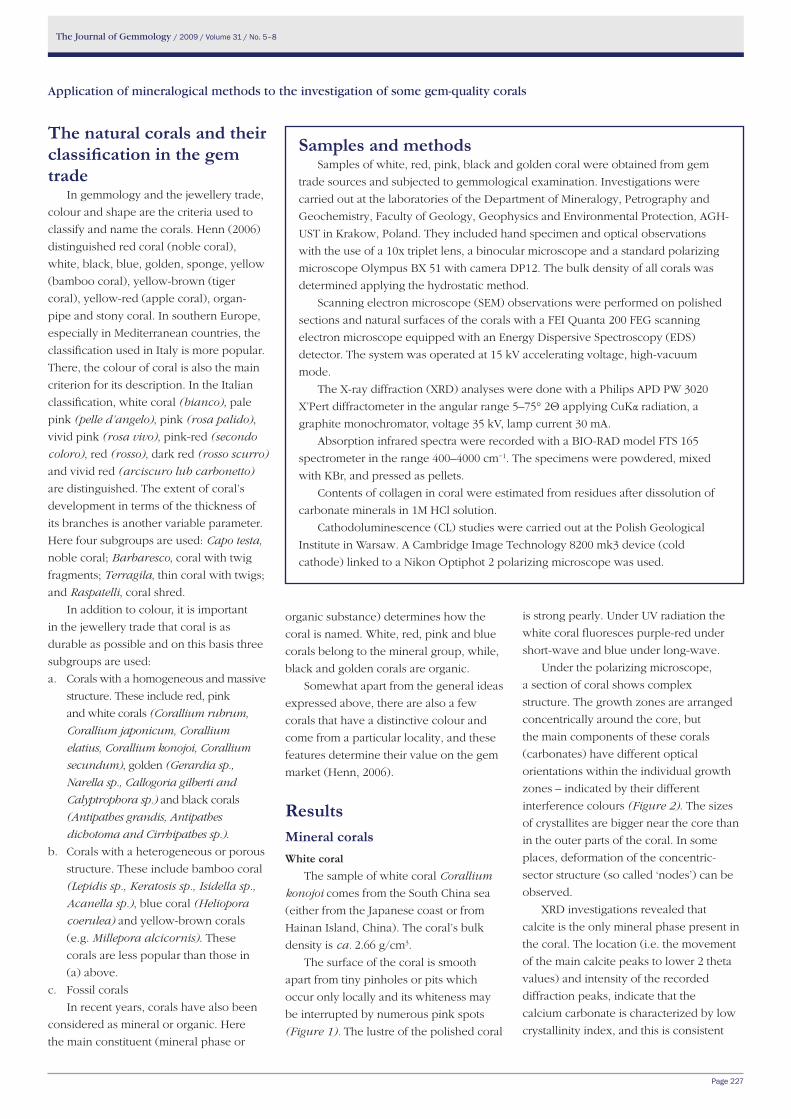
The Journal of Gemmology / 2009 / Volume 31 / No. 5–8
Page 227
the natural corals and their classification in the gem trade
In gemmology and the jewellery trade,
colour and shape are the criteria used to
classify and name the corals. Henn (2006)
distinguished red coral (noble coral),
white, black, blue, golden, sponge, yellow
(bamboo coral), yellow-brown (tiger
coral), yellow-red (apple coral), organ-
pipe and stony coral. In southern Europe,
especially in Mediterranean countries, the
classification used in Italy is more popular.
There, the colour of coral is also the main
criterion for its description. In the Italian
classification, white coral (bianco), pale
pink (pelle d’angelo), pink (rosa palido),
vivid pink (rosa vivo), pink-red (secondo
coloro), red (rosso), dark red (rosso scurro)
and vivid red (arciscuro lub carbonetto)
are distinguished. The extent of coral’s
development in terms of the thickness of
its branches is another variable parameter.
Here four subgroups are used: Capo testa,
noble coral; Barbaresco, coral with twig
fragments; Terragila, thin coral with twigs;
and Raspatelli, coral shred.
In addition to colour, it is important
in the jewellery trade that coral is as
durable as possible and on this basis three
subgroups are used:
a. Corals with a homogeneous and massive
structure. These include red, pink
and white corals (Corallium rubrum,
Corallium japonicum, Corallium
elatius, Corallium konojoi, Corallium
secundum), golden (Gerardia sp.,
Narella sp., Callogoria gilberti and
Calyptrophora sp.) and black corals
(Antipathes grandis, Antipathes
dichotoma and Cirrhipathes sp.).
b. Corals with a heterogeneous or porous
structure. These include bamboo coral
(Lepidis sp., Keratosis sp., Isidella sp.,
Acanella sp.), blue coral (Heliopora
coerulea) and yellow-brown corals
(e.g. Millepora alcicornis). These
corals are less popular than those in
(a) above.
c. Fossil corals
In recent years, corals have also been
considered as mineral or organic. Here
the main constituent (mineral phase or
organic substance) determines how the
coral is named. White, red, pink and blue
corals belong to the mineral group, while,
black and golden corals are organic.
Somewhat apart from the general ideas
expressed above, there are also a few
corals that have a distinctive colour and
come from a particular locality, and these
features determine their value on the gem
market (Henn, 2006).
ResultsMineral coralswhite coral
The sample of white coral Corallium
konojoi comes from the South China sea
(either from the Japanese coast or from
Hainan Island, China). The coral’s bulk
density is ca. 2.66 g/cm3.
The surface of the coral is smooth
apart from tiny pinholes or pits which
occur only locally and its whiteness may
be interrupted by numerous pink spots
(Figure 1). The lustre of the polished coral
is strong pearly. Under UV radiation the
white coral fluoresces purple-red under
short-wave and blue under long-wave.
Under the polarizing microscope,
a section of coral shows complex
structure. The growth zones are arranged
concentrically around the core, but
the main components of these corals
(carbonates) have different optical
orientations within the individual growth
zones – indicated by their different
interference colours (Figure 2). The sizes
of crystallites are bigger near the core than
in the outer parts of the coral. In some
places, deformation of the concentric-
sector structure (so called ‘nodes’) can be
observed.
XRD investigations revealed that
calcite is the only mineral phase present in
the coral. The location (i.e. the movement
of the main calcite peaks to lower 2 theta
values) and intensity of the recorded
diffraction peaks, indicate that the
calcium carbonate is characterized by low
crystallinity index, and this is consistent
Application of mineralogical methods to the investigation of some gem-quality corals
Samples and methodsSamples of white, red, pink, black and golden coral were obtained from gem
trade sources and subjected to gemmological examination. Investigations were
carried out at the laboratories of the Department of Mineralogy, Petrography and
Geochemistry, Faculty of Geology, Geophysics and Environmental Protection, AGH-
UST in Krakow, Poland. They included hand specimen and optical observations
with the use of a 10x triplet lens, a binocular microscope and a standard polarizing
microscope Olympus BX 51 with camera DP12. The bulk density of all corals was
determined applying the hydrostatic method.
Scanning electron microscope (SEM) observations were performed on polished
sections and natural surfaces of the corals with a FEI Quanta 200 FEG scanning
electron microscope equipped with an Energy Dispersive Spectroscopy (EDS)
detector. The system was operated at 15 kV accelerating voltage, high-vacuum
mode.
The X-ray diffraction (XRD) analyses were done with a Philips APD PW 3020
X’Pert diffractometer in the angular range 5–75° 2Θ applying CuKα radiation, a
graphite monochromator, voltage 35 kV, lamp current 30 mA.
Absorption infrared spectra were recorded with a BIO-RAD model FTS 165
spectrometer in the range 400–4000 cm−1. The specimens were powdered, mixed
with KBr, and pressed as pellets.
Contents of collagen in coral were estimated from residues after dissolution of
carbonate minerals in 1M HCl solution.
Cathodoluminescence (CL) studies were carried out at the Polish Geological
Institute in Warsaw. A Cambridge Image Technology 8200 mk3 device (cold
cathode) linked to a Nikon Optiphot 2 polarizing microscope was used.
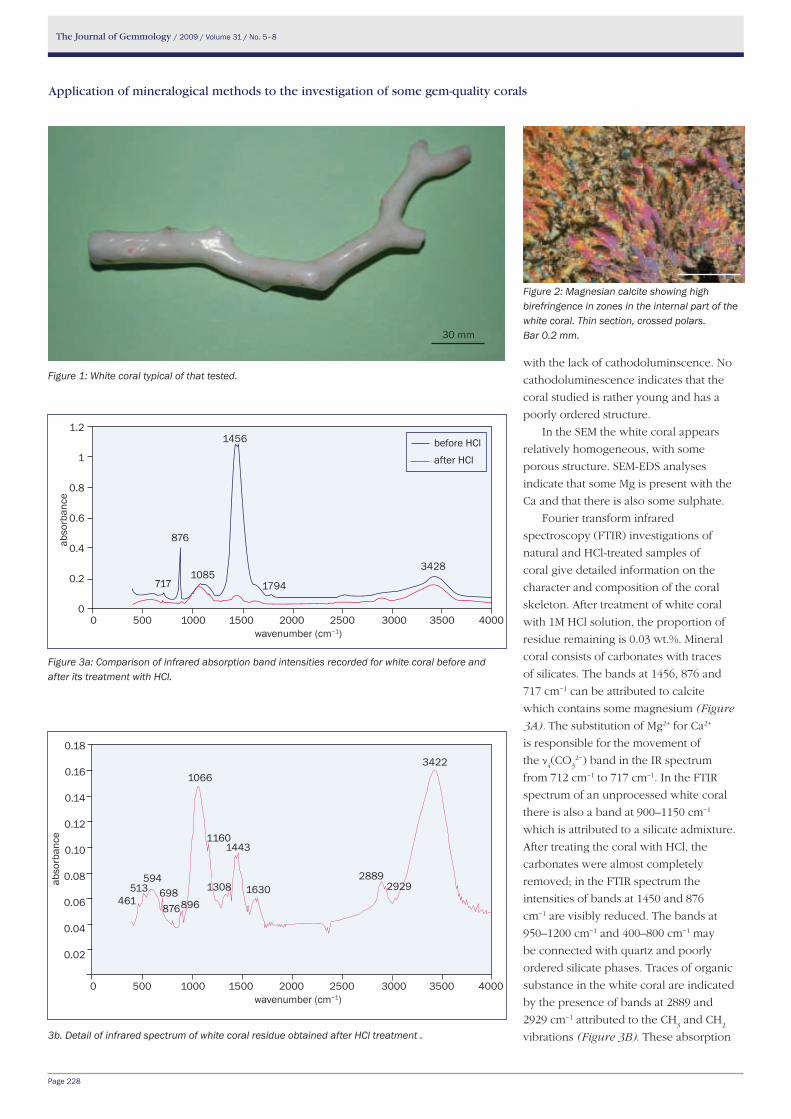
The Journal of Gemmology / 2009 / Volume 31 / No. 5–8
Page 228
Figure 1: White coral typical of that tested.
Figure 2: Magnesian calcite showing high birefringence in zones in the internal part of the white coral. Thin section, crossed polars. Bar 0.2 mm.
Figure 3a: Comparison of infrared absorption band intensities recorded for white coral before and after its treatment with HCl.
3b. Detail of infrared spectrum of white coral residue obtained after HCl treatment .
with the lack of cathodoluminscence. No
cathodoluminescence indicates that the
coral studied is rather young and has a
poorly ordered structure.
In the SEM the white coral appears
relatively homogeneous, with some
porous structure. SEM-EDS analyses
indicate that some Mg is present with the
Ca and that there is also some sulphate.
Fourier transform infrared
spectroscopy (FTIR) investigations of
natural and HCl-treated samples of
coral give detailed information on the
character and composition of the coral
skeleton. After treatment of white coral
with 1M HCl solution, the proportion of
residue remaining is 0.03 wt.%. Mineral
coral consists of carbonates with traces
of silicates. The bands at 1456, 876 and
717 cm−1 can be attributed to calcite
which contains some magnesium (Figure
3A). The substitution of Mg2+ for Ca2+
is responsible for the movement of
the ν4(CO
32−) band in the IR spectrum
from 712 cm−1 to 717 cm−1. In the FTIR
spectrum of an unprocessed white coral
there is also a band at 900–1150 cm−1
which is attributed to a silicate admixture.
After treating the coral with HCl, the
carbonates were almost completely
removed; in the FTIR spectrum the
intensities of bands at 1450 and 876
cm−1 are visibly reduced. The bands at
950–1200 cm−1 and 400–800 cm−1 may
be connected with quartz and poorly
ordered silicate phases. Traces of organic
substance in the white coral are indicated
by the presence of bands at 2889 and
2929 cm−1 attributed to the CH3 and CH
2
vibrations (Figure 3B). These absorption
0 500 1000 1500 2000 2500 3000 3500 4000wavenumber (cm−1)
1.2
1
0.8
0.6
0.4
0.2
0
abso
rban
ce
before hClafter hCl
3428
876
7171085
1456
1794
0 500 1000 1500 2000 2500 3000 3500 4000wavenumber (cm−1)
0.18
0.16
0.14
0.12
0.10
0.08
0.06
0.04
0.02
abso
rban
ce
1443
29292889
16301308
1160
1066
876896461698
594513
3422
Application of mineralogical methods to the investigation of some gem-quality corals
30 mm
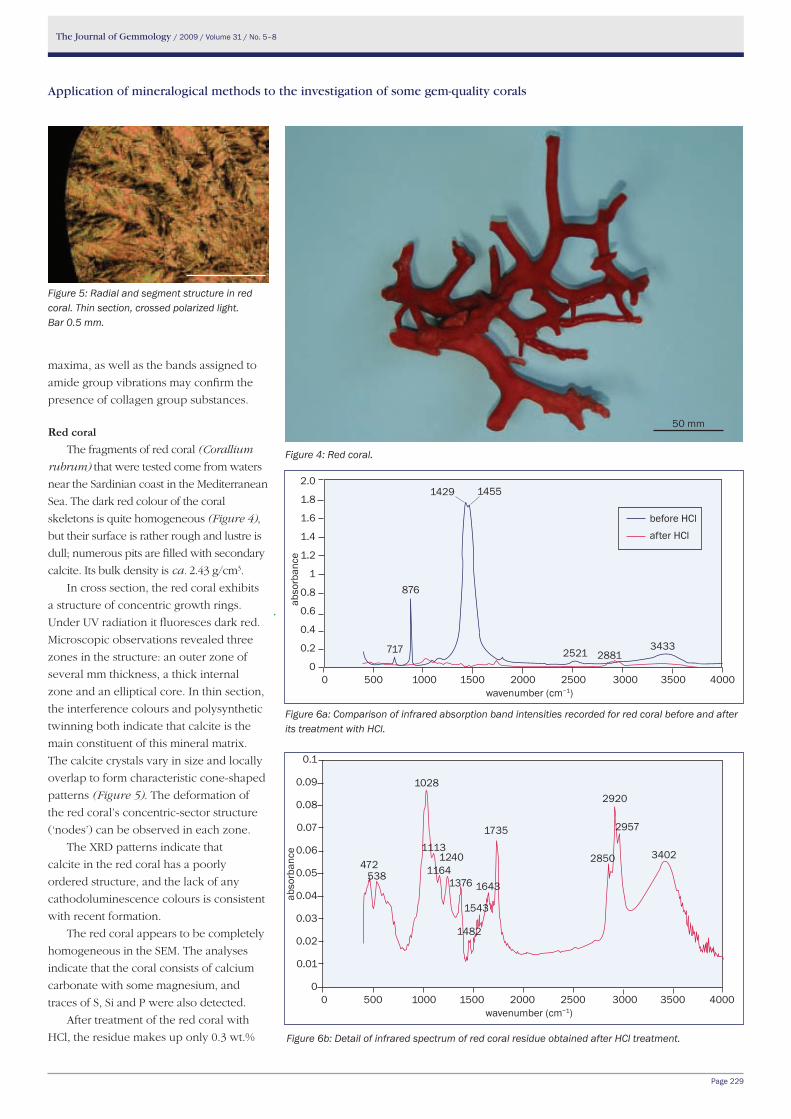
The Journal of Gemmology / 2009 / Volume 31 / No. 5–8
Page 229
maxima, as well as the bands assigned to
amide group vibrations may confirm the
presence of collagen group substances.
Red coral The fragments of red coral (Corallium
rubrum) that were tested come from waters
near the Sardinian coast in the Mediterranean
Sea. The dark red colour of the coral
skeletons is quite homogeneous (Figure 4),
but their surface is rather rough and lustre is
dull; numerous pits are filled with secondary
calcite. Its bulk density is ca. 2.43 g/cm3.
In cross section, the red coral exhibits
a structure of concentric growth rings.
Under UV radiation it fluoresces dark red.
Microscopic observations revealed three
zones in the structure: an outer zone of
several mm thickness, a thick internal
zone and an elliptical core. In thin section,
the interference colours and polysynthetic
twinning both indicate that calcite is the
main constituent of this mineral matrix.
The calcite crystals vary in size and locally
overlap to form characteristic cone-shaped
patterns (Figure 5). The deformation of
the red coral’s concentric-sector structure
(‘nodes’) can be observed in each zone.
The XRD patterns indicate that
calcite in the red coral has a poorly
ordered structure, and the lack of any
cathodoluminescence colours is consistent
with recent formation.
The red coral appears to be completely
homogeneous in the SEM. The analyses
indicate that the coral consists of calcium
carbonate with some magnesium, and
traces of S, Si and P were also detected.
After treatment of the red coral with
HCl, the residue makes up only 0.3 wt.%
Figure 6a: Comparison of infrared absorption band intensities recorded for red coral before and after its treatment with HCl.
Figure 4: Red coral.
Figure 5: Radial and segment structure in red coral. Thin section, crossed polarized light.Bar 0.5 mm.
0 500 1000 1500 2000 2500 3000 3500 4000wavenumber (cm−1)
0.1
0.09
0.08
0.07
0.06
0.05
0.04
0.03
0.02
0.01
0
abso
rban
ce
538
1482
3402
2920
2957
2850
1735
1643
1543
1376
12401164
1113
1028
472
Figure 6b: Detail of infrared spectrum of red coral residue obtained after HCl treatment.
Application of mineralogical methods to the investigation of some gem-quality corals
50 mm
0 500 1000 1500 2000 2500 3000 3500 4000wavenumber (cm−1)
2.0
1.8
1.6
1.4
1.2
1
0.8
0.6
0.4
0.2
0
abso
rban
ce
before hClafter hCl
1429
876
717 2881
1455
25213433
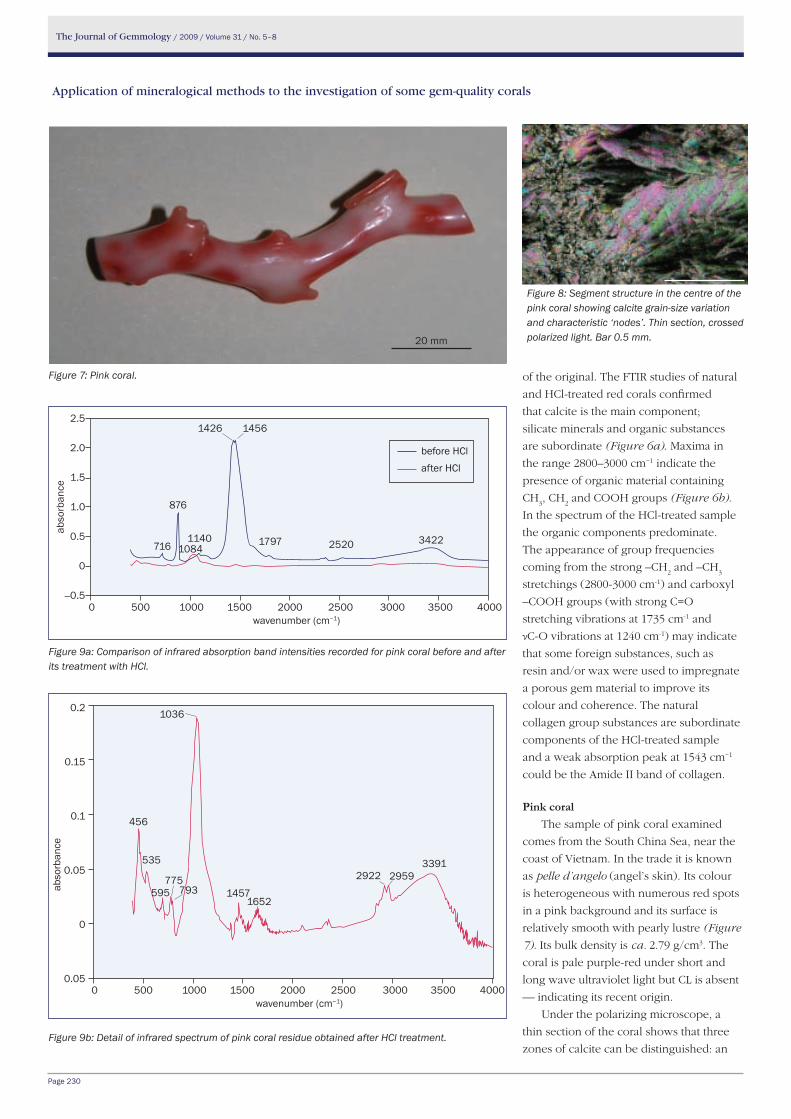
The Journal of Gemmology / 2009 / Volume 31 / No. 5–8
Page 230
of the original. The FTIR studies of natural
and HCl-treated red corals confirmed
that calcite is the main component;
silicate minerals and organic substances
are subordinate (Figure 6a). Maxima in
the range 2800–3000 cm−1 indicate the
presence of organic material containing
CH3, CH
2 and COOH groups (Figure 6b).
In the spectrum of the HCl-treated sample
the organic components predominate.
The appearance of group frequencies
coming from the strong –CH2 and –CH
3
stretchings (2800-3000 cm-1) and carboxyl
–COOH groups (with strong C=O
stretching vibrations at 1735 cm-1 and
νC-O vibrations at 1240 cm-1) may indicate
that some foreign substances, such as
resin and/or wax were used to impregnate
a porous gem material to improve its
colour and coherence. The natural
collagen group substances are subordinate
components of the HCl-treated sample
and a weak absorption peak at 1543 cm−1
could be the Amide II band of collagen.
Pink coralThe sample of pink coral examined
comes from the South China Sea, near the
coast of Vietnam. In the trade it is known
as pelle d’angelo (angel’s skin). Its colour
is heterogeneous with numerous red spots
in a pink background and its surface is
relatively smooth with pearly lustre (Figure
7). Its bulk density is ca. 2.79 g/cm3. The
coral is pale purple-red under short and
long wave ultraviolet light but CL is absent
— indicating its recent origin.
Under the polarizing microscope, a
thin section of the coral shows that three
zones of calcite can be distinguished: an
Figure 7: Pink coral.
Figure 8: Segment structure in the centre of the pink coral showing calcite grain-size variation and characteristic ‘nodes’. Thin section, crossed polarized light. Bar 0.5 mm.
Figure 9a: Comparison of infrared absorption band intensities recorded for pink coral before and after its treatment with HCl.
Figure 9b: Detail of infrared spectrum of pink coral residue obtained after HCl treatment.
0 500 1000 1500 2000 2500 3000 3500 4000wavenumber (cm−1)
0.2
0.15
0.1
0.05
0
0.05
abso
rban
ce
29592922775
1652
3391
1457595
535
456
793
1036
Application of mineralogical methods to the investigation of some gem-quality corals
20 mm
2.5
2.0
1.5
1.0
0.5
0
–0.50 500 1000 1500 2000 2500 3000 3500 4000
wavenumber (cm−1)
abso
rban
ce
716 34222520
14561426
1084
876
17971140
before hClafter hCl
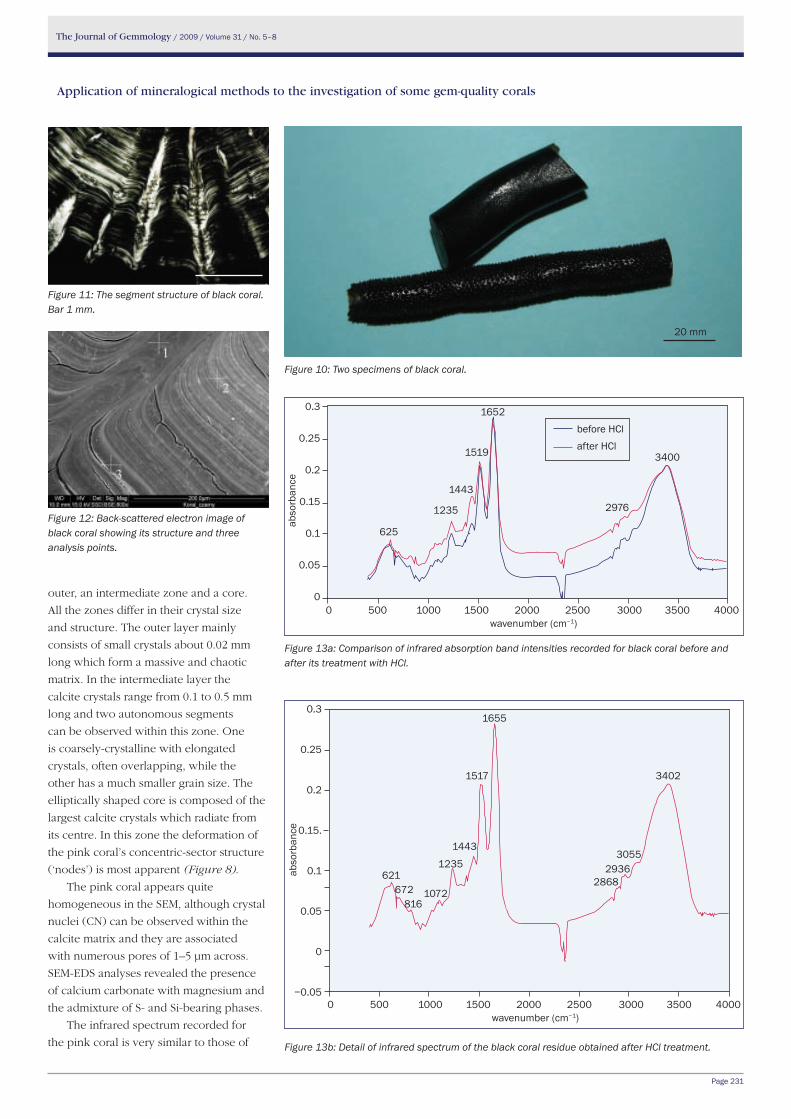
The Journal of Gemmology / 2009 / Volume 31 / No. 5–8
Page 231
outer, an intermediate zone and a core.
All the zones differ in their crystal size
and structure. The outer layer mainly
consists of small crystals about 0.02 mm
long which form a massive and chaotic
matrix. In the intermediate layer the
calcite crystals range from 0.1 to 0.5 mm
long and two autonomous segments
can be observed within this zone. One
is coarsely-crystalline with elongated
crystals, often overlapping, while the
other has a much smaller grain size. The
elliptically shaped core is composed of the
largest calcite crystals which radiate from
its centre. In this zone the deformation of
the pink coral’s concentric-sector structure
(‘nodes’) is most apparent (Figure 8).
The pink coral appears quite
homogeneous in the SEM, although crystal
nuclei (CN) can be observed within the
calcite matrix and they are associated
with numerous pores of 1–5 μm across.
SEM-EDS analyses revealed the presence
of calcium carbonate with magnesium and
the admixture of S- and Si-bearing phases.
The infrared spectrum recorded for
the pink coral is very similar to those of
Figure 10: Two specimens of black coral.
Figure 11: The segment structure of black coral. Bar 1 mm.
Figure 12: Back-scattered electron image of black coral showing its structure and three analysis points.
Figure 13a: Comparison of infrared absorption band intensities recorded for black coral before and after its treatment with HCl.
Figure 13b: Detail of infrared spectrum of the black coral residue obtained after HCl treatment.
0 500 1000 1500 2000 2500 3000 3500 4000wavenumber (cm−1)
0.3
0.25
0.2
0.15.
0.1
0.05
0
−0.05
abso
rban
ce
621
3402
30552936
2868
1655
1517
1443
1235
1072816
672
0 500 1000 1500 2000 2500 3000 3500 4000wavenumber (cm−1)
0.3
0.25
0.2
0.15
0.1
0.05
0
abso
rban
ce
3400
1443
2976
1652
625
1235
1519
before hClafter hCl
Application of mineralogical methods to the investigation of some gem-quality corals
20 mm
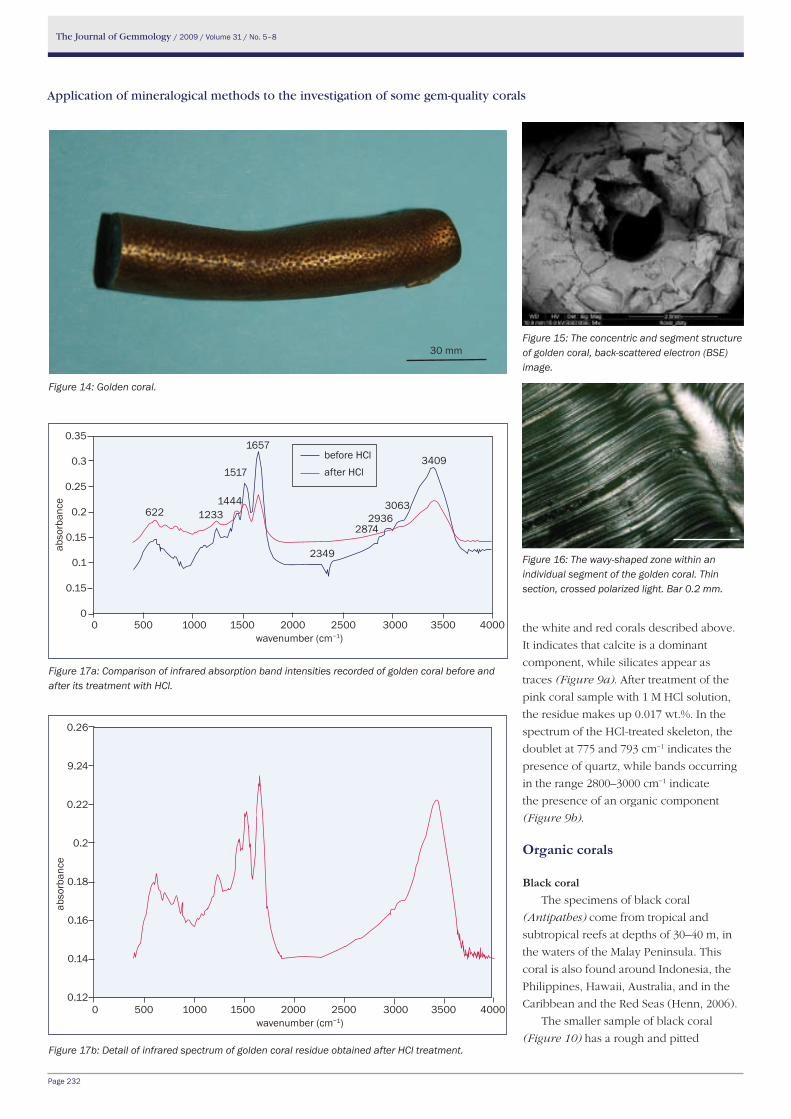
The Journal of Gemmology / 2009 / Volume 31 / No. 5–8
Page 232
the white and red corals described above.
It indicates that calcite is a dominant
component, while silicates appear as
traces (Figure 9a). After treatment of the
pink coral sample with 1 M HCl solution,
the residue makes up 0.017 wt.%. In the
spectrum of the HCl-treated skeleton, the
doublet at 775 and 793 cm−1 indicates the
presence of quartz, while bands occurring
in the range 2800–3000 cm−1 indicate
the presence of an organic component
(Figure 9b).
organic corals
Black coralThe specimens of black coral
(Antipathes) come from tropical and
subtropical reefs at depths of 30–40 m, in
the waters of the Malay Peninsula. This
coral is also found around Indonesia, the
Philippines, Hawaii, Australia, and in the
Caribbean and the Red Seas (Henn, 2006).
The smaller sample of black coral
(Figure 10) has a rough and pitted Figure 17b: Detail of infrared spectrum of golden coral residue obtained after HCl treatment.
Figure 14: Golden coral.
Figure 15: The concentric and segment structure of golden coral, back-scattered electron (BSE) image.
Figure 16: The wavy-shaped zone within an individual segment of the golden coral. Thin section, crossed polarized light. Bar 0.2 mm.
Figure 17a: Comparison of infrared absorption band intensities recorded of golden coral before and after its treatment with HCl.
0 500 1000 1500 2000 2500 3000 3500 4000wavenumber (cm−1)
0.35
0.3
0.25
0.2
0.15
0.1
0.15
0
abso
rban
ce
before hClafter hCl
622 2936
2349
1517
12332874
1657
1444
3409
3063
0 500 1000 1500 2000 2500 3000 3500 4000wavenumber (cm−1)
0.26
9.24
0.22
0.2
0.18
0.16
0.14
0.12
abso
rban
ce
Application of mineralogical methods to the investigation of some gem-quality corals
30 mm
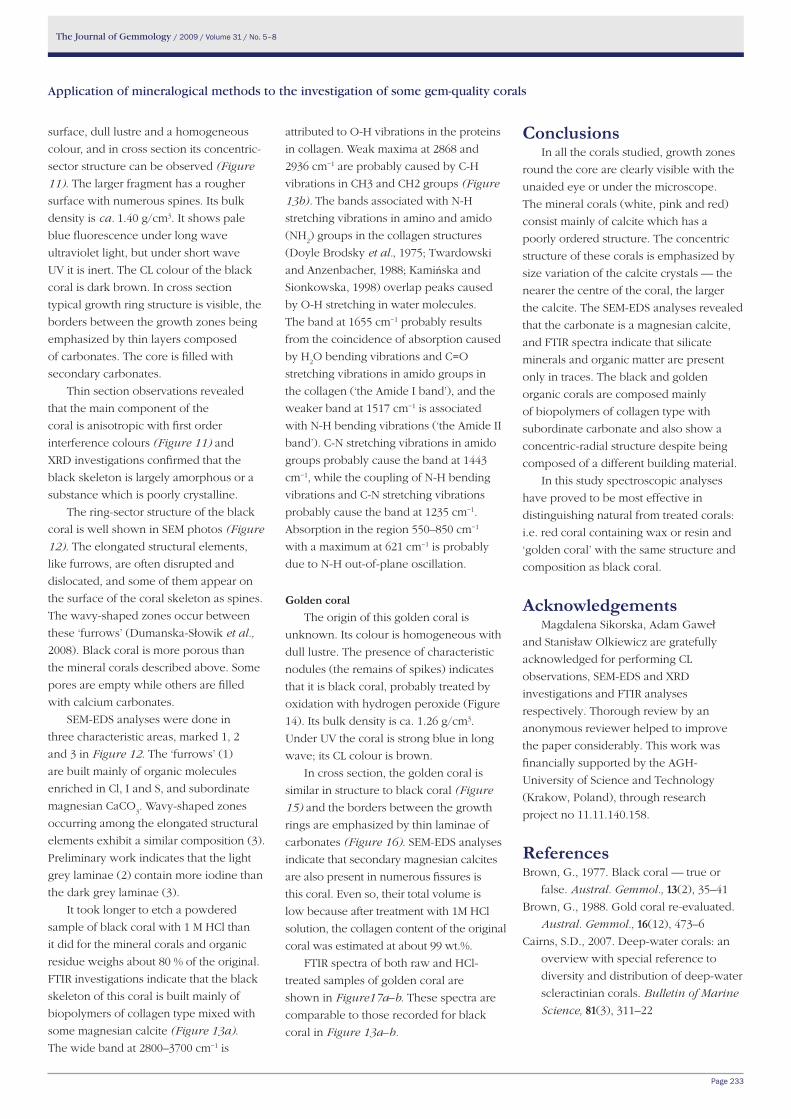
The Journal of Gemmology / 2009 / Volume 31 / No. 5–8
Page 233
surface, dull lustre and a homogeneous
colour, and in cross section its concentric-
sector structure can be observed (Figure
11). The larger fragment has a rougher
surface with numerous spines. Its bulk
density is ca. 1.40 g/cm3. It shows pale
blue fluorescence under long wave
ultraviolet light, but under short wave
UV it is inert. The CL colour of the black
coral is dark brown. In cross section
typical growth ring structure is visible, the
borders between the growth zones being
emphasized by thin layers composed
of carbonates. The core is filled with
secondary carbonates.
Thin section observations revealed
that the main component of the
coral is anisotropic with first order
interference colours (Figure 11) and
XRD investigations confirmed that the
black skeleton is largely amorphous or a
substance which is poorly crystalline.
The ring-sector structure of the black
coral is well shown in SEM photos (Figure
12). The elongated structural elements,
like furrows, are often disrupted and
dislocated, and some of them appear on
the surface of the coral skeleton as spines.
The wavy-shaped zones occur between
these ‘furrows’ (Dumanska-Słowik et al.,
2008). Black coral is more porous than
the mineral corals described above. Some
pores are empty while others are filled
with calcium carbonates.
SEM-EDS analyses were done in
three characteristic areas, marked 1, 2
and 3 in Figure 12. The ‘furrows’ (1)
are built mainly of organic molecules
enriched in Cl, I and S, and subordinate
magnesian CaCO3. Wavy-shaped zones
occurring among the elongated structural
elements exhibit a similar composition (3).
Preliminary work indicates that the light
grey laminae (2) contain more iodine than
the dark grey laminae (3).
It took longer to etch a powdered
sample of black coral with 1 M HCl than
it did for the mineral corals and organic
residue weighs about 80 % of the original.
FTIR investigations indicate that the black
skeleton of this coral is built mainly of
biopolymers of collagen type mixed with
some magnesian calcite (Figure 13a).
The wide band at 2800–3700 cm−1 is
attributed to O-H vibrations in the proteins
in collagen. Weak maxima at 2868 and
2936 cm−1 are probably caused by C-H
vibrations in CH3 and CH2 groups (Figure
13b). The bands associated with N-H
stretching vibrations in amino and amido
(NH2) groups in the collagen structures
(Doyle Brodsky et al., 1975; Twardowski
and Anzenbacher, 1988; Kamińska and
Sionkowska, 1998) overlap peaks caused
by O-H stretching in water molecules.
The band at 1655 cm−1 probably results
from the coincidence of absorption caused
by H2O bending vibrations and C=O
stretching vibrations in amido groups in
the collagen (‘the Amide I band’), and the
weaker band at 1517 cm−1 is associated
with N-H bending vibrations (‘the Amide II
band’). C-N stretching vibrations in amido
groups probably cause the band at 1443
cm−1, while the coupling of N-H bending
vibrations and C-N stretching vibrations
probably cause the band at 1235 cm−1.
Absorption in the region 550–850 cm−1
with a maximum at 621 cm−1 is probably
due to N-H out-of-plane oscillation.
Golden coralThe origin of this golden coral is
unknown. Its colour is homogeneous with
dull lustre. The presence of characteristic
nodules (the remains of spikes) indicates
that it is black coral, probably treated by
oxidation with hydrogen peroxide (Figure
14). Its bulk density is ca. 1.26 g/cm3.
Under UV the coral is strong blue in long
wave; its CL colour is brown.
In cross section, the golden coral is
similar in structure to black coral (Figure
15) and the borders between the growth
rings are emphasized by thin laminae of
carbonates (Figure 16). SEM-EDS analyses
indicate that secondary magnesian calcites
are also present in numerous fissures is
this coral. Even so, their total volume is
low because after treatment with 1M HCl
solution, the collagen content of the original
coral was estimated at about 99 wt.%.
FTIR spectra of both raw and HCl-
treated samples of golden coral are
shown in Figure17a–b. These spectra are
comparable to those recorded for black
coral in Figure 13a–b.
ConclusionsIn all the corals studied, growth zones
round the core are clearly visible with the
unaided eye or under the microscope.
The mineral corals (white, pink and red)
consist mainly of calcite which has a
poorly ordered structure. The concentric
structure of these corals is emphasized by
size variation of the calcite crystals — the
nearer the centre of the coral, the larger
the calcite. The SEM-EDS analyses revealed
that the carbonate is a magnesian calcite,
and FTIR spectra indicate that silicate
minerals and organic matter are present
only in traces. The black and golden
organic corals are composed mainly
of biopolymers of collagen type with
subordinate carbonate and also show a
concentric-radial structure despite being
composed of a different building material.
In this study spectroscopic analyses
have proved to be most effective in
distinguishing natural from treated corals:
i.e. red coral containing wax or resin and
‘golden coral’ with the same structure and
composition as black coral.
AcknowledgementsMagdalena Sikorska, Adam Gaweł
and Stanisław Olkiewicz are gratefully
acknowledged for performing CL
observations, SEM-EDS and XRD
investigations and FTIR analyses
respectively. Thorough review by an
anonymous reviewer helped to improve
the paper considerably. This work was
financially supported by the AGH-
University of Science and Technology
(Krakow, Poland), through research
project no 11.11.140.158.
ReferencesBrown, G., 1977. Black coral — true or
false. Austral. Gemmol., 13(2), 35–41
Brown, G., 1988. Gold coral re-evaluated.
Austral. Gemmol., 16(12), 473–6
Cairns, S.D., 2007. Deep-water corals: an
overview with special reference to
diversity and distribution of deep-water
scleractinian corals. Bulletin of Marine
Science, 81(3), 311–22
Application of mineralogical methods to the investigation of some gem-quality corals
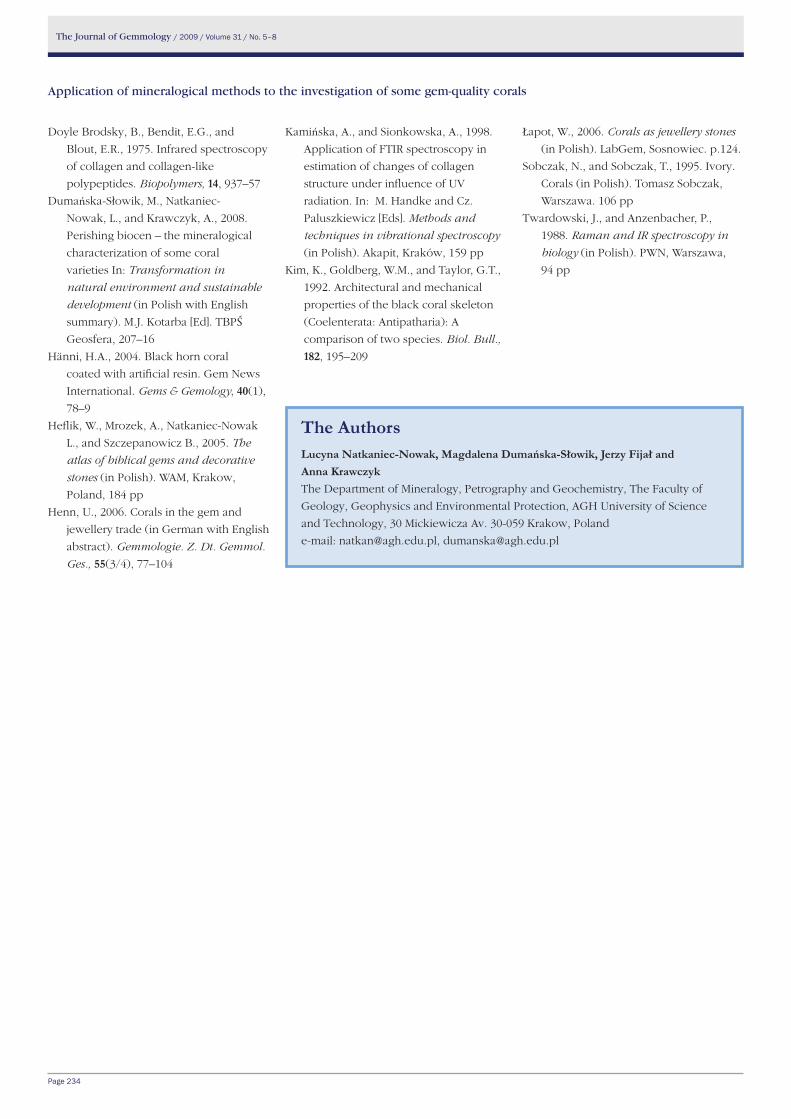
The Journal of Gemmology / 2009 / Volume 31 / No. 5–8
Page 234
Doyle Brodsky, B., Bendit, E.G., and
Blout, E.R., 1975. Infrared spectroscopy
of collagen and collagen-like
polypeptides. Biopolymers, 14, 937–57
Dumańska-Słowik, M., Natkaniec-
Nowak, L., and Krawczyk, A., 2008.
Perishing biocen – the mineralogical
characterization of some coral
varieties In: Transformation in
natural environment and sustainable
development (in Polish with English
summary). M.J. Kotarba [Ed]. TBPŚ
Geosfera, 207–16
Hänni, H.A., 2004. Black horn coral
coated with artificial resin. Gem News
International. Gems & Gemology, 40(1),
78–9
Heflik, W., Mrozek, A., Natkaniec-Nowak
L., and Szczepanowicz B., 2005. The
atlas of biblical gems and decorative
stones (in Polish). WAM, Krakow,
Poland, 184 pp
Henn, U., 2006. Corals in the gem and
jewellery trade (in German with English
abstract). Gemmologie. Z. Dt. Gemmol.
Ges., 55(3/4), 77–104
the Authorslucyna Natkaniec-Nowak, Magdalena Dumańska-Słowik, Jerzy Fijał and Anna Krawczyk
The Department of Mineralogy, Petrography and Geochemistry, The Faculty of
Geology, Geophysics and Environmental Protection, AGH University of Science
and Technology, 30 Mickiewicza Av. 30-059 Krakow, Poland
e-mail: [email protected], [email protected]
Application of mineralogical methods to the investigation of some gem-quality corals
Kamińska, A., and Sionkowska, A., 1998.
Application of FTIR spectroscopy in
estimation of changes of collagen
structure under influence of UV
radiation. In: M. Handke and Cz.
Paluszkiewicz [Eds]. Methods and
techniques in vibrational spectroscopy
(in Polish). Akapit, Kraków, 159 pp
Kim, K., Goldberg, W.M., and Taylor, G.T.,
1992. Architectural and mechanical
properties of the black coral skeleton
(Coelenterata: Antipatharia): A
comparison of two species. Biol. Bull.,
182, 195–209
Łapot, W., 2006. Corals as jewellery stones
(in Polish). LabGem, Sosnowiec. p.124.
Sobczak, N., and Sobczak, T., 1995. Ivory.
Corals (in Polish). Tomasz Sobczak,
Warszawa. 106 pp
Twardowski, J., and Anzenbacher, P.,
1988. Raman and IR spectroscopy in
biology (in Polish). PWN, Warszawa,
94 pp
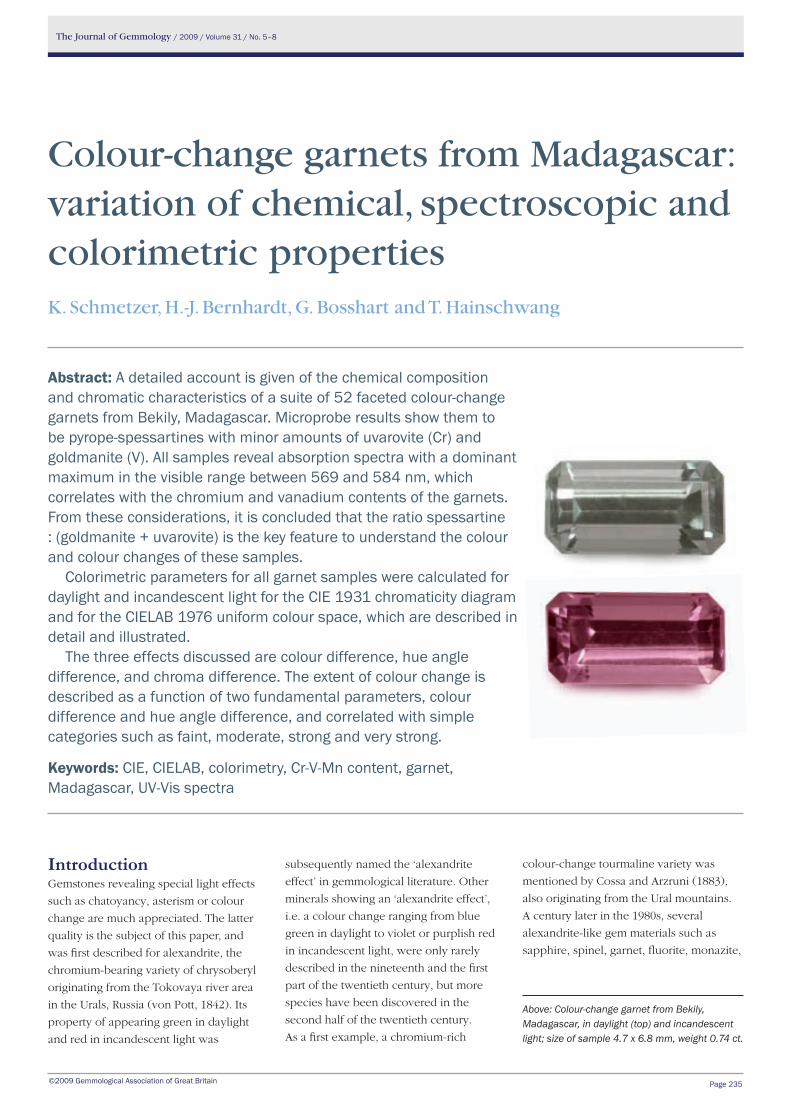
The Journal of Gemmology / 2009 / Volume 31 / No. 5–8
©2009 Gemmological Association of Great Britain Page 235
IntroductionGemstones revealing special light effects
such as chatoyancy, asterism or colour
change are much appreciated. The latter
quality is the subject of this paper, and
was first described for alexandrite, the
chromium-bearing variety of chrysoberyl
originating from the Tokovaya river area
in the Urals, Russia (von Pott, 1842). Its
property of appearing green in daylight
and red in incandescent light was
subsequently named the ‘alexandrite
effect’ in gemmological literature. Other
minerals showing an ‘alexandrite effect’,
i.e. a colour change ranging from blue
green in daylight to violet or purplish red
in incandescent light, were only rarely
described in the nineteenth and the first
part of the twentieth century, but more
species have been discovered in the
second half of the twentieth century.
As a first example, a chromium-rich
colour-change tourmaline variety was
mentioned by Cossa and Arzruni (1883),
also originating from the Ural mountains.
A century later in the 1980s, several
alexandrite-like gem materials such as
sapphire, spinel, garnet, fluorite, monazite,
Colour-change garnets from Madagascar: variation of chemical, spectroscopic and colorimetric propertiesK. Schmetzer, H.-J. Bernhardt, G. Bosshart and T. Hainschwang
Abstract: A detailed account is given of the chemical composition and chromatic characteristics of a suite of 52 faceted colour-change garnets from Bekily, Madagascar. Microprobe results show them to be pyrope-spessartines with minor amounts of uvarovite (Cr) and goldmanite (V). All samples reveal absorption spectra with a dominant maximum in the visible range between 569 and 584 nm, which correlates with the chromium and vanadium contents of the garnets. From these considerations, it is concluded that the ratio spessartine : (goldmanite + uvarovite) is the key feature to understand the colour and colour changes of these samples.
Colorimetric parameters for all garnet samples were calculated for daylight and incandescent light for the CIe 1931 chromaticity diagram and for the CIeLAB 1976 uniform colour space, which are described in detail and illustrated.
The three effects discussed are colour difference, hue angle difference, and chroma difference. The extent of colour change is described as a function of two fundamental parameters, colour difference and hue angle difference, and correlated with simple categories such as faint, moderate, strong and very strong.
Keywords: CIe, CIeLAB, colorimetry, Cr-V-Mn content, garnet, Madagascar, UV-Vis spectra
Above: Colour-change garnet from Bekily, Madagascar, in daylight (top) and incandescent light; size of sample 4.7 x 6.8 mm, weight 0.74 ct.
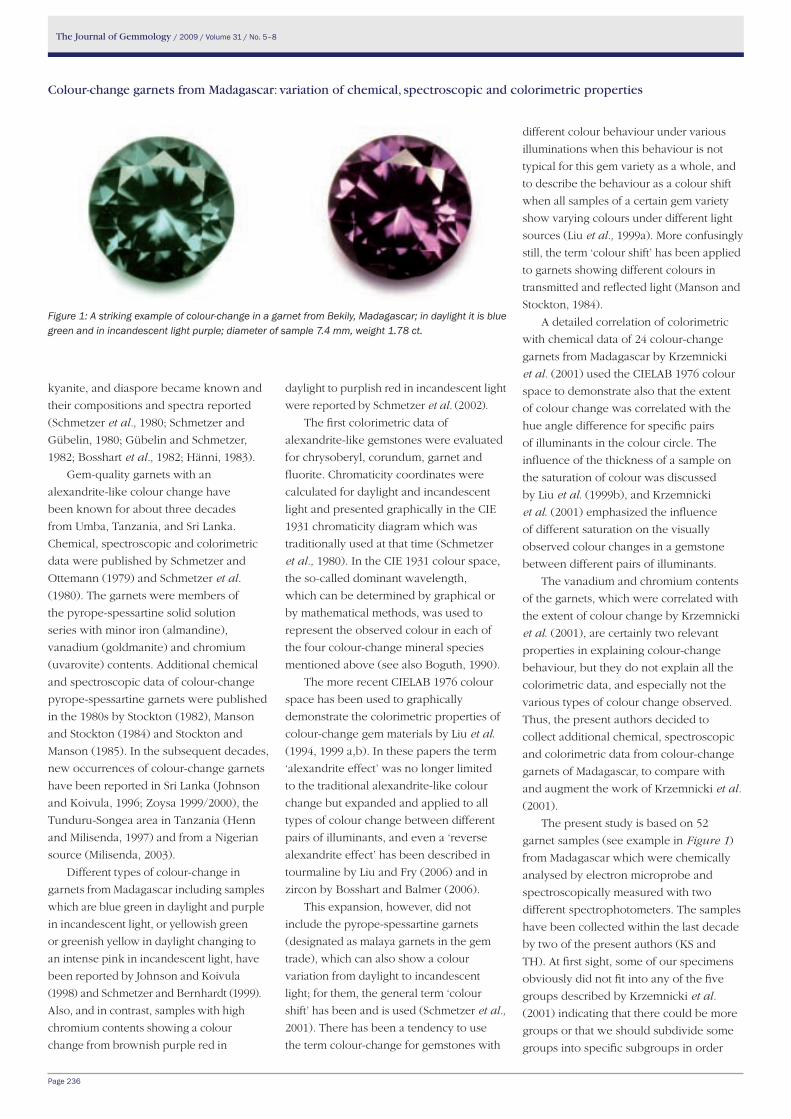
The Journal of Gemmology / 2009 / Volume 31 / No. 5–8
Page 236
kyanite, and diaspore became known and
their compositions and spectra reported
(Schmetzer et al., 1980; Schmetzer and
Gübelin, 1980; Gübelin and Schmetzer,
1982; Bosshart et al., 1982; Hänni, 1983).
Gem-quality garnets with an
alexandrite-like colour change have
been known for about three decades
from Umba, Tanzania, and Sri Lanka.
Chemical, spectroscopic and colorimetric
data were published by Schmetzer and
Ottemann (1979) and Schmetzer et al.
(1980). The garnets were members of
the pyrope-spessartine solid solution
series with minor iron (almandine),
vanadium (goldmanite) and chromium
(uvarovite) contents. Additional chemical
and spectroscopic data of colour-change
pyrope-spessartine garnets were published
in the 1980s by Stockton (1982), Manson
and Stockton (1984) and Stockton and
Manson (1985). In the subsequent decades,
new occurrences of colour-change garnets
have been reported in Sri Lanka (Johnson
and Koivula, 1996; Zoysa 1999/2000), the
Tunduru-Songea area in Tanzania (Henn
and Milisenda, 1997) and from a Nigerian
source (Milisenda, 2003).
Different types of colour-change in
garnets from Madagascar including samples
which are blue green in daylight and purple
in incandescent light, or yellowish green
or greenish yellow in daylight changing to
an intense pink in incandescent light, have
been reported by Johnson and Koivula
(1998) and Schmetzer and Bernhardt (1999).
Also, and in contrast, samples with high
chromium contents showing a colour
change from brownish purple red in
daylight to purplish red in incandescent light
were reported by Schmetzer et al. (2002).
The first colorimetric data of
alexandrite-like gemstones were evaluated
for chrysoberyl, corundum, garnet and
fluorite. Chromaticity coordinates were
calculated for daylight and incandescent
light and presented graphically in the CIE
1931 chromaticity diagram which was
traditionally used at that time (Schmetzer
et al., 1980). In the CIE 1931 colour space,
the so-called dominant wavelength,
which can be determined by graphical or
by mathematical methods, was used to
represent the observed colour in each of
the four colour-change mineral species
mentioned above (see also Boguth, 1990).
The more recent CIELAB 1976 colour
space has been used to graphically
demonstrate the colorimetric properties of
colour-change gem materials by Liu et al.
(1994, 1999 a,b). In these papers the term
‘alexandrite effect’ was no longer limited
to the traditional alexandrite-like colour
change but expanded and applied to all
types of colour change between different
pairs of illuminants, and even a ‘reverse
alexandrite effect’ has been described in
tourmaline by Liu and Fry (2006) and in
zircon by Bosshart and Balmer (2006).
This expansion, however, did not
include the pyrope-spessartine garnets
(designated as malaya garnets in the gem
trade), which can also show a colour
variation from daylight to incandescent
light; for them, the general term ‘colour
shift’ has been and is used (Schmetzer et al.,
2001). There has been a tendency to use
the term colour-change for gemstones with
different colour behaviour under various
illuminations when this behaviour is not
typical for this gem variety as a whole, and
to describe the behaviour as a colour shift
when all samples of a certain gem variety
show varying colours under different light
sources (Liu et al., 1999a). More confusingly
still, the term ‘colour shift’ has been applied
to garnets showing different colours in
transmitted and reflected light (Manson and
Stockton, 1984).
A detailed correlation of colorimetric
with chemical data of 24 colour-change
garnets from Madagascar by Krzemnicki
et al. (2001) used the CIELAB 1976 colour
space to demonstrate also that the extent
of colour change was correlated with the
hue angle difference for specific pairs
of illuminants in the colour circle. The
influence of the thickness of a sample on
the saturation of colour was discussed
by Liu et al. (1999b), and Krzemnicki
et al. (2001) emphasized the influence
of different saturation on the visually
observed colour changes in a gemstone
between different pairs of illuminants.
The vanadium and chromium contents
of the garnets, which were correlated with
the extent of colour change by Krzemnicki
et al. (2001), are certainly two relevant
properties in explaining colour-change
behaviour, but they do not explain all the
colorimetric data, and especially not the
various types of colour change observed.
Thus, the present authors decided to
collect additional chemical, spectroscopic
and colorimetric data from colour-change
garnets of Madagascar, to compare with
and augment the work of Krzemnicki et al.
(2001).
The present study is based on 52
garnet samples (see example in Figure 1)
from Madagascar which were chemically
analysed by electron microprobe and
spectroscopically measured with two
different spectrophotometers. The samples
have been collected within the last decade
by two of the present authors (KS and
TH). At first sight, some of our specimens
obviously did not fit into any of the five
groups described by Krzemnicki et al.
(2001) indicating that there could be more
groups or that we should subdivide some
groups into specific subgroups in order
Colour-change garnets from Madagascar: variation of chemical, spectroscopic and colorimetric properties
Figure 1: A striking example of colour-change in a garnet from Bekily, Madagascar; in daylight it is blue green and in incandescent light purple; diameter of sample 7.4 mm, weight 1.78 ct.
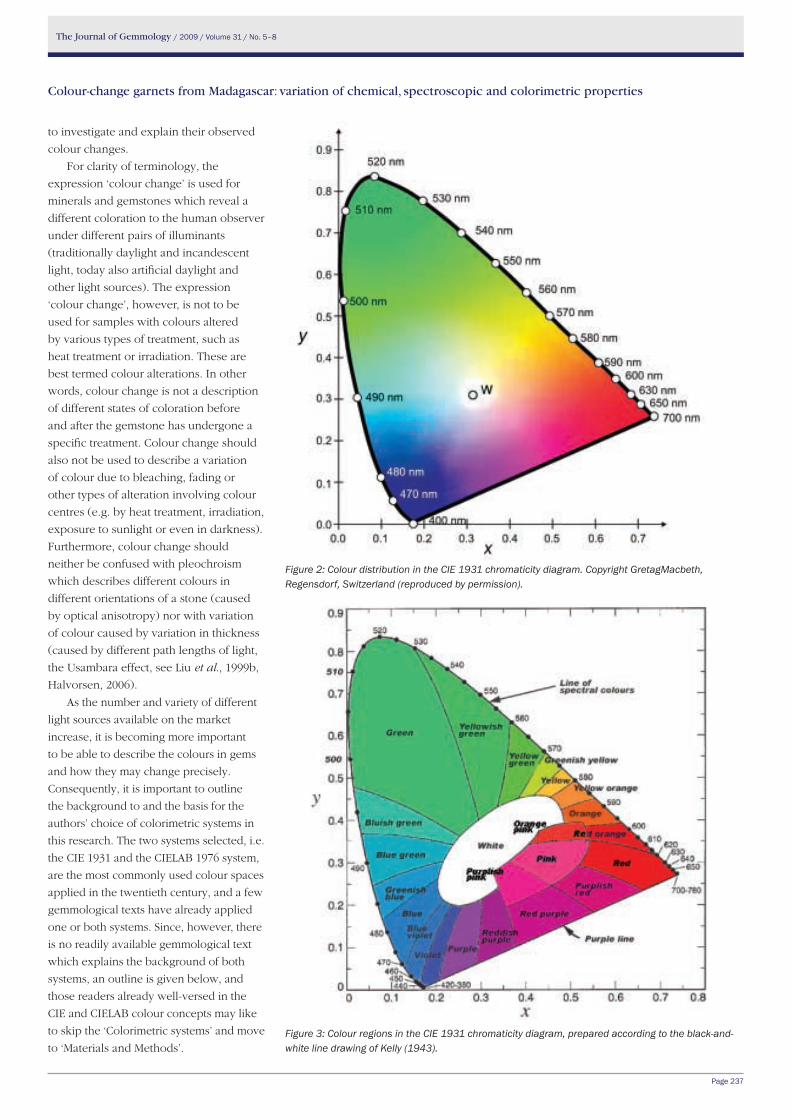
The Journal of Gemmology / 2009 / Volume 31 / No. 5–8
Page 237
to investigate and explain their observed
colour changes.
For clarity of terminology, the
expression ‘colour change’ is used for
minerals and gemstones which reveal a
different coloration to the human observer
under different pairs of illuminants
(traditionally daylight and incandescent
light, today also artificial daylight and
other light sources). The expression
‘colour change’, however, is not to be
used for samples with colours altered
by various types of treatment, such as
heat treatment or irradiation. These are
best termed colour alterations. In other
words, colour change is not a description
of different states of coloration before
and after the gemstone has undergone a
specific treatment. Colour change should
also not be used to describe a variation
of colour due to bleaching, fading or
other types of alteration involving colour
centres (e.g. by heat treatment, irradiation,
exposure to sunlight or even in darkness).
Furthermore, colour change should
neither be confused with pleochroism
which describes different colours in
different orientations of a stone (caused
by optical anisotropy) nor with variation
of colour caused by variation in thickness
(caused by different path lengths of light,
the Usambara effect, see Liu et al., 1999b,
Halvorsen, 2006).
As the number and variety of different
light sources available on the market
increase, it is becoming more important
to be able to describe the colours in gems
and how they may change precisely.
Consequently, it is important to outline
the background to and the basis for the
authors’ choice of colorimetric systems in
this research. The two systems selected, i.e.
the CIE 1931 and the CIELAB 1976 system,
are the most commonly used colour spaces
applied in the twentieth century, and a few
gemmological texts have already applied
one or both systems. Since, however, there
is no readily available gemmological text
which explains the background of both
systems, an outline is given below, and
those readers already well-versed in the
CIE and CIELAB colour concepts may like
to skip the ‘Colorimetric systems’ and move
to ‘Materials and Methods’.
Colour-change garnets from Madagascar: variation of chemical, spectroscopic and colorimetric properties
Figure 2: Colour distribution in the CIE 1931 chromaticity diagram. Copyright GretagMacbeth, Regensdorf, Switzerland (reproduced by permission).
Figure 3: Colour regions in the CIE 1931 chromaticity diagram, prepared according to the black-and-white line drawing of Kelly (1943).
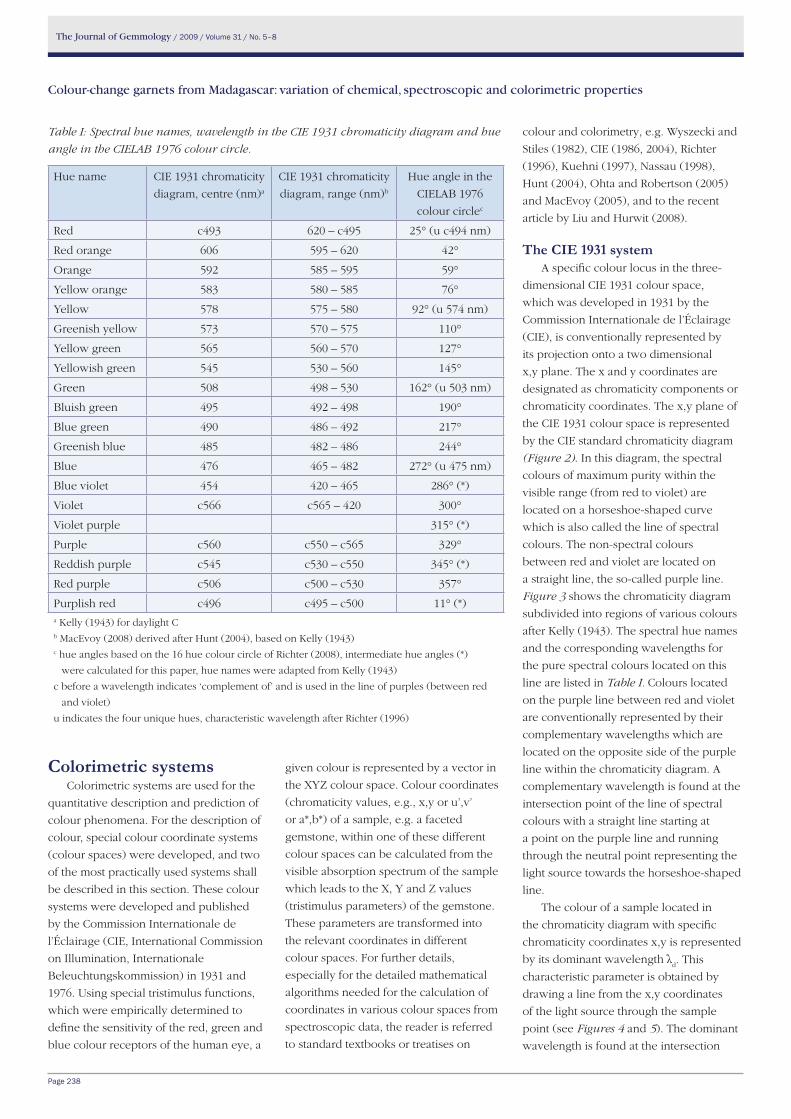
The Journal of Gemmology / 2009 / Volume 31 / No. 5–8
Page 238
Colorimetric systemsColorimetric systems are used for the
quantitative description and prediction of
colour phenomena. For the description of
colour, special colour coordinate systems
(colour spaces) were developed, and two
of the most practically used systems shall
be described in this section. These colour
systems were developed and published
by the Commission Internationale de
l’Éclairage (CIE, International Commission
on Illumination, Internationale
Beleuchtungskommission) in 1931 and
1976. Using special tristimulus functions,
which were empirically determined to
define the sensitivity of the red, green and
blue colour receptors of the human eye, a
Colour-change garnets from Madagascar: variation of chemical, spectroscopic and colorimetric properties
Table I: Spectral hue names, wavelength in the CIE 1931 chromaticity diagram and hue
angle in the CIELAB 1976 colour circle.
Hue name CIE 1931 chromaticity
diagram, centre (nm)a
CIE 1931 chromaticity
diagram, range (nm)b
Hue angle in the
CIELAB 1976
colour circlec
Red c493 620 – c495 25° (u c494 nm)
Red orange 606 595 – 620 42°
Orange 592 585 – 595 59°
Yellow orange 583 580 – 585 76°
Yellow 578 575 – 580 92° (u 574 nm)
Greenish yellow 573 570 – 575 110°
Yellow green 565 560 – 570 127°
Yellowish green 545 530 – 560 145°
Green 508 498 – 530 162° (u 503 nm)
Bluish green 495 492 – 498 190°
Blue green 490 486 – 492 217°
Greenish blue 485 482 – 486 244°
Blue 476 465 – 482 272° (u 475 nm)
Blue violet 454 420 – 465 286° (*)
Violet c566 c565 – 420 300°
Violet purple 315° (*)
Purple c560 c550 – c565 329°
Reddish purple c545 c530 – c550 345° (*)
Red purple c506 c500 – c530 357°
Purplish red c496 c495 – c500 11° (*)a Kelly (1943) for daylight Cb MacEvoy (2008) derived after Hunt (2004), based on Kelly (1943) c hue angles based on the 16 hue colour circle of Richter (2008), intermediate hue angles (*)
were calculated for this paper, hue names were adapted from Kelly (1943)
c before a wavelength indicates ‘complement of’ and is used in the line of purples (between red
and violet)
u indicates the four unique hues, characteristic wavelength after Richter (1996)
given colour is represented by a vector in
the XYZ colour space. Colour coordinates
(chromaticity values, e.g., x,y or u’,v’
or a*,b*) of a sample, e.g. a faceted
gemstone, within one of these different
colour spaces can be calculated from the
visible absorption spectrum of the sample
which leads to the X, Y and Z values
(tristimulus parameters) of the gemstone.
These parameters are transformed into
the relevant coordinates in different
colour spaces. For further details,
especially for the detailed mathematical
algorithms needed for the calculation of
coordinates in various colour spaces from
spectroscopic data, the reader is referred
to standard textbooks or treatises on
colour and colorimetry, e.g. Wyszecki and
Stiles (1982), CIE (1986, 2004), Richter
(1996), Kuehni (1997), Nassau (1998),
Hunt (2004), Ohta and Robertson (2005)
and MacEvoy (2005), and to the recent
article by Liu and Hurwit (2008).
the CIe 1931 systemA specific colour locus in the three-
dimensional CIE 1931 colour space,
which was developed in 1931 by the
Commission Internationale de l’Éclairage
(CIE), is conventionally represented by
its projection onto a two dimensional
x,y plane. The x and y coordinates are
designated as chromaticity components or
chromaticity coordinates. The x,y plane of
the CIE 1931 colour space is represented
by the CIE standard chromaticity diagram
(Figure 2). In this diagram, the spectral
colours of maximum purity within the
visible range (from red to violet) are
located on a horseshoe-shaped curve
which is also called the line of spectral
colours. The non-spectral colours
between red and violet are located on
a straight line, the so-called purple line.
Figure 3 shows the chromaticity diagram
subdivided into regions of various colours
after Kelly (1943). The spectral hue names
and the corresponding wavelengths for
the pure spectral colours located on this
line are listed in Table I. Colours located
on the purple line between red and violet
are conventionally represented by their
complementary wavelengths which are
located on the opposite side of the purple
line within the chromaticity diagram. A
complementary wavelength is found at the
intersection point of the line of spectral
colours with a straight line starting at
a point on the purple line and running
through the neutral point representing the
light source towards the horseshoe-shaped
line.
The colour of a sample located in
the chromaticity diagram with specific
chromaticity coordinates x,y is represented
by its dominant wavelength λd. This
characteristic parameter is obtained by
drawing a line from the x,y coordinates
of the light source through the sample
point (see Figures 4 and 5). The dominant
wavelength is found at the intersection
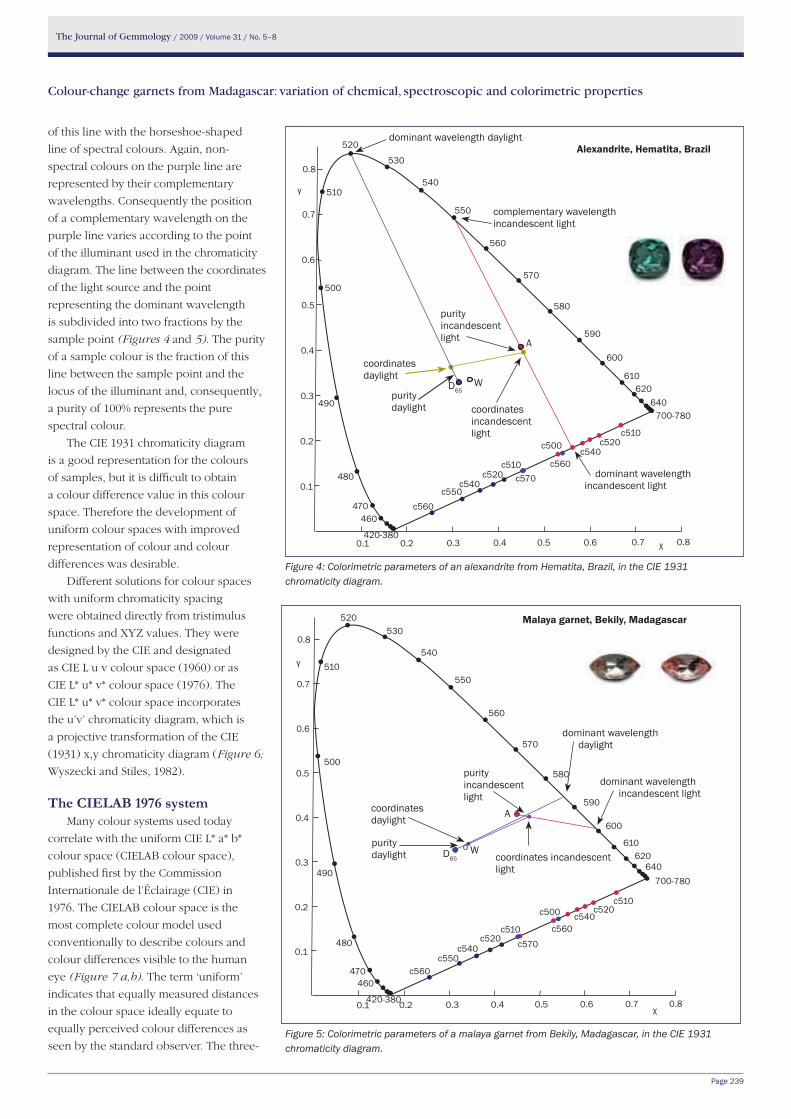
The Journal of Gemmology / 2009 / Volume 31 / No. 5–8
Page 239
of this line with the horseshoe-shaped
line of spectral colours. Again, non-
spectral colours on the purple line are
represented by their complementary
wavelengths. Consequently the position
of a complementary wavelength on the
purple line varies according to the point
of the illuminant used in the chromaticity
diagram. The line between the coordinates
of the light source and the point
representing the dominant wavelength
is subdivided into two fractions by the
sample point (Figures 4 and 5). The purity
of a sample colour is the fraction of this
line between the sample point and the
locus of the illuminant and, consequently,
a purity of 100% represents the pure
spectral colour.
The CIE 1931 chromaticity diagram
is a good representation for the colours
of samples, but it is difficult to obtain
a colour difference value in this colour
space. Therefore the development of
uniform colour spaces with improved
representation of colour and colour
differences was desirable.
Different solutions for colour spaces
with uniform chromaticity spacing
were obtained directly from tristimulus
functions and XYZ values. They were
designed by the CIE and designated
as CIE L u v colour space (1960) or as
CIE L* u* v* colour space (1976). The
CIE L* u* v* colour space incorporates
the u’v’ chromaticity diagram, which is
a projective transformation of the CIE
(1931) x,y chromaticity diagram (Figure 6;
Wyszecki and Stiles, 1982).
the CIelAB 1976 systemMany colour systems used today
correlate with the uniform CIE L* a* b*
colour space (CIELAB colour space),
published first by the Commission
Internationale de l’Éclairage (CIE) in
1976. The CIELAB colour space is the
most complete colour model used
conventionally to describe colours and
colour differences visible to the human
eye (Figure 7 a,b). The term ‘uniform’
indicates that equally measured distances
in the colour space ideally equate to
equally perceived colour differences as
seen by the standard observer. The three-
Figure 4: Colorimetric parameters of an alexandrite from Hematita, Brazil, in the CIE 1931 chromaticity diagram.
Figure 5: Colorimetric parameters of a malaya garnet from Bekily, Madagascar, in the CIE 1931 chromaticity diagram.
Colour-change garnets from Madagascar: variation of chemical, spectroscopic and colorimetric properties
dominant wavelength daylight
complementary wavelengthincandescent light
Alexandrite, Hematita, Brazil
purity incandescent light
coordinates daylight
coordinatesincandescent light
purity daylight
A
D65W
dominant wavelengthincandescent light
0.8
0.7
0.6
0.5
0.4
0.3
0.2
0.1
0.1 0.2 0.3 0.4 0.5 0.6 0.7 0.8
γ
χ
c540
c560c550
540
550
560
570
580
590
600
610
530
520
700-780
c510c520
c540c560
c570
c500
c510c520
500
510
640620
460470
480
490
420-380
dominant wavelength daylight
Malaya garnet, Bekily, Madagascar
purity daylight
dominant wavelength incandescent light
purity incandescent light
coordinates daylight
coordinates incandescent light
A
D65W
0.8
0.7
0.6
0.5
0.4
0.3
0.2
0.1
0.1 0.2 0.3 0.4 0.5 0.6 0.7 0.8
γ
χ
c540
c560c550
540
550
560
570
580
590
600
610
530520
700-780
c510c520
c540c560
c570
c500
c510c520
500
510
640620
460470
480
490
420-380
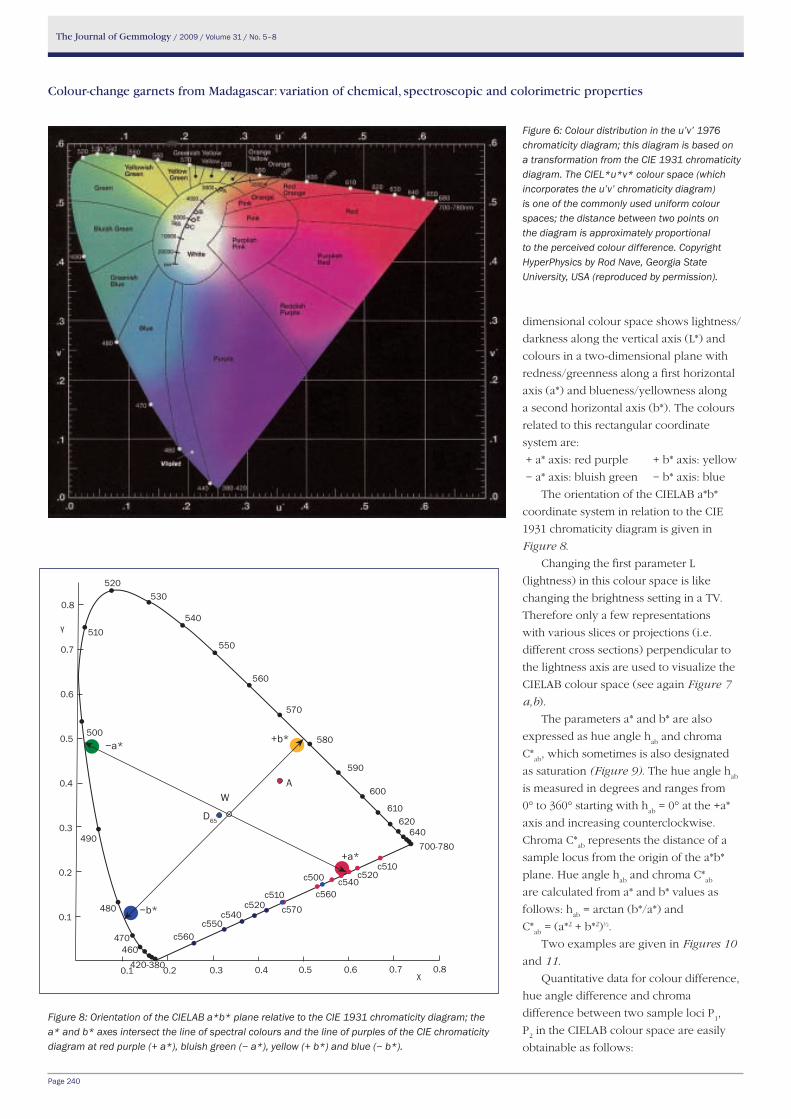
The Journal of Gemmology / 2009 / Volume 31 / No. 5–8
Page 240
Colour-change garnets from Madagascar: variation of chemical, spectroscopic and colorimetric properties
Figure 6: Colour distribution in the u’v’ 1976 chromaticity diagram; this diagram is based on a transformation from the CIE 1931 chromaticity diagram. The CIEL*u*v* colour space (which incorporates the u’v’ chromaticity diagram) is one of the commonly used uniform colour spaces; the distance between two points on the diagram is approximately proportional to the perceived colour difference. Copyright HyperPhysics by Rod Nave, Georgia State University, USA (reproduced by permission).
dimensional colour space shows lightness/
darkness along the vertical axis (L*) and
colours in a two-dimensional plane with
redness/greenness along a first horizontal
axis (a*) and blueness/yellowness along
a second horizontal axis (b*). The colours
related to this rectangular coordinate
system are:
+ a* axis: red purple + b* axis: yellow
− a* axis: bluish green − b* axis: blue
The orientation of the CIELAB a*b*
coordinate system in relation to the CIE
1931 chromaticity diagram is given in
Figure 8.
Changing the first parameter L
(lightness) in this colour space is like
changing the brightness setting in a TV.
Therefore only a few representations
with various slices or projections (i.e.
different cross sections) perpendicular to
the lightness axis are used to visualize the
CIELAB colour space (see again Figure 7
a,b).
The parameters a* and b* are also
expressed as hue angle hab
and chroma
C*ab
, which sometimes is also designated
as saturation (Figure 9). The hue angle hab
is measured in degrees and ranges from
0° to 360° starting with hab
= 0° at the +a*
axis and increasing counterclockwise.
Chroma C*ab
represents the distance of a
sample locus from the origin of the a*b*
plane. Hue angle hab
and chroma C*ab
are calculated from a* and b* values as
follows: hab
= arctan (b*/a*) and
C*ab
= (a*2 + b*2)½.
Two examples are given in Figures 10
and 11.
Quantitative data for colour difference,
hue angle difference and chroma
difference between two sample loci P1,
P2 in the CIELAB colour space are easily
obtainable as follows:
Figure 8: Orientation of the CIELAB a*b* plane relative to the CIE 1931 chromaticity diagram; the a* and b* axes intersect the line of spectral colours and the line of purples of the CIE chromaticity diagram at red purple (+ a*), bluish green (− a*), yellow (+ b*) and blue (− b*).
+a*
+b*−a*
−b*
A
D65
W
0.8
0.7
0.6
0.5
0.4
0.3
0.2
0.1
0.1 0.2 0.3 0.4 0.5 0.6 0.7 0.8
γ
χ
c540
c560c550
540
550
560
570
580
590
600
610
530520
700-780
c510c520
c540c560
c570
c500
c510c520
500
510
640620
460470
480
490
420-380
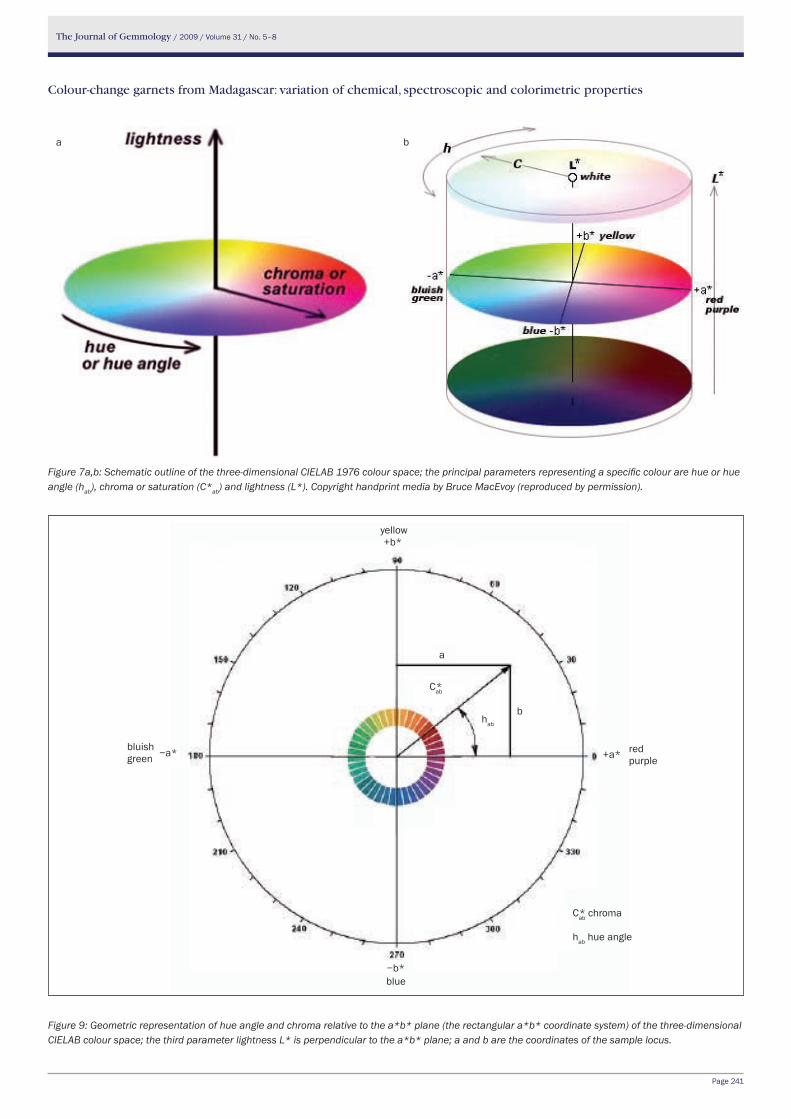
The Journal of Gemmology / 2009 / Volume 31 / No. 5–8
Page 241
Colour-change garnets from Madagascar: variation of chemical, spectroscopic and colorimetric properties
Figure 7a,b: Schematic outline of the three-dimensional CIELAB 1976 colour space; the principal parameters representing a specific colour are hue or hue angle (hab), chroma or saturation (C*ab) and lightness (L*). Copyright handprint media by Bruce MacEvoy (reproduced by permission).
Figure 9: Geometric representation of hue angle and chroma relative to the a*b* plane (the rectangular a*b* coordinate system) of the three-dimensional CIELAB colour space; the third parameter lightness L* is perpendicular to the a*b* plane; a and b are the coordinates of the sample locus.
ba
+a*
+b*
−a*
−b*
red purple
yellow
a
Cab*
blue
bluishgreen
bhab
Cab* chroma
hab hue angle
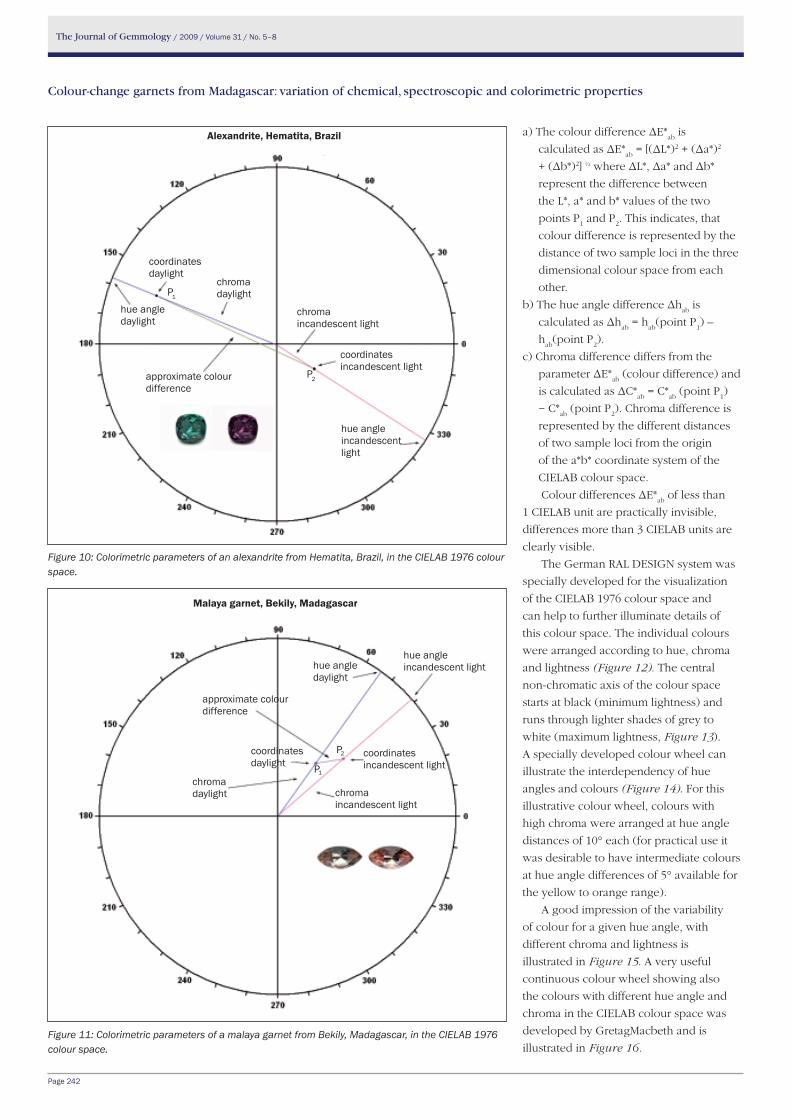
The Journal of Gemmology / 2009 / Volume 31 / No. 5–8
Page 242
Colour-change garnets from Madagascar: variation of chemical, spectroscopic and colorimetric properties
Figure 10: Colorimetric parameters of an alexandrite from Hematita, Brazil, in the CIELAB 1976 colour space.
a) The colour difference ΔE*ab
is
calculated as ΔE*ab
= [(ΔL*)2 + (Δa*)2
+ (Δb*)2] ½ where ΔL*, Δa* and Δb*
represent the difference between
the L*, a* and b* values of the two
points P1 and P
2. This indicates, that
colour difference is represented by the
distance of two sample loci in the three
dimensional colour space from each
other.
b) The hue angle difference Δhab
is
calculated as Δhab
= hab
(point P1) –
hab
(point P2).
c) Chroma difference differs from the
parameter ΔE*ab
(colour difference) and
is calculated as ΔC*ab
= C*ab
(point P1)
− C*ab
(point P2). Chroma difference is
represented by the different distances
of two sample loci from the origin
of the a*b* coordinate system of the
CIELAB colour space.
Colour differences ΔE*ab
of less than
1 CIELAB unit are practically invisible,
differences more than 3 CIELAB units are
clearly visible.
The German RAL DESIGN system was
specially developed for the visualization
of the CIELAB 1976 colour space and
can help to further illuminate details of
this colour space. The individual colours
were arranged according to hue, chroma
and lightness (Figure 12). The central
non-chromatic axis of the colour space
starts at black (minimum lightness) and
runs through lighter shades of grey to
white (maximum lightness, Figure 13).
A specially developed colour wheel can
illustrate the interdependency of hue
angles and colours (Figure 14). For this
illustrative colour wheel, colours with
high chroma were arranged at hue angle
distances of 10° each (for practical use it
was desirable to have intermediate colours
at hue angle differences of 5° available for
the yellow to orange range).
A good impression of the variability
of colour for a given hue angle, with
different chroma and lightness is
illustrated in Figure 15. A very useful
continuous colour wheel showing also
the colours with different hue angle and
chroma in the CIELAB colour space was
developed by GretagMacbeth and is
illustrated in Figure 16. Figure 11: Colorimetric parameters of a malaya garnet from Bekily, Madagascar, in the CIELAB 1976 colour space.
approximate colour difference
chromaincandescent light
Alexandrite, Hematita, Brazil
hue angleincandescent light
coordinates daylight
coordinatesincandescent light
hue angle daylight
chromadaylightP1
P2
approximate colour difference
chromaincandescent light
Malaya garnet, Bekily, Madagascar
hue angleincandescent light
coordinates daylight
coordinatesincandescent light
hue angle daylight
chromadaylight
P2
P1
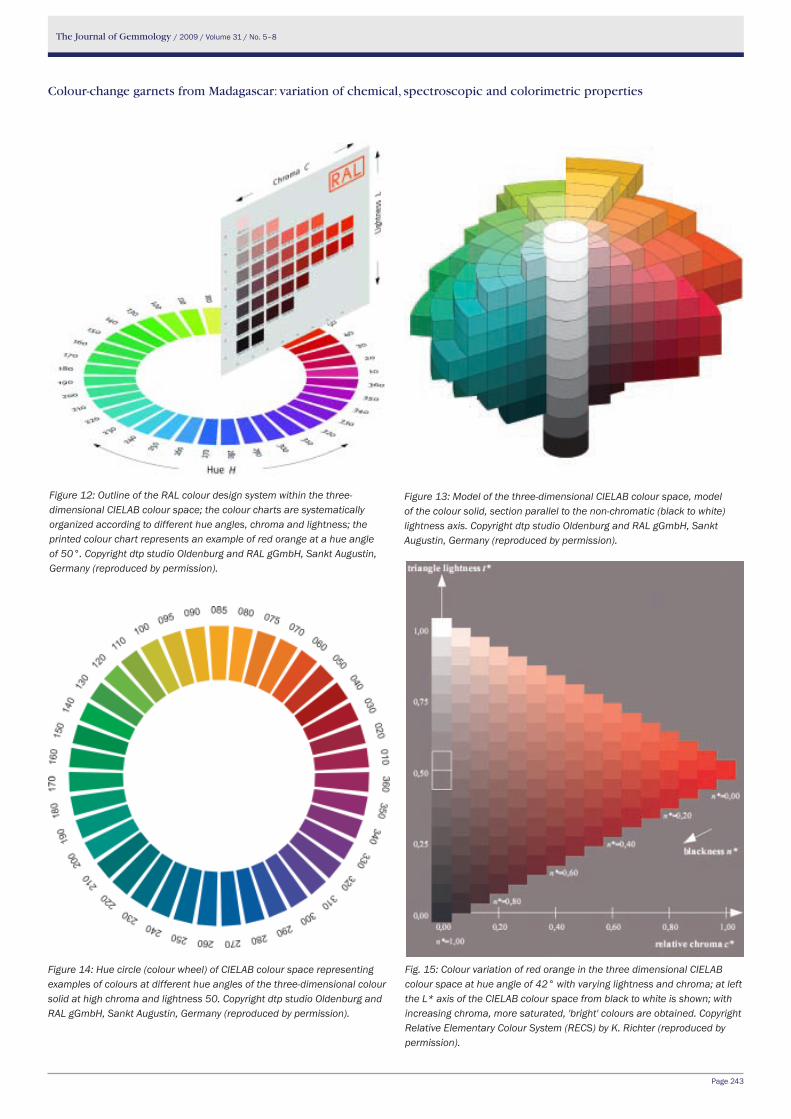
The Journal of Gemmology / 2009 / Volume 31 / No. 5–8
Page 243
Colour-change garnets from Madagascar: variation of chemical, spectroscopic and colorimetric properties
Figure 14: Hue circle (colour wheel) of CIELAB colour space representing examples of colours at different hue angles of the three-dimensional colour solid at high chroma and lightness 50. Copyright dtp studio Oldenburg and RAL gGmbH, Sankt Augustin, Germany (reproduced by permission).
Fig. 15: Colour variation of red orange in the three dimensional CIELAB colour space at hue angle of 42° with varying lightness and chroma; at left the L* axis of the CIELAB colour space from black to white is shown; with increasing chroma, more saturated, 'bright' colours are obtained. Copyright Relative Elementary Colour System (RECS) by K. Richter (reproduced by permission).
Figure 12: Outline of the RAL colour design system within the three-dimensional CIELAB colour space; the colour charts are systematically organized according to different hue angles, chroma and lightness; the printed colour chart represents an example of red orange at a hue angle of 50°. Copyright dtp studio Oldenburg and RAL gGmbH, Sankt Augustin, Germany (reproduced by permission).
Figure 13: Model of the three-dimensional CIELAB colour space, model of the colour solid, section parallel to the non-chromatic (black to white) lightness axis. Copyright dtp studio Oldenburg and RAL gGmbH, Sankt Augustin, Germany (reproduced by permission).
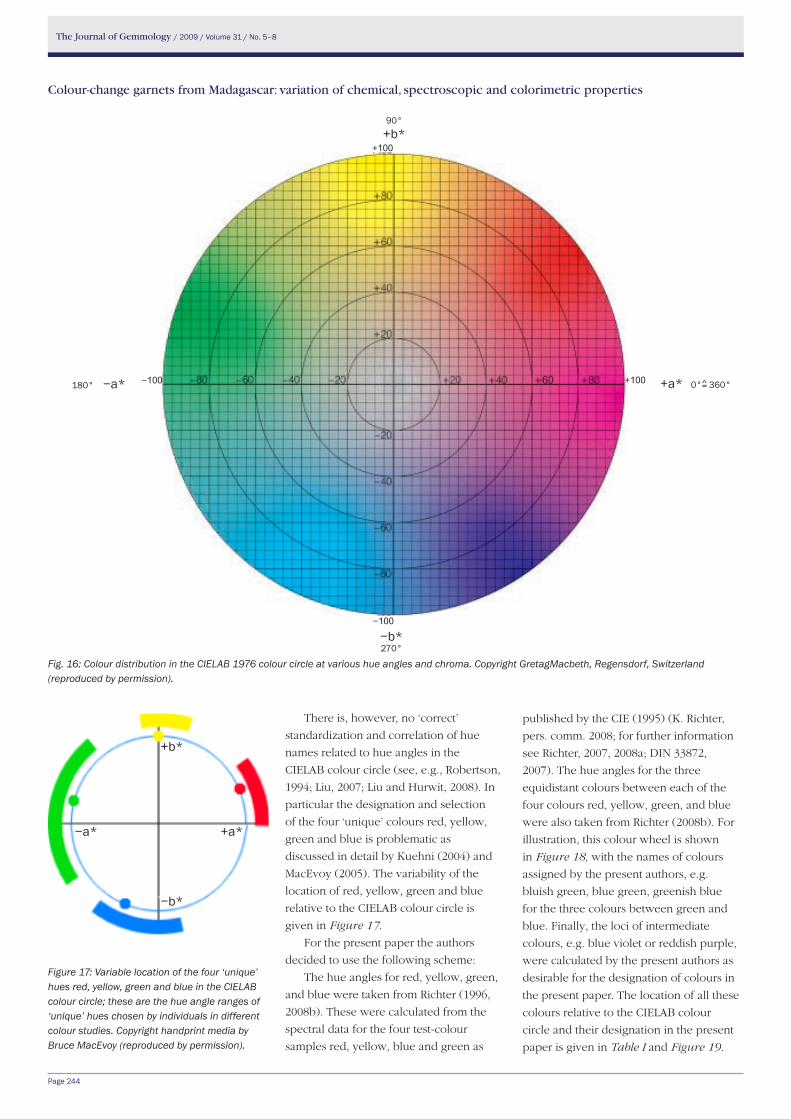
The Journal of Gemmology / 2009 / Volume 31 / No. 5–8
Page 244
Colour-change garnets from Madagascar: variation of chemical, spectroscopic and colorimetric properties
Fig. 16: Colour distribution in the CIELAB 1976 colour circle at various hue angles and chroma. Copyright GretagMacbeth, Regensdorf, Switzerland (reproduced by permission).
There is, however, no ‘correct’
standardization and correlation of hue
names related to hue angles in the
CIELAB colour circle (see, e.g., Robertson,
1994; Liu, 2007; Liu and Hurwit, 2008). In
particular the designation and selection
of the four ‘unique’ colours red, yellow,
green and blue is problematic as
discussed in detail by Kuehni (2004) and
MacEvoy (2005). The variability of the
location of red, yellow, green and blue
relative to the CIELAB colour circle is
given in Figure 17.
For the present paper the authors
decided to use the following scheme:
The hue angles for red, yellow, green,
and blue were taken from Richter (1996,
2008b). These were calculated from the
spectral data for the four test-colour
samples red, yellow, blue and green as
published by the CIE (1995) (K. Richter,
pers. comm. 2008; for further information
see Richter, 2007, 2008a; DIN 33872,
2007). The hue angles for the three
equidistant colours between each of the
four colours red, yellow, green, and blue
were also taken from Richter (2008b). For
illustration, this colour wheel is shown
in Figure 18, with the names of colours
assigned by the present authors, e.g.
bluish green, blue green, greenish blue
for the three colours between green and
blue. Finally, the loci of intermediate
colours, e.g. blue violet or reddish purple,
were calculated by the present authors as
desirable for the designation of colours in
the present paper. The location of all these
colours relative to the CIELAB colour
circle and their designation in the present
paper is given in Table I and Figure 19.
Figure 17: Variable location of the four ‘unique’ hues red, yellow, green and blue in the CIELAB colour circle; these are the hue angle ranges of ‘unique’ hues chosen by individuals in different colour studies. Copyright handprint media by Bruce MacEvoy (reproduced by permission).
−100
−100
+100
+100
90° +b*
+a* 0°= 360°
−b* 270°
180° −a*
−a*
+b*
−b*
+a*
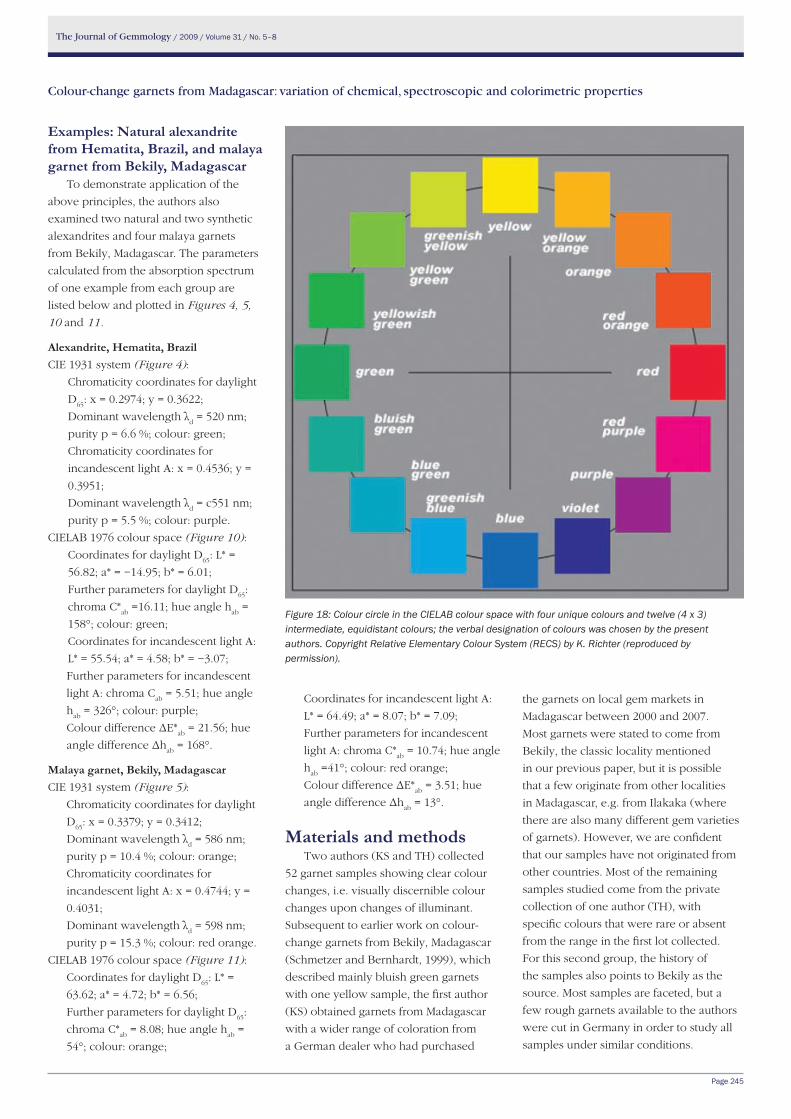
The Journal of Gemmology / 2009 / Volume 31 / No. 5–8
Page 245
Colour-change garnets from Madagascar: variation of chemical, spectroscopic and colorimetric properties
examples: Natural alexandrite from hematita, Brazil, and malaya garnet from Bekily, Madagascar
To demonstrate application of the
above principles, the authors also
examined two natural and two synthetic
alexandrites and four malaya garnets
from Bekily, Madagascar. The parameters
calculated from the absorption spectrum
of one example from each group are
listed below and plotted in Figures 4, 5,
10 and 11.
Alexandrite, hematita, BrazilCIE 1931 system (Figure 4):
Chromaticity coordinates for daylight
D65
: x = 0.2974; y = 0.3622;
Dominant wavelength λd = 520 nm;
purity p = 6.6 %; colour: green;
Chromaticity coordinates for
incandescent light A: x = 0.4536; y =
0.3951;
Dominant wavelength λd = c551 nm;
purity p = 5.5 %; colour: purple.
CIELAB 1976 colour space (Figure 10):
Coordinates for daylight D65
: L* =
56.82; a* = −14.95; b* = 6.01;
Further parameters for daylight D65
:
chroma C*ab
=16.11; hue angle hab
=
158°; colour: green;
Coordinates for incandescent light A:
L* = 55.54; a* = 4.58; b* = −3.07;
Further parameters for incandescent
light A: chroma Cab
= 5.51; hue angle
hab
= 326°; colour: purple;
Colour difference ΔE*ab
= 21.56; hue
angle difference Δhab
= 168°.
Malaya garnet, Bekily, MadagascarCIE 1931 system (Figure 5):
Chromaticity coordinates for daylight
D65
: x = 0.3379; y = 0.3412;
Dominant wavelength λd = 586 nm;
purity p = 10.4 %; colour: orange;
Chromaticity coordinates for
incandescent light A: x = 0.4744; y =
0.4031;
Dominant wavelength λd = 598 nm;
purity p = 15.3 %; colour: red orange.
CIELAB 1976 colour space (Figure 11):
Coordinates for daylight D65
: L* =
63.62; a* = 4.72; b* = 6.56;
Further parameters for daylight D65
:
chroma C*ab
= 8.08; hue angle hab
=
54°; colour: orange;
Figure 18: Colour circle in the CIELAB colour space with four unique colours and twelve (4 x 3) intermediate, equidistant colours; the verbal designation of colours was chosen by the present authors. Copyright Relative Elementary Colour System (RECS) by K. Richter (reproduced by permission).
Coordinates for incandescent light A:
L* = 64.49; a* = 8.07; b* = 7.09;
Further parameters for incandescent
light A: chroma C*ab
= 10.74; hue angle
hab
=41°; colour: red orange;
Colour difference ΔE*ab
= 3.51; hue
angle difference Δhab
= 13°.
Materials and methodsTwo authors (KS and TH) collected
52 garnet samples showing clear colour
changes, i.e. visually discernible colour
changes upon changes of illuminant.
Subsequent to earlier work on colour-
change garnets from Bekily, Madagascar
(Schmetzer and Bernhardt, 1999), which
described mainly bluish green garnets
with one yellow sample, the first author
(KS) obtained garnets from Madagascar
with a wider range of coloration from
a German dealer who had purchased
the garnets on local gem markets in
Madagascar between 2000 and 2007.
Most garnets were stated to come from
Bekily, the classic locality mentioned
in our previous paper, but it is possible
that a few originate from other localities
in Madagascar, e.g. from Ilakaka (where
there are also many different gem varieties
of garnets). However, we are confident
that our samples have not originated from
other countries. Most of the remaining
samples studied come from the private
collection of one author (TH), with
specific colours that were rare or absent
from the range in the first lot collected.
For this second group, the history of
the samples also points to Bekily as the
source. Most samples are faceted, but a
few rough garnets available to the authors
were cut in Germany in order to study all
samples under similar conditions.
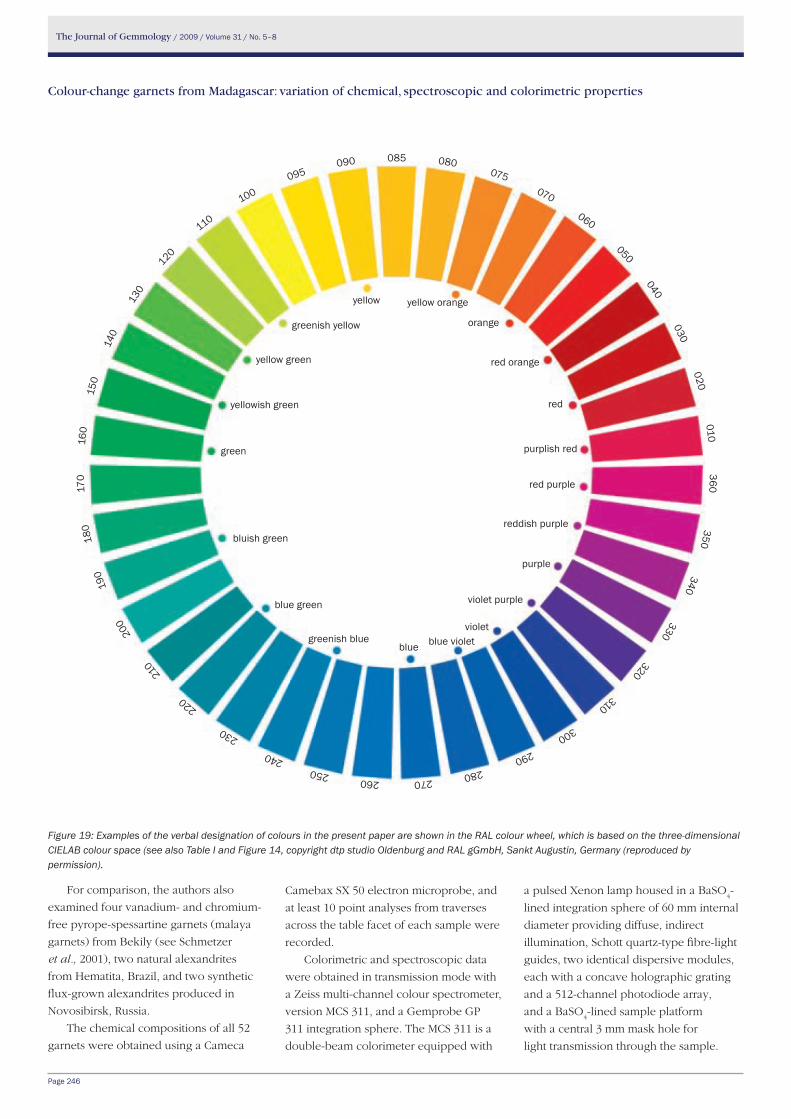
The Journal of Gemmology / 2009 / Volume 31 / No. 5–8
Page 246
Colour-change garnets from Madagascar: variation of chemical, spectroscopic and colorimetric properties
Figure 19: Examples of the verbal designation of colours in the present paper are shown in the RAL colour wheel, which is based on the three-dimensional CIELAB colour space (see also Table I and Figure 14, copyright dtp studio Oldenburg and RAL gGmbH, Sankt Augustin, Germany (reproduced by permission).
For comparison, the authors also
examined four vanadium- and chromium-
free pyrope-spessartine garnets (malaya
garnets) from Bekily (see Schmetzer
et al., 2001), two natural alexandrites
from Hematita, Brazil, and two synthetic
flux-grown alexandrites produced in
Novosibirsk, Russia.
The chemical compositions of all 52
garnets were obtained using a Cameca
Camebax SX 50 electron microprobe, and
at least 10 point analyses from traverses
across the table facet of each sample were
recorded.
Colorimetric and spectroscopic data
were obtained in transmission mode with
a Zeiss multi-channel colour spectrometer,
version MCS 311, and a Gemprobe GP
311 integration sphere. The MCS 311 is a
double-beam colorimeter equipped with
a pulsed Xenon lamp housed in a BaSO4-
lined integration sphere of 60 mm internal
diameter providing diffuse, indirect
illumination, Schott quartz-type fibre-light
guides, two identical dispersive modules,
each with a concave holographic grating
and a 512-channel photodiode array,
and a BaSO4-lined sample platform
with a central 3 mm mask hole for
light transmission through the sample.
yellow yellow orange
orange
red orange
red
red purple
reddish purple
purple
violet purple
violetblue violetblue
greenish blue
blue green
bluish green
yellow green
greenish yellow
yellowish green
green purplish red
360 350 340 330 320 310 300 290 280 270 260 250 240
230
2
20
210
200
190
1
80
17
0
160
150
1
40
130
120
1
10
100 0
95 090 085 080 075 070 060 050 040 030 020 010
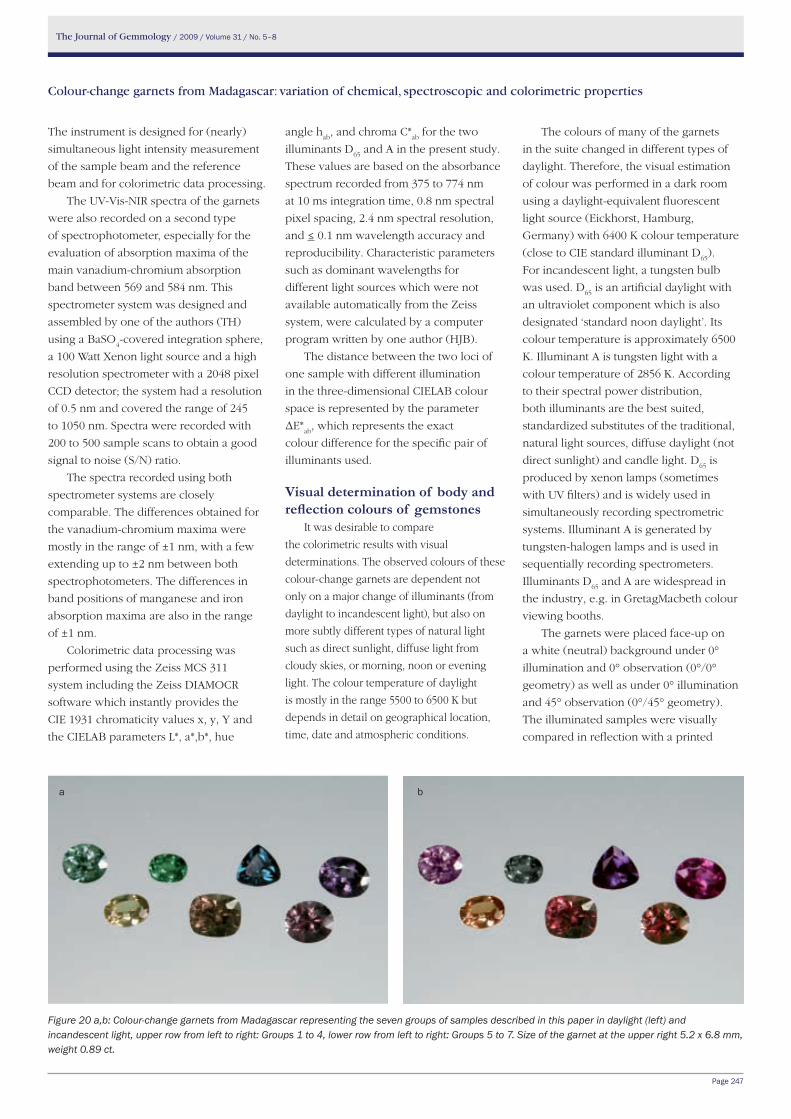
The Journal of Gemmology / 2009 / Volume 31 / No. 5–8
Page 247
Colour-change garnets from Madagascar: variation of chemical, spectroscopic and colorimetric properties
The instrument is designed for (nearly)
simultaneous light intensity measurement
of the sample beam and the reference
beam and for colorimetric data processing.
The UV-Vis-NIR spectra of the garnets
were also recorded on a second type
of spectrophotometer, especially for the
evaluation of absorption maxima of the
main vanadium-chromium absorption
band between 569 and 584 nm. This
spectrometer system was designed and
assembled by one of the authors (TH)
using a BaSO4-covered integration sphere,
a 100 Watt Xenon light source and a high
resolution spectrometer with a 2048 pixel
CCD detector; the system had a resolution
of 0.5 nm and covered the range of 245
to 1050 nm. Spectra were recorded with
200 to 500 sample scans to obtain a good
signal to noise (S/N) ratio.
The spectra recorded using both
spectrometer systems are closely
comparable. The differences obtained for
the vanadium-chromium maxima were
mostly in the range of ±1 nm, with a few
extending up to ±2 nm between both
spectrophotometers. The differences in
band positions of manganese and iron
absorption maxima are also in the range
of ±1 nm.
Colorimetric data processing was
performed using the Zeiss MCS 311
system including the Zeiss DIAMOCR
software which instantly provides the
CIE 1931 chromaticity values x, y, Y and
the CIELAB parameters L*, a*,b*, hue
angle hab
, and chroma C*ab
for the two
illuminants D65
and A in the present study.
These values are based on the absorbance
spectrum recorded from 375 to 774 nm
at 10 ms integration time, 0.8 nm spectral
pixel spacing, 2.4 nm spectral resolution,
and ≤ 0.1 nm wavelength accuracy and
reproducibility. Characteristic parameters
such as dominant wavelengths for
different light sources which were not
available automatically from the Zeiss
system, were calculated by a computer
program written by one author (HJB).
The distance between the two loci of
one sample with different illumination
in the three-dimensional CIELAB colour
space is represented by the parameter
ΔE*ab
, which represents the exact
colour difference for the specific pair of
illuminants used.
Visual determination of body and reflection colours of gemstones
It was desirable to compare
the colorimetric results with visual
determinations. The observed colours of these
colour-change garnets are dependent not
only on a major change of illuminants (from
daylight to incandescent light), but also on
more subtly different types of natural light
such as direct sunlight, diffuse light from
cloudy skies, or morning, noon or evening
light. The colour temperature of daylight
is mostly in the range 5500 to 6500 K but
depends in detail on geographical location,
time, date and atmospheric conditions.
The colours of many of the garnets
in the suite changed in different types of
daylight. Therefore, the visual estimation
of colour was performed in a dark room
using a daylight-equivalent fluorescent
light source (Eickhorst, Hamburg,
Germany) with 6400 K colour temperature
(close to CIE standard illuminant D65
).
For incandescent light, a tungsten bulb
was used. D65
is an artificial daylight with
an ultraviolet component which is also
designated ‘standard noon daylight’. Its
colour temperature is approximately 6500
K. Illuminant A is tungsten light with a
colour temperature of 2856 K. According
to their spectral power distribution,
both illuminants are the best suited,
standardized substitutes of the traditional,
natural light sources, diffuse daylight (not
direct sunlight) and candle light. D65
is
produced by xenon lamps (sometimes
with UV filters) and is widely used in
simultaneously recording spectrometric
systems. Illuminant A is generated by
tungsten-halogen lamps and is used in
sequentially recording spectrometers.
Illuminants D65
and A are widespread in
the industry, e.g. in GretagMacbeth colour
viewing booths.
The garnets were placed face-up on
a white (neutral) background under 0°
illumination and 0° observation (0°/0°
geometry) as well as under 0° illumination
and 45° observation (0°/45° geometry).
The illuminated samples were visually
compared in reflection with a printed
Figure 20 a,b: Colour-change garnets from Madagascar representing the seven groups of samples described in this paper in daylight (left) and incandescent light, upper row from left to right: Groups 1 to 4, lower row from left to right: Groups 5 to 7. Size of the garnet at the upper right 5.2 x 6.8 mm, weight 0.89 ct.
ba
360 350 340 330 320 310 300 290 280 270 260 250 240
230
2
20
210
200
190
1
80
17
0
160
150
1
40
130
120
1
10
100 0
95 090 085 080 075 070 060 050 040 030 020 010
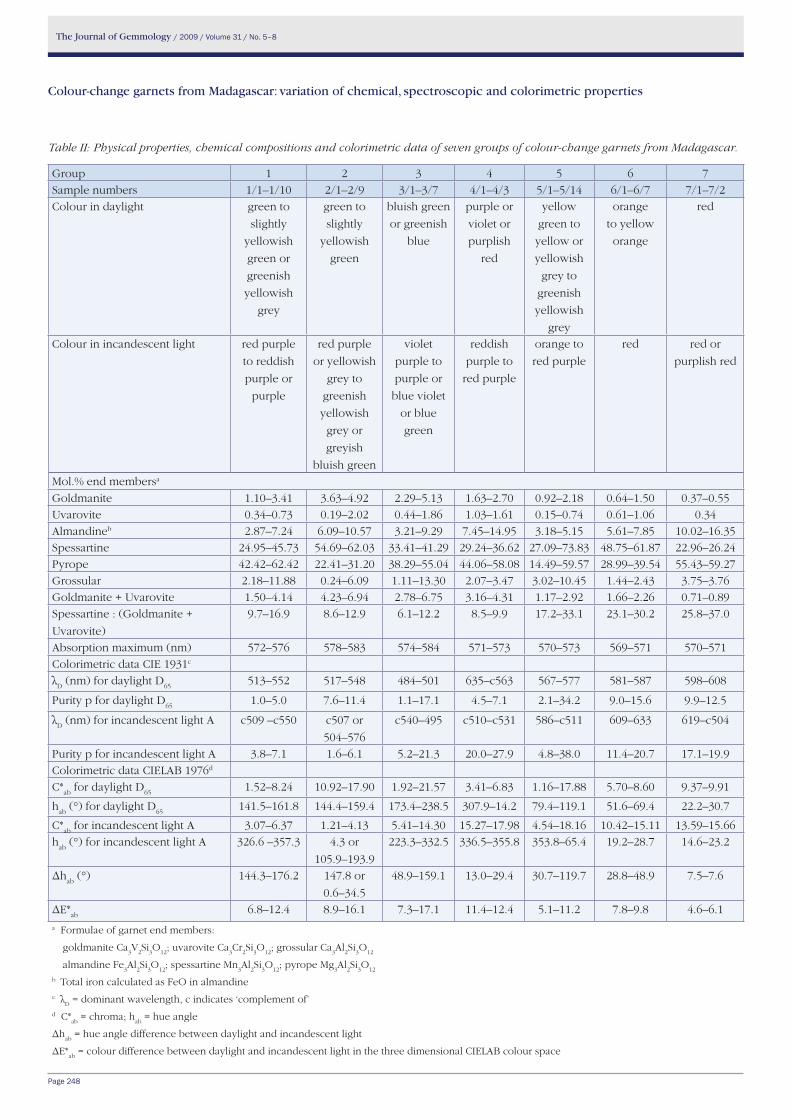
The Journal of Gemmology / 2009 / Volume 31 / No. 5–8
Page 248
Colour-change garnets from Madagascar: variation of chemical, spectroscopic and colorimetric properties
Table II: Physical properties, chemical compositions and colorimetric data of seven groups of colour-change garnets from Madagascar.
Group 1 2 3 4 5 6 7Sample numbers 1/1–1/10 2/1–2/9 3/1–3/7 4/1–4/3 5/1–5/14 6/1–6/7 7/1–7/2Colour in daylight green to
slightly
yellowish
green or
greenish
yellowish
grey
green to
slightly
yellowish
green
bluish green
or greenish
blue
purple or
violet or
purplish
red
yellow
green to
yellow or
yellowish
grey to
greenish
yellowish
grey
orange
to yellow
orange
red
Colour in incandescent light red purple
to reddish
purple or
purple
red purple
or yellowish
grey to
greenish
yellowish
grey or
greyish
bluish green
violet
purple to
purple or
blue violet
or blue
green
reddish
purple to
red purple
orange to
red purple
red red or
purplish red
Mol.% end membersa
Goldmanite 1.10–3.41 3.63–4.92 2.29–5.13 1.63–2.70 0.92–2.18 0.64–1.50 0.37–0.55Uvarovite 0.34–0.73 0.19–2.02 0.44–1.86 1.03–1.61 0.15–0.74 0.61–1.06 0.34Almandineb 2.87–7.24 6.09–10.57 3.21–9.29 7.45–14.95 3.18–5.15 5.61–7.85 10.02–16.35Spessartine 24.95–45.73 54.69–62.03 33.41–41.29 29.24–36.62 27.09–73.83 48.75–61.87 22.96–26.24Pyrope 42.42–62.42 22.41–31.20 38.29–55.04 44.06–58.08 14.49–59.57 28.99–39.54 55.43–59.27Grossular 2.18–11.88 0.24–6.09 1.11–13.30 2.07–3.47 3.02–10.45 1.44–2.43 3.75–3.76Goldmanite + Uvarovite 1.50–4.14 4.23–6.94 2.78–6.75 3.16–4.31 1.17–2.92 1.66–2.26 0.71–0.89Spessartine : (Goldmanite +
Uvarovite)
9.7–16.9 8.6–12.9 6.1–12.2 8.5–9.9 17.2–33.1 23.1–30.2 25.8–37.0
Absorption maximum (nm) 572–576 578–583 574–584 571–573 570–573 569–571 570–571Colorimetric data CIE 1931c
λD (nm) for daylight D
65513–552 517–548 484–501 635–c563 567–577 581–587 598–608
Purity p for daylight D65
1.0–5.0 7.6–11.4 1.1–17.1 4.5–7.1 2.1–34.2 9.0–15.6 9.9–12.5
λD (nm) for incandescent light A c509 –c550 c507 or
504–576
c540–495 c510–c531 586–c511 609–633 619–c504
Purity p for incandescent light A 3.8–7.1 1.6–6.1 5.2–21.3 20.0–27.9 4.8–38.0 11.4–20.7 17.1–19.9Colorimetric data CIELAB 1976d
C*ab
for daylight D65
1.52–8.24 10.92–17.90 1.92–21.57 3.41–6.83 1.16–17.88 5.70–8.60 9.37–9.91
hab
(°) for daylight D65
141.5–161.8 144.4–159.4 173.4–238.5 307.9–14.2 79.4–119.1 51.6–69.4 22.2–30.7
C*ab
for incandescent light A 3.07–6.37 1.21–4.13 5.41–14.30 15.27–17.98 4.54–18.16 10.42–15.11 13.59–15.66h
ab (°) for incandescent light A 326.6 –357.3 4.3 or
105.9–193.9
223.3–332.5 336.5–355.8 353.8–65.4 19.2–28.7 14.6–23.2
Δhab
(°) 144.3–176.2 147.8 or
0.6–34.5
48.9–159.1 13.0–29.4 30.7–119.7 28.8–48.9 7.5–7.6
ΔE*ab
6.8–12.4 8.9–16.1 7.3–17.1 11.4–12.4 5.1–11.2 7.8–9.8 4.6–6.1
a Formulae of garnet end members:
goldmanite Ca3V
2Si
3O
12; uvarovite Ca
3Cr
2Si
3O
12; grossular Ca
3Al
2Si
3O
12
almandine Fe3Al
2Si
3O
12; spessartine Mn
3Al
2Si
3O
12; pyrope Mg
3Al
2Si
3O
12
b Total iron calculated as FeO in almandinec λ
D = dominant wavelength, c indicates ‘complement of’
d C*ab
= chroma; hab
= hue angle
Δhab
= hue angle difference between daylight and incandescent light
ΔE*ab
= colour difference between daylight and incandescent light in the three dimensional CIELAB colour space
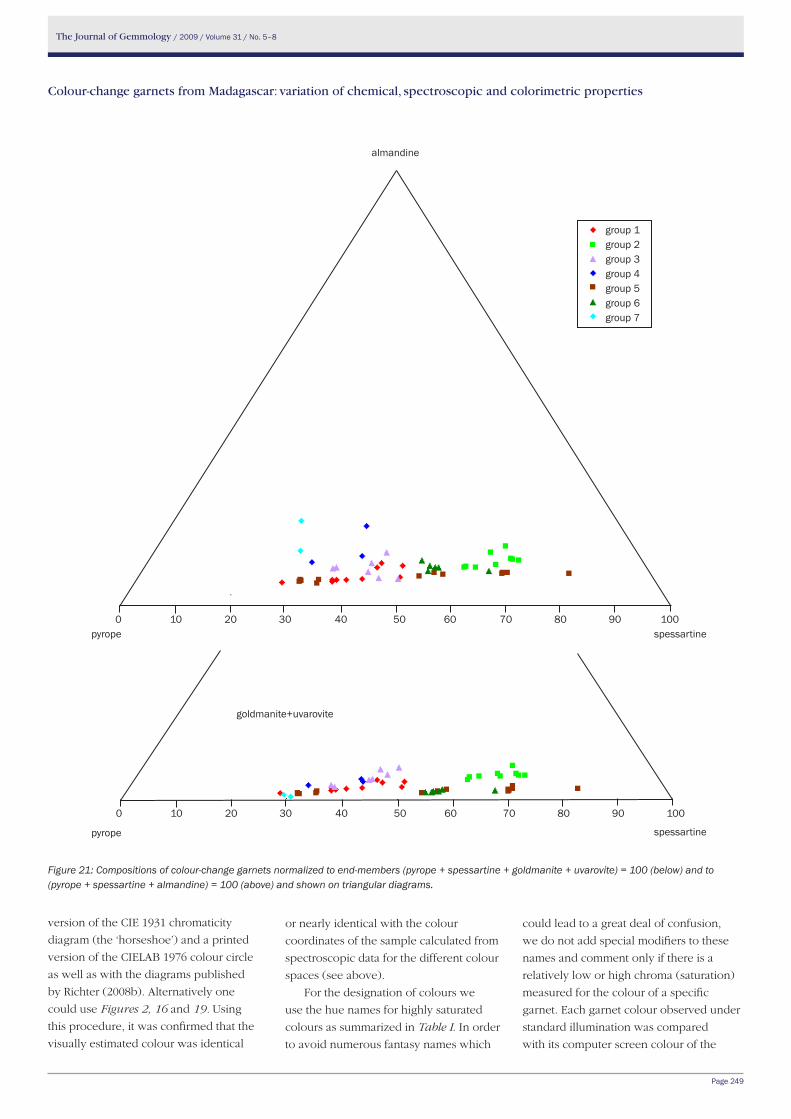
The Journal of Gemmology / 2009 / Volume 31 / No. 5–8
Page 249
version of the CIE 1931 chromaticity
diagram (the ‘horseshoe’) and a printed
version of the CIELAB 1976 colour circle
as well as with the diagrams published
by Richter (2008b). Alternatively one
could use Figures 2, 16 and 19. Using
this procedure, it was confirmed that the
visually estimated colour was identical
or nearly identical with the colour
coordinates of the sample calculated from
spectroscopic data for the different colour
spaces (see above).
For the designation of colours we
use the hue names for highly saturated
colours as summarized in Table I. In order
to avoid numerous fantasy names which
could lead to a great deal of confusion,
we do not add special modifiers to these
names and comment only if there is a
relatively low or high chroma (saturation)
measured for the colour of a specific
garnet. Each garnet colour observed under
standard illumination was compared
with its computer screen colour of the
Figure 21: Compositions of colour-change garnets normalized to end-members (pyrope + spessartine + goldmanite + uvarovite) = 100 (below) and to (pyrope + spessartine + almandine) = 100 (above) and shown on triangular diagrams.
Colour-change garnets from Madagascar: variation of chemical, spectroscopic and colorimetric properties
0 10 20 30 40 50 60 70 80 90 100
pyrope
pyrope
spessartine
spessartine
goldmanite+uvarovite
almandine
group 1group 2group 3group 4group 5group 6group 7
0 10 20 30 40 50 60 70 80 90 100
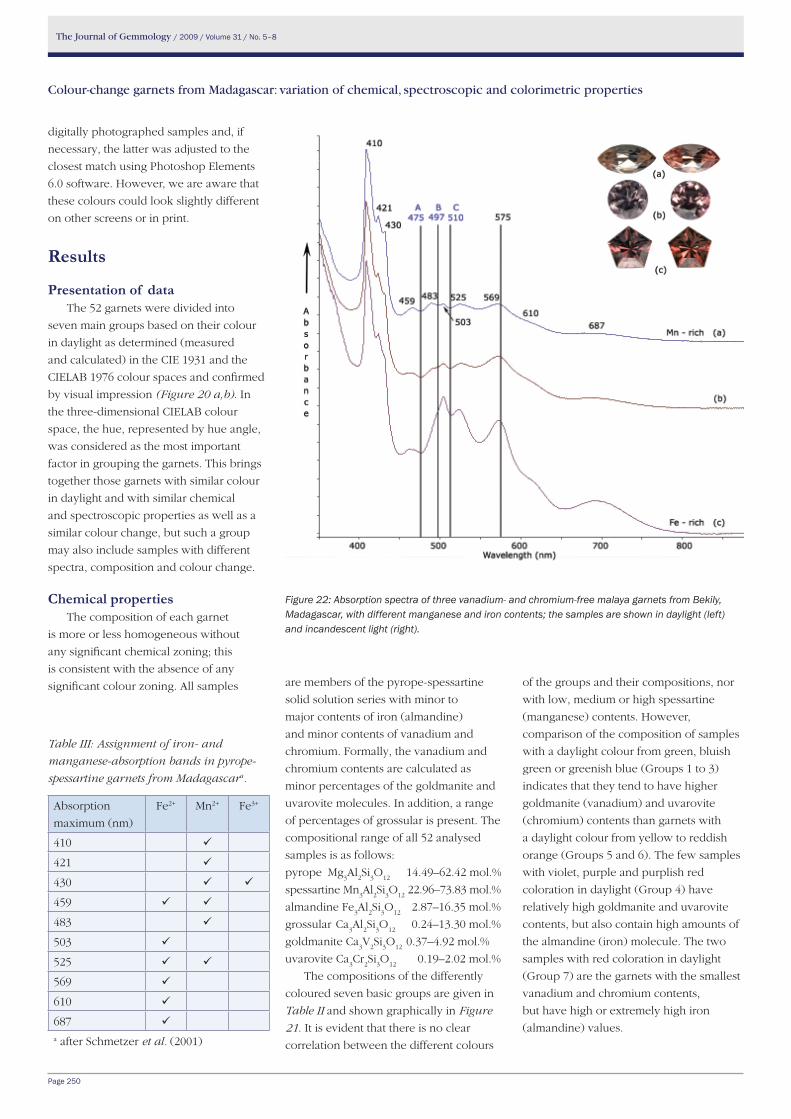
The Journal of Gemmology / 2009 / Volume 31 / No. 5–8
Page 250
Colour-change garnets from Madagascar: variation of chemical, spectroscopic and colorimetric properties
digitally photographed samples and, if
necessary, the latter was adjusted to the
closest match using Photoshop Elements
6.0 software. However, we are aware that
these colours could look slightly different
on other screens or in print.
Results
Presentation of dataThe 52 garnets were divided into
seven main groups based on their colour
in daylight as determined (measured
and calculated) in the CIE 1931 and the
CIELAB 1976 colour spaces and confirmed
by visual impression (Figure 20 a,b). In
the three-dimensional CIELAB colour
space, the hue, represented by hue angle,
was considered as the most important
factor in grouping the garnets. This brings
together those garnets with similar colour
in daylight and with similar chemical
and spectroscopic properties as well as a
similar colour change, but such a group
may also include samples with different
spectra, composition and colour change.
Chemical propertiesThe composition of each garnet
is more or less homogeneous without
any significant chemical zoning; this
is consistent with the absence of any
significant colour zoning. All samples are members of the pyrope-spessartine
solid solution series with minor to
major contents of iron (almandine)
and minor contents of vanadium and
chromium. Formally, the vanadium and
chromium contents are calculated as
minor percentages of the goldmanite and
uvarovite molecules. In addition, a range
of percentages of grossular is present. The
compositional range of all 52 analysed
samples is as follows:
pyrope Mg3Al
2Si
3O
12 14.49–62.42 mol.%
spessartine Mn3Al
2Si
3O
12 22.96–73.83 mol.%
almandine Fe3Al
2Si
3O
12 2.87–16.35 mol.%
grossular Ca3Al
2Si
3O
12 0.24–13.30 mol.%
goldmanite Ca3V
2Si
3O
12 0.37–4.92 mol.%
uvarovite Ca3Cr
2Si
3O
12 0.19–2.02 mol.%
The compositions of the differently
coloured seven basic groups are given in
Table II and shown graphically in Figure
21. It is evident that there is no clear
correlation between the different colours
of the groups and their compositions, nor
with low, medium or high spessartine
(manganese) contents. However,
comparison of the composition of samples
with a daylight colour from green, bluish
green or greenish blue (Groups 1 to 3)
indicates that they tend to have higher
goldmanite (vanadium) and uvarovite
(chromium) contents than garnets with
a daylight colour from yellow to reddish
orange (Groups 5 and 6). The few samples
with violet, purple and purplish red
coloration in daylight (Group 4) have
relatively high goldmanite and uvarovite
contents, but also contain high amounts of
the almandine (iron) molecule. The two
samples with red coloration in daylight
(Group 7) are the garnets with the smallest
vanadium and chromium contents,
but have high or extremely high iron
(almandine) values.
Figure 22: Absorption spectra of three vanadium- and chromium-free malaya garnets from Bekily, Madagascar, with different manganese and iron contents; the samples are shown in daylight (left) and incandescent light (right).
Table III: Assignment of iron- and
manganese-absorption bands in pyrope-
spessartine garnets from Madagascara.
Absorption
maximum (nm)
Fe2+ Mn2+ Fe3+
410
421
430
459
483
503
525
569
610
687 a after Schmetzer et al. (2001)
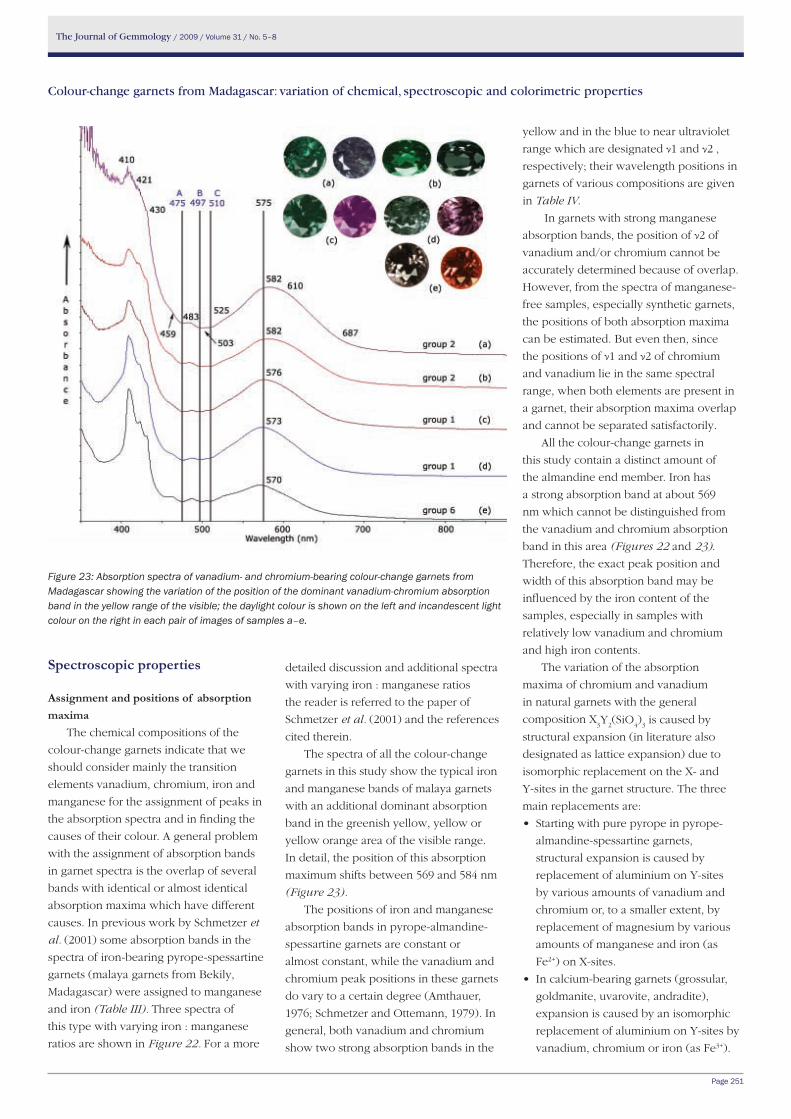
The Journal of Gemmology / 2009 / Volume 31 / No. 5–8
Page 251
Colour-change garnets from Madagascar: variation of chemical, spectroscopic and colorimetric properties
Figure 23: Absorption spectra of vanadium- and chromium-bearing colour-change garnets from Madagascar showing the variation of the position of the dominant vanadium-chromium absorption band in the yellow range of the visible; the daylight colour is shown on the left and incandescent light colour on the right in each pair of images of samples a–e.
Spectroscopic properties
Assignment and positions of absorption maxima
The chemical compositions of the
colour-change garnets indicate that we
should consider mainly the transition
elements vanadium, chromium, iron and
manganese for the assignment of peaks in
the absorption spectra and in finding the
causes of their colour. A general problem
with the assignment of absorption bands
in garnet spectra is the overlap of several
bands with identical or almost identical
absorption maxima which have different
causes. In previous work by Schmetzer et
al. (2001) some absorption bands in the
spectra of iron-bearing pyrope-spessartine
garnets (malaya garnets from Bekily,
Madagascar) were assigned to manganese
and iron (Table III). Three spectra of
this type with varying iron : manganese
ratios are shown in Figure 22. For a more
detailed discussion and additional spectra
with varying iron : manganese ratios
the reader is referred to the paper of
Schmetzer et al. (2001) and the references
cited therein.
The spectra of all the colour-change
garnets in this study show the typical iron
and manganese bands of malaya garnets
with an additional dominant absorption
band in the greenish yellow, yellow or
yellow orange area of the visible range.
In detail, the position of this absorption
maximum shifts between 569 and 584 nm
(Figure 23).
The positions of iron and manganese
absorption bands in pyrope-almandine-
spessartine garnets are constant or
almost constant, while the vanadium and
chromium peak positions in these garnets
do vary to a certain degree (Amthauer,
1976; Schmetzer and Ottemann, 1979). In
general, both vanadium and chromium
show two strong absorption bands in the
yellow and in the blue to near ultraviolet
range which are designated ν1 and ν2 ,
respectively; their wavelength positions in
garnets of various compositions are given
in Table IV.
In garnets with strong manganese
absorption bands, the position of ν2 of
vanadium and/or chromium cannot be
accurately determined because of overlap.
However, from the spectra of manganese-
free samples, especially synthetic garnets,
the positions of both absorption maxima
can be estimated. But even then, since
the positions of ν1 and ν2 of chromium
and vanadium lie in the same spectral
range, when both elements are present in
a garnet, their absorption maxima overlap
and cannot be separated satisfactorily.
All the colour-change garnets in
this study contain a distinct amount of
the almandine end member. Iron has
a strong absorption band at about 569
nm which cannot be distinguished from
the vanadium and chromium absorption
band in this area (Figures 22 and 23).
Therefore, the exact peak position and
width of this absorption band may be
influenced by the iron content of the
samples, especially in samples with
relatively low vanadium and chromium
and high iron contents.
The variation of the absorption
maxima of chromium and vanadium
in natural garnets with the general
composition X3Y
2(SiO
4)
3 is caused by
structural expansion (in literature also
designated as lattice expansion) due to
isomorphic replacement on the X- and
Y-sites in the garnet structure. The three
main replacements are:
• Startingwithpurepyropeinpyrope-
almandine-spessartine garnets,
structural expansion is caused by
replacement of aluminium on Y-sites
by various amounts of vanadium and
chromium or, to a smaller extent, by
replacement of magnesium by various
amounts of manganese and iron (as
Fe2+) on X-sites.
• Incalcium-bearinggarnets(grossular,
goldmanite, uvarovite, andradite),
expansion is caused by an isomorphic
replacement of aluminium on Y-sites by
vanadium, chromium or iron (as Fe3+).
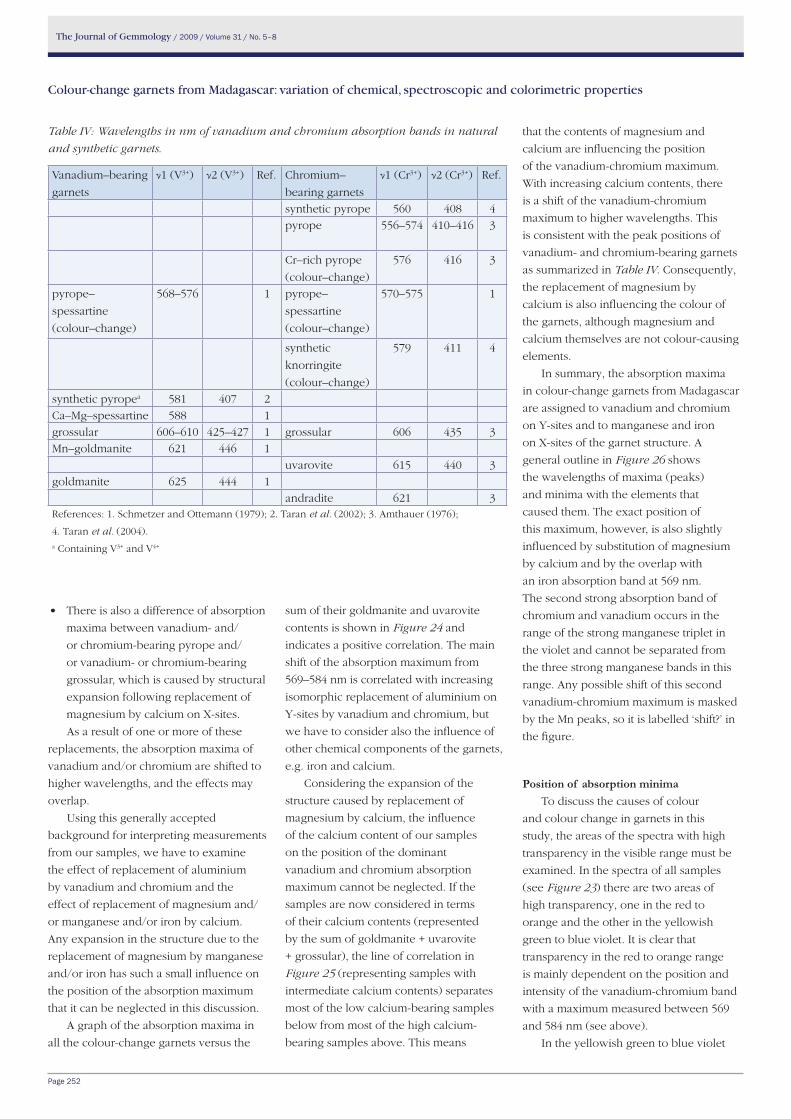
The Journal of Gemmology / 2009 / Volume 31 / No. 5–8
Page 252
Colour-change garnets from Madagascar: variation of chemical, spectroscopic and colorimetric properties
• Thereisalsoadifferenceofabsorption
maxima between vanadium- and/
or chromium-bearing pyrope and/
or vanadium- or chromium-bearing
grossular, which is caused by structural
expansion following replacement of
magnesium by calcium on X-sites.
As a result of one or more of these
replacements, the absorption maxima of
vanadium and/or chromium are shifted to
higher wavelengths, and the effects may
overlap.
Using this generally accepted
background for interpreting measurements
from our samples, we have to examine
the effect of replacement of aluminium
by vanadium and chromium and the
effect of replacement of magnesium and/
or manganese and/or iron by calcium.
Any expansion in the structure due to the
replacement of magnesium by manganese
and/or iron has such a small influence on
the position of the absorption maximum
that it can be neglected in this discussion.
A graph of the absorption maxima in
all the colour-change garnets versus the
sum of their goldmanite and uvarovite
contents is shown in Figure 24 and
indicates a positive correlation. The main
shift of the absorption maximum from
569–584 nm is correlated with increasing
isomorphic replacement of aluminium on
Y-sites by vanadium and chromium, but
we have to consider also the influence of
other chemical components of the garnets,
e.g. iron and calcium.
Considering the expansion of the
structure caused by replacement of
magnesium by calcium, the influence
of the calcium content of our samples
on the position of the dominant
vanadium and chromium absorption
maximum cannot be neglected. If the
samples are now considered in terms
of their calcium contents (represented
by the sum of goldmanite + uvarovite
+ grossular), the line of correlation in
Figure 25 (representing samples with
intermediate calcium contents) separates
most of the low calcium-bearing samples
below from most of the high calcium-
bearing samples above. This means
that the contents of magnesium and
calcium are influencing the position
of the vanadium-chromium maximum.
With increasing calcium contents, there
is a shift of the vanadium-chromium
maximum to higher wavelengths. This
is consistent with the peak positions of
vanadium- and chromium-bearing garnets
as summarized in Table IV. Consequently,
the replacement of magnesium by
calcium is also influencing the colour of
the garnets, although magnesium and
calcium themselves are not colour-causing
elements.
In summary, the absorption maxima
in colour-change garnets from Madagascar
are assigned to vanadium and chromium
on Y-sites and to manganese and iron
on X-sites of the garnet structure. A
general outline in Figure 26 shows
the wavelengths of maxima (peaks)
and minima with the elements that
caused them. The exact position of
this maximum, however, is also slightly
influenced by substitution of magnesium
by calcium and by the overlap with
an iron absorption band at 569 nm.
The second strong absorption band of
chromium and vanadium occurs in the
range of the strong manganese triplet in
the violet and cannot be separated from
the three strong manganese bands in this
range. Any possible shift of this second
vanadium-chromium maximum is masked
by the Mn peaks, so it is labelled ‘shift?’ in
the figure.
Position of absorption minimaTo discuss the causes of colour
and colour change in garnets in this
study, the areas of the spectra with high
transparency in the visible range must be
examined. In the spectra of all samples
(see Figure 23) there are two areas of
high transparency, one in the red to
orange and the other in the yellowish
green to blue violet. It is clear that
transparency in the red to orange range
is mainly dependent on the position and
intensity of the vanadium-chromium band
with a maximum measured between 569
and 584 nm (see above).
In the yellowish green to blue violet
Table IV: Wavelengths in nm of vanadium and chromium absorption bands in natural
and synthetic garnets.
Vanadium–bearing
garnets
ν1 (V3+) ν2 (V3+) Ref. Chromium–
bearing garnets
ν1 (Cr3+) ν2 (Cr3+) Ref.
synthetic pyrope 560 408 4pyrope 556–574 410–416 3
Cr–rich pyrope
(colour–change)
576 416 3
pyrope–
spessartine
(colour–change)
568–576 1 pyrope–
spessartine
(colour–change)
570–575 1
synthetic
knorringite
(colour–change)
579 411 4
synthetic pyropea 581 407 2Ca–Mg–spessartine 588 1grossular 606–610 425–427 1 grossular 606 435 3Mn–goldmanite 621 446 1
uvarovite 615 440 3goldmanite 625 444 1
andradite 621 3References: 1. Schmetzer and Ottemann (1979); 2. Taran et al. (2002); 3. Amthauer (1976);
4. Taran et al. (2004).a Containing V3+ and V4+
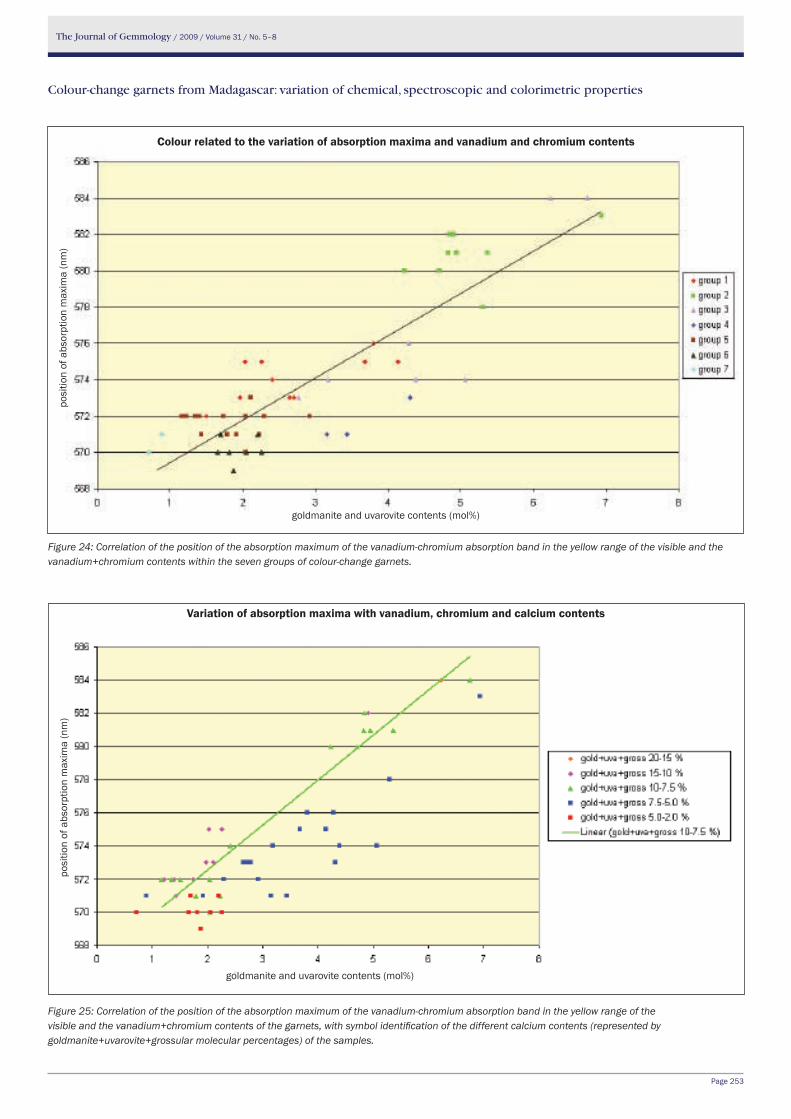
The Journal of Gemmology / 2009 / Volume 31 / No. 5–8
Page 253
Colour-change garnets from Madagascar: variation of chemical, spectroscopic and colorimetric properties
Figure 24: Correlation of the position of the absorption maximum of the vanadium-chromium absorption band in the yellow range of the visible and the vanadium+chromium contents within the seven groups of colour-change garnets.
Figure 25: Correlation of the position of the absorption maximum of the vanadium-chromium absorption band in the yellow range of the visible and the vanadium+chromium contents of the garnets, with symbol identification of the different calcium contents (represented by goldmanite+uvarovite+grossular molecular percentages) of the samples.
Variation of absorption maxima with vanadium, chromium and calcium contents
goldmanite and uvarovite contents (mol%)
posi
tion
of a
bsor
ptio
n m
axim
a (n
m)
Colour related to the variation of absorption maxima and vanadium and chromium contents
goldmanite and uvarovite contents (mol%)
posi
tion
of a
bsor
ptio
n m
axim
a (n
m)
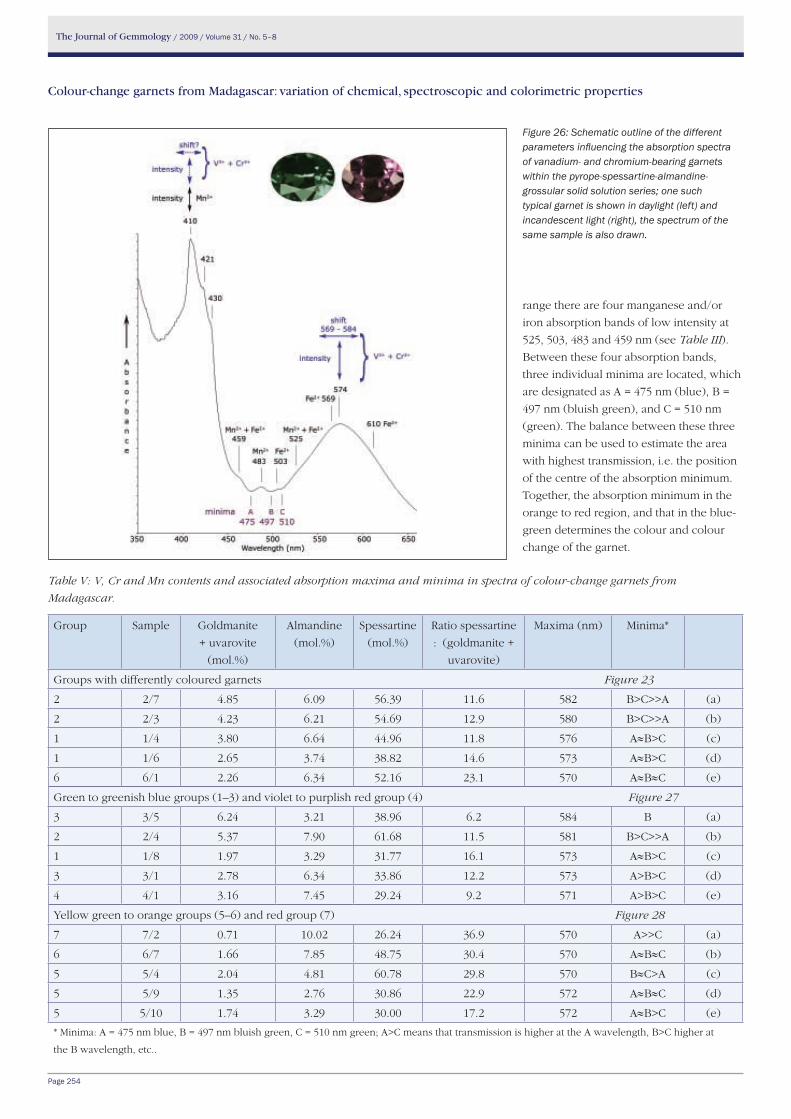
The Journal of Gemmology / 2009 / Volume 31 / No. 5–8
Page 254
Colour-change garnets from Madagascar: variation of chemical, spectroscopic and colorimetric properties
range there are four manganese and/or
iron absorption bands of low intensity at
525, 503, 483 and 459 nm (see Table III).
Between these four absorption bands,
three individual minima are located, which
are designated as A = 475 nm (blue), B =
497 nm (bluish green), and C = 510 nm
(green). The balance between these three
minima can be used to estimate the area
with highest transmission, i.e. the position
of the centre of the absorption minimum.
Together, the absorption minimum in the
orange to red region, and that in the blue-
green determines the colour and colour
change of the garnet.
Figure 26: Schematic outline of the different parameters influencing the absorption spectra of vanadium- and chromium-bearing garnets within the pyrope-spessartine-almandine-grossular solid solution series; one such typical garnet is shown in daylight (left) and incandescent light (right), the spectrum of the same sample is also drawn.
Table V: V, Cr and Mn contents and associated absorption maxima and minima in spectra of colour-change garnets from
Madagascar.
Group Sample Goldmanite
+ uvarovite
(mol.%)
Almandine
(mol.%)
Spessartine
(mol.%)
Ratio spessartine
: (goldmanite +
uvarovite)
Maxima (nm) Minima*
Groups with differently coloured garnets Figure 23
2 2/7 4.85 6.09 56.39 11.6 582 B>C>>A (a)
2 2/3 4.23 6.21 54.69 12.9 580 B>C>>A (b)
1 1/4 3.80 6.64 44.96 11.8 576 A≈B>C (c)
1 1/6 2.65 3.74 38.82 14.6 573 A≈B>C (d)
6 6/1 2.26 6.34 52.16 23.1 570 A≈B≈C (e)
Green to greenish blue groups (1–3) and violet to purplish red group (4) Figure 27
3 3/5 6.24 3.21 38.96 6.2 584 B (a)
2 2/4 5.37 7.90 61.68 11.5 581 B>C>>A (b)
1 1/8 1.97 3.29 31.77 16.1 573 A≈B>C (c)
3 3/1 2.78 6.34 33.86 12.2 573 A>B>C (d)
4 4/1 3.16 7.45 29.24 9.2 571 A>B>C (e)
Yellow green to orange groups (5–6) and red group (7) Figure 28
7 7/2 0.71 10.02 26.24 36.9 570 A>>C (a)
6 6/7 1.66 7.85 48.75 30.4 570 A≈B≈C (b)
5 5/4 2.04 4.81 60.78 29.8 570 B≈C>A (c)
5 5/9 1.35 2.76 30.86 22.9 572 A≈B≈C (d)
5 5/10 1.74 3.29 30.00 17.2 572 A≈B>C (e)
* Minima: A = 475 nm blue, B = 497 nm bluish green, C = 510 nm green; A>C means that transmission is higher at the A wavelength, B>C higher at
the B wavelength, etc..
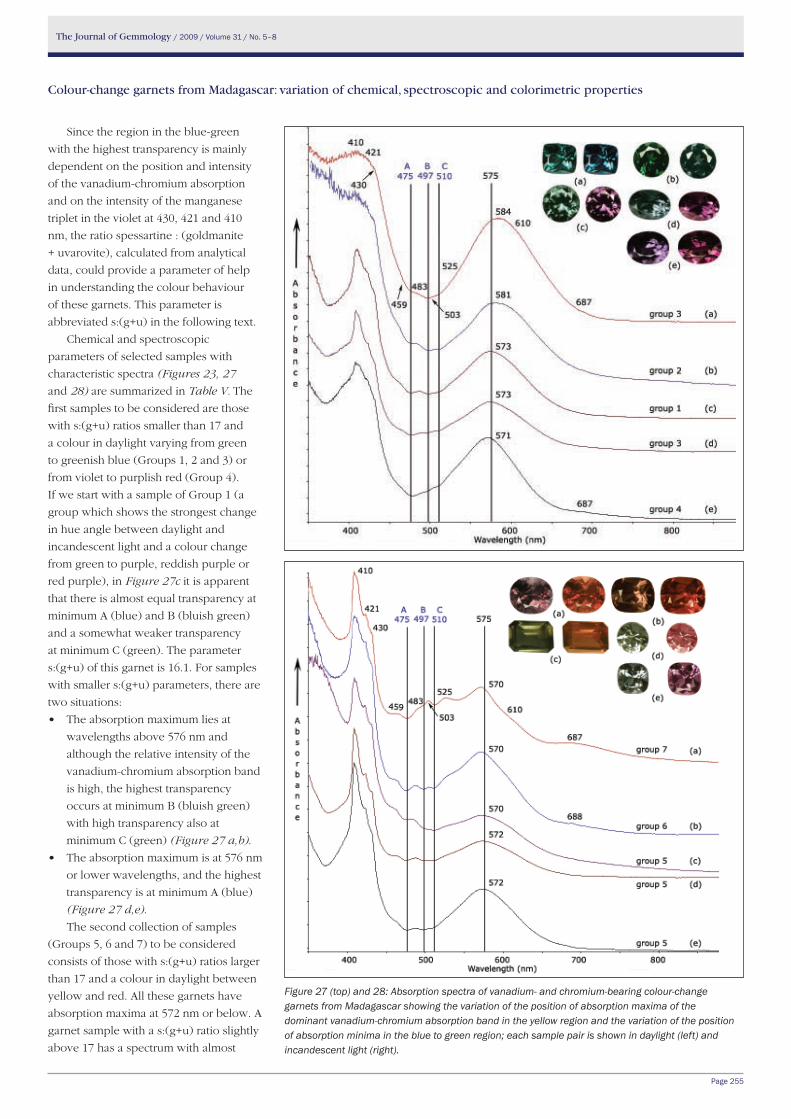
The Journal of Gemmology / 2009 / Volume 31 / No. 5–8
Page 255
Colour-change garnets from Madagascar: variation of chemical, spectroscopic and colorimetric properties
Since the region in the blue-green
with the highest transparency is mainly
dependent on the position and intensity
of the vanadium-chromium absorption
and on the intensity of the manganese
triplet in the violet at 430, 421 and 410
nm, the ratio spessartine : (goldmanite
+ uvarovite), calculated from analytical
data, could provide a parameter of help
in understanding the colour behaviour
of these garnets. This parameter is
abbreviated s:(g+u) in the following text.
Chemical and spectroscopic
parameters of selected samples with
characteristic spectra (Figures 23, 27
and 28) are summarized in Table V. The
first samples to be considered are those
with s:(g+u) ratios smaller than 17 and
a colour in daylight varying from green
to greenish blue (Groups 1, 2 and 3) or
from violet to purplish red (Group 4).
If we start with a sample of Group 1 (a
group which shows the strongest change
in hue angle between daylight and
incandescent light and a colour change
from green to purple, reddish purple or
red purple), in Figure 27c it is apparent
that there is almost equal transparency at
minimum A (blue) and B (bluish green)
and a somewhat weaker transparency
at minimum C (green). The parameter
s:(g+u) of this garnet is 16.1. For samples
with smaller s:(g+u) parameters, there are
two situations:
• Theabsorptionmaximumliesat
wavelengths above 576 nm and
although the relative intensity of the
vanadium-chromium absorption band
is high, the highest transparency
occurs at minimum B (bluish green)
with high transparency also at
minimum C (green) (Figure 27 a,b).
• Theabsorptionmaximumisat576nm
or lower wavelengths, and the highest
transparency is at minimum A (blue)
(Figure 27 d,e).
The second collection of samples
(Groups 5, 6 and 7) to be considered
consists of those with s:(g+u) ratios larger
than 17 and a colour in daylight between
yellow and red. All these garnets have
absorption maxima at 572 nm or below. A
garnet sample with a s:(g+u) ratio slightly
above 17 has a spectrum with almost
Figure 27 (top) and 28: Absorption spectra of vanadium- and chromium-bearing colour-change garnets from Madagascar showing the variation of the position of absorption maxima of the dominant vanadium-chromium absorption band in the yellow region and the variation of the position of absorption minima in the blue to green region; each sample pair is shown in daylight (left) and incandescent light (right).
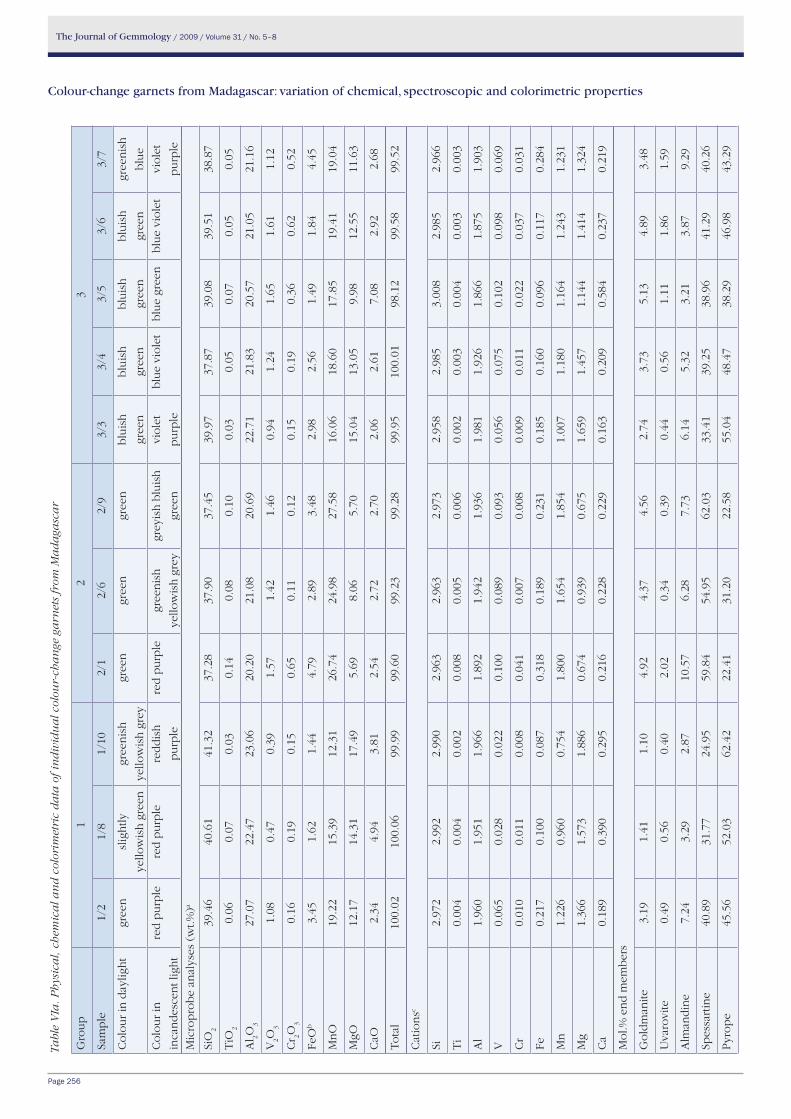
The Journal of Gemmology / 2009 / Volume 31 / No. 5–8
Page 256
Colour-change garnets from Madagascar: variation of chemical, spectroscopic and colorimetric properties
Tabl
e V
Ia.
Ph
ysic
al,
chem
ica
l an
d c
olor
imet
ric
da
ta o
f in
div
idu
al c
olou
r-ch
an
ge g
arn
ets
from
Ma
da
gasc
ar
Gro
up
12
3
Sam
ple
1/2
1/8
1/10
2/1
2/6
2/9
3/3
3/4
3/5
3/6
3/7
Co
lou
r in
day
ligh
tgr
een
slig
htly
yello
wis
h g
reen
gree
nis
h
yello
wis
h g
rey
gree
ngr
een
gree
nb
luis
h
gree
n
blu
ish
gree
n
blu
ish
gree
n
blu
ish
gree
n
gree
nis
h
blu
e
Co
lou
r in
inca
nd
esce
nt l
igh
t
red
pu
rple
red
pu
rple
red
dis
h
pu
rple
red
pu
rple
gree
nis
h
yello
wis
h g
rey
grey
ish
blu
ish
gree
n
vio
let
pu
rple
blu
e vi
ole
tb
lue
gree
nb
lue
vio
let
vio
let
pu
rple
Mic
rop
rob
e an
alys
es (
wt.%
)a
SiO
239
.46
40.6
141
.32
37.2
837
.90
37.4
539
.97
37.8
739
.08
39.5
138
.87
TiO
20.
060.
070.
030.
140.
080.
100.
030.
050.
070.
050.
05
Al 2O
327
.07
22.4
723
.06
20.2
021
.08
20.6
922
.71
21.8
320
.57
21.0
521
.16
V2O
31.
080.
470.
391.
571.
421.
460.
941.
241.
651.
611.
12
Cr 2O
30.
160.
190.
150.
650.
110.
120.
150.
190.
360.
620.
52
FeO
b3.
451.
621.
444.
792.
893.
482.
982.
561.
491.
844.
45
Mn
O19
.22
15.3
912
.31
26.7
424
.98
27.5
816
.06
18.6
017
.85
19.4
119
.04
MgO
12.1
714
.31
17.4
95.
698.
065.
7015
.04
13.0
59.
9812
.55
11.6
3
CaO
2.34
4.94
3.81
2.54
2.72
2.70
2.06
2.61
7.08
2.92
2.68
Tota
l 10
0.02
100.
0699
.99
99.6
099
.23
99.2
899
.95
100.
0198
.12
99.5
899
.52
Cat
ion
sc
Si2.
972
2.99
22.
990
2.96
32.
963
2.97
32.
958
2.98
53.
008
2.98
52.
966
Ti
0.00
40.
004
0.00
20.
008
0.00
50.
006
0.00
20.
003
0.00
40.
003
0.00
3
Al
1.96
01.
951
1.96
61.
892
1.94
21.
936
1.98
11.
926
1.86
61.
875
1.90
3
V0.
065
0.02
80.
022
0.10
00.
089
0.09
30.
056
0.07
50.
102
0.09
80.
069
Cr
0.01
00.
011
0.00
80.
041
0.00
70.
008
0.00
90.
011
0.02
20.
037
0.03
1
Fe0.
217
0.10
00.
087
0.31
80.
189
0.23
10.
185
0.16
00.
096
0.11
70.
284
Mn
1.22
60.
960
0.75
41.
800
1.65
41.
854
1.00
71.
180
1.16
41.
243
1.23
1
Mg
1.36
61.
573
1.88
60.
674
0.93
90.
675
1.65
91.
457
1.14
41.
414
1.32
4
Ca
0.18
90.
390
0.29
50.
216
0.22
80.
229
0.16
30.
209
0.58
40.
237
0.21
9
Mo
l.% e
nd
mem
ber
s
Go
ldm
anite
3.19
1.41
1.10
4.92
4.37
4.56
2.74
3.73
5.13
4.89
3.48
Uva
rovi
te0.
490.
560.
402.
020.
340.
390.
440.
561.
111.
861.
59
Alm
and
ine
7.24
3.29
2.87
10.5
76.
287.
736.
145.
323.
213.
879.
29
Spes
sart
ine
40.8
931
.77
24.9
559
.84
54.9
562
.03
33.4
139
.25
38.9
641
.29
40.2
6
Pyr
op
e45
.56
52.0
362
.42
22.4
131
.20
22.5
855
.04
48.4
738
.29
46.9
843
.29
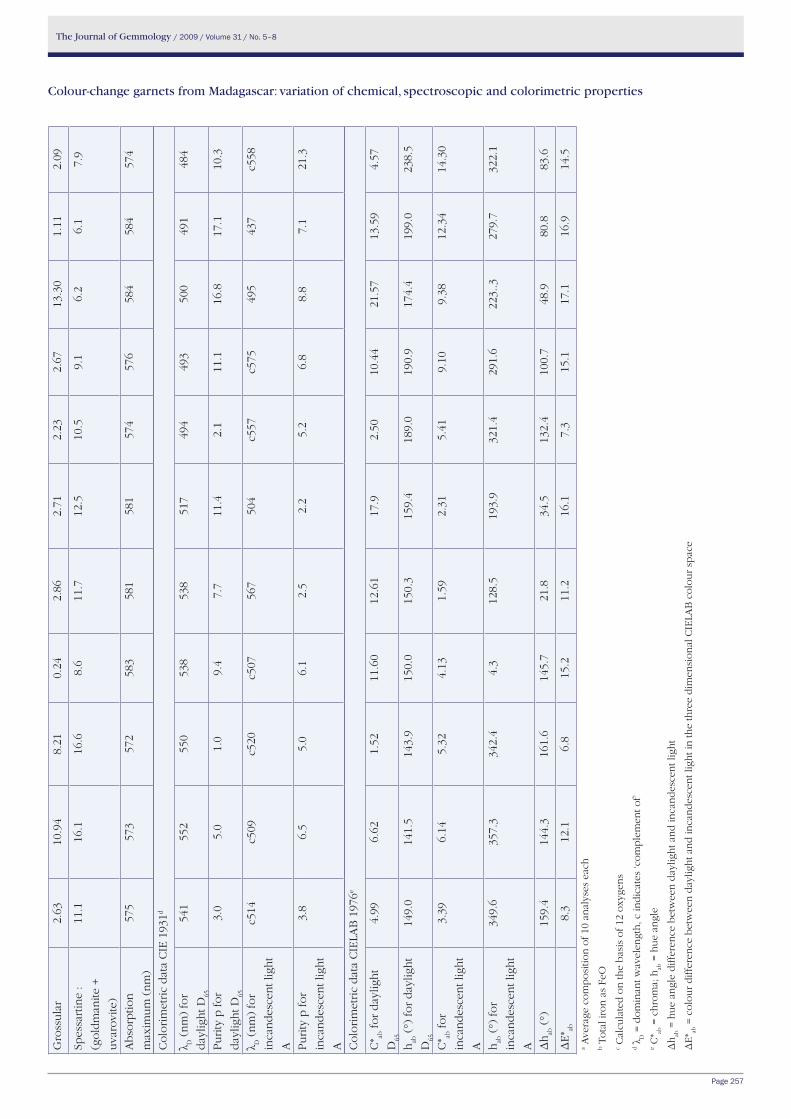
The Journal of Gemmology / 2009 / Volume 31 / No. 5–8
Page 257
Colour-change garnets from Madagascar: variation of chemical, spectroscopic and colorimetric properties
Gro
ssu
lar
2.63
10.9
48.
210.
242.
862.
712.
232.
6713
.30
1.11
2.09
Spes
sart
ine
:
(go
ldm
anite
+
uva
rovi
te)
11.1
16.1
16.6
8.6
11.7
12.5
10.5
9.1
6.2
6.1
7.9
Ab
sorp
tion
max
imu
m (
nm
)
575
573
572
583
581
581
574
576
584
584
574
Co
lori
met
ric
dat
a C
IE 1
931d
λ D (
nm
) fo
r
day
ligh
t D65
541
552
550
538
538
517
494
493
500
491
484
Pu
rity
p f
or
day
ligh
t D65
3.0
5.0
1.0
9.4
7.7
11.4
2.1
11.1
16.8
17.1
10.3
λ D (
nm
) fo
r
inca
nd
esce
nt l
igh
t
A
c514
c509
c520
c507
567
504
c557
c575
495
437
c558
Pu
rity
p f
or
inca
nd
esce
nt l
igh
t
A
3.8
6.5
5.0
6.1
2.5
2.2
5.2
6.8
8.8
7.1
21.3
Co
lori
met
ric
dat
a C
IELA
B 1
976e
C* ab
fo
r d
aylig
ht
D65
4.99
6.62
1.52
11.6
012
.61
17.9
2.50
10.4
421
.57
13.5
94.
57
hab
(°)
fo
r d
aylig
ht
D65
149.
014
1.5
143.
915
0.0
150.
315
9.4
189.
019
0.9
174.
419
9.0
238.
5
C* ab
fo
r
inca
nd
esce
nt l
igh
t
A
3.39
6.14
5.32
4.13
1.59
2.31
5.41
9.10
9.38
12.3
414
.30
hab
(°)
fo
r
inca
nd
esce
nt l
igh
t
A
349.
635
7.3
342.
44.
312
8.5
193.
932
1.4
291.
622
3..3
279.
732
2.1
Δh
ab (
°)15
9.4
144.
316
1.6
145.
721
.834
.513
2.4
100.
748
.980
.883
.6
ΔE
* ab8.
312
.16.
815
.211
.216
.17.
315
.117
.116
.914
.5a A
vera
ge c
om
po
sitio
n o
f 10
an
alys
es e
ach
b T
ota
l iro
n a
s Fe
Oc C
alcu
late
d o
n th
e b
asis
of
12 o
xyge
ns
d λ
D =
do
min
ant w
avel
engt
h, c
ind
icat
es ‘c
om
ple
men
t of’
e C* ab
= c
hro
ma;
hab
= h
ue
angl
e
Δh
ab =
hu
e an
gle
dif
fere
nce
bet
wee
n d
aylig
ht a
nd
inca
nd
esce
nt l
igh
t
ΔE
* ab =
co
lou
r d
iffe
ren
ce b
etw
een
day
ligh
t an
d in
can
des
cen
t lig
ht i
n th
e th
ree
dim
ensi
on
al C
IELA
B c
olo
ur
spac
e
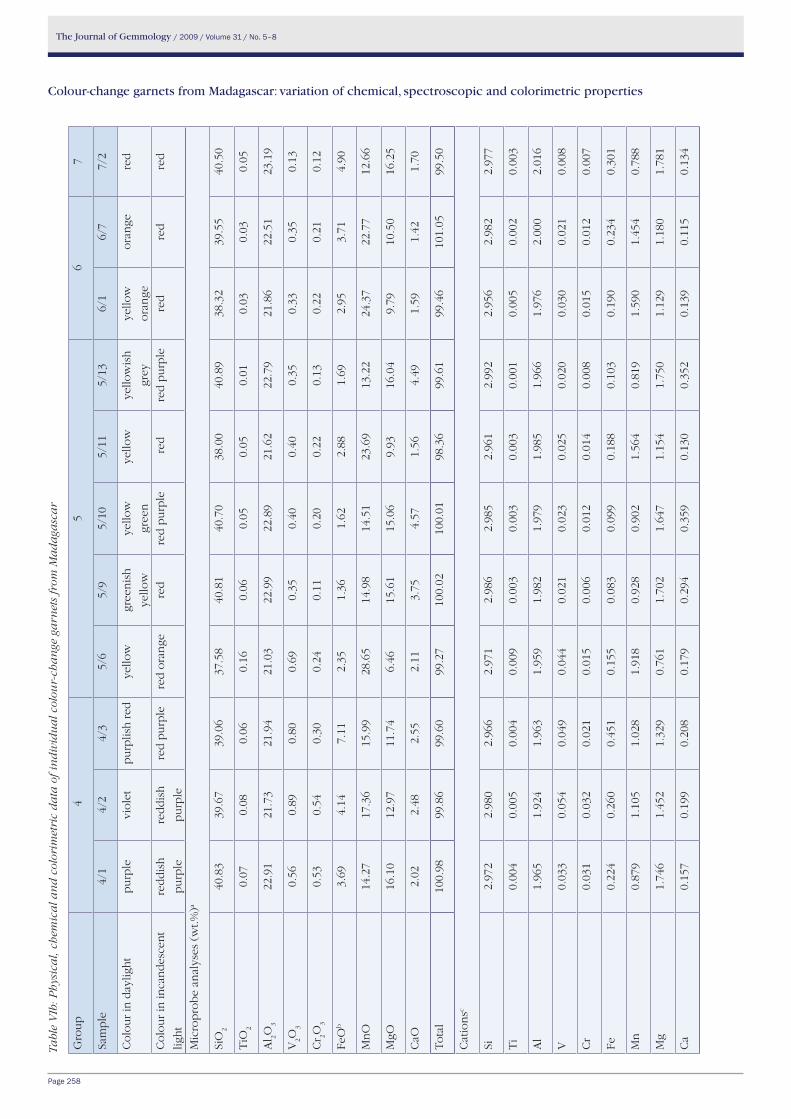
The Journal of Gemmology / 2009 / Volume 31 / No. 5–8
Page 258
Colour-change garnets from Madagascar: variation of chemical, spectroscopic and colorimetric properties
Tabl
e V
Ib:
Ph
ysic
al,
chem
ica
l an
d c
olor
imet
ric
da
ta o
f in
div
idu
al c
olou
r-ch
an
ge g
arn
ets
from
Ma
da
gasc
ar
Gro
up
45
67
Sam
ple
4/1
4/2
4/3
5/6
5/9
5/10
5/11
5/13
6/1
6/7
7/2
Co
lou
r in
day
ligh
tp
urp
levi
ole
tp
urp
lish
red
yello
wgr
een
ish
yello
w
yello
w
gree
n
yello
wye
llow
ish
grey
yello
w
ora
nge
ora
nge
red
Co
lou
r in
inca
nd
esce
nt
ligh
t
red
dis
h
pu
rple
red
dis
h
pu
rple
red
pu
rple
red
ora
nge
red
red
pu
rple
red
red
pu
rple
red
re
dre
d
Mic
rop
rob
e an
alys
es (
wt.%
)a
SiO
240
.83
39.6
739
.06
37.5
840
.81
40.7
038
.00
40.8
938
.32
39.5
540
.50
TiO
20.
070.
080.
060.
160.
060.
050.
050.
010.
030.
030.
05
Al 2O
322
.91
21.7
321
.94
21.0
322
.99
22.8
921
.62
22.7
921
.86
22.5
123
.19
V2O
30.
560.
890.
800.
690.
350.
400.
400.
350.
330.
350.
13
Cr 2O
30.
530.
540.
300.
240.
110.
200.
220.
130.
220.
210.
12
FeO
b3.
694.
147.
112.
351.
361.
622.
881.
692.
953.
714.
90
Mn
O14
.27
17.3
615
.99
28.6
514
.98
14.5
123
.69
13.2
224
.37
22.7
712
.66
MgO
16.1
012
.97
11.7
46.
4615
.61
15.0
69.
9316
.04
9.79
10.5
016
.25
CaO
2.02
2.48
2.55
2.11
3.75
4.57
1.56
4.49
1.59
1.42
1.70
Tota
l 10
0.98
99.8
699
.60
99.2
710
0.02
100.
0198
.36
99.6
199
.46
101.
0599
.50
Cat
ion
sc
Si2.
972
2.98
02.
966
2.97
12.
986
2.98
52.
961
2.99
22.
956
2.98
22.
977
Ti
0.00
40.
005
0.00
40.
009
0.00
30.
003
0.00
30.
001
0.00
50.
002
0.00
3
Al
1.96
51.
924
1.96
31.
959
1.98
21.
979
1.98
51.
966
1.97
62.
000
2.01
6
V0.
033
0.05
40.
049
0.04
40.
021
0.02
30.
025
0.02
00.
030
0.02
10.
008
Cr
0.03
10.
032
0.02
10.
015
0.00
60.
012
0.01
40.
008
0.01
50.
012
0.00
7
Fe0.
224
0.26
00.
451
0.15
50.
083
0.09
90.
188
0.10
30.
190
0.23
40.
301
Mn
0.87
91.
105
1.02
81.
918
0.92
80.
902
1.56
40.
819
1.59
01.
454
0.78
8
Mg
1.74
61.
452
1.32
90.
761
1.70
21.
647
1.15
41.
750
1.12
91.
180
1.78
1
Ca
0.15
70.
199
0.20
80.
179
0.29
40.
359
0.13
00.
352
0.13
90.
115
0.13
4
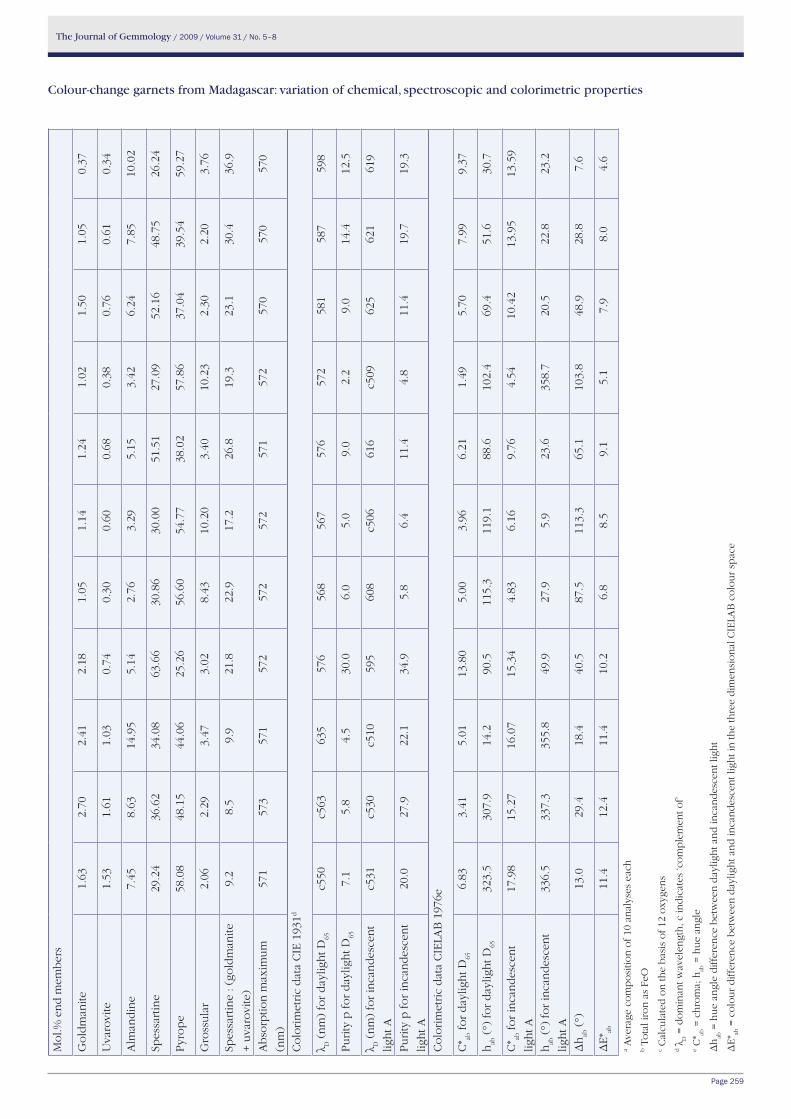
The Journal of Gemmology / 2009 / Volume 31 / No. 5–8
Page 259
Colour-change garnets from Madagascar: variation of chemical, spectroscopic and colorimetric properties
Mo
l.% e
nd
mem
ber
s
Go
ldm
anite
1.63
2.70
2.41
2.18
1.05
1.14
1.24
1.02
1.50
1.05
0.37
Uva
rovi
te1.
531.
611.
030.
740.
300.
600.
680.
380.
760.
610.
34
Alm
and
ine
7.45
8.63
14.9
55.
142.
763.
295.
153.
426.
247.
8510
.02
Spes
sart
ine
29.2
436
.62
34.0
863
.66
30.8
630
.00
51.5
127
.09
52.1
648
.75
26.2
4
Pyr
op
e58
.08
48.1
544
.06
25.2
656
.60
54.7
738
.02
57.8
637
.04
39.5
459
.27
Gro
ssu
lar
2.06
2.29
3.47
3.02
8.43
10.2
03.
4010
.23
2.30
2.20
3.76
Spes
sart
ine
: (go
ldm
anite
+ u
varo
vite
)
9.2
8.5
9.9
21.8
22.9
17.2
26.8
19.3
23.1
30.4
36.9
Ab
sorp
tion
max
imu
m
(nm
)
571
573
571
572
572
572
571
572
570
570
570
Co
lori
met
ric
dat
a C
IE 1
931d
λ D (
nm
) fo
r d
aylig
ht D
65c5
50c5
6363
557
656
856
757
657
258
158
759
8
Pu
rity
p f
or
day
ligh
t D65
7.1
5.8
4.5
30.0
6.0
5.0
9.0
2.2
9.0
14.4
12.5
λ D (
nm
) fo
r in
can
des
cen
t
ligh
t A
c531
c530
c510
595
608
c506
616
c509
625
621
619
Pu
rity
p f
or
inca
nd
esce
nt
ligh
t A
20.0
27.9
22.1
34.9
5.8
6.4
11.4
4.8
11.4
19.7
19.3
Co
lori
met
ric
dat
a C
IELA
B 1
976e
C* ab
fo
r d
aylig
ht D
656.
833.
415.
0113
.80
5.00
3.96
6.21
1.49
5.70
7.99
9.37
hab
(°)
fo
r d
aylig
ht D
6532
3.5
307.
914
.290
.511
5.3
119.
188
.610
2.4
69.4
51.6
30.7
C* ab
fo
r in
can
des
cen
t
ligh
t A
17.9
815
.27
16.0
715
.34
4.83
6.16
9.76
4.54
10.4
213
.95
13.5
9
hab
(°)
fo
r in
can
des
cen
t
ligh
t A
336.
533
7.3
355.
849
.927
.95.
923
.635
8.7
20.5
22.8
23.2
Δh
ab (
°)13
.029
.418
.440
.587
.511
3.3
65.1
103.
848
.928
.87.
6
ΔE
* ab11
.412
.411
.410
.26.
88.
59.
15.
17.
98.
04.
6
a Ave
rage
co
mp
osi
tion
of
10 a
nal
yses
eac
hb T
ota
l iro
n a
s Fe
Oc C
alcu
late
d o
n th
e b
asis
of
12 o
xyge
ns
d λ
D =
do
min
ant w
avel
engt
h, c
ind
icat
es ‘c
om
ple
men
t of’
e C* ab
= c
hro
ma;
hab
= h
ue
angl
e
Δh
ab =
hu
e an
gle
dif
fere
nce
bet
wee
n d
aylig
ht a
nd
inca
nd
esce
nt l
igh
t
ΔE
* ab =
co
lou
r d
iffe
ren
ce b
etw
een
day
ligh
t an
d in
can
des
cen
t lig
ht i
n th
e th
ree
dim
ensi
on
al C
IELA
B c
olo
ur
spac
e
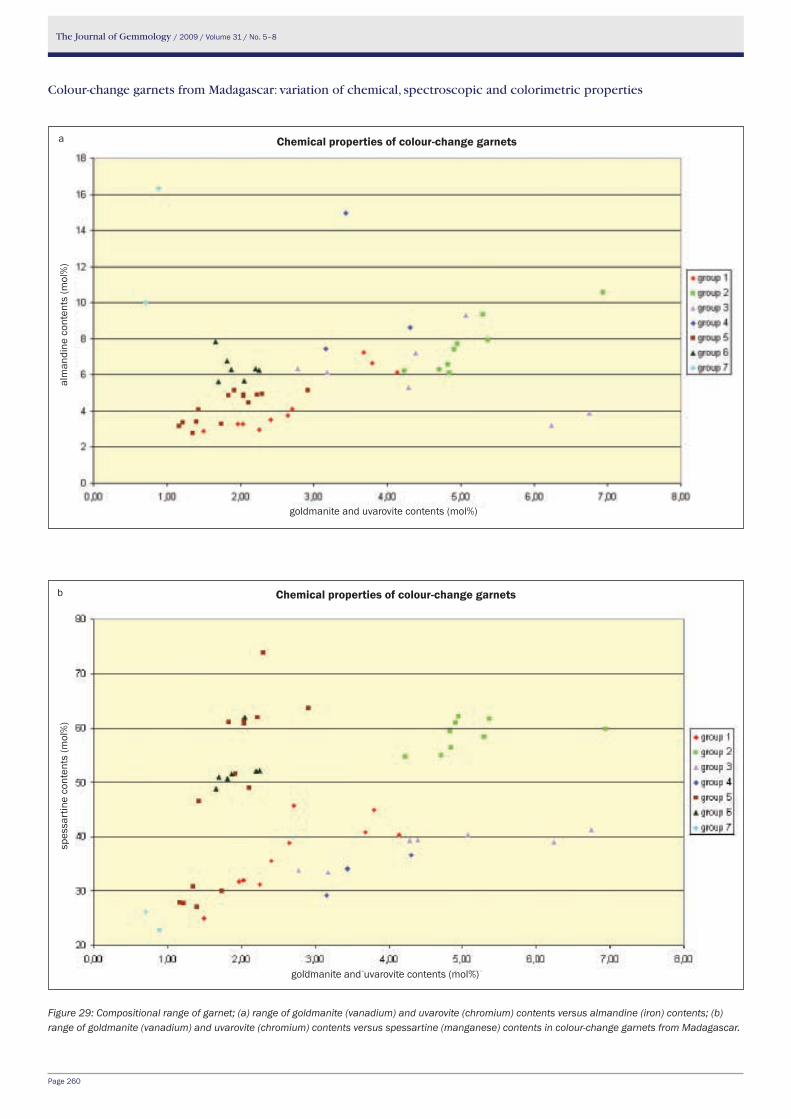
The Journal of Gemmology / 2009 / Volume 31 / No. 5–8
Page 260
Colour-change garnets from Madagascar: variation of chemical, spectroscopic and colorimetric properties
Figure 29: Compositional range of garnet; (a) range of goldmanite (vanadium) and uvarovite (chromium) contents versus almandine (iron) contents; (b) range of goldmanite (vanadium) and uvarovite (chromium) contents versus spessartine (manganese) contents in colour-change garnets from Madagascar.
a Chemical properties of colour-change garnets
goldmanite and uvarovite contents (mol%)
alm
andi
ne c
onte
nts
(mol
%)
b Chemical properties of colour-change garnets
goldmanite and uvarovite contents (mol%)
spes
sart
ine
cont
ents
(mol
%)
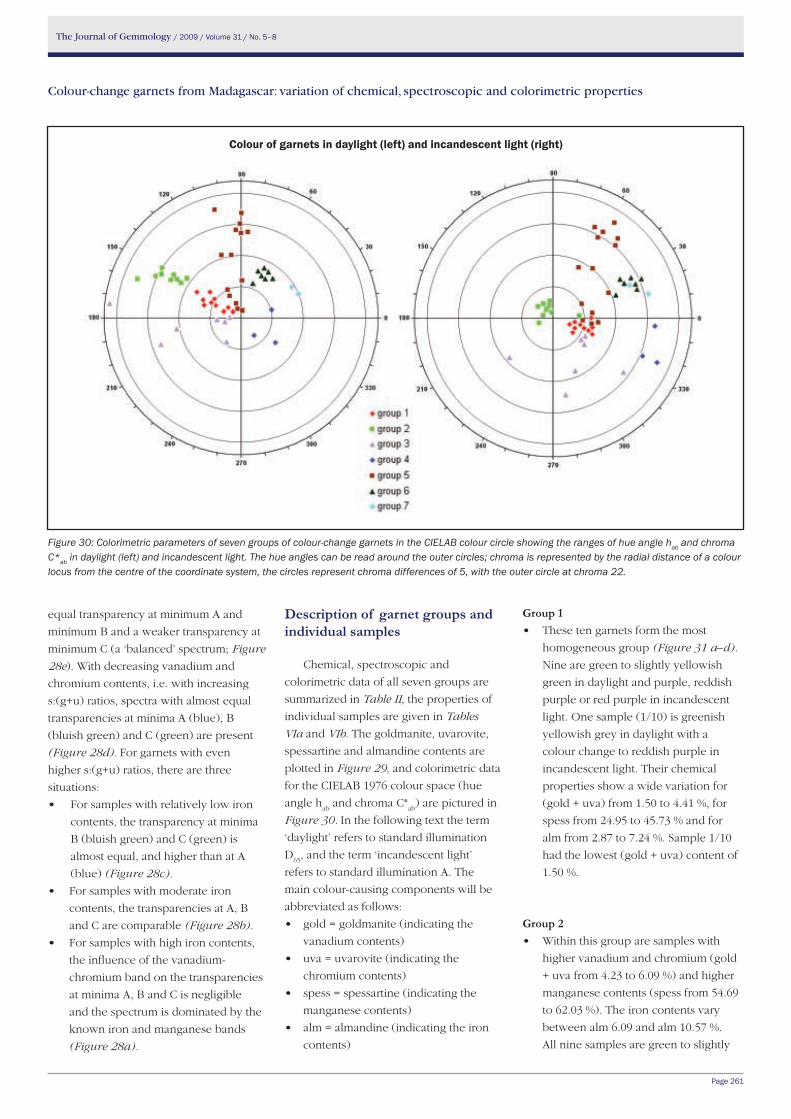
The Journal of Gemmology / 2009 / Volume 31 / No. 5–8
Page 261
Colour-change garnets from Madagascar: variation of chemical, spectroscopic and colorimetric properties
equal transparency at minimum A and
minimum B and a weaker transparency at
minimum C (a ‘balanced’ spectrum; Figure
28e). With decreasing vanadium and
chromium contents, i.e. with increasing
s:(g+u) ratios, spectra with almost equal
transparencies at minima A (blue), B
(bluish green) and C (green) are present
(Figure 28d). For garnets with even
higher s:(g+u) ratios, there are three
situations:
• Forsampleswithrelativelylowiron
contents, the transparency at minima
B (bluish green) and C (green) is
almost equal, and higher than at A
(blue) (Figure 28c).
• Forsampleswithmoderateiron
contents, the transparencies at A, B
and C are comparable (Figure 28b).
• Forsampleswithhighironcontents,
the influence of the vanadium-
chromium band on the transparencies
at minima A, B and C is negligible
and the spectrum is dominated by the
known iron and manganese bands
(Figure 28a).
Description of garnet groups and individual samples
Chemical, spectroscopic and
colorimetric data of all seven groups are
summarized in Table II, the properties of
individual samples are given in Tables
VIa and VIb. The goldmanite, uvarovite,
spessartine and almandine contents are
plotted in Figure 29, and colorimetric data
for the CIELAB 1976 colour space (hue
angle hab
and chroma C*ab
) are pictured in
Figure 30. In the following text the term
‘daylight’ refers to standard illumination
D65
, and the term ‘incandescent light’
refers to standard illumination A. The
main colour-causing components will be
abbreviated as follows:
• gold=goldmanite(indicatingthe
vanadium contents)
• uva=uvarovite(indicatingthe
chromium contents)
• spess=spessartine(indicatingthe
manganese contents)
• alm=almandine(indicatingtheiron
contents)
Group 1• Thesetengarnetsformthemost
homogeneous group (Figure 31 a–d).
Nine are green to slightly yellowish
green in daylight and purple, reddish
purple or red purple in incandescent
light. One sample (1/10) is greenish
yellowish grey in daylight with a
colour change to reddish purple in
incandescent light. Their chemical
properties show a wide variation for
(gold + uva) from 1.50 to 4.41 %, for
spess from 24.95 to 45.73 % and for
alm from 2.87 to 7.24 %. Sample 1/10
had the lowest (gold + uva) content of
1.50 %.
Group 2• Withinthisgrouparesampleswith
higher vanadium and chromium (gold
+ uva from 4.23 to 6.09 %) and higher
manganese contents (spess from 54.69
to 62.03 %). The iron contents vary
between alm 6.09 and alm 10.57 %.
All nine samples are green to slightly
Figure 30: Colorimetric parameters of seven groups of colour-change garnets in the CIELAB colour circle showing the ranges of hue angle hab and chroma C*ab in daylight (left) and incandescent light. The hue angles can be read around the outer circles; chroma is represented by the radial distance of a colour locus from the centre of the coordinate system, the circles represent chroma differences of 5, with the outer circle at chroma 22.
Colour of garnets in daylight (left) and incandescent light (right)
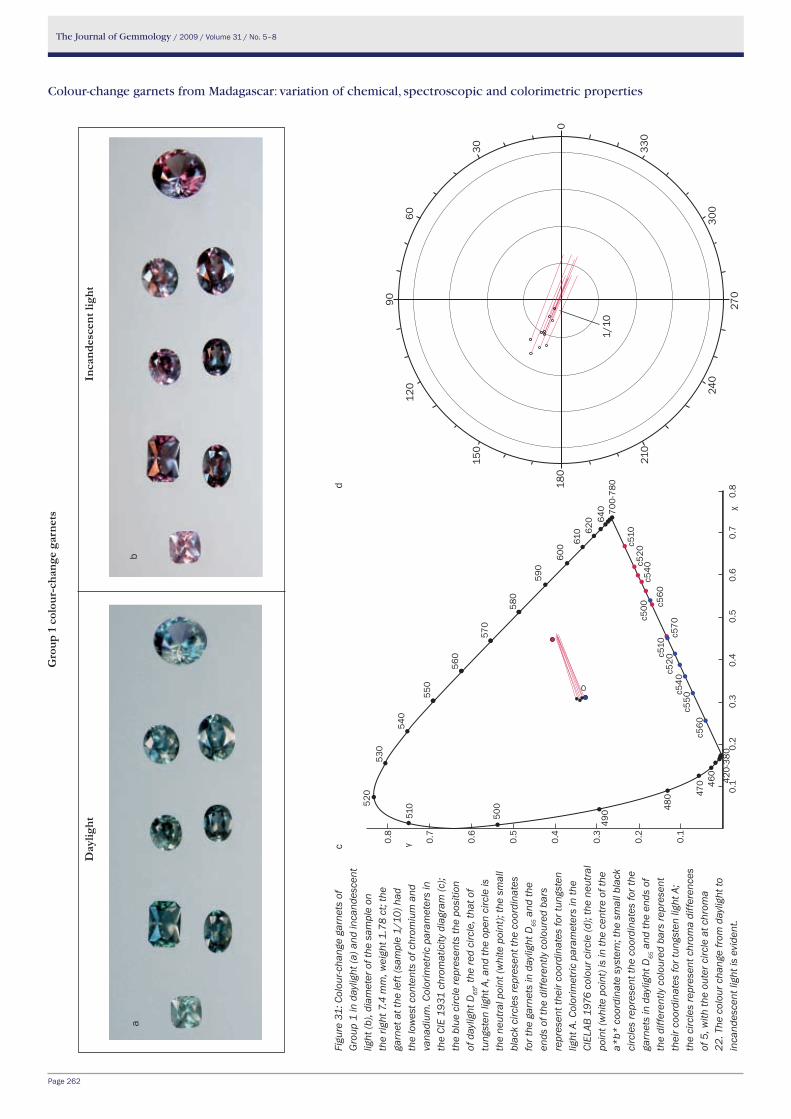
The Journal of Gemmology / 2009 / Volume 31 / No. 5–8
Page 262
Colour-change garnets from Madagascar: variation of chemical, spectroscopic and colorimetric properties
Gro
up 1
col
our-
chan
ge g
arne
ts
Day
light
In
cand
esce
nt li
ght
ab
cFi
gure
31:
Col
our-c
hang
e ga
rnet
s of
G
roup
1 in
day
light
(a) a
nd in
cand
esce
nt
light
(b),
diam
eter
of t
he s
ampl
e on
th
e rig
ht 7
.4 m
m, w
eigh
t 1.7
8 ct
; the
ga
rnet
at t
he le
ft (s
ampl
e 1/
10) h
ad
the
low
est c
onte
nts
of c
hrom
ium
and
va
nadi
um. C
olor
imet
ric p
aram
eter
s in
th
e CI
E 19
31 c
hrom
atic
ity d
iagr
am (c
); th
e bl
ue c
ircle
repr
esen
ts th
e po
sitio
n of
day
light
D65
, the
red
circ
le, t
hat o
f tu
ngst
en li
ght A
, and
the
open
circ
le is
th
e ne
utra
l poi
nt (w
hite
poi
nt);
the
smal
l bl
ack
circ
les
repr
esen
t the
coo
rdin
ates
fo
r the
gar
nets
in d
aylig
ht D
65 a
nd th
e en
ds o
f the
diff
eren
tly c
olou
red
bars
re
pres
ent t
heir
coor
dina
tes
for t
ungs
ten
light
A. C
olor
imet
ric p
aram
eter
s in
the
CIEL
AB 1
976
colo
ur c
ircle
(d);
the
neut
ral
poin
t (w
hite
poi
nt) i
s in
the
cent
re o
f the
a*
b* c
oord
inat
e sy
stem
; the
sm
all b
lack
ci
rcle
s re
pres
ent t
he c
oord
inat
es fo
r the
ga
rnet
s in
day
light
D65
and
the
ends
of
the
diffe
rent
ly c
olou
red
bars
repr
esen
t th
eir c
oord
inat
es fo
r tun
gste
n lig
ht A
; th
e ci
rcle
s re
pres
ent c
hrom
a di
ffere
nces
of
5, w
ith th
e ou
ter c
ircle
at c
hrom
a 22
. The
col
our c
hang
e fro
m d
aylig
ht to
in
cand
esce
nt li
ght i
s ev
iden
t.
d
0
30
60
330
300
240
210
180
150
120
90 270
1/10
0.8
0.7
0.6
0.5
0.4
0.3
0.2
0.1
0.1
0.2
0.3
0.4
0.5
0.6
0.7
0.8
γ
χ
c540
c560
c550
540
550
560
570
580
590
600 61
0
530
520
700-
780
c510
c520
c540
c560
c570
c500
c510
c520
500
510
640
620
460
470
480
490
420-
380
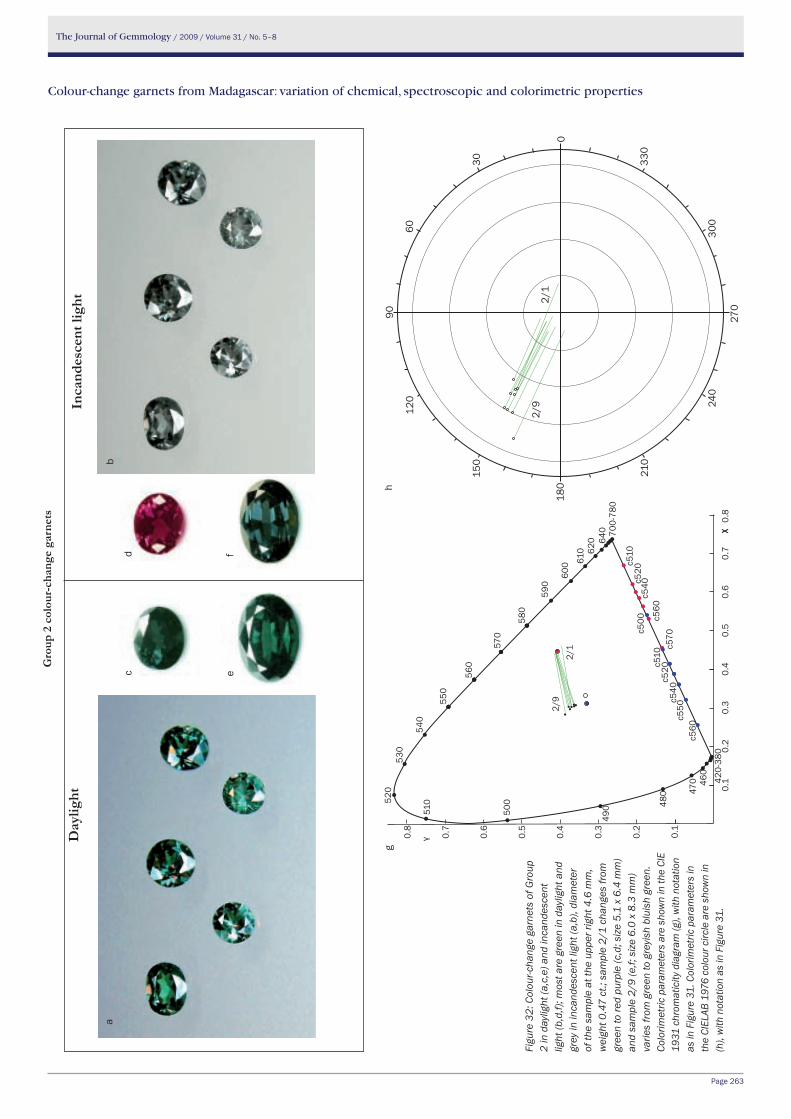
The Journal of Gemmology / 2009 / Volume 31 / No. 5–8
Page 263
Colour-change garnets from Madagascar: variation of chemical, spectroscopic and colorimetric properties
Figu
re 3
2: C
olou
r-cha
nge
garn
ets
of G
roup
2
in d
aylig
ht (a
,c,e
) and
inca
ndes
cent
lig
ht (b
,d,f)
; mos
t are
gre
en in
day
light
and
gr
ey in
inca
ndes
cent
ligh
t (a,
b), d
iam
eter
of
the
sam
ple
at th
e up
per r
ight
4.6
mm
, w
eigh
t 0.4
7 ct
.; sa
mpl
e 2/
1 ch
ange
s fro
m
gree
n to
red
purp
le (c
,d; s
ize
5.1
x 6.
4 m
m)
and
sam
ple
2/9
(e,f;
siz
e 6.
0 x
8.3
mm
) va
ries
from
gre
en to
gre
yish
blu
ish
gree
n.
Colo
rimet
ric p
aram
eter
s ar
e sh
own
in th
e CI
E 19
31 c
hrom
atic
ity d
iagr
am (g
), w
ith n
otat
ion
as in
Fig
ure
31. C
olor
imet
ric p
aram
eter
s in
th
e CI
ELAB
197
6 co
lour
circ
le a
re s
how
n in
(h
), w
ith n
otat
ion
as in
Fig
ure
31.
Gro
up 2
col
our-
chan
ge g
arne
ts
d
e
Day
light
Inca
ndes
cent
ligh
t
gh
0
30
60
330
300
270
240
210
180
150
120
90
2/1
2/9
ab
f
c
0.1
0.2
0.3
0.4
0.5
0.6
0.7
0.8
γ
χ
c540
c560
c550
540
550
560
580
590
600 61
0
530
520
700-
780
c510
c520
c540
c560
c570
c500
c510
c520
500
510
640
620
460
470
480
490
420-
380
0.8
0.7
0.6
0.5
0.4
0.3
0.2
0.1
χ
2/1
2/9
570
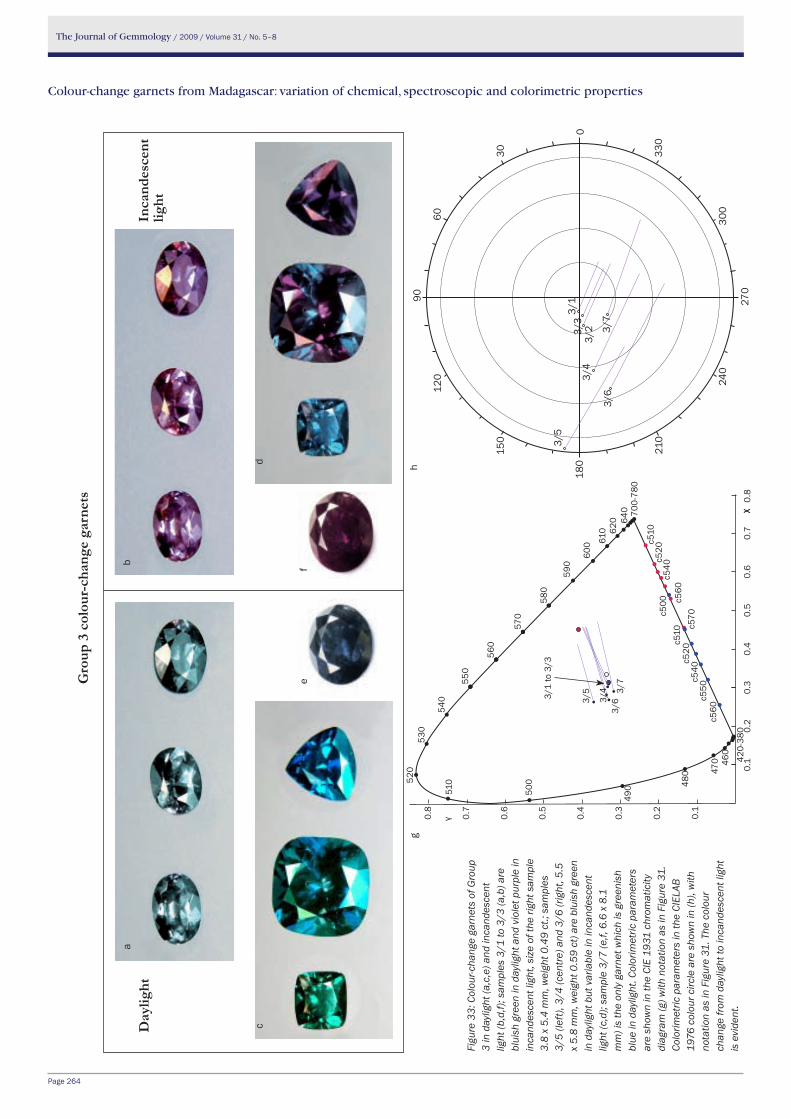
The Journal of Gemmology / 2009 / Volume 31 / No. 5–8
Page 264
b
d
f
Figu
re 3
3: C
olou
r-cha
nge
garn
ets
of G
roup
3
in d
aylig
ht (a
,c,e
) and
inca
ndes
cent
lig
ht (b
,d,f)
; sam
ples
3/1
to 3
/3 (a
,b) a
re
blui
sh g
reen
in d
aylig
ht a
nd v
iole
t pur
ple
in
inca
ndes
cent
ligh
t, si
ze o
f the
righ
t sam
ple
3.8
x 5.
4 m
m, w
eigh
t 0.4
9 ct
.; sa
mpl
es
3/5
(left)
, 3/4
(cen
tre)
and
3/6
(rig
ht, 5
.5
x 5.
8 m
m, w
eigh
t 0.5
9 ct
) are
blu
ish
gree
n in
day
light
but
var
iabl
e in
inca
ndes
cent
lig
ht (c
,d);
sam
ple
3/7
(e,f,
6.6
x 8
.1
mm
) is
the
only
gar
net w
hich
is g
reen
ish
blue
in d
aylig
ht. C
olor
imet
ric p
aram
eter
s ar
e sh
own
in th
e CI
E 19
31 c
hrom
atic
ity
diag
ram
(g) w
ith n
otat
ion
as in
Fig
ure
31.
Colo
rimet
ric p
aram
eter
s in
the
CIEL
AB
1976
col
our c
ircle
are
sho
wn
in (h
), w
ith
nota
tion
as in
Fig
ure
31. T
he c
olou
r ch
ange
from
day
light
to in
cand
esce
nt li
ght
is e
vide
nt.
Gro
up 3
col
our-
chan
ge g
arne
ts
a
c
e
Colour-change garnets from Madagascar: variation of chemical, spectroscopic and colorimetric properties
Inca
ndes
cent
lig
htD
aylig
ht
h
0
30
60
330
300
270
240
210
180
150
120
90
3/1
3/6
3/5
3/4
3/3
3/2 3/
7
g
0.1
0.2
0.3
0.4
0.5
0.6
0.7
0.8
γ
χ
c540
c560
c550
540
550
560
570
580
590
600 61
0
530
520
700-
780
c510
c520
c540
c560
c570c5
00c5
10c5
20
500
510
640
620
460
470
480
490
420-
380
0.8
0.7
0.6
0.5
0.4
0.3
0.2
0.1
χ
3/1
to 3
/3
3/4 3/
73/
63/5
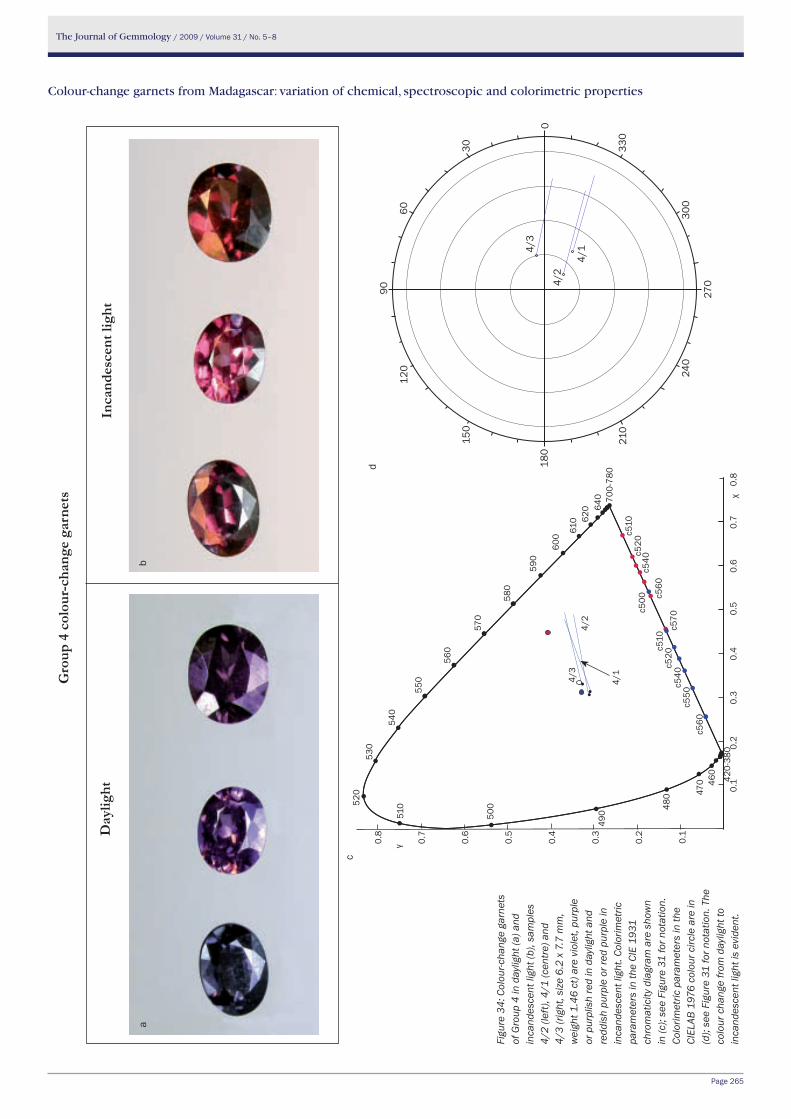
The Journal of Gemmology / 2009 / Volume 31 / No. 5–8
Page 265
Colour-change garnets from Madagascar: variation of chemical, spectroscopic and colorimetric properties
a
Figu
re 3
4: C
olou
r-cha
nge
garn
ets
of G
roup
4 in
day
light
(a) a
nd
inca
ndes
cent
ligh
t (b)
, sam
ples
4/
2 (le
ft), 4
/1 (c
entr
e) a
nd
4/3
(righ
t, si
ze 6
.2 x
7.7
mm
, w
eigh
t 1.4
6 ct
) are
vio
let,
purp
le
or p
urpl
ish
red
in d
aylig
ht a
nd
redd
ish
purp
le o
r red
pur
ple
in
inca
ndes
cent
ligh
t. Co
lorim
etric
pa
ram
eter
s in
the
CIE
1931
ch
rom
atic
ity d
iagr
am a
re s
how
n in
(c);
see
Figu
re 3
1 fo
r not
atio
n.
Colo
rimet
ric p
aram
eter
s in
the
CIEL
AB 1
976
colo
ur c
ircle
are
in
(d);
see
Figu
re 3
1 fo
r not
atio
n. T
he
colo
ur c
hang
e fro
m d
aylig
ht to
in
cand
esce
nt li
ght i
s ev
iden
t.
Gro
up 4
col
our-
chan
ge g
arne
ts
b
Inca
ndes
cent
ligh
tD
aylig
ht
0
30
60
330
300
270
240
210
180
150
120
90
4/1
4/2
4/3
c
d0.
8
0.7
0.6
0.5
0.4
0.3
0.2
0.1
0.1
0.2
0.3
0.4
0.5
0.6
0.7
0.8
γ
χ
c540
c560
c550
540
550
560
570
580
590
600
610
530
520
700-
780
c510
c520
c540
c560
c570
c500
c510
c520
500
510
640
620
460
470
480
490
420-
380
4/3
4/2
4/1
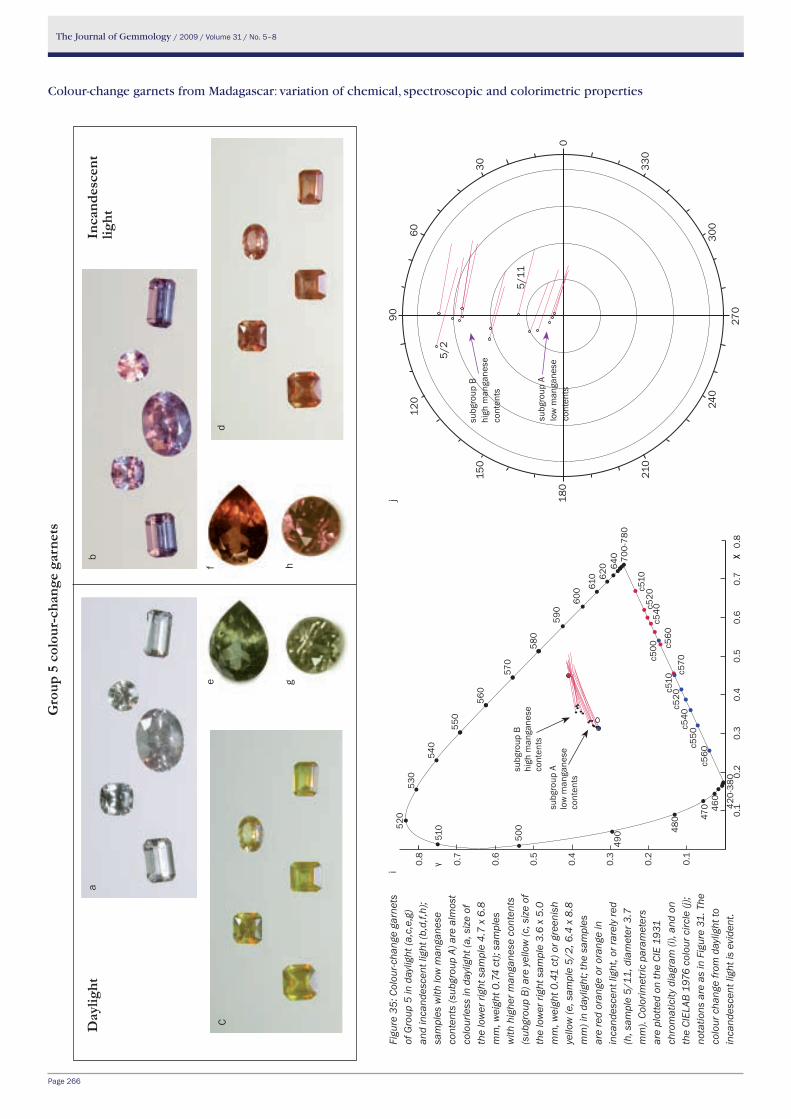
The Journal of Gemmology / 2009 / Volume 31 / No. 5–8
Page 266
Colour-change garnets from Madagascar: variation of chemical, spectroscopic and colorimetric properties
h
ef
g
Gro
up 5
col
our-
chan
ge g
arne
ts
ab
d
Figu
re 3
5: C
olou
r-cha
nge
garn
ets
of G
roup
5 in
day
light
(a,c
,e,g
) an
d in
cand
esce
nt li
ght (
b,d,
f,h);
sam
ples
with
low
man
gane
se
cont
ents
(sub
grou
p A)
are
alm
ost
colo
urle
ss in
day
light
(a, s
ize
of
the
low
er ri
ght s
ampl
e 4.
7 x
6.8
mm
, wei
ght 0
.74
ct);
sam
ples
w
ith h
ighe
r man
gane
se c
onte
nts
(sub
grou
p B)
are
yel
low
(c, s
ize
of
the
low
er ri
ght s
ampl
e 3.
6 x
5.0
mm
, wei
ght 0
.41
ct) o
r gre
enis
h ye
llow
(e, s
ampl
e 5/
2, 6
.4 x
8.8
m
m) i
n da
ylig
ht; t
he s
ampl
es
are
red
oran
ge o
r ora
nge
in
inca
ndes
cent
ligh
t, or
rare
ly re
d (h
, sam
ple
5/11
, dia
met
er 3
.7
mm
). Co
lorim
etric
par
amet
ers
are
plot
ted
on th
e CI
E 19
31
chro
mat
icity
dia
gram
(i),
and
on
the
CIEL
AB 1
976
colo
ur c
ircle
(j);
nota
tions
are
as
in F
igur
e 31
. The
co
lour
cha
nge
from
day
light
to
inca
ndes
cent
ligh
t is
evid
ent.
Inca
ndes
cent
lig
htD
aylig
ht
j
0
30
60
330
300
270
240
210
180
150
120
90
5/2
5/11
subg
roup
Bhi
gh m
anga
nese
co
nten
ts
subg
roup
Alo
w m
anga
nese
co
nten
ts
i
0.1
0.2
0.3
0.4
0.5
0.6
0.7
0.8
γ
χ
c540
c560
c550
540
550
560
570
580
590
600 61
0
530
520
700-
780
c510
c520
c540
c560
c570c5
00
c510
c520
500
510
640
620
460
470
480
490
0.8
0.7
0.6
0.5
0.4
0.3
0.2
0.1
χ42
0-38
0
subg
roup
Alo
w m
anga
nese
co
nten
ts
subg
roup
Bhi
gh m
anga
nese
co
nten
ts
C
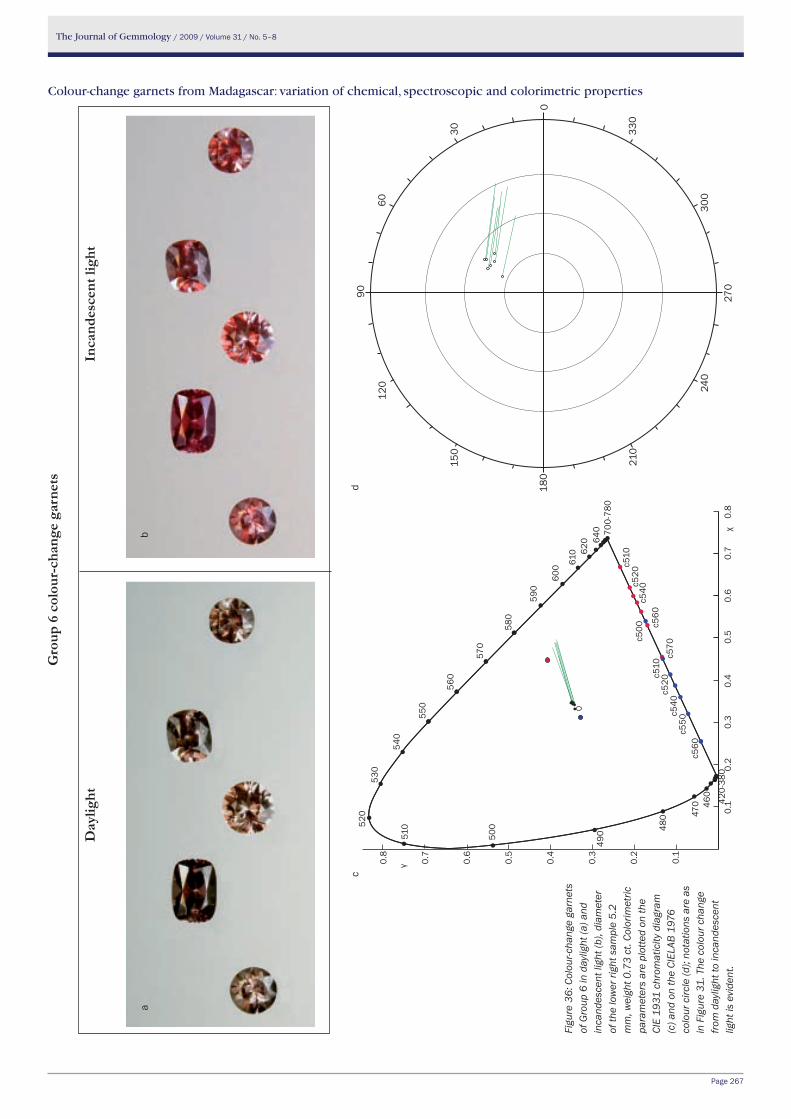
The Journal of Gemmology / 2009 / Volume 31 / No. 5–8
Page 267
Colour-change garnets from Madagascar: variation of chemical, spectroscopic and colorimetric properties
Figu
re 3
6: C
olou
r-cha
nge
garn
ets
of G
roup
6 in
day
light
(a) a
nd
inca
ndes
cent
ligh
t (b)
, dia
met
er
of th
e lo
wer
righ
t sam
ple
5.2
mm
, wei
ght 0
.73
ct. C
olor
imet
ric
para
met
ers
are
plot
ted
on th
e CI
E 19
31 c
hrom
atic
ity d
iagr
am
(c) a
nd o
n th
e CI
ELAB
197
6 co
lour
circ
le (d
); no
tatio
ns a
re a
s in
Fig
ure
31. T
he c
olou
r cha
nge
from
day
light
to in
cand
esce
nt
light
is e
vide
nt.
Gro
up 6
col
our-
chan
ge g
arne
ts
Day
light
In
cand
esce
nt li
ght
ba
cd
0
30
60
330
300
270
240
210
180
150
120
90
0.8
0.7
0.6
0.5
0.4
0.3
0.2
0.1
0.1
0.2
0.3
0.4
0.5
0.6
0.7
0.8
γ
χ
c540
c560
c550
540
550
560
570
580
590
600 61
0
530
520
700-
780
c510
c520
c540
c560
c570
c500
c510
c520
500
510
640
620
460
470
480
490
420-
380
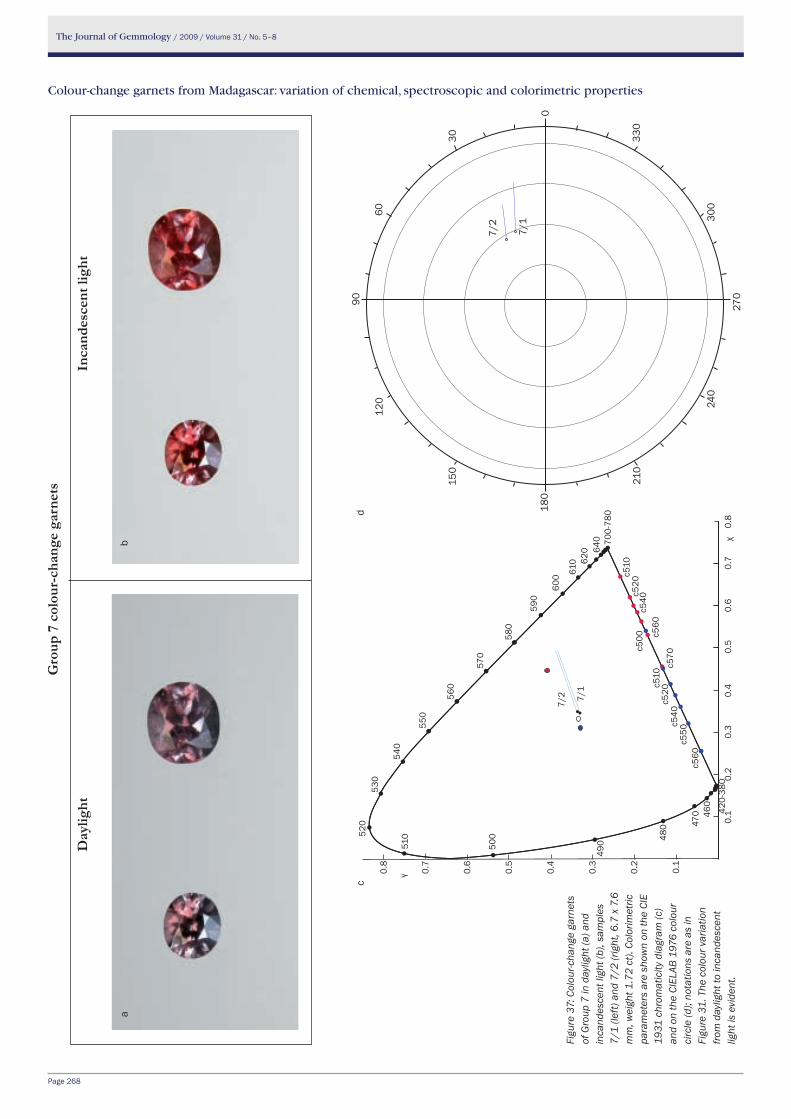
The Journal of Gemmology / 2009 / Volume 31 / No. 5–8
Page 268
Colour-change garnets from Madagascar: variation of chemical, spectroscopic and colorimetric properties
Figu
re 3
7: C
olou
r-cha
nge
garn
ets
of G
roup
7 in
day
light
(a) a
nd
inca
ndes
cent
ligh
t (b)
, sam
ples
7/
1 (le
ft) a
nd 7
/2 (r
ight
, 6.7
x 7
.6
mm
, wei
ght 1
.72
ct).
Colo
rimet
ric
para
met
ers
are
show
n on
the
CIE
1931
chr
omat
icity
dia
gram
(c)
and
on th
e CI
ELAB
197
6 co
lour
ci
rcle
(d);
nota
tions
are
as
in
Figu
re 3
1. T
he c
olou
r var
iatio
n fro
m d
aylig
ht to
inca
ndes
cent
lig
ht is
evi
dent
.
Gro
up 7
col
our-
chan
ge g
arne
ts
Day
light
In
cand
esce
nt li
ght
ab
d
0
30
60
330
300
270
240
210
180
150
120
90
7/1
7/2
c
0.8
0.7
0.6
0.5
0.4
0.3
0.2
0.1
0.1
0.2
0.3
0.4
0.5
0.6
0.7
0.8
γ
χ
c540
c560
c550
540
550
560
570
580
590
600 61
0
530
520
700-
780
c510
c520
c540
c560
c570
c500
c510
c520
500
510
640
620
460
470
480
490
420-
380
7/2 7/
1
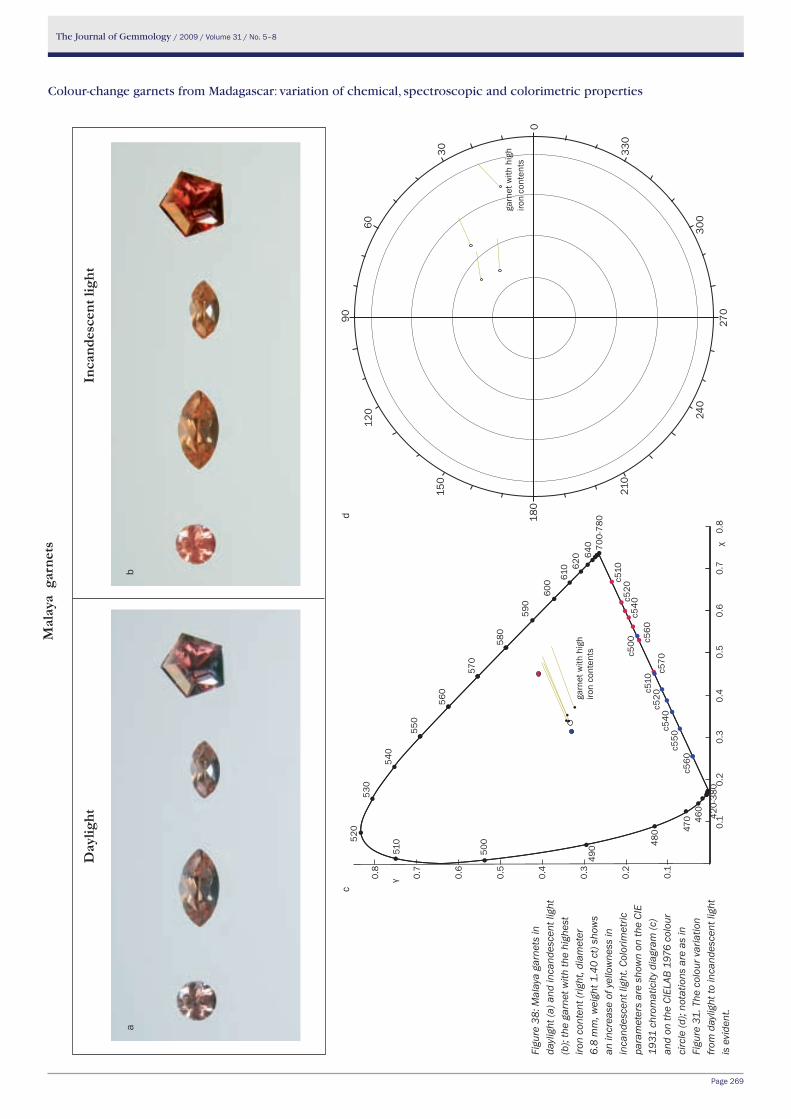
The Journal of Gemmology / 2009 / Volume 31 / No. 5–8
Page 269
Colour-change garnets from Madagascar: variation of chemical, spectroscopic and colorimetric properties
Figu
re 3
8: M
alay
a ga
rnet
s in
da
ylig
ht (a
) and
inca
ndes
cent
ligh
t (b
); th
e ga
rnet
with
the
high
est
iron
cont
ent (
right
, dia
met
er
6.8
mm
, wei
ght 1
.40
ct) s
how
s an
incr
ease
of y
ello
wne
ss in
in
cand
esce
nt li
ght.
Colo
rimet
ric
para
met
ers
are
show
n on
the
CIE
1931
chr
omat
icity
dia
gram
(c)
and
on th
e CI
ELAB
197
6 co
lour
ci
rcle
(d);
nota
tions
are
as
in
Figu
re 3
1. T
he c
olou
r var
iatio
n fro
m d
aylig
ht to
inca
ndes
cent
ligh
t is
evi
dent
.
c
0
30
60
330
300
270
240
210
180
150
120
90
garn
et w
ith h
igh
iron
cont
ents
Mal
aya
gar
nets
Day
light
In
cand
esce
nt li
ght
ab
0.8
0.7
0.6
0.5
0.4
0.3
0.2
0.1
0.1
0.2
0.3
0.4
0.5
0.6
0.7
0.8
γ
χ
c540
c560
c550
540
550
560
570
580
590
600 61
0
530
520
700-
780
c510
c520
c540
c560
c570
c500
c510
c520
500
510
640
620
460
470
480
490
420-
380
garn
et w
ith h
igh
iron
cont
ents
d
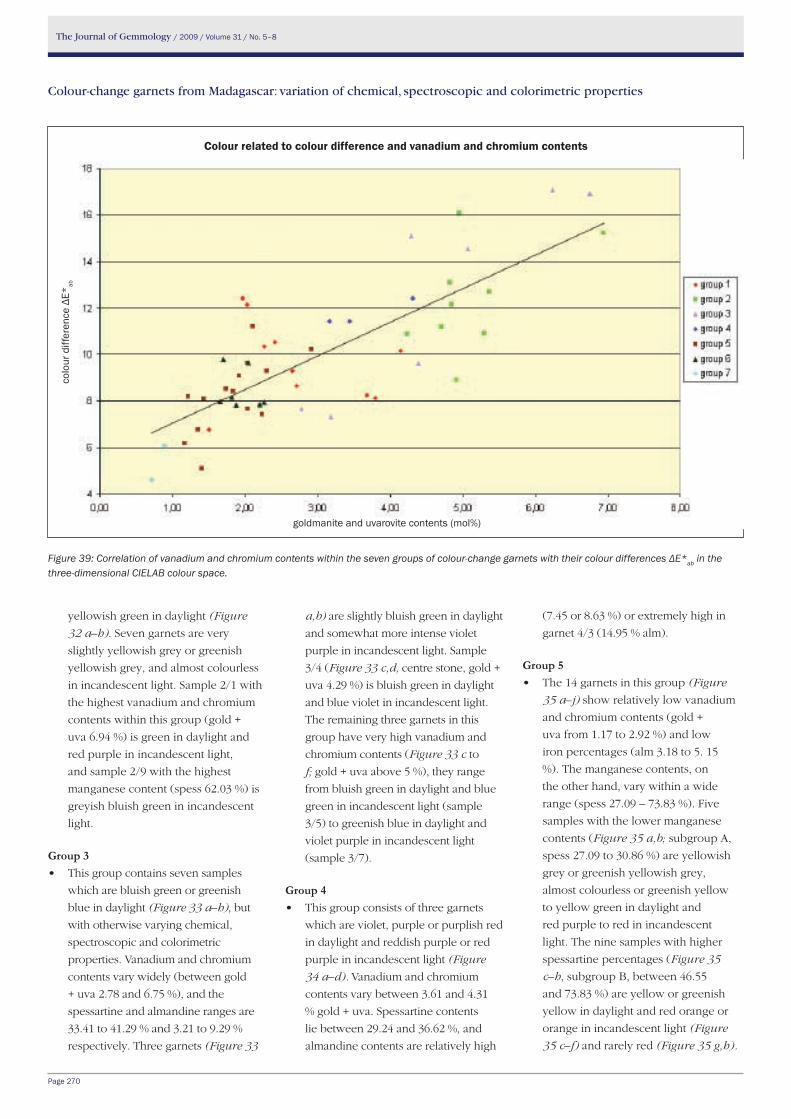
The Journal of Gemmology / 2009 / Volume 31 / No. 5–8
Page 270
Colour-change garnets from Madagascar: variation of chemical, spectroscopic and colorimetric properties
Figure 39: Correlation of vanadium and chromium contents within the seven groups of colour-change garnets with their colour differences ΔE*ab in the three-dimensional CIELAB colour space.
yellowish green in daylight (Figure
32 a–h). Seven garnets are very
slightly yellowish grey or greenish
yellowish grey, and almost colourless
in incandescent light. Sample 2/1 with
the highest vanadium and chromium
contents within this group (gold +
uva 6.94 %) is green in daylight and
red purple in incandescent light,
and sample 2/9 with the highest
manganese content (spess 62.03 %) is
greyish bluish green in incandescent
light.
Group 3• Thisgroupcontainssevensamples
which are bluish green or greenish
blue in daylight (Figure 33 a–h), but
with otherwise varying chemical,
spectroscopic and colorimetric
properties. Vanadium and chromium
contents vary widely (between gold
+ uva 2.78 and 6.75 %), and the
spessartine and almandine ranges are
33.41 to 41.29 % and 3.21 to 9.29 %
respectively. Three garnets (Figure 33
a,b) are slightly bluish green in daylight
and somewhat more intense violet
purple in incandescent light. Sample
3/4 (Figure 33 c,d, centre stone, gold +
uva 4.29 %) is bluish green in daylight
and blue violet in incandescent light.
The remaining three garnets in this
group have very high vanadium and
chromium contents (Figure 33 c to
f; gold + uva above 5 %), they range
from bluish green in daylight and blue
green in incandescent light (sample
3/5) to greenish blue in daylight and
violet purple in incandescent light
(sample 3/7).
Group 4• Thisgroupconsistsofthreegarnets
which are violet, purple or purplish red
in daylight and reddish purple or red
purple in incandescent light (Figure
34 a–d). Vanadium and chromium
contents vary between 3.61 and 4.31
% gold + uva. Spessartine contents
lie between 29.24 and 36.62 %, and
almandine contents are relatively high
(7.45 or 8.63 %) or extremely high in
garnet 4/3 (14.95 % alm).
Group 5• The14garnetsinthisgroup(Figure
35 a–j) show relatively low vanadium
and chromium contents (gold +
uva from 1.17 to 2.92 %) and low
iron percentages (alm 3.18 to 5. 15
%). The manganese contents, on
the other hand, vary within a wide
range (spess 27.09 – 73.83 %). Five
samples with the lower manganese
contents (Figure 35 a,b; subgroup A,
spess 27.09 to 30.86 %) are yellowish
grey or greenish yellowish grey,
almost colourless or greenish yellow
to yellow green in daylight and
red purple to red in incandescent
light. The nine samples with higher
spessartine percentages (Figure 35
c–h, subgroup B, between 46.55
and 73.83 %) are yellow or greenish
yellow in daylight and red orange or
orange in incandescent light (Figure
35 c–f) and rarely red (Figure 35 g,h).
Colour related to colour difference and vanadium and chromium contents
goldmanite and uvarovite contents (mol%)
colo
ur d
iffer
ence
Δe*
ab
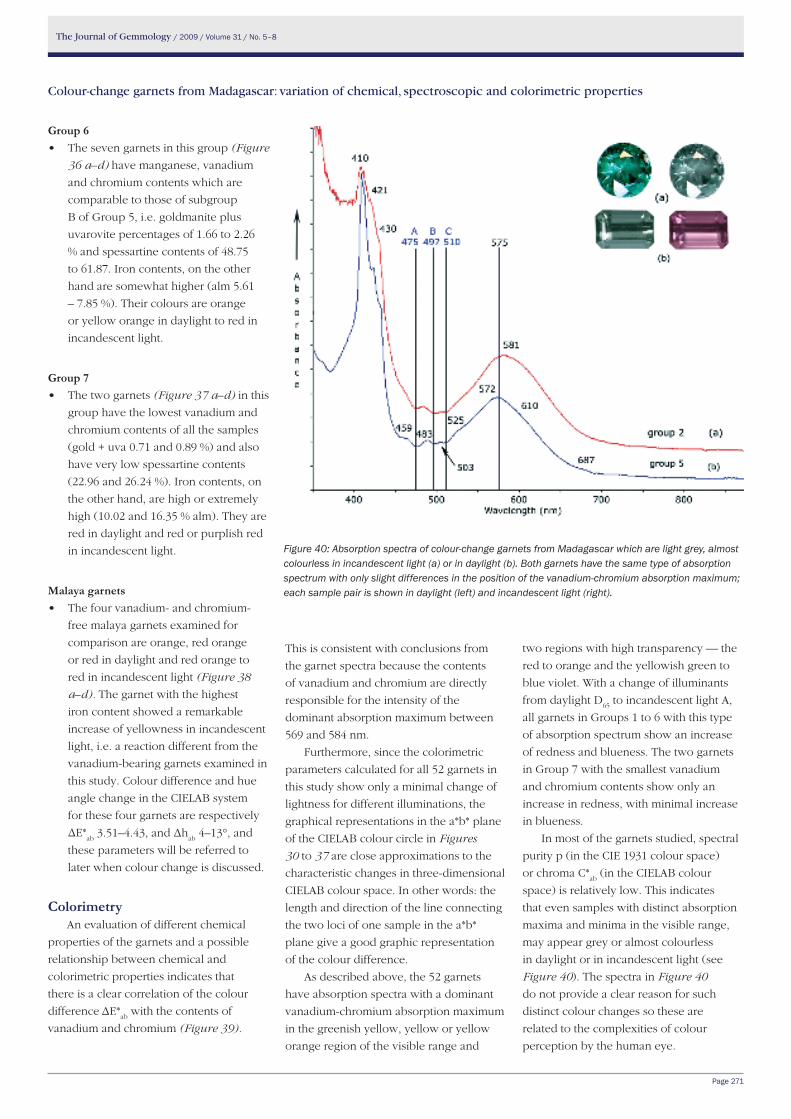
The Journal of Gemmology / 2009 / Volume 31 / No. 5–8
Page 271
Colour-change garnets from Madagascar: variation of chemical, spectroscopic and colorimetric properties
Group 6 • Thesevengarnetsinthisgroup(Figure
36 a–d) have manganese, vanadium
and chromium contents which are
comparable to those of subgroup
B of Group 5, i.e. goldmanite plus
uvarovite percentages of 1.66 to 2.26
% and spessartine contents of 48.75
to 61.87. Iron contents, on the other
hand are somewhat higher (alm 5.61
– 7.85 %). Their colours are orange
or yellow orange in daylight to red in
incandescent light.
Group 7• Thetwogarnets(Figure 37 a–d) in this
group have the lowest vanadium and
chromium contents of all the samples
(gold + uva 0.71 and 0.89 %) and also
have very low spessartine contents
(22.96 and 26.24 %). Iron contents, on
the other hand, are high or extremely
high (10.02 and 16.35 % alm). They are
red in daylight and red or purplish red
in incandescent light.
Malaya garnets • Thefourvanadium-andchromium-
free malaya garnets examined for
comparison are orange, red orange
or red in daylight and red orange to
red in incandescent light (Figure 38
a–d). The garnet with the highest
iron content showed a remarkable
increase of yellowness in incandescent
light, i.e. a reaction different from the
vanadium-bearing garnets examined in
this study. Colour difference and hue
angle change in the CIELAB system
for these four garnets are respectively
ΔE*ab
3.51–4.43, and Δhab
4–13°, and
these parameters will be referred to
later when colour change is discussed.
ColorimetryAn evaluation of different chemical
properties of the garnets and a possible
relationship between chemical and
colorimetric properties indicates that
there is a clear correlation of the colour
difference ΔE*ab
with the contents of
vanadium and chromium (Figure 39).
two regions with high transparency — the
red to orange and the yellowish green to
blue violet. With a change of illuminants
from daylight D65
to incandescent light A,
all garnets in Groups 1 to 6 with this type
of absorption spectrum show an increase
of redness and blueness. The two garnets
in Group 7 with the smallest vanadium
and chromium contents show only an
increase in redness, with minimal increase
in blueness.
In most of the garnets studied, spectral
purity p (in the CIE 1931 colour space)
or chroma C*ab
(in the CIELAB colour
space) is relatively low. This indicates
that even samples with distinct absorption
maxima and minima in the visible range,
may appear grey or almost colourless
in daylight or in incandescent light (see
Figure 40). The spectra in Figure 40
do not provide a clear reason for such
distinct colour changes so these are
related to the complexities of colour
perception by the human eye.
Figure 40: Absorption spectra of colour-change garnets from Madagascar which are light grey, almost colourless in incandescent light (a) or in daylight (b). Both garnets have the same type of absorption spectrum with only slight differences in the position of the vanadium-chromium absorption maximum; each sample pair is shown in daylight (left) and incandescent light (right).
This is consistent with conclusions from
the garnet spectra because the contents
of vanadium and chromium are directly
responsible for the intensity of the
dominant absorption maximum between
569 and 584 nm.
Furthermore, since the colorimetric
parameters calculated for all 52 garnets in
this study show only a minimal change of
lightness for different illuminations, the
graphical representations in the a*b* plane
of the CIELAB colour circle in Figures
30 to 37 are close approximations to the
characteristic changes in three-dimensional
CIELAB colour space. In other words: the
length and direction of the line connecting
the two loci of one sample in the a*b*
plane give a good graphic representation
of the colour difference.
As described above, the 52 garnets
have absorption spectra with a dominant
vanadium-chromium absorption maximum
in the greenish yellow, yellow or yellow
orange region of the visible range and
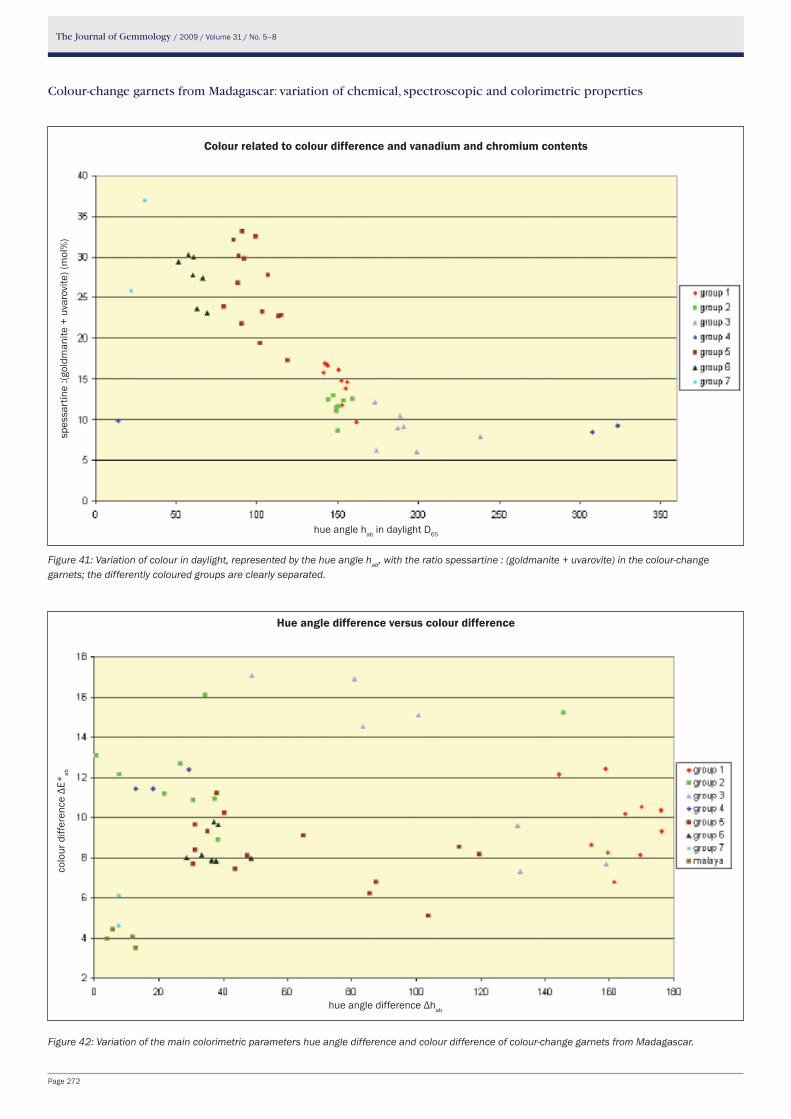
The Journal of Gemmology / 2009 / Volume 31 / No. 5–8
Page 272
Colour-change garnets from Madagascar: variation of chemical, spectroscopic and colorimetric properties
Figure 41: Variation of colour in daylight, represented by the hue angle hab, with the ratio spessartine : (goldmanite + uvarovite) in the colour-change garnets; the differently coloured groups are clearly separated.
Figure 42: Variation of the main colorimetric parameters hue angle difference and colour difference of colour-change garnets from Madagascar.
Colour related to colour difference and vanadium and chromium contents
hue angle hab in daylight D65
spes
sart
ine
:(gol
dman
ite +
uva
rovi
te) (
mol
%)
colo
ur d
iffer
ence
Δe*
ab
hue angle difference Δhab
Hue angle difference versus colour difference
The Journal of Gemmology / 2009 / Volume 31 / No. 5–8
Page 273
Colour-change garnets from Madagascar: variation of chemical, spectroscopic and colorimetric properties
Causes of colour: correlation of chemical, spectroscopic and colorimetric data
Important features of the chemistry
of our garnets are plotted on Figure
29 and their colours in daylight and
incandescent light are plotted on Figure
30. In the section on spectra the various
intensities of the (vanadium + chromium),
manganese and iron absorption bands
and the shift of the position of the
dominant vanadium-chromium absorption
maximum from 569 to 584 nm were
discussed. The two regions in the spectra
of low absorption (the red to orange and
yellowish green to blue-violet ranges)
and their ratios should play a major
role in determining the colour of the
garnets. The balance between these two
regions of high transparency depends
on the intensity of the first vanadium-
chromium absorption maximum in
the greenish yellow, yellow or yellow
orange compared with that of the
manganese triplet in the violet, on which
is superimposed the second vanadium-
chromium absorption band (see Figure
26).
On the basis of daylight colour,
represented by hue angle hab
, the seven
groups of colour-change garnets can
be plotted against the spessartine :
(goldmanite + uvarovite) ratio (Figure 41),
and they can be subdivided further into
• garnetswithadaylightcolourofgreen
to greenish blue and lower spessartine
: (goldmanite + uvarovite) ratios
(Groups 1, 2 and 3);
• garnetswithadaylightcolourof
yellow green to orange and higher
spessartine : (goldmanite + uvarovite)
ratios (Groups 5 and 6);
• garnetsofGroup4withdaylight
colour violet, purple or purplish red
with low spessartine : (goldmanite +
uvarovite) ratios and very high iron
contents; and
• garnetsofGroup7,redindaylight
with high spessartine : (goldmanite +
uvarovite) ratios and very high iron
contents.
In addition to these compositional
factors, to understand the colour variations
in the garnets, the intensity and position of
the absorption maximum of the dominant
vanadium-chromium band (Figure 26) and
the intensity of the manganese triplet in
the violet must be considered. As general
background we know that standard
daylight D65
has high percentages of blue
and green compared with incandescent
light A, which has higher amounts of red
and orange. So, typical vanadium- and
chromium-bearing pyrope-spessartine
garnets show an increase of redness
and blueness under light source A. The
colour difference as measured by ΔE*ab
in three-dimensional colour space is, in
general, correlated with the vanadium
and chromium contents (Figure 39). The
relationship between colour difference
ΔE*ab
and hue angle difference Δhab
is
shown in Figure 42.
Group 1 (see Figure 31):
• Garnetsinthisgroupare
colorimetrically homogeneous with a
colour change from green to slightly
yellowish green in daylight to red
purple, reddish purple or purple in
incandescent light. They have an
absorption maximum in the range
572 to 576 nm, and the absorption
minima in the blue to green range
are A (blue) ≈ B (bluish green) > C
(green) (see Table V and Figures 23
and 27). The spessartine : (goldmanite
+ uvarovite) ratios vary between 9.7
and 16.9. These garnets have almost
identical chroma in daylight and
incandescent light lying equidistant
from the centre of the CIELAB colour
space. The hue angle differences vary
between 144.3 and 176.2°. In order to
better understand how these colours
and colour changes vary from those
of other groups, we may designate a
typical spectrum of a Group 1 garnet
as a ‘balanced spectrum’.
The differences shown by other
groups of garnets may then be
summarized as follows:
Group 2 (see Figure 32): • Garnetsinthisgrouphavehigher
goldmanite, uvarovite and spessartine
contents than Group 1 garnets, but the
spessartine : (goldmanite + uvarovite)
ratios are within the same range
(Figure 41).
• Theabsorptionmaximaofeight
samples lie between 578 and 582 nm
(Figure 27, 40a). Thus the absorption
minima in the blue to green become
broader with B (bluish green) > C
(green) >>A (blue) and the absorption
in the red to orange is somewhat
stronger. Consequently the chroma
in daylight and the intensity of the
green coloration in daylight is strong.
However, the stronger absorption in the
red to orange range means that under
incandescent light most samples are
still yellowish grey, greenish yellowish
grey or greyish bluish green (almost
colourless) and not red or purple (see
Figure 32h).
• Theabsorptionmaximumofsample
2/1, which is green in daylight and
red purple in incandescent light,
lies at 583 nm. The percentage of
goldmanite + uvarovite is 6.94 and the
spessartine : (goldmanite + uvarovite)
ratio is 8.6. Thus, the effect of the
shift of the absorption maximum to
higher wavelength is compensated
by a somewhat higher vanadium and
chromium content and the structure of
the absorption minimum is similar to
that of samples in Group 1. This higher
transmission at A is the cause of the red
purple coloration in incandescent light.
Group 3 (see Figure 33):
• Fourgarnetsinthisgrouphave
absorption maxima between 573
and 576 nm, i.e. in the range of
the maxima measured for samples
of Group 1 (Figure 27). However,
these garnets have somewhat smaller
spessartine : (goldmanite + uvarovite)
ratios. Thus the minimum in the blue
to green is shifted to lower wavelength
with A (blue) >B (bluish green) >C
(green). Their colour in daylight is
bluish green (samples 3/3 and 3/4),
The Journal of Gemmology / 2009 / Volume 31 / No. 5–8
Page 274
Colour-change garnets from Madagascar: variation of chemical, spectroscopic and colorimetric properties
absorption minimum is A ≈ B ≈ C. The
resulting colour in daylight is orange
or yellow orange. In incandescent
light, the increase of blueness is weak
or extremely weak, and the stones are
red.
Group 7 (see Figure 37):
• Thetwogarnetsinthisgroupshow
the smallest vanadium and chromium
contents of the whole garnet series,
and they also have high iron contents
(alm 10.02 or 16.35 %). The spectra
(Figure 28) are comparable with the
spectra of iron-rich malaya garnets
(Figure 22) which show a somewhat
increased intensity of the absorption
band at 569 nm. The structure at
the absorption minimum is A >>
B ≈ C and is not influenced by the
vanadium-chromium band. The stones
are red in daylight, and a somewhat
more intense red or purplish red in
incandescent light.
In comparing our groups with those of
Krzemnicki et al. (2001) we can note the
following similarities:
This paper: Krzemnicki et al.:
Two samples
of Group 3
Compare with Group 1
Groups 1, 3, 4 Compare with Group 2
Group 5, low
manganese
contents
Compare with Group 3
Group 5, high
manganese
contents
Compare with Group 4
Krzemnicki and his co-workers did
not examine samples comparable with
our Groups 2, 6 and 7, and the single
garnet in their Group 5 has a particular
combination of properties not represented
among our 52 samples.
Most probably, according to the
spectrum, this garnet specimen reveals
— in addition to the ‘normal’ absorption
bands of manganese, iron, vanadium and
chromium discussed in detail in this paper
— a continuously increasing absorption
from red to violet. A similar spectroscopic
feature was observed in samples from
and under incandescent light this
changes to violet purple (sample 3/3)
or blue violet (sample 3/4).
• Thesametypeofspectrumwitha
maximum at 574 nm and minima
according to the scheme A (blue) >B
(bluish green) >C (green) is shown
by sample 3/7. However, due to the
higher contents of vanadium and
chromium (gold + uva 5.07 %) the
intensity of the absorption maximum
is higher and the resulting colour in
daylight is greenish blue. This is the
bluest of the 52 studied garnets, and in
incandescent light it is violet purple.
• Garnets3/5and3/6haveextremely
high vanadium and chromium
contents, and their absorption maxima
were measured at 584 nm (Figure 27).
This shift of absorption to a higher
wavelength and the resulting structure
of the minimum where B (bluish
green) > C (bluish green) > A (blue),
results in a daylight colour of bluish
green. With the increase of blueness
and redness in incandescent light, the
blueness remains strong and 3/5 is
blue green in this light and 3/6 is blue
violet.
Group 4 (see Figure 34):
• Thegarnetsinthisgrouphave
somewhat lower spessartine :
(goldmanite + uvarovite) ratios than
comparable samples of Group 3
(Figure 41). The vanadium-chromium
maximum lies at 571–573 nm (Figure
27) and the transmission pattern in the
blue is A (blue) >B (bluish green) >C
(green). The intensity of the vanadium-
chromium absorption band is probably
enhanced by the high to extremely
high iron contents of the garnets, and
due to the position of this band at
571 nm, the red in daylight has more
influence resulting in violet, purple
or purplish red. The garnet with the
highest almandine content (sample 4/3)
is purplish red in daylight.
• Uponchangeofilluminantto
incandescent light, the increase of
blueness and redness result in a
reddish purple or red purple coloration
of the three garnets.
Group 5 (see Figure 35):
• Withinthisgroup,thethreegarnets
with the lowest manganese contents
(spess 27.09 – 27.90 %) and a
vanadium-chromium absorption
maximum at 572 nm (see Figure
40b) are slightly yellowish grey,
almost colourless. The structure in
the blue transmission region is A > B
≈ C. Although these samples reveal
pronounced absorption spectra in
the visible range, their chromas
are extremely low (1.2 to 2.1). The
resulting colour is only understandable
in terms of the mechanism of human
colour perception, but it proves the
results of chromaticity calculation in
the CIELAB colour space to be correct.
In incandescent light, these stones are
red purple.
• Twosampleshavesomewhathigher
spessartine contents and similar
vanadium and chromium contents.
The structure of the absorption
minimum (see Figure 28) is A ≈ B >
C (sample 5/10) or A ≈ B ≈ C (sample
5/9) and in daylight they are greenish
yellow or yellow green; consequently,
these two samples are closest to those
of Group 1. In incandescent light
redness and blueness are increased
and the colour shifts to red or red
purple.
• Theremainingninesampleshave
distinctly higher manganese contents
between 46.44 and 73.83 % spess.
The ratio spess : (gold + uva) varies
accordingly from 21.8 to 33.1 (Figure
41). The structure of the absorption
minimum (see again Figure 28) is B ≈
C > A or C > B > A and the daylight
colour is greenish yellow or yellow. In
incandescent light they are orange to
red.
Group 6 (see Figure 36):
• Thesevengarnetsinthisgrouphave
similar manganese, vanadium and
chromium but higher iron contents
than the first three garnets mentioned
in Group 5. The absorption maximum,
which is influenced by the high iron
contents, lies between 569 and 571 nm
(Figure 28) and the structure at the
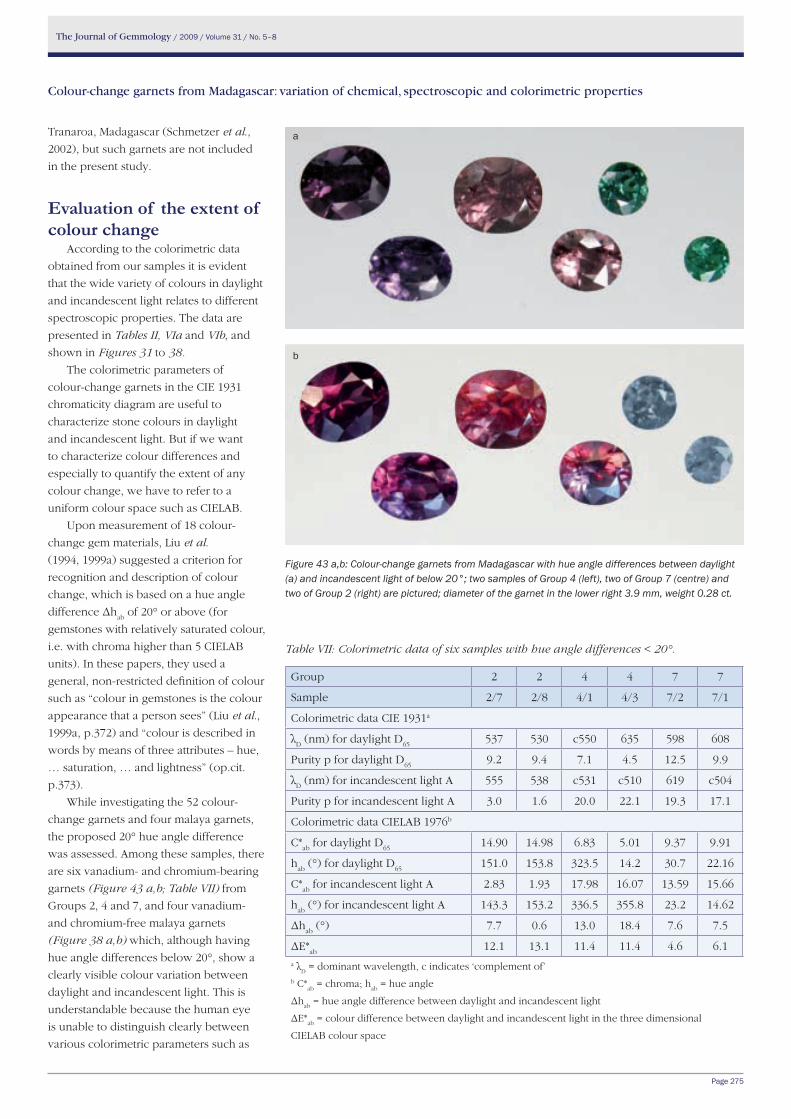
The Journal of Gemmology / 2009 / Volume 31 / No. 5–8
Page 275
Colour-change garnets from Madagascar: variation of chemical, spectroscopic and colorimetric properties
Figure 43 a,b: Colour-change garnets from Madagascar with hue angle differences between daylight (a) and incandescent light of below 20°; two samples of Group 4 (left), two of Group 7 (centre) and two of Group 2 (right) are pictured; diameter of the garnet in the lower right 3.9 mm, weight 0.28 ct.
Tranaroa, Madagascar (Schmetzer et al.,
2002), but such garnets are not included
in the present study.
evaluation of the extent of colour change
According to the colorimetric data
obtained from our samples it is evident
that the wide variety of colours in daylight
and incandescent light relates to different
spectroscopic properties. The data are
presented in Tables II, VIa and VIb, and
shown in Figures 31 to 38.
The colorimetric parameters of
colour-change garnets in the CIE 1931
chromaticity diagram are useful to
characterize stone colours in daylight
and incandescent light. But if we want
to characterize colour differences and
especially to quantify the extent of any
colour change, we have to refer to a
uniform colour space such as CIELAB.
Upon measurement of 18 colour-
change gem materials, Liu et al.
(1994, 1999a) suggested a criterion for
recognition and description of colour
change, which is based on a hue angle
difference Δhab
of 20° or above (for
gemstones with relatively saturated colour,
i.e. with chroma higher than 5 CIELAB
units). In these papers, they used a
general, non-restricted definition of colour
such as “colour in gemstones is the colour
appearance that a person sees” (Liu et al.,
1999a, p.372) and “colour is described in
words by means of three attributes – hue,
… saturation, … and lightness” (op.cit.
p.373).
While investigating the 52 colour-
change garnets and four malaya garnets,
the proposed 20° hue angle difference
was assessed. Among these samples, there
are six vanadium- and chromium-bearing
garnets (Figure 43 a,b; Table VII) from
Groups 2, 4 and 7, and four vanadium-
and chromium-free malaya garnets
(Figure 38 a,b) which, although having
hue angle differences below 20°, show a
clearly visible colour variation between
daylight and incandescent light. This is
understandable because the human eye
is unable to distinguish clearly between
various colorimetric parameters such as
Table VII: Colorimetric data of six samples with hue angle differences < 20°.
Group 2 2 4 4 7 7
Sample 2/7 2/8 4/1 4/3 7/2 7/1
Colorimetric data CIE 1931a
λD (nm) for daylight D
65537 530 c550 635 598 608
Purity p for daylight D65
9.2 9.4 7.1 4.5 12.5 9.9
λD (nm) for incandescent light A 555 538 c531 c510 619 c504
Purity p for incandescent light A 3.0 1.6 20.0 22.1 19.3 17.1
Colorimetric data CIELAB 1976b
C*ab
for daylight D65
14.90 14.98 6.83 5.01 9.37 9.91
hab
(°) for daylight D65
151.0 153.8 323.5 14.2 30.7 22.16
C*ab
for incandescent light A 2.83 1.93 17.98 16.07 13.59 15.66
hab
(°) for incandescent light A 143.3 153.2 336.5 355.8 23.2 14.62
Δhab
(°) 7.7 0.6 13.0 18.4 7.6 7.5
ΔE*ab
12.1 13.1 11.4 11.4 4.6 6.1a λ
D = dominant wavelength, c indicates ‘complement of’
b C*ab
= chroma; hab
= hue angle
Δhab
= hue angle difference between daylight and incandescent light
ΔE*ab
= colour difference between daylight and incandescent light in the three dimensional
CIELAB colour space
b
a
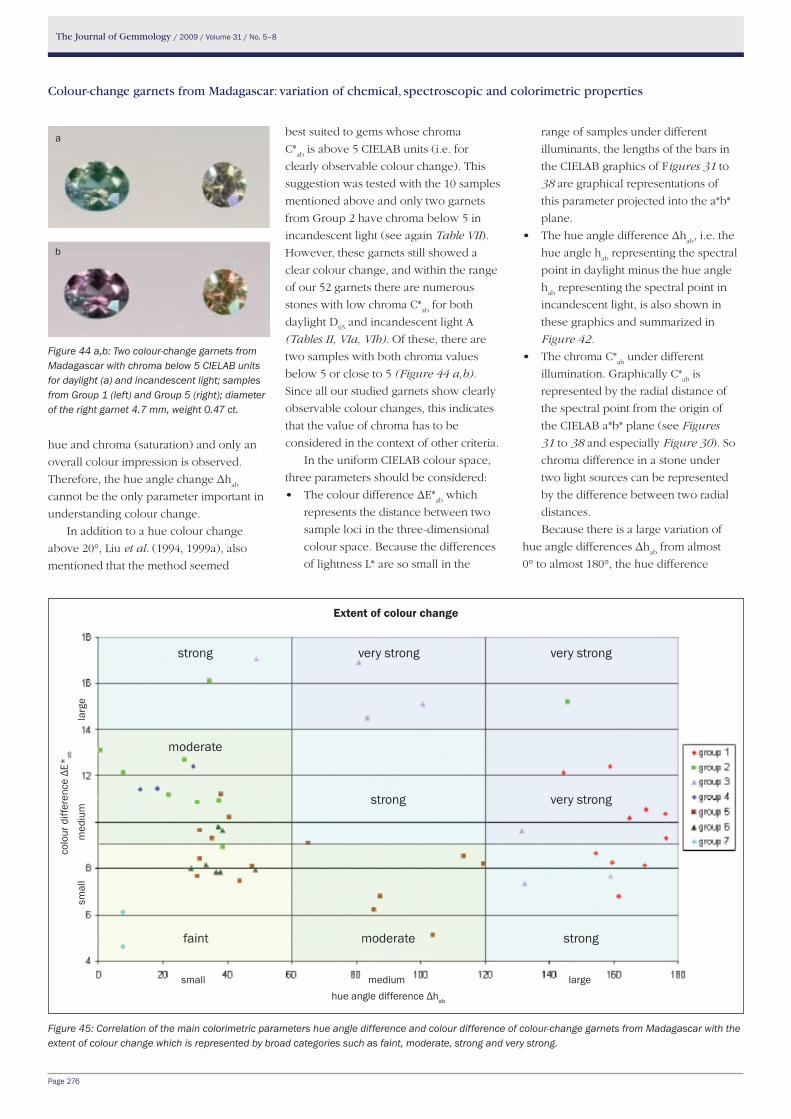
The Journal of Gemmology / 2009 / Volume 31 / No. 5–8
Page 276
Colour-change garnets from Madagascar: variation of chemical, spectroscopic and colorimetric properties
hue and chroma (saturation) and only an
overall colour impression is observed.
Therefore, the hue angle change Δhab
cannot be the only parameter important in
understanding colour change.
In addition to a hue colour change
above 20°, Liu et al. (1994, 1999a), also
mentioned that the method seemed
best suited to gems whose chroma
C*ab
is above 5 CIELAB units (i.e. for
clearly observable colour change). This
suggestion was tested with the 10 samples
mentioned above and only two garnets
from Group 2 have chroma below 5 in
incandescent light (see again Table VII).
However, these garnets still showed a
clear colour change, and within the range
of our 52 garnets there are numerous
stones with low chroma C*ab
for both
daylight D65
and incandescent light A
(Tables II, VIa, VIb). Of these, there are
two samples with both chroma values
below 5 or close to 5 (Figure 44 a,b).
Since all our studied garnets show clearly
observable colour changes, this indicates
that the value of chroma has to be
considered in the context of other criteria.
In the uniform CIELAB colour space,
three parameters should be considered:
• ThecolourdifferenceΔE*ab
which
represents the distance between two
sample loci in the three-dimensional
colour space. Because the differences
of lightness L* are so small in the
Figure 45: Correlation of the main colorimetric parameters hue angle difference and colour difference of colour-change garnets from Madagascar with the extent of colour change which is represented by broad categories such as faint, moderate, strong and very strong.
Figure 44 a,b: Two colour-change garnets from Madagascar with chroma below 5 CIELAB units for daylight (a) and incandescent light; samples from Group 1 (left) and Group 5 (right); diameter of the right garnet 4.7 mm, weight 0.47 ct.
b
a range of samples under different
illuminants, the lengths of the bars in
the CIELAB graphics of Figures 31 to
38 are graphical representations of
this parameter projected into the a*b*
plane.
• ThehueangledifferenceΔhab
, i.e. the
hue angle hab
representing the spectral
point in daylight minus the hue angle
hab
representing the spectral point in
incandescent light, is also shown in
these graphics and summarized in
Figure 42.
• ThechromaC*ab
under different
illumination. Graphically C*ab
is
represented by the radial distance of
the spectral point from the origin of
the CIELAB a*b* plane (see Figures
31 to 38 and especially Figure 30). So
chroma difference in a stone under
two light sources can be represented
by the difference between two radial
distances.
Because there is a large variation of
hue angle differences Δhab
from almost
0° to almost 180°, the hue difference
Extent of colour change
colo
ur d
iffer
ence
Δe*
ab
hue angle difference Δhab
smal
lm
ediu
mla
rge
small medium large
strong
strong
strong
very strong very strong
moderate
very strong
moderate
faint
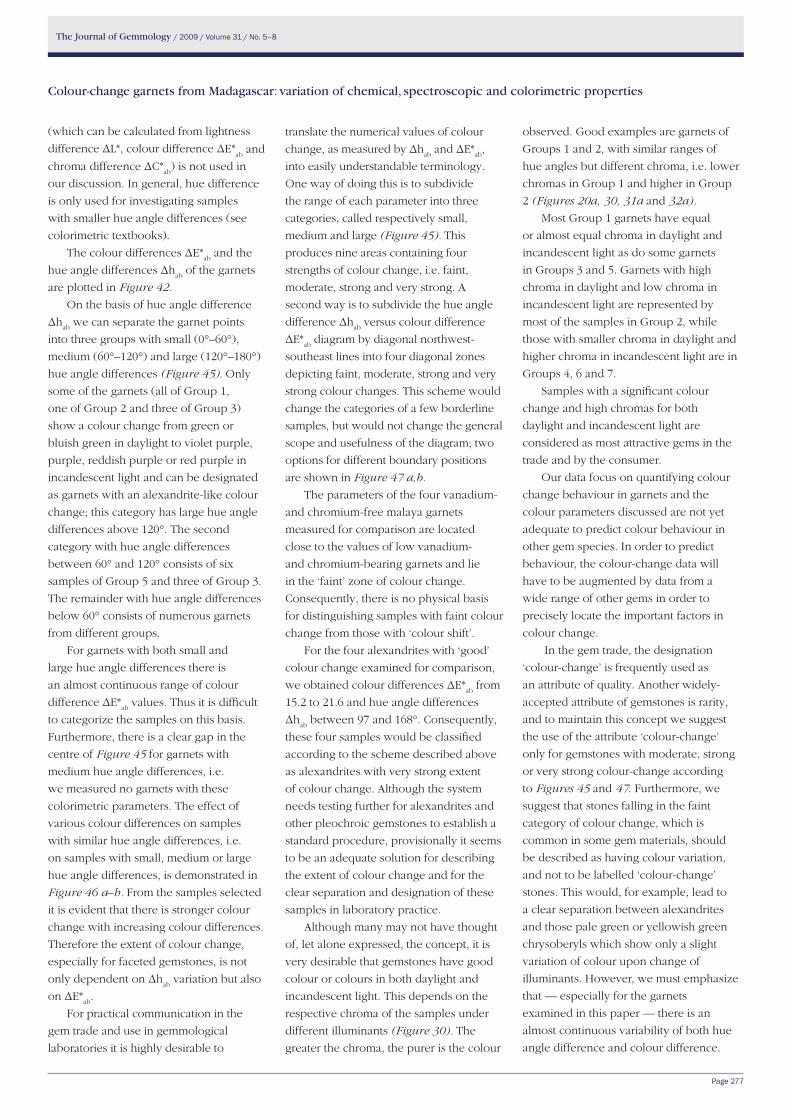
The Journal of Gemmology / 2009 / Volume 31 / No. 5–8
Page 277
Colour-change garnets from Madagascar: variation of chemical, spectroscopic and colorimetric properties
translate the numerical values of colour
change, as measured by Δhab
and ΔE*ab
,
into easily understandable terminology.
One way of doing this is to subdivide
the range of each parameter into three
categories, called respectively small,
medium and large (Figure 45). This
produces nine areas containing four
strengths of colour change, i.e. faint,
moderate, strong and very strong. A
second way is to subdivide the hue angle
difference Δhab
versus colour difference
ΔE*ab
diagram by diagonal northwest-
southeast lines into four diagonal zones
depicting faint, moderate, strong and very
strong colour changes. This scheme would
change the categories of a few borderline
samples, but would not change the general
scope and usefulness of the diagram; two
options for different boundary positions
are shown in Figure 47 a,b.
The parameters of the four vanadium-
and chromium-free malaya garnets
measured for comparison are located
close to the values of low vanadium-
and chromium-bearing garnets and lie
in the ‘faint’ zone of colour change.
Consequently, there is no physical basis
for distinguishing samples with faint colour
change from those with ‘colour shift’.
For the four alexandrites with ‘good’
colour change examined for comparison,
we obtained colour differences ΔE*ab
from
15.2 to 21.6 and hue angle differences
Δhab
between 97 and 168°. Consequently,
these four samples would be classified
according to the scheme described above
as alexandrites with very strong extent
of colour change. Although the system
needs testing further for alexandrites and
other pleochroic gemstones to establish a
standard procedure, provisionally it seems
to be an adequate solution for describing
the extent of colour change and for the
clear separation and designation of these
samples in laboratory practice.
Although many may not have thought
of, let alone expressed, the concept, it is
very desirable that gemstones have good
colour or colours in both daylight and
incandescent light. This depends on the
respective chroma of the samples under
different illuminants (Figure 30). The
greater the chroma, the purer is the colour
observed. Good examples are garnets of
Groups 1 and 2, with similar ranges of
hue angles but different chroma, i.e. lower
chromas in Group 1 and higher in Group
2 (Figures 20a, 30, 31a and 32a).
Most Group 1 garnets have equal
or almost equal chroma in daylight and
incandescent light as do some garnets
in Groups 3 and 5. Garnets with high
chroma in daylight and low chroma in
incandescent light are represented by
most of the samples in Group 2, while
those with smaller chroma in daylight and
higher chroma in incandescent light are in
Groups 4, 6 and 7.
Samples with a significant colour
change and high chromas for both
daylight and incandescent light are
considered as most attractive gems in the
trade and by the consumer.
Our data focus on quantifying colour
change behaviour in garnets and the
colour parameters discussed are not yet
adequate to predict colour behaviour in
other gem species. In order to predict
behaviour, the colour-change data will
have to be augmented by data from a
wide range of other gems in order to
precisely locate the important factors in
colour change.
In the gem trade, the designation
‘colour-change’ is frequently used as
an attribute of quality. Another widely-
accepted attribute of gemstones is rarity,
and to maintain this concept we suggest
the use of the attribute ‘colour-change’
only for gemstones with moderate, strong
or very strong colour-change according
to Figures 45 and 47. Furthermore, we
suggest that stones falling in the faint
category of colour change, which is
common in some gem materials, should
be described as having colour variation,
and not to be labelled ‘colour-change’
stones. This would, for example, lead to
a clear separation between alexandrites
and those pale green or yellowish green
chrysoberyls which show only a slight
variation of colour upon change of
illuminants. However, we must emphasize
that — especially for the garnets
examined in this paper — there is an
almost continuous variability of both hue
angle difference and colour difference.
(which can be calculated from lightness
difference ΔL*, colour difference ΔE*ab
and
chroma difference ΔC*ab
) is not used in
our discussion. In general, hue difference
is only used for investigating samples
with smaller hue angle differences (see
colorimetric textbooks).
The colour differences ΔE*ab
and the
hue angle differences Δhab
of the garnets
are plotted in Figure 42.
On the basis of hue angle difference
Δhab
we can separate the garnet points
into three groups with small (0°–60°),
medium (60°–120°) and large (120°–180°)
hue angle differences (Figure 45). Only
some of the garnets (all of Group 1,
one of Group 2 and three of Group 3)
show a colour change from green or
bluish green in daylight to violet purple,
purple, reddish purple or red purple in
incandescent light and can be designated
as garnets with an alexandrite-like colour
change; this category has large hue angle
differences above 120°. The second
category with hue angle differences
between 60° and 120° consists of six
samples of Group 5 and three of Group 3.
The remainder with hue angle differences
below 60° consists of numerous garnets
from different groups.
For garnets with both small and
large hue angle differences there is
an almost continuous range of colour
difference ΔE*ab
values. Thus it is difficult
to categorize the samples on this basis.
Furthermore, there is a clear gap in the
centre of Figure 45 for garnets with
medium hue angle differences, i.e.
we measured no garnets with these
colorimetric parameters. The effect of
various colour differences on samples
with similar hue angle differences, i.e.
on samples with small, medium or large
hue angle differences, is demonstrated in
Figure 46 a–h. From the samples selected
it is evident that there is stronger colour
change with increasing colour differences.
Therefore the extent of colour change,
especially for faceted gemstones, is not
only dependent on Δhab
variation but also
on ΔE*ab
.
For practical communication in the
gem trade and use in gemmological
laboratories it is highly desirable to
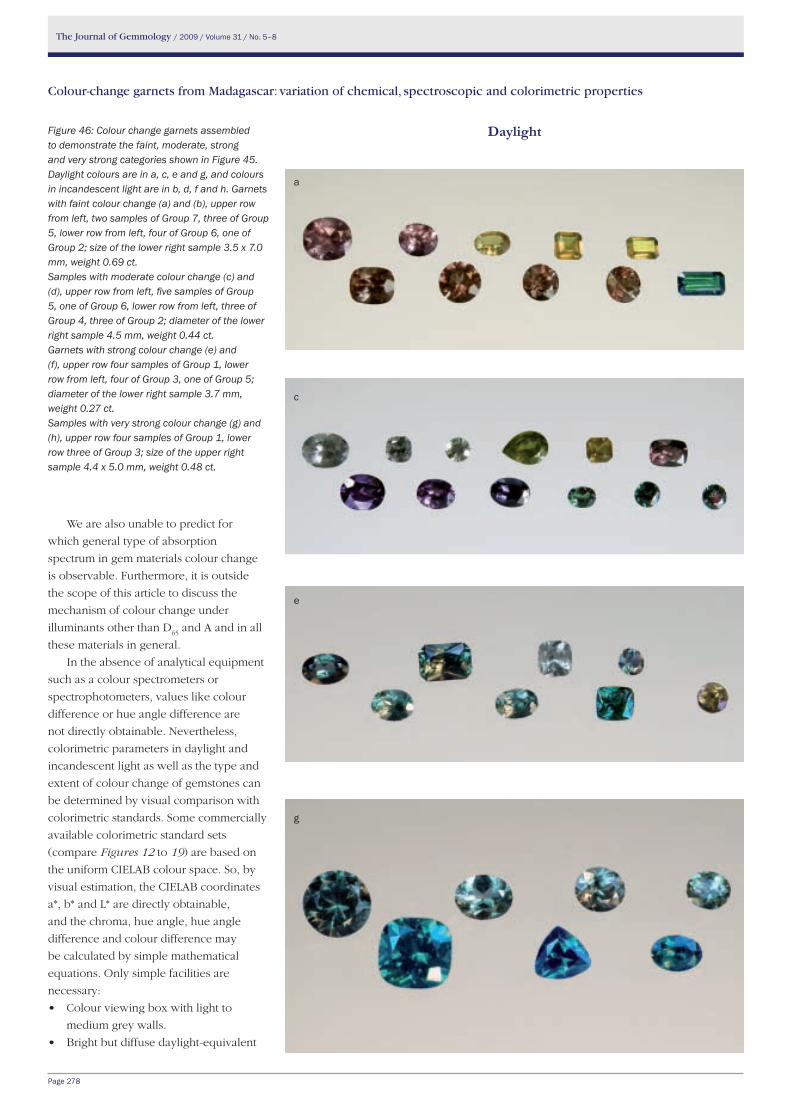
The Journal of Gemmology / 2009 / Volume 31 / No. 5–8
Page 278
Colour-change garnets from Madagascar: variation of chemical, spectroscopic and colorimetric properties
We are also unable to predict for
which general type of absorption
spectrum in gem materials colour change
is observable. Furthermore, it is outside
the scope of this article to discuss the
mechanism of colour change under
illuminants other than D65
and A and in all
these materials in general.
In the absence of analytical equipment
such as a colour spectrometers or
spectrophotometers, values like colour
difference or hue angle difference are
not directly obtainable. Nevertheless,
colorimetric parameters in daylight and
incandescent light as well as the type and
extent of colour change of gemstones can
be determined by visual comparison with
colorimetric standards. Some commercially
available colorimetric standard sets
(compare Figures 12 to 19) are based on
the uniform CIELAB colour space. So, by
visual estimation, the CIELAB coordinates
a*, b* and L* are directly obtainable,
and the chroma, hue angle, hue angle
difference and colour difference may
be calculated by simple mathematical
equations. Only simple facilities are
necessary:
• Colourviewingboxwithlightto
medium grey walls.
• Brightbutdiffusedaylight-equivalent
Figure 46: Colour change garnets assembled to demonstrate the faint, moderate, strong and very strong categories shown in Figure 45. Daylight colours are in a, c, e and g, and colours in incandescent light are in b, d, f and h. Garnets with faint colour change (a) and (b), upper row from left, two samples of Group 7, three of Group 5, lower row from left, four of Group 6, one of Group 2; size of the lower right sample 3.5 x 7.0 mm, weight 0.69 ct. Samples with moderate colour change (c) and (d), upper row from left, five samples of Group 5, one of Group 6, lower row from left, three of Group 4, three of Group 2; diameter of the lower right sample 4.5 mm, weight 0.44 ct.Garnets with strong colour change (e) and (f), upper row four samples of Group 1, lower row from left, four of Group 3, one of Group 5; diameter of the lower right sample 3.7 mm, weight 0.27 ct.Samples with very strong colour change (g) and (h), upper row four samples of Group 1, lower row three of Group 3; size of the upper right sample 4.4 x 5.0 mm, weight 0.48 ct.
Daylight
c
a
g
e
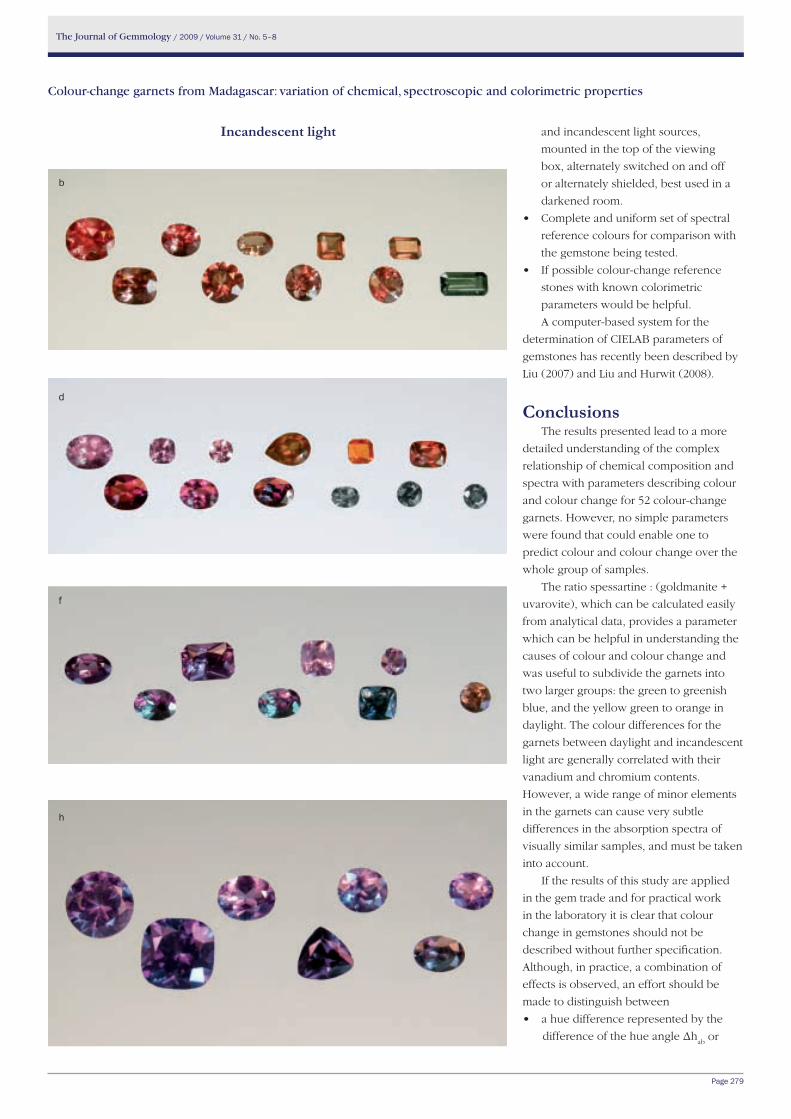
The Journal of Gemmology / 2009 / Volume 31 / No. 5–8
Page 279
Colour-change garnets from Madagascar: variation of chemical, spectroscopic and colorimetric properties
and incandescent light sources,
mounted in the top of the viewing
box, alternately switched on and off
or alternately shielded, best used in a
darkened room.
• Completeanduniformsetofspectral
reference colours for comparison with
the gemstone being tested.
• Ifpossiblecolour-changereference
stones with known colorimetric
parameters would be helpful.
A computer-based system for the
determination of CIELAB parameters of
gemstones has recently been described by
Liu (2007) and Liu and Hurwit (2008).
ConclusionsThe results presented lead to a more
detailed understanding of the complex
relationship of chemical composition and
spectra with parameters describing colour
and colour change for 52 colour-change
garnets. However, no simple parameters
were found that could enable one to
predict colour and colour change over the
whole group of samples.
The ratio spessartine : (goldmanite +
uvarovite), which can be calculated easily
from analytical data, provides a parameter
which can be helpful in understanding the
causes of colour and colour change and
was useful to subdivide the garnets into
two larger groups: the green to greenish
blue, and the yellow green to orange in
daylight. The colour differences for the
garnets between daylight and incandescent
light are generally correlated with their
vanadium and chromium contents.
However, a wide range of minor elements
in the garnets can cause very subtle
differences in the absorption spectra of
visually similar samples, and must be taken
into account.
If the results of this study are applied
in the gem trade and for practical work
in the laboratory it is clear that colour
change in gemstones should not be
described without further specification.
Although, in practice, a combination of
effects is observed, an effort should be
made to distinguish between
• ahuedifferencerepresentedbythe
difference of the hue angle Δhab
or
Incandescent light
b
d
f
h
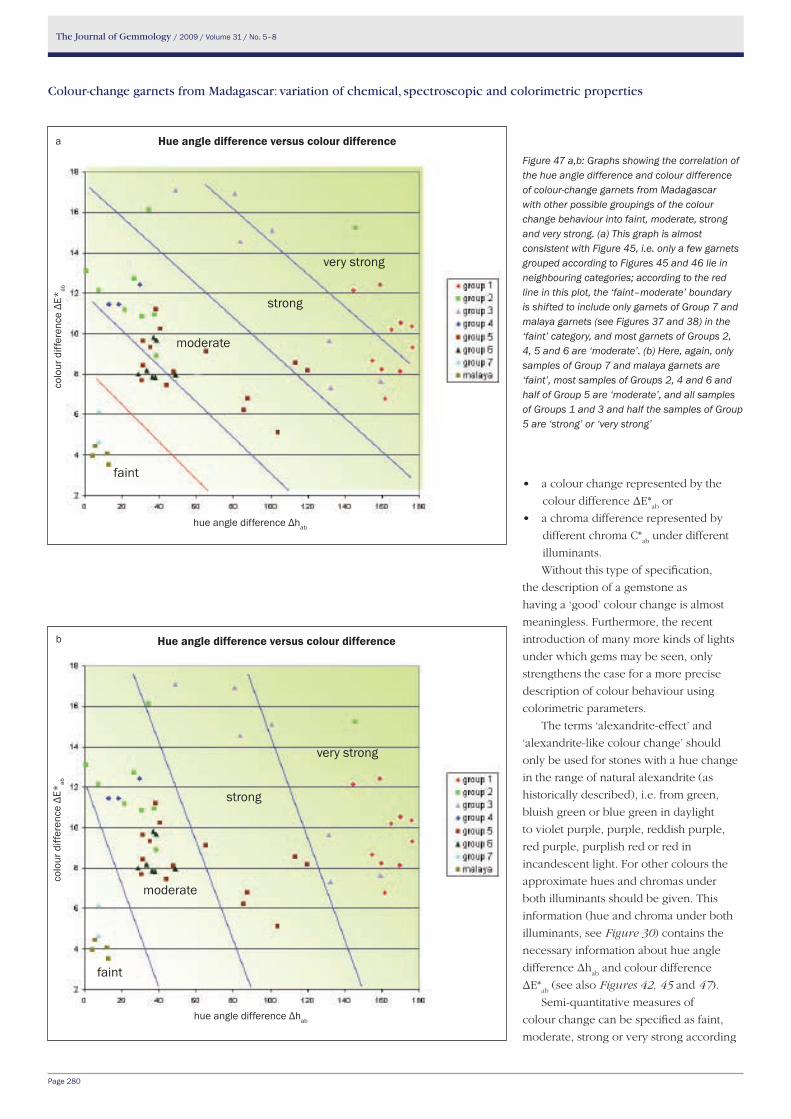
The Journal of Gemmology / 2009 / Volume 31 / No. 5–8
Page 280
Colour-change garnets from Madagascar: variation of chemical, spectroscopic and colorimetric properties
• acolourchangerepresentedbythe
colour difference ΔE*ab
or
• achromadifferencerepresentedby
different chroma C*ab
under different
illuminants.
Without this type of specification,
the description of a gemstone as
having a ‘good’ colour change is almost
meaningless. Furthermore, the recent
introduction of many more kinds of lights
under which gems may be seen, only
strengthens the case for a more precise
description of colour behaviour using
colorimetric parameters.
The terms ‘alexandrite-effect’ and
‘alexandrite-like colour change’ should
only be used for stones with a hue change
in the range of natural alexandrite (as
historically described), i.e. from green,
bluish green or blue green in daylight
to violet purple, purple, reddish purple,
red purple, purplish red or red in
incandescent light. For other colours the
approximate hues and chromas under
both illuminants should be given. This
information (hue and chroma under both
illuminants, see Figure 30) contains the
necessary information about hue angle
difference Δhab
and colour difference
ΔE*ab
(see also Figures 42, 45 and 47).
Semi-quantitative measures of
colour change can be specified as faint,
moderate, strong or very strong according
Figure 47 a,b: Graphs showing the correlation of the hue angle difference and colour difference of colour-change garnets from Madagascar with other possible groupings of the colour change behaviour into faint, moderate, strong and very strong. (a) This graph is almost consistent with Figure 45, i.e. only a few garnets grouped according to Figures 45 and 46 lie in neighbouring categories; according to the red line in this plot, the ‘faint–moderate’ boundary is shifted to include only garnets of Group 7 and malaya garnets (see Figures 37 and 38) in the ‘faint’ category, and most garnets of Groups 2, 4, 5 and 6 are ‘moderate’. (b) Here, again, only samples of Group 7 and malaya garnets are ‘faint’, most samples of Groups 2, 4 and 6 and half of Group 5 are ‘moderate’, and all samples of Groups 1 and 3 and half the samples of Group 5 are ‘strong’ or ‘very strong’
a
colo
ur d
iffer
ence
Δe*
ab
hue angle difference Δhab
Hue angle difference versus colour difference
strong
very strong
moderate
faint
b
colo
ur d
iffer
ence
Δe*
ab
hue angle difference Δhab
Hue angle difference versus colour difference
strong
very strong
moderate
faint
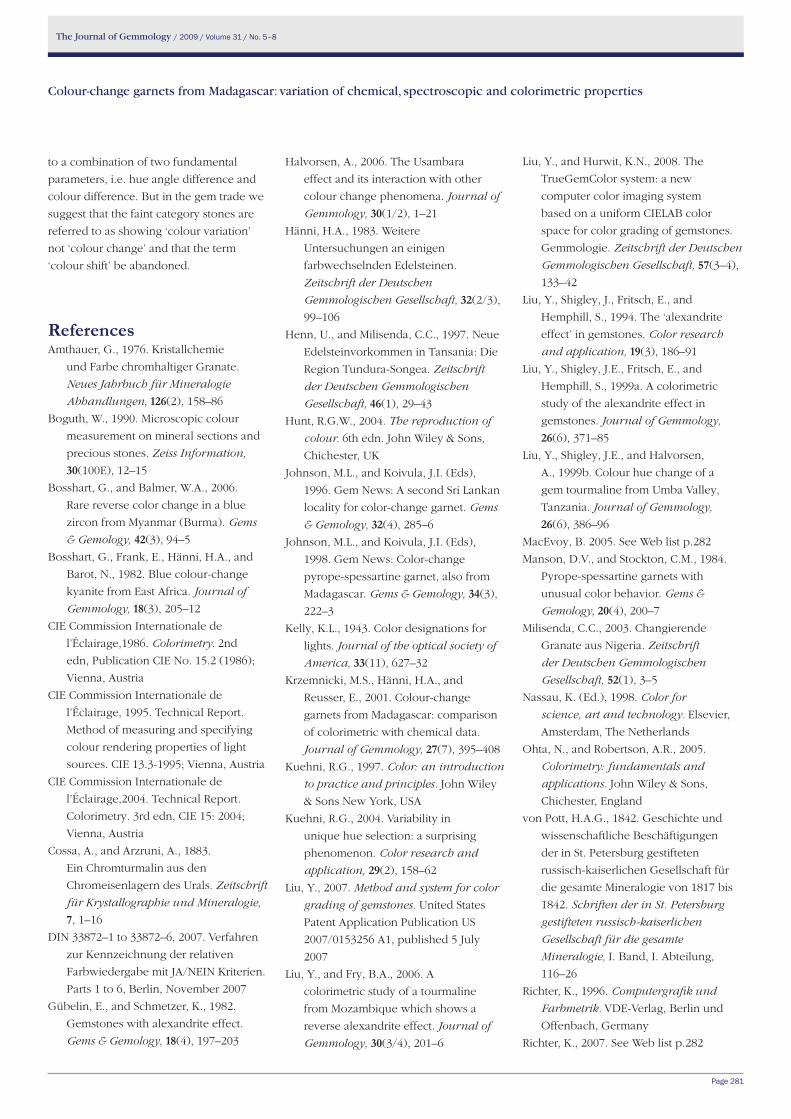
The Journal of Gemmology / 2009 / Volume 31 / No. 5–8
Page 281
Colour-change garnets from Madagascar: variation of chemical, spectroscopic and colorimetric properties
to a combination of two fundamental
parameters, i.e. hue angle difference and
colour difference. But in the gem trade we
suggest that the faint category stones are
referred to as showing ‘colour variation’
not ‘colour change’ and that the term
‘colour shift’ be abandoned.
ReferencesAmthauer, G., 1976. Kristallchemie
und Farbe chromhaltiger Granate.
Neues Jahrbuch für Mineralogie
Abhandlungen, 126(2), 158–86
Boguth, W., 1990. Microscopic colour
measurement on mineral sections and
precious stones. Zeiss Information,
30(100E), 12–15
Bosshart, G., and Balmer, W.A., 2006.
Rare reverse color change in a blue
zircon from Myanmar (Burma). Gems
& Gemology, 42(3), 94–5
Bosshart, G., Frank, E., Hänni, H.A., and
Barot, N., 1982. Blue colour-change
kyanite from East Africa. Journal of
Gemmology, 18(3), 205–12
CIE Commission Internationale de
l’Éclairage,1986. Colorimetry. 2nd
edn, Publication CIE No. 15.2 (1986);
Vienna, Austria
CIE Commission Internationale de
l’Éclairage, 1995. Technical Report.
Method of measuring and specifying
colour rendering properties of light
sources. CIE 13.3-1995; Vienna, Austria
CIE Commission Internationale de
l’Éclairage,2004. Technical Report.
Colorimetry. 3rd edn, CIE 15: 2004;
Vienna, Austria
Cossa, A., and Arzruni, A., 1883.
Ein Chromturmalin aus den
Chromeisenlagern des Urals. Zeitschrift
für Krystallographie und Mineralogie,
7, 1–16
DIN 33872–1 to 33872–6, 2007. Verfahren
zur Kennzeichnung der relativen
Farbwiedergabe mit JA/NEIN Kriterien.
Parts 1 to 6, Berlin, November 2007
Gübelin, E., and Schmetzer, K., 1982.
Gemstones with alexandrite effect.
Gems & Gemology, 18(4), 197–203
Halvorsen, A., 2006. The Usambara
effect and its interaction with other
colour change phenomena. Journal of
Gemmology, 30(1/2), 1–21
Hänni, H.A., 1983. Weitere
Untersuchungen an einigen
farbwechselnden Edelsteinen.
Zeitschrift der Deutschen
Gemmologischen Gesellschaft, 32(2/3),
99–106
Henn, U., and Milisenda, C.C., 1997. Neue
Edelsteinvorkommen in Tansania: Die
Region Tundura-Songea. Zeitschrift
der Deutschen Gemmologischen
Gesellschaft, 46(1), 29–43
Hunt, R.G.W., 2004. The reproduction of
colour. 6th edn. John Wiley & Sons,
Chichester, UK
Johnson, M.L., and Koivula, J.I. (Eds),
1996. Gem News: A second Sri Lankan
locality for color-change garnet. Gems
& Gemology, 32(4), 285–6
Johnson, M.L., and Koivula, J.I. (Eds),
1998. Gem News: Color-change
pyrope-spessartine garnet, also from
Madagascar. Gems & Gemology, 34(3),
222–3
Kelly, K.L., 1943. Color designations for
lights. Journal of the optical society of
America, 33(11), 627–32
Krzemnicki, M.S., Hänni, H.A., and
Reusser, E., 2001. Colour-change
garnets from Madagascar: comparison
of colorimetric with chemical data.
Journal of Gemmology, 27(7), 395–408
Kuehni, R.G., 1997. Color: an introduction
to practice and principles. John Wiley
& Sons New York, USA
Kuehni, R.G., 2004. Variability in
unique hue selection: a surprising
phenomenon. Color research and
application, 29(2), 158–62
Liu, Y., 2007. Method and system for color
grading of gemstones. United States
Patent Application Publication US
2007/0153256 A1, published 5 July
2007
Liu, Y., and Fry, B.A., 2006. A
colorimetric study of a tourmaline
from Mozambique which shows a
reverse alexandrite effect. Journal of
Gemmology, 30(3/4), 201–6
Liu, Y., and Hurwit, K.N., 2008. The
TrueGemColor system: a new
computer color imaging system
based on a uniform CIELAB color
space for color grading of gemstones.
Gemmologie. Zeitschrift der Deutschen
Gemmologischen Gesellschaft, 57(3–4),
133–42
Liu, Y., Shigley, J., Fritsch, E., and
Hemphill, S., 1994. The ‘alexandrite
effect’ in gemstones. Color research
and application, 19(3), 186–91
Liu, Y., Shigley, J.E., Fritsch, E., and
Hemphill, S., 1999a. A colorimetric
study of the alexandrite effect in
gemstones. Journal of Gemmology,
26(6), 371–85
Liu, Y., Shigley, J.E., and Halvorsen,
A., 1999b. Colour hue change of a
gem tourmaline from Umba Valley,
Tanzania. Journal of Gemmology,
26(6), 386–96
MacEvoy, B. 2005. See Web list p.282
Manson, D.V., and Stockton, C.M., 1984.
Pyrope-spessartine garnets with
unusual color behavior. Gems &
Gemology, 20(4), 200–7
Milisenda, C.C., 2003. Changierende
Granate aus Nigeria. Zeitschrift
der Deutschen Gemmologischen
Gesellschaft, 52(1), 3–5
Nassau, K. (Ed.), 1998. Color for
science, art and technology. Elsevier,
Amsterdam, The Netherlands
Ohta, N., and Robertson, A.R., 2005.
Colorimetry: fundamentals and
applications. John Wiley & Sons,
Chichester, England
von Pott, H.A.G., 1842. Geschichte und
wissenschaftliche Beschäftigungen
der in St. Petersburg gestifteten
russisch-kaiserlichen Gesellschaft für
die gesamte Mineralogie von 1817 bis
1842. Schriften der in St. Petersburg
gestifteten russisch-kaiserlichen
Gesellschaft für die gesamte
Mineralogie, I. Band, I. Abteilung,
116–26
Richter, K., 1996. Computergrafik und
Farbmetrik. VDE-Verlag, Berlin und
Offenbach, Germany
Richter, K., 2007. See Web list p.282
The Journal of Gemmology / 2009 / Volume 31 / No. 5–8
Page 282
Colour-change garnets from Madagascar: variation of chemical, spectroscopic and colorimetric properties
Richter, K., 2008a. See Web list
Richter, K., 2008b. Relative Elementary
Colour System (RECS). Eigenverlag,
Berlin, Germany
Robertson, A.R., 1994. Color order systems
– diversity and congruence. Vision, 6,
165–8
Schmetzer, K., Bank, H., and Gübelin,
E., 1980. The alexandrite effect
in minerals: chrysoberyl, garnet,
corundum, fluorite. Neues Jahrbuch
für Mineralogie Abhandlungen, 138(2),
147–64
Schmetzer, K., and Gübelin, E., 1980.
Alexandrite-like natural spinel from Sri
Lanka. Neues Jahrbuch für Mineralogie
Monatshefte, 1980(9), 428–32
Schmetzer, K., and Ottemann, J., 1979.
Kristallchemie und Farbe Vanadium-
haltiger Granate. Neues Jahrbuch für
Mineralogie Abhandlungen, 136(2),
146–68
Schmetzer, K., Hainschwang, T., Kiefert,
L., and Bernhardt, H.-J., 2001. Pink to
pinkish orange malaya garnets from
Bekily, Madagascar. Gems & Gemology,
37(4), 296–308
Schmetzer, K., Hainschwang, T.,
Bernhardt, H.-J., and Kiefert, L., 2002.
New chromium- and vanadium-
bearing garnets from Tranoroa,
Madagascar. Gems & Gemology, 38(2),
148–55
Schmetzer, K., and Bernhardt, H.-J., 1999.
Garnets from Madagascar with a color
change of blue-green to purple. Gems
& Gemology, 35(4), 196–201
Stockton, C.M., 1982. Two notable color-
change garnets. Gems & Gemology,
18(2), 100–1
Stockton, C.M., and Manson, D.V., 1985.
Unusual color-change garnet. Gems &
Gemology, 21(2), 116–17
Taran, M.N., Langer, K., Abs-Wurmbach, I.,
Frost, D.J., and Platonov, A.N., 2004.
Local relaxation around [6]Cr3+ in synthetic pyrope-knorringite
garnets, [8]Mg3[6](Al
1-xCr
x3+)
2[4]Si
3O
12, from
electronic absorption spectra. Physics
and Chemistry of Minerals, 31, 650–7
Taran, M.N., Langer, K., and Geiger,
C.A., 2002. Single-crystal electronic
absorption spectroscopy of synthetic
chromium-, cobalt-, and vanadium-
bearing pyropes at different
temperatures and pressures. Physics
and Chemistry of Minerals, 29, 362–8
Wyszecki, G., and Stiles, W.S., 1982.
Color Science: concepts and methods,
quantitative data and formulae. 2nd
Edn. John Wiley & Sons, New York,
USA
Zoysa, E.G., 1999/2000. Gem deposits
in Sri Lanka with special emphasis
on unusual types of gems (part
3). Journal of the Gemmological
Association of Hong Kong, 21, 38–43
web listMacEvoy, B., 2005. Handprint: color vision.
http://handprint.com/LS/CVS/color.
html (different chapters updated and
revised at different times)
Richter, K., 2007. Colour definition and
workflow for relative affin colour
image reproduction in offices. http://
www.ps.bam.de/BAMWS07E.PDF
Richter, K., 2008a. Colorimetric
supplement for DIN 33872–1 to –6.
http://www.ps.bam.de/D33872–AE.
IllustrationsUnless otherwise stated in the captions,
all figures (photographs and diagrams)
were produced by and are the copyright of
the authors.
the AuthorsK. SchmetzerD–85238 Petershausen, Germany
email: [email protected]
h.-J. Bernhardt ZEM, Institut für Geologie, Mineralogie und Geophysik, Ruhr-University,
D-44780 Bochum, Germany
email: [email protected]
G. BosshartCH-8810 Horgen, Switzerland
email: [email protected]
t. hainschwang GEMLAB Gemmological Laboratory, FL-9496 Balzers, Liechtenstein
email: [email protected]
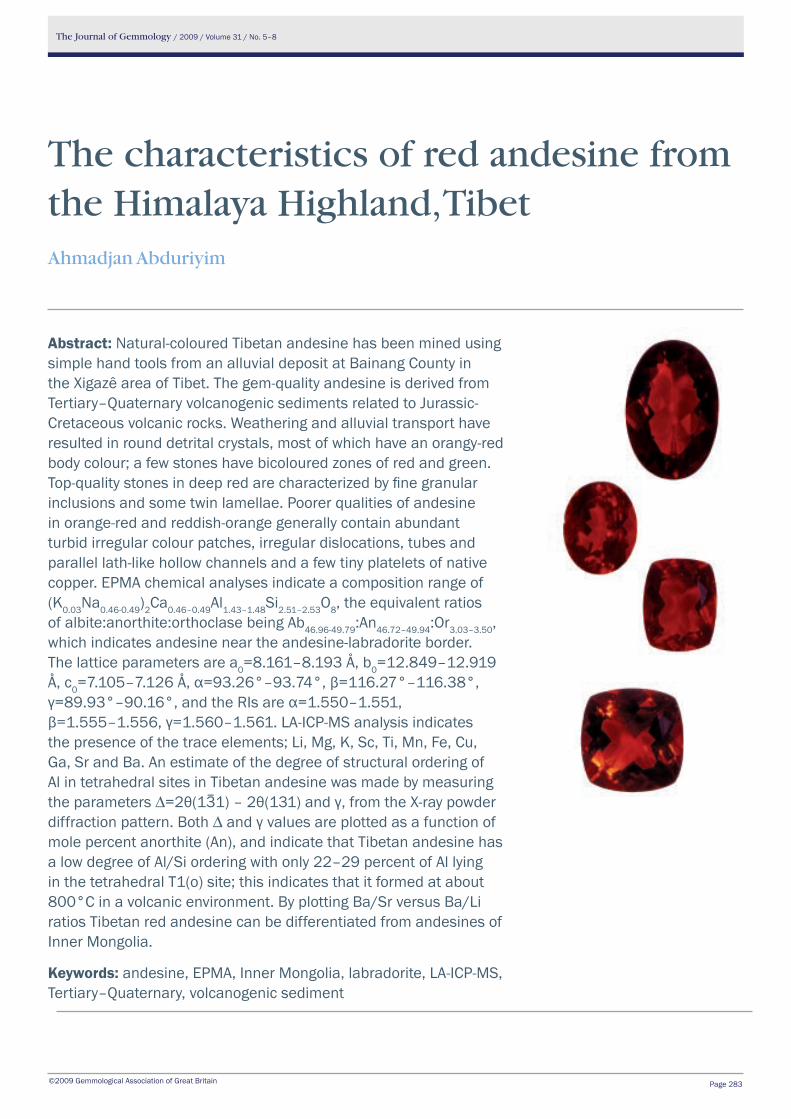
The Journal of Gemmology / 2009 / Volume 31 / No. 5–8
©2009 Gemmological Association of Great Britain Page 283
The characteristics of red andesine from the Himalaya Highland, TibetAhmadjan Abduriyim
Abstract: Natural-coloured Tibetan andesine has been mined using simple hand tools from an alluvial deposit at Bainang County in the Xigazê area of Tibet. The gem-quality andesine is derived from Tertiary–Quaternary volcanogenic sediments related to Jurassic-Cretaceous volcanic rocks. Weathering and alluvial transport have resulted in round detrital crystals, most of which have an orangy-red body colour; a few stones have bicoloured zones of red and green. Top-quality stones in deep red are characterized by fine granular inclusions and some twin lamellae. Poorer qualities of andesine in orange-red and reddish-orange generally contain abundant turbid irregular colour patches, irregular dislocations, tubes and parallel lath-like hollow channels and a few tiny platelets of native copper. EPMA chemical analyses indicate a composition range of (K0.03Na0.46-0.49)2Ca0.46–0.49Al1.43–1.48Si2.51–2.53O8, the equivalent ratios of albite:anorthite:orthoclase being Ab46.96-49.79:An46.72–49.94:Or3.03–3.50, which indicates andesine near the andesine-labradorite border. The lattice parameters are a0=8.161–8.193 Å, b0=12.849–12.919 Å, c0=7.105–7.126 Å, α=93.26°–93.74°, β=116.27°–116.38°, γ=89.93°–90.16°, and the RIs are α=1.550–1.551, β=1.555–1.556, γ=1.560–1.561. LA-ICP-MS analysis indicates the presence of the trace elements; Li, Mg, K, Sc, Ti, Mn, Fe, Cu, Ga, Sr and Ba. An estimate of the degree of structural ordering of Al in tetrahedral sites in Tibetan andesine was made by measuring the parameters ∆=2θ(13–1) – 2θ(131) and γ, from the X-ray powder diffraction pattern. Both ∆ and γ values are plotted as a function of mole percent anorthite (An), and indicate that Tibetan andesine has a low degree of Al/Si ordering with only 22–29 percent of Al lying in the tetrahedral T1(o) site; this indicates that it formed at about 800°C in a volcanic environment. By plotting Ba/Sr versus Ba/Li ratios Tibetan red andesine can be differentiated from andesines of Inner Mongolia.
Keywords: andesine, ePMA, Inner Mongolia, labradorite, LA-ICP-MS, Tertiary–Quaternary, volcanogenic sediment
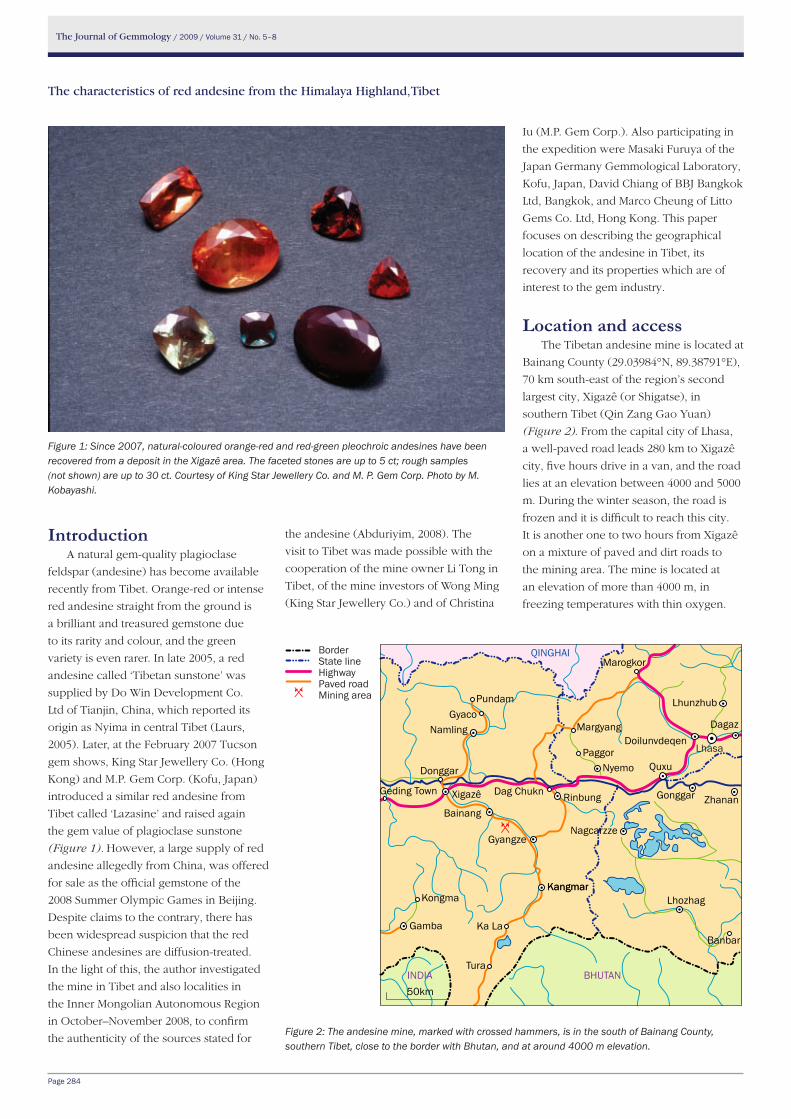
The Journal of Gemmology / 2009 / Volume 31 / No. 5–8
Page 284
The characteristics of red andesine from the Himalaya Highland, Tibet
Lhasa
Banbar
Bainang
Nyemo
Rinbung
KangmarKangmar
Gonggar
Quxu
DoilunvdeqenDagaz
GyacoPundam
Namling
Lhozhag
Gamba
Kongma
Lhunzhub
Xigazê
Ka La
Tura
Donggar
Margyang
Paggor
Geding Town
Marogkor
GyangzeNagcarzze
Zhanan
BHUTANINDIA
QINGHAI
50km
Dag Chukn
IntroductionA natural gem-quality plagioclase
feldspar (andesine) has become available
recently from Tibet. Orange-red or intense
red andesine straight from the ground is
a brilliant and treasured gemstone due
to its rarity and colour, and the green
variety is even rarer. In late 2005, a red
andesine called ‘Tibetan sunstone’ was
supplied by Do Win Development Co.
Ltd of Tianjin, China, which reported its
origin as Nyima in central Tibet (Laurs,
2005). Later, at the February 2007 Tucson
gem shows, King Star Jewellery Co. (Hong
Kong) and M.P. Gem Corp. (Kofu, Japan)
introduced a similar red andesine from
Tibet called ‘Lazasine’ and raised again
the gem value of plagioclase sunstone
(Figure 1). However, a large supply of red
andesine allegedly from China, was offered
for sale as the official gemstone of the
2008 Summer Olympic Games in Beijing.
Despite claims to the contrary, there has
been widespread suspicion that the red
Chinese andesines are diffusion-treated.
In the light of this, the author investigated
the mine in Tibet and also localities in
the Inner Mongolian Autonomous Region
in October–November 2008, to confirm
the authenticity of the sources stated for
Figure 1: Since 2007, natural-coloured orange-red and red-green pleochroic andesines have been recovered from a deposit in the Xigazê area. The faceted stones are up to 5 ct; rough samples (not shown) are up to 30 ct. Courtesy of King Star Jewellery Co. and M. P. Gem Corp. Photo by M. Kobayashi.
Figure 2: The andesine mine, marked with crossed hammers, is in the south of Bainang County, southern Tibet, close to the border with Bhutan, and at around 4000 m elevation.
BorderState lineHighwayPaved roadMining area
the andesine (Abduriyim, 2008). The
visit to Tibet was made possible with the
cooperation of the mine owner Li Tong in
Tibet, of the mine investors of Wong Ming
(King Star Jewellery Co.) and of Christina
Iu (M.P. Gem Corp.). Also participating in
the expedition were Masaki Furuya of the
Japan Germany Gemmological Laboratory,
Kofu, Japan, David Chiang of BBJ Bangkok
Ltd, Bangkok, and Marco Cheung of Litto
Gems Co. Ltd, Hong Kong. This paper
focuses on describing the geographical
location of the andesine in Tibet, its
recovery and its properties which are of
interest to the gem industry.
location and accessThe Tibetan andesine mine is located at
Bainang County (29.03984°N, 89.38791°E),
70 km south-east of the region’s second
largest city, Xigazê (or Shigatse), in
southern Tibet (Qin Zang Gao Yuan)
(Figure 2). From the capital city of Lhasa,
a well-paved road leads 280 km to Xigazê
city, five hours drive in a van, and the road
lies at an elevation between 4000 and 5000
m. During the winter season, the road is
frozen and it is difficult to reach this city.
It is another one to two hours from Xigazê
on a mixture of paved and dirt roads to
the mining area. The mine is located at
an elevation of more than 4000 m, in
freezing temperatures with thin oxygen.
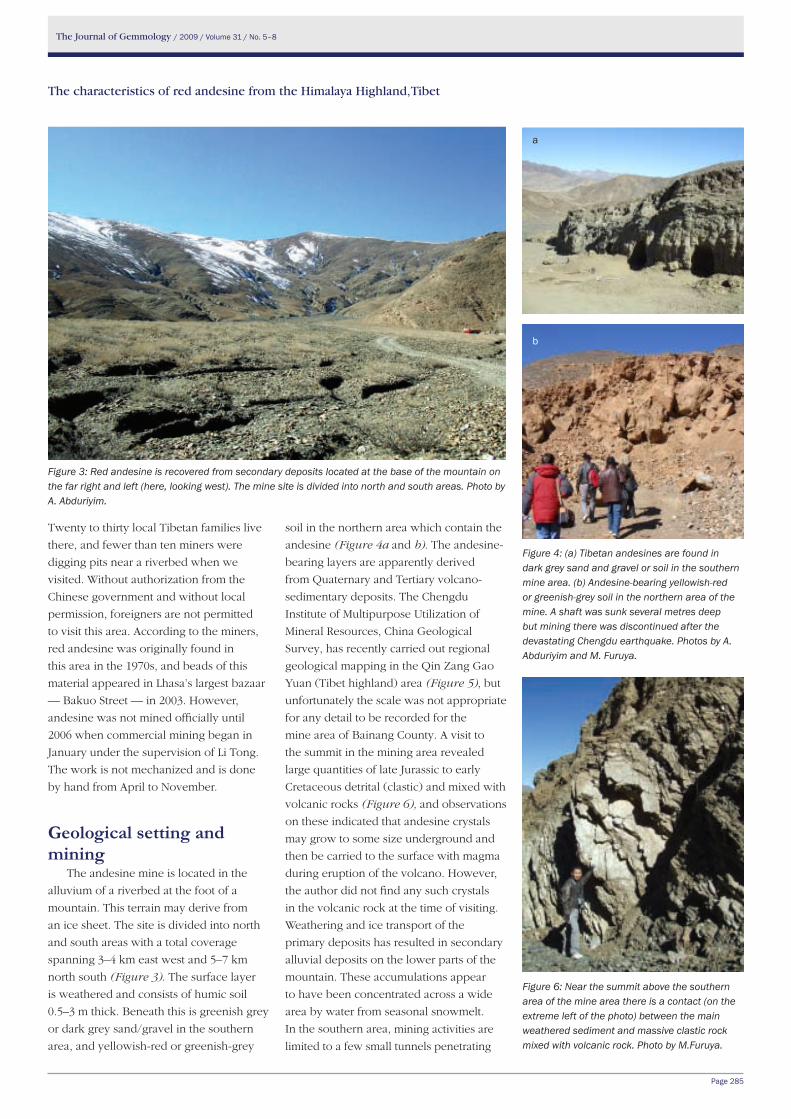
The Journal of Gemmology / 2009 / Volume 31 / No. 5–8
Page 285
The characteristics of red andesine from the Himalaya Highland, Tibet
Figure 4: (a) Tibetan andesines are found in dark grey sand and gravel or soil in the southern mine area. (b) Andesine-bearing yellowish-red or greenish-grey soil in the northern area of the mine. A shaft was sunk several metres deep but mining there was discontinued after the devastating Chengdu earthquake. Photos by A. Abduriyim and M. Furuya.
Figure 3: Red andesine is recovered from secondary deposits located at the base of the mountain on the far right and left (here, looking west). The mine site is divided into north and south areas. Photo by A. Abduriyim.
Figure 6: Near the summit above the southern area of the mine area there is a contact (on the extreme left of the photo) between the main weathered sediment and massive clastic rock mixed with volcanic rock. Photo by M.Furuya.
Twenty to thirty local Tibetan families live
there, and fewer than ten miners were
digging pits near a riverbed when we
visited. Without authorization from the
Chinese government and without local
permission, foreigners are not permitted
to visit this area. According to the miners,
red andesine was originally found in
this area in the 1970s, and beads of this
material appeared in Lhasa’s largest bazaar
— Bakuo Street — in 2003. However,
andesine was not mined officially until
2006 when commercial mining began in
January under the supervision of Li Tong.
The work is not mechanized and is done
by hand from April to November.
Geological setting and mining
The andesine mine is located in the
alluvium of a riverbed at the foot of a
mountain. This terrain may derive from
an ice sheet. The site is divided into north
and south areas with a total coverage
spanning 3–4 km east west and 5–7 km
north south (Figure 3). The surface layer
is weathered and consists of humic soil
0.5–3 m thick. Beneath this is greenish grey
or dark grey sand/gravel in the southern
area, and yellowish-red or greenish-grey
soil in the northern area which contain the
andesine (Figure 4a and b). The andesine-
bearing layers are apparently derived
from Quaternary and Tertiary volcano-
sedimentary deposits. The Chengdu
Institute of Multipurpose Utilization of
Mineral Resources, China Geological
Survey, has recently carried out regional
geological mapping in the Qin Zang Gao
Yuan (Tibet highland) area (Figure 5), but
unfortunately the scale was not appropriate
for any detail to be recorded for the
mine area of Bainang County. A visit to
the summit in the mining area revealed
large quantities of late Jurassic to early
Cretaceous detrital (clastic) and mixed with
volcanic rocks (Figure 6), and observations
on these indicated that andesine crystals
may grow to some size underground and
then be carried to the surface with magma
during eruption of the volcano. However,
the author did not find any such crystals
in the volcanic rock at the time of visiting.
Weathering and ice transport of the
primary deposits has resulted in secondary
alluvial deposits on the lower parts of the
mountain. These accumulations appear
to have been concentrated across a wide
area by water from seasonal snowmelt.
In the southern area, mining activities are
limited to a few small tunnels penetrating
a
b
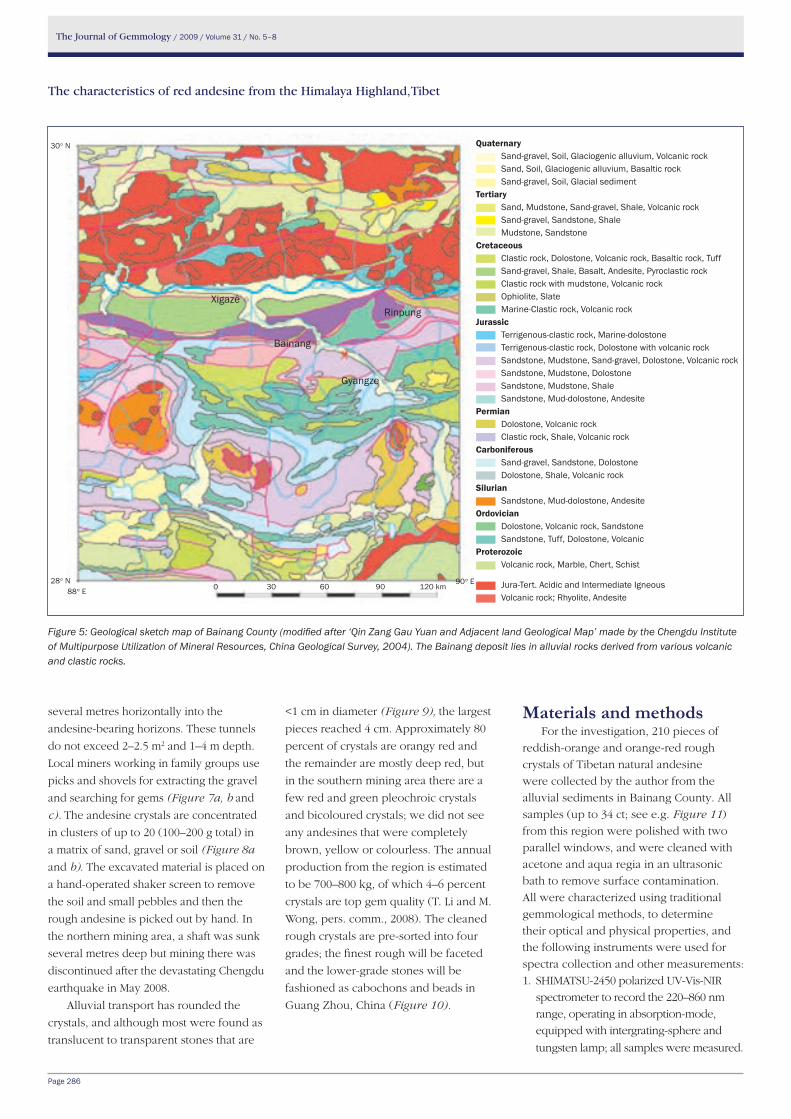
The Journal of Gemmology / 2009 / Volume 31 / No. 5–8
Page 286
The characteristics of red andesine from the Himalaya Highland, Tibet
Quaternary Sand-gravel, Soil, Glaciogenic alluvium, Volcanic rock Sand, Soil, Glaciogenic alluvium, Basaltic rock Sand-gravel, Soil, Glacial sedimentTertiary Sand, Mudstone, Sand-gravel, Shale, Volcanic rock Sand-gravel, Sandstone, Shale Mudstone, SandstoneCretaceous Clastic rock, Dolostone, Volcanic rock, Basaltic rock, Tuff Sand-gravel, Shale, Basalt, Andesite, Pyroclastic rock Clastic rock with mudstone, Volcanic rock Ophiolite, Slate Marine-Clastic rock, Volcanic rockJurassic Terrigenous-clastic rock, Marine-dolostone Terrigenous-clastic rock, Dolostone with volcanic rock Sandstone, Mudstone, Sand-gravel, Dolostone, Volcanic rock Sandstone, Mudstone, Dolostone Sandstone, Mudstone, Shale Sandstone, Mud-dolostone, AndesitePermian Dolostone, Volcanic rock Clastic rock, Shale, Volcanic rockCarboniferous Sand-gravel, Sandstone, Dolostone Dolostone, Shale, Volcanic rock Silurian Sandstone, Mud-dolostone, AndesiteOrdovician Dolostone, Volcanic rock, Sandstone Sandstone, Tuff, Dolostone, VolcanicProterozoic Volcanic rock, Marble, Chert, Schist
Jura-Tert. Acidic and Intermediate Igneous Volcanic rock; Rhyolite, Andesite
Figure 5: Geological sketch map of Bainang County (modified after ‘Qin Zang Gau Yuan and Adjacent land Geological Map’ made by the Chengdu Institute of Multipurpose Utilization of Mineral Resources, China Geological Survey, 2004). The Bainang deposit lies in alluvial rocks derived from various volcanic and clastic rocks.
several metres horizontally into the
andesine-bearing horizons. These tunnels
do not exceed 2–2.5 m2 and 1–4 m depth.
Local miners working in family groups use
picks and shovels for extracting the gravel
and searching for gems (Figure 7a, b and
c). The andesine crystals are concentrated
in clusters of up to 20 (100–200 g total) in
a matrix of sand, gravel or soil (Figure 8a
and b). The excavated material is placed on
a hand-operated shaker screen to remove
the soil and small pebbles and then the
rough andesine is picked out by hand. In
the northern mining area, a shaft was sunk
several metres deep but mining there was
discontinued after the devastating Chengdu
earthquake in May 2008.
Alluvial transport has rounded the
crystals, and although most were found as
translucent to transparent stones that are
<1 cm in diameter (Figure 9), the largest
pieces reached 4 cm. Approximately 80
percent of crystals are orangy red and
the remainder are mostly deep red, but
in the southern mining area there are a
few red and green pleochroic crystals
and bicoloured crystals; we did not see
any andesines that were completely
brown, yellow or colourless. The annual
production from the region is estimated
to be 700–800 kg, of which 4–6 percent
crystals are top gem quality (T. Li and M.
Wong, pers. comm., 2008). The cleaned
rough crystals are pre-sorted into four
grades; the finest rough will be faceted
and the lower-grade stones will be
fashioned as cabochons and beads in
Guang Zhou, China (Figure 10).
Materials and methodsFor the investigation, 210 pieces of
reddish-orange and orange-red rough
crystals of Tibetan natural andesine
were collected by the author from the
alluvial sediments in Bainang County. All
samples (up to 34 ct; see e.g. Figure 11)
from this region were polished with two
parallel windows, and were cleaned with
acetone and aqua regia in an ultrasonic
bath to remove surface contamination.
All were characterized using traditional
gemmological methods, to determine
their optical and physical properties, and
the following instruments were used for
spectra collection and other measurements:
1. SHIMATSU-2450 polarized UV-Vis-NIR
spectrometer to record the 220–860 nm
range, operating in absorption-mode,
equipped with intergrating-sphere and
tungsten lamp; all samples were measured.
Bainang
XigazêRinpung
Gyangze
30° N
28° N88° E
90° E0 30 60 90 120 km
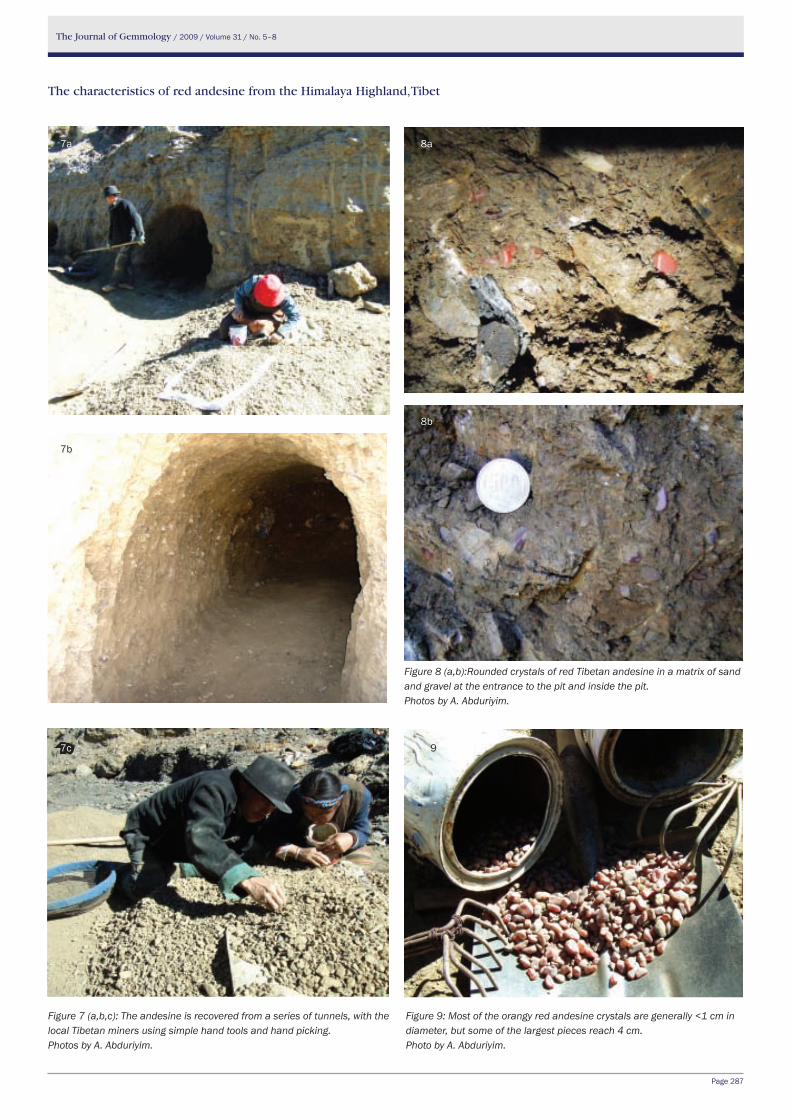
The Journal of Gemmology / 2009 / Volume 31 / No. 5–8
Page 287
The characteristics of red andesine from the Himalaya Highland, Tibet
Figure 7 (a,b,c): The andesine is recovered from a series of tunnels, with the local Tibetan miners using simple hand tools and hand picking. Photos by A. Abduriyim.
Figure 8 (a,b):Rounded crystals of red Tibetan andesine in a matrix of sand and gravel at the entrance to the pit and inside the pit. Photos by A. Abduriyim.
Figure 9: Most of the orangy red andesine crystals are generally <1 cm in diameter, but some of the largest pieces reach 4 cm. Photo by A. Abduriyim.
8b
8a7a
7c
7b
9
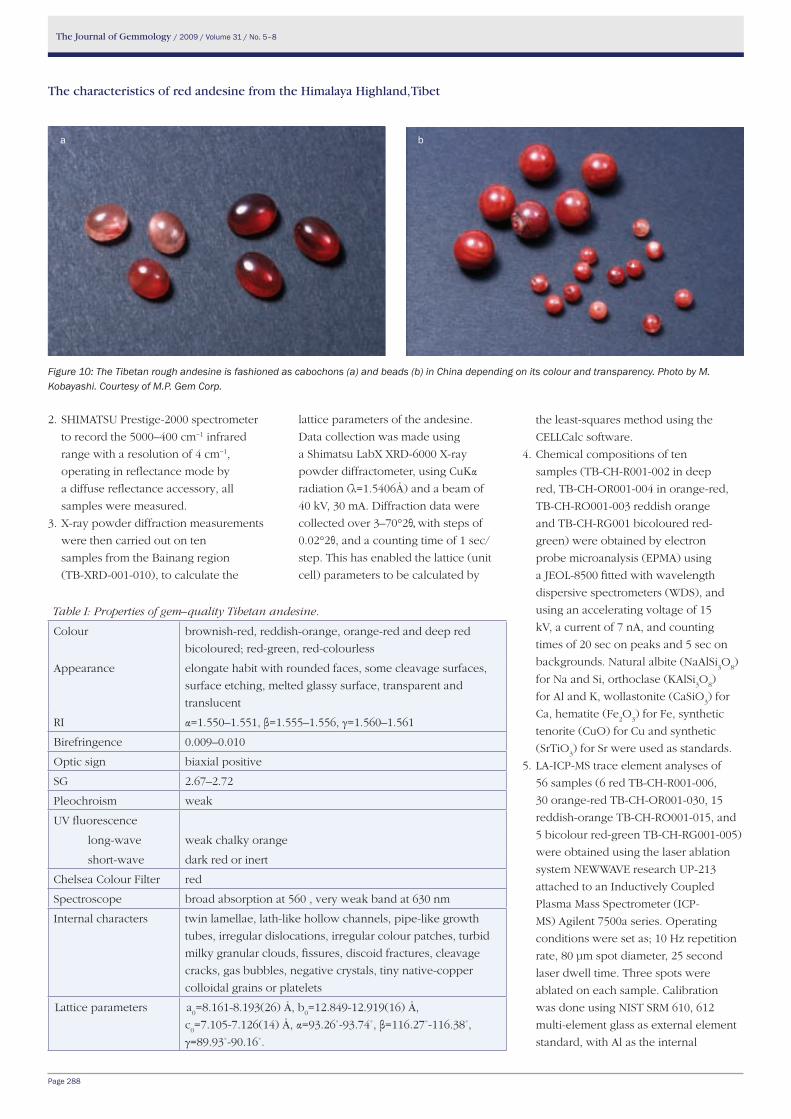
The Journal of Gemmology / 2009 / Volume 31 / No. 5–8
Page 288
The characteristics of red andesine from the Himalaya Highland, Tibet
2. SHIMATSU Prestige-2000 spectrometer
to record the 5000–400 cm−1 infrared
range with a resolution of 4 cm−1,
operating in reflectance mode by
a diffuse reflectance accessory, all
samples were measured.
3. X-ray powder diffraction measurements
were then carried out on ten
samples from the Bainang region
(TB-XRD-001-010), to calculate the
lattice parameters of the andesine.
Data collection was made using
a Shimatsu LabX XRD-6000 X-ray
powder diffractometer, using CuKα
radiation (λ=1.5406Å) and a beam of
40 kV, 30 mA. Diffraction data were
collected over 3–70°2θ, with steps of
0.02°2θ, and a counting time of 1 sec/
step. This has enabled the lattice (unit
cell) parameters to be calculated by
the least-squares method using the
CELLCalc software.
4. Chemical compositions of ten
samples (TB-CH-R001-002 in deep
red, TB-CH-OR001-004 in orange-red,
TB-CH-RO001-003 reddish orange
and TB-CH-RG001 bicoloured red-
green) were obtained by electron
probe microanalysis (EPMA) using
a JEOL-8500 fitted with wavelength
dispersive spectrometers (WDS), and
using an accelerating voltage of 15
kV, a current of 7 nA, and counting
times of 20 sec on peaks and 5 sec on
backgrounds. Natural albite (NaAlSi3O
8)
for Na and Si, orthoclase (KAlSi3O
8)
for Al and K, wollastonite (CaSiO3) for
Ca, hematite (Fe2O
3) for Fe, synthetic
tenorite (CuO) for Cu and synthetic
(SrTiO3) for Sr were used as standards.
5. LA-ICP-MS trace element analyses of
56 samples (6 red TB-CH-R001-006,
30 orange-red TB-CH-OR001-030, 15
reddish-orange TB-CH-RO001-015, and
5 bicolour red-green TB-CH-RG001-005)
were obtained using the laser ablation
system NEWWAVE research UP-213
attached to an Inductively Coupled
Plasma Mass Spectrometer (ICP-
MS) Agilent 7500a series. Operating
conditions were set as; 10 Hz repetition
rate, 80 μm spot diameter, 25 second
laser dwell time. Three spots were
ablated on each sample. Calibration
was done using NIST SRM 610, 612
multi-element glass as external element
standard, with Al as the internal
Figure 10: The Tibetan rough andesine is fashioned as cabochons (a) and beads (b) in China depending on its colour and transparency. Photo by M. Kobayashi. Courtesy of M.P. Gem Corp.
Table I: Properties of gem–quality Tibetan andesine.
Colour brownish-red, reddish-orange, orange-red and deep red
bicoloured; red-green, red-colourless
Appearance elongate habit with rounded faces, some cleavage surfaces,
surface etching, melted glassy surface, transparent and
translucent
RI α=1.550–1.551, β=1.555–1.556, γ=1.560–1.561
Birefringence 0.009–0.010
Optic sign biaxial positive
SG 2.67–2.72
Pleochroism weak
UV fluorescence
long-wave weak chalky orange
short-wave dark red or inert
Chelsea Colour Filter red
Spectroscope broad absorption at 560 , very weak band at 630 nm
Internal characters twin lamellae, lath-like hollow channels, pipe-like growth
tubes, irregular dislocations, irregular colour patches, turbid
milky granular clouds, fissures, discoid fractures, cleavage
cracks, gas bubbles, negative crystals, tiny native-copper
colloidal grains or platelets
Lattice parameters a0=8.161-8.193(26) Å, b
0=12.849-12.919(16) Å,
c0=7.105-7.126(14) Å, α=93.26˚-93.74˚, β=116.27˚-116.38˚,
γ=89.93˚-90.16˚.
a b
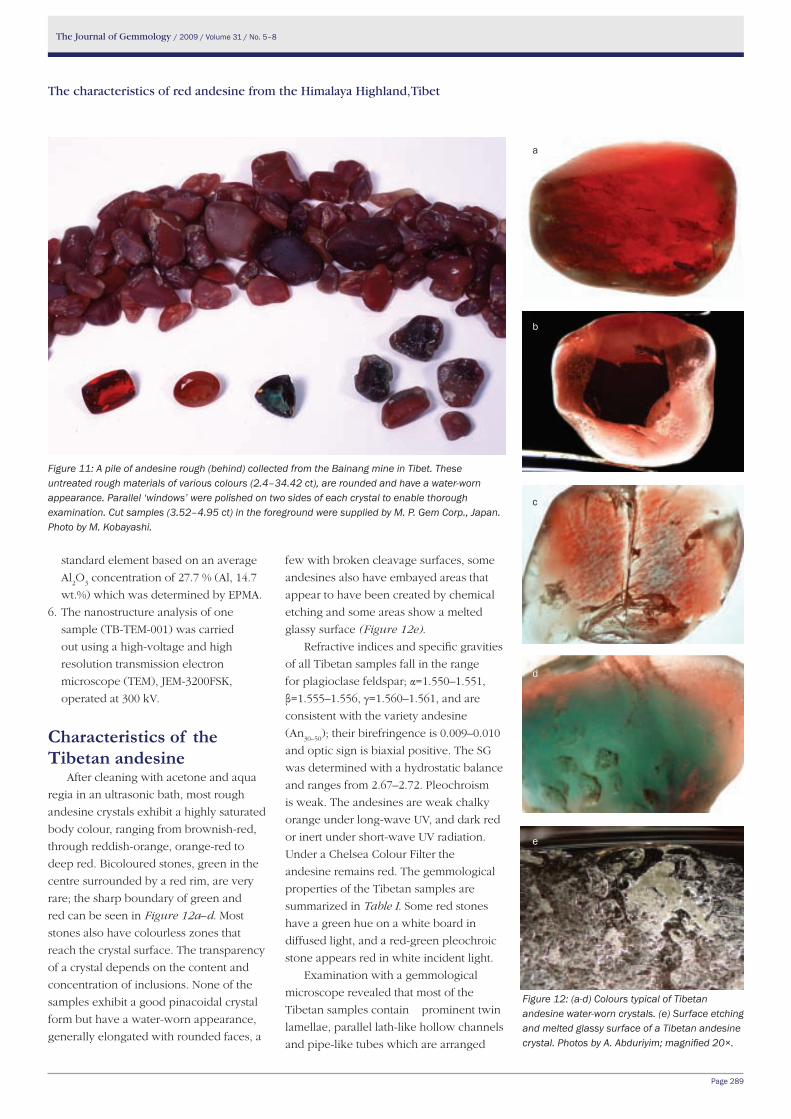
The Journal of Gemmology / 2009 / Volume 31 / No. 5–8
Page 289
The characteristics of red andesine from the Himalaya Highland, Tibet
standard element based on an average
Al2O
3 concentration of 27.7 % (Al, 14.7
wt.%) which was determined by EPMA.
6. The nanostructure analysis of one
sample (TB-TEM-001) was carried
out using a high-voltage and high
resolution transmission electron
microscope (TEM), JEM-3200FSK,
operated at 300 kV.
Characteristics of the tibetan andesine
After cleaning with acetone and aqua
regia in an ultrasonic bath, most rough
andesine crystals exhibit a highly saturated
body colour, ranging from brownish-red,
through reddish-orange, orange-red to
deep red. Bicoloured stones, green in the
centre surrounded by a red rim, are very
rare; the sharp boundary of green and
red can be seen in Figure 12a–d. Most
stones also have colourless zones that
reach the crystal surface. The transparency
of a crystal depends on the content and
concentration of inclusions. None of the
samples exhibit a good pinacoidal crystal
form but have a water-worn appearance,
generally elongated with rounded faces, a
few with broken cleavage surfaces, some
andesines also have embayed areas that
appear to have been created by chemical
etching and some areas show a melted
glassy surface (Figure 12e).
Refractive indices and specific gravities
of all Tibetan samples fall in the range
for plagioclase feldspar; α=1.550–1.551,
β=1.555–1.556, γ=1.560–1.561, and are
consistent with the variety andesine
(An30–50
); their birefringence is 0.009–0.010
and optic sign is biaxial positive. The SG
was determined with a hydrostatic balance
and ranges from 2.67–2.72. Pleochroism
is weak. The andesines are weak chalky
orange under long-wave UV, and dark red
or inert under short-wave UV radiation.
Under a Chelsea Colour Filter the
andesine remains red. The gemmological
properties of the Tibetan samples are
summarized in Table I. Some red stones
have a green hue on a white board in
diffused light, and a red-green pleochroic
stone appears red in white incident light.
Examination with a gemmological
microscope revealed that most of the
Tibetan samples contain prominent twin
lamellae, parallel lath-like hollow channels
and pipe-like tubes which are arranged
Figure 11: A pile of andesine rough (behind) collected from the Bainang mine in Tibet. These untreated rough materials of various colours (2.4–34.42 ct), are rounded and have a water-worn appearance. Parallel ‘windows’ were polished on two sides of each crystal to enable thorough examination. Cut samples (3.52–4.95 ct) in the foreground were supplied by M. P. Gem Corp., Japan. Photo by M. Kobayashi.
Figure 12: (a-d) Colours typical of Tibetan andesine water-worn crystals. (e) Surface etching and melted glassy surface of a Tibetan andesine crystal. Photos by A. Abduriyim; magnified 20×.
d
c
b
a
e
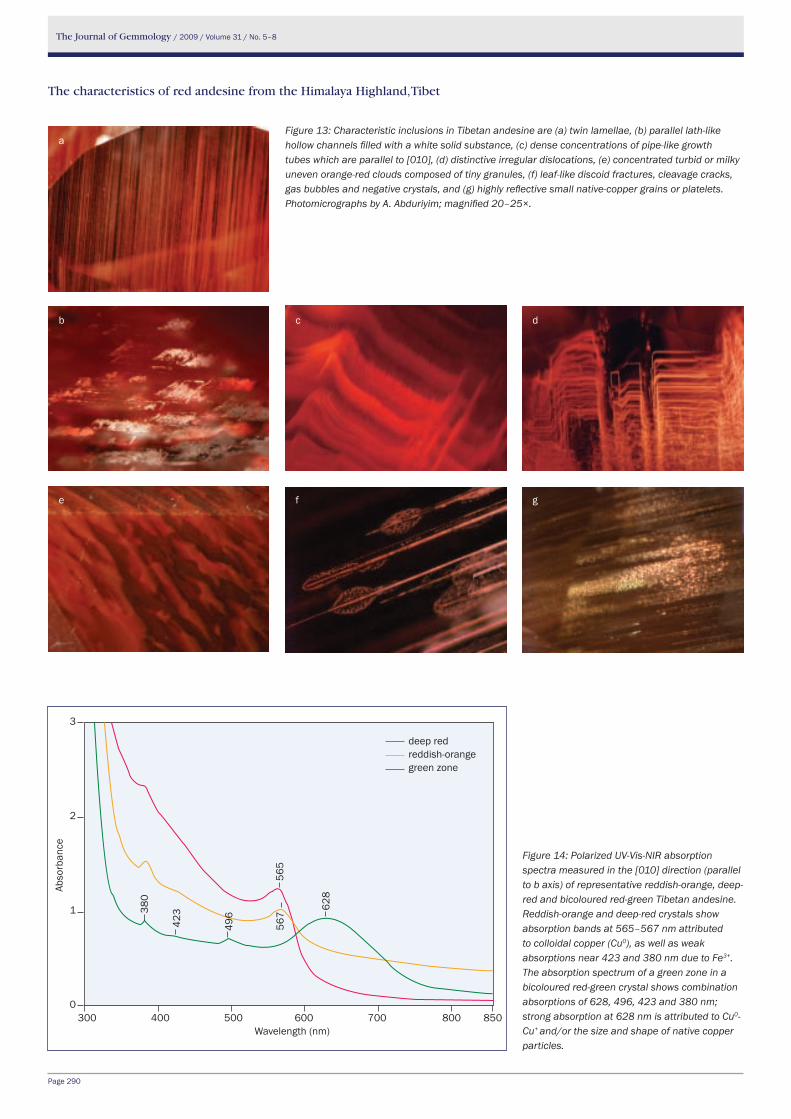
The Journal of Gemmology / 2009 / Volume 31 / No. 5–8
Page 290
The characteristics of red andesine from the Himalaya Highland, Tibet
Figure 14: Polarized UV-Vis-NIR absorption spectra measured in the [010] direction (parallel to b axis) of representative reddish-orange, deep-red and bicoloured red-green Tibetan andesine. Reddish-orange and deep-red crystals show absorption bands at 565–567 nm attributed to colloidal copper (Cu0), as well as weak absorptions near 423 and 380 nm due to Fe3+. The absorption spectrum of a green zone in a bicoloured red-green crystal shows combination absorptions of 628, 496, 423 and 380 nm; strong absorption at 628 nm is attributed to Cu0-Cu+ and/or the size and shape of native copper particles.
Figure 13: Characteristic inclusions in Tibetan andesine are (a) twin lamellae, (b) parallel lath-like hollow channels filled with a white solid substance, (c) dense concentrations of pipe-like growth tubes which are parallel to [010], (d) distinctive irregular dislocations, (e) concentrated turbid or milky uneven orange-red clouds composed of tiny granules, (f) leaf-like discoid fractures, cleavage cracks, gas bubbles and negative crystals, and (g) highly reflective small native-copper grains or platelets. Photomicrographs by A. Abduriyim; magnified 20–25×.
300 400 500 600 700 800 850Wavelength (nm)
3
2
1
0
Abso
rban
ce
deep redreddish-orangegreen zone
380
423 62
8
565
567
496
g
d
fe
cb
a
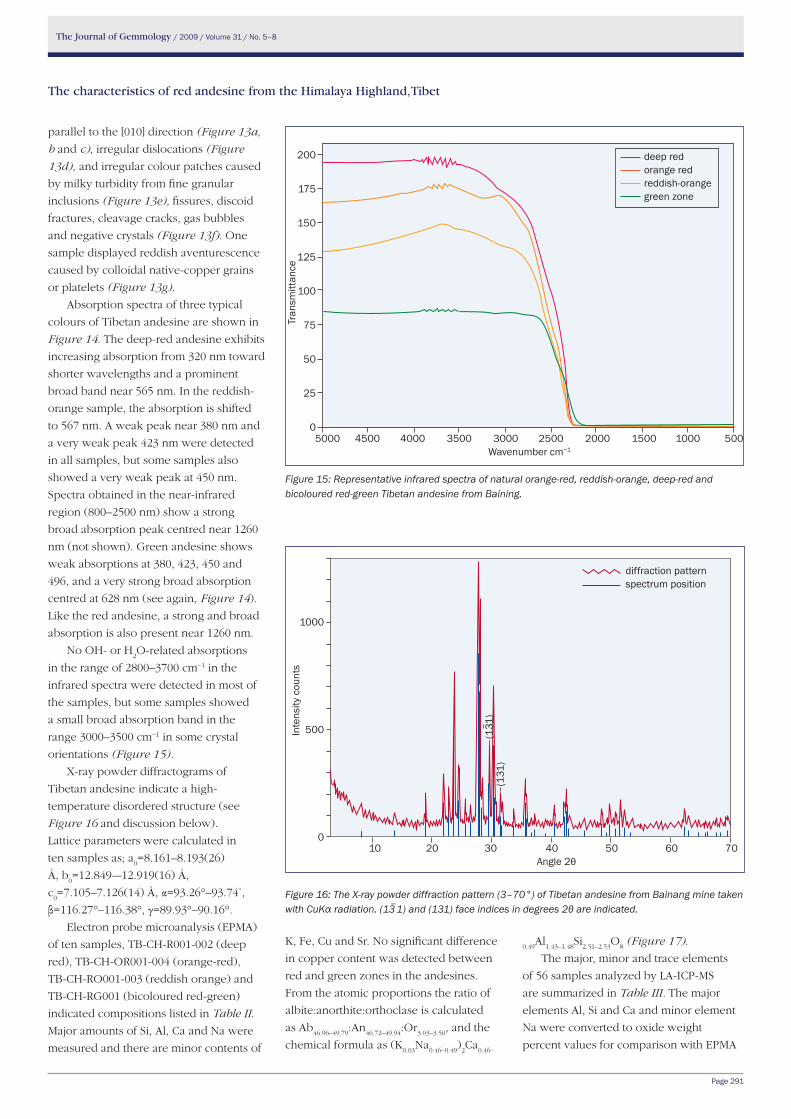
The Journal of Gemmology / 2009 / Volume 31 / No. 5–8
Page 291
The characteristics of red andesine from the Himalaya Highland, Tibet
parallel to the [010] direction (Figure 13a,
b and c), irregular dislocations (Figure
13d), and irregular colour patches caused
by milky turbidity from fine granular
inclusions (Figure 13e), fissures, discoid
fractures, cleavage cracks, gas bubbles
and negative crystals (Figure 13f). One
sample displayed reddish aventurescence
caused by colloidal native-copper grains
or platelets (Figure 13g).
Absorption spectra of three typical
colours of Tibetan andesine are shown in
Figure 14. The deep-red andesine exhibits
increasing absorption from 320 nm toward
shorter wavelengths and a prominent
broad band near 565 nm. In the reddish-
orange sample, the absorption is shifted
to 567 nm. A weak peak near 380 nm and
a very weak peak 423 nm were detected
in all samples, but some samples also
showed a very weak peak at 450 nm.
Spectra obtained in the near-infrared
region (800–2500 nm) show a strong
broad absorption peak centred near 1260
nm (not shown). Green andesine shows
weak absorptions at 380, 423, 450 and
496, and a very strong broad absorption
centred at 628 nm (see again, Figure 14).
Like the red andesine, a strong and broad
absorption is also present near 1260 nm.
No OH- or H2O-related absorptions
in the range of 2800–3700 cm−1 in the
infrared spectra were detected in most of
the samples, but some samples showed
a small broad absorption band in the
range 3000–3500 cm−1 in some crystal
orientations (Figure 15).
X-ray powder diffractograms of
Tibetan andesine indicate a high-
temperature disordered structure (see
Figure 16 and discussion below).
Lattice parameters were calculated in
ten samples as; a0=8.161–8.193(26)
Å, b0=12.849-–12.919(16) Å,
c0=7.105–7.126(14) Å, α=93.26°–93.74˚,
β=116.27°–116.38°, γ=89.93°–90.16°.
Electron probe microanalysis (EPMA)
of ten samples, TB-CH-R001-002 (deep
red), TB-CH-OR001-004 (orange-red),
TB-CH-RO001-003 (reddish orange) and
TB-CH-RG001 (bicoloured red-green)
indicated compositions listed in Table II.
Major amounts of Si, Al, Ca and Na were
measured and there are minor contents of
Figure 15: Representative infrared spectra of natural orange-red, reddish-orange, deep-red and bicoloured red-green Tibetan andesine from Baining.
Figure 16: The X-ray powder diffraction pattern (3–70°) of Tibetan andesine from Bainang mine taken with CuKα radiation. (13–1) and (131) face indices in degrees 2θ are indicated.
deep redorange redreddish-orangegreen zone
5000 4500 4000 3500 3000 2500 2000 1500 1000 500Wavenumber cm−1
Tran
smitt
ance
200
175
150
125
100
75
50
25
0
10 20 30 40 50 60 70Angle 2θ
1000
500
0
Inte
nsity
cou
nts
(131
)(1
3– 1)
diffraction patternspectrum position
K, Fe, Cu and Sr. No significant difference
in copper content was detected between
red and green zones in the andesines.
From the atomic proportions the ratio of
albite:anorthite:orthoclase is calculated
as Ab46.96–49.79
:An46.72–49.94
:Or3.03–3.50
, and the
chemical formula as (K0.03
Na0.46–0.49
)2Ca
0.46–
0.49Al
1.43–1.48Si
2.51–2.53O
8 (Figure 17).
The major, minor and trace elements
of 56 samples analyzed by LA-ICP-MS
are summarized in Table III. The major
elements Al, Si and Ca and minor element
Na were converted to oxide weight
percent values for comparison with EPMA
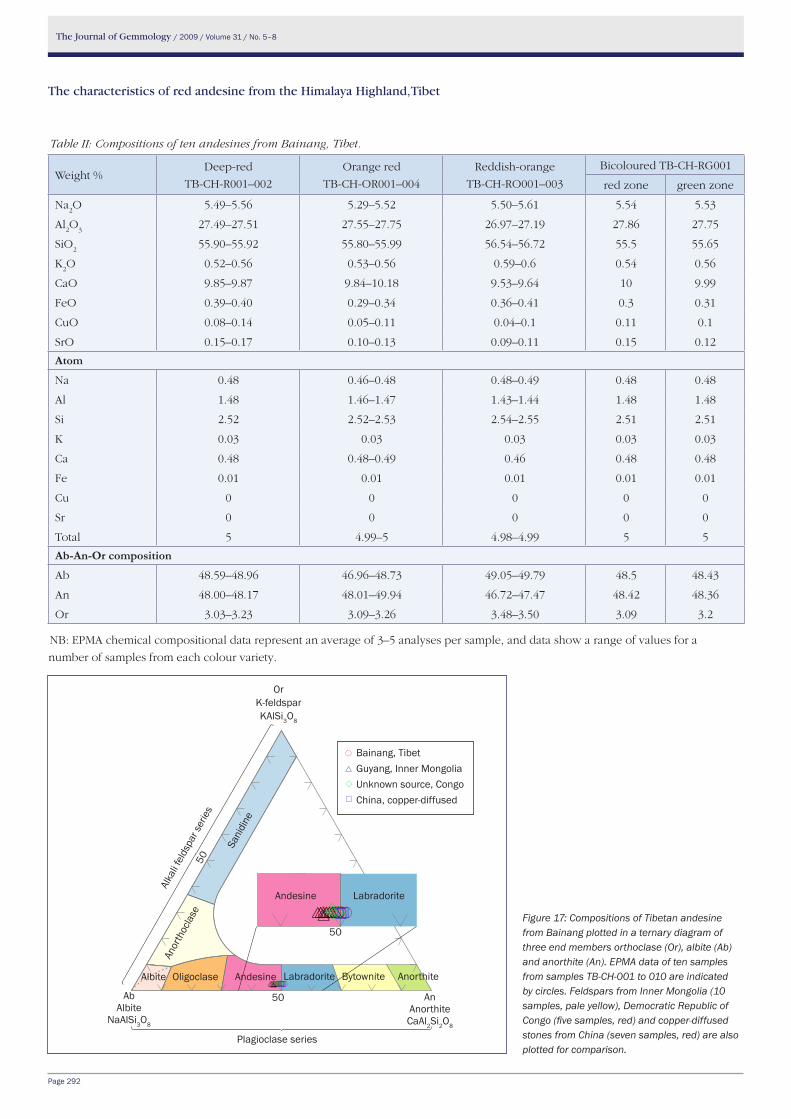
The Journal of Gemmology / 2009 / Volume 31 / No. 5–8
Page 292
The characteristics of red andesine from the Himalaya Highland, Tibet
Figure 17: Compositions of Tibetan andesine from Bainang plotted in a ternary diagram of three end members orthoclase (Or), albite (Ab) and anorthite (An). EPMA data of ten samples from samples TB-CH-001 to 010 are indicated by circles. Feldspars from Inner Mongolia (10 samples, pale yellow), Democratic Republic of Congo (five samples, red) and copper-diffused stones from China (seven samples, red) are also plotted for comparison.
Table II: Compositions of ten andesines from Bainang, Tibet.
Weight %Deep-red
TB-CH-R001–002
Orange red
TB-CH-OR001–004
Reddish-orange
TB-CH-RO001–003
Bicoloured TB-CH-RG001
red zone green zone
Na2O 5.49–5.56 5.29–5.52 5.50–5.61 5.54 5.53
Al2O
327.49–27.51 27.55–27.75 26.97–27.19 27.86 27.75
SiO2
55.90–55.92 55.80–55.99 56.54–56.72 55.5 55.65
K2O 0.52–0.56 0.53–0.56 0.59–0.6 0.54 0.56
CaO 9.85–9.87 9.84–10.18 9.53–9.64 10 9.99
FeO 0.39–0.40 0.29–0.34 0.36–0.41 0.3 0.31
CuO 0.08–0.14 0.05–0.11 0.04–0.1 0.11 0.1
SrO 0.15–0.17 0.10–0.13 0.09–0.11 0.15 0.12
Atom
Na 0.48 0.46–0.48 0.48–0.49 0.48 0.48
Al 1.48 1.46–1.47 1.43–1.44 1.48 1.48
Si 2.52 2.52–2.53 2.54–2.55 2.51 2.51
K 0.03 0.03 0.03 0.03 0.03
Ca 0.48 0.48–0.49 0.46 0.48 0.48
Fe 0.01 0.01 0.01 0.01 0.01
Cu 0 0 0 0 0
Sr 0 0 0 0 0
Total 5 4.99–5 4.98–4.99 5 5
Ab-An-or composition
Ab 48.59–48.96 46.96–48.73 49.05–49.79 48.5 48.43
An 48.00–48.17 48.01–49.94 46.72–47.47 48.42 48.36
Or 3.03–3.23 3.09–3.26 3.48–3.50 3.09 3.2
NB: EPMA chemical compositional data represent an average of 3–5 analyses per sample, and data show a range of values for a
number of samples from each colour variety.
○○○○○○○
○
△△△△△△△△
△
◇◇◇◇◇
◇
□
□□□
○○○○○○○△△△△△△△△◇◇◇◇◇□□□
OrK-feldsparKAlSi3O8
Plagioclase series
An AnorthiteCaAl2Si2O8
AbAlbite
NaAlSi3O8
Andesine Labradorite
50
50
Albite Oligoclase Andesine BytowniteLabradorite Anorthite
Anor
thoc
lase
Sani
dine
50
Alka
li fel
dspa
r ser
ies
Bainang, TibetGuyang, Inner MongoliaUnknown source, CongoChina, copper-diffused
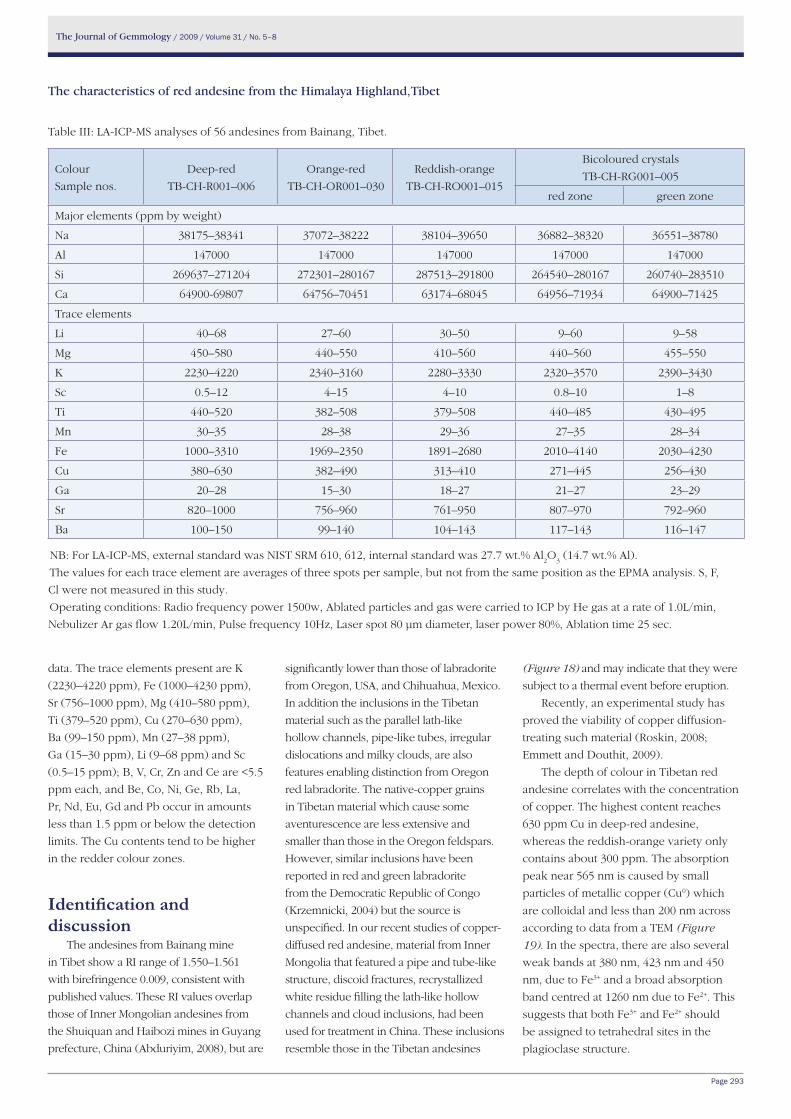
The Journal of Gemmology / 2009 / Volume 31 / No. 5–8
Page 293
The characteristics of red andesine from the Himalaya Highland, Tibet
data. The trace elements present are K
(2230–4220 ppm), Fe (1000–4230 ppm),
Sr (756–1000 ppm), Mg (410–580 ppm),
Ti (379–520 ppm), Cu (270–630 ppm),
Ba (99–150 ppm), Mn (27–38 ppm),
Ga (15–30 ppm), Li (9–68 ppm) and Sc
(0.5–15 ppm); B, V, Cr, Zn and Ce are <5.5
ppm each, and Be, Co, Ni, Ge, Rb, La,
Pr, Nd, Eu, Gd and Pb occur in amounts
less than 1.5 ppm or below the detection
limits. The Cu contents tend to be higher
in the redder colour zones.
Identification and discussion
The andesines from Bainang mine
in Tibet show a RI range of 1.550–1.561
with birefringence 0.009, consistent with
published values. These RI values overlap
those of Inner Mongolian andesines from
the Shuiquan and Haibozi mines in Guyang
prefecture, China (Abduriyim, 2008), but are
significantly lower than those of labradorite
from Oregon, USA, and Chihuahua, Mexico.
In addition the inclusions in the Tibetan
material such as the parallel lath-like
hollow channels, pipe-like tubes, irregular
dislocations and milky clouds, are also
features enabling distinction from Oregon
red labradorite. The native-copper grains
in Tibetan material which cause some
aventurescence are less extensive and
smaller than those in the Oregon feldspars.
However, similar inclusions have been
reported in red and green labradorite
from the Democratic Republic of Congo
(Krzemnicki, 2004) but the source is
unspecified. In our recent studies of copper-
diffused red andesine, material from Inner
Mongolia that featured a pipe and tube-like
structure, discoid fractures, recrystallized
white residue filling the lath-like hollow
channels and cloud inclusions, had been
used for treatment in China. These inclusions
resemble those in the Tibetan andesines
(Figure 18) and may indicate that they were
subject to a thermal event before eruption.
Recently, an experimental study has
proved the viability of copper diffusion-
treating such material (Roskin, 2008;
Emmett and Douthit, 2009).
The depth of colour in Tibetan red
andesine correlates with the concentration
of copper. The highest content reaches
630 ppm Cu in deep-red andesine,
whereas the reddish-orange variety only
contains about 300 ppm. The absorption
peak near 565 nm is caused by small
particles of metallic copper (Cu0) which
are colloidal and less than 200 nm across
according to data from a TEM (Figure
19). In the spectra, there are also several
weak bands at 380 nm, 423 nm and 450
nm, due to Fe3+ and a broad absorption
band centred at 1260 nm due to Fe2+. This
suggests that both Fe3+ and Fe2+ should
be assigned to tetrahedral sites in the
plagioclase structure.
Table III: LA-ICP-MS analyses of 56 andesines from Bainang, Tibet.
Colour
Sample nos.
Deep-red
TB-CH-R001–006
Orange-red
TB-CH-OR001–030
Reddish-orange
TB-CH-RO001–015
Bicoloured crystals
TB-CH-RG001–005
red zone green zone
Major elements (ppm by weight)
Na 38175–38341 37072–38222 38104–39650 36882–38320 36551–38780
Al 147000 147000 147000 147000 147000
Si 269637–271204 272301–280167 287513–291800 264540–280167 260740–283510
Ca 64900-69807 64756–70451 63174–68045 64956–71934 64900–71425
Trace elements
Li 40–68 27–60 30–50 9–60 9–58
Mg 450–580 440–550 410–560 440–560 455–550
K 2230–4220 2340–3160 2280–3330 2320–3570 2390–3430
Sc 0.5–12 4–15 4–10 0.8–10 1–8
Ti 440–520 382–508 379–508 440–485 430–495
Mn 30–35 28–38 29–36 27–35 28–34
Fe 1000–3310 1969–2350 1891–2680 2010–4140 2030–4230
Cu 380–630 382–490 313–410 271–445 256–430
Ga 20–28 15–30 18–27 21–27 23–29
Sr 820–1000 756–960 761–950 807–970 792–960
Ba 100–150 99–140 104–143 117–143 116–147
NB: For LA-ICP-MS, external standard was NIST SRM 610, 612, internal standard was 27.7 wt.% Al2O
3 (14.7 wt.% Al).
The values for each trace element are averages of three spots per sample, but not from the same position as the EPMA analysis. S, F,
Cl were not measured in this study.
Operating conditions: Radio frequency power 1500w, Ablated particles and gas were carried to ICP by He gas at a rate of 1.0L/min,
Nebulizer Ar gas flow 1.20L/min, Pulse frequency 10Hz, Laser spot 80 μm diameter, laser power 80%, Ablation time 25 sec.
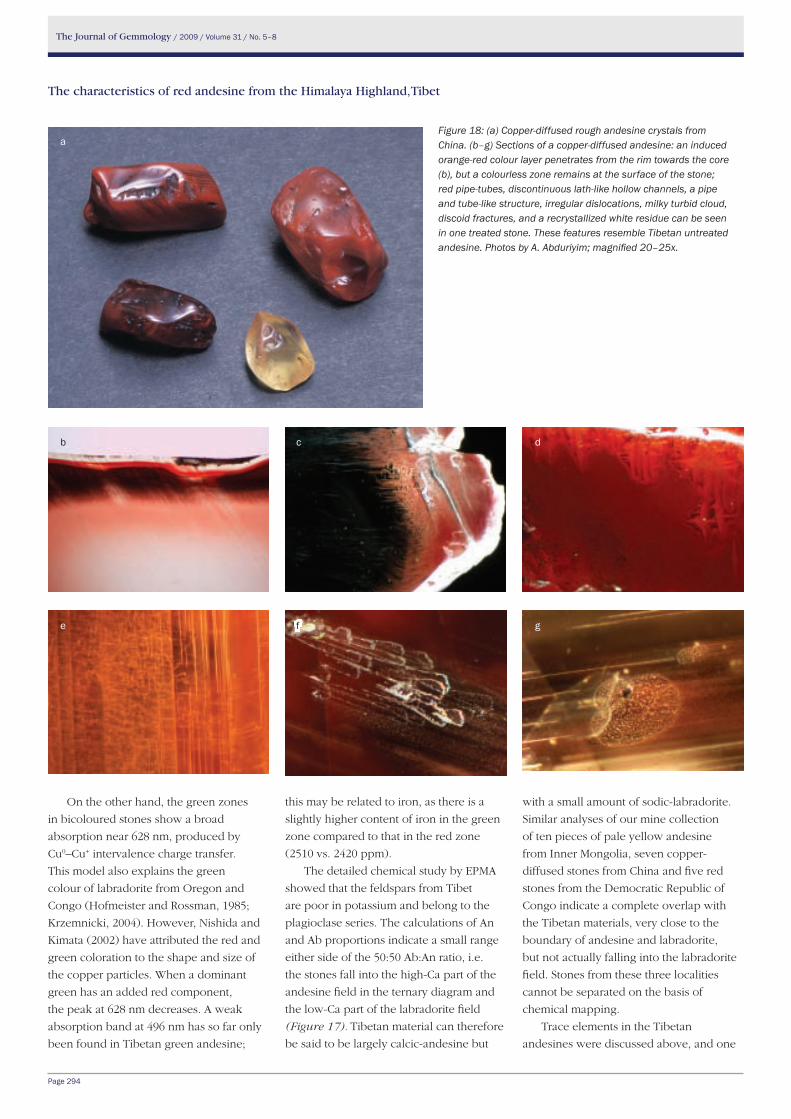
The Journal of Gemmology / 2009 / Volume 31 / No. 5–8
Page 294
The characteristics of red andesine from the Himalaya Highland, Tibet
Figure 18: (a) Copper-diffused rough andesine crystals from China. (b–g) Sections of a copper-diffused andesine: an induced orange-red colour layer penetrates from the rim towards the core (b), but a colourless zone remains at the surface of the stone; red pipe-tubes, discontinuous lath-like hollow channels, a pipe and tube-like structure, irregular dislocations, milky turbid cloud, discoid fractures, and a recrystallized white residue can be seen in one treated stone. These features resemble Tibetan untreated andesine. Photos by A. Abduriyim; magnified 20–25x.
On the other hand, the green zones
in bicoloured stones show a broad
absorption near 628 nm, produced by
Cu0–Cu+ intervalence charge transfer.
This model also explains the green
colour of labradorite from Oregon and
Congo (Hofmeister and Rossman, 1985;
Krzemnicki, 2004). However, Nishida and
Kimata (2002) have attributed the red and
green coloration to the shape and size of
the copper particles. When a dominant
green has an added red component,
the peak at 628 nm decreases. A weak
absorption band at 496 nm has so far only
been found in Tibetan green andesine;
with a small amount of sodic-labradorite.
Similar analyses of our mine collection
of ten pieces of pale yellow andesine
from Inner Mongolia, seven copper-
diffused stones from China and five red
stones from the Democratic Republic of
Congo indicate a complete overlap with
the Tibetan materials, very close to the
boundary of andesine and labradorite,
but not actually falling into the labradorite
field. Stones from these three localities
cannot be separated on the basis of
chemical mapping.
Trace elements in the Tibetan
andesines were discussed above, and one
this may be related to iron, as there is a
slightly higher content of iron in the green
zone compared to that in the red zone
(2510 vs. 2420 ppm).
The detailed chemical study by EPMA
showed that the feldspars from Tibet
are poor in potassium and belong to the
plagioclase series. The calculations of An
and Ab proportions indicate a small range
either side of the 50:50 Ab:An ratio, i.e.
the stones fall into the high-Ca part of the
andesine field in the ternary diagram and
the low-Ca part of the labradorite field
(Figure 17). Tibetan material can therefore
be said to be largely calcic-andesine but
a
gfe
dcb
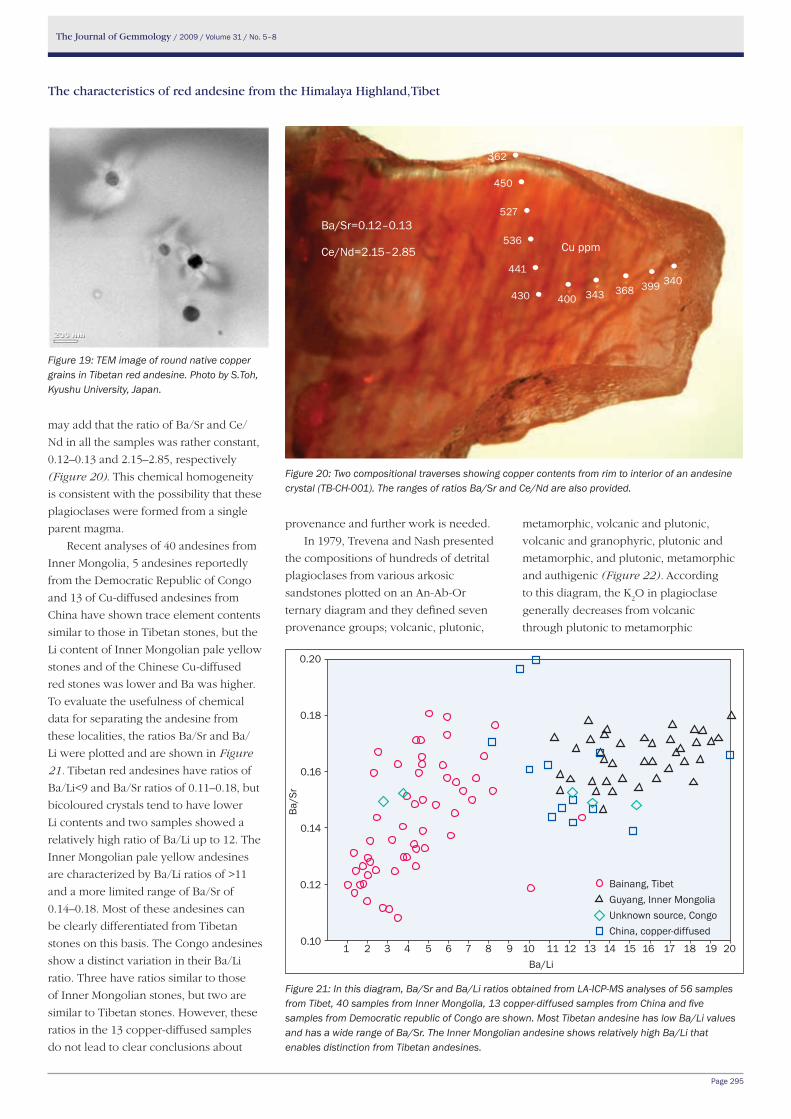
The Journal of Gemmology / 2009 / Volume 31 / No. 5–8
Page 295
The characteristics of red andesine from the Himalaya Highland, Tibet
may add that the ratio of Ba/Sr and Ce/
Nd in all the samples was rather constant,
0.12–0.13 and 2.15–2.85, respectively
(Figure 20). This chemical homogeneity
is consistent with the possibility that these
plagioclases were formed from a single
parent magma.
Recent analyses of 40 andesines from
Inner Mongolia, 5 andesines reportedly
from the Democratic Republic of Congo
and 13 of Cu-diffused andesines from
China have shown trace element contents
similar to those in Tibetan stones, but the
Li content of Inner Mongolian pale yellow
stones and of the Chinese Cu-diffused
red stones was lower and Ba was higher.
To evaluate the usefulness of chemical
data for separating the andesine from
these localities, the ratios Ba/Sr and Ba/
Li were plotted and are shown in Figure
21. Tibetan red andesines have ratios of
Ba/Li<9 and Ba/Sr ratios of 0.11–0.18, but
bicoloured crystals tend to have lower
Li contents and two samples showed a
relatively high ratio of Ba/Li up to 12. The
Inner Mongolian pale yellow andesines
are characterized by Ba/Li ratios of >11
and a more limited range of Ba/Sr of
0.14–0.18. Most of these andesines can
be clearly differentiated from Tibetan
stones on this basis. The Congo andesines
show a distinct variation in their Ba/Li
ratio. Three have ratios similar to those
of Inner Mongolian stones, but two are
similar to Tibetan stones. However, these
ratios in the 13 copper-diffused samples
do not lead to clear conclusions about
provenance and further work is needed.
In 1979, Trevena and Nash presented
the compositions of hundreds of detrital
plagioclases from various arkosic
sandstones plotted on an An-Ab-Or
ternary diagram and they defined seven
provenance groups; volcanic, plutonic,
metamorphic, volcanic and plutonic,
volcanic and granophyric, plutonic and
metamorphic, and plutonic, metamorphic
and authigenic (Figure 22). According
to this diagram, the K2O in plagioclase
generally decreases from volcanic
through plutonic to metamorphic
Figure 19: TEM image of round native copper grains in Tibetan red andesine. Photo by S.Toh, Kyushu University, Japan.
Figure 20: Two compositional traverses showing copper contents from rim to interior of an andesine crystal (TB-CH-001). The ranges of ratios Ba/Sr and Ce/Nd are also provided.
Figure 21: In this diagram, Ba/Sr and Ba/Li ratios obtained from LA-ICP-MS analyses of 56 samples from Tibet, 40 samples from Inner Mongolia, 13 copper-diffused samples from China and five samples from Democratic republic of Congo are shown. Most Tibetan andesine has low Ba/Li values and has a wide range of Ba/Sr. The Inner Mongolian andesine shows relatively high Ba/Li that enables distinction from Tibetan andesines.
Ba/Sr=0.12–0.13
Ce/Nd=2.15–2.85 Cu ppm
362 •
450 •
527 •
536 •
441 •
430 ••
400
•368
•343
•399
•340
Bainang, TibetGuyang, Inner MongoliaUnknown source, CongoChina, copper-diffused
1 2 3 4 5 6 7 8 9 10 11 12 13 14 15 16 17 18 19 20Ba/Li
0.20
0.18
0.16
0.14
0.12
0.10
Ba/S
r
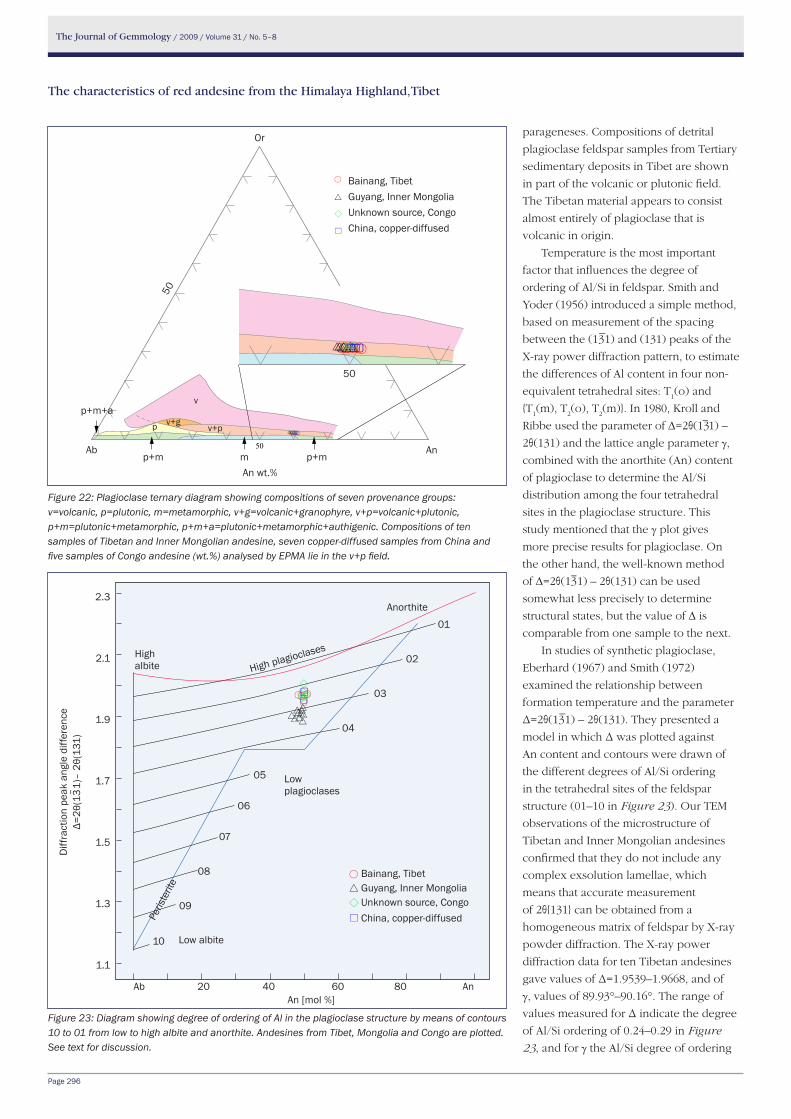
The Journal of Gemmology / 2009 / Volume 31 / No. 5–8
Page 296
The characteristics of red andesine from the Himalaya Highland, Tibet
parageneses. Compositions of detrital
plagioclase feldspar samples from Tertiary
sedimentary deposits in Tibet are shown
in part of the volcanic or plutonic field.
The Tibetan material appears to consist
almost entirely of plagioclase that is
volcanic in origin.
Temperature is the most important
factor that influences the degree of
ordering of Al/Si in feldspar. Smith and
Yoder (1956) introduced a simple method,
based on measurement of the spacing
between the (13–1) and (131) peaks of the
X-ray power diffraction pattern, to estimate
the differences of Al content in four non-
equivalent tetrahedral sites: T1(o) and
{T1(m), T
2(o), T
2(m)}. In 1980, Kroll and
Ribbe used the parameter of ∆=2θ(13 −1) –
2θ(131) and the lattice angle parameter γ,
combined with the anorthite (An) content
of plagioclase to determine the Al/Si
distribution among the four tetrahedral
sites in the plagioclase structure. This
study mentioned that the γ plot gives
more precise results for plagioclase. On
the other hand, the well-known method
of ∆=2θ(13−1) – 2θ(131) can be used
somewhat less precisely to determine
structural states, but the value of ∆ is
comparable from one sample to the next.
In studies of synthetic plagioclase,
Eberhard (1967) and Smith (1972)
examined the relationship between
formation temperature and the parameter
Δ=2θ(13–1) – 2θ(131). They presented a
model in which Δ was plotted against
An content and contours were drawn of
the different degrees of Al/Si ordering
in the tetrahedral sites of the feldspar
structure (01–10 in Figure 23). Our TEM
observations of the microstructure of
Tibetan and Inner Mongolian andesines
confirmed that they do not include any
complex exsolution lamellae, which
means that accurate measurement
of 2θ{131} can be obtained from a
homogeneous matrix of feldspar by X-ray
powder diffraction. The X-ray power
diffraction data for ten Tibetan andesines
gave values of Δ=1.9539–1.9668, and of
γ, values of 89.93°–90.16°. The range of
values measured for Δ indicate the degree
of Al/Si ordering of 0.24–0.29 in Figure
23, and for γ the Al/Si degree of ordering
Figure 23: Diagram showing degree of ordering of Al in the plagioclase structure by means of contours 10 to 01 from low to high albite and anorthite. Andesines from Tibet, Mongolia and Congo are plotted. See text for discussion.
Figure 22: Plagioclase ternary diagram showing compositions of seven provenance groups: v=volcanic, p=plutonic, m=metamorphic, v+g=volcanic+granophyre, v+p=volcanic+plutonic, p+m=plutonic+metamorphic, p+m+a=plutonic+metamorphic+authigenic. Compositions of ten samples of Tibetan and Inner Mongolian andesine, seven copper-diffused samples from China and five samples of Congo andesine (wt.%) analysed by EPMA lie in the v+p field.
50
○○○○○○○△△△△△△△◇◇◇◇□□□◇□
An
v
m
v+p ○○○○○○○△△△△△△△◇◇◇◇□□□◇□
○
△
◇
□
Bainang, TibetGuyang, Inner MongoliaUnknown source, CongoChina, copper-diffused
p+m m p+mAn wt.%
Ab An
50
Or
p+m+av+gp v+p
v
50
○
△
○
△
◇
□
○○○○○
△△△
△△△
△
◇
◇
□◇◇◇◇□
△△
○
High albite
Bainang, TibetGuyang, Inner MongoliaUnknown source, CongoChina, copper-diffused
High plagioclases
Anorthite
Low plagioclases
Low albite
Peris
terit
e
01
02
03
04
05
06
07
08
09
10
Ab 20 40 60 80 AnAn [mol %]
2.3
2.1
1.9
1.7
1.5
1.3
1.1
Diff
ract
ion
peak
ang
le d
iffer
ence
Δ=2θ
(13– 1)
– 2θ
(131
)
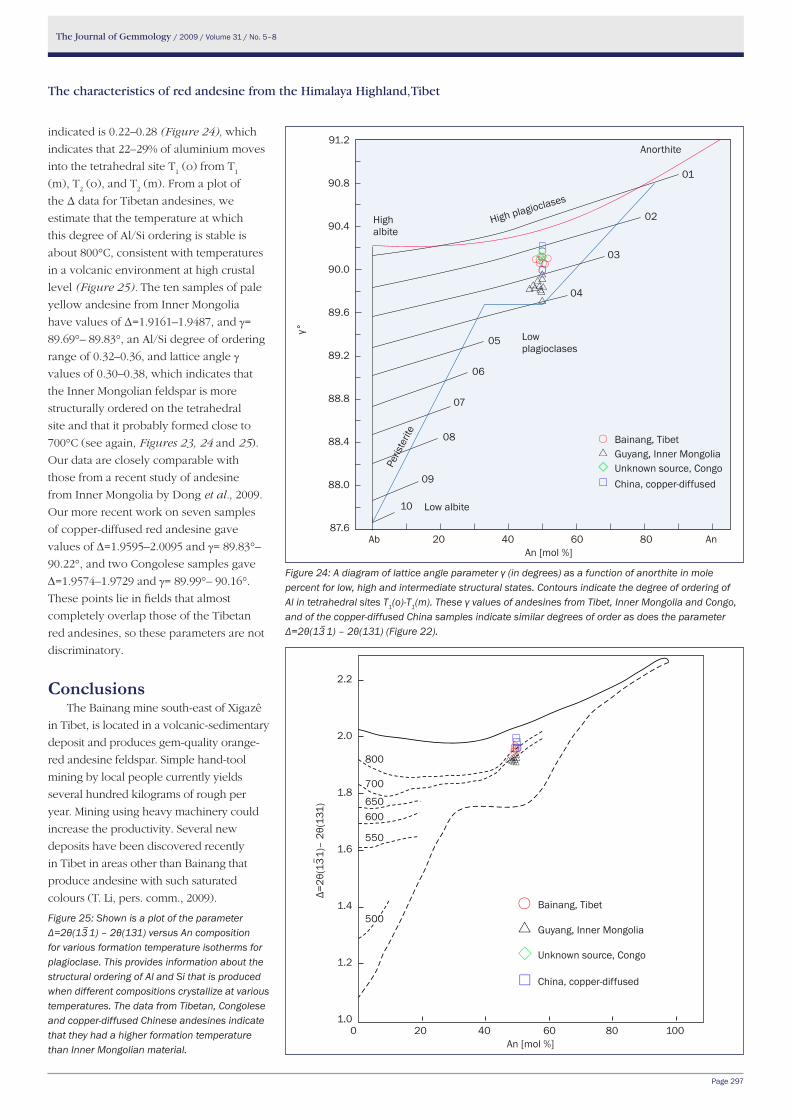
The Journal of Gemmology / 2009 / Volume 31 / No. 5–8
Page 297
The characteristics of red andesine from the Himalaya Highland, Tibet
indicated is 0.22–0.28 (Figure 24), which
indicates that 22–29% of aluminium moves
into the tetrahedral site T1 (o) from T
1
(m), T2 (o), and T
2 (m). From a plot of
the Δ data for Tibetan andesines, we
estimate that the temperature at which
this degree of Al/Si ordering is stable is
about 800°C, consistent with temperatures
in a volcanic environment at high crustal
level (Figure 25). The ten samples of pale
yellow andesine from Inner Mongolia
have values of Δ=1.9161–1.9487, and γ=
89.69°– 89.83°, an Al/Si degree of ordering
range of 0.32–0.36, and lattice angle γ
values of 0.30–0.38, which indicates that
the Inner Mongolian feldspar is more
structurally ordered on the tetrahedral
site and that it probably formed close to
700°C (see again, Figures 23, 24 and 25).
Our data are closely comparable with
those from a recent study of andesine
from Inner Mongolia by Dong et al., 2009.
Our more recent work on seven samples
of copper-diffused red andesine gave
values of ∆=1.9595–2.0095 and γ= 89.83°–
90.22°, and two Congolese samples gave
∆=1.9574–1.9729 and γ= 89.99°– 90.16°.
These points lie in fields that almost
completely overlap those of the Tibetan
red andesines, so these parameters are not
discriminatory.
ConclusionsThe Bainang mine south-east of Xigazê
in Tibet, is located in a volcanic-sedimentary
deposit and produces gem-quality orange-
red andesine feldspar. Simple hand-tool
mining by local people currently yields
several hundred kilograms of rough per
year. Mining using heavy machinery could
increase the productivity. Several new
deposits have been discovered recently
in Tibet in areas other than Bainang that
produce andesine with such saturated
colours (T. Li, pers. comm., 2009).
Figure 24: A diagram of lattice angle parameter γ (in degrees) as a function of anorthite in mole percent for low, high and intermediate structural states. Contours indicate the degree of ordering of Al in tetrahedral sites T1(o)-T1(m). These γ values of andesines from Tibet, Inner Mongolia and Congo, and of the copper-diffused China samples indicate similar degrees of order as does the parameter Δ=2θ(13–1) – 2θ(131) (Figure 22).
Figure 25: Shown is a plot of the parameter Δ=2θ(13–1) – 2θ(131) versus An composition for various formation temperature isotherms for plagioclase. This provides information about the structural ordering of Al and Si that is produced when different compositions crystallize at various temperatures. The data from Tibetan, Congolese and copper-diffused Chinese andesines indicate that they had a higher formation temperature than Inner Mongolian material.
High albite
High plagioclases
Anorthite
Low plagioclases
Low albite
01
02
03
04
Ab 20 40 60 80 AnAn [mol %]
91.2
90.8
90.4
90.0
89.6
89.2
88.8
88.4
88.0
87.6
γ°
05
06
07
08
09
10
Bainang, TibetGuyang, Inner MongoliaUnknown source, CongoChina, copper-diffused
Peris
terit
e
○
△
◇
□
○
○○○○○○○
△
△
△△
△△△
△△ △△
○
◇
◇◇◇◇◇
□
□
500○
△
◇
□
○○○○○
△△○
△△△△△◇◇
△△
□□□□
0 20 40 60 80 100An [mol %]
2.2
2.0
1.8
1.6
1.4
1.2
1.0
Δ=2θ
(13– 1)
– 2θ
(131
)
800
700
650600
550
500Bainang, Tibet
Guyang, Inner Mongolia
Unknown source, Congo
China, copper-diffused
The Journal of Gemmology / 2009 / Volume 31 / No. 5–8
Page 298
The characteristics of red andesine from the Himalaya Highland, Tibet
Gemmological and chemical
investigations indicate that the red colour
results from clusters of tiny copper
particles (Cu0) and the green colour may
result from Cu0-Cu+ intervalence charge
transfer or from differences in shape
and size of the copper particles. RI and
SG values and chemical data indicate an
andesine composition of Ab46.96–49.79
:An46.72–
49.94:Or
3.03–3.50, i.e. an andesine near the
andesine-labradorite border; its chemical
formula is (K0.03
Na0.46–0.49
)2Ca
0.46–0.49Al
1.43–
1.48Si
2.51–2.53O
8. The lattice parameters are
(a0=8.161–8.193 Å, b
0=12.849–12.919
Å, c0=7.105–7.126 Å, α=93.26°–93.74°,
β=116.27˚-116.38˚, γ=89.93°–90.16°).
The parameter ∆=2θ(13−1) –
2θ(131)=1.9539–1.9668, calculated from
XRD measurements indicates that Tibetan
andesine is in a low state of structural
order with a value of 0.22–0.29, and that
it formed at a minimum of 800°C in a
volcanic environment.
Chemical analysis of Cu-bearing Tibetan
and non-Cu-bearing Inner Mongolian
andesines by EPMA has shown comparable
contents of major and minor elements. But
trace element analysis using LA-ICP-MS
and the plot of Ba/Sr versus Ba/Li has been
found useful for distinguishing Cu-bearing
andesine from Tibet.
AcknowledgementsThe author is grateful to Wong Ming
(King Star Jewellery Co) and Christina
Iu (M. P. Gem Corp.) for supporting and
organizing the field trip and especially
to the mine owner Li Ting in Tibet for
allowing access to and for a guide to
the mine. Special thanks to Prof. Detlef
Günther from the Swiss Federal Institute
of Technology, Zürich, for comparative
study of chemical analysis by the LA-ICP-
MS technique. Also Kousuke Kosuda from
National Institute for Materials Science
(NIMS) is thanked for his support on
electron probe microanalysis. Dr Shoichi
Toh from the Research Laboratory of High
Voltage Electron Microscopy, Kyushu
University, is thanked for supporting
the TEM observations. Assistance from
research colleagues Hiroshi Kitawaki,
Dr Jun Kawano, Makoto Okano, Taisuke
Kobayashi and Chihiro Fukuda at
GAAJ-ZENHOKYO Laboratory is much
appreciated, and the author is also thankful
to Prof. Masao Kitamura for critically
reading this manuscript.
ReferencesAbduriyim, A., 2008. Gem News
International: Visit to andesine
mines in Tibet and Inner Mongolia,
Gemmological properties of andesine
collected in Tibet and Inner Mongolia.
Gems & Gemology, 44(4), 369–73
Carpenter, M.A., and McConnell, J.D.C.,
1984. Experimental bracketing of
order/disorder transformations in
plagioclase. Progress in Experimental
Petrology, 6, 186–9
Dong X. Z., Qi L.J., and Zhong Z.Q., 2009.
Preliminary study on gemmological
characteristics and genesis of andesine
from Guyang, Inner Mongolia. Journal
of Gems and Gemmology, 11(1), 20–4
Eberhard, V.E., 1967. Zur synthese
der plagioclase. Schweizerische
mineralogische und petrographische
Mitteilungen, 47, 385–98
Haifu Li, 1992. First study of gem-
quality Inner Mongolian Labradorite
moonstone. Jewellery, 1(6), 45–7 [in
Chinese]
Hofmeister, A.N., and Rossman, G.R., 1985.
Exsolution of metallic copper from
Lake County labradorite. Geology, 13, 644–7
Kroll, H., and Ribbe, P.H., 1980.
Determinative diagrams for Al, Si order
in plagioclases. American Mineralogist,
65, 449–57
Krzemnicki, M.S., 2004. Red and green
labradorite feldspar from Congo.
Journal of Gemmology, 29(1), 15–23
Laurs, M.B., 2005. Gem News International:
Gem plagioclase reportedly from Tibet.
Gems & Gemology, 41(4), 356–7
Nishida N., and Kimata M., 2002.
Identification of microinclusions
in the nanometer dimension by
electron microprobe analysis — the
chromophores in colored sunstones.
Ganseki Kobutsu Kagaku, 31, 268–74
Smith, J.R, and Yoder, H.S., 1956. Variation
in X-ray powder diffraction patterns
of plagioclase feldspars. American
Mineralogist, 41, 632–47
Smith, J.R., 1972. Critical review of
synthesis and occurrence of plagioclase
feldspar and a possible phase diagram.
The Journal of Geology, 80(5), 505–25
Trevena, A.S., and Nash, W.P., 1979.
Chemistry and provenance of detrital
plagioclase. Geology, 7, 475–8
Yue Cao, 2006. Study on the feldspar from
Guyang County, Inner Mongolia, and
their colour enhancement, Master’s
thesis, Beijing, Geological University
of China
web listEmmett, J., and Douthit, T. (2009). Copper
diffusion in plagioclase. Presentation in
GIA seminar on 21st Aug, http://www.
gia.edu/research-resources/news-from-
research/special-issue-homepage.html
Roskin, G., 2008. “JCK web exclusive: The
andesine report,” posted November
12, http://www.jckonline.com/article/
CA6613857.html?desc=topstory
the AuthorDr Ahmadjan AbduriyimChief Research Scientist, Research Laboratory, Gemmological Association of All
Japan (GAAJ)-ZENHOKYO, 5-25-11 Uneo Taitoku, Tokyo, 110-0005 Japan
Email: [email protected]
twist Portable lamp
• Ideal for examining diamonds and coloured stones
• Lightweight and foldable — take it with you wherever you go
• Low heat technology
• 13w DaylightTM energy-saving tube: Energy Grade A
• Runs on 220 volts
PRICe: £44.00* (Gem-A members and Gem-A registered students £39.60*)* Prices exclude VAt, postage and packing
For further details or to order your Twist Portable Lamp, contact the Gem-A shop at
[email protected] or call +44 (0)20 7404 3334.
The GemmoloGical associaTion
of GreaT BriTain
Gem-A
Flexible head twists to give maximum light exactly where you want it.
Now used in all Gem-A in-house diamond classes.
NEW!
The Journal of Gemmology / 2009 / Volume 31 / No. 5–8
Page 300
Abstracts
Diamonds
the SeM and CCl-SeM study of graphitic inclusions in natural brown diamonds.A.S. bidny, O.V. KOnOnOV, A.G. VereSOV and P.V. iVAnniKOV. The Australian Gemmologist, 23(3), 2007, 126–30.
Plastic deformation, the supposed cause of colour in brown diamonds, closely parallels the high density of dislocations found in brown type I and type IIa diamonds. Using high-resolution Scanning Electron Microscopy (SEM) and Colour Cathodoluminescence Scanning Electron Microscopy (CCL-SEM) the characteristics of graphite inclusions in natural brown diamonds was researched. Graphite inclusions were found to lie along the {111} plane and of approximately 0.7 μm. Besides graphite, recrystallized micro-figures were visible with trigons on the octahedral surfaces. J.S.
Color variation and properties of johachidolite from Myanmar. K.M. chAdwicK And c.M. breedinG. Gems & Gemology, 44(3), 2009, 246–51.
Various analytical techniques were used to study 15 faceted examples of the rare gem material johachidolite from Myanmar showing a range of colours: saturated orange, orange, yellow, desaturated yellow and desaturated green. Both orange-yellow-hued and green samples showed various trends for Be, U, Th and Pb. Orange/yellow samples also showed relatively constant amounts of REE, though the green samples had higher REE values, particularly for the lighter REE. R.A.H.
'Fluorescence cage': visual identification of hPht-treated type I diamonds.i.A. dObrinetS and A.M. ZAitSeV. Gems & Gemology, 45(3), 2009, 186–90.
High-pressure/high-temperature
diamonds of various colours may exhibit
unusually intense fluorescence at the
facet edges and junctions. This effect
(here named the 'fluorescence cage') is
observed with a fluorescence microscope
as a luminous network on the surface of
the diamond; it is not seen in untreated
diamonds or colourless type IIa HPHT-
treated diamonds. This fluorescence
pattern is considered to result from a high
concentration of HPHT-induced optical
centres which remain on facet edges after
repolishing. R.A.H.
the wittelsbach Blue.r. dröSchel, J. eVerS and h. OttOMeyere. Gems & Gemology, 44(4), 2008, 348–63.
The 55.56 ct Wittelsbach Blue is one of the largest historic, blue diamonds ever fashioned. Its chequered history is reviewed; it was most recently sold at Christie's in December 2008 to the London jeweller Laurence Graff for £16,393,250 (or just over $683,000 per carat). R.A.H.
the French Blue and the hope: new data from the discovery of a historical lead cast. F. FArGeS, S. Sucher, h. hOrOVitZ And J.-M. FOurcAult. Gems & Gemology, 45(1), 2009, 4–19.
Models of a recently discovered lead cast of the French Blue diamond and of the Hope diamond confirm that the latter could have been recut from the French Blue. R.A.H.
Color grading 'C to Z' diamonds at the GIA laboratory.J.M. KinG, r.h. GeurtS, A.M. GilbertSOn and J.e. ShiGley. Gems & Gemology, 44(4), 2008, 296–321.
The use of letter designations for diamond colour grades is virtually universal in the gem and jewellery industry but
the use of GIA colour grading standards and procedures is not. The history and ongoing development and application of this grading system is described. Important aspects of this system include a specific colour grading methodology for judging the absence of colour in diamonds, a standard illumination and viewing environment, and the use of colour reference diamonds ('masterstones') for the visual comparison of colour. R.A.H.
Gem News International.b.M. lAurS (Ed.). Gems & Gemology, 45(3), 2009, 214–32.
A brief description is given of a 1.02 ct greenish-yellow diamond which has had a glass filling and HPHT treatment. R.A.H.
lab notes. t.M. MOSeS And S.F. Mcclure (edS). Gems & Gemology, 44(3), 2009, 252–60.
Notes are given on black diamonds coloured by hydrogen clouds and other diamond oddities. R.A.H.
lab Notes.t.M. MOSeS and S.F. Mcclure (Eds). Gems & Gemology, 44(4), 2008, 364–8.
Notes are given on a 3 ct fancy dark brown-yellow zoned type IIa/IIb diamond and a 0.21 ct CVD synthetic diamond which was found to have been HPHT treated. R.A.H.
lab notes. t.M. MOSeS And S.F. Mcclure (edS). Gems & Gemology, 45(1), 2009, 53–8.
Notes include mention of a cut cubic zirconia coated with nanocrystalline synthetic diamond, and of a rare mixed type (Ia/IIb) diamond with nitrogen and boron centres. R.A.H.
lab Notes.t.M. MOSeS and S.F. Mcclure (Eds). Gems &
The Journal of Gemmology / 2009 / Volume 31 / No. 5–8
Page 301
Abstracts (continued)
Gemology, 45(2), 2009, 134–40.Items noted include a 1.79 ct cut
bicoloured diamond (near colourless to orangy brown) and a 0.4 ct cut diamond graded as Fancy Black but which showed a deep violet colour when viewed through the pavilion. R.A.H.
lab Notes.t.M. MOSeS and S.F. Mcclure (Eds). Gems & Gemology, 45(3), 2009, 208–13.
Items noted include a treated 0.28 ct diamond graded as Fancy Red (a very rare colour grade) and a 12.01 ct Fancy Vivid Yellow diamond (type Ib) coloured by isolated nitrogen. R.A.H.
A crystallographic analysis of the tavernier blue diamond.S.d. Sucher. Gems & Gemology, 45(3), 2009, 178–85.
By correlating the facets on the Tavernier Blue (the 'grandparent' of the Hope diamond) with the facets of a diamond crystal, information has been obtained on the crystallography of the original rough. By using these data, the original drawings and a computer model of the French Blue diamond generated from a laser scan of a recently discovered lead cast, a computer model of the Tavernier Blue was obtained. This new model completely encloses the computer model of the French Blue, conforms to Tavernier's physical description and establishes the orientation of the finished diamond within the original diamond crystal. R.A.H.
Spectroscopic methods for the identification of natural yellow gem-quality diamonds.l. tretriAKOVA. European Journal of Mineralogy, 21(1), 2009, 43–50.
The characteristic spectroscopic features and identification criteria for different types of yellow diamonds are presented, including varieties of naturally occurring yellow diamonds and varieties of artificially produced yellow diamonds. The spectroscopic techniques discussed include infrared spectroscopy, optical absorption spectroscopy and laser-induced photoluminescence spectroscopy. The latter technique is much more sensitive than optical absorption spectroscopy and can excite defects which have very low concentrations in diamonds: examples are
given of diamonds with high hydrogen contents or with high nitrogen and low hydrogen. R.A.H.
Gray-to-blue-to-violet hydrogen-rich diamonds from the Argyle mine, Australia. c.h. VAn der bOGert, c.P. SMith, t. hAinSchwAnG and S.F. Mcclure. Gems & Gemology, 45(1), 2009, 20–37.
A study of 20 type IaB hydrogen- and nitrogen-rich grey to blue to violet diamonds from the Argyle mine showed that their unusual colour is the result of broad absorption bands centred at ~ 520–565 and 720–730 nm with a pronounced 551 nm band superimposed on the 520–565 nm feature. The photoluminescence spectra exhibit peaks associated with Ni-related defects which may be important in the more violet diamonds. R.A.H.
Gems and Minerals
Characterization of 'green amber' with infrared and nuclear magnetic resonance spectroscopy.A. AbduriyiM, h. KiMurA, y. yOKOyAMA, h. nAKAZOnO, M. wAKASuKi, t. ShiMiZu, M. tAnShO and S. OhKi. Gems & Gemology, 45(3), 2009, 158–77.
A peridot-like bright greenish yellow to green gem material is produced by treating natural resin (amber or copal) with heat and pressure in two stages in an autoclave. Differences in the molecular structure between the untreated materials and treated 'green amber' were studied by FTIR and 13C NMR, using powdered samples. Regardless of the starting material, the FTIR spectrum of 'green amber' showed an amber pattern but with a characteristic small absorption feature at 820 cm−1. Solid-state 13C NMR of the treated material indicated a significantly lower volatile content than the untreated natural resin. A new absorption feature near 179 ppm in the NMR spectrum of all treated samples distinguished them from their natural-colour counterparts. R.A.H.
Characterization of peridot from Sardinia, Italy.i. AdAMO, r. bOcchiO, A. PAVeSe and l. PrOSPeri. Gems & Gemology, 45(2), 2009, 130–33.
Olivine-rich nodules in basalts near
Pozzomaggiore, NW Sardinia, yield yellowish-green peridot crystals with gem quality potential and have α 1.650–1.652, β 1.669–1.670, γ 1.688–1.690, SG 3.32–3.36. Microprobe results give a composition of Fo
91Fa
9. R.A.H.
Aquamarine, maxixe-type beryl and hydrothermal synthetic blue beryl: analysis and identification. i. AdAMO, A. PAVeSe, l. PrOSPeri, V. diellA, d. AJò, c.d. GAttA And c.P. SMith. Gems & Gemology, 44(3), 2009, 252–60.
An investigation is reported of aquamarine, maxixe-type (irradiated) beryl and two types of hydrothermally grown synthetic beryl, using standard gemmological methods, chemical analysis (microprobe results are reported), UV-Vis-NIR and mid-IR spectroscopy to identify these materials conclusively. The maxixe-type beryl (as for natural colour maxixe beryls) is distinguished by its unusual pleochroism, green UV fluorescence (if present), iron-free chemical composition and distinctive UV-Vis-NIR spectrum. The blue hydrothermal synthetic beryls can be discriminated from their natural equivalents by their microscopic features, chemical composition, and their visible and infrared spectroscopic features. R.A.H.
the lac d'Amiante mine. M. AMAbili, F. SPertini, M. AuGuSte and G. bOnin. Mineralogical Record, 40(4), 2009, 297–304.
Fine ornamental green fluorite is described from the Lac d'Amiante mine, in the town of Thetford, Quebec, Canada. M.O'D.
Crystallization of biogenic Ca-carbonate within organo-mineral micro-domains. Structure of the calcite prisms of the Pelecypod Pinctada margaritifera
(Mollusca) at the submicron to nanometre ranges. A. bArOnnet, J.P. cuiF, y. dAuPhin, b. FArre and J. nOuet. Mineralogical Magazine, 72(2), 2008, 617–26.
Atomic force microscopy (AFM) and TEM were used to investigate the fine structure of calcite prisms from the pearl-oyster shell Pinctada margaritifera. The AFM analysis showed that the prisms are made of densely packed circular micro-
The Journal of Gemmology / 2009 / Volume 31 / No. 5–8
Page 302
Abstracts (continued)
domains (in the 0.1 μm range) surrounded by a dense cortex. The TEM images and diffraction patterns allow the internal structure of the micro-domains to be described: each of them is enriched in Ca-carbonate. Hosted in distinct regions of each prism, some are fully amorphous, and others are fully crystallized as sub-units of a large calcite single crystal. At the border separating the two regions, micro-domains display a crystallized core and an amorphous rim, probably marking out an arrested crystallization front having propagated through a previously bio-controlled architecture of the piling of amorphous micro-domains. Compared to recent data concerning the stepping mode of growth of the calcite prisms and the resulting layered organization at the μm-scale, these results give unexpected views regarding the modalities of biocrystallization. R.A.H.
Aquamarine from the Masino-Bregaglia Massif, Central Alps, Italy.r. bOcchiO, i. AdAMO and F. cAuciA. Gems & Gemology, 45(3), 2009, 204–7.
Pale, blue-green aquamarine crystals occur in granitic pegmatites of the Masino-Bregaglia massif in the Central Alps of northern Italy. They have yielded three cut and faceted stones, the largest being a 2.33 ct pale greenish-blue aquamarine. An 8.5 ct cabochon is also illustrated. The UV-Vis-NIR and mid-IR absorption spectra are shown, and trace elements determined by LA-ICP-MS are reported for six crystals. R.A.H.
topaz from near el Chalten, Santa Cruz Province, Agentina.r. brAndStetter. Mineralogical Record, 40(1), 2009, 1–15.
Topaz of ornamental or even gem quality is described from pegmatite pockets in a remote area of Patagonia, Argentina. Large white crystals of feldspar and milky quartz crystals accompany the topaz. M.O'D.
edle topase und Zepterquarze aus Patagonien.r. brAndStetter. Lapis, 34(5), 2009, 13–24.
Transparent yellow topaz of apparent ornamental quality is described from Patagonia, Argentina, from where sceptre quartz is also reported. M.O'D.
Die Rogerley Mine.r. brAndStetter. Lapis, 35(1), 2010, 13–26.
Fine, probably transparent, green fluorite crystals are described from the Rogerley mine in the northern Pennine orefield, England. M.O'D.
Fluorite from Riemvasmaak. b. cAirncrOSS. Mineralogical Record, 40(4), 2009, 307–24.
Fine green ornamental to gem-quality fluorite is described from the Riemvasmaak area of Northern Cape Province, South Africa. M.O'D.
A study on the characteristics of some C- and Ct-opals from Brazil. F. cAuciA, c. GhiSOli and i. AdAMO. Neues Jahrbuch für Mineralogie, Abhandlungen, 185(3), 2009, 289–96.
The physical properties of blue and fire opals from Piaui State, Brazil, have been determined by optical analyses, specific gravity, X-ray diffraction and IR spectroscopy, with chemical compositions via LA-ICP-MS and SEM-EDS. The values obtained for specific gravity and refractive index are 1.98-2.28 and 1.420-1.461, respectively. The presence of cristobalite is confirmed. Trace amounts of chromophore elements are correlated with variation in colour. The particular 'coral islands' structure, built of micro-spherules of amorphous silica, is observed by SEM analyses, and could explain the particular effects of iridescence shown by some blue specimens. The LA-ICP-MS analyses confirm the presence of Fe as the principal cause of colour in the fire opals (perhaps present as an Fe-oxyhydroxide); only in the darkest specimens is Mn significant. R.A.H.
About mineral collecting. Part 5 of 5.r. currier. Mineralogical Record, 40(3), 2009, 193–202.
The author describes the Tucson Gem and Mineral Show and gives advice to prospective exhibitors and visitors. Examples of some classic items are illustrated in colour. M.O'D.
the color durability of 'Chocolate pearls' by Ballerina Pearl Co. G. du tOit, A.h. Shen And c.M. breedinG. Gems & Gemology, 44(3), 2009, 234–41.
Seven colour-treated brown Tahitian
cultured pearls supplied by the Ballerina Pearl Co. and 12 untreated Tahitian cultured pearls were exposed to typical conditions of customer use (heat, household chemicals, daylight and some typical cosmetics) to determine their effects on the colour. Both groups gave similar largely negative results, but subtle changes were noticed after exposure to heat, with more significant changes observed when the samples were exposed to chemically reactive household cleaning solutions (bleaches). R.A.H.
Zur Flammenstruktur bei einigen porzellanartigen Perlen. H.A. hänni, 2009. Gemmologie. Z. Dt. Gemmol. Ges., 58(1/2), 47–52. 2 photographs, 5 photomicrographs, bibl.
The sheen displayed on nacreous pearls is due to the structure of stacked aragonite tablets in parallel superimposition. Non-nacreous pearls often show a flame structure that is due to a crosswise array of bundles of aragonite laths or fibres. Small bundles alternate in their orientation, so that some light is reflected and some absorbed, producing brighter and darker patches as in a flame structure. This is typical for the porcellaneous lining of marine gastropod shells and some bivalves, and their pearls produced by the same mantle tissue. Some of these bundles can also occasionally produce interference colours. E.S.
Beschädigungen an geschliffenen edelsteinen.H.A. hänni. Gemmologie. Z. Dt.
Gemmol. Ges., 58(3/4), 2009, 91–104. 22
photographs, bibl.
The article deals with the various
factors that can influence a gem’s
durability. These can be caused during
mining, manufacture and setting, cleaning
or wearing. Damage to diamonds includes
damage caused during cutting and setting
or use, such as chipped girdle, worn facet
edges, or abrasion by rubbing against
other diamonds. More marked is damage
to other gemstones, especially if in contact
with diamonds. Naturally caused damage
with time is the expansion of uranium-
containing zircon inclusions and uraninite
inclusions in sapphires, which can lead
to chipping or fractures, especially during
The Journal of Gemmology / 2009 / Volume 31 / No. 5–8
Page 303
Abstracts (continued)
repairs. During torch repairs diamonds
are protected by coating with a borax
compound; however, the same compound
attacks rubies, sapphire and other gems
during soldering. When borax is not
used, diamond surfaces can be burned.
Soldering can also cause heat stress and
fracture in some set stones. An example
shows a crater-shaped chip in a diamond
caused by a soldering laser shot to a
prong. Other examples show damage by
removal of the polymer-filler in jade by
ultrasonic cleaning and serious etching to
peridot from acid cleaning after soldering.
E.S.
Das neue Rubinvorkommen von Montepuez, Mosambik.H.A. hänni and M.S. KrZeMnicKi. Gemmolo-gie. Z. Dt. Gemmol. Ges., 58(3/4), 2009,
127–30. 6 photographs, bibl.
The new deposit is in the north-east of
Mozambique and the first faceted stones
from there were shown at the Hong
Kong autumn Fair 2008. The rubies are
found in an amphibolite, a metamorphic
rock that also hosts the Winza deposit
in Tanzania. Crystal habit is tabular to
prismatic. The iron-containing rubies often
show twin lamellae, contain minor rutile
silk, corroded amphibolite grains, some
zircons, fluids and secondary minerals in
fissures. E.S.
Mit Kunstharz stabilisierter Seraphinit (Klinochlor).U. henn. Gemmologie. Z. Dt. Gemmol. Ges., 57(3/4), 2008, 143–5. 2 photographs, 1 graph, bibl.
Radial to fibrous aggregates of clinochlore are known in the trade as seraphinite. Material from Korshunovskoye in Siberia has been found to be polymer impregnated. Infrared spectra and density proved the material to have been treated. E.S.
Zirkone von tansania: 'Malaya-Zirkon'.u. henn. Gemmologie. Z. Dt. Gemmol. Ges., 58(1/2), 2009, 67–72. 4 photographs, 2 graphs, 2 tables, bibl.
The zircons are found in the Tanga province in northern Tanzania. They are transparent and brown, yellow or red,
known in the trade as Malaya zircons. They are ‘high crystalline’, with high density and RI values, and with typical absorption spectra with narrow bands and fine lines of tetravalent uranium. All Malaya zircons fluoresce in brown or yellow-brown colours. E.S.
Sultanit — farbwechselnder diaspor aus der türkei. U. henn. Gemmologie. Z. Dt. Gemmol. Ges., 58(1/2), 2009, 73. 1 photograph.
Diaspore from Mugla in Turkey shows an interesting colour change from greenish-brown in daylight to pink-brown in incandescent light. Material is called sultanate/zultanite. E.S.
tiefgrüne Sphene aus tansania.J. hintZe. Lapis, 34(10), 2009, 29-30.
Specimens of green sphene, some translucent, are reported from Tanzania.
M.O'D.
Vorkommen von Achaten in rhyolitischen bis dacitischen Vulkaniten Deutschlands und deren historische Gewinnung sowie Nutzung — teil I.G. hOlZhey. Gemmologie. Z. Dt. Gemmol. Ges., 57(3/4), 2008, 77–102. 27 photographs, 1 map. Bibl.
The article deals with agates from rhyolitic to dacitic volcanic rocks with relatively little free silica, which are generally less known. In Freiburg these types of agates were already worked in the fifteenth to sixteenth centuries, while other agates from the Black Forest came into favour in the eighteenth to nineteenth centuries. In Thuringia rhyolite balls were well known in the seventeenth and eighteenth centuries, while about the same time Saxony produced many agate articles. E.S.
Vorkommen von Achaten in rhyolitischen bis dacitischen Vulkaniten Deutschlands und deren historische Gewinnung sowie Nutzung — teil II (Sachsen).G. hOlZhey. Gemmologie. Z. Dt. Gemmol. Ges., 58(1/2), 2008, 3–46. 44 Photographs, 1 table.
The author deals in some detail with the locations and occurrences in Saxony. Mining first became important under
the reign of August I of Saxony in 1694 and gained popularity during the first half of the eighteenth century. Lapidary and goldsmiths’ skills were developed in Dresden and master goldsmiths such as Taddel, Stiehl and Nueber produced beautiful pieces of hardstone mounted in gold, such as snuff boxes, table tops, fireplaces and cabochons for personal jewellery, mostly from banded jasper. E.S.
Fact or fiction: lessons from the history of gems.D. hOOVer. The Australian Gemmologist, 23(3), 2007, 117–25.
A transcribed lecture stating how erroneous, fabricated and misinterpreted information passed down through history has skewed information we perceive to be true today. As the lecturer quotes from Thomas Katz: “Frequent repetition can turn fictional breakthroughs into common lore.” Without proper correction the future will continue to believe these stories as true. Several interesting examples are given to illustrate how false information has been handed down and what the correct information really is. (NB: A 'must read', if not for the information the author provides, then for the strength of character to believe not what others deem to be true, but what you do). J.S.
Magnetic susceptibility for gemstone discrimination.d.b. hOOVer and b. williAMS. The Australian Gemmologist, 23(4), 2007, 146–59.
Delving into the past history, beginning with Pliny’s writings of 2000 years ago, the author presents how magnets were used to aid in medicine, science and gemmology. Once calibrated, the presence and amount of a magnetic pull is an important indicator of the nature of growth and in differentiating between gem materials. For example, based on the amount of iron content in corundums, magnetic pull can differentiate between magmatic or metamorphic growth. In this example, the first of four magnetic principles is explored; the elemental make-up is magnetic (iron and magnesium). The other three are: diamagnetic (diamond and quartz),
The Journal of Gemmology / 2009 / Volume 31 / No. 5–8
Page 304
Abstracts (continued)Abstracts (continued)
paramagnetic (peridot and garnet) and ferromagnetic (inclusions in a diamond). J.S.
lune River petrified ferns: an overview.R.E. JOneS. The Australian Gemmologist, 23(3), 2007, 131–5.
Tectonic movement led to volcanic activity creating the Lune River flora, an area of petrified plants in Tasmania. Dating zircon in the ash and sandstone in the area using Pb-U indicates that the specimens are from the Toarcian stage of the early mid-Jurassic period. Six genera are represented: Cibotium tasmanense, Oguracaulis banksii, Osmundacaulis sp., Lunea jonesii, Ashicaulis wrightii and Tasmanopteris richmondii. J.S.
Role of polyenes in the coloration of cultured freshwater pearls.S. KArAMPelAS, e. FritSch, J.-y. MeVellec, S. SKlAVOunOS and t. SOldAtOS. European Journal of Mineralogy, 21(1), 2009, 85–7.
The examination of 21 untreated cultured freshwater pearls from Hyriopsis by diffuse reflectance UV-Vis-NIR and Raman scattering measurements at high resolution is reported. All natural colour samples show the two major Raman resonance features of unmethylated (unsubstituted) polyenes, not carotenoids. Their general formulae are R-(-CH=CH)
N-R' with N = 6 to 14,
and they give absorptions from violet to yellow-green. R.A.H.
Aquamarine, quartz and topaz in kimberlites: case studies from Minas Gerais State, Brazil.J. KArFunKel, G.n.c. SGArbi, P.b. de A.
SGArbi, P.A.F. de brOt, O.S. FrAncA, d.b.
hOOVer and r. weGner. Gemmologie. Z. Dt.
Gemmol. Ges., 58(3/4), 2009, 105–14. 10
photographs, 2 maps, bibl.
Most gems form in magmatic rock,
with many coloured stones coming
from pegmatites. Diamonds originate
mainly from kimberlites. Recent finds
of aquamarine, quartz and topaz in
kimberlites from central-west Minas
Gerais State apparently contradict
accepted genetic aspects. The study from
this region explains their occurrence
in weathered pipes as ‘hitchhikers’.
Pegmatite fragments detached probably
many hundreds of metres below surface
from their original rock were plucked
and incorporated into the ascending
magma and transported to the surface.
The gems were released near the surface
and tropical weathering processes did not
affect them as much as some kimberlite
minerals. These finds might be important
for coloured gem prospectors in avoiding
wrong interpretations. E.S.
Identification of the endangered pink-to-red Stylaster corals by Raman spectroscopy.S. KAtAMPelAS, e. FritSch, b. rOndeAu, A. AndOuche And b. MétiVier. Gems & Gemology, 45(1), 2009, 48–52.
Raman scattering revealed that corals of the Stylaster genus (as opposed to those of the Corallium genus which include most pink-to-red corals used in jewellery) are made of aragonite and contain carotenoid pigments (polyenic pigments substituted with methyl groups), whereas those of the Corallium genus are coloured by unmethylated polyenic
pigments and consist of calcite. R.A.H
Solution-generated pink color surrounding growth tubes and cracks in blue to blue-green copper-bearing tourmalines from Mozambique. J.i. KOiVulA, K. nAGle, A. h-t. Shen and P. OwenS. Gems & Gemology, 45(1), 2009, 44–7.
From the examination of several transparent, faceted, blue to blue-green copper-bearing tourmalines containing growth tubes and cracks surrounded by sleeves of pink colour, it is suggested that the probable cause of the pink colour is treatment with a radioactive solution. There was no visual evidence of heat treatment. R.A.H.
hackmanite/sodalite from Myanmar and Afghanistan. d. KOndO and d. beAtOn. Gems & Gemology, 45(1), 2009, 38–43.
Many samples of sodalite from Myanmar and about half of those studied from Afghanistan showed the distinct tenebrescence characteristic of hackmanite, but a few saturated blue-to-purple Myanmar specimens and some very desaturated Afghan specimens showed little or no colour change on exposure to UV radiation or bright
white light. Such stones with no or only very weak tenebrescence may best be referred to as sodalite (despite containing sulphur). It is suggested that only sodalite with notable tenebrescence be called hackmanite. R.A.H.
Gem news international. b. lAurS (ed.). Gems & Gemology, 44(3), 2009, 262–82.
Items mentioned include fluorite impersonating colour-change garnet, colourless cut forsterite from the Mogok area and from Tadjikistan, a tourmaline crystal within a crystal, a cluster of aquamarine crystals from Namibia showing trapiche structure and long crystals of spodumene extending from a matrix of K-feldspar reportedly from Afghanistan. R.A.H.
Gem News International.b.M. lAurS (Ed.). Gems & Gemology, 44(4), 2008, 369–79.
Items mentioned include a visit to andesine mines in Tibet and Inner Mongolia, a particularly vivid gem-quality kunzite from Pala, California, synthetic citrine with abundant nail-head spicules and a cobalt-blue synthetic quartz. R.A.H.
Gem news international. b. lAurS (ed.). Gems & Gemology, 45(1), 2009, 59–75.
Items noted include opals from Ethiopia, gem-quality rhodochrosite from China, colour-zoned Moroccan amethyst, cabochons of intergrown malachite and azurite, kornerupine from Tanzania, crystals of pink zoisite from Afghanistan, gem-quality blue kyanite from Myanmar, Australian chrysoprase with dendritic inclusions and inclusions of ankangite and celsian in quartz from Brazil (for which analyses are given). R.A.H.
Gem News International.b.M. lAurS (Ed.). Gems & Gemology, 45(2), 2009, 142–55.
Items mentioned include the first occurrence of a star apatite, translucent bluish-green crystals from Bahia State, Brazil, of 'sugarcane emerald' with white mottled veins (some set as jewellery), distinctly orange kyanite crystals from Tanzania, and unusual colourless cut stones of petalite (14.98 ct) and pollucite (11.30
The Journal of Gemmology / 2009 / Volume 31 / No. 5–8
Page 305
Abstracts (continued)
and 12.10 ct) reportedly from Laghman province, Afghanistan. A description is also given of mining in Cambodia for brownish zircons which yield blue crystals after heat treatment. R.A.H.
Gem News International.b.M. lAurS (Ed.). Gems & Gemology, 45(3), 2009, 214–32.
Brief descriptions are given of an 8 cm long aquamarine crystals with inclusions resembling seaweed, a phenakite from Madagascar exhibiting chatoyancy, garnets from Kenya showing a colour change from greenish in daylight to bluish violet in incandescent light, lilac-coloured Cu-bearing tourmaline from Nigeria, sapphires from the Vortex mine in Montana showing a uniform cornflower-blue colour and mabe pearls from Vietnam with seashell nuclei. R.A.H.
Polymer-filled aquamarine.li JiAnJun, S. yuAn, h. wAnGJiAO, l. hAn, c. yOuFA, l. huAFenG, l. yinG, y. hOnG and F. chenGxinG. Gems & Gemology, 45(3), 2009, 197–9.
Polymer-filled aquamarines which have been appearing on the Chinese jewellery market can be identified readily using a standard gemmological microscope as this material shows a flash effect and relief lines. Some of the filled fractures fluoresce chalky white in long-wave UV radiation. FTIR spectroscopy reveals diagnostic features at ~ 3100–2850 cm−1. R.A.H.
leD lightsources and gemmological instruments that analyse colour.T. lintOn. The Australian Gemmologist, 23(4), 2007, 177–9.
As the colour temperature of LEDs (light emitting diodes) can vary dramatically (from 5000 to 8000K). so does their effect on gemstones. The pleochroic and dichroic colours seen through a dichroscope have traditionally been obtained using tungsten lamps (2800K). Using the ‘whiter’ light of LEDs will alter these colours from what has hitherto been considered the standard. Three images show the different spectral absorptions of over 6000K LED, 6000K LED and 5000K daylight equivalent light, further showing how spectra can vary even within the close proximity of similar
temperature colour. The author suggests LEDs are very good for microscopic evaluations while a Solux 50W halogen lamp will better serve the purpose for a dichroscope and Chelsea colour filter. J.S.
Sanidin aus der eifel-als wasserklarer edelstein.H. lOcKer. Lapis, 34(6), 2009, 13–18.
Notably inclusion-free sanidine feldspar is described from the Eifel region of Germany. M.O'D.
echte edelsteine?H. lOcKer. Lapis, 34(9), 2009, 13–19.
It is suggested that a translucent to transparent blue volcanic glass from the Eifel region of Germany may have ornamental potential. M.O'D.
Mushroom elbaite from the Kat Chay mine, Momeik, near Mogok, Myanmar: II. Zoning and crystal growth.A. J. luSSier, F. c. hAwthOrne, S. herwiG, y. Abdu, P. M. AGuiAr, V. K. MichAeliS and S. KrOeKer. Mineralogical Magazine, 72(5), 2008, 999–1010.
A variety of mushroom tourmaline from the Kat Chay mine, Myanmar, has a black-to-grey single-crystal core, the remaining 50% consists of extremely acicular, sub-parallel crystals that diverge towards the edge of the mushroom. These acicular crystals are dominantly colourless to white, and pale pink outside the black zone. Microprobe results confirm that both the crystal core at the base of the mushroom and the material near the top are elbaite, the principal substitutions being Li + Al = 2 Fe and B + Al = Si + Fe. It is suggested that the changes in habit are driven in part by changes in external variables such as T and P. R.A.H.
Der opal Jaspis von tautenhain, Sachsen.J. lütich. Lapis, 34(1), 2009, 40-4.
Jasper with an opal-like play-of-colour against a predominantly orange-brown background is described from Tautenhain, Saxony, Germany. M.O'D.
Famous mineral localities: Volodarsk-Volynski, Zhitomir oblast, ukraine.P. lycKberG, V. chOrnOuSenKO and w.e. wilSOn. Mineralogical Record, 40(6), 2009, 473–506.
Green beryl and blue topaz, some with apparent gem potential, are described from a major pegmatite in north-central Ukraine. M.O'D.
the Sapo mine.l. MenZeS. Mineralogical Record, 40(4), 2009, 273–96.
Attractive and ornamental-quality crystals of apatite and tourmaline are described from the Sapo mine, located in a pegmatite about 40 km NW of Conselheiro Pena, Minas Gerais, Brazil. M.O'D.
Gemmologie Aktuell.c.c. MiliSendA and K. wehr. Gemmologie. Z. Dt. Gemmol. Ges., 58(3/4), 2009, 77–89.
16 photographs.
Transparent to translucent orange-
brown kyanite crystals were examined;
these were found in the new spessartine
garnet occurrence near Loliondo in north
Tanzania. Two rectangular faceted stones
of 0.30 ct and 0.80 ct were also received.
Also from Tanzania (Longido) came
some green oligoclase with an unusual
mint-green colour; the transparent faceted
stone weighed 8.64 ct. Also from Tanzania
came two faceted green kornerupines
and some faceted light yellowish-green
diopside.
Other stones described included a
demantoid garnet from Madagascar, a
sillimanite cat’s-eye from Guinea in West
Africa, a trapiche tourmaline from Zambia,
and pink fire quartz from Brazil. The
latter are rock crystals with aventurescent
inclusions. Also mentioned were euclase
from Colombia and colourless pollucite
from Pakistan; also from Pakistan some
green pargasite crystals and a brown-
yellow sphene twin with a greenish tinge
weighing 92.79 ct.
Also described are some scapolite
cat’s-eyes from Afghanistan; these are
violet transparent cabochons weighing
between 1.40 and 8.63 ct. Some greenish-
brown rough and faceted stones were
offered in the trade as dunilite. These
were identified as olivines, originally
described by Dunil P. Gunasekera, hence
the name dunilite.
Opaque white stones were recently
offered in the trade as howlites, but were
The Journal of Gemmology / 2009 / Volume 31 / No. 5–8
Page 306
Abstracts (continued)
identified as a barium-sulphate ceramic.
A transparent cushion-cut sapphire of
unusual neon-blue colour weighing 0.89
ct was shown to be cobalt treated. E.S.
edle Zirkone aus dem Sächsischen Vogtland.W. MOdAlecK, G. SeiFert and S. weiSS. Lapis, 34(2), 2009, 13–27.
Zircon of gem quality is described from the Vogtland area, Saxony, Germany. Specimens of various colour are illustrated: yellow to reddish-brown colours appear to dominate and phantom specimens (zircon in zircon) are also illustrated. M.O'D.
Collector profile: John S. white, Jr., and his single crystal collection. t.P. MOOre. Mineralogical Record, 40(3), 2009, 215–23.
A biography of the former Curator-in-Chief of the mineralogical collection at the Smithsonian and founder of the Mineralogical Record. Some examples from his collection of single crystals and twins are illustrated in colour. M.O'D.
what's new in Minerals.t.P. MOOre. Mineralogical Record, 40(3), 2009, 239–58.
Vayrynenite of gem quality was exhibited at the 2009 Tucson show. The orange crystal came from Shengus, Shigar Valley, Skardu District, Northern Areas, Pakistan. The crystal was displayed alongside a faceted stone of 1.89 ct. In the same show was a green twinned crystal of titanite from Mpwapwa, Dodoma Province, Tanzania. M.O'D.
Mexico V.t.P. MOOre, M. OriGlieri, t.c. wAllAce and b.l. crOSS. Mineralogical Record, 39(6), 2008, 13–26.
Beautifully illustrated survey of spectacular minerals found in Mexico. The text is well written. M.O'D.
lab Notes. t.M. MOSeS And S.F. Mcclure (edS). Gems & Gemology, 44(3), 2009, 252–60.
Notes are given on a citrine with Brazil law twinning visible to the naked eye, a 74 mm long inclusion of emerald in quartz, a calcite 'melt' in a Tanzanian grossular and a rare yellow trapiche sapphire. R.A.H.
lab Notes.t.M. MOSeS and S.F. Mcclure (Eds). Gems & Gemology, 44(4), 2008, 364–8.
A note is given of induced copper contamination of two cut 'water-melon' tourmalines. R.A.H.
lab Notes.t.M. MOSeS and S.F. Mcclure (Eds). Gems & Gemology, 45(2), 2009, 134–40.
Items noted include a 22.21 ct peridot with a distinct four-rayed star and a 5.44 ct tourmaline double cabochon showing silver chatoyancy on one side and a golden eye on the other. R.A.H.
lab Notes.t.M. MOSeS and S.F. Mcclure (Eds). Gems & Gemology, 45(3), 2009, 208–13.
Items noted include a striking 6.64 ct polished quartz crystal coloured green by inclusions of pumpellyite and a 2.62 mm long, doubly terminated columbite crystal inclusion in colourless topaz from Pakistan. R.A.H.
update on ammolite production from southern Alberta, Canada.K.A. MychAluK. Gems & Gemology, 45(3), 2009, 192–6.
Since 2001, the dominant supplier of ammolite (a gem material composed of aragonite in the shells of ammonites) from the area southwest of Lethbridge, Alberta, reports a 40% increase in finished stone production. 'Dinolite', in which ammolite is combined with siliceous dinosaur bone, is being produced as yet another use of ammolite. R.A.H.
lapis lazuli and phlogopite paragenesis from Sar-e-Sang deposit (Badakhshan, Afghanistan).l. nAtKAniec-nOwAK, w. heFliK and M. duMAnSKA-SłOwiK. Gemmologie. Z. Dt. Gemmol. Ges., 57(3/4), 2008, 103–12. 9 photographs, 1 table, bibl.
From the investigations of the overgrowths of lapis lazuli on phlogopite flakes from the Sar-e-Sang deposit in Afghanistan, it can be concluded that the paragenesis is a product of postmagmatic and metasomatic activities. E.S.
'Cristalli' — Sonderschau die Sammlung Adalberto Giazotto in Florenz.F. PeZZOttA and G. PrAteSi. Lapis, 34(10), 2009, 61–4.
Gem quality minerals are a feature of the Florentian Adalberto Giazotto. M.O'D.
Gota de Aceite: nomenclature for the finest Colombian emeralds. r. rinGSrud. Gems & Gemology, 44(3), 2009, 242–5.
The finest and rarest emeralds have been said to have an optical effect termed gota de aceite, used to describe a particular aspect of emerald clarity associated with Colombian emeralds. This phenomenon and the gemmological causes of it are described and illustrated. The term should be used only after a careful examination and an understanding of the growth
structures that cause the effect. R.A.H.
winza, ein neues Rubinvorkommen in tansania.K. SchMetZer, w. rAdl and d. SchwArZ. Lapis, 34(5), 2009, 41–6.
Ruby of gem quality is described from Winza in central Tanzania where it occurs in amphibolite. Some well-formed crystals are described and illustrated. M.O'D.
Rubine und Saphir aus winza-eine ergänzung.K. SchMetZer, w. rAdl and d. SchwArZ. Lapis, 34(6), 2009, 48.
Additional notes on ruby found at Winza, Tanzania. A table summarizing the morphologies of this material is given. M.O'D.
'Deutscher lapis': Der Nunkircher Jaspis und seine Verwendung.h. SchMitt. Lapis, 34(9), 2009, 20–4.
A bluish jasper thought to resemble lapis lazuli is reported from the Nunkircher area, Germany. M.O'D.
Rubies and sapphires from winza, central tanzania.d. SchwArZ, V. PArdieu, J.M. SAul, K. SchMetZer, b.M. lAurS, G. GiuliAni, l. KleMM, A.-K. MAlSy, e. erel, c. hAuZenberGer, G. du tOit, A.e. FAllicK and d. OhnenStetter. Gems & Gemology, 44(4), 2008, 322–47.
Rubies and sapphires are being mined from both eluvial and primary deposits at Winza. The gem corundum is related to 'dykes' of Proterozoic amphibolitic rocks. Prismatic-tabular-rhombohedral and dipyramidal types occur. In general, medium and dark red rubies are rhombohedral, whereas pink, purple
The Journal of Gemmology / 2009 / Volume 31 / No. 5–8
Page 307
Abstracts (continued)
and blue sapphires are, for the most part, dipyramidal. The top-quality rubies are characterized by long tube-, fibre-, needle- or hair-like inclusions containing limonitic material. The lower-quality material generally contains a larger amount of solid inclusions (mostly amphibole crystals), fissures and growth features. The corundum from this area has bluish violet colour zones parallel to the prism and basal pinacoid. A relatively high Fe content (>2370 ppm) of Winza rubies distinguishes them from most other natural and almost all synthetic counterparts.
R.A.H.
Natural gamma radioactivity and exploration for precious opal in Australia.b.r. SeniOr and l.t. chAddertOn. The Australian Gemmologist, 23(4), 2007, 160–76.
Through both spontaneous fissions, indicated by the high barium content, and radioactive decay of the trace elements uranium and thorium found in opals, there is a quantifiable amount of gamma ray emission. Utilizing the radioactive properties associated with opals and their surrounding environment it is possible using gamma ray logging to assess their location. Calibrated gamma ray logging can locate the host rock of opals, its quality and the relative depth. J.S.
Structural characterization and chemical composition of aragonite and vaterite in freshwater cultured pearls.A.l. SOldAti, d.e. JAcOb, u. wehrMeiSter and w. hOFMeiSter. Mineralogical Magazine, 72(2), 2008, 579–92.
Vaterite and aragonite in freshwater cultured pearls from mussels of the genus Hyriopsis (Unionidae) were structurally and compositionally characterized by Raman spectroscopy, micro computer tomography, high resolution field emission SEM and LA-ICP-MS. The appearance of vaterite in pearls is related to the initial stages of biomineralization, but vaterite cannot be a precursor to aragonite. Vaterite is not related to a particular crystal habit and therefore does not have a structural function in the pearls. Larger contents of such elements as P and S in vaterite, as well as larger total organic contents in vaterite as
opposed to aragonite, in conjunction with larger amounts of Mn2+ and Mg2+, imply a stabilizing role for organic molecules and X2+ ions for biological vaterite. Distribution coefficients between aragonite and vaterite for provenance-independent elements, such as Mn and Mg (0.27 and 0.04, respectively) agree very well with those observed in fish otoliths. R.A.H.
the Miguel Romero collection of Mexican minerals.t.c. wAllAce and others. Supplement to Mineralogical Record, 39(6), 2008.
Overview in colour of the Romero collection of Mexican minerals formed by the late Miguero Sanchez. Many specimens are ornamental or gem quality; none of the items illustrated have been fashioned. M.O'D.
Ruby suites from New South wales.G. webb. The Australian Gemmologist, 23(3), 2007, 99–116.
Corundum samples were analyzed for their gemmological features, absorption spectra, fluorescence, inclusions and chemical composition from seven New South Wales localities. Some trace elements seem to be diagnostic for the determination of geographic and geologic origin in some of the localities. Rubies from Swan Brook, Bingara, and Macquarie and Cudgegong rivers contain Sn, an element common in tin-bearing granite locations. Rubies from Swan Brook showed higher amounts of Ga compared to the surrounding localities, indicating magmatic inception. Other areas studied are Barrington Tops, Tumbarumba and Yarrowitch Valley. J.S.
Sammlersteine.K. wehr, c.c. MiliSendA and M. wild. Gemmologie. Z. Dt. Gemmol. Ges., 57(3/4), 2008, 113–32. 20 photographs, 2 graphs, 1 table, bibl.
Collector stones are not commercially viable due to their low hardness, perfect cleavage, low resistance to heat, brittleness or solubility in water, which makes cutting and faceting difficult. Some of these rare gemstones have recently been examined by the DSEF German Gem Lab and are presented in this article together with photographs and physical and optical properties. They are anatase from Pakistan,
parisite from Colombia, anglesite from Morocco, charlesite from South Africa, rhodizite-londonite from Madagascar, powellite from India, montebrasite from Brazil, xenotime from Afghanistan, monazite from Brazil, lazulite from Brazil, triphylite-lithiophilite mixed crystal from Brazil, triplite from Afghanistan, kovdorskite from Russia, legrandite from Mexico, katapleite from Canada, hackmanite from Afghanistan and Canada, staurolite from Brazil, chromepidote (tawmawite) from Pakistan, vlasovite from Canada, leucite from Italy, enstatite from Tanzania, poldervaartite-olmiite mixed crystal from South Africa and whewellite from Saxony (Germany). Many reflection spectra are given. There is also an extensive table showing the chemical composition, colour, RI, DR, density, hardness and literary references for these stones. E.S.
Photochromismus in hackmaniten aus Afghanistan und Myanmar.K. wehr, c.c. MiliSendA and M. wild.Gemmologie. Z. Dt. Gemmol. Ges., 58(3/4),
2009, 115–26. 10 photographs, 5 graphs,
bibl.
Some gem-quality sodalites and
hackmanites have recently appeared in
the trade; they have been mined in the
Badakhshan Province in Afghanistan and
in the Mogok area in Myanmar. The term
hackmanite has been used either for the
sulphur-bearing and/or pink variety that
shows tenebrescence (photochromism),
i.e. they changed their colour commonly
to an intense violet in response to either
sunlight or UV exposure and faded when
kept in the dark or by exposure to white
light. E.S.
Röntgen-Mikro-Computertomographie: Zerstörungsfreier einblick in das Innere von Zuchtperlen.u. wehrMeiSter, A. SOldAti, h. GOetZ, d.e. JAcOb, w. xu, h. duSchner and w. hOFMeiSter. Gemmologie. Z. Dt. Gemmol. Ges., 58(1/2), 2009, 53–66. 7 X-rays and tomographs, 1 table, bibl.
Computerized three-dimensional X-ray micro tomography is capable of revealing the internal structure and some of the material properties of pearls at high resolution, and is thus a more useful tool
The Journal of Gemmology / 2009 / Volume 31 / No. 5–8
Page 308
Abstracts (continued)
in pearl testing than conventional X-ray radiography. Differences in transparency to X-rays (radiodensities) can be detected and speed up the process locating different CaCO
3 polymorphs. When
combined with Raman spectroscopy, vaterite-containing areas can be identified. E.S.
hyazinthe und 'Malakone' im ofen: Zur Farbursache und Fluoreszenz sächsisch/bayerischer Zirkone.S. weiSS and S. Meier. Lapis, 34(2), 2009, 37–40.
The colour of zircon from different localities is described with notes on chemical composition and its possible influence on colour. M.O'D.
Neufund: Kupferhaltiger Aquamarin aus dem Binntal.S. weiSS and A. GOrSAtt. Lapis, 34(10), 2009, 54–60.
Aquamarine is reported from the Binntal area of Switzerland which may owe its colour to copper. M.O'D.
wilensky fine materials.W.E. wilSOn. Supplement to Mineralogical Record, 40(3), 2009.
Several mineral examples with possible ornamental quality are featured in this survey of some of the collection of Wilensky Fine Minerals. The survey includes very high-quality colour photographs. M.O'D.
Famous mineral localities: the Merelani tanzanite mines, lelatema Mountains, Arusha Region, tanzania.w.e. wilSOn, J.M. SAul, V. PArdieu and R.W. huGheS. The Mineralogical Record, 40(5), 2009, 346–408.
History of the discovery and development of the tanzanite mines at Merelani, Tanzania, with illustrations of major specimens retrieved and brief biographies of some of those engaged in the prospecting and marketing. M.O'D.
Pressures beyond rubies.A. wriGht. Geoscientist, 19(11), 2009, 16–17.
An exceptionally large specimen of ruby in zoisite is described from the Merkerstein area of northern Tanzania. M.O'D.
Gem-quality yellow-green haüyne from oldoinyo lengai volcano, northern tanzania.A.n. ZAitSeV, O.A. ZAitSeVA, A.K. buyKO, J. Keller, J. KlAudiuS and A.A. ZOlOtAreV. (Ed.). Gems & Gemology, 45(3), 2009, 200–3.
Yellow-green to green-yellow gem-quality haüyne is reported for the first time from an alkaline plutonic rock from the active Oldoinyo Lengai volcano. The haüyne has the typical optical and physical properties for sodalite-group minerals. Infrared and Raman spectroscopy showed that in addition to the (SO
4)2− group, this mineral also
contains (NO3)−, (CO
3)2−, and water in the
structure. The presence of Ca, Al, and Si as major cations, with minor K, was confirmed. A 1.53 ct brilliant cut yellow-green faceted stone is illustrated. R.A.H.
Instruments and Techniques
Application of the Vis-NIR Avaspec-2048 portable automatic spectrometer to distinguish gem-quality materials.D. bernini, F. cAuciA and M. bOiOcchi. S. Neues Jahrbuch für Mineralogie, Abhandlungen, 185(3), 2009, 281–8.
The use of the Avaspec-2048 fibre optic spectrometer to analyse the Vis-NIR spectra of cut gemstones is described. For each sample, however, the spectrum is influenced by such factors as the shape of the stone, the number of carats, the size of the exposed surface, and the intensity and tonality of the colour. An efficient use of this instrument to discriminate gemstones is only possible after a large and comprehensive database has been developed. R.A.H.
A new type of synthetic fire opal: Mexifire. G. chOudhAry And r. bhAndAri. Gems & Gemology, 44(3), 2009, 228–33.
A description is given of a new type
of fire opal marketed as 'Mexifire'. Some of its gemmological properties are similar to those of natural fire opal, though the low specific gravity of <1.77 offers strong evidence for a synthetic origin. Further indications of this include the relatively low refractive index of <1.40 and the presence of scattered pinpoint inclusions when examined at high magnification.
R.A.H.
Identification of melee-size synthetic yellow diamonds in jewelry. h. KitAwAKi, A. AbduriyiM and M. OKAnO. Gems & Gemology, 44(3), 2009, 202–13.
Melee-sized (0.05–0.30 ct) yellow synthetic diamonds have been examined using infrared microspectroscopy in combination with cathodoluminescence imaging for rapid and accurate distinction between these sizes of natural and synthetic diamonds, based on their characteristic mid-IR absorption spectra and growth structures. It has been established that approximately 10% of loose and dozens of mounted yellow melee diamonds submitted recently were synthetic. R.A.H.
the trueGemColor system: a new computer color imaging system based on a uniform CIelAB color space for color grading of gemstones.Y. Liu and K.N. Hurwit. Gemmologie. Z. Dt. Gemmol. Ges., 57(3/4), 2008, 133–42. 6 charts, 3 graphs, bibl.
A computer colour imaging system has been developed that incorporates a Universal Colour Grading system based on a uniform CIELAB colour space with 22 hues, 7 lightness levels and 4 saturation intensities. This system gives a reference colour grade which matches the average colour of the gemstone to be graded under standard light conditions (CIE D65 light source and neutral surrounding background) and also provides a corresponding CIELAB colour coordinate. For coloured diamonds, it gives the colour grade using fancy colour diamond terminology. The colour is precisely profiled and can be calibrated by the user. E.S.
AbstractorsR.A. Howie – R.A.H. M. O'Donoghue – M.O'D. J. Sheby – J.S. E. Stern – E.S.

For further information or to book for a workshop go to www.gem-a.com or call Paveet Amrit on +44 (0)20 7404 3334 email [email protected]
Mon 8 March ALLURE OF GEMS The perfect introduction to the world of gemstones. £97.00. Gem-A members and students £79.00
Mon 22 March INTRODUCTION TO PRACTICAL GEMMOLOGY How to test gems with basic gemmological equipment. Ideal for anyone considering a more in-depth study of gemmology and would like a 'taster' or for those wanting to brush up on existing skills. £97.00. Gem-A members and students £79.00
Mon 12 April DIAMOND BUYING GUIDE An introduction to the 4Cs, carat weight, colour, clarity and cut. £97.00. Gem-A members and students £79.00
Wed 28 April BEAD STRINGING I An introduction to the techniques needed for basic bead stringing. £156.00. Gem-A members and students £115.00
Thurs 29 April BEAD STRINGING II Gain an insight into the techniques needed for multi-strand and graduated beads, and some of the more complicated designs. £156.00. Gem-A members and students £115.00
Mon 26 April RUBY, SAPPHIRE AND EMERALD A day dedicated these important gemstones and their treatments, imitations and synthetic counterparts. £97.00. Gem-A members and students £79.00
From its headquarters in the Hatton Garden jewellery quarter, Gem-A provides a varied programme of workshops ranging from an introduction to the fascinating world of gemstones to information on the latest synthetic and treated gemstones.
Gem-A WORKShOPS Spring 2010
The GemmoloGical associaTion of GreaT BriTain
Gem-A
Gem-A Shop
Don't miss the monthly SPECIAL OFFERS on books and instruments from the
Gem-A Shop
Log on to the Gem-A website at www.gem-a.com to discover what is on offer each month.
The Journal of Gemmology / 2009 / Volume 31 / No. 5–8
Page 310
Book reviews
laboratory-grown Diamonds. Information Guide to hPht and CVD-grown Diamonds. Second edition.brAnKO delJAnin and duSAn SiMic, 2009. Gemology Headquarters International, Mumbai, India. pp 86. £15.00.
Attractively produced, well referenced and with many small but sharp colour photographs, this is a useful guide to the fast-changing diamond synthesis scene. HPHT and CVD-grown diamonds are highlighted. M.O’D.
eifel. Die Mineralien der Vulkaneifel. extralapis No. 34.2008. Weise, Munich, Germany. pp 98, illus. in colour. . €17.80.
Minerals, some of near-gem or ornamental quality, are described from the Eifel region of Germany. The area is noted for hauyne, a species of the forsterite-fayalite series, and for fine examples of bright orange hematite of micromount size. Details of the volcanic geology are described. M.O’D.
Freiberg. Mineralien, Bergbau und Museen. extralapis No. 36.2009. Weise, Munich, Germany. pp 100, illus. in colour. €17.80.
Survey, of the major mineral deposits, species and mineralogical museum collections of the Freiberg area of Germany. M.O’D.
the Immortal Stone: Chinese Jades from the Neolithic Period to the twentieth Century.JAMeS c.S. lin, 2009. Scala, London. pp 160. Illus. in colour. Hardcover, ISBN 978 1 85759 581 9 £29.95; paperback ISBN 9781857595949 £14.95.
This attractive and welcome survey is the first catalogue of the important collection of jades in the Fitzwilliam Museum, Cambridge. The collection consists largely of specimens bequested
by Oscar Raphael in 1946 and contains many items of high quality which are illustrated in colour in the book with a high standard of reproduction.
The book also includes an essay on the nature of the two jade minerals and on the use and significance of jade in different dynasties: there is a comprehensive bibliography and a table of Chinese characters to be found on the jade artefacts in the collection. Notes are given on the marketing of jade in and from the Song Dynasty of 960–1279, and from earlier dynasties. I have rarely seen a study in any field to equal this. M.O’D.
China: Mineralien, Fundstellen, lagerstätten. berthOld OttenS, 2008. Weise, Munich, Germany. pp 552, illus. in colour. Hardcover, €59.00. (In German.)
An English language version of this exhaustive survey of minerals of China would be most welcome. Many items depicted appear to be of ornamental quality. M.O’D.
Quartz. extralapis No. 37.2009. Weise, Munich, Germany. pp 100, illus. in colour. €17.80.
Well illustrated but lacking a bibliography, this survey of the quartz varieties is well up to the standard of this long-running series. M.O’D.
emeralds: A Passionate Guide.rOnAld rinGSrud, 2009. Green View press, Oxnard, California. pp 382. £75.00.
Most attractively illustrated overview of the nature of emerald, printed on heavy art paper which allows excellent reproduction of the colour photographs. As well as being a guide to the history, appreciation and grading of emeralds, it is a good read and invaluable to the gem dealer and appraiser. M.O’D.
American Mineral treasures.G. StAebler and w.e. wilSOn, 2008. Lithographie LLC, East Hampton, Connecticut. pp 368. Hardcover, ISBN 9780979099823. Price US$85.00.
This is a magnificent book, unequalled and a most welcome survey, beautifully illustrated with photographs of the highest quality. The page size is 33 x 24 cm and there are 368 of them. Every opening shows some colour. Due to the excellent paper and the solid binding, the book needs to be supported when consulted.
The arrangement of the text appears to be random but a clear index precedes the major descriptive section. A comprehensive bibliography and literature for further reading completes the book.
The aim of the book is to introduce and describe some of the major mineral deposits of the United States and to illustrate the finest specimens obtained from them. Very many of the sites described produce gem material and so the book is of especial value for the gemmologist. Naturally most of the alluvial deposits are not covered as site and product might be less visually arresting.
Historical notes are plentiful and their profusion shows the depth of the source material consulted for the book.
I cannot sufficiently praise the enterprise of the authors and their assistants. The book may perhaps provide a ‘Tucson at home’. M.O.D.
Gems and Mines of Mogok.t. theMeliS, 2008. A & T Publishers, Bangkok. 352 pp. Over 800 colour figures, most of which are made up of several items. Hard cover. ISBN 0940-965-30-5. US$ 129 plus postage and packing.
There is far more in this book than the title would suggest and it is a photographic feast. It covers the history of the area, its geological evolution, mineralogy and crystallography; it
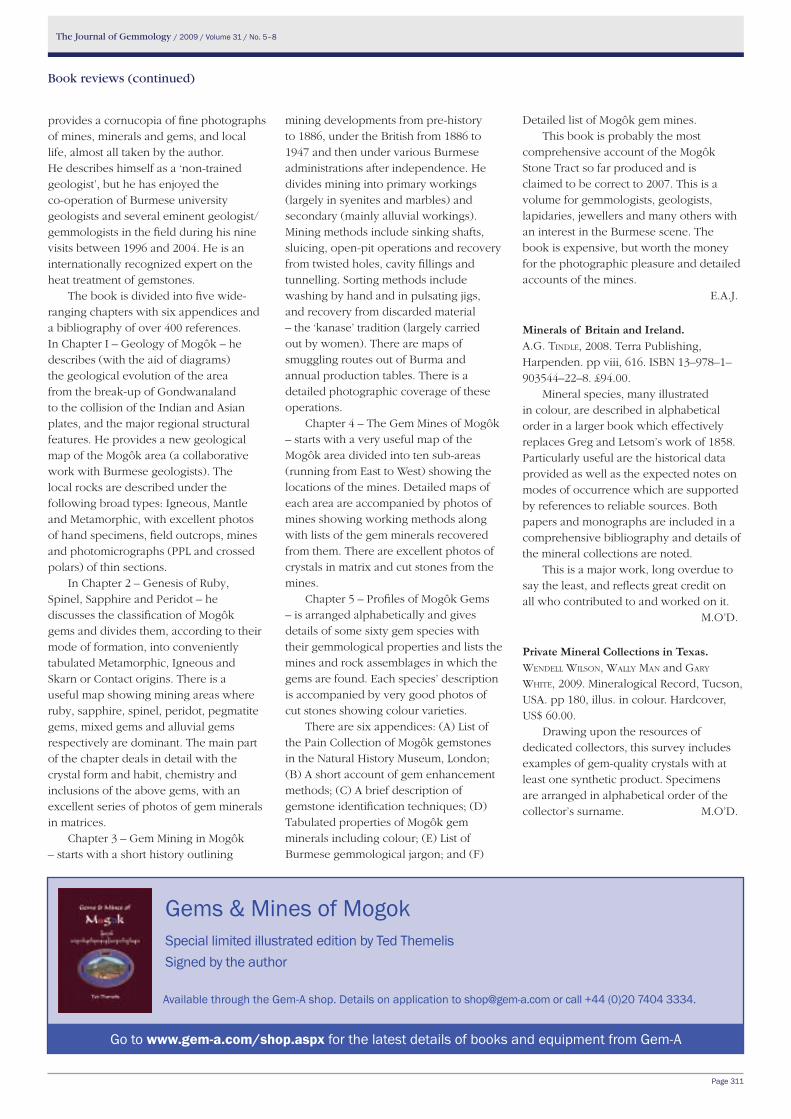
The Journal of Gemmology / 2009 / Volume 31 / No. 5–8
Page 311
Book reviews (continued)
provides a cornucopia of fine photographs of mines, minerals and gems, and local life, almost all taken by the author. He describes himself as a ‘non-trained geologist’, but he has enjoyed the co-operation of Burmese university geologists and several eminent geologist/gemmologists in the field during his nine visits between 1996 and 2004. He is an internationally recognized expert on the heat treatment of gemstones.
The book is divided into five wide-ranging chapters with six appendices and a bibliography of over 400 references. In Chapter I – Geology of Mogôk – he describes (with the aid of diagrams) the geological evolution of the area from the break-up of Gondwanaland to the collision of the Indian and Asian plates, and the major regional structural features. He provides a new geological map of the Mogôk area (a collaborative work with Burmese geologists). The local rocks are described under the following broad types: Igneous, Mantle and Metamorphic, with excellent photos of hand specimens, field outcrops, mines and photomicrographs (PPL and crossed polars) of thin sections.
In Chapter 2 – Genesis of Ruby, Spinel, Sapphire and Peridot – he discusses the classification of Mogôk gems and divides them, according to their mode of formation, into conveniently tabulated Metamorphic, Igneous and Skarn or Contact origins. There is a useful map showing mining areas where ruby, sapphire, spinel, peridot, pegmatite gems, mixed gems and alluvial gems respectively are dominant. The main part of the chapter deals in detail with the crystal form and habit, chemistry and inclusions of the above gems, with an excellent series of photos of gem minerals in matrices.
Chapter 3 – Gem Mining in Mogôk – starts with a short history outlining
mining developments from pre-history to 1886, under the British from 1886 to 1947 and then under various Burmese administrations after independence. He divides mining into primary workings (largely in syenites and marbles) and secondary (mainly alluvial workings). Mining methods include sinking shafts, sluicing, open-pit operations and recovery from twisted holes, cavity fillings and tunnelling. Sorting methods include washing by hand and in pulsating jigs, and recovery from discarded material – the ‘kanase’ tradition (largely carried out by women). There are maps of smuggling routes out of Burma and annual production tables. There is a detailed photographic coverage of these operations.
Chapter 4 – The Gem Mines of Mogôk – starts with a very useful map of the Mogôk area divided into ten sub-areas (running from East to West) showing the locations of the mines. Detailed maps of each area are accompanied by photos of mines showing working methods along with lists of the gem minerals recovered from them. There are excellent photos of crystals in matrix and cut stones from the mines.
Chapter 5 – Profiles of Mogôk Gems – is arranged alphabetically and gives details of some sixty gem species with their gemmological properties and lists the mines and rock assemblages in which the gems are found. Each species’ description is accompanied by very good photos of cut stones showing colour varieties.
There are six appendices: (A) List of the Pain Collection of Mogôk gemstones in the Natural History Museum, London; (B) A short account of gem enhancement methods; (C) A brief description of gemstone identification techniques; (D) Tabulated properties of Mogôk gem minerals including colour; (E) List of Burmese gemmological jargon; and (F)
Detailed list of Mogôk gem mines.This book is probably the most
comprehensive account of the Mogôk Stone Tract so far produced and is claimed to be correct to 2007. This is a volume for gemmologists, geologists, lapidaries, jewellers and many others with an interest in the Burmese scene. The book is expensive, but worth the money for the photographic pleasure and detailed accounts of the mines.
E.A.J.
Minerals of Britain and Ireland.A.G. tindle, 2008. Terra Publishing, Harpenden. pp viii, 616. ISBN 13–978–1–903544–22–8. £94.00.
Mineral species, many illustrated in colour, are described in alphabetical order in a larger book which effectively replaces Greg and Letsom’s work of 1858. Particularly useful are the historical data provided as well as the expected notes on modes of occurrence which are supported by references to reliable sources. Both papers and monographs are included in a comprehensive bibliography and details of the mineral collections are noted.
This is a major work, long overdue to say the least, and reflects great credit on all who contributed to and worked on it.
M.O’D.
Private Mineral Collections in texas.wendell wilSOn, wAlly MAn and GAry white, 2009. Mineralogical Record, Tucson, USA. pp 180, illus. in colour. Hardcover, US$ 60.00.
Drawing upon the resources of dedicated collectors, this survey includes examples of gem-quality crystals with at least one synthetic product. Specimens are arranged in alphabetical order of the collector’s surname. M.O’D.
Available through the Gem-A shop. Details on application to [email protected] or call +44 (0)20 7404 3334.
Gems & Mines of MogokSpecial limited illustrated edition by Ted ThemelisSigned by the author
Go to www.gem-a.com/shop.aspx for the latest details of books and equipment from Gem-A
The Journal of Gemmology / 2009 / Volume 31 / No. 5–8
Page 312
Proceedings of the Gemmological Association of Great Britain and Notices
Gem-A Conference: Showing Colour The 2009 annual Conference, held on Sunday 18
October at the Hilton London Kensington Hotel,
celebrated the 75th anniversary of the introduction of the
Chelsea Colour Filter with the theme 'showing Colour'.
Speakers included Brian Dunn, Thomas Hainschwang,
John Harris, Alan Hodgkinson, Harry Levy, Antoinette
Matlins, Dr Karl Schmetzer and Dr Menahem Sevdermish.
The conference was followed by a candlelit dinner at
the hotel.
A programme of events and workshops arranged to
coincide with the Conference was held on Monday 19
and Tuesday 20 October. These included the Graduation
Ceremony at Goldsmiths’ Hall (see below), and a guided
tour of the Crown Jewels at the Tower of London
with David Thomas. Following the theme 'Showing
Colour', a half-day workshop on the practical use of the
spectroscope with John Harris as guest tutor was held on
the morning of Monday 19 October and the final event
was Gem Discovery Club with guest speaker Beatrice
Gimpel who demonstrated how gems and pearls can
complement a person's colouring and also how to mix
stones for best effect.
A report of the Conference was published in the
October 2009 issue of Gems & Jewellery.
Graduation CeremonyOn Monday 19 October the Graduation Ceremony and
Presentation of Awards was held at Goldsmiths’ Hall in
the City of London. Professor Andy Rankin, President
of the Gemmological Association, presided and Alan
Hodgkinson, President of the Scottish Gemmological
Association presented the awards and gave the address.
Following the presentations to the graduates, it was
announced that John Harris of Dudar, Cumbria, had been
awarded the R. Keith Mitchell Award for Excellence in the
Field of Gemmological Spectroscopy, an award introduced
in 2006 in honour of the late R. Keith Mitchell. A Gem-A
gemmology tutor since 1986, John Harris is renowned
for his work with the spectroscope and his outstanding
photography of spectra.
During the ceremony it was also announced that E. Alan
Jobbins and Michael J. O'Donoghue had been appointed
Vice Presidents of the Association in appreciation of their
commitment to gemmological education for many years.
In his address, Alan Hodgkinson stressed to the
graduates the importance of taking every opportunity to
improve and increase their gemmological knowledge and
to 'go that extra mile'. He concluded: "Of all the careers
that are on offer, I cannot imagine one which is so full
Conference Sponsors and Supporters:
The Association is most grateful to the following for their support:
Major SponsorsMarcus McCallum FGA, Londonw: www.marcusmccallum.comt.h. March, Insurance Brokersw: www.thmarch.co.uk
SupportersBenjamin Zucker Precious Stones Company, New York, U.S.A.Apsaraw: apsara.co.ukMarcia lanyon ltd w: www.marcialanyon.co.uk
Sponsorship of Leaflets and Badges dg3 Diversified Global Graphics Group w: www.dg3.com
Gem-A Events
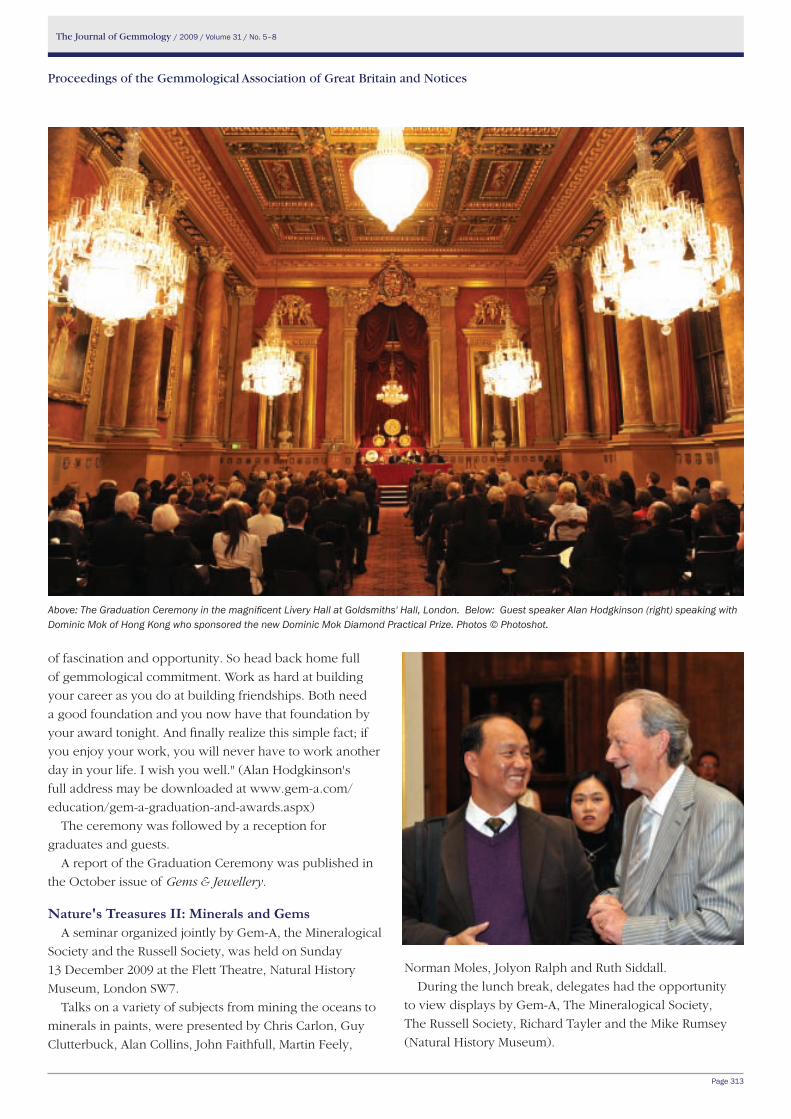
The Journal of Gemmology / 2009 / Volume 31 / No. 5–8
Page 313
Proceedings of the Gemmological Association of Great Britain and Notices
Norman Moles, Jolyon Ralph and Ruth Siddall.
During the lunch break, delegates had the opportunity
to view displays by Gem-A, The Mineralogical Society,
The Russell Society, Richard Tayler and the Mike Rumsey
(Natural History Museum).
of fascination and opportunity. So head back home full
of gemmological commitment. Work as hard at building
your career as you do at building friendships. Both need
a good foundation and you now have that foundation by
your award tonight. And finally realize this simple fact; if
you enjoy your work, you will never have to work another
day in your life. I wish you well." (Alan Hodgkinson's
full address may be downloaded at www.gem-a.com/
education/gem-a-graduation-and-awards.aspx)
The ceremony was followed by a reception for
graduates and guests.
A report of the Graduation Ceremony was published in
the October issue of Gems & Jewellery.
Nature's treasures II: Minerals and GemsA seminar organized jointly by Gem-A, the Mineralogical
Society and the Russell Society, was held on Sunday
13 December 2009 at the Flett Theatre, Natural History
Museum, London SW7.
Talks on a variety of subjects from mining the oceans to
minerals in paints, were presented by Chris Carlon, Guy
Clutterbuck, Alan Collins, John Faithfull, Martin Feely,
Above: The Graduation Ceremony in the magnificent Livery Hall at Goldsmiths' Hall, London. Below: Guest speaker Alan Hodgkinson (right) speaking with Dominic Mok of Hong Kong who sponsored the new Dominic Mok Diamond Practical Prize. Photos © Photoshot.
The Journal of Gemmology / 2009 / Volume 31 / No. 5–8
Page 314
Proceedings of the Gemmological Association of Great Britain and Notices
Gem-A Examinations were held worldwide in January and June 2009. In the Examinations in Gemmology 376
candidates sat for the Diploma Examination of whom 205 qualified, including two with Distinction and 31 with Merit.
In the Foundation in Gemmology Examination, 434 candidates sat of whom 335 qualified. In the Gem Diamond
Examination 178 candidates sat of whom 108 qualified, including eight with Distinction and 14 with Merit.
The Christie’s Prize for Gemmology for the best candidate of the year in the Diploma Examination was awarded to
Noémie Georgy of St Remy Les Chevreuse, France.
The Anderson Bank Prize for the best set of theory papers in the Diploma in Gemmology examination was
awarded to Yang Shuo of Hubei, China.
In 2008 we awarded for the first time a Diploma Practical Prize for excellence in the Diploma Practical Examination.
This has has been named the Read Practical Prize in memory of Peter Read who sadly died earlier in the year. The
prize was sponsored for 2009 by DeeDee Cunningham of Toronto, Canada, who also kindly donated a copy of
her book The Diamond Compendium. The Read Practical Prize was awarded to Amy Campbell-Jones of Sheffield,
Yorkshire.
In the Foundation Certificate in Gemmology examination, the Anderson Medal for the candidate who submitted
the best set of answers which, in the opinion of the Examiners, were of sufficiently high standard, and the hirsh Foundation Award for the best candidate of the year, were awarded to louise Dennis of Halesowen, West Midlands.
In the Gem Diamond Diploma examination, the Bruton Medal, awarded for the best set of theory answer papers
of the year, and the Deeks Diamond Prize for the best candidate of the year, were awarded to Antonia Ross of Fleet,
Hampshire.
A new prize, the Dominic Mok Diamond Practical Prize for excellence in the Diamond Practical Examination, was
awarded for the first time, sponsored by Dominic Mok from AGIL, Hong Kong. The Dominic Mok Diamond Practical
Prize was awarded to May wai ho of Hong Kong
The Tully Medal was not awarded.
The names of the successful candidates are listed below.
Gem-A Awards
Gemmology Diploma
Qualified with Distinction
Georgy, Noémie, St Remy Les Chevreuse, FranceZhong Feng, Beijing, P.R. China
Qualified with Merit
Campbell-Jones, Amy V., Sheffield, Yorkshire Cathelineau, Thierry, Les Breviaires, FranceChan Wai Sze, New Territories, Hong Kong Chen Xi, Beijing, P.R. ChinaCong Li, Wuhan, Hubei, P.R. ChinaEastwood, Layla, Bellaire, Texas, U.S.A. Gan, Cuiling, Guilin, Guangxi, P.R. ChinaHarris, Kay, Allendale, NorthumberlandHe Fei, Wuhan, Hubei, P.R. ChinaHovi, Maria, Hyvinkää, FinlandHuby, Melanie, Liège, BelgiumKong Jin, Wuhan, Hubei, P.R. ChinaLeavey, Harriet, Worcester
Li Yi, Guilin, Guanxi, P.R. ChinaLi Yujiao, Guilin, Guangxi, P.R. ChinaLi Xiao, Da Zu County, Ching Qing City, P.R. ChinaLiang Huan, Guilin, Guanxi, P.R. ChinaLiu Mei, Beijing, P.R. ChinaMing Yan, Guilin, Guanxi, P.R. ChinaNgan Yin Ying, Kowloon, Hong KongPareek, Subhash, Gujarat, IndiaParvela-Säde, Anu Liisa Johanna, Espoo, FinlandQi Ming, Guilin, Guanxi, P.R. ChinaRakotoharinavalona, Tahiana Lalaina, Antananarivo,
MadagascarSugihara, Toshiyuki, Osaka, JapanVersini, Valerie, Marseille, FranceWang Xia, Beijing, P.R. ChinaXu Jiahui, Guilin, Guangxi, P.R. ChinaYan Yaying, Guilin, Guanxi, P.R. ChinaYang Shuo, Jingzhou City, Hubei, P.R. ChinaZhan Zhanwen, Wuhan, Hubei, P.R. China
Examinations in Gemmology
The Journal of Gemmology / 2009 / Volume 31 / No. 5–8
Page 315
Proceedings of the Gemmological Association of Great Britain and Notices
Qualified
Abey, Sara, LondonAboosalih, Najeema Shahin, Colombo, Sri LankaAmrit, Paveet, Northolt, MiddlesexAu, Anita Suet Ki, Kowloon, Hong KongBahri, Sebastien, Feucherolles, FranceBaptiste, Karen Anne, Panadura, Sri LankaBecquaert, Gregory Julien Pascal, Saint-Jans-Cappel,
FranceBlagg, Natalie, LondonBurton, Estelle, Surbiton, SurreyCai Min, Guilin, Guangxi, P.R. ChinaCao Juan, Shanghai, P.R. ChinaCao Weifeng, Guilin, Guanxi, P.R. ChinaCartier, Laurent E., Ribeauvillé, FranceChan Kin Chung, Kowloon, Hong KongChatellain, Yannick, Bonneville, FranceChen Anny Shin-Mien, Taipei, Taiwan R.O.C.Chen Ge, Guilin, Guangxi, P.R. ChinaChen Hsiang Ling, Taipei, Taiwan R.O.C.Chen Tianran, Guilin, Guangxi, P.R. ChinaChen Wenlong, Beijing, P.R. ChinaChen Ying, Guilin, Guangxi, P.R. ChinaChen Yuemei, Guilin, Guangxi, P.R. ChinaCheng Qi, Guilin, Guangxi, P.R. ChinaCheng Yu-Lin, Taipei, Taiwan R.O.C.Cheung Suk Wan, New Territories, Hong Kong Chien Hung-Dau, Wuhan, Hubei, P.R. ChinaChit Su Su Lin, Mogok, MyanmarChou Mei-Lien, Taipei, Taiwan R.O.C.Chrismas, Jacqueline, Godalming, Surrey, Chu Chanyuan, Beijing, P.R. ChinaChu Kong Ting, New Territories, Hong Kong Chung Tsz Bun, Kowloon, Hong Kong Coquel, Isabelle, Saint Germain Laprade, Francede Josselin de Jong, J.P., Amsterdam, The NetherlandsDonsin, Julie, Verviers, BelgiumEvans, Natalie, LondonFeng Heng YI, Beijing, P.R. ChinaFu Kangyu, Guilin, Guanxi, P.R. ChinaGabay, Nicole, Montrouge, FranceGonzalez, Olga, New York, U.S.A.Grounds, Camilla Sara, LondonGuo Haifeng, Shanghai, P.R. ChinaGuo Hao, Guilin, Guanxi, P.R. ChinaGuo Yingli, Guilin, Guanxi, P.R. ChinaGuo Yunrong, Shanghai, Changning District, P.R. China Hara, Shintarou, Sasebo City, Nagasaki Pref., JapanHartono, Djayani, Mount Tamborine, Queensland,
Australia Häyry, Tiia, Hinthaara, Porroo, FinlandHirisy, Elisabeth, Ramboahangy Ranse, Madagascar
Hollaar, Alexa, Bias, France Hong, Nabin, Shanghai, P.R. ChinaHonour, Kevin J., Yeading, MiddlesexHu Jie, Guilin, Guangxi, P.R. ChinaHuang Shanshan, Beijing, P.R. ChinaHughes, Kym Renaye, Nerang, Queensland, Australia Jain, Devesh, Delhi, IndiaJansch, Peter Alexander, LuxembourgJeong, Eun Ah, Kofu City, Yamanashi Pref., JapanJohnston, Nanette LeTendre, Granite Bay, California,
U.S.A.Johnstone, Isobel Phebe, Brisbane, Queensland,
Australia Kagia, Georgia, Nikea, GreeceKambale, Sonia, Maharashtra, IndiaKettle, Georgina Elizabeth, Birmingham, West Midlands, Keung Wing Fun, Hong KongKovanovic, Milena, LondonKrska, Gemma, Durban, South AfricaKuchard, Monika, LondonLepage, Anick, Mont Saint Hilaire, Quebec, Canada Leung Rakotovao, Anna, Antananarivo, Madagascar Li Chunlin, Wuhan, Hubei, P.R. ChinaLi Geng, Beijing, P.R. ChinaLi Jiaxuan, Guilin, Guanxi, P.R. ChinaLi Lin, Guilin, Guanxi, P.R. ChinaLi Qian, Wuhan, Hubei, P.R. ChinaLi Qianhui, Wuhan, Hubei, P.R. ChinaLi Ruimin, Xi An City, Shanxi Province, P.R. ChinaLi Zhuonan, Shanghai, P.R. ChinaLilley, Heather Jane, Newcastle-under-Lyme,
Staffordshire, Liu Hailan, Shanghai, P.R. ChinaLiu Jingna, Guilin, Guangxi, P.R. ChinaLiu Liping, Guilin, Guangxi, P.R. ChinaLiu Xianfeng, Shanghai, P.R. ChinaLoke Hui Ying, Singapore Lu Yisha, Wuhan, Hubei, P.R. ChinaMa Hoi Shan, Kowloon, Hong Kong Ma Tsz Kwan, New Territories, Hong Kong Ma Xu, Guilin, Guanxi, P.R. ChinaMaccaferri, Arianna, LondonMclachlan, David, Woking, SurreyMan Sai Wing, Yuen Long, Hong Kong Matsukawa, Kent, Yokohama, JapanMergalet, Caroline, Villefranche-sur-Mer, FranceMithaiwala, Priyanka M., Surat, India Mizukami, Yusuke, Saitama City, Saitama Pref., JapanMooney, Robert John, Cooroy, Queensland, Australia Muhhamedjanova, Jelena, Tallinn, Estonia Muller, Paul, Antananarivo, MadagascarMurakami, Akiko, Tokyo, Japan
The Journal of Gemmology / 2009 / Volume 31 / No. 5–8
Page 316
Proceedings of the Gemmological Association of Great Britain and Notices
Wiguna, Aland, Surabaya, IndonesiaWright, Lee Peter, Chaddesley Corbett, Worcestershire Wu Na, Guilin, Guanxi, P.R. ChinaXiang Tingyi, Wuhan, Hubei, P.R. ChinaXu Gengbo, Wuhan, Hubei, P.R. ChinaXu Zhao, Shanghai, P.R. China Yang Pei-Chi, Taipei, Taiwan R.O.C.Yang Yiwei, LondonYang Zhuo, Guangzhou, P.R. ChinaYip Long Ching, Hong Kong Young, Stephanie Lynne, Chalfont St. Peter,
BuckinghamshireYu, Byron Kwai Sang, New Territories, Hong KongYu Zhiwei, Shanghai, P.R. ChinaYuan Yi, Guilin, Guangxi, P.R. ChinaZhang Fan, Wuhan, Hubei, P.R. ChinaZhang Li, Wuhan, Hubei, P.R. ChinaZhang Xiao Wen, Wuhan, Hubei, P.R. China Zhang Xiaohu, Guilin, Guanxi, P.R. ChinaZhao Chunji, Shanghai, P.R. ChinaZheng Wenting, Shanghai, P.R. ChinaZhou Die, Wuhan City, Hubei Province, P.R. ChinaZhou Jing, Wuhan, Hubei, P.R. ChinaZhou Mengji, Shanghai, P.R. ChinaZhou Xia, Shanghai, P.R. China
Foundation in Gemmology
Qualified
Aarsaether, Anita Ronning, Sandvika, NorwayAderhold, Bryan Christopher, Ridgewood, New Jersey,
U.S.A.Agrawal, Shriraj, Nagpur, IndiaÅkerlund, Sophia, Lidingo, SwedenAkintayo, Olusegun James, LondonAllen, Amanda, NorthamptonAlokhin, Andriy, LondonAn, Ran, LondonAndren Georgsen, Cecilia, Lund, Sweden Andriamanohisoa Axhel, Robert, Antananarivo,
Madagascar Aung Ko Ko, Yangon, MyanmarAzema, Valerian, Le Val, FranceBagriacik, Didem, LondonBailey, Sarah, LondonBalakchiev, Ruslan, Marseille, FranceBeale, Sioned, Lapworth, WarwickshireBecquaert, Gregory Julien Pascal, Saint-Jans-Cappel,
FranceBelanger, Jeannine, Quebec, Canada Bergeron, Marie Josee, Quebec, CanadaBorenstein, Guy, Pardes-hana Karkur, Israel
Murray, Patricia A, Ottawa, Ontario, Canada Nay Lin Aung, Mogok Township, MyanmarNaylor, Peter D., Birmingham, West MidlandsNg Fei Yeung, Kowloon, Hong Kong O'Hagan, David Michael, Sutton Coldfield, West
MidlandsOncina, Christelle, St Raphael, FranceOtterstrom, Camilla Anna, Bålsta, SwedenOuchene, Linda, Paris, FranceOxberry, Hannah Clare, Norwich, NorfolkPartner, Robert, Cropston, LeicestershirePatel, Maulika, LondonPetropoulou, Eleni, Athens, GreecePoore, Sarah, Worthing, West SussexPossen, Armand, Soumagne, BelgiumPreston, Paula, London Prince, Ronald Fisher, Richmond, SurreyQin Qing, Guilin, Guanxi, P.R. ChinaQuiros, Marylene, Bordeaux, FranceQureshi, Erum Ali, Thane, IndiaRamampy, Pierrot, Antananarivo, MadagascarRaneke, Annamaria, Stockholm, SwedenRibarevic, Ivanka, Montreal, Quebec, Canada Rousseville, Prisca, Nantes, FranceSanter, Kurt, Jersey, Channel IslandsShare, Rebecca Louise, Birmingham, West MidlandsShen, Huanqun, Shanghai, P.R. ChinaShi, Hua Yan, Shanghai, P.R. China Siegan-Smith, Breige, LondonSoe Pa Pa, Yangon, MyanmarSong Lanlan, Guilin, Guangxi, P.R. ChinaSong Liping, Beijing, P.R. ChinaSu Chenmin, Wuhan, Hubei, P.R. ChinaSun, Norton, Central, Hong KongSung, Sophia, Tapei, Taiwan R.O.C.Szvath, Gabriella, Laukaa, FinlandTang Kit Yee, New Territories, Hong Kong Tian Mi, Guilin, Guanxi, P.R. ChinaTidd, Lauren Elizabeth, Churchdown, GloucesterTissa, V.G. Samith Madhawa, Colombo, Sri LankaTran Vinh-Logez, Caroline, Paris, France Verma, Pragati, Delhi, IndiaVlemmix, Joost M.A, Ravenstein, The NetherlandsWan Qijuan, Wuhan City, Hubei Province, P.R. ChinaWang Mengqing, Guilin, Guangxi, P.R. ChinaWang Junyi, Guilin, Guanxi, P.R. ChinaWang Zongyu, Guilin, Guangxi, P.R. ChinaWard, Simon Francis, Leigh-on-Sea, EssexWei, Qiaokun, Guangzhou, P.R. ChinaWeng Chuxin, Guilin, Guangxi, P.R. ChinaWickramarathne, Hettiarachchi Keerthi, Thalawatugoda,
Sri Lanka
The Journal of Gemmology / 2009 / Volume 31 / No. 5–8
Page 317
Proceedings of the Gemmological Association of Great Britain and Notices
Brenan, Amy, Dorchester, DorsetBrown, Sandra Jane, Birmingham, West MidlandsBryan, Daniel, LondonBurgoni, Eva Maria, Carnoux-en-Provence, FranceButini, Enrico, Rome, ItalyButini, Flavio, Rome, ItalyByrne, Ruth, LondonCai Jia, Beijing, P.R. ChinaCaldwell, Neil Charles, Morningside, South AfricaCambray, Elinor, Salisbury, WiltshireCathelineau, Thierry, Les Breviaires, FranceCederferm, Magdalena, Rosersberg, Sweden Cederqvist, Zarah, Lannavaara, Sweden Cerutti, Gabriella, Valenza, ItalyChan Kam Kong, Tseung Kwan O, Hong KongChan Pei Pei, Betty, Quarry Bay, Hong Kong Chan Pui Shan, Shatin, New Territories, Hong KongChan Sau Kwan, Hong KongChatagnier, Pierre Yves, Saint-Albin, Vareilles, FranceChatellain, Yannick, Bonneville, FranceChau Lai La, New Territories, Hong KongChen Ge, Guilin, Guangxi, P.R. ChinaChen Shan-Yi, Roquebrune Cap Martin, France Chen Shifeng, Guang Dong, P.R. ChinaChen Suoyi, Beijing, P.R. ChinaChen Tianran, Guilin, Guangxi, P.R. ChinaChen Ying, Guilin, Guangxi, P.R. ChinaChen Yuemei, Guilin, Guangxi, P.R. ChinaCheng Qi, Guilin, Guangxi, P.R. ChinaCherino, Edwin, LondonCheung Yuk King, New Territories, Hong KongChit Su Su Lin, Mogok, MyanmarChiu Po Yee, Lam Tin, Hong Kong Choi Chi Ho, Tuen Mun, Hong Kong Choi Wing Cheong, Chai Wan, Hong Kong Chow Chun Lok, New Territories, Hong KongChow Man Fai, Shatin, New Territories, Hong KongChow Wai Kei, North Point, Hong Kong Chu Yilin, Zhejiang Province, P.R. ChinaChui Wing Chung, Kowloon, Hong Kong Chung Chin Ying, Kowloon, Hong KongCirkot, Mark, New York, U.S.A.Clark, David, Lewes, East SussexComotto, Elisabetta, Genova-Sestri, ItalyCooper, Amy, Las Vegas, Nevada, U.S.A.Coquel, Isabelle, Saint Germain Laprade, FranceDarli Sein Win, Yangon, MyanmarDe Mey, Inge, Shanghai, P.R. Chinade Nevi, Danilo, Genoa, ItalyDe Witt Sandstrom, Ida, Lunde, SwedenDelerholm, Peter, Enskede, Sweden
Deng Xiansong, Guilin, Guangxi, P.R. ChinaDennis, Louise, Halesowen, West MidlandsDonsin, Julie, Verviers, BelgiumDu Liuyin, Beijing, P.R. ChinaDumas, Anne Catherine, London, Elliott, Marc, Birmingham, West MidlandsElmetto, Pamela, London Esteves, Catarina, Meudon, FranceEvans, Rachel, LondonFeatherstone, Hazel, London, Feng Yan, Guangzhou, P.R. China Filipe, Muenga Ana Paula, Birmingham, West MidlandsFontaine, Marie, LondonFung Sin Ting, Central, Hong KongGabay, Nicole, Montrouge, FranceGamley, Alistair, Harare, ZimbabweGan Cuiling, Guilin, Guangxi, ChinaGeorgy, Noémie, St Remy Les Chevreuse, FranceGilson, Karen Margaret, Wanstead, LondonGlendening, Sarah Louise, Eastbourne, East SussexGomez, Amanda, London Gorris, Tanja, Amsterdam, The Netherlands Graham, Lisa J., Tunbridge Wells, KentGram-Jensen, Margrethe, Vejle, DenmarkGrocholska, Katherine, London Gu Ying, Shanghai, P.R. ChinaGuez, Arielle, Aix-en-Provence, FranceGuo Fang Yu, Beijing, P.R. ChinaHall, Josephus, Birmingham, West MidlandsHammond, Ross, LondonHan, Byeo Ri, Geumjeong-Gu, Busan, KoreaHan Yi, Beijing, P.R. ChinaHarnois, Dominique, Paris, France Hart, Alan, LondonHerzog, Franz Adrian, Oltingen, SwitzerlandHirisy, Elisabeth, Ramboahangy Ranse, Antananarivo,
MadagascarHoeksma, John, Surhuisterveen, The Netherlands Hollaar, Alexa, Bias, France Horak, Jana M., Cardiff, South Glamorgan, WalesHöstlöf, Catarina, Enskede Se, SwedenHsiao Yu-Hsin, Taichung City, Taiwan R.O.C.Hu Jie, Guilin, Guangxi, P.R. ChinaHuang Yi-Chia, Taipei, Taiwan R.O.C.Huang Hsiang-Ching, Taipei, Taiwan R.O.C.Hui Kei Chun, Aberdeen, Hong KongHui Marilyn Hang-Chung, Hong Kong Hui Wai Wai, New Territories, Hong KongJackson, Annie, Uxbridge, MiddlesexJacquier, Nathalie, Genthod, SwitzerlandJefford, Alexandra, London
The Journal of Gemmology / 2009 / Volume 31 / No. 5–8
Page 318
Proceedings of the Gemmological Association of Great Britain and Notices
Jia Xiaodan, Tanjian, P.R. ChinaJonsson, Caroline, Uppsala, SwedenJoung Ki Park, Daejeon, South KoreaJubelin, Marion, Sanary-sur-Mer, FranceJung-Lim Han, Busan, South KoreaKapoor, Kushagra, LondonKauppinen, Paivi, Sunningdale, BerkshireKedaria, Sujata, Amstelveen, The NetherlandsKim Hee Jung, Daegu, South KoreaKim Sae Bom, Gyeonggi-Do, South Korea Kintgen Gerez, Ingrid, Wasquehal, FranceKoutra, Ioanna, Agia Paraskeyi, GreeceKovanovic, Milena, LondonKrontira, Sofia, Marousi, Athens, GreeceKyaw Min Naing, Yangon, MyanmarKyaw Myo Htet, Mogok, MyanmarLai Chin Heng, Taipei, Taiwan R.O.C.Lai Hsin Ya, Taichung City, Taiwan R.O.C.Lai Ngating, LondonLai Pui Ki, Emily, Kowloon, Hong KongLam King Fai, Kowloon, Hong KongLanza, Davide, Genoa, Italy Lau King Suen, Shau Kei Wan, Hong KongLaw Chun Him, Kwai Chung, Hong Kong Leavey, Harriet, WorcesterLee Hsiu-Ling, Taipei, Taiwan R.O.C.Lee Hun Ji, Seoul, KoreaLee Ji Hyun, Yeonje-Gu, Busan, KoreaLee Ka Chun, New Territories, Hong Kong Lee Ki Chan, Daejeon, Korea Lee Shih-Ping, Taipei, Taiwan R.O.C.Lee Yi Chen, New Territories, Hong Kong Leon, Virginie, Marseille, FranceLeung Man Nga, New Territories, Hong Kong Leung Rakotovao, Anna, Antananarivo, Madagascar Leza, Marianna, Ano Glyfada, GreeceLi Mengfei, Shanghai, P.R. China Li Yujiao, Guilin, Guangxi, P.R. ChinaLiang Zhe, Guilin, Guangxi, P.R. ChinaLin Yuk Ling, North Point, Hong Kong Lioe Yuk Fung, North Point, Hong Kong Liu Hong Jie, Beijing, P.R. ChinaLiu Jingna, Guilin, Guangxi, P.R. ChinaLiu Liping, Guilin, Guangxi, P.R. ChinaLiu Sui Chung, New Territories, Hong Kong Liu Zhichao, Guilin, Guangxi, P.R. ChinaLo King Shan, Hong KongLogan, Peter, Coventry, West MidlandsLoosvelt, Bart, Kortrijk, BelgiumLundin, Emelie, Akersstyckebruk, SwedenLung Mei Ting, May, Shatin, Hong Kong
Lungley, Charlotte, Repton, DerbyshireMcIntosh, Emma Jayne, Newcastle-upon-Tyne, Tyne and
WearMaclean, Victoria Elizabeth Frances, LondonMcKeown, Julia, Oldbury, West MidlandsMclachlan, David, Woking, SurreyMayer, Melanie, St. Helier, Jersey, Channel IslandsMeikle, Alastair Murray Scott, CambridgeMeng Yan, Yunan Province, P.R. ChinaMi Ruiyun, Birmingham, West MidlandsMichaelides, Emma, Enfield, MiddlesexMidwinter-Porter, Holly, LondonMinassian Bardehshahi, Odett, Mykonos, GreeceMisme, Eric, Lyon, FranceMohammad, Aamir, Oldham, LancashireMullan, Bronagh, Birmingham, West MidlandsMuller, Paul, Antananarivo, MadagascarMulrooney, Rosalyn, LondonMuntz, Jennifer Louise, LondonMurakami, Akiko, Tokyo, JapanMyint Htun Yan, Stephen, Yangon, MyanmarNamboyera, Annet, Entebbe, UgandaNavarro, Gloria, LondonNay Hlaing Oo, Yangon, MyanmarNay Lin Aung, Mogok Township, MyanmarNeslen, Lewis, LondonNg Lit Kwan, Kowloon, Hong KongNg Siu May, Sai Wan Ho, Hong KongNg Wing Yan, New Territories, Hong KongNgan Lai Shan, Ann, Kowloon, Hong Kong Nicolai, Namaste, Cardiff, South Glamorgan, WalesNilsson, Jeanette Karin Madeleine, Lannavaara, SwedenNing, Charles, Loughborough, LeicestershireNoble, Frances, Wendover, BuckinghamshireO'Neill, Helen, Berkhamsted, HertfordshireO'Neill, Sarah Louise, Leeds, West YorkshireOr Ting Ting, Tammy, Causeway Bay, Hong KongOrsini, Paolo, Alessandria, ItalyOtterstrom, Camilla Anna, Bålsta, SwedenOudy, Myriam, LondonPaige, Denise, LondonPalo, Markus, Malmberget, SwedenParkes, Matthew, Dublin, IrelandParnpuu, Rao, Harku Vald, EstoniaPatel, Maulika, LondonPatenaude, Lizanne, Westmount, Quebec, Canada Perosino, Lorenzo, Novi Ligure AL, Italy Piper, Valerie, Birmingham, West MidlandsPoilane, Nadji, Paris, FrancePoon Pak Kei, New Territories, Hong Kong Possen, Armand, Soumagne, Belgium
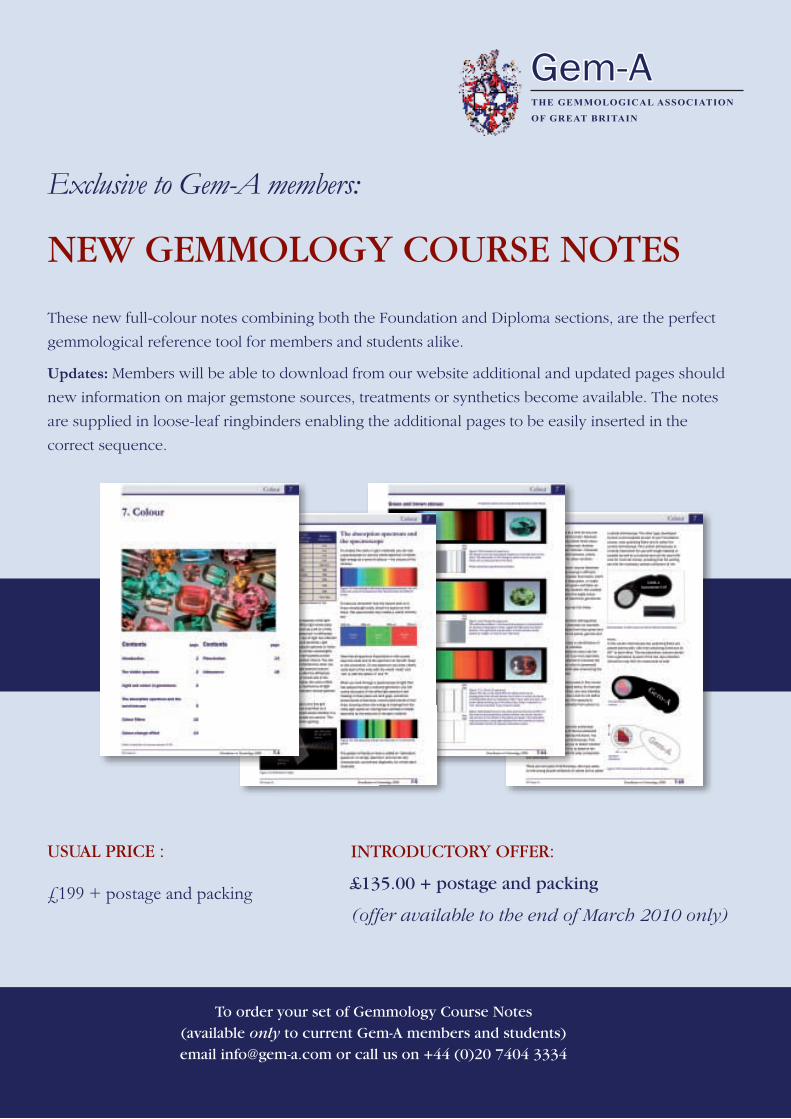
Exclusive to Gem-A members:
NEW GEMMoLoGY CoURSE NoTES
These new full-colour notes combining both the Foundation and Diploma sections, are the perfect
gemmological reference tool for members and students alike.
updates: Members will be able to download from our website additional and updated pages should
new information on major gemstone sources, treatments or synthetics become available. The notes
are supplied in loose-leaf ringbinders enabling the additional pages to be easily inserted in the
correct sequence.
USUAL PRICE :
£199 + postage and packing
To order your set of Gemmology Course Notes (available only to current Gem-A members and students) email [email protected] or call us on +44 (0)20 7404 3334
The GemmoloGical associaTion
of GreaT BriTain
Gem-A
INTRoDUCToRY oFFER:
£135.00 + postage and packing
(offer available to the end of March 2010 only)
The Journal of Gemmology / 2009 / Volume 31 / No. 5–8
Page 320
Proceedings of the Gemmological Association of Great Britain and Notices
Pradat, Thierry, Francheville, FranceProkopenko, Vera, Kallithea, GreecePrus, Emilia, LondonQuiros, Marylene, Bordeaux, FranceRabary-Ranovona, Haga, Antananarivo, Madagascar Rakotoharinavalona, Tahiana Lalaina, Antananarivo,
Madagascar Ramampy, Pierrot, Antananarivo, MadagascarRamaromisa, Naina, Antananarivo, Madagascar Ramsen, Jan Hakan, Halmstad, SwedenRann, Evelina Birgitta, Övre Soppero, SwedenRavaioni, Camilla, Genova, ItalyReeves, Emma, Sunninghill, BerkshireRegala, Benjamin, Alea, Hawaii, U.S.A.Renaud, Eric, LondonRichbourg, Carole, Las Altos, California, U.S.A.Rocchiero, Loredana, Genova, ItalyRoelofse, Frederick, Die Wilgers, South AfricaRowe Rawlence, Emily, LondonRutter, Anna, Edinburgh, ScotlandRyu, Hyunjung, Seoul, Korea Sanders, Esmee Elice, Amsterdam, The Netherlands Schutte, Maryke, LondonSeidenbinder, Arnaud, Ville-d-Avray, FranceShen Yi, Shanghai, P.R. China Shih Chih Wen, Taipei, Taiwan R.O.C.Sibley, Christopher, St Albans, HertfordshireSimm, Charlotte, LondonSmookler, Deborah, LondonSo Kin On, Kowloon, Hong KongSong Lanlan, Guilin, Guangxi, P.R. ChinaSpofforth, Kristian David, LondonSrinivasa, Deepa, Ras al Khaimah, U.A.E.Tan, Fiona Jing, Calgary, Alberta, CanadaTejima, Yuko, Ichikawa City, Chiba Pref., JapanTereszczuk, Stasia-Mae, LondonThilakaratne, Kanishka Lalith, Birmingham, West
MidlandsThomas, Craig Arthur, Sandton, Gauteng, South AfricaTo Ka Lun, New Territories, Hong Kong Tong Siu-Kuen, Ma On Shan, Hong Kong Tong Po Sang Cindy, Tsing Yi Island, Hong KongTsai Min-Chieh, Taipei, Taiwan R.O.C.Tsai Su-Fen, Shanghai, Zhabei District, P.R. China Tsai Yi-han Emma, Barcelona, SpainTsang Hing Cheung, Tuen Mun, Hong Kong Vaessen, Servaas, Amsterdam, The Netherlands Valentini, Francesca, LondonVan der Lint, Roos, AB Haaften, The Netherlandsvan Elderen, Colin Nico, Schoonhoven, The NetherlandsVan Minsel, Eefje Eva, West Drayton, Middlesex
Verret, Jean-Michel, Montreal, Quebec, Canada Versini, Valerie, Marseille, FranceViksten, Fanny Catarina Ariane, Umeå, SwedenVodyanova Hitzi, Elena, Athens, GreeceWan Ching Yi, New Territories, Hong Kong Wang Jingjing, Guilin, Guangxi, ChinaWang Lei, Shanghai, P.R. ChinaWang Mengqing, Guilin, Guangxi, P.R. ChinaWang Shang Bai, Beijing, P.R. ChinaWang Xiawen, Guilin, Guangxi, P.R. ChinaWang Xu, Shanghai, P.R. ChinaWaugh, Andrew D., Braintree, EssexWei Qiaokun, Guangzhou, P.R. ChinaWelsh, Simon Ian, Dawlish, DevonWen Huashan, Guilin, Guangxi, P.R. ChinaWeng Annlu Yu, Shanghai, P.R. China Westley, Penny, Hagley, WorcestershireWhiffin, Andrew Stafford, Meopham, KentWhittaker, Laura Victoria, Pedmore, West MidlandsWilliams, Samantha, Birmingham, West MidlandsWilson, Maria, Rugby, WarwickshireWong, Phyllis, Greenwich, LondonWong Fung Ha, Hong Kong Wong Tsz Shing Milton, Kowloon, Hong Kong Wong Wan Kam Jean Vele, Junk Bay, Hong KongWong Wing Suet, Kowloon, Hong Kong Wong Yee Man, Quarry Bay, Hong KongWright, Hayley, Wolverhampton, West MidlandsWu Di, Beijing, P.R. ChinaWu Tsung-Jen, Taipei City, Taiwan R.O.C.Xia Xiyue, Guilin, Guangxi, P.R. ChinaXie Tian Qi, Da Qing City, Hei Long Jiang Province,
P.R. ChinaXie Yan, Shanghai, P.R. ChinaXu Jiahui, Guilin, Guangxi, P.R. ChinaXu Zhao, Shanghai, P.R. China Xu Zhenxiu, Guangzhou, P.R. ChinaYang Pei-Chi, Taipei, Taiwan R.O.C.Yang Yiwei, LondonYang Zhuo, Guangzhou, P.R. ChinaYao Qiong, Shanghai, P.R. China Yapa Abeywardena, Jayani Madhavi, Colombo, Sri
LankaYau Chui Shan, Yuen Long, Hong Kong Ye Jiandong, Wenzhou City, Zhejiang Province, P.R.
ChinaYeh Chun-Hau, Taichung, Taiwan R.O.C.Yin Yiqing, Shanghai, P.R. ChinaYip Wing Man Kennis, Kowloon, Hong KongYoung, Stephanie Lynne, Chalfont St Peter,
Buckinghamshire
The Journal of Gemmology / 2009 / Volume 31 / No. 5–8
Page 321
Proceedings of the Gemmological Association of Great Britain and Notices
Qualified with Distinction
Cheung Yuk King, New Territories, Hong KongDiamond, Marcia, London Gleave, Elizabeth , London Gong Sheng Wei, Zhujiang New Town, P.R. ChinaKorejwo, David A., Quantico, Virginia, U.S.A.Leavey, Harriet, Worcester Liang, Weizhang, Guangzhou, P.R. ChinaRoss, Antonia, Fleet, Hampshire
Qualified with Merit
Bigford, Julie Claire, Malvern Wells, Worcestershire, Jensen, Annalisa, London, Lee Chi-Ju, Taipei, Taiwan R.O.C.Lin Chun Hsien, Taipei, Taiwan R.O.C.Lin Xin, Beijing, P.R. China Liu Siyang, Beijing, P.R. China Lu Jia, Wuhan, Hubei, P.R. ChinaMaclellan, Kiki, Nr Southam, Warwickshire Peng Hsiang Chieh, Taipei, Taiwan R.O.C. Rufus, Simon, London Shaw, Heather Catherine, Barnsley, West YorkshireSpencer, Jason, Birmingham, West Midlands Xu Juan, Beijing, P.R. ChinaZhai Shanshan, Beijing, P.R. China
Qualified
Brunstrom, Isabella, Älvsjö, SwedenCai Hongxiang, Beijing, P.R. ChinaChan Chun Wai, Kowloon, Hong Kong Chan Ho Yin, Henry, Kowloon, Hong KongChan Man Tao, New Territories, Hong Kong Chan Shun Heng, Champaign, Illinois, U.S.A.Chan Wai Ming, Jerry, Kowloon, Hong KongChan Yuen Yi, Kowloon, Hong KongChen Hsiu-Chuan, Taipei, Taiwan R.O.C. Chen Min, Wuhan, Hubei, P.R. China
Chen Yanni, Wuhan, Hubei, P.R. ChinaCheng Cheuk Yu, New Territories Hong KongCheng Wing Yan, New Territories, Hong KongCheng Yee Ha, Joyce, Kowloon, Hong KongCheung, Siu Lui Sharon, Kowloon, Hong KongChoi Wing Cheong, Eric, Chai Wan, Hong KongClifford, Ellen, Kirkella, East YorkshireDalton, Alan, Dungarvan, Co. Waterford, Ireland Efthymiadis, Avraam, Parga, Greece Elliott, Marc, Birmingham, West MidlandsEvans, Natalie, LondonFumagalli, Laura, Brentford, MiddlesexGibbard, Penelope, Marlow, BuckinghamshireGu Rui, Beijing, P.R. ChinaGuo Haihong, Beijing, P.R. ChinaHaymes, Richard, Caterham, SurreyHe Wan Ying, Wuhan, Hubei, P.R. ChinaHou Yu, Beijing, P.R. ChinaHuang Ya Yao, Kowloon, Hong KongKarkouli, Elpida, Drossia, GreeceKotlarska, Patrycja, LondonLam Pui Pik, Kowloon, Hong KongLam Tan Ly, Kowloon, Hong KongLaow Chun Yim, New Territories, Hong Kong Lau Yuen Yee Simmy, Kowloon, Hong KongLee Shan Shan, New Territories, Hong Kong Leung Ka Wai, Hong Kong Leung Pui Shan, Sandra, Kowloon, Hong KongLi Ching Tung, New Territories, Hong KongLi Liu Fen, Kowloon, Hong KongLiang Yue, Wuhan, Hubei, P.R. ChinaLin Ling, Beijing, P.R. China Lo Yi Ting, Kowloon, Hong KongMa Yu, LondonMcLoughlin, Emma, Dublin, Ireland Mai Zhiqiang, Zhujiang New Town, P.R. China
Youssef, Raewin, Melbourne, Victoria, Australia Yu Nordgren, Pia, Arsta, SwedenYu Pei-Shang, Wellingborough, NorthamptonshireYu Tao, Guilin, Guangxi, P.R. ChinaYuan Heng Yi, Guangdong, ChinaYuan Yi, Guilin, Guangxi, P.R. ChinaZachou, Maria, Papagou, GreeceZahid, Asiya, Nairobi, Kenya Zerillo, Jocelyn, Marseille, France
Zhang Jingwen, Birmingham, West MidlandsZhang Kai, Shanghai, P.R. ChinaZhang Rui, Taiyuan Shanxi, P.R. ChinaZhang Yi, Da Qing City, Hei Long Jiang, P.R. ChinaZhao Xin, Guilin, Guangxi, P.R. ChinaZhou Xia, Shanghai, P.R. China Zhou Xing, Shanghai, P.R. ChinaZhu Jiachen, Zhenjiang, P.R. China
Gem Diamond Diploma Examination
The Journal of Gemmology / 2009 / Volume 31 / No. 5–8
Page 322
Proceedings of the Gemmological Association of Great Britain and Notices
Meninno, Marco, LondonMuddyman, Jennifer Ruth Sarah, Birmingham, West
MidlandsMurakami, Akiko, Tokyo, JapanO'Doherty, Brigid Isobel, Belfast, Northern IrelandO'Hagan, David Michael, Sutton Coldfield, West
MidlandsOwen, Cheryl, Birmingham, West MidlandsPan Hong, Wuhan, Hubei, P.R. ChinaPatel, Maulika, LondonPlatis, George, Athens, GreecePoon King Hong, Kowloon Bay, Hong KongPoon Wai Man, Sheung Wan, Hong KongPoon Yuen Yan, Kowloon, Hong KongSmith-Bingham, Cassia, London Starkey, Imogen, Shanklin, Isle of Wight Stevens, Laura Ann, Bewdley, Worcestershire Stöt, Linda, Stockholm, SwedenSu Chenmin, Wuhan, Hubei, P.R. China Tachiveyi, Brian, Birmingham, West MidlandsTang Yalong, Wuhan, Hubei, P.R. China
To, Matthew Ka Ho, Taipo, Hong KongTo Ka Wing, Kowloon, Hong KongTse Vivian Wai Yin, Hong KongWalsh, Antonio, Bilston, West MidlandsWang Bo, Wuhan, Hubei, P.R. ChinaWebster, Rebecca, Birmingham, West MidlandsWhittaker, Laura Victoria, West MidlandsWong Kam Yan, Kowloon Tong, Hong Kong Wong Yin Kwan, Angela, Tin Shui Wai, Hong KongWu Shih-Ying, Taipei, Taiwan R.O.C.Xiaoyan, Yu, Wuhan, Hubei, P.R. ChinaYeung Kwok Li, Kowloon, Hong KongYeung Man Yee, New Territories, Hong KongYu Mingxia, Beijing, P.R. China Yuan Ye, Beijing, P.R. ChinaYuen Kim-Yu, Kowloon Bay, Hong Kong Zhang Pingting, Wuhan, Hubei, P.R. ChinaZhao Yuan, Beijing, P.R. ChinaZhao Yunmiao, Beijing, P.R. China Zheng Chen, Wuhan, Hubei, P.R. ChinaZou Yi, Beijing, P.R. China
During 2009, the Council approved the election to
Membership of the following:
Fellowship and Diamond membership (FGA DGA)Kettle, Georgina Elizabeth, Birmingham, West Midlands.
2009/2008Khaing, Win Win, Yangon, Myanmar. 2004/2008Lau, Ho, Sandra, Kowloon, Hong Kong. 2008/2006Meninno, Marco, London. 2008/2009O'Hagan, David, Sutton Coldfield, West Midlands.
2009/2009Taylor, Roger, Walsall, West Midlands. 1986/1994
Fellowship (FGA)Bai Feng, Beijing, P.R. China. 2008Barrows, Mark, Hunnington, West Midlands. 1973Benson, Jillian Rose, Ontario, Canada. 2008Bove, Bertrand, Vitry-sur-Seine, France. 2007Burton, Estelle, Surbiton, Surrey. 2009Campbell-Jones, Amy Victoria, Sheffield, South Yorkshire.
2009Cartier, Laurent E., Ribeauvillé, France. 2009Cathelineau, Thierry, Les Breviaires, France. 2009Chen, Anny Shin-Mien, Taipei, Taiwan R.O.C. 2009Cheung Suk Wan, New Territories, Hong Kong. 2009Chrismas, Jacqueline, Godalming, Surrey. 2009
Chu, Sin-Yi, Christine, Sheungwan, Hong Kong. 1990De Josselin De Jong, J.P., Amsterdam, The Netherlands.
2009Fontaine, Josee, St-Basile-le-Grand, Quebec, Canada. 2009Foran, Amelia Luetta, Toronto, Ontario, Canada. 2008Forsberg, Conny, Kisa, Sweden. 1987Goldman, Lucy, London. 2008Han, Fen, London. 2007Hartono, Djayani, Mt Tamborine, Queensland, Australia.
2009Hirst, Catherine, Harborne, West Midlands. 2004Honour, Kevin J., Yeading, Middlesex. 2009Hughes, Kym Renaye, Nerang, Queensland, Australia. 2009Jaugeat, Blaise, Vanves, France. 2008Johnston, Nanette LeTendre, Granite Bay, California,
U.S.A. 2009Kamoune Ndemanga, Yannick, Pierrefitte-sur-Seine,
France, 2009Larsson, Alf Christian, Finland. 1982Lee, Marian Hui Min, Taipei, Taiwan R.O.C. 2007Lek Chin Kwang, Singapore. 2009Li Geng, Beijing, P.R. China. 2009Liang Jie, Beijing, P.R. China. 2008Matsukawa, Kent, Yokohama, Japan. 2009Menekodathu Remanan Amarnath, New Delhi, India. 2007Meraly, Afsana, Antananarivo, Madagascar. 2008
Membership

New to the Gem-A website is the ‘Members only’ area, where paid-up Gem-A members are able to access searchable downloads of the latest issues of The Journal and our magazine Gems & Jewellery, and view current articles to be published in the The Journal at a later date. Fellows and Diamond Members are able to download the Gem-A Coat of Arms for use on their business stationery and websites. Members are also able to update their contact details and pay their membership subscription online.
This takes you to the Login screen. Enter your username, which is your surname (or family name) only, and your password which is your six-digit membership number. Click on the Login button which will take you to the Members only area.
From the Home page, click on Login/Register in the top right-hand corner.
To update your contact details or to change your password, click on Member area in the top right-hand corner, then go to My Details.
If you would like to add the name of your workplace, go to My organization.
To access the latest issues and upcoming articles of The Journal, click on the Publications tag, then go to The Journal of Gemmology in Publications, and The Journal online.
Step 1: Step 2:
Logging into the Members Only area
View The Journal onlineexclusive to Gem-A Members
The Journal of Gemmology / 2009 / Volume 31 / No. 5–8
Page 324
Proceedings of the Gemmological Association of Great Britain and Notices
Mooney, Robert John, Cooroy, Queensland, Australia. 2009Muhhamedjanova, Jelena, Tallinn, Estonia. 2009Otterstrom, Camilla Anna, Bålsta, Sweden. 2009Ouchene, Linda, Paris, France. 2009Oxberry, Hannah Clare, Norwich, Norfolk. 2009Partner, Robert, Cropston, Leicestershire. 2009Poore, Sarah, Worthing, West Sussex. 2009Ranasinghe, Liyanage Daya Somaratna, Kadawatha, Sri
Lanka. 1995Raneke, AnnaMaria, Stockholm, Sweden. 2009Ranorosoa, Nadine Joelle, Antananarivo, Madagascar. 2008Ribarevic, Ivanka, Montreal, Quebec, Canada. 2009Samaratunge, Punyadevi, Horana, Sri Lanka. 2008Share, Rebecca Louise, Birmingham, West Midlands. 2009Sun, Norton, Central, Hong Kong. 2009Sung, Sophia, Taipei, Taiwan R.O.C. 2009Szvath, Gabriella, Laukaa, Finland. 2009Tang, Kit Yee, New Territories, Hong Kong. 2009Tran Vinh-Logez, Caroline, Paris, France. 2009Veenhoven, Taletta W., Amsterdam, The Netherlands. 2008Vlemmix, Joost, Ravenstein, The Netherlands. 2009Ward, Simon Francis, Leigh-on-Sea, Essex. 1979Watson, Timothy, Johannesburg, South Africa. 2009Wickramarathne, Hettiarachchi Keerthi, Thalawatugoda, Sri
Lanka. 2008Wright, Lee Peter, Chaddesley Corbett, Worcestershire.
2009Wu, Benson Hon Wa, Toronto, Ontario, Canada. 2007Yu, Byron Kwai Sang, Beijing, P.R. China. 2009Yu, Xiaoyan, New Territories, Hong Kong. 2008
Diamond Membership (DGA)Bresson, Wan, Bussy Saint Georges, France. 2008Brunstrom, Isabella, Älvsjö, Sweden. 2009Chan, Shun Heng, Champaign, U.S.A. 2009Gibbard, Penelope, Marlow, Buckinghamshire. 2009Lai Siu Kwong, New Territories, Hong Kong. 2006Monogyios, John, Athens, Greece. 2008Platis, George, Rhodes, Greece. 2009Shaw, Bianca, Wanchai, Hong Kong. 2008Shaw, Martin Mackenzie, Wanchai, Hong Kong. 2008Starkey, Imogen, Shanklin, Isle of White. 2009Yuen, Kim-Yu, Kowloon Bay, Hong Kong. 2009
Associate MembershipAlcantara, Regina, LondonAlgaay, Khaled, London Bailey, Anneabell, Althorpe, Essex Baker, Carol, London Bayliss, Catherine, Tamworth, StaffordshireBhatia, Naresh Satram, Pune, IndiaBirchall, Alana, Victoria, AustraliaBorenstein, Guy, Pardes-hana Karkur, Israel
Chang, Cheng, Taipei, Taiwan R.O.C.Chia, Simon, SingaporeDavis, Fitzroy, Godmanchester, Cambridgeshire Dayaratne, Rohan Pushpakumara Dayaratn, Kohuwala, Sri
Lanka Delerholm, Peter, Enskede, Sweden Fleming, Emanuel, Lewisham, LondonGibson, David, Scarborough, North YorkshireGraham, Lisa, Tunbridge Wells, KentGrocholska, Katherine Rose, LondonHenderson, Elizabeth, Altrincham, CheshireHikel, Jerry, Stamford, Connecticut, U.S.A.Hunt, Glynis, Andover, HampshireHussein, Batcha, LondonJefford, Alexandra, LondonJoshi, Radhika, Hounslow, MiddlesexKaneko, Midori, Tokyo, JapanKapoor, Kushagra, New Delhi, IndiaKaye, Charlotte, Hungerford, BerkshireLangeslag, Leone, Bussum, The NetherlandsLiu Shih-Chieh, Edinburgh, ScotlandLoosvelt, Bart, Kortrijk, BelgiumMacMillan, Margaret-Anne, Grangemouth, Stirlingshire,
ScotlandMatsumoto, Itsufumi, Nakatsu City, JapanMeikle, Alastair, CambridgeMowbray, Caroline, LondonNorris, Eddi, LondonO'Connell, Angela, Edgbaston, West MidlandsOno, Kouichi, Kurume City, Fukuoka Pref., JapanPatel, Farzin, GloucesterRing, L. G., Christchurch, DorsetRisdon, Jennifer Leigh, Bethesda, Maryland, U.S.A.Robbins, Laurie, San Leandro, California, U.S.A.Sakaguchi, Saori, Kumamoto-si, Kumamoto Ken, JapanSakakibara, Kenichi, Oita City, JapanSansom, Henry, Hove, East SussexSmart, Jacqui, Cupar, Fife, ScotlandVan Minsel, Eva Eefje, West Drayton, MiddlesexWetherall, Alan, Hitchin, HertfordshireWilson, Claire, Bristol, AvonWong, Phyllis, LondonYu Ling-Yu, Danville, California, U.S.A.Zazai, Rahem Khoshal, Barking, Essex
transfersFellowship to Fellowship and Diamond Membership (FGA DGA)Bigford, Julie Claire, Malvern Wells, Worcestershire. 2009Gleave, Elizabeth, London. 2009Jensen, Annalisa, London. 2009Lau Yuen Yee Simmy, Kowloon, Hong Kong. 2009Lin Chun Hsien, Chung Ho, Taiwan R.O.C. 209
The Journal of Gemmology / 2009 / Volume 31 / No. 5–8
Page 325
Proceedings of the Gemmological Association of Great Britain and Notices
Maclellan, Kiki, London. 2009Ross, Antonia, Fleet, Hampshire. 2009Rufus, Simon, London. 2009Shaw, Heather Catherine, Barnsley, Yorkshire. 2009Spencer, Jason, Birmingham, West Midlands. 2009
Diamond Membership to Fellowship and Diamond Membership (FGA DGA)Naylor, Peter D., Birmingham, West Midlands. 2009Patel, Maulika, London. 2009Prince, Ronald F., Richmond, Surrey. 2009Yang, Yiwei, London. 2009Shen, Huanqun, Shanghai, P.R. China. 2009
Associate Membership to Fellowship (FGA)Abey, Sara, London. 2009Amrit, Paveet, London. 2009Chen, Anny Shin-Mien, Taipei, Taiwan R.O.C. 2009Eastwood, Layla, Madeira Beach, Florida, U.S.A. 2009Gonzalez, Olga, New York, U.S.A. 2009Hara, Shintarou, Sasebo City, Nagasaki Pref., Japan. 2009Harris, Kay, Allendale, Northumberland. 2009Hartono, Djayani, Mt Tamborine, Queensland, Australia. 2009Häyry, Tiia Marjut, Hintaara/Porvoo, Finland. 2009Jeong, Eun Ah, Yamanashi Pref., Japan. 2009Johnstone, Isobel, Brisbane, Queensland, Australia. 2009Kovanovic, Milena, London. 2009
Apsara Gems, London, for faceted and rough sapphires, and ruby rough before and after 'glass filling'.
edwin Vincent Cherino, London, for a pyrite crystal from the Congo.
Cyrille Djankoff, London, for three pieces of morganite (one natural colourless, one greyish after irradiation and one pinkish after irradiation and heating) from the Marropino Mine, Zambezi province Mozambique; also for a piece of lapis from Tadjikistan, Pamir Region.
Makhmout Douman, Arzawa Mineralogical Inc., New York, U.S.A., for a demantoid garnet crystal from Kerman Province, South East Iran.
luella woods Dykhuis, Tucson, Arizona, U.S.A., for a selection of coral branches, a star garnet rough from India, heat treated rough Montana sapphires, faceted amethysts and tumbled olivines from Hawaii.
Gemfields PLC, London, for three pieces of emerald rough from the Kagem mine, Zambia.
lisa Graham, Tunbridge Wells, Kent, for a carved ivory puzzle ball.
Marcia lanyon, London, a selection of small faceted emeralds and sapphires, and some cut natural and synthetic gemstones.
Graham and Anthony Mitchell, Kent, for a collection 35 mm slides depicting gems and jewellery from the estate of their late father R. Keith Mitchell.
emma Mouawad, West Hampstead, London, for a nephrite jade cylinder with fern leaf design finials.
So Pa Pa, Yangon, Myanmar, for a quartz crystal with rutile inclusions and mica crystals in matrix.
Jason williams, G.F. Williams & Co., London for selections of synthetic and natural cut gemstones.
Monetary donations were gratefully received from:
Raed Al-hadad, Abu Dhabi, U.A.E.Alexander Armati, Reading, BerkshireBurton A. Burnstein, Los Angeles, California, U.S.A.Joseph A. Cassarino, Rochester, New York, U.S.A.Susan Deacon, LondonJames C. Finlayson, Stoke-on-Trent, Staffordshire, Bernice M. Gay, Romsey, HampshireMasao Kaneko, Tokyo, JapanSandra lear, Morpeth, NorthumberlandCherie leigh, Canterbury, Kenttorbjorn lindwall, Lannavaara, SwedenCaroline e. Maclachlan, Edinburgh, ScotlandAnton S. Mayer, Jersey, Channel Islandsernest Mindry, Chesham, BuckinghamshireSara Naudi, LondonJamie B. Nelson, LondonDaniel Novak, Amarillo, Texas, U.S.A.Bebs Roper, Howrah, Tasmania, Australiathomas C. Roper, Howrah, Tasmania, AustraliaRobert l. Rosenblatt, Salt Lake City, Utah, U.S.A.David J. Sayer, Wells, SomersetMoe Moe Shwe, SingaporePaul l. Siegel, Rocky Point, New York, U.S.A.Joseph w. tenhagen, Miami, Florida, U.S.A.u Myint tun, Lulea, SwedenVeronica wetten, Hounslow, Middlesex
The Association is most grateful to the following for their gifts and donationsfor research and treaching purposes:
Gifts and Donations to the Association

The Journal of Gemmology / 2009 / Volume 31 / No. 5–8
Page 326
Proceedings of the Gemmological Association of Great Britain and Notices
Lepage, Anick, Mont Saint Hilaire, Quebec, Canada. 2009Maccaferri, Arianna, London. 2009Mclachlan, David, Woking, Surrey. 2009Mergalet, Caroline, Villefranche-sur-Mer, France. 2009Mizukami, Yusuke, Saitama City, Saitama Pref, Japan. 2009Mooney, Robert, Cooroy, Queensland, Australia. 2009Oxberry, Hannah Clare, Norwich, Norfolk. 2009Parvela-Säde, Anu, Espoo, Finland. 2009Preston, Paula, London. 2009Santer, Kurt, Jersey, Channel Islands. 2009Sugihara, Toshiyuki, Osaka, Japan. 2009Sung, Sophia, Taipei, Taiwan R.O.C. 2009Young, Stephanie, Chalfont St. Peter, Buckinghamshire.
2009
Associate Membership to Diamond membership (DGA)
Diamond, Marcia, London, 2009Efthymiadis, Avraam, Parga, Greece. 2009O'Doherty, Brigid, Belfast, Northern Ireland. 2009Patel, Maulika, London, 2009Stöt, Linda, Stockholm, Sweden. 2009
Associate Membership to Fellowship and Diamond Membership (FGA DGA)Leavey, Harriet, Worcester. 2009Murakami, Akiko, Tokyo, Japan. 2009
Corporate MembershipCherie Leigh Antique Jewellery, Canterbury, Kent HPJ Retailing Limited (head office), Congleton, Cheshire Landsberg and Son Antiques, London Otley Jewellers, Leeds, South Yorkshire Van Molendorff Diamonds Ltd, Woking, Surrey
Gold Corporate membershipBKT Rings Ltd, LondonMarcus McCallum, LondonS.P. Green & Co. Ltd, Hockley, West Midlands
Subscriptions 2010
The membership subscriptions for 2010 are £85.00 for
UK members and £90 for those in Europe and overseas.
Annual General Meeting
The Annual General Meeting was held at the National
Liberal Club, Whitehall Place, London SW1, on Monday 22
June. The meeting was chaired by James Riley the newly
appointed Chairman of the Council. The Annual Report
and Accounts were approved. Professor Alan Collins was
re-elected and Steven Collins, Brian Jackson, and Cally
Oldershaw elected to serve on the Council. Dr Tony
Allnutt was re-elected and Janice Kalischer elected to serve
on the Membership Liaison Committee. David Lancaster
retired in rotation from the Membership Liaison Committee
and did not seek re-election. Hazlems Fenton were re-
appointed as auditors for the year.
A presentation by Rui Galopim de Carvalho of the
Gemological Laboratory in Portugal (LABGEM), entitled
'Lalique's gems: as seen in the collections of the Calouste
Gulbenkian Foundation' followed the AGM.
Enrol now for the Spring 2010 course held at Gem-A’s London headquarters
Gem-A Diploma in GemmologyThe course that prepares you for the realities of the gem world and for decision making when buying and selling, whether for business or hobby.
eight-Month Gemmology Daytime Course
28 September 2010 to June 2011. Fee: ₤7425.00 Three days a week (Tues, Wed and Thurs*), combining the Foundation and Diploma courses and exams. * Supported study day
The GemmoloGical associaTion of GreaT BriTain
For further information or to enrol go to www.gem-a.com/education/gemmology-courses.aspx or call our Education team on +44 (0)20 7404 3334
Gem-A
The Journal of Gemmology / 2009 / Volume 31 / No. 5–8
Page 327
Proceedings of the Gemmological Association of Great Britain and Notices
Obituary
Peter George Read 1927-2009
Born in London in 1927,
Peter passed away quietly
on 15 January 2009 after a
brave fight with cancer: he
will be sadly missed by his
family and all his friends
and colleagues who knew
him as a most congenial,
friendly and talented person.
Peter’s education led
him to become a Chartered
Engineer with a strong
background knowledge of
electronics. He qualified as
a Fellow of the Gemmological Association and also held
the Diamond Certificate of the Association.
Peter held a number of professional positions during
his working life in a diverse range of companies including
GEC, Iliffe the publishers and Johnson Matthey & Co. Ltd,
the bullion refiners, where he was the senior Development
Engineer. Later he became Technical Manager of the
Diamond Trading Company (Pty) Ltd. (part of the De
Beers organization).
During his time with De Beers Peter spent some time
in Namibia, where he was involved in the development
of a diamond-sorting machine. Whilst in South Africa, he
was able to visit many of the major diamond producing
areas including the famous Premier mine near Pretoria,
the Dutoitspan and Bultfontein at Kimberley and the
Consolidated Diamond Mines coastal operation at
Oranjemund in South West Africa.
As a technical author, Peter excelled and he produced
a number of books, which included Gemmology,
Gemmological Instruments and Dictionary of Gemmology.
He also edited the 5th edition of Webster’s Gems. Peter
was also known to some of us as an author of several
novels, including The Phantom Diamond, Diamond
Mine and The Peking Diamonds; these were based on his
experiences in the gemmological world.
Peter gave many talks on gemmological matters both
in the UK and abroad. For many years he was a tutor for
the Gem-A courses. Since 1994 he was an Assistant Editor
of The Journal, and wrote many book reviews. For a
number of years he was a Member of the Council of the
Association and latterly a he sat on the Members' Council.
All the foregoing was still not enough for Peter.
He became very involved in designing gemmological
instruments, one of which was Gem Data, a computer-
aided programme for gem identification. The most recent
instrument that he designed was the Brewster Angle Meter
for Gem-A, which is now in use worldwide.
Although retired, Peter kept in close touch with his
gem friends and colleagues in both the UK and abroad.
He was a gentleman in every respect, quiet, helpful,
modest and with a great sense of humour. He will be
greatly missed by all.
Noel W. Deeks
* * *
Alain A.M. van Acker FGA (D.1990), Tilburg, The
Netherlands, died on 30 March 2009.
Bruno Bolli FGA (D.1976), St Gallen, Switzerland, died
on 16 December 2008.
leslie Punchihewa FGA (D.1983), Colombo, Sri Lanka,
died on 26 April 2009.
leonard Sanitt FGA (D.1949), London, died in 2009.
Richard A.F. will FGA (D.1974), Peterborough,
Cambridgeshire, died on 21 May 2009.
wilhelm J.e. Van Deijl, FGA (D.1969), Bellville, South
Africa, died on 23 July 2009.
Patricia J. walker FGA DGA (D.1969 and 1970), London,
died in 2009.
Daniel taylor FGA DGA (D.2005 and 2004), Leeds,
Yorkshire, died on 29 October 2009.
Gem-A
The Journal of Gemmology / 2009 / Volume 31 / No. 5–8
Page 328
Gem-A Events 2010
Friday 26 February MIDlANDS BRANChEmeralds: formation, treatment, manufacturing and identification by DouG GARRoDVenue: The Earth Science Building, University of Birmingham, Edgbaston
Tuesday 2 March GeM DISCoVeRY CluBGemmology on the Job - identifying set gemstones with KeRRY GReGoRYVenue: Gem-A, 27 Greville Street (Saffron Hill entrance), London EC1N 8TN
Tuesday 2 March SCottISh GeMMoloGICAl ASSoCIAtIoNMembers' Night: tales from tucsonVenue: British Geological Survey, West Mains Road, Edinburgh
Friday 26 March MIDlANDS BRANChA practical and hands-on look at some rare stones and inclusions in quartz with MARCuS McCAlluMVenue: The Earth Science Building, University of Birmingham, Edgbaston
Tuesday 30 March SCottISh GeMMoloGICAl ASSoCIAtIoNwine and cheese reception and SGA AGM followed by Piteiras emeralds with PADRAIC lAVIN Venue: British Geological Survey, W Mains Road, Edinburgh
Friday 30 April MIDlANDS BRANChJewellery of the Great exhibition of 1851 by DAVID lANCASteRVenue: The Earth Science Building, University of Birmingham, Edgbaston
Friday 30 April toMonday 3 May
SCottISh GeMMoloGICAl CoNFeReNCe Venue: The Queens Hotel, Perth For further information see page 180
Sunday 7 November GeM-A CoNFeReNCe Venue: The Hilton London Kensington Hotel
Monday 8 November GRADuAtIoN CeReMoNY AND PReSeNtAtIoN oF AwARDS Venue: Goldsmiths' Hall, London
Sunday 12 December NAtuRe'S tReASuReS III: MINeRAlS AND GeMS A seminar organized jointly by Gem-A, The Mineralogical Society, The Russell Society and Rockwatch Venue: Flett Theatre, Natural History Museum, London
Contact details
Gem-A Headquarters: Arianna Maccaferri on 020 7404 3334 email [email protected] Branch: Paul Phillips on 02476 758940 email [email protected] East Branch: Mark Houghton on 01904 639761 email [email protected] North West Branch: James Riley on 01565 734184 or 07931 744139 email [email protected] East Branch: Veronica Wetten on 020 8577 9074 email [email protected] West Branch: Richard Slater on 07810 097408 email [email protected] Gemmological Association: Email [email protected]; website www.scotgem.co.uk
For up-to-the minute information on Gem-A Events visit our website at www.gem-a.com

The GemmoloGical associaTion of GreaT BriTain
Supercharge your career
New Open Distance Learning Courses in Gemmology
enrolling now
A strong knowledge of gemstones and diamonds will increase customer confidence and boost your sales. Gain that knowledge by studying with the world’s longest established educator in gemmology. Graduates may apply for Fellowship of the Association enabling them to use the initials FGA after their name.
Study gemmology from your own home or workplace with comprehensive course notes, and online coursework and study groups*. you will also receive a selection of instruments and stones to help you with your studies. Additional instruments and books can be purchased from Gem-A’s extensive range.* Access to a computer with an internet connection essential.
Foundation Certificate in Gemmology Start date: 15 March 2010 (nine-month programme) Course fees: £1500 (or £1800 to include the London practical workshop) payable in instalments
Diploma in Gemmology (open only to Foundation Certificate holders) Start date: 15 March 2010 (nine-month programme) Course fees: £1695 (or £2295 to include the London practical workshop) payable in instalments
Full details at www.gem-a.com/education.aspx or call 020 7404 3334
The Gemmological Association of Great Britain27 Greville Street (Saffron hill entrance), London eC1N 8TNtel: 020 7404 3334 fax: 020 7404 8843 email: [email protected] UK Registered Charity No. 1109555
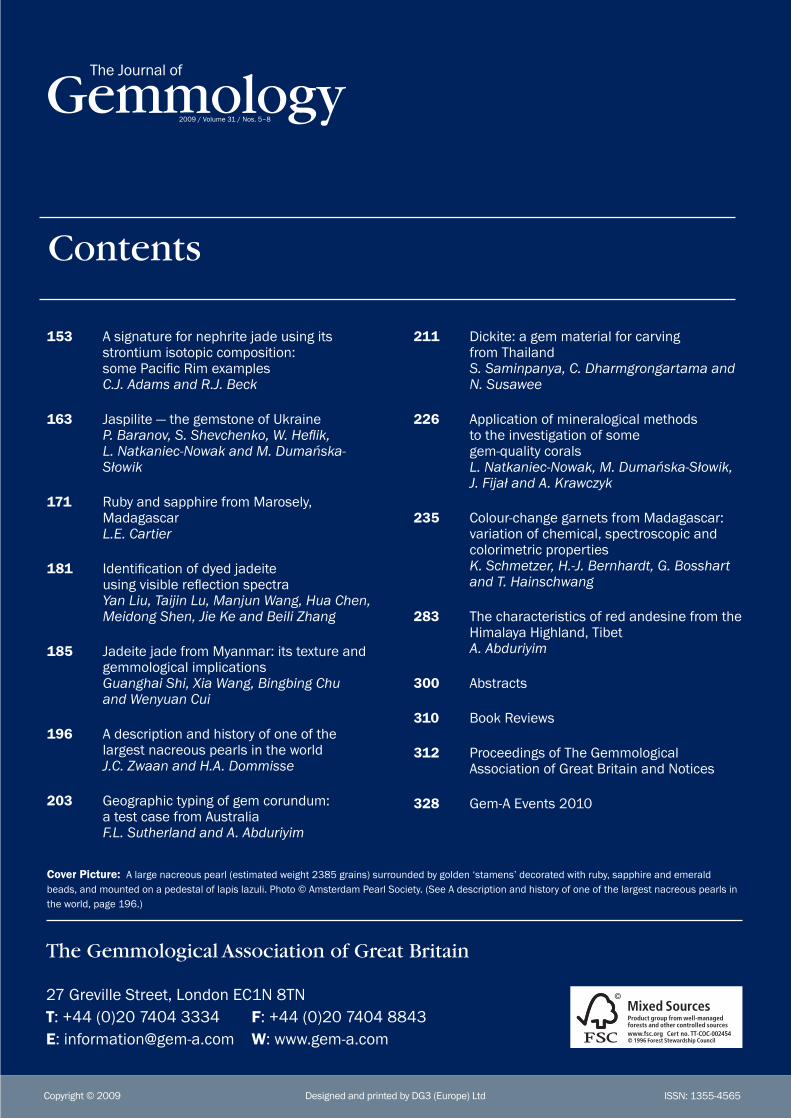
©2004 Gemmological Association and Gem Testing Laboratory of Great Britain
Gemmology2009 / Volume 31 / Nos. 5–8
The Journal of
ISSN: 1355-4565Designed and printed by DG3 (Europe) LtdCopyright © 2009
Contents
27 Greville Street, London EC1N 8TNT: +44 (0)20 7404 3334 F: +44 (0)20 7404 8843E: [email protected] W: www.gem-a.com
The Gemmological Association of Great Britain
Gemmology2009 / Volume 31 / Nos. 5–8
The Journal of Gem
mology - 2009 / Volum
e 31 / Nos. 5–8 / pp 153–328
The Journal of
The Gemmological Association of Great Britain
Cert no. TT-COC-002454
153 A signature for nephrite jade using its strontium isotopic composition: some Pacific Rim examples C.J. Adams and R.J. Beck
163 Jaspilite — the gemstone of Ukraine P. Baranov, S. Shevchenko, W. Heflik, L. Natkaniec-Nowak and M. Dumańska-Słowik
171 Ruby and sapphire from Marosely, Madagascar L.E. Cartier
181 Identification of dyed jadeite using visible reflection spectra Yan Liu, Taijin Lu, Manjun Wang, Hua Chen, Meidong Shen, Jie Ke and Beili Zhang
185 Jadeite jade from Myanmar: its texture and gemmological implications Guanghai Shi, Xia Wang, Bingbing Chu and Wenyuan Cui
196 A description and history of one of the largest nacreous pearls in the world J.C. Zwaan and H.A. Dommisse
203 Geographic typing of gem corundum: a test case from Australia F.L. Sutherland and A. Abduriyim
211 Dickite: a gem material for carving from Thailand S. Saminpanya, C. Dharmgrongartama and N. Susawee
226 Application of mineralogical methods to the investigation of some gem-quality corals L. Natkaniec-Nowak, M. Dumańska-Słowik, J. Fijał and A. Krawczyk
235 Colour-change garnets from Madagascar: variation of chemical, spectroscopic and colorimetric properties K. Schmetzer, H.-J. Bernhardt, G. Bosshart and T. Hainschwang
283 The characteristics of red andesine from the Himalaya Highland, Tibet A. Abduriyim
300 Abstracts
310 Book Reviews
312 Proceedings of The Gemmological Association of Great Britain and Notices
328 Gem-A Events 2010
Cover Picture: A large nacreous pearl (estimated weight 2385 grains) surrounded by golden ‘stamens’ decorated with ruby, sapphire and emerald beads, and mounted on a pedestal of lapis lazuli. Photo © Amsterdam Pearl Society. (See A description and history of one of the largest nacreous pearls in the world, page 196.)