geophysical journal international magma displacements under insular volcanic fields, applications to...
TRANSCRIPT
Geophysical Journal InternationalGeophys. J. Int. (2014) doi: 10.1093/gji/ggt505
GJI
Min
eral
phys
ics,
rheo
logy
,he
atflow
and
volc
anol
ogy
Magma displacements under insular volcanic fields, applications toeruption forecasting: El Hierro, Canary Islands, 2011–2013
A. Garcıa,1 A. Fernandez-Ros,2 M. Berrocoso,2 J. M. Marrero,3 G. Prates,2,4
S. De la Cruz-Reyna5 and R. Ortiz1
1Geosciences Institute IGEO, CSIC-UCM. J. Gutierrez Abascal, 2, Madrid E-28006, Spain. E-mail: [email protected] of Sciences, Cadiz University, Puerto Real, Cadiz E-11510, Spain3Volcanic Hazard and Risk Consultant, Tenerife, Canary Islands E-38410, Spain4Universidade do Algarve, P-8005-139 Faro, Portugal5Instituto de Geofısica, Universidad Nacional Autonoma de Mexico, C. Universitaria, Mexico D.F. 04510, Mexico
Accepted 2013 December 13. Received 2013 December 12; in original form 2013 March 21
S U M M A R YSignificant deformations, followed by increased seismicity detected since 2011 July at ElHierro, Canary Islands, Spain, prompted the deployment of additional monitoring equipment.The climax of this unrest was a submarine eruption first detected on 2011 October 10, andlocated at about 2 km SW of La Restinga, southernmost village of El Hierro Island. Theeruption ceased on 2012 March 5, after the volcanic tremor signals persistently weakenedthrough 2012 February. However, the seismic activity did not end with the eruption, as severalother seismic crises followed. The seismic episodes presented a characteristic pattern: overa few days the number and magnitude of seismic event increased persistently, culminatingin seismic events severe enough to be felt all over the island. Those crises occurred in 2011November, 2012 June and September, 2012 December to 2013 January and in 2013 March–April. In all cases the seismic unrest was preceded by significant deformations measured onthe island’s surface that continued during the whole episode. Analysis of the available GPS andseismic data suggests that several magma displacement processes occurred at depth from thebeginning of the unrest. The first main magma movement or ‘injection’ culminated with the2011 October submarine eruption. A model combining the geometry of the magma injectionprocess and the variations in seismic energy release has allowed successful forecasting of thenew-vent opening.
Key words: Volcano seismology; Pluton emplacement; Magma migration and fragmentation;Volcano monitoring; Volcanic hazards and risks; Atlantic Ocean.
1 I N T RO D U C T I O N
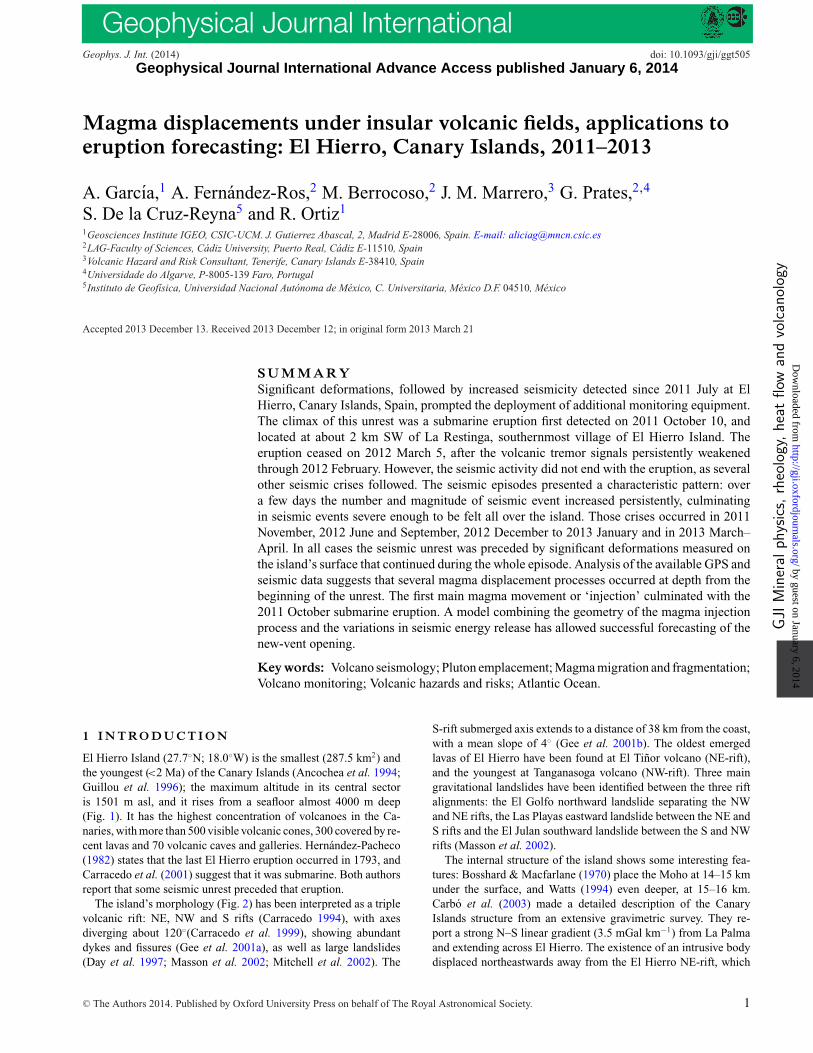
El Hierro Island (27.7◦N; 18.0◦W) is the smallest (287.5 km2) andthe youngest (<2 Ma) of the Canary Islands (Ancochea et al. 1994;Guillou et al. 1996); the maximum altitude in its central sectoris 1501 m asl, and it rises from a seafloor almost 4000 m deep(Fig. 1). It has the highest concentration of volcanoes in the Ca-naries, with more than 500 visible volcanic cones, 300 covered by re-cent lavas and 70 volcanic caves and galleries. Hernandez-Pacheco(1982) states that the last El Hierro eruption occurred in 1793, andCarracedo et al. (2001) suggest that it was submarine. Both authorsreport that some seismic unrest preceded that eruption.
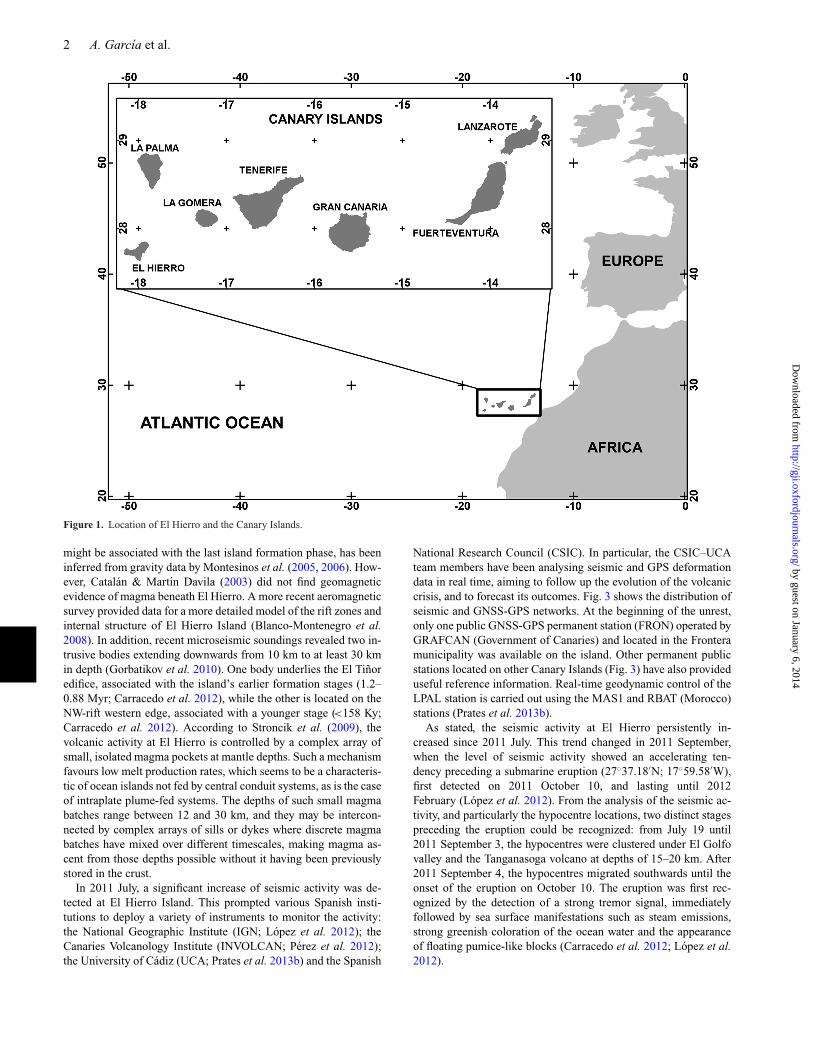
The island’s morphology (Fig. 2) has been interpreted as a triplevolcanic rift: NE, NW and S rifts (Carracedo 1994), with axesdiverging about 120◦(Carracedo et al. 1999), showing abundantdykes and fissures (Gee et al. 2001a), as well as large landslides(Day et al. 1997; Masson et al. 2002; Mitchell et al. 2002). The
S-rift submerged axis extends to a distance of 38 km from the coast,with a mean slope of 4◦ (Gee et al. 2001b). The oldest emergedlavas of El Hierro have been found at El Tinor volcano (NE-rift),and the youngest at Tanganasoga volcano (NW-rift). Three maingravitational landslides have been identified between the three riftalignments: the El Golfo northward landslide separating the NWand NE rifts, the Las Playas eastward landslide between the NE andS rifts and the El Julan southward landslide between the S and NWrifts (Masson et al. 2002).
The internal structure of the island shows some interesting fea-tures: Bosshard & Macfarlane (1970) place the Moho at 14–15 kmunder the surface, and Watts (1994) even deeper, at 15–16 km.Carbo et al. (2003) made a detailed description of the CanaryIslands structure from an extensive gravimetric survey. They re-port a strong N–S linear gradient (3.5 mGal km−1) from La Palmaand extending across El Hierro. The existence of an intrusive bodydisplaced northeastwards away from the El Hierro NE-rift, which
C© The Authors 2014. Published by Oxford University Press on behalf of The Royal Astronomical Society. 1
Geophysical Journal International Advance Access published January 6, 2014
by guest on January 6, 2014http://gji.oxfordjournals.org/
Dow
nloaded from
2 A. Garcıa et al.
Figure 1. Location of El Hierro and the Canary Islands.
might be associated with the last island formation phase, has beeninferred from gravity data by Montesinos et al. (2005, 2006). How-ever, Catalan & Martın Davila (2003) did not find geomagneticevidence of magma beneath El Hierro. A more recent aeromagneticsurvey provided data for a more detailed model of the rift zones andinternal structure of El Hierro Island (Blanco-Montenegro et al.2008). In addition, recent microseismic soundings revealed two in-trusive bodies extending downwards from 10 km to at least 30 kmin depth (Gorbatikov et al. 2010). One body underlies the El Tinoredifice, associated with the island’s earlier formation stages (1.2–0.88 Myr; Carracedo et al. 2012), while the other is located on theNW-rift western edge, associated with a younger stage (<158 Ky;Carracedo et al. 2012). According to Stroncik et al. (2009), thevolcanic activity at El Hierro is controlled by a complex array ofsmall, isolated magma pockets at mantle depths. Such a mechanismfavours low melt production rates, which seems to be a characteris-tic of ocean islands not fed by central conduit systems, as is the caseof intraplate plume-fed systems. The depths of such small magmabatches range between 12 and 30 km, and they may be intercon-nected by complex arrays of sills or dykes where discrete magmabatches have mixed over different timescales, making magma as-cent from those depths possible without it having been previouslystored in the crust.
In 2011 July, a significant increase of seismic activity was de-tected at El Hierro Island. This prompted various Spanish insti-tutions to deploy a variety of instruments to monitor the activity:the National Geographic Institute (IGN; Lopez et al. 2012); theCanaries Volcanology Institute (INVOLCAN; Perez et al. 2012);the University of Cadiz (UCA; Prates et al. 2013b) and the Spanish
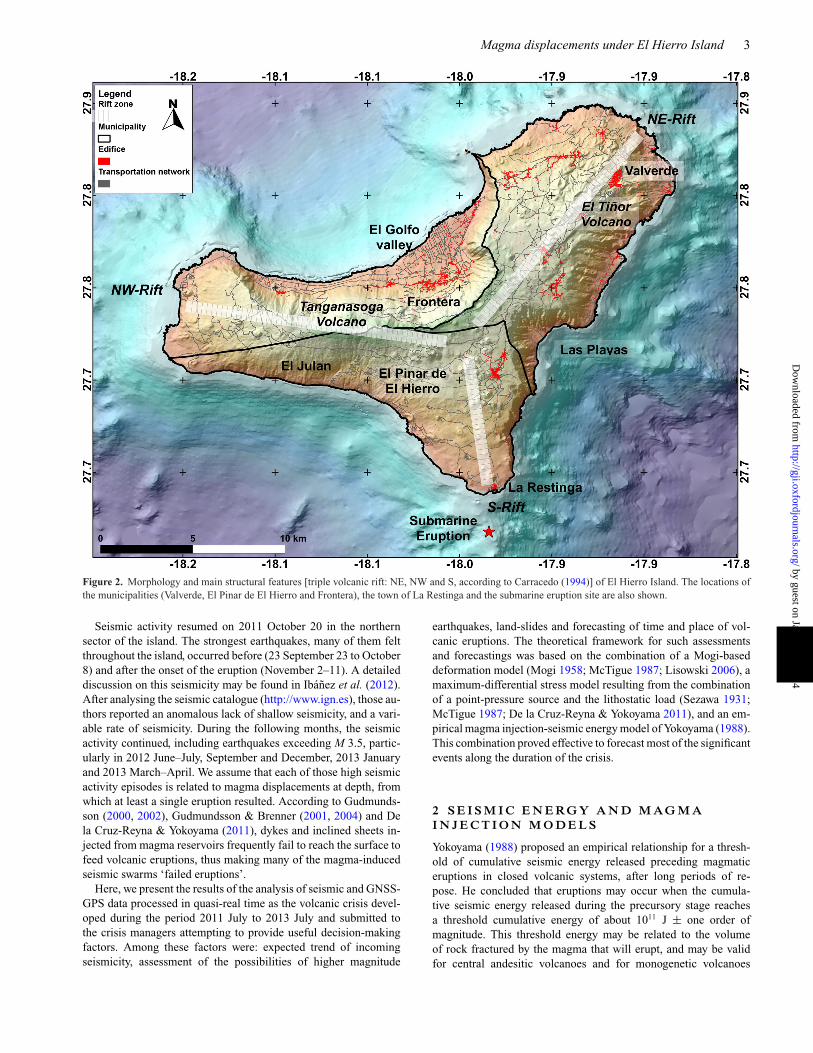
National Research Council (CSIC). In particular, the CSIC–UCAteam members have been analysing seismic and GPS deformationdata in real time, aiming to follow up the evolution of the volcaniccrisis, and to forecast its outcomes. Fig. 3 shows the distribution ofseismic and GNSS-GPS networks. At the beginning of the unrest,only one public GNSS-GPS permanent station (FRON) operated byGRAFCAN (Government of Canaries) and located in the Fronteramunicipality was available on the island. Other permanent publicstations located on other Canary Islands (Fig. 3) have also provideduseful reference information. Real-time geodynamic control of theLPAL station is carried out using the MAS1 and RBAT (Morocco)stations (Prates et al. 2013b).
As stated, the seismic activity at El Hierro persistently in-creased since 2011 July. This trend changed in 2011 September,when the level of seismic activity showed an accelerating ten-dency preceding a submarine eruption (27◦37.18′N; 17◦59.58′W),first detected on 2011 October 10, and lasting until 2012February (Lopez et al. 2012). From the analysis of the seismic ac-tivity, and particularly the hypocentre locations, two distinct stagespreceding the eruption could be recognized: from July 19 until2011 September 3, the hypocentres were clustered under El Golfovalley and the Tanganasoga volcano at depths of 15–20 km. After2011 September 4, the hypocentres migrated southwards until theonset of the eruption on October 10. The eruption was first rec-ognized by the detection of a strong tremor signal, immediatelyfollowed by sea surface manifestations such as steam emissions,strong greenish coloration of the ocean water and the appearanceof floating pumice-like blocks (Carracedo et al. 2012; Lopez et al.2012).
by guest on January 6, 2014http://gji.oxfordjournals.org/
Dow
nloaded from
Magma displacements under El Hierro Island 3
Figure 2. Morphology and main structural features [triple volcanic rift: NE, NW and S, according to Carracedo (1994)] of El Hierro Island. The locations ofthe municipalities (Valverde, El Pinar de El Hierro and Frontera), the town of La Restinga and the submarine eruption site are also shown.
Seismic activity resumed on 2011 October 20 in the northernsector of the island. The strongest earthquakes, many of them feltthroughout the island, occurred before (23 September 23 to October8) and after the onset of the eruption (November 2–11). A detaileddiscussion on this seismicity may be found in Ibanez et al. (2012).After analysing the seismic catalogue (http://www.ign.es), those au-thors reported an anomalous lack of shallow seismicity, and a vari-able rate of seismicity. During the following months, the seismicactivity continued, including earthquakes exceeding M 3.5, partic-ularly in 2012 June–July, September and December, 2013 Januaryand 2013 March–April. We assume that each of those high seismicactivity episodes is related to magma displacements at depth, fromwhich at least a single eruption resulted. According to Gudmunds-son (2000, 2002), Gudmundsson & Brenner (2001, 2004) and Dela Cruz-Reyna & Yokoyama (2011), dykes and inclined sheets in-jected from magma reservoirs frequently fail to reach the surface tofeed volcanic eruptions, thus making many of the magma-inducedseismic swarms ‘failed eruptions’.
Here, we present the results of the analysis of seismic and GNSS-GPS data processed in quasi-real time as the volcanic crisis devel-oped during the period 2011 July to 2013 July and submitted tothe crisis managers attempting to provide useful decision-makingfactors. Among these factors were: expected trend of incomingseismicity, assessment of the possibilities of higher magnitude
earthquakes, land-slides and forecasting of time and place of vol-canic eruptions. The theoretical framework for such assessmentsand forecastings was based on the combination of a Mogi-baseddeformation model (Mogi 1958; McTigue 1987; Lisowski 2006), amaximum-differential stress model resulting from the combinationof a point-pressure source and the lithostatic load (Sezawa 1931;McTigue 1987; De la Cruz-Reyna & Yokoyama 2011), and an em-pirical magma injection-seismic energy model of Yokoyama (1988).This combination proved effective to forecast most of the significantevents along the duration of the crisis.
2 S E I S M I C E N E RG Y A N D M A G M AI N J E C T I O N M O D E L S
Yokoyama (1988) proposed an empirical relationship for a thresh-old of cumulative seismic energy released preceding magmaticeruptions in closed volcanic systems, after long periods of re-pose. He concluded that eruptions may occur when the cumula-tive seismic energy released during the precursory stage reachesa threshold cumulative energy of about 1011 J ± one order ofmagnitude. This threshold energy may be related to the volumeof rock fractured by the magma that will erupt, and may be validfor central andesitic volcanoes and for monogenetic volcanoes
by guest on January 6, 2014http://gji.oxfordjournals.org/
Dow
nloaded from
4 A. Garcıa et al.
Figure 3. Location of seismic and GNSS-GPS stations (IGN, UCA and CSIC networks). LPAL belongs to the IGS network and it was therefore selected as areference station for the GNSS-GPS data processing for the entire seismic crisis and eruptive process. ALAJ, MAZO, IZA and STEI have been used as controlstations.
(De la Cruz-Reyna & Yokoyama 2011). In addition, the cumulativeseismic energy evolution shows a behaviour similar to the evolutionof the observables of the volcano activity proposed by Voight (1988;Failure Forecast Method, FFM). The FFM has frequently been ap-plied to forecast the event time in volcano monitoring (Voight & Cor-nelius 1991; De la Cruz-Reyna & Reyes-Davila 2001; Ortiz et al.2003; Tarraga et al. 2008). There are diverse interpretations and im-plementations for its application to the forecasting of the volcanicphenomena (Kilburn 2003, 2012; De la Cruz-Reyna et al. 2008; Bellet al. 2011), depending on the observable used and on the calcula-tion procedure. Magma induces additional stresses on the confiningcountry rock in which it is intruding. When the combination of thisstress with the regional tectonic stress reaches a critical value, theinduced fracturing, or reactivation of pre-existent fractures, allowsmagma, and magma-related fluids to find their paths to the surface(Voight & Cornelius 1991; De la Cruz-Reyna & Yokoyama 2011).Assuming a simple model consisting of a small spherical pressuresource of radius a, at a depth D below the horizontal surface ofa solid half-space, solutions of the surface deformation when thepressure P0 in the sphere exceeds the lithostatic pressure were firstfound by Sezawa (1931) for a general plastic medium. Later, Mogi(1958) used those results to compare that model with field data ofvolcanic deformations. A simplified solution based on the assump-tion a/D � 1 (point dilatation) includes the quantity a3P0, knownas the intensity of the singularity, since the stresses at the pointdilatation are singular (McTigue 1987). The medium thus under-
goes a maximum horizontal differential stress at the radial distancer = ±0.82D, corresponding to a dip angle (φ) between the pressuresource and the site of potential fracturing near the surface of 51◦.This model thus considers that, in a homogeneous elastic medium,the maximum differential stress defines an inverted cone with itsapex at a depth D, at the point dilatation and its base on the crustalsurface as a circle with radius 0.82D.
We adopt this conceptually simple model considering that ouranalysis is focused on the time and space evolution of the magma-induced pressure sources, and not on the precise determination oftheir pressures, locations and dimensions. The validity and possiblelimitations of the model and their consequences on our results arediscussed in the final section of this paper.
3 E L H I E R RO P RO C E S S : S E I S M I C I T YA N D D E F O R M AT I O N
The unrest episode at El Hierro occurred after a long repose pe-riod (over 200 yr). According to the empirical model of Yokoyama(1988), an eruption may occur in a closed volcanic system if thevolcano-tectonic (VT) seismic energy exceeds a threshold of theorder of 1011 J. Accordingly, using cumulative VT energy from theearliest stages of the unrest may be a more reliable parameter, as itis controlled by the largest magnitude events, unlike the statisticsof the number of events, controlled by the smallest, more frequent,events.
by guest on January 6, 2014http://gji.oxfordjournals.org/
Dow
nloaded from
Magma displacements under El Hierro Island 5
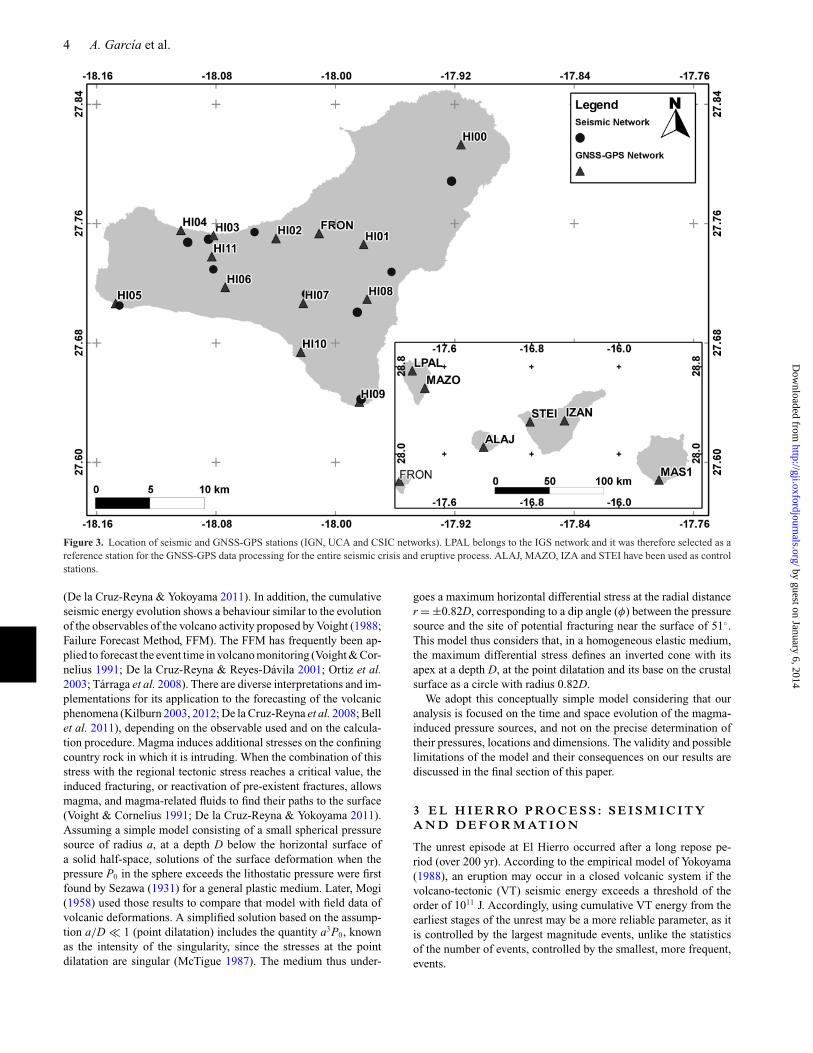
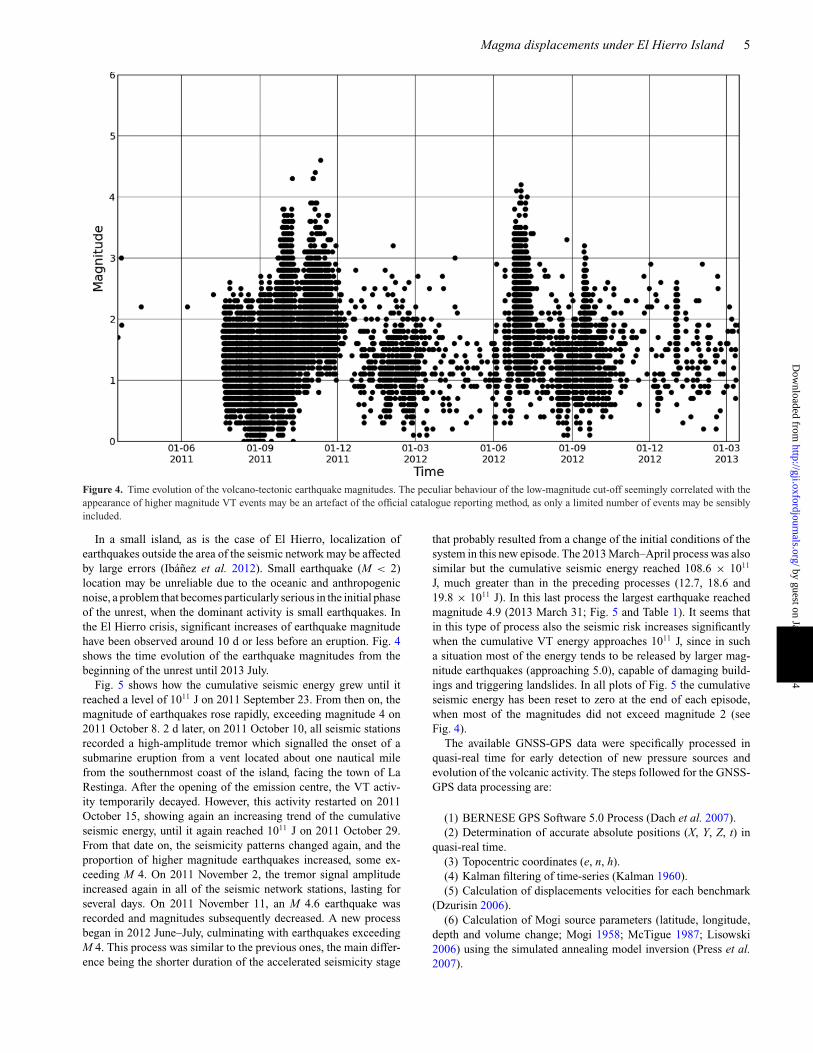
Figure 4. Time evolution of the volcano-tectonic earthquake magnitudes. The peculiar behaviour of the low-magnitude cut-off seemingly correlated with theappearance of higher magnitude VT events may be an artefact of the official catalogue reporting method, as only a limited number of events may be sensiblyincluded.
In a small island, as is the case of El Hierro, localization ofearthquakes outside the area of the seismic network may be affectedby large errors (Ibanez et al. 2012). Small earthquake (M < 2)location may be unreliable due to the oceanic and anthropogenicnoise, a problem that becomes particularly serious in the initial phaseof the unrest, when the dominant activity is small earthquakes. Inthe El Hierro crisis, significant increases of earthquake magnitudehave been observed around 10 d or less before an eruption. Fig. 4shows the time evolution of the earthquake magnitudes from thebeginning of the unrest until 2013 July.
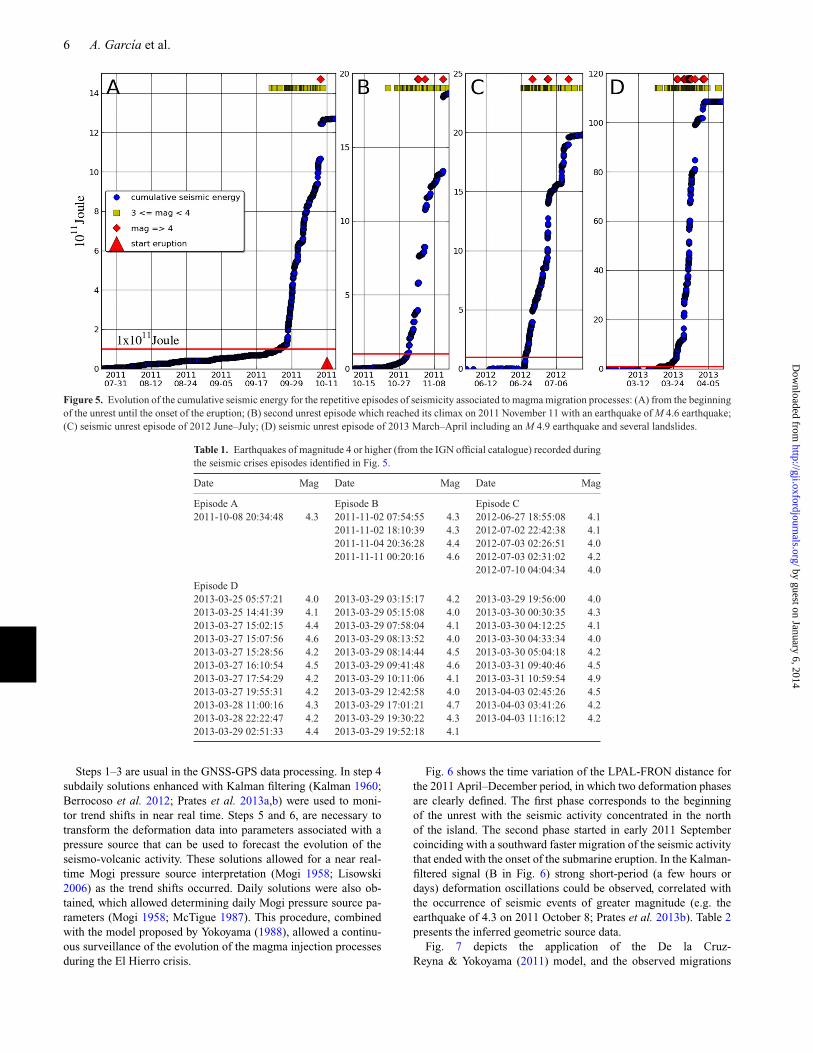
Fig. 5 shows how the cumulative seismic energy grew until itreached a level of 1011 J on 2011 September 23. From then on, themagnitude of earthquakes rose rapidly, exceeding magnitude 4 on2011 October 8. 2 d later, on 2011 October 10, all seismic stationsrecorded a high-amplitude tremor which signalled the onset of asubmarine eruption from a vent located about one nautical milefrom the southernmost coast of the island, facing the town of LaRestinga. After the opening of the emission centre, the VT activ-ity temporarily decayed. However, this activity restarted on 2011October 15, showing again an increasing trend of the cumulativeseismic energy, until it again reached 1011 J on 2011 October 29.From that date on, the seismicity patterns changed again, and theproportion of higher magnitude earthquakes increased, some ex-ceeding M 4. On 2011 November 2, the tremor signal amplitudeincreased again in all of the seismic network stations, lasting forseveral days. On 2011 November 11, an M 4.6 earthquake wasrecorded and magnitudes subsequently decreased. A new processbegan in 2012 June–July, culminating with earthquakes exceedingM 4. This process was similar to the previous ones, the main differ-ence being the shorter duration of the accelerated seismicity stage
that probably resulted from a change of the initial conditions of thesystem in this new episode. The 2013 March–April process was alsosimilar but the cumulative seismic energy reached 108.6 × 10¹¹
J, much greater than in the preceding processes (12.7, 18.6 and19.8 × 1011 J). In this last process the largest earthquake reachedmagnitude 4.9 (2013 March 31; Fig. 5 and Table 1). It seems thatin this type of process also the seismic risk increases significantlywhen the cumulative VT energy approaches 1011 J, since in sucha situation most of the energy tends to be released by larger mag-nitude earthquakes (approaching 5.0), capable of damaging build-ings and triggering landslides. In all plots of Fig. 5 the cumulativeseismic energy has been reset to zero at the end of each episode,when most of the magnitudes did not exceed magnitude 2 (seeFig. 4).
The available GNSS-GPS data were specifically processed inquasi-real time for early detection of new pressure sources andevolution of the volcanic activity. The steps followed for the GNSS-GPS data processing are:
(1) BERNESE GPS Software 5.0 Process (Dach et al. 2007).(2) Determination of accurate absolute positions (X, Y, Z, t) in
quasi-real time.(3) Topocentric coordinates (e, n, h).(4) Kalman filtering of time-series (Kalman 1960).(5) Calculation of displacements velocities for each benchmark
(Dzurisin 2006).(6) Calculation of Mogi source parameters (latitude, longitude,
depth and volume change; Mogi 1958; McTigue 1987; Lisowski2006) using the simulated annealing model inversion (Press et al.2007).
by guest on January 6, 2014http://gji.oxfordjournals.org/
Dow
nloaded from
6 A. Garcıa et al.
Figure 5. Evolution of the cumulative seismic energy for the repetitive episodes of seismicity associated to magma migration processes: (A) from the beginningof the unrest until the onset of the eruption; (B) second unrest episode which reached its climax on 2011 November 11 with an earthquake of M 4.6 earthquake;(C) seismic unrest episode of 2012 June–July; (D) seismic unrest episode of 2013 March–April including an M 4.9 earthquake and several landslides.
Table 1. Earthquakes of magnitude 4 or higher (from the IGN official catalogue) recorded duringthe seismic crises episodes identified in Fig. 5.
Date Mag Date Mag Date Mag
Episode A Episode B Episode C2011-10-08 20:34:48 4.3 2011-11-02 07:54:55 4.3 2012-06-27 18:55:08 4.1
2011-11-02 18:10:39 4.3 2012-07-02 22:42:38 4.12011-11-04 20:36:28 4.4 2012-07-03 02:26:51 4.02011-11-11 00:20:16 4.6 2012-07-03 02:31:02 4.2
2012-07-10 04:04:34 4.0
Episode D2013-03-25 05:57:21 4.0 2013-03-29 03:15:17 4.2 2013-03-29 19:56:00 4.02013-03-25 14:41:39 4.1 2013-03-29 05:15:08 4.0 2013-03-30 00:30:35 4.32013-03-27 15:02:15 4.4 2013-03-29 07:58:04 4.1 2013-03-30 04:12:25 4.12013-03-27 15:07:56 4.6 2013-03-29 08:13:52 4.0 2013-03-30 04:33:34 4.02013-03-27 15:28:56 4.2 2013-03-29 08:14:44 4.5 2013-03-30 05:04:18 4.22013-03-27 16:10:54 4.5 2013-03-29 09:41:48 4.6 2013-03-31 09:40:46 4.52013-03-27 17:54:29 4.2 2013-03-29 10:11:06 4.1 2013-03-31 10:59:54 4.92013-03-27 19:55:31 4.2 2013-03-29 12:42:58 4.0 2013-04-03 02:45:26 4.52013-03-28 11:00:16 4.3 2013-03-29 17:01:21 4.7 2013-04-03 03:41:26 4.22013-03-28 22:22:47 4.2 2013-03-29 19:30:22 4.3 2013-04-03 11:16:12 4.22013-03-29 02:51:33 4.4 2013-03-29 19:52:18 4.1
Steps 1–3 are usual in the GNSS-GPS data processing. In step 4subdaily solutions enhanced with Kalman filtering (Kalman 1960;Berrocoso et al. 2012; Prates et al. 2013a,b) were used to moni-tor trend shifts in near real time. Steps 5 and 6, are necessary totransform the deformation data into parameters associated with apressure source that can be used to forecast the evolution of theseismo-volcanic activity. These solutions allowed for a near real-time Mogi pressure source interpretation (Mogi 1958; Lisowski2006) as the trend shifts occurred. Daily solutions were also ob-tained, which allowed determining daily Mogi pressure source pa-rameters (Mogi 1958; McTigue 1987). This procedure, combinedwith the model proposed by Yokoyama (1988), allowed a continu-ous surveillance of the evolution of the magma injection processesduring the El Hierro crisis.
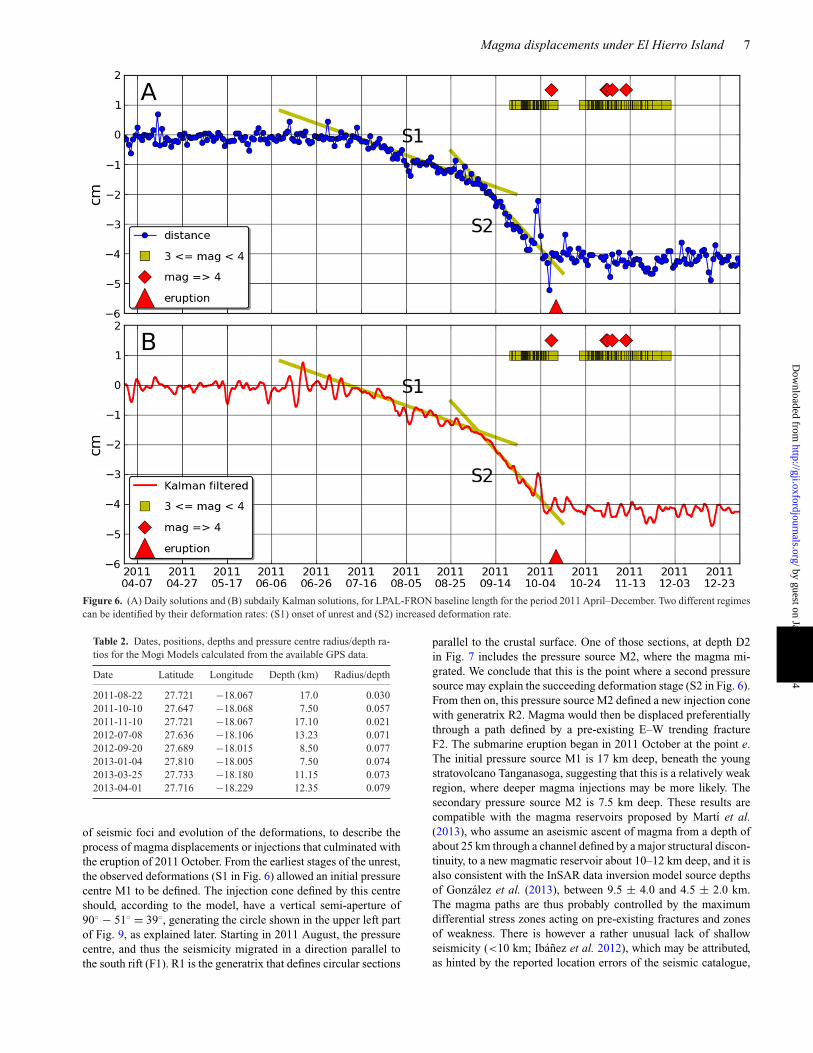
Fig. 6 shows the time variation of the LPAL-FRON distance forthe 2011 April–December period, in which two deformation phasesare clearly defined. The first phase corresponds to the beginningof the unrest with the seismic activity concentrated in the northof the island. The second phase started in early 2011 Septembercoinciding with a southward faster migration of the seismic activitythat ended with the onset of the submarine eruption. In the Kalman-filtered signal (B in Fig. 6) strong short-period (a few hours ordays) deformation oscillations could be observed, correlated withthe occurrence of seismic events of greater magnitude (e.g. theearthquake of 4.3 on 2011 October 8; Prates et al. 2013b). Table 2presents the inferred geometric source data.
Fig. 7 depicts the application of the De la Cruz-Reyna & Yokoyama (2011) model, and the observed migrations
by guest on January 6, 2014http://gji.oxfordjournals.org/
Dow
nloaded from
Magma displacements under El Hierro Island 7
Figure 6. (A) Daily solutions and (B) subdaily Kalman solutions, for LPAL-FRON baseline length for the period 2011 April–December. Two different regimescan be identified by their deformation rates: (S1) onset of unrest and (S2) increased deformation rate.
Table 2. Dates, positions, depths and pressure centre radius/depth ra-tios for the Mogi Models calculated from the available GPS data.
Date Latitude Longitude Depth (km) Radius/depth
2011-08-22 27.721 −18.067 17.0 0.0302011-10-10 27.647 −18.068 7.50 0.0572011-11-10 27.721 −18.067 17.10 0.0212012-07-08 27.636 −18.106 13.23 0.0712012-09-20 27.689 −18.015 8.50 0.0772013-01-04 27.810 −18.005 7.50 0.0742013-03-25 27.733 −18.180 11.15 0.0732013-04-01 27.716 −18.229 12.35 0.079
of seismic foci and evolution of the deformations, to describe theprocess of magma displacements or injections that culminated withthe eruption of 2011 October. From the earliest stages of the unrest,the observed deformations (S1 in Fig. 6) allowed an initial pressurecentre M1 to be defined. The injection cone defined by this centreshould, according to the model, have a vertical semi-aperture of90◦ − 51◦ = 39◦, generating the circle shown in the upper left partof Fig. 9, as explained later. Starting in 2011 August, the pressurecentre, and thus the seismicity migrated in a direction parallel tothe south rift (F1). R1 is the generatrix that defines circular sections
parallel to the crustal surface. One of those sections, at depth D2in Fig. 7 includes the pressure source M2, where the magma mi-grated. We conclude that this is the point where a second pressuresource may explain the succeeding deformation stage (S2 in Fig. 6).From then on, this pressure source M2 defined a new injection conewith generatrix R2. Magma would then be displaced preferentiallythrough a path defined by a pre-existing E–W trending fractureF2. The submarine eruption began in 2011 October at the point e.The initial pressure source M1 is 17 km deep, beneath the youngstratovolcano Tanganasoga, suggesting that this is a relatively weakregion, where deeper magma injections may be more likely. Thesecondary pressure source M2 is 7.5 km deep. These results arecompatible with the magma reservoirs proposed by Martı et al.(2013), who assume an aseismic ascent of magma from a depth ofabout 25 km through a channel defined by a major structural discon-tinuity, to a new magmatic reservoir about 10–12 km deep, and it isalso consistent with the InSAR data inversion model source depthsof Gonzalez et al. (2013), between 9.5 ± 4.0 and 4.5 ± 2.0 km.The magma paths are thus probably controlled by the maximumdifferential stress zones acting on pre-existing fractures and zonesof weakness. There is however a rather unusual lack of shallowseismicity (<10 km; Ibanez et al. 2012), which may be attributed,as hinted by the reported location errors of the seismic catalogue,
by guest on January 6, 2014http://gji.oxfordjournals.org/
Dow
nloaded from
8 A. Garcıa et al.
Figure 7. Application of the model of De la Cruz-Reyna and Yokoyama(2011) to the magma injection process that ended with the 2011 Octobereruption at El Hierro. From an initial pressure centre (M1) the magmapreferentially migrates through a path defined by the N–S trending fractureF1. In the intersection of the fractures marked F1 and F2, the accumulatedmagma forms a second pressure source (M2). From M2, the magma migratesthrough a new path (F2), reaching the surface at point e, starting an eruption.The inset shows an schematic view of the resulting maximum differentialstress cones.
to a combination of the geometry of the seismic network with aninadequate seismic velocity model for that region.
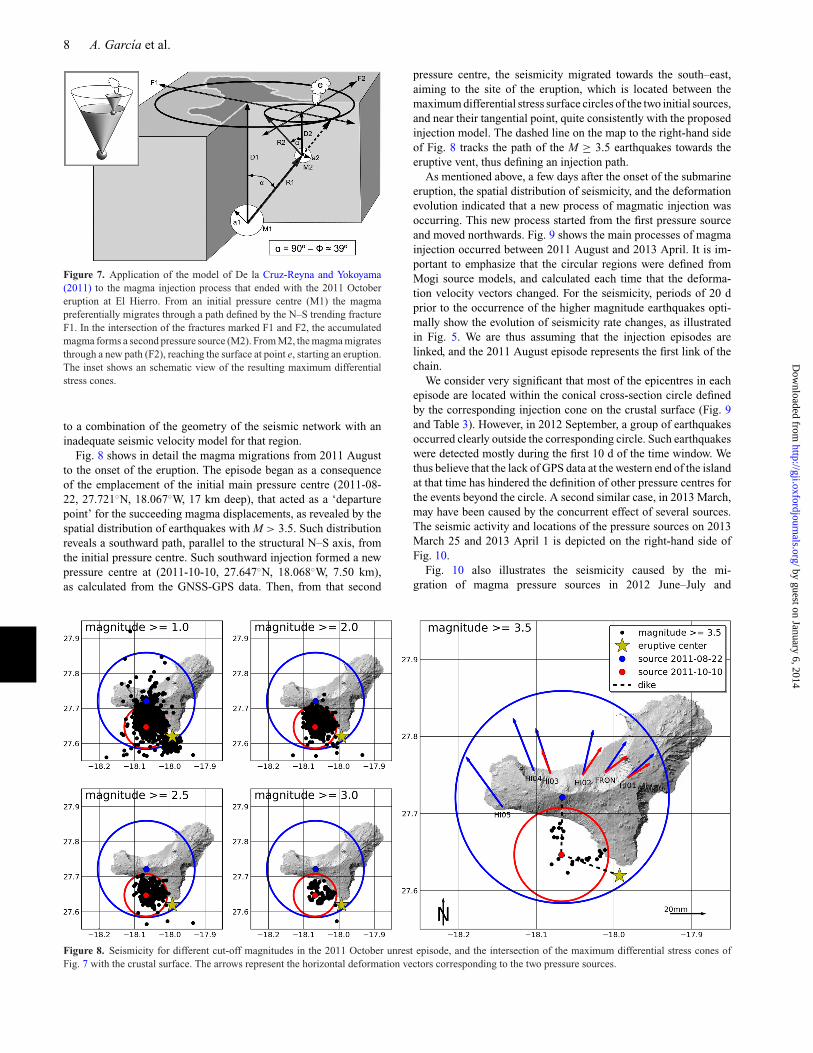
Fig. 8 shows in detail the magma migrations from 2011 Augustto the onset of the eruption. The episode began as a consequenceof the emplacement of the initial main pressure centre (2011-08-22, 27.721◦N, 18.067◦W, 17 km deep), that acted as a ‘departurepoint’ for the succeeding magma displacements, as revealed by thespatial distribution of earthquakes with M > 3.5. Such distributionreveals a southward path, parallel to the structural N–S axis, fromthe initial pressure centre. Such southward injection formed a newpressure centre at (2011-10-10, 27.647◦N, 18.068◦W, 7.50 km),as calculated from the GNSS-GPS data. Then, from that second
pressure centre, the seismicity migrated towards the south–east,aiming to the site of the eruption, which is located between themaximum differential stress surface circles of the two initial sources,and near their tangential point, quite consistently with the proposedinjection model. The dashed line on the map to the right-hand sideof Fig. 8 tracks the path of the M ≥ 3.5 earthquakes towards theeruptive vent, thus defining an injection path.
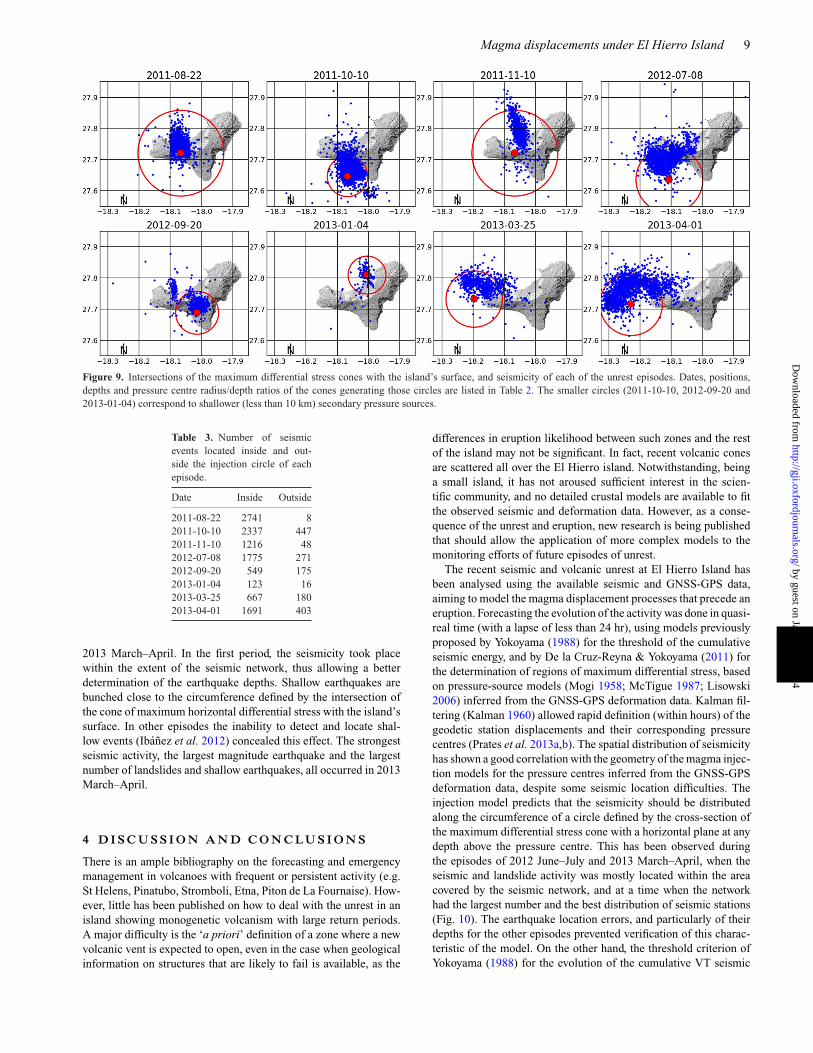
As mentioned above, a few days after the onset of the submarineeruption, the spatial distribution of seismicity, and the deformationevolution indicated that a new process of magmatic injection wasoccurring. This new process started from the first pressure sourceand moved northwards. Fig. 9 shows the main processes of magmainjection occurred between 2011 August and 2013 April. It is im-portant to emphasize that the circular regions were defined fromMogi source models, and calculated each time that the deforma-tion velocity vectors changed. For the seismicity, periods of 20 dprior to the occurrence of the higher magnitude earthquakes opti-mally show the evolution of seismicity rate changes, as illustratedin Fig. 5. We are thus assuming that the injection episodes arelinked, and the 2011 August episode represents the first link of thechain.
We consider very significant that most of the epicentres in eachepisode are located within the conical cross-section circle definedby the corresponding injection cone on the crustal surface (Fig. 9and Table 3). However, in 2012 September, a group of earthquakesoccurred clearly outside the corresponding circle. Such earthquakeswere detected mostly during the first 10 d of the time window. Wethus believe that the lack of GPS data at the western end of the islandat that time has hindered the definition of other pressure centres forthe events beyond the circle. A second similar case, in 2013 March,may have been caused by the concurrent effect of several sources.The seismic activity and locations of the pressure sources on 2013March 25 and 2013 April 1 is depicted on the right-hand side ofFig. 10.
Fig. 10 also illustrates the seismicity caused by the mi-gration of magma pressure sources in 2012 June–July and
Figure 8. Seismicity for different cut-off magnitudes in the 2011 October unrest episode, and the intersection of the maximum differential stress cones ofFig. 7 with the crustal surface. The arrows represent the horizontal deformation vectors corresponding to the two pressure sources.
by guest on January 6, 2014http://gji.oxfordjournals.org/
Dow
nloaded from
Magma displacements under El Hierro Island 9
Figure 9. Intersections of the maximum differential stress cones with the island’s surface, and seismicity of each of the unrest episodes. Dates, positions,depths and pressure centre radius/depth ratios of the cones generating those circles are listed in Table 2. The smaller circles (2011-10-10, 2012-09-20 and2013-01-04) correspond to shallower (less than 10 km) secondary pressure sources.
Table 3. Number of seismicevents located inside and out-side the injection circle of eachepisode.
Date Inside Outside
2011-08-22 2741 82011-10-10 2337 4472011-11-10 1216 482012-07-08 1775 2712012-09-20 549 1752013-01-04 123 162013-03-25 667 1802013-04-01 1691 403
2013 March–April. In the first period, the seismicity took placewithin the extent of the seismic network, thus allowing a betterdetermination of the earthquake depths. Shallow earthquakes arebunched close to the circumference defined by the intersection ofthe cone of maximum horizontal differential stress with the island’ssurface. In other episodes the inability to detect and locate shal-low events (Ibanez et al. 2012) concealed this effect. The strongestseismic activity, the largest magnitude earthquake and the largestnumber of landslides and shallow earthquakes, all occurred in 2013March–April.
4 D I S C U S S I O N A N D C O N C LU S I O N S
There is an ample bibliography on the forecasting and emergencymanagement in volcanoes with frequent or persistent activity (e.g.St Helens, Pinatubo, Stromboli, Etna, Piton de La Fournaise). How-ever, little has been published on how to deal with the unrest in anisland showing monogenetic volcanism with large return periods.A major difficulty is the ‘a priori’ definition of a zone where a newvolcanic vent is expected to open, even in the case when geologicalinformation on structures that are likely to fail is available, as the
differences in eruption likelihood between such zones and the restof the island may not be significant. In fact, recent volcanic conesare scattered all over the El Hierro island. Notwithstanding, beinga small island, it has not aroused sufficient interest in the scien-tific community, and no detailed crustal models are available to fitthe observed seismic and deformation data. However, as a conse-quence of the unrest and eruption, new research is being publishedthat should allow the application of more complex models to themonitoring efforts of future episodes of unrest.
The recent seismic and volcanic unrest at El Hierro Island hasbeen analysed using the available seismic and GNSS-GPS data,aiming to model the magma displacement processes that precede aneruption. Forecasting the evolution of the activity was done in quasi-real time (with a lapse of less than 24 hr), using models previouslyproposed by Yokoyama (1988) for the threshold of the cumulativeseismic energy, and by De la Cruz-Reyna & Yokoyama (2011) forthe determination of regions of maximum differential stress, basedon pressure-source models (Mogi 1958; McTigue 1987; Lisowski2006) inferred from the GNSS-GPS deformation data. Kalman fil-tering (Kalman 1960) allowed rapid definition (within hours) of thegeodetic station displacements and their corresponding pressurecentres (Prates et al. 2013a,b). The spatial distribution of seismicityhas shown a good correlation with the geometry of the magma injec-tion models for the pressure centres inferred from the GNSS-GPSdeformation data, despite some seismic location difficulties. Theinjection model predicts that the seismicity should be distributedalong the circumference of a circle defined by the cross-section ofthe maximum differential stress cone with a horizontal plane at anydepth above the pressure centre. This has been observed duringthe episodes of 2012 June–July and 2013 March–April, when theseismic and landslide activity was mostly located within the areacovered by the seismic network, and at a time when the networkhad the largest number and the best distribution of seismic stations(Fig. 10). The earthquake location errors, and particularly of theirdepths for the other episodes prevented verification of this charac-teristic of the model. On the other hand, the threshold criterion ofYokoyama (1988) for the evolution of the cumulative VT seismic
by guest on January 6, 2014http://gji.oxfordjournals.org/
Dow
nloaded from
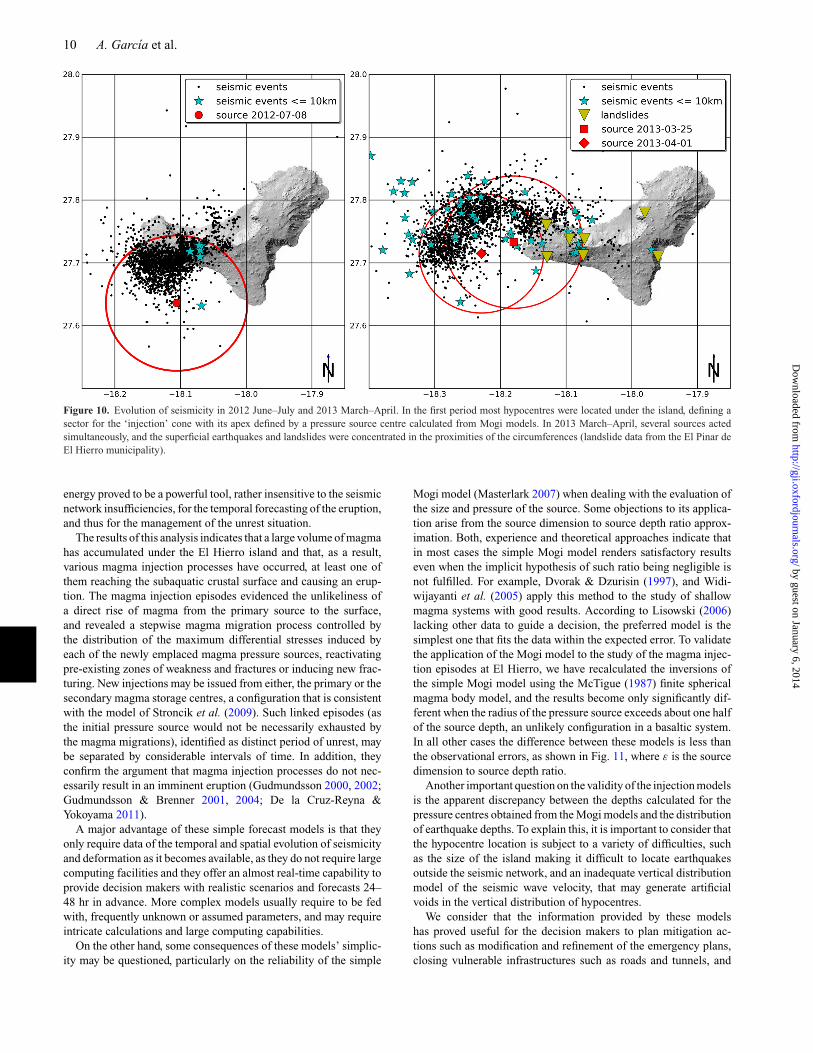
10 A. Garcıa et al.
Figure 10. Evolution of seismicity in 2012 June–July and 2013 March–April. In the first period most hypocentres were located under the island, defining asector for the ‘injection’ cone with its apex defined by a pressure source centre calculated from Mogi models. In 2013 March–April, several sources actedsimultaneously, and the superficial earthquakes and landslides were concentrated in the proximities of the circumferences (landslide data from the El Pinar deEl Hierro municipality).
energy proved to be a powerful tool, rather insensitive to the seismicnetwork insufficiencies, for the temporal forecasting of the eruption,and thus for the management of the unrest situation.
The results of this analysis indicates that a large volume of magmahas accumulated under the El Hierro island and that, as a result,various magma injection processes have occurred, at least one ofthem reaching the subaquatic crustal surface and causing an erup-tion. The magma injection episodes evidenced the unlikeliness ofa direct rise of magma from the primary source to the surface,and revealed a stepwise magma migration process controlled bythe distribution of the maximum differential stresses induced byeach of the newly emplaced magma pressure sources, reactivatingpre-existing zones of weakness and fractures or inducing new frac-turing. New injections may be issued from either, the primary or thesecondary magma storage centres, a configuration that is consistentwith the model of Stroncik et al. (2009). Such linked episodes (asthe initial pressure source would not be necessarily exhausted bythe magma migrations), identified as distinct period of unrest, maybe separated by considerable intervals of time. In addition, theyconfirm the argument that magma injection processes do not nec-essarily result in an imminent eruption (Gudmundsson 2000, 2002;Gudmundsson & Brenner 2001, 2004; De la Cruz-Reyna &Yokoyama 2011).
A major advantage of these simple forecast models is that theyonly require data of the temporal and spatial evolution of seismicityand deformation as it becomes available, as they do not require largecomputing facilities and they offer an almost real-time capability toprovide decision makers with realistic scenarios and forecasts 24–48 hr in advance. More complex models usually require to be fedwith, frequently unknown or assumed parameters, and may requireintricate calculations and large computing capabilities.
On the other hand, some consequences of these models’ simplic-ity may be questioned, particularly on the reliability of the simple
Mogi model (Masterlark 2007) when dealing with the evaluation ofthe size and pressure of the source. Some objections to its applica-tion arise from the source dimension to source depth ratio approx-imation. Both, experience and theoretical approaches indicate thatin most cases the simple Mogi model renders satisfactory resultseven when the implicit hypothesis of such ratio being negligible isnot fulfilled. For example, Dvorak & Dzurisin (1997), and Widi-wijayanti et al. (2005) apply this method to the study of shallowmagma systems with good results. According to Lisowski (2006)lacking other data to guide a decision, the preferred model is thesimplest one that fits the data within the expected error. To validatethe application of the Mogi model to the study of the magma injec-tion episodes at El Hierro, we have recalculated the inversions ofthe simple Mogi model using the McTigue (1987) finite sphericalmagma body model, and the results become only significantly dif-ferent when the radius of the pressure source exceeds about one halfof the source depth, an unlikely configuration in a basaltic system.In all other cases the difference between these models is less thanthe observational errors, as shown in Fig. 11, where ε is the sourcedimension to source depth ratio.
Another important question on the validity of the injection modelsis the apparent discrepancy between the depths calculated for thepressure centres obtained from the Mogi models and the distributionof earthquake depths. To explain this, it is important to consider thatthe hypocentre location is subject to a variety of difficulties, suchas the size of the island making it difficult to locate earthquakesoutside the seismic network, and an inadequate vertical distributionmodel of the seismic wave velocity, that may generate artificialvoids in the vertical distribution of hypocentres.
We consider that the information provided by these modelshas proved useful for the decision makers to plan mitigation ac-tions such as modification and refinement of the emergency plans,closing vulnerable infrastructures such as roads and tunnels, and
by guest on January 6, 2014http://gji.oxfordjournals.org/
Dow
nloaded from
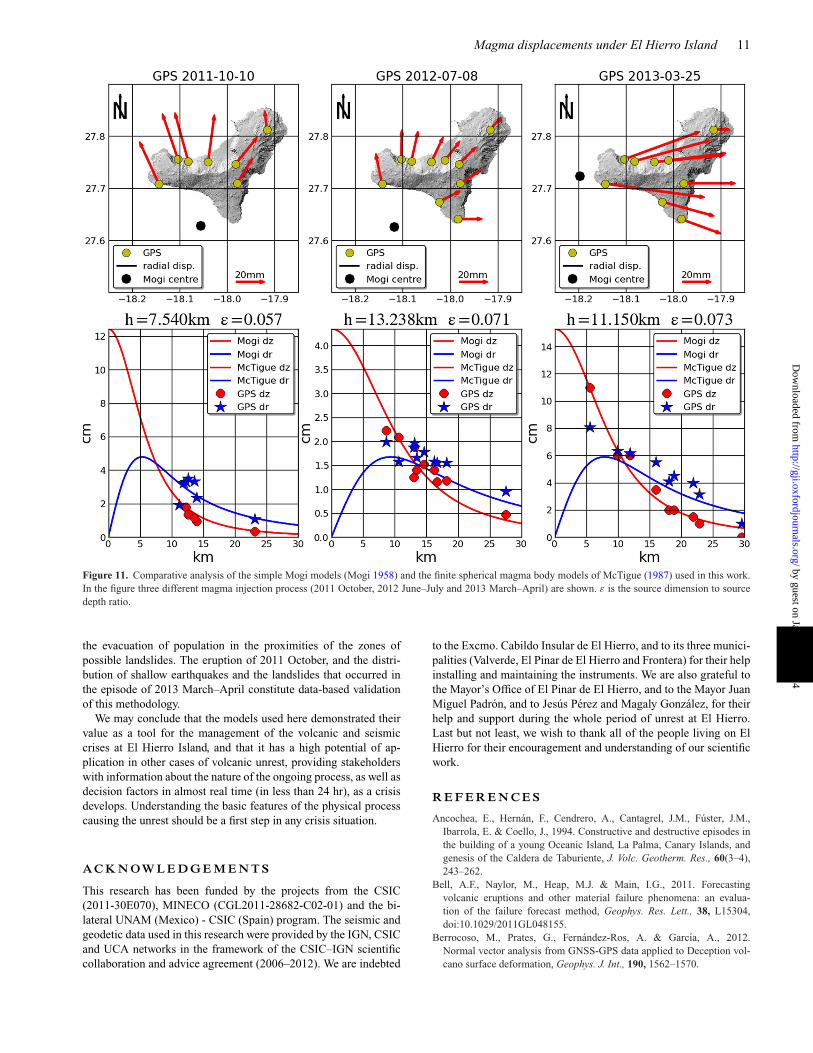
Magma displacements under El Hierro Island 11
Figure 11. Comparative analysis of the simple Mogi models (Mogi 1958) and the finite spherical magma body models of McTigue (1987) used in this work.In the figure three different magma injection process (2011 October, 2012 June–July and 2013 March–April) are shown. ε is the source dimension to sourcedepth ratio.
the evacuation of population in the proximities of the zones ofpossible landslides. The eruption of 2011 October, and the distri-bution of shallow earthquakes and the landslides that occurred inthe episode of 2013 March–April constitute data-based validationof this methodology.
We may conclude that the models used here demonstrated theirvalue as a tool for the management of the volcanic and seismiccrises at El Hierro Island, and that it has a high potential of ap-plication in other cases of volcanic unrest, providing stakeholderswith information about the nature of the ongoing process, as well asdecision factors in almost real time (in less than 24 hr), as a crisisdevelops. Understanding the basic features of the physical processcausing the unrest should be a first step in any crisis situation.
A C K N OW L E D G E M E N T S
This research has been funded by the projects from the CSIC(2011-30E070), MINECO (CGL2011-28682-C02-01) and the bi-lateral UNAM (Mexico) - CSIC (Spain) program. The seismic andgeodetic data used in this research were provided by the IGN, CSICand UCA networks in the framework of the CSIC–IGN scientificcollaboration and advice agreement (2006–2012). We are indebted
to the Excmo. Cabildo Insular de El Hierro, and to its three munici-palities (Valverde, El Pinar de El Hierro and Frontera) for their helpinstalling and maintaining the instruments. We are also grateful tothe Mayor’s Office of El Pinar de El Hierro, and to the Mayor JuanMiguel Padron, and to Jesus Perez and Magaly Gonzalez, for theirhelp and support during the whole period of unrest at El Hierro.Last but not least, we wish to thank all of the people living on ElHierro for their encouragement and understanding of our scientificwork.
R E F E R E N C E S
Ancochea, E., Hernan, F., Cendrero, A., Cantagrel, J.M., Fuster, J.M.,Ibarrola, E. & Coello, J., 1994. Constructive and destructive episodes inthe building of a young Oceanic Island, La Palma, Canary Islands, andgenesis of the Caldera de Taburiente, J. Volc. Geotherm. Res., 60(3–4),243–262.
Bell, A.F., Naylor, M., Heap, M.J. & Main, I.G., 2011. Forecastingvolcanic eruptions and other material failure phenomena: an evalua-tion of the failure forecast method, Geophys. Res. Lett., 38, L15304,doi:10.1029/2011GL048155.
Berrocoso, M., Prates, G., Fernandez-Ros, A. & Garcıa, A., 2012.Normal vector analysis from GNSS-GPS data applied to Deception vol-cano surface deformation, Geophys. J. Int., 190, 1562–1570.
by guest on January 6, 2014http://gji.oxfordjournals.org/
Dow
nloaded from
12 A. Garcıa et al.
Blanco-Montenegro, I., Nicolosi, I., Pignatelli, A. & Chiappini, M., 2008.Magnetic imaging of the feeding system of oceanic volcanic islands: ElHierro (Canary Islands), Geophys. J. Int., 173(1), 339–350.
Bosshard, E. & Macfarlane, D., 1970. Crustal structure of the western CanaryIslands from seismic refraction and gravity data, J. geophys. Res.-Sol.Earth., 75(26), 4901–4918.
Carbo, A., Munoz Martın, A., Llanes, P. & Alvarez, J. EEZ Working Group,2003. Gravity analysis offshore the Canary Islands from a systematicsurvey, Mar. geophys. Res., 24(1–2), 113–127.
Carracedo, J., 1994. The Canary Islands: an example of structural controlon the growth of large oceanic-island volcanoes, J. Volc. Geotherm. Res.,60(3–4), 225–241.
Carracedo, J.C., Day, S.J., Guillou, H. & Perez-Torrado, F.J., 1999. GiantQuaternary landslides in the evolution of La Palma and El Hierro, CanaryIslands, J. Volc. Geotherm. Res., 94, 169–190.
Carracedo, J.C., Rodrıguez-Badiola, E.R., Guillou, H., de la Nuez, J. &Perez-Torrado, F.J., 2001. Geology and volcanology of La Palma and ElHierro, Western Canaries, Estu. Geol., 57(5–6), 175–273.
Carracedo, J.C., Perez-Torrado, F., Rodrıguez-Gonzalez, A., Soler, V.,Fernandez-Turiel, J.L., Troll, V.R. & Wiesmaier, S., 2012. The 2011 sub-marine volcanic eruption in El Hierro (Canary Islands), Geol. Today,28(2), 53–58.
Catalan, M. & Martın Davila, J., 2003. A magnetic anomaly study offshorethe Canary Archipelago, Mar. geophys. Res., 24, 129–148.
Dach, R., Hugentobler, U., Fridez, P. & Meindl, M., 2007. Bernese GPS Soft-ware Version 5.0. Tech. Rep., 612 p., Astronomical Institute, Universityof Bern.
Day, S., Carracedo, J. & Guillou, H., 1997. Age and geometry of an abortedrift flank collapse: the San Andres fault system, El Hierro, Canary Islands,Geol. Mag., 134, 523–537.
De la Cruz-Reyna, S. & Reyes-Davila, G.A., 2001. A model to de-scribe precursory material-failure phenomena: applications to short-term forecasting at Colima volcano, Mexico, Bull. Volcanol., 63, 297–308.
De la Cruz-Reyna, S. & Yokoyama, I., 2011. A geophysical characterizationof monogenetic volcanism, Geofis. Int., 50, 465–484.
De la Cruz-Reyna, S., Yokoyama, I., Martinez-Bringas, A. & Ramos, E.,2008. Precursory seismicity of the 1994 eruption of Popocatepetl Volcano,Central Mexico, Bull. Volcanol., 70(6), 753–767.
Dvorak, J.J. & Dzurisin, D., 1997. Volcano geodesy: the search for magmareservoirs and the formation of eruptive vents, Rev. Geophys., 35(3), 343–384.
Dzurisin, D., 2006. Volcano Deformation: New Geodetic Monitoring Tech-niques, Springer.
Gee, M., Masson, D., Watts, A. & Mitchell, N., 2001a. Offshore continuationof volcanic rift zones, El Hierro, Canary Islands, J. Volc. Geotherm. Res.,105(1–2), 107–119.
Gee, M.J., Watts, A.B., Masson, D.G. & Mitchell, N.C., 2001b. Landslidesand the evolution of El Hierro in the Canary Islands, Mar. Geol., 177(3–4),271–293.
Gonzalez, P.J. et al., 2013. Magma storage and migration associated withthe 2011-2012 El Hierro eruption: implications for crustal magmaticsystems at oceanic island volcanoes, J. geophys. Res.-Sol. Earth, 118, 1–17.
Gorbatikov, A., Montesinos, F., Arnoso, J. & Stepanova, M., 2010. El HierroIsland Model-Canary-On a basis of joint interpretation of microseismicsounding and gravity inversions, in Proceedings of the European Associ-ation of Geoscientists & Engineers 4th International Conference & Ex-hibition, no. P211, pp.1–5, European Association of Geoscientist & En-gineers, Saint Petersburg, Russia.
Gudmundsson, A., 2000. Dynamics of volcanic systems in Iceland: exampleof tectonism and volcanism at juxtaposed hot spot and mid-ocean ridgesystems, Annu. Rev. Earth planet. Sci., 28(1), 107–140.
Gudmundsson, A., 2002. Emplacement and arrest of sheets and dykes incentral volcanoes, J. Volc. Geotherm. Res., 116(3–4), 279–298.
Gudmundsson, A. & Brenner, S.L., 2001. How hydrofractures become ar-rested, Terra Nova, 13(6), 456–462.
Gudmundsson, A. & Brenner, S., 2004. Local stresses, dyke arrest andsurface deformation in volcanic edifices and rift zones, Ann. Geophys.-Italy, 47(4), 1433–1454.
Guillou, H., Carracedo, J., Perez Torrado, F. & Rodrıguez Badiola, E., 1996.K-Ar ages and magnetic stratigraphy of a hotspot-induced, fast grownoceanic island: El Hierro, Canary Islands, J. Volc. Geotherm. Res., 73(1–2), 141–155.
Hernandez-Pacheco, A., 1982. Sobre una posible erupcion en 1793 en laisla de El Hierro (Canarias), Estu. Geol., 38(1–2), 15–26.
Ibanez, J.M., De Angelis, S., Dıaz-Moreno, A., Hernandez, P., Alguacil,G., Posadas, A. & Perez, N., 2012. Insights into the 2011-2012 subma-rine eruption off the coast of El Hierro (Canary Islands, Spain) fromstatistical analyses of earthquake activity, Geophys. J. Int., 191(2), 659–670.
Kalman, R.E., 1960. A new approach to linear filtering and prediction prob-lems, J. Basic Eng.-T. Asme., 82(1), 35–45.
Kilburn, C.R., 2003. Multiscale fracturing as a key to forecasting volcaniceruptions, J. Volc. Geotherm. Res., 125(3–4), 271–289.
Kilburn, C., 2012. Precursory deformation and fracture before brittle rockfailure and potential application to volcanic unrest, J. geophys. Res.-Sol.Earth, 117, B02211, doi:10.1029/2011JB008703.
Lisowski, M., 2006. Analytical volcano deformation source models, in Vol-cano Deformation, pp. 279–304, ed. Dzurisin, D., Springer.
Lopez, C. et al., 2012. Monitoring the volcanic unrest of El Hierro (CanaryIslands) before the onset of the 2011–2012 submarine eruption, Geophys.Res. Lett., 39, L13303, doi:10.1029/2012GL051846.
Martı, J. et al., 2013. Causes and mechanisms of El Hierro submarine erup-tion (2011-2012) (Canary Islands), J. geophys. Res.-Sol. Earth, 118(3),823–839.
Masson, D., Watts, A., Gee, M., Urgeles, R., Mitchell, N., Bas, T.L. &Canals, M., 2002. Slope failures on the flanks of the western CanaryIslands, Earth-Sci. Rev., 57(1–2), 1–35.
Masterlark, T., 2007. Magma intrusion and deformation predictions: sen-sitivities to the Mogi assumptions, J. geophys. Res.-Sol. Earth, 112(B6),B06419, doi:10.1029/2006JB004860.
McTigue, D., 1987. Elastic stress and deformation near a finite sphericalmagma body: resolution of the point source paradox, J. geophys. Res.-Sol. Earth, 92(B12), 12 931–12 940.
Mitchell, N.C., Masson, D.G., Watts, A.B., Gee, M.J. & Urgeles, R., 2002.The morphology of the submarine flanks of volcanic ocean islands: acomparative study of the Canary and Hawaiian hotspot islands, J. Volc.Geotherm. Res., 115(1–2), 83–107.
Mogi, K., 1958. Relations between the eruptions of various volcanoes andthe deformations of the ground surfaces around them, B. Earthq. Res.Inst. Univ. Tokio, 36, 99–134.
Montesinos, F., Arnoso, J. & Vieira, R., 2005. Using a genetic algorithmfor 3-D inversion of gravity data in Fuerteventura (Canary Islands), Int.J. Earth Sci., 94, 301–316.
Montesinos, F., Arnoso, J., Benavent, M. & Vieira, R., 2006. The crustalstructure of El Hierro (Canary Islands) from 3-D gravity inversion, J.Volc. Geotherm. Res., 150(1–3), 283–299.
Ortiz, R., Moreno, H., Garcıa, A., Fuentealba, G., Astiz, M., Pena, P.,Sanchez, N. & Tarraga, M., 2003. Villarrica volcano (Chile): charac-teristics of the volcanic tremor and forecasting of small explosions bymeans of a material failure method, J. Volc. Geotherm. Res., 128(1), 247–259.
Perez, N.M. et al., 2012. Precursory diffuse CO2 and H2S emission signa-tures of the 2011–2012 El Hierro submarine eruption, Canary Islands,Geophys. Res. Lett., 39(16), L16311, doi:10.1029/2012GL052410.
Prates, G., Berrocoso, M., Fernandez-Ros, A. & Garcıa, A., 2013a. En-hancement of sub-daily positioning solutions for surface deformationmonitoring at Deception volcano (South Shetland Islands, Antarctica),Bull. Volcanol., 75, 1–10.
Prates, G., Garcıa, A., Fernandez-Ros, A., Marrero, J.M., Ortiz, R. &Berrocoso, M., 2013b. Enhancement of sub-daily positioning solutionsfor surface deformation surveillance at El Hierro volcano (Canary Islands,Spain), Bull. Volcanol., 75(6), 1–9.
by guest on January 6, 2014http://gji.oxfordjournals.org/
Dow
nloaded from
Magma displacements under El Hierro Island 13
Press, W.H., Teukolsky, S.A., Vetterling, W.T. & Flannery, B.P., 2007. Sim-ulated annealing methods, in Numerical Recipes 3rd Edition: The Art ofScientific Computing, p. 1195, Cambridge Univ. Press.
Sezawa, K., 1931. The plastic-elastic deformation of a semi-infinite solidbody due to an internal force, B. Earthq. Res. Inst. Univ. Tokio, 9, 398–406.
Stroncik, N., Klugel, A. & Hansteen, T., 2009. The magmatic plumbing sys-tem beneath El Hierro (Canary Islands): constraints from phenocrysts andnaturally quenched basaltic glasses in submarine rocks, Contrib. Mineral.Petr., 157, 593–607.
Tarraga, M., Carniel, R., Ortiz, R. & Garcıa, A., 2008. Chapter 13, thefailure forecast method: review and application for the real-time detectionof precursory patterns at reawakening volcanoes, Dev. Volcanol., 10, 447–469.
Voight, B., 1988. A method for prediction of volcanic eruptions, Nature,332, 125–130.
Voight, B. & Cornelius, R.R., 1991. Prospects for eruption prediction innear real-time, Nature, 350, 695–698.
Watts, A.B., 1994. Crustal structure, gravity anomalies and flexure of litho-sphere in the vicinity of the Canary Islands, Geophys. J. Int., 119(2),648–666.
Widiwijayanti, C., Clarke, A., Elsworth, D. & Voight, B., 2005.Geodetic constraints on the shallow magma system at SoufriereHills Volcano, Montserrat, Geophys. Res. Lett., 32(11), L11309,doi:10.1029/2005GL022846.
Yokoyama, I., 1988. Seismic energy releases from volcanoes, Bull. Volcanol.,50, 1–13.
by guest on January 6, 2014http://gji.oxfordjournals.org/
Dow
nloaded from