integration potentials of insular energy systems to smart energy regions
TRANSCRIPT
This article was downloaded by: [79.130.36.201]On: 19 November 2014, At: 13:03Publisher: Taylor & FrancisInforma Ltd Registered in England and Wales Registered Number: 1072954 Registered office: Mortimer House,37-41 Mortimer Street, London W1T 3JH, UK
Energy Technology & Policy: An Open Access JournalPublication details, including instructions for authors and subscription information:http://www.tandfonline.com/loi/uetp20
Integration Potentials of Insular Energy Systems toSmart Energy RegionsParis A. Fokaidesa, Angeliki Kylilia, Andri Pyrgoua & Christopher J. Koroneosb
a School of Engineering and Applied Sciences, Frederick University, Nicosia, Cyprusb Laboratory of Heat Transfer and Environmental Engineering, Aristotle University ofThessaloniki, Thessaloniki, GreecePublished online: 17 Nov 2014.
To cite this article: Paris A. Fokaides, Angeliki Kylili, Andri Pyrgou & Christopher J. Koroneos (2014) Integration Potentialsof Insular Energy Systems to Smart Energy Regions, Energy Technology & Policy: An Open Access Journal, 1:1, 70-83, DOI:10.1080/23317000.2014.969455
To link to this article: http://dx.doi.org/10.1080/23317000.2014.969455
PLEASE SCROLL DOWN FOR ARTICLE
Taylor & Francis makes every effort to ensure the accuracy of all the information (the “Content”) contained inthe publications on our platform. Taylor & Francis, our agents, and our licensors make no representations orwarranties whatsoever as to the accuracy, completeness, or suitability for any purpose of the Content. Versionsof published Taylor & Francis and Routledge Open articles and Taylor & Francis and Routledge Open Selectarticles posted to institutional or subject repositories or any other third-party website are without warrantyfrom Taylor & Francis of any kind, either expressed or implied, including, but not limited to, warranties ofmerchantability, fitness for a particular purpose, or non-infringement. Any opinions and views expressed in thisarticle are the opinions and views of the authors, and are not the views of or endorsed by Taylor & Francis. Theaccuracy of the Content should not be relied upon and should be independently verified with primary sourcesof information. Taylor & Francis shall not be liable for any losses, actions, claims, proceedings, demands,costs, expenses, damages, and other liabilities whatsoever or howsoever caused arising directly or indirectly inconnection with, in relation to or arising out of the use of the Content. This article may be used for research, teaching, and private study purposes. Terms & Conditions of access anduse can be found at http://www.tandfonline.com/page/terms-and-conditions It is essential that you check the license status of any given Open and Open Select article to confirmconditions of access and use.
Energy Technology & Policy (2014) 1, 70–83Published with license by Taylor & Francis Group, LLCISSN: 2331-7000 onlineDOI: 10.1080/23317000.2014.969455
Integration Potentials of Insular Energy Systems to Smart EnergyRegions
PARIS A. FOKAIDES1* , ANGELIKI KYLILI1, ANDRI PYRGOU1, and CHRISTOPHER J. KORONEOS2
1School of Engineering and Applied Sciences, Frederick University, Nicosia, Cyprus2Laboratory of Heat Transfer and Environmental Engineering, Aristotle University of Thessaloniki, Thessaloniki, Greece
Received June 2014, Accepted August 2014
Abstract: Smart energy regions are defined as regions that offer maximal quality of living to their inhabitants with a minimal consump-tion of energy by intelligently joining of infrastructure (energy, mobility, transport, communication, etc.) on different hierarchical levels(building, district, city). The development of insular energy systems into smart energy regions, due to their special character, is presentedwith some challenges. The focus of this article is on presenting the potential of insular energy systems transforming into smart energyregions. Insular energy systems are defined based on data retrieved from Energy Information Administration (EIA) and classified accordingto their size and the nature of their isolation. In terms of this study, two novel indexes are introduced: the necessity index, which quantifiesthe need, and the ability index, which represents the capability of an insular energy system to develop into a smart one. These indexes aredefined for those insular systems that are considered potentially upgradable. The analysis revealed that the main prerequisites to achieve thedevelopment of insular energy systems into smart ones are the reduction of GHG emissions, the introduction of political obligation towardpromoting environmentally friendly policies, and the increase of RES utilization for energy production.
Keywords: Smart energy regions, necessity index, ability index, energy insular systems
1. Introduction
The emerging environmental concerns arising from the increaseof carbon dioxide (CO2) and greenhouse gases (GHG) emissions,the uncertainty of the international and regional energy supply,and the ever-increasing cost of energy have induced the neces-sity of promoting measures toward low-carbon societies. Smartenergy regions are expected to play a crucial role in achievingthe decarbonization of Europe’s economy, in line with the EU2020 energy and climate goals.
IEA’s World Energy Outlook (WEO)1 presents an assess-ment of the prospects for global energy markets in the periodto 2035 and draws out the implications for energy security, envi-ronmental protection, and economic development. The objectiveis to provide policymakers, industry, and the general public in
© Paris A. Fokaides, Angeliki Kylili, Andri Pyrgou, ChristopherJ. KoroneosThis is an Open Access article. Non-commercial re-use, distribution,and reproduction in any medium, provided the original work is prop-erly attributed, cited, and is not altered, transformed, or built upon inany way, is permitted. The moral rights of the named author(s) havebeen asserted.*Address correspondence to: Paris A. Fokaides, School ofEngineering and Applied Sciences, Frederick University, 7 Y.Friderickou Str., 1036 Nicosia, Cyprus. Email: [email protected]
countries all over the world with the data, analysis, and insightsneeded to make judgments about our energy future, as a basis forsound energy decision-making. Demographic factors will con-tinue to drive changes in the energy mix. Energy technologiesthat are already in use or that are approaching commercial-ization are expected to achieve ongoing cost reductions as aresult of increased learning and deployment. Although there areexceptions that create some basis for optimism, recent progressin deploying clean energy technologies has not matched policyexpectations, and, in many cases, their future uptake hinges ondedicated policy support or subsidies.
The European Strategic Energy Technology Plan (SET Plan),the strategic plan to accelerate the development and deploymentof cost-effective low-carbon technologies in Europe, defines“smart cities” as systems of people interacting with and usingflows of energy, materials, and services and financing to catalyzesustainable economic development, resilience, and high qualityof life.2 According to the SET Plan, these flows and interactionsbecome smart through making strategic use of information andcommunication infrastructure and services in a process of trans-parent urban planning and management that is responsive to thesocial and economic needs of society.3 However, a broad set ofchallenges, including the lack of skills related to implementinglow-carbon technologies in the built environment, misunder-standing of capital and operational costs, where technologiescan be implemented, the impact on quality of life and policy,and planning for the future have yet to be overcome in orderto enable technologies to be widely applicable and transferable
Dow
nloa
ded
by [
79.1
30.3
6.20
1] a
t 13:
03 1
9 N
ovem
ber
2014
Integration Potentials of Insular Energy Systems 71
within and between regions within the context of a low-carbonbuilt environment.4
The distinctiveness of insular energy systems, defined by thecountry’s inability to interconnect with other energy generatorsand/or consumers through a wider transmission grid outside itsnational borders, is what drives their need to develop into smartones.5 This interconnection inability could be attributed to thesmallness of the system, its remoteness, or political aspects. Thegreat dependency of insular systems on imported conventionalfossil fuels typically makes their power generation costly andinsecure. Furthermore, the potential of these energy systems forrenewable energy generation extends only up to the point allowedby the locally available environmental conditions.
This study aims to introduce quantitative parameters for thedefinition and classification of energy insular systems as well astheir capability of being integrated to energy smart ones. In termsof this study, the main features of energy insular systems, as wellas the existing gap between the current status and the vision ofenergy intelligence, will be analyzed and discussed. This workhas been introduced by providing definitions for smart energyregions and insular energy systems. The following section willpresent the necessary provisions for the upgrading of an energysystem into an intelligent one and explain the special natureof an insular energy system, while Section 3 will describe themethodology for the classification of energy insular systems.The development of two novel indices, the necessity and abilityindices that are introduced in this article, will also be presentedin Section 3. The results of the analysis and the relevant discus-sion are given in Section 4, and the last section provides the finalconcluding remarks.
2. Theoretical Background
2.1 Energy Smart Regions Development Prerequisites
Global environmental problems such as global warming causedby human activities are expected to be alleviated once the cur-rent society of heavy energy consumption transforms into arecycling-oriented society with systematic energy- and resource-saving measures.6 The prerequisites for the development of anintelligent energy region are the following:
• The existence or the potential of developing the necessaryenergy distribution and storage infrastructure in terms of smartgrids
• The existence of advanced renewable energy sources (RES)applications as well as the required renewable energy potentialfor the diversification of the energy mix
• The existence of indigenous energy sources and their contribu-tion toward reducing the cost of energy
• The existence of political obligations such as those imposedunder European directives or other policy initiatives such asthe Kyoto Protocol
2.1.1 Gross Domestic Product (GDP) and Economic GrowthRate
The development of smart energy regions requires the existenceor the potential to develop the required infrastructure. This poten-tial can be defined through financial vectors such as the country’sgross domestic product (GDP) and its economic growth rate.
Energy consumption and GDP exert a positive impact on eachother.7 Countries that increase investment in energy infrastruc-ture and promote the development of energy efficiency measuresavoid as well the negative effect on the country’s economicgrowth by reducing energy dependency. Kjaer elaborates evenfurther, stating that the development of infrastructure solutionsnot only reduces the transfer of a country’s wealth to oil exportersbut also increases the input money in its own economy and,furthermore, gains control of its own energy future.8
2.1.2 Renewable Energy Technologies (RET)
Renewable energy technologies (RET) consist of a prerequisitefor the establishment of smart energy regions. RET exploit thepotential of solar, wind, geothermal, and tidal energy, as well asthe biomass and the hydropower potential and thus contributeto the diversification of the energy mix. Czisch9 has suggesteda “supergrid,” a high-voltage direct-current grid across the EUthat would be able transmit power from RES and deal withthe variability of RET, while Elliott10 confirms that a coun-try’s energy security requires a wide mix of renewable sources,scales, and locations. Moreover, Roiniotia et al.11 explain that thedevelopment of a more efficient, flexible, and environmentallyacceptable energy system will arise through its energy diversi-fication and efficiency, the co-operation of the energy marketparticipants, and the orientation of the economy toward RESinvestments. The available solar applications in the built sec-tor include solar photovoltaics (PV) and concentrating solarpower (CSP) for electricity generation, as well as solar ther-mal collectors for heat production. Kylili and Fokaides definedthe potentials of achieving zero energy buildings using buildingintegrated photovoltaics.12 Wind turbines are used for electricitygeneration, while biomass can be exploited for all three energysectors, namely electricity, heat, and transportation. The avail-able geothermal applications include high enthalpy systems forelectricity generation and mild enthalpy systems for heat pro-duction. Hydropower and tidal power also generate electricity byemploying hydro turbine and wave generators, respectively.
2.1.3 Indigenous and Imported Energy Sources
The potential of an energy system to be upgraded into a smart onegreatly depends on the availability of indigenous energy sources.The indigenous resources define the nature of the energy mixand the energy technologies, as well as the potential of the sys-tem’s further development. Michalena and Angeon13 reportedthat before the adoption of RETs’ promotion strategy, the specialcharacteristics of territories, such as the geo-morphologic par-ticularities, the energy, socioeconomic, and demographic char-acteristics, the local natural resources, and the level of greenawareness should be studied. Also, Kaldellis et al.14stated thatthe introduction of a variety of RET to the energy mix of aninsular system by employing the locally available resources canprovide a cheaper alternative to the high fossil-fuel electricitygeneration and also provide additional security to the power sys-tem. Other works, including Xydis et al.15 and Koroneos16 alsoencourage the utilization of indigenous energy sources to satisfythe local energy demands toward the development of an intelli-gent community. Additionally, the low cost of energy provided bythe indigenous energy sources gives the possibility of investingin other development areas of intelligent energy systems such as
Dow
nloa
ded
by [
79.1
30.3
6.20
1] a
t 13:
03 1
9 N
ovem
ber
2014
72 P. A. Fokaides et al.
in infrastructures for smart grids as well as in the promotion ofrenewable energy technologies.
2.1.4 Motivation Imposed by Political Obligations
Another significant parameter that defines the potential ofachieving smart energy systems is the political or other obliga-tions, which commit the countries to the promotion of relevantpolicies. Bojnec and Papler17 concluded that management strate-gies and policies are improving the country’s economic effi-ciency performance and, consequently, contributing to energysaving sustainable economic development. Examples include theDirective 2009/28/EC on the promotion of the use of energyfrom renewable sources and the Kyoto Protocol. The KyotoProtocol is considered the first attempt of humanity to miti-gate climate change, by committing countries internationally toachieve at least an 80% reduction of their GHG emissions fromtheir 1990 baseline levels by 2050. Encouraged by the KyotoProtocol, the EU has set 2020 as a milestone year, targeting forthe 20% contribution of the renewable energy sources (RES) toits overall energy consumption and a 10% contribution of RESto the transport sector, under the Directive 2009/28/EC. TheMember States were obligated to implement this directive intotheir legislations and develop their National Action Plans (NAP)to fulfil these targets.
In Europe, the motivation imposed by political obligations isdriven mainly by the climate and energy package, a set of bindinglegislation that aims to ensure the EU meets its ambitious climateand energy targets for 2020.18 These targets, known as the “20-20-20” targets, set three key objectives for 2020:
• A 20% reduction in EU greenhouse gas emissions from1990 levels;
• Raising the share of EU energy consumption produced fromrenewable resources to 20%;
• A 20% improvement in the EU’s energy efficiency.
The climate and energy package comprises four pieces of com-plementary legislation that are intended to deliver on the 20-20-20 targets. Apart from the promotion of the RES target,analyzed in the previous paragraph, the other three targets arethe following:
• Reform of the EU Emissions Trading System (EU ETS)• Set national targets for non-EU ETS emissions• Promote carbon capture and storage
The EU ETS is the key tool for cutting industrial greenhouse gasemissions most cost-effectively. The climate and energy pack-age includes a comprehensive revision and strengthening of thelegislation that underpins the EU ETS. Also under the so-calledeffort sharing decision, Member States have taken on bindingannual targets for reducing their greenhouse gas emissions fromthe sectors not covered by the EU ETS, such as housing, agri-culture, waste, and transport. The last element of the climate andenergy package is a directive creating a legal framework for theenvironmentally safe use of carbon capture and storage technolo-gies. Carbon capture and storage involves capturing the carbon
dioxide emitted by industrial processes and storing it in under-ground geological formations, where it does not contribute toglobal warming.
2.2 Energy Mix in Insular Energy Systems
The current energy mix of most insular energy systems is dom-inated by diesel and heavy fuel oil (HFO).19 The imports ofenergy fossil fuels to cover the demands of the insular system cre-ate a potential instability in the economy and the security of thecommunities.20 The absence of indigenous energy resources, thelimited infrastructure of energy delivery, the lack of storage, andthe flexibility of the power generators to meet seasonal needs pro-mote further the domination of fossil fuels. The high cost of fueltransportation and the risk of spills undermine their utilization.21
Insular energy systems typically have only a few independentpower producers, and there is not a variety of power genera-tion technologies. The reduction of GHG emissions is one ofthe greatest challenges for insular energy systems as most oftheir electricity production is based on fossil fuels.22 Typically,there are not adequate support schemes and incentives in insu-lar systems to promote the transition to alternative low-emissionenergy sources, and their current state makes it difficult andcostly to comply with international or European legislations, asalso expressed in Sanseverino et al.23
Existing external networks are based on a centralized supplymodel similar to what dominates today’s national and regionalenergy systems, the nature of which already requires significanttransmission capacities due to the long distance between cen-ters of supply and demand and significant built-in redundancyin capacity.24 Establishing flexible demand response to real-timeprice signals for all end-users is a central component of localenergy grids. Local smart energy grids may include all the ele-ments of a distributed micro-grid, such as the integration ofdifferent renewable energy technologies, the integration of microheat and power cogeneration units (CHP) and heat pumps indistributed generation, and the development of real-time mar-kets that allows for both households and distributed operators toprovide balancing and ancillary services.25−27
Archipelagos represent a special case of energy insular sys-tems. The islands’ interconnection, where possible, may gradu-ally replace the local autonomous power stations’ operation and,at the same time, allow the absorption of large amounts of renew-able energy without causing the instability effects noticed inautonomous grids. On the other hand, such an electricity produc-tion strategy has to face the significant technological problemsrelated to the undersea electricity transportation, the rather highfirst installation cost (approx. C3 million per km of transporta-tion grid), and the strong opposition of local societies claimingimportant environmental impacts.28
The energy transition of insular systems to energy smart onescan be achieved through various measures and policies such asthe promotion of energy efficiency measures, the establishmentof smart grids, the utilization of RET, and the installation oflarge storage systems. All the applications should preliminarilyconsider the local conditions of the energy system and prior con-sideration, and a feasibility study of the cost and investigation ofthe latest technologies should be conducted, as Kaldellis et al.29
have done for the case of Agathonisi in Greece. Exploiting RES,
Dow
nloa
ded
by [
79.1
30.3
6.20
1] a
t 13:
03 1
9 N
ovem
ber
2014
Integration Potentials of Insular Energy Systems 73
as indigenous energy sources, as well as mixing RET and/orhybrid RET models, can play an important role in reducing thelevel of energy imports of insular energy systems with positiveimpacts for the balance of trade and security of supply.30,31
3. Classification of Energy Insular Systems
In this study, the main assumption for defining an insular energysystem was zero electricity imports and exports from adjacentcountries. An energy-isolated system can easily be identified inthe case of an island as the surrounding sea is a barrier in thepower interchange. However, other mainland nations may be iso-lated due to political issues or lack of energy infrastructure andpower grids.
In terms of this study, insular systems were defined based ondata retrieved from the Energy Information Administration.32 Itshould be noted that only oil- producing countries and islandnations that were defined as energy insular systems were includedin the analysis. Islands and non-self-governing territories whoselegislation is regulated by a mainland central government wereexcluded. Energy insular systems were divided into three cate-gories according to the following parameters:
• Installed power capacity (up to 100 MW and from 100 MW to15 GW)
• Location (island or mainland nation)
Based on the above criteria, three categories of insular energysystems were defined (Table 1).
The first category includes islands having installed genera-tion capacity of up to 100 MW. The countries in this categoryhave limited energy demand and, in many cases, large distancefrom the mainland. The small energy requirements aggrandizethe impact of establishing renewable energy power stations asthe small economy of these regions is vulnerable to large-scaleinvestments. Only a few of these countries utilize renewableenergy sources, mainly hydroelectric power stations, and thesecontribute up to 5% of the energy mix. This category includes atotal of 17 countries: four in Africa, six in the United States, onein Asia, and six in Oceania.
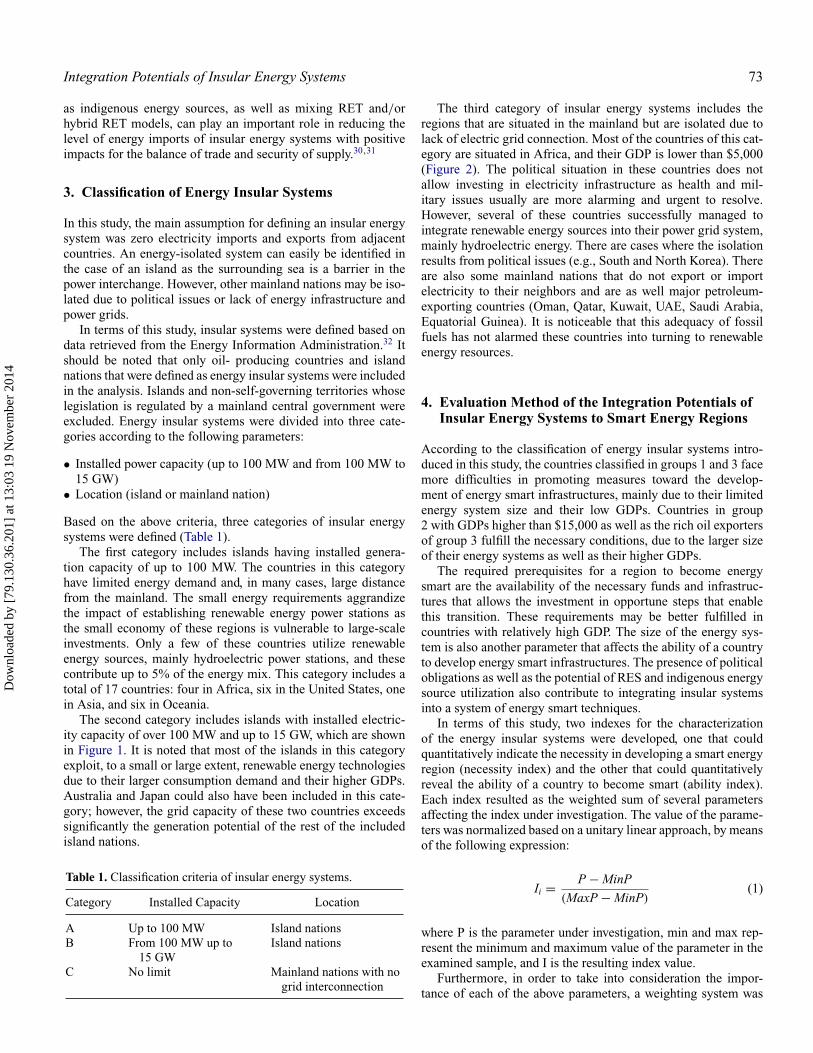
The second category includes islands with installed electric-ity capacity of over 100 MW and up to 15 GW, which are shownin Figure 1. It is noted that most of the islands in this categoryexploit, to a small or large extent, renewable energy technologiesdue to their larger consumption demand and their higher GDPs.Australia and Japan could also have been included in this cate-gory; however, the grid capacity of these two countries exceedssignificantly the generation potential of the rest of the includedisland nations.
Table 1. Classification criteria of insular energy systems.
Category Installed Capacity Location
A Up to 100 MW Island nationsB From 100 MW up to
15 GWIsland nations
C No limit Mainland nations with nogrid interconnection
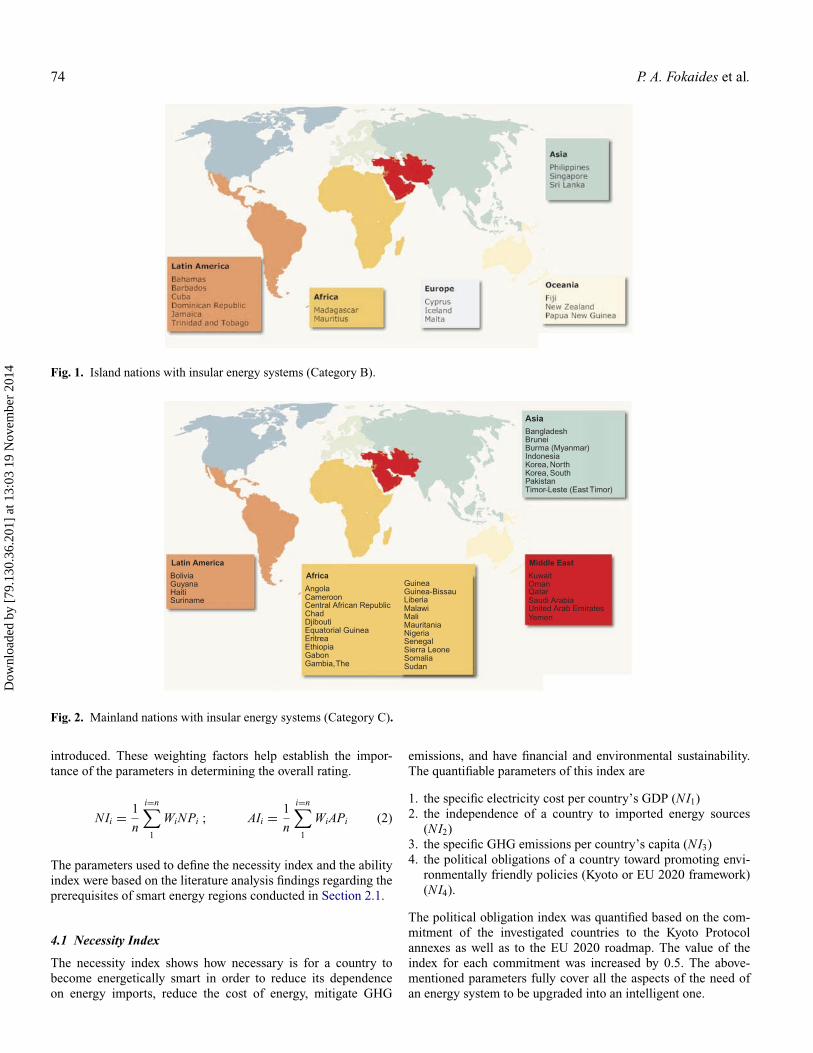
The third category of insular energy systems includes theregions that are situated in the mainland but are isolated due tolack of electric grid connection. Most of the countries of this cat-egory are situated in Africa, and their GDP is lower than $5,000(Figure 2). The political situation in these countries does notallow investing in electricity infrastructure as health and mil-itary issues usually are more alarming and urgent to resolve.However, several of these countries successfully managed tointegrate renewable energy sources into their power grid system,mainly hydroelectric energy. There are cases where the isolationresults from political issues (e.g., South and North Korea). Thereare also some mainland nations that do not export or importelectricity to their neighbors and are as well major petroleum-exporting countries (Oman, Qatar, Kuwait, UAE, Saudi Arabia,Equatorial Guinea). It is noticeable that this adequacy of fossilfuels has not alarmed these countries into turning to renewableenergy resources.
4. Evaluation Method of the Integration Potentials ofInsular Energy Systems to Smart Energy Regions
According to the classification of energy insular systems intro-duced in this study, the countries classified in groups 1 and 3 facemore difficulties in promoting measures toward the develop-ment of energy smart infrastructures, mainly due to their limitedenergy system size and their low GDPs. Countries in group2 with GDPs higher than $15,000 as well as the rich oil exportersof group 3 fulfill the necessary conditions, due to the larger sizeof their energy systems as well as their higher GDPs.
The required prerequisites for a region to become energysmart are the availability of the necessary funds and infrastruc-tures that allows the investment in opportune steps that enablethis transition. These requirements may be better fulfilled incountries with relatively high GDP. The size of the energy sys-tem is also another parameter that affects the ability of a countryto develop energy smart infrastructures. The presence of politicalobligations as well as the potential of RES and indigenous energysource utilization also contribute to integrating insular systemsinto a system of energy smart techniques.
In terms of this study, two indexes for the characterizationof the energy insular systems were developed, one that couldquantitatively indicate the necessity in developing a smart energyregion (necessity index) and the other that could quantitativelyreveal the ability of a country to become smart (ability index).Each index resulted as the weighted sum of several parametersaffecting the index under investigation. The value of the parame-ters was normalized based on a unitary linear approach, by meansof the following expression:
Ii = P − MinP
(MaxP − MinP)(1)
where P is the parameter under investigation, min and max rep-resent the minimum and maximum value of the parameter in theexamined sample, and I is the resulting index value.
Furthermore, in order to take into consideration the impor-tance of each of the above parameters, a weighting system was
Dow
nloa
ded
by [
79.1
30.3
6.20
1] a
t 13:
03 1
9 N
ovem
ber
2014
74 P. A. Fokaides et al.
Fig. 1. Island nations with insular energy systems (Category B).
Asia
Latin America
Africa
Middle East
BangladeshBruneiBurma (Myanmar)IndonesiaKorea, NorthKorea, SouthPakistanTimor-Leste (East Timor)
BoliviaGuyanaHaitiSuriname
AngolaGuinea
KuwaitOmanQatarSaudi ArabiaUnited Arab EmiratesYemen
Guinea-BissauLiberiaMalawiMaliMauritaniaNigeriaSenegalSierra LeoneSomaliaSudan
CameroonCentral African RepublicChadDjiboutiEquatorial GuineaEritreaEthiopiaGabonGambia, The
Fig. 2. Mainland nations with insular energy systems (Category C).
introduced. These weighting factors help establish the impor-tance of the parameters in determining the overall rating.
NIi = 1
n
i=n∑
1
WiNPi ; AIi = 1
n
i=n∑
1
WiAPi (2)
The parameters used to define the necessity index and the abilityindex were based on the literature analysis findings regarding theprerequisites of smart energy regions conducted in Section 2.1.
4.1 Necessity Index
The necessity index shows how necessary is for a country tobecome energetically smart in order to reduce its dependenceon energy imports, reduce the cost of energy, mitigate GHG
emissions, and have financial and environmental sustainability.The quantifiable parameters of this index are
1. the specific electricity cost per country’s GDP (NI1)2. the independence of a country to imported energy sources
(NI2)3. the specific GHG emissions per country’s capita (NI3)4. the political obligations of a country toward promoting envi-
ronmentally friendly policies (Kyoto or EU 2020 framework)(NI4).
The political obligation index was quantified based on the com-mitment of the investigated countries to the Kyoto Protocolannexes as well as to the EU 2020 roadmap. The value of theindex for each commitment was increased by 0.5. The above-mentioned parameters fully cover all the aspects of the need ofan energy system to be upgraded into an intelligent one.
Dow
nloa
ded
by [
79.1
30.3
6.20
1] a
t 13:
03 1
9 N
ovem
ber
2014
Integration Potentials of Insular Energy Systems 75
4.2 Ability Index
The ability index shows the capability of a country to beupgraded into an energy smart region. The quantifiable param-eters of this index that fully cover all the aspects of the ability ofthis upgrading are
1. the GDP per capita (AI1)2. the growth rate (AI2)3. the electricity produced from renewable energy sources (AI3).
An alternative would be to use the renewable potential rather thanthe installed renewable energy capacity. However, apart from thesolar and the wind potential, for which remote sensing techniques(satellites) are employed, the rest of the renewable resources(hydro, geothermal, and biomass) are still not documented forall countries. To this end, the authors were restricted to use theinstalled RES instead of the potential resources.
With regard to the role of the distance of the insular sys-tems from the mainland energy networks, the investigation of thisaspect would have been of interest if the interconnection of insu-lar energy systems to mainland energy networks would mean,at the same time, the integration of these systems to smart ones.However, the kickoff point of this analysis is that the developmentof smart energy regions in insular systems will not be based ontheir interconnection with advanced systems but rather with thepromotion of specific measures that would improve the quality ofthe examined energy systems per se. To this end, this aspect wasnot considered in the ability index.
All these values were normalized, and any negative values ofthe growth rate were considered 0.
5. Results and Discussion
Three scenarios were investigated in this work, which weredefined by the weighting factors of the parameters shown inTable 2:
• Basic scenario that assumes equal weighting among all param-eters
• Economy-dominant scenario, where the weighting favors thecost-driven parameters
• Technology/environment-dominant scenario, where theweighting favors the technological and/or environmentallydriven parameters
The investigated scenarios illustrate the necessity and ability ofeach of the countries’ energy system to develop into a smart one.
Table 2. Weighting factors of the three investigated scenarios.
Index
Scenario NI1 NI2 NI3 NI4 AI1 AI2 AI3
Basic 0.25 0.25 0.25 0.25 0.33 0.33 0.33Economy-driven 0.35 0.35 0.15 0.15 0.40 0.40 0.20Technology/
Environment-driven
0.15 0.15 0.35 0.35 0.20 0.20 0.40
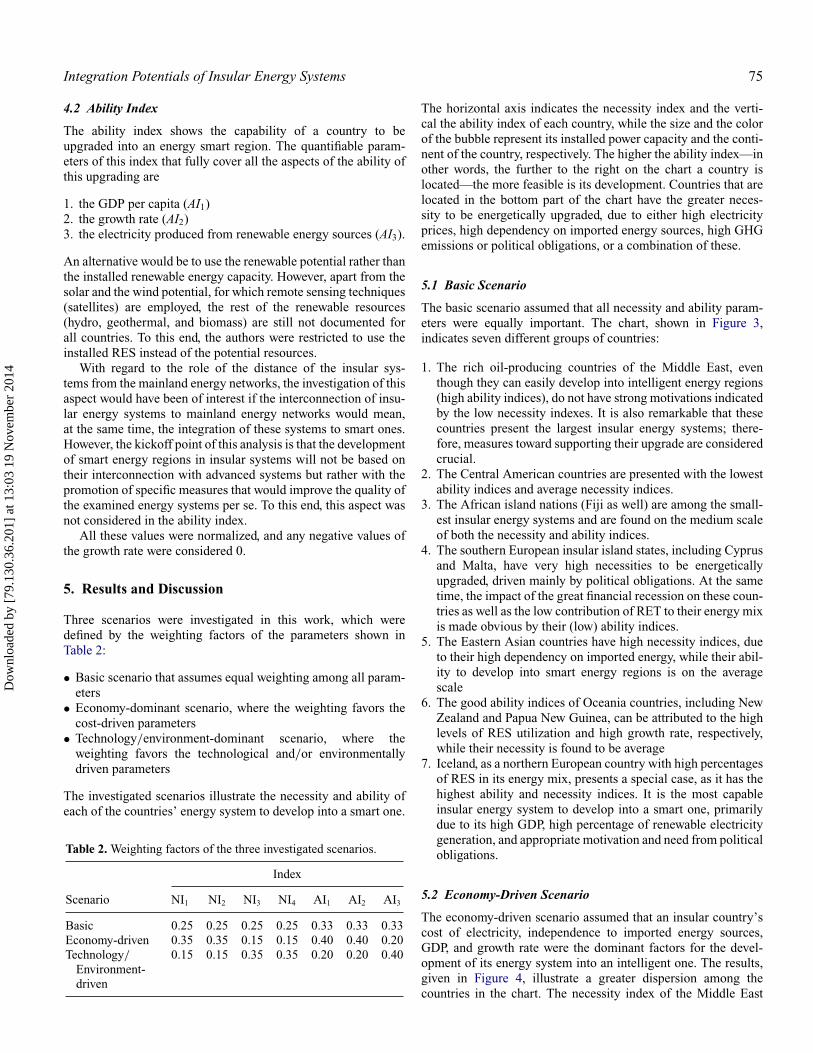
The horizontal axis indicates the necessity index and the verti-cal the ability index of each country, while the size and the colorof the bubble represent its installed power capacity and the conti-nent of the country, respectively. The higher the ability index—inother words, the further to the right on the chart a country islocated—the more feasible is its development. Countries that arelocated in the bottom part of the chart have the greater neces-sity to be energetically upgraded, due to either high electricityprices, high dependency on imported energy sources, high GHGemissions or political obligations, or a combination of these.
5.1 Basic Scenario
The basic scenario assumed that all necessity and ability param-eters were equally important. The chart, shown in Figure 3,indicates seven different groups of countries:
1. The rich oil-producing countries of the Middle East, eventhough they can easily develop into intelligent energy regions(high ability indices), do not have strong motivations indicatedby the low necessity indexes. It is also remarkable that thesecountries present the largest insular energy systems; there-fore, measures toward supporting their upgrade are consideredcrucial.
2. The Central American countries are presented with the lowestability indices and average necessity indices.
3. The African island nations (Fiji as well) are among the small-est insular energy systems and are found on the medium scaleof both the necessity and ability indices.
4. The southern European insular island states, including Cyprusand Malta, have very high necessities to be energeticallyupgraded, driven mainly by political obligations. At the sametime, the impact of the great financial recession on these coun-tries as well as the low contribution of RET to their energy mixis made obvious by their (low) ability indices.
5. The Eastern Asian countries have high necessity indices, dueto their high dependency on imported energy, while their abil-ity to develop into smart energy regions is on the averagescale
6. The good ability indices of Oceania countries, including NewZealand and Papua New Guinea, can be attributed to the highlevels of RES utilization and high growth rate, respectively,while their necessity is found to be average
7. Iceland, as a northern European country with high percentagesof RES in its energy mix, presents a special case, as it has thehighest ability and necessity indices. It is the most capableinsular energy system to develop into a smart one, primarilydue to its high GDP, high percentage of renewable electricitygeneration, and appropriate motivation and need from politicalobligations.
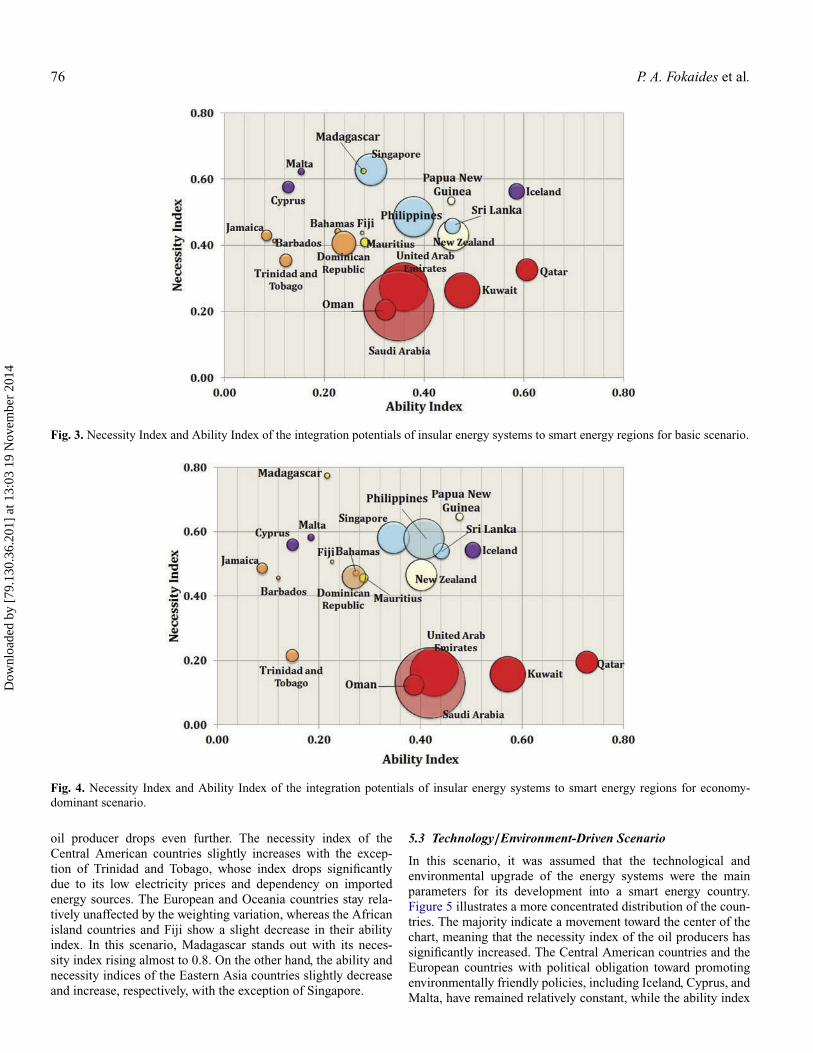
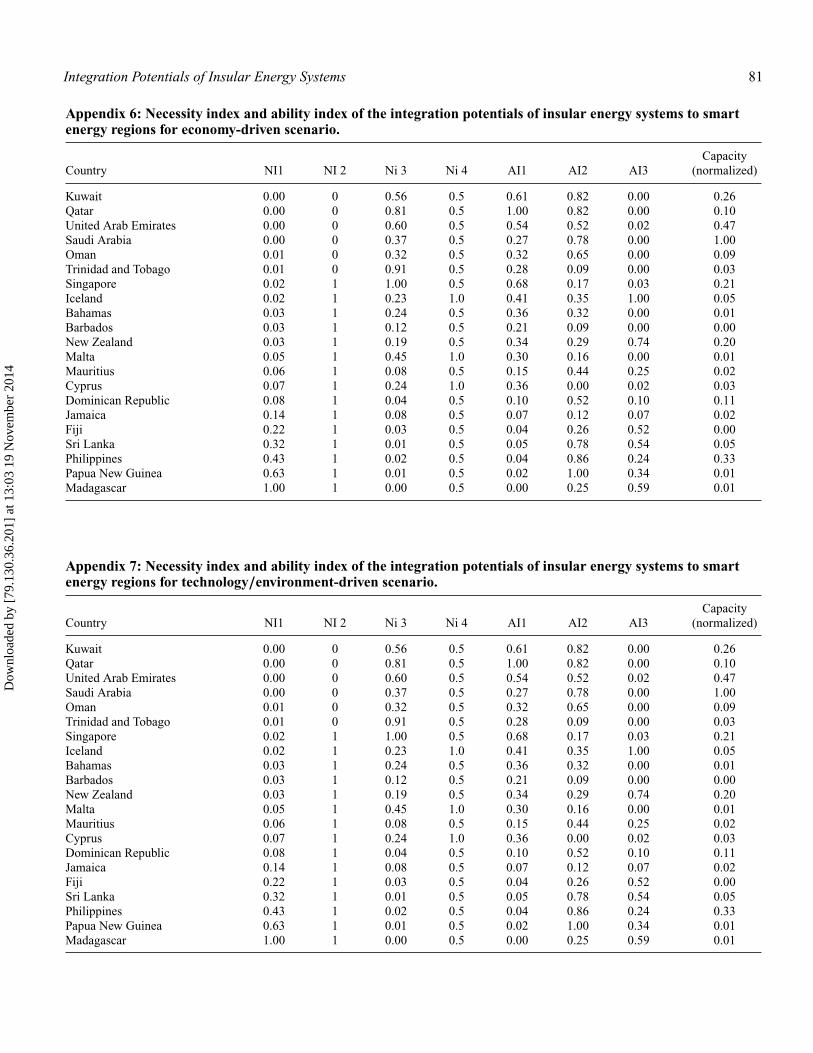
5.2 Economy-Driven Scenario
The economy-driven scenario assumed that an insular country’scost of electricity, independence to imported energy sources,GDP, and growth rate were the dominant factors for the devel-opment of its energy system into an intelligent one. The results,given in Figure 4, illustrate a greater dispersion among thecountries in the chart. The necessity index of the Middle East
Dow
nloa
ded
by [
79.1
30.3
6.20
1] a
t 13:
03 1
9 N
ovem
ber
2014
76 P. A. Fokaides et al.
Fig. 3. Necessity Index and Ability Index of the integration potentials of insular energy systems to smart energy regions for basic scenario.
Fig. 4. Necessity Index and Ability Index of the integration potentials of insular energy systems to smart energy regions for economy-dominant scenario.
oil producer drops even further. The necessity index of theCentral American countries slightly increases with the excep-tion of Trinidad and Tobago, whose index drops significantlydue to its low electricity prices and dependency on importedenergy sources. The European and Oceania countries stay rela-tively unaffected by the weighting variation, whereas the Africanisland countries and Fiji show a slight decrease in their abilityindex. In this scenario, Madagascar stands out with its neces-sity index rising almost to 0.8. On the other hand, the ability andnecessity indices of the Eastern Asia countries slightly decreaseand increase, respectively, with the exception of Singapore.
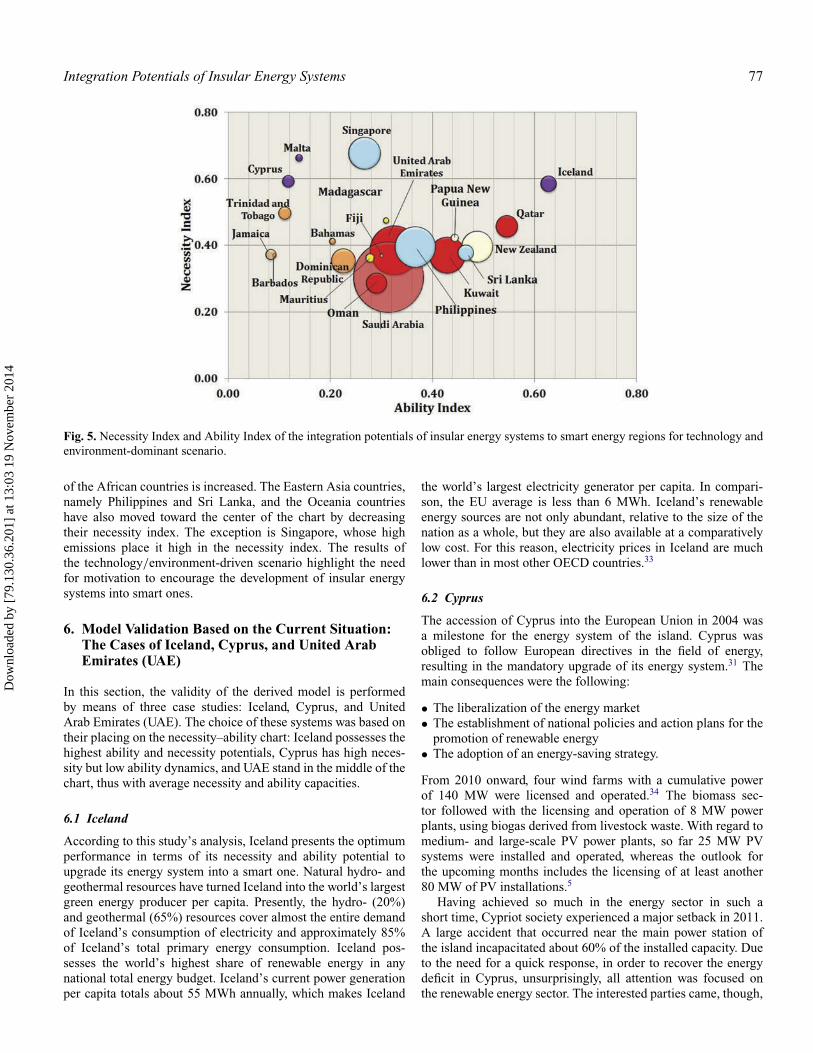
5.3 Technology/Environment-Driven Scenario
In this scenario, it was assumed that the technological andenvironmental upgrade of the energy systems were the mainparameters for its development into a smart energy country.Figure 5 illustrates a more concentrated distribution of the coun-tries. The majority indicate a movement toward the center of thechart, meaning that the necessity index of the oil producers hassignificantly increased. The Central American countries and theEuropean countries with political obligation toward promotingenvironmentally friendly policies, including Iceland, Cyprus, andMalta, have remained relatively constant, while the ability index
Dow
nloa
ded
by [
79.1
30.3
6.20
1] a
t 13:
03 1
9 N
ovem
ber
2014
Integration Potentials of Insular Energy Systems 77
Fig. 5. Necessity Index and Ability Index of the integration potentials of insular energy systems to smart energy regions for technology andenvironment-dominant scenario.
of the African countries is increased. The Eastern Asia countries,namely Philippines and Sri Lanka, and the Oceania countrieshave also moved toward the center of the chart by decreasingtheir necessity index. The exception is Singapore, whose highemissions place it high in the necessity index. The results ofthe technology/environment-driven scenario highlight the needfor motivation to encourage the development of insular energysystems into smart ones.
6. Model Validation Based on the Current Situation:The Cases of Iceland, Cyprus, and United ArabEmirates (UAE)
In this section, the validity of the derived model is performedby means of three case studies: Iceland, Cyprus, and UnitedArab Emirates (UAE). The choice of these systems was based ontheir placing on the necessity–ability chart: Iceland possesses thehighest ability and necessity potentials, Cyprus has high neces-sity but low ability dynamics, and UAE stand in the middle of thechart, thus with average necessity and ability capacities.
6.1 Iceland
According to this study’s analysis, Iceland presents the optimumperformance in terms of its necessity and ability potential toupgrade its energy system into a smart one. Natural hydro- andgeothermal resources have turned Iceland into the world’s largestgreen energy producer per capita. Presently, the hydro- (20%)and geothermal (65%) resources cover almost the entire demandof Iceland’s consumption of electricity and approximately 85%of Iceland’s total primary energy consumption. Iceland pos-sesses the world’s highest share of renewable energy in anynational total energy budget. Iceland’s current power generationper capita totals about 55 MWh annually, which makes Iceland
the world’s largest electricity generator per capita. In compari-son, the EU average is less than 6 MWh. Iceland’s renewableenergy sources are not only abundant, relative to the size of thenation as a whole, but they are also available at a comparativelylow cost. For this reason, electricity prices in Iceland are muchlower than in most other OECD countries.33
6.2 Cyprus
The accession of Cyprus into the European Union in 2004 wasa milestone for the energy system of the island. Cyprus wasobliged to follow European directives in the field of energy,resulting in the mandatory upgrade of its energy system.31 Themain consequences were the following:
• The liberalization of the energy market• The establishment of national policies and action plans for the
promotion of renewable energy• The adoption of an energy-saving strategy.
From 2010 onward, four wind farms with a cumulative powerof 140 MW were licensed and operated.34 The biomass sec-tor followed with the licensing and operation of 8 MW powerplants, using biogas derived from livestock waste. With regard tomedium- and large-scale PV power plants, so far 25 MW PVsystems were installed and operated, whereas the outlook forthe upcoming months includes the licensing of at least another80 MW of PV installations.5
Having achieved so much in the energy sector in such ashort time, Cypriot society experienced a major setback in 2011.A large accident that occurred near the main power station ofthe island incapacitated about 60% of the installed capacity. Dueto the need for a quick response, in order to recover the energydeficit in Cyprus, unsurprisingly, all attention was focused onthe renewable energy sector. The interested parties came, though,
Dow
nloa
ded
by [
79.1
30.3
6.20
1] a
t 13:
03 1
9 N
ovem
ber
2014
78 P. A. Fokaides et al.
across a small surprise: the state was not able to determine pre-cisely the number of renewable energy projects that were alreadylicensed as well as the number of projects that were still in theprocess of getting all their licenses. The answer to this ques-tion was also not possible to be given, in view of the verytangled way of licensing RET projects in Cyprus. This fact ledto considerable concerns and initiated a discussion on licensingprocedures of RET projects.35 Progress was also decelerated dueto the great 2013 Cypriot financial crisis, which resulted to aC10 billion international bailout by the Eurogroup, the EuropeanCommission (EC), the European Central Bank (ECB), and theInternational Monetary Fund (IMF). The findings of our anal-ysis are hence in good agreement with the told story, namelythe high necessity and the low ability of Cyprus to improve thetechnological status of its energy system.
6.3 UAE
According to the necessity–ability model, the UAE govern-ment currently presents moderate trends to further upgrade itsenergy system. Realizing the risks of being largely exposedto fuel prices, the government of the UAE effectively soughtdiversification of its energy mix away from fossil fuels andtoward clean energy. The UAE enjoys reasonable renewableenergy resources, with the average vertical solar irradiance being2120 kWh/m2/year, and the average monthly wind speed incoastal areas lying between 4.2–5.3 m/s in coastal areas. Havingthese facts as drivers, the UAE aims to attract significant invest-ment in alternative and sustainable energy projects by 2020. BothAbu Dhabi and Dubai are targeting the generation of 7% and5%, respectively, of total power demand from renewable sourcesby 2030. In a strong reaffirmation of the country’s commit-ment to the wider carbon and sustainable living agenda, AbuDhabi launched its Masdar Sustainable City initiative, which
will house 50,000 people and which will be completely relianton renewable sources for its power needs. The UAE’s trackrecord of delivering against plans and growing evidence of aproject pipeline is gradually contributing to an increased trust bythe international community in the UAE’s renewables program.However, the program still remains highly dependent on govern-ment investments in large utility-scale projects, which presents aclear sustainability risk.36
7. Conclusion
The focus of this article was on insular energy systems and theirpotential to develop into smart energy regions. Due to the uniquecharacteristics of insular energy systems, a special approach wasrequired toward defining the dominant parameters that can drivethis development. In terms of this work, the main features ofthe smart energy regions, as well as of the insular energy sys-tems, were defined. An overview of the insular energy systemsworldwide was performed, and the systems were classified basedon specific criteria, resulting in three categories. This work alsoexamined the necessity and the ability of a number of energyinsular countries to develop into intelligent ones. Two factors,namely the ability index and the necessity index, were definedand calculated for all insular energy systems taken into account.Each of the indices has resulted as the weighted sum of a vari-ety of parameters, namely the cost of energy, the dependency onimported energy sources, GHG emissions, political obligations,GDP, growth rate, and level of RET utilization. The main out-come of this analysis was that the development of insular energysystems into smart ones will be driven mainly by technologicaland environmental motivations including the reduction of GHGemissions, the introduction of political obligation toward promot-ing environmentally friendly policies, and the increase of RESutilization for the diversification of their energy mix.
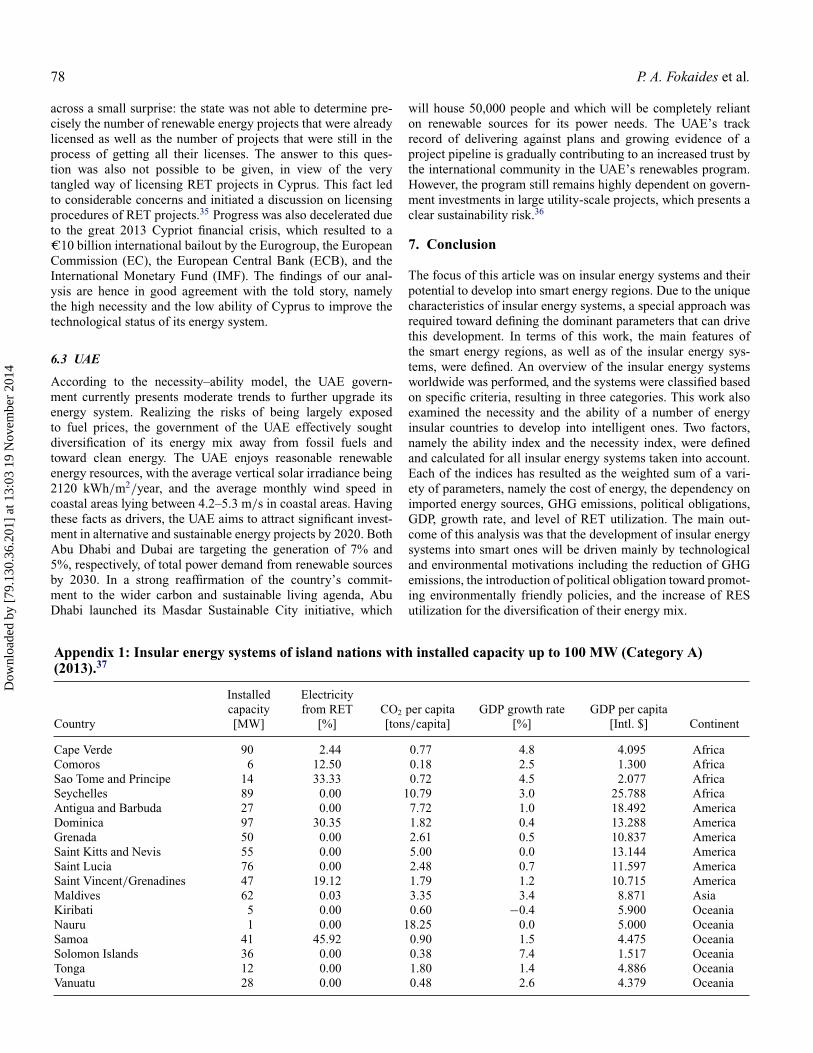
Appendix 1: Insular energy systems of island nations with installed capacity up to 100 MW (Category A)(2013).37
Country
Installedcapacity[MW]
Electricityfrom RET
[%]CO2 per capita[tons/capita]
GDP growth rate[%]
GDP per capita[Intl. $] Continent
Cape Verde 90 2.44 0.77 4.8 4.095 AfricaComoros 6 12.50 0.18 2.5 1.300 AfricaSao Tome and Principe 14 33.33 0.72 4.5 2.077 AfricaSeychelles 89 0.00 10.79 3.0 25.788 AfricaAntigua and Barbuda 27 0.00 7.72 1.0 18.492 AmericaDominica 97 30.35 1.82 0.4 13.288 AmericaGrenada 50 0.00 2.61 0.5 10.837 AmericaSaint Kitts and Nevis 55 0.00 5.00 0.0 13.144 AmericaSaint Lucia 76 0.00 2.48 0.7 11.597 AmericaSaint Vincent/Grenadines 47 19.12 1.79 1.2 10.715 AmericaMaldives 62 0.03 3.35 3.4 8.871 AsiaKiribati 5 0.00 0.60 −0.4 5.900 OceaniaNauru 1 0.00 18.25 0.0 5.000 OceaniaSamoa 41 45.92 0.90 1.5 4.475 OceaniaSolomon Islands 36 0.00 0.38 7.4 1.517 OceaniaTonga 12 0.00 1.80 1.4 4.886 OceaniaVanuatu 28 0.00 0.48 2.6 4.379 Oceania
Dow
nloa
ded
by [
79.1
30.3
6.20
1] a
t 13:
03 1
9 N
ovem
ber
2014
Integration Potentials of Insular Energy Systems 79
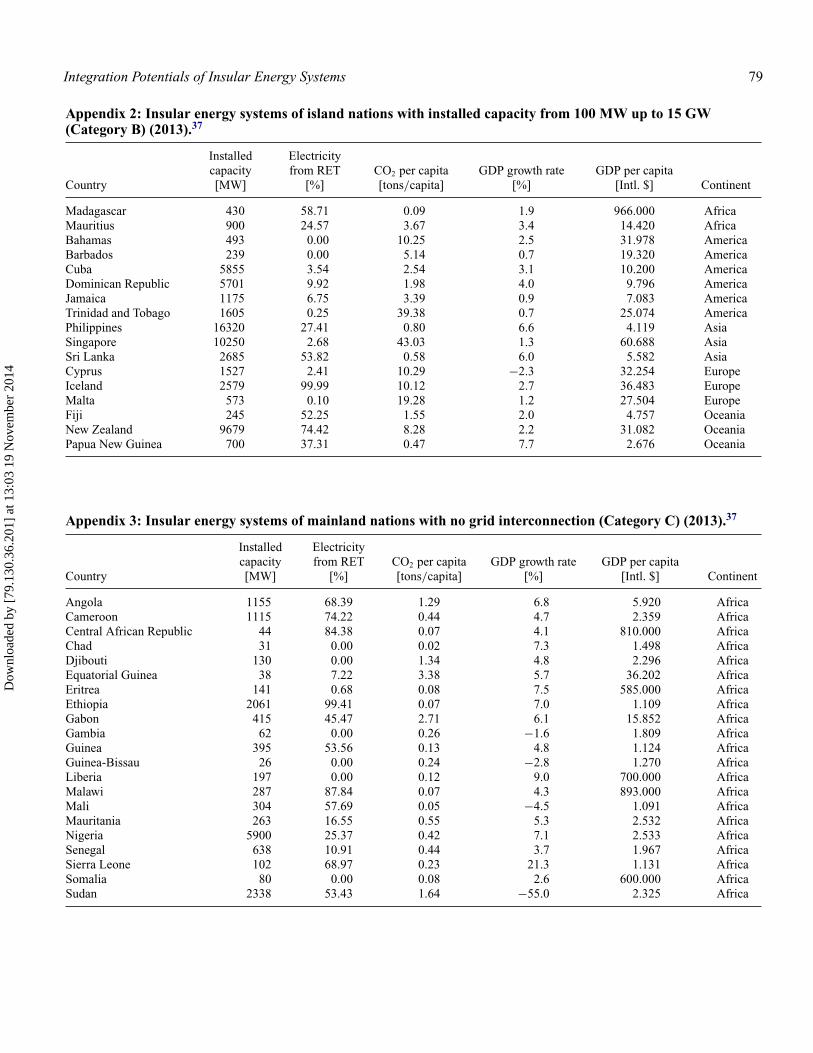
Appendix 2: Insular energy systems of island nations with installed capacity from 100 MW up to 15 GW(Category B) (2013).37
Country
Installedcapacity[MW]
Electricityfrom RET
[%]CO2 per capita[tons/capita]
GDP growth rate[%]
GDP per capita[Intl. $] Continent
Madagascar 430 58.71 0.09 1.9 966.000 AfricaMauritius 900 24.57 3.67 3.4 14.420 AfricaBahamas 493 0.00 10.25 2.5 31.978 AmericaBarbados 239 0.00 5.14 0.7 19.320 AmericaCuba 5855 3.54 2.54 3.1 10.200 AmericaDominican Republic 5701 9.92 1.98 4.0 9.796 AmericaJamaica 1175 6.75 3.39 0.9 7.083 AmericaTrinidad and Tobago 1605 0.25 39.38 0.7 25.074 AmericaPhilippines 16320 27.41 0.80 6.6 4.119 AsiaSingapore 10250 2.68 43.03 1.3 60.688 AsiaSri Lanka 2685 53.82 0.58 6.0 5.582 AsiaCyprus 1527 2.41 10.29 −2.3 32.254 EuropeIceland 2579 99.99 10.12 2.7 36.483 EuropeMalta 573 0.10 19.28 1.2 27.504 EuropeFiji 245 52.25 1.55 2.0 4.757 OceaniaNew Zealand 9679 74.42 8.28 2.2 31.082 OceaniaPapua New Guinea 700 37.31 0.47 7.7 2.676 Oceania
Appendix 3: Insular energy systems of mainland nations with no grid interconnection (Category C) (2013).37
Country
Installedcapacity[MW]
Electricityfrom RET
[%]CO2 per capita[tons/capita]
GDP growth rate[%]
GDP per capita[Intl. $] Continent
Angola 1155 68.39 1.29 6.8 5.920 AfricaCameroon 1115 74.22 0.44 4.7 2.359 AfricaCentral African Republic 44 84.38 0.07 4.1 810.000 AfricaChad 31 0.00 0.02 7.3 1.498 AfricaDjibouti 130 0.00 1.34 4.8 2.296 AfricaEquatorial Guinea 38 7.22 3.38 5.7 36.202 AfricaEritrea 141 0.68 0.08 7.5 585.000 AfricaEthiopia 2061 99.41 0.07 7.0 1.109 AfricaGabon 415 45.47 2.71 6.1 15.852 AfricaGambia 62 0.00 0.26 −1.6 1.809 AfricaGuinea 395 53.56 0.13 4.8 1.124 AfricaGuinea-Bissau 26 0.00 0.24 −2.8 1.270 AfricaLiberia 197 0.00 0.12 9.0 700.000 AfricaMalawi 287 87.84 0.07 4.3 893.000 AfricaMali 304 57.69 0.05 −4.5 1.091 AfricaMauritania 263 16.55 0.55 5.3 2.532 AfricaNigeria 5900 25.37 0.42 7.1 2.533 AfricaSenegal 638 10.91 0.44 3.7 1.967 AfricaSierra Leone 102 68.97 0.23 21.3 1.131 AfricaSomalia 80 0.00 0.08 2.6 600.000 AfricaSudan 2338 53.43 1.64 −55.0 2.325 Africa
Dow
nloa
ded
by [
79.1
30.3
6.20
1] a
t 13:
03 1
9 N
ovem
ber
2014
80 P. A. Fokaides et al.
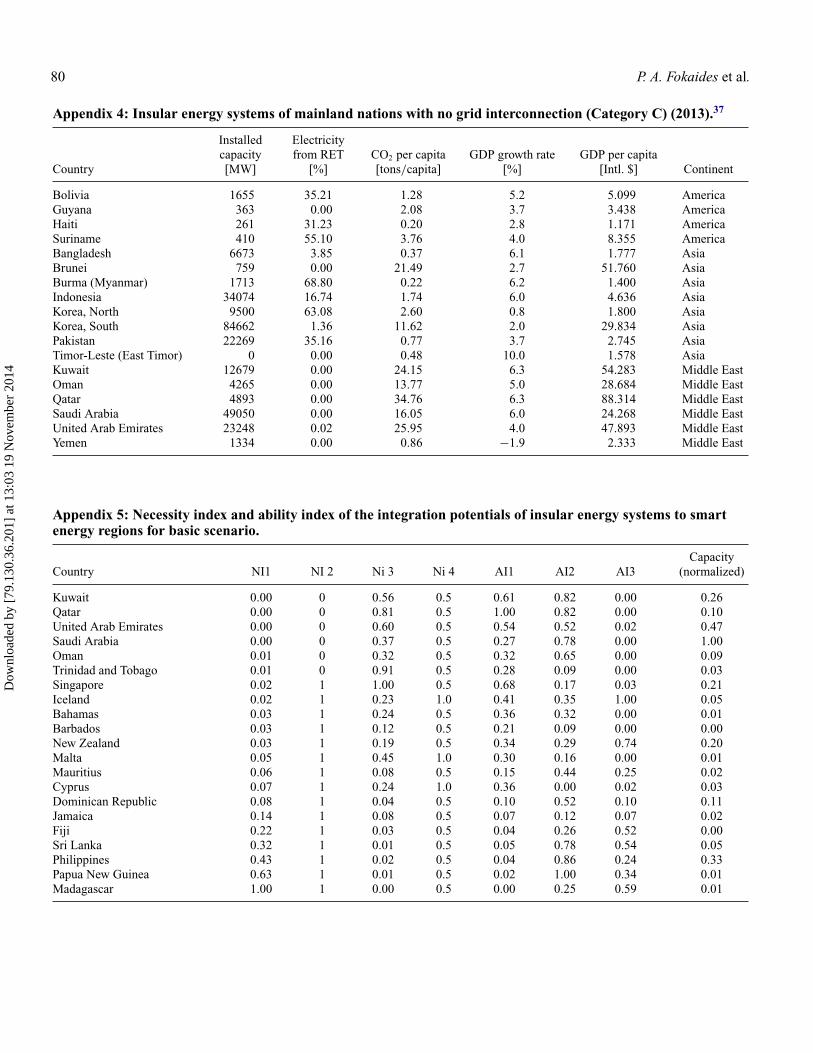
Appendix 4: Insular energy systems of mainland nations with no grid interconnection (Category C) (2013).37
Country
Installedcapacity[MW]
Electricityfrom RET
[%]CO2 per capita[tons/capita]
GDP growth rate[%]
GDP per capita[Intl. $] Continent
Bolivia 1655 35.21 1.28 5.2 5.099 AmericaGuyana 363 0.00 2.08 3.7 3.438 AmericaHaiti 261 31.23 0.20 2.8 1.171 AmericaSuriname 410 55.10 3.76 4.0 8.355 AmericaBangladesh 6673 3.85 0.37 6.1 1.777 AsiaBrunei 759 0.00 21.49 2.7 51.760 AsiaBurma (Myanmar) 1713 68.80 0.22 6.2 1.400 AsiaIndonesia 34074 16.74 1.74 6.0 4.636 AsiaKorea, North 9500 63.08 2.60 0.8 1.800 AsiaKorea, South 84662 1.36 11.62 2.0 29.834 AsiaPakistan 22269 35.16 0.77 3.7 2.745 AsiaTimor-Leste (East Timor) 0 0.00 0.48 10.0 1.578 AsiaKuwait 12679 0.00 24.15 6.3 54.283 Middle EastOman 4265 0.00 13.77 5.0 28.684 Middle EastQatar 4893 0.00 34.76 6.3 88.314 Middle EastSaudi Arabia 49050 0.00 16.05 6.0 24.268 Middle EastUnited Arab Emirates 23248 0.02 25.95 4.0 47.893 Middle EastYemen 1334 0.00 0.86 −1.9 2.333 Middle East
Appendix 5: Necessity index and ability index of the integration potentials of insular energy systems to smartenergy regions for basic scenario.
Country NI1 NI 2 Ni 3 Ni 4 AI1 AI2 AI3Capacity
(normalized)
Kuwait 0.00 0 0.56 0.5 0.61 0.82 0.00 0.26Qatar 0.00 0 0.81 0.5 1.00 0.82 0.00 0.10United Arab Emirates 0.00 0 0.60 0.5 0.54 0.52 0.02 0.47Saudi Arabia 0.00 0 0.37 0.5 0.27 0.78 0.00 1.00Oman 0.01 0 0.32 0.5 0.32 0.65 0.00 0.09Trinidad and Tobago 0.01 0 0.91 0.5 0.28 0.09 0.00 0.03Singapore 0.02 1 1.00 0.5 0.68 0.17 0.03 0.21Iceland 0.02 1 0.23 1.0 0.41 0.35 1.00 0.05Bahamas 0.03 1 0.24 0.5 0.36 0.32 0.00 0.01Barbados 0.03 1 0.12 0.5 0.21 0.09 0.00 0.00New Zealand 0.03 1 0.19 0.5 0.34 0.29 0.74 0.20Malta 0.05 1 0.45 1.0 0.30 0.16 0.00 0.01Mauritius 0.06 1 0.08 0.5 0.15 0.44 0.25 0.02Cyprus 0.07 1 0.24 1.0 0.36 0.00 0.02 0.03Dominican Republic 0.08 1 0.04 0.5 0.10 0.52 0.10 0.11Jamaica 0.14 1 0.08 0.5 0.07 0.12 0.07 0.02Fiji 0.22 1 0.03 0.5 0.04 0.26 0.52 0.00Sri Lanka 0.32 1 0.01 0.5 0.05 0.78 0.54 0.05Philippines 0.43 1 0.02 0.5 0.04 0.86 0.24 0.33Papua New Guinea 0.63 1 0.01 0.5 0.02 1.00 0.34 0.01Madagascar 1.00 1 0.00 0.5 0.00 0.25 0.59 0.01
Dow
nloa
ded
by [
79.1
30.3
6.20
1] a
t 13:
03 1
9 N
ovem
ber
2014
Integration Potentials of Insular Energy Systems 81
Appendix 6: Necessity index and ability index of the integration potentials of insular energy systems to smartenergy regions for economy-driven scenario.
Country NI1 NI 2 Ni 3 Ni 4 AI1 AI2 AI3Capacity
(normalized)
Kuwait 0.00 0 0.56 0.5 0.61 0.82 0.00 0.26Qatar 0.00 0 0.81 0.5 1.00 0.82 0.00 0.10United Arab Emirates 0.00 0 0.60 0.5 0.54 0.52 0.02 0.47Saudi Arabia 0.00 0 0.37 0.5 0.27 0.78 0.00 1.00Oman 0.01 0 0.32 0.5 0.32 0.65 0.00 0.09Trinidad and Tobago 0.01 0 0.91 0.5 0.28 0.09 0.00 0.03Singapore 0.02 1 1.00 0.5 0.68 0.17 0.03 0.21Iceland 0.02 1 0.23 1.0 0.41 0.35 1.00 0.05Bahamas 0.03 1 0.24 0.5 0.36 0.32 0.00 0.01Barbados 0.03 1 0.12 0.5 0.21 0.09 0.00 0.00New Zealand 0.03 1 0.19 0.5 0.34 0.29 0.74 0.20Malta 0.05 1 0.45 1.0 0.30 0.16 0.00 0.01Mauritius 0.06 1 0.08 0.5 0.15 0.44 0.25 0.02Cyprus 0.07 1 0.24 1.0 0.36 0.00 0.02 0.03Dominican Republic 0.08 1 0.04 0.5 0.10 0.52 0.10 0.11Jamaica 0.14 1 0.08 0.5 0.07 0.12 0.07 0.02Fiji 0.22 1 0.03 0.5 0.04 0.26 0.52 0.00Sri Lanka 0.32 1 0.01 0.5 0.05 0.78 0.54 0.05Philippines 0.43 1 0.02 0.5 0.04 0.86 0.24 0.33Papua New Guinea 0.63 1 0.01 0.5 0.02 1.00 0.34 0.01Madagascar 1.00 1 0.00 0.5 0.00 0.25 0.59 0.01
Appendix 7: Necessity index and ability index of the integration potentials of insular energy systems to smartenergy regions for technology/environment-driven scenario.
Country NI1 NI 2 Ni 3 Ni 4 AI1 AI2 AI3Capacity
(normalized)
Kuwait 0.00 0 0.56 0.5 0.61 0.82 0.00 0.26Qatar 0.00 0 0.81 0.5 1.00 0.82 0.00 0.10United Arab Emirates 0.00 0 0.60 0.5 0.54 0.52 0.02 0.47Saudi Arabia 0.00 0 0.37 0.5 0.27 0.78 0.00 1.00Oman 0.01 0 0.32 0.5 0.32 0.65 0.00 0.09Trinidad and Tobago 0.01 0 0.91 0.5 0.28 0.09 0.00 0.03Singapore 0.02 1 1.00 0.5 0.68 0.17 0.03 0.21Iceland 0.02 1 0.23 1.0 0.41 0.35 1.00 0.05Bahamas 0.03 1 0.24 0.5 0.36 0.32 0.00 0.01Barbados 0.03 1 0.12 0.5 0.21 0.09 0.00 0.00New Zealand 0.03 1 0.19 0.5 0.34 0.29 0.74 0.20Malta 0.05 1 0.45 1.0 0.30 0.16 0.00 0.01Mauritius 0.06 1 0.08 0.5 0.15 0.44 0.25 0.02Cyprus 0.07 1 0.24 1.0 0.36 0.00 0.02 0.03Dominican Republic 0.08 1 0.04 0.5 0.10 0.52 0.10 0.11Jamaica 0.14 1 0.08 0.5 0.07 0.12 0.07 0.02Fiji 0.22 1 0.03 0.5 0.04 0.26 0.52 0.00Sri Lanka 0.32 1 0.01 0.5 0.05 0.78 0.54 0.05Philippines 0.43 1 0.02 0.5 0.04 0.86 0.24 0.33Papua New Guinea 0.63 1 0.01 0.5 0.02 1.00 0.34 0.01Madagascar 1.00 1 0.00 0.5 0.00 0.25 0.59 0.01
Dow
nloa
ded
by [
79.1
30.3
6.20
1] a
t 13:
03 1
9 N
ovem
ber
2014
82 P. A. Fokaides et al.
Appendix 8: Nomenclature
Abbreviations
CHP Cogeneration of heat and powerCSP Concentrating Solar PowerEC European CommissionECB European Central BankEIA Energy Information AdministrationETS Emissions Trading SystemEU European UnionGDP Gross Domestic ProductGHG Greenhouse GasesHFO Heavy Fuel OilHVDC High Voltage Direct CurrentIEA International Energy AgencyIMF International Monetary FundNAP National Action PlanPV PhotovoltaicRES Renewable Energy SourcesRET Renewable Energy TechnologiesSET Strategic Energy TechnologyUAE United Arab Emirates
Symbols
AIi Ability IndexIi Indexmax Maximummin MinimumNIi Necessity IndexPi ParameterWi Weighting factor
Acknowledgment
The authors are indebted to COST Action TU 1104 “SmartEnergy Regions” for supporting this work.
ORCID
Paris A. Fokaides http://orcid.org/0000-0003-4112-3819
References
1. International Energy Agency. World Energy Outlook 2013. http://www.worldenergyoutlook.org/publications/weo-2013/ (accessed November2013).
2. European Energy Research Alliance (EERA).Smart Cities: JP Review[Online], 2013, http://www.eera-set.eu/lw_resource/datapool/_items/item_755/reviewsmartcites_web.pdf (accessed Nov 21, 2013).
3. European Commission. European Innovation Partnership on SmartCities and Communities: Strategic Implementation Plan. http://ec.europa.eu/eip/smartcities/files/sip_final_en.pdf (accessed Nov 21,2013).
4. European Cooperation in Science and Technology (COST).Memorandum of Understanding for the Implementation of a EuropeanConcerted Research Action Designated as COST Action TU1104:Smart Energy Regions, 2011.
5. Fokaides, P.A.; Kylili, A. Towards Grid Parity in Insular EnergySystems: The Case of Photovoltaics (PV) in Cyprus. Energ. Policy2014, 65, 223–228.
6. Yantovski, E.; Gorski, J. Zero Emissions Future City. In Clean EnergySystems and Experiences; Eguchi, K., Ed.; InTech [Online] 2010,165–178.http://www.intechopen.com/books/clean-energy-systems-and-experiences/zero-emissions-future-city (accessed Nov 27, 2013).
7. Mishra, V.; Smyth, R.; Sharma, S. The Energy-GDP Nexus: Evidencefrom a Panel of Pacific Island Countries. Resour. Energy Econ. 2009,31, 210–220.
8. Kjaer, C. Energy Transition Can Bring Lasting Peace and GenerateWealth. Energy Strategy Rev. 2013, 1, 140–142.
9. Czisch, G. Scenarios for a Future Electricity Supply; IET: London,2011.
10. Elliott, D. Emergence of European Supergrids—Essay on StrategyIssues. Energy Strategy Rev. 2013, 1, 171–173.
11. Roinioti, A.; Koroneos, C.; Wangensteen, I. Modeling the Greek EnergySystem: Scenarios of Clean Energy Use and Their Implications. Energ.Policy 2012, 50, 711–722.
12. Kylili, A., Fokaides, P.A. Investigation of Building IntegratedPhotovoltaics Potential in Achieving the Zero Energy Building Target.Indoor Built Environ. 2014, 23, 92–106.
13. Michalena, E.; Angeon, V. Local Challenges in the Promotion ofRenewable Energy Sources: The Case of Crete. Energ. Policy 2009, 37,2018–2026.
14. Kaldellis, J.K.; Kavadias, K.; Christinakis, E. Evaluation of the Wind-Hydro Energy Solution for Remote Islands. Energ. Convers. Manage.2001, 42, 1105–1120.
15. Xydis, G.A.; Nanaki, E.A.; Koroneos, C.J. Low-enthalpy GeothermalResources for Electricity Production: A Demand-Side ManagementStudy for Intelligent Communities. Energ. Policy 2013, 62,118–123.
16. Koroneos, C.; Zairis, N.; Charaklias, P.; Moussiopoulos, N.Optimization of Energy Production System in the DodecaneseIslands. Renew. Energ. 2005, 30, 195–210.
17. Bojnec, S.; Papler, D. Economic Efficiency, Energy Consumptionand Sustainable Development. J. Bus. Econ. Manag. 2011, 12,353–374.
18. European Commission. The 2020 Climate and Energy Package. http://ec.europa.eu/clima/policies/package/index_en.htm (accessed Aug 8,2014).
19. Poullikkas, A.; Hadjipaschalis, I.; Kourtis, G. The Cost of Integration ofParabolic Trough CSP Plants in Isolated Mediterranean Power Systems.Renew. Sustain. Energ. Rev, 2010, 14, 1469–1476.
20. Shupe, J.W.; Weingart, J.M. Emerging Energy Technologies in an islandenvironment: Hawaii. Annu. Rev. Energy 1980, 5, 293–333.
21. Ibrahim, H.; Younes, R.; Ilinca, A.; Dimitrova, M.; Perron, J. Studyand Design of a Hybrid Wind-Diesel–Compressed Air Energy StorageSystem for Remote Areas. Appl. Energ. 2010, 87, 1749–1762.
22. Oikonomou, E.K.; Kilias, V.; Goumas, A.; Rigopoulos, A.; Karakatsani,E., Damasiotis, M.; Papastefanakis, D.; Marini, N. Renewable EnergySources (RES) Projects and Their Barriers on a Regional Scale: TheCase Study of Wind Parks in the Dodecanese Islands, Greece. Energ.Policy 2009, 37, 4874–4883.
23. Sanseverino, E.R.; Sanseverino, R.R.; Favuzza, S.; Vaccaro, V. NearZero Energy Islands in the Mediterranean: Supporting Policies andLocal Obstacles. Energ. Policy 2014, 66, 592–602.
24. Blarke M.B.; Jenkins B.M. Super Grid or Smart Grid: CompetingStrategies for Large-Scale Integration of Intermittent Renewables?Energ. Policy 2013, 58, 381–390.
25. Faruqui A.; Harris D.; Hledik R. Unlocking the C53 Billion Savingsfrom Smart Meters in the EU: How Increasing the Adoption of DynamicTariffs Could Make or Break the EU’s Smart Grid Investment. Energ.Policy 2010, 38, 6222–6231.
26. Hargreaves, T.; Nye, M.; Burgess, J. Making Energy Visible: AQualitative Field Study of How Householders Interact with Feedbackfrom Smart Energy Monitors. Energ. Policy 2010, 38, 6111–6119.
Dow
nloa
ded
by [
79.1
30.3
6.20
1] a
t 13:
03 1
9 N
ovem
ber
2014
Integration Potentials of Insular Energy Systems 83
27. Jackson, J. Improving Energy Efficiency and Smart Grid ProgramAnalysis with Agent-Based End-Use Forecasting Models. Energ. Policy2010, 38, 3771–3780.
28. Kaldelis, J.K.; Zafirakis, D. Present Situation and Future Prospects ofElectricity Generation in Aegean Archipelago Islands. Energ. Policy2007, 35, 4623–4639.
29. Kaldellis, J.K.; Gkikaki, A.; Kaldelli, E.; Kapsali, M. Investigating theEnergy Autonomy of Very Small Non-Interconnected Islands: A CaseStudy: Agathonisi, Greece. Energ. Sustain. Dev. 2012, 16, 476–485.
30. Ribeiro, L.A.; Saavedra, O.R.; Lima, S.L.; Matos, J.G.; Bonan, G.Making Isolated Renewable Energy Systems More Reliable. Renew.Energ. 2012, 45, 221–231.
31. Koroneos, C.; Fokaides, P.A.; Moussiopoulos, N. Cyprus EnergySystem and the Use of Renewable Energy Sources. Energy 2005, 30,1889–1901.
32. Energy Information Administration (EIA). EIA’s website. http://www.eia.gov/ (accessed Nov 27, 2013).
33. The Independent Icelandic Energy Portal. http://askjaenergy.org/iceland-introduction/iceland-energy-sector/ (accessed Aug 1,2014).
34. Fokaides, P.A.; Miltiadous, C.I; Neophytou, M.K.A.; Spyridou, L.P.Promotion of Wind Energy in Isolated Energy Systems: The Caseof the Orites Wind Farm. Clean Techn. Environ. Policy 2014, 16,477–488.
35. Fokaides, P.A.; Poullikkas, A; Christofides, C. Lost in the NationalLabyrinths of Bureaucracy: The Case of Renewable Energy Governancein Cyprus. In E. Michalena and J. M. Hills (Eds.), Renewable EnergyGovernance, Lecture Notes in Energy 57; Springer-Verlag: London,2013.
36. Nimer, A.A. Renewable Energy Review: United Arab Emirates. http://www.renewableenergyworld.com/rea/news/article/2012/12/renewable-energy-review-united-arab-emirates (accessed Aug 1, 2014).
37. Central Intelligence Agency (CIA). The World Factbook. http://www.cia.gov/index.html (accessed Nov 21, 2013).
Dow
nloa
ded
by [
79.1
30.3
6.20
1] a
t 13:
03 1
9 N
ovem
ber
2014