geographic information system for flood simulation in nakhon si
TRANSCRIPT
66
Geographic Information System for Flood Simulation
in Nakhon Si Thammarat Province, Thailand
Kanitta Keeratipattarakarn Science and Technology Faculty, Nakhon Si Thammarat Rajabhat University,
Nakhon Si Thammarat Province, Thailand
Abstract
The aims of the present study were to create a Geographic Information System for Flood Simulation in Nakhon Si Thammarat province, and to make a map for flood risk areas in Nakhon Si Thammarat province by using Geographic Information System (GIS) with Potential Surface Analysis (PSA) and Overlay Analysis. The results showed that there are 7 factors for flooding with an appropriate weighting of each factor (Weighing). Rainfall gave the highest result (10 points), followed by the barrier to water (9.33 points), the density of water (8.33 points), altitude from sea level (6.33 points), the topography of the area (6.17 points), drainage capacity of soil (6.17 points), and finally the minimum land use and cover (5.50 points). Analysis of the flood risk areas by the weight of factors and the appropriate level of inputs given by experts found that most of the area in Mueang Nakhon Si Thammarat district has an area of moderate flood risk, which is 47.85%, followed by a high flood risk area which is 46.72% and a minimum risk flood area which accounted for 0.05% of the total area. Chai Montri, Na Khian, Mamuang Song Ton , Na Sai, Pho Sadet and Tha Rai sub-district were revealed to be the areas most prone to flooding. They had high risks of 100%, 100%, 99%, 46%, 98%, 78%, 95%, 88%, and 92.28% of the total area, respectively.
Keywords: Geographic Information System, Flood, Risk Areas
21st Century Academic Forum Conference at UC Berkeley Berkeley, Calif, USA Vol. 2, No. 1 ISSN: 2330-‐1236
67
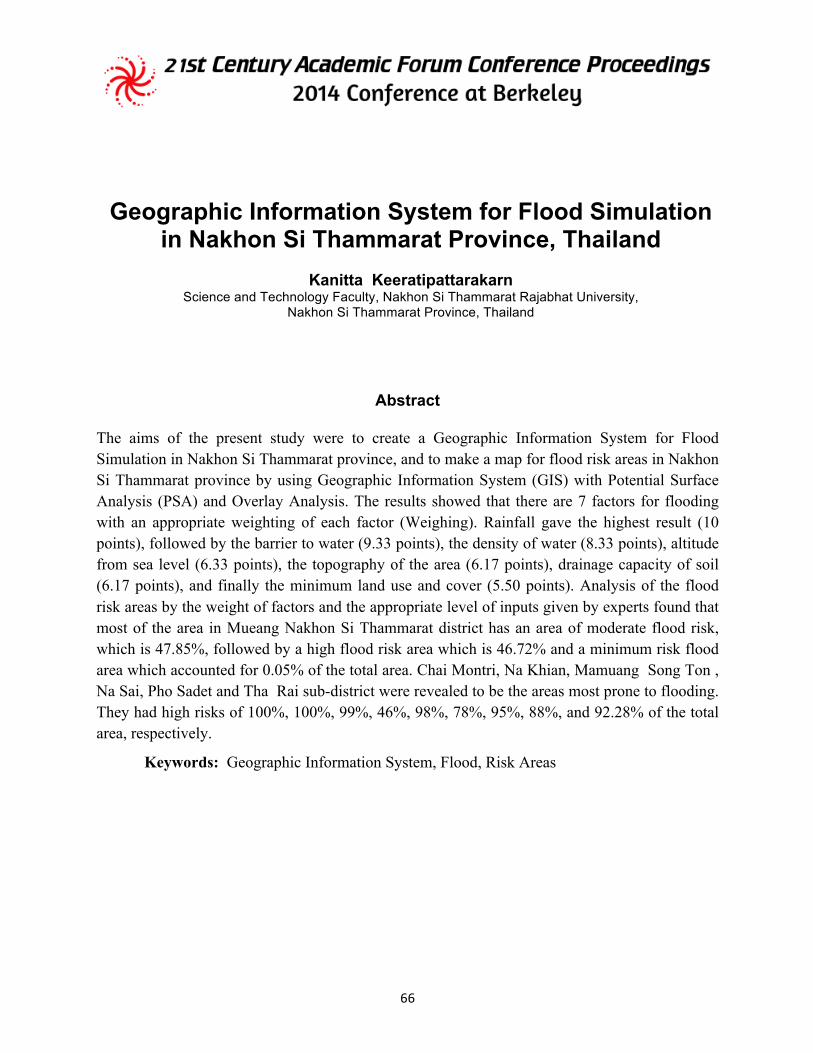
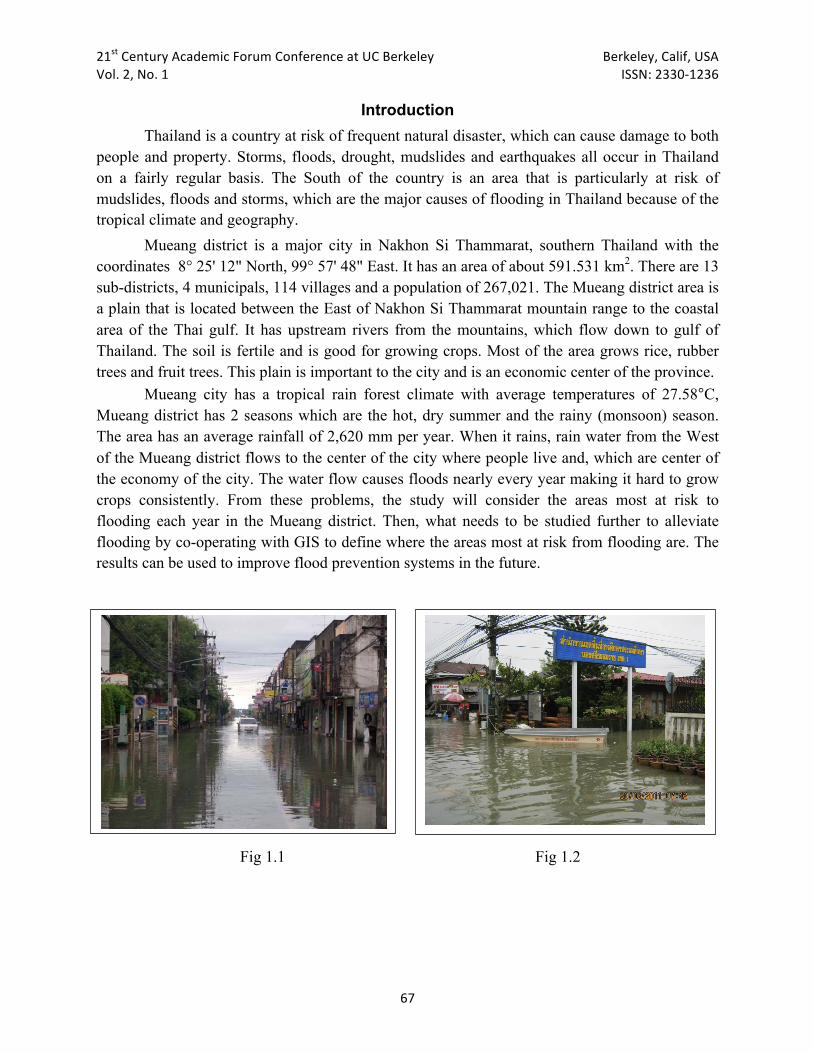
Introduction Thailand is a country at risk of frequent natural disaster, which can cause damage to both people and property. Storms, floods, drought, mudslides and earthquakes all occur in Thailand on a fairly regular basis. The South of the country is an area that is particularly at risk of mudslides, floods and storms, which are the major causes of flooding in Thailand because of the tropical climate and geography. Mueang district is a major city in Nakhon Si Thammarat, southern Thailand with the coordinates 8° 25' 12" North, 99° 57' 48" East. It has an area of about 591.531 km2. There are 13 sub-districts, 4 municipals, 114 villages and a population of 267,021. The Mueang district area is a plain that is located between the East of Nakhon Si Thammarat mountain range to the coastal area of the Thai gulf. It has upstream rivers from the mountains, which flow down to gulf of Thailand. The soil is fertile and is good for growing crops. Most of the area grows rice, rubber trees and fruit trees. This plain is important to the city and is an economic center of the province. Mueang city has a tropical rain forest climate with average temperatures of 27.58°C, Mueang district has 2 seasons which are the hot, dry summer and the rainy (monsoon) season. The area has an average rainfall of 2,620 mm per year. When it rains, rain water from the West of the Mueang district flows to the center of the city where people live and, which are center of the economy of the city. The water flow causes floods nearly every year making it hard to grow crops consistently. From these problems, the study will consider the areas most at risk to flooding each year in the Mueang district. Then, what needs to be studied further to alleviate flooding by co-operating with GIS to define where the areas most at risk from flooding are. The results can be used to improve flood prevention systems in the future. Fig 1.1 Fig 1.2
21st Century Academic Forum Conference at UC Berkeley Berkeley, Calif, USA Vol. 2, No. 1 ISSN: 2330-‐1236
68
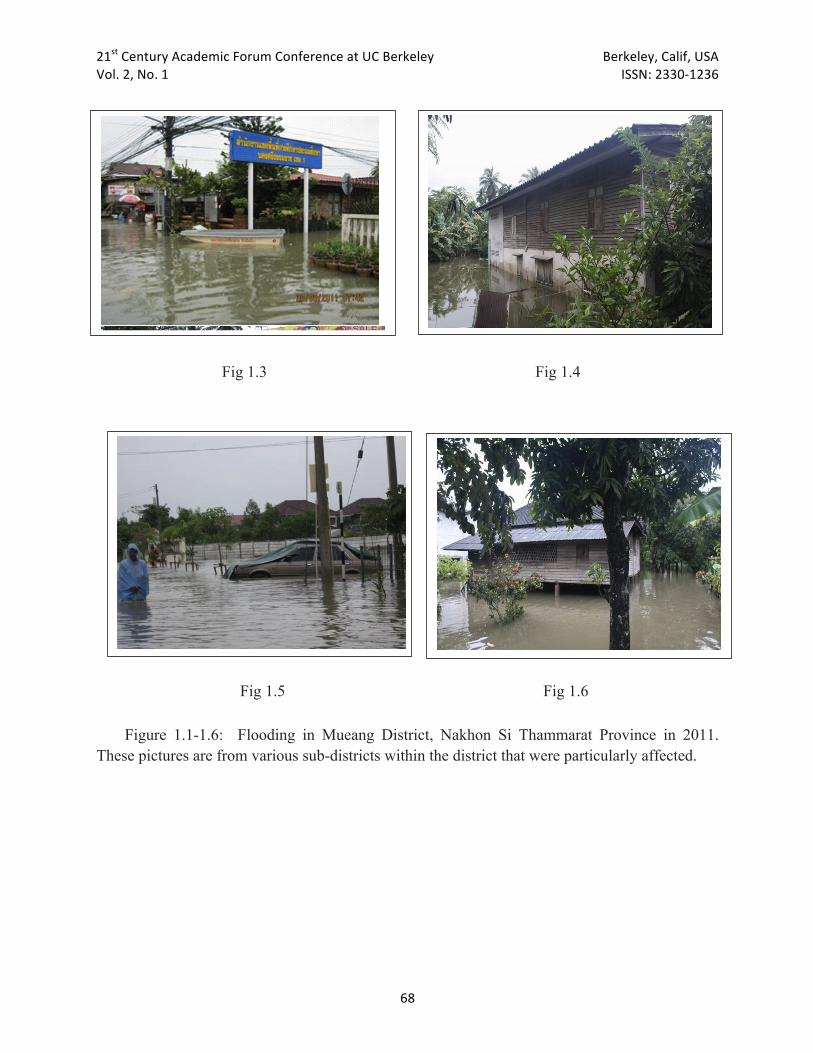
Fig 1.3 Fig 1.4
Fig 1.5 Fig 1.6
Figure 1.1-1.6: Flooding in Mueang District, Nakhon Si Thammarat Province in 2011. These pictures are from various sub-districts within the district that were particularly affected.
21st Century Academic Forum Conference at UC Berkeley Berkeley, Calif, USA Vol. 2, No. 1 ISSN: 2330-‐1236
69
RESEARCH OBJECTIVES
1. Develop a Geographic Information System for Flood Simulation in Nakhon Si Thammarat Province. 2. Build map flood-risk areas of Nakhon Si Thammarat Province.
Methodology and Materials
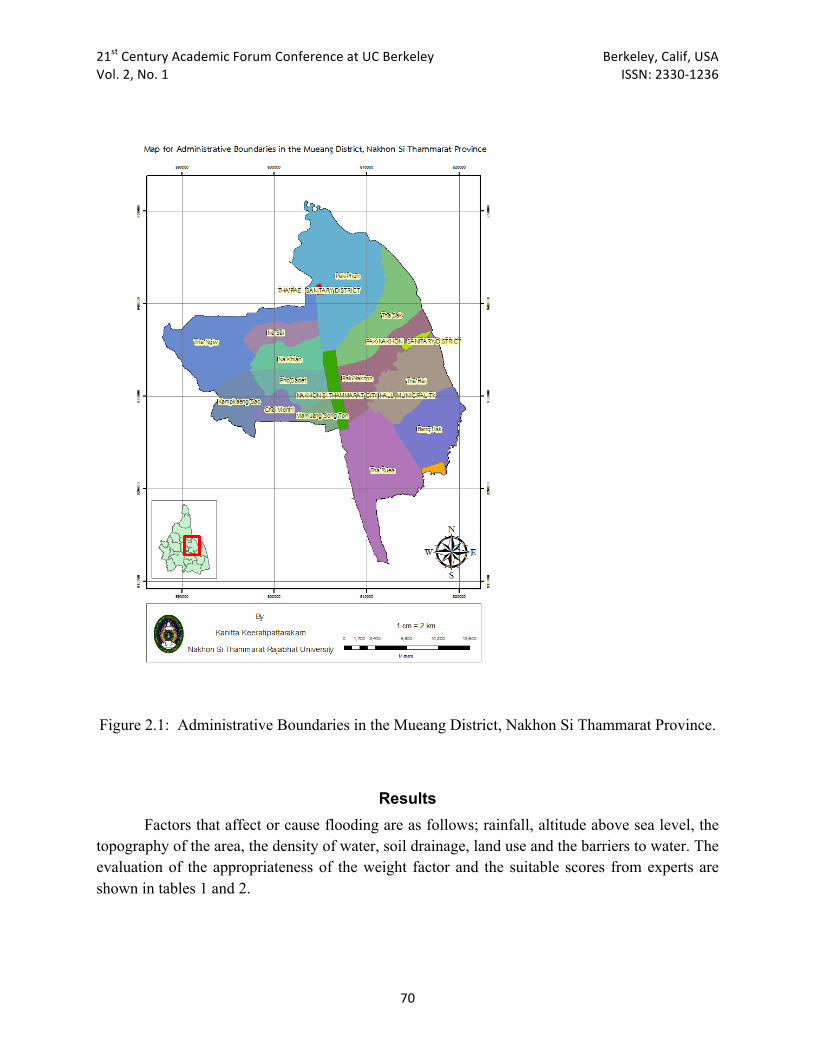
This study focuses primarily on Mueang district, Nakhon Si Thammarat province. It applied Geographic Information System (GIS) with spatial analysis (PSA) and the results of the analysis are shown on the map (Fig.2.1). Designing and developing databases used various sources, including dominant place and the location of villages, traffic/transport, soil, drainage, land use, and watershed sub-basin boundaries, meteorology data, rivers and sources of water, the location and extent of irrigation projects, altitude from sea level, slope and the location of government/private departments and offices.
21st Century Academic Forum Conference at UC Berkeley Berkeley, Calif, USA Vol. 2, No. 1 ISSN: 2330-‐1236
70
Figure 2.1: Administrative Boundaries in the Mueang District, Nakhon Si Thammarat Province.
Results Factors that affect or cause flooding are as follows; rainfall, altitude above sea level, the topography of the area, the density of water, soil drainage, land use and the barriers to water. The evaluation of the appropriateness of the weight factor and the suitable scores from experts are shown in tables 1 and 2.
21st Century Academic Forum Conference at UC Berkeley Berkeley, Calif, USA Vol. 2, No. 1 ISSN: 2330-‐1236
71
Table 1: Weight scores for each factor in analysis
Factor Weight Scores
1. Rainfall (W1) 10.00
2. Barrier to water (W2) 9.33
3. Density of water (W3) 8.33
4. Altitude above sea level (W4) 6.33
5. Slope (W5) 6.17
6. Soil drainage (W6) 6.17
7. Land use (W7) 5.50
Table 2: Suitability scores for each factor in analysis
1. Rainfall (R1) Suitable Scores Class 1 > 100 mm. 9.83
Class 2 76 – 100 mm. 6.67 Class 3 61 – 75 mm. 4.67
Class 4 0 – 60 mm. 2.17
2 Barrier to water (R2) Class 1 0.000000 – 0.001540 km../km.2 3.67 Class 2 0.001541 – 0.002249 km../km.2 6.00
Class 3 0.002250 – 0.003906 km../km.2 7.00
Class 4 0.003907 – 0.005672 km../km.2 8.17 3. Density of water (R3)
Class 1 0.009621 - 0.350000 km../km.2 5.17
Class 2 0.350001 - 0.700000 km../km.2 5.33
Class 3 0.7000001- 1.000000 km../km.2 5.33 Class 4 1.000001 - 1.326256 km../km.2 6.00
4. Altitude from sea level (R4)
Class 1 20 – 100 Meters. Above sea level 7.17 Class 2 101 – 300 Meters. Above sea level 5.00
Class 3 301 – 500 Meters. Above sea level 3.83
Class 4 > 500 Meters. Above sea level 3.17
21st Century Academic Forum Conference at UC Berkeley Berkeley, Calif, USA Vol. 2, No. 1 ISSN: 2330-‐1236
72
Table 2: (continued)
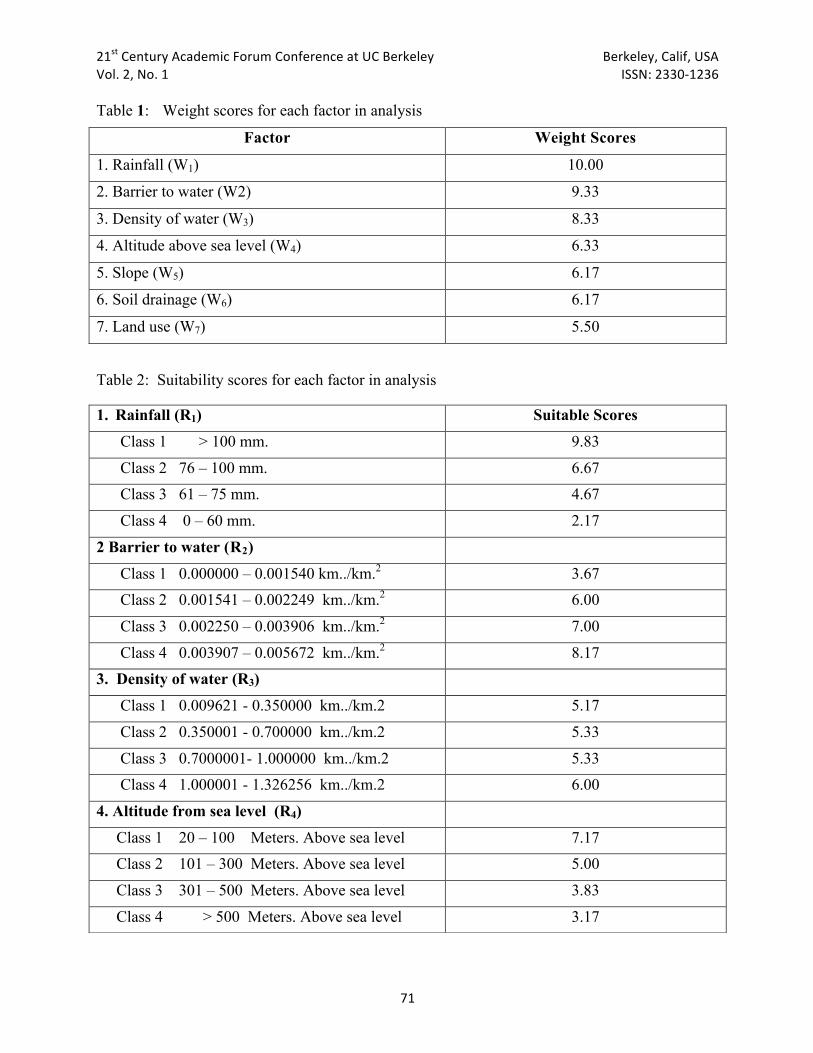
The following maps are the results of our data input; they are classified by four classes respectively. The rainfall map is the only one without the classification as it is not possible to classify rainfall data in this way. The results are shown below.
Fig 3.1: Average of the maximum daily rainfall per month in Nakhon Si Thammarat province.
5. Slope (R5) Class 1 0 – 5 % 7.17 Class 2 6 – 10 % 5.17 Class 3 11 – 15 % 3.33 Class 4 > 15 % 2.00 6. Soil drainage (R6) Class 1 Poor drainage 6.67 Class 2 Relatively poor drainage 5.00 Class 3 Moderately well drained 3.67 Class 4 Good drainage 2.33 7. Land use (R7) Class 1 Residential areas 6.83 Class 2 Rice / crops 4.67 Class 3 Space for other uses 6.00 Class 4 Horticulture / perennial 3.67
21st Century Academic Forum Conference at UC Berkeley Berkeley, Calif, USA Vol. 2, No. 1 ISSN: 2330-‐1236
73
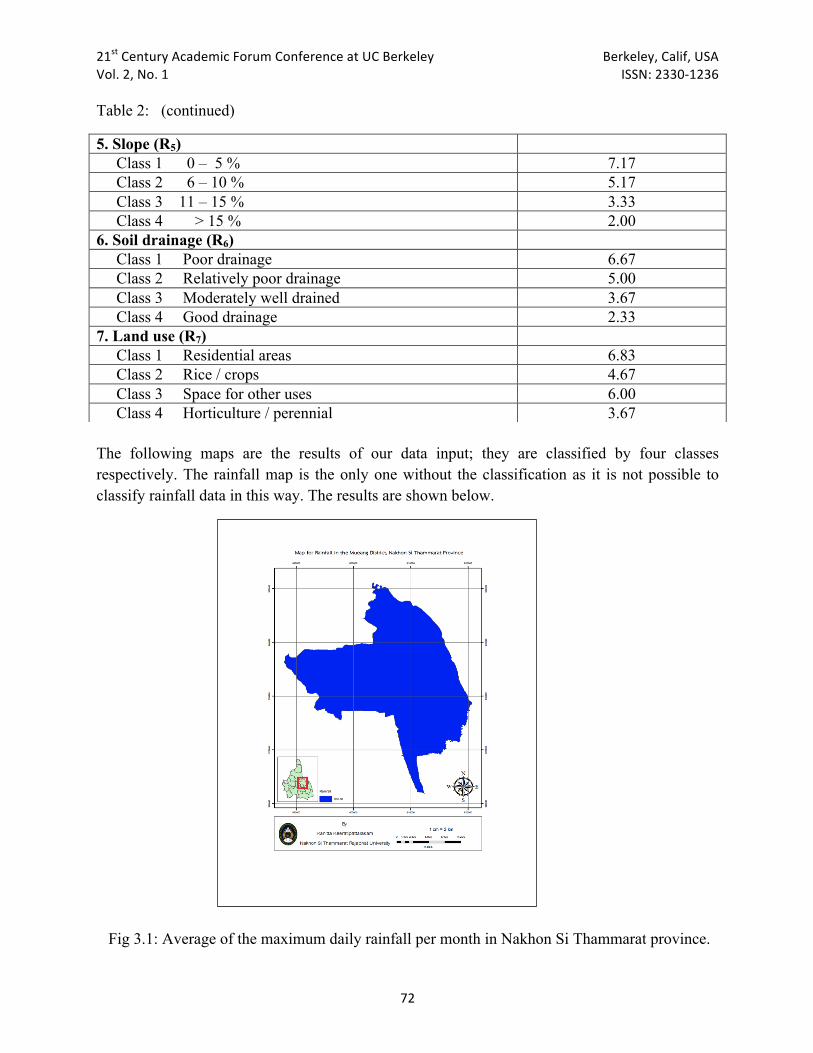
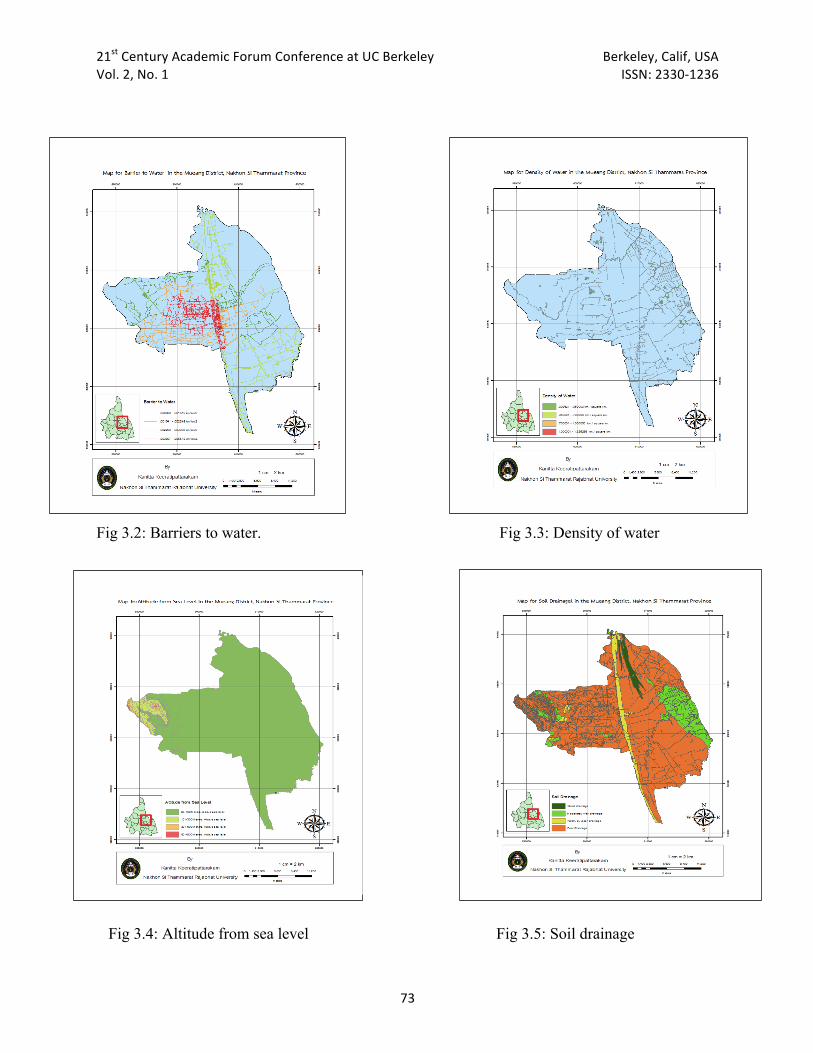
Fig 3.2: Barriers to water. Fig 3.3: Density of water Fig 3.4: Altitude from sea level Fig 3.5: Soil drainage
21st Century Academic Forum Conference at UC Berkeley Berkeley, Calif, USA Vol. 2, No. 1 ISSN: 2330-‐1236
74
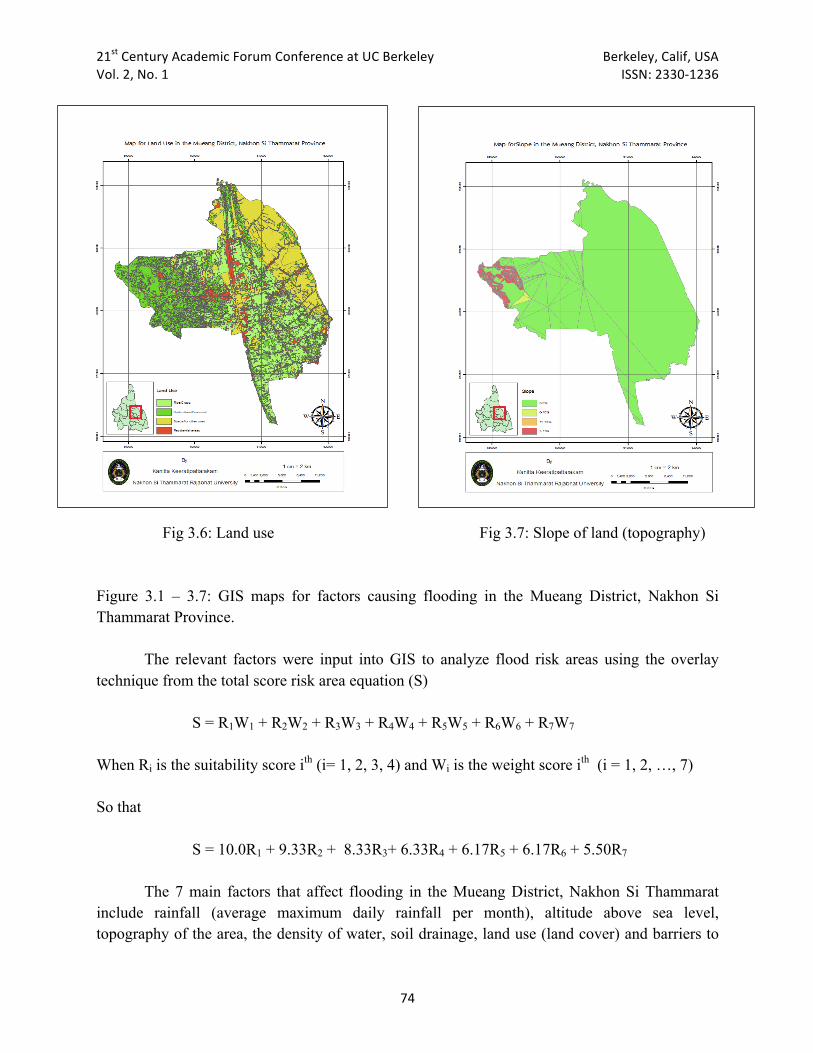
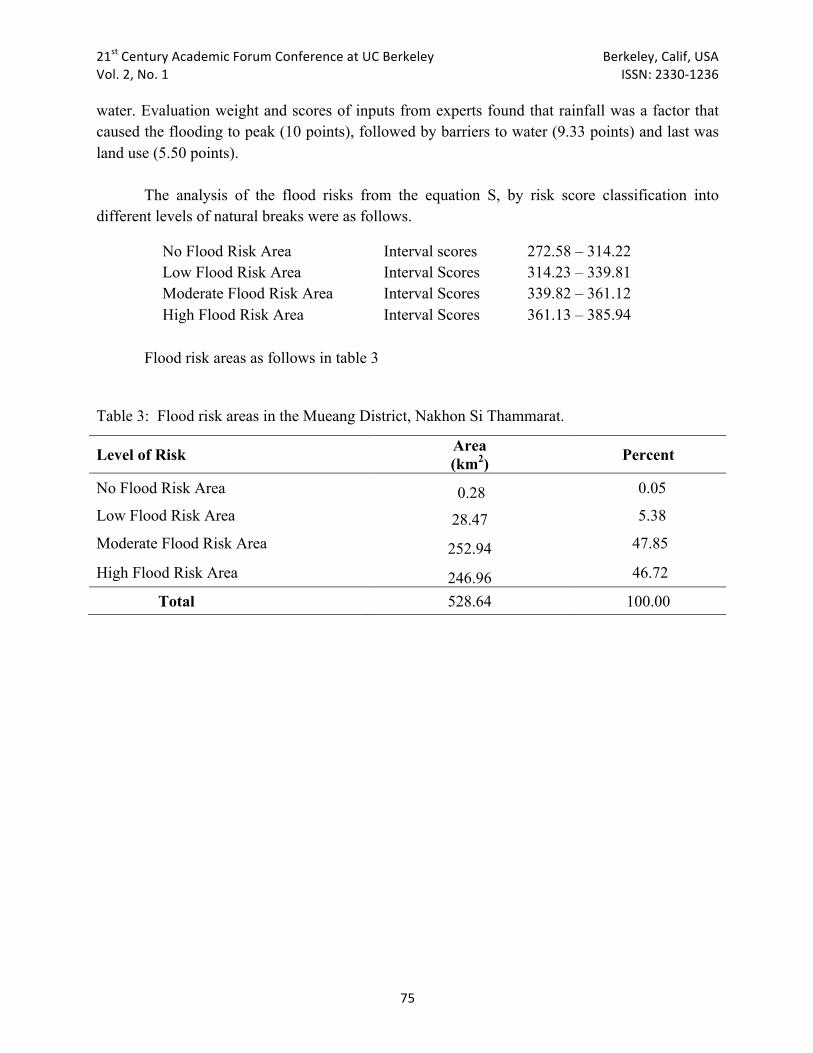
Fig 3.6: Land use Fig 3.7: Slope of land (topography) Figure 3.1 – 3.7: GIS maps for factors causing flooding in the Mueang District, Nakhon Si Thammarat Province. The relevant factors were input into GIS to analyze flood risk areas using the overlay technique from the total score risk area equation (S) S = R1W1 + R2W2 + R3W3 + R4W4 + R5W5 + R6W6 + R7W7 When Ri is the suitability score ith (i= 1, 2, 3, 4) and Wi is the weight score ith (i = 1, 2, …, 7) So that S = 10.0R1 + 9.33R2 + 8.33R3+ 6.33R4 + 6.17R5 + 6.17R6 + 5.50R7 The 7 main factors that affect flooding in the Mueang District, Nakhon Si Thammarat include rainfall (average maximum daily rainfall per month), altitude above sea level, topography of the area, the density of water, soil drainage, land use (land cover) and barriers to
21st Century Academic Forum Conference at UC Berkeley Berkeley, Calif, USA Vol. 2, No. 1 ISSN: 2330-‐1236
75
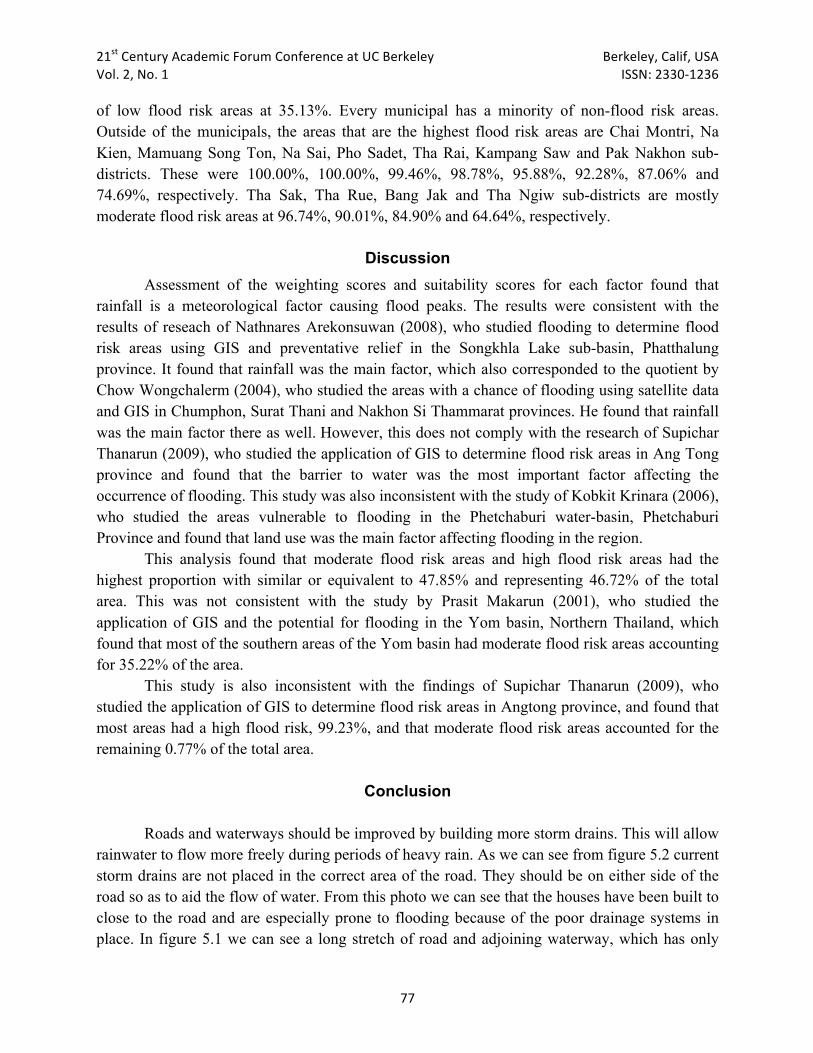
water. Evaluation weight and scores of inputs from experts found that rainfall was a factor that caused the flooding to peak (10 points), followed by barriers to water (9.33 points) and last was land use (5.50 points). The analysis of the flood risks from the equation S, by risk score classification into different levels of natural breaks were as follows.
No Flood Risk Area Interval scores 272.58 – 314.22 Low Flood Risk Area Interval Scores 314.23 – 339.81 Moderate Flood Risk Area Interval Scores 339.82 – 361.12 High Flood Risk Area Interval Scores 361.13 – 385.94
Flood risk areas as follows in table 3
Table 3: Flood risk areas in the Mueang District, Nakhon Si Thammarat.
Level of Risk Area (km2) Percent
No Flood Risk Area 0.28 0.05
Low Flood Risk Area 28.47 5.38
Moderate Flood Risk Area 252.94 47.85
High Flood Risk Area 246.96 46.72
Total 528.64 100.00
21st Century Academic Forum Conference at UC Berkeley Berkeley, Calif, USA Vol. 2, No. 1 ISSN: 2330-‐1236
76
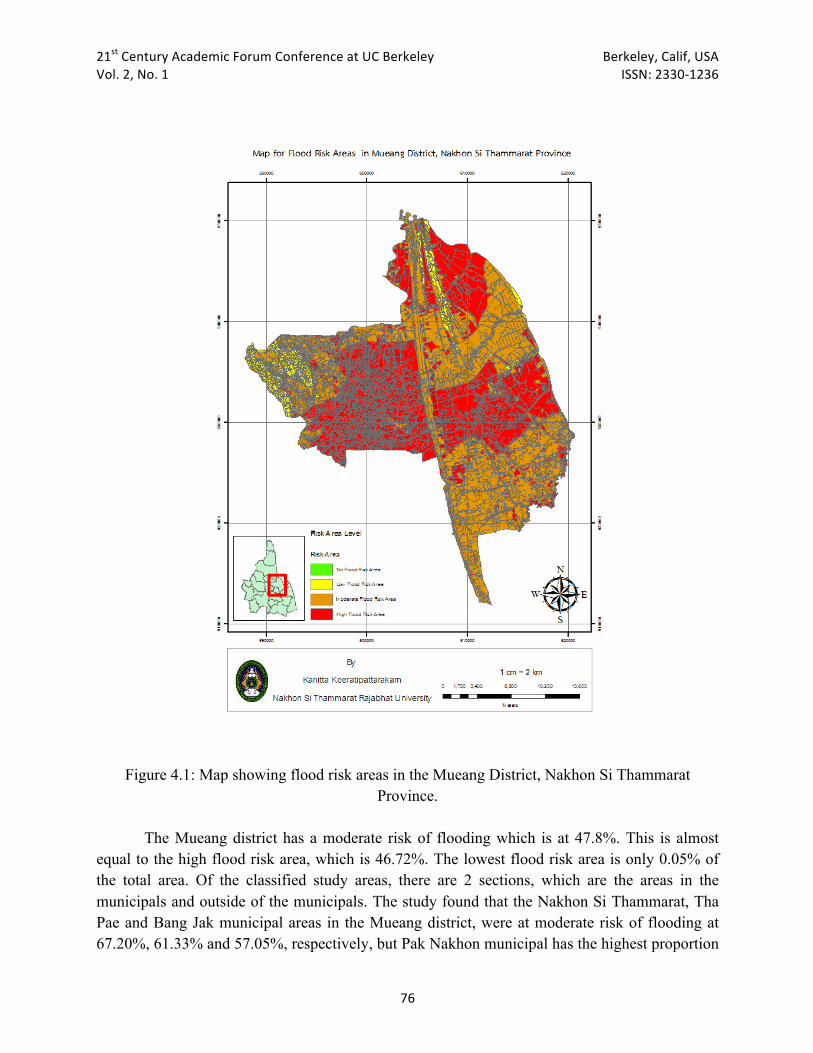
Figure 4.1: Map showing flood risk areas in the Mueang District, Nakhon Si Thammarat
Province. The Mueang district has a moderate risk of flooding which is at 47.8%. This is almost equal to the high flood risk area, which is 46.72%. The lowest flood risk area is only 0.05% of the total area. Of the classified study areas, there are 2 sections, which are the areas in the municipals and outside of the municipals. The study found that the Nakhon Si Thammarat, Tha Pae and Bang Jak municipal areas in the Mueang district, were at moderate risk of flooding at 67.20%, 61.33% and 57.05%, respectively, but Pak Nakhon municipal has the highest proportion
21st Century Academic Forum Conference at UC Berkeley Berkeley, Calif, USA Vol. 2, No. 1 ISSN: 2330-‐1236
77
of low flood risk areas at 35.13%. Every municipal has a minority of non-flood risk areas. Outside of the municipals, the areas that are the highest flood risk areas are Chai Montri, Na Kien, Mamuang Song Ton, Na Sai, Pho Sadet, Tha Rai, Kampang Saw and Pak Nakhon sub-districts. These were 100.00%, 100.00%, 99.46%, 98.78%, 95.88%, 92.28%, 87.06% and 74.69%, respectively. Tha Sak, Tha Rue, Bang Jak and Tha Ngiw sub-districts are mostly moderate flood risk areas at 96.74%, 90.01%, 84.90% and 64.64%, respectively.
Discussion Assessment of the weighting scores and suitability scores for each factor found that rainfall is a meteorological factor causing flood peaks. The results were consistent with the results of reseach of Nathnares Arekonsuwan (2008), who studied flooding to determine flood risk areas using GIS and preventative relief in the Songkhla Lake sub-basin, Phatthalung province. It found that rainfall was the main factor, which also corresponded to the quotient by Chow Wongchalerm (2004), who studied the areas with a chance of flooding using satellite data and GIS in Chumphon, Surat Thani and Nakhon Si Thammarat provinces. He found that rainfall was the main factor there as well. However, this does not comply with the research of Supichar Thanarun (2009), who studied the application of GIS to determine flood risk areas in Ang Tong province and found that the barrier to water was the most important factor affecting the occurrence of flooding. This study was also inconsistent with the study of Kobkit Krinara (2006), who studied the areas vulnerable to flooding in the Phetchaburi water-basin, Phetchaburi Province and found that land use was the main factor affecting flooding in the region. This analysis found that moderate flood risk areas and high flood risk areas had the highest proportion with similar or equivalent to 47.85% and representing 46.72% of the total area. This was not consistent with the study by Prasit Makarun (2001), who studied the application of GIS and the potential for flooding in the Yom basin, Northern Thailand, which found that most of the southern areas of the Yom basin had moderate flood risk areas accounting for 35.22% of the area. This study is also inconsistent with the findings of Supichar Thanarun (2009), who studied the application of GIS to determine flood risk areas in Angtong province, and found that most areas had a high flood risk, 99.23%, and that moderate flood risk areas accounted for the remaining 0.77% of the total area.
Conclusion
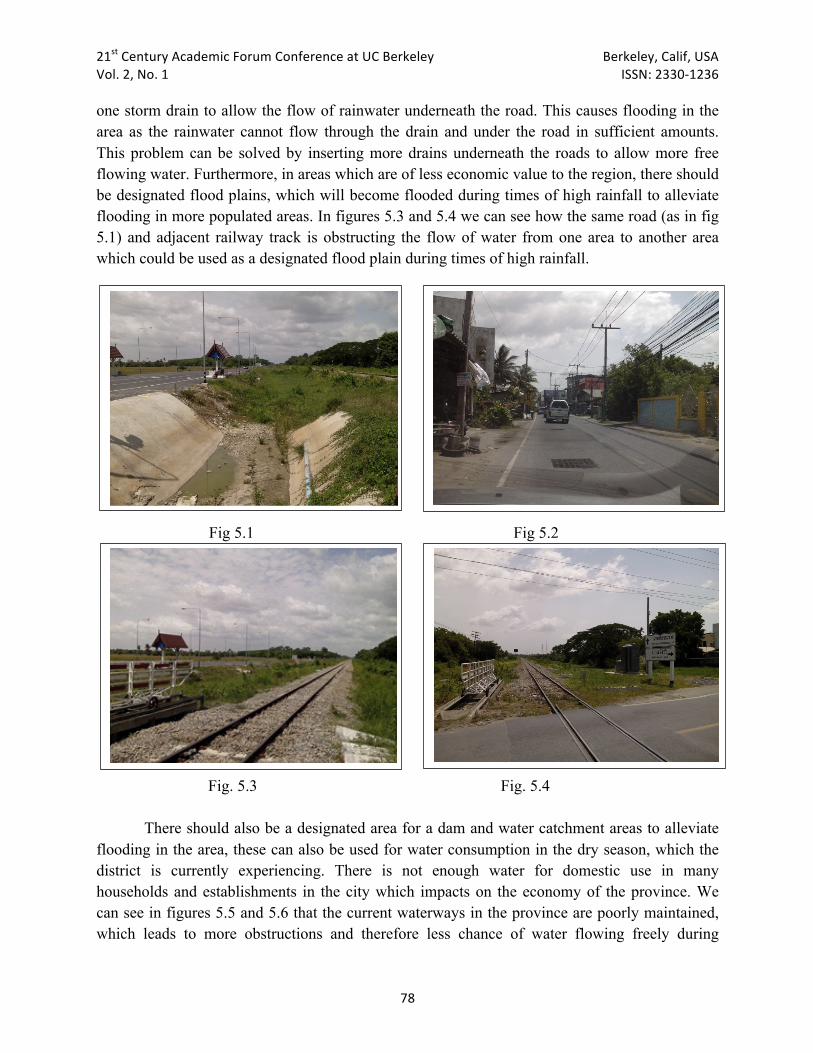
Roads and waterways should be improved by building more storm drains. This will allow rainwater to flow more freely during periods of heavy rain. As we can see from figure 5.2 current storm drains are not placed in the correct area of the road. They should be on either side of the road so as to aid the flow of water. From this photo we can see that the houses have been built to close to the road and are especially prone to flooding because of the poor drainage systems in place. In figure 5.1 we can see a long stretch of road and adjoining waterway, which has only
21st Century Academic Forum Conference at UC Berkeley Berkeley, Calif, USA Vol. 2, No. 1 ISSN: 2330-‐1236
78
one storm drain to allow the flow of rainwater underneath the road. This causes flooding in the area as the rainwater cannot flow through the drain and under the road in sufficient amounts. This problem can be solved by inserting more drains underneath the roads to allow more free flowing water. Furthermore, in areas which are of less economic value to the region, there should be designated flood plains, which will become flooded during times of high rainfall to alleviate flooding in more populated areas. In figures 5.3 and 5.4 we can see how the same road (as in fig 5.1) and adjacent railway track is obstructing the flow of water from one area to another area which could be used as a designated flood plain during times of high rainfall.
Fig 5.1 Fig 5.2
Fig. 5.3 Fig. 5.4
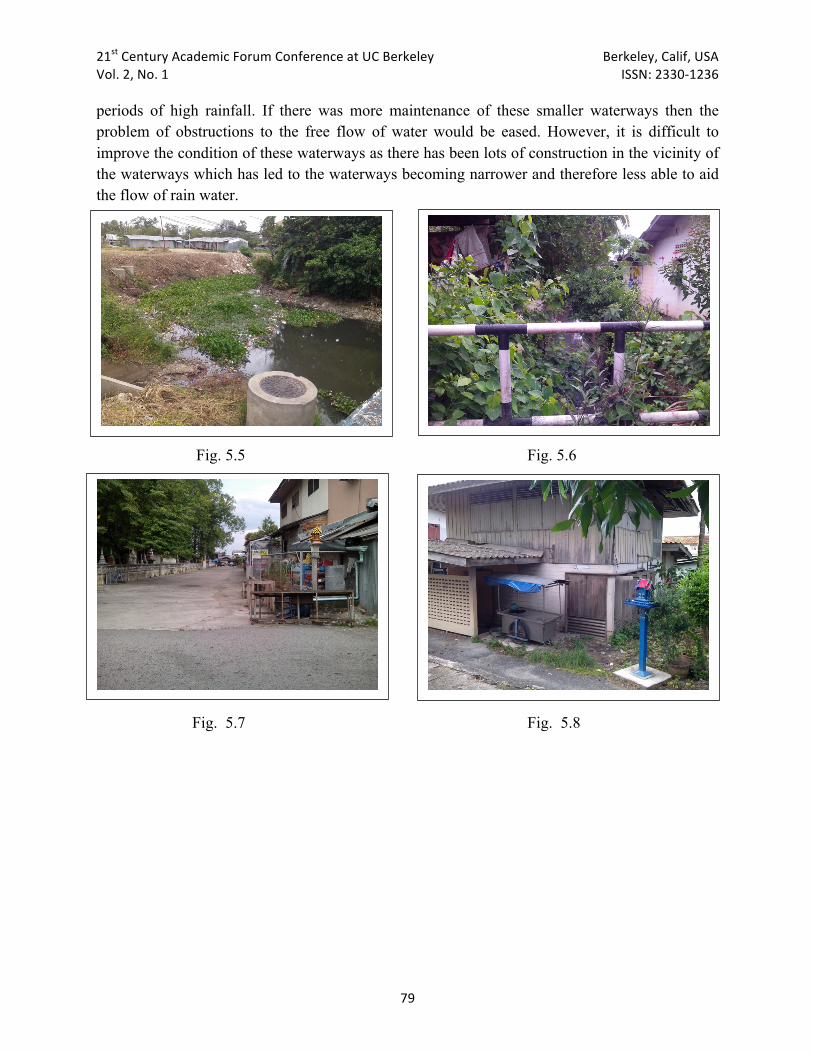
There should also be a designated area for a dam and water catchment areas to alleviate flooding in the area, these can also be used for water consumption in the dry season, which the district is currently experiencing. There is not enough water for domestic use in many households and establishments in the city which impacts on the economy of the province. We can see in figures 5.5 and 5.6 that the current waterways in the province are poorly maintained, which leads to more obstructions and therefore less chance of water flowing freely during
21st Century Academic Forum Conference at UC Berkeley Berkeley, Calif, USA Vol. 2, No. 1 ISSN: 2330-‐1236
79
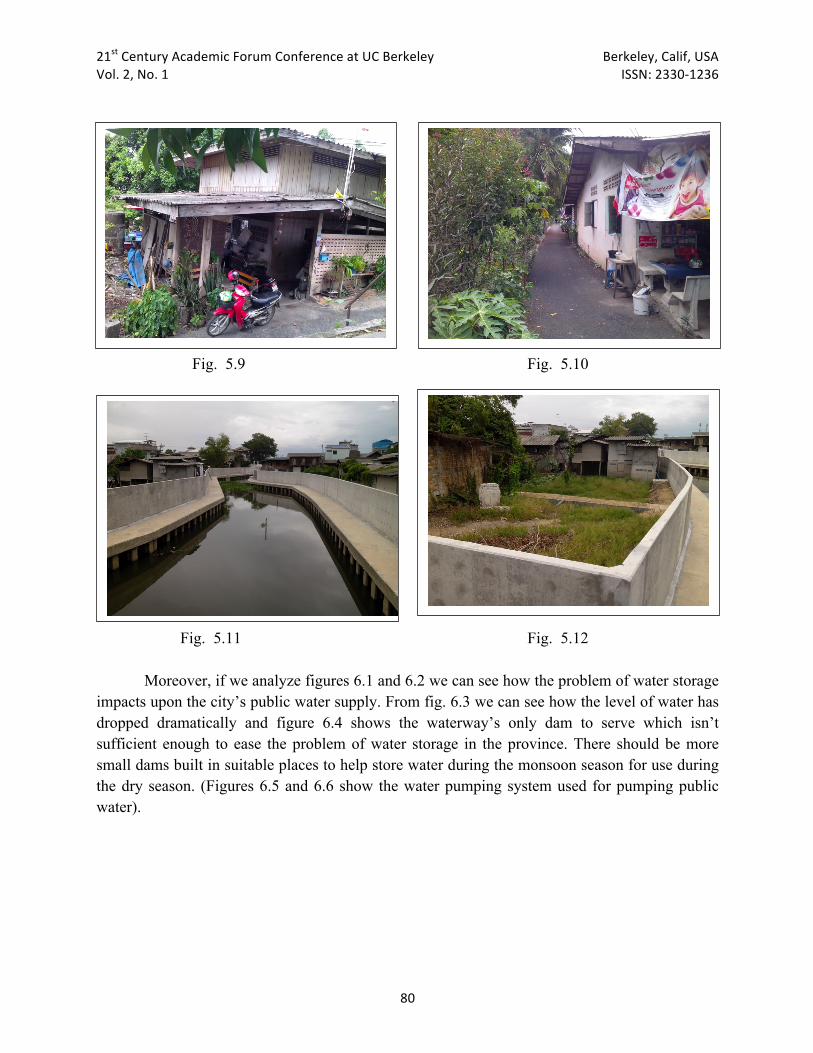
periods of high rainfall. If there was more maintenance of these smaller waterways then the problem of obstructions to the free flow of water would be eased. However, it is difficult to improve the condition of these waterways as there has been lots of construction in the vicinity of the waterways which has led to the waterways becoming narrower and therefore less able to aid the flow of rain water.
Fig. 5.5 Fig. 5.6
Fig. 5.7 Fig. 5.8
21st Century Academic Forum Conference at UC Berkeley Berkeley, Calif, USA Vol. 2, No. 1 ISSN: 2330-‐1236
80
Fig. 5.9 Fig. 5.10
Fig. 5.11 Fig. 5.12
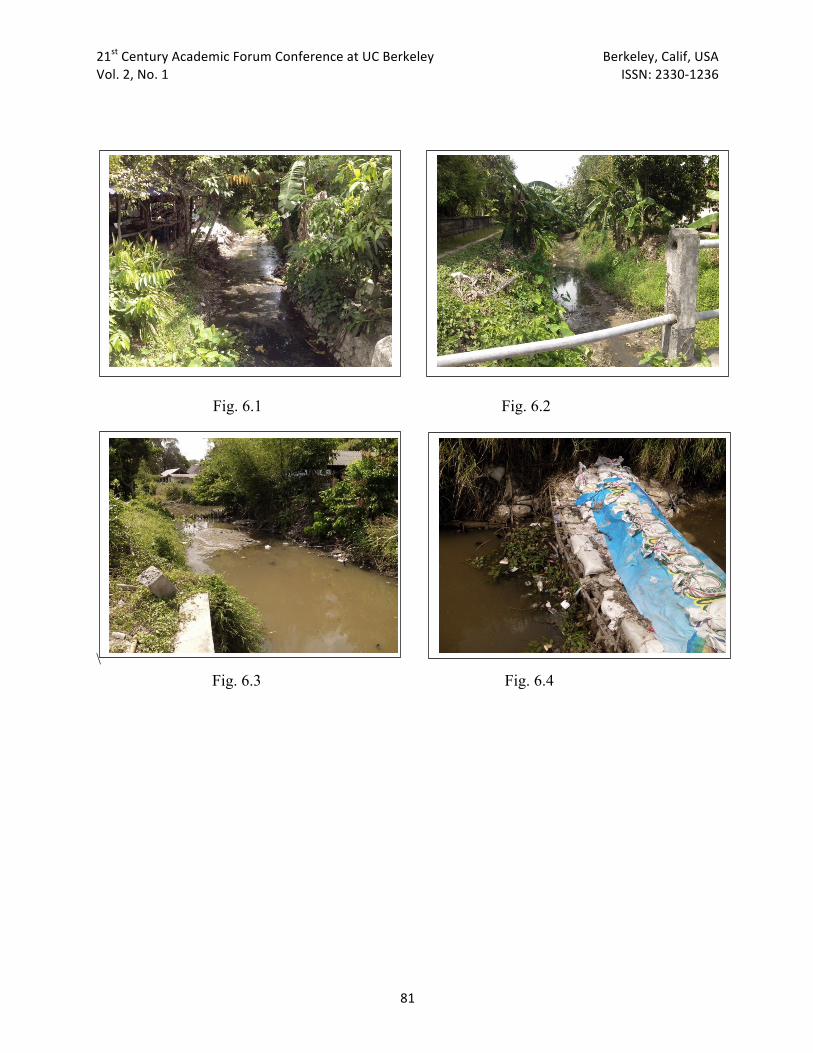
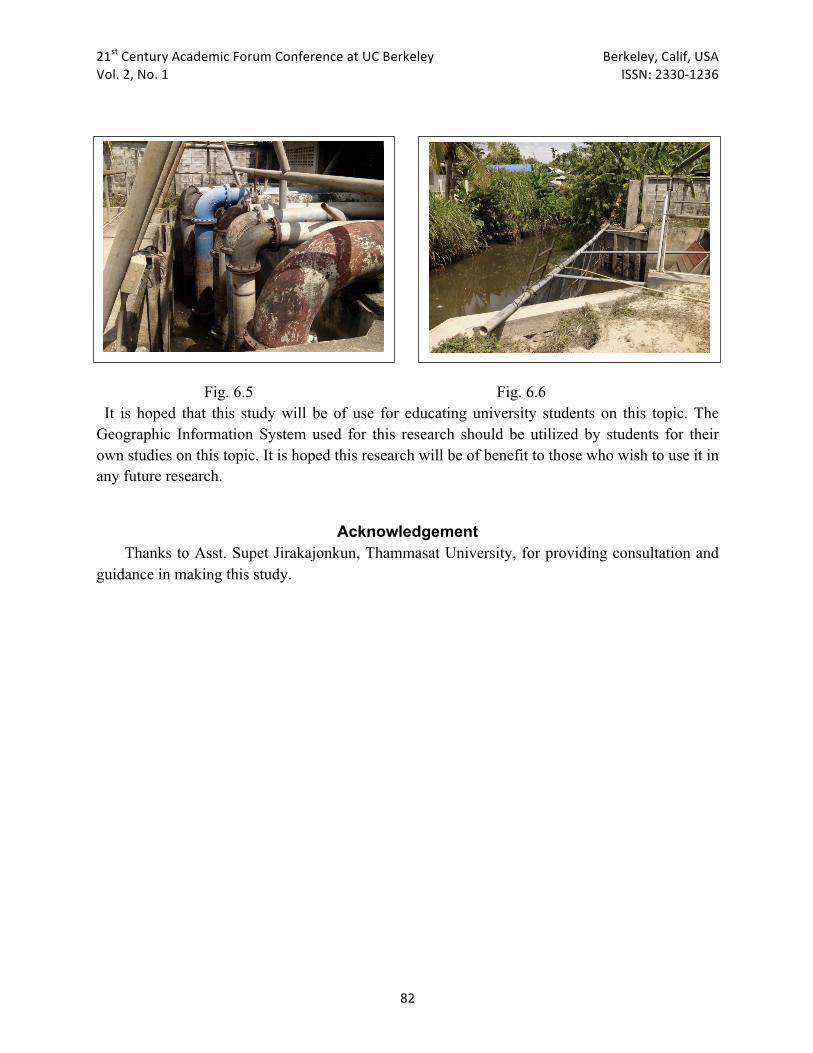
Moreover, if we analyze figures 6.1 and 6.2 we can see how the problem of water storage impacts upon the city’s public water supply. From fig. 6.3 we can see how the level of water has dropped dramatically and figure 6.4 shows the waterway’s only dam to serve which isn’t sufficient enough to ease the problem of water storage in the province. There should be more small dams built in suitable places to help store water during the monsoon season for use during the dry season. (Figures 6.5 and 6.6 show the water pumping system used for pumping public water).
21st Century Academic Forum Conference at UC Berkeley Berkeley, Calif, USA Vol. 2, No. 1 ISSN: 2330-‐1236
81
Fig. 6.1 Fig. 6.2
\ Fig. 6.3 Fig. 6.4
21st Century Academic Forum Conference at UC Berkeley Berkeley, Calif, USA Vol. 2, No. 1 ISSN: 2330-‐1236
82
Fig. 6.5 Fig. 6.6 It is hoped that this study will be of use for educating university students on this topic. The Geographic Information System used for this research should be utilized by students for their own studies on this topic. It is hoped this research will be of benefit to those who wish to use it in any future research.
Acknowledgement
Thanks to Asst. Supet Jirakajonkun, Thammasat University, for providing consultation and guidance in making this study.
21st Century Academic Forum Conference at UC Berkeley Berkeley, Calif, USA Vol. 2, No. 1 ISSN: 2330-‐1236
83
Reference
Arekonsuwan, Nathanres. 2008. The study of the Songkhla sub-basin. Aronoff, Stan. 1995. Geographic Information System: A Management Perspective. Ottawa: WDL. Barrows, H.K. 1948. Floods, Their Hydrology and Control. New York: McGraw – Hill. Brook, K.N.; Ffolliott, P.E.; Gregersen, H.M. and Thames, J.L. 1991. Hydrology and the Management of Watersheds. Iowa: Iowa State University Press. 125. Krinara, Kobkit. 2006. The study of areas at risk of flooding in the Petchaburi sub-basin. Thanarun, Supichar. 2009. The geographical study of areas at risk of flooding in Ang Thong. Wongchalerm, Chow. 2004. The study of mapping the areas at risk of flooding in the North – West region of Southern Thailand.