fruit senescence and decay simulation
TRANSCRIPT

Fruit Senescence and Decay SimulationFruit Senescence and Decay SimulationFruit Senescence and Decay SimulationFruit Senescence and Decay Simulation
Presented by Tae-hyeong Kim
2012. 1. 2
Korea UniversityComputer Graphics Lab.
EUROGRAPHICS 2011
Joseph T. Kider et al.
Copyright of figures and other materials in the paper is belongs to original authors.

Abstract
• Aging and imperfections provide important visual cues for realism.
• A novel physically-based approach for simulating the biological aging and decay process in fruits. § Closely mirrors the progression of decay in real fruits under
similar parameterized conditions.
• Provide a tool § that allows artists to customize
the input of the program to produce generalized fruit simulations.
Korea UniversityComputer Graphics Lab. Tae-hyeong Kim | 2011. 11. 24 | # 2KUCG |
• Aging and imperfections provide important visual cues for realism.
• A novel physically-based approach for simulating the biological aging and decay process in fruits. § Closely mirrors the progression of decay in real fruits under
similar parameterized conditions.
• Provide a tool § that allows artists to customize
the input of the program to produce generalized fruit simulations.

Introduction
• We attempt to address the rather unexplored area of organic decomposition, a fundamental step in a fruit’s life-cycle.§ While artists can add visual imperfections to their models and
environments, but these may be based on observation, intuition, and artistic skill.
• Traditional surface texture imperfection and aging techniques are visually satisfying, § but they do not take into account the effect of mold and other
micro-organisms on environments in a way that is biologically accurate.
Korea UniversityComputer Graphics Lab. Tae-hyeong Kim | 2011. 11. 24 | # 3KUCG |
• We attempt to address the rather unexplored area of organic decomposition, a fundamental step in a fruit’s life-cycle.§ While artists can add visual imperfections to their models and
environments, but these may be based on observation, intuition, and artistic skill.
• Traditional surface texture imperfection and aging techniques are visually satisfying, § but they do not take into account the effect of mold and other
micro-organisms on environments in a way that is biologically accurate.
Introduction
• We present a novel, parameterized method to simulate fruit senescence and decay that is grounded in scientific research.§ As real fruits age, their physical structures become compromised
and vulnerable to attack by infectious agents.§ We generate growth patterns for areas of fungal and bacterial
infection with a reaction-diffusion model.
• Our model changes both the overall shape and the appearance properties of the fruit’s anatomy.
Korea UniversityComputer Graphics Lab. Tae-hyeong Kim | 2011. 11. 24 | # 4KUCG |
• We present a novel, parameterized method to simulate fruit senescence and decay that is grounded in scientific research.§ As real fruits age, their physical structures become compromised
and vulnerable to attack by infectious agents.§ We generate growth patterns for areas of fungal and bacterial
infection with a reaction-diffusion model.
• Our model changes both the overall shape and the appearance properties of the fruit’s anatomy.
Introduction
• The simulation is based on user-defined parameters for § skin thickness and porosity, water content, flesh rigidity, ambient
temperature, humidity, and proximity to other surfaces.
• These parameters allow direct control of the simulation and a broad range of results.
• Additionally, we provide a tool that allows an artist to direct the simulation.
Korea UniversityComputer Graphics Lab. Tae-hyeong Kim | 2011. 11. 24 | # 5KUCG |
• The simulation is based on user-defined parameters for § skin thickness and porosity, water content, flesh rigidity, ambient
temperature, humidity, and proximity to other surfaces.
• These parameters allow direct control of the simulation and a broad range of results.
• Additionally, we provide a tool that allows an artist to direct the simulation.
투과성 어떤
물질계나
구조에
액체나
기체
등의
확산이
있는
경우에
그
구조가
확산성
물질분자의
통과나
침입을
허용하는
성질

Related work
• Turk and Witkin and Kass proposed using reaction-diffusion for texture synthesis.
• Several researchers have attempted physically-based simulation methods to automate the creation of realistic aging and imperfections.
• Data-driven simulation techniques rely on carefully captured images and measurements to produce time-varying surface imperfections.
Korea UniversityComputer Graphics Lab. Tae-hyeong Kim | 2011. 11. 24 | # 6KUCG |
• Turk and Witkin and Kass proposed using reaction-diffusion for texture synthesis.
• Several researchers have attempted physically-based simulation methods to automate the creation of realistic aging and imperfections.
• Data-driven simulation techniques rely on carefully captured images and measurements to produce time-varying surface imperfections.
Biological Background of Fruit Decay
• Decay is an essential step in the reproductive process of fruiting plants.§ While disease can strike a fruit at any stage of life, fruit naturally
becomes more vulnerable to disease over time.
• Post-harvest disease is typically initiated when a point on the fruit’s surface is compromised, either due to injury or structural vulnerabilities.§ Once an initial infectious agent like bacteria has attacked, it
further weakens the surface and leaves it susceptible to infection by other organisms.
• The soft rot serves as an entry point for fungal spores.
Korea UniversityComputer Graphics Lab. Tae-hyeong Kim | 2011. 11. 24 | # 7KUCG |
• Decay is an essential step in the reproductive process of fruiting plants.§ While disease can strike a fruit at any stage of life, fruit naturally
becomes more vulnerable to disease over time.
• Post-harvest disease is typically initiated when a point on the fruit’s surface is compromised, either due to injury or structural vulnerabilities.§ Once an initial infectious agent like bacteria has attacked, it
further weakens the surface and leaves it susceptible to infection by other organisms.
• The soft rot serves as an entry point for fungal spores.

Biological Background of Fruit Decay
Fungal Growth
• Various reaction-diffusion processes have been proposed to better predict fungal growth based on a variety of parameters.
• Bacteria and fungi thrive on the nutrient-rich surface of a ripened fruit.§ However, nutrient levels deplete over time as colonies use up
resources, slowing down the growth process.§ Environmental factors such as temperature and humidity greatly
affect mold and bacterial growth.• Warmer temperatures lead to more rapid proliferation, while
colder temperatures retard growth.
Korea UniversityComputer Graphics Lab. Tae-hyeong Kim | 2011. 11. 24 | # 8KUCG |
• Various reaction-diffusion processes have been proposed to better predict fungal growth based on a variety of parameters.
• Bacteria and fungi thrive on the nutrient-rich surface of a ripened fruit.§ However, nutrient levels deplete over time as colonies use up
resources, slowing down the growth process.§ Environmental factors such as temperature and humidity greatly
affect mold and bacterial growth.• Warmer temperatures lead to more rapid proliferation, while
colder temperatures retard growth.

Biological Background of Fruit Decay
Mold
• Mold vs Fungi?
• Various types of mold affect fruit.
• Mold starts to form at the points of contact with the glass. § This occurs because the flesh weakens under the pressure of the
weight of the fruit, providing entry points for pathological agents.
Korea UniversityComputer Graphics Lab. Tae-hyeong Kim | 2011. 11. 24 | # 9KUCG |
• Mold vs Fungi?
• Various types of mold affect fruit.
• Mold starts to form at the points of contact with the glass. § This occurs because the flesh weakens under the pressure of the
weight of the fruit, providing entry points for pathological agents.
Biological Background of Fruit Decay
Transpiration
• Fruits have high water content in proportion to their weight.• Moisture loss due to transpiration is a major factor
§ in fruit decay and § is one of the main factors that drive changes in the internal
structure.
Korea UniversityComputer Graphics Lab. Tae-hyeong Kim | 2011. 11. 24 | # 10KUCG |
증산작용 [蒸散作用, transpiration] 잎의
뒷면에
있는
기공을
통해
물이
기체상태로
식물체
밖으로
빠져나가는
작용을
말한다.
Biological Background of Fruit Decay
Factors not discussed
• Fruit decay is a complex natural phenomenon that is driven by innumerable conditions in addition to those we have discussed.§ We do not consider elements such as nutrient deficiency or poor
fertilization while growing.§ Our mathematical model can be generalized to different types of
fruits and infectious agents based on the input parameterization.
Korea UniversityComputer Graphics Lab. Tae-hyeong Kim | 2011. 11. 24 | # 11KUCG |
• Fruit decay is a complex natural phenomenon that is driven by innumerable conditions in addition to those we have discussed.§ We do not consider elements such as nutrient deficiency or poor
fertilization while growing.§ Our mathematical model can be generalized to different types of
fruits and infectious agents based on the input parameterization.

Fruit Senescence and Decay Pipeline
• 1st, the user sets both the skin and internal substrate meshes. • 2nd, the user selects fruit, mold, and environmental presets, or
sets custom values for each parameter.§ These input parameters drive the reaction-diffusion and
transpiration mathematical models described in detail below.§ Then, the user selects contact points, which will serve as initial
seed points for the bacterial soft rot map.• Finally, the user runs the simulation.
Korea UniversityComputer Graphics Lab. Tae-hyeong Kim | 2011. 11. 24 | # 12KUCG |
• 1st, the user sets both the skin and internal substrate meshes. • 2nd, the user selects fruit, mold, and environmental presets, or
sets custom values for each parameter.§ These input parameters drive the reaction-diffusion and
transpiration mathematical models described in detail below.§ Then, the user selects contact points, which will serve as initial
seed points for the bacterial soft rot map.• Finally, the user runs the simulation.

Fruit Senescence and Decay Pipeline
• The program output includes a series of maps § representing distributions of fungus, bacteria, and nutrients for
each frame of the simulation. § It also includes a vertex cache which is automatically applied to
the internal substrate mesh. § The alpha maps shade the different layers of the fruit-fresh
surface, bacterial soft rot, and mold.
Korea UniversityComputer Graphics Lab. Tae-hyeong Kim | 2011. 11. 24 | # 13KUCG |
• The program output includes a series of maps § representing distributions of fungus, bacteria, and nutrients for
each frame of the simulation. § It also includes a vertex cache which is automatically applied to
the internal substrate mesh. § The alpha maps shade the different layers of the fruit-fresh
surface, bacterial soft rot, and mold.

Fruit Senescence and Decay Pipeline
Map
• Our maps range X between [0... 1], with white representing a maximum density of 1, and black representing a density of 0.
• We use three different map sequences: the nutrient map, the fungal map, and the soft rot map.§ nutrient map
• represents the distribution of nutrients over the surface of the fruit, and serves as a distribution map for fungal growth.
§ soft rot map • represents the areas of bacterial growth that form on fruit.
§ fungal map • track the areas of fungal colony formation.
• For our implementation, the maps were sized at 512×512 pixels.
Korea UniversityComputer Graphics Lab. Tae-hyeong Kim | 2011. 11. 24 | # 14KUCG |
• Our maps range X between [0... 1], with white representing a maximum density of 1, and black representing a density of 0.
• We use three different map sequences: the nutrient map, the fungal map, and the soft rot map.§ nutrient map
• represents the distribution of nutrients over the surface of the fruit, and serves as a distribution map for fungal growth.
§ soft rot map • represents the areas of bacterial growth that form on fruit.
§ fungal map • track the areas of fungal colony formation.
• For our implementation, the maps were sized at 512×512 pixels.

Fruit Senescence and Decay Pipeline
Map
Korea UniversityComputer Graphics Lab. Tae-hyeong Kim | 2011. 11. 24 | # 15KUCG |
Fruit Senescence and Decay Pipeline
Internal Volume
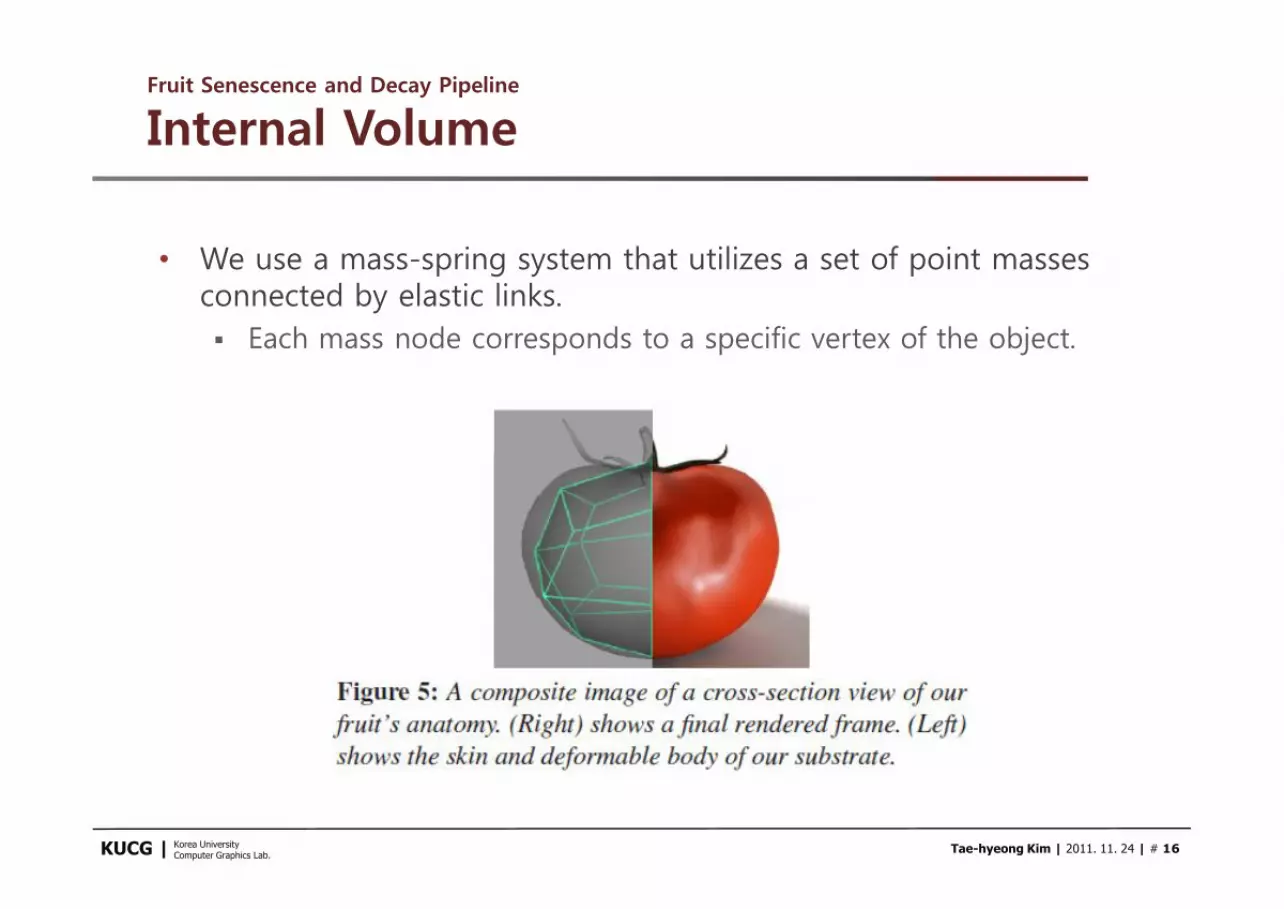
• We use a mass-spring system that utilizes a set of point masses connected by elastic links. § Each mass node corresponds to a specific vertex of the object.
Korea UniversityComputer Graphics Lab. Tae-hyeong Kim | 2011. 11. 24 | # 16KUCG |

Fruit Senescence and Decay Pipeline
Internal Volume
• Initial spring constants are determined by the user-defined firmness parameter(Ks = firmness), § which varies across different fruits.
• For example, tomatoes have high water content and are softer than apples.
• The spring constants and resting lengths(rLen) are governed by a pressure map, which may change at every time-step.
Korea UniversityComputer Graphics Lab. Tae-hyeong Kim | 2011. 11. 24 | # 17KUCG |
• Initial spring constants are determined by the user-defined firmness parameter(Ks = firmness), § which varies across different fruits.
• For example, tomatoes have high water content and are softer than apples.
• The spring constants and resting lengths(rLen) are governed by a pressure map, which may change at every time-step.

• As the soft rot map changes the outer appearance from the reaction-diffusion growth, springs at the same locations in the pressure map decrease in stiffness and length, affecting the internal volume. § This represents areas of soft bacterial rot where the fruit is softer.§ Therefore certain areas may collapse faster based on the level of
infection.
• At each time step of the simulation, § spring constants and resting lengths are decreased at a rate
proportional to water content and the calculated transpiration rate.
Fruit Senescence and Decay Pipeline
Internal Volume
Korea UniversityComputer Graphics Lab. Tae-hyeong Kim | 2011. 11. 24 | # 18KUCG |
• As the soft rot map changes the outer appearance from the reaction-diffusion growth, springs at the same locations in the pressure map decrease in stiffness and length, affecting the internal volume. § This represents areas of soft bacterial rot where the fruit is softer.§ Therefore certain areas may collapse faster based on the level of
infection.
• At each time step of the simulation, § spring constants and resting lengths are decreased at a rate
proportional to water content and the calculated transpiration rate.

• The volume is proportional to the cube of the spring resting lengths.
• waterContent : water• tRate : the rate at which water volume is lost• c : weighting factor
• In addition, we wanted the springs to lose tightness over time § to reflect the softening that occurs due to water loss and
decrease in structural integrity of the internal fibers.
Fruit Senescence and Decay Pipeline
Internal Volume
Korea UniversityComputer Graphics Lab. Tae-hyeong Kim | 2011. 11. 24 | # 19KUCG |
• The volume is proportional to the cube of the spring resting lengths.
• waterContent : water• tRate : the rate at which water volume is lost• c : weighting factor
• In addition, we wanted the springs to lose tightness over time § to reflect the softening that occurs due to water loss and
decrease in structural integrity of the internal fibers.

Fruit Senescence and Decay Pipeline
Internal Volume
Korea UniversityComputer Graphics Lab. Tae-hyeong Kim | 2011. 11. 24 | # 20KUCG |

Fruit Senescence and Decay Pipeline
External Skin
• Dynamic properties of fruit skin can be modeled in much the same way as cloth.
• First, we bound the skin to the internal volume mesh with point constraints. § As the internal mesh started to collapse, it naturally produced the
effects that occur during decay, such as wrinkling and shriveling.§ The simulation parameters of the cloth were determined by user-
defined thickness(St).
• The fruit skin layer was simulated using the nCloth cloth solver in Maya.
Korea UniversityComputer Graphics Lab. Tae-hyeong Kim | 2011. 11. 24 | # 21KUCG |
• Dynamic properties of fruit skin can be modeled in much the same way as cloth.
• First, we bound the skin to the internal volume mesh with point constraints. § As the internal mesh started to collapse, it naturally produced the
effects that occur during decay, such as wrinkling and shriveling.§ The simulation parameters of the cloth were determined by user-
defined thickness(St).
• The fruit skin layer was simulated using the nCloth cloth solver in Maya.
Fruit Senescence and Decay Pipeline
Presets and Parameters
• We provide a set of fruit, mold, and environmental presets and parameters § to effect the decay of fruit in our simulation.§ Fruit presets include tomato, orange and apple. § Environment presets include tropical, cold desert, hot desert, and
temperate climates.
Korea UniversityComputer Graphics Lab. Tae-hyeong Kim | 2011. 11. 24 | # 22KUCG |
• We provide a set of fruit, mold, and environmental presets and parameters § to effect the decay of fruit in our simulation.§ Fruit presets include tomato, orange and apple. § Environment presets include tropical, cold desert, hot desert, and
temperate climates.

• Many researchers have conducted studies to accurately determine these values for other types of fruit [BH94, CRBG88]. § Mold parameters, such as growth rate, propagation rate, and
color allow for different mold growth patterns. • Ito and Mizuno [IM09] specify other growth settings for more
mold types.
§ Environmental factors, such as temperature and humidity, also influence the simulation.
• Lastly, we allow the user to specify initial areas of rot by selecting vertices on the input mesh. § By default, the simulation begins to rot at the points of contact
with other surfaces and at the stem.
Fruit Senescence and Decay Pipeline
Presets and Parameters
Korea UniversityComputer Graphics Lab. Tae-hyeong Kim | 2011. 11. 24 | # 23KUCG |
• Many researchers have conducted studies to accurately determine these values for other types of fruit [BH94, CRBG88]. § Mold parameters, such as growth rate, propagation rate, and
color allow for different mold growth patterns. • Ito and Mizuno [IM09] specify other growth settings for more
mold types.
§ Environmental factors, such as temperature and humidity, also influence the simulation.
• Lastly, we allow the user to specify initial areas of rot by selecting vertices on the input mesh. § By default, the simulation begins to rot at the points of contact
with other surfaces and at the stem.

Fruit Senescence and Decay Pipeline
Rendering
• We modeled and rendered our results in Autodesk Maya 2010. • The color and polygonal structure of each fruit were empirically
derived by observing and photographing real fruit (Figure 2).
• We used a layered shading system, applying the map sequence acquired from our simulation as alpha maps for the decay layers.
• We used the fungal map as a length and baldness map for Maya Fur to simulate hair-like mold fibers.
• Our results were rendered with Mental Ray for Maya.
Korea UniversityComputer Graphics Lab. Tae-hyeong Kim | 2011. 11. 24 | # 24KUCG |
• We modeled and rendered our results in Autodesk Maya 2010. • The color and polygonal structure of each fruit were empirically
derived by observing and photographing real fruit (Figure 2).
• We used a layered shading system, applying the map sequence acquired from our simulation as alpha maps for the decay layers.
• We used the fungal map as a length and baldness map for Maya Fur to simulate hair-like mold fibers.
• Our results were rendered with Mental Ray for Maya.

Simulation Framework
• We simulate § both fungal colony and mold growth on the exocarp,§ and soft rot formation and transpiration on the mesocarp.
• We present mathematical models § that tie together these time-varying biological processes on the
multiple layers.
Korea UniversityComputer Graphics Lab. Tae-hyeong Kim | 2011. 11. 24 | # 25KUCG |
• We simulate § both fungal colony and mold growth on the exocarp,§ and soft rot formation and transpiration on the mesocarp.
• We present mathematical models § that tie together these time-varying biological processes on the
multiple layers.
http://en.wikipedia.org/wiki/File:Drupe_fruit_diagram-en.svg

Implementation Overview
• We utilize numerical reaction-diffusion equations to form fungal and bacterial colonies, and a transpiration model to drive the volume collapse. § These calculations affect the underlying maps and substrate
meshes as the fruit decays.
• we simulate all three processes, the internal deformable body, skin, and output the maps simultaneously.§ Since the soft rot, nutrient, and fungal maps interact
Korea UniversityComputer Graphics Lab. Tae-hyeong Kim | 2011. 11. 24 | # 26KUCG |
• We utilize numerical reaction-diffusion equations to form fungal and bacterial colonies, and a transpiration model to drive the volume collapse. § These calculations affect the underlying maps and substrate
meshes as the fruit decays.
• we simulate all three processes, the internal deformable body, skin, and output the maps simultaneously.§ Since the soft rot, nutrient, and fungal maps interact

Implementation Overview
Step 1.
• We spawn new colonies in the fungal and soft rot maps § to simulate the effect of individual cells spreading
from the existing mold or bacterial colonies and taking root in nearby areas of the fruit’s surface.
• For each existing colony, § we create a seed point § in a randomly selected location within some radius r
with a probability given by 1/(10−propagationRate) • with propagationRate’s range between [0 ... 9].
Korea UniversityComputer Graphics Lab. Tae-hyeong Kim | 2011. 11. 24 | # 27KUCG |
• We spawn new colonies in the fungal and soft rot maps § to simulate the effect of individual cells spreading
from the existing mold or bacterial colonies and taking root in nearby areas of the fruit’s surface.
• For each existing colony, § we create a seed point § in a randomly selected location within some radius r
with a probability given by 1/(10−propagationRate) • with propagationRate’s range between [0 ... 9].

Implementation Overview
Step 2.
• We form additional new colonies in the fungal map § in areas of the surface affected by bacterial soft rot.
• The soft rot map serves as a probability map, § with more concentrated areas of bacteria containing
higher probabilities of spawning a new colony.
Korea UniversityComputer Graphics Lab. Tae-hyeong Kim | 2011. 11. 24 | # 28KUCG |
• We form additional new colonies in the fungal map § in areas of the surface affected by bacterial soft rot.
• The soft rot map serves as a probability map, § with more concentrated areas of bacteria containing
higher probabilities of spawning a new colony.

Implementation Overview
Step 3.
• We calculate the reaction diffusion step. • The fungal and bacterial maps follow similar reaction diffusion
processes, § with differences in equation parameters, § while the nutrient map undergoes a separate nutrient diffusion
process.
Korea UniversityComputer Graphics Lab. Tae-hyeong Kim | 2011. 11. 24 | # 29KUCG |
• We calculate the reaction diffusion step. • The fungal and bacterial maps follow similar reaction diffusion
processes, § with differences in equation parameters, § while the nutrient map undergoes a separate nutrient diffusion
process.

Implementation Overview
Step 3.
1. The fungal and bacterial concentrations at each cell (corresponding to a pixel on the map) are calculated § from known concentrations at the previous time step
2. The diffusion term is determined as an average of the immediate neighboring cells
3. The reaction term is computed § based on density at the corresponding cell in the
nutrient map during the previous time step.
4. Calculate the nutrient reaction-diffusion process
5. Update the maps by writing the new concentration values at each fungal, rot, and nutrient cells.
Korea UniversityComputer Graphics Lab. Tae-hyeong Kim | 2011. 11. 24 | # 30KUCG |
1. The fungal and bacterial concentrations at each cell (corresponding to a pixel on the map) are calculated § from known concentrations at the previous time step
2. The diffusion term is determined as an average of the immediate neighboring cells
3. The reaction term is computed § based on density at the corresponding cell in the
nutrient map during the previous time step.
4. Calculate the nutrient reaction-diffusion process
5. Update the maps by writing the new concentration values at each fungal, rot, and nutrient cells.
Implementation Overview
Step 4.
• We integrate the deformable body at each time step§ using the explicit fourth order Runge-Kutta scheme.
• A time step size of 6 milliseconds was found § to be sufficiently small to guarantee numerical stability, although
for more complex polygonal meshes, an implicit scheme may be preferred.
Korea UniversityComputer Graphics Lab. Tae-hyeong Kim | 2011. 11. 24 | # 31KUCG |
• We integrate the deformable body at each time step§ using the explicit fourth order Runge-Kutta scheme.
• A time step size of 6 milliseconds was found § to be sufficiently small to guarantee numerical stability, although
for more complex polygonal meshes, an implicit scheme may be preferred.

Algorithm Details
Fungal and Bacterial Growth
• In our model, the fungus is separates into two states, active and inactive.
• As active fungi grow and proliferate, they deplete the underlying nutrient concentration defined in our nutrient map. § As values in the nutrient map approach 0, the fungi at that point
become inactive and cease to spread.
Korea UniversityComputer Graphics Lab. Tae-hyeong Kim | 2011. 11. 24 | # 32KUCG |
• In our model, the fungus is separates into two states, active and inactive.
• As active fungi grow and proliferate, they deplete the underlying nutrient concentration defined in our nutrient map. § As values in the nutrient map approach 0, the fungi at that point
become inactive and cease to spread.
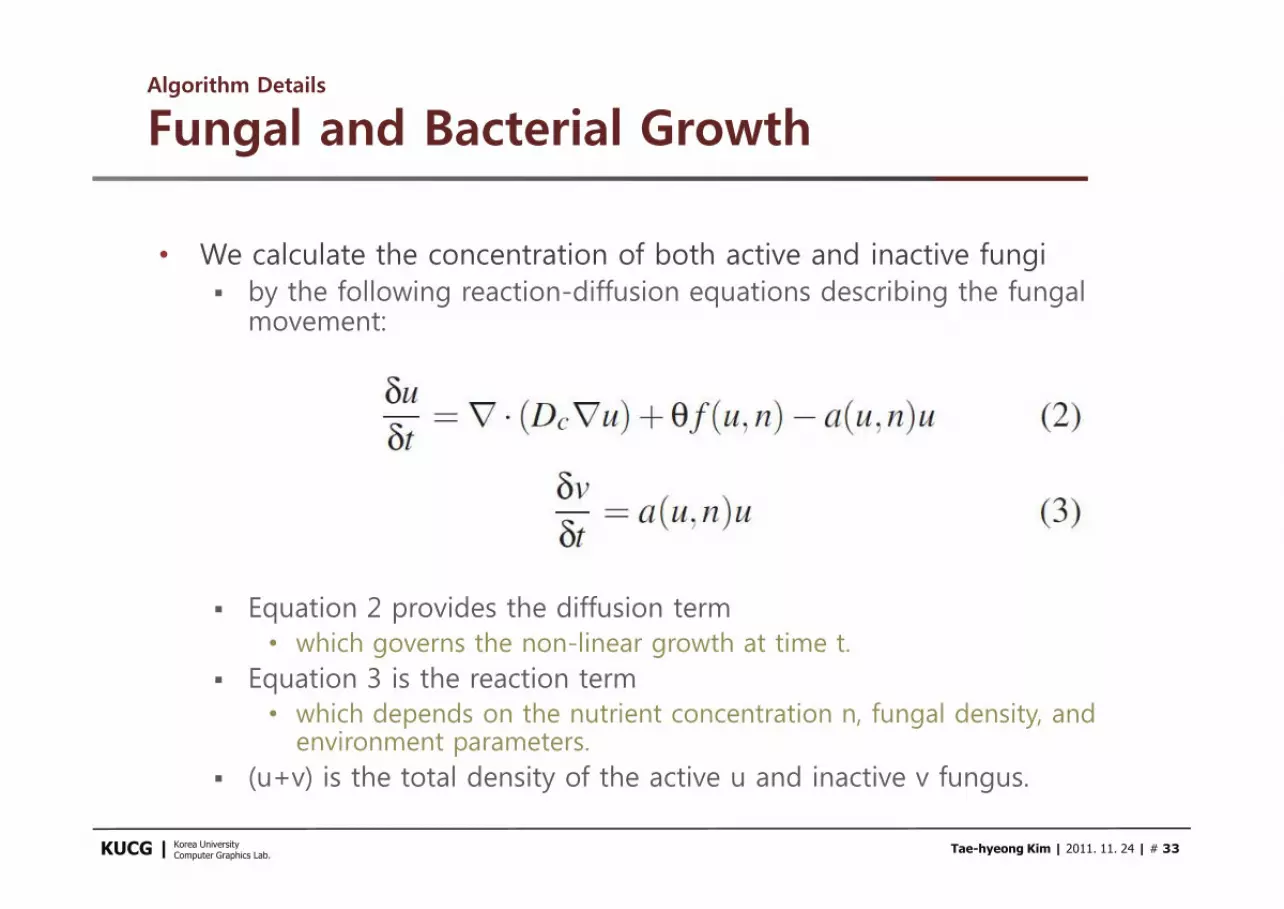
• We calculate the concentration of both active and inactive fungi § by the following reaction-diffusion equations describing the fungal
movement:
§ Equation 2 provides the diffusion term • which governs the non-linear growth at time t.
§ Equation 3 is the reaction term • which depends on the nutrient concentration n, fungal density, and
environment parameters. § (u+v) is the total density of the active u and inactive v fungus.
Algorithm Details
Fungal and Bacterial Growth
Korea UniversityComputer Graphics Lab. Tae-hyeong Kim | 2011. 11. 24 | # 33KUCG |
• We calculate the concentration of both active and inactive fungi § by the following reaction-diffusion equations describing the fungal
movement:
§ Equation 2 provides the diffusion term • which governs the non-linear growth at time t.
§ Equation 3 is the reaction term • which depends on the nutrient concentration n, fungal density, and
environment parameters. § (u+v) is the total density of the active u and inactive v fungus.

• The motility of active fungus is expressed by the diffusion coefficient Dc, which is defined by the logistic Equation 4.
§ d1, d2 > 0 are model parameters and is a scaling parameter.§ s = porosity+temp+humidity+waterContent
• produces the growth rate difference between the soft rot and fungal colonies, and between different species of fungus.
§ adds random movement to the diffusion coefficient
Algorithm Details
Fungal and Bacterial Growth
Korea UniversityComputer Graphics Lab. Tae-hyeong Kim | 2011. 11. 24 | # 34KUCG |
• The motility of active fungus is expressed by the diffusion coefficient Dc, which is defined by the logistic Equation 4.
§ d1, d2 > 0 are model parameters and is a scaling parameter.§ s = porosity+temp+humidity+waterContent
• produces the growth rate difference between the soft rot and fungal colonies, and between different species of fungus.
§ adds random movement to the diffusion coefficient

• Fungal growth depends heavily on the physical environment.
§ Relative humidity and temperature T,dampen Ddamp = norm(T + phi) the diffusion coefficient Dcexpressed in eq 6.
Algorithm Details
Fungal and Bacterial Growth
Korea UniversityComputer Graphics Lab. Tae-hyeong Kim | 2011. 11. 24 | # 35KUCG |
• Fungal growth depends heavily on the physical environment.
§ Relative humidity and temperature T,dampen Ddamp = norm(T + phi) the diffusion coefficient Dcexpressed in eq 6.

• We then use a Michaelis-Menten kinetic function (eq 7) to model the reaction kinetics of enzymes.
§ is the constant rate in which fungal proliferation connects to nutrient consumption.
§ f1, f2 are model parameters and is a scaling parameter.
Algorithm Details
Fungal and Bacterial Growth
Korea UniversityComputer Graphics Lab. Tae-hyeong Kim | 2011. 11. 24 | # 36KUCG |
• We then use a Michaelis-Menten kinetic function (eq 7) to model the reaction kinetics of enzymes.
§ is the constant rate in which fungal proliferation connects to nutrient consumption.
§ f1, f2 are model parameters and is a scaling parameter.

• Equation 2 transforms active fungus u to inactive fungus v.• Here we used Mimura’s formula (Equation 8).
§ Active fungus normally diffuses along the border while inactive fungus resides in the center.
§ a1, a2 are model parameters and is a scaling parameter.
Algorithm Details
Fungal and Bacterial Growth
Korea UniversityComputer Graphics Lab. Tae-hyeong Kim | 2011. 11. 24 | # 37KUCG |
• Equation 2 transforms active fungus u to inactive fungus v.• Here we used Mimura’s formula (Equation 8).
§ Active fungus normally diffuses along the border while inactive fungus resides in the center.
§ a1, a2 are model parameters and is a scaling parameter.

• We model the spread of bacterial colonies using the same formula. § The bacterial soft rot map guides the propagation of fungal
colonies.
• The fungi cannot propagate into areas unaffected by bacteria, § thus reflecting the notion that the growth of certain organisms on
the surface depends on existing infection.
Algorithm Details
Fungal and Bacterial Growth
Korea UniversityComputer Graphics Lab. Tae-hyeong Kim | 2011. 11. 24 | # 38KUCG |
• We model the spread of bacterial colonies using the same formula. § The bacterial soft rot map guides the propagation of fungal
colonies.
• The fungi cannot propagate into areas unaffected by bacteria, § thus reflecting the notion that the growth of certain organisms on
the surface depends on existing infection.

• Nutrients exist in a non-uniform random distribution § on the surface and substrate of the fruit.
• Nutrients deplete and do not allow fungus to remain active indefinitely.
• Nutrient transport is defined by Equation 9.
§ The nutrients are diffused by the term § and consumed by f(u,n). § Dn is the nutrient diffusion coefficient.
Algorithm Details
Fungal and Bacterial Growth
Korea UniversityComputer Graphics Lab. Tae-hyeong Kim | 2011. 11. 24 | # 39KUCG |
• Nutrients exist in a non-uniform random distribution § on the surface and substrate of the fruit.
• Nutrients deplete and do not allow fungus to remain active indefinitely.
• Nutrient transport is defined by Equation 9.
§ The nutrients are diffused by the term § and consumed by f(u,n). § Dn is the nutrient diffusion coefficient.

• Table 3 provides the initial model parameters of our simulation.• Our system provides default parameters for the most popular
types of mold growth. § However, our simulation method below can generalize to different
mold types by manipulating the input parameters.
Algorithm Details
Fungal and Bacterial Growth
Korea UniversityComputer Graphics Lab. Tae-hyeong Kim | 2011. 11. 24 | # 40KUCG |
Algorithm Details
Translation
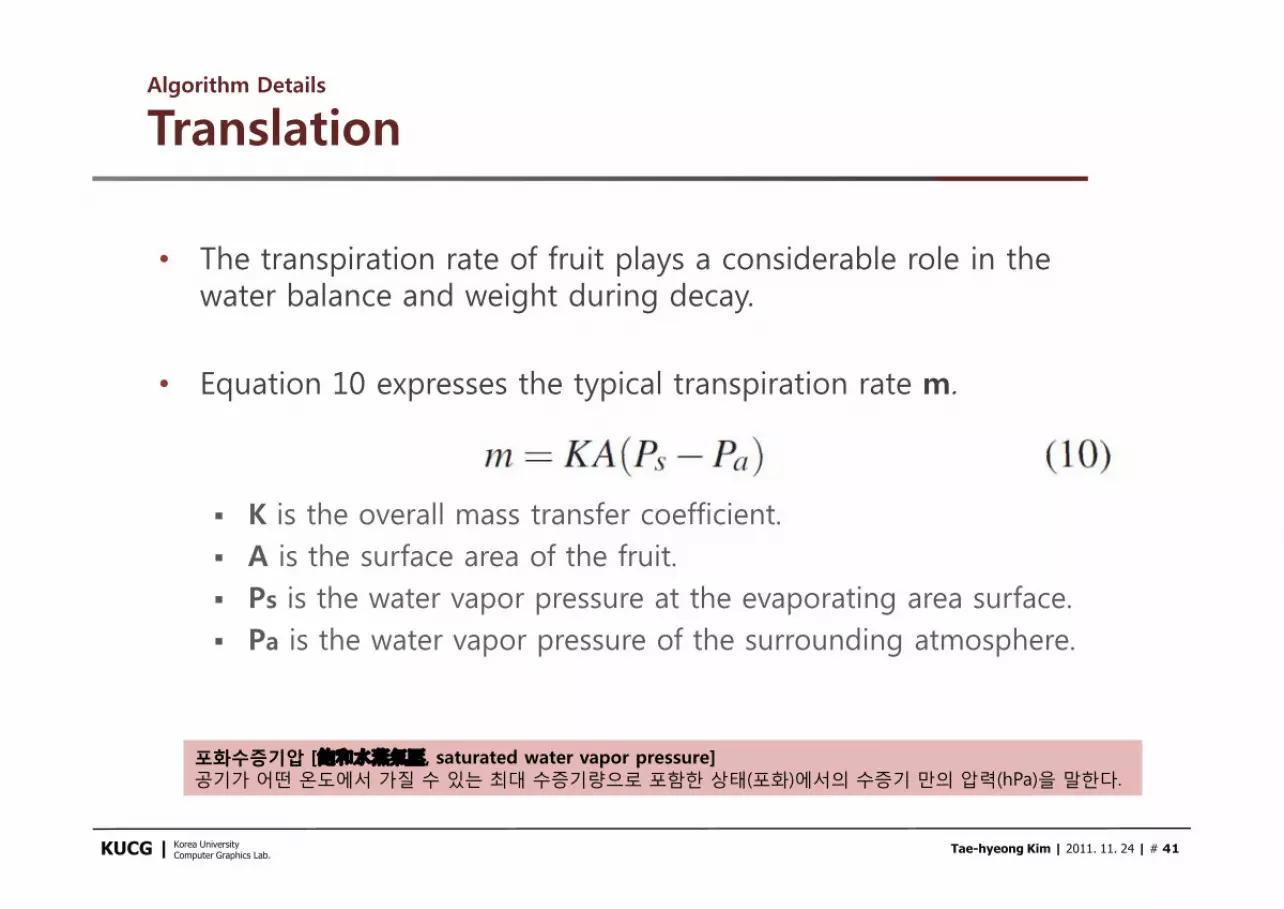
• The transpiration rate of fruit plays a considerable role in the water balance and weight during decay.
• Equation 10 expresses the typical transpiration rate m.
§ K is the overall mass transfer coefficient.§ A is the surface area of the fruit. § Ps is the water vapor pressure at the evaporating area surface. § Pa is the water vapor pressure of the surrounding atmosphere.
Korea UniversityComputer Graphics Lab. Tae-hyeong Kim | 2011. 11. 24 | # 41KUCG |
• The transpiration rate of fruit plays a considerable role in the water balance and weight during decay.
• Equation 10 expresses the typical transpiration rate m.
§ K is the overall mass transfer coefficient.§ A is the surface area of the fruit. § Ps is the water vapor pressure at the evaporating area surface. § Pa is the water vapor pressure of the surrounding atmosphere.
포화수증기압 [飽和水蒸氣壓, saturated water vapor pressure] 공기가
어떤
온도에서
가질
수
있는
최대
수증기량으로
포함한
상태(
포화)
에서의
수증기
만의
압력(hPa)
을
말한다.

Results
• We simulated our results on a 3.2GHz quad core Xeon processor with 4 GB of memory. § The deformable body and fungal growth codes were written in
C++. § Each time-step averaged around 10 seconds
• to compute the reaction-diffusion, transpiration, and deformable collapse, and to write the texture maps.
§ Rendering time was approximately 10 minutes per frame with our scene lighting.
Korea UniversityComputer Graphics Lab. Tae-hyeong Kim | 2011. 11. 24 | # 42KUCG |
• We simulated our results on a 3.2GHz quad core Xeon processor with 4 GB of memory. § The deformable body and fungal growth codes were written in
C++. § Each time-step averaged around 10 seconds
• to compute the reaction-diffusion, transpiration, and deformable collapse, and to write the texture maps.
§ Rendering time was approximately 10 minutes per frame with our scene lighting.

Results
• In this paper, we have provided final renders for three types of fruit: an apple, an orange, and a tomato.
Korea UniversityComputer Graphics Lab. Tae-hyeong Kim | 2011. 11. 24 | # 43KUCG |

Results
User Interface Tool
• We have designed and developed an authoring tool that integrates our simulation into a plug-in to Autodesk Maya 2010.
Korea UniversityComputer Graphics Lab. Tae-hyeong Kim | 2011. 11. 24 | # 44KUCG |

Results
True Life Comparison
• Every individual piece of fruit has its own unique decay since it will have some random variation and growth.
• However, our simulation produces similar decay patterns to the real data.
Korea UniversityComputer Graphics Lab. Tae-hyeong Kim | 2011. 11. 24 | # 45KUCG |
Results
Multiple Fruit
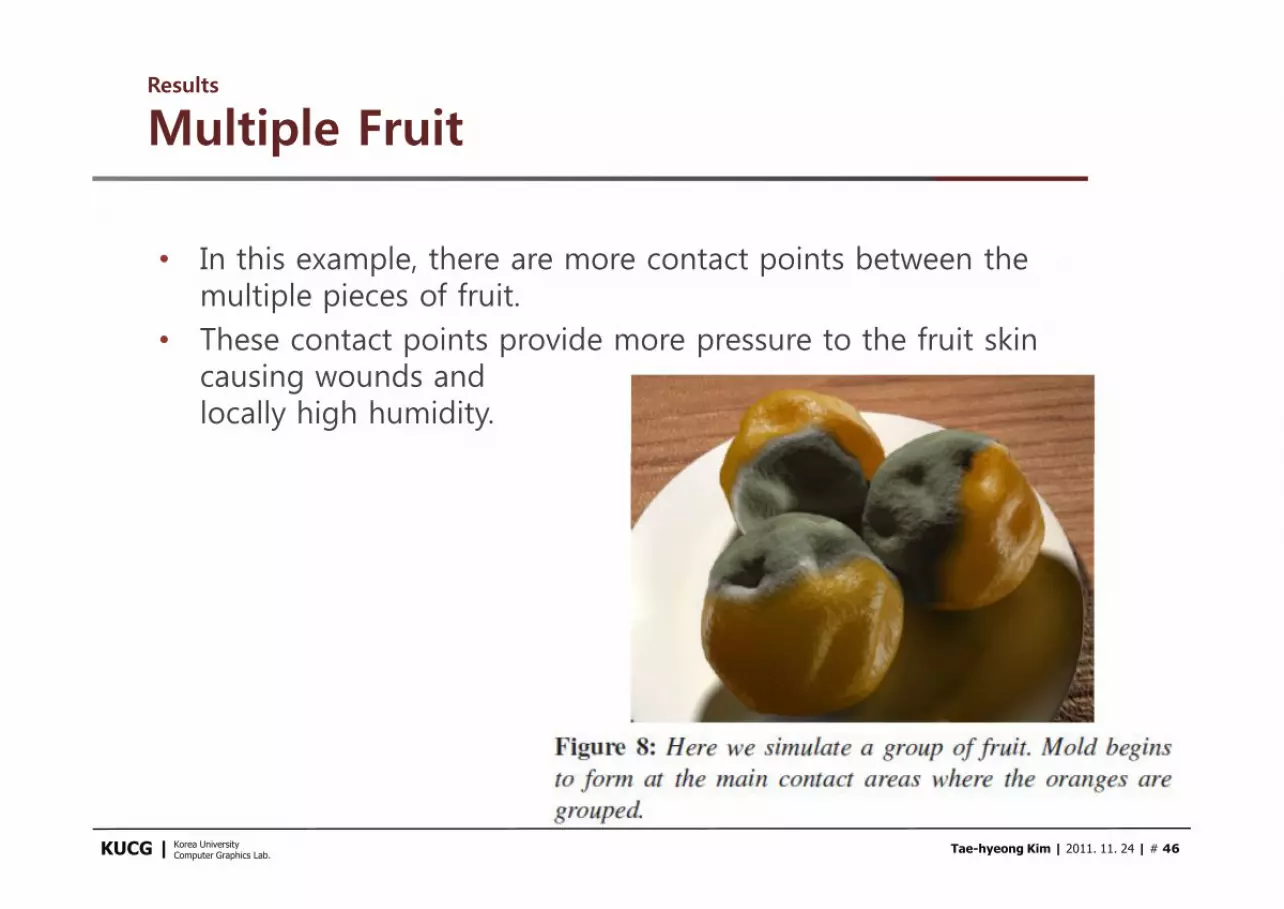
• In this example, there are more contact points between the multiple pieces of fruit.
• These contact points provide more pressure to the fruit skin causing wounds and locally high humidity.
Korea UniversityComputer Graphics Lab. Tae-hyeong Kim | 2011. 11. 24 | # 46KUCG |

Conclusions
• We describe a system for simulating fruit senescence and decay.§ Our approach is perceptually similar to real photographs and
time-lapse videos.
• We don’t consider if the fruit was sliced, § and we also do not take into account any liquid phase losses
from the fruit.§ Or the effects of macroscopic organisms such as worms or flies.
• In the future, we wish to extend our model to other growth and decay time-varying phenomena.§ Adding even more complex wrinkling and color changes are easy
extensions to our model.
Korea UniversityComputer Graphics Lab. Tae-hyeong Kim | 2011. 11. 24 | # 47KUCG |
• We describe a system for simulating fruit senescence and decay.§ Our approach is perceptually similar to real photographs and
time-lapse videos.
• We don’t consider if the fruit was sliced, § and we also do not take into account any liquid phase losses
from the fruit.§ Or the effects of macroscopic organisms such as worms or flies.
• In the future, we wish to extend our model to other growth and decay time-varying phenomena.§ Adding even more complex wrinkling and color changes are easy
extensions to our model.