from the sun to the outer heliosphere: modeling and analyses of the interplanetary propagation of...
TRANSCRIPT

From the Sun to the outer heliosphere: Modeling and analyses of the
interplanetary propagation of the October//November (Halloween)
2003 solar events
Devrie S. Intriligator,1 Wei Sun,2 Murray Dryer,3,4 Craig D. ‘‘Ghee’’ Fry,4 Charles Deehr,2
and James Intriligator1,5
Received 30 November 2004; revised 19 May 2005; accepted 8 June 2005; published 30 September 2005.
[1] We use the space weather validated 3-D HAFv2 model to help us study theinterplanetary propagation of the October/November 2003 solar eruptions from the Sun to>90 AU and over a wide range of heliolongitudes and heliolatitudes. The HAFv2model predictions at ACE (1 AU), Ulysses (5.23 AU), Cassini (8.67 AU), Voyager 2(73 AU), and Voyager 1 (93 AU) are compared with available data. These comparisonsindicate the importance of asymmetric interplanetary propagation both in heliolongitudeand heliolatitude. We recommend that these effects explicitly be taken into account.The HAFv2 results appear to be useful for interpreting the Voyager 2 and Voyager 1energetic particle data in the outer heliosphere. They are consistent with the effects of theHalloween solar events observed in the energetic particle data at both spacecraft. TheHAFv2 results also may be helpful for predicting the plasma wave 2–3 kHz radioemission previously associated with large shocks and their interaction with the heliopause.Our study indicates that the Halloween events may give rise to 2–3 kHz radio emissionin early 2005, assuming that the shocks which propagated beyond Voyager 1 will bestrong enough.
Citation: Intriligator, D. S., W. Sun, M. Dryer, C. D. Fry, C. Deehr, and J. Intriligator (2005), From the Sun to the outer heliosphere:
Modeling and analyses of the interplanetary propagation of the October/November (Halloween) 2003 solar events, J. Geophys. Res.,
110, A09S10, doi:10.1029/2004JA010939.
1. Introduction
[2] We believe it is time for researchers in our field tomove on to three-dimensional (3-D) time-dependent modelsfor studying solar wind propagation to the outerheliosphere. To date most of the modeling to the outerheliosphere of interplanetary events arising from solardisturbances has been time-dependent 1-D MHD [Zanket al., 2001; Richardson et al., 2005]. In the work ofIntriligator et al. [2004], we successfully experimented usingthe time-dependent HAFv2 (Hakamada - Akasofu - Fryversion 2) model [Fry et al., 2001, 2003; Sun et al., 2003],which is a 3-D kinematic model, for the November 2001 andApril 2002 events. This modeling led to important insightsabout the outer heliosphere in 2002 and placed the differencesin the energetic particle observations from Voyager 1 andVoyager 2 in this context so that they could be moremeaningfully interpreted.
[3] In the present paper we use the HAFv2 model againas a first step toward providing a benchmarking approachfor simulating solar wind parameters and studying thepropagation of the October/November (Halloween) 2003solar events from the Sun to a number of locations inheliocentric distance, longitude, and latitude throughoutthe heliosphere. The October/November 2003 solar eventswere unusual and present more of a challenge for modelingthan the earlier events we studied. Some of the resultsindicate that this first benchmarking effort is far fromperfect, sometimes in the outer heliosphere there are largeerrors, but given the complexity of the problem and theinsights gained from these initial forays, we believe thatthese initial results deserve wider consideration. Examplesof insights gained include the arrival of two sets of twoshocks each at Voyager 2. The earlier shock set arrived inFebruary/March 2004 and may be associated with the4 November 2003 fast west limb (S19W83) X40 shock.The second pair of shocks arrived at Voyager 2 in April2004, and the longer duration 28 April 2004 shock eventwas associated with significant energetic particle effects.[4] We are aware of and emphasize the limitations and the
shortcomings of our approach, but we believe that theirpresentation may lead to new insights and that they alsorepresent a yardstick by which the future progress in thisarea can be measured. Rather than hiding the errors, wewant to advertise where the model does well and where it
JOURNAL OF GEOPHYSICAL RESEARCH, VOL. 110, A09S10, doi:10.1029/2004JA010939, 2005
1Carmel Research Center, Santa Monica, California, USA.2Geophysical Institute, University of Alaska, Fairbanks, Alaska, USA.3NOAA Space Environment Center, Boulder, Colorado, USA.4Exploration Physics International, Inc., Huntsville, Alabama, USA.5University of Wales, Bangor, Wales, UK.
Copyright 2005 by the American Geophysical Union.0148-0227/05/2004JA010939
A09S10 1 of 11

does not. Often these very errors can be the most importantresults for future research leading to new insights in thephysics of the problem, new constraints on models, and anew focus on why the model does well on some events andnot on others.[5] Large solar events have occurred during the descend-
ing phase of the solar cycle. The August 1972 events[Intriligator, 1976] are an example of this phenomenon asare the October/November 2003 events currently understudy. These two sets of events also yielded the two highestsolar wind speeds measured in situ [Skoug et al., 2004]. Inthe latter case, we emphasize the asymmetry of the Voyager1 and Voyager 2 locations (respectively, 34� north of theecliptic plane and 149� east of Earth when projected ontothe ecliptic and 24� south and 106� east of Earth) withrespect to the three flaring active regions that ranged from,at most, N08 to S21. The implication of this statement isthat peak propagating shock strengths would be expected tobe directionally biased in latitude toward Voyager 2.[6] We find that the three-dimensional HAFv2 model
provides a reasonable first step benchmarking approachfor simulating the solar wind parameters throughout a widerange of heliospheric distances (from the Sun to 92 AU),over a wide range of heliographic longitudes (from HGI(Heliographic inertial coordinate system (NSSDC)) 25� to320�), and over a wide range of heliographic latitudes (from�24� to +34�). In addition, we find that the HAFv2 modelresults may help us to understand other heliospheric obser-vations and phenomena including the Voyager 1 and Voy-ager 2 energetic particle and plasma wave measurements.[7] We discuss the HAFv2 model and our previous study
of the outer heliosphere briefly in section 2. The well-known solar events of the October–November 2003 arethen invoked as the background for the present study insection 3. We then offer a prediction for plasma wave
heliosheath activity in section 4 followed by our conclu-sions in section 5.
2. HAFv2 Solar Wind Model
[8] Numerous papers have been published on theHAFv2 model, e.g., Fry et al. [2001, 2002, 2003, 2004,2005], Dryer et al. [2001, 2004], Sun et al. [2002a, 2002b,2003], Smith et al. [2004, 2005], McKenna-Lawlor et al.[2002, 2005], Intriligator et al. [2004], and Veselovsky et al.[2004]. The three-dimensional HAFv2 kinematic modelprojects radial solar wind flow from inhomogeneous sour-ces on a surface at 2.5 solar radii out into space whileadjusting the flow for stream-stream interactions as faststreams overtake slower ones. The stream-stream interactionprocedure is described in great detail by Olmstead andAkasofu [1985] and Fry and Akasofu [1987]. Stream-streaminteractions are handled in a manner that mimics the netresult of the collisionless interactions of solar wind plasmaand fields. This procedure accounts for magnetic fluxconservation; the frozen field condition; and the formation,interaction, and evolution of high and low speed streams.This process includes compression and rarefaction, devel-opment of corotating interaction regions, and propagation ofCMEs (excluding the flux rope type) and interplanetaryshocks. The details of the modified kinematic procedure arethoroughly presented by Hakamada and Akasofu [1982].While MHD solutions integrate the equations of motion toobtain velocity, the kinematic model begins with the equa-tions integrated twice to obtain the fluid parcel positions.The velocity then comes from dx/dt. Preevent, nonhomo-geneous 3-D solar wind conditions (radial velocities andIMF magnitudes and initial radial components) are initial-ized from daily-available (from NOAA/SEC) solar magne-tograms and their use via the empirical methods given in the
Table 1. October/November (‘‘Halloween’’) 2003 Solar Events and HAFv2 Model Inputsa
NNNN YYYYMMDD HHMM Latitude Longitude Vs Tau Optical X-Ray
0507 20031019 1650 N05 E56 625 0120 XXX X1.10508 20031021 0347 S10 E90 1058 0040 SF C7.80509 20031022 0938 S02 E22 650 0300 XX M1.70510 20031023 0827 S21 E88 967 0130 1B X5.40511 20031025 0415 S15 E43 316 0200 2N M1.20512 20031026 0617 S18 E44 1500 0300 3N X1.20513 20031026 1735 N05 W38 1700 0330 2N X1.20514 20031028 1102 S16 E08 3200 0300 XX X17.20515 20031029 2044 S15 W02 2700 0130 2B X10.00516 20031101 2234 S12 W60 400 0100 1N M3.30517 20031102 1714 S14 W56 2000 0100 2B X8.30518 20031103 0124 N10 W83 1600 0145 2B X2.70519 20031103 0956 N08 W77 1100 0130 2F X3.90520 20031104 1943 S19 W83 2380 0130 3B X400521 20031111 1335 S03 W61 492 0300 SF M1.60522 20031113 0924 N01 E90 1100 0300 XX M1.40523 20031117 0917 S01 E33 1100 0200 1N M4.20524 20031118 0747 N00 E18 950 0300 2N M3.20525 20031120 0747 N01 W08 900 0045 2B M9.6aFrom Dryer et al. [2004] with the exception of Vs that were modified (see below). The first column lists the ‘‘Fearless Forecast’’ numbers (NNNN) used
sequentially in real time by these authors since 1997. The date (YYYYMMDD) and time (HHMM) refer to the metric type II start time that is usually closeto the soft x-ray maximum time at 1-8A. The source locations are given in latitude and longitude relative to the central meridian of Earth. The HAFv2model’s shock speed input (Vs in km/s) at the Sun is based on heuristic consideration of real-time radio and halo/partial halo CME plane-of-sky speedestimates (FF#520, FF#522, and FF#524) in real time [Dryer et al., 2004; Smith et al., 2004, 2005] and an ex post facto fine tuning (FF#512-FF#519, andFF#523) to achieve improved actual shock arrivals at L1 (Figure 1). Tau values refer to the assumed piston driving time of the coronal shocks above theflare site in hours and minutes. The shape of the shock thereafter is determined by the HAFv2 simulation, not by any assumed cone angle. The optical andx-ray classifications of the events also are listed.
A09S10 INTRILIGATOR ET AL.: INTERPLANETARY PROPAGATION
2 of 11
A09S10
references provided by Fry et al. [2003]. The model hasbeen calibrated with 1-D ideal MHD solutions [Sun et al.,1985] and, even more importantly, with multipoint space-craft observations [e.g., Intriligator et al., 2004].[9] In the present paper the HAFv2 model results are
based on the solar inputs as shown in Table 1. The valuesin Table 1 are the only free parameters in the HAFv2model. Table 1 lists the input conditions for the 19 flaresand CMEs during the October/November 2003 series ofevents from active regions 484, 486, and 488. It is basedon the real-time predictions for shock arrivals at L1described by Dryer et al. [2004]. The present Table 1differs from their Table 1 in that the input shock speedsin our table have been tuned to allow for a morefavorable shock arrival time comparison with the ACEobservations as shown in Figure 1. This tuning for ACEshock arrival times is the only procedure that is employedwith the use of free parameters in this paper.[10] Since the HAFv2 model is usually used [Fry et al.,
2003; Dryer et al., 2004] at heliocentric distances within10 AU, it does not take into account the effects of pickupions. These effects generally lead to a �10% slowing of thesolar wind [Wang et al., 2000]. Our comparisons betweenthe HAFv2 model, the Voyager 2 plasma and magnetic fielddata, and the Voyager 1 magnetic field data (there has beenno operational plasma probe on Voyager 1 since 1981)indicate that this �10% correction due to pickup ionsappears to be on average correct. As a next step inimproving our modeling, we plan to compare the HAFv2results with full 3-D MHD results (T. R. Detman et al., A
hybrid heliospheric modeling system, I. Backgroundsolar wind, submitted to Journal of Geophysical Research,2005 (hereinafter referred to as Detman et al., submittedmanuscript, 2005)). Following that we hope to also explic-itly include the effects of pickup ions.[11] In the work of Intriligator et al. [2004] we used
the 3-D HAFv2 model for studying the propagation throughthe heliosphere to Voyager 2 (at 67 AU) and to Voyager 1(at 85 AU) of the November 2001 solar events and theMarch/April 2002 solar events. We compared the HAFv2predictions with Voyager 1 and Voyager 2 data and withthe predictions of the 1-D models [Wang et al., 2000;Richardson et al., 2003]. The HAFv2 results showed thatboth the November 2001 events and the March/April 2002events propagated asymmetrically in both longitudeand latitude through the heliosphere. We suggested thatVoyager 1 and Voyager 2 observed different effects of theasymmetric propagation of solar events to the outerheliosphere and that these different effects, rather thanonly the crossing or approach of the termination shock byVoyager 1, may have contributed to the differences(during 2002.6–2003.1: August 2002 to February 2003) inthe Voyager 1 and Voyager 2 energetic particle observations[Krimigis et al., 2003; McDonald et al., 2003; Burlaga etal., 2003].
3. HAFv2 Comparisons at ACE, Ulysses, Cassini,Voyager 2, and Voyager 1
3.1. Introduction
[12] As noted in section 2, solar flare events are approx-imated during the Halloween 2003 epoch and initiated at theSun with initialization tuned only by shock arrival times atACE. This is the only tuning that was done. No other tuningwas done at any other locations, and no other tuning wasdone for any other parameters at ACE. There are no otherfree parameters. The shock shape is determined by a presetinternal algorithm in HAFv2 and is not adjusted for betterresults with respect to observations at other spacecraft.The HAFv2 model then simulates, with no further inputs,the ICMEs that propagate throughout the inner and outerheliosphere. We will discuss below the simulated resultswith available observations, in appropriate helioradialsequence, at ACE, Ulysses, Cassini, Voyager 2, andVoyager 1.
3.2. ACE
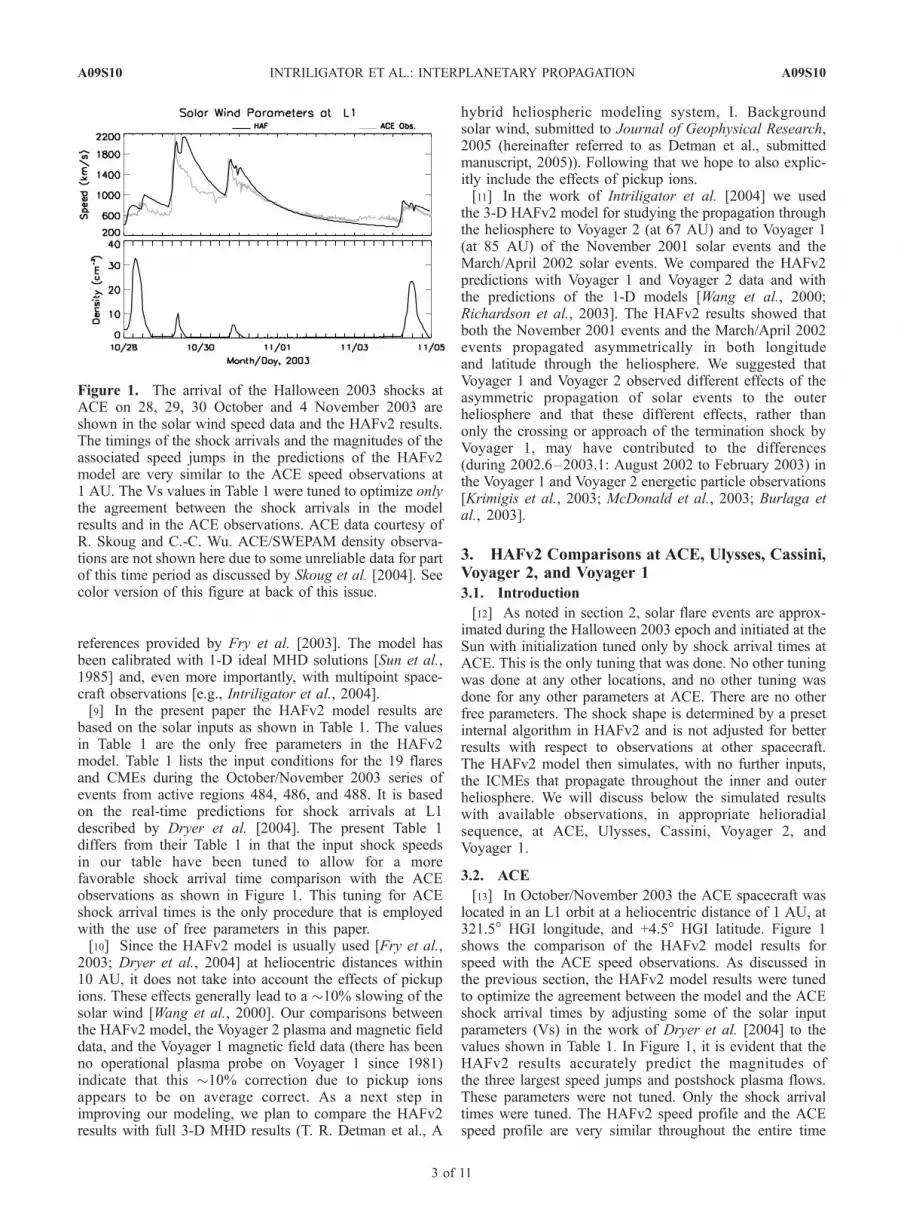
[13] In October/November 2003 the ACE spacecraft waslocated in an L1 orbit at a heliocentric distance of 1 AU, at321.5� HGI longitude, and +4.5� HGI latitude. Figure 1shows the comparison of the HAFv2 model results forspeed with the ACE speed observations. As discussed inthe previous section, the HAFv2 model results were tunedto optimize the agreement between the model and the ACEshock arrival times by adjusting some of the solar inputparameters (Vs) in the work of Dryer et al. [2004] to thevalues shown in Table 1. In Figure 1, it is evident that theHAFv2 results accurately predict the magnitudes ofthe three largest speed jumps and postshock plasma flows.These parameters were not tuned. Only the shock arrivaltimes were tuned. The HAFv2 speed profile and the ACEspeed profile are very similar throughout the entire time
Figure 1. The arrival of the Halloween 2003 shocks atACE on 28, 29, 30 October and 4 November 2003 areshown in the solar wind speed data and the HAFv2 results.The timings of the shock arrivals and the magnitudes of theassociated speed jumps in the predictions of the HAFv2model are very similar to the ACE speed observations at1 AU. The Vs values in Table 1 were tuned to optimize onlythe agreement between the shock arrivals in the modelresults and in the ACE observations. ACE data courtesy ofR. Skoug and C.-C. Wu. ACE/SWEPAM density observa-tions are not shown here due to some unreliable data for partof this time period as discussed by Skoug et al. [2004]. Seecolor version of this figure at back of this issue.
A09S10 INTRILIGATOR ET AL.: INTERPLANETARY PROPAGATION
3 of 11
A09S10

interval shown. The HAFv2 model predictions for solarwind plasma density also are shown.
3.3. Ulysses
[14] Figure 2 shows at Ulysses (at a heliocentric distanceof 5.23 AU, HGI longitude of 80�, and HGI latitude of+5.8�) the comparisons between the HAFv2 model predic-tions and the in situ observations of the solar wind speedand density for the Halloween events. The agreementbetween the model and the observations is quite good interms of the range of magnitudes of the speed and densityand in terms of the relative timings of the jumps. TheHAFv2 model predictions of the shocks lead those observedas reported by Richardson et al. [2005] and Lario et al.[2005]. The 6 November 2003 shock is predicted to arriveon 5 November 2003; the 7 November 2003 shock ispredicted to arrive on 6 November 2003; and so on. Bythe end of the series of stream-stream interactions theHAFv2 model predicts the higher speeds occurring 2–3 days earlier than observed. However, the HAFv2 pre-dicted magnitudes of the associated speed jumps are quiteaccurate. Thus, even though Ulysses and ACE are separatedby more than 4 AU and by >90� in longitude, the HAFv2predictions at Ulysses are accurate within a few days andthe overall envelope of the predicted speed magnitudesat Ulysses quite accurately reflects the observations.In contrast, the 1-D MHD results of Richardson et al.[2005], which used 1 AU data at Earth as input to their1-D model, had to be shifted 8 days forward in time tomore closely coincide with the shock arrival times atUlysses. Despite this adjustment, their envelope of thepredicted speed magnitudes did not agree well with theUlysses measurements. This again emphasizes the impor-tance of 3-D modeling.[15] The HAFv2 model results can provide additional
insights into the interplanetary propagation of the solar
events. Figure 3 shows on 6 November 2003 an eclipticplane projection in HGI coordinates of the configuration ofthe interplanetary magnetic field (IMF) after several days ofpropagation of the events using the HAFv2 model [Fry etal., 2003; Intriligator et al., 2004]. In Figure 3 the outer-most shock front near 90� has reached Ulysses as alsoshown in the time line plot of Figure 2. The small black dotin the 270�–0� quadrant indicates the location of Earth andthe ACE spacecraft. Further inspection of Figure 3 indicatesthat the outermost shock fronts are propagating asymmetri-cally faster in the lower half of the figure (180�–270�–0�)than in the upper half. The simulation also indicates the highprobability that, for a given ICME, the western flank of theshock can hit Ulysses while its eastern flank can hit Earth.In the case of FF#520, the large west limb event (X40 fromS19W83) on 4 November 2003, and the inner shock frontsin Figure 3 show the FF#520 event propagating asymmet-
Figure 2. HAFv2 predictions and solar wind observationsat Ulysses of the Halloween events. The generallyconsistent agreement in the speed profiles of the HAFv2predictions of the arrival times of the shocks and themagnitudes of their associated jumps with the solar windmeasurements provides validation of the HAFv2 model atUlysses. No model shifting is necessary. See color versionof this figure at back of this issue.
Figure 3. HAFv2 results on 6 November 2003 showingthe asymmetric interplanetary propagation of the October/November 2003 solar eruptions. Ecliptic plane projection ofIMF lines in heliographic inertial coordinates shows thelongitudinal distribution. The curved blue/dark (red/light)lines show the IMF toward (away) sectors. The results showthe distortions of the IMF lines from the spiral fieldconfiguration. The Sun is at the origin of the X axis. Theradius extends to 10 AU. The small black dot at �320�indicates the location of Earth and ACE. The positions ofUlysses and Cassini also are shown. Near 90� the outermostshock has reached Ulysses. At this time this innermostshock, which we associate with FF#520, is barely extendinginto the 180�–270� quadrant. This shock propagates laterinto this quadrant. Eventually, as a result of its originalstrength and ability to be refracted completely around theSun, it reaches Voyager 2 as shown in Figures 8 and 9. Seecolor version of this figure at back of this issue.
A09S10 INTRILIGATOR ET AL.: INTERPLANETARY PROPAGATION
4 of 11
A09S10

rically toward Ulysses and Cassini in the 0�–90� quadrant.At Earth, in the 270�–0� quadrant, a shock was recorded,but Earth was spared the brunt of the event.[16] In the 180�–270� quadrant, the inner shock front is
barely extending into this region. The inner shock continuesto refract around the Sun, however, propagating farther out,and extends more into this quadrant. By 16 February 2004(see Figure 9) it is approaching Voyager 2. As discussedbelow, we believe this inner shock may have reachedVoyager 2 on 15 March 2004 (see Figure 8).
3.4. Cassini
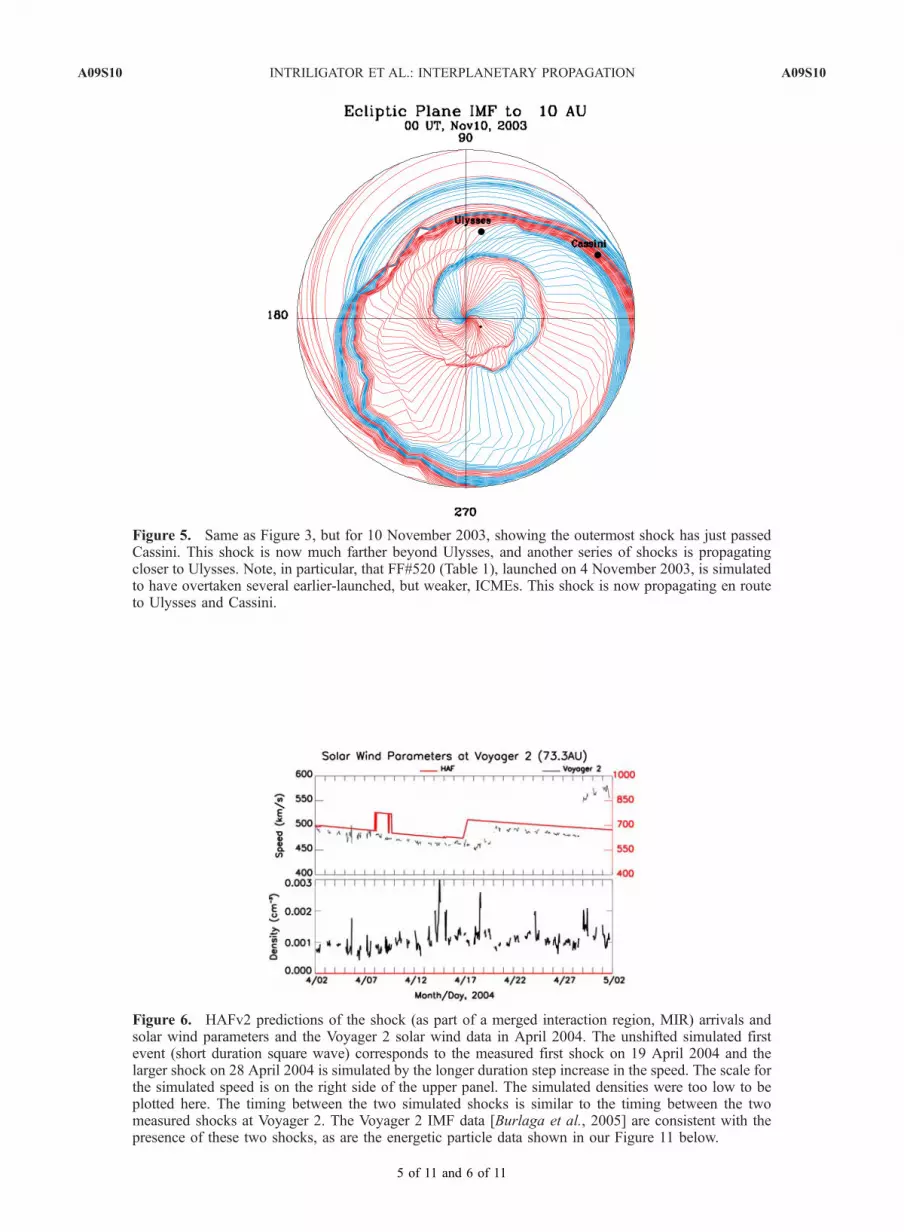
[17] The Cassini spacecraft (at a heliocentric distance of8.67 AU, a HGI longitude of 25.8�, and HG latitude of�3.5�) was en route to Saturn in November 2003. Unfor-tunately, no in situ solar wind plasma observations weremade on Cassini. The arrival times at Cassini of two shocksfrom the Halloween events were observed in the magneticfield and energetic particle measurements [Lario et al.,2005], as indicated by the two vertical lines in Figure 4.These observed shock arrival times are in reasonably goodagreement with the HAFv2 predictions shown in Figure 4.Each of the two large modeled shocks arrives �2 daysbefore the observed shock arrives. Thus the time intervalbetween the two large modeled shocks is similar to the timeinterval between the two observed large shocks. Theseresults are in good agreement with the HAFv2 modelresults in Figure 5 showing the ecliptic plane projection on10 November 2003 in the vicinity of Cassini. In Figure 5the outermost shock has recently passed Cassini andcontinues to propagate to greater heliocentric distances.Figure 5 also indicates that the outermost shock haspropagated beyond Ulysses. The leading edge of the other
series of interplanetary events (probably FF#520) approach-ing Ulysses is also indicated in Figure 5.
3.5. Voyager 2
[18] Richardson et al. [2005] report that the shock(merged interaction region, MIR) from the Halloween eventarrived at Voyager 2 (at 73.2 AU, 215.3� HGI longitude,and �25.2� HG latitude) in late April 2004. The arrivaloccurred during a data gap in the solar wind plasma data on�28 April. Since the HAFv2 model does not include theeffects of pickup ions it is anticipated that the HAFv2prediction of the shock arrival time could be 10–14%earlier than the observed arrival time. Figure 6 displaysthe HAFv2 model predictions and the solar wind data inApril 2004. The predicted shock arrival time is earlier thanobserved, in agreement with our expectations. A closeinspection of the model predictions and the solar wind datain Figure 6 indicates that there are two predicted eventarrivals shown in the speed and, also, two observed shocksshown in the speed. In addition to the larger shock thatoccurred during the data gap on �28 April, there appears tobe this smaller shock observed on �19 April. The HAFv2model predicts the arrival of a longer duration MIR on�17 April and of a shorter duration event on �8 April.Magnetic and plasma data presented by Burlaga et al. [2005]support this point despite their omission of mentioning the
Figure 4. HAFv2 predictions of solar wind parameters atthe Cassini spacecraft. There are no in situ solar windplasma data available from Cassini. Two shocks (see text),as indicated by the two vertical lines, were observed atCassini: the first late on 10 November, and the second on16 November 2003. The time interval between theseshocks is in good agreement with the HAFv2 predictionsshown above, though the HAFv2 model predicts they willarrive �2 days earlier than observed. See color version ofthis figure at back of this issue.
Figure 5. Same as Figure 3, but for 10 November 2003,showing the outermost shock has just passed Cassini. Thisshock is now much farther beyond Ulysses, and anotherseries of shocks is propagating closer to Ulysses. Note, inparticular, that FF#520 (Table 1), launched on 4 November2003, is simulated to have overtaken several earlier-launched, but weaker, ICMEs. This shock is now propagat-ing en route to Ulysses and Cassini. See color version ofthis figure at back of this issue.
A09S10 INTRILIGATOR ET AL.: INTERPLANETARY PROPAGATION
5 of 11
A09S10

first shock on DOY 110 (April 19). The decrease in intensityin the >70 MeV/nucleon CRS data in the work of Burlaga etal. [2005] and in our Figure 11 below are consistent with thearrival of this earlier shock on 19 April at Voyager 2. Thetime interval (�9 days) between the arrival times of the twoshocks in the HAFv2 simulation is about the same as thatbetween the two shocks observed by Voyager 2. The trend inthe speed profile for the longer duration shock in the HAFv2simulation is similar to that observed for the larger shock.Thus, while the magnitudes of the simulated speed anddensity and the exact time of arrival of the two events arenot precise in the HAFv2 model simulations, the arrival ofthe two shocks, the time interval between them, and the trendin the speed profile for the larger shock are all as suggestedby the HAFv2 simulation. Overall, our simulation only canbe indicative of the result that should be expected from afully 3-D MHDmodel with the incorporation of pickup ions.[19] Richardson et al. [2005] used their 1-D MHD model,
which includes the effects of pickup ions, to predict theHalloween shocks’ arrival at Voyager 2. The differencebetween the Richardson et al. [2005] model predictedarrival time at Voyager 2 and the actual observed arrivaltime was about 14 days. Owing to an ambiguity in theirpaper, it is not clear whether they predicted a 14-day earlieror a 14-day later arrival than that observed. Richardson etal.’s [2005] Figure 6 caption says ‘‘model profiles are time-shifted back 14 days,’’ but in the text (paragraph 11) theynote that ‘‘The model results are time-shifted forward14 days to match the arrival of the first [28 April, DOY
119] shock’’. This need for a 14-day time shift, generally, isto be expected since their 1-D model, with input at L1,implicitly assumes spherical expansion even though thereare large differences in heliolongitude (106�) and in helio-latitude (�30�).[20] Figure 7 shows the HAFv2 model results for the
ecliptic plane plot of the IMF out to 100 AU on 19 April2004. Figure 7 is similar in format to Figures 3 and 5, but inthe case of Figure 7 the radius extends out to 100 AU. It isevident in Figure 7 that the large broad simulated shockfront has recently gone beyond the heliocentric distance ofVoyager 2. Presumably this shock front contains the smallerduration shock observed at Voyager 2 on 19 April 2004 andthe longer duration merged shock observed at Voyager 2 on28 April 2004. Figure 11 below also shows the effects ofthese shocks in the Voyager 2 energetic particle data. The28 April 2004 shock was a prolific source of low energyparticles (e.g., 2–3 MeV H+) and also strongly modulatedthe >70 MeV/nucleon galactic cosmic rays. In contrast, theearlier shock (19 April 2004) slightly modulated the galacticcosmic rays as evidenced by the dip in the Voyager 2intensity of the >70 MeV/nucleon ions at that time, asdiscussed midway in paragraph 18. Figure 7 also indicatesthat this shock front has not yet reached the heliocentricdistance of Voyager 1 at its longitude, but at Voyager 2’s
Figure 6. HAFv2 predictions of the shock (as part of amerged interaction region, MIR) arrivals and solar windparameters and the Voyager 2 solar wind data in April 2004.The unshifted simulated first event (short duration squarewave) corresponds to the measured first shock on 19 April2004 and the larger shock on 28 April 2004 is simulated bythe longer duration step increase in the speed. The scalefor the simulated speed is on the right side of the upperpanel. The simulated densities were too low to be plottedhere. The timing between the two simulated shocks issimilar to the timing between the two measured shocks atVoyager 2. The Voyager 2 IMF data [Burlaga et al., 2005]are consistent with the presence of these two shocks, as arethe energetic particle data shown in our Figure 11 below.See color version of this figure at back of this issue.
Figure 7. Same as Figures 3 and 5, but showing theHAFv2 model predictions for the IMF ecliptic planeconfiguration out to 100 AU on 19 April 2004. Thelocations of Voyager 2 and Voyager 1 are shown. The figureindicates that a broad shock (MIR) associated with theHalloween 2003 events recently passed the location ofVoyager 2. We associate this broad MIR with the 19 and28 April 2004 shocks shown in Figure 6. An additionalMIR, perhaps associated with the speed peak in May(Figure 11), is approaching Voyager 2. See color versionof this figure at back of this issue.
A09S10 INTRILIGATOR ET AL.: INTERPLANETARY PROPAGATION
6 of 11
A09S10

longitude the shock front has propagated faster and fartherand has passed Voyager 1’s heliocentric distance. Figure 7also indicates that an additional shock front is approachingVoyager 2. The reader is reminded that the solar flare eventsare probably stronger below the ecliptic plane near the S25latitude of Voyager 2, whereas Voyager 1 is at N34. Thus, inFigure 7, foreshortening of the strongest part of the shock’sleading edge below the ecliptic appears to be closer toVoyager 1 than it is in reality, assuming the model’s result isgenerally correct.[21] The HAFv2 model also provides some additional
insights on the propagation of the shocks to the outerheliosphere from the October/November 2003 solar erup-tions. The HAFv2 model predicts the arrival of earliershocks in February 2004 at Voyager 2 at 73 AU, as shownin Figure 8. In Figure 8 on �3 February, the HAFv2 modelpredicts a small speed increase accompanied by a largedensity increase. The solar wind observations in speedin Figure 8 appear to indicate the arrival of a shock on4 February. The density data show an accompanyingincrease in density. We thus associate the predictedsmall shock of 3 February with the measured small shockof 4 February. This possible association is surprising inview of the expected effects of pickup ions causing theslowdown of the background solar wind and of the prop-agation of shocks [Wang et al., 2000] that are not consid-ered here. However, in view of many other uncertainties(e.g., preevent background inhomogeneties based on limitedsolar source inputs, temporal shock interactions with oneanother, etc.), we cannot definitively ascertain at this time
which, if any, or all, these effects can mask any kind ofaverage shock estimates. We speculate, however, that thewestern flank of the FF#520 fast west limb shock (gener-ated on 4 November 2003) participated in the solar windplasma’s acceleration.[22] The HAFv2 predictions in the speed plot in Figure 8
show that the larger shock front arrives at Voyager 2�21 February 2004. We believe that the 15 March shockobserved on Voyager 2 may correspond to the simulatedone shown on 21 February. The Voyager 2 solar wind speedand density data for 15 March show the arrival of a shockduring a data gap with the speed increasing from �470 to490 km/s with an accompanying increase in density. Themagnetic field data [Burlaga et al., 2005] also show a peakin the IMF magnitude at this time. We believe it is possiblethat this early arriving shock is associated with FF#520, thefast west limb event that occurred on 4 November 2003.This event propagated to Cassini with an average transitspeed of 2500 km/s [Russell et al., 2004]. Its arrival atVoyager 2 on 15 March implies an average transit speed of�950 km/s between the Sun and Voyager 2. As indicated inTable 1, FF#520 occurred at S19�, and Voyager 2 at thistime was at �S25� quite close to the latitude of the solarevent. The early arrival (21 February 2004) of the HAFv2shock is consistent with our expectations, as discussedabove, since the effects of slowing due to pickup ions are
Figure 9. Same as Figure 7, but showing the HAFv2model predictions for the IMF ecliptic plane configurationout to 100 AU on 16 February 2004. A broad MIR isapproaching Voyager 2. The asymmetric configuration ofthe MIR is evident with its faster and farthest propagation inthe 270�–0� quadrant. We believe the shock (MIR) arrivedat Voyager 2 on 15 March 2004 giving rise to thecorresponding modulation (dip) in galactic cosmic rays(>70 MeV/nucleon) shown in Figure 11. See color versionof this figure at back of this issue.
Figure 8. Additional HAFv2 model predictions associatedwith the Halloween solar events. HAFv2 predictions of theshock arrival and solar wind parameters and the Voyager 2solar wind data in February and March 2004. An observedshock arrived on 4 February, and a simulated one arrived on3 February. An additional shock was observed at Voyager 2on 15 March 2004. This shock may be associated with theHAFv2 shock prediction for an arrival �21 February. Thusthe HAFv2 model also suggests that shocks associatedwith the October/November 2003 solar eruptions (perhapsfrom the FF#520 fast west limb flare (X40)) may arrive atVoyager 2 before the April shock front associated with theseHalloween 2003 solar eruptions arrives. Note the scale forthe simulated speed is on the right side of the upper panel.See color version of this figure at back of this issue.
A09S10 INTRILIGATOR ET AL.: INTERPLANETARY PROPAGATION
7 of 11
A09S10
not included in our model. We have no explanation at thistime for the differences in speed and density between themodel and data and for the differences in the simulatedarrival times and observed shock arrival times in this figure.Here again, though, our HAFv2 simulation is only the firststep toward a fully 3-D MHD model with the incorporationof pickup ions. We suggest that this result be considered, aswith the other results in this paper, as benchmarks thatshould, in turn, be followed by further investigations withimproved models.[23] Figure 9 shows the HAFv2 predictions of the ecliptic
plane IMF configuration out to 100 AU for 16 February2004. We believe this is the inner shock front that wasshown in Figure 3 (see, also, paragraph 16) where, at thattime, it was barely intruding into the 180�–270� quadrant.Now in Figure 9 it shows this evolved shock front as thelarge shock front approaching the heliocentric distance ofVoyager 2. It is interesting to note that this shock front isasymmetric and that in the 270�–0� quadrant it has prop-agated out to heliocentric distances as large as thoseassociated with Voyager 1.[24] Thus the HAFv2 model predicts that there will be a
series of shocks arriving at Voyager 2. The large variationsin initial speeds continually change the grouping of theshocks, which also changes the magnitude of one grouprelative to another as they proceed outward. Thus it is notsurprising to see that the fast event (FF#520?) arrived in theouter heliosphere with not much magnitude in February2004 while a larger event, perhaps associated with the otherOctober/November 2003 events, could develop along theway to arrive there on 28 April 2004 as a more complexMIR.
3.6. Voyager 1
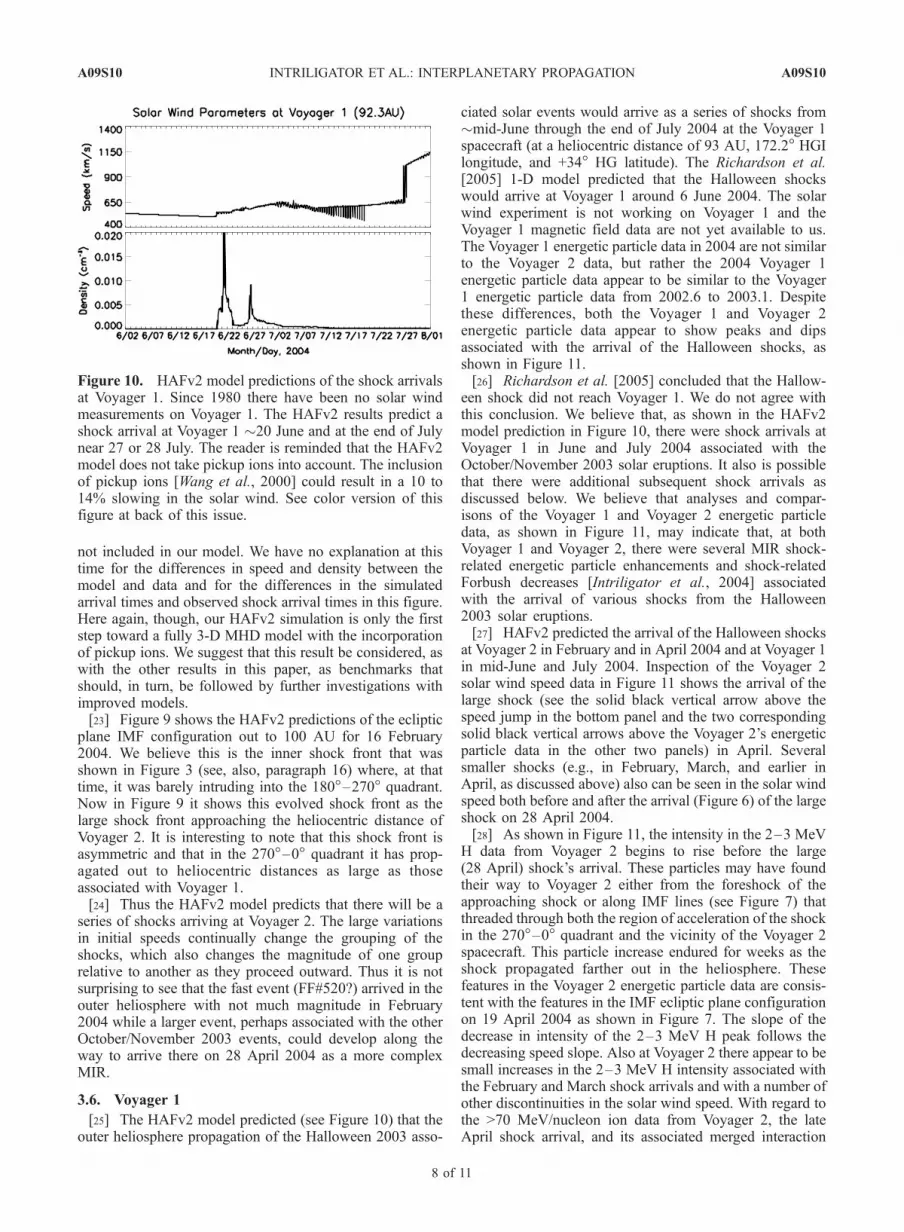
[25] The HAFv2 model predicted (see Figure 10) that theouter heliosphere propagation of the Halloween 2003 asso-
ciated solar events would arrive as a series of shocks from�mid-June through the end of July 2004 at the Voyager 1spacecraft (at a heliocentric distance of 93 AU, 172.2� HGIlongitude, and +34� HG latitude). The Richardson et al.[2005] 1-D model predicted that the Halloween shockswould arrive at Voyager 1 around 6 June 2004. The solarwind experiment is not working on Voyager 1 and theVoyager 1 magnetic field data are not yet available to us.The Voyager 1 energetic particle data in 2004 are not similarto the Voyager 2 data, but rather the 2004 Voyager 1energetic particle data appear to be similar to the Voyager1 energetic particle data from 2002.6 to 2003.1. Despitethese differences, both the Voyager 1 and Voyager 2energetic particle data appear to show peaks and dipsassociated with the arrival of the Halloween shocks, asshown in Figure 11.[26] Richardson et al. [2005] concluded that the Hallow-
een shock did not reach Voyager 1. We do not agree withthis conclusion. We believe that, as shown in the HAFv2model prediction in Figure 10, there were shock arrivals atVoyager 1 in June and July 2004 associated with theOctober/November 2003 solar eruptions. It also is possiblethat there were additional subsequent shock arrivals asdiscussed below. We believe that analyses and compar-isons of the Voyager 1 and Voyager 2 energetic particledata, as shown in Figure 11, may indicate that, at bothVoyager 1 and Voyager 2, there were several MIR shock-related energetic particle enhancements and shock-relatedForbush decreases [Intriligator et al., 2004] associatedwith the arrival of various shocks from the Halloween2003 solar eruptions.[27] HAFv2 predicted the arrival of the Halloween shocks
at Voyager 2 in February and in April 2004 and at Voyager 1in mid-June and July 2004. Inspection of the Voyager 2solar wind speed data in Figure 11 shows the arrival of thelarge shock (see the solid black vertical arrow above thespeed jump in the bottom panel and the two correspondingsolid black vertical arrows above the Voyager 2’s energeticparticle data in the other two panels) in April. Severalsmaller shocks (e.g., in February, March, and earlier inApril, as discussed above) also can be seen in the solar windspeed both before and after the arrival (Figure 6) of the largeshock on 28 April 2004.[28] As shown in Figure 11, the intensity in the 2–3 MeV
H data from Voyager 2 begins to rise before the large(28 April) shock’s arrival. These particles may have foundtheir way to Voyager 2 either from the foreshock of theapproaching shock or along IMF lines (see Figure 7) thatthreaded through both the region of acceleration of the shockin the 270�–0� quadrant and the vicinity of the Voyager 2spacecraft. This particle increase endured for weeks as theshock propagated farther out in the heliosphere. Thesefeatures in the Voyager 2 energetic particle data are consis-tent with the features in the IMF ecliptic plane configurationon 19 April 2004 as shown in Figure 7. The slope of thedecrease in intensity of the 2–3 MeV H peak follows thedecreasing speed slope. Also at Voyager 2 there appear to besmall increases in the 2–3 MeV H intensity associated withthe February and March shock arrivals and with a number ofother discontinuities in the solar wind speed. With regard tothe >70 MeV/nucleon ion data from Voyager 2, the lateApril shock arrival, and its associated merged interaction
Figure 10. HAFv2 model predictions of the shock arrivalsat Voyager 1. Since 1980 there have been no solar windmeasurements on Voyager 1. The HAFv2 results predict ashock arrival at Voyager 1 �20 June and at the end of Julynear 27 or 28 July. The reader is reminded that the HAFv2model does not take pickup ions into account. The inclusionof pickup ions [Wang et al., 2000] could result in a 10 to14% slowing in the solar wind. See color version of thisfigure at back of this issue.
A09S10 INTRILIGATOR ET AL.: INTERPLANETARY PROPAGATION
8 of 11
A09S10

region, was observed first, as an increase in intensity due toparticle acceleration, and then (see the first inclined, dashedblack arrow below the data) as a large Forbush decrease[Intriligator et al., 2004]. Figure 11 shows there also weresmall Forbush decreases associated with the February,March, and 19 April shock arrivals.
[29] In terms of the Voyager 1 data, as noted above, the2–3 MeV hydrogen intensities are several orders of mag-nitude higher than the Voyager 2 intensities. This situationis reminiscent of the 2002.6–2003.1 time interval. In theVoyager 1 data, there are a number of order of magnitudepeaks. Comparison of the 2–3 MeV H peaks from Voyager1 with the Voyager 1 galactic cosmic ray >70 MeV/nucleonion data indicates that the timings of the 2–3 MeV H datapeaks correspond with smaller enhancements and then theForbush decreases in the galactic cosmic rays. The slope ofthe Voyager 1 Forbush decrease near the beginning ofAugust 2004 (see black dashed inclined arrow below thedata) is quite similar to the slope of the large Forbushdecrease in the Voyager 2 data following the major shockarrival at the end of April. The Voyager 1 peaks and dips inthe 2–3 MeV H data in July also appear to correspondto the galactic cosmic ray changes in that spacecraft’s>70 MeV/nucleon ions. This correspondence appears tocontinue into November 2004 as shown in Figure 11.[30] We speculate that the highest intensity peak in the 2–
3 MeV H data in late August also is associated with atraveling Halloween-associated interplanetary shock. Recall-ing that the HAFv2 model predicted shocks at Voyager 1 inmid-June and at the end of July (Figure 10) and also thatthis model does not include the effects of pickup ions, it ispossible that, for example, the large shock predicted forthe end of July actually arrived at Voyager 1 about amonth later and was responsible for the highest peakintensity observed in the particles to date this year.[31] The Voyager 2 plasma speed in Figure 11 shows a
series of shocks and discontinuities continuing throughout2004. A number of these, perhaps in different groupings asdiscussed above, may have eventually reached the vicinityof Voyager 1 and may have been responsible for therecurring peaks and dips observed at that spacecraft. Inparticular, the Halloween shocks in the vicinity of Voy-ager 1 may have accelerated the ambient particles in theouter heliosphere including the pickup ions, the anoma-lous cosmic rays, electrons, and other termination shockassociated particles, and enhanced and modulated thegalactic cosmic rays. It is also possible that this is atwo shock phenomenon with particles traveling between,or threading among, the traveling interplanetary shock(s)and the termination shock. When additional in situ databecome available (e.g., Voyager magnetic field data,energetic particle anisotropies and composition, electrons,etc.), we may be able to eliminate or to substantiate thesepossibilities for the locations of the sources of theseparticles, their acceleration sites, and the mechanismsinvolved (perhaps including those discussed by Intriligatoret al. [2001]).
4. Prediction for Plasma Wave HeliosheathActivity
[32] Gurnett et al. [2003] reported the return on1 November 2002 of the 2–3 kHz radio emission asobserved by the plasma wave experiment on Voyager 1.They associated this with the interaction of a strong shock(from the solar events of early April 2002) with theheliopause. The Bastille Day 2000 solar events did notgive rise to such a plasma wave event. Richardson et al.
Figure 11. Voyager 1 and Voyager 2 data during 2004.(bottom) Voyager 2 solar wind speed (two-hourly averages).(middle) Voyager 2 and Voyager 1 CRS [McDonald et al.,2003; Intriligator et al., 2004] 2–3 MeV hydrogen ion(proton) data. (top) CRS >70 MeV/nucleon ions. The CRSdata are six-hourly averages. In the middle panel theintensity of the 2–3 MeV hydrogen ions from Voyager 1 isseveral orders of magnitude higher than the correspondingVoyager 2 data. This difference in intensities is similar tothe situation in 2002.6 to 2003.1. As shown in the lowerpanel, the large Halloween shock (indicated by the blackvertical arrow above the data) arrives at Voyager 2 on28 April. A number of smaller shocks arrive at Voyager 2,including on 4 February, 15 March, 19 April, 1 June,21 August, etc. In association with the Halloween shocks atthe respective spacecraft, the Voyager 2 and Voyager 1 dataappear to show peaks and dips in the 2–3 MeV H data andcorresponding enhancements and modulations in the>70 MeV/nucleon ion data (e.g., at Voyager 2 on 15 March,19 April, 28 April 2004). The black vertical arrow abovethe data indicates the arrival of the 28 April shock atVoyager 2. The inclined black arrows below the data denotethe modulation (Forbush decrease) associated with the28 April 2004 Voyager 2 event in the >70 MeV/nucleonions and, subsequently, at Voyager 1. Note the dip in the>70 MeV/nucleon ions at Voyager 2 �9 days earlierassociated with the earlier 19 April 2004 shock arrival. Seecolor version of this figure at back of this issue.
A09S10 INTRILIGATOR ET AL.: INTERPLANETARY PROPAGATION
9 of 11
A09S10

[2005] speculated that the large shock observed at the endof April 2004 at Voyager 2 might arrive at the heliopausein March 2005. They assert, however, that the shock wasnot seen at Voyager 1 (the spacecraft closest to the nose ofthe heliosphere) and that the strength of this shock wassimilar to the Bastille Day shock. Thus they conjecturedthat the shock may not reach the heliopause or may not bestrong enough to trigger plasma wave emission.[33] We believe that some of the Halloween shocks did
reach Voyager 1, e.g., as discussed above, in mid-June andin July 2004, and that they accelerated the ambient particlepopulation and modulated galactic cosmic rays. They alsomay have interacted with the termination shock. Generally,the Halloween interplanetary shocks were quite asymmetric.They appear to be stronger in the neutron monitor data (notshown) than the April 2002 or the Bastille 2000 events.They tended to be weaker in the upwind direction and in thenorth, i.e., in the vicinity of Voyager 1. Thus we also wouldspeculate that the 2–3 kHz plasma wave activity may returnin early 2005. However, if the wave activity does not recur,it would likely be due to the 3-D asymmetric interplanetaryconfiguration of these events.
5. Conclusions
[34] We have used a first generation (kinematic), spaceweather forecasting 3-D solar wind model, HAFv2, tosuggest the necessity for consideration of solar-generateddisturbances when examining Voyager 1 and Voyager 2observations in the outer heliosphere. Our first effort in thisdirection is described by Intriligator et al. [2004]. The 3-DHAFv2 model was deemed to be appropriate because of itslengthy history of published space weather real-time expe-riences as noted in sections 1 and 2 above. Here, we havecontinued this methodology by considering the October/November (Halloween) 2003 solar flare disturbances. Wehave suggested here, starting from solar observationsand using benchmarks at ACE (1 AU), Ulysses (5.23 AU),and Cassini (8.67 AU) in addition to Voyager 2 (73 AU) andVoyager 1 (93AU), that heliolongitudinal and heliolatitudi-nal effects should explicitly be taken into consideration. Weplan to extend this work by using the 3-D MHD approach(Detman et al., submitted manuscript, 2005) that alsoincorporates a global, preevent, inhomogeneous, back-ground solar wind plasma and interplanetary magnetic field.Eventually, of course, the effects of pick up ions should beincluded within this 3-D MHD context. Our 3-D HAFv2results appear to be useful for interpreting the Voyagerenergetic particle data and perhaps the 2–3 kHz plasmawave emissions as well.
[35] Acknowledgments. We are grateful to the Voyager experiment-ers for making their data available to us: E. C. Stone and F. B. McDonaldfor the CRS data, and J. D. Richardson for the plasma data. We thankR. Skoug and C.-C. Wu for the ACE plasma data. We acknowledge theNSSDC for the available solar wind observations, energetic particle data,and trajectory information. We acknowledge the Bartol Spaceship Earth forthe use of the cosmic ray neutron monitor data. We benefited from usefuldiscussions with J. R. Jokipii, E. C. Stone, R. Mewaldt, A. C. Cummings,L. F. Fisk, S. M. Krimigis, R. B. Decker, T. Armstrong, M. Zhang, and L. F.Burlaga. The work by DSI and JI was supported by Carmel ResearchCenter. The work by MD, CDF, WS, and CSD was supported by the DoDproject, University Partnering for Operational Support (UPOS), and byNASA’s Living With a Star (LWS) Targeted Research and DevelopmentProgram.
[36] Arthur Richmond thanks the reviewers for their assistance inevaluating this paper.
ReferencesBurlaga, L. F., N. F. Ness, E. C. Stone, F. B. McDonald, M. H. Acuna, R. P.Lepping, and J. E. P. Connerney (2003), Search for the heliosheath withVoyager 1 magnetic field measurements, Geophys. Res. Lett., 30(20),2072, doi:10.1029/2003GL018291.
Burlaga, L. F., N. F. Ness, E. C. Stone, F. B. McDonald, and J. D. Richardson(2005), Voyager 2 observations related to the October-November2003 solar events, Geophys. Res. Lett., 32, L03S05, doi:10.1029/2004GL021480.
Dryer, M., C. D. Fry, W. Sun, C. S. Deehr, Z. Smith, S.-I. Akasofu, andM. D. Andrews (2001), Prediction in real-time of the 2000 July 14 helio-spheric shock wave and its companions during the ‘‘Bastille’’ epoch, Sol.Phys., 204, 267–286.
Dryer, M., Z. Smith, C. D. Fry, W. Sun, C. S. Deehr, and S.-I. Akasofu(2004), Real-time shock arrival predictions during the ‘‘Halloween 2003epoch’’, Space Weather, 2, S09001, doi:10.1029/2004SW000087.
Fry, C. D., and S.-I. Akasofu (1987), Latitudinal dependence of solar windspeed, Planet. Space Sci., 35(7), 913–920.
Fry, C. D., W. Sun, C. S. Deehr, M. Dryer, Z. Smith, S.-I. Akasofu,M. Tokumaru, and M. Kojima (2001), Improvements to the HAF solarwind model for space weather predictions,’’ J. Geophys. Res., 106,20,985–21,001.
Fry, C. D., W. Sun, C. Deehr, M. Dryer, Z. Smith, and S.-I. Akasofu (2002),Real-time space weather forecasting driven by solar observations,in Solar-Terrestrial Magnetic Activity and Space Environment, COSPARColloq. Ser. on Phys. and Astron., edited by H. Wang and R. Xu, pp.401–407, Elsevier, New York.
Fry, C. D., M. Dryer, Z. Smith, W. Sun, C. S. Deehr, and S.-I. Akasofu(2003), Forecasting solar wind structures and shock arrival times using anensemble of models, J. Geophys. Res., 108(A2), 1070, doi:10.1029/2002JA009474.
Fry, C. D., M. Dryer, W. Sun, T. R. Detman, Z. Smith, C. S. Deehr, C.-C.Wu, S.-I. Akasofu, and D. Berdichevsky (2004), Solar observation-basedmodel for multi-day predictions of interplanetary shock and CME arrivalsat Earth, IEEE Trans. Plasma Phys., Part I, 32(4), 1489–1497.
Fry, C. D., M. Dryer, W. Sun, C. S. Deehr, Z. Smith, A. Aran, D. Lario,B. Sanahuja, T. R. Detman, and S.-I. Akasofu (2005), Key links inspace weather forecasting solar-generated shocks and proton accelera-tion, AIAA J., 43, 987–993.
Gurnett, D. A., W. S. Kurth, and E. C. Stone (2003), The return of theheliospheric 2–3 kHz radio emission during solar cycle 23, Geophys.Res. Lett., 30(23), 2209, doi:10.1029/2003GL018514.
Hakamada, K., and S.-I. Akasofu (1982), Simulation of three-dimensionalsolar wind disturbances and resulting geomagnetic storms, Space Sci.Rev., 31, 3–70.
Intriligator, D. S. (1976), The August 1972 solar-terrestrial events: Solarwind plasma observations, Space Sci. Rev., 19, 629–660.
Intriligator, D. S., J. R. Jokipii, T. S. Horbury, J. M. Intriligator, R. J.Forsyth, H. Kunow, G. Wibberenz, and J. T. Gosling (2001), Processesassociated with particle transport in corotating interaction regions andnear stream interfaces, J. Geophys. Res., 106, 10,625–10,634.
Intriligator, D. S., M. Dryer, W. Sun, C. D. Fry, C. Deehr, and J. Intriligator(2004), Dynamics of the outer heliosphere, in Physics of the Outer Helio-sphere, edited by V. Florinski, N. Pogorelov, and G. Zank, Conf. Proc.Am. Inst. Phys., 719, 117–123.
Krimigis, S.M., R. B.Decker,M. E.Hill, T. P. Armstrong,G.Gloeckler, D. C.Hamilton, L. J. Lanzerotti, and E. O. Roelof (2003), Voyager 1 exited thesolar wind at a distance of �85 AU from the Sun, Nature, 426, 45–48.
Lario, D., R. B. Decker, S. Livi, S. M. Krimigis, E. C. Roelof, C. T. Russell,and C. D. Fry (2005), Heliospheric energetic particle observationsduring the October-November 2003 events, J. Geophys. Res., 110,A09S11, doi:10.1029/2004JA010940.
McDonald, F. B., E. C. Stone, A. C. Cummings, B. Heikkila, N. Lal, andW. B. Webber (2003), Enhancements of energetic particles near the helio-spheric termination shock, Nature, 426, 48–51.
McKenna-Lawlor, S. M. P., M. Dryer, Z. Smith, K. Kecskemety, C. D. Fry,W. Sun, C. S. Deehr, D. Berdichevsky, K. Kudela, and G. Zastenker(2002), Arrival times of flare/HALO CME associated shocks at the Earth:Comparison of the predictions of three numerical models with theseobservations, Ann. Geophys., 20, 917–935.
McKenna-Lawlor, S., M. Dryer, C. D. Fry, W. Sun, D. Lario, C. S. Deehr,B. Sanahuja, V. A. Afonin, M. I. Verigin, and G. A. Kotova (2005),Prediction of energetic particle radiation in the close Martian environ-ment, J. Geophys. Res., 110, A03102, doi:10.1029/2004JA010587.
Olmstead, C., and S.-I. Akasofu (1985), One-dimensional kinematics ofparticle stream flow with application to solar wind simulation, Planet.Space Sci., 33(7), 831–839.
A09S10 INTRILIGATOR ET AL.: INTERPLANETARY PROPAGATION
10 of 11
A09S10
Richardson, J. D., C. Wang, and L. F. Burlaga (2003), Correlated solar windspeed, density, and magnetic field changes at Voyager 2, Geophys. Res.Lett., 30(23), 2207, doi:10.1029/2003GL018253.
Richardson, J. D., C. Wang, J. C. Kasper, and Y. Liu (2005), Propagation ofthe October/November 2003 CMEs through the heliosphere, Geophys.Res. Lett., 32, L03S03, doi:10.1029/2004GL020679.
Russell, C. T., J. Luhmann, C. W. Smith, R. Skoug, M. Dougherty,D. Lario, and L. Jian (2004), The October/November 2003 solarevents: Heliospheric disturbances, poster presented at SHINE 2004,Big Sky, Montana.
Skoug, R. M., J. T. Gosling, J. T. Steinberg, D. J. McComas, C. W. Smith,N. F. Ness, Q. Hu, and L. F. Burlaga (2004), Extremely high speed solarwind: 29–30 October 2003, J. Geophys. Res., 109, A09102, doi:10.1029/2004JA010494.
Smith, Z., T. Detman, M. Dryer, C. D. Fry, C.-C. Wu, W. Sun, and C. S.Deehr (2004), A verification method for space weather models usingsolar data to predict arrivals of interplanetary shocks at Earth, IEEETrans. Plasma Phys., Part I, 32(4), 1498–1505.
Smith, Z., M. Dryer, and C. D. Fry (2005), Determining shock velocities forinputs to Sun-to-Earth models from radio and coronagraph data, SpaceWeather, 3, S07002, doi:10.1029/2004SW000136.
Sun, W., S.-I. Akasofu, Z. K. Smith, and M. Dryer (1985), Calibration ofthe kinematic method of studying the solar wind on the basis of a one-dimensional MHD solution and a simulation study of the heliospherebetween November 22–December 6, 1977, Planet. Space Sci., 33,933–943.
Sun, W., M. Dryer, C. D. Fry, C. S. Deehr, Z. Smith, S.-I. Akasofu, M. D.Kartalev, and K. G. Grigorov (2002a), Evaluation of solar type II radioburst estimates of initial solar wind shock speed using a kinematic model
of the solar wind on the April 2001 solar event swarm, Geophys. Res.Lett., 29(8), 1171, doi:10.1029/2001GL013659.
Sun, W., M. Dryer, C. D. Fry, C. S. Deehr, Z. Smith, S.-I. Akasofu, M. D.Kartalev, and K. G. Grigorov (2002b), Real-time forecasting of ICMEshock arrivals at L1 during the ‘‘April Fool’s Day’’ epoch: 28 March–21April 2001, Ann. Geophys., 20, 937–945.
Sun, W., C. S. Deehr, C. D. Fry, M. Dryer, Z. Smith, and S.-I. Akasofu(2003), Plane-of-sky simulations of interplanetary shock waves, Geo-phys. Res. Lett., 30(20), 2044, doi:10.1029/2003GL017574.
Veselovsky, I. S., et al. (2004), Solar andheliosphericphenomena inOctober–November 2003: Causes and effects,Cosmic Res., 42(5), 435–488.
Wang, C., J. D. Richardson, and J. T. Gosling (2000), Slowdown of thesolar wind in the outer heliosphere and the interstellar neutral hydrogendensity, J. Geophys. Res., 105, 2337–2344.
Zank, G. P., W. Rice, I. Cairns, J. Bieber, R. Skoug, and C. Smith (2001),Predicted timing for the turn-on of radiation in the outer heliosphere dueto the Bastille Day shock, J. Geophys. Res., 106, 29,363–29,372.
�����������������������C. Deehr and W. Sun, Geophysical Institute, University of Alaska,
Fairbanks, AK 99775, USA.M. Dryer, NOAA Space Environment Center, 325 Broadway, Boulder,
CO 80305, USA.C. D. Fry, Exploration Physics International, Inc., Huntsville, AL 35806,
USA.D. S. Intriligator, Carmel Research Center, P.O. Box 1732, Santa Monica,
CA 90406, USA. ([email protected])J. Intriligator, University of Wales, Bangor, Gwynedd LL57 2AS, Wales,
UK.
A09S10 INTRILIGATOR ET AL.: INTERPLANETARY PROPAGATION
11 of 11
A09S10

3 of 11 and 4 of 11
Figure 1. The arrival of the Halloween 2003 shocks at ACE on 28, 29, 30 October and 4 November2003 are shown in the solar wind speed data and the HAFv2 results. The timings of the shock arrivals andthe magnitudes of the associated speed jumps in the predictions of the HAFv2 model are very similar tothe ACE speed observations at 1 AU. The Vs values in Table 1 were tuned to optimize only theagreement between the shock arrivals in the model results and in the ACE observations. ACE datacourtesy of R. Skoug and C.-C. Wu. ACE/SWEPAM density observations are not shown here due tosome unreliable data for part of this time period as discussed by Skoug et al. [2004].
Figure 2. HAFv2 predictions and solar wind observations at Ulysses of the Halloween events. Thegenerally consistent agreement in the speed profiles of the HAFv2 predictions of the arrival times of theshocks and the magnitudes of their associated jumps with the solar wind measurements providesvalidation of the HAFv2 model at Ulysses. No model shifting is necessary.
A09S10 INTRILIGATOR ET AL.: INTERPLANETARY PROPAGATION A09S10

4 of 11 and 5 of 11
Figure 3. HAFv2 results on 6 November 2003 showing the asymmetric interplanetary propagation ofthe October/November 2003 solar eruptions. Ecliptic plane projection of IMF lines in heliographicinertial coordinates shows the longitudinal distribution. The curved blue/dark (red/light) lines show theIMF toward (away) sectors. The results show the distortions of the IMF lines from the spiral fieldconfiguration. The Sun is at the origin of the X axis. The radius extends to 10 AU. The small black dot at�320� indicates the location of Earth and ACE. The positions of Ulysses and Cassini also are shown.Near 90� the outermost shock has reached Ulysses. At this time this innermost shock, which we associatewith FF#520, is barely extending into the 180�–270� quadrant. This shock propagates later into thisquadrant. Eventually, as a result of its original strength and ability to be refracted completely around theSun, it reaches Voyager 2 as shown in Figures 8 and 9.
Figure 4. HAFv2 predictions of solar wind parameters at the Cassini spacecraft. There are no in situsolar wind plasma data available from Cassini. Two shocks (see text), as indicated by the two verticallines, were observed at Cassini: the first late on 10 November, and the second on 16 November 2003. Thetime interval between these shocks is in good agreement with the HAFv2 predictions shown above,though the HAFv2 model predicts they will arrive �2 days earlier than observed.
A09S10 INTRILIGATOR ET AL.: INTERPLANETARY PROPAGATION A09S10
5 of 11 and 6 of 11
Figure 5. Same as Figure 3, but for 10 November 2003, showing the outermost shock has just passedCassini. This shock is now much farther beyond Ulysses, and another series of shocks is propagatingcloser to Ulysses. Note, in particular, that FF#520 (Table 1), launched on 4 November 2003, is simulatedto have overtaken several earlier-launched, but weaker, ICMEs. This shock is now propagating en routeto Ulysses and Cassini.
Figure 6. HAFv2 predictions of the shock (as part of a merged interaction region, MIR) arrivals andsolar wind parameters and the Voyager 2 solar wind data in April 2004. The unshifted simulated firstevent (short duration square wave) corresponds to the measured first shock on 19 April 2004 and thelarger shock on 28 April 2004 is simulated by the longer duration step increase in the speed. The scale forthe simulated speed is on the right side of the upper panel. The simulated densities were too low to beplotted here. The timing between the two simulated shocks is similar to the timing between the twomeasured shocks at Voyager 2. The Voyager 2 IMF data [Burlaga et al., 2005] are consistent with thepresence of these two shocks, as are the energetic particle data shown in our Figure 11 below.
A09S10 INTRILIGATOR ET AL.: INTERPLANETARY PROPAGATION A09S10

6 of 11 and 7 of 11
Figure 7. Same as Figures 3 and 5, but showing the HAFv2 model predictions for the IMF eclipticplane configuration out to 100 AU on 19 April 2004. The locations of Voyager 2 and Voyager 1 areshown. The figure indicates that a broad shock (MIR) associated with the Halloween 2003 eventsrecently passed the location of Voyager 2. We associate this broad MIR with the 19 and 28 April 2004shocks shown in Figure 6. An additional MIR, perhaps associated with the speed peak in May(Figure 11), is approaching Voyager 2.
Figure 8. Additional HAFv2 model predictions associated with the Halloween solar events. HAFv2predictions of the shock arrival and solar wind parameters and the Voyager 2 solar wind data in Februaryand March 2004. An observed shock arrived on 4 February, and a simulated one arrived on 3 February.An additional shock was observed at Voyager 2 on 15 March 2004. This shock may be associated withthe HAFv2 shock prediction for an arrival �21 February. Thus the HAFv2 model also suggests thatshocks associated with the October/November 2003 solar eruptions (perhaps from the FF#520 fast westlimb flare (X40)) may arrive at Voyager 2 before the April shock front associated with these Halloween2003 solar eruptions arrives. Note the scale for the simulated speed is on the right side of the upper panel.
A09S10 INTRILIGATOR ET AL.: INTERPLANETARY PROPAGATION A09S10

7 of 11 and 8 of 11
Figure 9. Same as Figure 7, but showing the HAFv2 model predictions for the IMF ecliptic planeconfiguration out to 100 AU on 16 February 2004. A broad MIR is approaching Voyager 2. Theasymmetric configuration of the MIR is evident with its faster and farthest propagation in the 270�–0�quadrant. We believe the shock (MIR) arrived at Voyager 2 on 15 March 2004 giving rise tothe corresponding modulation (dip) in galactic cosmic rays (>70 MeV/nucleon) shown in Figure 11.
Figure 10. HAFv2 model predictions of the shock arrivals at Voyager 1. Since 1980 there have beenno solar wind measurements on Voyager 1. The HAFv2 results predict a shock arrival at Voyager 1�20 June and at the end of July near 27 or 28 July. The reader is reminded that the HAFv2 modeldoes not take pickup ions into account. The inclusion of pickup ions [Wang et al., 2000] could result ina 10 to 14% slowing in the solar wind.
A09S10 INTRILIGATOR ET AL.: INTERPLANETARY PROPAGATION A09S10

9 of 11
Figure 11. Voyager 1 and Voyager 2 data during 2004. (bottom) Voyager 2 solar wind speed (two-hourly averages). (middle) Voyager 2 and Voyager 1 CRS [McDonald et al., 2003; Intriligator et al.,2004] 2–3 MeV hydrogen ion (proton) data. (top) CRS >70 MeV/nucleon ions. The CRS data are six-hourly averages. In the middle panel the intensity of the 2–3 MeV hydrogen ions from Voyager 1 isseveral orders of magnitude higher than the corresponding Voyager 2 data. This difference in intensities issimilar to the situation in 2002.6 to 2003.1. As shown in the lower panel, the large Halloween shock(indicated by the black vertical arrow above the data) arrives at Voyager 2 on 28 April. A number ofsmaller shocks arrive at Voyager 2, including on 4 February, 15 March, 19 April, 1 June, 21 August, etc.In association with the Halloween shocks at the respective spacecraft, the Voyager 2 and Voyager 1 dataappear to show peaks and dips in the 2–3 MeV H data and corresponding enhancements and modulationsin the >70 MeV/nucleon ion data (e.g., at Voyager 2 on 15 March, 19 April, 28 April 2004). The blackvertical arrow above the data indicates the arrival of the 28 April shock at Voyager 2. The inclined blackarrows below the data denote the modulation (Forbush decrease) associated with the 28 April 2004Voyager 2 event in the >70 MeV/nucleon ions and, subsequently, at Voyager 1. Note the dip in the>70 MeV/nucleon ions at Voyager 2 �9 days earlier associated with the earlier 19 April 2004 shockarrival.
A09S10 INTRILIGATOR ET AL.: INTERPLANETARY PROPAGATION A09S10