imaging the interaction of the heliosphere with the interstellar medium from saturn with cassini
TRANSCRIPT

DOI: 10.1126/science.1181079, 971 (2009);326 Science
, et al.S. M. KrimigisMedium from Saturn with CassiniImaging the Interaction of the Heliosphere with the Interstellar
This copy is for your personal, non-commercial use only.
clicking here.colleagues, clients, or customers by , you can order high-quality copies for yourIf you wish to distribute this article to others
here.following the guidelines
can be obtained byPermission to republish or repurpose articles or portions of articles
): March 4, 2011 www.sciencemag.org (this infomation is current as of
The following resources related to this article are available online at
http://www.sciencemag.org/content/328/5975/170.2.full.htmlA correction has been published for this article at:
http://www.sciencemag.org/content/326/5955/971.full.htmlversion of this article at:
including high-resolution figures, can be found in the onlineUpdated information and services,
http://www.sciencemag.org/content/suppl/2009/10/15/1181079.DC1.htmlcan be found at: Supporting Online Material
http://www.sciencemag.org/content/326/5955/971.full.html#relatedfound at:
can berelated to this article A list of selected additional articles on the Science Web sites
http://www.sciencemag.org/content/326/5955/971.full.html#ref-list-1, 3 of which can be accessed free:cites 14 articlesThis article
1 article(s) on the ISI Web of Sciencecited by This article has been
http://www.sciencemag.org/cgi/collection/planet_sciPlanetary Science
subject collections:This article appears in the following
registered trademark of AAAS. is aScience2009 by the American Association for the Advancement of Science; all rights reserved. The title
CopyrightAmerican Association for the Advancement of Science, 1200 New York Avenue NW, Washington, DC 20005. (print ISSN 0036-8075; online ISSN 1095-9203) is published weekly, except the last week in December, by theScience
on
Mar
ch 4
, 201
1w
ww
.sci
ence
mag
.org
Dow
nloa
ded
from
flow conditions for three species during the cur-rent extended solar minimum. Any temporal varia-tions of these conditions are of a much longertime scale than the observation period presentedhere. These observations provide constraints onthe interstellar flow parameters and the interac-tion of the interstellar flow with the heliosphericboundary. Together with future observations dur-ing different solar activity, they also constrain theionization rates of these species and the solar ra-diation pressure for H.
References and Notes1. J. L. Bertaux, J. E. Blamont, Astron. Astrophys. 11, 200 (1971).2. C. S. Weller, R. R. Meier, Astrophys. J. 193, 471 (1974).3. E. Möbius et al., Nature 318, 426 (1985).
4. G. Gloeckler et al., Science 261, 70 (1993).5. E. Möbius et al., Astron. Astrophys. 426, 897 (2004).6. M. Gruntman, Planet. Space Sci. 41, 307 (1993).7. E. Möbius et al., Space Sci. Rev. 10.1007/s11214-009-
9498-5 (2009).8. M. Witte, M. Banaszkiewicz, H. Rosenbauer, Space Sci.
Rev. 78, 289 (1996).9. M. Witte, Astron. Astrophys. 426, 835 (2004).10. P. Wurz et al., AIP Conf. Proc. 719, 195 (2004).11. D. J. McComas et al., Space Sci. Rev. 10.1007/s11214-
009-9499 (2009).12. D. J. McComas et al., Science 326, 959 (2009); published
online 15 October 2009 (10.1126/science.1180906).13. H. Funsten et al., Science 326, 964 (2009); published
online 15 October 2009 (10.1126/science.1180927).14. S. A. Fuselier et al., Science 326, 962 (2009); published
online 15 October 2009 (10.1126/science.1180981).15. S. A. Fuselier et al., Space Sci. Rev. 10.1007/s11214-
009-9495 (2009).
16. P. Wurz et al., J. Appl. Phys. 103, 10.1063/1.2842398(2008).
17. R. Lallement et al., Science 307, 1447 (2005).18. V. V. Izmodenov, D. B. Alexashov, A. V. Myasnikov,
Astron. Astrophys. 437, L35 (2005).19. E. C. Stone et al., Nature 454, 71 (2008).20. E. Quemerais et al., Astron. Astrophys. 455, 1135 (2006).21. M. Bzowski et al., Astron. Astrophys. 491, 7 (2008).22. We thank the many individuals who made this mission
possible. This work is supported by NASA under contractNNG05EC85C, by the Swiss National Science Foundation,the Programme de Développement d’ExpériencesScientifiques (PRODEX), the Space Research Centre of thePolish Academy of Sciences, and the Russian Federation.
24 August 2009; accepted 2 October 2009Published online 15 October 2009;10.1126/science.1180971Include this information when citing this paper.
Imaging the Interaction of theHeliosphere with the InterstellarMedium from Saturn with CassiniS. M. Krimigis,1,2* D. G. Mitchell,1 E. C. Roelof,1 K. C. Hsieh,3 D. J. McComas4,5
We report an all-sky image of energetic neutral atoms (ENAs) >6 kilo–electron volts produced byenergetic protons occupying the region (heliosheath) between the boundary of the extended solaratmosphere and the local interstellar medium (LISM). The map obtained by the Ion and NeutralCamera (INCA) onboard Cassini reveals a broad belt of energetic protons whose nonthermalpressure is comparable to that of the local interstellar magnetic field. The belt, centered at~260° ecliptic longitude extending from north to south and looping back through ~80°, appears tobe ordered by the local interstellar magnetic field. The shape revealed by the ENA imagedoes not conform to current models, wherein the heliosphere resembles a cometlike figure alignedin the direction of Sun’s travel through the LISM.
The quest for the dimensions and shape ofthe bubble of plasma called the helio-sphere, created by the continuously flow-
ing solar wind as the Sun travels through theLISM, is older than the space age (1). Estimatesof the distance to the boundary in the generaldirection of the solar apex have ranged from afew astronomical units (1 AU equals the distancebetween Earth and Sun, 150 million km) to tensof AU (2–4). Voyager 1 and 2 (V1 and V2)crossed the termination shock (TS) at distances of94 and 84AU in 2004 and 2007 at +35° and –26°ecliptic latitudes, respectively [e.g., (5–7)], im-plying that the radial dimensions of the TS aredifferent in time and/or location. More surpris-ingly, the shocked thermal plasma in the helio-sheath remained supersonic because only 20% ofthe upstream energy density went into heating the
downstream thermal plasma, while most ofthe rest went into heating pickup ions (PUI), in-cluding a substantial part (≥15%) going intoprotons >28 keV (6, 7). PUI are interstellarneutrals that are ionized in the solar wind andpicked up and accelerated to energies >1 keV bythe flow (8).
The prevailing models of the shape of theheliosphere suggest a cometary-type interaction(Fig. 1) with a possible bow shock and/orheliopause, heliosheath, and TS, all foreshort-ened in the direction of motion of the solarsystem through the LISM (3, 9). Energetic sin-
gly charged particles in the heliosheath willcharge-exchange with interstellar neutral hydro-gen and enter the heliosphere as ENAs unim-peded by the interplanetary magnetic field [e.g.,(10, 11)].
Launch of the ENA imager on the Cassini-Huygens mission to Saturn occurred in October1997. The Cassini spacecraft spent nearly 7 yearsin interplanetary cruise with sporadic data cov-erage before insertion into orbit at Saturn on1 July 2004. Because the principal objective ofthe Ion and Neutral Camera (INCA) instrument(12) (fig. S1) is to image the energetic plasmaions trapped in Saturn’s magnetosphere throughENAs, it took several years to obtain a nearlyfull image of the heliosphere in directions awayfrom Saturn, with a minor gap in the direction ofthe Sun. In October 2008, Interstellar BoundaryExplorer (IBEX) was launched with ENA cam-eras specifically designed to map the helio-spheric boundary at lower (<6 keV) energies(13, 14).
Here, we present the INCA map of the skyin ~6 to 13 keV ENAs (Fig. 2A). The ENA mapreveals an intensity ratio ≥ 10 between low in-tensities in the middle of the image and a bright,broad, latitude-dependent belt of higher inten-sities. The minimum reappears beyond the belt at≥120° to about –170° at the respective edges ofthe image. The belt that makes a rough circle inthe sky about the interstellar field direction as itextends from north to south is ~100° full width athalf maximum (FWHM) at the ecliptic equator in
1Applied Physics Laboratory, Johns Hopkins University, Laurel,MD 20723, USA. 2Office for Space Research and Technology,Academy of Athens, 106 79 Athens, Greece. 3Departmentof Physics, University of Arizona, Tucson, AZ 85721, USA.4Southwest Research Institute, San Antonio, TX 78228, USA.5University of Texas, San Antonio, TX 78249, USA.
*To whom correspondence should be addressed. E-mail:[email protected]
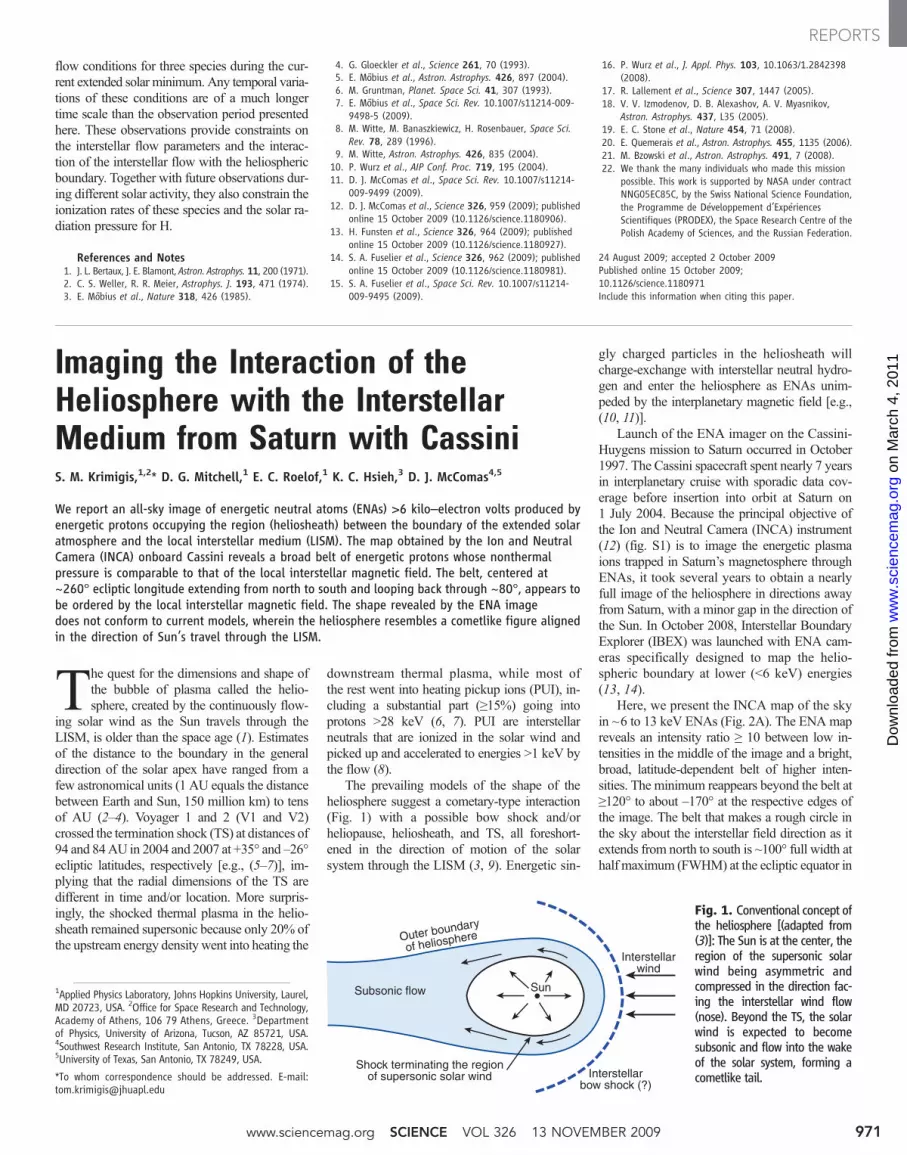
Fig. 1. Conventional concept ofthe heliosphere [(adapted from(3)]: The Sun is at the center, theregion of the supersonic solarwind being asymmetric andcompressed in the direction fac-ing the interstellar wind flow(nose). Beyond the TS, the solarwind is expected to becomesubsonic and flow into the wakeof the solar system, forming acometlike tail.
Interstellarwind
Interstellarbow shock (?)
Subsonic flow
Outer boundary
of heliosphere
Shock terminating the regionof supersonic solar wind
Sun
www.sciencemag.org SCIENCE VOL 326 13 NOVEMBER 2009 971
REPORTS
on
Mar
ch 4
, 201
1w
ww
.sci
ence
mag
.org
Dow
nloa
ded
from

the range –30° to –150° and then loops back torecross the equator again at longitudes ~50° to~110°, albeit at a lower intensity. Also, there arestatistically significant enhancements in theintensity as the belt loops toward both north andsouth ecliptic poles. It is similar to, but broaderthan, the ribbon seen at lower (<6-keV) energiesin the IBEX images (14). However, there is nomaximum in the direction of the local interstellarflow (nose) at about –100°, as anticipated fromthe model shown in Fig. 1. The lower intensitiesin the direction of the anticipated tail at ~90°longitude are less organized. The intensities inthe directions of V1 and V2 are slightly lowerthan those at the belt maximum.
Plotted in galactic coordinates (Fig. 2B), thebelt of higher intensities now lies within T60° ofthe galactic equator, being tilted ~30° towardnorth and south at positive and negative longi-tudes, respectively. The two intensity minima dis-cussed earlier are now identified with the galacticnorth and south poles, although their bounda-ries are also tilted ~30° to the galactic equator.Although most x-ray, ultraviolet, and extreme ul-traviolet radiation sources reside close to thegalactic plane, a detailed study of the most intenseof these proves that they are not correlated withthe INCA ENA emissions [supporting onlinematerial (SOM) text and fig. S1]. It is clear fromFig. 2B that, contrary to theoretical expectations(compare with Fig. 1), the ENA emissions areat least partially ordered by galactic rather thanecliptic coordinates.
We evaluated the role that the nonthermal en-ergetic ion pressure in the heliosheath (estimatedfrom the observed ENAs) plays in the dynamics
of the interaction with the LISM. The intensity( jENA) measured by INCA for ENAs with veloc-ity (v) is given by the line-of-sight (LOS) integralbeyond the TS (r0) through the heliosheath of theproduct of interstellar H-atom density (nH) andthe energetic ion intensity ( jion) multiplied by thecharge-exchange cross section (s10)
jENAðv,t þ r0=vÞ¼ s10
ð∞r0
drnH ðr − vtÞjionðr − vt,tÞ
t ≥ 0 ð1ÞWe could rewrite the integral as
jENA ¼ ðs10n0 j0ÞLion ð2Þ
where n0 j0 is the average value of the product ofthe density and intensity (nH jion) over someradial interval (r0, r0 + Lion), presumably beyondthe TS that contains the bulk of the energetic ionpopulation. This allows us to convert the mea-sured jENA into a proton intensity averaged over aradial interval Lion beyond the TS.
j0 ¼ jENA=ðs10n0LionÞ ð3Þ
Figure 2C shows ENA spectra at key lo-cations identified in Fig. 2, A and B. Protonspectra (Eq. 3) are derived by normalizing theintensity of the highest ENA energy channel(~45 keV) to the overlapping Voyager 1 protonchannel (~46 keV), making in situ measurementsin the heliosheath at 110 AU. We find that j0 =
80 jENA at V1. By assuming that nH ~ 0.1 cm–3
and using the known value of s10 (~2.32 × 10⁻¹⁶
cm2) at that energy, we find that Lion ~ 36 AU ornHLion = 3.6 AU cm–3 for any other choice of nH.The value for Lion may well be different at otherlocations along the belt, and various assumptionson averaging can change it by up to ~40%; weadopt a representative value of 50 AU. The ENAspectra have a power-law slope of ~E–4 where Eis particle energy, whereas the resulting ionspectrum is substantially less steep because ofthe energy dependence of the cross sections, andit joins smoothly with the V1 slope of ~E–1.5 at>40 keV. The ENA spectrum overall has thesame slope, irrespective of locations marked onthe map shown in Fig. 2A. A calculation of thespectral index over every pixel in the entire mapgives the same slope throughout to within ~5%.
Having converted the ENA intensities intoequivalent ion intensities beyond the TS, wecomputed the partial plasma pressure at ≥6 keV, arange where many of the PUIs associated withthe TS and heliosheath are expected to reside.The partial pressure DP is given by
DP ¼ ð4pp=3ÞjionDE
where p is proton momentum and DE is theenergy width of each INCA channel. Thisbecomes
DPðpPaÞ ¼ ð7:47� 10−8Þvðkm s–1Þ� jENADEðcm2sr sÞ–1=s10n0Lion
Fig. 2. (A) Image of heliospheric ENAs in the range of 5.2 to 13.5 keV (datafrom day 265, 2003, to day 184, 2009) plotted in ecliptic coordinates. Thelocation of local interstellar flow (nose), its opposite (tail), solar apex (SA), andanti-apex (SAA), as well as the positions of Voyager 1 and 2 in the heliosheathare marked; the local ISMF direction (16, 17) is indicated. Gray-shaded areascentered at about –70° longitude, 0° latitude and at ~120° longitude, –40°latitude are regions of incomplete coverage in the directions of the Sun andSaturn, respectively. (B) The same data plotted in galactic coordinates. (C) ENAspectra of INCA data over the energy range 5.2 to 55 keV (lower grouping) anddeduced proton spectra (upper grouping) from selected locations shown in (A).Horizontal bars indicate the INCA energy channel limits for hydrogen ENAs.Laboratory charge exchange (CS) cross sections for protons on hydrogen (Eq. 3)were used for each channel.
13 NOVEMBER 2009 VOL 326 SCIENCE www.sciencemag.org972
REPORTS
on
Mar
ch 4
, 201
1w
ww
.sci
ence
mag
.org
Dow
nloa
ded
from
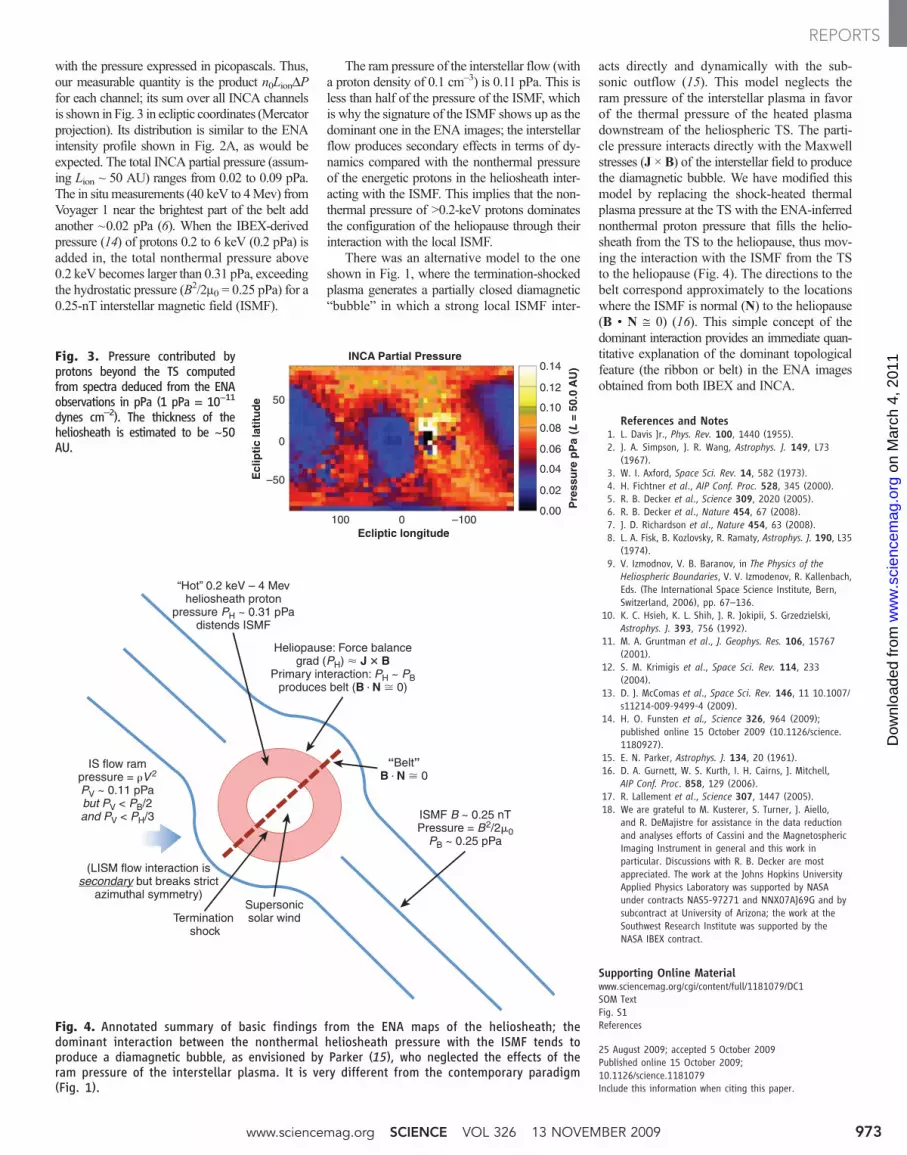
with the pressure expressed in picopascals. Thus,our measurable quantity is the product n0LionDPfor each channel; its sum over all INCA channelsis shown in Fig. 3 in ecliptic coordinates (Mercatorprojection). Its distribution is similar to the ENAintensity profile shown in Fig. 2A, as would beexpected. The total INCA partial pressure (assum-ing Lion ~ 50 AU) ranges from 0.02 to 0.09 pPa.The in situ measurements (40 keV to 4Mev) fromVoyager 1 near the brightest part of the belt addanother ~0.02 pPa (6). When the IBEX-derivedpressure (14) of protons 0.2 to 6 keV (0.2 pPa) isadded in, the total nonthermal pressure above0.2 keV becomes larger than 0.31 pPa, exceedingthe hydrostatic pressure (B2/2m0 = 0.25 pPa) for a0.25-nT interstellar magnetic field (ISMF).
The ram pressure of the interstellar flow (witha proton density of 0.1 cm–3) is 0.11 pPa. This isless than half of the pressure of the ISMF, whichis why the signature of the ISMF shows up as thedominant one in the ENA images; the interstellarflow produces secondary effects in terms of dy-namics compared with the nonthermal pressureof the energetic protons in the heliosheath inter-acting with the ISMF. This implies that the non-thermal pressure of >0.2-keV protons dominatesthe configuration of the heliopause through theirinteraction with the local ISMF.
There was an alternative model to the oneshown in Fig. 1, where the termination-shockedplasma generates a partially closed diamagnetic“bubble” in which a strong local ISMF inter-
acts directly and dynamically with the sub-sonic outflow (15). This model neglects theram pressure of the interstellar plasma in favorof the thermal pressure of the heated plasmadownstream of the heliospheric TS. The parti-cle pressure interacts directly with the Maxwellstresses (J × B) of the interstellar field to producethe diamagnetic bubble. We have modified thismodel by replacing the shock-heated thermalplasma pressure at the TS with the ENA-inferrednonthermal proton pressure that fills the helio-sheath from the TS to the heliopause, thus mov-ing the interaction with the ISMF from the TSto the heliopause (Fig. 4). The directions to thebelt correspond approximately to the locationswhere the ISMF is normal (N) to the heliopause(B • N ≅ 0) (16). This simple concept of thedominant interaction provides an immediate quan-titative explanation of the dominant topologicalfeature (the ribbon or belt) in the ENA imagesobtained from both IBEX and INCA.
References and Notes1. L. Davis Jr., Phys. Rev. 100, 1440 (1955).2. J. A. Simpson, J. R. Wang, Astrophys. J. 149, L73
(1967).3. W. I. Axford, Space Sci. Rev. 14, 582 (1973).4. H. Fichtner et al., AIP Conf. Proc. 528, 345 (2000).5. R. B. Decker et al., Science 309, 2020 (2005).6. R. B. Decker et al., Nature 454, 67 (2008).7. J. D. Richardson et al., Nature 454, 63 (2008).8. L. A. Fisk, B. Kozlovsky, R. Ramaty, Astrophys. J. 190, L35
(1974).9. V. Izmodnov, V. B. Baranov, in The Physics of the
Heliospheric Boundaries, V. V. Izmodenov, R. Kallenbach,Eds. (The International Space Science Institute, Bern,Switzerland, 2006), pp. 67–136.
10. K. C. Hsieh, K. L. Shih, J. R. Jokipii, S. Grzedzielski,Astrophys. J. 393, 756 (1992).
11. M. A. Gruntman et al., J. Geophys. Res. 106, 15767(2001).
12. S. M. Krimigis et al., Space Sci. Rev. 114, 233(2004).
13. D. J. McComas et al., Space Sci. Rev. 146, 11 10.1007/s11214-009-9499-4 (2009).
14. H. O. Funsten et al., Science 326, 964 (2009);published online 15 October 2009 (10.1126/science.1180927).
15. E. N. Parker, Astrophys. J. 134, 20 (1961).16. D. A. Gurnett, W. S. Kurth, I. H. Cairns, J. Mitchell,
AIP Conf. Proc. 858, 129 (2006).17. R. Lallement et al., Science 307, 1447 (2005).18. We are grateful to M. Kusterer, S. Turner, J. Aiello,
and R. DeMajistre for assistance in the data reductionand analyses efforts of Cassini and the MagnetosphericImaging Instrument in general and this work inparticular. Discussions with R. B. Decker are mostappreciated. The work at the Johns Hopkins UniversityApplied Physics Laboratory was supported by NASAunder contracts NAS5-97271 and NNX07AJ69G and bysubcontract at University of Arizona; the work at theSouthwest Research Institute was supported by theNASA IBEX contract.
Supporting Online Materialwww.sciencemag.org/cgi/content/full/1181079/DC1SOM TextFig. S1References
25 August 2009; accepted 5 October 2009Published online 15 October 2009;10.1126/science.1181079Include this information when citing this paper.
Fig. 4. Annotated summary of basic findings from the ENA maps of the heliosheath; thedominant interaction between the nonthermal heliosheath pressure with the ISMF tends toproduce a diamagnetic bubble, as envisioned by Parker (15), who neglected the effects of theram pressure of the interstellar plasma. It is very different from the contemporary paradigm(Fig. 1).
Fig. 3. Pressure contributed byprotons beyond the TS computedfrom spectra deduced from the ENAobservations in pPa (1 pPa = 10−11
dynes cm–2). The thickness of theheliosheath is estimated to be ~50AU.
50
0
0100 –100
–50
0.14
0.08
0.10
0.12
0.04
0.06
0.02
0.00
Ecl
ipti
c la
titu
de
Ecliptic longitude
INCA Partial Pressure
Pre
ssu
re p
Pa
(L
= 5
0.0
AU
)
www.sciencemag.org SCIENCE VOL 326 13 NOVEMBER 2009 973
REPORTS
on
Mar
ch 4
, 201
1w
ww
.sci
ence
mag
.org
Dow
nloa
ded
from
www.sciencemag.org SCIENCE VOL 328 9 APRIL 2010 169
LETTERSedited by Jennifer Sills
181
Statelesssocieties
The iron in the mussel’s grip
After the Maule quake
COMMENTARY
175LETTERS I BOOKS I POLICY FORUM I EDUCATION FORUM I PERSPECTIVES
180
CR
ED
IT: K
RIS
TIN
A S
TE
FA
NO
VA
/USA
ID
Food Security: Green
Revolution Drawbacks
AS DISCUSSED IN THE SPECIAL SECTION ON FOOD
Security (12 February, p. 797), the process of
increasing food production and improving its
quality to sustain population growth without
compromising environmental safety has been
called a global green revolution. Science and
technology are supposed to play a key role in
this revolution by enhancing crop effi ciency
and food quality, as well as developing alter-
native protein sources (1). A successful green
revolution, however, will likely maintain or
exacerbate the current rates of population
growth, eventually leading to resource exhaus-
tion. Scientists should think critically about
the green revolution option, just as they would
about any other scientifi c endeavor. A green
revolution is only needed if the current global
economy and mode of development must be
maintained.VALENTÍ RULL
Palynology and Paleoecology Laboratory, Botanical Insti-tute of Barcelona, 08038 Barcelona, Spain. E-mail: [email protected]
Reference 1. J. Beddington, Phil. Trans. R. Soc. B 365, 61 (2010).
Food Security: Beyond
Technology
THE AUTHORS OF THE SPECIAL SECTION ON
Food Security (12 February, p. 797) make a
plausible case that feeding a hungry world
requires “rethinking agriculture.”
Unfortunately, the advocacy on display
here implies that technological solu-
tions—any technological solutions—
are not only necessary but suffi cient.
This would be a serious mistake.
Those of us engaged “on the
ground” in Africa and elsewhere know
very well that the binding constraint
on a viable food system is not defi -
cient technology but the institutional
(policy) and organizational (bureau-
cratic) incoherencies—touched on in
the Perspective by G. Ejeta (“African green
revolution needn’t be a mirage,” p. 831)—that
combine to pervert incentives, render neces-
sary inputs unavailable, defeat the best efforts
of dedicated extension agents, and generally
encourage individual farmers to retreat into
autarchy.
We have nothing against promising tech-
nology. We remain, however, incorrigible real-
ists when it comes to the inevitable optimism
that offers up the latest technical solution to
complex policy and organizational settings
and circumstances.DANIEL W. BROMLEY
Professor Emeritus, Department of Agricultural and Applied Economics, University of Wisconsin–Madison, Madison, WI 53706, USA. E-mail: [email protected]
Food Security: Crop
Species Diversity
THE SPECIAL SECTION ON FOOD SECURITY (12
February, p. 797) did not consider the value
of crop species diversity. It is agronomically,
ecologically, nutritionally, and economically
risky and unsustainable to rely almost exclu-
sively on a handful of major crops to provide
food for the world’s projected 9 billion people
by 2050. Indeed, this approach may have been
partially responsible for the failure of the green
revolution in much of Africa.
Calls for improvement of major crops
(described in M. Tester and P. Langridge’s
Food Security: Population Controls
THE SPECIAL SECTION ON FOOD SECURITY (12 FEBRUARY, P. 797) PRESENTS VARIOUS TECHNO-
logical fi xes to address the problem of sustainably and equitably feeding the 9 billion humans
now projected for 2050. However, population controls are not mentioned as a possible strategy.
Suggestions for reducing demand are essentially limited to eating less meat and more insects, as
well as establishing good governance and eliminating pervasive worldwide corruption. Why not
make reduced world population a central part of the proposed mix of solutions for the future?ARTHUR H. WESTING
Westing Associates in Environment, Security, and Education, Putney, VT 05346, USA. E-mail: [email protected]
Editor’s Note: We received a number of thoughtful letters on this point. You can read them online
at www.sciencemag.org/cgi/eletters/328/5975/169-b. JENNIFER SILLS
Letters to the Editor
Letters (~300 words) discuss material published
in Science in the previous 3 months or issues of
general interest. They can be submitted through
the Web (www.submit2science.org) or by regular
mail (1200 New York Ave., NW, Washington, DC
20005, USA). Letters are not acknowledged upon
receipt, nor are authors generally consulted before
publication. Whether published in full or in part,
letters are subject to editing for clarity and space.
Published by AAAS
on
Mar
ch 4
, 201
1w
ww
.sci
ence
mag
.org
Dow
nloa
ded
from
9 APRIL 2010 VOL 328 SCIENCE www.sciencemag.org 170
LETTERS
Build new scientific relationships andexplore the best way to conduct a clinicaland translational science career at CTSciNet,the new online community from Science,
Science Careers, and AAASmade possibleby the BurroughsWellcome Fund.
There’s no charge for joining, and you’llenjoy access to:
Practical and specific information onnavigating a career in clinical or trans-lational research
Opportunities to connect with otherscientists including peers,mentors,andmentees
Access to the resources of the world’sleading multidisciplinary professionalsociety and those of our partnerorganizations
Connect with CTSciNet now at:
Community.ScienceCareers.org/CTSciNet
Presented by
Science Careers in Translation
Learn how current eventsare impacting your work.
ScienceInsider, the new policy blog from the journalScience, is your source for breaking news and instantanalysis from the nexus of politics and science.
Producedbyan international teamofscience journalists,ScienceInsideroffershard-hitting coverageon a rangeofissues including climate change, bioterrorism, researchfunding, andmore.
Before research happens at the bench, science policy isformulated in the halls of government. Make sure youunderstandhow currenteventsare impacting yourwork.Read ScienceInsider today.
Breaking news and analysis from
the world of science policy
www.ScienceInsider.org
Review, “Breeding technologies to increase
crop production in a changing world,” p. 818),
such as Africa’s major staples (described in
G. Ejeta’s Perspective, “African green revolu-
tion needn’t be a mirage,” p. 831), should be
extended to include locally important crops.
Such crops generally are well adapted to
local conditions, form the basis of local food
systems, show remarkable resilience to envi-
ronmental change, and frequently possess
unique characteristics that are in demand on the
global marketplace (1). Although the breeding
infrastructure for such species is often severely
underdeveloped and underfunded, breeding
can be facilitated by linkages to closely related
major crops (2). Strategies that aim to increase
or sustain crop diversity in agricultural pro-
duction systems have many benefi ts, includ-
ing the maintenance of cultural practices and
traditional knowledge, balanced nutrition,
increased resilience to climate extremes, and
exploitation of a broader array of environ-
ments for food production. HANNES DEMPEWOLF,1* PAUL BORDONI,2 LOREN
H. RIESEBERG,1 JOHANNES M. M. ENGELS2
1The Biodiversity Research Centre and Department of Botany, University of British Columbia, Vancouver, BC V6T 1Z4, Can-ada. 2Bioversity International, 00057 Maccarese, Rome, Italy.
*To whom correspondence should be addressed. E-mail: [email protected]
References 1. R. L. Naylor et al., Food Pol. 29, 15 (2004). 2. R. J. Nelson et al., Crop Sci. 44, 1901 (2004).
Food Security: GM Crops
Threaten BiodiversityTHE SPECIAL SECTION ON FOOD SECURITY (12 February, p. 797) appeared to strongly and
uncritically support the application and devel-
opment of genetically modifi ed (GM) technol-
ogies and the reliance on agrochemicals. There
was little appreciation of the confl icts that are
likely to arise. Increased access to expensive
nonrenewable inputs, along with increased
public acceptance and trust of GM crops, could
threaten biodiversity (1, 2) and overall sustain-
ability of agriculture. The articles should have
acknowledged the success of non-GM alter-
natives, such as observed increases in yields
resulting from low-input ecological practices
on rainfed farms (3).
In their Review for the section (“Food
security: The challenge of feeding 9 billion
people,” p. 812), H. C. J. Godfray et al. wrote,
“we must avoid the temptation to further sac-
CORRECTIONS AND CLARIFICATIONS
Perspectives: “A test for geoengineering?” by A. Robock et al. (29 January, p. 530). In the third paragraph, the sentence “Some authors have argued that the effects of polar testing could be confi ned to the Arctic (4)” should read, “Some authors, in simulations designed to control Arctic climate, have confi ned radiative forcing to the Arctic (4).” In the fourth paragraph, the phrase “Even if insertion does indeed have to end up as planetwide” should read “Even if insertion does indeed have to end up affecting a large part of the planet….”
Association Affairs: “Refl ections on: Our planet and its life, origins, and futures” by J. J. McCarthy (18 December 2009, p. 1646). In the second sentence of the Fig. 10 caption, the allowed emissions should have been referred to as gray, not blue.
Reports: “Imaging the interaction of the heliosphere with the interstellar medium from Saturn with Cassini” by S. M. Krimigis et al. (13 November 2009, p. 971). Because of a conversion error, on p. 973, fi rst column, line 15, the expres-sion (B2/2µ
0 = 0.25 pPa), and in Fig. 4 the label at lower right P
B ~ 0.25 pPa are both inconsistent with the value com-
monly assumed for the interstellar magnetic fi eld (ISMF) of 0.25 nT (brought to the authors’ attention by J. F. Cooper). The value of 0.25 nT for the ISMF corresponds to a pressure of 0.025 pPa. For the hot plasma pressure that was estimated (0.31 pPa) from the measurements to be balanced by the external ISMF, the external fi eld would need to be ~0.9 nT.
Published by AAAS
on
Mar
ch 4
, 201
1w
ww
.sci
ence
mag
.org
Dow
nloa
ded
from

www.sciencemag.org SCIENCE VOL 328 9 APRIL 2010 171
LETTERS
rifi ce Earth’s already hugely depleted biodi-
versity for easy gains in food production.”
By being held hostage to the agro-industrial
“machine,” we succumb to that temptation.
REYES TIRADO* AND PAUL JOHNSTON
Greenpeace Research Laboratories, School of Biosciences, University of Exeter, Exeter EX4 4RN, UK.
*To whom correspondence should be addressed. E-mail: [email protected]
References 1. E. J. Rosi-Marshall et al., Proc. Natl. Acad. Sci. U.S.A.
104, 16204 (2007).
2. J. Schmidt, C. Braun, L. Whitehouse, A. Hilbeck, Arch.
Environ. Contam. Toxicol. 56, 221 (2009).
3. J. N. Pretty, J. I. L. Morison, R. E. Hine, Agric. Ecosys.
Environ. 95, 217 (2003).
Food Security: Rigorous
Regulation Required
WE AGREE WITH N. V. FEDOROFF ET AL. THAT
the U.S. regulatory framework for agricul-
tural biotechnology needs serious reexami-
nation (“Radically rethinking agriculture
for the 21st century,” Perspectives, spe-
cial section on Food Security, 12 February,
p. 833). However, we disagree with their
suggestion that regulators should relax
oversight to facilitate biotechnology prod-
ucts’ entry into the market. The existing
framework is already too weak. For exam-
ple, under current food laws, the Food
and Drug Administration (FDA) does not
require data, review it, and then use it to
conclude that biotech plant foods are safe
(1). Instead, the agency reviews stud-
ies submitted by product developers and
issues letters that simply restate the devel-
opers’ conclusions about the safety of their
products [e.g., (2)]. Understanding that this
cozy approach would be unacceptable for
biotech food animals, FDA regulates them
under stronger, but inappropriate, authority
as drugs (3).
The authors are wrong to assert that
genetically modifi ed (GM) crops are safe
because we’ve consumed them “without
incident” for 15 years. First, no agency col-
lects data to evaluate adverse incidents, and
because GM foods aren’t labeled, consum-
ers experiencing problems would not know
to report them as such. Second, the relative
safety of the insect- and herbicide-resistant
crops that dominate today says little about
the safety of more complex traits the indus-
try has promised for the future.
There are some benefi ts associated with
GM crops, but the authors oversell their
virtues. Insect-resistant crops have reduced
insecticide use, but this is offset by the surge
in herbicide use due to resistant weeds (4).
GM corn and soy yields have indeed risen,
but the increase is largely due to the success
of classical breeding and other practices, not
GM traits (5). Finally, further increases in
no-till farming would have environmental
payoffs, but recent research has called into
question the extent of its carbon sequestra-
tion benefi ts (6–8).
We applaud the authors’ recommendation
to radically rethink the U.S. agriculture sys-
tem, but it might be simpler than they suggest.
Cover-cropping and four-crop rotations for
commodity crops, for example, would enable
farmers to reduce pesticide use and nitrogen
fertilizer pollution [e.g., (9, 10)] without
ever encountering a federal regulator. Policy-
makers should prioritize increased research
support to optimize such methods and pro-
vide incentives for farmers to adopt them.MARGARET MELLON
Food and Environment Program Director, Union of Con-cerned Scientists, Washington, DC 20006, USA. E-mail: [email protected]
Published by AAAS
on
Mar
ch 4
, 201
1w
ww
.sci
ence
mag
.org
Dow
nloa
ded
from

LETTERS
References and Notes 1. U.S. Food and Drug Administration, “Consultation pro-
cedures under FDA’s 1992 statement of policy: Foods derived from new plant varieties” (1997); www.fda.gov/Food/GuidanceComplianceRegulatoryInformation/GuidanceDocuments/Biotechnology/ucm096126.htm.
2. A letter from FDA to a biotechnology developer at the conclusion of a safety review includes the following: “Based on the safety and nutritional assessment that Pioneer has conducted, it is our understanding that
Pioneer has concluded that the new soybean variety is not materially different in any respect relevant to food or feed safety compared to soybean varieties currently on the market and that the genetically engineered soybean does not raise issues that would require premarket review or approval by FDA” (emphasis added); www.fda.gov/Food/Biotechnology/Submissions/ucm155567.htm.
3. U.S. Food and Drug Administration, “Guidance for indus-try: Regulation of genetically engineered animals con-taining heritable recombinant DNA constructs, fi nal guid-ance” (2009); www.fda.gov/downloads/AnimalVeterinary/GuidanceComplianceEnforcement/GuidanceforIndustry/UCM113903.pdf.
4. C. Benbrook, “Impacts of genetically engineered crops on pesticide use: The fi rst thirteen years” (The Organic Cen-ter, Boulder, CO, 2009); www.organic-center.org/science.pest.php?action=view&report_id=159.
5. D. Gurian-Sherman, “Failure to yield: Evaluating the performance of genetically engineered crops” (Union of Concerned Scientists, Cambridge, MA, 2009); www.ucsusa.org/food_and_agriculture/science_and_impacts/science/failure-to-yield.html.
6. J. M. Baker et al., Agric. Ecosys. Environ. 118, 1 (2007). 7. H. Blanco-Canqui, R. Lal, Soil Sci. Soc. Am. J. 72, 693
(2008). 8. V. Poirier et al., Soil Sci. Soc. Am. J. 73, 255 (2009). 9. M. Liebman et al., Agron. J. 100, 600 (2008). 10. C. Tonitto et al., Agric. Ecosys. Environ. 112, 58 (2005).
Food Security: Focus on AgricultureTHE REVIEW BY H. C. J. GODFRAY ET AL. (12 February, p. 812) and the rest of the special
section on Food Security call for a multifac-
eted approach to future global food security.
We would like to emphasize three agricultural
issues that were lacking.
First, it is important to analyze yield
as the result of genotype, environment,
and management interactions. This type of
analysis permits a nuanced understanding
of the factor(s) that lie behind regional dif-
ferences in yield gaps, especially between
developed- and developing-country agri-
culture. These insights can then be used to
apply more targeted research as needed.
Second, we must pursue the fastest route to
improved yield. We have 30 to 40 years, and it
can take 10 to 15 years to develop a food crop
variety that can be cultivated extensively in
farmers’ fi elds. We have little time to experi-
ment with totally new crop plants and need to
work with currently available genetic mate-
rial. Poor farmers in Africa will benefi t sooner
by having access to plentiful and inexpensive
nitrogen and phosphorus fertilizer than by
waiting for possible N-fi xing cereal crops.
Third, there needs to be a focus on scenario-
building exercises for agriculture—the kind
used in the development of the Millennium
Ecosystem Assessment and the IPCC reports.
Major drivers such as regional or global agri-
cultural markets should be analyzed against
low or high impacts of environmental change
(including climate) on agriculture. Such sce-
nario analyses recognize that agriculture is
more than just food production; this is a cru-
cial perspective, given that 45% of the global
population depends on agriculture for their
livelihoods. JOHN R. PORTER,1* ANDREW CHALLINOR,2
FRANK EWERT,3 PETE FALLOON,4 TONY FISCHER,5
PETER GREGORY,6 MARTIN K. VAN ITTERSUM,7
JØRGEN E. OLESEN,8 KENNETH J. MOORE,9
CYNTHIA ROSENZWEIG,10 PETE SMITH11
1Department of Agriculture and Ecology, University of Copenhagen, 1870 Copenhagen, Denmark. 2Insti-tute for Climate and Atmospheric Science, University of Leeds, Leeds LS2 9JT, UK. 3Institute of Crop Science and Resource Conservation, University of Bonn, Katzenburg-weg 5, D-53115 Bonn, Germany. 4Hadley Centre, FitzRoy Road, Exeter EX1 3PB, UK. 5ATSE Crawford Fund, One Geils Court, Deakin, 2600 ACT, Australia. 6Scottish Crop Research Institute, Invergowrie, Dundee DD2 5DA, Scotland, UK. 7Plant Production Systems Group, Wageningen University, Droevendaalsesteeg 1, 6708 PB Wageningen, The Nether-
Published by AAAS
on
Mar
ch 4
, 201
1w
ww
.sci
ence
mag
.org
Dow
nloa
ded
from

www.sciencemag.org SCIENCE VOL 328 9 APRIL 2010 173
LETTERS
lands. 8Department of Agroecology and Environment, Univer-sity of Aarhus, Blichers Allé, DK-8830 Tjele, Denmark. 9Depart-ment of Agronomy, Iowa State University, 2101 Agronomy Hall, Ames, IA 50011–1010, USA. 10NASA Goddard Institute for Space Studies, 2880 Broadway, New York, NY 10025, USA. 11Institute of Biological and Environmental Sciences, Univer-sity of Aberdeen, Aberdeen AB24 3UU, Scotland, UK.
*To whom correspondence should be addressed. E-mail: [email protected]
Food Security: Fossil FuelsTHE SPECIAL SECTION ON FOOD SECURITY (12
February, p. 797) omitted two points. First,
addressing the unmet need for voluntary,
cost-effective family planning (1) deserves
mention as a means for improving global food
security in the coming decades. Second, any
discussion of food security should address
the dangerously heavy dependence of global
agriculture on fossil fuels. Although several
authors stressed the need for sustainability
in agricultural systems, none even alluded to
the virtual certainty that the peak of global oil
production will occur before 2050. The rise
in food prices in 2008 and the attendant civil
unrest derived in part from the extreme rise
in the costs of oil and of fertilizer. The poten-
tial for similar disruption in the future—
possibly as soon as the global economy
recovers—deserves serious consideration.RICHARD E. WHITE1* AND RICHARD GROSSMAN2
1Sustainability Alliance of Southwest Colorado, Du rango, CO 81302, USA. 2Department of Biology, Fort Lewis College, Durango, CO 81301, USA.
*To whom correspondence should be addressed. E-mail: [email protected]
Reference 1. S. Singh et al., Adding it Up: The Benefi ts of Investing in
Sexual and Reproductive Health Care (Alan Guttmacher
Institute, New York, 2003).
Food Security:
Perception FailuresTHE SPECIAL SECTION ON FOOD SECURITY (12
February, p. 797) examines several obstacles to
achieving global food security. One obstacle the
section did not address is perception failure.
Perception failure poses an imminent dan-
ger to the advancement of science. Consumer
resistance to genetically modifi ed (GM) prod-
ucts affects trade relations and reduces private
research and development on plant biotechnol-
ogy (1). A case in point is the recent rejection
of GM eggplant in India, detailed in the News
of the Week story by P. Bagla in the same issue
(“After acrimonious debate, India rejects GM
eggplant,” p. 767). GM technology is not new
to India; Bacillus thuringiensis (Bt) cotton was
fi rst commercialized in India in 2002. Since
then, about 5 million farmers have adopted
the technology (2). Thus, negative experiences
with GM crops cannot explain the rejection
of Bt eggplant. Nor can regulation—India’s
highest biotechnology regulatory body, The
Genetic Engineering Approval Committee,
approved the Bt eggplant, deeming the tech-
nology safe (recounted in Bagla’s News story).
The major obstacle stemmed not from inad-
equate technology or strict regulations, but
from the public’s perception of the technology.
Bridging the gap between science and society
needs to be a high priority in order to put all
currently available science to effi cient use in
addressing global food security concerns. ARJUNAN SUBRAMANIAN,1,2*
KERRY KIRWAN,1 DAVID PINK2
1Warwick Manufacturing Group, University of Warwick, Coventry CV4 7AL, UK. 2Warwick HRI, University of Warwick, Coventry CV35 9EF, UK.
*To whom correspondence should be addressed. E-mail: [email protected]
References 1. J. Huang, S. Rozelle, C. Pray, Q. Wang, Science 295, 674
(2002).
2. C. James, ISAAA Briefs 39 (2008).
Published by AAAS
on
Mar
ch 4
, 201
1w
ww
.sci
ence
mag
.org
Dow
nloa
ded
from