for official use com/tad/ca/env/epoc(2015)5 - o.n.e
TRANSCRIPT
For Official Use COM/TAD/CA/ENV/EPOC(2015)5 Organisation de Coopération et de Développement Économiques Organisation for Economic Co-operation and Development 30-Mar-2015
___________________________________________________________________________________________
_____________ English - Or. English TRADE AND AGRICULTURE DIRECTORATE
ENVIRONMENT DIRECTORATE
Joint Working Party on Agriculture and the Environment
THE IMPACTS OF VARIOUS FARM MANAGEMENT PRACTICES ON RESOURCE EFFICIENCY
AND PRODUCTIVITY
27-28 April 2015
OECD Conference Centre
Paris, France
This document is submitted for DECLASSIFICATION at the 39th session of the Joint Working Party on
Agriculture and the Environment, to be held from 27-28 April 2015.
This work is mandated under the Programme of Work and Budget 2013-14 (Output Area 3.2.3: Agriculture and
Fisheries Sustainability, 3.2.3.2.1 Green Growth for Agriculture and Food).
Item 5(b) of the Draft Agenda.
Contact person:
Dimitris DIAKOSAVVAS
Email: [email protected]
JT03373329
Complete document available on OLIS in its original format
This document and any map included herein are without prejudice to the status of or sovereignty over any territory, to the delimitation of
international frontiers and boundaries and to the name of any territory, city or area.
CO
M/T
AD
/CA
/EN
V/E
PO
C(2
01
5)5
Fo
r Officia
l Use
En
glish
- Or. E
ng
lish
COM/TAD/CA/ENV/EPOC(2015)5
2
NOTE BY THE SECRETARIAT
This work is mandated under the Programme of Work and Budget 2013-14 (Output
Area 3.2.3: Agriculture and Fisheries Sustainability, 3.2.3.2.1 Green Growth for Agriculture and Food).
It complements the work currently undertaken on the analysis of policy options and market approaches for
green growth for agriculture and food.
A scoping paper outlining the Secretariat’s plans to analyse the impacts of various management
practices, such as organic farming, on resource productivity and efficiency was discussed at the meeting of
the Joint Working Party Agriculture and the Environment (JWPAE) held in April 2013 [Analysis of the
Impacts of Various Management Practices on Resource Productivity and Efficiency – Scoping Paper,
COM/TAD/CA/ENV/EPOC(2013)16].
A document providing a literature review of the impacts of conservation farm management practices
and organic farming efficiency was discussed at the meeting of the JWPAE held in November 2013
[Impacts of Conservation Farm Management Practices on Resource Productivity and Efficiency –
Progress Report, COM/TAD/CA/ENV/EPOC(2013)47].
A document examining the case of new science and generic technologies offering possibilities of
greening farm management practices was discussed at the meeting of the JWPAE held in April 2014 [The
impacts of various farm management practices on resource productivity and efficiency – the case of
modern biotechnology and precision agriculture, COM/TAD/CA/ENV/EPOC(2014)12].
At the meeting of the JWPAE held in November 2014 two documents were presented: one examining
the case of Integrated Pest Management (IPM) COM/TAD/CA/ENV/EPOC/RD/(2014)39] and another one
analysing the case of conservation agriculture in Australia [COM/TAD/CA/ENV/EPOC/RD(2014)40].
This document brings together all the above work and incorporates comments submitted by
Delegations, as well as some new material
This document is submitted to the Joint Working Party for DECLASSIFICATION.
COM/TAD/CA/ENV/EPOC(2015)5
3
TABLE OF CONTENTS
THE IMPACTS OF VARIOUS FARM MANAGEMENT ON RESOURCE EFFICIENCY AND
PRODUCTIVITY............................................................................................................................................ 6
EXECUTIVE SUMMARY ............................................................................................................................. 6
Farmer-led management system innovations ............................................................................................... 6 Science-led technologies with green growth potential ................................................................................ 7 Preliminary policy recommendations .......................................................................................................... 8
CHAPTER 1. INVESTIGATING FARM MANAGEMENT PRACTICES THAT MAY FOSTER GREEN
GROWTH ....................................................................................................................................................... 9
CHAPTER 2. ANALYSING SOIL AND WATER CONSERVATION PRACTICES TO ACCELERATE
THE TRANSITION TO GREEN GROWTH ............................................................................................... 12
Main messages ........................................................................................................................................... 12 Improving agriculture’s soil footprint by promoting soil conservation practices ...................................... 12 Productivity and efficiency gains, but types of soil and crops critical ....................................................... 17 Improving agriculture’s water footprint by promoting water conservation practices ................................ 20 High productivity, efficiency and innovation impacts, but empirical assessment is challenging .............. 22
CHAPTER 3. WHAT ORGANIC FARMING MEANS FOR GREEN GROWTH? ................................... 25
Main messages ........................................................................................................................................... 25 A rapidly growing sector ........................................................................................................................... 25 Wide-ranging policy approaches used by OECD governments ................................................................. 27 Is organic agriculture economically viable? .............................................................................................. 30 Is organic agricultural environmentally sound? ......................................................................................... 32 Does organic farming trigger innovations? ................................................................................................ 35 Does organic farming create jobs? ............................................................................................................. 36
CHAPTER 4. UNLEASHING THE GREEN GROWTH POTENTIAL OF INTEGRATED PEST
MANAGEMENT .......................................................................................................................................... 38
Main messages ........................................................................................................................................... 38 Lack of an unambiguously agreed definition renders understanding, use in policy and assessment of
impacts difficult ......................................................................................................................................... 38 Complexity of the concept hinders adoption ............................................................................................. 40 Wide-ranging positive on- and off-farm economic impacts, albeit limited empirical evidence ................ 41 Positive environmental impacts ................................................................................................................. 43 Gains spread beyond off-farm, but impacts on human and social capital difficult to assess ..................... 44 Factors influencing the emergence and spread of IPM .............................................................................. 45
National policies and international initiatives in force to reduce risks from pesticide use provide a push
for IPM ................................................................................................................................................... 45 Advances in science and technology are important drivers for reducing the perceived risk of low yields
in IPM ..................................................................................................................................................... 48 Enabling policy environment necessary to overcome barriers of adoption ............................................ 51
Lessons about best-policy practices ........................................................................................................... 52 Selected examples of successful IPM programmes ................................................................................ 52 Best-policy practices to address barriers and increase IPM adoption .................................................... 54
COM/TAD/CA/ENV/EPOC(2015)5
4
CHAPTER 5. THE CRITICAL ROLE OF MODERN AGRICULTURAL BIOTECHNOLOGY IN
SCALING OUT PRODUCTIVITY .............................................................................................................. 57
Main messages ........................................................................................................................................... 57 What is biotechnology and how is it used in agriculture? ......................................................................... 57 How widespread is biotechnology in agriculture? ..................................................................................... 60 Profitability expectations are mainly based on yields and relative costs ................................................... 63
Higher yields .......................................................................................................................................... 65 Labour use and productivity positive impacts mainly evident in non-OECD countries ........................ 65 Pesticide use reduction will benefit the environment ............................................................................. 66 Fertiliser use efficiency uncertain .......................................................................................................... 66 Impacts on biodiversity are ambiguous and context-specific ................................................................. 66
Additional potential beneficial environmental implications, but limited scientific evidence .................... 67 Environmental and other economic concerns impede adoption ................................................................ 68 Public R&D investment an important factor in enhancing availability and accessibility of new
biotechnologies .......................................................................................................................................... 68 Assuring safety at reasonable cost indispensable for the development of modern agricultural
biotechnology over time ............................................................................................................................ 70 Attaining the greatest benefits to the society will require governments to specifically take into
consideration public perceptions and risk communication ........................................................................ 71
CHAPTER 6. PRECISION AGRICULTURE – A NEW REVOLUTION IS EMERGING? ...................... 73
Main messages ........................................................................................................................................... 73 Applying the right treatment in the right place at the right time ... ............................................................ 73 … but adoption by farmers is low .............................................................................................................. 75 Important efficiency and resource productivity gains ................................................................................ 79 Positive employment effect in the up- and down-stream sectors, but variable for the on-farm sector ...... 82 Improved environmental footprint of agriculture ...................................................................................... 82 Impediments to nurturing the green growth potential ................................................................................ 83
Farm structural characteristics are critical drivers of adoption .............................................................. 83 High level of farmer expertise is required .............................................................................................. 84 High start-up costs hinder adoption ........................................................................................................ 85
ANNEXES .................................................................................................................................................... 87
ANNEX 1: Integrated Pest Management ................................................................................................... 87 Principles, concepts and practices .......................................................................................................... 87 Adoption of IPM practices across countries ........................................................................................... 90
Annex 2. Modern agricultural biotechnology ............................................................................................ 94 Types of transgenic traits in commercial cultivation ............................................................................. 94 Empirical evidence of the effects of biotech crops ................................................................................ 95
REFERENCES ............................................................................................................................................ 107
Chapter 1. Investigating farm management practices that may foster green growth ............................... 107 Chapter 2. Analysing soil and water conservation practices to accelerate the transition to green growth107 Chapter 3. What does organic farming mean for green growth? ............................................................. 113 Chapter 4. Unleashing the green growth potential of integrated pest management ................................. 118 Chapter 5. The critical role of modern agricultural biotechnology in scaling out productivity ............... 126 Chapter 6. Precision agriculture – a new revolution is emerging? .......................................................... 135
COM/TAD/CA/ENV/EPOC(2015)5
5
Tables
Table 2.1. Effects of traditional tillage, conservation tillage and conservation agriculture ....................... 15 Table 2.2. Changes in pesticide concentrations in runoff due to the creation of buffer zones .................. 24 Table 6.1. Precision agriculture tools used by Wimmera Conservation Farming Association members in
2006 ........................................................................................................................................................... 77 Table 6.2. Proportions of farms using precision farming techniques ........................................................ 79 Table 6.3. Estimated costs for three site-specific fertilisation strategies ................................................... 84 Table 6.4. Reasons for hesitating with the introduction of PF*. Group of potential PF-Users (more than
one possible answers) ................................................................................................................................ 86 Annex Table A2.1. Extent of the adoption of conservation agriculture .................................................... 99 Annex Table A3.1. Organic agricultural land and share of total agricultural land, by country 2005 and
2013 ......................................................................................................................................................... 100 Annex Table A5.1. Global area of biotech crops in 2014, by country .................................................... 102 Annex Table A6.1. Economic benefits of precision agriculture technologies ......................................... 103
Figures
Figure 2.1. Adoption of conservation agriculture in OECD countries - share in total cultivated area, 2011
or most recent year ..................................................................................................................................... 16 Figure 3.1.Organic agriculture in OECD countries - share in total agricultural land, 2013 ...................... 27 Figure 5.1. Percentage of biotechnology R&D by application, latest available year ................................ 69 Figure 6.1. Variable Rate Application (2013 Base: 171) ........................................................................... 78 Figure 6.2. Use of precision agriculture technology over time .................................................................. 78 Annex Figure A1.1. The concept of economic injury level ....................................................................... 89 Annex Figure A1.2. Economic injury level and action (economic) threshold ........................................... 89 Annex Figure A5.1. Global area of biotech crops, by country, crop and trait, 2014 (%) ........................ 101
Boxes
Box 1.1. Assessing the impacts of farm management practices on resource productivity: defining the
concepts ..................................................................................................................................................... 10 Box 2.1. What is conservation agriculture? ............................................................................................... 13 Box 2.2. Management water resources efficiently - the case of Israel ...................................................... 21 Box 3.1. The French organic sector ........................................................................................................... 29 Box 4.1. What is IPM? ............................................................................................................................... 39 Box 4.2. Netherlands - Farming with Future............................................................................................. 40 Box 4.3. What does the empirical evidence show? .................................................................................... 42 Box 4.4. IPM and climate change .............................................................................................................. 43 Box 4.5. International initiatives to restrict the use of hazardous pesticides ............................................. 46 Box 4.6. Germany's Action Thresholds and US's eXtension initiatives .................................................... 49 Box 5.1. OECD’s definition of biotechnology .......................................................................................... 58 Box 5.2. Genomics : the new revolution .................................................................................................... 59 Box 5.3. Bio-fortification: creating Golden Rice ....................................................................................... 60 Box 5.4. Biotech crops in the United States .............................................................................................. 61 Box 5.5. EU legislative framework covering GMOs ................................................................................. 63 Box 5.6. The Gene Technology Act in Australia ....................................................................................... 71 Box 6.1. What is precision agriculture? ..................................................................................................... 74 Box 6.2. Economic impacts: what does the empirical evidence show? ..................................................... 80
COM/TAD/CA/ENV/EPOC(2015)5
6
THE IMPACTS OF VARIOUS FARM MANAGEMENT ON RESOURCE EFFICIENCY AND
PRODUCTIVITY
EXECUTIVE SUMMARY
1. Resource use efficiency has become a key priority for policymaking in OECD countries and a
core element of green growth strategies. This document provides a synoptic review of a selection of farm
management practices with green growth potential: i) farmer-led management system innovations, such as
those relating to soil and water, organic agriculture and Integrated Pest Management (IPM); and
ii) science-led technologies, such as biotechnology and precision agriculture. The focus of this report on
these farm management practices does not, however, imply that other farm practices are not also beneficial
to green growth.
Farmer-led management system innovations
2. As compared to conventional farming, the economic productivity of farmers practicing soil and
water conservation, and organic is mixed: i) there is ambiguity as concerns yields because they are
improved under certain agro-ecological regimes and decrease under others; ii) the cost for material inputs,
energy and nutrients is reduced in the soil conservation practices, even in the case where inorganic
fertilisers are needed to sustain yields under no tillage; and iii) capital inputs are increased in certain soil
conservation methods, while labour inputs are almost always increased. On average, their yields tend to be
lower, although this varies between OECD countries and between agricultural products.
3. The effects on resource productivity are clear. Soil and water conservation practices and organic
agriculture tend to reduce the use of non-energy materials and waste, and manage nutrients in an
environmentally sound way. The adoption of soil and water conservation practices by a large number of
farmers can potentially lower nutrient run-off and reduce GHG emissions, as well as sequester large
additional amounts of carbon; the effects of organic farming on GHG emissions are less certain. These
practices can also produce ecosystem services, especially in the preservation of biodiversity and rural
landscapes. Evidence from research, field trials and farm experience generally shows that organic
agricultural practices are more environmentally friendly than conventional agriculture. However, the full
extent of resource productivity and environmental advantages of soil and water conservation management
systems can only arises after these practices have been in place for several years.
4. Conservation farm practices and organic agriculture could also trigger innovations in non-
agricultural sectors, such as machinery, the chemical industry and the bio-engineering sectors. These
results, however, should be viewed against increasing demand for food and feed. Even in the case where
conservation agriculture is successful in maintaining yields equivalent to those found in conventional
agriculture, increasing food demand and the signals of rising prices may put additional stress on soil
resources and in particular on the conversion of land to agriculture. This can lead to converting to
agricultural use land that may have potential alternative value (e.g. as a nature area).
5. Concerning employment, the available evidence suggests diverse range of impact. On balance,
soil conservation practices decrease labour requirements, but water conservation practices are more labour-
intensive. Organic farming, involves higher on-farm labour-intensity, with the potential to generate
COM/TAD/CA/ENV/EPOC(2015)5
7
additional off-farm labour, through its links with food processing, marketing and retailing. Moreover, in
several countries the positive image of organic farming favours tourism and the creation of associated
small businesses in rural areas.
6. For IPM, the effects on yields, farm profits, farm incomes on the environment appear to be
positive. By adopting low input and integrated techniques, the use of pesticides can be reduced. Evidence
on the employment effects is limited.
7. The difficulties involved in evaluating the overall impact of farmer-led farming practices on
green growth in comparison with other farming systems should not be under-estimated, as technical
difficulties exist in defining the appropriate benchmarks for measurement and comparison. Also the
analysis of the number of new jobs potentially “created” by “green agriculture” should take into account
the jobs “lost” in more “conventional” segments of the sector as a result. Moreover, it should be
highlighted that the impacts are usually context-specific and vary considerably according to crop and agro-
ecological environment.
Science-led technologies with green growth potential
8. Modern agricultural biotechnology includes both modern biotechnology and many traditional
biotech activities. In general, it refers to the combination of life-sciences and engineering that includes
DNA technology. Despite the controversy it has generated in some countries, agricultural biotechnology
impacts positively crop and animal productivity, yield stability and environmental sustainability. In
principle, it can be applied to all crops and, as it is largely scale-neutral, the possibilities for its widespread
adoption by both small- and large-scale farmers are considerable.
9. Although the use of biotech crops has increased steadily, its adoption has been uneven across
countries and its commercialisation has involved only mainly feed crops – and few traits. Today, second-
and third-generation products are addressing more complex challenges, such as drought tolerance and
nitrogen-use efficiency, but substantial research efforts are still needed.
10. In general, the evidence suggests that the application of modern biotechnology in agriculture has
resulted in: net economic benefit; reduced GHGs and release of toxic active ingredients into the
environment; reduced land use pressure; major employment effects in the up- and down-stream sectors;
and lowered prices for major agricultural commodities, namely cotton, maize, oilseed rape and soybean.
However, environmental benefits are context-specific and heavily dependent on thoughtful management
practices that avoid the build-up of insect and weed resistance.
11. An important opportunity to contribute to the agricultural green growth agenda will be missed if
the potential risks and benefits of modern agricultural biotechnology cannot be objectively evaluated on
the basis of the best available scientific evidence. Imposing high regulatory barriers to respond to
uncertainties could result in a high cost to society by restricting or slowing its access to beneficial
technologies. Indeed, a key lesson from the analysis is that the economic gains from the widespread
adoption of biotech crops cannot be realised unless such technology is accepted by society.
12. Finally, this report analyses the possibilities of precision agriculture – a whole-farm management
approach with the objective of optimising returns on inputs, while improving agriculture’s environmental
footprint. A wide range of technologies are available, but the most widely adopted precision farming
technologies are knowledge-intensive (e.g. GPS guidance). Information on precision agriculture adoption
is based on sporadic and geographically dispersed surveys as countries do not regularly collect data.
13. Precision agriculture can contribute to higher productivity and resource efficiency in regard to
both natural resources and farm inputs, thereby mitigating environmental problems associated with
COM/TAD/CA/ENV/EPOC(2015)5
8
agriculture. In addition, precision agriculture has the potential to improve the environmental footprint
beyond farm-level (e.g. by its more efficient water productivity management). Its employment effects on
farms are variable, but positive in the up- and down-stream sectors. Nevertheless, with low adoption levels,
knowledge of the environmental effects of precision agriculture is still limited. Knowledge and technical
gaps, high start-up costs with a risk of insufficient return on investment, as well as structural (e.g. small
farm size) and institutional constraints are key obstacles to the adoption of precision agriculture by
farmers.
Preliminary policy recommendations
14. A preliminary conclusion is that agricultural policy should appropriate price signals on
environmental benefits and flexibility to allow for different practices or combinations of practices to apply
in the most suitable environments. A key policy challenge will be to ensure that the various environmental
externalities both positive and negative arising from farming systems are incentivised, so that farmers
can make decisions as to the most appropriate system to adopt to produce or avoid those externalities.
Ensure that policies to facilitate adoption of farm management practices with green growth
potential are coherent with other policies aiming at increasing productivity in a sustainable
manner.
Facilitate the creation and dissemination of credible, science-based information on farmer- and
science-led farm management practices to both farmers and the general public.
Improve the monitoring and assessment of the economic, environmental and social effects of
farm-management practices with green growth potential to improve understanding of the risks
involved and to inform policy decisions, as well as maximise its contribution to green growth.
Identify factors that would prevent the uptake of farm-management practices with green growth
potential.
Support international initiatives aimed at designing common guidelines on the definition of IPM
and on principles that establish the benchmarks by which to measure its uptake and impact.
Increase research in modern agricultural biotechnologies by increasing investment in public
research, reduce regulatory burdens, and encourage private-public partnerships and establish the
regulatory frameworks necessary to ensure that biotech applications meet acceptable bio-safety
and environmental standards.
COM/TAD/CA/ENV/EPOC(2015)5
9
Chapter 1. Investigating farm management practices that may foster green growth
15. The paramount objective of a “Green Growth” strategy in agriculture is to meet global food
demand in a sustainable way. This major challenge cannot be accomplished by a “business as usual”
approach. On the contrary, this challenge unwraps opportunities to new forms of agricultural production
and to innovative improvements of existing technologies. These opportunities, if realised, may be able to
provide a sustainable and environmentally sound use of resources and make a positive contribution to the
mitigation of climate change.
16. Farm management practices that increase the productivity, stability, and resilience of production
systems need to be encouraged and the technology for development must go well beyond just raising yields
to saving water and energy, reducing risk, improving product quality and protecting the environment.
17. The aim of this report is to analyse the effects on resource productivity and efficiency of key
farm management practices with green growth potential in OECD countries, based on a literature review. It
should be emphasised, however, that beyond the selected farm management practices, all farm
management systems, from intensive conventional farming to organic farming and science-led
technologies, have the potential to contribute to green growth in a specific natural and policy environment.
Whether they do or not, in practice, depends on farmers adopting the appropriate technology and practices
in the specific agro-ecological environment. This, in turn, can strongly depend on the right policy
framework. More intensive farming systems can co-exist with more extensive systems with the overall
effect of increasing productivity and natural resource efficiency in a sustainable manner.
18. The selected practices include farmer-led innovations (such as those directly linked to soil and
water, Integrated Pest Management, organic farming) and science-led technologies with green potential
(such as biotechnology and precision agriculture).
19. Concerning soil conservation management practices, the report reviews and examines
conservation tillage and its variants, conservation crop rotation, and soil nutrient management techniques.
Soil related problems are interlinked and, frequently, there is not a single solution or a single measure to
address all challenges. Rather, there is a wide range of solutions addressing multifaceted soil problems.
The attempt to institutionalise these solutions and address nation-wide soil problems has guided many
countries to adopt mandatory soil conservation policies, linked, or not, to their agricultural policies and
support payments.
20. Concerning water conservation practices, the report examines land management practices for
preparing fields for efficient irrigation and managing excess water, on farm water delivery systems and the
application of irrigation practices, irrigation water use management and protecting water from non-point
source pollution and sedimentation.
21. Organic agriculture is the most developed integrated management practices occupying almost 1%
of world’s agricultural land. Although, the rules of organic agriculture differ slightly from country to
country, some general practices apply to all organic cultivation systems around the world and the stages of
growing, storage, processing, packaging and shipping. Other integrated management practices, such as
precision agriculture and IPM present a “hybrid” approach between conventional practices and organic
agriculture.
COM/TAD/CA/ENV/EPOC(2015)5
10
22. Modern agricultural biotechnology can be applied to all classes of organism - from viruses and
bacteria to plants and animals - and it is becoming a major feature of modern agriculture. There are many
examples of biotechnology application in agriculture. It includes using micro-organisms to transform
materials (such as in fermentation), different methods of propagation (such as plant cloning or grafting)
and genetic alteration (through methods such as selective breeding). Biotechnology has the potential to
increase production and productivity in agriculture, and could lead to higher farm profitability.
23. Assessing the resource productivity of these farm practices extends well beyond a mere
examination of their conventional economic productivity. In this report a broad view of resource
productivity is adopted defined by the ratio of output to the various single resources used for production.
The following chapters analyse two key groups of indicators for each type of farm practice: their resource
productivity and their resource efficiency (the economic efficiency and environmental effectiveness a
production process is using natural resources).
24. Managing the natural resource base means matching farm practices with the agro-ecological and
socio-economic conditions that will maximise resource productivity (i.e. attain maximum yields with the
minimum use of resources, such as nutrients, water and soil); maximise environmental and energy
productivity (i.e. attain maximum yields with minimum total emissions and energy use) and maximise the
production of public goods (e.g. biodiversity) (Box 1.1).
Box 1.1. Assessing the impacts of farm management practices on resource productivity: defining the concepts
Economic productivity: measures the ability to produce by employing factors of production and resources. As such, the most widely used measures of productivity turn to simple ratios of output relative to inputs used to produce the output. In these ratios or indices the numerator is a measure of the output and the denominator is a measure of the employed resource/factors. Depending on what the numerator measures, productivity measures are categorised as partial or multifactor. In the partial factor productivity context, the numerator measures only the input by one single factor (e.g. hours of labour used for the production of the output), while a multifactor productivity setting measures the change in output per unit of a combination of factors (e.g. combined capital and labour input). Multifactor measures are designed to measure the joint influences of technological change, efficiency improvements, returns to scale, reallocation of resources, and other factors of economic growth, allowing for the effects of capital and labour.
Resource productivity: the ratio of output to the various single resources used in the production. Single resources
include non-energy materials, nutrients, water and soil (in terms of productive capability and land-use). Main nutrients include nitrogen and phosphorus, which may lead to surface and groundwater pollution, due to excessive commercial fertiliser-use and intensive livestock farming. For instance, high stress on water resources and the consequent low water productivity are related to the inefficient use of water and to its environmental and socio-economic consequences: low river flows, water shortages, salinization of freshwater bodies in coastal areas, human health problems, loss of wetlands, desertification and reduced food production.
Energy productivity: the ratio of output to energy use. Energy productivity is closely related to the effects on greenhouse gas emissions and on local and regional air pollution. Energy productivity reflects, at least partly, efforts to improve energy efficiency and to reduce carbon and other atmospheric emissions. Energy productivity also is associated to water abstraction and intensity of land-use, which both absorb the largest amount of energy needed by agriculture.
25. The concept of resource productivity and efficiency is understood to contain both a quantitative
dimension (e.g. the quantity of output produced with a given input of natural resources) and a qualitative
dimension (e.g. the environmental impacts per unit of output produced with a given natural resource input)
(for the various indicators on natural resource and environmental productivity used in the context of green
growth in agriculture, see OECD, 2014).
COM/TAD/CA/ENV/EPOC(2015)5
11
26. The Secretariat has undertaken several studies related to farm management practices, particularly
in the context of analysing the environmental performance of agriculture and understanding the
environmental impact of agricultural support policies in OECD countries (see, for example,
OECD, 2012a). But the main focus of such work has been on the “green” impacts of the various farming
practices examined, while the “growth” dimension has been a lesser subject of focus. In contrast this report
will focus on both the “green” and “growth” impacts of these farm practices.
COM/TAD/CA/ENV/EPOC(2015)5
12
Chapter 2. Analysing soil and water conservation practices to accelerate the transition to green
growth
Main messages
The evidence concerning traditional economic productivity growth performance of soil or water
conservation practices compared to conventional farming is mixed.
Yields tend to be lower on farms that use conservation farm practices, but differences in yields vary
between OECD countries and between agricultural products. Yields of farming systems that have
adopted soil conservation practices improve under certain agro-ecological regimes and decrease under
others.
The effects of soil or water conservation practices on resource productivity are, overall, unambiguous.
Soil conservation practices tend to reduce the use of non-energy materials and waste, and manage
nutrients in an environmentally sound way.
The limited available evidence on the employment effects of soil and water conservation practices
suggests rather contrasting results: soil conservation seems to decrease labour requirements, while the
effects of water conservation is the opposite with heavy reliance on the labour-intensity of displaced
crops.
Improving agriculture’s soil footprint by promoting soil conservation practices
27. Soil erosion and desertification are global environmental issues. Soil degradation is related to soil
management practices, such as soil tillage, slash and burn management, deforestation, overgrazing, and
other human-induced pressures. These trends are aggravated by extreme climatic and topographic
conditions and climate change, which increase erosion and accelerate its effects. Current rates of land and
soil degradation are considered to be unsustainable. UNEP (2012) argues that 24% of the global land area
has already suffered declines in health and productivity over the past quarter-century as a result of
unsustainable land-use. The damage to organic matter due to land-clearing for agriculture and urban
development is responsible for the loss of an estimated 60% of the carbon stored in soils and vegetation
since the 19th century worldwide.
28. With more and more land being cultivated, it is now increasingly recognised that production
gains have been accompanied by negative environmental impacts, jeopardising the very future of
agriculture as intensive farming methods put a strain on the natural resources upon which they rely. For
example, in the EU, a study co-authored by the European Commission’s Joint Research Centre, found that
intense use of land for agriculture is the main pressure on soil biodiversity (Gardi, Jeffery and
Salteli, 2013).1
29. Conservation agriculture – which originated in Brazil in the 1970s – is based on the application
of three major principles of agro-system management: i) minimal soil disturbance; ii) protection of the soil
through the permanent maintenance of plant cover at the surface; and iii) the diversification of rotations
COM/TAD/CA/ENV/EPOC(2015)5
13
and intercropping (Box 2.1). The diversity of production conditions and of farmers’ needs have led to a
considerable diversification of practices in the application of these three principles.
Box 2.1. What is conservation agriculture?
FAO defines conservation agriculture as “an approach to managing agro-ecosystems for improved and sustained productivity, increased profits and food security while preserving and enhancing the resource base and the environment” (www.fao.org/ag/ca/1a.html; FAO, 2001). It comprises the following conservation farm practices:
Conservation (or zero) tillage: this is defined as any method of soil cultivation that leaves the previous year's
crop residue (such as maize stalks or wheat stubble) on the fields before and after planting the next crop, in order to reduce soil erosion and runoff. It minimises (or eliminates) tillage and maintains crop residues as ground cover (practices include no-till, strip-till, ridge-till and mulch-till) (Minnesota Department of Agriculture, 2012). Each of these four methods requires different types of specialised or modified equipment and adaptations in management. No-till and strip-till require that crops are planted crops directly into the residue. With the no-till method, the residue is not tilled at all. With the strip-till method the soil is tilled along narrow strips (zones) with the rest of the field left untilled. With ridge-till method, row crops are planted on permanent ridges about 4-6 inches high, with the previous year’s crop residue cleared off the ridge-tops into adjacent furrows, thus making way for the new crop to be planted on the ridges. (However, maintaining the ridges is essential and requires modified or specialised equipment). Mulch-till is any other reduced tillage system that leaves at least one-third of the soil surface covered with crop residue.
Conservation crop rotation: a farm practice in which several crops are planted in succession on the same field.
These crops should include at least one soil-conserving crop, such as perennial hay, or nitrate-trapping and nutrient-enriching crops, such as various legumes. Conservation crop rotation is similar and frequently practised with crop
cover activities.
Cover crops: all crops that are planted to provide seasonal soil cover on land when the soil would otherwise be
bare. Cover crops include various grasses, legumes or forbs and are planted before the main cash crop emerges in spring or after harvest in the autumn. The term “cover crops” includes various practices, such as winter cover crops, catch crops, smother crops, green manure and short-rotation forage crops. Winter cover crops aim to provide the soil with cover over winter in order to reduce water and wind erosion. Catch crops are planted immediately after harvesting the cash crop in order to reduce nutrient leaching. Smother crops are used as an environmentally friendly weed control practice. These crops, such as buckwheat and rye are able to out-compete major weeds. Other cover crops are used as green manure because they are incorporated into the soil in order to improve soil fertility. Finally, cover crops may be used for grazing or green chop to provide forage and are called short-rotation forage crops.
30. Conservation agriculture, thus, corresponds to a family of cropping systems rather than to a
single technology or system. In some cases, seeds are sown directly through the crop residues (drilling
directly through the stubble), while in others, the soil receives some light preparation to facilitate crops
planting. In all cases, changes related to the introduction of conservation agriculture go beyond a mere
change in soil tillage techniques, and must be considered in a broader context including other innovations,
such as the use of cover crops and intercropping for example.
31. The amount and type of tillage used in crop residue management systems have become critical
issues for farm managers and policymakers alike, as tillage practices affect nutrient availability, soil
structure and aggregate stability, soil strength and temperature, the soil-water relationship and the crop
residue cover. In addition, tillage consumes energy and affects soil carbon sequestration capacity with
consequent implications for GHG emissions. Loss of Soil Organic Carbon (SOC) has been primarily
assigned to tillage, while tilled soils are viewed as a depleted carbon reservoir (Reicosky, 2003).
32. Conservation (or zero) tillage methods, which are one of the most dramatic technological
revolutions in crop management, have many advantages over conventional tillage: increased profitability
from savings in labour and energy, soil conservation, improved tolerance to drought, and lower GHG
COM/TAD/CA/ENV/EPOC(2015)5
14
emissions. But they make the control of weeds, pests, and diseases more complex, and this usually requires
some use of herbicides.
33. On the other hand, conservation tillage is considered as a sustainable alternative to conventional
tillage because, by maintaining residue cover, it provides environmental benefits and improves both
agronomic and economic efficiency, which the reduction in fuel and labour expenditures, due to fewer
tillage passes over the field, can boost farm profits.
34. Likewise, conservation crop rotation practices reduce the risk of soil erosion and help to prevent
water runoff and improve the chemical and physical properties of the soil. At the same time, crop rotation
may provide supplemental forage and provide as substitute for part of the total agricultural inputs including
fertilisers, herbicides and water, due to the significant nitrogen storage and improvement of soil fertility,
the suppression of weeds and soil moisture retention.
35. Additionally, farms using crop residue management retain more moisture by trapping snow,
decreasing water evaporation from the top layer of soil, and improving water infiltration to plant root
systems. Environmental benefits include reduced soil erosion and water pollution (via reduced sediment,
fertiliser and pesticide runoff), and improved air quality (as soil particulates do not become airborne).
Reductions in tillage may, however, be associated with increased pest management costs in some climates
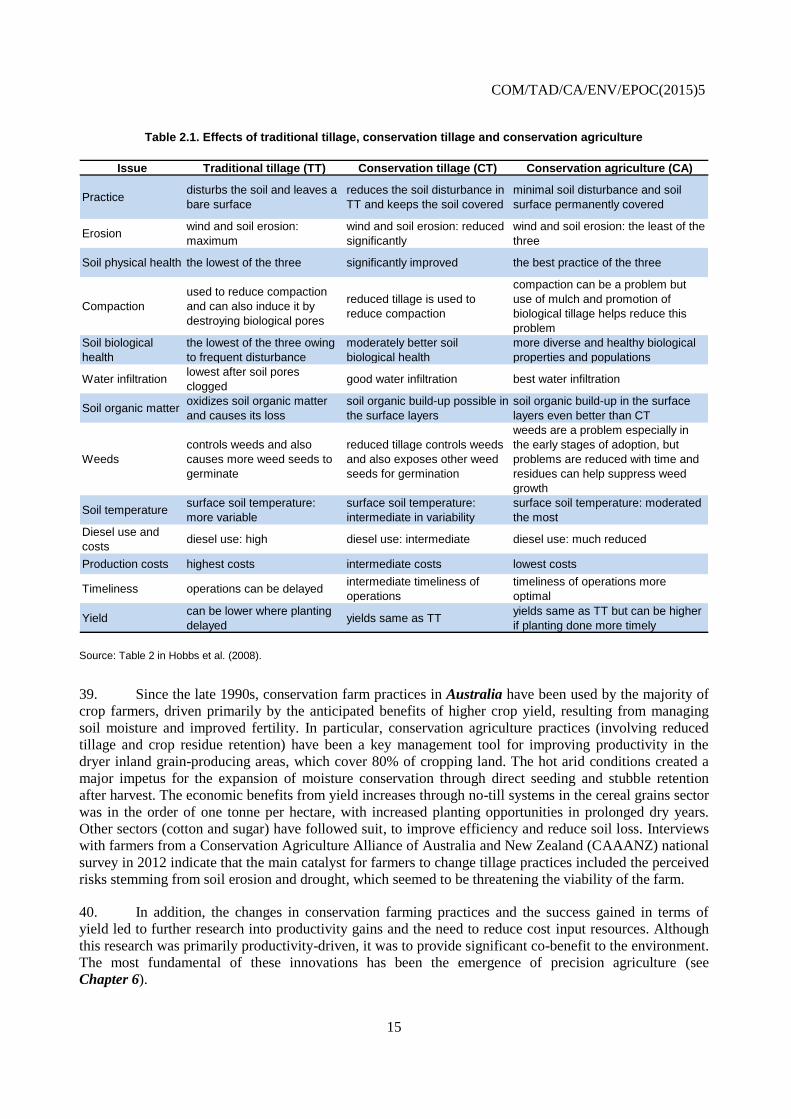
and crops (Ebel, 2012). Table 2.1 summarises the effects and benefits of conservation agriculture
contrasted with no-tillage (Hobbs et al., 2008).
36. Most OECD countries have developed programmes to encourage practices that are specifically
targeted at reducing the risk of soil erosion, including transfers of arable land to grassland, the extensive
use of pastures, green cover (mainly in the winter period) and the promotion of conservation practices.
37. Conservation agriculture and no-tillage techniques are developing rapidly in several countries.
According to data collected by FAO, conservation agriculture has expanded at an average rate of around
7 million hectares per year (from 45 to 125 million) over the period 1999-2011. In particular, the rate of
adoption globally since 1990 has been growing exponentially, mainly in North and South America and in
Australia and New Zealand (Friedrich, Derpsch and Kassam, 2012). Five countries account for almost
90% of the total global area under conservation agriculture: the United States (21%); Argentina and Brazil
(20%); Australia (14%); and Canada (13%) (Table A.2.1). Further, for seven countries the share of
cultivated area under conservation agriculture is equal or larger than 30% (Argentina, Brazil, Australia,
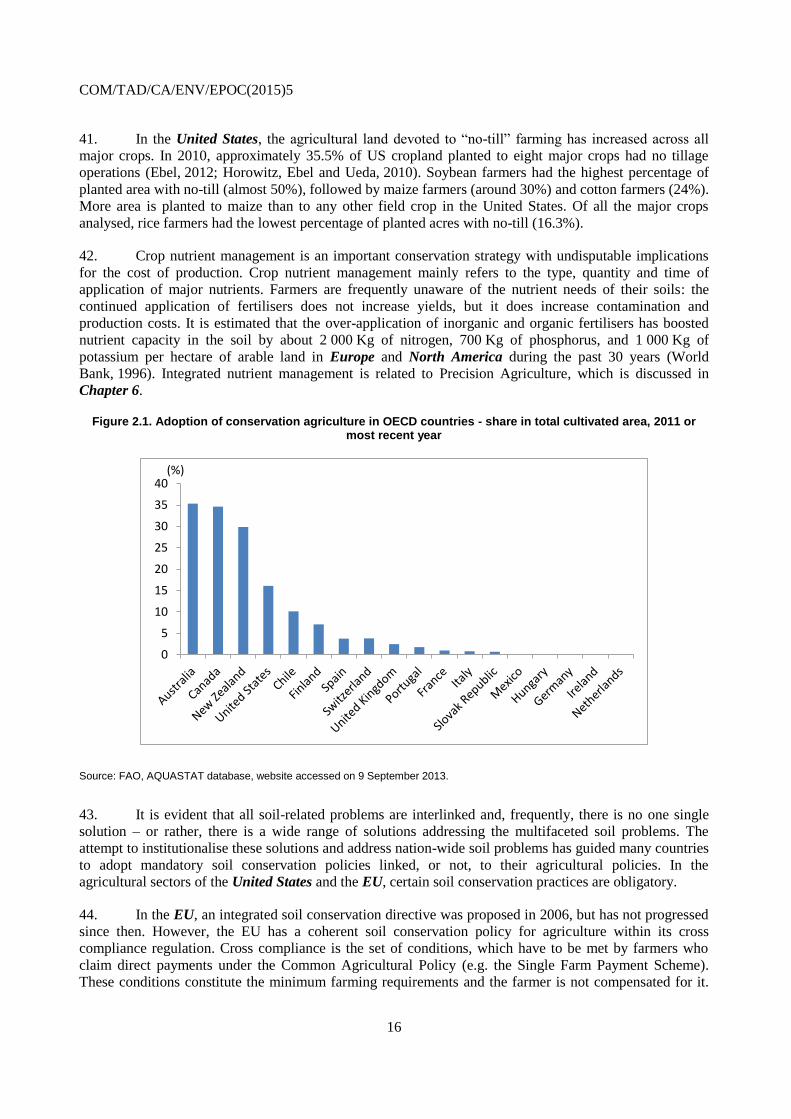
Canada, New Zealand, Paraguay and Uruguay) (Figure 2.1 and Annex Table A2.1).
38. Overall, except in a few countries (e.g. the United States, Canada, Australia, Brazil, Argentina,
Paraguay and Uruguay), conservation agriculture has not been “mainstreamed” either by farmers or policy
makers and the total arable area under conservation agriculture worldwide remains relatively small
(about 9%) compared to areas farmed using tillage. The main factors hindering greater adoption cited in
the literature include: i) insufficient knowledge (know-how); ii) farmer attitudes and aspirations; iii) lack of
adequate machines; iv) availability of suitable herbicides to facilitate weed management; and v)
inappropriate policies (e.g. commodity-based support in some OECD countries) (Friedrich, Derpsch and
Kassam, 2012; D’Emden, Llewellyn and Burton, 2008; Thomas, et al., 2007; Pannell et al., 2006;
Prokopy et al., 2008; Gedikoglou and McCann, 2010).2
COM/TAD/CA/ENV/EPOC(2015)5
15
Table 2.1. Effects of traditional tillage, conservation tillage and conservation agriculture
Source: Table 2 in Hobbs et al. (2008).
39. Since the late 1990s, conservation farm practices in Australia have been used by the majority of
crop farmers, driven primarily by the anticipated benefits of higher crop yield, resulting from managing
soil moisture and improved fertility. In particular, conservation agriculture practices (involving reduced
tillage and crop residue retention) have been a key management tool for improving productivity in the
dryer inland grain-producing areas, which cover 80% of cropping land. The hot arid conditions created a
major impetus for the expansion of moisture conservation through direct seeding and stubble retention
after harvest. The economic benefits from yield increases through no-till systems in the cereal grains sector
was in the order of one tonne per hectare, with increased planting opportunities in prolonged dry years.
Other sectors (cotton and sugar) have followed suit, to improve efficiency and reduce soil loss. Interviews
with farmers from a Conservation Agriculture Alliance of Australia and New Zealand (CAAANZ) national
survey in 2012 indicate that the main catalyst for farmers to change tillage practices included the perceived
risks stemming from soil erosion and drought, which seemed to be threatening the viability of the farm.
40. In addition, the changes in conservation farming practices and the success gained in terms of
yield led to further research into productivity gains and the need to reduce cost input resources. Although
this research was primarily productivity-driven, it was to provide significant co-benefit to the environment.
The most fundamental of these innovations has been the emergence of precision agriculture (see
Chapter 6).
Issue Traditional tillage (TT) Conservation tillage (CT) Conservation agriculture (CA)
Practicedisturbs the soil and leaves a
bare surface
reduces the soil disturbance in
TT and keeps the soil covered
minimal soil disturbance and soil
surface permanently covered
Erosionwind and soil erosion:
maximum
wind and soil erosion: reduced
significantly
wind and soil erosion: the least of the
three
Soil physical health the lowest of the three significantly improved the best practice of the three
Compaction
used to reduce compaction
and can also induce it by
destroying biological pores
reduced tillage is used to
reduce compaction
compaction can be a problem but
use of mulch and promotion of
biological tillage helps reduce this
problem
Soil biological
health
the lowest of the three owing
to frequent disturbance
moderately better soil
biological health
more diverse and healthy biological
properties and populations
Water infiltrationlowest after soil pores
cloggedgood water infiltration best water infiltration
Soil organic matteroxidizes soil organic matter
and causes its loss
soil organic build-up possible in
the surface layers
soil organic build-up in the surface
layers even better than CT
Weeds
controls weeds and also
causes more weed seeds to
germinate
reduced tillage controls weeds
and also exposes other weed
seeds for germination
weeds are a problem especially in
the early stages of adoption, but
problems are reduced with time and
residues can help suppress weed
growth
Soil temperaturesurface soil temperature:
more variable
surface soil temperature:
intermediate in variability
surface soil temperature: moderated
the most
Diesel use and
costsdiesel use: high diesel use: intermediate diesel use: much reduced
Production costs highest costs intermediate costs lowest costs
Timeliness operations can be delayedintermediate timeliness of
operations
timeliness of operations more
optimal
Yieldcan be lower where planting
delayedyields same as TT
yields same as TT but can be higher
if planting done more timely
COM/TAD/CA/ENV/EPOC(2015)5
16
41. In the United States, the agricultural land devoted to “no-till” farming has increased across all
major crops. In 2010, approximately 35.5% of US cropland planted to eight major crops had no tillage
operations (Ebel, 2012; Horowitz, Ebel and Ueda, 2010). Soybean farmers had the highest percentage of
planted area with no-till (almost 50%), followed by maize farmers (around 30%) and cotton farmers (24%).
More area is planted to maize than to any other field crop in the United States. Of all the major crops
analysed, rice farmers had the lowest percentage of planted acres with no-till (16.3%).
42. Crop nutrient management is an important conservation strategy with undisputable implications
for the cost of production. Crop nutrient management mainly refers to the type, quantity and time of
application of major nutrients. Farmers are frequently unaware of the nutrient needs of their soils: the
continued application of fertilisers does not increase yields, but it does increase contamination and
production costs. It is estimated that the over-application of inorganic and organic fertilisers has boosted
nutrient capacity in the soil by about 2 000 Kg of nitrogen, 700 Kg of phosphorus, and 1 000 Kg of
potassium per hectare of arable land in Europe and North America during the past 30 years (World
Bank, 1996). Integrated nutrient management is related to Precision Agriculture, which is discussed in
Chapter 6.
Figure 2.1. Adoption of conservation agriculture in OECD countries - share in total cultivated area, 2011 or most recent year
Source: FAO, AQUASTAT database, website accessed on 9 September 2013.
43. It is evident that all soil-related problems are interlinked and, frequently, there is no one single
solution – or rather, there is a wide range of solutions addressing the multifaceted soil problems. The
attempt to institutionalise these solutions and address nation-wide soil problems has guided many countries
to adopt mandatory soil conservation policies linked, or not, to their agricultural policies. In the
agricultural sectors of the United States and the EU, certain soil conservation practices are obligatory.
44. In the EU, an integrated soil conservation directive was proposed in 2006, but has not progressed
since then. However, the EU has a coherent soil conservation policy for agriculture within its cross
compliance regulation. Cross compliance is the set of conditions, which have to be met by farmers who
claim direct payments under the Common Agricultural Policy (e.g. the Single Farm Payment Scheme).
These conditions constitute the minimum farming requirements and the farmer is not compensated for it.
0
5
10
15
20
25
30
35
40(%)
COM/TAD/CA/ENV/EPOC(2015)5
17
Additional requirements and their associated payment may be covered by agri-environmental schemes.
Good Agricultural and Environmental Conditions (GAECs) are legal requirements that are either existing
law, or were already existing good practice in EU member states before the introduction of cross
compliance. Especially for soil conservation, the GAECs requirements relate to soil erosion, soil organic
matter, soil structure and ensuring a minimum level of maintenance.
45. For soil erosion, GAECs require minimum soil cover, minimum land management reflecting site-
specific conditions and the retention of terraces when possible. For soil organic matter, standards are set
for crop rotations and arable stubble management. Soil structure recommendations include appropriate use
of machinery and minimum livestock stocking rates. Finally, in addition to the aforementioned soil-related
GAECs, cross compliance requirements in the EU ensure that the ratio of permanent pasture to total
agricultural area is maintained at 2003 level. Permanent pasture is defined as land that has been under grass
for at least five years and has not been ploughed for other crops in that time. There are also many voluntary
agri-environmental programmes, implemented under Axis 2 of the 2007-13 Rural Development
Programmes, which compensate farmers for agreeing to produce further environmental and conservation
public benefits, in addition to what is envisaged through cross compliance.
46. In the United States, the Food Security Act (1985 Farm Bill) introduced two important
compliance conservation practices aimed at conserving soil and water resources (collectively referred to as
conservation compliance). These two provisions, which are still in force, require, that in exchange for
certain U.S. Department of Agriculture (USDA) programme benefits, producers agree to maintain a
minimum level of conservation on highly erodible land and not to convert wetlands to cultivated land. In
addition, many voluntary programmes exist for soil and water conservation.
47. The Agricultural Management Assistance programme provides financial and technical assistance
to agricultural producers who voluntarily want to adopt water management, water quality, and erosion
control practices by incorporating conservation into their farming operations. The Environmental Quality
Incentives Program is a voluntary programme that provides financial and technical assistance to
agricultural producers through contracts of up to a maximum term of ten years. Assistance is provided to
help plan and implement conservation practices that address natural resource concerns and for
opportunities to improve soil, water, plant, animal, air and related resources on agricultural land and non-
industrial private forestland.
Productivity and efficiency gains, but types of soil and crops critical
48. Soil is an asset, whose returns are composed of three elements: i) the value of soil as an input to
agricultural production; ii) the value of soil as a capital element which − depending on the amount and
productivity − affects the potential resale value of the land; and iii) the value that soil provides above and
beyond production (i.e. provision of ecosystem services). These elements, depending on the amount and
productivity of the soil, determine the potential resale value of the farmland.
49. The returns to soil conservation practices and their effects on farm productivity and efficiency
have been a widely discussed issue in the agricultural economics profession and academia.3 At farm level,
the economic impacts of soil erosion and soil degradation are related to productivity slowdown and
decreasing returns.
50. The impact of changes in prices (input or output) may have contradictory effects on soil erosion.
First, an increase in the output price creates an incentive for increased soil erosion in the current period due
to the fact that increasing production increases profits. However, if the price increase is permanent, an
incentive to conserve more soil for future use is produced. The net effect on soil depth will depend on the
COM/TAD/CA/ENV/EPOC(2015)5
18
relative size of these two influences, which may also cancel each other out. However, agricultural pricing
policies will distort the incentives to farmers to adopt less-erosive crops in their farming systems.
51. Empirical evidence suggests that, overall, the effects on productivity are positive, although they
are influenced by the prevailing environmental conditions, including types of soil and crops, and could
vary over time. In terms of yields, DeVita et al. (2007) examined the effect of no-tillage and conventional
tillage on durum wheat under rainfed Mediterranean conditions, over a 3-year period (2000–02) at two
locations (Foggia and Vasto) in southern Italy. Higher yields were obtained with no tillage (rather than
conventional tillage) in the first two years at Foggia. In contrast, mean yield and quality parameters at
Vasto were similar for the two treatments during the first two years and higher for conventional tillage
during the third year. This was attributed to the high correlation between rainfall and yields, with a system
of no-tillage supporting higher levels of soil moisture. In this case, soil conservation practices are more
productive (more output and less input) than conventional practices. In contrast, a study for wheat and
maize in the Pampas, in Argentina, found that although the adoption of limited tillage systems leads to soil
improvement, it also generates the necessity to increase the use of nitrogen fertilisers in order to sustain
yields (Alvarez and Steinbach, 2009).
52. Van de Puttea et al. (2010) present an econometric analysis of 47 European studies, including
563 observations that compare crop yields under systems of conventional tillage, reduced tillage and no-
tillage. Surprisingly, they find that no-tillage performs worse under drier climatic conditions. They argue
that this is due to the fact that in wetter climatic conditions negative effects, such as an increased
prevalence of pests and a lower quality of seed placement seem to outweigh possible gains stemming from
increased water availability. On clay and sandy soils, however, this negative effect of no-tillage is
counteracted, and all conservation tillage techniques perform better under drier climatic conditions.
Another important finding is that concerning cereals-only rotations, relative yields under conservation
tillage tend to decrease with time. The authors suggest that conservation tillage can be a viable option for
European agriculture from the viewpoint of agricultural productivity. Potential negative effects on
agricultural productivity can be strongly reduced by applying sufficiently deep tillage and by practising
crop rotation, including crops other than cereals.
53. Hobbs et al. (2008) review the role of conservation agriculture in sustainable agriculture and
present the benefits of conservation agriculture as an improvement on conservation tillage. The paper
concludes that conservation agriculture is a more sustainable and environmentally friendly management
system for cultivating crops. The authors use case studies from Asia and Mexico to show that agricultural
conservation practices have been used in these two environments to raise production both sustainably and
profitably.
54. Concerning climate change effects, studies have estimated the additional amount of carbon
sequestration that occurs as a result of farmers switching to reduced tillage or no-till. Eve et al. (2002)
reported that, on average, a farmer in the Corn Belt, in the United States, who changes from conventional
tillage to reduced tillage would sequester 0.33 more metric tons of CO2 per acre per year over a 20-year
period, while the change from conventional tillage to the more restrictive no-till would sequester 0.64 more
metric tons of CO2 per acre per year.
55. Many uncertainties remain in scientists’ understanding of the relationship between tillage, soil
carbon, and other greenhouse gases (Vanden Bygaart et al., 2003). Baker et al. (2007) argue that reduced
tillage has not been shown to cause a consistent increase in soil organic carbon. Boddey et al. (2009) and
Franzluebbers (2009), however, argue against the claims made by Baker et al. Blanco-Canqui and Lal
(2008) found that the impacts of no-tillage farming on soil organic carbon and nitrous oxide were soil
specific: no-tillage farming increases soil organic carbon concentrations in the upper layers of some soils,
but it does not store soil organic carbon more than plow tillage soils for the whole soil profile.56. West
COM/TAD/CA/ENV/EPOC(2015)5
19
and Marland (2002) estimate the carbon dioxide emissions from the use of machinery and agricultural
inputs (fertilisers, pesticides, seeds, etc.) for three tillage practices in the non-irrigated areas of the United
States. The authors undertake a full carbon cycle analysis on US agriculture and find that changing from
conventional tillage to no-tillage does not increase CO2 emissions, and in most cases contributes to a
decrease. They also find that changing from conventional tillage to no-tillage offers an opportunity to both
increase carbon sequestration and simultaneously reduce carbon emissions from agriculture.
57. A review study has been undertaken by FAO of the scientific literature concerning the impacts
and benefits of the two most common types of agriculture, “traditional tillage agriculture” and
“conservation agriculture, a no-till system”, with respect to their effects on soil carbon pools (Corsi et
al., 2012). The results from the literature review on carbon sequestration in tillage agriculture were
compared with conservation agriculture. The review shows that conservation agriculture permits higher
rates of carbon sequestration in the soil compared with tillage agriculture.
58. When no carbon sequestration or carbon loss is reported in agricultural systems, this is most
frequently associated with any one, or with a combination, of the following reasons: i) soil disturbance, ii)
mono-cropping, iii) specific crop rotations, iv) poor management of crop residues, and v) soil sampling
extended deeper than 30 cm.
59. Another aspect of conservation agriculture in relation to carbon budgets is the reduced power and
energy requirements as a result of not tilling the soil. This translates into decreased fuel consumption, less
working time and slower depreciation rates of equipment per unit area per unit of output, all of which lead
to emission reductions from the various farm operations, as well as from the machinery manufacturing
processes. In addition, crop residues left in the field return the carbon fixed in the crops to the soil through
photosynthesis and the resulting improvement in soil health and fertility leads, over time, to reduced
fertiliser use and CO2 emissions.
Lower labour requirements
60. Herren et al. (2012) report that most no-till farm operations have lower labour requirements per
productive unit of output and per unit of land. Overall, due to the fact that yields from no-till farms were
consistently greater than those from conventional farms, the economic return to no-till farm labour was
significantly higher.
61. The level of farm households’ off-farm income is one of the factors influencing their decisions to
adopt new technologies. But the existing literature seems to suggest that the effect of off-farm income on
adoption is ambiguous increasing the adoption of some practices and decreasing the adoption of others.
Off-farm employment would be expected to decrease the availability of labour and thus could impede the
adoption of labour-intensive conservation farm practices.
62. A study by Gedikoglu et al. (2011), which is based on a survey of 3 104 livestock farmers in
Iowa and Missouri (United States), found that the off-farm employment of the farm operator has a
significantly positive impact on the adoption of capital-intensive practices at the expense of more labour-
intensive practices. In particular, the adoption of the practice of injecting manure into the soil, which is a
capital-intensive procedure (and which contributes to the compaction of topsoil, due to the use of heavy
machinery) is preferred to non-mechanical (and more soil-conserving) spreading, due to its time-saving
advantages. The same results are supported by previous studies which have found that in regions where
off-farm employment plays a major role, farmers are less likely to divert labour to conservation practices if
the economic returns from off-farm labour are higher than the perceived benefits from investing scarce
labour in soil conservation (Neill and Lee, 2001; Moser and Barrett, 2003; Jansen et al., 2006; Lee et al.,
2006; Wollni et al., 2009).
COM/TAD/CA/ENV/EPOC(2015)5
20
63. At a watershed or even higher spatial-level, the application of soil and water conservation
practices can be very beneficial for the rural economy and for job creation. Pincus and Moseley (2012)
analyse the impacts of watershed restoration practices on Oregon’s (United States) economy using input-
output analysis. They found that the sustained programme of restoration work in Oregon has conferred
significant benefits on the economy. They also note that these impacts largely accrue to rural areas in need
of economic development opportunities due to the decline in traditional resource management activities.
They estimate that in addition to approximately 16 jobs supported per million dollars invested in ecological
restoration, a sustained investment in restoration has created both new local organisational capacity in
watershed councils and other community-based partners and business opportunities, especially in rural
Oregon.
64. In a rather more “holistic” investigation, Herren et al. (2012) apply an integrated dynamic global
modelling approach to assess the job-creation capacity of green agriculture. The authors specified the
adoption of actions such as sustainable management practices (e.g. no-till cultivation, natural fertilisation),
research and development, integrated pest control and rural value-added food processing, and assumed that
investments of initially USD 100 billion and subsequently USD 180 billion per annum, to facilitate these
actions will be induced through subsidies and shifts in taxation. These investments were assumed to be
directed either to green agriculture or to conventional agriculture. Projections showed that if the green
agriculture option is chosen, farm and food employment in 2050 is 3% higher than that associated with the
conventional agriculture option.
Improving agriculture’s water footprint by promoting water conservation practices
65. Agriculture accounts for around 70% of the water used in the world today (45% in the OECD
area). Rapidly growing water demand from cities, industry and energy suppliers and the effects of climate
change will make less water available for irrigation in the future. Therefore, it will be even more important
in future for farmers to receive the right signals to increase water use efficiency and improve agricultural
water management, while preserving aquatic ecosystems.
66. The scope of sustainable management of water resources in agriculture concerns the
responsibility of water managers and users to ensure that water resources are allocated efficiently and
equitably and used to achieve socially, environmentally and economically beneficial outcomes. It includes:
irrigation to smooth water supply across the production seasons; water management in rain-fed
agriculture; management of floods, droughts, and drainage; and conservation of ecosystems and
associated cultural and recreational values.
67. Conservation water management practices include land management practices for preparing
fields for efficient irrigation and managing excess water, on-farm water delivery systems and the
application of irrigation practices, irrigation water use management and protecting water from non-point
source pollution and sedimentation. Non-point source pollution comprises all the constituents such as
nutrients, and organic and toxic substances from diffuse sources, such as runoff from agricultural land
development and use. Soil conservation practices, especially conservation tillage and conservation crop
rotation are also water conservation practices because they enhance soil water content due to minimum soil
disturbance and maintenance of soil cover, reduction of water runoff and enhancement of infiltration.
68. Correct initial land levelling conserves water by reducing runoff and allowing uniform
distribution of rainfall and irrigation water. For example, in Texas (United States), correct levelling can
reduce water use-by 20-30% and increase crop yields by 10-20% (Texas Water Development Board).
Furrow diking conserves water by capturing precipitation or irrigation water in small dams made by earth
in the furrows. Knowledge about weather conditions, the capacity of the soil to absorb and retain water and
COM/TAD/CA/ENV/EPOC(2015)5
21
the capacity of crops to utilise water, depending on root depth and soil properties at different depths, can
provide crucial information for water conservation.
69. There are three basic types of water delivery: surface (gravity), sprinkler, and drip irrigation. The
highest levels of water conservation are attained by drip irrigation, which can be very effective with certain
crops and on uneven terrain. Sprinklers, especially those of the older high-pressure technology are not very
efficient, especially under high temperature and windy conditions. For this reason, modifications to low-
energy precision application and low-elevation spray application have been introduced. The case of Israel,
in particular, offers a unique insight into what an integrated water management system may look like in
practice, and provides lessons on how to efficiently manage a scare resource (see Box 2.2).
70. Farming practices for minimising non-point source pollution and sedimentation include the
creation of various types of buffer areas, grass filter strips, grass waterways, forested riparian buffers,
terraces, diversions, water and sediment control basins, etc. A buffer area (buffer strip or buffer zone) is an
area of natural or established vegetation managed to protect critical resource areas, such as wetlands, water
bodies, waterways or even wells, from significant degradation due to land disturbance and nutrient
chemical runoff.
Box 2.2. Management water resources efficiently - the case of Israel
A notable feature of Israeli agriculture has been its capacity to increase the efficiency of water-use in agriculture. Efficiency has been improved in physical (technical) terms of water use per tonne of output (or hectare irrigated), in terms of economic water-use efficiency (value of output per unit of water used and through reducing the sector’s use of fresh drinking quality water while increasing use of recycled water).
Efficient water management has been the foundation of much of Israel’s success in agriculture in arid, semi-arid and dry sub-humid zones. The invention and development of drip irrigation in Israel from the 1960s has been the key innovation behind the rise in technical water-use efficiency, as well as shift towards other pressurised irrigation systems (i.e. sprinklers, micro-sprinklers, micro-jets) with flood irrigation no longer being used. Water-use efficiency is increased through lowering runoff and evaporation losses and reducing leaching of water and contaminants below the root zone. The success of drip irrigation lies in the provision of optimum conditions for plant uptake of water and nutrients. Drip systems also facilitate the more efficient agronomic use of saline, brackish and marginal water.
Initially, drip irrigation met with limited interest and was not without problems, such as pipe clogging and breakage. This changed in the 1980s with further refinements to drip systems, including developments towards the next generation of drip technology including computerised systems and pressurised drippers, which enable the stable distribution of water. In Israel over half the irrigated area is now under drip irrigation.
A more recent development has been sub-surface drip irrigation (SDI), with about 5-10% of the irrigated area currently under SDI systems. These systems are positioned within the soil to: conserve water; control weeds; minimise runoff and evaporation (reducing evaporation by up to 20%); increase longevity of piping and emitters; ease use of heavy equipment in the field; and prevent human contact with low-quality water. Additional motivation for SDI comes in the form of savings, as the extensive labour costs involved with the seasonal installation and collection of surface drip system piping is eliminated. SDI also provides the opportunity to manipulate root distribution and soil conditions in arid climates in order to better manage environmental variables including nutrients, salinity, oxygen and temperature.
Source. OECD (2012), Review of Agricultural Policies: Israel, OECD Publishing, Paris, doi: 10.1787/9789264079397-en.
70. Grass filter strips are planted between the field and surface water (rivers, streams, lakes and
drainage ditches) to protect water quality. They slow the runoff from fields, trapping and filtering
sediment, nutrients, pesticides and other potential pollutants before they reach surface waters. Filter strips
also are planted around drainage tiles. Grass waterways are a type of broad and shallow conservation
buffer designed to prevent soil erosion while draining runoff water from adjacent cropland. Grass
waterways also help prevent gully erosion in areas of concentrated flow.
COM/TAD/CA/ENV/EPOC(2015)5
22
71. Forested riparian buffers are rows of trees or shrubs or maintained grass planted alongside rivers,
streams, lakes or wetlands and are designed primarily for water quality and wildlife habitat purposes.
Forested riparian buffers prevent potential pollutants in agricultural runoff (sediment, nutrients, pesticides,
pathogens) from reaching surface waters. Terraces are earthen or stone embankments, channels, or
combined ridges and channels built across the slope of the field (USEPA, 1993). They may reduce the
topsoil erosion rate and lessen the sediment and pollutants content in surface water runoff. In the United
States, terraces have been reported to reduce soil loss by 94 to 95%, nutrient losses by 56 to 92% and
runoff by 73 to 88% (Cestti et al., 2003).
72. A diversion is similar to a terrace, but its purpose is to direct or divert surface water runoff away
from an area, or to collect and direct water to a pond. Diversions are used with filter strips above them in
order to trap sediments and protect the diversion, and with vegetative cover in the diversion ridge. A water
and sediment control basin is a small earthen ridge-and-channel or embankment built across a small
watercourse or area of concentrated flow within a field.
73. A good example of integrated water conservation policy with direct implications for agriculture
is the EU’s Water Framework Directive (WFD) introduced by “Directive 2000/60/EC of the European
Parliament and of the Council establishing a framework for the Community action in the field of water
policy”. The WFD classification scheme for the ecological status of surface water includes five categories:
high, good, moderate, poor and bad. The WFD requires river, lakes, ground and coastal waters to reach
good ecological and chemical status by 2015. Thus, the WFD has very serious implications for farming
practices and land management as well as water management, concerning diffuse pollution and water
consumption. One of the most important measures to achieve this goal includes reducing emissions of
nitrogen (N) and phosphates (P2O5) from manure and mineral fertilisers into the environment. This action
incurs a considerable cost to the farming sector and, in certain cases, the cost is far beyond what can be
achieved within the budget of agri-environmental measures (OECD, 2012c).
High productivity, efficiency and innovation impacts, but empirical assessment is challenging
74. Water-conservation practices target the quantity and quality of water and can potentially be
implemented at all stages of water storage, delivery and use both on- and off-farm. In principle, water
conservation measures are resource-efficient because they attain their yields by managing the water-
retention capacity of soil. Water conservation practices work best in rain-fed cultivations. Almost all types
of buffer zones attain a significant reduction in pesticide and nutrient concentrations in water and are thus
environmentally efficient.
75. Water-conservation techniques are also energy-efficient because water-saving practices reduce
energy needs and emissions. The contribution of water conservation practices to the production of public
goods or the reduction of negative externalities comes mainly from reduced sedimentation and the
associated reduction of flood risks, as well as the protection of watercourses and the supply of cleaner
water.
76. Water conservation practices are not only associated with well-known green innovations in the
irrigation industry, such as drip irrigation. They also utilise a very rich knowledge base of promising water
management innovation systems for rain-fed agriculture, including a broad spectrum of water-harvesting
practices, conservation farming systems, water conservation techniques and integrated soil fertility
management.
77. Despite these common beliefs about the potential economic and environmental benefits of water
conservation management practices, empirical assessment of the economic productivity gains in terms of
yields from applying water conservation practices is difficult. The complexity involved in making simple
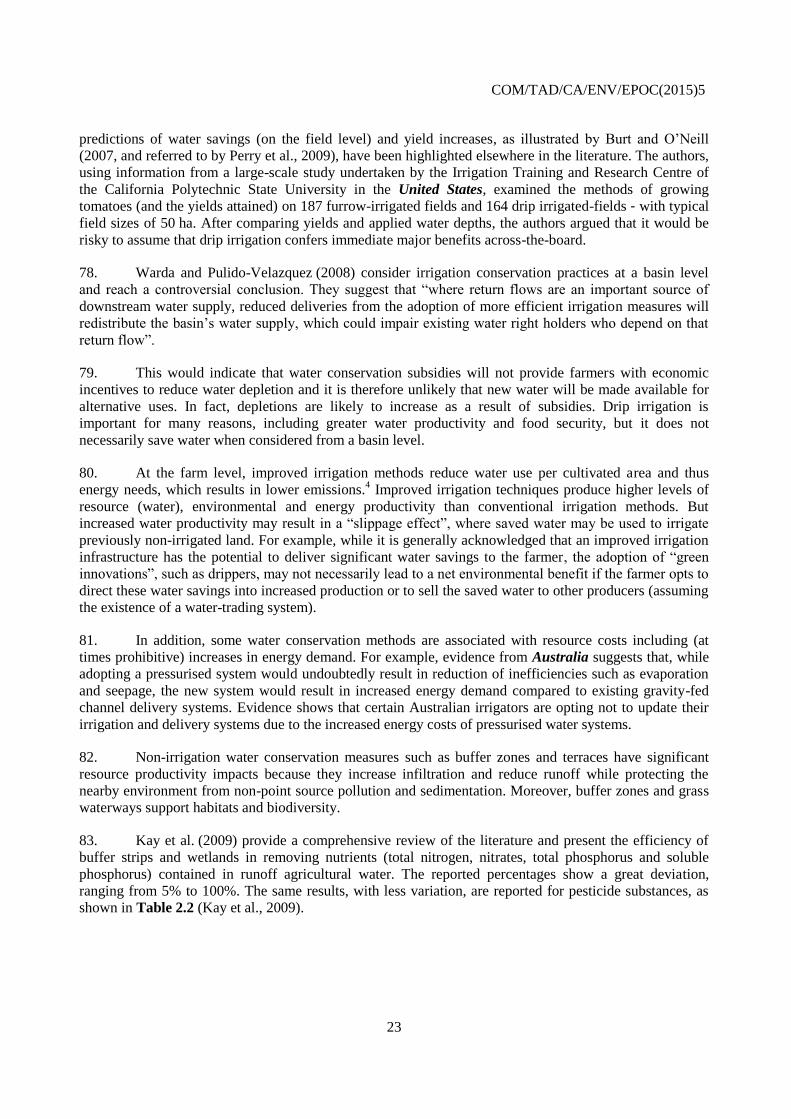
COM/TAD/CA/ENV/EPOC(2015)5
23
predictions of water savings (on the field level) and yield increases, as illustrated by Burt and O’Neill
(2007, and referred to by Perry et al., 2009), have been highlighted elsewhere in the literature. The authors,
using information from a large-scale study undertaken by the Irrigation Training and Research Centre of
the California Polytechnic State University in the United States, examined the methods of growing
tomatoes (and the yields attained) on 187 furrow-irrigated fields and 164 drip irrigated-fields with typical
field sizes of 50 ha. After comparing yields and applied water depths, the authors argued that it would be
risky to assume that drip irrigation confers immediate major benefits across-the-board.
78. Warda and Pulido-Velazquez (2008) consider irrigation conservation practices at a basin level
and reach a controversial conclusion. They suggest that “where return flows are an important source of
downstream water supply, reduced deliveries from the adoption of more efficient irrigation measures will
redistribute the basin’s water supply, which could impair existing water right holders who depend on that
return flow”.
79. This would indicate that water conservation subsidies will not provide farmers with economic
incentives to reduce water depletion and it is therefore unlikely that new water will be made available for
alternative uses. In fact, depletions are likely to increase as a result of subsidies. Drip irrigation is
important for many reasons, including greater water productivity and food security, but it does not
necessarily save water when considered from a basin level.
80. At the farm level, improved irrigation methods reduce water use per cultivated area and thus
energy needs, which results in lower emissions.4 Improved irrigation techniques produce higher levels of
resource (water), environmental and energy productivity than conventional irrigation methods. But
increased water productivity may result in a “slippage effect”, where saved water may be used to irrigate
previously non-irrigated land. For example, while it is generally acknowledged that an improved irrigation
infrastructure has the potential to deliver significant water savings to the farmer, the adoption of “green
innovations”, such as drippers, may not necessarily lead to a net environmental benefit if the farmer opts to
direct these water savings into increased production or to sell the saved water to other producers (assuming
the existence of a water-trading system).
81. In addition, some water conservation methods are associated with resource costs including (at
times prohibitive) increases in energy demand. For example, evidence from Australia suggests that, while
adopting a pressurised system would undoubtedly result in reduction of inefficiencies such as evaporation
and seepage, the new system would result in increased energy demand compared to existing gravity-fed
channel delivery systems. Evidence shows that certain Australian irrigators are opting not to update their
irrigation and delivery systems due to the increased energy costs of pressurised water systems.
82. Non-irrigation water conservation measures such as buffer zones and terraces have significant
resource productivity impacts because they increase infiltration and reduce runoff while protecting the
nearby environment from non-point source pollution and sedimentation. Moreover, buffer zones and grass
waterways support habitats and biodiversity.
83. Kay et al. (2009) provide a comprehensive review of the literature and present the efficiency of
buffer strips and wetlands in removing nutrients (total nitrogen, nitrates, total phosphorus and soluble
phosphorus) contained in runoff agricultural water. The reported percentages show a great deviation,
ranging from 5% to 100%. The same results, with less variation, are reported for pesticide substances, as
shown in Table 2.2 (Kay et al., 2009).
COM/TAD/CA/ENV/EPOC(2015)5
24
Table 2.2. Changes in pesticide concentrations in runoff due to the creation of buffer zones
Pesticide Effect of buffer zone Reference
Atrazine 53% reduction Arora et al. (2003)
25–49% reduction Popov et al. (2006)
Chlorpyriphos 83% reduction Arora et al. (2003)
Metolachlor 54% reduction Arora et al. (2003)
30–61% reduction Popov et al. (2006
Source: Table 4 in Kay et al. (2009)
84. These results indicate the need for changing the way in which herbaceous riparian buffers are
implemented adjacent to channelized headwater streams, and also suggest that their use should be paired
with upland management practices, riparian wetland creation, and/or in-stream habitat practices that are
capable of addressing the chemical and physical habitat degradation exhibited by channelled agricultural
headwater streams. Their research highlights the risk embedded in fragmented approaches versus
integrated watershed management practices.
COM/TAD/CA/ENV/EPOC(2015)5
25
Chapter 3. What organic farming means for green growth?
Main messages
Economic productivity performance of organic farming is lower than conventional agriculture, both
for crops and livestock.
Organic farming is more labour intensive than its conventional counterpart.
On balance, empirical evidence show positive environmental effects for soil, water and biodiversity,
but effects on GHG emissions are uncertain.
A rapidly growing sector
85. Organic agriculture is an approach to food production that seeks to develop environmental and
economically sustainable production systems with a strong emphasis on the use of local, renewable
resources and the minimal use of external inputs. Since the 1970s, markets have been developed for
organic products in several countries, and legally enforced production standards have been introduced to
protect the consumer.
86. There are many definitions of organic agriculture. At its simplest, it is a production system that
relies on ecological processes, such as waste recycling, organic-based fertilisers (such as manure and
vegetable-based compost) and natural pesticides (such as predator animal species), rather than synthetic
inputs, such as chemical fertilisers and pesticides. Use of antibiotics and other products related to health is
limited to treating sick animals, not for enhancing yields. Other definitions of organic agriculture go much
further. For example, the definition provided by the International Federation of Organic Agriculture
Movements (IFOAM) goes beyond biophysical aspects, to encompass matters such as animal welfare,
biodiversity and social justice.5 It is necessary, however, to distinguish between certified organic
agriculture and an agriculture that follows organic methods of production, but is not officially certified.
87. Although the rules of organic agriculture differ slightly from country to country, some general
practices apply to all organic cultivation systems around the world and to the stages of growing, storage,
processing, packaging and shipping. First and foremost, organic cultivation avoids the use of synthetic
chemical inputs, including fertilisers and pesticides, and the over-use of antibiotics and food additives.
Each country adopts a List of Allowed and Prohibited Substances for organic agriculture.
88. In addition, organic agriculture does not use genetically modified organisms, cultivars selected
using techniques such as irradiation, bio-solids, or non-human sewage sludge for fertilising or feeding of
animals. The land under cultivation must be free from all prohibited synthetic chemicals for a period of
usually three years to be declared organic. Cultivators have to record the production and sales for auditing,
maintain strict physical separation of organic certified production from non-certified production, and
accept periodic on-site inspections by the certified bodies in charge.
COM/TAD/CA/ENV/EPOC(2015)5
26
89. Over the last two decades, organic farming has become one of the most thriving segments of the
agricultural sector in several OECD countries. The sales of organic food and drink reached USD 72 billion
world-wide in 2013, implying an almost five-fold expansion from USD 15 billion in 1999
(FiBL/IFOAM, 2015). Organic agriculture is expanding in all OECD countries, in response to increasing
consumer demand for perceived healthy food products. Organic farming is no longer limited to farmers for
whom organic production is part of a holistic life-style, and who sell through specialist outlets, but has
extended into the mainstream of the agri-food chain as an economic opportunity to satisfy a niche market
at premium prices.
90. However, it still only accounts for a relatively small share of total agricultural production and
food consumption in most countries. Despite strong growth, however, organic farming accounts for a
modest proportion of global agricultural land (1%) (Annex Table A3.1).
91. By region, the share is highest in Oceania (4.1%), followed by Europe (2.4%) and Latin America
(1.1%). In the EU27, the share of organically managed land is 5.7%. Globally, 43.1 million hectares of
land are under organic cultivation (including in-conversion areas) globally. Australia is the country with
the largest organic agricultural land (97% of which is extensive grazing area), followed by Argentina, and
the United States. In 2013, there were 2 million producers, more than three-quarters of whom were located
in Asia, Africa and Latin America. The country with the most producers is India (650 000), followed by
Uganda (189 610) and Mexico (169 703).
92. In several OECD countries, organic agriculture is the most rapidly growing agricultural sector, at
anything between 15-30% annually, albeit from a very low base. Compared with 1999, when data on
organic agriculture worldwide were available for the first time, the size of agricultural land under organic
farming has almost quadrupled. In 2013, organic agricultural land worldwide increased by 15% compared
with 2012, mainly because of a sharp growth in fully certified organic land in Australia due to rangeland
areas coming into organic production to meet strong demand for organic beef. On average, organic
agriculture accounts for about 2% of total agricultural land across the OECD, but varies considerably, from
under 0.2% in Japan to 20% in Austria (Figure 3.1). The main organic markets are in fruits and
vegetables, fresh poultry and eggs, and fresh milk, butter and cheese, although in certain countries cereals
are also important.
93. Demand for organic products is concentrated in North America and Europe, which represent
more than 90% of global revenues. This is indicative of the extreme disparity between production and
consumption. In 2013, the organic largest market, by a wide margin, was the United States, with
USD 32 billion of organic food sales, followed by Germany, with USD 10 billion and France with USD 6
billion. The highest annual per capita consumption was in Switzerland (USD 279) and Denmark
(USD 216). Denmark, Switzerland and Austria have the highest share of organic food sales.
94. The growth of organic farming indicates some disenchantment with “conventional” agriculture
and its products. Growth has largely been led by demand from consumers in high-income countries who
favour organic produce for a variety of reasons, including the perceived benefits to health and the
environment, perceived improvements in food quality and taste, accessibility of fresh produce, and the
support it provides to small-scale local producers, communities and markets.
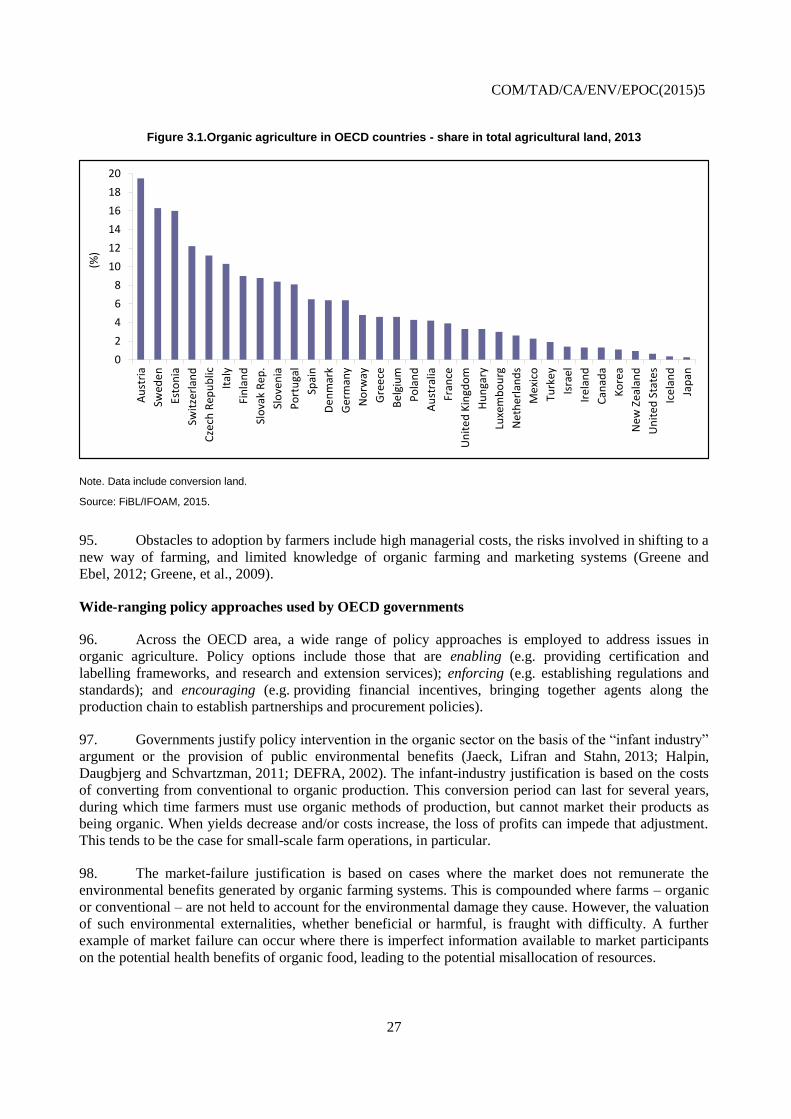
COM/TAD/CA/ENV/EPOC(2015)5
27
Figure 3.1.Organic agriculture in OECD countries - share in total agricultural land, 2013
Note. Data include conversion land.
Source: FiBL/IFOAM, 2015.
95. Obstacles to adoption by farmers include high managerial costs, the risks involved in shifting to a
new way of farming, and limited knowledge of organic farming and marketing systems (Greene and
Ebel, 2012; Greene, et al., 2009).
Wide-ranging policy approaches used by OECD governments
96. Across the OECD area, a wide range of policy approaches is employed to address issues in
organic agriculture. Policy options include those that are enabling (e.g. providing certification and
labelling frameworks, and research and extension services); enforcing (e.g. establishing regulations and
standards); and encouraging (e.g. providing financial incentives, bringing together agents along the
production chain to establish partnerships and procurement policies).
97. Governments justify policy intervention in the organic sector on the basis of the “infant industry”
argument or the provision of public environmental benefits (Jaeck, Lifran and Stahn, 2013; Halpin,
Daugbjerg and Schvartzman, 2011; DEFRA, 2002). The infant-industry justification is based on the costs
of converting from conventional to organic production. This conversion period can last for several years,
during which time farmers must use organic methods of production, but cannot market their products as
being organic. When yields decrease and/or costs increase, the loss of profits can impede that adjustment.
This tends to be the case for small-scale farm operations, in particular.
98. The market-failure justification is based on cases where the market does not remunerate the
environmental benefits generated by organic farming systems. This is compounded where farms – organic
or conventional – are not held to account for the environmental damage they cause. However, the valuation
of such environmental externalities, whether beneficial or harmful, is fraught with difficulty. A further
example of market failure can occur where there is imperfect information available to market participants
on the potential health benefits of organic food, leading to the potential misallocation of resources.
0
2
4
6
8
10
12
14
16
18
20
Au
stri
a
Swed
en
Esto
nia
Swit
zerl
and
Cze
ch R
epu
blic
Ital
y
Fin
lan
d
Slo
vak
Rep
.
Slo
ven
ia
Po
rtu
gal
Spai
n
De
nm
ark
Ger
man
y
No
rway
Gre
ece
Be
lgiu
m
Po
lan
d
Au
stra
lia
Fran
ce
Un
ite
d K
ingd
om
Hu
nga
ry
Luxe
mb
ou
rg
Net
her
lan
ds
Me
xico
Turk
ey
Isra
el
Ire
lan
d
Can
ada
Ko
rea
New
Zea
lan
d
Un
ite
d S
tate
s
Ice
lan
d
Jap
an
(%)
COM/TAD/CA/ENV/EPOC(2015)5
28
99. While in some OECD countries it is largely market forces that drive the development of the
organic sector, several governments, mostly in Europe, offer to farmers financial (and other incentives) to
convert to, and continue in, organic production. In the EU, most countries provide support for organic
farming via Pillar 2 of the CAP on top of the standard Pillar 1 payments – with per-hectare payment for
agri-environmental measures under “Axis 2”. Additional funding is also available under Axes 1 and 3, for
forestry and improved rural life and diversification.
100. In France, in 2013, the government launched a new organic Action Plan, which is intended to
restructure the country’s organic farming sector. Among other goals, the programme aims to double the
land surface used for organic cultivation and boost the consumption of organic products (see Box 3.1). The
plan proposes higher direct payments for farmers, both during and following conversion periods; financial
support for supply-chain actors; it sets a goal of achieving 20% of organic products in public procurement
of food; makes more funds available for research and dissemination; supports better training and education
of farmers and supply-chain actors; and ensures appropriate adaptation to organic farming, as stipulated by
the EU regulations, including the rules on organic farming regulation.
101. In virtually all OECD countries, market-based policy approaches, including certification and
labelling schemes, are now in place or are being developed, in order to aid consumer choice. But the
proliferation of different labels and standards can be confusing to consumers. Differences in certification
and labelling schemes, both public and private, can inhibit trade flows, and differences in government
approaches to equivalency assessments may also hinder trade (OECD, Synergies between Private
Standards and Public Regulations, TAD/TC/CA/WP(2014)3/FINAL].
102. Several governments have undertaken information campaigns and promotional activities to
encourage consumption of organic products. In a few countries, notably in Europe, government
procurement policies encourage or require the purchase of organic food by public institutions such as
schools and hospitals.6
103. The major agricultural producer countries have adopted a set of rules and established institutions
for certifying, auditing, inspecting and monitoring organic cultivation. In the United States, the Organic
Foods Production Act (OFPA) was passed in 1990, with the aim of developing a national standard for
organic food and fibre production. OFPA mandated the USDA to develop regulations to explain the law to
producers, handlers and certifiers. OFPA called for the National Organic Standards Board to be set up, in
order to make recommendations. The final rules were implemented in the autumn of 2002.7
104. In the United States, federal legislation defines three levels of organic foods. First, products
made entirely with certified organic ingredients and methods that are labelled "100% organic", second,
products with at least 95% organic ingredients that are labelled "organic" and third, products containing a
minimum of 70% organic ingredients that are labelled "made with organic ingredients". The last category
cannot display the USDA Organic seal. All organic growers, processors and distributors are required to
meet the national standard and be certified by a USDA-accredited state (or private) group unless their sales
of organic products are less than USD 5 000 annually (Greene and Ebel, 2012).
105. In the EU, comprehensive organic legislation has been in place since 1992 (Council Regulation
EEC 2092/91). However, many member countries already had organic production legislation in place and
were operating organic production rules long before the EU-wide legislation was introduced. Examples are
found in France, where organic certification was introduced in 1985, and in Germany, where organic food
labels have been in use since 1928. The original 1992 legislation was later amended by Council Regulation
EC 834/2007 that outlined the objectives and principles of organic agriculture and fixed the general
production rules, which was completed by the implementing Regulation EC 889/2008, with detailed
production and labelling rules, and control requirements.
COM/TAD/CA/ENV/EPOC(2015)5
29
Box 3.1. The French organic sector
French organic agriculture is a dynamic sector. Between 2007 and 2012, the area of land devoted to organic farming in France almost doubled, going from 557 000 ha to more than 1 million hectares; over the same period, the number of organic farmers has more than doubled, up from 12 000 to 24 500; the number of processors and retailers of organic products has also shown the same positive development, rising from 6 400 to 12 300. The turnover generated from the sale of organic food to consumers increased from EUR 2 billion to EUR 4.1 billionn; and the input of organic products in the catering sector has been increasing, resulting in a 7% rise in turnover, up to EUR 169 million in the community catering industry in general. In 2012, the organic sector employed more than 36 700 people (producers, processors, distributors, etc.) (compared with 18 400 in 2007); and it occupied 3.8% of Utilized Agricultural Area (over 2.47 million hectares). According to a survey commissioned by Agence Bio, the number of consumers who regularly buy organic products has risen to 43% in 2012.
The first Organic Action Plan was in place from 2007 until 2012. On 31 May 2013 a new Action Plan, the Ambition Bio 2017, was launched by the government to further develop the organic sector. More specifically, the following six main goals have been defined:
Develop organic production: An incentive system will encourage farmers to keep their fields under organic
management. A grant of EUR 160 million a year for conversion to organic (or to support the continuation of organic cultivation) will be provided in the context of Pillar II support of the EU Common Agricultural Policy (CAP) for the period 2014 to 2020.
Restructure the sector: Two priorities have been outlined, the first of which is to support the cultivation of
protein crops (such as canola, sunflower and soy) in order to reduce dependence on imports for feed proteins. Secondly, to improve the organisation of the sector, improved data on prices of production and distribution are needed. For this purpose, national and regional observatories will be strengthened and co-ordinated. A special fund dedicated to organic farming, “Bio Future Fund” (Avenir Bio), will be managed by the French Organic Agency and will receive an extra EUR 1 million each year, in addition to the EUR 3 million it already receives annually. Avenir Bio informs consumers, co-ordinates professionals, and identifies necessary changes to structure the sector and finance projects.
Develop organic markets and consumer information: In the case of community catering, the plan is for organic
production to achieve a share of 20%. Public awareness campaigns will also be conducted; these will be designed to appeal particularly to the younger generation through targeted advertisements, organised school visits to organic farms, and community garden projects.
Encourage research and development: R&D for the organic sector will receive more finance via the CAS DAR
(Compte d’affectation spéciale pour le développement agricole et rural) programme that is running from 2014 to 2020, and the outcomes will be communicated more effectively to the public.
Educate farmers and processors: This point addresses the offer of training and advanced training, with special attention being paid to improving collaboration between the administration in the agricultural sector and the experts in organic agriculture. Continuing education programmes will be launched for farmers, and specific courses and training that already offered by agricultural schools will be developed and expanded.
Adapt to EU regulations: This point focuses on the specific implementation by farmers of special features in the EU regulations for the organic sector. Two bodies have been created to ensure closer liaison in the future between the regions and the Ministry of Agriculture.
Further information can be found at the Ministry of Agriculture’s website: www.agriculture.gouv.fr/ambition-bio-2017.
106. In 2010 and 2012, the legislative framework was enhanced with the introduction of two
regulations for organic aquaculture and wine production, while work on poultry production, greenhouse
production, feed production and food processing is currently underway. The European organic food logo
has been obligatory since July 2010. EU member countries vary in the number and type of measures they
choose to adopt to support organic farming (a comprehensive description and review of the public support
measures in place for organic farming, including a categorisation of the mix of the measures used can be
found in Sanders et al., 2011).
COM/TAD/CA/ENV/EPOC(2015)5
30
107. In Japan, the Japanese Agricultural Standard (JAS) was implemented 2001 and underwent a
thorough revision in 2005. In Canada, certification has been implemented at the federal level since 2009,
while in Australia standards were introduced in 1991 and are now in their 6th revision. Finally, India, an
important exporter of organic products, regulates the certification of organic products through the National
Standards for Organic Production, which has been recognised by the EU, the USDA and other agencies in
major importing countries.
Is organic agriculture economically viable?
108. The key factor affecting the profitability of organic production is the market premia received by
farmers for their products. The premia reflect the perceived collective benefits of organic farming
practices. These premia are offset to varying degrees by the higher production and certification costs, but
appear to be providing some parity between gross margins for organic versus non-organic producers.
109. An important point to consider is what will happen to these premia as the organic sector expands.
If the organic sector grows in a manner similar to other food and fibre sectors, it could be expected than the
production, processing, delivery and retail costs per tonne will decrease over time. Anecdotal evidence
suggests that this is happening as the industry expands. Examples range from economics in production
systems (e.g. more effective pest control) to increased efficiency in transport and to more efficient use of
processing plants.
110. The other major factor affecting profitability is the yield obtained by organic production. Yields
per hectare do generally appear to be lower on organic farms, due to the lower input intensity of organic
farming. Organic crop farms use less pesticides and fertilisers per hectare than their conventional
counterparts, although for fuel and lubricants the amounts are comparable. Where conventional farms use
chemicals, organic farms usually resort to mechanical techniques (e.g. for weeding) and their fields have to
be worked as often as those on conventional farms. For livestock, organic farms have lower stocking
densities. They grow less fodder maize than their conventional counterparts, but the proportion of pasture
in their utilised agricultural land is higher.
111. The EC (2013) study, which compared the financial performance of organic holdings with that of
conventional holdings for the dairy sector in Austria, Germany and France, and for the field crop sector
(cereals, oilseeds and protein crops) in the same three countries plus Spain and Poland, found that there is
no clear pattern because each country and sector has different rates of income per unit of labour: organic
farming practices have lower yields as they are more extensive - except for labour-use, where it is more
intensive, but the higher prices tend to compensate for this; cost of production is not always lower as their
level of depreciation per unit of production is comparable or higher than that of conventional farms; and
income per unit of labour is often lower, although agri-environmental and animal welfare payments could
compensate this.
112. The comprehensive study undertaken by the French National Institute for Agricultural Research
(INRA) points out that it is difficult to draw an unequivocal conclusion concerning the economic
performance of organic farming in France compared with conventional farming, based on a literature
review due to: i) unclear definitions of organic farming (e.g. farms in conversion or certified); ii) small size
of organic farms; iii) methodological problems; and iv) multiplicity and heterogeneity of the economic
performance indicators used in various studies (Bellon and Penvern, 2014).
113. Comparing the yields of organic and conventional agriculture is not a straightforward exercise.
Seufert et al. (2012) have carried out the most recent and complete meta-analysis based on 62 study sites
and 316 organic-to-conventional yield comparisons on 34 different crop species. In general, the authors
COM/TAD/CA/ENV/EPOC(2015)5
31
find that the average organic–to-conventional yield ratio is 0.75 or, in other words, that organic yields are
25% lower than conventional yields.
114. However, these results present significant variability across crop types and species. Yields of
organic fruits and oilseed crops show a small and not statistically significant difference. Perennial organic
cultivations show better performance over annual crops, and legumes out-perform non-legumes. The
authors examine further the possible sources of these differences and attribute them to four reasons. First,
they argue that organic systems are, frequently, nitrogen-constrained and, when organic systems receive
higher quantities of nitrogen, their performance is improved.8
115. Second, the authors argue that it is difficult to manage phosphorus in organic systems. Evidence
shows that organic crops perform better on weak acid, rather than weak alkaline soils, and it has already
been established that under strongly alkaline and acidic conditions phosphorus is less readily available to
plants because it forms insoluble phosphates. Thus, organic plants are more dependent on fertilisers and
soil modifications.
116. The third reason suggested is the relation between water and yields, with organic systems
performing better than conventional systems under rain-fed conditions, as well as under drought and
excessive rainfall. On the other hand, conventional crops perform better with irrigation. This may be
attributed to the fact that organic systems are nutrient-limited, as explained above, and do not respond to
irrigation in the same way as conventional systems. Moreover, due to the soil management practices
employed in organic agriculture, soils have better water-holding capacity and higher infiltration rates and
thus are able to withstand droughts or excessive rainfall.
117. Finally, organic yields depend on knowledge and good management practices. The authors found
that when best-management practices are applied on both conventional and organic systems, the latter
perform better. Organic yields are low in the first years after conversion and then gradually increase, due to
improvements in soil fertility and management skills. They go on to suggest that “improvements in
management techniques that address factors limiting yields in organic systems and/or the adoption of
organic agriculture under those agro-ecological conditions where it performs best may be able to close the
gap between organic and conventional yields”.
118. Chavas et al. (2009) report the economic and risk analysis of a long term (1993-2006) series of
data collected under the Wisconsin Integrated Cropping Systems Trial in the United States. When the
authors estimated net return using only market prices (i.e. no government programmes or organic price
premia), the no-till maize-soybean system was the most profitable grain system, and rotational grazing the
most profitable forage system. Once government programmes were included, returns were seen to increase
for all the cash grain systems especially continuous maize, with increases of 50-190%.
119. When organic price premia were included with the government payment, returns to the organic
grain system increased by 85-110% and by 35-40% under the organic forage system higher returns than
any of the Mid-western standards of no-till corn-soybean, continuous corn, or intensive alfalfa production.
The authors conclude that under high grain prices, if organic price premiums remain high, the gap spread
among grain systems will increase to the advantage of organic grain and organic forage production. One
option that the authors observed in response to this changing market is that of parallel production. Under
this system, some growers are converting some of their farms to organic production, while also
maintaining conventional production systems on others.
120. But the fact that organic producers in the United States enjoy higher returns is not always
translated into higher incomes. Organic farmers are not significantly better-off, in terms of farm household
income, than conventional farmers. Although the average gross cash income for certified organic farms is
COM/TAD/CA/ENV/EPOC(2015)5
32
higher than that for conventional farms, organic farms face significantly higher production costs. These
costs are explained by higher labour costs, insurance expenses and marketing charges (Uematsu and
Mishra, 2012).9 The authors also find that organic farmers are very active in hedging the greater risk and
uncertainty inherent in organic farming. Insurance premia are USD 12 000 per year higher for organic
farms than for conventional farms. Finally, organic farms pay up to USD 120 000 more for marketing fees
than conventional farms.
Is organic agricultural environmentally sound?
121. In terms of resource productivity, organic agriculture performs better than conventional farming.
Organic agriculture is, by definition, low in pesticide- and nutrient-use (organic cultivations are frequently
found to be nutrient-deficient) and due to the utilisation of compost, residues and wastes, organic
agriculture also has high resource productivity, concerning waste material. Organic practices enhance soil
properties (the organic matter that is left on the field allows water to infiltrate the soil and be retained,
enabling organic cultivations to perform better than conventional systems during periods of drought and
heavy rain).
122. In essence, the way that organic agriculture is practised has direct impacts on soil and water
conservation, biodiversity and climate change. Due to the absence of synthetic fertilisation, organic
farmers pay attention to soil conditions, and organic practices aim to enhance organic matter and Soil
Organic Carbon (SOC) and maintain the soil structure in a good condition. These aims imply the use of
crop rotation, the return of organic matter to the soil, and management of residues, year-round soil
coverage with inter-tillage, under-sown crops and perennial forage.
123. In principle, such practices should result in decreased erosion and improved flood control: higher
drought tolerance; reduced soil acidification, due to the absence of ammonia emissions; improved soil
fertility; higher levels of biodiversity (especially in soil organisms and higher soil fertility due to careful
nutrients management). By definition, the water runoff from organic cultivation has considerably lower
concentrations of nutrients and is free of synthetic chemical pesticides and thus does not contribute to
eutrophication and is safe for human consumption.
124. Finally, organic practices could be considered as mitigation and adaptation strategies for climate
change. Mitigation is achieved through the avoidance of chemical fertilisers (and the consequent reduction
in CO2 and N2O emissions) and the increased levels of SOC attained under organic agricultural systems.
Adaptation is achieved because organic systems are thought to be better adapted to droughts and to offer
restoration from floods, increase biodiversity and reduce toxicity, while most organic cultivations are
production activities that reduce risks and minimise production costs.
On balance, empirical evidence show positive environmental effects for soil, water and biodiversity, but
effects on GHG emissions are ambivalent
125. However, organic farming could require more use of ploughing than would be the case if
herbicides were used. It has been argued that, on some soils, repeated ploughing compacts deep layers of
soil and reduces yields; water runs off compacted soils more easily, which, in turn, increases erosion (New
Scientist, 2002).
126. Gomiero et al. (2011) carried out a comparative review of the environmental performance of
organic agriculture versus conventional farming and found that under organic management soil loss is
greatly reduced and soil organic matter content increases. Furthermore, soil bio-chemical and ecological
characteristics also appear to be improved, and organically managed soils have a much higher water-
holding capacity than conventionally managed soils, resulting in much larger yields, under conditions of
COM/TAD/CA/ENV/EPOC(2015)5
33
water scarcity. It is suggested that the higher levels of organic matter and the practice of minimum tillage
in organic systems increase the water percolation and retention capacity of the soil, reducing irrigation
needs. Thus, organic agriculture’s resource productivity gains, concerning water and soil, are very high. In
the case of water quality, in particular, several studies show that nitrogen leaching can be reduced by 40-
64% through organic farming practices (Schader et al., 2012; Schader, 2009).
127. The recent INRA study, which compared the environmental performance of organic farming in
relation to conventional agriculture both, globally and in France, concluded that: i) higher environmental
performance when use of natural resources (energy, water and phosphorus) is assessed per area used both
for crops and livestock, but this advantage of organic farming decreases or even reverses when expressed
per unit of output; direct and indirect energy consumption is lower, particularly for arable crops and
bovine, but higher for vegetable production and when the duration of fattening of animals is increased (e.g.
pigs to the fattening, table fowls); less need for irrigation and thus water use; less phosphorus consumption,
although this advantage is partly counterbalanced by the fact that, as soils farmed organically have lower
phosphorus content, the phosphorus nutrition of soils could become a limiting factor of the output
(Guyomard, 2013).
128. Concerning water quality, organic farming generally results in lower or similar nitrate-leaching
rates than conventional agriculture. However, the ploughing-in of legume crops (a necessary process on
organic farms) and continued manure breakdown may lead to nitrate leaching into aquifers and waterways
at identical rates to conventional farms. The environmental effects of using livestock manure in organic
systems will depend on how the manure is stored and when and how it is applied.
129. The impacts of organic agriculture on energy use can be analysed on the basis of different
functional units such as “area”, or the weight of output from the farming system as a reference.
Lampkin (2007) identified that most product- and area-related energy use assessments of organic farming
to date show lower energy use per hectare. Lower energy use (direct and indirect) for organic farming is
also reported in France, particularly for arable crops and dairy, but higher for horticulture (Bellon and
Penvern, 2014).
130. In terms of energy productivity, Gomiero et al. (2008) claim that organic agriculture, along with
other low-input agriculture practices, results in less energy demand compared with intensive agriculture,
and could represent a means of improving energy savings and CO2 abatement if adopted on a sufficiently
large scale. Gomiero et al. (2011) describe energy use in different agricultural settings and conclude that
organic agriculture has higher energy efficiency (input/output) but, on average, exhibits lower yields and
hence reduced productivity.
131. Pimentel (2006) argues that, in several respects, energy use actually does not differ significantly
on conventional and organic farms. For example, in the United States the energy cost of lorries taking
grain to market is the same per kilometre; the same amount of energy is needed to manufacture and run a
tractor; the energy cost of pumping irrigation water is the same per hectare on conventional and organic
farm; and the energy tied up in seed, or livestock-breeding stock differs little between conventional and
organic farms. Nevertheless, substantial differences do exist between energy use on conventional and
organic farms, particularly those associated with the energy required to manufacture, ship and apply
pesticides and nitrogen-based fertilisers.
132. Schader (2009) examined the differences in energy use per ha between organic and conventional
farm types in Switzerland, based on a representative farm sample. As well as pig and poultry farms,
conventional mixed farms have the highest total level of energy use (60 GJ/ha), while average energy use,
expressed as a sum of all energy-use components in dairy, suckler cow, other grassland, arable and
speciality crop farms, ranges from 20 to 30 GJ/ha. The energy use of organic farms is about one-third
COM/TAD/CA/ENV/EPOC(2015)5
34
lower (10-20 GJ/ha), except on mixed farms, where average energy use is approximately 50% less than on
conventional farms. Schader (2009) attributes the lower quantities of purchased feedstuffs (particularly
concentrates), to lower-stocking densities, the ban on mineral nitrogen fertilisers, and the absence of highly
intensified specialised pig and poultry farms.
133. In terms of environmental productivity and the effects of organic agriculture on climate change,
the empirical evidence despite differences in methodology appears to produce similar results.
FAO (2011) carried out a comprehensive literature review that integrated 45 scientific publications and
280 datasets into a single data matrix. Quantitative evaluation of this dataset revealed strong scientific
evidence for higher SOC contents in soils under organic farming. This is also in accordance with the
findings of Leifeld and Fuhrer (2010) and Gattinger (2012).
134. Lynch, MacRae and Martin (2011), analysed about 130 studies to form a comparison of farm-
level energy use and the global warming potential (GWP) of organic and conventional production
sectors. They concluded that:
“the evidence strongly favours organic farming with respect to whole-farm energy use and
energy efficiency both on a per hectare and per farm product basis, with the possible exception of
poultry and fruit sectors. For GWP, evidence is insufficient except in a few sectors, with results
per ha more consistently favouring organic farming than GWP per unit product. Tillage was
consistently a negligible contributor to farm energy use and additional tillage on organic farms
does not appear to significantly deplete soil carbon. Energy offsets, biogas, energy crops and
residues have a more limited role on organic farms compared to conventional ones, because of
the nutrient and soil building uses of soil organic matter, and the high demand for organic foods
in human markets” (Lynch, MacRae and Martin, 2011).
135. FAO (2011) refers to studies that have shown no marked difference between GHG emissions
under organic and conventional systems: however, soil carbon changes were not included in these studies –
and they can have a major impact, especially on plant products. On the contrary, Gattinger (2012) in a
meta-analysis of 19 studies, involving 101 comparisons, found that organic agriculture has significantly
lower N2O emissions, which are more pronounced for arable land. Furthermore, Gattinger’s (2012) meta-
analysis of 7 studies, involving 27 comparisons, that allowed assessments of emissions per weight of
produced crop, found that nitrous oxide emissions per kg of yield were higher with organic than with
conventional agriculture, due to an average of 26% lower yields in organic agriculture.
136. Scialabba and Lindenlauf (2010) also discuss the mitigation and adaptation potential of organic
agricultural systems along three main features: farming system design, cropland management and
grassland and livestock management. They find that an important potential contribution of organically
managed systems to climate change mitigation lies in the careful management of nutrients and the
reduction of N2O emissions from soils.
137. Another high mitigation potential of organic agriculture may be found in carbon sequestration in
soils. In a first estimate, the potential emission reduction resulting from abstention from the use of mineral
fertilisers is calculated to be about 20% and the compensation potential by carbon sequestration to be about
40-72% of the world's current annual agricultural GHG emissions; nonetheless, as the authors argue,
further research is needed to consolidate these numbers.
138. Concerning the contribution to biodiversity and the provision of public goods, a considerable
body of research reveals that there is a higher abundance of arthropods (insects such as spiders, mites,
centipedes, millipedes etc.) in organic agriculture systems compared with other production systems. This
appears to be linked to the absence of pesticides, the lower density of crops and the higher incidence of
COM/TAD/CA/ENV/EPOC(2015)5
35
weeds, which provide a food source. The greater abundance of microbial activity, anthropoids and weeds
attracts other forms of wildlife higher up the food chain, such as birds, although more frequent mechanical
weeding on organic farms can damage nesting birds, worms and invertebrates. Evidence also suggests that
organic systems perform better in respect to floral and faunal biodiversity. Through the use of crop
rotation, organic farming can encourage landscape diversity, which in turn produces a diversity of habitats,
to the benefit of local wildlife populations but the actual impact of organic systems on the landscape is
very difficult to quantify.
139. Schader et al. (2012) conclude that the effects of organic farming on biodiversity are among the
most frequently studied and are among the undisputable environmental benefits of organic agriculture.
They refer to various meta-studies that show clear differences between organic and conventional farming
systems (Bengtsson et al., 2005; Fuller et al., 2005; Hole et al., 2005). While these differences vary among
taxonomic groups, for each species-group large differences were found, with an average of about 50%
greater species diversity on organic farms.
140. Crowder et al. (2010) state that ecosystem function is degraded by reducing species number
(what the authors call “richness”), and by skewing the relative abundance of species (“evenness”). The
ecological effects of disrupted evenness has not received much attention, while conservation efforts often
focus on restoring or maintaining species number, reflecting the well-known impacts of richness on many
ecological processes. The authors argue that organic farming methods mitigate this ecological damage by
promoting “evenness”.
141. Moreover, the effects of evenness among natural enemy groups were seem to be independent and
complementary. Their results “strengthen the argument that rejuvenation of ecosystem function requires
restoration of species evenness, rather than just richness. Organic farming potentially offers a means of
returning functional evenness to ecosystems.” Even concerning landscape and habitat diversity, organic
farming may perform better, as a result of more diverse crop rotation and higher implementation rates of
structural elements, such as hedges and fruit trees – although the effects on the landscape are very farm-
and site-specific (Norton et al., 2009).
142. Gomiero et al. (2011) also found that organic farming systems generally support a larger floral
and faunal biodiversity than conventional systems, although, when properly managed, the latter can also
improve biodiversity. But, more importantly, they argue that the landscape surrounding conventionally
farmed land also appears to have the potential to enhance biodiversity in agricultural areas. Sandhu et
al. (2010) argue that organic agriculture plays a vital role in the provision of ecosystem services, such as
biological control, pollination, soil formation and nutrient cycle in agriculture which are important for the
sustainable supply of food and fibre.
Does organic farming trigger innovations?
143. In relation to the potential of organic farming to trigger innovations, an important element in
green growth processes, some observers consider organic farming as an innovation in itself (Padel, 2001).
But recent studies have found that organic farmers have little technology in product form and the main
innovations that enable competitive advantage, or allow higher labour productivity, occur in the form of
processes, organisation and marketing (Tereso et al., 2012).
144. Moreover, organic farming has the potential to trigger innovations in many fields of science and
engineering and create innovations in order to unravel its constraints. For example, breeding needs to
produce varieties with efficient nutrient uptake and use (Wolfe, 2008). Innovation could also be triggered
in the chemical industry to respond to the needs for biological pest control and the development of
biopesticides or other substances that are permitted by in organic agriculture.
COM/TAD/CA/ENV/EPOC(2015)5
36
Does organic farming create jobs?
Organic farming is more labour intensive compared with conventional production practices.
145. Although studies assessing the employment impacts of soil and water conservation practices are
rather rare, the relevant research literature is richer in the case of organic farming. This can possibly be
attributed to two facts: first, low-input production systems, such as organic farming, target the sustainable
use of nutrients, soil conservation and the optimised use of water; second especially in the developed
world organic farming has been (and still is) perceived as a competitive means of on- and off-farm (the
latter through its economy-wide linkages) diversification and as a reaction of the agricultural production
system to rising consumer demand for safe, high-quality food.
146. Many studies found that labour requirements per hectare on organic farms are higher than in their
conventional counterparts (e.g. Hird, 1997; Jansen, 2000; Lataccz-Lohmann and Renwick, 2002). This is
due to more labour-intensive production activities (e.g. complex rotation systems, mixed farming, etc.); a
higher share of labour-intensive crops (e.g. fruit and vegetables); less mechanisation; more on-farm
processing and trading and higher requirements for information (Morison et al., 2005).
147. In contrast to the above-mentioned studies, there have been arguments that labour needs in
organic farming depend on industry and country characteristics. For example, organic horticulture farms
need considerably more labour, while organic cereal-livestock and dairy farms might not require any more
labour than their conventional counterparts.
148. Offerman and Nieberg (2000) reviewed over 40 European studies between 1990 and 1997, and
found that labour use per hectare is, on average, 10-20% higher on organic farms, although considerable
variability exists between countries. Haring et al. (2001) suggest that, despite the fact that organic farming
requires a higher level of labour than conventional farming, it has had no significant effects on
employment in rural regions of Europe because of its relatively small size. (Greer et al., 2008) finds that
higher labour requirements compared to conventional farming practices are used by organic kiwi farms in
New Zealand, while Clavin and Moran (2011) found that labour needs of organic cattle farms in Ireland
were 15% higher than those on conventional cattle farms.
149. The positive employment effects associated with organic farming are also reported by
Jacobsen (2003), who uses a computable general equilibrium model for assessing the impacts of a subsidy
for organic farmers in Denmark. The study estimates rather significant positive employment effects
associated with the expansion of organic production, both in the primary and the food processing sector.
150. A survey of 1144 organic farms in the United Kingdom and Ireland found higher labour
intensity per organic farm (i.e. 97% and 27%, respectively) relative to conventional farms, despite the fact
that comparisons were complicated by a variety of factors such as different sizes of farms, crop variations,
horticulture and livestock farming and the inclusion of on-farm organic marketing activities, etc. (Morison
et al., 2005). The study concludes that, if 20% of all farms were to become organic, this would result in the
creation of 19% more jobs in farming in the United Kingdom and 6% more in Ireland.
151. As reported by Herren et al. (2012), the same data were analysed by the U.K. Soil
Association (2006), which found that, on a weighted basis, the labour requirements on organic farms were,
on average, 32% higher than on comparable non-organic farms (Green and Maynard, 2006). Also, another
study (Lobley et al., 2005), which surveyed 302 organic and 353 non-organic farms in three English
regions confirmed that organic farms provide more jobs than their non-organic counterparts (64% more
jobs per farm; 39% more jobs per hectare). The same study revealed a greater reliance in organic farming
on non-family labour (an average of 4 employees per farm, compared to 2.3 in the conventional sector) and
COM/TAD/CA/ENV/EPOC(2015)5
37
that organic farmers were more likely to diversify into other business activities (mainly trading and
processing) compared with non-organic farmers.
152. In an economy-wide context, Mon and Holland (2005) applied input-output analysis to the
investigation of the economic impact of organic apple production in Washington State (United States). The
authors compared the economic impact of organic versus conventional apple production. Results showed
that organic apple production was more labour-intensive than conventional production and that it produced
higher returns to labour and capital.
153. Lobley et al. (2009) argue that, despite the relatively small contribution of the sector to food
production, organic farmers in the United Kingdom are more likely to diversify their operations and adopt
innovative marketing arrangements, which generate more local employment, both on- and off-farm. Also,
the same study identified small-scale and locally orientated organic producers who manage a more diverse
range of marketing channels compared to those focussing on national and/or regional markets. However,
their input-output analysis revealed that, despite the capacity of small-scale organic producers to generate
high economy-wide employment effects at the local level, it is the large-scale organic producers who
account for the largest employment and income benefits in the organic sector.
154. In a similar context, the Organic Farming Research Foundation (2012) reports that production
and manufacturing of organic products in the United States creates 21% more jobs than the equivalent
non-organic activity, due to larger labour requirements, the smaller size of organic farms and reliance on
the organic certification industry. Similarly, a study in Maine found that organic agriculture (especially
vegetable and fruit farming) creates more jobs (8%) per farm and sells more locally than its conventional
counterparts (Maine Organic Farmers and Gardeners Association, 2010); also, workers in these jobs were
more likely to be younger and female than on conventional farms.
155. In contrast to the above-mentioned studies, there have been arguments that labour needs in
organic farming depend on industry and country characteristics. In Australia, Wynen (1994) found that
both in the cereal-livestock and dairy sectors, labour requirements on organic and non-organic
establishments were not very different. Offermann and Nieberg (2000) and Lobley et al. (2009) showed
that organic horticulture farms need considerably more labour, but Wynen (2000; 2001) has shown that
organic cereal-livestock and dairy farms in Australia do not require more labour than their conventional
counterparts, while Tzouvelekas et al. (2001) showed that organic olive oil farms in Greece require less
labour than conventional ones.
156. However, higher labour requirements can be positively perceived in regions with high
unemployment, but in some other cases, the restricted availability of farm workers may be a constraint for
the development of organic farming. The importance of industry and country characteristics are further
confirmed by Tyburski (2003), who argues that the fact that the average size of organic farms in Poland is
three times that of conventional farms, raises doubts as to the ability of the organic farming to generate
employment in that country.
COM/TAD/CA/ENV/EPOC(2015)5
38
Chapter 4. Unleashing the green growth potential of integrated pest management
Main messages
In most OECD countries, IPM adoption is primarily a response to demands for improved food
safety and lower health risks from both consumers and producers.
Impacts are in general positive and span over the economic, environmental and social arenas, but
a lack of common IPM definition renders assessment difficult.
The effects on yields, farm profits and farm incomes appear to be uniform and positive. By
adopting low input and integrated techniques, the use of pesticides can be reduced, without
compromising yields and without affecting farmers’ incomes, as cost savings outweigh
production losses.
Lack of an unambiguously agreed definition renders understanding, use in policy and assessment of
impacts difficult
157. Many definitions of the term Integrated Pest Management (IPM) exist, mainly due to its long
history and evolution (Box 4.1). The lack of an unambiguously agreed definition is a significant
impediment not only to common understanding of the term, but also to its use in policy and its
measurement.
158. The definitions have considerable implications for the way IPM is adopted on the field and the
methodology by which IPM policy efforts are measured. For example, the definitions vary considerably in
their treatment to pesticides (OECD, 1999). Some definitions appear neutral on the use of chemical
pesticides, while others argue for reduced pesticide use and others insist that pesticides should be used only
as a last resort, when all other approaches have failed. The holistic approach implies the simultaneous
management of multiple pests and the integrated use of multiple suppressive tactics.
159. For policy purposes, the most influential definitions are those provided by the FAO and by the
EU (which are very similar) and those of the United States Department of Agriculture (USDA), the U.S.
Environmental Protection Agency (EPA) and the International Organisation for Biological Control
(IOBC). The OECD has not endorsed a particular definition of integrated pest management and uses the
existing definitions of organisations such as the FAO or the IOBC.
160. There is a wide range of practices applied within IPM strategies due to the fact that IPM is
adapted to local geographic conditions and crop needs that vary enormously from region to region, even
within the same country. IPM is usually deployed in a number of steps, each one involving various
practices. In general, the standard procedures include: i) the preventive suppression of potentially harmful
organisms; ii) the identification and monitoring of these organisms; iii) a decision-making procedure based
on pre-defined action thresholds; iv) information from monitoring; and v) if and when needed, suppression
actions.
161. For this reason IPM never prescribes ready-to-use recipes or “one-size-fits-all” management
practices. For each case, a unique package of practices is proposed and a tailor-made strategy adapted to
local requirements is developed. However, in the historical course of developing and applying IPM, certain
practices have been found to contribute significantly more than others and in a wider range of
environments.
COM/TAD/CA/ENV/EPOC(2015)5
39
Box 4.1. What is IPM?
Reviews bring the number of IPM definitions to above 65 (Ehler, 2006; Prokopy and Kogan, 2003; Bajwa and Kogan, 2002). The early scientific definitions of IPM express a strong ecological inclination by stressing the need for the integrated use of multiple, suppressive tactics and the simultaneous management of multiple pests without neglecting the use of economic or treatment thresholds when applying pesticides. The historical roots of IPM can be found in the convergence of the related terms of Integrated Control or Integrated Pest Control that were developed in the early 1960s in the United States, and the term Pest Management developed in the same period in Australia
(Kogan, 1998), where it was used by ecologists and entomologists. A typical example of the scientific approach to define IPM is given by Prokopy (2003) as: “a decision-based process involving coordinated use of multiple tactics for optimising the control of all classes of pests (insects, pathogens, weeds, vertebrates) in an ecologically and economically sound manner”.
The FAO definition: “IPM means the careful consideration of all available pest control techniques and subsequent integration of appropriate measures that discourage the development of pest populations and keep pesticides and other interventions to levels that are economically justified and reduce or minimise risks to human health and the environment. IPM emphasises the growth of a healthy crop with the least possible disruption to agro-ecosystems and encourages natural pest control mechanisms”. FAO (2014) suggests the following six main steps as typical for an IPM approach: prevention and or suppression of harmful organisms; monitoring of harmful organisms; decision making based on monitoring and concerning with whether and when to use what pest management inputs with priority given to sustainable non-chemical methods; pesticide application should be considered as a last resort when there are no adequate non-chemical alternatives and the use of pesticides is economically justified; selection of pesticides which are as specific as possible for the target and have the least side effects on human health, non-target organisms and the environment; and monitoring of the success of the applied pest management measures.
The EU definition: “IPM means careful consideration of all available plant protection methods and subsequent integration of appropriate measures that discourage the development of populations of harmful organisms and keep the use of plant protection products and other forms of intervention to levels that are economically and ecologically justified and reduce or minimise risks to human health and the environment. ‘Integrated pest management’ emphasises the growth of a healthy crop with the least possible disruption to agro-ecosystems and encourages natural pest control mechanisms” (Article 3 of Directive 2009/128/EC).
The USDA definition: “IPM is a sustainable approach to managing pests by combining biological, cultural, physical and chemical tools in a way that minimizes economic, health and environmental risks”. “IPM is an effective and environmentally sensitive approach to pest management that relies on a combination of common sense practices. IPM programs use current, comprehensive information on the life cycles of pests and their interactions with the environment. This information, in combination with available pest control methods, is used to manage pest damage by the most economical means, and with the least possible hazard to people, property, and the environment. IPM programs take advantage of all pest management options possibly including, but not limited to, the judicious use of pesticides (US EPA)”. The US EPA (2014) proposes a four-step procedure: prevention, avoidance, monitoring and suppression.
Other organisations, such as the International Organisation for Biological Control (IOBC), place IPM within the framework of Integrated Production and defined IPM as “a concept of sustainable agriculture based on the use of natural resources and regulating mechanisms to replace potentially polluting inputs. The agronomic preventive measures and biological/physical/chemical methods are carefully selected and balanced taking into account the protection of health of both farmers and consumers and of the environment. Emphasis is placed on a holistic systems approach involving the entire farm as the basic unit, on the central role of agro-ecosystems, on balanced nutrient cycles, and on the welfare of all species in animal husbandry”.
162. Thus, taking into account the wide range of IPM practices and the environmental diversity in
which these practices are applied, a very detailed and restrictive definition of IPM does not seem to be
either possible or desirable. However, a harmonised definition of the principles and on the decision-making
process of IPM may be feasible. For example, a harmonised definition may ensure that the use of chemical
pesticides must be a last-resort farm practice and, when exercised, must be undertaken in a way that
minimises potential risks to human beings and the environment, respecting levels that are far below the
corresponding levels for conventional agriculture. On decision-making grounds, a harmonised definition
COM/TAD/CA/ENV/EPOC(2015)5
40
may ensure that IPM follows specific stages supporting a holistic and agro-ecological approach to farm
management with clearly defined decision rules and objectives.
163. One serious criticism is that contemporary IPM is far from how it was envisioned by its
proponents and has become Integrated Pesticide Management instead of Integrated Pest Management
(Ehler, 2006). Critics argue that this has come about because, in the effort to provide a quick-fix solution,
the holistic and integrated approach to pest management is suppressed and lost. The holistic approach
implies the simultaneous management of multiple pests and the integrated use of multiple suppressive
tactics.
Complexity of the concept hinders adoption
164. Despite some notable examples of IPM, adoption has often been limited, due to its complexity.
The brief exposition of IPM’s adoption across the major agricultural economies of OECD countries
presented in the Annex 1 suggests that in most European and North American countries IPM adoption was,
primarily, a response to demands for higher food safety and health from both consumers and producers. In
the EU, the United States and Canada, where consumer surveys have been carried out, a major issue is
still the harmonisation of IPM concepts and strategies among member states and provinces and the co-
ordination of actions at federal (United States and Canada) or EU level.
165. The examples presented suggest that these countries have identified the most critical stages in
IPM adoption and have attempted to provide cost-effective solutions. In these countries, monitoring and
early detection of pest populations above action thresholds is the major (and most costly) issue and thus
efforts target the development of monitoring and announcement systems. Training is also an issue and
training courses and material have been developed, distributed and delivered through various and
innovative ways (Box 4.2).
Box 4.2. Netherlands - Farming with Future
In the Netherlands, the national network project, Farming with Future, adopted a stakeholder management approach to mobilize the support and contribution of stakeholders in the development and subsequent introduction of IPM in practice (Wijnands et al., 2014). The Dutch approach for knowledge development and dissemination in the Farming with Future project appears to be effective. The project functioned as a transfer point for transferring knowledge on sustainable crop protection methods and it provided support to stakeholders wishing to transform their ambitions into concrete activities. The authors argue that “one could also use the term knowledge circulation or co-creation to refer to this process of sharing, applying, and developing knowledge further in an interactive process usually within heterogeneous groups. An important aspect within knowledge circulation is the interchange of scientific and tacit knowledge found within the different parties involved”.
166. In the EU, tremendous variability of IPM concepts, efforts, targets and measurement are depicted
in the National Action Plans of EU member states. These different approaches are rooted in the different
historical pathways followed by EU countries. Analysis of the Action Plans shows that what is argued as
the statutory adoption of IPM in 2014 is rather pesticide control, driven by the Sustainable Use Directive
and Plant Protection Products Directive (Directive 128/2009 and Regulation 1107/2009).
167. The lack of harmonisation prohibits the development of nation- or EU-wide schemes for the
certification of products under the IPM production technology. This is a potential drawback in the efforts
to communicate this technology to consumers. The lack of harmonisation and co-ordination makes
monitoring of adoption rates and assessment of IPM efforts more difficult. Information dissemination and
knowledge transfer are also critical issues in all countries.
COM/TAD/CA/ENV/EPOC(2015)5
41
Wide-ranging positive on- and off-farm economic impacts, albeit limited empirical evidence
168. In an economic analysis framework, IPM should be viewed as a damage abatement technology.
The economic impacts of IPM are primarily observed on the farm in terms of yields, production costs and
product prices, and off the farm in terms of social benefits from improved environment and health. These
economic impacts, in turn, can have significant consequences on the level of future IPM uptake and the
design of policy. Positive economic effects may attract farmers, while negative economic effects may
discourage the future uptake of IPM. If, however, off-farm welfare impacts are taken into account, it may
be in the interest of society to encourage IPM adoption by various incentives.
169. The economic impacts of IPM are closely related to the use and effects of pesticides and their
role in production. Early economic thinking considered pesticides in the same way as other inputs to
agricultural production functions, with a yield increasing effect just like labour, capital and fertilisers.
170. Farm practices that reduce the use of dangerous pesticides can have win-win-win benefits for
profitability, the environment, and human health in intensive systems. IPM uses a combination of
practices, especially improved information on pest populations and predators, to estimate pest losses and
adjust pesticide doses accordingly.
171. In its simplest form IPM should be considered as a responsive activity which may, at the end, use
chemical pesticides or other suppression methods according to pest levels. In this sense, monitoring is the
critical element in deciding the use of preventive or responsive pesticide application. If the cost of
monitoring is less than pesticide cost, IPM responsive activities will be preferred over preventive activities.
If monitoring is costless, preventive pesticide application activities will always be sub-optimal.
172. If the difference between optimal pesticide applications under different pest levels is large, and
the cost of monitoring is relatively small, then responsive application will produce a higher level of
expected profits than preventive application. However, even if the variance of the amount of required
pesticide is large, farmers may still use prevent applications if the price of pesticides is relatively cheap or
the cost of IPM is relatively high. Technology can be used to reduce the costs of monitoring and thereby
induce more responsive applications.
Why would farmers adopt IPM practices?
173. At the farm level, the economic impacts of IPM adoption are related to the costs and revenues
associated with the chosen IPM technology. Cost savings may accrue if reductions in pesticide use
outweigh the additional costs of practising IPM. The fact that there is contradicting evidence as regards
pesticide use under IPM technology highlights the need to adopt a common definition of IPM that will
allow scientists to build a coherent evaluation framework. Revenues are more certain, as yields are not
affected significantly under IPM, and prices are at least equal to the conventional product.
174. Despite strong political support for pesticide-use reduction and considerable scientific progress in
terms of tactical approaches to controlling pests (biological control, plant resistance, etc.), farming
practices – and thus pesticide usage – have not changed substantially (Lefebvre et al., 2013). The empirical
evidence on the effect of IPM on pesticide use is mixed, even for a given crop: IPM can reduce pesticide
use and costs without compromising yield in some circumstances, while in other circumstances IPM has no
significant effects on pesticide use; and a few studies even found evidence of increased use (Box 4.3).
COM/TAD/CA/ENV/EPOC(2015)5
42
Box 4.3. What does the empirical evidence show?
Hillocks (2012) argues that loss of triazoles in the United Kingdom could allow Septoria tritici to reduce wheat yields 10% to 20% and could cause yield reductions in rapeseed oil due to Leptosphaeria maculans and Pyrenopeziza brassicae. If mancozeb is withdrawn, fungicide resistant deterrent strategies for potatoes and other minor crops could be adversely affected. This will be a great opportunity for the adoption of IPM, at least for selected crops. Of course, some argue that the pesticide regulatory process directly affects the use of individual materials, and influences the types of new pesticides developed, registering new materials, and removing others from the market, but only indirectly affects aggregate quantity (Osteen and Fernandez-Cornejo, 2013).
Velivelli et al. (2014) review the problems and challenges of bacterium-based bicinchoninic acid BCA when used as part of an integrated management system. The authors conclude that “in addition to resourcing, the problems and challenges inherent in the identification, performance assessment, and registration of BCAs require significant co-operation from governmental agencies and the academic and industrial sectors to support the development of sustainable agriculture”.
An economic evaluation of 61 IPM programmes conducted by Norton and Mullen (1994) reported that adoption of IPM methods resulted in lower pesticide use. Pretty et al. (2006) reported that of 62 international IPM programmes, three-quarters showed declines in pesticide use, although this was criticised by Phalan et al. (2007) for selection bias in the study. More recently, Lechenet et al. (2014) assessed the sustainability of 48 arable cropping systems from two major agricultural regions of France, including conventional, integrated and organic systems, with a wide range of pesticide-use intensities and management (crop rotation, soil tillage, cultivars, fertilisation, etc.). They found that, in comparison with conventional systems, integrated strategies showed a decrease in the use of both pesticides and nitrogen fertilisers; they consumed less energy; and were frequently more energy-efficient. Other studies, however, failed to find significant effects of IPM adoption on pesticide use (Fernandez-Cornejo and Jans, 1996; Wetzstein et al., 1985), while others found evidence of increased use (Yee and Ferguson, 1996).
A recent French study carried out by INRA in the framework of the EcoPhyto programme, were pesticide use to be reduced by 50% in arable crops, 21% in orchard crops, and 37% in viticulture, yield decreases might be 12% in arable crops, 19% in orchards, and 24% in grapes. However, Jacquet et al. (2011) demonstrated ways of reducing the use of pesticides for field crops in France without necessarily incurring considerable income losses for the producers. The authors demonstrate that by adopting low-input integrated techniques, the use of pesticides can be reduced by about 10% without significant production loss. A more general adoption of integrated agricultural techniques can further produce a reduction of pesticides by 30%, with a reduction in production that is outweighed by cost savings and thus, no effects on farmers’ incomes.
Pimentel (2009) provides a rough account of the health and environmental costs of pesticide use in United States agriculture. He records that “human pesticide poisonings and illnesses are clearly the highest price paid for all
pesticide use. The total number of pesticide poisonings in the United States is estimated to be 300 000 per year. Worldwide, the application of 3 million metric tons of pesticides results in more than 26 million cases of non-fatal pesticide poisonings. Of all the pesticide poisonings, about 3 million cases are hospitalised and there are approximately 220 000 fatalities and about 750 000 chronic illnesses every year”. Estimates suggest that human pesticide poisonings and related illnesses in the United States cost about USD 1 billion per year (Pimentel and Greiner, 1997).
175. There is a wide range of reasons underlying the failure of certain IPM programmes to reduce
pesticide use. First, studies use different definitions of IPM in different contexts and results are not directly
comparable. For example, as pointed out earlier, the definitions of IPM used in the studies vary
considerably in the way use of pesticides is considered. Second, side effects were not always taken into
account. For example, IPM adoption may lead to an increase in cultivated areas which will result in higher
total farm pesticide use, but lower average use (per hectare use of active ingredient). Another important
reason is that there are numerous circumstances in standard agricultural practice that may be considered as
part of an IPM programme, but which do not really meet IPM guidelines (Epstein, 2014). Finally, it should
COM/TAD/CA/ENV/EPOC(2015)5
43
be noted that scientists are still far from achieving a full understanding all of the longer-term and region-
wide agricultural and ecosystem impacts of the use of even the softer pesticides (Bahlai, 2010).
176. Two critical areas which will affect the economic effects of IPM at the farm level are related to
the cost for inputs (conventional and IPM related) and the prices for output. Institutional and legislative
changes have prohibited the presence of many active substances in pesticides that might affect the cost of
pesticides. Furthermore, taxation and other economic regulations, such as quotas may also have an effect
on increasing pesticide prices in the very near future. On the other hand, R&D and infrastructure for
reducing the cost of monitoring and the early detection of pests reduce the cost of adopting IPM, but most
importantly reduces the risk perception of farmers when IPM is adopted.
IPM products command a price premium
177. The price of IPM products can command a price premium in the market as consumers become
more aware of the health risks associated with pesticide residues in food. Research shows that consumers
would be willing to pay more for products labelled “IPM Certified”. A wide range of studies based on
surveys indicates that IPM products are closely related to organic products in that those households that are
willing to pay a premium for organic products are also willing to consider alternative agriculture, such as
IPM. Evidence suggests that consumer preferences for IPM are strongly impacted by the price difference
with organic products (Marrone, 2009; Anderson et al., 1996; Magnusson and Granfield, 2003 and 2005;
Biguzzi et al., 2014).
Positive environmental impacts
178. The environmental effects of IPM programmes are, in general, positive and stem mainly from the
reduction of pesticide use (and, when necessary, use of only the most selective pesticides at the lowest
required quantities) and incorporation of good agricultural preventive practices which are usually
associated with the implementation of IPM practices. Thus, all recorded adverse effects of pesticide use on
the abiotic and biotic environment are ameliorated by IPM practices.
179. As noted earlier, most IPM assessments confirm a significant reduction in pesticide use, and thus
IPM brings about positive environmental effects, but these effects also accrue from the adoption of good
farming practices for the prevention of diseases, such as crop rotation and reduced tillage that enhance
biodiversity, protect soils and conserve water (conservation tillage and crop rotation form the core of many
IPM programmes). Tillage practices affect nutrient availability, soil structure and aggregate stability, soil
strength, soil temperature, the soil-water relationship and finally, the crop residue cover, with profound soil
microorganism and ecological effects that decrease pesticide reliance and use. The same beneficial effects
are produced by crop rotation.
Box 4.4. IPM and climate change
There is an argument that climate change could reduce the effectiveness of current IPM measures. Global warming could have serious consequences for the diversity and abundance of arthropods, and the extent of losses due to insect pests (Sharma and Prabhakar, 2014). As such, the components of pest management under IPM, such as host-plant resistance, bio-pesticides, natural enemies, and synthetic chemicals, may become less effective. Therefore, there is a need to take a concerted look at the likely effects of climate change on crop protection and to devise appropriate measures to mitigate the effects of climate change on food security. Sharma and Prabhakar (2014) propose actions to support the adaptation of IPM to possible climate change effects, as follows:
Map and predict the geographic distribution of insect pests and of their natural enemies, and understand the metabolic alterations in insects in relation to climate change;
COM/TAD/CA/ENV/EPOC(2015)5
44
Investigate how climatic changes will affect development, incidence, and population dynamics of insect pests;
Refresh the existing economic threshold levels for each crop–pest interaction, as changed feeding habits or increased feeding under high CO2 will change the economic threshold level for the pest;
Examine changes in levels of resistance to insect pests and identify stable sources of resistance for use in crop improvement;
Understand the effect of global warming on the efficacy of transgenic crops in pest management;
Taking into account the aforementioned, assess the efficacy of various pest management technologies under diverse environmental conditions, and
Draw appropriate strategies for pest management to mitigate the effects of climate change.
Gains spread beyond off-farm, but impacts on human and social capital difficult to assess
180. IPM’s economic benefits to society (welfare) are found in the reduction of pesticide use and the
consequent prevention of certain health problems, as well as environmental conservation, but these are not
well studied. It is difficult to locate studies dedicated to IPM’s impacts on health, which are estimated by
assuming that IPM reduces the use of high-risk pesticides and allows or tolerates the use of low-risk,
selective and rapidly deteriorating suppression substances.
181. The impacts of pesticides on environmental and human health increase the social cost of
pesticides beyond the private cost facing the farmer. If this cost is considerable, it can justify public
expenditure for the support of IPM adoption, either in the form of reducing the cost and risk of adoption
(monitoring and announcement systems) or in the form of subsidising forgone income.
182. The literature on the effects of pesticide on human health is long, especially in the area of
toxicology and the effects of pesticides have been well researched,10
but there is no real body of literature
that attempts to measure the economic benefits of IPM adoption on human health and the environment.
The results pertain to pesticide use in general and, as such, can be used indirectly in an IPM framework.
183. The social impacts of IPM refer mainly to impacts on human and social capital, but any
assessment faces important attribution issues. Impacts on human capital refer mainly to changes in the
knowledge and skills of farmers for decision-making related to pest control. Impacts on social capital refer
to changes in organisation, social networks, access to information and collective action for pest control.
184. IPM is about information provision and building knowledge on new approaches to pest control.
Social and human capital changes are embedded in IPM practice and are a pre-requisite to the successful
implementation of IPM. With IPM training programmes, farmers acquire knowledge and skills and
increase human capital. IPM projects lead to social empowerment and initiate a process of creation and
sharing of IPM knowledge and building of social relations within and between participants. For example,
training, and the consequent advancement in human capital resulting from training activities, is an essential
condition for the application of IPM. As such, IPM impacts on social and human capital are difficult to
disentangle from total IPM impacts. It is, however, difficult to clearly attribute observed productivity or
other differences between IPM-practicing farmers and control groups to the practice of IPM per se or to
increased human and social capital. More carefully designed studies and monitoring systems are required
for such an assessment.
185. However, the advancement in social and human capital occurring through the implementation of
IPM programmes is a stand-alone benefit and as such is a distinct positive impact. For example, higher
levels of networking achieved because of the implementation of a monitoring activity within an IPM
programme can spill over and diffuse information and knowledge not related to IPM. Techniques learned
COM/TAD/CA/ENV/EPOC(2015)5
45
for the prevention of pests in a specific cultivation may trigger the farmer to search for similar techniques
for other cultivations.
186. With IPM training programmes, farmers acquire knowledge and skills on a wide range of issues
including knowledge of:
the origin, biology and behaviour of the pest;
the means of dissemination (ways in which the pest arrives to field or storage)
control practices
the principles of controlled practices, that is, farmers learn the reasons for which a specific
practice should be implemented at a certain time and place.
And skills to:
diagnose and identify the presence and severity of an insect or a specific disease that is attacking
the crop, and how to monitor the development of the pest;
carry out a specific practice, as for example, in the case where farmers increase their capacities to
monitor the presence of pests with pheromone traps, which implies skills for installing and
monitoring traps.
Factors influencing the emergence and spread of IPM
187. The factors influencing the emergence and spread of IPM can be classified into factors pushing
farmers out of conventional agriculture and factors pulling farmers into alternative technologies, including
IPM. Among the push factors we include all the developments that make the exercise of conventional
agriculture more difficult and that are related to IPM. For example, banning of certain pesticides makes
IPM methods an appealing alternative and supports the spread of IPM.
188. On the other side, many factors attract (pull) farmers to the IPM technology. These factors
include many market developments driven by consumers, manufacturers or retailers and scientific and
technological developments that either provide IPM cost-efficient solutions to conventional problems or
reduce the cost of IPM practices, especially monitoring and announcement. Climate change is also among
the push and pull factors in IPM adoption. Finally, agricultural policy instruments also can support – but
also inhibit – the emergence and spread of IPM and, for this reason, are discussed in their own section.
National policies and international initiatives in force to reduce risks from pesticide use provide a push
for IPM
189. Developments that make the exercise of conventional agriculture more difficult and that are
related to IPM could be an important push factor influencing the emergence and spread of IPM. For
example, banning of certain pesticides makes IPM methods an appealing alternative and supports the
spread of IPM.
190. In particular, such factors include: international conventions for the restriction of hazardous
pesticides and national legislation (especially in Europe, North America and Japan that have banned a
number of hazardous pesticides; a pesticide tax that increases pesticide market prices; and the growing-pest
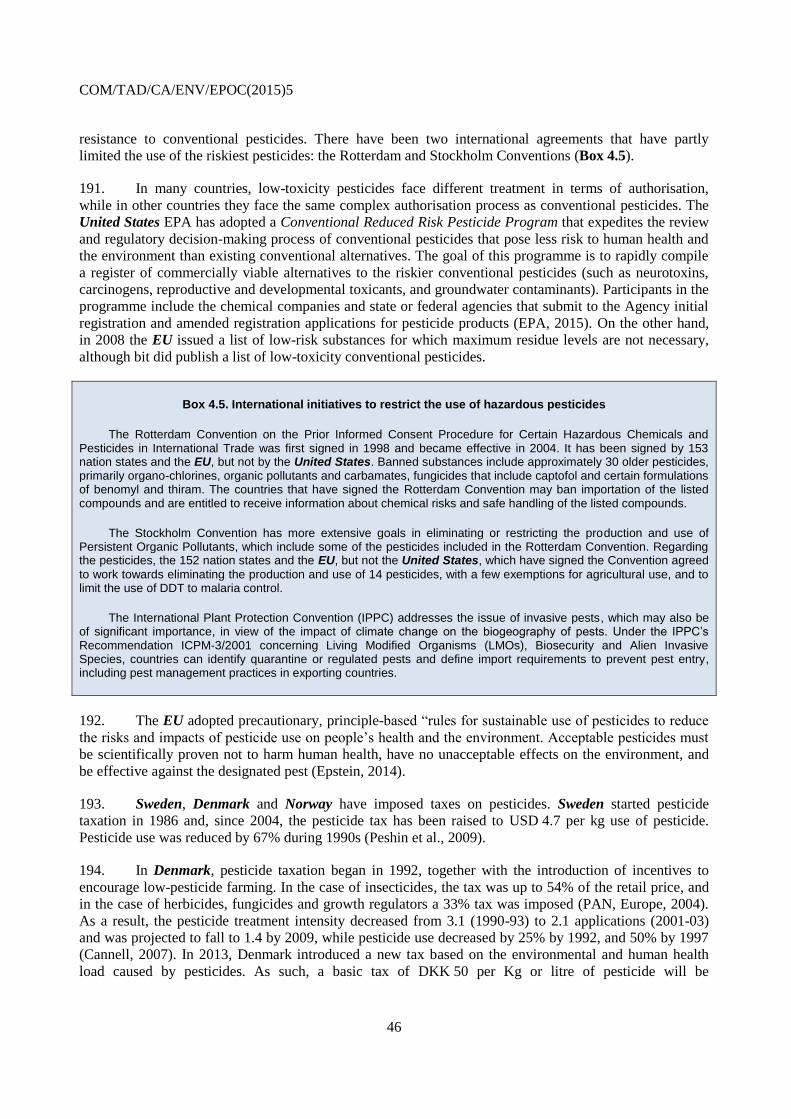
COM/TAD/CA/ENV/EPOC(2015)5
46
resistance to conventional pesticides. There have been two international agreements that have partly
limited the use of the riskiest pesticides: the Rotterdam and Stockholm Conventions (Box 4.5).
191. In many countries, low-toxicity pesticides face different treatment in terms of authorisation,
while in other countries they face the same complex authorisation process as conventional pesticides. The
United States EPA has adopted a Conventional Reduced Risk Pesticide Program that expedites the review
and regulatory decision-making process of conventional pesticides that pose less risk to human health and
the environment than existing conventional alternatives. The goal of this programme is to rapidly compile
a register of commercially viable alternatives to the riskier conventional pesticides (such as neurotoxins,
carcinogens, reproductive and developmental toxicants, and groundwater contaminants). Participants in the
programme include the chemical companies and state or federal agencies that submit to the Agency initial
registration and amended registration applications for pesticide products (EPA, 2015). On the other hand,
in 2008 the EU issued a list of low-risk substances for which maximum residue levels are not necessary,
although bit did publish a list of low-toxicity conventional pesticides.
Box 4.5. International initiatives to restrict the use of hazardous pesticides
The Rotterdam Convention on the Prior Informed Consent Procedure for Certain Hazardous Chemicals and Pesticides in International Trade was first signed in 1998 and became effective in 2004. It has been signed by 153 nation states and the EU, but not by the United States. Banned substances include approximately 30 older pesticides, primarily organo-chlorines, organic pollutants and carbamates, fungicides that include captofol and certain formulations of benomyl and thiram. The countries that have signed the Rotterdam Convention may ban importation of the listed compounds and are entitled to receive information about chemical risks and safe handling of the listed compounds.
The Stockholm Convention has more extensive goals in eliminating or restricting the production and use of Persistent Organic Pollutants, which include some of the pesticides included in the Rotterdam Convention. Regarding the pesticides, the 152 nation states and the EU, but not the United States, which have signed the Convention agreed
to work towards eliminating the production and use of 14 pesticides, with a few exemptions for agricultural use, and to limit the use of DDT to malaria control.
The International Plant Protection Convention (IPPC) addresses the issue of invasive pests, which may also be of significant importance, in view of the impact of climate change on the biogeography of pests. Under the IPPC’s Recommendation ICPM-3/2001 concerning Living Modified Organisms (LMOs), Biosecurity and Alien Invasive Species, countries can identify quarantine or regulated pests and define import requirements to prevent pest entry, including pest management practices in exporting countries.
192. The EU adopted precautionary, principle-based “rules for sustainable use of pesticides to reduce
the risks and impacts of pesticide use on people’s health and the environment. Acceptable pesticides must
be scientifically proven not to harm human health, have no unacceptable effects on the environment, and
be effective against the designated pest (Epstein, 2014).
193. Sweden, Denmark and Norway have imposed taxes on pesticides. Sweden started pesticide
taxation in 1986 and, since 2004, the pesticide tax has been raised to USD 4.7 per kg use of pesticide.
Pesticide use was reduced by 67% during 1990s (Peshin et al., 2009).
194. In Denmark, pesticide taxation began in 1992, together with the introduction of incentives to
encourage low-pesticide farming. In the case of insecticides, the tax was up to 54% of the retail price, and
in the case of herbicides, fungicides and growth regulators a 33% tax was imposed (PAN, Europe, 2004).
As a result, the pesticide treatment intensity decreased from 3.1 (1990-93) to 2.1 applications (2001-03)
and was projected to fall to 1.4 by 2009, while pesticide use decreased by 25% by 1992, and 50% by 1997
(Cannell, 2007). In 2013, Denmark introduced a new tax based on the environmental and human health
load caused by pesticides. As such, a basic tax of DKK 50 per Kg or litre of pesticide will be
COM/TAD/CA/ENV/EPOC(2015)5
47
complemented by a tax of DKK 107, multiplied by the score of the effect of the pesticide on the
environment, its environmental “fate” and human health.
195. The environmental and human health load of the individual product is divided into the following
three groups of factors, which comprise a total of 16 factors. Environmental effects are the effects of the
product on non-target organisms (e.g. birds, fish, daphnia, algae and earthworms). The terms
“environmental fate and behaviour effect” refer to the degradation and accumulation of the product in the
environment. The tax base is determined by the substances’ persistence, bioaccumulation and risk of
leaching to groundwater. Human health effects concern the risks of the product for users, such as the
possibility of causing damage to foetuses, acute toxicity or eye irritations.
196. Norway started a pesticide reduction programme in 1988, which employed a levied banded tax
system based on toxicity at the rate of USD 3.8 per ha. Today, Norway uses an innovative system, dear
which tax rates on pesticides vary according to the actual environmental harm caused rather than quantity
sold. This is not as challenging as it seems to be because Norway has approved only 188 pesticides for use
(OECD, 2010).
197. The counter-argument to taxes comes from the fact that pesticides are price inelastic and thus
their demand is relatively price insensitive. Skevas et al. (2013) reviewed 27 studies from the United States
and the EU and concluded that, due to the fact that pesticide demand is relatively inelastic in economic
terms (meaning that pesticide use is relatively price-insensitive) proposed taxes would be unlikely to have
a major effect on pesticide use. For example, in Denmark, the 1996 and 1998 pesticide tax schemes did not
deliver pesticide use reductions or reductions in the Treatment Frequency Index (Pedersen et al., 2011). As
the authors argue, it is impossible to deem the tax system of that period either a success or a failure as there
were so many concurrent factors influencing pesticide use.
198. For Norway, Withana et al. (2014) argue that it is very hard to estimate the exact impact of the
pesticide tax on the environment due to the multiplicity of variables that can have a potential influence on
pesticide sales, as well as statistical data that record pesticide stockpiling in the years before a tax is
imposed or raised. However, it seems that the banded tax system in Norway had the effect of encouraging
more conservative use of pesticides and provided an incentive to use less harmful products. Skevas et al.
(2012) argue that pesticide quotas can be more effective in reducing pesticide use and, consequently,
decreasing adverse environmental consequences than taxes, even if they differentiate between high and
low toxicity pesticides, price penalties on the environmental effects of pesticides, or subsidies on low-
toxicity products.
199. Pesticides are the predominant control method because they are relatively cheap and – to an
extent – efficient, and because supply chains are in place and farmers have the equipment and knowledge
needed to apply them. The global pesticide market fluctuates at around USD 33 billion, with herbicides to
account for almost half of it and fungicides and insecticides to account for the other half. The EU member
states account for roughly one-third of this market. As a percentage of farm production costs, pesticides are
relatively inexpensive and account for less than 5% of the intermediate consumption in the European
Union and the United States (USDA ERS, 2014). At the same time, the chemicals pesticide industry
shows some signs of stagnation. For example, in 2009 only one new chemically active ingredient was
registered by the US EPA largely because pesticide development and testing by the crop protection
industry, and EPA registration, take an average of nine years to complete and cost pesticide manufacturers
USD 152 million to USD 256 million for each crop protection product introduced to market
(CropLife, 2014).
200. On top of legislative changes, and the phase-out of many active substances and residue
restrictions, pest resistance is another serious development constraining the use of pesticides and
COM/TAD/CA/ENV/EPOC(2015)5
48
facilitating the use of alternative technologies. Over-use and injudicious preventive use of pesticides have
resulted in pest resurgence, secondary pest problems and the development of heritable resistance (Van
Emden and Service, 2004). Around the world, almost 500 species of arthropod pests and 200 species of
weeds have been reported to present resistance to one or more insecticide or herbicide (Hajek, 2004; Heap,
2010). Weeds have evolved resistance to 21 of the 25 known herbicide sites of action and to 156 different
herbicides (Heap, 2014).
201. Environmental restrictions, especially have related to water quality for human consumption,
amenities or nature conservation, have also instigated a range restrictions not only concerning the actual
use of pesticides, but also pesticide emissions in soil, water and air. For example, in the Netherlands, a
significant push out of the conventional use of pesticides was induced by the adoption of MYCPP to
reduce pesticide emissions into soil, surface and groundwater, and air by 50–90% (Wijnands et al., 2014).
202. Furthermore, and in view of the targets set by the adoption of the EU Water Framework
Directive, many National Action Plans for the sustainable use of pesticides in Europe contain specific
reference to pesticides emitted to water. For example, the United Kingdom Action Plan states among its
priorities that “Residues of some pesticides particularly those in slug pellets applied to autumn sown
cereals and oilseed rape crops are detected in water in certain parts of the UK with a frequency and
concentration that may compromise the UK’s ability to meet its obligations under the Water Framework
Directive (WFD)”. Furthermore, from the nature conservation side, many Natura 2000 protected areas in
Europe have attempted to addressing risks posed by pesticides to biodiversity by including restrictions or
incentives in their management plans.
Advances in science and technology are important drivers for reducing the perceived risk of low yields
in IPM
203. The perceived risk of low yields is perhaps the most significant barrier to IPM adoption by
farmers. Thus, any development in science, technology and policy that reduces this perceived risk will
attract farmers to IPM. However, it should be noted that farmers' perception of production risks has not
always been identified as a major barrier to adopting integrated farming practices. De Buck et al. (2001),
argued that “dealing with production risks, such as weather-dependent problems with weeds, pests and
diseases, is considered part of professionalism of both conventional and integrated arable farming systems
and hence not a reason for avoiding a specific crop husbandry technique. On the contrary, the authors
found that uncertainties emerging from market conditions and environmental policy were more important
factors than perceived production risks.
204. Many developments in science and technology have attempted to provide support and reduce the
cost in crucial stages for IPM implementation. IPM is very dependent not only on information collected
through monitoring, but also on information regarding Economic and Action Thresholds. The information
is used in decision making concerning with the need to activate suppression practices or not, selecting
which practice to apply and decide on the optimal time to do so. As concerns large-scale monitoring and
forecasting, countries have undertaken efforts to improve meteorological data and weather forecasts and
warnings of possible pest events to farmers (Box 4.6).
205. IPM is not a simple technology. Thus, the decision-making process for its adoption is more
complex in comparison to packaged technologies. Being a complex technology, IPM requires a well-
planned educational effort to facilitate potential users to change their mind and adopt IPM technology. For
this reason, IPM is considered to be a knowledge-based technology. Farmers’ lack of knowledge about the
correct application of IPM technology has been identified as an important constraint to adoption (Olson et
al., 2003). To this end, extension efforts are the most crucial step in encouraging adoption. Conventional
extension strategies in developed countries (e.g. one-on-one farm visits, field demonstrations, training
COM/TAD/CA/ENV/EPOC(2015)5
49
workshops, printed materials, telephone and mass media) have been complemented by developments in
information technology (OECD, 2015).
206. The most important scientific development in the suppression stage of the IPM is the biological
control, in general, and of bio-pesticides, in particular. Although there is no commonly accepted definition
of bio-pesticides (OECD, 2013), the term that describes them as a “mass-produced agent manufactured
from a living microorganism or a natural product and sold for the control of plant pests” encompasses most
entities classed as bio-pesticides within the OECD. However, there is no agreement if bio-pesticides
include genetically modified organisms (GMOs), growth regulators or products of natural origin.
Box 4.6. Germany's Action Thresholds and US's eXtension initiatives
In Germany, a new forecasting system and simulation models are supported by the National Meteorological Service with 560 weather stations and a radar network (Hommel, et al. 2014). Prognosis models are displayed at nation-wide risk maps using GIS spatial interpolation techniques. These daily risk maps, based on the aforementioned elements, show the infection pressure of different pests in cereals, potatoes, sugar beet, and horticultural crops. Action thresholds – or, in other words – the numbers of pests above which suppressive action should be taken to block the population from reaching the Economic Threshold and cause economic injury, are calculated, based on the epidemiology of pests and their injury profiles. Of course, thresholds are not available in all regions and crops and, even when they are available, they vary between regions and depend on microclimate and agronomic practices. Information about thresholds provided by the plant protection services and via the ISIP online portal has become an important part of independent advice (Hommel et al., 2014). The ISIP is Germany’s information system for integrated plant production (das Informations System Integrierte Pflanzenproduktion).
eXtension is a USDA-funded extension initiative to gather all the expertise in the United States using the Internet as the collaborating and information-disseminating platform. The eXtension site provides useful information about IPM for Extension Agents, as well as farmers and others. In addition, and taking into account the widespread use of Smartphones, the Co-operative Extension Service has started to transmit IPM information using phone applications to help users readily access information.
207. The most well-known semio-chemicals are insect sex pheromones, used for monitoring or pest
control by mass trapping, lure-and-kill systems and mating disruption. The global market for bio-pesticides
was at around USD 1.3 billion in 2011, dominated by North America, which accounted for around 40% of
the global bio-pesticide demand in 2011. Europe is expected to be the fastest-growing market in the near
future, once certain organisational issues have been resolved.
208. In Europe, efforts have focused on the issue of defining what is not a low-risk substance. Europe
has not, as yet, produced a list of low-risk substances that could be supported – and this work may take a
long time to realise. As a result, certain bio-pesticides are currently treated as regular chemical insecticides.
An example of such a case refers to semi-ochemicals, which are chemicals that mediate interactions
between organisms. Semio-chemicals are sub-divided into allelochemicals and pheromones, depending on
whether the interactions are interspecific or intraspecific, respectively (Flint and Doane, 2013). EU
Regulation 1107/2009 on Plant Protection Products requires that semio-chemicals be subjected to the same
regulatory requirements as chemical insecticides – this restriction constitutes a major regulatory barrier for
products containing semio-chemicals and has discouraged a number of bio-control firms from putting
effort to the European market, while European bio-control firms switch their efforts to North America and
other emerging markets with more welcoming legislation (Tasin, 2013).
209. Marrone (2009) records the major obstacles to the adoption and widespread use of bio-pesticides.
She argues that firstly, the market is highly competitive and capital-intensive. Many companies addressing
the same market include the large companies (such as Monsanto, Dupont, Syngenta, Bayer, BASF and
Dow), the medium ones (including Arysta, Advan, Makhteshim, FMC, Cerexagri, Gowan Valent and
others) and the many small ones. This number of companies and products makes it hard for small bio-
COM/TAD/CA/ENV/EPOC(2015)5
50
pesticides companies to stand out among the others. Also, it requires large amounts of capital in order to
enter the market, conduct field trials, organize farm demonstrations, and develop marketing programmes.
210. The second obstacle to the adoption of bio-pesticides, according to Marrone (2009), is the
complex selling channel including distributors, advisors, university and government researchers, etc.
Finally, the third serious barrier to the adoption of bio-pesticides is risk aversion on the part of farmers,
distributors and advisors. Unless a serious problem exists (hazardous pesticide, pest resistance, banning,
etc.), growers and their gatekeepers and key influencers (distributors and pest control advisors) have
become accustomed to affordable chemicals that generally perform up to expectations. Changing this
requires a lot of effort and field trials to persuade farmers and advisors that there is only a low risk of
losing the produce if they switch to bio-pesticides.
211. Problems are also recorded for Biological Control Agents (BCAs) that internationally are
becoming harder to source, due to the strict regulation that require impacts of BCA to be assessed. For
example, the New Zealand Environmental Protection Authority has approved the use of 19 BCAs since
2000. In addition to resourcing, the problems and challenges inherent in the identification, performance
assessment and registration of BCAs require significant co-operation from the stakeholders involved
(government, private sector and academia) to support the development of sustainable agriculture (Velivelli
et al., 2014). Moreover, marketing a BCA depends on the ability of the provider to illustrate that the
product is safe and cost-effective. The economic impacts of BCAs have not yet been the subject of in-
depth research (especially in the area of cost effectiveness). This lack of economic assessment can be
attributed to three reasons, namely: (a) long period from commencement to full field results; (b) difficulties
in assigning monetary values to biodiversity and social impacts; and (c) difficulties in assessing impacts of
biological control (McFadyen, 2008).
212. A final “pull” factor is related to market-driven developments, ranging from consumer concerns
over food safety, the retail and manufacturing industry and the institutions regulating the market. As
discussed earlier, consumers are gradually becoming aware of the IPM technology – however, the level of
awareness is not as high as had been expected or – at least – is not as high as the awareness of organic
production. To this end, the lack of a clear definition and the lack of harmonisation among IPM policies
have contributed to the relatively lower recognition of IPM products in the market.
213. In the United States, the USDA is developing a national certification scheme for growers
adopting organic practices, but there is no similar scheme underway for IPM. Since IPM is a complex pest
control process, not merely a series of practices, it is impossible to identify one IPM definition for all foods
and all areas of the country. Many individual commodity growers, for such crops as potatoes and
strawberries, are working to define what IPM means for their crop and region, and IPM-labelled foods are
available in limited areas. The same situation holds for the EU. In the United States a private IPM
labelling scheme was started by Wegmans Food Markets, Inc., a Rochester-based retail grocer, which
approached Cornell University in 1994, seeking the means to offer its customers IPM-grown sweet maize.
Other private labels include Green Shield Certified, an independent, non-profit certification program that
promotes practitioners of effective, prevention-based pest control, while minimising the use of pesticides,
the Northeast Eco Apple Project, funded by EPA, Region 1 Strategic Agricultural Initiative and many
others.
214. AvoGreen® is a Pest Monitoring programme of New Zealand’s Avocado Growers' Association
and Industry Council with an auditable avocado production system based on the principles of IPM. The
programme aims to keep pest populations at levels below those that can cause economic loss and with
careful monitoring and trace-back systems provide overall quality and safety assurances to all customers.
Beyond food safety, IPM labels can serve as eco-labels, which assure consumers of countryside
stewardship and guarantee that farming practices have not harmed the environment.
COM/TAD/CA/ENV/EPOC(2015)5
51
Enabling policy environment necessary to overcome barriers of adoption
215. Agricultural and other policies related to the environment, food safety and consumer security or
even energy, can prohibit or inhibit IPM adoption. Agricultural price support policies or energy policies
favouring biofuels can incentivise continuous crop production without rotations because they inflate output
prices. This does not favour crop rotation, which is a fundamental practice in IPM programmes. At the
legislative level, certain regulations ban the use of high-risk pesticides and favour bio-controls while, at the
same time, many bio-pesticides (e.g. semi-ochemicals) have to undergo the same authorisation procedures
as high-risk chemical pesticides.
216. Other policies have tried to support IPM development. In the United States, in order for growers
to collect indemnities for state crop insurance they have to follow “best management practices,” which
include pesticide applications: Horowitz and Lichtenberg (1993) reported that corn growers in the Midwest
who purchased crop insurance spent 21% more on pesticides and treated 63% more acreage with
insecticides than those without crop insurance. Even energy policies for biofuel production have prohibited
the adoption of IPM in maize cultivation.
217. In the EU’s rural development policy, IPM is usually treated under the horizontal agri-
environmental scheme that offers, on a voluntary basis, farmers with payments for adopting IPM practices
such as minimisation of pesticide use and optimisation of input use (fertilisers, irrigation water, etc.). This
type of support has been the subject of some criticism, however, on the grounds that they are not targeted
and they do not reward best practice. IPM’s spread in the EU has been supported by the Sustainable Use
Directive and the Plant Protection Products Directive. In addition, food safety standards and especially the
adoption of maximum residue levels have supported IPM adoption worldwide (see Annex 1).
218. More targeted support could be provided for the purchase of inputs (e.g. recognised cultivars and
authorised bio-pesticides) to reward specific and costly prevention farming practices, to hire scouting
labour or acquire monitoring devises (e.g. light traps) and, more generally, to reduce the high cost of
adoption. Furthermore, IPM programmes may consider support to tailor-made insurance packages for IPM
participants.
219. Public policies can improve two critical areas that affect the economic effects of IPM and the
probability of IPM adoption at farm level: the cost of inputs (conventional and IPM-related) and the prices
for output. Conventional high-risk pesticides may become less available and more expensive due to
institutional and legislative changes that prohibit the availability of many active substances and to financial
disincentives, such as taxation.
220. In parallel, IPM practices may also be assisted through the provision of infrastructure for
monitoring, early detection of pests and decision making and support to alternative suppression practices
including the production of very low-risk pesticides. Such efforts can reduce the cost difference, whenever
it exists, between conventional and IPM agriculture and limit the perceived adoption risk for potential IPM
adopters. If this is further coupled with an IPM product differentiation rewarded with a market price
premium, higher adoption rates can be expected.
221. Best policy examples include actions initiated by governments in a “top-down” approach that
attempt to provide solutions to well-identified barriers to adopt IPM solutions, or actions initiated by the
industry itself in a “bottom-up” approach as a response to acute market problems or changing market
demands.
COM/TAD/CA/ENV/EPOC(2015)5
52
Lessons about best-policy practices
Selected examples of successful IPM programmes
222. In this section some key lessons learned from the application of selective successful IPM
programmes and practices are drawn. It is very difficult to discuss about best policies for fostering and
promoting IPM because policies are made up by different actions. Of the actions that together constitute an
IPM policy, some may be more successful than others. In the section below we concentrate on such “case
studies” and record the factors that contributed to their success. These cases were initiated from the
government in a “top-down” approach where government tried to provide solutions to well identified
barriers to adopt IPM solutions or were initiated from the industry itself in a “bottom up” approach as a
response to acute problems or market demands.
IPM and wheat production in Canada
Key lesson: Successful IPM programmes are built over a long period, are based on accumulated
knowledge, and include a number of complementary actions to reduce the cost of IPM adoption
(forecast and risk warnings), provide alternatives for prevention, monitoring and suppression and
support decision-making (Action Thresholds and Decision Support Systems)
223. Wheat producers in Canada have access to a comprehensive management programme to
minimise the economic and ecological impact of S. mosellana. This IPM toolkit was developed over a
period of 15-20 years, and has been successfully adopted by producers, in large part due to the technology
transfer efforts of researchers and provincial entomologists (Dixon et al., 2014). The technology which is
available to producers includes: forecasts and risk warnings systems; monitoring tools (e.g. field scouting
tool, sticky cards and pheromone traps); cultural control and agronomic practices (e.g. selecting susceptible
varieties of spring wheat on planting early); biological control and host plant resistance; Action Threshold
Levels (e.g. use of insecticide is only authorised once a specified level of infection has been reached);
Decision Support Systems (e.g. accumulated degree-day models to predict the emergence of adult pests
throughout the infested areas and to assist producers in the scouting of their fields).
Support Bio-control firms in Denmark
Key lesson: Government subsidies can be used to confront barriers to entry in the bio-pesticide
industry, increase the number of alternative low-risk pesticides or bio-pesticides available to farmers,
possibly reduce their cost and sustain or attract an innovative, high-tech and employment-creating
industry in Denmark.
224. A subsidy scheme to promote alternative pesticides is in place. The objective is to increase the
supply of alternative low-risk pesticides (i.e. those with a better health and environmental profile than
traditional synthetic pesticides) by assisting small firms in the bio-control industry to register their
products, as the high cost of trial could be a potential entry barrier for small firms. This initiative should be
viewed as part of an integrated approach in Denmark to push farmers out of conventional pest control
(through taxation, strict regulation, etc.) and pull them into low-risk pest control approaches. It is still too
early to be able to report the results of this intervention.
IPM and scientific contributions - the Environmental Impact Quotient
Key lesson: Scientific contributions within a collaborative IPM framework can yield widely
applicable and transferable results
COM/TAD/CA/ENV/EPOC(2015)5
53
225. Within the framework of the New York IPM programme, a methodology to assess the
environmental impact of pesticides was created (Chandran, 2014). The model, termed the Environmental
Impact Quotient (EIQ), considers various factors, such as toxicity and the environmental attributes of
pesticides, to produce the risk factor of using a pesticide in a given situation (Kovach et al., 1992). The
model was based on a scientific collaboration between Cornell University and the New York State
Agricultural Experiment Station. Since then, the model has gained US and international acceptance as a
credible method to quantify the impact and success of IPM programmes, and has formed the basis for
extended-augmented models and for the introduction of more complex pesticide tax systems.
The kiwi and apples industry in New Zealand
Key lessons: Factors contributing to the success include: i) close partnership between researchers,
technology transfer experts and the sectors working towards a common goal; ii) the strong foundation
of basic knowledge gained through sustained research programmes – the knowledge and information
are available to be implemented in collaboration with the industry, when a specific issue or problem
arises; iii) collaborative activity between scientists and industry personnel in transferring technology;
and iv) co-ordinated industries, capable of making unified commitments.
226. Kiwi growers in New Zealand traditionally sprayed pests (specifically leaf-roller and scale
insects) by the calendar. Early export requirements, required that orchards should be inspected and
declared free of pests and diseases, and before 1992, up to eight insecticide applications were made each
season (compared with only one in hotter areas, such as Chile and California).
227. In a collaborative action between the kiwi fruit industry and the scientists from Horticulture and
Food Research Institute of New Zealand Limited (HortResearch), large-scale orchard trials were
undertaken using IPM in 1991 and 1992. In 1992 an industry trial successfully produced 262 000 trays of
fruit under this new management system; 4.7 million trays in 1993; and 6.8 million trays in 1994. Since
1997 100% of kiwi fruit exported from New Zealand (63 million trays) has been produced by growers
using this eco-friendly production system known as ‘KiwiGreen’. The KiwiGreen IPM label indicates that
biocontrol methods are favoured and that chemical sprays are used only when numbers of pests are high.
The KiwiGreen programme also considers environmental factors, sustainability, ethical trading practices
and hygiene standards.
228. For apples, which is an important export commodity of New Zealand’s agriculture, pesticides and
fungicides were used in order to ensure high quality and reduce production loss caused by codling moth
and five leafroller species, as well as the key fungal problem caused by black spot (scab) due to the moist
New Zealand climate. Pesticides were also used in order to comply with foreign markets’ phytosanitary
requirements, especially the zero tolerance levels for live codling moth in New Zealand apple exports to
Chinese Taipei, China, Japan, Thailand and India (Gianessi, 2013). The Integrated Fruit Production (IFP)
programme started in 1996 and was instigated by the apple industry to introduce major changes to insect
and disease management (Stevens, 2011). The programme was rapidly adopted and by late 2010 91% of
the area with apple orchards was under IFP practice. The fungicide loading declined by 45% to 16.9 kg of
active ingredient per hectare (Walker et al., 2009) and insecticides use was reduced by 80%, while use of
insecticide sprays was reduced by 40-50%.
Agro-environmental partnerships in the Californian wine-grape sector
Key lessons: Successful approaches are better built on a dense nexus of pre-existing economic and
social relationships by strong local organisations with the collaborative scientific support of
institutions that have accumulated knowledge and experience.
COM/TAD/CA/ENV/EPOC(2015)5
54
229. Agro-environmental partnerships is a strategy for extending sustainable agriculture in California
and consist of an agreement over more than one season among growers, growers’ organisations and
agricultural scientists to apply agro-ecological principles to farm-scale practices and improve the
stewardship of environmental resources. In the wine-grape industry, these partnerships have also involved
regulators, and environmental and community leaders and their organisations.
230. At the state level, in 2001 the Sustainable Winegrowing Program began to promote sustainable
practices from “ground to bottle.” Practices concerning pest management, water and energy use, labour
practices, wine quality, community issues and other topics are outlined in the Code of Sustainable
Winegrowing Practices: Self-Assessment Workbook. As Warner (2007) argues, “California wine-grape
growers have created more partnerships than any other commodity because they have: strong local
organizations; differentiated product quality by varieties that depend on regional environmental conditions;
added significant economic value to wines by geographic branding; and recognized the importance of
providing educational outreach to their environmentally conscious neighbours”. These factors have
prompted the industry to develop what may be the most comprehensive sustainability initiative of any US
commodity.
231. California has more than 40 regional winegrower and vintner associations, which provide a pre-
existing set of economic and social relationships upon which these partnerships have been built. Many of
the practices effectively implement the results of years of University of California research, such as leaf
removal and canopy management, use of cover crops, IPM, economic injury thresholds, use of weather
data and models for disease-risk forecasting, and genetic resource improvements (Broome and Warner,
2008).
Best-policy practices to address barriers and increase IPM adoption
232. Best-policy practices aim to confront the factors prohibiting IPM adoption and to support the
factors inhibiting IPM adoption. The latest OECD workshop on IPM (OECD, 2011) contains many
recommendations for governments and stakeholders. Of course, it should be mentioned that in complex
technologies, as is the case for IPM, there is no policy recipe. Policies should be tailor-made to respond to
issues and problems created within specific production and environmental frames. Taking this into
account, the central issue is how far IPM harmonisation and standardisation may be pursued.
233. Throughout this chapter, it has been shown that efforts to harmonise IPM definitions and
procedures should maintain a delicate balance between expected benefits from harmonisation and possible
problems that may be created due to harmonisation. A high degree of harmonisation and standardisation
will return benefits related to scale economies of unified markets for IPM products and inputs. This will
facilitate the certification and labelling of IPM products and the authorisation of inputs in international
markets. It will also allow for improvements in the monitoring and assessment of IPM practices worldwide
and for a more efficient design of policy instruments.
234. At the same time, it may be argued that a strict definition of IPM implies two risks. First, the
strict definition of IPM will inevitably confine the available IPM practices and thus it will challenge the
very essence of IPM, which depends on the ability of farmers to respond and innovate under different
production systems and environmental conditions. In other words, as the degree of harmonisation and
standardisation of IPM increases, the diversity of responses and of innovative solutions will decrease and
the “integrated” and “environmental” dimensions of IPM will be sacrificed for the sake of economic and
managerial efficiency. Second, a strict definition of IPM will bring to the international trade and marketing
of agricultural products a level of regulation on top of Sanitary and Phytosanitary requirements. This may
create more bureaucracy and give rise to the emergence of yet another Non-Tariff Measure in international
trade.
COM/TAD/CA/ENV/EPOC(2015)5
55
235. The list below records some policy-relevant recommendations for the adoption of best practices
emerging from the analysis.
Develop a framework for IPM certification programme
236. For example, building on the FAO definition, consumers may be certain that when they purchase
an IPM product, three basic concepts prevail in its production: (a) pests are managed in an integrated way
with the simultaneous use of different product and place dependent farm practices, (b) there is a decision-
making process and a product-place specific decision rule for the use of pesticides as a last resort and that
(c) these pesticides are selected and used in such a way as to ensure minimum risks to human health
beyond MRLs and minimum damage to the environment, including biodiversity.
Set clearly defined and quantifiable multi-dimensional policy targets
237. Such target could, for example, go beyond targets focused on cultivated area under IPM or
quantity of pesticides. They may take account of the quantity of active ingredients or a compound risk
indicator. The process of setting up these policy targets may be assisted by life-cycle analysis or other
types of analyses that will measure the sustainability of proposed plant protection practices, taking into
account climate change.
Set baseline indicators of IPM adoption according to policy targets
238. Baseline indicators are the cornerstone of any policy monitoring and evaluation activities, as well
as of the cost-effectiveness of policy measures and instruments. Baseline indicators should be extended
beyond the policy targets to include indicators related to economic, environmental and social assessment.
Consolidating a strong scientific background and information database on available practices,
action thresholds and suppression tactics is a pre-requisite to any IPM programme to be
implemented
239. There is already a strong and wide scientific background on IPM practices, including Action
Thresholds and suppression tactics. This material should be organised under a world-wide, publicly
accessible database. The database should be updated with any new research and empirical evidence.
Support innovative IPM training for farmers and assess the effects of these training schemes with
sound methodology. Couple training with extension and demonstration
240. Training schemes have a positive impact on building the human and social capital needed for
IPM use on farms. These should be enhanced by providing follow-up schemes for networking, re-training,
demonstration projects, visits and meetings.
Reduce farmers’ perceived risk of IPM adoption by providing selective support for a pre-defined
limited time period
241. Due to learning curves, a time period is needed for the full range of benefits to follow the
adoption of new IPM practices or technology. During this period, and especially for the early adopters, the
risk of dropping out from the new technology is high. Therefore, for the early adopters discretionary
support may be provided (e.g. to be used for the purchase of inputs, such as recognised cultivars and
authorised bio-pesticides; to compensate for specific and costly prevention farming practices; support for
the hire of scouting labour or the acquisition of monitoring devices, such as light traps; and various other
aids that may be judged necessary by the programme to reduce the high initial outlay).
COM/TAD/CA/ENV/EPOC(2015)5
56
Revise existing insurance subsidy policies that have a negative impact on IPM adoption
242. Some insurance programmes impede the adoption of IPM. They can be linked to actions that
reduce the risk of lower yields and imply the preventive use of conventional pesticides. To counter this,
IPM programmes may consider support to tailor-made insurance packages for IPM participants.
COM/TAD/CA/ENV/EPOC(2015)5
57
Chapter 5. The critical role of modern agricultural biotechnology in scaling out productivity
Main messages
Modern biotechnology can be potentially applied in several applications in agriculture, but some
elements have proved highly controversial in some countries and commercialisation of biotech
crops so far has been limited to a few crops, mainly feed, and a small number of traits.
Modern agricultural biotechnology has the potential to greatly increase the resource use
efficiency of agriculture production: i) it offers a wide range of technical possibilities for
overcome production constraints that are more difficult or intractable with conventional breeding,
to increase profitability and productivity; ii) it can speed up conventional breeding programmes
and provide farmers with disease-free planting materials; iii) it can create crops that are resistant
to pests and diseases, replacing toxic chemicals; iv) it can provide diagnostic tools and vaccines
to help in controlling devastating animal diseases; and v) second- and third-generation products
of modern biotechnology address additional and more complex challenges, such as drought
tolerance and nitrogen-use efficiency
On average, empirical evidence show positive economic effects of biotechnology use, while the
effects on biodiversity are ambiguous and context specific.
What is biotechnology and how is it used in agriculture?
243. The main objective of this chapter is to provide a succinct synthesis of the potential impacts of
agricultural biotechnology on resource productivity and efficiency in OECD countries, and to identify
some of the associated main policy issues. It is not intended to provide an exhaustive review of the full
range of agricultural biotechnology tools and applications. Genetic engineering, particularly in the crop
sector, is the area in which biotechnology having the most direct effect on agriculture in many countries
and has given rise to pressing public concerns and policy issues. Therefore, although the chapter touches
on the full range of agricultural biotechnology tools and applications, the main focus is on: disease-, insect-
and pesticide-resistant crops, and drought-tolerant crops. For more information on OECD's work on
biotechnology, see the OECD biotechnology web site at: http://www.oecd.org/sti/biotech/ .
244. Biotechnology comprises a number of related technologies with a wide range of current and
potential applications in many sectors and is of significant interest to policy makers. It has the potential to
contribute to meeting the challenges of green growth. Biotechnology can overcome production constraints
that are more difficult or intractable under conventional breeding schemes. It can speed up conventional
breeding programmes and provide farmers with disease-free planting materials. It can create crops that
resist pests and diseases, thus replacing toxic chemicals that harm the environment and human health, and
it can provide diagnostic tools and vaccines that help control devastating animal diseases.
245. Renewed interest in biotechnology has arisen in parallel with the emergence of the notion of the
bio-economy – the economic sectors that are based on bioscience and biotechnology innovation
(OECD, 2009). For example, the use of renewable resources, which is expected to increase substantially
COM/TAD/CA/ENV/EPOC(2015)5
58
over time, often requires specific properties of the plant that can be developed using genetically
engineering technologies.
246. Most of the bio-economy strategies or visions adopted by OECD countries include references to
agricultural biotechnology. The United States’ National Bioeconomy Blueprint, published in 2012, for
example – which recognises the bio-economy as a political priority because of its tremendous potential for
economic growth and social benefits – considers that agricultural biotechnology can make an important
contribution to the bio-economy through the development of innovative products and processes, the
creation of jobs and growth – the “greening” – of the agricultural sector
(www.whitehouse.gov/sites/default/files/microsites/ostp/national_bioeconomy_blueprint_april_2012.pdf).
247. The OECD study into the bio-economy in 2030 suggests that the use of biotechnology is likely to
be pervasive by 2030, and the separation of agriculture into biotechnology and non-biotechnology
disciplines will likely become obsolete, due to the rapid adoption of biotechnology for better diagnostics
and improved varieties of farmed plants and animals (OECD, 2009).
248. Modern agricultural biotechnology includes a range of tools that scientists employ to understand
and modify the genetic make-up of organisms for use in the production or processing of agricultural
products: genetically engineered crops, such as insect- and herbicide-resistant plants or transgenic animals,
such as pigs that can digest cellulose, or transgenic fish, such as faster-growing salmon. Modern
biotechnology in general refers to the combination of life-science with engineering that includes
recombinant DNA technology (Tramper and Zhu, 2011). The applications not only include crops and farm
animals, but also food products such as cheeses, bakery products, wine, beer, a wide range of
pharmaceutical products and other areas of the bio-economy.
249. The OECD’s definition of biotechnology is deliberately broad, covering all modern
biotechnology, as well as many traditional or borderline activities, and is as follows: the application of
science and technology to living organisms, as well as parts, products and models thereof, to alter living or
non-living materials for the production of knowledge, goods and services (Box 5.1).11,12
Box 5.1. OECD’s definition of biotechnology
Defining biotechnology
The single definition
The provisional single definition of biotechnology is deliberately broad. It covers all modern biotechnology but also many traditional or borderline activities. For this reason, the single definition should always be accompanied by the list-based definition which operationalizes the definition for measurement purposes. The single definition is:
The application of science and technology to living organisms, as well as parts, products and models thereof, to alter living or non-living materials for the production of knowledge, goods and services.
The list-based definition
The following list of biotechnology techniques functions as an interpretative guideline to the single definition. The list is indicative rather than exhaustive and is expected to change over time as data collection and biotechnology activities evolve.
The list-based definition of biotechnology techniques:
DNA/RNA: Genomics, pharmacogenomics, gene probes, genetic engineering, DNA/RNA sequencing/synthesis/amplification, gene expression profiling, and use of antisense technology.
Proteins and other molecules: Sequencing/synthesis/engineering of proteins and peptides (including large
COM/TAD/CA/ENV/EPOC(2015)5
59
molecule hormones); improved delivery methods for large molecule drugs; proteomics, protein isolation and purification, signaling, identification of cell receptors.
Cell and tissue culture and engineering: Cell/tissue culture, tissue engineering (including tissue scaffolds and
biomedical engineering), cellular fusion, vaccine/immune stimulants, embryo manipulation.
Process biotechnology techniques: Fermentation using bioreactors, bioprocessing, bioleaching, biopulping, biobleaching, biodesulphurisation, bioremediation, biofiltration and phytoremediation.
Gene and RNA vectors: Gene therapy, viral vectors.
Bioinformatics: Construction of databases on genomes, protein sequences; modelling complex biological processes, including systems biology.
Nanobiotechnology: Applies the tools and processes of nano/microfabrication to build devices for studying biosystems and applications in drug delivery, diagnostics etc.
Source: http://www.oecd.org/sti/biotech/statisticaldefinitionofbiotechnology.htm
250. Interpreted in this broad sense, the definition of biotechnology covers many of the tools and
techniques that are commonplace in agriculture and food production, such as fermentation and brewing.13
For example, conventional plant breeding has been the method used to develop new varieties of crops for
hundreds of years. The most controversial of the improved biotechnologies are transgenic crops also called
genetically engineered or genetically modified organisms, commonly known as GMOs.14
Genetic
engineering is a tool for “precision breeding,” enabling the insertion of genes with desirable traits from
different species.
251. It should be emphasised, however, that modern agricultural biotechnology is more than genetic
engineering. The most significant breakthroughs in agricultural biotechnology, for example, are coming
from research into the structure of genomes and the genetic mechanisms behind economically important
traits. The rapidly progressing discipline of genomics, revolutionising understanding of the ways in which
genes, cells, organisms and ecosystems function, is opening new horizons for marker-assisted breeding and
genetic resource management: it provides information on the identity, location, impact and function of
genes affecting such traits - knowledge that will increasingly drive the application of biotechnology in all
agricultural sectors (Box 5.2 and 5.3).
Box 5.2. Genomics : the new revolution
Genomics, the study of all the genetic material in an organism, is leading to tremendous advances in biotechnology. Genomics is both generating new tools and techniques and producing huge amounts of biological data for scientists to analyse. As a result of genomics, genes for desirable traits can be rapidly identified and used to create new biotechnology products.
It should be stressed that genomics does not necessarily involve genetic modification or synthetic biology. Rather, genomics technologies can be applied to animal and plant breeding to greatly improve the efficiency of selection of traits. In the case of trees, this is especially important given the long timescales needed for growth and trait expression. Genomics can address several challenges facing sustainable agriculture. For example, the combination of drought/heat tolerant traits with the ability of a plant to make its own fertilisers addresses several vitally important challenges, including water security, food security, resource depletion and climate change.
COM/TAD/CA/ENV/EPOC(2015)5
60
Box 5.3. Bio-fortification: creating Golden Rice
Bio-fortification – the creation of plants that make or accumulate micronutrients – aims to increase the nutritional quality of staple crops through breeding and is used for the production of functional foods. The breeding can either be through conventional or traditional ways or through genetic engineering methods. Crops produced through bio-fortification tend to be rich in nutrients such as iron, zinc, and Vitamin A. Bio-fortification differs from ordinary fortification because it focuses on making plant foods more nutritious as the plants are growing, rather than having nutrients added to the foods when they are being processed. Golden Rice is a good example of a bio-fortified crop. In
this specific case, bio-fortification was obtained by genetic modification of the rice plant to produce and accumulate pro-vitamin A in the grain, a trait not found in nature. Initially developed in Switzerland and Germany in the late 1990s, Golden Rice has now spread to other places – although its critics point out that dealing with Vitamin A deficiencies may not best be achieved through the engineering of a rice cultivar (Scoones, 2002).
Source: Hall and Dorai (2010).
How widespread is biotechnology in agriculture?
252. Biotechnology is being used to address problems in all areas of agricultural production and
processing. Biotechnology contributes to the development of new varieties of plants and animals, new
diagnostic tools, breeding, and veterinary therapeutics and vaccines.
253. In the case of plants, the main goals of biotechnology include: i) agronomic traits to improve
yields and provide resistance to stress, such as heat, cold, drought or salinity; ii) herbicide tolerance, to
allow plants to resist the effects of specific herbicides; iii) pest resistance to improve the ability of the plant
to resist harmful insects, viruses, bacteria, fungi or nematodes; and iv) product quality characteristics, such
as modified colour, or flavour, modified starch or oil composition to improve nutritional value or
processing characteristics, and the production of medical and industrial compounds.
254. For livestock, biotechnology has three main applications: breeding, propagation and health.
Diagnostics can be used to identify serious inherited diseases, so as to remove afflicted animals from the
breeding population. The largest commercial application of biotechnology in animal breeding is the use of
Market Assisted Selection (MAS) to improve the accuracy and speed of conventional breeding
programmes, by employing biological markets to identify certain traits. MAS is widely used in both OECD
and non-OECD countries.
255. However, whether the traits selected through biotechnology are in support of a green growth
agenda depends very much on the goals of crop improvement efforts. While breeding approaches to
develop drought-tolerant, pest-resistant varieties could have a benign effect on green growth, the same
techniques could be used to address traits, such as responsiveness to chemical fertilisers, which are not
intrinsically sustainable.
Adoption of biotech crops has been rapid, but narrowly based
256. The use of biotech (transgenic) crops has increased steadily since the first commercial plantings
in North America in 1996. Over the 1996-2014 period, the global area planted with bio crops increased by
more than 100-fold – from 1.7 million hectares in 1996 to 181.5 million hectares. This represents just over
12% of the world’s arable land, and is largely constituted of soybeans, maize, cotton and oilseed rape
(canola) (James, 2015).
257. Although 28 countries worldwide are growing biotech crops, adoption has been uneven across
countries and commercialisation has involved only a few crops and traits. Five countries (United States,
COM/TAD/CA/ENV/EPOC(2015)5
61
Brazil, Argentina, Canada and India) accounted for almost 90% of the global area planted in biotech crops
in 2014, and two crops (soybeans and maize) and two traits (insect resistance and herbicide tolerance)
accounted for more than 70% of the global area planted in biotech crops (Annex Figure A5.1, Annex
Table A5.1).
258. Worldwide, for nearly half of the biotech crop area herbicide tolerance is the dominant trait
introduced, followed by insect resistance. Stacked traits is an important and growing feature of biotech
crops (28% of the global 181 million hectares), with 13 countries having planted biotech crops with two or
more traits in 2014. Herbicide tolerance soybean is the most dominant transgenic crop grown commercially
(48% of the global area devoted to biotech crop total, mainly in Brazil, the United States and Argentina),
followed by Bt maize (33% – mainly in the United States) and Bt cotton (14% – mainly in India, China,
the United States and Pakistan) and herbicide tolerance canola (mainly in Canada and the United States
(James, 2015).
259. A significant development in 2014 was the over fivefold increase in the adoption of the first
biotech drought-tolerant maize (which uses less water per hectare) planted in the United States in 2013
(from 50 000 ha in 2013 to 275 000 ha in 2014).
260. Data on adoption patterns show: i) adoption rates and speed of herbicide resistant plants which
are higher than for insect resistant plants; ii) herbicide resistant soybean worldwide being the crop with the
highest adoption rate; iii) herbicide tolerant sugar beet in the United States being the crop with the highest
speed of adoption; and iv) biotech maize being the crop where adoption substantially increased with a
combination of traits.
261. Public policies are key to explain the narrow geographical development of biotech crop use.
Although several OECD countries have granted regulatory approvals to biotech crops for use as food, feed
or environmental release since 1996, biotech crops are planted in only nine OECD countries – United
States, Canada, Mexico, Australia, Spain, Portugal, Czech Republic, Slovakia and Chile for seeds
(Annex Table A5.1). In terms of food or feed approval, the OECD country with the highest number of
approved events for biotech crops is Japan, followed by the United States, Canada and Mexico
(James, 2015).1516
The information presented in Annex Table 1 clearly shows that currently the United
States (with 70.1 million hectares and with an average of around 90% adoption across all crops) and
Canada are the two OECD countries where biotech crops are of main importance.
Box 5.4. Biotech crops in the United States
Biotech seed suppliers and technology providers
The number of field releases for the testing of biotech varieties approved by USDA’s Animal and Plant Health Inspection Service (APHIS), which is an important indicator of R&D activities in agricultural biotechnology, grew from 4 in 1985 to 1 194 in 2002 and averaged around 800 per year thereafter. Also, releases of biotech varieties with agronomic properties (like drought resistance) jumped from 1 043 in 2005 to 5 190 in 2013. As of September 2013, about 7 800 releases were approved for biotech maize, more than 2 200 for biotech soybeans, more than 1 100 for biotech cotton and about 900 for biotech potatoes. Releases were approved for biotech varieties with HT (6 772 releases), IR (4 809), product quality such as flavour or nutrition (4 896), agronomic properties like drought resistance (5 190) and virus/fungal resistance (2 616). The institutions with the most authorised field releases include Monsanto (6 782), Pioneer/DuPont (1 405), Syngenta (565) and USDA’s Agricultural Research Service (370). As of September 2013, APHIS had received 145 petitions for deregulation (allowing biotech seeds to be sold) and had approved 96 petitions: 30 for maize; 15 for cotton; 11 for tomatoes; 12 for soybeans; 8 for rapeseed/canola; 5 for potatoes; 3 for sugar beets; 2 each for papaya, rice, and squash; and 1 each for alfalfa, plum, rose, tobacco, flax, and chicory.
COM/TAD/CA/ENV/EPOC(2015)5
62
Farmers
Three crops (maize, cotton and soybeans) make up the bulk of the area planted to biotech crops. In 2013, about 169 million acres of these biotech crops were planted, or about half of total land used to grow crops. In 2013, the area of HT crops planted accounted for 93% of soybean acreages, 85% of maize acreage and 82% of cotton acreage. Farmers planted insect-resistant (Bt) cotton to control pests on 75% of cotton acreage and Bt maize was planted on 76% of maize acreage in 2013.
The adoption of Bt crops increases yields by mitigating yield losses from insects. However, empirical evidence
regarding the effect of HT crops on yields is mixed. Generally, stacked seeds (seeds with more than one biotech trait) tend to have higher yields than conventional seeds, or seeds with only one biotech trait. Biotech maize with stacked traits grew from 1% of maize acres in 2000 to 71% in 2013. Stacked seed varieties also accounted for 67% of cotton acres in 2013.
Planting Bt cotton and Bt maize seed is associated with higher net returns when pest pressure is high. The extent to which HT adoption affects net returns is mixed and depends primarily on the extent to which weed control costs are reduced and seed costs are increased. HT soybean adoption is associated with an increase in total household income because HT soybeans require less management and enable farmers to generate income via off-farm activities or by expanding their operations.
Farmers generally use less insecticide when they plant Bt maize and Bt cotton. Maize insecticide use by both GE seed adopters and non-adopters has decreased – only 9% of all U.S. maize farmers used insecticides in 2010. Insecticide use on maize farms declined from 0.21 pound per planted acre in 1995 to 0.02 pound in 2010. The establishment of minimum refuge requirements (planting sufficient acres of the non-Bt crop near the Bt crop) has helped delay the evolution of Bt resistance. However, there are some indications that insect resistance is developing to some Bt traits in certain areas.
The adoption of HT crops has enabled farmers to substitute glyphosate for more toxic and persistent herbicides. However, an overreliance on glyphosate and a reduction in the diversity of weed management practices adopted by crop producers have contributed to the evolution of glyphosate resistance in 14 weed species and biotypes in the United States. Best management practices (BMPs) to control weeds may help delay the evolution of resistance and sustain the efficacy of HT crops. BMPs include applying multiple herbicides with different modes of action, rotating crops, planting weed-free seed, scouting fields routinely, cleaning equipment to reduce the transmission of weeds to other fields, and maintaining field borders.
The price of biotech soybean and maize seeds grew by about 50% in real terms (adjusted for inflation) between 2001 and 2010. The price of GE cotton seed grew even faster. The yield advantage of Bt maize and Bt cotton over conventional seed has become larger in recent years as new Bt traits have been incorporated and stacked traits have become available. Planting Bt cotton and Bt corn continues to be more profitable, as measured by net returns, than planting conventional seeds.
Source: Fernandez-Cornejo, J., S. Wechsler, M. Livingston and L. Mitchell (2014), Genetically Engineered Crops in the United States, USDA, Economic Research Service Economic Research Report Number 162, http://www.ers.usda.gov/media/1282246/err162.pdf
262. In the EU, only two biotech crops are currently authorised for cultivation – insect-resistant Bt
maize (MON810) and starch-modified Amflora potatoes. Commercial planting of these crops is grown on
relatively small areas. The Bt maize (MON810) aims to protect the crop against a harmful pest – the
European corn borer. In 2014, Bt maize – which aims to protect the crop against a harmful pest (the
European corn borer) was cultivated in five EU member states (Spain, Portugal, Czech Republic, Slovakia
and Romania), with a total area planted of 143 016 hectares (of which 131 538 hectares planted in Spain).
It represents 1.6% of the 9.6 million hectares of maize cultivated in the EU (or 30% of maize cultivated in
Spain). The Amflora potato, which was authorised in 2010 for cultivation and industrial processing, is no
longer cultivated since 2011. New GM traits, genes and crops that have been developed in field trials, but
have yet to be cleared for commercial use, include crop varieties which provide different nutritional or
industrial qualities (such as easier conversion to biofuel), or increased tolerance to environmental stresses
such as freezing, drought or salinity.
COM/TAD/CA/ENV/EPOC(2015)5
63
263. The differences in adoption pattern can be explained by the differences in the cultivation
problems addressed. For example, the dominance of herbicide-resistant transgenic varieties is linked to the
use of use and the large area where it can be applied. Glyphosate and other broadband herbicides control
almost all plants, and can be applied under different agro-climatic conditions and the technology is easy to
apply. Moreover, their use can encourage the use of no-till, by removing the need for mechanic weeding
(e.g. soybeans and canola).
264. In the EU, there are considerable differences in the attitudes of member states towards the use of
biotech crops, including a wide range of views on the impacts of these crops on biodiversity (EC, 2011). A
number of EU countries have chosen to adopt the precautionary principle, with nine of them implementing
national ban on GM crop cultivation (Austria, France, Germany, Greece, Hungary, Italy, Poland,
Luxembourg and Bulgaria). Anyone who wants to release a GM organism or market a GM product has to
get formal authorisation before doing so. Applications for approval to market a product (including crop
seeds for cultivation, food or feed) are assessed and decided upon at EU level, while applications to release
a GM organism for R&D purposes are considered at national level (Box 5.5).
Box 5.5. EU legislative framework covering GMOs
Authorisation for the import, cultivation and processing of GMOs in the EU requires, a priori, authorisation at the EU level, conducted by the European Food Safety Authority (EFSA), based on a scientific risk safety assessment on health and the environment. The risk assessment for GMO plants that are used for non-food or non-feed purposes include, inter alia, assessments of persistence, invasiveness and selective advantage or disadvantage. While cultivation of GMOs is recognised to be an issue with strong national or local dimensions, current EU legislation offers limited possibilities to member states to adopt GMO cultivation on their territory. Member states can only restrict or ban the cultivation of GMOs by adopting safeguard clauses where new serious risks to human health, animal health and the environment have been identified, following cultivation of the GMO. In 2009, 13 member states requested the European Commission to grant more flexibility in this area.
In January 2015, an amendment was adopted which aims at giving EU member states enhanced flexibility by broadening the criteria for refusing to permission to cultivate GMO on their territory. In particular, during the authorisation procedure of a GMO, EU member states may demand that the geographical scope of the authorisation be adjusted to exclude all or part of their territory. In addition, the amendment permits that EU member states to ‘opt-out’ of the EU authorisation (i.e. be able to restrict or prohibit cultivation of GMOs that have been authorised at the EU-level on “compelling grounds” related to, inter alia, environmental policy objectives, town and country planning, land use, socio-economic impacts, agricultural policy objectives and public policy). Member states, however, are not allowed to ban a GMO on the grounds of risk to health or the environment: this will remain the domain of EU’s food safety body, EFSA.
Source: http://ec.europa.eu/food/plant/gmo/legislation/future_rules_en.htm
Profitability expectations are mainly based on yields and relative costs
265. Like any technological innovation in agriculture, biotechnology will have economic impacts on
farmers’ wellbeing. The potential income-related impacts for farmers include changes in the use of inputs;
associated costs; output (quantity and quality); and gross income. The overall economic impacts of
biotechnology will depend on a wide range of factors including (among others) the impact of the
technology on farming practices and yields, consumers' willingness to buy biotech products (expressed by
food companies’ policies as the main crops are largely for animal feed and non-food use) and regulatory
requirements and associated costs. In the longer term, other factors, such as industry concentration in the
production and marketing of biotechnology crop technology, may also influence the level and distribution
of economic benefits.
COM/TAD/CA/ENV/EPOC(2015)5
64
266. Farmers who adopt the new technology, especially those who adopt early, may reap benefits in
terms of lower production costs and/or higher output.17
Other farmers could be placed at a competitive
disadvantage depending on how consumer preferences and regulatory regimes evolve. If the attitude of
consumers is generally accepting of biotech crops and if regulatory requirements are not too onerous,
adopting farmers would gain and non-adopting farmers would lose (this is usually the case with biotech
cotton). If consumer opinion is negative, however, non-adopting farmers could turn this into a competitive
advantage and command a price premium for non-biotech products.18
Another consideration to be taken
into account is that biotechnology is mainly controlled by a few large companies, which can raise issues of
competition.
267. Biotech-adopter farmers could also directly influence the economic benefits of non-biotech
adopter farmers if there is inadvertent gene flow from biotech adopter to non-biotech adopter fields. Such
eventuality may create problems for non-biotech adopter farmers willing to sell their products in specific
markets (e.g. organic certified markets).
268. Thus, the net economic impact of biotech on farms can be a complex and dynamic concept that is
not easily measured. Although, in the first instance, biotech will only be widely adopted if it provides
economic benefits for farmers, a number of economic and institutional factors affect the farm-level
profitability of biotech crops in addition to their purely agronomic characteristics.
269. Overall, the farm-level profitability of biotech crops is likely to be influenced by key variables
such as differences in yield, reductions in insecticide or weed management costs, differences in seed
prices, and differences in the price received by the farmer between the biotech crop and its conventional
counterpart. Moreover, a combination of underlying factors, such as local socio-economic and cultural
factors, are also important drivers.
270. There is a voluminous and ever increasing body of literature concerning the potential economic
effects of biotech crops, which has found positive economic impacts, although the impacts vary between
and within countries, across years and between different crop or trait combinations (see Annex A2). It
appears that the more heterogeneous the growing environment, pest pressures, farmer practices and social
context, the more variable are any benefits likely to be. Thus, the extent of economic benefit associated
with different crop-trait combinations is likely to vary widely.
271. For example, a study by Klumper and Qaim (2014), which performed a meta-analysis approach –
on 147 published biotech crop studies conducted during 1995-2014 worldwide – found that, on average,
biotech technology has reduced chemical pesticide use by 37%; increased crop yields by 22%; and
increased farmer profits by 68%. One of the key findings of the Hall et al. (2013) study, who performed a
systematic literature review approach19
, is that planting GM crops as opposed to a non-GM equivalent,
resulted in a positive farm-level economic impact.
272. Generally, studies have found that certain categories of costs are lower following adoption of
biotech crops (notably chemical costs), while others are consistently higher (specifically, seed costs). Cost
categories that are particularly high for biotech crops when compared to non-biotech crops include seed
costs and technology fees (value of biotech technology) (the latter are an entirely additional cost not
incurred with conventional crops), while chemical costs are generally lower.
273. Changes in farm level profit and costs have been shown to vary through time, but the results are
inconclusive as to why. It appears that the greatest benefits have been recorded by the earliest studies
(profits were highest and cost increases were lowest) and that the benefits from cultivating biotech crops
have declined since then.
COM/TAD/CA/ENV/EPOC(2015)5
65
274. Although caution is necessary in extrapolating from one crop or country to another, from the
short term to the long term and from a small sample of farmers to an entire sector, the general conclusions
emerging from the literature review is that, overall, biotech crops have brought net economic benefits to
farmers through reduced pesticide costs, or more flexible and less labour-intensive weed management, and
by the facilitation of zero-tillage cropping systems.
Higher yields
275. Productivity gains encompass higher returns on all factors of production or lower input
requirements per unit of production. This could lead to higher crop yields (due to the presence of fewer
insects or pests), lower pesticide and fertiliser applications, less demanding production techniques, higher
product quality, better storage and easier processing. These gains should be assessed in comparison with
conventionally produced crops, produced under the same production system. Ultimately, higher
productivity may result in lower producer and consumer prices.
276. Overall, available empirical evidence tends to suggest that yields are higher with biotech crops
than with their conventional counterparts, although there is significant variation by crop, trait, location and
year. The largest yield increases have been observed in cotton, followed by maize. The yield effects in
herbicide resistant crops are, on average, moderate, as they mainly facilitate simplified crop management,
particularly weed control and encourage no till.
277. Unsurprisingly, the yield gains reported for soybeans are smaller than those for cotton and maize,
as biotech soybean varieties are mainly herbicide-resistant and the yield effect there is small. The studies
also show a wide range of yield effects, which can be explained by differences in environmental (e.g.
different pest pressures, seasonal variations), economic and surrounding policy conditions between
countries. The introduction of an insect-resistant variety results in a larger yield gain in countries where
farmers do not use insecticides to control plant pests (e.g. many developing countries) compared with
countries where crop protection is commonly practiced (Bennett et al., 2013).
278. Due to higher yields, biotechnology crops might reduce pressure on land resources and diminish
the need for clearing the land or for land preservation, thereby reducing pressure on natural habitats from
agricultural land-use. In the future, drought-resistant biotech crops could become available (thereby saving
water). Salinity-resistance of the soil could contribute towards the continuation of agriculture in regions
affected by this phenomenon, which is primarily linked to irrigation.
Labour use and productivity positive impacts mainly evident in non-OECD countries
279. Insect-resistant and herbicide-tolerant crops can reduce on-farm labour demand as they reduce
the number of pesticide applications, increase flexibility and simplify crop management. According to
Marra and Piggott (2006), farmers in the United States highly value the simplified weed control offered by
herbicide-resistant crops. The non-pecuniary benefits have been estimated to be about USD 10 to USD 25
per hectare. In countries with a high use of insecticides for pest control, insect-resistant crops not only
reduce labour demand, but also provide labour benefits via reduced health costs.
280. While the effects of labour productivity will be more pronounced in non-OECD countries, such
as China and India, major employment effects are expected in the up- and down-stream sectors of OECD
countries. As modern biotechnology is a key technology for the emerging bio-economy, additional
employment opportunities can be expected in the bio-economy sector (OECD, 2009).
COM/TAD/CA/ENV/EPOC(2015)5
66
Pesticide use reduction will benefit the environment
281. Changes in pesticide use associated with the production of biotech crops have been considered as
an important possible impact, with potential benefits for human health and the environment.20
Cultivation
of biotech crops could lead to a reduction in the use of environmentally harmful chemicals to control
weeds and pests because certain pesticides are no longer used, the frequency of treatments is reduced, or
the area treated is reduced.
282. The scientific consensus appears to be that the use of transgenic insect-resistant Bt crops is
reducing the volume and frequency of insecticide use on maize, cotton and soybean. These results have
been especially significant for cotton in Australia, China, Mexico, South Africa and the United States.
283. The environmental benefits include less contamination of water supplies and less damage to non-
target insects. Reduced pesticide use suggests that Bt crops would be generally beneficial to in-crop
biodiversity in comparison with conventional crops that receive regular, broad-spectrum pesticide
applications.
Fertiliser use efficiency uncertain
284. The contribution of first-generation biotechnology crops to improvements in nitrogen-use
efficiency (NUE) is indirect via yield-improving traits (pest and/or herbicide resistance) (e.g. reduced
damage to the root system of biotechnology-corn resistant to corn rootworm can lead to greater N uptake).
In contrast, the adoption of herbicide-tolerant soybean crops increases the use of glyphosate, which is toxic
to the N-fixing symbiont Bradyrhizobium japonicum – important for supplying soybeans with N. Further,
concerns exist about the impacts of biotechnology crops on soil microbes and hence nutrient cycling, but
empirical evidence is lacking.
285. From the above, it is inconclusive that yield gains due to currently used biotechnology crops
directly result in NUE improvements. NUE improved crops are, however, being researched and could have
large productivity potential under climate change ((Rosegrant et al., 2014). Studies investigating the effects
of biotech crops consider biotechnology to be neutral in terms of fertiliser use (see, for example, Qaim and
Traxler, 2005).
Impacts on biodiversity are ambiguous and context-specific
286. The changes associated with biotech crop production practices can have positive or negative
effects on biodiversity, and the overall impact can vary according to the precise management practices,
environment and landscape context, and may only be noticeable after a number of years.
287. As is the case of conventional farming systems, the main impacts of current biotech crops on
biodiversity are mostly related to the changes in management practices involved, particularly changes in
herbicide or insecticide use, reduced till and zero-till practices, and altered crop-rotation practices. The
scale and direction of these impacts depends very much on how farmers manage biotech crops, the
regulatory restrictions imposed on biotech crop management, and on how the biotech crop system is
compared with conventional crop management practices.
288. Changes in insecticide use on biotech insect-resistant crops can be associated with benefits for
biodiversity if insecticide or fungicide use decreases in frequency and toxicity, particularly if biotech crops
are used with IPM. Changes in management of biotech herbicide-tolerant crops can influence biodiversity
through: i) the change in herbicide application and timing; ii) the change in the type(s) of herbicide
applied; and iii) associated changes in farming practices, including reduced or no-tillage and alterations in
crop rotations or monoculture.
COM/TAD/CA/ENV/EPOC(2015)5
67
289. Scientists acknowledge that there is insufficient evidence to predict what the long-term impacts
of transgenic herbicide-tolerant crops will be on weed populations and associated in-crop biodiversity.
Biotech herbicide-tolerant crops change the types of herbicides used (usually glyphosate combined with a
pre-emergence herbicide). The altered herbicide use associated with herbicide-resistant biotech crops may
reduce weed populations, resulting in reduced populations of weed-associated wildlife, such as seed-eating
birds. But changes in herbicide use could also be beneficial for biodiversity if the frequency and toxicity of
herbicide use are decreased and if weed populations continue to provide habitat and food resources for
wildlife.
290. Biotech herbicide-tolerant crops enable greater flexibility of herbicide use and this can be
implemented in a way that either increases in-field biodiversity or that significantly decreases it, depending
on the timing and frequency of herbicide applications. Evidence shows that biotech herbicide-resistant
crops in the United States have not decreased the quantity of herbicide used on crops, but have resulted in
a large-scale shift to herbicide use with a lower environmental toxicity rating than previously used
herbicide treatments, because glyphosate is a relatively quick-acting, readily degradable herbicide.21
There
is concern, however, that greater use of herbicides - even less toxic herbicides - will further erode habitats
for farmland birds and other species.
291. As mentioned earlier, biotech herbicide-tolerant crops facilitate the greater uptake of reduced
tillage or zero-till farming systems, which are beneficial to biodiversity. However, a lack of weed
resistance management could result in the proliferation of herbicide-tolerant weeds.22
292. Biotech herbicide-tolerant cropping systems have also facilitated a greater use of monoculture
cropping and reduced crop rotations, which could be expected to decrease overall farmland biodiversity.
This has given rise to concerns that the expansion of biotech herbicide-tolerant crops has contributed to a
reduction in biodiversity, particularly in Latin America. However, while the expansion of agriculture may
have reduced biodiversity, to link this expansion with biotechnology is questionable, as the agricultural
expansion may have happened with or without the technology and increased productivity through biotech
crops may have reduced the amount of land needed for the same amount of product. For instance, the
expansion of soybean production has largely been driven by the increase in demand for protein feeds
(Backus et al., 2009). Soybean traders, together with other stakeholders, have organised a Soybean
Moratorium, which has been in place since 2006, under which is undertaken not to “purchase soy from
lands that have been deforested in the Amazon biome from this date.” (Cargill, 2014).
Additional potential beneficial environmental implications, but limited scientific evidence
293. Biotechnology can support green growth by improving the environmental efficiency of primary
production and industrial processing and by helping repair degraded soil and water. Examples include (i)
the use of bioremediation – using micro-organisms to reduce, eliminate, contain or transform into benign
products the contaminants present in soil, sediments, water or air (ii) improved crop varieties that require
less tillage (reducing soil erosion and compaction) or fewer pesticides and fertilisers (reducing water
pollution); (iii) and industrial biotechnology applications to reduce greenhouse gas emissions from
chemical production (e.g. biotechnological processes to produce chemicals and plastics ) (OECD, 2009).
294. The scientific evidence concerning the other environmental impacts of biotech crops is still
emerging. There may also be other types of beneficial environmental impacts associated with biotech
crops. Biotech crops change farming practices and contribute to savings in energy and air emissions or
reductions in soil erosion, due to less frequent operations in the field. Herbicide-resistant crops may lead to
environmental benefits by letting farmers use herbicides that do need not to be incorporated with the soil,
thereby encouraging a shift to no-till and conservation tillage practices, and reducing associated GHG
emissions.23
COM/TAD/CA/ENV/EPOC(2015)5
68
295. In contrast to crops requiring conventional chemical applications, herbicide-resistant crops may
reduce wind and water sediment damages by allowing for reductions in ploughing. These techniques also
facilitate the use of winter cover crops, thereby limiting nutrient leaching (e.g. nitrates). Herbicide use is
changing as a result of the rapid adoption of herbicide-tolerant crops, and there has been a marked shift
away from the more toxic herbicides towards less toxic forms, but, overall, total herbicide use has
increased (Traxler, 2004). Certain biotech crops in the pipeline could also increase removal of toxic heavy
metals from the soil, either by incorporating them in the cells or transforming them into less toxic
substances.
Environmental and other economic concerns impede adoption
296. Despite the rapid adoption of biotech crops by farmers in many countries, controversies about
this technology continue. Uncertainty about biotech crop impacts is one reason for widespread public
suspicion. The way contracts for the use of biotech crops were drafted – with concerns of having contracts
too binding for farmers – also raised big controversy. Environmental safety issues focus on the effects –
direct or indirect – of biotech crops on non-target organisms and on the transfer of biotechnology traits to
populations of wild plants (FAO, 2003a). The potential transfer of herbicide-resistant and insect-resistant
traits to weedy species and the persistence of feral crop plants carrying these traits raise issues about their
impacts on the environment. Moreover, the development of resistance to pests and viruses is equally
possible, as in the case of conventional crops showing similar resistance (especially in the case of
monogenic resistance) and thus the benefits of biotech can be temporary.
297. There are also issues associated with the potential impacts of biotech crops on organic
agriculture due to the inadvertent presence of transgenic crops or material in organic land. The possibility
that biotech farms could contaminate non-GM farms via unintentional, inadvertent gene flow constitutes a
challenge for the coexistence of biotech farming and non-GM agriculture, including in particular organic
certified agricultural systems.
298. Organic farmers are not allowed to use seed or plants with any transgenic content. For example,
the EU Regulation for organic farming (EC No. 2092/91) forbids the use of living modified organisms
(LMOs). In July 2003, the European Commission published guidelines for the development of strategies
and best practices to ensure the co-existence of LMO crops with conventional and organic farming, with
the intention of helping EU member states to develop workable measures for co-existence in conformity
with EU legislation. The guidelines set out the general principles and the technical and procedural aspects
to be taken into account: approaches to co-existence should be developed in a transparent way, based on
scientific evidence and in co-operation with all concerned; and measures should be specific to different
types of crop and regional and local aspects should be fully taken into account.
Public R&D investment an important factor in enhancing availability and accessibility of new
biotechnologies
299. If modern agricultural biotechnology is to be perceived and used as one of the solutions for
fostering green growth in agriculture, policy will have to play a significant role, in investing in research,
establishing the regulatory frameworks necessary to ensure that biotech applications meet acceptable bio-
safety and environmental standards and in increasing public awareness of the potential benefits (as well as
risks) (OECD, 2009).
300. Despite growing awareness of the importance of innovation for increasing agricultural
productivity sustainably, and even though government funding for R&D is permitted under international
trade agreements, public spending on agricultural R&D accounts for only a small share of total support to
agriculture – around 2% in the OECD area.
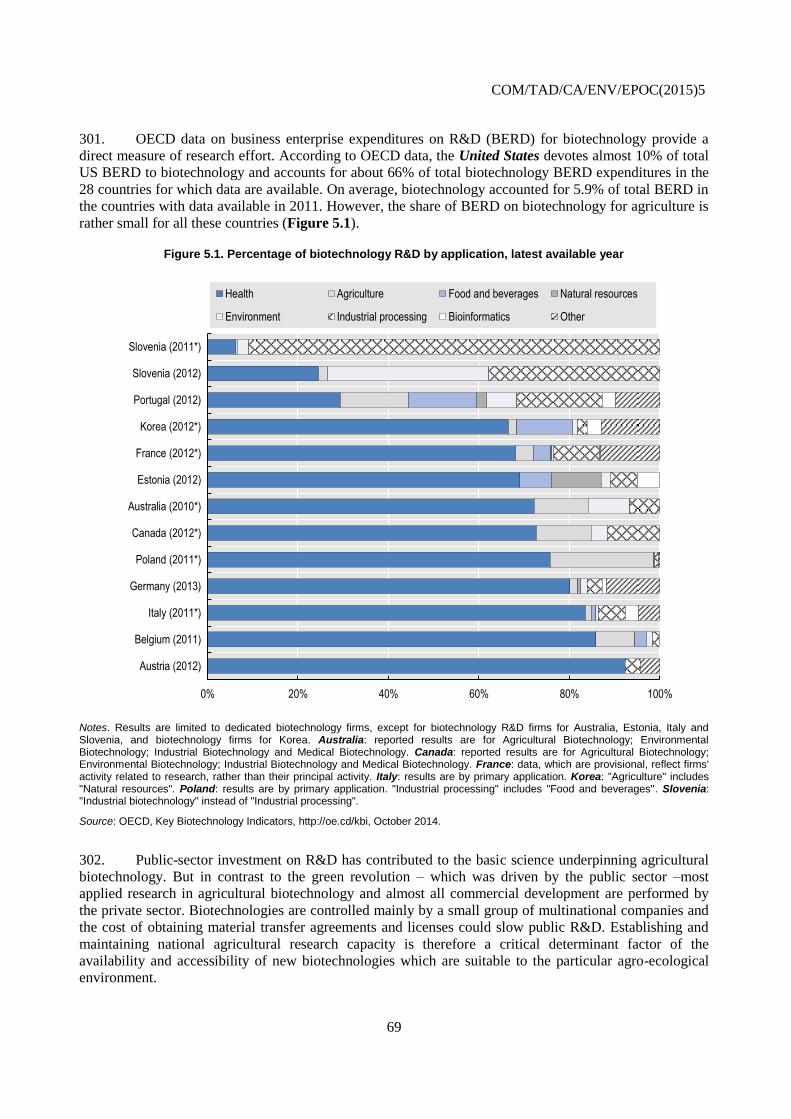
COM/TAD/CA/ENV/EPOC(2015)5
69
301. OECD data on business enterprise expenditures on R&D (BERD) for biotechnology provide a
direct measure of research effort. According to OECD data, the United States devotes almost 10% of total
US BERD to biotechnology and accounts for about 66% of total biotechnology BERD expenditures in the
28 countries for which data are available. On average, biotechnology accounted for 5.9% of total BERD in
the countries with data available in 2011. However, the share of BERD on biotechnology for agriculture is
rather small for all these countries (Figure 5.1).
Figure 5.1. Percentage of biotechnology R&D by application, latest available year
Notes. Results are limited to dedicated biotechnology firms, except for biotechnology R&D firms for Australia, Estonia, Italy and Slovenia, and biotechnology firms for Korea. Australia: reported results are for Agricultural Biotechnology; Environmental Biotechnology; Industrial Biotechnology and Medical Biotechnology. Canada: reported results are for Agricultural Biotechnology; Environmental Biotechnology; Industrial Biotechnology and Medical Biotechnology. France: data, which are provisional, reflect firms' activity related to research, rather than their principal activity. Italy: results are by primary application. Korea: "Agriculture" includes "Natural resources". Poland: results are by primary application. "Industrial processing" includes "Food and beverages". Slovenia: "Industrial biotechnology" instead of "Industrial processing".
Source: OECD, Key Biotechnology Indicators, http://oe.cd/kbi, October 2014.
302. Public-sector investment on R&D has contributed to the basic science underpinning agricultural
biotechnology. But in contrast to the green revolution – which was driven by the public sector –most
applied research in agricultural biotechnology and almost all commercial development are performed by
the private sector. Biotechnologies are controlled mainly by a small group of multinational companies and
the cost of obtaining material transfer agreements and licenses could slow public R&D. Establishing and
maintaining national agricultural research capacity is therefore a critical determinant factor of the
availability and accessibility of new biotechnologies which are suitable to the particular agro-ecological
environment.
0% 20% 40% 60% 80% 100%
Austria (2012)
Belgium (2011)
Italy (2011*)
Germany (2013)
Poland (2011*)
Canada (2012*)
Australia (2010*)
Estonia (2012)
France (2012*)
Korea (2012*)
Portugal (2012)
Slovenia (2012)
Slovenia (2011*)
Health Agriculture Food and beverages Natural resources
Environment Industrial processing Bioinformatics Other
COM/TAD/CA/ENV/EPOC(2015)5
70
303. Modern agricultural biotechnology is cross-sectoral and interdisciplinary. Genetic engineering in
crops, for example, cannot proceed without knowledge derived from genomics and is of little practical use
in the absence of an effective plant-breeding programme. Agricultural biotechnology should therefore be
part of a wider agricultural knowledge and innovation strategy that brings about interactions between
multiple stakeholders.
Assuring safety at reasonable cost indispensable for the development of modern agricultural
biotechnology over time
304. All OECD member countries, as well as many non-members, have a system for performing
environmental assessments of genetically engineered plants used in the production of foods and feeds. In
the majority of countries, these systems have been in place for a number of years. National approaches to
biosafety have been enhanced by successful multilateral activities aimed at developing a common approach
to both the principles and practice of risk/safety assessment. Much of this common understanding was
developed through work at the OECD, where biosafety projects, addressing, inter alia, transgenic crops,
have been in place since approximately.
305. The main objectives of the OECD work on biosafety, which dates back to 1986, are to: promote
harmonisation in the sharing of information and risk assessment practices; assist countries in ensuring a
high standard of safety; aid in the mutual understanding of the regulatory systems among countries; and
avoid non-tariff barriers to trade. There are two aspects to the OECD’s work on biosafety. First, the
OECD’s Working Group on the Harmonisation of Regulatory Oversight in Biotechnology primarily
addresses the environmental risk/safety assessment of transgenic organisms. Second, the Task Force for the
Safety of Novel Foods and Feeds specialises mainly in the safety assessment of foods and feed derived
from transgenic organisms.
306. The main outputs related to environmental risk/safety assessment include the series of ‘biosafety
consensus documents’ which compile information regarded as relevant by countries to risk and safety
assessment (e.g. the use of the crop or trait in agricultural practice; its taxonomy; characteristics of its
reproductive system; knowledge of its wild relatives including those with which it can hybridise; its centre
of origin and diversity; and its weediness).
307. A separate but complementary series of documents has also been published, which address the
safety assessment of novel foods and feeds, especially those derived from transgenic varieties. Once again,
they are intended for use in regulatory safety assessment.
308. It is important to note another significant multilateral effort, the Cartagena Protocol on Biosafety,
which is a key international instrument dealing with “living modified organisms” (LMOs) in transboundary
movements. The objective of this Protocol is to contribute to ensuring an adequate level of protection in
the field of the safe transfer, handling and use of LMOs resulting from modern biotechnology that may
have adverse effects on the conservation and sustainable use of biological diversity. The Protocol has
established an advance informed agreement (AIA) procedure to ensure that countries are provided with the
information necessary to make informed decisions before agreeing to the import of such organisms into
their territory. The Protocol has also established a Biosafety Clearing-House (BCH) to facilitate the
exchange of information on, inter alia, LMOs used for Foods Feeds or Processing. The BCH also assists
countries in the implementation of the Protocol.
COM/TAD/CA/ENV/EPOC(2015)5
71
Box 5.6. The Gene Technology Act in Australia
The development and use of GMOs in Australia is regulated through an integrated legislative framework which includes the Gene Technology Regulator and a number of other regulatory authorities, with complementary responsibilities and expertise. This arrangement both enhances co-ordinated decision-making and avoids duplication.
The Gene Technology Act 2000 and the Gene Technology Regulator 2001, which administers the Act, in conjunction with corresponding State and Territory legislation, underpin the framework. Implementation of the framework is overseen by the Gene Technology Ministerial Council, which comprises representation from all Australian jurisdictions. Its object is to protect human health and safety, and to protect the environment, by identifying risks posed by, or resulting from, gene technology, and by managing those risks.
Transparency is built into the regulatory system through requirements in the gene technology legislation for the Regulator to: maintain a publicly accessible record of GMO and GM product dealings; provide quarterly and annual reports to the Australian parliament; and conduct extensive consultation with the public and a wide range of experts, agencies and authorities on applications for dealings involving the intentional release of GMOs into the environment.
The inter-governmental Gene Technology Agreement 2001 (GTA) sets out the understanding between Commonwealth, State and Territory Governments regarding the establishment of a nationally consistent regulatory system for gene technology. The GTA requires an independent review of the Act every five years. The first review was completed in 2006. The 2006 review found that the Act and the national regulatory scheme had worked well over the previous five years (2000-05), and that no major changes were required. The review panel recommended a number of changes intended to improve the operation of the Act. In particular, the 2006 review recommended that the Act be reviewed in five years (2011) to ensure that it continues to accommodate emerging trends. The 2011 review was limited to issues within the scope of the object of the Act (i.e. health and safety of people and the environment). The review also considered the findings from the 2006 review.
Source. Office of the Gene Technology Regulator, http://www.ogtr.gov.au/internet/ogtr/publishing.nsf/Content/home-1 ; Australian Government, Department of Health, http://www.health.gov.au/internet/main/publishing.nsf/Content/gene-techact-review
Attaining the greatest benefits to the society will require governments to specifically take into
consideration public perceptions and risk communication
309. Confidence in the decisions that governments make on behalf of the public is a precondition for
public acceptance and adoption of agricultural biotechnology products. A well-defined biosafety regulatory
system is a prerequisite for realising the benefits that modern agricultural biotechnology can provide to
foster green growth, as weak regulatory systems could fuel public distrust and trigger opposition to modern
agricultural biotechnology.
310. Public perception of risks is as important as assessments based on scientific evidence in ensuring
acceptance. There are distinct national and regional differences to acceptability of modern agricultural
biotechnology. Continuing concerns about possible food safety and environmental risks have slowed or
even stalled commercialisation in many countries. Public attitudes to biotechnology will play an important
role in determining how widely genetic engineering techniques will be adopted in food and agriculture.
311. As noted earlier, genetically engineered technologies have been mainly applied to four crops:
soybean, cotton, maize and oilseed rape. Genetically engineered sugar beet and potato are additional crops
gaining in importance. Innovations are also expected for wheat, barley, rice and many other species (Stein
and Rodriguez-Cerezo, 2009). The main application of biotechnology for crops has been for animal feed
crops and for crops used in food processing; neither of which produce agricultural products for direct
human consumption.
312. One of the stumbling blocks to the commercialisation of biotech crops has been the reluctance of
the downstream sector such as millers, brewers, soft drink companies, and fast food chains to use GMOs
COM/TAD/CA/ENV/EPOC(2015)5
72
(Gruère and Sengupta, 2009; Venus et al., 2012). This has recently changed in the United States and
Canada for potato (e.g. Johnson, 2014), sugar beet (Dillen et al., 2012), and wheat (e.g. Arnason, 2013).
Overall, this adoption difficulty can be traced back to consumer concern about food products derived from
biotech crops.
313. Overall, products based on biotech crops have been successful in those parts of the world where
the technology is accepted. Restrictive regulatory systems have arisen as a result of negative public
perceptions that have little to do with scientific evidence and objective risk assessments (Miller, 2006).
Greater consumer acceptance of this technology is a necessary precursor to regulatory reform.
314. Consumer acceptance of foods with biotech ingredients varies with product characteristics,
geography, and the information that the public is exposed to. Most studies in OECD countries find that
consumers are willing to pay a premium for foods that do not contain biotech ingredients: willingness-to-
pay for non-biotech foods is highest in the EU, where some retailers have policies limiting the use of
biotech ingredients. Non-biotech foods are available in the United States, but there is evidence that such
foods represent a small share of retail food markets.
315. Social factors become important within the debate of biotech crops. Some farmers may reject
biotech crops for ethical, cultural and other reasons (although available empirical studies about adoption or
rejection do not indicate that ethical reasons are an important factor among farmers). One important factor
that has been identified for the EU is the view of neighbours, friends, and local communities. Some
farmers who were considering cultivating biotech crops observed their families being threatened (Venus et
al., 2012), while others reported social pressure from organic farmers (Binimelis, 2008).
COM/TAD/CA/ENV/EPOC(2015)5
73
Chapter 6. Precision agriculture – a new revolution is emerging?
Main messages
Data on farmers’ use of precision-agriculture technology are sparse as countries do not regularly
collect such data.
Adoption of precision-agriculture technologies is so far limited to only a few countries and
sectors (mainly arable crops).
The most widely adopted precision farming technologies are GPS guidance.
Significant efficiency and resource productivity gains can be achieved on arable crops,
particularly where intra-field variability in yield is high.
Knowledge and technical gaps, high start-up costs with, in some cases, a risk of insufficient
return on investment, and structural and institutional constraints are key obstacles to the adoption
of precision agriculture by farmers.
Precision agriculture has a substantial role to play in fostering green growth in agriculture in
OECD countries, but the prevalence of small size of farms in several countries makes widespread
adoption problematic.
Applying the right treatment in the right place at the right time ...
316. Precision farming is a relatively new management practice which has been made possible by the
development of information technology and remote sensing. Precision agriculture entails the application of
technologies and agronomic principles to manage the spatial and temporal variability associated with all
aspects of agricultural production – both crops and livestock (Box 6.1).
317. In particular, precision farming, defined as a systems approach to optimise crop yields through
systematic gathering and handling of information about the crop and the field, has the potential to
contribute to nutrient management by tailoring input use and application more closely to ideal plant growth
and management needs.
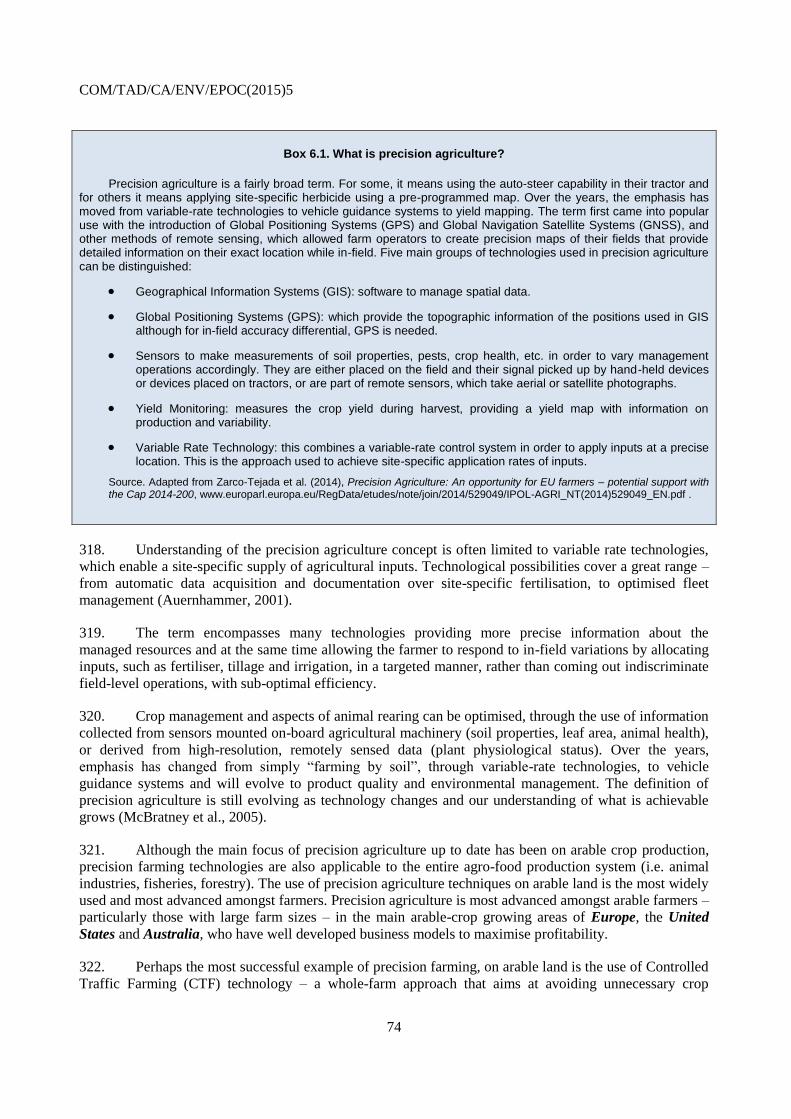
COM/TAD/CA/ENV/EPOC(2015)5
74
Box 6.1. What is precision agriculture?
Precision agriculture is a fairly broad term. For some, it means using the auto-steer capability in their tractor and for others it means applying site-specific herbicide using a pre-programmed map. Over the years, the emphasis has moved from variable-rate technologies to vehicle guidance systems to yield mapping. The term first came into popular use with the introduction of Global Positioning Systems (GPS) and Global Navigation Satellite Systems (GNSS), and other methods of remote sensing, which allowed farm operators to create precision maps of their fields that provide detailed information on their exact location while in-field. Five main groups of technologies used in precision agriculture can be distinguished:
Geographical Information Systems (GIS): software to manage spatial data.
Global Positioning Systems (GPS): which provide the topographic information of the positions used in GIS although for in-field accuracy differential, GPS is needed.
Sensors to make measurements of soil properties, pests, crop health, etc. in order to vary management operations accordingly. They are either placed on the field and their signal picked up by hand-held devices or devices placed on tractors, or are part of remote sensors, which take aerial or satellite photographs.
Yield Monitoring: measures the crop yield during harvest, providing a yield map with information on production and variability.
Variable Rate Technology: this combines a variable-rate control system in order to apply inputs at a precise location. This is the approach used to achieve site-specific application rates of inputs.
Source. Adapted from Zarco-Tejada et al. (2014), Precision Agriculture: An opportunity for EU farmers – potential support with the Cap 2014-200, www.europarl.europa.eu/RegData/etudes/note/join/2014/529049/IPOL-AGRI_NT(2014)529049_EN.pdf .
318. Understanding of the precision agriculture concept is often limited to variable rate technologies,
which enable a site-specific supply of agricultural inputs. Technological possibilities cover a great range –
from automatic data acquisition and documentation over site-specific fertilisation, to optimised fleet
management (Auernhammer, 2001).
319. The term encompasses many technologies providing more precise information about the
managed resources and at the same time allowing the farmer to respond to in-field variations by allocating
inputs, such as fertiliser, tillage and irrigation, in a targeted manner, rather than coming out indiscriminate
field-level operations, with sub-optimal efficiency.
320. Crop management and aspects of animal rearing can be optimised, through the use of information
collected from sensors mounted on-board agricultural machinery (soil properties, leaf area, animal health),
or derived from high-resolution, remotely sensed data (plant physiological status). Over the years,
emphasis has changed from simply “farming by soil”, through variable-rate technologies, to vehicle
guidance systems and will evolve to product quality and environmental management. The definition of
precision agriculture is still evolving as technology changes and our understanding of what is achievable
grows (McBratney et al., 2005).
321. Although the main focus of precision agriculture up to date has been on arable crop production,
precision farming technologies are also applicable to the entire agro-food production system (i.e. animal
industries, fisheries, forestry). The use of precision agriculture techniques on arable land is the most widely
used and most advanced amongst farmers. Precision agriculture is most advanced amongst arable farmers –
particularly those with large farm sizes – in the main arable-crop growing areas of Europe, the United
States and Australia, who have well developed business models to maximise profitability.
322. Perhaps the most successful example of precision farming, on arable land is the use of Controlled
Traffic Farming (CTF) technology – a whole-farm approach that aims at avoiding unnecessary crop
COM/TAD/CA/ENV/EPOC(2015)5
75
damage and soil compaction by heavy machinery caused by standard methods, thereby reducing costs.24
In
particular, farmers in Australia and the United Kingdom have been able to reduce machinery and input
costs up to 75% in some cases, while at the same time increasing crop yields (Tulberg et al., 2007;
Bowman, 2008).
323. Precision-agriculture technologies are applied to a wide range of field and horticultural crops,
such as: maize, soybean, potato, wheat, sugar beet, sugarcane, barley, sorghum, cotton, oat, rice, wine
grape, citrus, bananas, tea, date palm, tobacco, olive, tomato and kiwifruit (Bramley, 2009). The
development and adoption of precision-agriculture technologies and methodologies in viticulture are more
recent than has been the case for arable land. Precision-livestock farming focuses on: the automatic
monitoring of individual animal, milk and egg production; the early detection of diseases; and monitors
animal behaviour, productivity and the physical environment (such as the thermal micro-environment and
emissions of gaseous pollutants).
324. The precision agriculture management approach currently relies almost entirely on the private
sector, which offers services, devices and products to the farmers. Public-sector involvement is generally
very limited, notwithstanding the growing policy interest in the role of innovations for increasing
productivity sustainability. An example of a recent public initiative aimed at the “mainstreaming of
precision farming” is the creation of a focus group in the EU under the European Innovation Partnership
on Agricultural Productivity and Sustainability. The initial priorities of the group are to look at data
capture and processing, but it is envisaged that the process will be expanded to encompass evidence-based
benchmarking of precision-agriculture performance and impact evaluation.
… but adoption by farmers is low
325. Available data on adoption rates are fragmented and often dated because countries do not
regularly collect data on the use of precision agriculture, while manufacturers and precision agriculture
dealers rarely revealing their sales data. Evidence on the use of precision agriculture relies mainly on
information from sporadic and geographically dispersed surveys: thus, an accurate measurement of the rate
of adoption and the various technological practices is problematic.
326. In summary, the results of analysed adoption studies show similar tendencies for selected OECD
member countries:
Adoption rates of precision agriculture technologies have not been as rapid as was previously
envisaged;
Adoption rates of auto guidance systems are higher, compared with variable rate technologies
The percentage of farmers who have adopted data collection (diagnostic) techniques is higher
than the percentage of farmers who are actually using this information for site-specific
management.
327. The overall conclusion of the available studies is that farm-level adoption of precision
agricultural technologies has been low, uneven – both geographically and temporally – and often lags
behind the initial expectation (e.g. Bramley, 2009; Evans et al., 2013; Lamb et al., 2008; Reichardt and
Jürgens, 2009; Griffin et al., 2010; Mandel et al., 2011).
328. Notwithstanding the low adoption rate, the number of farmers using precision agriculture
technologies has been growing steadily over the last decade: in Germany, from 2001 to 2006 the
proportion of farmers using precision agriculture grew from 7% to 11%, while the rate of un-informed
COM/TAD/CA/ENV/EPOC(2015)5
76
farmers dropped from 46% to 28% (Reichardt et al., 2009); among the grain growers of Australia, it
increased from 5% in 2006 to 20% in 2012 (Robertson et al., 2012), and a survey in Ohio (United States)
showed that by 2010 39% of all farms and 48% of farmers with gross sales over USD 100 000 had already
adopted precision agriculture (Diekmann and Batte, 2010).
329. In the EU, uptake remains modest, and is mostly concentrated on the large and more business-
oriented farms in the main grain growing areas of the EU (Zarco-Tejada et al., 2014). Use of nitrogen
sensors for fertiliser application is very high, probably because it helps farmers to comply with the EU
nitrate regulation and also because it receives government support. There is growing interest in GPS
guidance, especially in areas with relatively large farms, such as eastern Germany and farmers are also
becoming aware of the possibilities of CTF technology on arable land.25
Adoption of precision agriculture
for fruits and vegetables and viticulture is more recent than for arable farming, with a rapid increase in the
adoption of machine vision methods.26
In high-value fruit and vegetable crops, precision irrigation
methods are being developed in order to save water, increase yields and improve quality, while automatic
monitoring of individual animals is used for animal growth, milk and egg production and the detection of
diseases, as well as for monitoring animal’s behaviour and physical environment.
330. The basic patterns observed so far in the adoption of precision agriculture technologies are likely
to continue into the foreseeable future: adoption is likely to expand faster in those places where input use
in agriculture is already relatively efficient and in labour-scarce, land-abundant countries (e.g. Australia,
the United States, Canada), with rates of adoption accelerating when commodity prices are high and
interest rates low: adoption is likely to expand more slowly in land-scarce, but labour- and capital-
abundant countries (e.g. Europe) (Swinton and Lowenberg-DeBoer, 2001).
331. The following paragraphs present examples of the rates of adoption for selected OECD countries
(Australia, the United States, United Kingdom and Germany) and an attempt will be made to identify
country specific trends in terms of adopted technologies and crops, respectively.
Australia – a leader of GPS guidance technology
332. A survey by Robertson et al. (2012) finds that 20% of Australian grain growers have
implemented precision agriculture technologies to manage variable inputs. Jochinke et al. (2007) surveyed
farmers from the Wimmera Conservation Farming Association in 2006 and found that 42% of members
had adopted precision agriculture technologies. Detailed results of the survey are listed in Table 6.1. As
shown in this table, steering and auto-guidance systems belong to the most important implemented
precision agriculture technologies. Jochinke et al. (2007) mention that their results are comparable to the
situation in other regions in Australia.
333. As noted earlier, Australia has led the way in use of GPS guidance (the CTF approach). The use
of the Control Traffic Farming (CTF) has been reported to reduce fuel consumption by a further 50% from
Zero-Till systems (Tullberg, 2009). Yet, data available from an Australian Bureau of Statistics survey
indicates that CTF is now being implemented by only about 25% of farms.27
334. There is public sector research in precision agriculture for viticulture, as well as an interest in
precision agriculture for sugar, which is being driven by economic and environmental concerns. Tullberg
et al. (2007) have described the high adoption rates of this technology in Australian cropping systems.

COM/TAD/CA/ENV/EPOC(2015)5
77
Table 6.1. Precision agriculture tools used by Wimmera Conservation Farming Association members in 2006
Precision agriculture tool All respondents (%)
(N=146)
Steering/guidance
Auto-steer 2 cm 16
Auto-steer 10 cm 13
Auto-steer < 100 cm 2
Visual guidance-sub 1 m, including light bars
27
Marker arms
1
Other
Yield maps
14
Aerial photos
3
Electromagnetic 38 or Gamma radiometric soil surveys
3
Sowing equipment with variable rate technology
2
Auto depth on sowing equipment <1 Source: Jochinke et al. (2007, p. 70), adapted.
United States –increasing adoption of yield monitoring technology
335. Using Agricultural Resource Management Survey (ARMS) data collected over the past 10 years,
an USDA/ERS report found that adoption by farmers of the main precision information technologies –
yield monitors, variable-rate applicators and GPS maps – has been mixed (Schimmelpfenning and
Ebel, 2011). While yield monitoring – often a first step in the utilisation of precision technology for grain
crop producers – has grown most rapidly (being used on over 40% of grain crop area), farmers have mostly
chosen not to complement this yield information with the use of detailed GPS maps or variable-rate input
applicators that capitalise on the detailed yield information. Farm operator education, technical
sophistication and farm management acumen are among the factors cited in the report that could be
contributing factor in this adoption lag.
336. The study reports that yield monitors are being adopted more quickly by farmers who practice
conservation tillage. Adoption of guidance systems, which notify farm equipment operators as to their
exact field position, is showing a strong upward trend, with 35% of wheat producers using it by 2009.
Farmers who adopted of yield monitors achieved higher maize and soybean yields than non-adopters. Even
though the adoption of GPS mapping is less prevalent than yield monitors, both maize and soybean farmers
achieved higher yields nationwide when GPS was used. Likewise, when variable-rate technology was used
to apply fertiliser, higher yields were obtained for both crops. Average fuel expenses, per area planted, for
both maize and soybean are lower for farmers who use yield monitors. Variable-rate technology for
fertiliser application is associated with lower fuel expenses for both maize and soybeans.
337. The precision agriculture services dealership survey, conducted biennially, provides an extensive
data source on the use of precision agriculture technologies and offers of related services by US
dealerships (Holland et al., 2013). Figure 5.1 illustrates that in 2013 more than 50% of surveyed crop input
dealers in the US offered variable rate application services for single nutrients. For multi-nutrient
applications, dealerships reported slightly lower adoption rates. The projections for 2016, made by survey
participants, show expectations of increased demand in areas of variable rate seeding and variable rate
pesticide use.
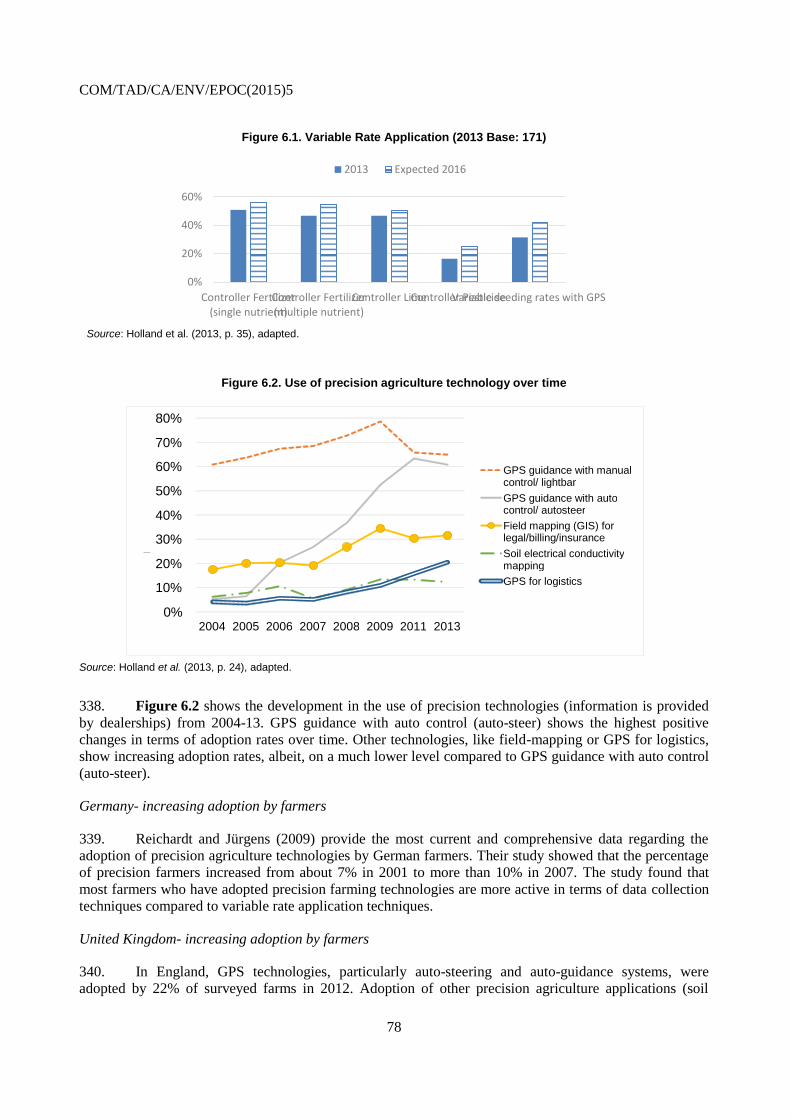
COM/TAD/CA/ENV/EPOC(2015)5
78
Figure 6.1. Variable Rate Application (2013 Base: 171)
Source: Holland et al. (2013, p. 35), adapted.
Figure 6.2. Use of precision agriculture technology over time
Source: Holland et al. (2013, p. 24), adapted.
338. Figure 6.2 shows the development in the use of precision technologies (information is provided
by dealerships) from 2004-13. GPS guidance with auto control (auto-steer) shows the highest positive
changes in terms of adoption rates over time. Other technologies, like field-mapping or GPS for logistics,
show increasing adoption rates, albeit, on a much lower level compared to GPS guidance with auto control
(auto-steer).
Germany- increasing adoption by farmers
339. Reichardt and Jürgens (2009) provide the most current and comprehensive data regarding the
adoption of precision agriculture technologies by German farmers. Their study showed that the percentage
of precision farmers increased from about 7% in 2001 to more than 10% in 2007. The study found that
most farmers who have adopted precision farming technologies are more active in terms of data collection
techniques compared to variable rate application techniques.
United Kingdom- increasing adoption by farmers
340. In England, GPS technologies, particularly auto-steering and auto-guidance systems, were
adopted by 22% of surveyed farms in 2012. Adoption of other precision agriculture applications (soil
0%
20%
40%
60%
Controller Fertilizer(single nutrient)
Controller Fertilizer(multiple nutrient)
Controller LimeController PesticideVariable seeding rates with GPS
2013 Expected 2016
0%
10%
20%
30%
40%
50%
60%
70%
80%
2004 2005 2006 2007 2008 2009 2011 2013
respondents
GPS guidance with manual control/ lightbar GPS guidance with auto control/ autosteer Field mapping (GIS) for legal/billing/insurance Soil electrical conductivity mapping GPS for logistics
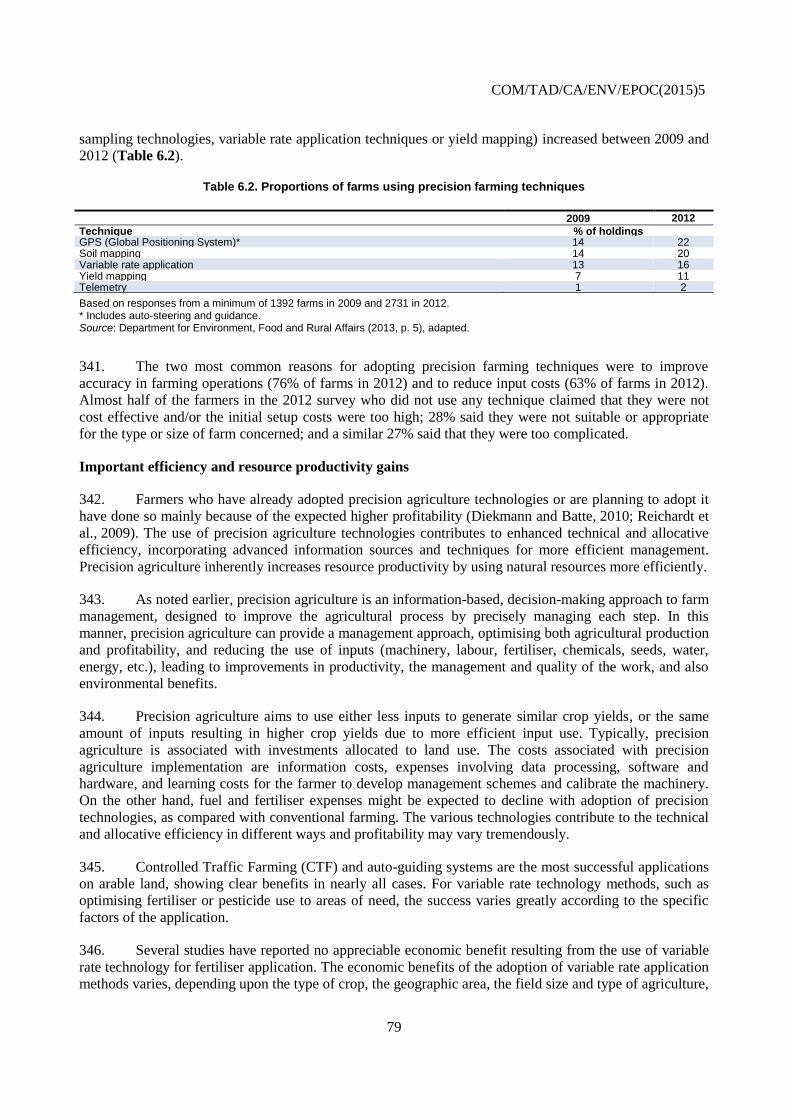
COM/TAD/CA/ENV/EPOC(2015)5
79
sampling technologies, variable rate application techniques or yield mapping) increased between 2009 and
2012 (Table 6.2).
Table 6.2. Proportions of farms using precision farming techniques
2009 2012
Technique % of holdings GPS (Global Positioning System)* 14 22 Soil mapping 14 20 Variable rate application 13 16 Yield mapping 7 11 Telemetry 1 2
Based on responses from a minimum of 1392 farms in 2009 and 2731 in 2012. * Includes auto-steering and guidance. Source: Department for Environment, Food and Rural Affairs (2013, p. 5), adapted.
341. The two most common reasons for adopting precision farming techniques were to improve
accuracy in farming operations (76% of farms in 2012) and to reduce input costs (63% of farms in 2012).
Almost half of the farmers in the 2012 survey who did not use any technique claimed that they were not
cost effective and/or the initial setup costs were too high; 28% said they were not suitable or appropriate
for the type or size of farm concerned; and a similar 27% said that they were too complicated.
Important efficiency and resource productivity gains
342. Farmers who have already adopted precision agriculture technologies or are planning to adopt it
have done so mainly because of the expected higher profitability (Diekmann and Batte, 2010; Reichardt et
al., 2009). The use of precision agriculture technologies contributes to enhanced technical and allocative
efficiency, incorporating advanced information sources and techniques for more efficient management.
Precision agriculture inherently increases resource productivity by using natural resources more efficiently.
343. As noted earlier, precision agriculture is an information-based, decision-making approach to farm
management, designed to improve the agricultural process by precisely managing each step. In this
manner, precision agriculture can provide a management approach, optimising both agricultural production
and profitability, and reducing the use of inputs (machinery, labour, fertiliser, chemicals, seeds, water,
energy, etc.), leading to improvements in productivity, the management and quality of the work, and also
environmental benefits.
344. Precision agriculture aims to use either less inputs to generate similar crop yields, or the same
amount of inputs resulting in higher crop yields due to more efficient input use. Typically, precision
agriculture is associated with investments allocated to land use. The costs associated with precision
agriculture implementation are information costs, expenses involving data processing, software and
hardware, and learning costs for the farmer to develop management schemes and calibrate the machinery.
On the other hand, fuel and fertiliser expenses might be expected to decline with adoption of precision
technologies, as compared with conventional farming. The various technologies contribute to the technical
and allocative efficiency in different ways and profitability may vary tremendously.
345. Controlled Traffic Farming (CTF) and auto-guiding systems are the most successful applications
on arable land, showing clear benefits in nearly all cases. For variable rate technology methods, such as
optimising fertiliser or pesticide use to areas of need, the success varies greatly according to the specific
factors of the application.
346. Several studies have reported no appreciable economic benefit resulting from the use of variable
rate technology for fertiliser application. The economic benefits of the adoption of variable rate application
methods varies, depending upon the type of crop, the geographic area, the field size and type of agriculture,
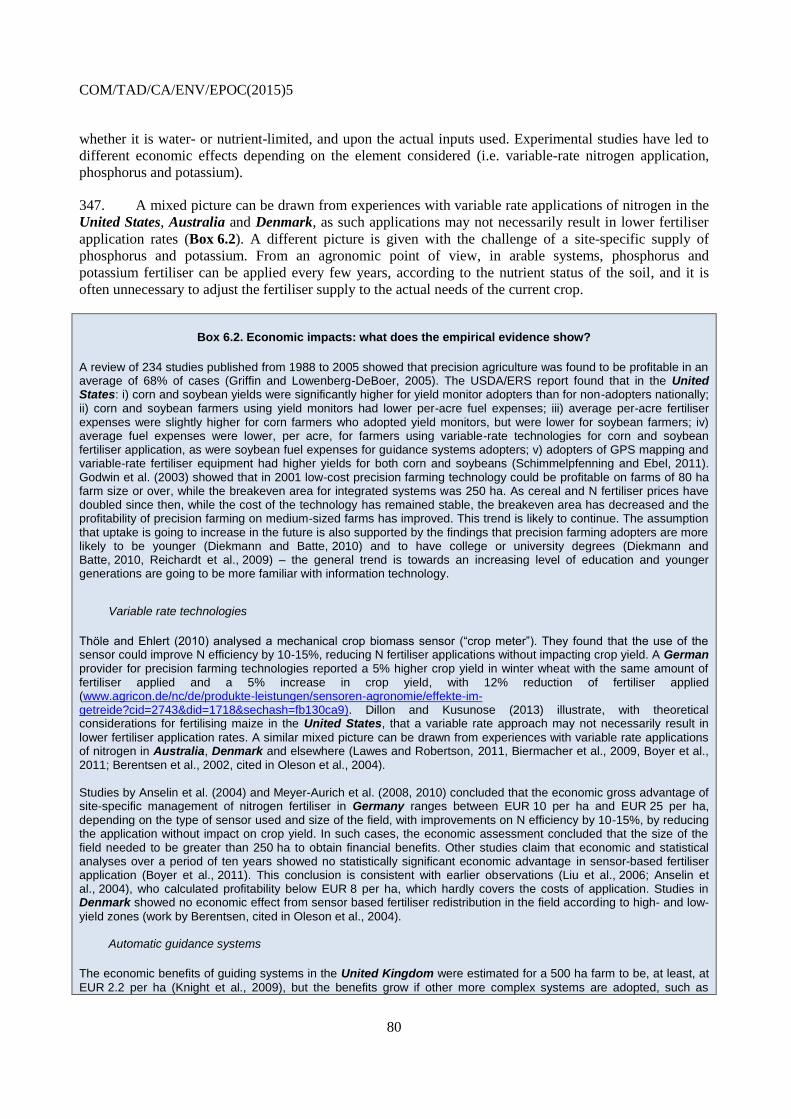
COM/TAD/CA/ENV/EPOC(2015)5
80
whether it is water- or nutrient-limited, and upon the actual inputs used. Experimental studies have led to
different economic effects depending on the element considered (i.e. variable-rate nitrogen application,
phosphorus and potassium).
347. A mixed picture can be drawn from experiences with variable rate applications of nitrogen in the
United States, Australia and Denmark, as such applications may not necessarily result in lower fertiliser
application rates (Box 6.2). A different picture is given with the challenge of a site-specific supply of
phosphorus and potassium. From an agronomic point of view, in arable systems, phosphorus and
potassium fertiliser can be applied every few years, according to the nutrient status of the soil, and it is
often unnecessary to adjust the fertiliser supply to the actual needs of the current crop.
Box 6.2. Economic impacts: what does the empirical evidence show?
A review of 234 studies published from 1988 to 2005 showed that precision agriculture was found to be profitable in an average of 68% of cases (Griffin and Lowenberg-DeBoer, 2005). The USDA/ERS report found that in the United States: i) corn and soybean yields were significantly higher for yield monitor adopters than for non-adopters nationally; ii) corn and soybean farmers using yield monitors had lower per-acre fuel expenses; iii) average per-acre fertiliser expenses were slightly higher for corn farmers who adopted yield monitors, but were lower for soybean farmers; iv) average fuel expenses were lower, per acre, for farmers using variable-rate technologies for corn and soybean fertiliser application, as were soybean fuel expenses for guidance systems adopters; v) adopters of GPS mapping and variable-rate fertiliser equipment had higher yields for both corn and soybeans (Schimmelpfenning and Ebel, 2011). Godwin et al. (2003) showed that in 2001 low-cost precision farming technology could be profitable on farms of 80 ha farm size or over, while the breakeven area for integrated systems was 250 ha. As cereal and N fertiliser prices have doubled since then, while the cost of the technology has remained stable, the breakeven area has decreased and the profitability of precision farming on medium-sized farms has improved. This trend is likely to continue. The assumption that uptake is going to increase in the future is also supported by the findings that precision farming adopters are more likely to be younger (Diekmann and Batte, 2010) and to have college or university degrees (Diekmann and Batte, 2010, Reichardt et al., 2009) – the general trend is towards an increasing level of education and younger generations are going to be more familiar with information technology.
Variable rate technologies
Thöle and Ehlert (2010) analysed a mechanical crop biomass sensor (“crop meter”). They found that the use of the sensor could improve N efficiency by 10-15%, reducing N fertiliser applications without impacting crop yield. A German provider for precision farming technologies reported a 5% higher crop yield in winter wheat with the same amount of fertiliser applied and a 5% increase in crop yield, with 12% reduction of fertiliser applied (www.agricon.de/nc/de/produkte-leistungen/sensoren-agronomie/effekte-im-getreide?cid=2743&did=1718&sechash=fb130ca9). Dillon and Kusunose (2013) illustrate, with theoretical considerations for fertilising maize in the United States, that a variable rate approach may not necessarily result in
lower fertiliser application rates. A similar mixed picture can be drawn from experiences with variable rate applications of nitrogen in Australia, Denmark and elsewhere (Lawes and Robertson, 2011, Biermacher et al., 2009, Boyer et al., 2011; Berentsen et al., 2002, cited in Oleson et al., 2004). Studies by Anselin et al. (2004) and Meyer-Aurich et al. (2008, 2010) concluded that the economic gross advantage of site-specific management of nitrogen fertiliser in Germany ranges between EUR 10 per ha and EUR 25 per ha, depending on the type of sensor used and size of the field, with improvements on N efficiency by 10-15%, by reducing the application without impact on crop yield. In such cases, the economic assessment concluded that the size of the field needed to be greater than 250 ha to obtain financial benefits. Other studies claim that economic and statistical analyses over a period of ten years showed no statistically significant economic advantage in sensor-based fertiliser application (Boyer et al., 2011). This conclusion is consistent with earlier observations (Liu et al., 2006; Anselin et al., 2004), who calculated profitability below EUR 8 per ha, which hardly covers the costs of application. Studies in Denmark showed no economic effect from sensor based fertiliser redistribution in the field according to high- and low-
yield zones (work by Berentsen, cited in Oleson et al., 2004).
Automatic guidance systems
The economic benefits of guiding systems in the United Kingdom were estimated for a 500 ha farm to be, at least, at
EUR 2.2 per ha (Knight et al., 2009), but the benefits grow if other more complex systems are adopted, such as
COM/TAD/CA/ENV/EPOC(2015)5
81
controlled traffic farming (2-5%), which would lead to additional returns of EUR 18-45 per ha for winter wheat cultivation. In Germany, economic benefits due to savings of inputs were assessed at EUR 27 per ha for the case of winter wheat.
348. Thus, precision agriculture concepts for phosphorus and potassium are generally more related to
the status of the soil. Especially for bigger fields, service providers can offer mapping of soil nutrient
status, which can be used as a recommendation for phosphorus and potassium fertiliser application.
349. A similar situation arises with site-specific application of lime. Soil pH is an important
agronomic parameter, which can vary substantially across fields. The soil pH directly influences nutrient
availability for plants because nutrients in the soil become soluble only within a certain pH range. An
imbalanced pH leads to economic losses and environmental problems. Thus, variable rate application of
lime can optimise nutrient availability for all parts of the field. Soil mapping or on-the-go soil pH sensing
systems can be used to map the spatial distribution of pH in the field and prescribe the appropriate lime
application rates (Bongiovanni and Lowenberg-DeBoer, 2000; Wang et al., 2003).
350. Precision weed and pest management can contribute to a drastic reduction the application of
pesticides and thus contribute to increased efficiency of their use. Automatic guidance systems are well
known to increase input efficiency by avoiding application overlaps. The economic advantages are well
documented and contribute to the success of precision agriculture technology (Knight et al., 2009).
351. For example, the investments required for the implementation of automatic guidance systems are
generally lower than other precision agriculture technologies, the risk is lower, and the results obtained are
more convincing for the farmer. Additionally, automatic guiding systems are easy to use and they do not
require agronomic experience, producing benefits, such as profitability, by reducing input costs (seeds,
fertiliser, chemicals, fuel and labour) and increasing yields, work simplification and speed, work comfort
and ability to extend the working hours on the field.
352. Nevertheless, precision agriculture technologies are designed for optimal input use rather than
increased output per ha. Also, production functions are mostly unaffected by precision agriculture
technologies, with the exception of precision irrigation, which generally enables higher crop yields.
353. The positive effects of precision agriculture on the natural resource base can be further achieved
with precision pest management. Another positive effect of precision agriculture can be expected from
controlled traffic farming, where less driving is needed, which releases the land allotted to driving tracks
for crops in a more resource efficient way, and with less soil compaction from heavy farm
machines.354. The use of precision agriculture technologies needs to result in higher revenues to cover
the costs of the technologies. This may be realised at a costs to the environment. For example, Morari et al.
(2013) have indicated that high quality standards for wheat grains may create incentives to fertilise wheat
at very high rates in order to capture economically attractive premiums for high quality wheat.
355. Precision agriculture technologies could be used to secure these economic potentials. Also,
Meyer-Aurich et al. (2010) showed incorrect fertiliser decisions can be costly if quality of the output, in addition
to yield, is influenced by the application rate. Considering quality enhances the opportunity for site-specific
management to be profitable as the benefits of variable rate technology compared to uniform management increases
with the degree of heterogeneity. In this special case, it is only with the availability of precision agriculture
technologies that it becomes possible to achieve the higher quality.
COM/TAD/CA/ENV/EPOC(2015)5
82
Positive employment effect in the up- and down-stream sectors, but variable for the on-farm sector
356. There is limited information available on the effect of precision agriculture on employment or
farm labour. However, CropLife's 2013 survey provides indirect trends of precision agriculture on labour
off the farm (Holland et al., 2013). It can be supposed that equipment manufacturers, dealers, retailers or
input suppliers have a growing demand for employees with a precision agriculture background.
357. There is anecdotal evidence that precision agriculture technologies require more office time,
compared with conventional farming (Möbius, 2012). Meyer-Aurich et al. (2008) provide an economic
analysis of precision farming technologies at the farm level and find, depending on farm size and structure,
that the implementation of precision agriculture technologies can reduce labour requirements due to the
automation potential of variable rate technologies.
358. This is confirmed by Pedersen et al. (2006), who conclude that autonomous systems are capital-
intensive, but less labour-intensive, as they are more flexible than conventional systems and may
significantly reduce labour costs and restrictions on the number of daily working hours. Kingwell and
Fuchsbichler (2011) showed that under Australian conditions labour input, and therefore cost, could be
reduced through CTF compared with conventional farming systems. However, Maheswari et al. (2008)
found that labour cost per ha (for vegetable production) may increase significantly with the adoption of
precision agriculture compared with conventional farming.
359. The adoption of precision farming practices has impacts on the management and organisation of
the farming system. This includes the implementation of on-farm IT systems and processes. Depending on
the approach, this could include services from precision agriculture service suppliers and extension
services. Precision agriculture practices, such as guidance systems, may increase the availability of labour,
which has an indirect effect on other farming practices. Furthermore, the adoption of precision agriculture
technologies may have impact on the farming practices of neighbouring farmers through land or
technology leasing (Batte, 2003).
360. In summary, it can be supposed from the available information that precision agriculture
technologies have a positive employment effect in the up- and down-stream sectors, whereas the on-farm
effects may be negative, due to the automation potential of precision agriculture technology. Nonetheless,
it can be expected that precision agriculture technologies will increase on-farm workforce productivity.
Since available research results in this area are limited, it will be an important task for future research to
analyse the employment effects of precision agriculture in more detail.
Improved environmental footprint of agriculture
361. Although the possible use of precision technologies in managing the environmental side effects
of farming and reducing pollution is appealing, little assessment has been made of the benefits provided to
the environment and no quantified figures are available.
362. There is some evidence from research which shows that the site specific management of inputs
such as fertilisers and chemicals that are required by precision agriculture technologies can reduce the
environmental footprint of agriculture. For example, precision farming, by providing an opportunity to
reduce physical overlap between machinery passes, reduces GHG emissions and lowers diffuse water
pollution from fertilisers, agro-chemicals and fuel. GPS mapping and guidance systems can reduce the
need for over-spraying by precisely defining the borders of previously sprayed areas.
363. Some other examples include nitrate leaching in cropping systems, demonstrating that variable
rate application methods were successful in reducing groundwater contamination and that precision
COM/TAD/CA/ENV/EPOC(2015)5
83
agriculture methods may reduce erosion when precise tillage is conducted. A literature review on the
environmental effects is provided by Bongiovanni and Lowenberg-Deboer (2004).
Impediments to nurturing the green growth potential
364. Precision agriculture remains in the early stages of adoption and the suite of information
technologies are not expected to be adopted universally across and within countries. The high cost and
complexity of the technology, farm-operator education and farm management acumen, as well as failure to
deliver the expected economic benefits in some instances, are among the main factors which have hindered
wider adoption as cited in several studies (Khanna et al., 1999; Griffin et al., 2004; Reichardt and Jürgens,
2009; Robertson et al., 2012; Rutt, 2011). More widespread adoption would largely hinges on the extent to
which the precision agriculture technologies become less expensive and/or easier to install and maintain.
Farm structural characteristics are critical drivers of adoption
365. Precision agriculture is effectively a suite of methods, approaches and instrumentation that
farmers should examine in detail to decide which is the most suitable for their business. Farm-level factors
such as farm size, field size, field geometry – as well as soil heterogeneity – play a prominent role in the
adoption of precision agriculture technologies and are therefore influencing its growth potential to a great
extent. Since one of the goals of variable rate technology is to manage in-field soil heterogeneity, it is
obvious that a reasonable amount of observable soil heterogeneity is a prerequisite for farmers to think
about managing heterogeneity. However, if the precision farming technology results in low to moderate
changes in input levels at a given location within the field, there is a high probability that the improvement
in profit will be very low.28
366. Regarding farm size, it is obvious that economies of scale are an important issue when
calculating the economic benefit and discussing the adoption of cost-intensive precision agriculture
technologies, as cost/benefit estimations require a minimum farm size in order to depreciate the investment
over the entire farm (Kingwell and Fuchsbichler, 2011). In the EU, studies demonstrate that auto-guidance
systems are profitable when they are implemented on field of 100-300 ha (Frank et al., 2008; Lawes and
Robertson, 2011).
367. In addition to the field size, another important aspect for successful adoption is the suitability of
the fields for the implementation of precision agriculture methods. Where the field size is small, or when
the farmer does not own the technology, specialist contractors, sharing of farming methods and co-
operative approaches may be suitable ways of introducing precision farming technologies.
368. Wagner (2009) provided cost estimations for three different technological approaches for site-
specific nitrogen fertilisation (Table 6.3). Annual costs of a sensor system decreased from EUR 21.38
per ha, assuming a cropping area of 250 ha, to only EUR 5.35 per ha for a cropping area of 1 000 ha. As a
consequence, many reports show that increasing farm size has a positive effect on the probability that
precision agriculture technologies are adopted (e.g. Roberts et al., 2004; McBride and Daberkow, 2003).
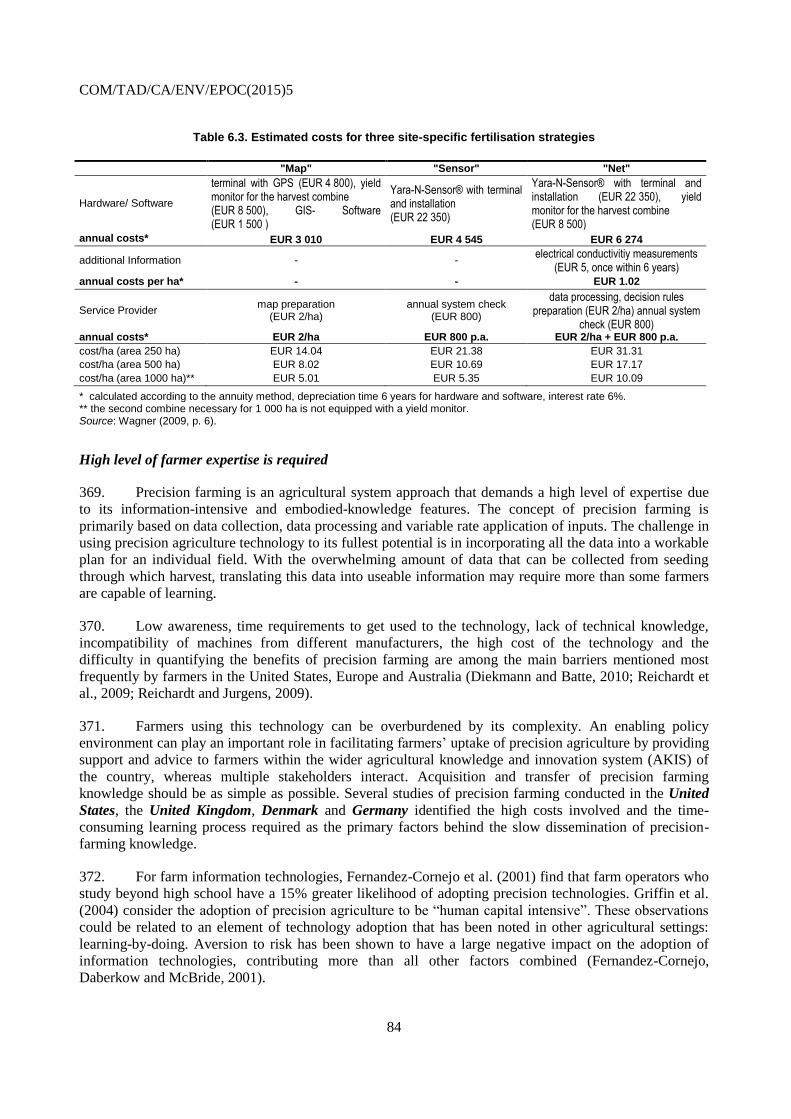
COM/TAD/CA/ENV/EPOC(2015)5
84
Table 6.3. Estimated costs for three site-specific fertilisation strategies
"Map" "Sensor" "Net"
Hardware/ Software
terminal with GPS (EUR 4 800), yield monitor for the harvest combine (EUR 8 500), GIS- Software (EUR 1 500 )
Yara-N-Sensor® with terminal and installation (EUR 22 350)
Yara-N-Sensor® with terminal and installation (EUR 22 350), yield monitor for the harvest combine (EUR 8 500)
annual costs* EUR 3 010 EUR 4 545 EUR 6 274
additional Information - - electrical conductivitiy measurements
(EUR 5, once within 6 years) annual costs per ha* - - EUR 1.02
Service Provider map preparation
(EUR 2/ha) annual system check
(EUR 800)
data processing, decision rules preparation (EUR 2/ha) annual system
check (EUR 800) annual costs* EUR 2/ha EUR 800 p.a. EUR 2/ha + EUR 800 p.a.
cost/ha (area 250 ha) EUR 14.04 EUR 21.38 EUR 31.31
cost/ha (area 500 ha) EUR 8.02 EUR 10.69 EUR 17.17
cost/ha (area 1000 ha)** EUR 5.01 EUR 5.35 EUR 10.09
* calculated according to the annuity method, depreciation time 6 years for hardware and software, interest rate 6%. ** the second combine necessary for 1 000 ha is not equipped with a yield monitor. Source: Wagner (2009, p. 6).
High level of farmer expertise is required
369. Precision farming is an agricultural system approach that demands a high level of expertise due
to its information-intensive and embodied-knowledge features. The concept of precision farming is
primarily based on data collection, data processing and variable rate application of inputs. The challenge in
using precision agriculture technology to its fullest potential is in incorporating all the data into a workable
plan for an individual field. With the overwhelming amount of data that can be collected from seeding
through which harvest, translating this data into useable information may require more than some farmers
are capable of learning.
370. Low awareness, time requirements to get used to the technology, lack of technical knowledge,
incompatibility of machines from different manufacturers, the high cost of the technology and the
difficulty in quantifying the benefits of precision farming are among the main barriers mentioned most
frequently by farmers in the United States, Europe and Australia (Diekmann and Batte, 2010; Reichardt et
al., 2009; Reichardt and Jurgens, 2009).
371. Farmers using this technology can be overburdened by its complexity. An enabling policy
environment can play an important role in facilitating farmers’ uptake of precision agriculture by providing
support and advice to farmers within the wider agricultural knowledge and innovation system (AKIS) of
the country, whereas multiple stakeholders interact. Acquisition and transfer of precision farming
knowledge should be as simple as possible. Several studies of precision farming conducted in the United
States, the United Kingdom, Denmark and Germany identified the high costs involved and the time-
consuming learning process required as the primary factors behind the slow dissemination of precision-
farming knowledge.
372. For farm information technologies, Fernandez-Cornejo et al. (2001) find that farm operators who
study beyond high school have a 15% greater likelihood of adopting precision technologies. Griffin et al.
(2004) consider the adoption of precision agriculture to be “human capital intensive”. These observations
could be related to an element of technology adoption that has been noted in other agricultural settings:
learning-by-doing. Aversion to risk has been shown to have a large negative impact on the adoption of
information technologies, contributing more than all other factors combined (Fernandez-Cornejo,
Daberkow and McBride, 2001).
COM/TAD/CA/ENV/EPOC(2015)5
85
373. Factors that slow adoption in some regions are related to social capital and the strength of
information networks. Kutter et al. (2011) analysed social factors, such as the role of communication and
co-operation with regard to the adoption of precision farming technologies. In terms of communication,
they studied various information sources and communication channels and their impact on adopting
precision agriculture technologies. Additionally, joint investments, agricultural contracting and data out-
sourcing were investigated as possible forms of co-operation.
374. Based on qualitative interviews, Kutter et al. (2011) came to the conclusion that professional
literature, field days, and exhibitions played a key role as communication instruments. Furthermore, they
concluded that co-operation between contractors, farmers and industry was important to advance the
adoption process.
375. These conclusions are in line with Aubert et al. (2012), who also pointed out that it is important
to co-ordinate all stakeholders (farmers, input suppliers, equipment manufacturers and dealers) in order to
improve adoption of the technology. Such a co-ordination initiative could be organised by co-operatives or
farmers associations (Aubert et al., 2012). McBride and Daberkow (2003) observed that personalised
technical support (e.g. from crop consultants/input suppliers) was extremely important in terms of the
probability that precision farming technologies would be adopted at the farm level (see also Bramley and
Trengove, 2013).
376. Also, Aubert et al. (2012) recognised training programmes as an important issue in the adoption
process of precision agriculture technologies. Zhang et al. (2002) also found that educational programmes
involving various stakeholders (researchers, industry, extension specialists and consultants) were needed to
speed up the implementation of precision agriculture technologies. Reichardt et al. (2009) came to similar
conclusions, underlining the importance of teaching precision farming at vocational and technical schools
in order to improve implementation.
377. Further relevant social and socio-economic factors discussed in the literature were farmers’
education and age (see Adrian et al., 2005; Aubert et al., 2012; Walton et al., 2008). McBride and
Daberkow (2003) showed that the probability of precision agriculture adoption declined with age.
However, Aubert et al. (2012) found no correlation between the age of farmers and the adoption rates.
378. With regard to education, higher levels of education alter the probability of adaptation (Aubert et
al., 2012; Reichardt and Jürgens, 2009; McBride and Daberkow, 2003), since the technology is
sophisticated and often complicated to use. However, Pannell et al. (2006) argued that participation in
technology-relevant training courses may be more important than the level of education, when predicting
adoption.
High start-up costs hinder adoption
379. The relative advantage of precision agriculture technologies compared to conventional
agriculture (e.g. uniform input management) is an important factor influencing adoption (Aubert et al.,
2012), and, therefore, the growth potential of the technology. The relative advantage can have economic,
social, or environmental dimensions (Pannell et al., 2006).
380. In terms of economic relative advantage, it can be stated that for most variable rate technologies,
farm level economics currently shows mixed results, resulting from: high technology and learning costs,
the complexity of the technology, missing compatibility of technology components, sub-optimal or missing
decision algorithms, and the limiting effect of flat pay-off functions. For instance, according to the method
of managing nitrogen fertiliser used, the site-specific, annual technology costs (not including the learning
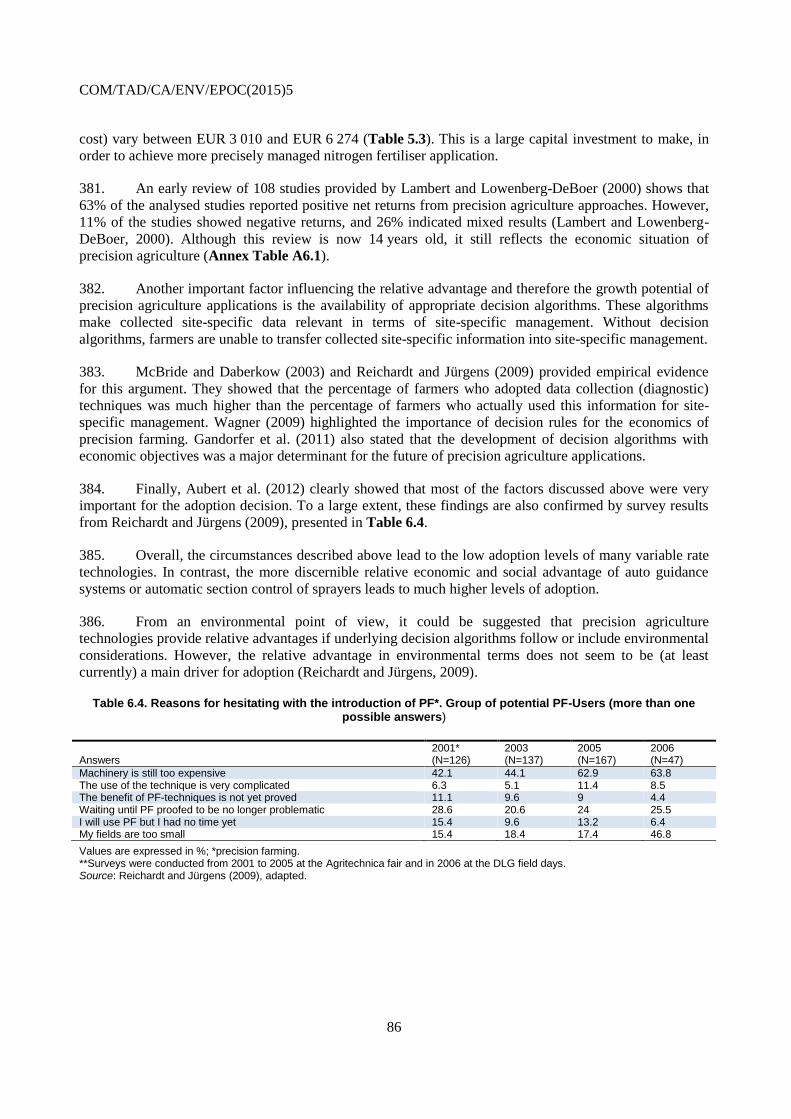
COM/TAD/CA/ENV/EPOC(2015)5
86
cost) vary between EUR 3 010 and EUR 6 274 (Table 5.3). This is a large capital investment to make, in
order to achieve more precisely managed nitrogen fertiliser application.
381. An early review of 108 studies provided by Lambert and Lowenberg-DeBoer (2000) shows that
63% of the analysed studies reported positive net returns from precision agriculture approaches. However,
11% of the studies showed negative returns, and 26% indicated mixed results (Lambert and Lowenberg-
DeBoer, 2000). Although this review is now 14 years old, it still reflects the economic situation of
precision agriculture (Annex Table A6.1).
382. Another important factor influencing the relative advantage and therefore the growth potential of
precision agriculture applications is the availability of appropriate decision algorithms. These algorithms
make collected site-specific data relevant in terms of site-specific management. Without decision
algorithms, farmers are unable to transfer collected site-specific information into site-specific management.
383. McBride and Daberkow (2003) and Reichardt and Jürgens (2009) provided empirical evidence
for this argument. They showed that the percentage of farmers who adopted data collection (diagnostic)
techniques was much higher than the percentage of farmers who actually used this information for site-
specific management. Wagner (2009) highlighted the importance of decision rules for the economics of
precision farming. Gandorfer et al. (2011) also stated that the development of decision algorithms with
economic objectives was a major determinant for the future of precision agriculture applications.
384. Finally, Aubert et al. (2012) clearly showed that most of the factors discussed above were very
important for the adoption decision. To a large extent, these findings are also confirmed by survey results
from Reichardt and Jürgens (2009), presented in Table 6.4.
385. Overall, the circumstances described above lead to the low adoption levels of many variable rate
technologies. In contrast, the more discernible relative economic and social advantage of auto guidance
systems or automatic section control of sprayers leads to much higher levels of adoption.
386. From an environmental point of view, it could be suggested that precision agriculture
technologies provide relative advantages if underlying decision algorithms follow or include environmental
considerations. However, the relative advantage in environmental terms does not seem to be (at least
currently) a main driver for adoption (Reichardt and Jürgens, 2009).
Table 6.4. Reasons for hesitating with the introduction of PF*. Group of potential PF-Users (more than one possible answers)
Answers
2001* (N=126)
2003 (N=137)
2005 (N=167)
2006 (N=47)
Machinery is still too expensive 42.1 44.1 62.9 63.8 The use of the technique is very complicated 6.3 5.1 11.4 8.5 The benefit of PF-techniques is not yet proved 11.1 9.6 9 4.4 Waiting until PF proofed to be no longer problematic 28.6 20.6 24 25.5 I will use PF but I had no time yet 15.4 9.6 13.2 6.4 My fields are too small 15.4 18.4 17.4 46.8
Values are expressed in %; *precision farming. **Surveys were conducted from 2001 to 2005 at the Agritechnica fair and in 2006 at the DLG field days. Source: Reichardt and Jürgens (2009), adapted.
COM/TAD/CA/ENV/EPOC(2015)5
87
ANNEXES
ANNEX 1: Integrated Pest Management
Principles, concepts and practices
387. IPM is usually deployed in a number of steps, each of which involving various practices. FAO
(2014) suggests the following six main steps as typical for an IPM approach:
Prevention and/or suppression of harmful organisms;
Monitoring of harmful organisms;
Decision making based on monitoring and with consideration given to individual cases, where
pest management might be necessary, with priority given to sustainable, non-chemical methods;
Pesticide application should be considered as a last resort when there are no adequate non-
chemical alternatives available and where the use of pesticides is economically justified;
Selection of pesticides which are targeted as specifically as possible at the problem and which
have the least side effects on human health, non-target organisms and the environment;
Monitoring of the success of the applied pest management measures.
388. The US EPA (2014) proposes the same strategy, but in a four-step procedure. USDA has put
forth the PAMS concept, an acronym for prevention, avoidance, monitoring and suppression. In general,
the standard procedures include the preventive suppression of potentially harmful organisms, the
identification and monitoring of these organisms, a decision-making procedure based on pre-defined action
thresholds and information from monitoring and – if and when needed – suppression actions.
389. There is a wide range of practices applied within IPM strategies due to the fact that IPM is
adapted to local geographic conditions and crop needs that vary enormously from region to region even
within the same country. For this reason IPM never prescribes ready-to-use recipes or “one-size-fits-all”
management practices. For each case, a unique package of practices is proposed and a tailor-made strategy
adapted to local requirements is developed. However, in the historical course of developing and applying
IPM, certain practices have been found to contribute significantly more than others, and in a wider context
of environments.
390. For the prevention of pests, a combination of the following practices, very often, provides
encouraging results:
Use of pest resistant/tolerant cultivars and varieties, and use of certified seed and planting
material;
Crop rotation, inter-cropping, crop sequences and associations, that minimise the pressure and
maximise biological prevention of pests and diseases; and
Cultivation practices such as seedbed sanitation, correct selection of sowing dates and densities,
under-sowing, conservation tillage, pruning, direct sowing.
COM/TAD/CA/ENV/EPOC(2015)5
88
391. It is important to note that most of the preventive IPM practices are also common sense good
farm practices for resource (soil and water) conservation, nutrient management and for building resilience
to climate change.
392. Monitoring techniques fall into three types: absolute methods, relative methods, and population
indices. In absolute methods, estimates of the density of the pest population are expressed as a level per
unit of crop area, or as a percentage of the sampling units affected. In relative monitoring methods the
same estimates are expressed per unit of effort, while in population indices methods the estimates are
expressed by crop damage or the frequency of pest infestations.
393. For monitoring harmful organisms field scouting is the primary practice. This is the most
important means of obtaining information to make management decisions. Scouting patterns depend upon
the pattern of pest infestations which may be uniformly spread over the field, concentrated in particular
areas of a field or appear at field edges first. Scouting and visual counts or assessments are frequently
supported by traps such as pheromone or light traps.
394. The decision-making process utilises information from monitoring to address two basic
questions. First, whether the natural controls present on the farm capable of keeping the pest population
below economic levels. Second, if the cost that may be caused by the pest is higher than the cost of
controlling the pest. The decision-making process is assisted by the estimation of the Economic Injury
Levels (EIL) and the Economic Threshold (or Action Threshold). Injury is defined as the physical harm or
destruction to a valued commodity caused by the presence or activities of a pest. Damage is the monetary
value lost to the commodity as a result of injury by the pest. The concept of the EIL goes back to 1959,
when Stern et al. (1959) defined it as “the lowest population density of a pest that will cause economic
damage; or the amount of pest injury which will justify the cost of control”. One way to express EIL
mathematically is:
𝐸𝐼𝐿 =𝐶 ∗ 𝑁
𝑉 ∗ 𝐼=𝐶
𝑉∗1
𝐿
where C is the unit cost of controlling the pest, N is the number of pests injuring the commodity unit, V is
the unit value of the commodity and I is the percentage of the commodity unit injured. EIL is expressed as
the number of pests per unit area or per sampling unit and L is the loss caused per pest (Pedigo et al.,
1986). The EIL is a function of the cost of pest control (C) and the value of the commodity (V). Despite its
expression in quantities of pest, the EIL is a break-even point or a cost/benefit ratio that determines the pest
control decisions and consequent actions. However, pest managers take account of the time lag between
the implementation of a control strategy and its effect on the pest population, and set the so-called
Economic or Action Thresholds which set the pest density at which control measures should be
implemented to prevent the population from reaching the EIL.
395. In other words, Action Thresholds point out the pest density at which control operations should
begin to prevent the pest from reaching the density at which it will cause economic damage. Graphically
speaking, the EIL and the Action Threshold have the relationship shown in Annex Figures A1.1 and
Annex Figures A1.2. Figure 1a shows how the dynamic of a pest population may reach EIL and cause
economic losses. Figure 1b sets the Action Thresholds and shows the time at which management activity
should be undertaken in order to deter the dynamic movement of the pest population from reaching the
EIL. The Action Thresholds and EIL concepts have been criticised. A thorough discussion of these
concepts is presented below.
396. Suppression practices include physical, biological and chemical activities. USDA’s manual on
IPM records a range of physical suppression practices including cultural practices such as narrow row
spacing, or optimised in-row plant populations; alternative tillage approaches, such as no-till or striptill
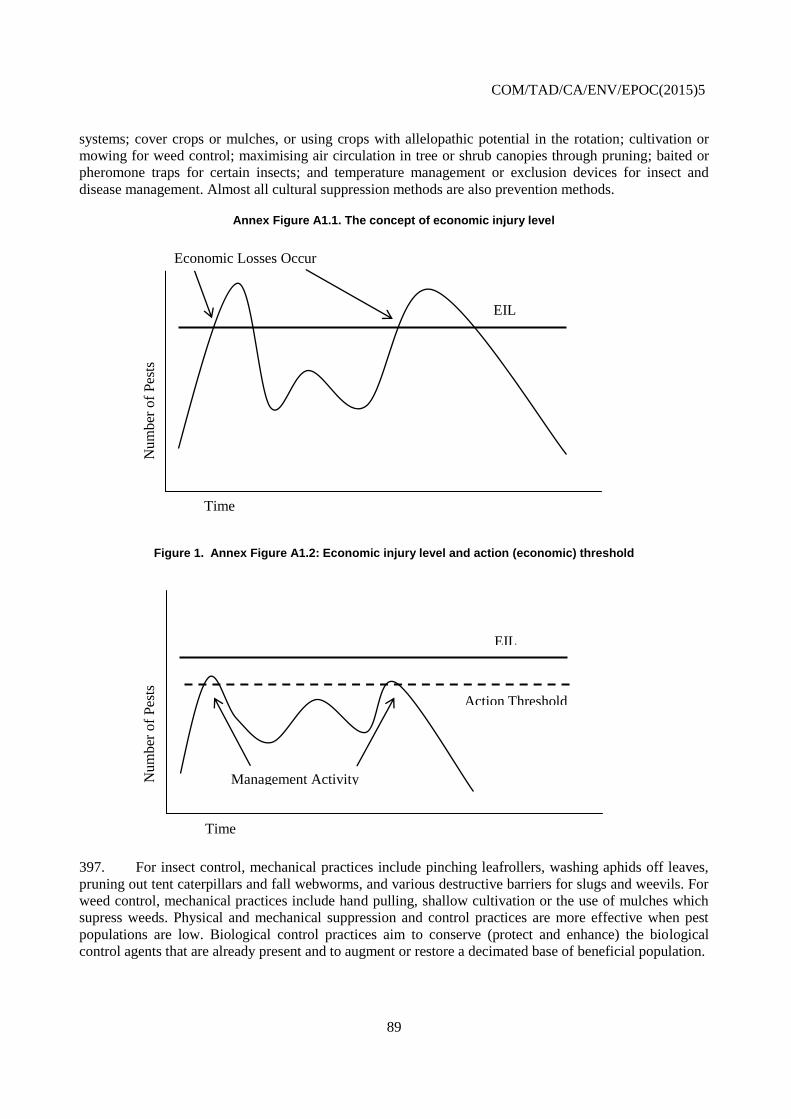
COM/TAD/CA/ENV/EPOC(2015)5
89
systems; cover crops or mulches, or using crops with allelopathic potential in the rotation; cultivation or
mowing for weed control; maximising air circulation in tree or shrub canopies through pruning; baited or
pheromone traps for certain insects; and temperature management or exclusion devices for insect and
disease management. Almost all cultural suppression methods are also prevention methods.
Annex Figure A1.1. The concept of economic injury level
Figure 1. Annex Figure A1.2: Economic injury level and action (economic) threshold
397. For insect control, mechanical practices include pinching leafrollers, washing aphids off leaves,
pruning out tent caterpillars and fall webworms, and various destructive barriers for slugs and weevils. For
weed control, mechanical practices include hand pulling, shallow cultivation or the use of mulches which
supress weeds. Physical and mechanical suppression and control practices are more effective when pest
populations are low. Biological control practices aim to conserve (protect and enhance) the biological
control agents that are already present and to augment or restore a decimated base of beneficial population.
Num
ber
of
Pes
ts
Time
EIL
Economic Losses Occur
Num
ber
of
Pes
ts
Time
EIL
Action Threshold
Management Activity
COM/TAD/CA/ENV/EPOC(2015)5
90
398. The most important practices of biological control include the selective use of pesticides and the
release of predatory agents. Other biological suppression practices include mating disruption for insects,
and should be considered as alternatives to conventional pesticides, especially where long-term control of
an especially troublesome pest species can be obtained. Chemical suppression methods should be
considered only as a last resort, when all other alternatives have been tried. The whole philosophy of IPM
is to consider non-toxic and selective materials first. These materials include horticultural oils, insecticidal
soaps and botanically derived pesticides, such as neem seed extracts, pyrethrum, and rotenone. Effective
pesticide application (i.e. proper timing and targeted application) may reduce the use of pesticides by as
much as 90%.
Adoption of IPM practices across countries
Canada
399. Canada has been at the forefront of research into reducing the use of chemicals without lowering
crop yield or quality since the 1940's. Already in 1968, Canadian researchers had investigated ways to
reduce the use of pesticides in apple orchards without increasing damage to the fruit. By 1974, the
development of a computerized forecast and early warning system made available pest and weather data to
apple-growing areas in Ontario. Initial use and field testing of IPM has generated grower confidence in the
programme.
400. Crops are chosen as candidates for IPM on the basis of three major criteria: crops being treated
with large amounts of pesticides; overall value of the crop in the region and/or large crop area and research
information available on pest biology; monitoring techniques; and thresholds and control strategies. Today,
government support for IPM is provided through two programmes. One is delivered by Agriculture and
Agri-Food Canada (AAFC) and the provinces. The Pesticide Risk Reduction Program (RRRP), a joint
initiative of AAFC and Health Canada's Pest Management Regulatory Agency (PMRA), aims to reduce the
risks from pesticides used in the agriculture and agri-food industry. These include risks to human health,
risks to biodiversity resulting from impacts on non-target organisms, and risks to air, water and soil.
401. The programme creates a framework through which producers develop and implement pesticide
risk reduction strategies, targeting priority pest management issues that are determined through stakeholder
consultations at a national level. The programme provides project funding and regulatory support for the
implementation of developed strategies. The second is the Minor Use Pesticides Program (MUPP), which
aims at conducting regulatory data generation trials and submit to PMRA in order to make new pest
management product uses available for Canadian growers of small acreage and specialty (i.e. “minor”)
crops, thereby expanding the options available to growers (Dixon et al., 2014).
European Union
402. In the European Union (EU) there is a long history of IPM promotion and adoption which is
closely linked to pesticide control. The breakthrough in IPM adoption was the introduction of Directive
2009/128/EC, or the so-called Sustainable Use Directive (SUD). The Directive’s objective is to establish
“… a framework to achieve a sustainable use of pesticides by reducing the risks and impacts of pesticide
use on human health and the environment and promoting the use of Integrated Pest Management and of
alternative approaches or techniques such as non-chemical alternatives to pesticides”.
403. In article 4 of this Directive, member states were asked to adopt National Action Plans that set up
quantitative objectives, targets, measures and timetables to reduce the risks and impacts of pesticide use on
human health and the environment, and to encourage the development and introduction of IPM and of
alternative approaches or techniques in order to reduce dependency on the use of pesticides. Furthermore,
COM/TAD/CA/ENV/EPOC(2015)5
91
it is obligatory for member states to describe in their National Action Plans how they ensure that the
general principles of IPM are implemented by all professional users by 1 January 2014. In this respect,
some type of IPM is obligatory across all EU territory. All 28 member states have, by now, submitted their
Action Plans. Examination of them reveals that the level and depth of IPM adoption vary significantly
across EU member states.
404. It is argued that, due to the fact that a number of countries have a history of national plans and
programmes to reduce pesticide use and risks, the approaches of IPM implementation vary between
countries, regarding the main players and stakeholders, and range from the general adoption of the IPM
principles; government-driven programmes for demonstration farms; and national IPM projects, to
development of crop specific guidelines and scoring systems to evaluate the national IPM performance
(Dachbrodt-Saaydeh and Barzman, 2013). Among the most serious critics is the lack of a European
Guideline that will harmonise the IPM guidelines at regional/territorial and national level. Non-
harmonisation corresponds to a confusing market and an unbalanced competition among the suppliers of
different EU member states (Tommasini, 2013).
405. Other critics argue that, since the SUD was developed and implemented within the DG
Environment and DG SANCO, the objectives and indicators relate to environmental protection and food
safety – with little consideration given to agricultural productivity, or to farming livelihoods (Hillocks,
2013). Furthermore, it is argued that certain substances which are appropriate to IPM strategies are listed
by authorities as active substances, creating adverse consequences for their use in IPM programmes.
IPM and agri-environmental payments in EU member states
406. Adoption of IPM practices (wholly or partly) is supported in the EU by payments directed to
farmers. These payments are aimed at covering the cost of contracting IPM advisors, the cost of adaptation
to the new practices (purchase of machinery and instruments) and to reducing the risk of income foregone
when IPM is adopted. The payments were directed to farmers within either the Common Market
Organization (CMO) or the Rural Development Plans at regional or national (member state) level. The
programmes targeted either specific products or specific environmentally sensitive areas. The following are
examples of IPM adoption with financial incentives provided by the CAP and recorded by Christensen
(2013):
Regional Rural Development Programme for Flanders (Belgium) under Axis 2 (Agri-
environment Measures): sexual confusion against the codling moth in pipfruit for at least 5 years
and on at least 1 ha, with a subsidy of EUR 250 per hectare;
Fruit and Vegetables (F&V) Common Market Organization in Emiglia/Romagna, Italy: use of
selected pesticides, combined with an integrated production system for F&V, with a subsidy of
EUR 100/ha for arable land, EUR 300/ha for vegetables and EUR 550/ha for fruit;
National Rural Development Programme for Austria (Axis 2): obligation for crop rotations for
annual crops, restrictions on fertiliser and pesticide use, training and record-keeping for
pesticides, with a subsidy of EUR 150/ha for potatoes and turnips, EUR 250/ha for strawberries,
EUR 300/ha for fruit and hops, and up to EUR 400/ha for vines;
Agri-environmental measures, France: biological control agents, introduction of beneficiaries,
sexual confusion, with a subsidy of EUR 105/ha for vegetables, EUR 70/ha for fruit trees and
EUR 79/ha for grapes.
COM/TAD/CA/ENV/EPOC(2015)5
92
407. Unfortunately, there are no any published assessments (to the best of our knowledge) that
examine the rates of IPM adoption once subsidies are phased out. In addition, assessments recording the
proportion of farmers who maintain at least some of the IPM practices or who move to organic agriculture
or return to conventional agriculture once agri-environment subsidies end, are not available.
408. In Italy, IPM has a very long history, with its first applications dating back in the mid-1970s
(Ciampitti, 2013). IPM began to really take off in 1987 with the nationwide “integrated pest and disease
control strategies” and the related first IPM funding of regional action plans (Faraglia et al., 2013). The
Action Plan provides for both statutory and voluntary IPM. Statutory IPM includes the application of
techniques to prevent and monitor pests, diseases and weeds, the use of biological pest control methods,
recourse to appropriate farming practices and the choice of those plant protection products which entail the
least risk for human health and the environment among those available for the same purpose.
409. Voluntary IPM is a system implemented through crop-specific technical standards and binding
plant health instructions (production specifications), including agricultural and plant protection actions and
constraints on the choice of plant protection products and on the number of their applications. The Action
Plan sets out the actions that should be undertaken by the Ministry of Agricultural, Food and Forestry
Policies and by the Regions and Autonomous Provinces to ensure that IPM training and services of
forecasting, monitoring and announcement are operational and harmonized and accessible to professional
users. The Action Plan also takes account of actions to monitor the presence of pesticides in the aquatic
environment and food.
410. In Germany, IPM is included as Integrated Plant Protection and is embedded in the Plant
Protection Act (PflSchG), which states that plant protection may be carried out solely according to good
professional practice and in accordance to the Sustainable Use Directive. The German Action Plan also
includes a range of quantified targets for the adoption of low-pesticide practices (e.g. the target that any the
exceeding of the maximum residue levels must be reduced to below 1% in all product groups for both
domestically-produced and imported foods by 2021). Other goals stated in other strategies also form part
of the German Action Plan as, for example, the goal in the National Sustainability Strategy, which aims at
a 20% share of Utilised Agricultural Area for organic farming.
411. In France, the National Action Plan is based on the Ecophyto plan that pre-existed as a national
initiative (Ricci, 2013). Ecophyto was adopted in 2008 as a result of wide consultation process among
multiple stakeholders. The aim of Ecophyto is to reconcile economic and environmental goals in
agriculture and to reduce the use of plant protection products, while maintaining a high quantitative and
qualitative level of production. The plan was subsequently embedded into the larger goal of “changing the
way of cropping”, by relying increasingly on the principles of agroecology. The plan is developed in nine
axes that include IPM. Many research and demonstration activities are financed under Ecophyto. For
example, Ecophyto has established a pest monitoring network based on observations in 12,000 fields and
delivers weekly information bulletins at the regional level. At the same time, Ecophyto has selected almost
2,000 demonstration fields with the aim of testing strategies for pesticide-use reduction under alternative
cropping systems.
412. In the United Kingdom, the UK National Action Plan outlines a number of IPM initiatives, but
there is no fully developed framework for IPM. Among non-regulatory initiatives and incentives, the
Assured Food Standards Schemes require growers to adopt practices which are consistent with the general
principles of IPM. Specific standards are set for individual crops and work is underway to develop an IPM
self-assessment tool for farmers (an IPM Plan) to encourage the use of IPM tools and techniques, such as
decision-support systems and pest and disease monitoring systems. The support to farmers wishing to
convert to organic methods of production under the Organic Entry Level Scheme is also considered as an
IPM initiative.
COM/TAD/CA/ENV/EPOC(2015)5
93
413. Belgium is one of the most advanced member states as concerns adoption of IPM. The Belgian
government has adopted a Federal Program for the Reduction of Pesticides (2013-2017) and three regional
programmes covering the areas of Walloon, Flemish and Brussels regions. For example, in the Walloon
region, a number of initiatives have been adopted, including a blight warning system for potatoes which
was adopted in 2011 by 431 farmers representing approximately 10 000 ha, or one-third of the surface area
dedicated to potatoes. Other examples include financial incentives for the adoption of IPM, as in the case
of subsidies granted to farmers complying with the official specifications for "integrated pest management
in pip fruit" adopted in 2011 by 49 farms, representing approximately 70% of pip fruit surface areas in
Wallonia. In the Walloon region, the history of IPM dates back to 1988, when arboriculturists founded the
GAWI (Groupements d’Arboriculteurs pratiquant en Wallonie les techniques Intégrées – Groupings of
arboriculturists applying integrated pest management techniques in Wallonia), who developed and
promoted integration production techniques and created the FRUITNET label, which guarantees the
minimal impact of production on the environment.
414. The Dutch crop protection policy has been focussing on the implementation of IPM since 1990.
It is claimed that in the 1980s the Netherlands had the highest pesticide use measured in quantity of active
ingredient in the world (Wijnands et al., 2014). This created substantial problems for drinking water
resources. The Netherlands responded with two long-term programmes. First, the Multi-Year Crop
Protection Programme (MYCPP), covering the period 1991-2000 and second, the Sustainable Crop
Protection Programme, covering the period 2001-10. During the end of this second period, in 2008-10,
national support to develop and promote IPM in practice was realised through the “Farming with Future”
initiative. Thus, the Netherlands had accumulated at least 25 years of experience in administering pesticide
control policies before launching the “Farming with Future” initiative. The MYCPP achieved a 49%
reduction in the volume of active ingredients and a 54-79% reduction in emissions to soil, surface and
groundwater, and air. The Sustainable Crop Protection programme achieved an 86% reduction in
calculated environmental impacts (Wijnands et al., 2014). Under the “Farming with Future” initiative 100
new IPM methods were tested, 80 were developed into useful, effective and feasible strategies and were
subsequently documented, described and demonstrated in hundreds of activities, reaching thousands of
farmers (Wijnands and Brinks, 2013). In the Netherlands, the Action Plan ensures that all professional
users apply the principles of IPM. It also states that “the industry and government will ensure integrated
methods are widely used by putting in place, for instance, financial and fiscal incentives, certification, a
link with the Common Agricultural Policy or statutory measures”.
United States
415. The history of IPM adoption in the US is long as, in fact, IPM was born out of early pest control
initiatives developed in the 1960s in California. In 1994, the USDA and the EPA announced a joint “IPM
Initiative”, setting a quantitative goal of IPM adoption on 75% of planted cropland area in the USA by the
end of 2000 (Jacobsen, 1996). Such an adoption rate was expected to bring about a reduction in pesticide
use on the nation’s farms. To measure the level of adoption, USDA put forth the PAMS concept (noted
earlier). A farmer was required to utilise at least three of the four PAMS components in order to qualify as
an IPM practitioner. In 2001, a survey conducted by the USDA National Agricultural Statistics Service
(NASS) found that some level of IPM had been adopted by 71% of farms, as opposed to 51% at the start of
the initiative.
416. However, the anticipated reduction in pesticide use did not occur. According to NASS, pesticide
use, as measured by quantity of active ingredient applied, increased about 4% from 1994 to 2000 (i.e.
during the period the “IPM Initiative” was in place). In 2000-01, the US General Accounting Office
(GAO) conducted a review of the IPM programme, known as the GAO study, to examine the status of IPM
adoption in US agriculture. The study concluded that “the implementation rate is a misleading indicator of
COM/TAD/CA/ENV/EPOC(2015)5
94
the progress made toward an original purpose of IPM – reducing chemical pesticide use”. The GAO study
observed that four elements critical to the successful implementation of the initiative were missing:
No one was effectively in charge of federal IPM efforts;
Coordination of IPM efforts was lacking among federal agencies and with the private sector;
The intended results of IPM efforts were not been clearly articulated or prioritized; and
Methods for measuring IPM’s environmental and economic results were not developed.
417. In May 2004, the Federal IPM Coordinating Committee adopted The Road Map for the National
Integrated Pest Management (IPM) Program after a long period of wide consultation with stakeholders.
The Road Map identifies strategic directions for IPM research, implementation and measurement for all
pests, in all settings, throughout the nation (Coble and Ortman, 2009). These include pest management for
all areas including agricultural, structural, ornamental, turf, museums, public and wildlife health pests, and
encompasses terrestrial and aquatic invasive species. Coble and Ortman (2009) state that the Road Map’s
overall goal is to improve the economic benefits of adopting IPM practices and to reduce potential risks to
human health and the environment caused by the pests themselves or by the use of pest management
practices.
418. The economic benefit of adopting IPM strategies is one dimension of IPM that is rarely
mentioned in EU IPM programmes and Action Plans. Evidence from US agriculture show that pesticide
expenditures accounted for a growing share of total expenditures of farm production inputs, increasing
from 3-4% in the 1950s to 7-8% in the 1990s (Mullen et al., 2003). Coble and Ortman (2009) state that
cost–benefit analysis of proposed IPM strategies should not be based solely on the monetary costs, but on
four main parameters (i.e. monetary; environmental/ecological health and function; aesthetic benefits; and
human health).
419. Currently the Federal IPM programme is managed by the Federal Integrated Pest Management
Coordinating Committee (FIPMCC), which was formed in 2003, and is composed of representatives of all
federal agencies with IPM research, implementation, or education programmes. As a response to the GAO
criticism, the FIPMCC provides inter-agency guidance on IPM policies, programmes and budgets and a
forum for communication among federal offices with IPM programmes to ensure efficiency of operations.
The committee has been active in defining, prioritising and articulating the goals of the federal IPM effort
through the IPM Road Map, making sure that IPM efforts and resources are focused on the goals, and
ensuring that appropriate measurements towards progress in attaining the goals are in place.
Annex 2. Modern agricultural biotechnology
Types of transgenic traits in commercial cultivation
420. Currently, there are three main types of traits used in commercial cultivation: herbicide tolerance;
insect resistance; and virus resistance. Insect resistant transgenic crops are used as a way of controlling
specific pests. Insect resistant crops have been developed by integrating genes derived from various strains
of a bacterium Bacillus thuringiensis (Bt), which produces toxins that kill certain insect pests, for example,
the European maize borer and the South-western maize borer. Insect resistance genes have been introduced
in maize and cotton.
421. For herbicide-tolerant traits, the insertion of a herbicide tolerance (HT) gene into a plant enables
farmers to spray wide-spectrum herbicides on their fields to control weeds without harming the crop.
COM/TAD/CA/ENV/EPOC(2015)5
95
Herbicide tolerant crops include soybean, maize, rapeseed and cotton. Virus resistance genes have been
introduced in tobacco, potatoes, papaya and squash. Transgenic crops, which involve two or more traits
(e.g. stacked events), have also been developed. The most common stacked events at present are
combinations of HT and insect resistance (e.g. Bt).
422. In addition to this relatively small number of biotech crops which have been commercialised so
far, it is important to note that there is an impressive range of crops and traits in R&D, many of which have
already been in field trials. Many of these are likely to be commercialised in the near future. It takes around
a decade for a new transgenic crop variety to be developed from the field trial stage to commercialisation
(actual commercialisation depends on the time for and outcome of the biosafety regulatory approval). New
genetically modified traits include improved plant nutrient use; altered crop metabolism for industrial
products; abiotic stress tolerance including drought-tolerance, freezing-tolerance and salinity-tolerance;
disease resistance traits; nitrogen use efficiency; and bioremediation capacity. In particular, crops in the
pipeline include soybeans with improved animal nutritional qualities through increase protein and amino
acid content; crops with modified oils, fats and starches to improve processing and digestibility, such as
high stearate canola, and low phytate or low phytic acid maize. The OECD’s Product Database
(http://www2.oecd.org/biotech/) contains information on most transgenic crops which have been approved
for commercial use (planting, and/or food and feed use) in OECD member countries.
Empirical evidence of the effects of biotech crops
Economic effects
423. A study by Klumper and Qaim (2014) performed a meta-analysis approach – on 147 published
biotech crop studies conducted during 1995-2014 worldwide – in order to evaluate the impacts of biotech
crops (soybean, maize or cotton) on yields, pesticide use, and farmer profits. The study found that, on
average, GM technology has reduced chemical pesticide use by 37%; increased crop yields by 22%; and
increased farmer profits by 68%. Impacts vary, especially by modified crop trait and geographic region.
Yield gains and pesticide reductions are larger for IR crops than for HT crops. Yield and farmer profit
gains are higher in developing countries than in developed countries.
424. Hall et al. (2013) performed a systematic literature review approach to review and analyse the
available literature published between 2006-10 on the costs and profits of GM crops in agriculture in
comparison with conventional agriculture. One of the key findings from the review is that, in every case,
planting GM crops as opposed to a non-GM equivalent, resulted in a farm-level economic impact. This
was particularly notable for certain economic variables, namely gross profit and seed costs, but less
significant for other economic variables such as price and energy costs. In some cases the economic impact
was positive for farmers and in other cases it was negative. Generally, the change in gross profit, revenue
and net profit was positive, while the change in seed costs, labour costs and total variable costs was
negative. As price was generally not differentiated, the profit and revenue increases are probably largely
due to increased yield (decreased losses). Economic impact was shown to vary by crop/trait combination,
indicating that treating “GM crops” as one homogenous technology is an unhelpful approach, and that the
impact of each crop/trait combination should be examined individually. Economic impact was also shown
to vary by development status of the country, suggesting that the baseline state of agricultural production at
the time of commercialisation is a key factor influencing economic impact. The change in farm level profit
was least positive in the most developed countries, where net profits were 66% higher for GM crops, while
seed costs were 97% and total variable costs 23% higher for GM crops.
425. Qaim (2009) found that on average (when reviewing 19 studies) the gross margin gains were
higher for Bt cotton than Bt maize, suggesting that farm-level economic impacts from cultivating GM
cotton were likely to be more positive for farmers than cultivating GM maize. Important productivity gains
COM/TAD/CA/ENV/EPOC(2015)5
96
are also reported by Brookes and Barfoot (2013), while Barrows et al. (2014b) estimate the land use
savings of GE cotton, maize and soybean at about 13 million hectares over the period 2000-10.
426. However, when reviewing 49 previous studies, Carpenter (2010) found evidence of a negative
economic impact, resulting from cultivation of GM cotton in a range of countries, including Australia,
China, Colombia, India and South Africa. Similarly, Wang et al. (2008) found that those farmers who had
planted Bt cotton in certain Chinese villages made less money than the farmers who planted conventional
cotton.
427. The collective study of INRA/CNRS experts (Beckert, et al. 2011), reaches a more cautious
conclusion, pointing out that although yields of GMO herbicide resistant crops could be increased in the
early years of adoption, they could be decreased after 5 years. This is partly due to the emergence of
resistance as farmers are obliged to use more toxic herbicides and pay higher prices for seeds than for
conventional seeds. For Bt crops, the yield does not increase. The Union of Concerned Scientists (2009)
study concludes that the overall impact of genetically engineered crops on yields is modest, with no yield
increase for herbicide-tolerant soybeans (the most widely planted biotech crop).
428. Review studies of farm-level impacts have noted considerable variation in both the nature and
scale of impact. For example, the scale of increase in gross margins from cultivating Bt and Ht crops has
been found to vary enormously between countries, from USD 12 per ha in the United States (for maize) to
USD 470 per ha in China (for cotton) (Qaim, 2009). Further inter-country variability has been
demonstrated for GM cotton, with a 12% increase in profits recorded in Mexico, and a 340% increase in
profit recorded in China (Pehu and Ragasa, 2007). Large variability from year to year and region to region
has also been noted by some studies. The more heterogeneous the growing environment, pest pressures,
farmer practices and social context, the more variable are any benefits likely to be.
429. The National Center for Food and Agricultural Policy, which estimated the impacts of nine
transgenic crops in the EU, found that, collectively, these nine transgenic crops have the potential to
increase yields by 8.5 million tonnes per year, increase grower net income by USD 1.6 billion per year and
reduce pesticide use by 0.014 million tonnes per year. Transgenic tomatoes would offer the greatest yield
and grower income increase, while herbicide-tolerant maize would result in the largest reduction in
pesticide use. The largest increase in yields is estimated for transgenic sugarbeet, whereas for glyphosate
tolerant maize, wheat and rice yields would remain unchanged (Gianessi, Sankula and Reigner, 2003).
430. Traxler (2003) found that yields of glyphosate-tolerant soybeans are not significantly different
from yields of conventional soybeans in either the United States or Argentina. A study by USDA (1999a)
reports that while glyphosate-tolerant soybeans appear to have low yields, in some US Midwest regions,
farmers planting Bt maize produced yields that were 26% higher than conventional, non-modified crops.
Brookes (2003) found that the effect of Bt insect-resistant maize yield in Spain varies depending, inter alia,
on location, climatic factors, timing of planting and on whether insecticides are used, with a country
average yield benefit of 6.3%. In Australia, the yield advantage offered by GM rapeseed over non-GM
varieties is estimated to be 12.7% (Foster, 2003), while in Canada it is estimated at 10% (Serecon, et al.,
2001).
Environmental effects
431. Knox et al. (2012) carried out a systematic literature approach to analyse the available literature
published between 2006-10 on the environmental impacts of commercial biotech crops. The database
analysis undertaken indicated that adoption of biotech crops caused a significant increase in the ratio of
environmental change with biotech crops as compared to conventional farming. However, due to the
COM/TAD/CA/ENV/EPOC(2015)5
97
limitations and diversity of the environmental indicators extracted from the articles, it cannot be
ascertained whether this shift represents a beneficial or detrimental environmental change.
432. Brookes and Barfoot (2013), applying the Environmental Impact Quotient (EIQ) indicator –
which includes the impact of pesticides on the environment, farm workers and consumers – to biotech
crops, found that biotech traits have contributed to a significant reduction in the environmental impacts
associated with insecticide and herbicide use on the areas devoted to biotech crops: the use of pesticides on
the biotech crop area was reduced, on average, by 8.9% and the EIQ by 18.3% over the 1996-2011 period.
In absolute terms, the largest decline in pesticide use was associated with biotech herbicide-resistant maize,
followed by biotech-insect resistant cotton, while the largest environmental impact has been associated
with the adoption of biotech insect resistant maize, followed by biotech insect resistant cotton and biotech
herbicide-resistant canola. Overall, the environmental impacts associated with herbicide use were larger
than the decline in their absolute volumes, suggesting a switch to more environmentally benign herbicides
from those generally used on conventional crops. Applying the EIQ to herbicide-resistant soybean varieties
indicates an overall positive environmental impact compared with non-herbicide resistant soybean
varieties.
433. Kleter et al. (2007) calculated that for pesticide applications on conventional versus biotech
rapeseeds in the United States, applications of pesticide active ingredients, total ecological impact per
hectare, ecological impact, and farmer impact were 30, 42, 39, and 54% lower, respectively.
434. Gusta et al. (2011) and Smyth et al. (2011a, 2011b) show that the adoption of herbicide-resistant
canola has changed weed control practices in Canada, where shifts from soil-incorporated- to foliar-
applied post-emergent herbicides have taken place. As a result, the environmental impact of canola
production – based on a modified EIQ – dropped by 59% between 1995 and 2006.
435. Studies published so far on the effects of transgenic plants on agricultural biodiversity indicate
that there is a lack of consensus of the consequences of gene flow and conclude that more data and new
models are needed to analyse the possible long-term unexpected effects of transgenes (Ervin and Welsh,
2005).
436. The US National Research Council has concluded that GM crops in the United States have
brought environmental benefits but “excessive reliance on a single technology combined with a lack of
diverse farming practices could undermine the economic and environmental gains” (NRC, 2010).
437. Wolfenbarger et al. (2008) conducted a meta-analysis on the effects of Bt crops on functional
guilds of non-target arthropods. They could not find uniform negative or positive effects when comparing
Bt crops with their non-GM counterparts, treated without any additional insecticides. Some species-
specific effects have been identified, but when the non-GM counterpart has been controlled with
insecticides, Bt crops exhibited a higher abundance of non-target arthropods. The effect of Bt-maize pollen
on non-target Lepidopetera in Europe has been estimated to be extremely low.
438. Perry et al. (2010) calculated mortality rates in the worst-case scenario of less than one individual
per 1 572 (one per 5 000 at the median) for butterflies and less than one individual per 392 (one per 4 366
at the median) for moths. Comparing this with alternative cultivation practices, they conclude that no
negative environmental impacts of Cry1Ab expressing Bt corn have so far been reported. Álvarez-
Alfageme et al. (2011) point out previous results showing the toxic effect of Cry1Ab and Cry3Bb on
ladybirds feeding on maize; these were not replicable.
439. The Farm-Scale Evaluation study initiated by the government of the United Kingdom compared
biodiversity in fields of glyphosate-tolerant sugarbeet, maize and rapeseed with that in comparable plots of
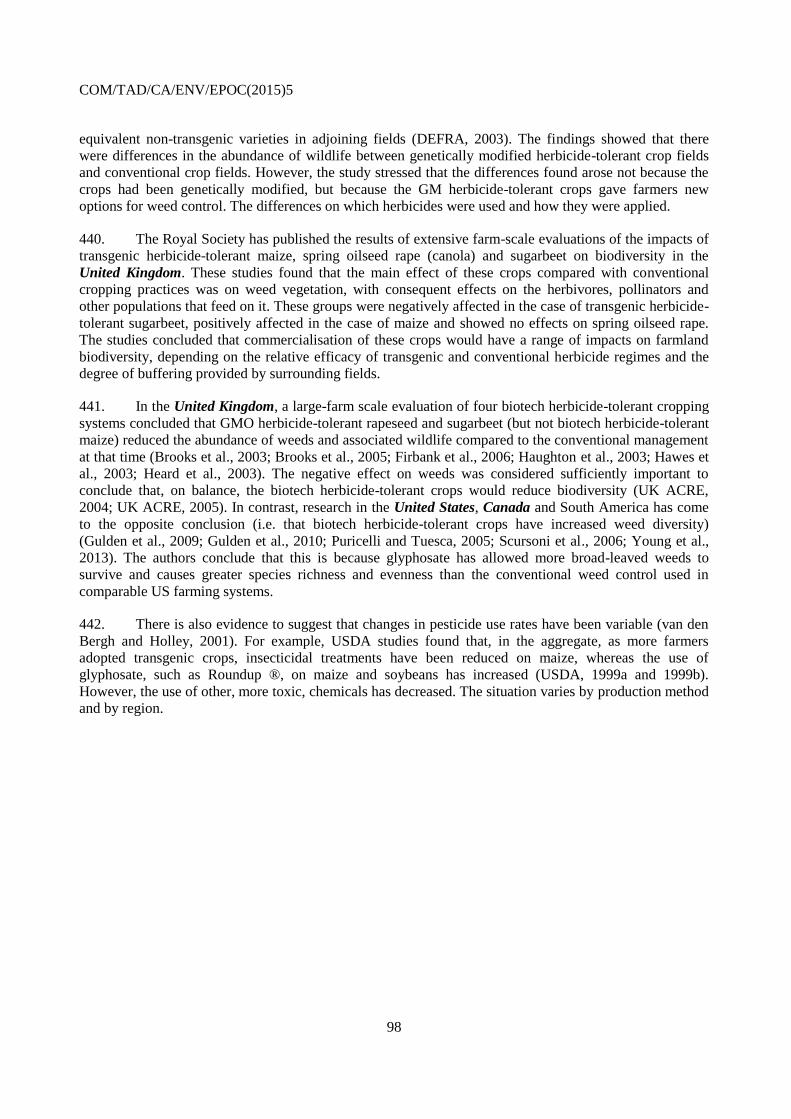
COM/TAD/CA/ENV/EPOC(2015)5
98
equivalent non-transgenic varieties in adjoining fields (DEFRA, 2003). The findings showed that there
were differences in the abundance of wildlife between genetically modified herbicide-tolerant crop fields
and conventional crop fields. However, the study stressed that the differences found arose not because the
crops had been genetically modified, but because the GM herbicide-tolerant crops gave farmers new
options for weed control. The differences on which herbicides were used and how they were applied.
440. The Royal Society has published the results of extensive farm-scale evaluations of the impacts of
transgenic herbicide-tolerant maize, spring oilseed rape (canola) and sugarbeet on biodiversity in the
United Kingdom. These studies found that the main effect of these crops compared with conventional
cropping practices was on weed vegetation, with consequent effects on the herbivores, pollinators and
other populations that feed on it. These groups were negatively affected in the case of transgenic herbicide-
tolerant sugarbeet, positively affected in the case of maize and showed no effects on spring oilseed rape.
The studies concluded that commercialisation of these crops would have a range of impacts on farmland
biodiversity, depending on the relative efficacy of transgenic and conventional herbicide regimes and the
degree of buffering provided by surrounding fields.
441. In the United Kingdom, a large-farm scale evaluation of four biotech herbicide-tolerant cropping
systems concluded that GMO herbicide-tolerant rapeseed and sugarbeet (but not biotech herbicide-tolerant
maize) reduced the abundance of weeds and associated wildlife compared to the conventional management
at that time (Brooks et al., 2003; Brooks et al., 2005; Firbank et al., 2006; Haughton et al., 2003; Hawes et
al., 2003; Heard et al., 2003). The negative effect on weeds was considered sufficiently important to
conclude that, on balance, the biotech herbicide-tolerant crops would reduce biodiversity (UK ACRE,
2004; UK ACRE, 2005). In contrast, research in the United States, Canada and South America has come
to the opposite conclusion (i.e. that biotech herbicide-tolerant crops have increased weed diversity)
(Gulden et al., 2009; Gulden et al., 2010; Puricelli and Tuesca, 2005; Scursoni et al., 2006; Young et al.,
2013). The authors conclude that this is because glyphosate has allowed more broad-leaved weeds to
survive and causes greater species richness and evenness than the conventional weed control used in
comparable US farming systems.
442. There is also evidence to suggest that changes in pesticide use rates have been variable (van den
Bergh and Holley, 2001). For example, USDA studies found that, in the aggregate, as more farmers
adopted transgenic crops, insecticidal treatments have been reduced on maize, whereas the use of
glyphosate, such as Roundup ®, on maize and soybeans has increased (USDA, 1999a and 1999b).
However, the use of other, more toxic, chemicals has decreased. The situation varies by production method
and by region.
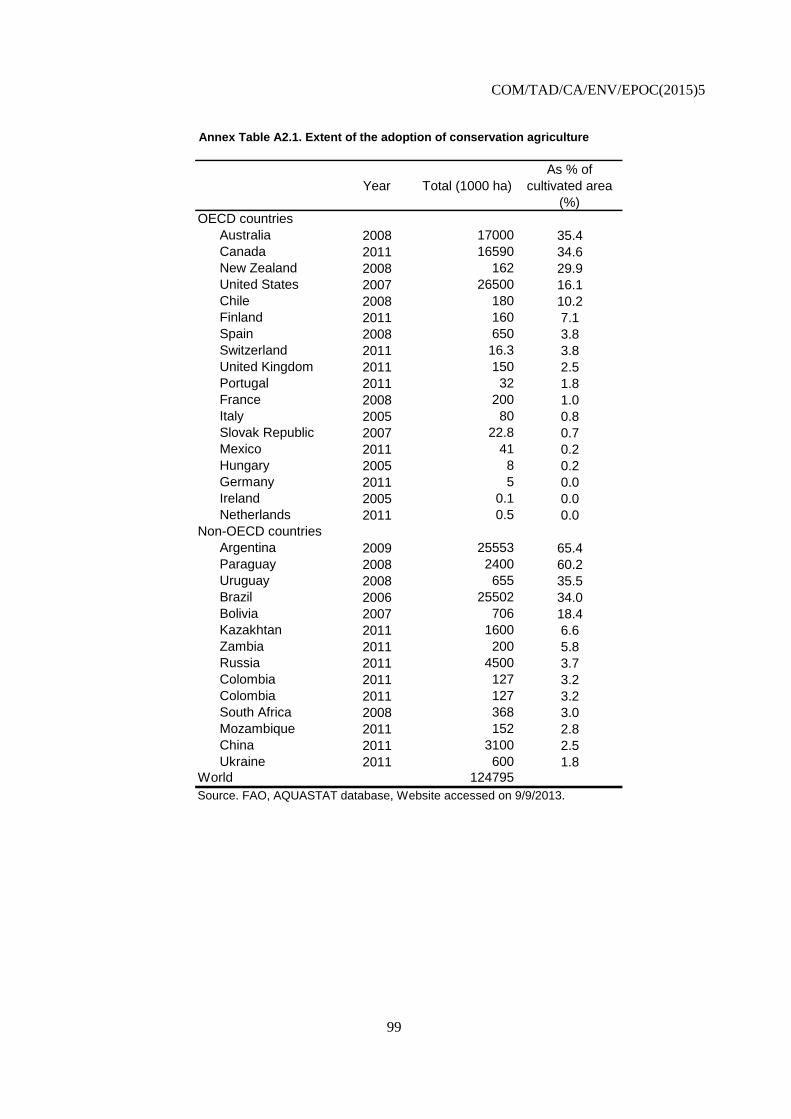
COM/TAD/CA/ENV/EPOC(2015)5
99
Annex Table A2.1. Extent of the adoption of conservation agriculture
Year Total (1000 ha)
As % of
cultivated area
(%)
OECD countries
Australia 2008 17000 35.4
Canada 2011 16590 34.6
New Zealand 2008 162 29.9
United States 2007 26500 16.1
Chile 2008 180 10.2
Finland 2011 160 7.1
Spain 2008 650 3.8
Switzerland 2011 16.3 3.8
United Kingdom 2011 150 2.5
Portugal 2011 32 1.8
France 2008 200 1.0
Italy 2005 80 0.8
Slovak Republic 2007 22.8 0.7
Mexico 2011 41 0.2
Hungary 2005 8 0.2
Germany 2011 5 0.0
Ireland 2005 0.1 0.0
Netherlands 2011 0.5 0.0
Non-OECD countries
Argentina 2009 25553 65.4
Paraguay 2008 2400 60.2
Uruguay 2008 655 35.5
Brazil 2006 25502 34.0
Bolivia 2007 706 18.4
Kazakhtan 2011 1600 6.6
Zambia 2011 200 5.8
Russia 2011 4500 3.7
Colombia 2011 127 3.2
Colombia 2011 127 3.2
South Africa 2008 368 3.0
Mozambique 2011 152 2.8
China 2011 3100 2.5
Ukraine 2011 600 1.8World 124795
Source. FAO, AQUASTAT database, Website accessed on 9/9/2013.
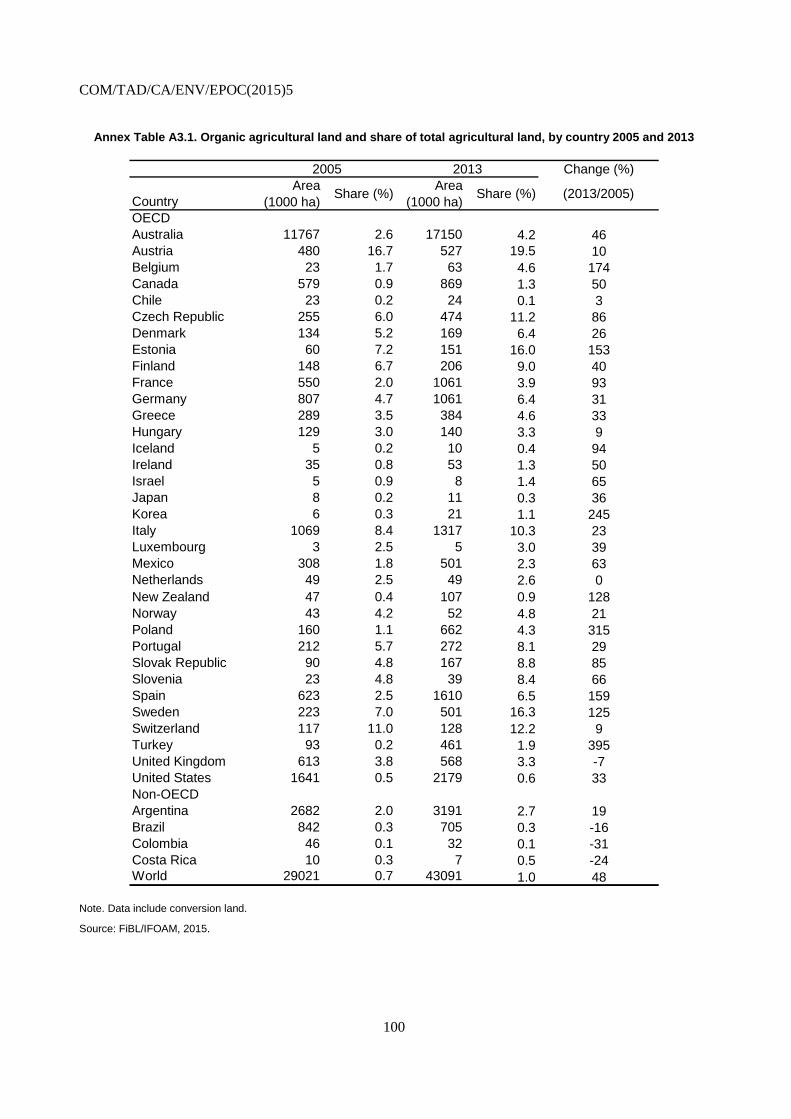
COM/TAD/CA/ENV/EPOC(2015)5
100
Annex Table A3.1. Organic agricultural land and share of total agricultural land, by country 2005 and 2013
Note. Data include conversion land.
Source: FiBL/IFOAM, 2015.
2005 2013 Change (%)
Country
Area
(1000 ha)Share (%)
Area
(1000 ha)Share (%) (2013/2005)
OECD
Australia 11767 2.6 17150 4.2 46
Austria 480 16.7 527 19.5 10
Belgium 23 1.7 63 4.6 174
Canada 579 0.9 869 1.3 50
Chile 23 0.2 24 0.1 3
Czech Republic 255 6.0 474 11.2 86
Denmark 134 5.2 169 6.4 26
Estonia 60 7.2 151 16.0 153
Finland 148 6.7 206 9.0 40
France 550 2.0 1061 3.9 93
Germany 807 4.7 1061 6.4 31
Greece 289 3.5 384 4.6 33
Hungary 129 3.0 140 3.3 9
Iceland 5 0.2 10 0.4 94
Ireland 35 0.8 53 1.3 50
Israel 5 0.9 8 1.4 65
Japan 8 0.2 11 0.3 36
Korea 6 0.3 21 1.1 245
Italy 1069 8.4 1317 10.3 23
Luxembourg 3 2.5 5 3.0 39
Mexico 308 1.8 501 2.3 63
Netherlands 49 2.5 49 2.6 0
New Zealand 47 0.4 107 0.9 128
Norway 43 4.2 52 4.8 21
Poland 160 1.1 662 4.3 315
Portugal 212 5.7 272 8.1 29
Slovak Republic 90 4.8 167 8.8 85
Slovenia 23 4.8 39 8.4 66
Spain 623 2.5 1610 6.5 159
Sweden 223 7.0 501 16.3 125
Switzerland 117 11.0 128 12.2 9
Turkey 93 0.2 461 1.9 395
United Kingdom 613 3.8 568 3.3 -7
United States 1641 0.5 2179 0.6 33
Non-OECD
Argentina 2682 2.0 3191 2.7 19
Brazil 842 0.3 705 0.3 -16
Colombia 46 0.1 32 0.1 -31
Costa Rica 10 0.3 7 0.5 -24World 29021 0.7 43091 1.0 48
COM/TAD/CA/ENV/EPOC(2015)5
101
Annex Figure A5.1. Global area of biotech crops, by country, crop and trait, 2014 (%)
Source. James (2015), Global status of commercialized biotech/GM crops: 2014, ISAA Brief 49-2015.
United States40%
Brazil23%
Argentine14%
India6%
Canada6%
Other11%
Soybeans48%
Maize33%
Cotton14%
Canola5%
Herbicide tolerant
crops (HT)56%
Insect resistant crops (IR)
16%
Stacked28%
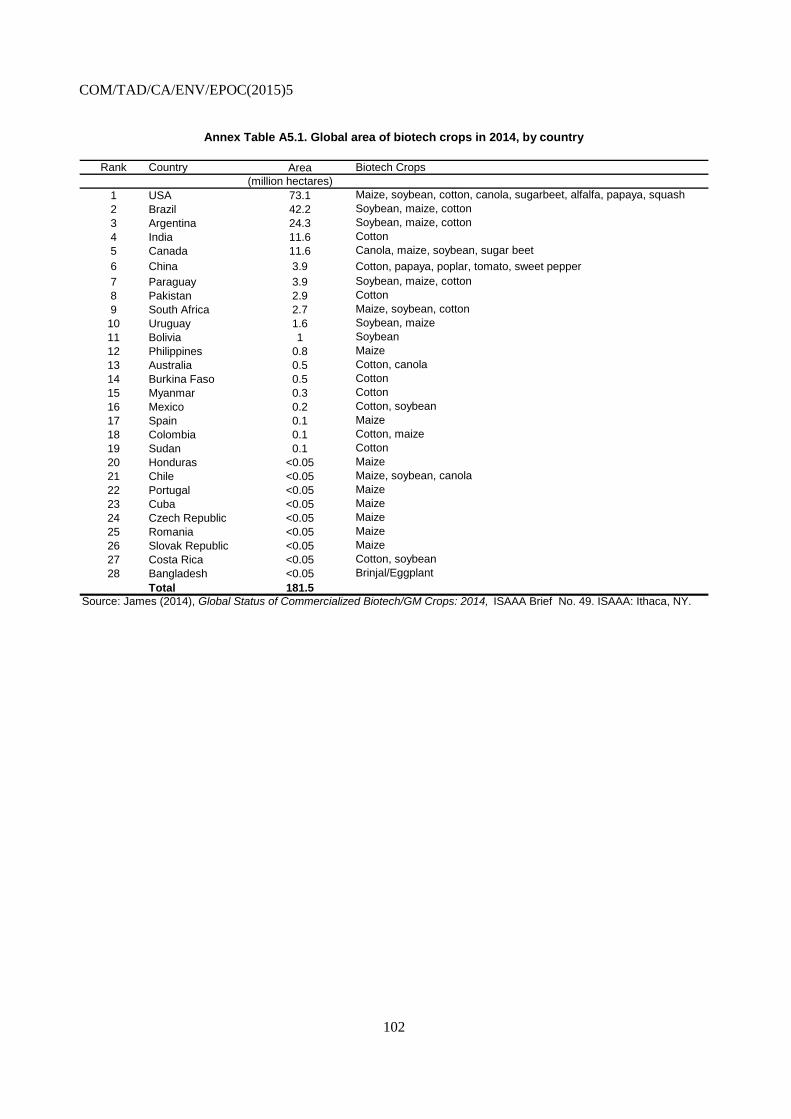
COM/TAD/CA/ENV/EPOC(2015)5
102
Annex Table A5.1. Global area of biotech crops in 2014, by country
Rank Country Area Biotech Crops
(million hectares)
1 USA 73.1 Maize, soybean, cotton, canola, sugarbeet, alfalfa, papaya, squash
2 Brazil 42.2 Soybean, maize, cotton
3 Argentina 24.3 Soybean, maize, cotton
4 India 11.6 Cotton
5 Canada 11.6 Canola, maize, soybean, sugar beet
6 China 3.9 Cotton, papaya, poplar, tomato, sweet pepper
7 Paraguay 3.9 Soybean, maize, cotton
8 Pakistan 2.9 Cotton
9 South Africa 2.7 Maize, soybean, cotton
10 Uruguay 1.6 Soybean, maize
11 Bolivia 1 Soybean
12 Philippines 0.8 Maize
13 Australia 0.5 Cotton, canola
14 Burkina Faso 0.5 Cotton
15 Myanmar 0.3 Cotton
16 Mexico 0.2 Cotton, soybean
17 Spain 0.1 Maize
18 Colombia 0.1 Cotton, maize
19 Sudan 0.1 Cotton
20 Honduras <0.05 Maize
21 Chile <0.05 Maize, soybean, canola
22 Portugal <0.05 Maize
23 Cuba <0.05 Maize
24 Czech Republic <0.05 Maize
25 Romania <0.05 Maize
26 Slovak Republic <0.05 Maize
27 Costa Rica <0.05 Cotton, soybean
28 Bangladesh <0.05 Brinjal/Eggplant
Total 181.5
Source: James (2014), Global Status of Commercialized Biotech/GM Crops: 2014, ISAAA Brief No. 49. ISAAA: Ithaca, NY.
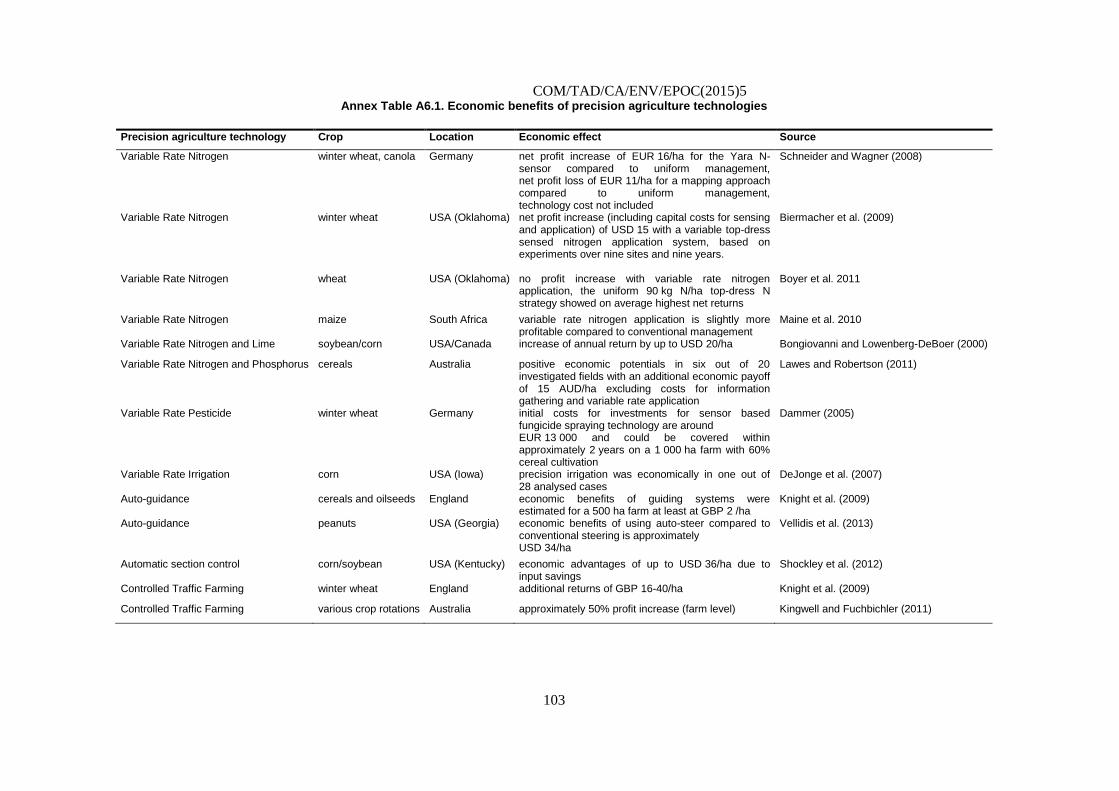
COM/TAD/CA/ENV/EPOC(2015)5
103
Annex Table A6.1. Economic benefits of precision agriculture technologies
Precision agriculture technology Crop Location Economic effect Source
Variable Rate Nitrogen winter wheat, canola Germany net profit increase of EUR 16/ha for the Yara N-sensor compared to uniform management, net profit loss of EUR 11/ha for a mapping approach compared to uniform management, technology cost not included
Schneider and Wagner (2008)
Variable Rate Nitrogen winter wheat USA (Oklahoma) net profit increase (including capital costs for sensing and application) of USD 15 with a variable top-dress sensed nitrogen application system, based on experiments over nine sites and nine years.
Biermacher et al. (2009)
Variable Rate Nitrogen wheat USA (Oklahoma) no profit increase with variable rate nitrogen application, the uniform 90 kg N/ha top-dress N strategy showed on average highest net returns
Boyer et al. 2011
Variable Rate Nitrogen maize South Africa variable rate nitrogen application is slightly more profitable compared to conventional management
Maine et al. 2010
Variable Rate Nitrogen and Lime soybean/corn USA/Canada increase of annual return by up to USD 20/ha Bongiovanni and Lowenberg-DeBoer (2000)
Variable Rate Nitrogen and Phosphorus cereals Australia positive economic potentials in six out of 20 investigated fields with an additional economic payoff of 15 AUD/ha excluding costs for information gathering and variable rate application
Lawes and Robertson (2011)
Variable Rate Pesticide winter wheat Germany initial costs for investments for sensor based fungicide spraying technology are around EUR 13 000 and could be covered within approximately 2 years on a 1 000 ha farm with 60% cereal cultivation
Dammer (2005)
Variable Rate Irrigation corn USA (Iowa) precision irrigation was economically in one out of 28 analysed cases
DeJonge et al. (2007)
Auto-guidance cereals and oilseeds England economic benefits of guiding systems were estimated for a 500 ha farm at least at GBP 2 /ha
Knight et al. (2009)
Auto-guidance peanuts USA (Georgia) economic benefits of using auto-steer compared to conventional steering is approximately USD 34/ha
Vellidis et al. (2013)
Automatic section control corn/soybean USA (Kentucky) economic advantages of up to USD 36/ha due to input savings
Shockley et al. (2012)
Controlled Traffic Farming winter wheat England additional returns of GBP 16-40/ha Knight et al. (2009)
Controlled Traffic Farming various crop rotations Australia approximately 50% profit increase (farm level) Kingwell and Fuchbichler (2011)
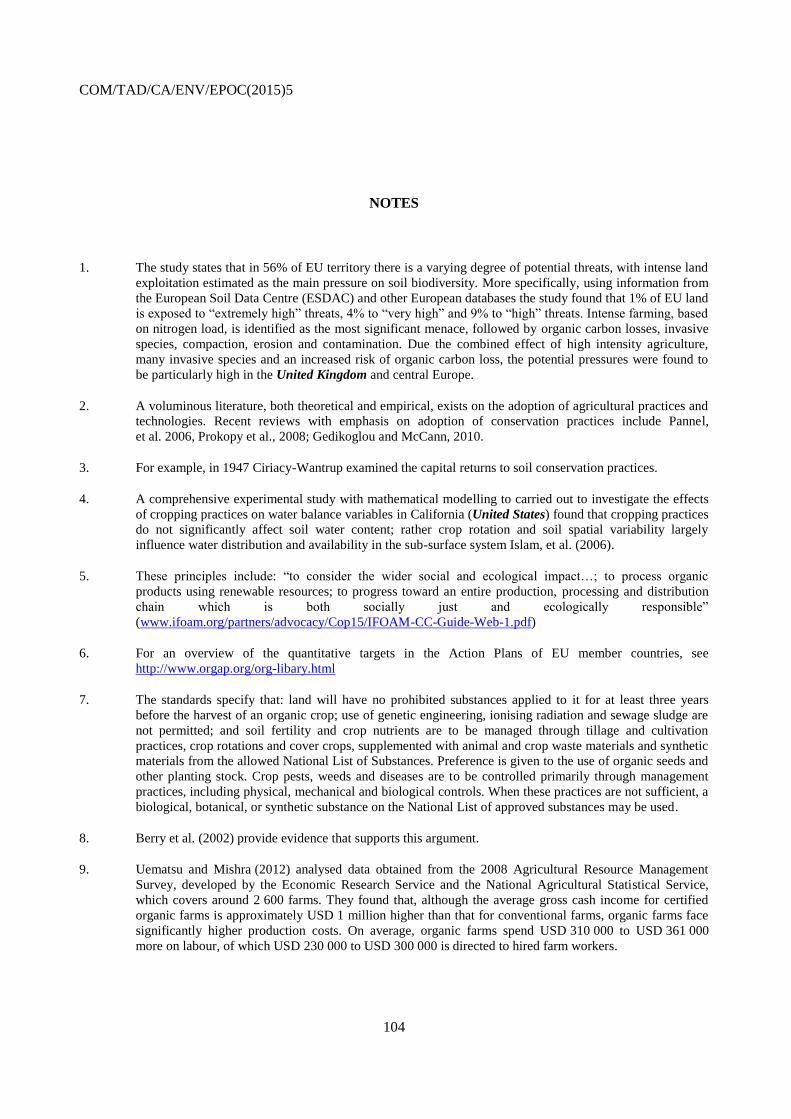
COM/TAD/CA/ENV/EPOC(2015)5
104
NOTES
1. The study states that in 56% of EU territory there is a varying degree of potential threats, with intense land
exploitation estimated as the main pressure on soil biodiversity. More specifically, using information from
the European Soil Data Centre (ESDAC) and other European databases the study found that 1% of EU land
is exposed to “extremely high” threats, 4% to “very high” and 9% to “high” threats. Intense farming, based
on nitrogen load, is identified as the most significant menace, followed by organic carbon losses, invasive
species, compaction, erosion and contamination. Due the combined effect of high intensity agriculture,
many invasive species and an increased risk of organic carbon loss, the potential pressures were found to
be particularly high in the United Kingdom and central Europe.
2. A voluminous literature, both theoretical and empirical, exists on the adoption of agricultural practices and
technologies. Recent reviews with emphasis on adoption of conservation practices include Pannel,
et al. 2006, Prokopy et al., 2008; Gedikoglou and McCann, 2010.
3. For example, in 1947 Ciriacy-Wantrup examined the capital returns to soil conservation practices.
4. A comprehensive experimental study with mathematical modelling to carried out to investigate the effects
of cropping practices on water balance variables in California (United States) found that cropping practices
do not significantly affect soil water content; rather crop rotation and soil spatial variability largely
influence water distribution and availability in the sub-surface system Islam, et al. (2006).
5. These principles include: “to consider the wider social and ecological impact…; to process organic
products using renewable resources; to progress toward an entire production, processing and distribution
chain which is both socially just and ecologically responsible”
(www.ifoam.org/partners/advocacy/Cop15/IFOAM-CC-Guide-Web-1.pdf)
6. For an overview of the quantitative targets in the Action Plans of EU member countries, see
http://www.orgap.org/org-libary.html
7. The standards specify that: land will have no prohibited substances applied to it for at least three years
before the harvest of an organic crop; use of genetic engineering, ionising radiation and sewage sludge are
not permitted; and soil fertility and crop nutrients are to be managed through tillage and cultivation
practices, crop rotations and cover crops, supplemented with animal and crop waste materials and synthetic
materials from the allowed National List of Substances. Preference is given to the use of organic seeds and
other planting stock. Crop pests, weeds and diseases are to be controlled primarily through management
practices, including physical, mechanical and biological controls. When these practices are not sufficient, a
biological, botanical, or synthetic substance on the National List of approved substances may be used.
8. Berry et al. (2002) provide evidence that supports this argument.
9. Uematsu and Mishra (2012) analysed data obtained from the 2008 Agricultural Resource Management
Survey, developed by the Economic Research Service and the National Agricultural Statistical Service,
which covers around 2 600 farms. They found that, although the average gross cash income for certified
organic farms is approximately USD 1 million higher than that for conventional farms, organic farms face
significantly higher production costs. On average, organic farms spend USD 310 000 to USD 361 000
more on labour, of which USD 230 000 to USD 300 000 is directed to hired farm workers.
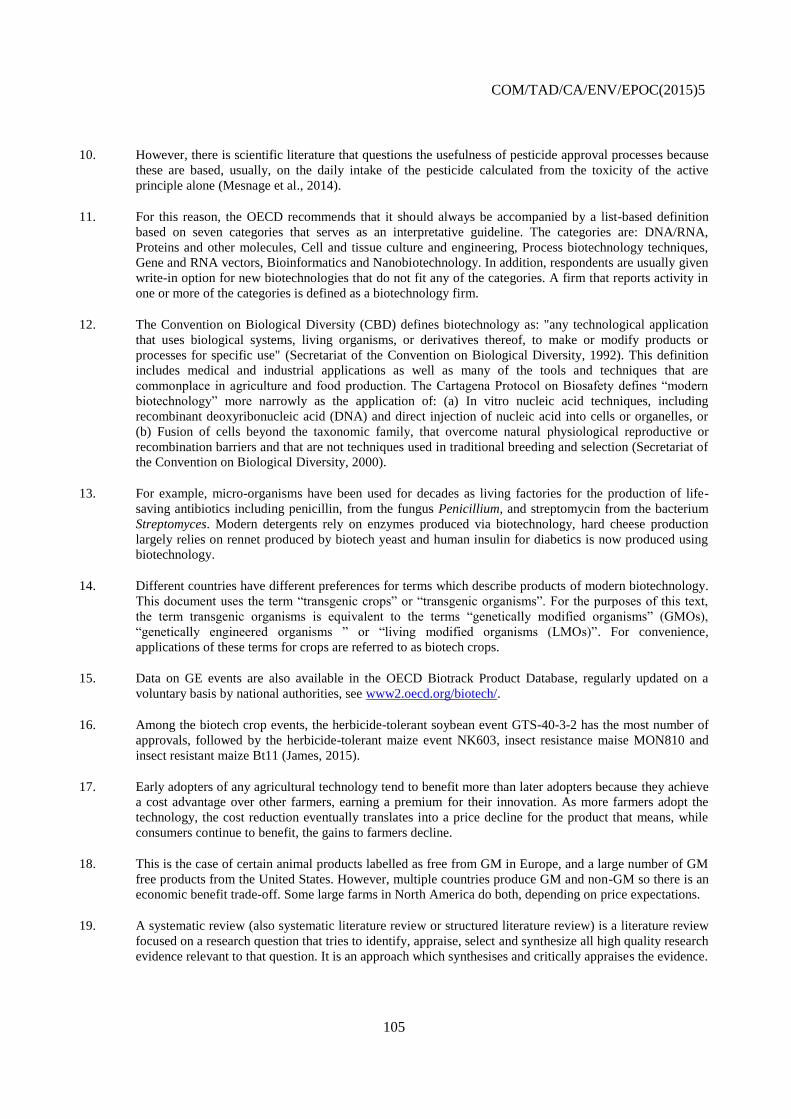
COM/TAD/CA/ENV/EPOC(2015)5
105
10. However, there is scientific literature that questions the usefulness of pesticide approval processes because
these are based, usually, on the daily intake of the pesticide calculated from the toxicity of the active
principle alone (Mesnage et al., 2014).
11. For this reason, the OECD recommends that it should always be accompanied by a list-based definition
based on seven categories that serves as an interpretative guideline. The categories are: DNA/RNA,
Proteins and other molecules, Cell and tissue culture and engineering, Process biotechnology techniques,
Gene and RNA vectors, Bioinformatics and Nanobiotechnology. In addition, respondents are usually given
write-in option for new biotechnologies that do not fit any of the categories. A firm that reports activity in
one or more of the categories is defined as a biotechnology firm.
12. The Convention on Biological Diversity (CBD) defines biotechnology as: "any technological application
that uses biological systems, living organisms, or derivatives thereof, to make or modify products or
processes for specific use" (Secretariat of the Convention on Biological Diversity, 1992). This definition
includes medical and industrial applications as well as many of the tools and techniques that are
commonplace in agriculture and food production. The Cartagena Protocol on Biosafety defines “modern
biotechnology” more narrowly as the application of: (a) In vitro nucleic acid techniques, including
recombinant deoxyribonucleic acid (DNA) and direct injection of nucleic acid into cells or organelles, or
(b) Fusion of cells beyond the taxonomic family, that overcome natural physiological reproductive or
recombination barriers and that are not techniques used in traditional breeding and selection (Secretariat of
the Convention on Biological Diversity, 2000).
13. For example, micro-organisms have been used for decades as living factories for the production of life-
saving antibiotics including penicillin, from the fungus Penicillium, and streptomycin from the bacterium
Streptomyces. Modern detergents rely on enzymes produced via biotechnology, hard cheese production
largely relies on rennet produced by biotech yeast and human insulin for diabetics is now produced using
biotechnology.
14. Different countries have different preferences for terms which describe products of modern biotechnology.
This document uses the term “transgenic crops” or “transgenic organisms”. For the purposes of this text,
the term transgenic organisms is equivalent to the terms “genetically modified organisms” (GMOs),
“genetically engineered organisms ” or “living modified organisms (LMOs)”. For convenience,
applications of these terms for crops are referred to as biotech crops.
15. Data on GE events are also available in the OECD Biotrack Product Database, regularly updated on a
voluntary basis by national authorities, see www2.oecd.org/biotech/.
16. Among the biotech crop events, the herbicide-tolerant soybean event GTS-40-3-2 has the most number of
approvals, followed by the herbicide-tolerant maize event NK603, insect resistance maise MON810 and
insect resistant maize Bt11 (James, 2015).
17. Early adopters of any agricultural technology tend to benefit more than later adopters because they achieve
a cost advantage over other farmers, earning a premium for their innovation. As more farmers adopt the
technology, the cost reduction eventually translates into a price decline for the product that means, while
consumers continue to benefit, the gains to farmers decline.
18. This is the case of certain animal products labelled as free from GM in Europe, and a large number of GM
free products from the United States. However, multiple countries produce GM and non-GM so there is an
economic benefit trade-off. Some large farms in North America do both, depending on price expectations.
19. A systematic review (also systematic literature review or structured literature review) is a literature review
focused on a research question that tries to identify, appraise, select and synthesize all high quality research
evidence relevant to that question. It is an approach which synthesises and critically appraises the evidence.
COM/TAD/CA/ENV/EPOC(2015)5
106
20. See for example, Royal Society, 1998; Ervin, et al., 2000; Fernandez-Cornejo and McBride, 2002;
Wolfenbarger and Phifer, 2000; Kleter and Kuiper, 2005.
21. However, there is also some recent evidence that suggests that glyphosate may actually have a higher
environmental toxicity than previously considered and that its environmental risk rating should be revised
(FoEE, 2013; Helander et al., 2012).
22. Risk management specifications are mandatory for biotech insect-resistant crops, but not for herbicide-
tolerant crops. As a result, rigorous resistance management measures and monitoring have been required
for insect-resistant biotech crops (particularly Bt maize and Bt cotton) since the first approvals. In contrast,
the evolution of herbicide-resistant weeds is now posing problems for biotech herbicide-resistant crops in
the United States, Argentina, Paraguay and Brazil. The consequences for biodiversity derive from the
increased use of herbicides to control resistant weeds that are more toxic and/or more persistent in the
environment than glyphosate, such as 2,4-D or dicamba, and/or increases in glyphosate applications
(Brookes and Barfoot, 2013).
23. The two most common herbicides are Roundup Ready, with the effective chemical glyphosate and
BASTA, with the effective chemical glufosinate (Wolfenbarger and Phifer, 2000).
24. CTF methods involve confining all field vehicles to the minimal area of permanent traffic lanes with the
aid of GNSS technology and decision support systems.
25. The growing interest in Europe in the CTF technology is reflected in the creation of an European
association aiming at fostering its development (www.controlledtrafficfarming.com).
26. An example is PA methods in viticulture, where grape quality assessment and yield maps obtained from
remote sensing and field instruments avoid mixing grapes of different potential quality during harvest.
27. Data source: ABS ARMS survey. Number of agricultural businesses using controlled traffic farming.
28. This means that even quite large deviations from optimal management decisions of inputs (e.g.
nitrogen) may make little absolute difference to the expected payoff. In other words, the payoff
function is flat near the optimum, often over quite a wide range (Pannel, 2006).
COM/TAD/CA/ENV/EPOC(2015)5
107
REFERENCES
Chapter 1. Investigating farm management practices that may foster green growth
OECD (2014), Green Growth Indicators for Agriculture: A Preliminary Assessment, OECD Green Growth
Studies, OECD Publishing, Paris, http://dx.doi.org/10.1787/978926423202-en.
Chapter 2. Analysing soil and water conservation practices to accelerate the transition to green
growth
Al-Kaisi, M.M. and X. Yin (2004), “Stepwise time response of corn yield and economic return to no
tillage”, Soil Tillage Research, Vol. 78, pp. 91-101.
Alvarez, R. and H.S. Steinbach (2009), “A review of the effects of tillage systems on some soil physical
properties, water content, nitrate availability and crops yield in the Argentine Pampas”, Soil &
Tillage Research, Vol. 104, No. 1, pp. 1–15.
Anderson, G. (2009), The Impact of tillage practices and crop residue (stubble) retention in the cropping
system of Western Australia, Bulletin Number 4786, Western Australian Government.
Armstrong, R.D., G. Millar, N. Halpin, D. Reid and J. Standley (2003), “Using zero tillage, fertilisers and
legume rotations to maintain productivity and soil fertility in opportunity cropping systems on a
shallow Vertosol”, Australian Journal of Experimental Agriculture, Vol. 43, No. 2, pp. 141-53.
Arora, K., S.K. Mickelson and J.L. Baker (2003), “Effectiveness of vegetated buffer strips in reducing
pesticide transport in simulated runoff”, Transactions of the ASAE, Vol. 46, No. 3, pp. 635–44.
Bailey, K.L. (1996), “Diseases under conservation tillage systems”, Canadian Journal of Plant Science,
Vol. 76, No. 4.
Baker, J., T. Ochsner, R. Venterea and T. Griffis (2007), “Tillage and soil carbon sequestration—What do
we really know?”, Agriculture, Ecosystems and Environment Vol. 118, pp. 1-5.
Barbier, E.B. (1990), “The Farm-Level Economics of Soil Conservation: The Uplands of Java”, Land
Economics, Vol. 66, No. 2, pp. 199-211.
Batte, M.T. (1999), “Precision Farming - Factors Influencing Profitability”, Northern Ohio Crops Day
meeting, Wood County, Ohio, 21 January: http://aede.osu.edu/sites/drupal-
aede.web/files/PrecisionFarming.pdf
Berck, P., S. Robinson and G. Goldman (1991), “The use of computable general equilibrium models to
assess water policies” in Dinar, A. and D. Zilberman (eds), The Economics and Management of
Water and Drainage in Agriculture, Boston: Kluwer Academic Publishers, pp. 489-509.
Blanco-Canqui, H. and R. Lal (2008), “No-Tillage and Soil-Profile Carbon Sequestration: An On-Farm
Assessment,” Soil Science Society of America Journal, Vol. 72, No. 3.
COM/TAD/CA/ENV/EPOC(2015)5
108
Blevins, R.L., G.W. Thomas, M.S. Smith, W.W. Frye and P.L. Cornelius (1983), “Changes in soil
properties after 10 years of continuous no-tilled and conventionally tilled corn”, Soil & Tillage
Research, Vol. 3, pp. 135-46.
Bloomer, D. and J. Powrie (2011), “Precision Agriculture: Doing the right thing in the right place at the
right time”, in Bloomer, D. and J. Powrie (eds), A Guide to Smart Farming, Landwise, Feilding,
New Zealand.
Boddey, R.M., C.P. Jantalia, B. Alves and S. Urquiaga (2009), “Comments on ‘No-Tillage and Soil-Profile
Carbon Sequestration: An On-Farm Assessment’”, Soil Science Society of America Journal, Vol. 73,
No. 2.
Branson, M. (2011), “Using Conservation Agriculture to improve water use efficiency in wheat crops on
the Branson farm in South Australia”, 5th World Congress of Conservation Agriculture
incorporating 3rd Farming Systems Design Conference - Resilient Food Systems for a Changing
World, Brisbane.
Butler, G. (ed.) (2008), Conservation Agriculture: Moving Beyond Adoption, SANTFA, Clare, South
Australia.
Chan, K.Y., D. Heenan and H.B. So (2003), “Sequestration of carbon and changes in soil quality under
conservation tillage on light-textured soils in Australia: a review”, Australian Journal of
Experimental Agriculture, Vol. 43, No. 4.
Ciriacy-Wantrup, S.V. (1947), “Capital returns to soil conservation practices”, Journal of Farm Economics,
Vol. 29, No. 4, pp. 1,181-96.
Commission of the European Communities (2006), “Proposal for a Directive of the European Parliament
and the Council establishing a framework for the protection of soil and amending Directive
2004/35/EC”, COM(2006) 232 final.
Commonwealth Scientific and Industrial Research Organisation (CSIRO) (2009), Identification of areas
within Australia with the potential to enhance soil carbon content, by Baldock, J., M. Grundy,
P. Wilson, D. Jacquier, T. Griffin, G. Chapman, J. Hall, D. Machmet, D. Crawford, J. Hill and
J. Kidd, CSIRO.
Corsi, S., T. Friedrich, A. Kassam, M. Pisante and João de Moraes Sà (2012), Soil Organic Carbon
Accumulation and Greenhouse Gas Emission Reductions from Conservation Agriculture:
A Literature Review, Integrated Crop Management, Vol. 16, Food and Agriculture Organization of
the United Nations (FAO), Rome.
D’Emden, F.H., R.S. Llewellyn and M.P. Burton (2008), “Factors Influencing Adoption of Conservation
Tillage in Australian Cropping Regions”, Australian Journal of Agricultural and Resource
Economics, Vol. 52, No. 2, pp. 169-82.
Das, R. and S. Bauer (2012), “Bio-economic analysis of soil conservation technologies in the mid-hill
region of Nepal”, Soil & Tillage Research, Vol. 121, pp. 38-48.
Eaton, D. (1996), “The Economics of soil erosion: A model of farm decision-making”, Environmental
Economics Programme, Pennsylvania State University, Discussion Paper DP 96-01, available at:
citeseerx.ist.psu.edu/viewdoc/download?doi=10.1.1.198.6507.pdf
COM/TAD/CA/ENV/EPOC(2015)5
109
Ebel, R. (2012), “Soil Management and Conservation”, in Osteen, C., J. Gottlieb and U. Vasavada (eds),
“Agricultural Resources and Environmental Indicators, 2012 Edition”, U.S. Department of
Agriculture, Economic Research Service, Economic Information Bulletin, Number 98,
Washington, D.C.
Eve, M., M. Sperow, K. Howerton, K. Paustian and R. Follett (2002), “Predicted impact of management
changes on soil carbon storage for each cropland region of the coterminous United States,” Journal
of Soil and Water Conservation, Vol. 57.
Foley, J., et al. (2010), “Solutions for a cultivated planet”, Nature, Vol. 478, pp. 337-42,
doi:10.1038/nature10452.
Franzluebbers, A.J. (2009), “Comments on ‘No-Tillage and Soil-Profile Carbon Sequestration: An On-
Farm Assessment”, Soil Science Society of America Journal, Vol. 73, No. 2.
Friedrich, T., R. Derpsch and A. Kassam (2012), “Overview of the Global Spread of Conservation
Agriculture”, Field Actions Science Reports, Special Issue 6, http://factsreports.revues.org/1941
Gardi, C., S. Jeffery and A. Salteli (2013), “An Estimate of Potential Threats levels to Soil Biodiversity in
EU”, Global Change Biology, Vol. 19, doi: 10.1111/gcb.12159.
Gruhn, P., F. Goletti and M. Yudelman (2000), Integrated Nutrient Management, Soil Fertility, and
Sustainable Agriculture: Current Issues and Future Challenges, International Food Policy Research
Institute, Washington, D.C.
Hassall, G. (2010), The Implication of Greenhouse Mitigation Policies on the Demand for Agricultural
land - Research Report, Australian Farm Institute, Surry Hills, Australia.
He, J., N. Kuhn, X.M. Zhang, X.R. Zhang and H. Li (2009), “Effects of 10 years of conservation tillage on
soil properties and productivity in the farming-pastoral ecotone of Inner Mongolia, China”, Soil Use
and Management, Vol. 25, No. 2, pp. 201–09, doi: 10.1111/j.1475-2743.2009.00210.x.
Hobbs, P.R. and R.K. Gupta (2004), “Problems and challenges of no-till farming for the rice-wheat
systems of the Indo-Gangetic Plains in South Asia”, in Lal, R., P. Hobbs, N. Uphoff and
D.O. Hansen (eds), Sustainable agriculture and the rice–wheat system, Paper 6, pp. 101–19,
Columbus, OH; New York: NY: Ohio State University; Marcel Dekker, Inc.
Hobbs, P., K. Sayre and R. Gupta (2008), “The role of conservation agriculture in sustainable agriculture”,
Philosophical Transactions of the Royal Society, Vol. 363, pp. 543-55, series B, Biological Sciences.
Horowitz, J., R. Ebel and K. Ueda (2010), “‘No-till’ Farming is a growing Practice”, U. S. Department of
Agriculture, Economic Research Service, Economic Information Bulletin, Number 70,
Washington, D.C.
Islam, N., W. Wallender, J. Mitchell, S. Wicks and R. Howitt (2006), “A comprehensive experimental
study with mathematical modeling to investigate the affects of cropping practices on water balance
variables”, Agricultural Water Management, Vol. 82.
Lahmar, R. (2010), “Adoption of conservation agriculture in Europe: Lessons of the KASSA project”,
Land Use Policy, Vol. 27, No. 1, pp. 4-10.
COM/TAD/CA/ENV/EPOC(2015)5
110
Lal, R., J.M. Kimble, R.F. Follett and C.V. Cole (1998), The Potential of U.S. Croplands to Sequester
Carbon and Mitigate the Greenhouse Effect, Ann Arbor Press, Ann Arbor, Michigan.
Lee, D.R., C.B. Barrett and J.G. McPeak (2006), “Policy, technology, and management strategies for
achieving sustainable agricultural intensification”, Agricultural Economics, Vol. 34, pp. 123-27.
Li, H., H. Gao, H. Wu, W. Li, X. Wang and J. He (2007), “Effects of 15 years of conservation tillage on
soil structure and productivity of wheat cultivation in northern China”, Soil Research, Vol. 45,
No. 5, pp. 344–50: doi:10.1071/SR07003.
Li, Y.X., J.N. Tullberg and D.M. Freebairn (2007), “Wheel traffic and tillage effects on runoff and crop
yield”, Soil & Tillage Research, Vol. 97, No. 2.
Liu, D.L., K.Y. Chan and M. Conyers (2009), “Simulation of soil organic carbon under different tillage
and stubble management practices using the Rothamsted carbon model”, Soil & Tillage Research,
Vol. 104.
Llewellyn, R., F. Demden and D. Gobbett (2009), Adoption of no-till and conservation farming practices
in Australian grain growing regions: current status and trends, CSIRO, Glen Osmond SA.
Loke, P.F., E. Kotzé and C.C. DuPreez (2012), “Changes in soil organic matter indices following 32 years
of different wheat production management practices in semi-arid South Africa”, Nutrient Cycle
Agroecosystems, Vol. 94, pp. 97-109, doi: 10.1007/s10705-012-9529-6.
Luo, Z.K., E.L. Wang and O.J. Sun (2010), “Soil carbon change and its responses to agricultural practices
in Australian agro-ecosystems: A review and synthesis”, Geoderma, Vol. 155, Nos. 3-4.
McConnell, K.E. (1983), “An Economic Model of Soil Conservation”, American Journal of Agricultural
Economics, Vol. 65, No. 1, pp. 83-89.
Malinda, D.K. (1995), “Factors in conservation farming that reduce erosion”, Australian Journal of
Experimental Agriculture, Vol. 35, No. 7.
Minnesota Department of Agriculture (2012), “Definitions and information on conservation tillage
practices”, www.mda.state.mn.us/home.aspx.
Moser, C.M. and C.B. Barrett (2003), “The disappointing adoption dynamics of a yield-increasing, low
external-input technology: the case of SRI in Madagascar”, Agricultural Systems, Vol. 76,
pp. 1,085-100.
Moss, B. (2008), “Water pollution by agriculture”, Philosophical Transactions of the Royal Society,
London, Series B, 363, 659-66, doi:10.1098/rstb.2007.2176.
Moussa-Machraouia, S., F. Errouissib, M. Ben-Hammoudaa and S. Nouirab (2010), “Comparative effects
of conventional and no-tillage management on some soil properties under Mediterranean semi-arid
conditions in northwestern Tunisia”, Soil & Tillage Research, Vol. 106, No. 2, pp. 247-53,
doi:10.1016/j.still.2009.10.009.
Neill, S.P. and D.R. Lee (2001), “Explaining the adoption and dis-adoption of sustainable agriculture: the
case of cover crops in Northern Honduras”, Economic Development and Cultural Change, Vol. 49,
No. 4, pp. 793-820.
COM/TAD/CA/ENV/EPOC(2015)5
111
OECD (2006), Water and Agriculture: Sustainability, Markets and Policies, OECD Publishing, Paris.
Pannell, D., G. Marshall, N. Barr, A. Curtis, F. Vanclay and R. Wilkinson (2006), “Understanding and
Promoting Adoption of Conservation Practices by Rural Landholders,” Australian Journal of
Experimental Agriculture, Vol. 46, No. 11.
Perry, C., P. Stedutob, P. Allenc and C. Burtd (2009), “Increasing productivity in irrigated agriculture:
Agronomic constraints and hydrological realities”, Agricultural Water Management, Vol. 96,
No. 11, pp. 1,517-24.
Pincus, M.N. and C. Moseley (2012), “The Economic and Employment Impacts of Forest and Watershed
Restoration”, Restoration Ecology, published on-line,
http://onlinelibrary.wiley.com/doi/10.1111/j.1526-100X.2012.00885.x/abstract),
doi: 10.1111/j.1526-100X.2012.00885.x.
Pink, B. (2009), Land management and Farming in Australia 2007-08, Australian Government, Hobart,
Tasmania.
Popov, V.H., P.S. Cornish and H. Sun (2006), “Vegetated biofilters: the relative importance of infiltration
and adsorption in reducing loads of water-soluble herbicides in agricultural runoff”, Agriculture,
Ecosystems and Environment, Vol. 114, Nos. 2-4, pp. 351-59.
Pretty, J. (2008), “Agricultural sustainability: concepts, principles and evidence”, Philosophical
Transactions of the Royal Society, London, Series B, Biological Sciences, Vol. 363, No. 1,491.
Prokopy, L., K. Floress, D. Klotthor-Weinkauf and A. Baumgart-Getz (2008), “Determinants of
Agricultural Best Management Practice Adoption: Evidence from the Literature”, Journal of Soil
and Water Conservation, Vol. 3, No. 5.
Van den Puttea, A., G. Goversa, J. Dielsa, K. Gillijnsb and M. Demuzerea (2010), “Assessing the effect of
soil tillage on crop growth: A meta-regression analysis on European crop yields under conservation
agriculture”, European Journal of Agronomy, Vol. 33, No. 3, pp. 231-41.
Reicosky, D.C. (2003), “Tillage-induced CO2 emissions and carbon sequestration: effect of secondary
tillage and compaction” in Garcia-Torres, L., J. Benites, A. Martinez-Vilela and A. Holgado-Cabrera
(eds), Conservation Agriculture, pp. 291-300, Kluwer Academic Publishers, Dordrecht.
Sanderman, J., R. Farquharson and J. Baldock (2010), Soil Carbon Sequestration Potential: A review for
Australian agriculture, CSIRO Land and Water, Canberra.
Scott, B.J., P.L. Eberbach, J. Evans and L.J. Wade (2010), Stubble Retention in Cropping Systems in
Southern Australia: Benefits and Challenges, EH Graham Centre Monograph 1, Industry &
Investment NSW, Orange.
Shi, Q., X. Deng, F. Wu, J. Zhan and L. Xu (2012), “Best management practices for agricultural non-point
source pollution control using PLOAD in Wuliangsuhai watershed”, Journal of Food, Agriculture
and Environment, Vol. 10, No. 2, pp. 1,389-93.
Siebert, S. and P. Döll (2010), “Quantifying blue and green virtual water contents in global crop
production as well as potential production losses without irrigation”, Journal of Hydrology,
Vol. 384, Nos. 3-4, pp. 198–217.
Silburn, D.M., D.M. Freebairn and D.J. Rattray (2007), “Tillage and the environment in sub-tropical
Australia - Tradeoffs and challenges”, Soil & Tillage Research, Vol. 97, No. 2, pp. 306-17.
COM/TAD/CA/ENV/EPOC(2015)5
112
Smiley, P.C., K. King and N. Fausey (2011), “Influence of herbaceous riparian buffers on physical habitat,
water chemistry, and stream communities within channelized agricultural headwater streams”,
Ecological Engineering, Vol. 37, No. 9, pp. 1,314-23.
Soil Association (2006), Organic Works, Soil Association UK, Bristol.
Texas Water Development Board (undated), “Agricultural Water Conservation Practices”, Texas Water
Development Board, Austin, Texas,
www.hcmud82.com/water_conservation/Ag%20Water%20Conservation.pdf.
Thomas, G.A., G.W. Titmarsh, D.M. Freebairn and B.J. Radford (2007), “No-tillage and conservation
farming practices in grain growing areas of Queensland - a review of 40 years of development”,
Australian Journal of Experimental Agriculture, Vol. 47, No. 8, pp. 887-98.
Tullberg, J. (2009), “CTF and Climate Change”, paper presented to 6th Australian Controlled Traffic
Farming Conference, Dubbo, New South Wales, 12-14 August 2008,
www.actfa.net/further_reading/documents/Tullberg.Jeff.pdf
Tullberg, J.N., D.F. Yule and D. McGarry (2007), “Controlled traffic farming - From research to adoption
in Australia”, Soil & Tillage Research, Vol. 97, No. 2.
Turner, N.C. and S. Asseng (2005), “Productivity, sustainability, and rainfall-use efficiency in Australian
rainfed Mediterranean agricultural systems”, Australian Journal of Agricultural Research, Vol. 56,
No. 11.
U.S. Environmental Protection Agency (USEPA) (1993), “Guidance Specifying Management Measures for
Sources of Non-Point Pollution in Coastal Waters”, USEPA, Office of Water, Washington, D.C.,
January, www.epa.gov/OWOW/NPS/MMGI/Chapter2/index.html
VandenBygaart, A.J., E.G. Gregorich and D.A. Angers (2003), “Influence of Agricultural Management on
Soil Organic Carbon: A Compendium and Assessment of Canadian Studies,” Canadian Journal of
Soil Science, Vol. 83.
Vanloqueren, G. and P.V. Baret (2009), “How agricultural research systems shape a technological regime
that develops genetic engineering but locks out agro-ecological innovations”, Research Policy,
Vol. 38, pp. 971-83, doi:10.1016/j.respol.2009.02.008.
de Vita, P., E. di Paolo, G. Fecondo, N. di Fonzo and M. Pisante (2007), “No-tillage and conventional
tillage effects on durum wheat yield, grain quality and soil moisture content in southern Italy”,
Soil & Tillage Research, Vol. 92, Nos. 1-2, pp. 69-78.
Wang, E.L., L. Zhongkui and C.J. Smith (2010), “Potential change of soil carbon in Australia agro-
ecosystems as affected by conservation management: data synthesis and modelling”, paper presented
to the 19th World Congress of Soil Science, “Soil Solutions for a Changing World”, Brisbane.
Warda, F. and M. Pulido-Velazquezb (2008), “Water conservation in irrigation can increase water use”,
Proceedings of the National Academy of Sciences, Vol. 105, No. 47, pp. 18,215-220.
Watson, S., E. Segarra, R. Lascano, K. Bronson and A.M. Schubert (2005), “Guidelines for
Recommending Precision Agriculture in Southern Crops”, Journal of Extension, Vol. 43, No. 2,
Article No. 2RIB7, available at: www.joe.org/joe/2005april/rb7p.shtml
COM/TAD/CA/ENV/EPOC(2015)5
113
West, T. and G. Marland (2002), “A synthesis of carbon sequestration, carbon emissions, and net carbon
flux in agriculture: comparing tillage practices in the United States”, Agriculture, Ecosystems and
Environment, Vol. 91, Nos. 1/3.
Wynen, E. (2000), “Bio-dynamic and conventional irrigated dairy farming in Australia:
an economic analysis”, Agribusiness Perspectives, Paper 50, available at:
www.agribusiness.asn.au/Review/Perspectives/2002/Wynen.htm
Wynen, E. (1994), “Bio-dynamic and conventional dairy farming in Victoria: a financial comparison” in
Small, D., J. McDonald and B. Wales (eds), Alternative Farming Practices Applicable to The Dairy
Industry, Victorian Department of Agriculture (Kyabram) and The Dairy Research and Development
Corporation, Melbourne.
Wynen, E. and G. Edwards (1990), “Towards a comparison of chemical-free and conventional farming in
Australia”, Australian Journal of Agricultural Economics, Vol. 34, No. 1.
Yule, D. and W. Chapman (2011), “Controlled Traffic Farming - more productivity, sustainability and
resilience”, paper presented to the 5th World Congress of Conservation in Agriculture incorporating
3rd
Farming Systems Design Conference, Brisbane.
Chapter 3. What does organic farming mean for green growth?
Bellon, S. and S. Penvern (eds) (2014), Organic Farming, Prototype for Sustainable Agricultures,
Springer.
Bengtsson, J., J. Ahnström and A.C. Weibull (2005), “The effects of organic agriculture on biodiversity
and abundance: A meta-analysis”, Journal of Applied Ecology, Vol. 42, pp. 261-69.
Berry, P., R. Sylvester-Bradley, L. Philipps, D.J. Hatch, S.P. Cuttle, F.W. Rayns and P. Gosling (2002), “Is
the productivity of organic farms restricted by the supply of available nitrogen?”, Soil Use and
Management, Vol. 18, Supplement 1, pp. 248-55.
Chavas, J.-P., J.L. Posner and J.L. Hedtcke (2009), “Organic and Conventional Production Systems in the
Wisconsin Integrated Cropping Systems, Trial: II. Economic and Risk Analysis 1993–2006”,
Agronomy Journal, Vol. 101, No. 2, pp. 288-95, doi:10.2134/agronj2008.0055x.
Cisilino, F. and F. Madau (2007), “Organic and Conventional Farming: a Comparison Analysis through
the Italian FADN”, in the proceedings of the Mediterranean Conference of Agro-Food Social
Scientists, 103rd
EAAE Seminar, Adding Value to the Agro-Food Supply Chain in the Future Euro-
Mediterranean Space, Barcelona, 23-25 April.
Clavin, D. and B. Moran (2011), “Financial performance of organic cattle farming”, Teagasc National
Organic Conference, Limerick Junction, Co. Tipperary, Ireland, 14 September.
Crowder, D.W., T.D. Northfield, M.R. Strand and W.E. Snyder (2010), “Organic agriculture promotes
evenness and natural pest control”, Nature, Vol. 466, pp. 109-12, doi:10.1038/nature09183.
Department for Environment, Food and Rural Affairs (DEFRA) (2002), Economic Evaluation of the
Organic Farming Scheme, report prepared by the Centre for Rural Economics Research, Department
of Land Economy, University of Cambridge.
COM/TAD/CA/ENV/EPOC(2015)5
114
Dimitri, C. and L. Oberholzter (2005), Market-led versus Government facilitated Growth: Development of
the U.S. and E.U. Organic Agricultural Sectors, U.S. Department of Agriculture, Washington, D.C.,
WRS 05-05, www.ers.usda.gov
Escalante, C. (2006), “Good Growing: Why Organic Farming Works”, American Journal of Agricultural
Economics, Book Reviews section, Vol. 88, No. 3.
European Commission (EC) (2013), “Organic versus conventional farming, which performs better
financially?”, Farm Economics Brief, No. 4, November, Brussels.
Food and Agriculture Organization of the United Nations (FAO) (2011), “Organic Agriculture and Climate
Change Mitigation: A Report of the Round Table on Organic Agriculture and Climate Change”,
Natural Resources Management and Environment Department, FAO, Rome,
www.fao.org/docrep/015/i2537e/i2537e00.pdf
FAO (2001), The Economics of Conservation Agriculture, FAO, Rome,
ftp://ftp.fao.org/agl/agll/docs/ecconsagr.pdf
Fuller, R.J., L.R. Norton, R.E. Feber, P.J. Johnson, D.E. Chamberlain, A.C. Joys, F. Mathews, R.C. Stuart,
M.C. Townsend, W.J. Manley, M.S. Wolfe, D.W. Macdonald and L.G. Firbank (2005), “Benefits of
organic farming to biodiversity vary among taxa”, Biology Letters, Vol. 1.
Gattinger, A. (2012), “The Potential of Organic Farming Practices for Meeting the Climate Challenge in
Different Regions of Europe – Mitigation and Adaptation”, paper presented to the International
Federation of Organic Agriculture Movements (IFOAM) conference, “Organic Days in Cyprus”,
Larnaka, 26 September, http://organicdays.eu/material/proceedings/
Gedikoglu, H. and L. McCann (2010), “What Causes Farmers to Adopt Agricultural and Conservation
Technologies and How Can We Use that Knowledge to Improve Policies, Programs and
Technologies?”, in Napier, T.L. (ed.), Human Dimensions of Soil and Water Conservation: A Global
Perspective, Hauppauge, NY: Nova Science Publishers, Inc.
Gedikoglu, H., L. McCann and G. Artz (2011), “Off-Farm Employment Effects on Adoption of Nutrient
Management Practices”, Agricultural and Resource Economics Review, Vol. 40, No. 2, pp. 293-306.
Gomiero, T., M.G. Paoletti and D. Pimental (2008), “Energy and Environmental Issues in Organic and
Conventional Agriculture”, Critical Reviews in Plant Sciences, Vol. 27, No. 4, pp. 239-54.
Gomiero, T., D. Pimentel and M.G. Paoletti (2011), “Environmental Impact of Different Agricultural
Management Practices: Conventional vs. Organic Agriculture”, Critical Reviews in Plant Sciences,
Vol. 30, Nos. 1-2, pp. 95-124.
Green, M. and R. Maynard (2006), “Organic Works: Providing More Jobs through Organic Farming and
Local Food Supply”, Soil Association, Bristol,
www.soilassociation.org/LinkClick.aspx?fileticket=60CVIT1Nw0U%3D&tabid=387.
Greene, C., C. Dimitri, B.W. Lin, W. McBride, L. Oberholtzer and T. Smith (2009), “Emerging Issues in
the U.S. Organic Industry”, U.S. Department of Agriculture, Economic Research Service, Economic
Information Bulletin No. 55, www.ers.usda.gov/publications/eib-economic-information-
bulletin/eib55.aspx#.UkFnij89XEM
COM/TAD/CA/ENV/EPOC(2015)5
115
Greene, C. and R. Ebel (2012), “Organic Farming Systems”, in Osteen, C., J. Gottlieb and U. Vasavada
(eds), “Agricultural Resources and Environmental Indicators, 2012 Edition”, U.S. Department of
Agriculture, Economic Research Service, Economic Information Bulletin Number 98.
Greer, G., W. Kaye-Blake, E. Zellman and C. Parsonson-Ensor (2008), “Comparison of the financial
performance of organic and conventional farms”, Journal of Organic Systems, Vol. 3, pp. 18-28.
Guyomard, H. (2014), « Conclusion générale: synthèse et recommandations », in Bellon, S. and S. Penvern
(eds) (2014), Organic Farming, Prototype for Sustainable Agricultures, Springer.
Halpin, D., C. Daugbjerg and Y. Schvartzman (2011), “Interest-group capacities and infant industry
development: State-sponsored growth in organic farming”, International Political Science Review,
Vol. 32, doi: 10.1177/0192512110372435.
Hanson, J., E. Lichtenberg and S. Peters (1997), “Organic versus conventional grain production in the mid-
Atlantic: An economic and Farming System Overview”, American Journal of Alternative
Agriculture, Vol. 12, No.1.
Ha ring, A., S. Dabbert, F. Offermann and H. Nieberg (2001), “Benefits of Organic Farming for Society”,
paper presented to the European Conference, “Organic Food and Farming,” 10-11 May,
Copenhagen.
Hole, D.G., A.J. Perkins, J.D. Wilson, I.H. Alexander, P.V. Grice and A.D. Evans (2005), “Does organic
farming benefit biodiversity?”, Biological Conservation, Vol. 122, pp. 113-30.
Jacobsen, L.B. (2003), “Do Support Payments for Organic Farming Achieve Environmental Goals
Efficiently?”, in Organic Agriculture: Sustainability, Markets and Policy, OECD, Paris, pp. 345-
366.
Jaeck, M., R. Lifran and H. Stahn (2013), “Emergence of organic farming under imperfect competition:
economic conditions and incentives”, Working Paper, No. 39, Aix-Marseille School of Economics,
http://halshs.archives-ouvertes.fr/docs/00/79/36/71/PDF/WP_2012_-_Nr_39.pdf
Jansen, H.G.P., J. Pender, A. Damon, W. Wielemaker and R. Schipper (2006), “Policies for sustainable
development in the hillside areas of Honduras: a quantitative livelihoods approach”, Agricultural
Economics, Vol. 34, pp. 141-53.
Jansen, K. (2000), “Labour, livelihoods and the quality of life in organic agriculture in Europe”, Biological
Agriculture and Horticulture, Vol. 17, pp. 247-78.
Kay, P., A. Edwards and M. Foulger (2009), “A review of the efficacy of contemporary agricultural
stewardship measures for ameliorating water pollution problems of key concern to the UK water
industry”, Agricultural Systems, Vol. 99, Nos. 2/3, pp. 67–75.
Kirchhof, G. and I. Daniels (2009), “Changing tillage management practices and their impact on soil
structural properties in north-western New South Wales, Australia”, ACIAR Technical Reports
Series, No. 71.
Klepper, R., W. Lockeretz, B. Commoner, M. Gertler, S. Fast, D. O’Leary and R. Blobaum (1977),
“Economic Performance and Energy Intensiveness on Organic and Conventional Farms in the Corn
Belt: a Preliminary Comparison”, American Journal of Agricultural Economics, Vol. 59, No. 1.
COM/TAD/CA/ENV/EPOC(2015)5
116
Lampkin, N.H. (2007), “Organic farming’s contribution to climate change and agricultural sustainability”,
paper presented at the Welsh Organic Producers’ Conference, 18 October.
Lampkin, N. and S. Padel (1994), The Economics of Organic Agriculture – An International Perspective,
Wallingford, CAB International.
Lataccz-Lohmann, U. and A. Renwick (2002), “An economic evaluation of the Organic Farming Scheme”
in Powell, J. (ed.), UK Organic Research 2002: Proceedings COR Conference, 26-28 March,
Aberystwyth, pp. 311-12.
Leifeld, J. and J. Fuhrer (2010), “Organic farming and soil carbon sequestration: what do we really know
about the benefits?”, Ambio, Vol. 39, No. 8, pp. 585-99.
Lobley, M., A. Butler, P. Courtney, B. Ilbery, J. Kirwan, J. Maye, C. Potter and M. Winter (2009),
“Analysis of Socio-economic Aspects of Local and National Organic Farming Markets”, Centre for
Rural Policy Research (CRPR) Research Report No. 29, Final Report for Defra, University of
Exeter.
Lobley, M., M. Reed and A. Butler (2005), “The Impact of Organic Farming on the Rural Economy in
England”, Final Report to Defra, University of Exeter.
Lynch, D., R. MacRae and R. Martin (2011), “The Carbon and Global Warming Potential Impacts of
Organic Farming: Does It Have a Significant Role in an Energy Constrained World?”,
Sustainability, Vol. 3, doi:10.3390/su3020322.
Madau, F. (2007), “Technical Efficiency in Organic and Conventional Farming: Evidence form Italian
Cereal Farms”, Agricultural Economics Review, Vol. 8, No. 1.
Madignier, M., B. Parent and P. Quevremont (2012), Sur le bilan du plan de développement de
l’agriculture biologique 2008-2012, Ministère de l'agriculture, de l'agro-alimentaire et de la forêt, http://agriculture.gouv.fr/IMG/pdf/2012-M084-01_Agriculture_bio__cle8f3f53.pdf
Maine Organic Farmers’ and Gardeners’ Association (2010), Maine’s Organic Farms – An Impact Report,
Unity, Maine.
Martini, E., J. Buyer, D. Bryant, T. Hartz and D. Ford (2004), “Yield increases during the organic
transition: Improving soil quality or increasing experience?”, Field Crops Research, Vol. 86, No. 2.
Mayen, C., J. Balagtas and C. Alexander (2010), “Technology Adoption and Technical Efficiency: organic
and conventional dairy farms in the United States”, American Journal of Agricultural Economics,
Vol. 92, No. 1.
Mon, P.N. and D.W. Holland (2005), “Organic Apple Production in Washington State: An Input-Output
Analysis”, Working Paper Series 2005-3, School of Economic Sciences, Washington State
University.
Morison, J., R. Hine and J. Pretty (2005), “Survey and Analysis of Labour on Organic Farms in the UK
and Republic of Ireland”, International Journal of Agricultural Sustainability, Vol. 3, No. 1, pp. 24-
43.
COM/TAD/CA/ENV/EPOC(2015)5
117
Norton, L., P. Johnson, A. Joys, R. Stuart, D. Chamberlain, R. Feber, L. Firbank, W. Manley, M. Wolfe
and B. Hart (2009), “Consequences of organic and non-organic farming practices for field, farm and
landscape complexity”, Agriculture, Ecosystems and Environment, Vol. 129, Nos. 1-3, pp. 221-27.
OECD (2003), Organic Agriculture: Sustainability, Markets and Policies, OECD Publishing, Paris.
Oehl, F., A. Oberson, H.U. Tagmann, J.M. Besson, D. Dubois, P. Mäder, H.-R. Roth and
E. Frossard (2002), “Phosphorus budget and phosphorus availability in soils under organic and
conventional farming”, Nutrient Cycling in Agroecosystems, Vol. 62, No. 1, pp. 25-35,
doi: 10.1023/A:1015195023724.
Offermann, F. and H. Nieberg (2000), “Economic performance of organic farms in Europe” in Organic
Farming in Europe: Economics and Policy, Vol. 5, University of Hohenheim, Stuttgart.
Organic Farming Research Foundation (2012), Organic Farming for Health and Prosperity, August.
Oude, L., A. Pietola and S. Backman (2002), “Efficiency and productivity of conventional and organic
farms in Finland 1994-1997”, European Review of Agricultural Economics, Vol. 29, No. 1.
Padel, S. (2001), “Conversion to organic farming: A typical example of the diffusion of an innovation?”,
Sociologia Ruralis, Vol. 41, pp. 40-61.
Pimentel, D. (2006), Impacts of Organic Farming on the Efficiency of Energy Use in Agriculture, The
Organic Center, www.organicvalley.coop/fileadmin/pdf/ENERGY_SSR.pdf
Research Institute of Organic Agriculture (FiBL) and IFOAM (2015), The World of Organic Agriculture
2015, www.organic-world.net/yearbook-2015.html
Sanders, J., M. Stolze and S. Padel (2011), Use and efficiency of public support measures addressing
organic farming, Institute of Farm Economics, Johann Heinrich von Thünen‐Institut (vTI),
Braunschweig, Germany, http://ec.europa.eu/agriculture/external-studies/2012/organic-farming-
support/full_text_en.pdf.
Sandhu, H.S., S.D. Wratten and R. Cullen (2010), “Organic agriculture and ecosystem services”,
Environmental Science & Policy, Vol. 13, No. 1, pp. 1-7, doi:/10.1016/j.envsci.2009.11.002.
Schader, C. (2009), Cost-effectiveness of organic farming for achieving environmental policy targets in
Switzerland, FiBL, Frick, and Aberystwyth University,
www.fibl.org/fileadmin/documents/shop/1539-cost-effectiveness-of-organic-farming.pdf
Schader, C., M. Stolze and A. Gattinger (2012), “Environmental performance of organic farming”, in
J.I. Boye and Y. Arcand (eds), Green Technologies in Food Production and Processing, pp. 183-
210, Food Engineering Series, Springer: New York, United States, doi:10.1007/978-1-4614-1587-9_
.
Scialabba, N. and M. Lindenlauf (2010), “Organic agriculture and climate change”, Renewable Agriculture
and Food Systems, Vol. 25, No. 2, pp. 158-69.
Seufert, V., N. Ramankutty and J. Foley (2012), “Comparing the yields of organic and conventional
agriculture”, Nature, Vol. 485, pp. 229-32.
COM/TAD/CA/ENV/EPOC(2015)5
118
Tereso, M.J.A., R.F. Abrahão, S.F.B. Gemma, U.B. Montedo, N.L. Menegon, J.E. Guarneti and
I.A.V. Ribeiro (2012), “Work and technological innovation in organic agriculture”, Work, Vol. 41,
pp. 4,975-78, doi:10.3233/WOR-2012-0041-4975.
Tyburski, J. (2003), “Organic Farming in Poland: Past, Present and Future Perspectives” in Organic
Agriculture: Sustainability, Markets and Policy, pp. 301-309, OECD, Paris.
Tzouvelekas, V., C.J. Pantzios and C. Fotopoulos (2001), “Technical efficiency of alternative farming
systems: the case of Greek organic and conventional olive growing farms”, Food Policy, Vol. 26,
No. 6, pp. 549-69.
Uematsu, H. and A.K. Mishra (2012), “Organic farmers or conventional farmers: Where’s the money?”,
Ecological Economics, Vol. 78, pp. 55-62, doi:10.1016/j.ecolecon.2012.03.013.
Wheeler, S. (2008), “What influences agricultural professionals’ view towards organic agriculture?”,
Ecological Economics, Vol. 65, pp. 145-15.
Willer, H. and J. Lernoud (2013), Organic Agriculture Worldwide: Key results from the FiBL-IFOAM
survey on organic agriculture worldwide 2013, FiBL, Frick, and IFOAM, Bonn,
http://orgprints.org/22349/28/fibl-ifoam-2013-global-data-2011.pdf
Wolfe, M.S., J.P. Baresel, D. Desclaux, I. Goldringer, S. Hoad, G. Kovacs, F. Löschenberger, T. Miedaner,
H. Østergård and E.T. Lammerts van Bueren (2008), “Developments in breeding cereals for organic
agriculture”, Euphytica, Vol. 163, pp. 323-46, doi:10.1007/s10681-008-9690-9.
World Bank (1996), “Natural Resource Degradation in Sub-Saharan Africa: Restoration of Soil Fertility:
A Concept Paper and Action Plan”, mimeo, The World Bank, Washington, D.C.
Wynen, E. (2003), “What are the key issues faced by organic producers?” in Organic Agriculture:
Sustainability, Markets and Policy, pp. 207-20, OECD Publishing, Paris.
Wynen, E. (2001), “The economics of organic cereal-livestock farming in Australia revisited”, proceedings
of the RIRDC Inaugural Conference on Organic Agriculture, Sydney, Australia, 27-28 August,
available at: www.elspl.com.au/Abstracts/abstract-a17.htm.
Yiridoe, E., S. Bonti-Ankomah and R. Martin (2005), “Comparison of consumer perceptions and
preference toward organic versus conventionally produced foods: A review and update of the
literature”, Renewable Agriculture and Food Systems, Vol. 20.
Chapter 4. Unleashing the green growth potential of integrated pest management
Anderson, M.D., C.S. Hollingsworth, Zee, V. Van, W.M. Coli and M. Rhodes (1996), “Consumer response
to integrated pest management and certification”, Agriculture, Ecosystems and Environment,
Vol. 60, pp. 97-106.
Antle, J. M. and P.L. Pingali (1994), “Pesticides, productivity and farmer health: a Philippine case study”,
American Journal of Agricultural Economics, Vol. 76, pp. 418–30.
Bahlai, C., Y. Xue, C.M. McCreary, A.W. Schaafsma and R.H. Hallett (2010), “Choosing organic
pesticides over synthetic pesticides may not effectively mitigate environmental risk in soybeans”,
PLoS ONE 5:e11250, last accessed on 21 September 2014 at:
www.plosone.org/article/info%3Adoi%2F10.1371%2Fjournal.pone.0011250
COM/TAD/CA/ENV/EPOC(2015)5
119
Bajwa, W. I. and M. Kogan (2002), Compendium of IPM Definitions (CID). What is IPM and how is it
defined in the Worldwide Literature?, IPPC Publication No. 998, Integrated Plant Protection Center
(IPPC), Oregon State University, Corvallis, OR 97331.
Bazoche, P., F. Bunte, P. Combris, E. Giraud-Héraud, A. Seabra-Pinto and E. Tsakiridou (2012),
“Willingness to pay for pesticides’ reduction in E.U: nothing but organic?”, Working Paper ALISS
2012-01, Institut national de la recherche agronomique (INRA), Paris, last accessed on
21 September 2014 at:
http://dev.finxchange.prodinternet.com/sites/default/files/pdf/Willingness%20to%20pay%20for%20
pesticides%E2%80%99%20reduction%20in%20E.U%20nothing%20but%20organic.pdf
Beckmann, V. and J. Wesseler (2003), “How labour organisation may affect technology adoption: an
analytical framework analysing the case of integrated pest management”, Environment and
Development Economics, Vol. 8, No. 3, pp. 437-50.
Biguzzi, C., E. Ginon, S. Gomez-y-Paloma, S. Langrell, M. Lefebvre, S. Marette, G. Mateu and A. Sutan
(2014), “Consumers’ preferences for Integrated Pest Management: Experimental insights”, paper
presented at the EAAE 2014 Congress “Agri-Food and Rural Innovations for Healthier Societies”
26-29 August, Ljubljana, Slovenia, last accessed on 21 September 2014 at:
http://ageconsearch.umn.edu/bitstream/183081/2/Biguzi-
Consumers_preferences_for_integrated_pest_management-343_a.pdf
Broome, J. and K.D. Warner (2008), “Agro-environmental partnerships facilitate sustainable wine-grape
production and assessment”, California Agriculture, Vol. 62, pp. 133-41.
Campbell, H.F. (1976), “Estimating the Marginal Productivity of Agricultural Pesticides: The Case of
Tree-Fruit Farms in the Okanagan Valley”, Canadian Journal of Agricultural Economics, Vol. 24,
pp. 23-30.
Carlberg, E., G. Kostandini and A. Dankyi (2012), “The Effects of Integrated Pest Management
Techniques (IPM) Farmer Field Schools on Groundnut Productivity: Evidence from Ghana”, paper
presented at the Agricultural and Applied Economics Association’s (AAEA) Annual Meeting,
Seattle, Washington, 12-14 August, last accessed on 21 September 2014 at:
http://ageconsearch.umn.edu/bitstream/124876/2/CarlbergRev.pdf
Carlson,G.A. (1977), “Long-Run Productivity of Pesticides”, American Journal of Agricultural
Economics, Vol. 59, pp. 543-48.
Chandran, R. (2014), “Experiences with Implementation and Adoption of Integrated Pest Management in
Northeastern USA”, in Peshin, R. and D. Pimentel (eds), “Integrated Pest Management: Experiences
with Implementation”, Global Overview, Vol. 4, pp. 37-64, Springer Dordrecht.
Christensen, H. (2013), Review of National Action Plans. Presentation to the 8th Annual Biocontrol
Industry Meeting, Basel, Switzerland, 22 October, last accessed on 21 September 2014 at:
www.abim.ch/fileadmin/documents-abim/Presentations_2013/ABIM_2013_1_2_Christensen.pdf
Ciampitti, M. (2013), “Integrated Pest Management in Italy”, paper presented to the International Congress
on Pesticide Use and Risk Reduction for Future IPM in Europe, 19-21 March, Pala Congressi, Riva
del Garda.
COM/TAD/CA/ENV/EPOC(2015)5
120
Coble, H. and E. Ortman (2009), “The USA National IPM Road Map”, in Integrated Pest Management,
Radcliffe, E.B., W.D. Hutchison and R.E. Cancelado (eds), Chapter 37, pp. 471-478, Cambridge
University Press.
Cranfield, J.A.L. and E. Magnusson (2003), “Canadian Consumer’s Willingness-To-Pay for Pesticide Free
Food Products: An Ordered Probit Analysis”, International Food and Agribusiness Management
Review.
CropLife America. (2014), Pesticide Regulation. Last accessed on 21 September 2014 at:
www.croplifeamerica.org/crop-protection/pesticide-regulation
Cuyno, L.C.M., G.W. Norton and A. Rola (2001), “Economic analysis of environmental benefits of
integrated pest management: a Philippines case study”, Agricultural Economics, Vol. 25, pp. 227-34.
Dachbrodt-Saaydeh, S. and M. Barzman (2013), “Goals in National Action Plans and IPM
Implementation – Core Elements of the Sustainable Use Directive”, paper presented to the
International Congress on Pesticide Use and Risk Reduction for Future IPM in Europe, 19-
21 March, Pala Congressi, Riva del Garda.
David, S. and C. Asamoah (2011), “Farmer Knowledge as an Early Indicator of IPM Adoption: A Case
Study from Cocoa Farmer Field Schools in Ghana”, Journal of Sustainable Development in Africa,
Vol. 13, pp. 213-24.
Dixon, P., L. Cass, C. Vincent and O. Olfert (2014), “Implementation and Adoption of Integrated Pest
Management in Canada: Insects”, in Peshin, R. and D. Pimentel (eds), Integrated Pest Management:
Experiences with Implementation, Global Overview, Vol. 4, pp. 222-52 Springer Dordrecht.
Ehler, E.L. (2006), “Integrated pest management (IPM): definition, historical development and
implementation, and the other IPM”, Pest Management Science, Vol. 62, pp. 787-89.
Van Emden, H.F. and M.W. Service (2004), Pest and vector control, Cambridge University Press,
Cambridge.
EPA (2014), Integrated Pest Management (IPM) Principles, last accessed on 21 September 2014 at:
www.epa.gov/pesticides/factsheets/ipm.htm
Epstein, L. (2014), “Fifty Years Since Silent Spring”, Annual Review in Phytopathology, Vol. 52, pp. 377-
402.
Faraglia, B., A. Frattarelli, P. Falzarano and T. Galassi (2013), “Implementation of Directive 128/09/EC in
Italy”, paper presented to the International Congress on Pesticide Use and Risk Reduction for Future
IPM in Europe, 19-21 March, Pala Congressi, Riva del Garda.
Flint, H.M. and C. Doane (2014), “Understanding Semiochemicals with Emphasis on Insect Sex
Pheromones in Integrated Pest Management Programs”, in Radcliffe’s IPM World Textbook,
Radcliffe, E.B. and W.D. Hutchison (eds), University of Minnesota, St. Paul, Minnesota, last
accessed on 25 September 2014 at: http://ipmworld.umn.edu/chapters/flint.htm
Food and Agriculture Organization of the United Nations (FAO) (2014), “AGP - Integrated Pest
Management”, last accessed on 21 September 2014 at:
www.fao.org/agriculture/crops/thematic-sitemap/theme/pests/ipm/en/
COM/TAD/CA/ENV/EPOC(2015)5
121
Fernandez-Cornejo, J. (1998), “Environmental and Economic Consequences of Technology Adoption:
IPM in Viticulture”, Agricultural Economics, Vol. 18, pp. 145–55.
Fernandez-Cornejo, J. (1996), “The Microeconomics Impact of IPM Adoption: Theory and Application”,
Agricultural and Resource Economics Review, Vol. 25, pp. 149-60.
Fernandez-Cornejo, J. and S. Jans (1996), “The Economics Impact of IPM Adoption for Orange Producers
in California and Florida”, Acta Horticulture, Vol. 429, pp. 325-34.
Fontes, M., E. Giraud-Héraud and A. Pinto (2013), “Consumers’ behaviour towards food safety:
A literature review”, Ecole Polytechnique, Centre National de la Recherche Scientifique,
Cahier n° 2013-26, last accessed on 25 September 2014 at:
http://hal.archives-ouvertes.fr/docs/00/91/24/76/PDF/2013-26.pdf
Godtland, E., E. Sadoulet, A. de Janvry, R. Murgai and O. Ortiz (2003), “The Impact of Farmer-Field-
Schools on Knowledge and Productivity: A Study of Potato Farmers in the Peruvian Andes”,
Department of Agricultural and Resource Economics, UCB, UC Berkeley, last accessed on
25 September 2014 at:
file:///C:/Users/User/Downloads/eScholarship%20UC%20item%208hp835xx.pdf
Govindasamy, R. and J. Italia (1997), “Consumer Response to Integrated Pest Management and Organic
Agriculture: An Econometric Study”, Working Paper, Department of Agricultural, Food and
Resource Economics, Rutgers University, last accessed on 21 September 2014 at:
http://ageconsearch.umn.edu/bitstream/36727/2/pa970297.pdf
Govindasamy, R., J. Italia and A. Adelaja (2001), “Predicting Willingness-to-Pay a Premium for Integrated
Pest Management Produce: A Logistic Approach”, Agricultural and Resource Economics Review,
Vol. 30, pp. 151-59.
Hajek, A. (2004), Natural enemies: an introduction to biological control, Cambridge University Press,
Cambridge.
Headley, J.C. (1968), “Estimating the Productivity of Agricultural Pesticides”, American Journal of
Agricultural Economics, Vol. 55, pp. 13-23.
Heap, I. (2014), “Herbicide Resistant Weeds”, in Pimentel, D. and R. Peshin (eds), Pesticide Problems,
Vol. 3, pp. 282-301. Springer, Dordrecht.
Heap, I. (2010), “The International Survey of Herbicide Resistant Weeds”, last accessed on 25 September
2014 at: www.weedscience.org/summary/home.aspx
Hillocks, R. (2013), “IPM – Can it Deliver? Balancing Environmental and Economic Sustainability”, paper
presented to the International Congress on Pesticide Use and Risk Reduction for Future IPM in
Europe, 19-21 March, Pala Congressi, Riva del Garda.
Hillocks, R.J. (2012), “Farming with fewer pesticides: EU pesticide review and resulting challenges for
UK agriculture”, Crop Protection, Vol. 31, pp. 85-93.
Hommel, B., S. Dachbrodt-Saaydeh and B. Freier (2014), “Experiences with Implementation and Adoption
of Integrated Plant Protection (IPP) in Germany”, in Peshin, R. and D. Pimentel (eds), “Integrated
Pest Management: Experiences with Implementation”, Global Overview, Vol. 4, pp. 429-65.
Springer, Dordrecht.
COM/TAD/CA/ENV/EPOC(2015)5
122
Horowitz, J.K. and E. Lichtenberg (1993), “Insurance, moral hazard and chemical use in agriculture”,
American Journal of Agricultural Economics, Vol. 75, pp. 926-37.
Hristovska, T. (2009), “Economic Impacts of Integrated Pest Management in Developing Countries:
Evidence from the IPM CRSP”, thesis submitted to the faculty of the Virginia Polytechnic Institute
and State University in partial fulfilment of the requirements for the degree of Master of Science in
Agricultural and Applied Economics, last accessed on 25 September 2014 at:
http://scholar.lib.vt.edu/theses/available/etd-05252009-
231519/unrestricted/Hristovska_Masters_Thesis.pdf
Institut national de la recherche agronomique (INRA) (2010), “Ecophyto R&D: Which Options to Reduce
Pesticide Use?”, INRA, Paris, last accessed on 25 September 2014 at:
http://institut.inra.fr/en/Missions/Inform-public-decision-making/Advanced-Studies/All-the-
news/Ecophyto-R-D
Jacobsen, B.J. (1996), “USDA Integrated Pest Management Initiative”, in Radcliffe’s IPM World
Textbook, Radcliffe, E.B. and W.D. Hutchison (eds), University of Minnesota, St. Paul, last accessed
on 25 September 2014 at: http://ipmworld.umn.edu/chapters/jacobsen.htm
Jacquet, F., J.-P. Butault and L. Guichard (2011), “An economic analysis of the possibility of reducing
pesticides in French field crops”, Ecological Economics, Vol. 70, pp. 1,638-48.
Kogan, M. (1998), “Integrated pest management: historical perspectives and contemporary developments”,
Annual Review of Entomology, Vol. 43, pp. 243-70.
Kovach, J., C. Petzoldt, J. Degni and J. Tette (1992), “A Method to Measure the Environmental Impact of
Pesticides”, New York Food and Life Sciences Bulletin Number 139, last accessed on 25 September
2014 at: www.nysipm.cornell.edu/publications/eiq/
Kranthi, K.R. (2012), “Bt cotton: Questions and answers”, Mumbai: Indian Society for Cotton
Improvement (ISCI), last accessed on 30 September 2014 at:
http://indiagminfo.org/wp-content/uploads/2011/08/Bt-Cotton-QA-Kranthi-2012.pdf
Lechenet, M., V. Bretagnolle, C. Bockstaller, F. Boissinot, M.-F. Petit, S. Petit and N. Munier-Jolain,
“Reconciling Pesticide Reduction with Economic and Environmental Sustainability in Arable
Farming”, PlosOne, 9: e97922.
Lefebvre, M., S. Langrell and S. Gomez-y-Paloma (2013), “Adoption of Integrated Pest Management:
What Role for Economics?”, paper presented to the International Congress on Pesticide Use and
Risk Reduction for Future IPM in Europe, 19-21 March, Pala Congressi, Riva del Garda.
Lichtenberg, E., and D. Zilberman (1986), “The Econometrics of Damage Control: Why Specification
Matters”, American Journal of Agricultural Economics, Vol. 68, pp. 261-73.
Lund, T., I. Nyborg, M.H. Rahman and M.G. Sæthre (2013), “Social Impacts of IPM-FFS on Urban and
Peri-Urban Vegetable Producers in Cotonou, Benin”, African Journal of Food, Agriculture,
Nutrition and Development, Vol. 13, pp. 7,727-45.
Magnusson, E. and J.A.L. Cranfield (2005), “Consumer demand for pesticide free food products in
Canada: A probit analysis”, Canadian Journal of Agricultural Economics, Vol. 53, pp. 67-81.
COM/TAD/CA/ENV/EPOC(2015)5
123
Mancini, F. (2006), Impact of Integrated Pest Management Farmer Field Schools on health, farming
systems, the environment, and livelihoods of cotton growers in Southern India, PhD thesis,
Wageningen University.
Marrone, P. (2009), “Barriers to adoption of biological control agents and biological pesticides”,
Chapter 13 in Integrated Pest Management, Radcliffe, E.B., W.D. Hutchison and R.E. Cancelado
(eds), pp. 163-178, Cambridge University Press, Cambridge.
Mullen, J.D., J.M. Alston, D.A. Sumner, M.T. Kreith and N.V. Kuminoff (2003), “Returns to University of
California pest management research and extension. Overview and case studies emphasizing IPM”,
University of California, Agriculture and Natural Resources, ANR Publication 3482.
Norton, G. and Mullen J. (1994), Economic Evaluation of Integrated Pest Management Programs:
A Literature Review, Virginia Coop. Ext. Pub. 448-120, Virginia Tech, Blacksburg, VI.
OECD (2015), Fostering Green Growth in Agriculture: The Role of Training, Advisory Services and
Extension Initiatives, OECD Publishing, Paris, forthcoming.
OECD (2013), “Report of Workshop on the Regulation of Biopesticides: Registration and Communication
Issues”, Series on Pesticides No. 448, OECD Publishing, Paris, last accessed on 25 September 2014
at: www.oecd.org/env/ehs/pesticides-biocides/ENV-JM-MONO(2009)19-ENG.pdf
OECD (2011), “Report of the OECD Workshop on Integrated Pest Management (IPM) Strategies for the
Adoption and Implementation of IPM in Agriculture Contributing to the Sustainable Use of
Pesticides and to Pesticide Risk Reduction”, Berlin, Germany, 16-19 October, Series on Pesticides
No. 70, OECD Publishing, Paris, last accessed on 25 September 2014 at:
www.oecd.org/officialdocuments/publicdisplaydocumentpdf/?cote=env/jm/mono%282012%2932&
doclanguage=en
OECD (2010), Taxation, Innovation and the Environment, OECD Publishing, Paris,
doi: 10.1787/9789264087637-en.
OECD (1999), “Report of the OECD/FAO Workshop on Integrated Pest Management and Pesticide Risk
Reduction”, Neuchâtel, Switzerland, 28 June-2 July 1998, Series on Pesticides No. 8. OECD
Publishing, Paris, last accessed on 25 September 2014 at:
www.oecd.org/officialdocuments/publicdisplaydocumentpdf/?cote=ENV/JM/MONO(99)7&doclang
uage=en
Olson, L., F. Zalom and P. Adkisson (2003), “Integrated pest management in the USA”, in Maredia, K.M.,
D. Dakouo and D. Mota-Sanchez (eds), Integrated Pest Management in the Global Arena, pp. 249-
72, CABI Publishing, Cambridge, MA.
Osteen, C. and J. Fernandez-Cornejo (2013), “Economic and policy issues of U.S. agricultural pesticide
use trends”, Pest Management Science, Vol. 69, pp. 1,001-25.
Pedigo, K.P., S.H. Hutchins and L.G. Higley (1986), “Economic injury levels in theory and practice”,
Annual Review of Entomology, Vol. 31, pp. 341-68.
Peshin, R., R. Bandral, W. Zhang, L. Wilson and A. Dhawan (2009), “Integrated Pest Management:
A Global Overview of History, Programs and Adoption”, in Integrated Pest Management:
Innovation-Development Process, Peshin, R. and A. Dhawan (eds), Vol. 1, pp. 1-50, Springer,
Dordrecht.
COM/TAD/CA/ENV/EPOC(2015)5
124
Peshin, R., K.R. Kranthi and R. Sharma (2014a), “Pesticide Use and Experiences with Integrated Pest
Management Programs and Bt Cotton in India”, in Peshin, R. and D. Pimentel (eds), Integrated Pest
Management: Experiences with Implementation, Global Overview, Vol. 4, pp. 269-306. Springer,
Dordrecht.
Peshin, R., K. Jayaratne and R. Sharma (2014b), “IPM Extension: A Global Overview”, in Abrol, D.P.
(ed.), Integrated Pest Management, pp. 493-529, Elsevier, Amsterdam.
Phalan, B., A.S.L. Rodrigues, A. Balmford, R.E. Green and R. Ewers (2007), Comment on “resource-
conserving agriculture increases yields in developing countries”, Environmental Science and
Technology, Vol. 41, pp. 1,054–55.
Pimentel, D. (2009), “Environmental and Economic Costs of the Application of Pesticides Primarily in the
United States”, Chapter 4 in Peshin, R. and A.K. Dhawan (eds), Integrated Pest Management:
Innovation-Development Process, pp. 89-112, Springer.
Pimentel, D. and A. Greiner (1997), “Environmental and socio-economic costs of pesticide use”, in
Pimentel, D. (ed.), Techniques for Reducing Pesticide Use: Environmental and Economic Benefits,
pp. 51-78, John Wiley & Sons, Chichester.
Pingali, P.L., C.B. Marquez and F.G. Palis (1994), “Pesticides and Philippine rice farmer health: a medical
and economic analysis”, American Journal of Agricultural Economics, Vol. 76, pp. 587-92.
Pretty, J. (2005), “Sustainability in agriculture: Recent progress and emergent challenges”, Issues in
Environmental Science and Technology, Sustainability in Agriculture, Vol. 21, pp. 1-15.
Pretty, J.N., A.D. Noble, D. Bossio, J. Dixon, R.E. Hine, F.W.T. Penning de Vries and J.I.L. Morison
(2006), “Resource-conserving agriculture increases yields in developing countries”, Environmental
Science and Technology, Vol. 40, pp. 1,114-19.
Prokopy, R.J. (2003), “Two decades of bottom-up, ecologically based pest management in a small
commercial apple orchard in Massachusetts”, Agriculture Ecosystems and Environment, Vol. 94,
pp. 299-309.
Prokopy R. and M. Kogan (2003), “Integrated pest management”, in Encyclopedia of Insects, Resh, V.J.
and R.T. Carde (eds), Academic Press, San Diego, pp. 589-95.
Ricci, P. (2013). “The Promotion of IPM and Pesticide-Related Research in the Frame of the French
Ecophyto Plan”, paper presented to the International Congress on Pesticide Use and Risk Reduction
for Future IPM in Europe, 19-21 March, Pala Congressi, Riva del Garda.
Sexton, S.E., Z. Lei and D. Zilberman (2007), “The Economics of Pesticides and Pest Control”,
International Review of Environmental and Resource Economics, Vol. 1, pp. 271–326.
Sharma, H. and C. Prabhakar (2014), “Impact of Climate Change on Pest Management and Food Security”
in Abrol, D.P. (ed.), Integrated Pest Management, Chapter 2, pp. 23-36, Elsevier, Amsterdam.
Skevas, T., A.G.J.M. Oude Lansink and S.E. Stefanou (2013), “Designing the emerging EU pesticide
policy: a literature review”, NJAS-Wageningen Journal of Life Sciences, Vols. 64-65, pp. 95-103.
COM/TAD/CA/ENV/EPOC(2015)5
125
Skevas, T., S.E. Stefanou and A. Oude Lansink (2012), “Can economic incentives encourage actual
reductions in pesticide use and environmental spillovers?”, Agricultural Economics, Vol. 43,
pp. 267-76.
Stern, V.M., R.F. Smith, R. Van Den Bosch and K.S. Hagen (1959), “The integrated control concept”,
Hilgardia, Vol. 29, pp. 81-101.
Swezey, S.L., P. Goldman, J. Bryer and D. Neto (2007), “Six-year comparison between organic IPM and
conventional cotton production systems in the Northern San Joaquin Valley, California”, Renewable
Agriculture and Food Systems, Vol. 22, pp. 30-40.
Swinton, S. and G. Norton (2009), “Economic impacts of IPM”, in Integrated Pest Management,
Radcliffe, E.B., W.D. Hutchison and R.E. Cancelado (eds), Chapter 2, pp. 14-24. Cambridge
University Press.
Tasin, M. (2013). “Semiochemicals in European IPM: Time to Move beyond a Regulatory Bottleneck?”,
paper presented to the International Congress on Pesticide Use and Risk Reduction for Future IPM
in Europe, 19-21 March, Pala Congressi, Riva del Garda.
Thomson, L.J., S. Macfadyen and A.A. Hoffmann (2010), “Predicting the effects of climate change on
natural enemies of agricultural pests”, Biological Control, Vol. 52, pp. 296-306.
Tommasini M.G. (2013), “Application of IPM - The Point of View of Producers”, paper presented to the
International Congress on Pesticide Use and Risk Reduction for Future IPM in Europe, 19-
21 March, Pala Congressi, Riva del Garda.
Tuomisto, H.L., I.D. Hodge, P. Riordan and D.W. Macdonald (2012), “Does organic farming reduce
environmental impacts? – A meta-analysis of European research”, Journal of Environmental
Management, Vol. 112, pp. 309-20.
U.S. Department of Agriculture/Economic Research Service (2014), Annual production expenses by
category, 2010-2014, Nominal (current dollars), last accessed on 30 September 2014 at:
www.ers.usda.gov/data-products/farm-income-and-wealth-statistics/production-expenses.aspx#.VC-
uwfl_uCk
Warner, K.D. (2007), “The quality of sustainability: Agroecological partnerships and the geographic
branding of California winegrapes”, Journal of Rural Studies, Vol. 23, pp. 142–55.
Wetzstein, M.E., W.N. Musser, D.K. Linder and G.K. Douce (1985), “An Evaluation of Integrated Pest
Management with Heterogeneous Participation”, Western Journal of Agricultural Economics,
Vol. 10, pp. 344-53.
Wijnands, F. and H. Brinks (2013), “Farming with Future - Stakeholder Involvement in Development and
Implementation of IPM in the Netherlands”, paper presented to the International Congress on
Pesticide Use and Risk Reduction for Future IPM in Europe, 19-21 March, Pala Congressi, Riva del
Garda.
Wijnands, F.G., H. Brinks, H. Schoorlemmer and J. de Bie (2014), “Integrated Pest Management Adoption
in the Netherlands: Experiences with Pilot Farm Networks and Stakeholder Participation”, in
Peshin, R. and D. Pimentel (eds), “Integrated Pest Management: Experiences with Implementation”,
Global Overview, Vol. 4, pp. 513-54, Springer, Dordrecht.
COM/TAD/CA/ENV/EPOC(2015)5
126
Xia, J.Y. (2010), “Development and expectation of public and green plant protection in China”, China
Plant Protection, Vol. 31, pp. 5-9.
Xia, J.Y. (2008), “Outbreaks of major agricultural pests and the control achievements in China”, China
Plant Protection, Vol. 28, pp. 5-9.
Yang, P.-Y., Z.-H. Zhao and Z.R. Shen (2014), “Experiences with Implementation and Adoption of
Integrated Pest Management in China”, in Peshin, R. and D. Pimentel (eds), “Integrated Pest
Management: Experiences with Implementation”, Global Overview, Vol. 4, Springer Dordrecht.
Yee, J. and W. Ferguson (1996), “Sample Selection Model Assessing Professional Scouting Programs and
Pesticide Use in Cotton Production”, Agribusiness, Vol. 12, pp. 291-300.
Chapter 5. The critical role of modern agricultural biotechnology in scaling out productivity
Al-Deeb, M.A., G.E. Wilde, J.M. Blair and T.C. Todd (2003), “Effect of Bt Corn for corn rootworm
control on non-target soil micro arthropods and nematodes”, Environmental Entomology, Vol. 32,
No. 4, pp. 859 –865.
Alston, J. and D.A. Sumner (2012), Proposition 37 – California Food Labeling Initative: Economic
Implications for Farmers and the Food Industry if the Proposed Initiative were Adopted,
nonprop37.com.
Álvarez-Alfageme, F., F. Bigler and J. Romeis (2011), “Laboratory toxicity studies demonstrate no adverse
effects of Cry1Ab and Cry3Bb1 to larvae of Adalia bipunctata (Coleoptera: Coccinellidae): The
importance of study design”, Transgenic Research, Vol. 20, pp. 457-79.
Arnason, R. (2013), “Canadian grain industry still not clear on GM wheat”, The Western Producer,
www.producer.com/daily/canadian-grain-industry-still-not-clear-on-gm-wheat/
Backus, G., P. Berkhout, D. Eaton, T. de Kleijn, E. van Mil, P. Roza, W. Uffelmann, L. Franke and B. Lotz
(2009), EU policy on GMOs: a quick scan of the economic consequences, LEI Wageningen UR, The
Hague.
Baker, D.B. (1990), “Herbicide concentrations in Ohio’s drinking water supplies: A quantitative
assessment”, in Weigmann, D.L. (ed.), Pesticides in the Next Decade: The Challenges Ahead,
Virginia Water Resources Center and VPI, Blacksburg, Virginia.
Barrows, J., S. Sexton and D. Zilberman (2014a), “Agricultural Biotechnology: The Promise and Prospects
of Genetically Modified Crops”, Journal of Economic Perspectives, Vol. 28, No. 1, pp. 99-120.
Barrows, J., S. Sexton and D. Zilberman (2014b), The Impact of Agricultural Biotechnology on Supply and
Land-Use, Environment and Development Economics, forthcoming.
Beckie, H.J., K.N. Harker, L.M. Hall, S.I. Warwick, A. Légère, P.H. Sikkema, G.W. Clayton,
A.G. Thomas, J.Y. Leeson, G. Séguin-Schwarz and M.-J. Simard (2006), “A decade of herbicide-
resistant crops in Canada”, Canadian Journal of Plant Science, Vol. 86, No. 4, pp. 1,243-1,264.
Beckmann, V., C. Soregaroli and J. Wesseler (2011), “Coexistence of genetically modified (GM) and non-
modified (non GM) crops: Are the two main property rights regimes equivalent with respect to the
coexistence value?”, in Carter, C., G. Moschini and I. Sheldon (eds), “Genetically modified food and
COM/TAD/CA/ENV/EPOC(2015)5
127
global welfare”, Frontiers of Economics and Globalization Series, Vol. 10, Emerald Group
Publishing, Bingley, pp. 201-224.
Beckmann, V., C. Soregaroli and J. Wesseler (2010), “Ex-Ante Regulation and Ex-Post Liability under
Uncertainty and Irreversibility: Governing the Coexistence of GM Crops”, Economics: The Open-
Access, Open-Assessment E-Journal, Vol. 4, 2010-9.
Beckmann, V., C. Soregaroli and J. Wesseler (2006), “Co-Existence Rules and Regulations in the
European Union”, American Journal of Agricultural Economics, Vol. 88, No. 5, pp. 1,193-99.
Benbrook, C. (2012), “Impacts of genetically engineered crops on pesticide use in the U.S. - the first
sixteen years”, Environmental Sciences Europe, Vol. 24, No. 24.
Beckert, M., Y. Dessaux, C. Charlier, H. Darmency, C. Richard, I. Savini and A. Tibi (eds) (2011), Les
variétés végétales tolérantes aux herbicides. Effets agronomiques, environnementaux, socio-
économiques. Expertise scientifique collective, CNRS-INRA (France),
www6.paris.inra.fr/depe/Projets/Varietes-Vegetales-Tolerantes-aux-Herbicides
Bennett, A.B., C. Chi-Ham, G. Barrows, S. Sexton and D. Zilberman (2013), “Agricultural Biotechnology:
Economics, Environment, Ethics, and the Future”, Annual Review of Environment and Resources,
Vol. 3, No. 8, pp. 249-79.
Best, L.B. (1995), “Impacts of Tillage Practices on Wildlife Habitat and Populations” in Farming for a
Better Environment, Soil and Water Conservation Society, Ankeny, Iowa.
Binimelis, R. (2008), “Co-existence of plants and coexistence of farmers: is an individual choice
possible?”, Journal of Agricultural and Environmental Ethics, Vol. 21, pp. 437-57.
Birger, J. (2011), Search for Super Corn Seeks to Limit Nitrogen Use Pollution, Bloomberg.
Birkman, L., E. van den Bosse, I. Carreno, A. Vogt, K. Weistra and W. Ortwijn (2013), Substitute Impact
Assessment of EC Directive Amending Council Honey Directive 2001/110/EC, European Union,
Brussels, p. 62.
Boldrin, M. and D.K. Levine (2008), Against Intellectual Monopoly, Cambridge University Press, New
York.
Bonny, S. (2008), “Genetically modified glyphosate-tolerant soybean in the USA: adoption factors,
impacts and prospects. A review”, Agronomy for Sustainable Development, Vol. 28, No. 1, pp. 21-
32.
Brookes G. and P. Barfoot (2013), GM crops: global socio-economic and environmental impacts 1996-
2011, PG Economics Ltd, UK.
Brookes G. and P. Barfoot (2008), Global impact of biotech crops: Socio-economic and environmental
effects, 1996-2006, AgBioForum 11(1), pp. 21-38.
Bullock, D. S. and J. Lowenberg-DeBoer (2007), “Using spatial analysis to study the values of variable
rate technology and information”, Journal of Agricultural Economics, 58(3); pp. 517-535.
Bullock, D.G., D.S. Bullock, E.D. Nafziger, T.A. Doerge, P.R. Carter, T.A. Peterson and S.R. Paszkiewicz.
1998. “Does Variable Rate Seeding of Corn Pay?” Agronomy Journal, Vol. 90: 830-836.
COM/TAD/CA/ENV/EPOC(2015)5
128
Canola Council of Canada (2014) What is Canola?, <www.canolacouncil.org/oil-and-meal/what-is-
canola#OfficialDefinition>, assessed March 14, 2014.
Cargill (2014), Responsible soy production, www.cargill.com/corporate-responsibility/pov/soy-
production/responsible-soy-production-amazon/index.jsp>, assessed March 14, 2014.
Carriére, Y.; Ellers-Kirk, C.; Sisterson, M.; Antilla, L.; Whitlow, M.; Dennehy, T. J. and B. E. Tabashnik
(2003), Long-term regional suppression of pink bollworm by Bacillus thuringiensis cotton, PNAS
100(4), pp. 1519-1523.
Carter, C. A.; Gruère, G. P.; McLaughlin, P. and M. MacLachlan (2012), California’s Proposition 37:
Effects of Mandatory Labeling of GM Food, ARE Update 15(6), pp. 3 -8.
Carter, C. A. and A. Smith (2007), “Estimating the Market Effect of a Food Scare: The Case of Genetically
Modified Starlink Corn”, Review of Economics and Statistics, Vol. 89, No. 2, pp. 522-33.
Castrale, J.S. (1985), “Responses of Wildlife to Various Tillage Conditions”, Transactions of the North
American Wildlife and Natural Resources Conference, Vol. 50, pp. 142-156.
Conway, G. (1999), “GM Foods can benefit developing countries”, www.biotechknowledge.com
Dammer, K.-H. (2005), Demonstration der Langzeitwirkung bedarfsorientierter Fungizidbehandlung mit
dem CROP-Meter, Bornimer Agrartechnische Berichte, Heft 41 Eigenverlag, Potsdam, (ISSN 0947-
7314), 38 S.
Demont, M., J. Wesseler and E. Tollens (2004), “Biodiversity versus transgenic sugar beets – the one Euro
question”, European Review of Agricultural Economics, Vol. 31. No. 1, pp. 1-18.
Department for Environment, Food and Rural Affairs (2013), Farm Practices Survey Autumn 2012 -
England, www.gov.uk/government/uploads/system/uploads/attachment_data/file/181719/defra-stats-
foodfarm-environ-fps-statsrelease-autumn2012edition-130328.pdf (last accessed 4 February 2014).
Dillen, K. M. Demont, P. Tillie and E. Rodriguez-Cerezo (2012), “Bred for Europe but grown in America:
the case of GM sugar beet”, New Biotechnology, Vol. 30, No. 2, pp. 131-35.
Dunwell, J.M. and C.S. Ford (2005), “Technologies for Biological Containment of GM and Non-GM
Crops”, Defra Contract CPEC 47, London.
EFSA Panel on Genetically Modified Organisms (2010), “Guidance on the environmental risk assessment
of genetically modified plants”, EFSA Journal, Vol. 8, No. 11, p. 1,879.
Ellstrand, N.C. (2001), “When Transgenes Wander, Should We Worry?”, Plant Physiology, Vol. 125,
pp. 1,543-45.
Environmental Biosafety Research (2006), “Special issue on OECD Workshop on Beyond the Blue Book.
Framework for Risk/Safety Assessment of Transgenic Plants”, Environmental Biosafety Research,
Vol. 5, No. 4, pp. 207-43.
European Commission (2011) Report from the Commission to the European Parliament and the Council
on socio-economic implications of GMO cultivation on the basis of Member States contributions, as
requested by the Conclusions of the Environment Council of December 2008, Report from the
COM/TAD/CA/ENV/EPOC(2015)5
129
Commission to the European Parliament and the Council, COM(2011) 0214 final*, 15.4.2011a,
European Commission, Brussels.
European Parliament (2013), “Technology options for feeding 10 billion people - Interactions between
climate change and agriculture, and biodiversity and agriculture”, Science and Technology Options
Assessment (STOA) project, paper prepared by the Institute for European Environmental Policy
(IEEP) in collaboration with BIO Intelligence Service, Ecologic Institute and the Institute for
Environmental Studies, VU University.
EUROSTAT (2013), “Biotechnology patent applications to the EPO by priority year at the national level”,
http://epp.eurostat.ec.europa.eu/cache/ITY_SDDS/EN/pat_esms.htm .
Fawcett, R. and D. Towery (2003), “Conservation tillage and plant biotechnology: how new technologies
can improve the environment by reducing the need to plow”, Purdue University, Conservation
Technology Information Center (CTIC).
Fedorof, N.V., D.S. Battisti, R.N. Beachy, P.J.M. Cooper, D.A. Fischhoff, C.N. Hodges, V.C. Knauf,
D. Lobell, B.J. Mazur, D. Molden, M.P. Reynolds, P.R. Ronald, M.W. Rosegrant, P.A. Sanchez; A.
Vonshak and J.-K. Zhu (2010) Radically Rethinking Agriculture for the 21st Century, Science
Vol. 327, pp. 833-34.
Fernandez-Cornejo, J., S. Wechsler, M. Livingston and L. Mitchell (2014), “Genetically Engineered Crops
in the United States”, U.S. Department of Agriculture, Economic Research Report Number 162,
Washington, D.C.
Finger, R.; N. El benni, T. Kaphengst, C. Evans, S. Herbert, B. Lehmann, S. Morse and N. Stupak (2011),
“A Meta Analysis on Farm-Level Costs and Benefits of GM Crops”, Sustainability, Vol. 3, pp. 743-
62.
Food and Agriculture Organization of the United Nations (FAO) (2014), The results of the FAO survey on
low levels of genetically modified (GM) crops in international food and feed trade, FAO, Rome.
FAO (2003a), Report of the FAO Expert Consultation on the Environmental Effects of Genetically
Modified Crops 16-18 June 2003, FAO, Rome.
FAO (2003b), World Agriculture Towards 2015/2010, FAO, Rome.
Finger, R., N. Benni, T. Kaphengst, C. Evans, S. Herbert, B. Lehmann, S. Morse and N. Stupak (2011), “A
Meta Analysis on Farm-Level Costs and Benefits of GM Crops”, Sustainability, Vol. 3, pp. 743-762.
Frisvold, G.B. and J.M. Reeves (2010), “Resistance Management and Sustainable Use of Agricultural
Biotechnology”, AgBioForum, Vol. 13. No. 4, pp. 343-59.
Frisvold, G.B., A. Boor and J.M. Reeves (2009), “Simultaneous Diffusion of Herbicide Resistant Cotton
and Conservation Tillage”, AgBioForum, Vol. 12, Nos. 3 and 4, pp. 249-57.
Gaines, T.A., W. Zhang, D. Wang, B. Bukun, S.T. Chisholm, D.L. Shaner, S.J. Nissen, W.L. Patzoldt,
P.J. Tranel, A.S. Culpepper, T.L. Grey, T.M. Webster, W.K. Vencill, R.D. Sammons, J. Jiang,
C. Preston, J.E. Leach and P. Westra (2010), “Gene amplification confers glyphosate resistance in
Amaranthus palmeri”, Proceedings of the National Academy of Sciences, Vol. 107, No. 3, pp. 1,029-
34.
COM/TAD/CA/ENV/EPOC(2015)5
130
Gebbers, R. and V.I. Adamchuk (2010), “Precision Agriculture and Food Security”, Science, Vol. 327,
pp. 828-31.
GMO Compass (2014), Short description of the GM plant, <www.gmo-compass.org/eng/gmo/db/>,
assessed 14 March 2014.
Gruère, G. and D. Sengupta (2009), “GM-free private standards and their effects on biosafety decision-
making in developing countries”, Food Policy, Vol. 34, pp. 399-406.
Gueritaine, G., M. Sester, F. Eber, A.M. Chevre and H. Darmency (2002), “Fitness of backcross six
hybrids of hybrids between transgenic oilseed rape (Brassica napus) and wild radish (Raphanus
raphanistrum)”, Molecular Ecology, Vol. 11, pp. 1,419-26.
Gusta, M., S.J. Smyth, K. Belcher, P.W.B. Phillips and D. Caste (2011), “Economic Benefits of
Genetically Modified Herbicide Tolerant Canola for Producers”, AgBioForum, Vol. 14, No. 1, pp. 1-
13.
Hall, C., B. Knight and S. Ringrose (2013), “What have been the farm-level economic impacts of the
global cultivation of GM crops? Systematic Review”, Environmental Evidence, ”, CEE Review 11-
002, www.environmentalevidence.org/wp-content/uploads/2014/07/CEE11-002.pdf
Hall, A. and K. Dorai (2010), “The Greening of Agriculture: Agricultural innovation and Sustainable
Growth”, paper prepared for OECD, www.oecd.org/tad/sustainable-agriculture/48268377.pdf
Henkel, J. and S.M. Maurer (2009), “Parts, property and sharing”, Nature Biotechnology, Vol. 27, No. 12,
pp. 1,095-98.
Henkel, J., S. Schöberl and O. Alexy (2013), “The emergence of openness: How and why firms adopt
selective revealing in open innovation”, Research Policy,
http://dx.doi.org/10.1016/j.respol.2013.08.014.
Herring, R. (2009), “Persistent Narratives: Why is the “Failure of Bt Cotton in India” Story Still with Us?”,
AgBioForum, Vol. 12, No. 1, pp. 14-22.
Herring, R. (2008), “Opposition to transgenic technologies: ideology, interests and collective action
frames”, Nature Genetics, Vol. 9, pp. 458-63.
Hoenen, S., C. Kolympiris, W. Schoenmakers and N. Kalaitzandonakes (2015), “The Diminishing
Signaling Value of Patents between Early Rounds of Venture Capital Financing”, Research Policy,
forthcoming.
Hossain, F., C.E. Pray, Y. Lu, J. Huang, C. Fan and R. Hu (2004), “Genetically Modified Cotton and
Farmers’ Health in China”, International Journal of Occupational Environmental Health, Vol. 10,
pp. 296-303.
Huang, J., R. Hu, S. Rozelle, and C. Pray (2005), “Insect-Resistance GM Rice in Farmers’ Fields:
Assessing Productivity and Health Effects in China”, Science, Vol. 308, pp. 688-90.
James, C. (2011), The Global Status of Commercialized Biotech/GM Crops: 2011, ISAAA Brief No. 43,
Ithaca, New York.
COM/TAD/CA/ENV/EPOC(2015)5
131
Jenczewski, E., J. Ronfort and A.M. Chevre (2003), “Crop-to-wild gene flow, introgression and possible
fitness effects of transgenes”, Environmental Biosafety Research, Vol. 2, pp. 9-24.
Johnson, L. (2014), McDonald's poised to embrace new GMO potato farming in 2014 and beyond,
www.naturalnews.com/043419_mcdonalds_gmo_potatoes_french_fries.html.
Jones, J.D.G., K. Wittek, W. Verwij, F. Jupe, D. Cooke, S. Dorling, L. Tomlinson, M. Smoker, S. Perkins
and S. Foster (2014), “Elevating crop disease resistance with cloned genes”, Philosophical
Transactions of the Royal Society B, 369, 20130087, http://dx.doi.org/10.1098/rstb.2013.0087.
Jongsma, M.A., F. Gould, M. Legros, L. Yang, J.J.A. van Loon and M. Dicke (2010), “Insect oviposition
behavior affects the evolution of adaptation to Bt crops: consequences for refuge policies”,
Evolutionary Ecology, Vol. 24, No. 5.
Karlen, D.L. (1995), “Tillage effects on soil fertility”, in Farming for a Better Environment, Soil and
Water Conservation Society, Ankeny, IA.
Karlen, D.L. and A.N. Sharpley (1994), “Management strategies for sustainable soil fertility”, in
Hatfield, J.L. and D.L. Karlen (eds), Sustainable Agricultural Systems, Lewis Publishing, Boca
Raton, FL.
Khanna, M., O. Epough and R. Hornbaker (1999), “Site-specific crop management: Adoption patterns and
incentives”, Review of Agricultural Economics, Vol. 21, No. 2.
Kleter, G.A.; Bhula, R.; Bodnaruk, K.; Carazo, E.; Felso, A. S.; Harris, C. A.; Katayama, A.; Kuiper, H.
A.; Racke, K. D.; Rubin, B.; Shevah, Y.; Stephenson, G. R.; Tanaka, K.; Unsworht, J.; Wauchope, R
D. and S. Wong (2007), Altered pesticide use on transgenic crops and the associated general impact
from an environmental perspective, Pest Management Science 63, pp. 1107–1115.
Kleter, G. and H. Kuiper (2005), “Assessing the Environmental Impact of Changes in Pesticide Use on
Transgenic Crops”, in Wesseler, J. (ed.), “Environmental Costs and Benefits of Transgenic Crops”,
Wageningen UR Frontis Series, Vol. 7, Springer, Dordrecht.
Klumper, W. and M. Qaim (2014), “A meta-analysis of the impacts of genetically modified crops”, PLoS One 9,
Knight, S., P. Miller and J. Orson (2009), “An up-to-date cost/benefit analysis of precision farming
techniques to guide growers of cereals and oilseeds”, HGCA Research Review 2009, No. 71, Home-
Grown Cereals Authority (HGCA), www.hgca.com/media/276988/rr71-final-project-report.pdf (last
accessed 10 February 2014).
Knox, O., A. McVittie, R. Walker, C. Hall, E. Booth and B. Knight (2012), “What are the environmental
impacts of the global cultivation of GM crops?”, paper prepared for DEFRA.
Kuiper, H.A., E.J. Kok and H.V. Davies (2013), “New EU Legislation for Risk Assessment of GM Food:
No Scientific Justification for Mandatory Animal Feeding Trials”, Plant Biotechnology Journal,
Vol. 11, No. 7, pp. 781-84.
Lu, Y., K. Wu, Y. Jiang, B. Xis, P. Li, H. Feng, K.A.G. Wyckhuys and Y. Guo (2010), “Mirid Bug
Outbreaks in Multiple Crops Correlated with Wide-Scale Adoption of Bt Cotton in China”, Science,
Vol. 328, pp. 1151-53.
COM/TAD/CA/ENV/EPOC(2015)5
132
Marra, M.C. and N.E. Piggott (2006), “The value of non-pecuniary characteristics of crop biotechnologies:
a new look at the evidence” in Just, R.E, J.D. Alston and D. Zilberman (eds), Regulating
Agricultural Biotechnology: Economics and Policy, Springer, New York.
Meyer-Aurich, A., A. Weersink, M. Gandorfer and P. Wagner (2010), “Optimal site-specific fertilization
and harvesting strategies with respect to crop yield and quality response to nitrogen”, Agricultural
Systems, Vol. 103.
Motavalli, P.P., R.J. Kremer, M. Fang and N.E. Means (2004), “Impact of Genetically Modified Crops and
Their Management on Soil Microbially Mediated Plant Nutrient Transformations”, Journal of
Environmental Quality, Vol. 33, No. 3, pp. 816-24.
Möbius, J. (2012), “Görminer Landwirtschaftsbetrieb Peenetal”, Neue Landwirtschaft, Vol. 7, p. 45.
National Research Council (NRC) (2010), The Impact of Genetically Engineered Crops on Farm
Sustainability in the United States, National Academy Press, Washington, D.C.
Nickson, T.E. (2005), “Crop biotechnology – the state of play”, in Poppy, G.M. and M.J. Wilkinson (eds),
Gene flow from GM plants, Blackwell, Oxford.
OECD (2013), Biotechnology for the Environment in the Future, OECD Science, Technology and Policy
Papers No. 3, OECD Publishing, http://dx.doi.org/10.1787/5k4840hqhp7j-en
OECD (2009), The Bioeconomy to 2030, OECD Publishing, Paris, www.oecd.org/futures/long-
termtechnologicalsocietalchallenges/thebioeconomyto2030designingapolicyagenda.htm .
OECD (2008), Compendium of Patent Statistics, OECD Publishing, Paris.
OECD (1993) Safety Considerations for Biotechnology: Scale-Up of Crop Plants, OECD Publishing,
Paris.
Oleson, J.E., P. Sorensen, I.K. Thomson, J. Erikson, A.G. Thomsen and J. Berntsen (2004), “Integrated
Nitrogen Input Systems in Denmark” in Mosier, A.R., J.K. Syers and J.R. Freney, Agriculture and
the nitrogen cycle, Island press, Washington, Covelo, London, pp. 129-40.
Pannell, D.J. (2006), Flat Earth Economics: The Far-reaching Consequences of Flat Payoff Functions in
Economic Decision Making, Review of Agricultural Economics, Vol. 28, No. 4, pp. 553-66.
Pannell, D.J., G.R. Marshall, N. Barr, A. Curtis, F. Vanclay and R. Wilkinson (2006), “Understanding and
promoting adoption of conservation practices by rural landholders”, Australian Journal of
Experimental Agriculture, Vol. 46, pp. 1,407-24.
Pemsl, D., A.P. Gutierrez and H. Waibel (2008), “The economics of biotechnology under ecosystem
disruption”, Ecological Economics, Vol. 66, pp. 177–83.
Pilson, D. and H.R. Prendeville (2004), “Ecological effects of transgenic crops and the escape of
transgenes into wild populations”, Annual Review of Ecology, Evolution, and Systematics, Vol. 35.
Protrykus, I. (2010), “Lessons from the ‘Humanitarian Golden Rice’ project: regulation prevents
development of public good genetically engineered crop products”, New Biotechnology, Vol. 27,
No. 5.
COM/TAD/CA/ENV/EPOC(2015)5
133
Qaim, M. (2009), “The Economics of Genetically Modified Crops”, Annual Review of Resource
Economics, Vol. 1, No. 3, pp. 1-3; 29.
Qaim, M. and G. Traxler (2005), “Roundup Ready soybeans in Argentina: farm level and aggregate
welfare effects”, Agricultural Economics, Vol. 32, pp. 73-86.
Qaim, M., A.J. Stein and J.V. Meenakshi (2007), “Economics of biofortification”, Agricultural Economics,
Vol. 37(S1), pp. 119-33.
Rao, S.C. and T.H. Dao (1996), “Nitrogen placement and tillage effects on dry matter and nitrogen
accumulation and redistribution in winter wheat”, Agronomic Journal, Vol. 88.
Ronald, P.C. and R.W. Adamchak (2008), Tomorrow's Table: Organic Farming, Genetics, and the Future
of Food, Oxford University Press, p. 232.
Roelofsen et al. (2011), “Stakeholder interaction within research consortia on emerging technologies:
Learning how and what?”, Research Policy, Vol. 40, pp. 341–54.
Rosegrant, M.W.; J. Koo, N. Cenacchi, C. Ringler, R. Robertson, M. Fisher, C. Cox, K. Garrett,
N.D. Perez and P. Sabbagh (2014), Food Security in a World of Growing Natural Resource
Scarcity: The Role of Agricultural Technologies for Maize, Rice and Wheat, IFPRI,
Washington, D.C.
Saxena, D. and G. Stotzky (2001), “Bacillus thuringiensis (Bt) toxin released from root exudates and
biomass of Bt corn has no apparent effect on earthworms, nematodes, protozoa, bacteria and fungi in
soil”, Soil Biology and Biochemistry, Vol. 33, pp. 1225-30.
Scatasta, S. (2005), “Comment on Van de Wiel, Groot and Den Nijs: Gene flow from crop to wild plants
and its population-ecological consequences in the context of GM-crop biosafety, including some
recent experiences from lettuce” in Wesseler, J. (ed.), “Environmental Costs and Benefits of
Transgenic Crops”, Wageningen UR Frontis Series, Vol. 7, Springer, Dordrecht, pp. 143-62.
Scatasta, S., J. Wesseler and M. Demont (2006), “A Critical Assessment of Methods for Analysis of Social
Welfare Impacts of Genetically Modified Crops: a Literature Survey”, Working Paper, Mansholt
Graduate School MWP-27, Wageningen University.
Scoones, I. (2002), “Agricultural Biotechnology and Food Security: Exploring the Debate”, IDS Working
Paper No. 145, Institute of Development Studies, Sussex.
Secchi, S., T.M. Hurley, B.A. Babcock and R.L. Hellmich (2006), “Managing European Corn Borer
Resistance to Bt Corn with Dynamic Refuges”, in R.D. Just, J.M. Alston and D. Zilberman (eds),
Regulating Biotechnology: Economics and Policy, Springer, New York, pp. 559-78.
Serecon Management Consulting Inc. (2005) Herbicide Tolerant Volunteer Canola Management in
Subsequent Crops. Canola Council of Canada (CCC), Winnipeg, Manitoba.
Service, R.F. (2007), “A Growing Threat Down on the Farm”, Science, Vol. 316, pp. 114-17.
Sexton, S. and D. Zilberman (2011) How agricultural biotechnology boosts food supply and
accommodates biofuels, Technical Report, National Bureau of Economic Research,
Washington, D.C.
COM/TAD/CA/ENV/EPOC(2015)5
134
Smal, M., P. Zambrano, G. Gruère, J. Falck-Zepeda, I. Matuschke, D. Horna, L. Nagarajan,
I. Yerramareddy and H. Jones (2009), “Measuring the Economic Impact of Transgenic Crops in
Developing Countries Agriculture during the First Decade”, Food Policy Review, Vol. 10, IFPRI,
Washington, D.C.
Smart, R., S. Leimgruber and J. Wesseler (2012), “Approval Processes: comparing Canada, the EU, South
Africa and the US”, paper presented at the 2012 ICABR International Conference, Ravello, Italy.
Smyth, S.J., M. Gusta, K. Belcher, P.W.B. Phillips and D. Caste (2011a), Environmental Impacts from
Herbicide Tolerant Canola Production in Western Canada”, Agricultural Systems, Vol. 104.
Smyth, S.J., M. Gusta, K. Belcher, P.W.B. Phillips and D. Caste (2011b), “Changes in Herbicide Use
Following the Adoption of Herbicide Tolerant Canola in Western Canada”, Weed Technology
Vol. 25.
Speiser et al. (2012), “Sustainability assessment of GM crops in a Swiss agricultural context”, Agronomy
for Sustainable Development, Vol. 33, Issue 1.
Snow, A.A., B. Andersen and R.B. Jorgensen (1999), “Costs of transgenic herbicide resistance
introgressed from Brassica napus into weedy B. rapa”, Molecular Ecology, Vol. 8, pp. 605-15.
Sørensen, C.G., N.A. Madsen and B.H. Jacobsen (2005), “Organic Farming Scenarios: Operational
Analysis and Costs of implementing Innovative Technologies”, Biosystems Engineering, Vol. 91,
No. 2.
Stein, A.J. and E. Rodriguez-Cerezo (2009), The global pipeline of new GM crops, JRC Scientific and
Technical Reports, Office for Official Publications of the European Communities, Luxembourg.
Tilman, D.; Cassman, K. G.; Matson, P. A.; Naylor, R. and S. Polasky (2002), “Agricultural sustainability
and intensive production practices”, Nature, Vol. 418, pp. 671–77.
Tramper, J. and Y. Zhu (2011), Modern Biotechnology, Wageningen Academic Publishers, The
Netherlands.
Traxler, G. (2004), “The Economic Impacts of Biotechnology-based Technological Innovations”, ESA
Working Paper No. 04-08, FAO, Rome.
United Nations (UN) (2008), UN Millennium Ecosystem Assessment, retrieved from
www.millenniumassessment.org/en/Index.aspx.
United States - Environmental Protection Agency (US-EPA) (1986), Pesticide Fact Sheet: Glyphosate,
No. 173, EPA 540/FS-88-124, Office of Pesticide Programs, Washington, D.C.
Venus, T., Kalaitzandonakes, N. and J. Wesseler (2012), “Ist das Angebot von Nahrungsmitteln ‘Ohne
Gentechnik’ wirtschaftlich Nachhaltig?”, Quarterly Journal of Economic Research, Vol. 81. No. 4.
Venus, T.; Casadamon, R.; Soregaroli, C. and J. Wesseler (2011), Comparison of Bt and Non-Bt maize
cultivation gross margin: a case study of maize producers from Italy, Spain and Germany,
FuturAgra, Rome.
Vermeulen, S.J.; Campbell, B.M. and J.S.I. Ingram (2012), Climate Change and Food Systems, Annual
Review of Environmental Resources, 37, pp. 195-222.
COM/TAD/CA/ENV/EPOC(2015)5
135
Von Blottnitz, H.; Rabl, A.; Boiadjiev, D.; Taylor, T. and S. Arnold (2006), Damage Costs of Nitrogen
Fertilizer in Europe and their Internalization, Journal of Environmental Planning and Management,
49(3), pp. 413 – 433.
Waibel, H. and G. Fleischer (1998), Kosten und Nutzen des chemischen Pflanzenschutzes in der deutschen
Landwirtschaft aus gesamtwirtschaftlicher Sicht, Vauk, Kiel, Germany.
Ward, C.; Flanders, A.; Isengildina, O. and F. White (2002), Efficiency of alternative technologies and
cultural practices for cotton in Georgia, AgBioForum, 5(1), pp. 10-13.
Wesseler, J. and N. Kalaitzandonakes (2011), Present and Future EU GMO policy, in Oskam, A.;
Meesters, G.; Silvis, H. (eds.), EU Policy for Agriculture, Food and Rural Areas. Second Edition,
Wageningen Academic Publishers, The Netherlands; pp. 23-323 – 23-332.
Wesseler, J. and D. Zilberman (2004), The Economic Power of the Golden Rice Opposition, Environment
and Development Economics, DOI: 10.1017/S1355770X1300065X.
Wesseler, J.; Scatasta, S,.; and E. Nillesen (2007), The Maximum Incremental Social Tolerable Irreversible
Costs (MISTICs) and other Benefits and Costs of Introducing Transgenic Maize in the EU-15,
Pedobiologia 51(3), pp. 261-269.
Wheatley, D. M. ; Macleod, D. A.; and R. S. Jessop (1995), Influence of Tillage Treatments on N2 Fixation
of Soybean, Soil Biology Biochemistry 27(4/5), pp. 571-574.
Wolfenbarger L. L,; Naranjo, S. E.; Lundgren, J. G.; Bitzer, R. J. and L. S. Watrud (2008), Bt Crop Effects
on Functional Guilds of Non-Target Arthropods: A Meta-Analysis, PLoS ONE, 3(5).
Wu, F. (2006), Mycotoxin reduction in Bt corn: potential economic, health, and regulatory impacts,
Transgenic Research 15, pp. 277-289.
World Health Organization (2001), Macroeconomics and Health: Investing in Health for Economic
Development. Report of the Commission on Macroeconomics and Health, World Health
Organization , Geneva.
Wu, K.; Lu, Y.; Feng, H.; Jiang, Y. and J. Zhao (2008), “Suppressing of cotton bollworm in multiple crops
in China in areas with Bt toxin-containing cotton”, Science, Vol. 321.
Zablotowicz, R. M. and K. N. Reddy (2007), Nitrogenase activity, nitrogen content, and yield responses to
glyphosate in glyphosate-resistant soybean, Crop Protection 26(3), pp. 370-376.
Zilberman, D.; Kaplan, S.; Kim, E. and G. Waterfield (2013), Lessons from the California GM Labeling
Proposition on the State of Crop Biotechnology, Paper presented at the Agricultural and Applied
Economics Association’s 2013 AAEA and CAES Joint Annual Meeting, Washington, DC.
Chapter 6. Precision agriculture – a new revolution is emerging?
Adrian, A.M., S.H. Norwood and P.L. Mask (2005), “Producers’ perceptions and attitudes toward
precision agriculture technologies”, Computers and Electronics in Agriculture, Vol. 48, No. 3.
pp. 256-271.
COM/TAD/CA/ENV/EPOC(2015)5
136
Aubert, B.A.; Schroeder, A. and J. Grimaudo (2012), IT as enabler of sustainable farming: An empirical
analysis of farmers' adoption decision of precision agriculture technology, Decision Support
Systems, 54 (1); pp. 510-520.
Auernhammer, H. (2001), Precision farming- the environmental challenge, Computers and Electronics in
Agriculture, 30, pp. 31-43.
Bachmaier, M. and M. Gandorfer (2009), A Conceptual Framework for Judging the Precision Agriculture
Hypothesis with Regard to Site-Specific Nitrogen Application, Precision Agriculture, Vol. 10, No. 2,
pp. 95-110.
Batte, M. (2003), “Precision farming and land leasing practices”, Journal of the ASFMRA, Vol. 66, pp. 55-
63.
Beckmann, V., C. Soregaroli and J. Wesseler (2010), Ex-Ante Regulation and Ex-Post Liability under
Uncertainty and Irreversibility: Governing the Coexistence of GM Crops, Economics: The Open-
Access, Open-Assessment E-Journal, Vol. 4, 2010-9.
Beckmann, V., C. Soregaroli and J. Wesseler (2006), “Co-Existence Rules and Regulations in the
European Union”, American Journal of Agricultural Economics, Vol. 88, No. 5, pp. 1193-1199.
Benbrook, C. (2012), “Impacts of genetically engineered crops on pesticide use in the U.S. -- the first
sixteen years”, Environmental Sciences Europe, Vol. 24, No. 24.
Beckert, M., Y. Dessaux, C. Charlier, H. Darmency, C. Richard, I. Savini, A. Tibi (editors), (2011), Les
variétés végétales tolérantes aux herbicides. Effets agronomiques, environnementaux, socio-
économiques. Expertise scientifique collective, CNRS-INRA (France),
www6.paris.inra.fr/depe/Projets/Varietes-Vegetales-Tolerantes-aux-Herbicides
Bennett, A.B., C. Chi-Ham, G. Barrows, S. Sexton and D. Zilberman (2013), “Agricultural Biotechnology:
Economics, Environment, Ethics, and the Future”, Annual Review of Environment and Resources,
Vol. 3, No. 8, pp. 249-79.
Best, L.B. (1995), Impacts of Tillage Practices on Wildlife Habitat and Populations. In Farming for a
Better Environment, Soil and Water Conservation Society, Ankeny, Iowa.
Biermacher, J.T., B.W. Brorsen, F.M. Epplin, J.B. Solie and W.R. Raun (2009), “The economic potential
of precision nitrogen application with wheat based on plant sensing”, Agricultural Economics,
Vol. 40, pp. 397-407.
Binimelis, R. (2008), “Coexistence of plants and coexistence of farmers: is an individual choice possible?”,
Journal of Agricultural and Environmental Ethics, Vol. 21, pp. 437-57.
Birger, J. (2011), Search for Super Corn Seeks to Limit Nitrogen Use, Pollution, Bloomberg.
Birkman, L., E. van den Bosse, I. Carreno, A. Vogt, K. Weistra and W. Ortwijn (2013), Substitute Impact
Assessment of EC Directive Amending Council Honey Directive 2001/110/EC, European Union,
Brussels, p. 62.
Blevins, R.L., G.W. Thomas, M.S. Smith, W.W. Frye and P.L. Cornelius (1983), “Changes in soil
properties after 10 years of continuous no-tilled and conventionally tilled corn”, Soil & Tillage
Research, Vol. 3, pp. 135-46.
COM/TAD/CA/ENV/EPOC(2015)5
137
Boldrin, M. and D.K. Levine (2008), Against Intellectual Monopoly, Cambridge University Press; NY.
Bongiovanni, R. and J. Lowenberg-DeBoer (2004), “Precision Agriculture and Sustainability”, Precision
Agriculture, Vol. 5; pp. 359-387.
Bongiovanni, R. and J. Lowenberg-Deboer (2000), “Economics of Variable Rate Lime in Indiana”,
Precision Agriculture, Vol. 2, pp. 55-70.
Bowman, K. (2008), “Economic and environmental analysis of converting to Controlled Traffic Farming”,
Proceedings, 6th Australian Controlled Traffic Farming Conference, Dubbo, NSW, Australian
Controlled Traffic Farming Association, www.ctfsolutions.com.au/ebm3-
doc/132275/Bowman%20Economics.pdf
Boyer, C.N., B. Wade Brorsen, J.B. Solie and W.R. Raun (2011), “Profitability of variable rate nitrogen
application in wheat production”, Precision Agriculture, Vol. 12, pp. 473-487.
Bramley, R. (2009), “Lessons from nearly 20 years of Precision Agriculture research, development, and
adoption as a guide to its appropriate application”, Crop & Pasture Science, Vol. 60, pp. 197-217.
Bramley, R. and S. Trengove (2013), “Precision Agricutlure in Australia: present status and recent
developments”, Engenharia Agrícola, Vol. 33, No. 3, pp. 575-588.
Bullock, D. S. and J. Lowenberg-DeBoer (2007), “Using spatial analysis to study the values of variable
rate technology and information”, Journal of Agricultural Economics, 58(3); pp. 517-535.
Bullock, D.G., D.S. Bullock, E.D. Nafziger, T.A. Doerge, P.R. Carter, T.A. Peterson and S.R. Paszkiewicz.
1998. “Does Variable Rate Seeding of Corn Pay?” Agronomy Journal, Vol. 90: 830-836.
DeJonge, K.C.; Kaleita, A.L. and K.R. Thorp (2007), Simulating the effects of spatially variable irrigation
on corn yields, costs, and revenue in Iowa, Agricultural Water Management, 92; pp.99-109.
Department for Environment, Food and Rural Affairs (2013), Farm Practices Survey Autumn 2012-
England, www.gov.uk/government/uploads/system/uploads/attachment_data/file/181719/defra-stats-
foodfarm-environ-fps-statsrelease-autumn2012edition-130328.pdf (last accessed 4 February 2014).
Diekmann, F. and M. Batte (2010), “2010 Ohio Farming Practices Survey: Adoption and Use of Precision
Farming Technology in Ohio”, Report No AEDE-RP-0129-10
Dillon, C.R. and Y. Kusunose (2013), Dispelling misperceptions regarding variable rate application,
Precision agriculture ’13. J. Stafford, Wageningen Academic Publishers; pp. 769-776.
Evans, R.G.; LaRue J.; Stone K.C. and B.A. King (2013), Adoption of site-specific variable rate sprinkler
irrigation systems, Irrigation Science, 31; pp. 871-887.
Gandorfer, M.; Meyer- Aurich, A. and M. Kapfer (2011), Ökonomische Aspekte von Precision Farming-
aktueller Stand und Perspektiven, Jahrbuch der Österreichischen Gesellschaft für Agrarökonomie,
20; pp. 34-43.
Gebbers, R. and V. I. Adamchuk (2010), Precision Agriculture and Food Security, Science, 327; pp. 828-
831.
COM/TAD/CA/ENV/EPOC(2015)5
138
Gerhards, R. and H. Oebel (2006), Practical experiences with a system for site-specific weed control in
arable crops using real-time image analysis and GPS-controlled patch spraying, Weed Research,
46; pp. 185-193.
Godwin, R., T. Richards, G. Wood, J. Welsh and S. Knight (2003), “An Economic Analysis of the Potential for
Precision Farming in UK Cereal Production”, Biosystems Engineering, Vol. 84.
Griffin, T.; Bongiovanni, R. and J. Lowenberg-DeBorer (2010), Worldwide Adoption of Precision
Agriculture Technology: The 2010 Update, presented at the 10th International Conference on
Precision Agriculture, Denver, CO, 22 July 2010.
Hall, A. and K. Dorai (2010), The Greening of Agriculture: Agricultural innovation and Sustainable
Growth, Paper prepared for OECD, www.oecd.org/tad/sustainable-agriculture/48268377.pdf
Henkel, J.; Schöberl, S. and O. Alexy (2013), The emergence of openness: How and why firms adopt
selective revealing in open innovation, Research Policy,
http://dx.doi.org/10.1016/j.respol.2013.08.014.
Holland, J.K.; Erickson, B. and D.A. Widmar (2013), 2013 Precision Agricultural Services Dealership
survey results, Department Of Agricultural Economics, Purdue University, West Lafayette.
Jochinke, D.C.; Noonon, B. J.; Wachsmann, N.G. and R.M. Norton (2007), The adoption of precision
agriculture in an Australian broadacre cropping system—Challenges and opportunities, Field Crops
Research, 104 (1-3); pp. 68-76.
Karlen, D. L. (1995), Tillage effects on soil fertility, in Farming for a Better Environment, Soil and Water
Conservation Society, Ankeny, IA.
Khanna, M., O Epough and R. Hornbaker (1999), “Site-specific crop management: Adoption patterns and
incentives”, Review of Agricultural Economics, Vol. 21, No. 2.
Kingwell, R. and A. Fuchsbichler (2011), The whole-farm benefits of controlled traffic farming: An
Australian appraisal, Agricultural Systems, 104; pp. 513-521.
Kutter, T.; Tiemann, S.; Siebert, R. and S. Fountas (2011), The role of communication and co-operation in
the adoption of precision farming, Precision Agriculture, 12; pp. 2-17.
Lamb, D.W.; Fraizer, P. and P. Adams (2008), Improving pathways to adoption: Putting the right P's in
precision agriculture, Computers and Electronics in Agriculture, 61 (1); pp. 4-9.
Lambert, D.M., and J. Lowenberg-DeBoer (2000), Precision agriculture profitability review, West
Lafayette: Site Specific Management Center, School of Agriculture, Purdue University, URL:
http://agriculture.purdue.edu/SSMC (last accessed 10 February 2014).
Lawes, R.A. and M.J. Robertson (2011), Whole farm implications on the application of variable rate
technology to every cropped field, Field Crops Research, 124; pp. 142-148.
Maheswari, R.; Ashok, K.R. and M. Prahadeeswaran (2008), Precision Farming Technology, Adoption
Decisions and Productivity of Vegetables in Resource-Poor Environments, Agricultural Economic
Research Review, 21; pp. 415-424.
COM/TAD/CA/ENV/EPOC(2015)5
139
Maine, N; Lowenberg-DeBoer, J; Nell, W.T. and Z.G. Alemu (2010), Impact of variable-rate application
of nitrogen on yield and profit: a case study from South Africa, Precision Agriculture, 11; pp. 448-
463.
Mandel, R., R. Lawes and M. Robertson (2011), “What’s preventing growers from implementing precision
agriculture (PA)?”, in Paterson, J. and C. Nicholls, Agribusiness Crop updates 2011, Perth, pp. 148-
152.
Marchant, B., Oliver, M., Bishop, T. and B. Whelan (2013), The economics of precision agriculture, in M.
Oliver, T. Bishop, B. Marchant: Precision Agriculture for Sustainability and Environmental
Protection. Routledge, Abington, UK.
McBratney, A.; Whelan, B. and T. Ancev (2005), Future Directions of Precision Agriculture, Precision
Agriculture, 6; pp. 7-23.
McBride, W.D. and S.G. Daberkow (2003), Information and the Adoption of Precision Farming
Technologie, Journal of Agribusiness, 1; pp. 21-38.
Meyer-Aurich, A.; Gandorfer, M. and A. Heißenhuber (2008), Economic analysis of precision farming
technologies at the farm level: Two German case studies, in: O. W. Castalonge: Agricultural
Systems: Economics, Technology, and Diversity. Nova Science Publishers; Hauppage NY, USA.
Meyer-Aurich, A., Weersink, A., Gandorfer, M., Wagner, P. (2010), “Optimal site-specific fertilization
and harvesting strategies with respect to crop yield and quality response to nitrogen”, Agricultural
Systems, Vol. 103.
Molden, D. (2007), Water for Food, Water for Life: A Comprehensive Assessment of Water Management;
London, UK: Earthscan.
Morari, F., S., Loddo, P., Berzaghi, J. C., Ferlito, A., Berti, L., Sartori, G., Visioli, N., Marmiroli, D.,
Piragnolo, Mosca. G. (2013), Understanding the effects of site-specific fertilization on yield and
protein content in durum wheat, in: Stafford, J.V.: Precision agriculture’13, Wageningen Academic
Publishers, 2013; pp. 321-327.
Möbius, J. (2012), Görminer Landwirtschaftsbetrieb Peenetal, Neue Landwirtschaft, 7; p. 45.
Oleson, J., E., Sorensen, P., Thomson, I.K., Erikson, J., Thomsen A.G. and J. Berntsen (2004), Integrated
Nitrogen input systems in Denmark, in: Mosier, A.R., Syers, J.K., Freney, J.R.: Agriculture and the
nitrogen cycle. Island press, Washington, Covelo, London; pp. 129-140.
Pannell, D.J. (2006), Flat Earth Economics: The Far-reaching Consequences of Flat Payoff Functions in
Economic Decision Making, Review of Agricultural Economics, 28 (4); pp. 553-566.
Pannell, D.J.; Marshall, G.R; Barr, N.; Curtis, A.; Vanclay, F. and R. Wilkinson (2006), Understanding and
promoting adoption of conservation practices by rural landholders, Australian Journal of
Experimental Agriculture, 46; pp. 1407-1424.
Pedersen, S.M.; Fountas, S.; H. Have and B.S. Blackmore (2006), Agricultural robots – system analysis
and economic feasibility, Precision Agriculture, 7; pp. 295-308.
Pemsl, D.; Gutierrez, A. P. and H. Waibel (2008), The economics of biotechnology under ecosystem
disruption, Ecological Economics 66, pp. 177–183.
COM/TAD/CA/ENV/EPOC(2015)5
140
Pierce, F.J. and P. Nowak (1999), Aspects of Precision Agriculture, Advances in Agronomy, 67.
Rao, S. C. and T. H. Dao (1996), Nitrogen placement and tillage effects on dry matter and nitrogen
accumulation and redistribution in winter wheat, Agronomic Journal, 88, 365-371.
Reichardt, M. (2010), Precision Farming in der deutschen Landwirtschaft – eine GIS – gestützte Analyse,
Dissertation, Ruhr-Univeristät, Bochum, (URL: http://www-brs.ub.ruhr-uni-
bochum.de/netahtml/HSS/Diss/ReichardtMaike/diss.pdf; 4 February 2014).
Reichardt, M. and C. Jürgens (2009), Adoption and future perspective of precision farming in Germany:
results of several surveys among different agricultural target groups, Precision Agriculture, 10; pp.
73-94.
Reichhardt, M.; Jürgens, C.; Klöble, U.; Hüter, J.; and K. Moser (2009), Dissemination of precision
farming in Germany: acceptance, adoption, obstacles, knowledge transfer and training activities,
Precision Agriculture, 10; pp. 525-545.
Roberts, R.K.; English, B.C.; Larson, J.A.; Cochran, R.L.; Goodman, C.W.R.; Larkin, S.L.; Marra, M.C.;
Martin, S.W.; Shurley, W.D. and J.M. Reeves (2004), Adoption of Site- Specific Information and
Variable- Rate Technologies in Cotton Precision Farming, Journal of Agriculture and Applied
Economics, 36 (1); pp. 143-185.
Robertson, M.J.; Llewellyn, R.S.; Mandel, R.; Laws, R.; Bramley, R. G.V.; Swift, L.; Metz, N. and C.
O‘Callaghan (2012), Adoption of variable rate fertiliser application in the Australian grains industry:
status, issues and prospects, Precision Agriculture, 13; pp. 181-199.
Rutt, K. (2011), Precision Farming braucht einen Neuanfang, DLG-Mitteilungen9/2011
Schimmelpfenning, D. and R. Ebel (2011), “On the Doorstep of the Information Age- Recent Adoption of
Precision Agriculture”, U.S. Department of Agriculture, Economic Research Service, Economic
Information Bulletin No. 80, www.ers.usda.gov/media/81195/eib80_1_.pdf
Schneider, M. and P. Wagner (2008), Ökonomische Effekte der teilflächenspezifischen Bewirtschaftung
auf betrieblicher Ebene, in: A. Werner, F. Dreger and J. Schwarz: Informationsgeleitete
Pflanzenproduktion mit Precision Farming als zentrale inhaltliche und technische Voraussetzung für
eine nachhaltige Entwicklung der landwirtschaftlichen Landnutzung – preagro II. Available at
www.preagro.de/Veroeff/preagro_Abschlussbericht_2008.pdf.
Swinton, S.M. and J. Lowenberg-DeBoer (2001), Global Adoption of Precision Agriculture Technologies:
Who, When and Why?, in: Grenier, G.; Blackmore, S. (eds.), Third European Conference on
Precision Agriculture, Montpellier, France: Agro Montpellier (ENSAM); pp. 557-562.
Tullberg, J.N.; Yule, D.F. and D. McGarry (2007), Controlled traffic farming – From research to adoption
in Australia, Soil & Tillage Research, 97; pp. 272-281.
Vellidis, G.; Oritz, B.; Beasley, J.; Hill, R.; Henry, H. and H. Brannen (2013), Using RTK-based GPS
guidance for planting and inverting peanuts, in: Stafford J. V. (ed.), Precision Agriculture 2013 –
Proceedings of the 9th European Conference on Precision Agriculture, Lleida, Spain.
Wagner, P. and M. Schneider, M. (2007), Economic benefits of neural network-generated site-specific
decision rules for nitrogen fertilization, in: Stafford, J. V. (ed.), Precision Agriculture `07, 6th.
ECPA. Wageningen Academic Publishers; pp. 775-782.
COM/TAD/CA/ENV/EPOC(2015)5
141
Wagner, P. (2009), The economic potential of Precision Farming- an interim report with regard to
nitrogen fertilization, Precision Agriculture 09, 7th European Conference on Precision Farming 2009,
Wageningen; pp. 501-508.
Walton, J.C.; Lambert, D.M.; Roberts, R.K.; Larson, J.A.; English, B.C.; Larkin, S.L.; Martin, S.W.;
Marra, M.C.; Paxton, K.W. and J.M. Reeves (2008), Adoption and Abandonment of Precision Soil
Sampling in Cotton Production, Journal of Agricultural and Resource Economics, 33 (3).
Wang, D., Prato, T., Qiu, Z., Kitchen, N. and K. Sudduth (2003), Economic and Environmental Evaluation
of Variable Rate Nitrogen and Lime Application for Claypan Soil Fields, Precision Agriculture, 4.
Zarco-Tejada, P., N. Hubbard and P. Loidjani (2014), Precision Agriculture: An opportunity for EU
Farmers – Potential Support with the CAP 2014-2020, Policy Department, Structural and Cohesion
Policies, agriculture and Rural development, European Parliament,
www.europarl.europa.eu/RegData/etudes/note/join/2014/529049/IPOL-
AGRI_NT%282014%29529049_EN.pdf
Zhang, N., Wang M. and N. Wang (2002), Precision agriculture—a worldwide overview, Computers and
Electronics in Agriculture, 36 (2-3); pp. 113-132.