unclassified tad/tc/wp(2007)6/part2/d/final - oecd
TRANSCRIPT
Unclassified TAD/TC/WP(2007)6/PART2/D/FINAL Organisation de Coopération et de Développement Economiques Organisation for Economic Co-operation and Development 29-Oct-2007 ___________________________________________________________________________________________
English - Or. English TRADE AND AGRICULTURE DIRECTORATE TRADE COMMITTEE
Working Party of the Trade Committee
FACILITATING TRADE AND STRUCTURAL ADJUSTMENT: EXPERIENCE IN NON-MEMBER ECONOMIES Country Case Study on the Philippines OECD Trade Policy Working Paper No. 59
by Dr Emilio Antonio and Osamu Onodera
Contact: Osamu Onodera; Tel. +33-1-45248937; e-mail: [email protected].
JT03234779
Document complet disponible sur OLIS dans son format d'origine Complete document available on OLIS in its original format
TA
D/T
C/W
P(2007)6/PAR
T2/D
/FINA
L
Unclassified
English - O
r. English
TAD/TC/WP(2007)6/PART2/D/FINAL
2
ABSTRACT This paper is the second of four country case studies which is a part of a broader research programme addressing trade and structural adjustment issues in non-member economies which was conducted as a follow-up to Trade and Structural Adjustment: Embracing Globalisation (OECD, 2005) which identified policies for successful trade-related structural adjustment. This paper studies the trade liberalisation experience of the Philippines from the 1980s. The report consists of 7 main parts; Part 1 provides the introduction, part 2 looks at the economic policies in the Philippines from the 1970s, and part 3 takes a general look at the general structure of the economy. Part 4 takes a closer look at the trade liberalisation in the Philippines which was implemented in three phases, (1) initial trade reforms (1981-88), (2) second phase (1991-93) and (3) third phase (1994-96). Part 5 takes an overview of the structural adjustments which took place in manufacturing and agriculture, with Part 6 taking a closer look at four sectors, electronics, food processing, cement, and business process outsourcing sectors. Part 7 concludes with lessons learnt and opportunities and challenges for further liberalisation. Despite considerable liberalisation including in trade policy since the 1980s, the Philippines economy posted only lacklustre performance initially. After a growth period in the 1990s and the Asian crisis, it is only in the recent past that some of the reforms are starting to pay off. The importance of a stable political and macroecnomic environment, need for appropriate exchange rates, need for early elimination of quantitative restrictions in trade reform, early deregulation on FDI are some of the lessons learnt. While challenges remain, better results are expected in the future if complemented with further reforms. Keywords: trade, structural adjustment, liberalisation, liberalization, Philippines, macroeconomic instability, tariffs, exchange rate policies, import-substitution, electronics, export processing zones, food processing, cement, business process outsourcing and IT services.
ACKNOWLEDGEMENTS This project was carried by Dr. Emilio T. Antonio Jr of the University of the Asia and the Pacific in the Philippines and Osamu Onodera under the supervision of Anthony Kleitz of the OECD Trade and Agriculture Directorate. The authors wish to thank Gene Ambrocio for research assistance and Dr. Raul Villasenior Fabella, Dr. Erlinda Medalla, Dr. Gloria Pasadilla, and Dr. Gwendolyn Tecson who through interviews provided valuable input to the paper. The Working Party of the OECD Trade Committee discussed this report and agreed to make the findings more widely available through declassification on its responsibility. The study is available on the OECD website in English and in French: http://oecd.org/trade Copyright OECD, 2007 Application for permission to reproduce or to translate all or part of this material should be made to: OECD Publication, 2 rue Andé Pascal, 75775 Paris Cédex 15, France
TAD/TC/WP(2007)6/PART2/D/FINAL
3
TABLE OF CONTENTS
EXECUTIVE SUMMARY ............................................................................................................................ 4 CASE STUDY ON THE PHILIPPINES ........................................................................................................ 5
1. Introduction ...................................................................................................................................... 5 2. Economic Policy (1970s to the present) ........................................................................................... 6 3. General structure of the economy ................................................................................................... 10 4. Trade and investment policies ........................................................................................................ 12 5. Structural adjustments in the manufacturing and agricultural sectors ............................................ 21 6. Sectoral developments .................................................................................................................... 25
1) Electronics ................................................................................................................................ 27 2) The food processing sector ....................................................................................................... 29 3) The cement sector ..................................................................................................................... 31 4) The business process outsourcing and IT services sectors ....................................................... 34
7. Conclusions .................................................................................................................................... 38 REFERENCES ............................................................................................................................................. 41 ANNEX SUMMARY OF ECONOMIC ZONE RELATED POLICIES IN THE PHILIPPINES ............... 44 Boxes
Box 1. A Glance at recent reforms in the Philippines ................................................................................. 9
TAD/TC/WP(2007)6/PART2/D/FINAL
4
EXECUTIVE SUMMARY
The Philippines’ experience with trade liberalisation has had mixed results. The aggressive trade reforms since the mid-1980s have realised average MFN tariff rates of less than 10%. However, while distortions in the economy have been reduced, economic performance has been disappointing. While GDP per capita in PPP terms in 1975 was comparable to Malaysia and far exceeded Thailand and Indonesia, it only increased from 3500USD to 4200 USD in 2005 while it more than tripled in the others. The burden of resource misallocation in the past, a relatively appreciated exchange rate, and above all, an unstable political and macroeconomic environment has deterred investment. It is only in recent years that reforms are beginning to pay dividends. This paper describes the Philippines’ experience in trade and structural adjustment: the initial trade regime and four phases of trade liberalisation.
Up to the 1980s, the Philippines had in place an import substitution policy with high tariffs and extensive quantitative restrictions. There was considerable government intervention in many industries ranging from automobiles to cement. This period while realising moderate growth also led to a considerable misallocation of resources to inherently uncompetitive sectors such as car assembly.
The first phase of tariff reform was begun in 1980 as a part of World Bank conditionality. Average tariffs were cut from 43% to 28% and quantitative restrictions were reduced. Towards the end of 1985, a debt crisis led to a partial reversal of trade reform. After a change in government, trade reform was resumed with an emphasis on reduction of quantitative restrictions. The effect of this first phase of trade reform was limited due to the remaining quantitative restrictions and relatively appreciated exchange rate. While other countries in the region benefited from FDI inflows after the Plaza Accord in 1985, the Philippines with a restrictive FDI regime and political and macroeconomic instability was unable to do so.
In 1991, the second phase of tariff reform was launched which replaced quantitative restrictions with tariffs, and cut tariff levels from 28% to 20% over a five year period. Restrictions on FDI began to be relaxed. Tariff reforms further entered the third phase in 1994 and tariffs were further cut to below 10% and the tariff structure was simplified. A fourth phase planning to cut tariffs to 5% has been suspended. Trade reform has gradually led to the realigning of incentive structures and there has been a shift from capital-intensive industries to more labour-intensive industries in line with its comparative advantage.
The introduction of export processing zones in the 1990s has allowed the Philippines to take advantage of its relatively inexpensive skilled labour force despite shortcomings in the general business environment. Although an industrial policy biased against agriculture, weak infrastructure and trade policy had stinted growth, reduction of anti-export bias has enabled the food-processing sector to show a decent 5% annual export growth since the late 1990s. Reform in inefficient import substitution industries such as cement has been slow mainly because of inertia in industrial behaviour. Trade and investment liberalisation however has transformed a once domestic oriented industry dependent on government support to an industry integrated to the international market led by multinational corporations. The services sector has emerged as the leading driver of the economy accounting for nearly 50% of the economy both in terms of added value and employment. The growth of the business process outsourcing and IT services sector shows how technology has enabled the Philippines to access the global market and leverage its labour force, and may show a new path of service sector led growth. Liberalisation in input services, i.e. telecommunication services, has been a key element of growth as has the provision of other infrastructure.
TAD/TC/WP(2007)6/PART2/D/FINAL
5
CASE STUDY ON THE PHILIPPINES
1. Introduction
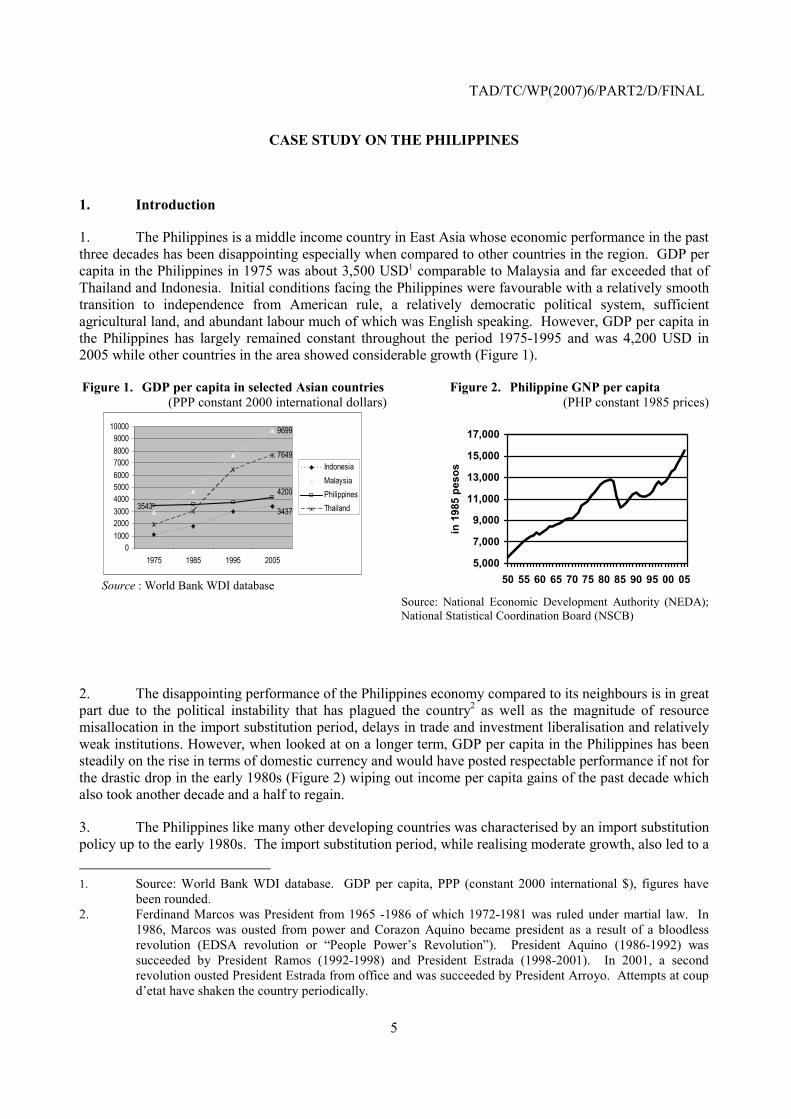
1. The Philippines is a middle income country in East Asia whose economic performance in the past three decades has been disappointing especially when compared to other countries in the region. GDP per capita in the Philippines in 1975 was about 3,500 USD1 comparable to Malaysia and far exceeded that of Thailand and Indonesia. Initial conditions facing the Philippines were favourable with a relatively smooth transition to independence from American rule, a relatively democratic political system, sufficient agricultural land, and abundant labour much of which was English speaking. However, GDP per capita in the Philippines has largely remained constant throughout the period 1975-1995 and was 4,200 USD in 2005 while other countries in the area showed considerable growth (Figure 1).
Figure 1. GDP per capita in selected Asian countries (PPP constant 2000 international dollars)
3437
9699
4200
3543
7649
0100020003000400050006000700080009000
10000
1975 1985 1995 2005
IndonesiaMalaysiaPhilippinesThailand
Source : World Bank WDI database
Figure 2. Philippine GNP per capita (PHP constant 1985 prices)
5,000
7,000
9,000
11,000
13,000
15,000
17,000
50 55 60 65 70 75 80 85 90 95 00 05
in 1
985
peso
s
Source: National Economic Development Authority (NEDA); National Statistical Coordination Board (NSCB)
2. The disappointing performance of the Philippines economy compared to its neighbours is in great part due to the political instability that has plagued the country2 as well as the magnitude of resource misallocation in the import substitution period, delays in trade and investment liberalisation and relatively weak institutions. However, when looked at on a longer term, GDP per capita in the Philippines has been steadily on the rise in terms of domestic currency and would have posted respectable performance if not for the drastic drop in the early 1980s (Figure 2) wiping out income per capita gains of the past decade which also took another decade and a half to regain.
3. The Philippines like many other developing countries was characterised by an import substitution policy up to the early 1980s. The import substitution period, while realising moderate growth, also led to a 1. Source: World Bank WDI database. GDP per capita, PPP (constant 2000 international $), figures have
been rounded. 2. Ferdinand Marcos was President from 1965 -1986 of which 1972-1981 was ruled under martial law. In
1986, Marcos was ousted from power and Corazon Aquino became president as a result of a bloodless revolution (EDSA revolution or “People Power’s Revolution”). President Aquino (1986-1992) was succeeded by President Ramos (1992-1998) and President Estrada (1998-2001). In 2001, a second revolution ousted President Estrada from office and was succeeded by President Arroyo. Attempts at coup d’etat have shaken the country periodically.
TAD/TC/WP(2007)6/PART2/D/FINAL
6
considerable misallocation of resources to inherently uncompetitive sectors. Starting in the mid 1980s, the Philippines pursued structural reforms with the objective of “gradually freeing the economy from inefficiencies and provide machinery that would allow the efficient use of all the factors available to the economy (Vistal, 2001)”. These structural reforms have included privatisation, tax reform, land reform, deregulation in certain industries, and trade and investment liberalisation (see Box 1). However, the results of reform have been uneven and the development path has not been smooth, characterised by boom and bust cycles.
4. The Philippines’ trade policy and experience in trade liberalisation is of special interest for several reasons. First, it presents a concrete illustration of the difficulties of undertaking structural reforms in an inward-looking economy where market forces were seriously stifled by numerous government interventions. Second, it provides an interesting comparison with Thailand which has been able to manage the transition from an import substitution oriented policy to an export oriented economic policy with better results. Third, it presents an interesting example of the use of second-best policy solutions such as export processing zones as a tool for transition where there is a strong resistance to reforms.
5. The objective of this paper is to study the trade liberalisation experiences of the Philippines in order to draw policy implications on trade policies and complementary policies. In section 2, we first look at the evolution of general economic policy, which is followed by section 3 which explains the structure of the economy. Section 4 studies trade and investment policies and how trade flows have evolved. Section 5 looks at how the manufacturing and agricultural sectors have adjusted, and some of the Philippines’ adjustment policies. Section 6 takes a closer looks at developments in a few selected sectors: 1) electronics; 2) the food processing sector; 3) the cement sector; and 4) the business process outsourcing and IT services sector. Section 7 concludes with lessons learnt and opportunities and challenges.
2. Economic Policy (1970s to the present)
6. The Philippines economy before 1986 under the rule of President Marcos can mainly be characterised by import substitution through heavy government intervention driven by strong nationalism. Growth was mainly financed by foreign loans which were relatively easily available due to a surplus of petrodollars in international financial markets. A cap was placed on interest rates and credit was allocated to sectors which government had identified as crucial to economic development. FDI was limited to sectors considered non-strategic. Export was heavily penalised by a regime of overvalued currency. To keep the growth of imports under control and to encourage production of domestic substitutes, tariff protection was high and characterised by tariff escalation (i.e. higher tariffs were imposed on final goods while tariffs were lower for intermediate and capital goods). Effective protection rates (ERP) for non-export industries were about 15 times higher than that applied to exporting industries.
7. This economic policy led to the development of import substitution industries producing consumer goods such as car assembly, flour milling, spinning mills, textile weaving and knitting, soft drink bottling and milk canning. These industries were typically capital intensive, dependant on imported materials and inputs, and were not in line with comparative advantages. The greater presence of these industries in the economy encouraged a greater policy bias against exchange rate adjustments: a depreciated exchange rate and resulting increase in the prices of imported inputs could endanger a larger number of jobs associated with these import dependent industries.
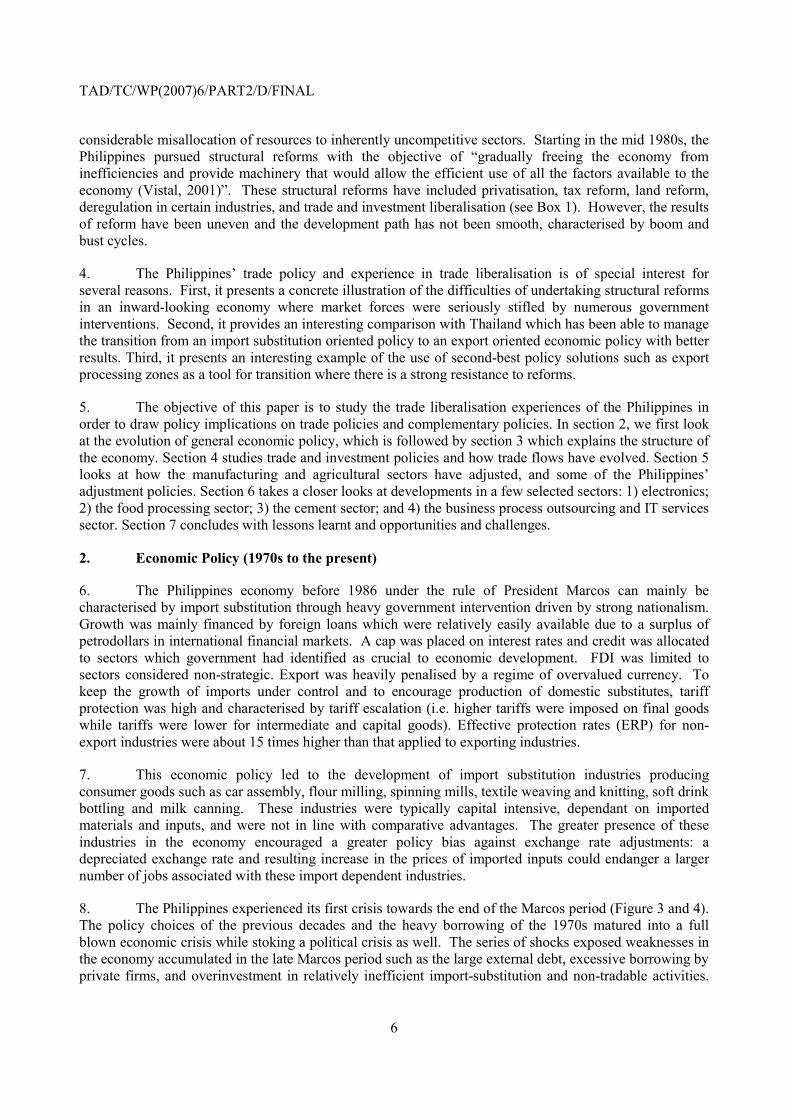
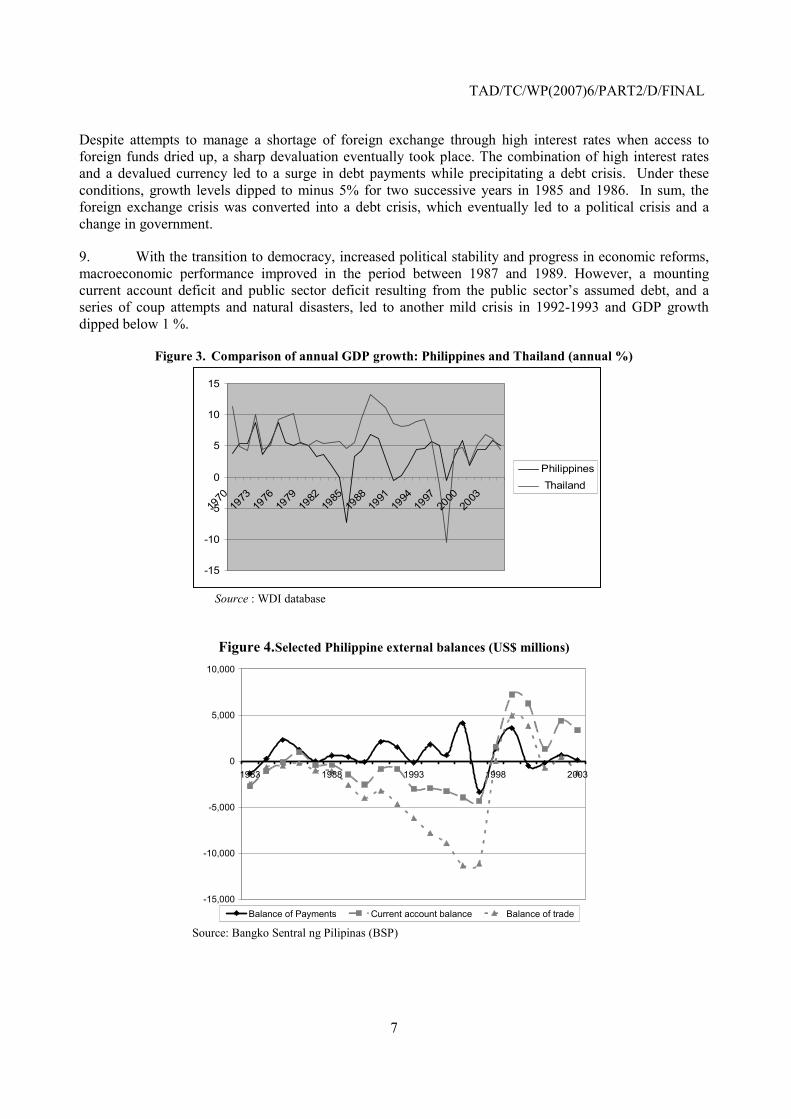
8. The Philippines experienced its first crisis towards the end of the Marcos period (Figure 3 and 4). The policy choices of the previous decades and the heavy borrowing of the 1970s matured into a full blown economic crisis while stoking a political crisis as well. The series of shocks exposed weaknesses in the economy accumulated in the late Marcos period such as the large external debt, excessive borrowing by private firms, and overinvestment in relatively inefficient import-substitution and non-tradable activities.
TAD/TC/WP(2007)6/PART2/D/FINAL
7
Despite attempts to manage a shortage of foreign exchange through high interest rates when access to foreign funds dried up, a sharp devaluation eventually took place. The combination of high interest rates and a devalued currency led to a surge in debt payments while precipitating a debt crisis. Under these conditions, growth levels dipped to minus 5% for two successive years in 1985 and 1986. In sum, the foreign exchange crisis was converted into a debt crisis, which eventually led to a political crisis and a change in government.
9. With the transition to democracy, increased political stability and progress in economic reforms, macroeconomic performance improved in the period between 1987 and 1989. However, a mounting current account deficit and public sector deficit resulting from the public sector’s assumed debt, and a series of coup attempts and natural disasters, led to another mild crisis in 1992-1993 and GDP growth dipped below 1 %.
Figure 3. Comparison of annual GDP growth: Philippines and Thailand (annual %)
-15
-10
-5
0
5
10
15
1970
1973
1976
1979
1982
1985
1988
1991
1994
1997
2000
2003
Philippines Thailand
Source : WDI database
Figure 4. Selected Philippine external balances (US$ millions)
-15,000
-10,000
-5,000
0
5,000
10,000
1983 1988 1993 1998 2003
Balance of Payments Current account balance Balance of trade Source: Bangko Sentral ng Pilipinas (BSP)
TAD/TC/WP(2007)6/PART2/D/FINAL
8
10. The country experienced a power shortage in the early 1990s but was successful in inviting both portfolio investments and FDI, the latter mainly in special economic zones (see electronics case study). As the public sector deficit was trimmed, GDP growth gradually returned to previous levels. While the economy was again spending more than it could earn in foreign exchange in terms of the balance of trade, for a time this was counterbalanced by growing remittances from Filipino overseas workers and foreign investment inflows. The growth pattern was yet again interrupted in 1998 by a drought that hit the agricultural sector and the Asian Financial Crisis.
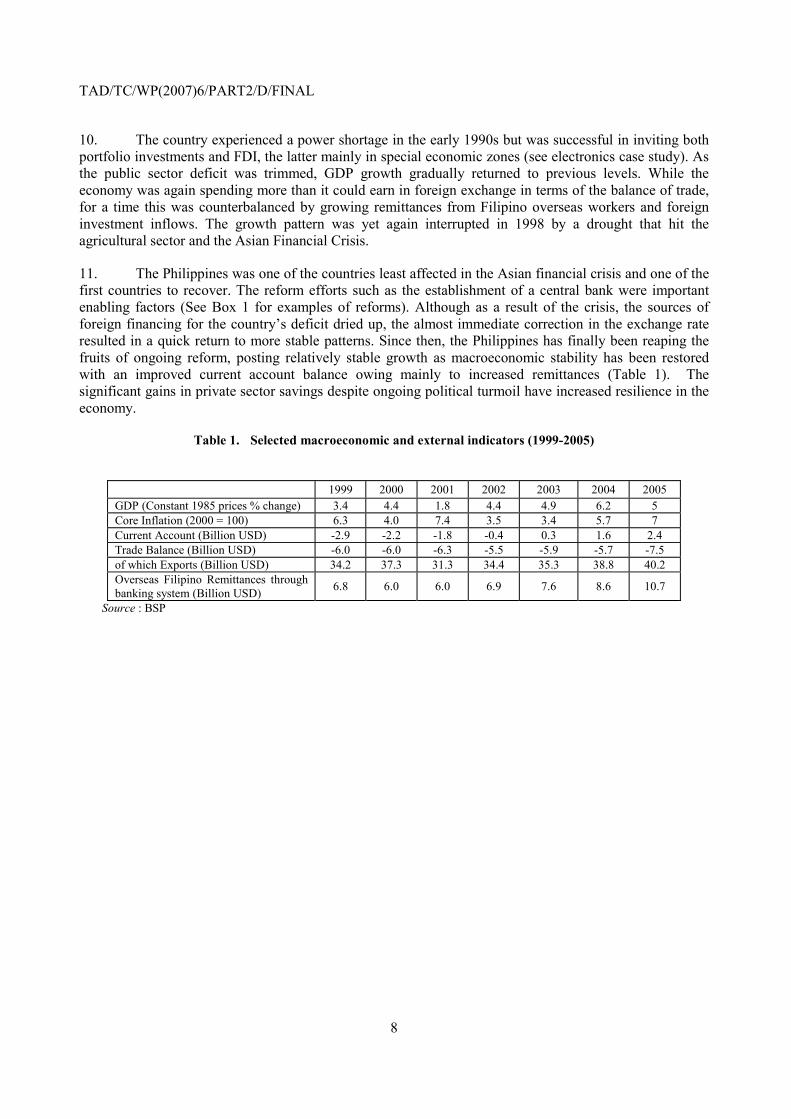
11. The Philippines was one of the countries least affected in the Asian financial crisis and one of the first countries to recover. The reform efforts such as the establishment of a central bank were important enabling factors (See Box 1 for examples of reforms). Although as a result of the crisis, the sources of foreign financing for the country’s deficit dried up, the almost immediate correction in the exchange rate resulted in a quick return to more stable patterns. Since then, the Philippines has finally been reaping the fruits of ongoing reform, posting relatively stable growth as macroeconomic stability has been restored with an improved current account balance owing mainly to increased remittances (Table 1). The significant gains in private sector savings despite ongoing political turmoil have increased resilience in the economy.
Table 1. Selected macroeconomic and external indicators (1999-2005)
1999 2000 2001 2002 2003 2004 2005 GDP (Constant 1985 prices % change) 3.4 4.4 1.8 4.4 4.9 6.2 5 Core Inflation (2000 = 100) 6.3 4.0 7.4 3.5 3.4 5.7 7 Current Account (Billion USD) -2.9 -2.2 -1.8 -0.4 0.3 1.6 2.4 Trade Balance (Billion USD) -6.0 -6.0 -6.3 -5.5 -5.9 -5.7 -7.5 of which Exports (Billion USD) 34.2 37.3 31.3 34.4 35.3 38.8 40.2 Overseas Filipino Remittances through banking system (Billion USD) 6.8 6.0 6.0 6.9 7.6 8.6 10.7
Source : BSP
TAD/TC/WP(2007)6/PART2/D/FINAL
9
Box 1. A Glance at recent reforms in the Philippines3
Macroeconomic policy: The government has moved from a controlled and partially effective monetary system in the 1980s to an independent, well functioning system by the end of the 1990s. As a result of the severe balance of payments crisis in the past, the government has had to follow IMF-designed stabilisation policies which emphasised fiscal and monetary discipline. In 1992, the central bank decided to liberalise nearly all capital flows and foreign exchange transactions. In 1993 a new independent Central Bank (Bangko Sentral ng Pilipinas) was established4 with the maintenance of price stability as its main goal. Although a certain bias or preference for a “stronger” currency is still apparent, the foreign exchange rate has been generally left to market forces with little intermediation from the central bank. It has been broadly successful being instrumental in the management of the Asian Crisis. The BSP formally adopted the inflation targeting framework in 2002. Tax and fiscal Policy: The first reform was started around 1986 and included introduction of the Value Added Tax (VAT) in 1988. The VAT system was further reformed in 1994 to correct the problem of low tax collection and to expand the tax base. A Comprehensive Tax Reform Package covering income and excise taxes, rationalisation of tax incentives and statutory changes to tax administration was passed in 1997. The public debt to GNP ratio declined until 1997 but built up after the Asian Crisis. However, a decline in tax collection to GDP ratio reignited the country’s fiscal woes triggering the declaration of a fiscal crisis in 2004. As a result, renewed efforts at fiscal discipline (the government’s fiscal austerity program) and legislation to increase sources of tax revenue were set in motion. This included VAT reform which further broadened the tax base and allowed the President to raise the VAT rate from 10 to 12% in 2006. The same reform also raised corporate income tax to 35 % until 2009 when it will be reduced to 30 %. Expenditures have been frozen for the past 3 years and this has contributed to the improvement in the fiscal situation in recent years. These developments have enabled the current administration to focus on improving the country’s infrastructure for the remainder of its term (2010). Trade liberalisation and product market reform: Since the 1980s, the Philippines has liberalised trade in phases (see main text). As a result quantitative restrictions have been tariffied and tariffs have been reduced substantially while tariff quotas remain in place for some sensitive agricultural products. The tariff reform programme which has been pushed forward on a unilateral basis has led to relatively low tariff levels even compared within the region. This unilateral liberalisation effort was however stalled, and the current policy stance seems to be to let current negotiations (bilateral, multilateral, or unilateral) direct the course of tariff reform. Marketing monopolies have been abolished and price controls have been largely eliminated (An example is the discontinuation of the Oil Price Stabilisation Fund in 1996). However, the National Food Authority (NFA) continues to control rice prices and have the authority to intervene in some commodity markets such as sugar and fertiliser. In March 2004, the NFA intervened in the sugar market to stabilise falling prices with the authorization of the President (WTO 2005). Investment policy: The policy framework towards foreign investment has been greatly improved through the implementation of the Omnibus Investment Code of 1987 and the Foreign Investment Act of 1991 opening up many parts of the economy to foreign direct investment. Liberalisation has continued to progress for example through the Special Economic Zone Act of 1995 (see main text and related box in electronics case). Such FDI friendly policies were a reversal from past policy which restricted foreign participation in most economic activities particularly those deemed crucial to the Philippine economy. In contrast, not only is full foreign ownership allowed for investment located in special economic zones but additional incentives are often provided. Infrastructure: Infrastructure has been one of the bottlenecks in economic growth as public investment in this area has remained insufficient. The Philippines has been spending only 2-3% of GDP to develop infrastructure compared to 5-6% in Thailand (JCCIP 2006)5. While infrastructure development through Build Operate Transfer (BOT)
3. This section is based on Vistal (2001). 4. The old Central Bank was closed down as it had become insolvent largely as a result of its bailing out of
domestic banks. 5. In Thailand the tollways extend as long as 333 km, while in the Philippines it is only 146 km. Ninety eight
percent of national roads are paved in Thailand whereas in the Philippines only 70% are paved. In Thailand freight trains carry a total load of 54.13 million passengers compared to 3.88 million in the Philippines. In Thailand 11.40 million tons of cargo is carried by freight trains while this figure is zero in the Philippines (JCCIP, 2005).
TAD/TC/WP(2007)6/PART2/D/FINAL
10
schemes has been promoted, legal disputes have occurred in some cases (e.g. Manila Airport Terminal 3). The recent fiscal freeze has further led to a slow-down in infrastructure development. The President’s 2006 State of the Nation Address (SONA) however, specifically focused on infrastructure improvements as the administration’s agenda for the remainder of its term. Among its flagship projects are the Roll-On Roll-Off Terminal System-Strong Republic Nautical Highway (RRTS-SRNH) designed to improve domestic transport costs and make inter-island transport more efficient, and, several roads and highways to connect special economic zones to key locations such as ports (sea and air). Privatisation: The first wave of privatisation involved the restoration of certain acquired assets to the private sector and the privatisation of essentially private activities undertaken by government entities (hotels, banks, an airline company, steel firm, mining companies, petroleum refinery, copper smelting and refinery company). Immediately following the change in government in 1986 several state-owned enterprises such as the Manila Electric Company and the Philippine Long Distance and Telephone Company were returned to private ownership. Proclamation No. 50 of 1986 created the Committee on Privatization to oversee government privatisation efforts (sustained by succeeding legislations). The Philippine National Bank (1989), Philippine Airlines (1992) and Petron Corporation (oil, 1993) were also privatised while the Bases Conversion Development Authority (1992) was created to convert military bases to commercial developments. The Philippines is now in the second wave of its privatisation efforts. The second wave is proceeding through Build-Operate-Transfer (BOT) schemes and its variants, and cover areas such as energy, road and other infrastructure projects. The BOT Act (R.A. 7718) was signed into law in 1993. Labour market6: The policy and legal framework covering the labour sector is embodied in the 1987 Constitution, the 1974 Labour Code and other executive policy instruments and provides for worker protection and collective bargaining. The Asian Development Bank (ADB) refers to three potential difficulties facing employers; (1) labour relations and the protection of permanent and union workers; (2) laws relating to labour contracts such as security of tenure clauses and (3) minimum wage clauses.7 Under the Wage Rationalization Act of 1989, minimum wage setting has been decentralised to regional wage boards who set minimum wages on a regional basis and collective bargaining was stated as the preferred mode of wage setting. Land reform8: A series of land reform programmes were initiated in the 1960s to address the skewed distribution of land ownership and perceived injustice. These programmes resulted in limited success. In 1987, the Comprehensive Agrarian Reform Program (CARP) was introduced with the intention of redistributing about three quarters of all agricultural land to landless farmers and farm workers. CARP provided for fair compensation to the owners and provision of service support for beneficiaries. Ostensibly to prevent any further concentration of land ownership and any future oppression by land owners, further legislation prohibited private land sales as well as share tenancy arrangements. Due to inherent political difficulties and the high cost of implementing the land transfer program, only about 60% of the original target of 4.9 million hectares of private and public land had been redistributed by the time the program ended in 1998.
3. General structure of the economy
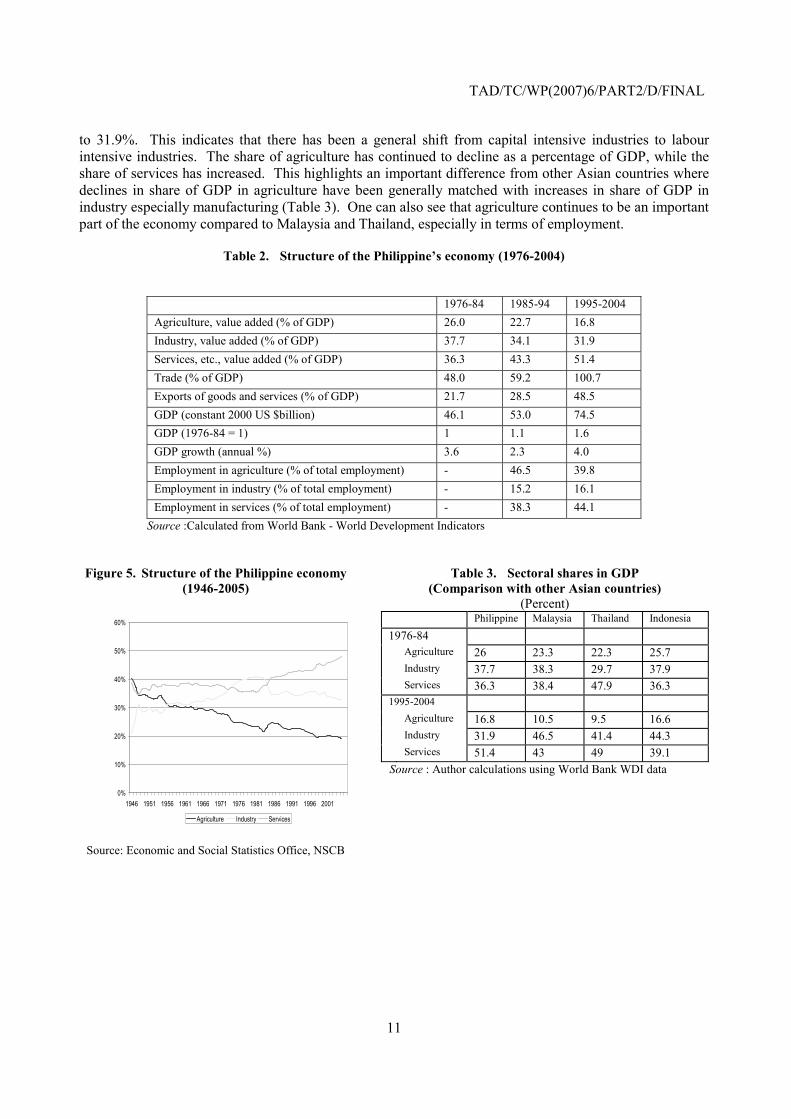
12. Table 2 and Figure 5 illustrate how the structure of GDP and employment has changed in the Philippines. Up to the early 1980s, the share of industry steadily grew as the economy underwent gradual industrialisation. In the 1970s the pace of industrialisation accelerated. From the early to mid 1980s, the artificial industrialisation in the late 1970s and early 1980s through the import substitution strategy collapsed and the industry sector contracted quite rapidly. After this adjustment, the share has been relatively stable at around 30%. It is interesting to note that the share of industry in employment has increased from 15.2% (1985-1994) to 16.1% (1995-2000) while its share in GDP has declined from 34.1%
6. This section is based on ADB (2005). 7. ADB (2005) states that if most companies do not abide by the minimum wage rules, they would not serve
as a binding constraint. However, some business groups assert that changes in the minimum wage in the Philippines which currently compares favourably with that of Thailand may pose problems if increased, implying that it may be a factor in making FDI decisions (JCCIP, 2005).
8. This section is based on David (2003) and Gerson (1998).
TAD/TC/WP(2007)6/PART2/D/FINAL
11
to 31.9%. This indicates that there has been a general shift from capital intensive industries to labour intensive industries. The share of agriculture has continued to decline as a percentage of GDP, while the share of services has increased. This highlights an important difference from other Asian countries where declines in share of GDP in agriculture have been generally matched with increases in share of GDP in industry especially manufacturing (Table 3). One can also see that agriculture continues to be an important part of the economy compared to Malaysia and Thailand, especially in terms of employment.
Table 2. Structure of the Philippine’s economy (1976-2004)
1976-84 1985-94 1995-2004 Agriculture, value added (% of GDP) 26.0 22.7 16.8 Industry, value added (% of GDP) 37.7 34.1 31.9 Services, etc., value added (% of GDP) 36.3 43.3 51.4 Trade (% of GDP) 48.0 59.2 100.7 Exports of goods and services (% of GDP) 21.7 28.5 48.5 GDP (constant 2000 US $billion) 46.1 53.0 74.5 GDP (1976-84 = 1) 1 1.1 1.6 GDP growth (annual %) 3.6 2.3 4.0 Employment in agriculture (% of total employment) - 46.5 39.8 Employment in industry (% of total employment) - 15.2 16.1 Employment in services (% of total employment) - 38.3 44.1
Source :Calculated from World Bank - World Development Indicators
Figure 5. Structure of the Philippine economy (1946-2005)
0%
10%
20%
30%
40%
50%
60%
1946 1951 1956 1961 1966 1971 1976 1981 1986 1991 1996 2001
Agriculture Industry Services
Source: Economic and Social Statistics Office, NSCB
Table 3. Sectoral shares in GDP (Comparison with other Asian countries)
(Percent) Philippine Malaysia Thailand Indonesia
1976-84 Agriculture 26 23.3 22.3 25.7 Industry 37.7 38.3 29.7 37.9 Services 36.3 38.4 47.9 36.3 1995-2004 Agriculture 16.8 10.5 9.5 16.6 Industry 31.9 46.5 41.4 44.3 Services 51.4 43 49 39.1 Source : Author calculations using World Bank WDI data
TAD/TC/WP(2007)6/PART2/D/FINAL
12
4. Trade and investment policies
Trade policy9
13. After taking an import substitution industrialisation policy during the 1970s, the Philippines has embraced a more market-oriented development policy from the 1980s, undertaking trade liberalisation mainly in three phases; the first phase (1981-1988); the second phase (1991-1993); and the third phase (1994-1996)10 although with some periodic reversals. Through its gradual trade liberalisation, the Philippines has achieved substantial trade liberalisation with average MFN applied tariffs of 6.3% for all products, 9.5% for agricultural products and 5.8% for non-agricultural products (WTO, 2005) well ahead of its international commitments. Market openness as measured by trade as a percentage of GDP has also increased from 48% in 1976-84 to 100.7% in 1995-2004. In this section we briefly summarise the history of trade policy in the Philippines.
14. While attempts were made in trade reform in the 1960s and 1970s, such efforts did not substantially change the structure of effective protection (Tecson 1996), and it was not until the 1980s and 1990s that actual trade liberalisation took place. The first phase of tariff reform was part of the conditionalities associated with a series of structural adjustment loans granted by the World Bank beginning 1980 (Medalla 1994). This initial Tariff Reform Program (TRP I) started in 1981 narrowed down the tariff structure from a range of 0-100% to 10-50%. As a result, overall, the average tariff rate dropped from 43% in 1980 to 28% in 1985 (Bautista and Tecson (2003)). The list of items which required import licensing was also trimmed down starting in 1981. In mid-1983, the trade liberalisation programme was suspended in response to the economic crisis with adoption of foreign exchange rationing and introduction of some new quantitative restrictions.
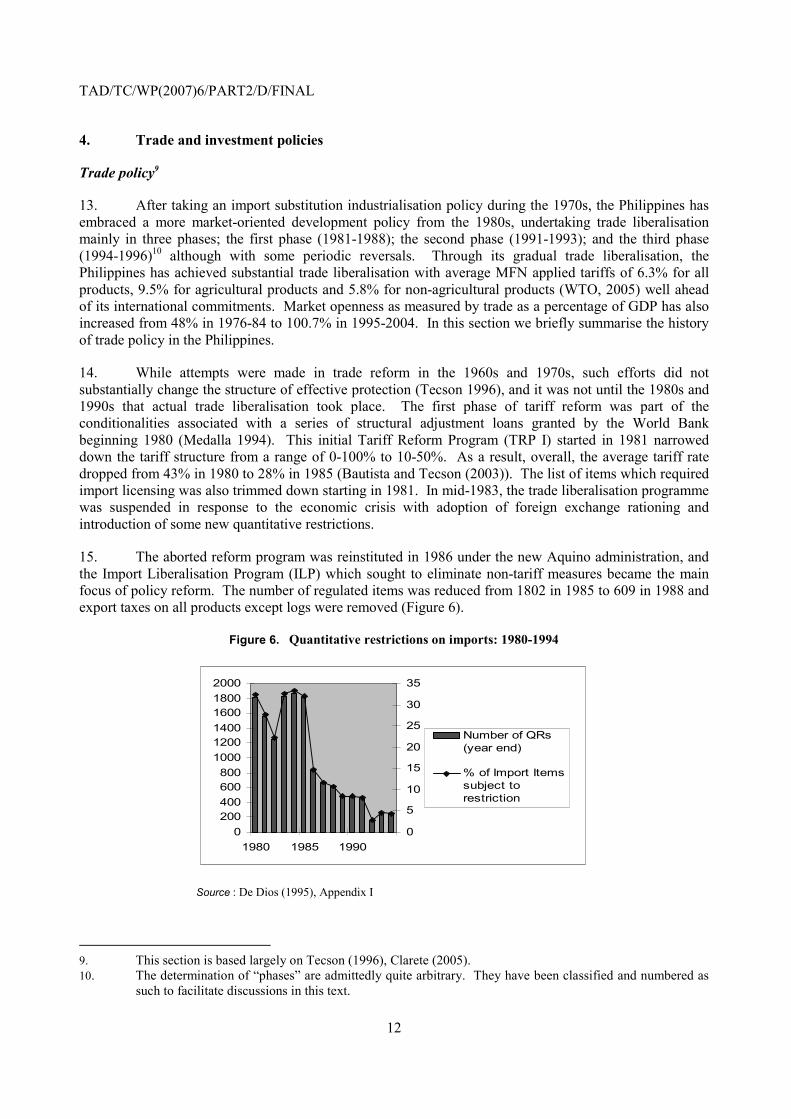
15. The aborted reform program was reinstituted in 1986 under the new Aquino administration, and the Import Liberalisation Program (ILP) which sought to eliminate non-tariff measures became the main focus of policy reform. The number of regulated items was reduced from 1802 in 1985 to 609 in 1988 and export taxes on all products except logs were removed (Figure 6).
Figure 6. Quantitative restrictions on imports: 1980-1994
0200400600800
100012001400160018002000
1980 1985 19900
5
10
15
20
25
30
35
Number of QRs(year end)
% of Import Itemssubject torestriction
Source : De Dios (1995), Appendix I
9. This section is based largely on Tecson (1996), Clarete (2005). 10. The determination of “phases” are admittedly quite arbitrary. They have been classified and numbered as
such to facilitate discussions in this text.
TAD/TC/WP(2007)6/PART2/D/FINAL
13
16. The effect of this first phase of trade reform was initially quite limited due to the continued prevalence of quantitative restrictions and the relatively appreciated exchange rate. However with the easing of quantitative restrictions and a gradual depreciation in the first half of the 1980s, exports started on an increasing trend from the mid to late 1980s.
17. The government launched the second phase of its Tariff Reform Program (TRP II) in 1991 with Executive Order (EO) 470 which aimed at lowering tariff rates over a five-year period. The programme aimed at clustering the commodities within a tariff range of 3-30% and the average tariff rate was cut from 28% to 20%. In 1992, EO 8 introduced tariff protection measures to replace quantitative restrictions (QRs) on imports of 153 commodities. The tariffication raised tariff rates for some items by up to 100% but these rates were reduced over the subsequent period. Some of these gains were reversed in 1993 with the re-imposition of QRs on 93 items as a result of the “Magna Carta for Small Farmers”.
18. The unilateral tariff reform programme entered its third phase (TRP III) in 1994. Tariffs were reduced for capital equipment and machinery (EO 189), and textiles, garments and chemical inputs (EO 204). EO 264 in 1995 subsequently reduced tariffs on 4,142 lines of the Harmonised System in the manufacturing sector. This was followed by EO 288 in 1996 which reduced tariffs on “non-sensitive” agricultural products. TRP III thus generally transformed the tariff structure into a four tier structure: 3% for raw materials and capital equipment that are not available locally; 10% for raw materials and capital equipment that are available from local sources; 20% for intermediate goods; and 30% for finished goods. Some sensitive agricultural products continued to be subject to high tariffs and/or tariff quotas. Finally, EO 313 issued in 1996 provided for the tariffication of QRs on sensitive agricultural products and paved the way for the elimination of QRs in order to comply with the Uruguay Round Agreements.
19. The final target for trade liberalisation had been set to achieving a uniform tariff rate of 5% except for “sensitive” agricultural products by 2004 (APEC Individual Action Plan 2000). This was considered as a necessary step towards implementation of the ASEAN Free Trade Agreement. However, in light of various developments, implementation has been postponed.
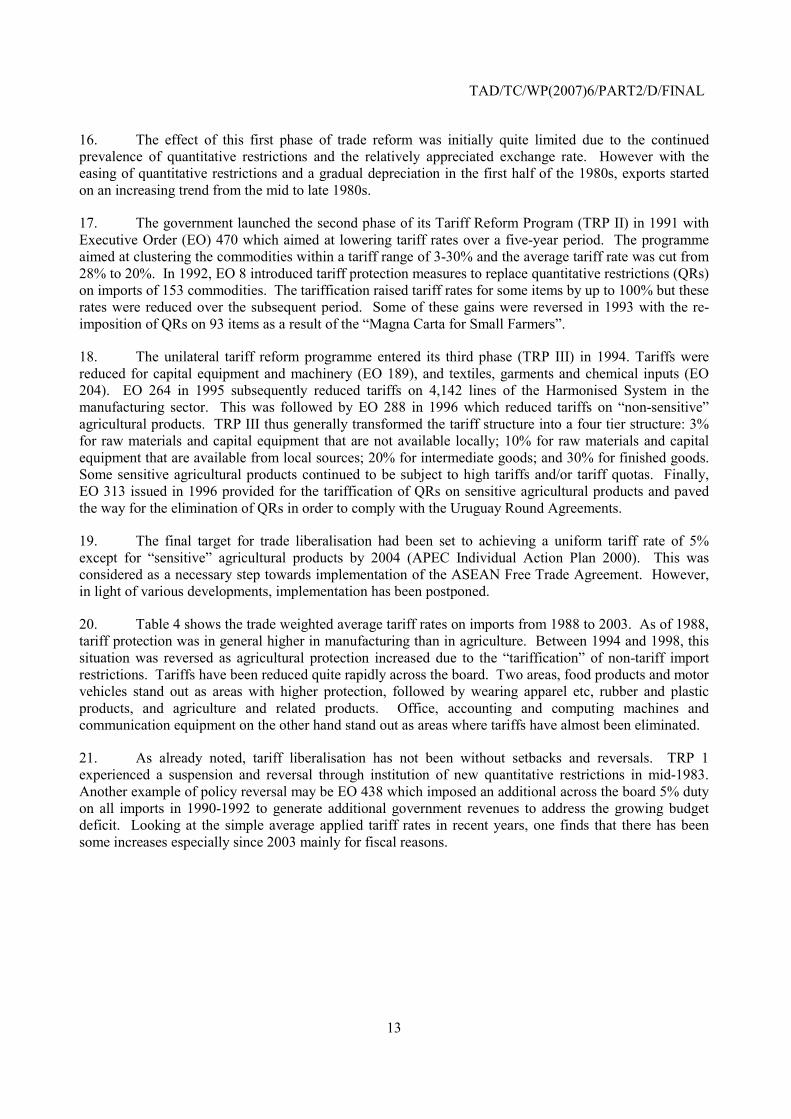
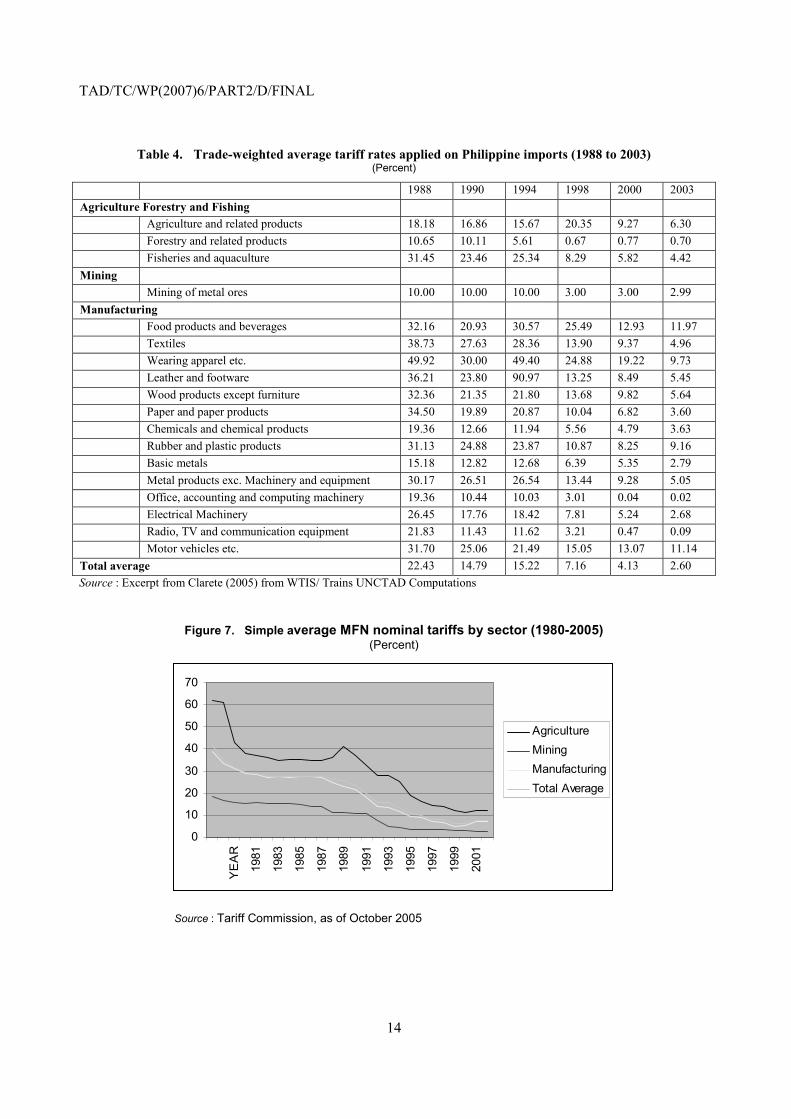
20. Table 4 shows the trade weighted average tariff rates on imports from 1988 to 2003. As of 1988, tariff protection was in general higher in manufacturing than in agriculture. Between 1994 and 1998, this situation was reversed as agricultural protection increased due to the “tariffication” of non-tariff import restrictions. Tariffs have been reduced quite rapidly across the board. Two areas, food products and motor vehicles stand out as areas with higher protection, followed by wearing apparel etc, rubber and plastic products, and agriculture and related products. Office, accounting and computing machines and communication equipment on the other hand stand out as areas where tariffs have almost been eliminated.
21. As already noted, tariff liberalisation has not been without setbacks and reversals. TRP 1 experienced a suspension and reversal through institution of new quantitative restrictions in mid-1983. Another example of policy reversal may be EO 438 which imposed an additional across the board 5% duty on all imports in 1990-1992 to generate additional government revenues to address the growing budget deficit. Looking at the simple average applied tariff rates in recent years, one finds that there has been some increases especially since 2003 mainly for fiscal reasons.
TAD/TC/WP(2007)6/PART2/D/FINAL
14
Table 4. Trade-weighted average tariff rates applied on Philippine imports (1988 to 2003)
(Percent)
1988 1990 1994 1998 2000 2003 Agriculture Forestry and Fishing Agriculture and related products 18.18 16.86 15.67 20.35 9.27 6.30 Forestry and related products 10.65 10.11 5.61 0.67 0.77 0.70 Fisheries and aquaculture 31.45 23.46 25.34 8.29 5.82 4.42 Mining Mining of metal ores 10.00 10.00 10.00 3.00 3.00 2.99 Manufacturing Food products and beverages 32.16 20.93 30.57 25.49 12.93 11.97 Textiles 38.73 27.63 28.36 13.90 9.37 4.96 Wearing apparel etc. 49.92 30.00 49.40 24.88 19.22 9.73 Leather and footware 36.21 23.80 90.97 13.25 8.49 5.45 Wood products except furniture 32.36 21.35 21.80 13.68 9.82 5.64 Paper and paper products 34.50 19.89 20.87 10.04 6.82 3.60 Chemicals and chemical products 19.36 12.66 11.94 5.56 4.79 3.63 Rubber and plastic products 31.13 24.88 23.87 10.87 8.25 9.16 Basic metals 15.18 12.82 12.68 6.39 5.35 2.79 Metal products exc. Machinery and equipment 30.17 26.51 26.54 13.44 9.28 5.05 Office, accounting and computing machinery 19.36 10.44 10.03 3.01 0.04 0.02 Electrical Machinery 26.45 17.76 18.42 7.81 5.24 2.68 Radio, TV and communication equipment 21.83 11.43 11.62 3.21 0.47 0.09 Motor vehicles etc. 31.70 25.06 21.49 15.05 13.07 11.14 Total average 22.43 14.79 15.22 7.16 4.13 2.60 Source : Excerpt from Clarete (2005) from WTIS/ Trains UNCTAD Computations
Figure 7. Simple average MFN nominal tariffs by sector (1980-2005) (Percent)
0
10
20
30
40
50
60
70
YE
AR
1981
1983
1985
1987
1989
1991
1993
1995
1997
1999
2001
AgricultureMiningManufacturingTotal Average
Source : Tariff Commission, as of October 2005
TAD/TC/WP(2007)6/PART2/D/FINAL
15
Exchange rate policy
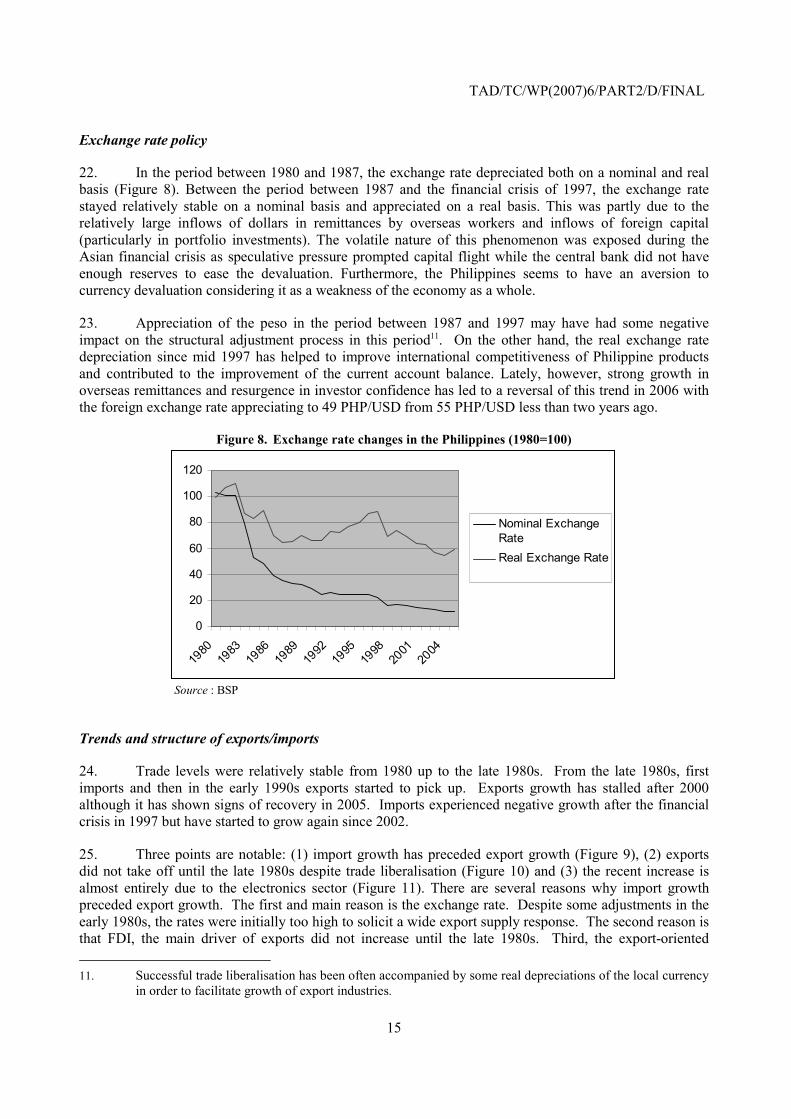
22. In the period between 1980 and 1987, the exchange rate depreciated both on a nominal and real basis (Figure 8). Between the period between 1987 and the financial crisis of 1997, the exchange rate stayed relatively stable on a nominal basis and appreciated on a real basis. This was partly due to the relatively large inflows of dollars in remittances by overseas workers and inflows of foreign capital (particularly in portfolio investments). The volatile nature of this phenomenon was exposed during the Asian financial crisis as speculative pressure prompted capital flight while the central bank did not have enough reserves to ease the devaluation. Furthermore, the Philippines seems to have an aversion to currency devaluation considering it as a weakness of the economy as a whole.
23. Appreciation of the peso in the period between 1987 and 1997 may have had some negative impact on the structural adjustment process in this period11. On the other hand, the real exchange rate depreciation since mid 1997 has helped to improve international competitiveness of Philippine products and contributed to the improvement of the current account balance. Lately, however, strong growth in overseas remittances and resurgence in investor confidence has led to a reversal of this trend in 2006 with the foreign exchange rate appreciating to 49 PHP/USD from 55 PHP/USD less than two years ago.
Figure 8. Exchange rate changes in the Philippines (1980=100)
0
20
40
60
80
100
120
1980
1983
1986
1989
1992
1995
1998
2001
2004
Nominal ExchangeRateReal Exchange Rate
Source : BSP
Trends and structure of exports/imports
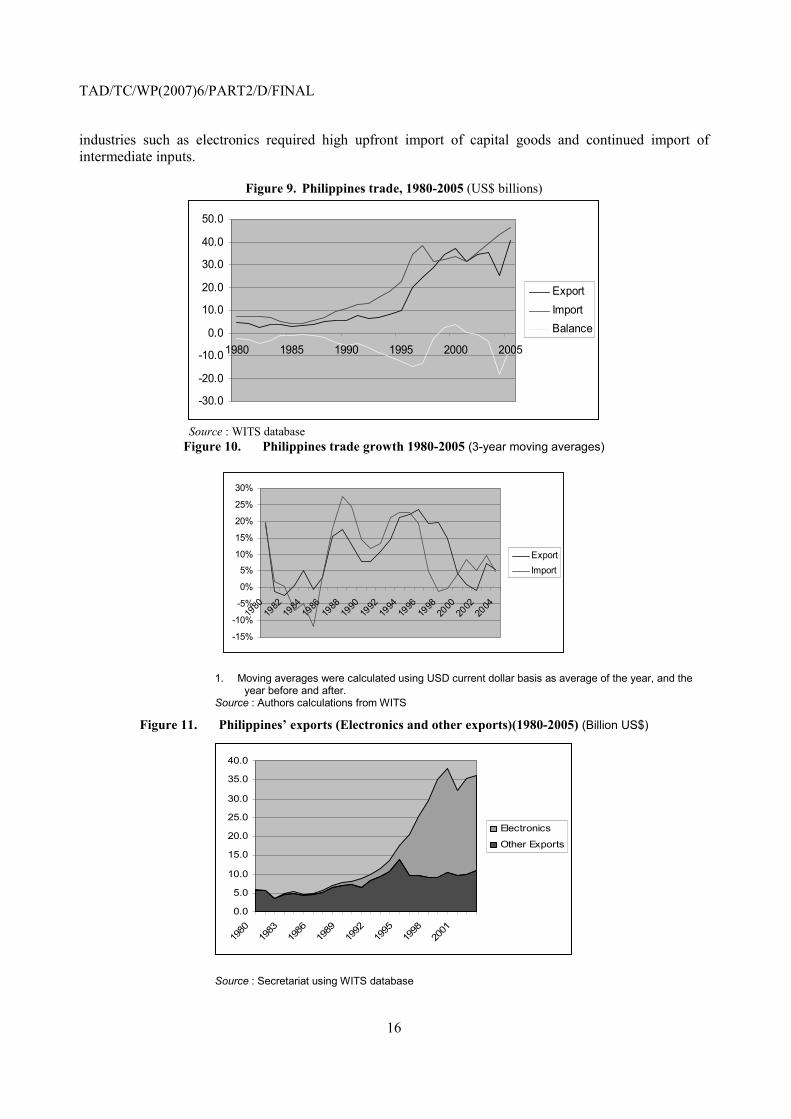
24. Trade levels were relatively stable from 1980 up to the late 1980s. From the late 1980s, first imports and then in the early 1990s exports started to pick up. Exports growth has stalled after 2000 although it has shown signs of recovery in 2005. Imports experienced negative growth after the financial crisis in 1997 but have started to grow again since 2002.
25. Three points are notable: (1) import growth has preceded export growth (Figure 9), (2) exports did not take off until the late 1980s despite trade liberalisation (Figure 10) and (3) the recent increase is almost entirely due to the electronics sector (Figure 11). There are several reasons why import growth preceded export growth. The first and main reason is the exchange rate. Despite some adjustments in the early 1980s, the rates were initially too high to solicit a wide export supply response. The second reason is that FDI, the main driver of exports did not increase until the late 1980s. Third, the export-oriented 11. Successful trade liberalisation has been often accompanied by some real depreciations of the local currency in order to facilitate growth of export industries.
TAD/TC/WP(2007)6/PART2/D/FINAL
16
industries such as electronics required high upfront import of capital goods and continued import of intermediate inputs.
Figure 9. Philippines trade, 1980-2005 (US$ billions)
-30.0
-20.0
-10.0
0.0
10.0
20.0
30.0
40.0
50.0
1980 1985 1990 1995 2000 2005
ExportImportBalance
Source : WITS database
Figure 10. Philippines trade growth 1980-2005 (3-year moving averages)
-15%
-10%
-5%
0%
5%
10%
15%
20%
25%
30%
1980
1982
1984
1986
1988
1990
1992
1994
1996
1998
2000
2002
2004
ExportImport
1. Moving averages were calculated using USD current dollar basis as average of the year, and the year before and after.
Source : Authors calculations from WITS
Figure 11. Philippines’ exports (Electronics and other exports)(1980-2005) (Billion US$)
0.0
5.0
10.0
15.0
20.0
25.0
30.0
35.0
40.0
1980
1983
1986
1989
1992
1995
1998
2001
Electronics
Other Exports
Source : Secretariat using WITS database
TAD/TC/WP(2007)6/PART2/D/FINAL
17
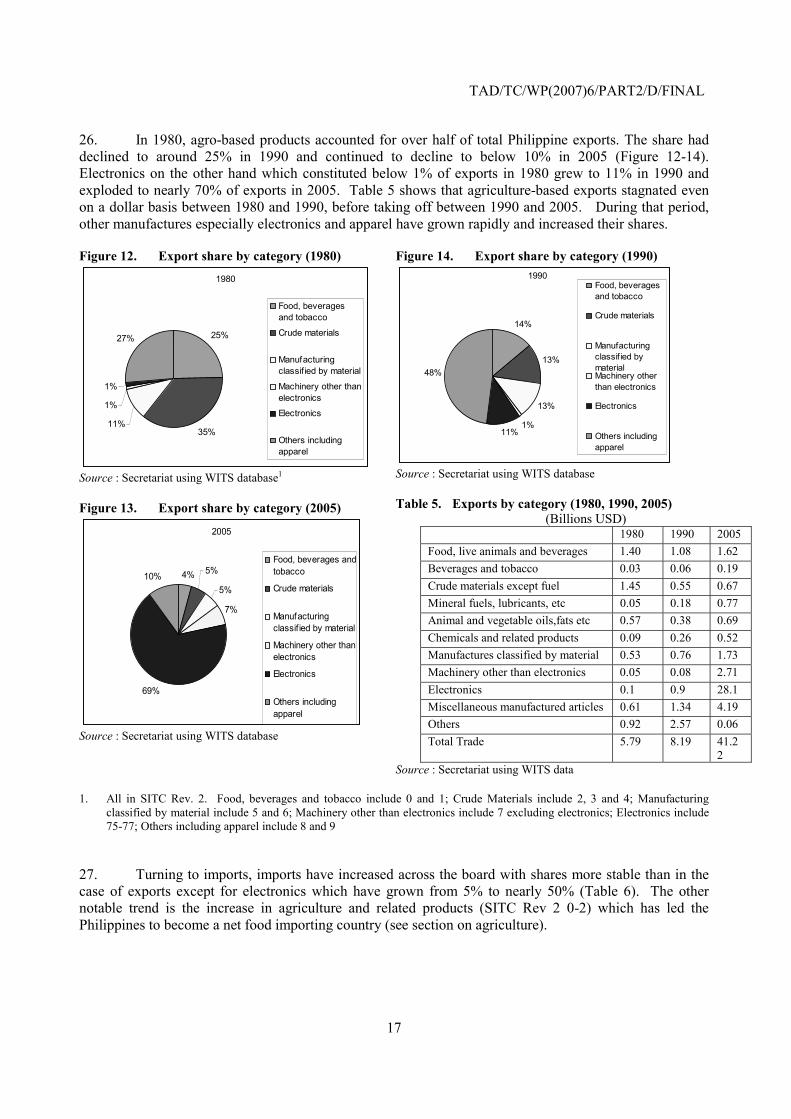
26. In 1980, agro-based products accounted for over half of total Philippine exports. The share had declined to around 25% in 1990 and continued to decline to below 10% in 2005 (Figure 12-14). Electronics on the other hand which constituted below 1% of exports in 1980 grew to 11% in 1990 and exploded to nearly 70% of exports in 2005. Table 5 shows that agriculture-based exports stagnated even on a dollar basis between 1980 and 1990, before taking off between 1990 and 2005. During that period, other manufactures especially electronics and apparel have grown rapidly and increased their shares.
Figure 12. Export share by category (1980) 1980
25%
35%11%
1%
1%
27%
Food, beveragesand tobacco
Crude materials
Manufacturingclassified by material
Machinery other thanelectronics
Electronics
Others includingapparel
Source : Secretariat using WITS database1 Figure 13. Export share by category (2005)
2005
4% 5%
5%
7%
69%
10%
Food, beverages andtobacco
Crude materials
Manufacturingclassif ied by material
Machinery other thanelectronics
Electronics
Others includingapparel
Source : Secretariat using WITS database
Figure 14. Export share by category (1990) 1990
14%
13%
13%
1%11%
48%
Food, beveragesand tobacco
Crude materials
Manufacturingclassif ied bymaterialMachinery otherthan electronics
Electronics
Others includingapparel
Source : Secretariat using WITS database Table 5. Exports by category (1980, 1990, 2005)
(Billions USD) 1980 1990 2005 Food, live animals and beverages 1.40 1.08 1.62 Beverages and tobacco 0.03 0.06 0.19 Crude materials except fuel 1.45 0.55 0.67 Mineral fuels, lubricants, etc 0.05 0.18 0.77 Animal and vegetable oils,fats etc 0.57 0.38 0.69 Chemicals and related products 0.09 0.26 0.52 Manufactures classified by material 0.53 0.76 1.73 Machinery other than electronics 0.05 0.08 2.71 Electronics 0.1 0.9 28.1 Miscellaneous manufactured articles 0.61 1.34 4.19 Others 0.92 2.57 0.06 Total Trade 5.79 8.19 41.2
2 Source : Secretariat using WITS data
1. All in SITC Rev. 2. Food, beverages and tobacco include 0 and 1; Crude Materials include 2, 3 and 4; Manufacturing
classified by material include 5 and 6; Machinery other than electronics include 7 excluding electronics; Electronics include 75-77; Others including apparel include 8 and 9
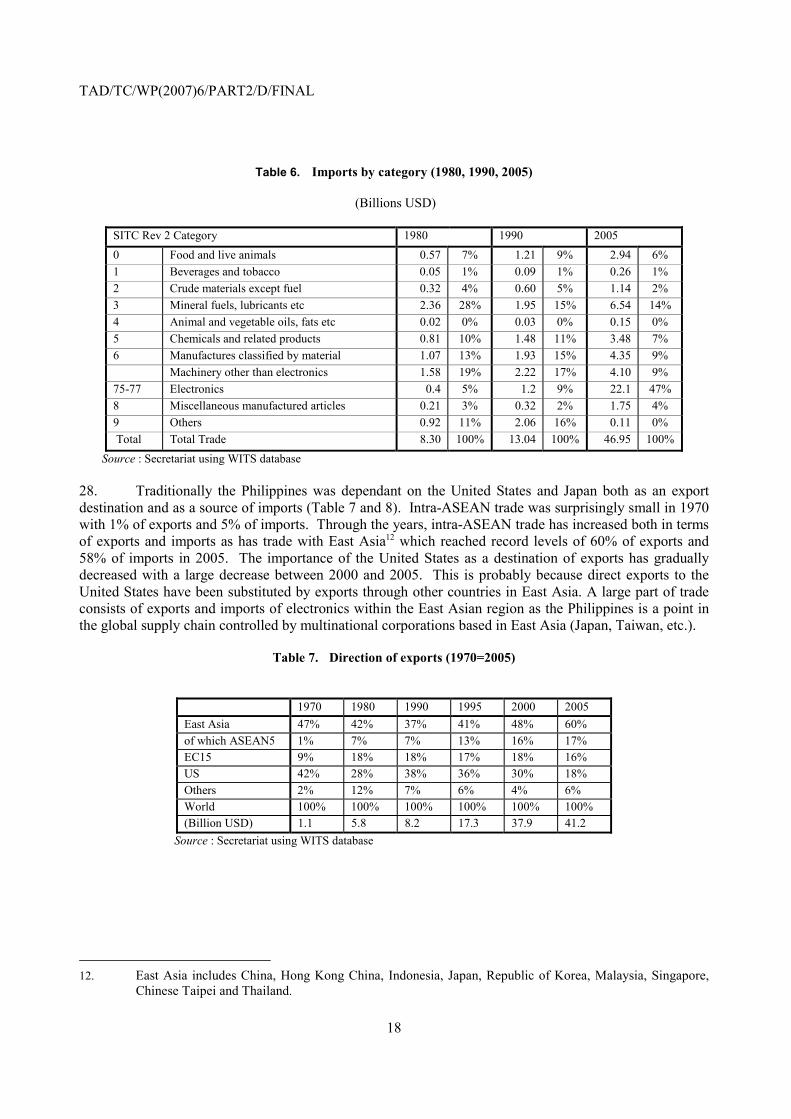
27. Turning to imports, imports have increased across the board with shares more stable than in the case of exports except for electronics which have grown from 5% to nearly 50% (Table 6). The other notable trend is the increase in agriculture and related products (SITC Rev 2 0-2) which has led the Philippines to become a net food importing country (see section on agriculture).
TAD/TC/WP(2007)6/PART2/D/FINAL
18
Table 6. Imports by category (1980, 1990, 2005)
(Billions USD)
SITC Rev 2 Category 1980 1990 2005 0 Food and live animals 0.57 7% 1.21 9% 2.94 6% 1 Beverages and tobacco 0.05 1% 0.09 1% 0.26 1% 2 Crude materials except fuel 0.32 4% 0.60 5% 1.14 2% 3 Mineral fuels, lubricants etc 2.36 28% 1.95 15% 6.54 14% 4 Animal and vegetable oils, fats etc 0.02 0% 0.03 0% 0.15 0% 5 Chemicals and related products 0.81 10% 1.48 11% 3.48 7% 6 Manufactures classified by material 1.07 13% 1.93 15% 4.35 9% Machinery other than electronics 1.58 19% 2.22 17% 4.10 9% 75-77 Electronics 0.4 5% 1.2 9% 22.1 47% 8 Miscellaneous manufactured articles 0.21 3% 0.32 2% 1.75 4% 9 Others 0.92 11% 2.06 16% 0.11 0% Total Total Trade 8.30 100% 13.04 100% 46.95 100%
Source : Secretariat using WITS database
28. Traditionally the Philippines was dependant on the United States and Japan both as an export destination and as a source of imports (Table 7 and 8). Intra-ASEAN trade was surprisingly small in 1970 with 1% of exports and 5% of imports. Through the years, intra-ASEAN trade has increased both in terms of exports and imports as has trade with East Asia12 which reached record levels of 60% of exports and 58% of imports in 2005. The importance of the United States as a destination of exports has gradually decreased with a large decrease between 2000 and 2005. This is probably because direct exports to the United States have been substituted by exports through other countries in East Asia. A large part of trade consists of exports and imports of electronics within the East Asian region as the Philippines is a point in the global supply chain controlled by multinational corporations based in East Asia (Japan, Taiwan, etc.).
Table 7. Direction of exports (1970=2005)
1970 1980 1990 1995 2000 2005 East Asia 47% 42% 37% 41% 48% 60% of which ASEAN5 1% 7% 7% 13% 16% 17% EC15 9% 18% 18% 17% 18% 16% US 42% 28% 38% 36% 30% 18% Others 2% 12% 7% 6% 4% 6% World 100% 100% 100% 100% 100% 100% (Billion USD) 1.1 5.8 8.2 17.3 37.9 41.2
Source : Secretariat using WITS database
12. East Asia includes China, Hong Kong China, Indonesia, Japan, Republic of Korea, Malaysia, Singapore,
Chinese Taipei and Thailand.
TAD/TC/WP(2007)6/PART2/D/FINAL
19
Table 8. Direction of imports (1970-2005)
1970 1980 1990 1995 2000 2005 East Asia 38% 35% 43% 51% 50% 58% Of which ASEAN5 5% 6% 9% 12% 14% 18% EC15 17% 12% 12% 11% 9% 8% US 29% 24% 20% 19% 15% 17% Others 11% 29% 25% 9% 26% 17% World 100% 100% 100% 100% 100% 100% (Billion USD) 1.2 8.3 13.0 28.5 37.0 47.0
Source : Secretariat using WITS database
Investment policy
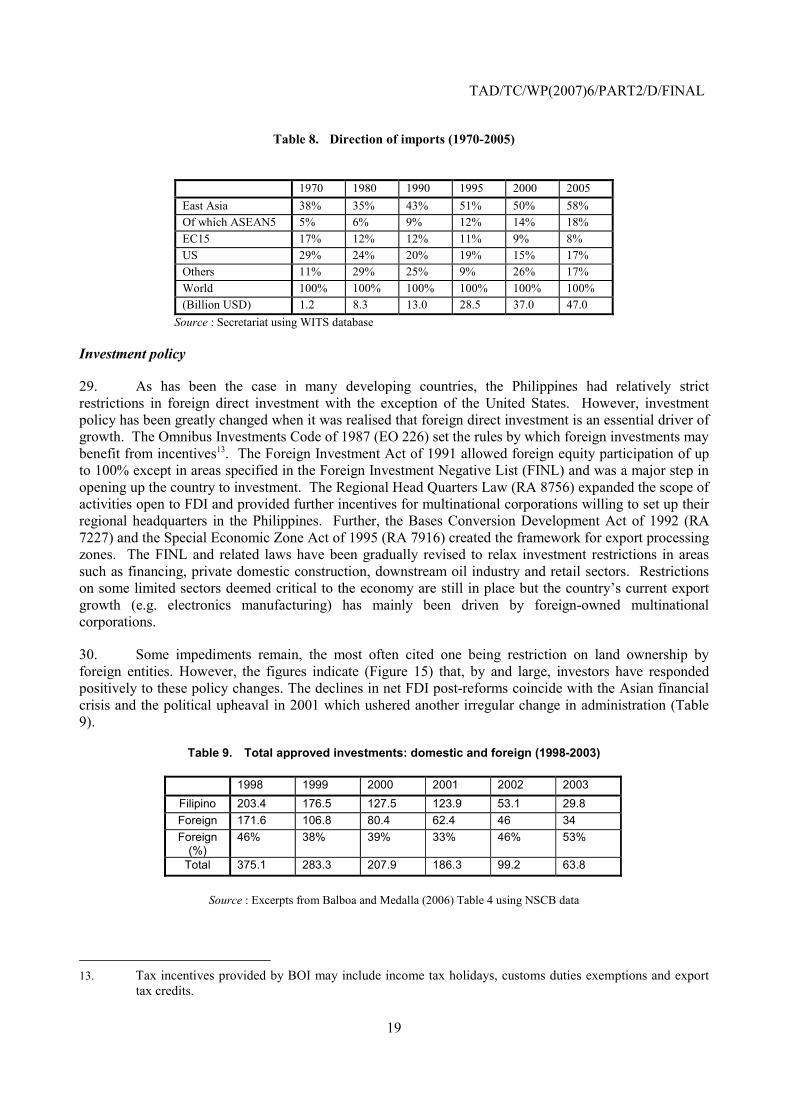
29. As has been the case in many developing countries, the Philippines had relatively strict restrictions in foreign direct investment with the exception of the United States. However, investment policy has been greatly changed when it was realised that foreign direct investment is an essential driver of growth. The Omnibus Investments Code of 1987 (EO 226) set the rules by which foreign investments may benefit from incentives13. The Foreign Investment Act of 1991 allowed foreign equity participation of up to 100% except in areas specified in the Foreign Investment Negative List (FINL) and was a major step in opening up the country to investment. The Regional Head Quarters Law (RA 8756) expanded the scope of activities open to FDI and provided further incentives for multinational corporations willing to set up their regional headquarters in the Philippines. Further, the Bases Conversion Development Act of 1992 (RA 7227) and the Special Economic Zone Act of 1995 (RA 7916) created the framework for export processing zones. The FINL and related laws have been gradually revised to relax investment restrictions in areas such as financing, private domestic construction, downstream oil industry and retail sectors. Restrictions on some limited sectors deemed critical to the economy are still in place but the country’s current export growth (e.g. electronics manufacturing) has mainly been driven by foreign-owned multinational corporations.
30. Some impediments remain, the most often cited one being restriction on land ownership by foreign entities. However, the figures indicate (Figure 15) that, by and large, investors have responded positively to these policy changes. The declines in net FDI post-reforms coincide with the Asian financial crisis and the political upheaval in 2001 which ushered another irregular change in administration (Table 9).
Table 9. Total approved investments: domestic and foreign (1998-2003)
1998 1999 2000 2001 2002 2003 Filipino 203.4 176.5 127.5 123.9 53.1 29.8 Foreign 171.6 106.8 80.4 62.4 46 34 Foreign
(%) 46% 38% 39% 33% 46% 53%
Total 375.1 283.3 207.9 186.3 99.2 63.8
Source : Excerpts from Balboa and Medalla (2006) Table 4 using NSCB data
13. Tax incentives provided by BOI may include income tax holidays, customs duties exemptions and export
tax credits.
TAD/TC/WP(2007)6/PART2/D/FINAL
20
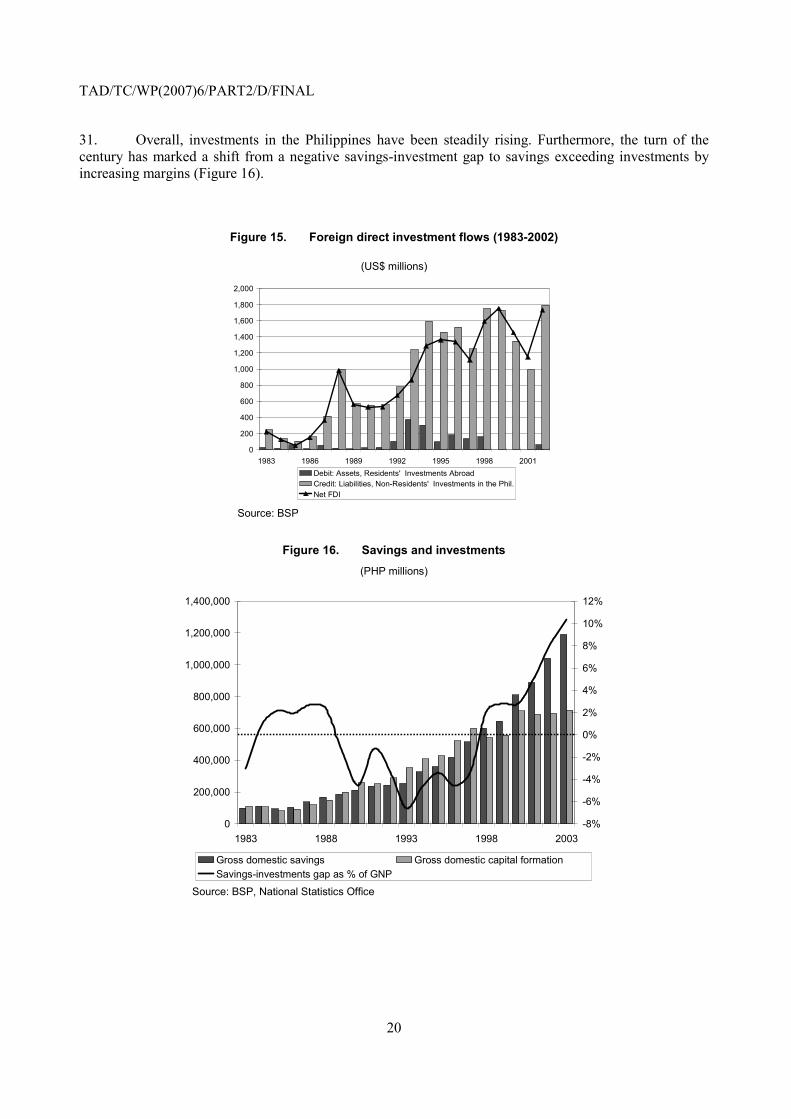
31. Overall, investments in the Philippines have been steadily rising. Furthermore, the turn of the century has marked a shift from a negative savings-investment gap to savings exceeding investments by increasing margins (Figure 16).
Figure 15. Foreign direct investment flows (1983-2002)
(US$ millions)
0
200
400
600
800
1,000
1,200
1,400
1,600
1,800
2,000
1983 1986 1989 1992 1995 1998 2001Debit: Assets, Residents' Investments AbroadCredit: Liabilities, Non-Residents' Investments in the Phil.Net FDI
Source: BSP
Figure 16. Savings and investments (PHP millions)
0
200,000
400,000
600,000
800,000
1,000,000
1,200,000
1,400,000
1983 1988 1993 1998 2003-8%
-6%
-4%
-2%
0%
2%
4%
6%
8%
10%
12%
Gross domestic savings Gross domestic capital formationSavings-investments gap as % of GNP
Source: BSP, National Statistics Office
TAD/TC/WP(2007)6/PART2/D/FINAL
21
5. Structural adjustments in the manufacturing and agricultural sectors
32. Trade and investment liberalisation together with various other reforms have triggered some structural adjustment both in the manufacturing and agriculture sectors. Trade liberalisation has reduced distortions adversely affecting the efficient allocation of resources to import substituting manufacturing over exports and agriculture, and consumer goods over capital and intermediate goods (Austria 2002). However, results of trade and investment liberalisation have been mixed, with some notable successes such as electronics, but with supply response generally falling short of expectations.
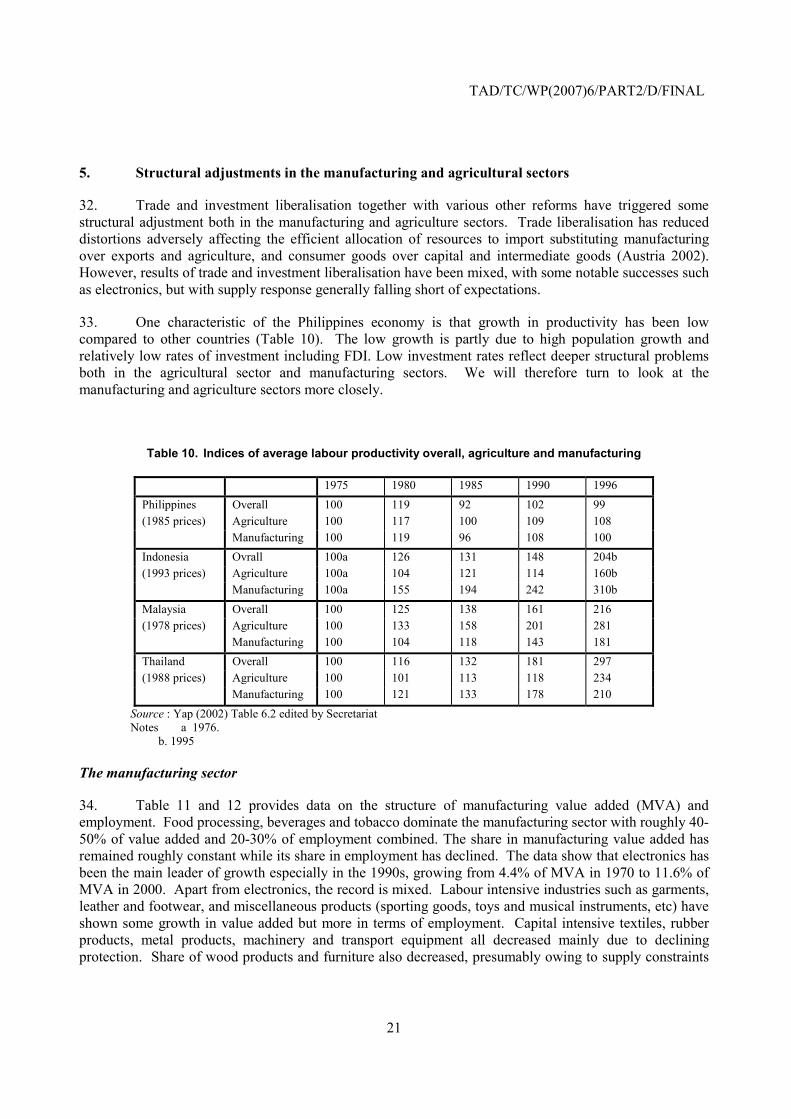
33. One characteristic of the Philippines economy is that growth in productivity has been low compared to other countries (Table 10). The low growth is partly due to high population growth and relatively low rates of investment including FDI. Low investment rates reflect deeper structural problems both in the agricultural sector and manufacturing sectors. We will therefore turn to look at the manufacturing and agriculture sectors more closely.
Table 10. Indices of average labour productivity overall, agriculture and manufacturing
1975 1980 1985 1990 1996 Philippines Overall 100 119 92 102 99 (1985 prices) Agriculture 100 117 100 109 108 Manufacturing 100 119 96 108 100 Indonesia Ovrall 100a 126 131 148 204b (1993 prices) Agriculture 100a 104 121 114 160b Manufacturing 100a 155 194 242 310b Malaysia Overall 100 125 138 161 216 (1978 prices) Agriculture 100 133 158 201 281 Manufacturing 100 104 118 143 181 Thailand Overall 100 116 132 181 297 (1988 prices) Agriculture 100 101 113 118 234 Manufacturing 100 121 133 178 210
Source : Yap (2002) Table 6.2 edited by Secretariat Notes a 1976. b. 1995
The manufacturing sector
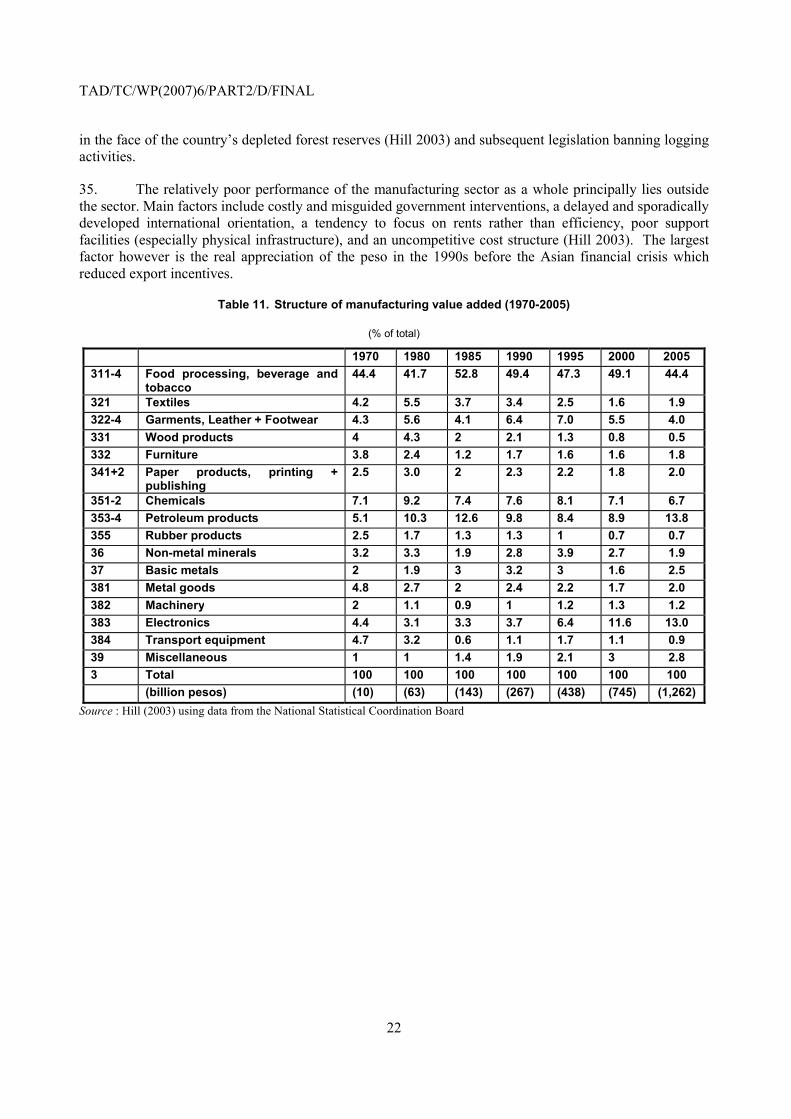
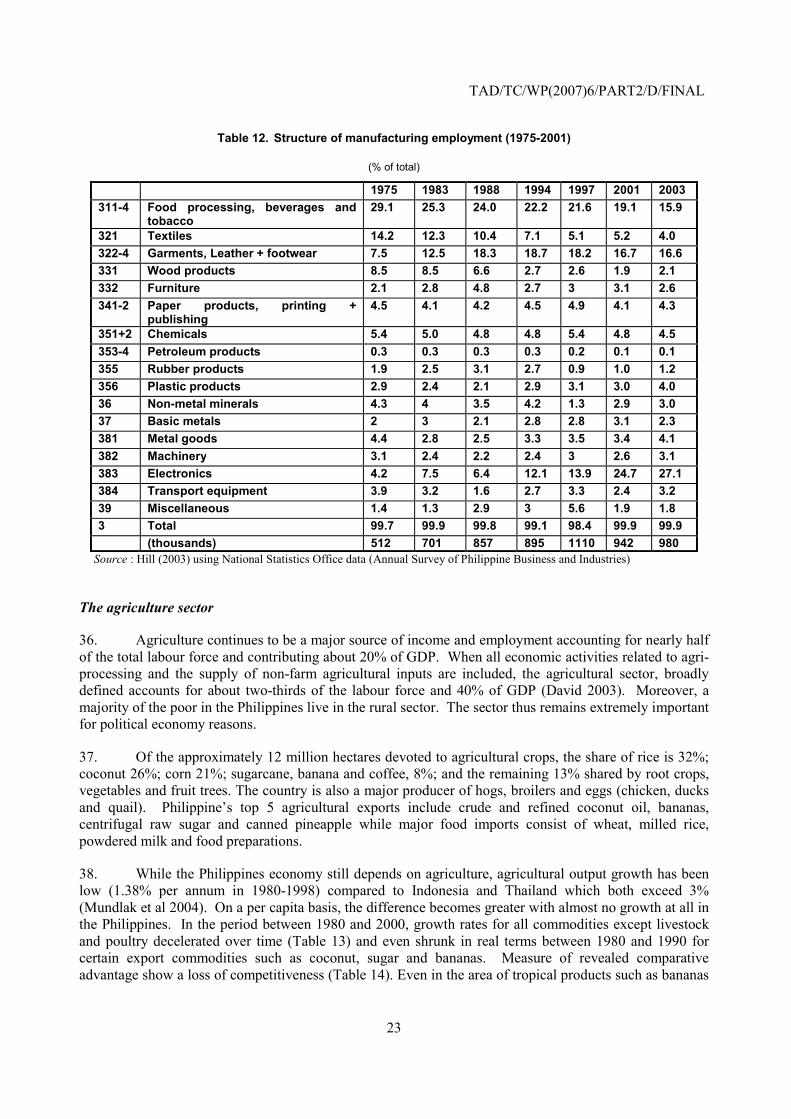
34. Table 11 and 12 provides data on the structure of manufacturing value added (MVA) and employment. Food processing, beverages and tobacco dominate the manufacturing sector with roughly 40-50% of value added and 20-30% of employment combined. The share in manufacturing value added has remained roughly constant while its share in employment has declined. The data show that electronics has been the main leader of growth especially in the 1990s, growing from 4.4% of MVA in 1970 to 11.6% of MVA in 2000. Apart from electronics, the record is mixed. Labour intensive industries such as garments, leather and footwear, and miscellaneous products (sporting goods, toys and musical instruments, etc) have shown some growth in value added but more in terms of employment. Capital intensive textiles, rubber products, metal products, machinery and transport equipment all decreased mainly due to declining protection. Share of wood products and furniture also decreased, presumably owing to supply constraints
TAD/TC/WP(2007)6/PART2/D/FINAL
22
in the face of the country’s depleted forest reserves (Hill 2003) and subsequent legislation banning logging activities.
35. The relatively poor performance of the manufacturing sector as a whole principally lies outside the sector. Main factors include costly and misguided government interventions, a delayed and sporadically developed international orientation, a tendency to focus on rents rather than efficiency, poor support facilities (especially physical infrastructure), and an uncompetitive cost structure (Hill 2003). The largest factor however is the real appreciation of the peso in the 1990s before the Asian financial crisis which reduced export incentives.
Table 11. Structure of manufacturing value added (1970-2005)
(% of total)
1970 1980 1985 1990 1995 2000 2005311-4 Food processing, beverage and
tobacco 44.4 41.7 52.8 49.4 47.3 49.1 44.4
321 Textiles 4.2 5.5 3.7 3.4 2.5 1.6 1.9322-4 Garments, Leather + Footwear 4.3 5.6 4.1 6.4 7.0 5.5 4.0331 Wood products 4 4.3 2 2.1 1.3 0.8 0.5332 Furniture 3.8 2.4 1.2 1.7 1.6 1.6 1.8341+2 Paper products, printing +
publishing 2.5 3.0 2 2.3 2.2 1.8 2.0
351-2 Chemicals 7.1 9.2 7.4 7.6 8.1 7.1 6.7353-4 Petroleum products 5.1 10.3 12.6 9.8 8.4 8.9 13.8355 Rubber products 2.5 1.7 1.3 1.3 1 0.7 0.736 Non-metal minerals 3.2 3.3 1.9 2.8 3.9 2.7 1.937 Basic metals 2 1.9 3 3.2 3 1.6 2.5381 Metal goods 4.8 2.7 2 2.4 2.2 1.7 2.0382 Machinery 2 1.1 0.9 1 1.2 1.3 1.2383 Electronics 4.4 3.1 3.3 3.7 6.4 11.6 13.0384 Transport equipment 4.7 3.2 0.6 1.1 1.7 1.1 0.939 Miscellaneous 1 1 1.4 1.9 2.1 3 2.83 Total 100 100 100 100 100 100 100 (billion pesos) (10) (63) (143) (267) (438) (745) (1,262)
Source : Hill (2003) using data from the National Statistical Coordination Board
TAD/TC/WP(2007)6/PART2/D/FINAL
23
Table 12. Structure of manufacturing employment (1975-2001)
(% of total)
1975 1983 1988 1994 1997 2001 2003311-4 Food processing, beverages and
tobacco 29.1 25.3 24.0 22.2 21.6 19.1 15.9
321 Textiles 14.2 12.3 10.4 7.1 5.1 5.2 4.0322-4 Garments, Leather + footwear 7.5 12.5 18.3 18.7 18.2 16.7 16.6331 Wood products 8.5 8.5 6.6 2.7 2.6 1.9 2.1332 Furniture 2.1 2.8 4.8 2.7 3 3.1 2.6341-2 Paper products, printing +
publishing 4.5 4.1 4.2 4.5 4.9 4.1 4.3
351+2 Chemicals 5.4 5.0 4.8 4.8 5.4 4.8 4.5353-4 Petroleum products 0.3 0.3 0.3 0.3 0.2 0.1 0.1355 Rubber products 1.9 2.5 3.1 2.7 0.9 1.0 1.2356 Plastic products 2.9 2.4 2.1 2.9 3.1 3.0 4.036 Non-metal minerals 4.3 4 3.5 4.2 1.3 2.9 3.037 Basic metals 2 3 2.1 2.8 2.8 3.1 2.3381 Metal goods 4.4 2.8 2.5 3.3 3.5 3.4 4.1382 Machinery 3.1 2.4 2.2 2.4 3 2.6 3.1383 Electronics 4.2 7.5 6.4 12.1 13.9 24.7 27.1384 Transport equipment 3.9 3.2 1.6 2.7 3.3 2.4 3.239 Miscellaneous 1.4 1.3 2.9 3 5.6 1.9 1.83 Total 99.7 99.9 99.8 99.1 98.4 99.9 99.9 (thousands) 512 701 857 895 1110 942 980
Source : Hill (2003) using National Statistics Office data (Annual Survey of Philippine Business and Industries)
The agriculture sector
36. Agriculture continues to be a major source of income and employment accounting for nearly half of the total labour force and contributing about 20% of GDP. When all economic activities related to agri-processing and the supply of non-farm agricultural inputs are included, the agricultural sector, broadly defined accounts for about two-thirds of the labour force and 40% of GDP (David 2003). Moreover, a majority of the poor in the Philippines live in the rural sector. The sector thus remains extremely important for political economy reasons.
37. Of the approximately 12 million hectares devoted to agricultural crops, the share of rice is 32%; coconut 26%; corn 21%; sugarcane, banana and coffee, 8%; and the remaining 13% shared by root crops, vegetables and fruit trees. The country is also a major producer of hogs, broilers and eggs (chicken, ducks and quail). Philippine’s top 5 agricultural exports include crude and refined coconut oil, bananas, centrifugal raw sugar and canned pineapple while major food imports consist of wheat, milled rice, powdered milk and food preparations.
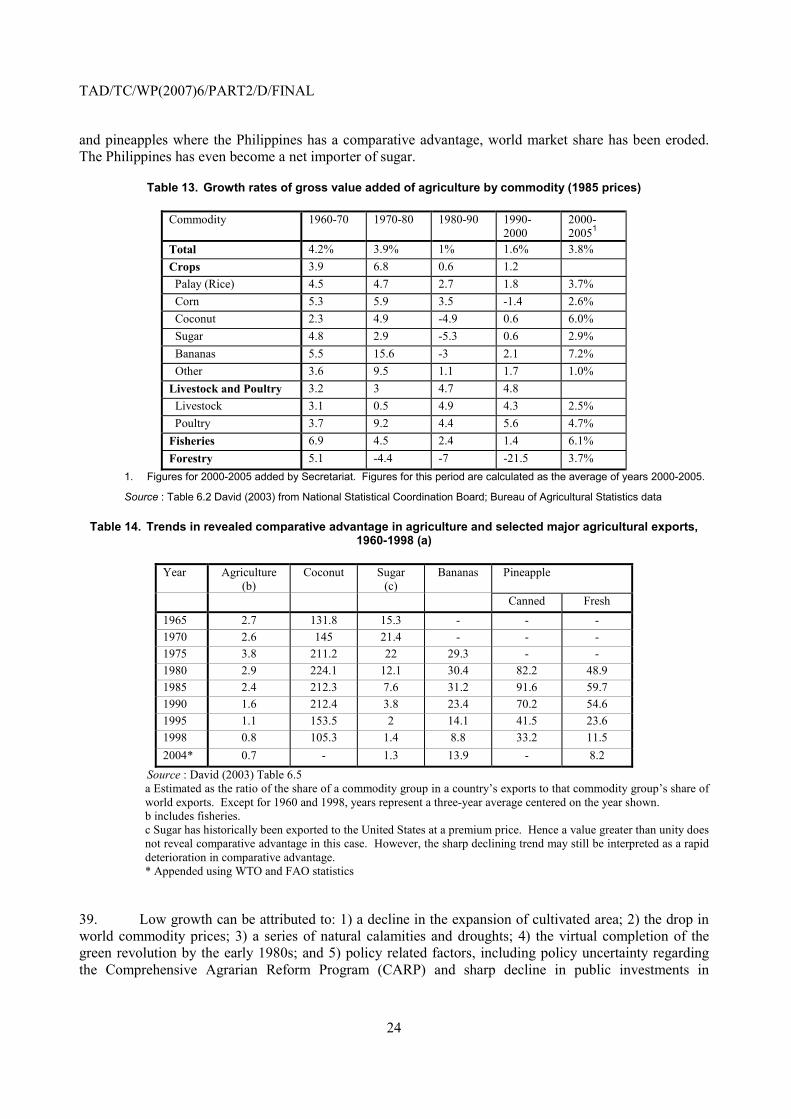
38. While the Philippines economy still depends on agriculture, agricultural output growth has been low (1.38% per annum in 1980-1998) compared to Indonesia and Thailand which both exceed 3% (Mundlak et al 2004). On a per capita basis, the difference becomes greater with almost no growth at all in the Philippines. In the period between 1980 and 2000, growth rates for all commodities except livestock and poultry decelerated over time (Table 13) and even shrunk in real terms between 1980 and 1990 for certain export commodities such as coconut, sugar and bananas. Measure of revealed comparative advantage show a loss of competitiveness (Table 14). Even in the area of tropical products such as bananas
TAD/TC/WP(2007)6/PART2/D/FINAL
24
and pineapples where the Philippines has a comparative advantage, world market share has been eroded. The Philippines has even become a net importer of sugar.
Table 13. Growth rates of gross value added of agriculture by commodity (1985 prices)
Commodity 1960-70 1970-80 1980-90 1990-2000
2000- 20051
Total 4.2% 3.9% 1% 1.6% 3.8% Crops 3.9 6.8 0.6 1.2 Palay (Rice) 4.5 4.7 2.7 1.8 3.7% Corn 5.3 5.9 3.5 -1.4 2.6% Coconut 2.3 4.9 -4.9 0.6 6.0% Sugar 4.8 2.9 -5.3 0.6 2.9% Bananas 5.5 15.6 -3 2.1 7.2% Other 3.6 9.5 1.1 1.7 1.0% Livestock and Poultry 3.2 3 4.7 4.8 Livestock 3.1 0.5 4.9 4.3 2.5% Poultry 3.7 9.2 4.4 5.6 4.7% Fisheries 6.9 4.5 2.4 1.4 6.1% Forestry 5.1 -4.4 -7 -21.5 3.7%
1. Figures for 2000-2005 added by Secretariat. Figures for this period are calculated as the average of years 2000-2005.
Source : Table 6.2 David (2003) from National Statistical Coordination Board; Bureau of Agricultural Statistics data
Table 14. Trends in revealed comparative advantage in agriculture and selected major agricultural exports, 1960-1998 (a)
Year Agriculture (b)
Coconut Sugar (c)
Bananas Pineapple
Canned Fresh 1965 2.7 131.8 15.3 - - - 1970 2.6 145 21.4 - - - 1975 3.8 211.2 22 29.3 - - 1980 2.9 224.1 12.1 30.4 82.2 48.9 1985 2.4 212.3 7.6 31.2 91.6 59.7 1990 1.6 212.4 3.8 23.4 70.2 54.6 1995 1.1 153.5 2 14.1 41.5 23.6 1998 0.8 105.3 1.4 8.8 33.2 11.5 2004* 0.7 - 1.3 13.9 - 8.2
Source : David (2003) Table 6.5 a Estimated as the ratio of the share of a commodity group in a country’s exports to that commodity group’s share of world exports. Except for 1960 and 1998, years represent a three-year average centered on the year shown. b includes fisheries. c Sugar has historically been exported to the United States at a premium price. Hence a value greater than unity does not reveal comparative advantage in this case. However, the sharp declining trend may still be interpreted as a rapid deterioration in comparative advantage. * Appended using WTO and FAO statistics
39. Low growth can be attributed to: 1) a decline in the expansion of cultivated area; 2) the drop in world commodity prices; 3) a series of natural calamities and droughts; 4) the virtual completion of the green revolution by the early 1980s; and 5) policy related factors, including policy uncertainty regarding the Comprehensive Agrarian Reform Program (CARP) and sharp decline in public investments in
TAD/TC/WP(2007)6/PART2/D/FINAL
25
agriculture14 (Mundlak et al 2002). Biased industrial policies in the past have hobbled the growth of the processed food industry. Prior to the 1990s, scarce capital, and foreign exchange and trade policy burdened the agricultural sector.15 Capital was allocated at artificially low interest rates to industrial activities to the detriment of agricultural modernisation. Up to the 1970s, the anti-agriculture bias in trade policy (i.e. high tariff protection for manufacturing and export taxes on agricultural exports) together with an over-valued exchange rate provided a disincentive for exports and led to increased import competition. The resistance to adjust the foreign exchange rate in the early 1980s maintained such a bias against agriculture.
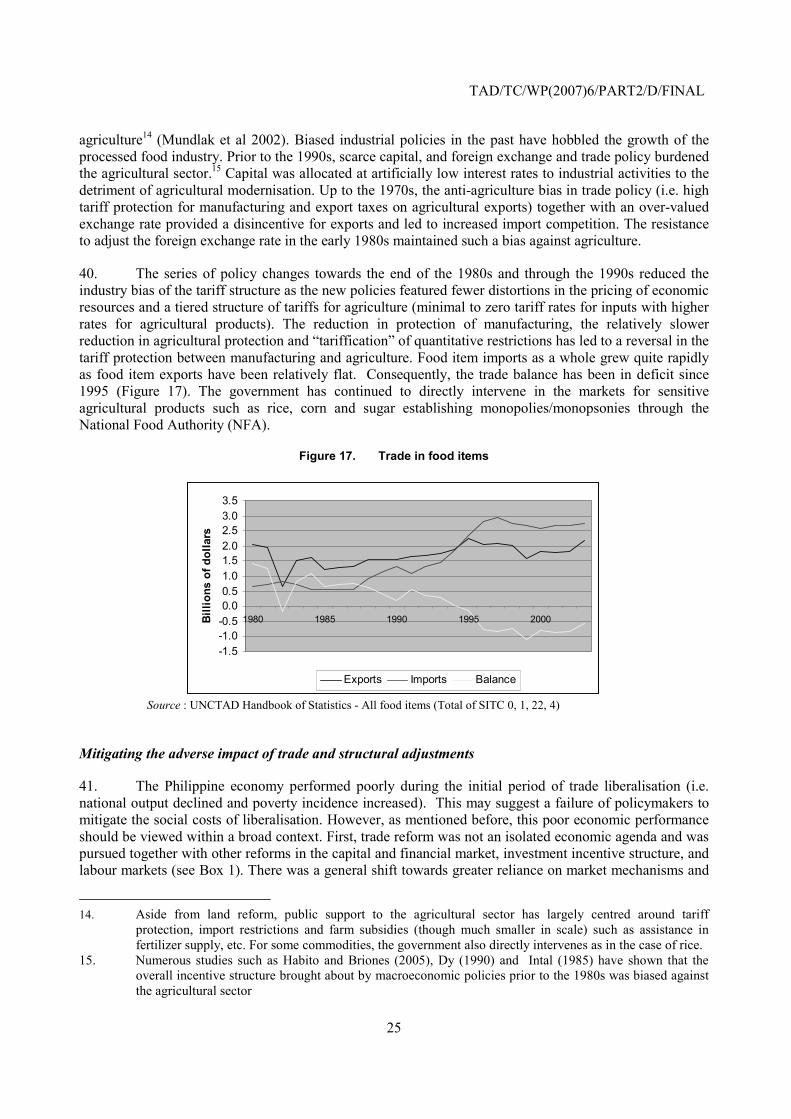
40. The series of policy changes towards the end of the 1980s and through the 1990s reduced the industry bias of the tariff structure as the new policies featured fewer distortions in the pricing of economic resources and a tiered structure of tariffs for agriculture (minimal to zero tariff rates for inputs with higher rates for agricultural products). The reduction in protection of manufacturing, the relatively slower reduction in agricultural protection and “tariffication” of quantitative restrictions has led to a reversal in the tariff protection between manufacturing and agriculture. Food item imports as a whole grew quite rapidly as food item exports have been relatively flat. Consequently, the trade balance has been in deficit since 1995 (Figure 17). The government has continued to directly intervene in the markets for sensitive agricultural products such as rice, corn and sugar establishing monopolies/monopsonies through the National Food Authority (NFA).
Figure 17. Trade in food items
-1.5-1.0-0.50.00.51.01.52.02.53.03.5
1980 1985 1990 1995 2000Billi
ons
of d
olla
rs
Exports Imports Balance
Source : UNCTAD Handbook of Statistics - All food items (Total of SITC 0, 1, 22, 4)
Mitigating the adverse impact of trade and structural adjustments
41. The Philippine economy performed poorly during the initial period of trade liberalisation (i.e. national output declined and poverty incidence increased). This may suggest a failure of policymakers to mitigate the social costs of liberalisation. However, as mentioned before, this poor economic performance should be viewed within a broad context. First, trade reform was not an isolated economic agenda and was pursued together with other reforms in the capital and financial market, investment incentive structure, and labour markets (see Box 1). There was a general shift towards greater reliance on market mechanisms and
14. Aside from land reform, public support to the agricultural sector has largely centred around tariff
protection, import restrictions and farm subsidies (though much smaller in scale) such as assistance in fertilizer supply, etc. For some commodities, the government also directly intervenes as in the case of rice.
15. Numerous studies such as Habito and Briones (2005), Dy (1990) and Intal (1985) have shown that the overall incentive structure brought about by macroeconomic policies prior to the 1980s was biased against the agricultural sector
TAD/TC/WP(2007)6/PART2/D/FINAL
26
policymakers expected that such extensive liberalisation would yield quicker results in terms of economic growth. Second, the start of economic reforms coincided with the most turbulent decade in Philippine political history. Thus the effects of political troubles easily overshadowed the gains from reforms. Consequently, the fruits of economic reforms only become apparent when the political atmosphere improved in the middle of 1990s.
42. Were there active policies set into motion to mitigate the potential negative impact of reforms? The Philippines government indeed undertook a number of safety net programmes such as food subsidies, public employment programmes and credit-based livelihood programmes which were intended to mitigate the effects of economic reform on the poor.16 However, the general policy direction during the period seems to be one of letting market-driven responses address the potentially adverse effects of trade liberalisation and structural adjustments.
43. Two points appear to bear these out. First: despite numerous discussions on the need for safety nets when the liberalisation policies were being crafted, there were no specific policy moves to address trade related adjustments. Second, reforms in other sectors appear to have facilitated market-driven responses from the private sector. For example, the liberalisation of the telecoms industry paved the way for the onset of the business process outsourcing industry that has now become an important source of growth for the Philippine economy. Similarly, the reforms removed the bias for “big” business and redirected resources to help promote the growth of more flexible and efficient micro, small, and medium enterprises particularly in the transport and retail services. These reforms proved to be conducive for greater development in the countryside and some decentralisation of economic growth.
44. As may be observed from the series of reforms outlined in Box 1, the economic environment and development process for the Philippines has significantly been altered. The reforms undertaken to liberalise the labour and capital markets enabled businesses and individuals to adapt to the new environment and take advantage of the opportunities present in the midst of reforms. The resulting shift in the economic structure where the services sector grew in importance compared to the industrial and agricultural sectors together with the increased role of OFWs and their remittances to the Philippine economy clearly suggest that the private sector and market forces acted as “social safety nets” of trade reform and structural adjustment.
45. As a result, despite the temporary halt by the Asian Financial Crisis, growth accelerated since the beginning of the 1990s. Poverty rates also declined as the new business environment became favourable to geographical decentralisation and the proliferation of smaller businesses. Instead of a hollowing out of the industrial sector, what is actually taking place in the Philippine economy is a “services sector revolution”. The services sector has become the new engine of growth and this can be expected to stimulate the development of the industrial sector in the years to come. A change in the development and growth path of the Philippines appears to have resulted from the reforms that have been undertaken.
6. Sectoral developments
46. In this section, we take a more in depth look at the structural adjustment experiences of selected sectors; (1) the electronics sector; (2) the food processing sector; (3) the cement sector; and (4) the business process outsourcing and IT services sector. The sectors have been chosen as they provide different insights
16 According to Subbarao et al. (1996), the Philippines government’s efforts to ease transitional problems and
to protect the well-being of the poor have focused on three major “safety net” programmes, food subsidies, public employment programmes and credit-based livelihood programmes. The study examines the effectiveness of these programmes from the perspectives of targeting, cost-effectiveness and sustainability, and finds that these programmes need substantial improvement.
TAD/TC/WP(2007)6/PART2/D/FINAL
27
into the Philippines’s structural adjustment experience. The electronics sector is the rising star in the export sector. The food processing sector is a major export sector which has not lived up to its potential. The cement sector is a typical import substitution sector which is still in the process of adjustment. Lastly, the business process outsourcing and IT services (BPO-ITS) sector is an example of an emerging globally competitive sector, services.
1) Electronics
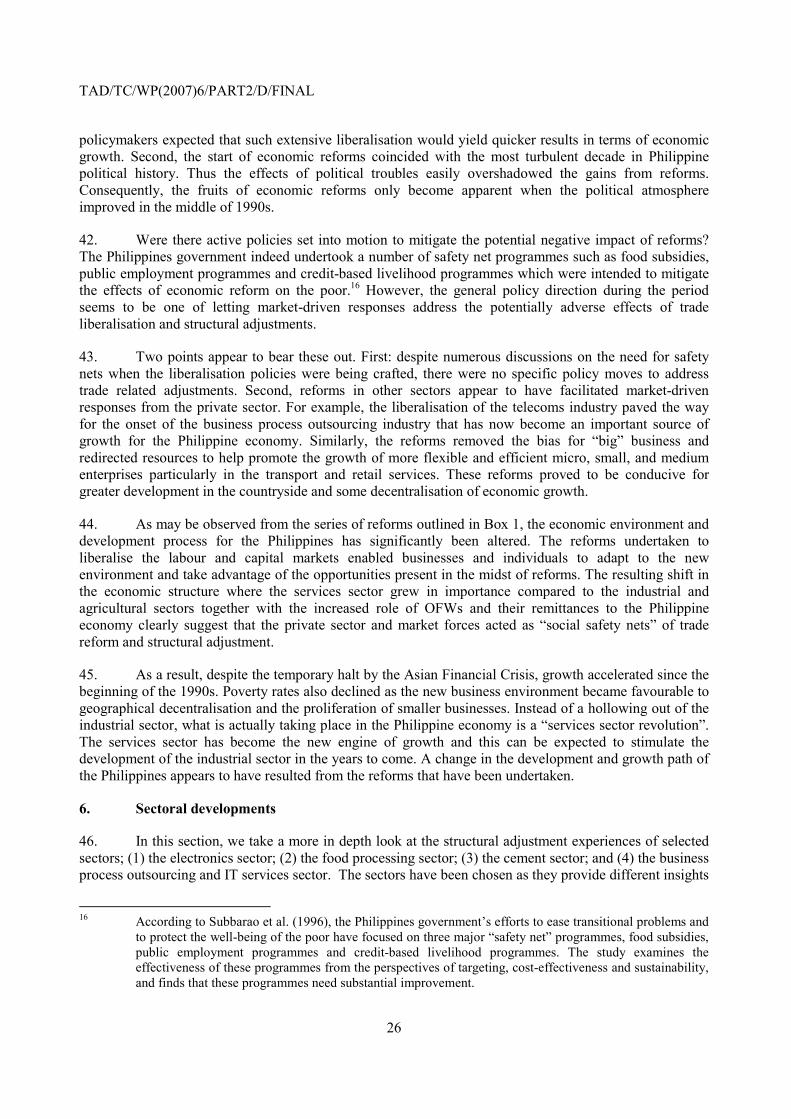
47. The electronics sub-sector is undoubtedly one of the key sectors in the Philippines manufacturing sector. Over the last decade and a half, this sub-sector has managed to become a major economic engine and driver of growth. It constitutes about 70% of total exports and about half of total imports in recent years and employed an estimated 346 thousand employees in 2003 (DTI). It has quickly increased its share in total manufacturing value added to over 10% of total MVA (Figure 18).
48. The electronics manufacturing industry in the Philippines has its roots in the early 1980s. The Philippines’ relatively cheap, abundant (skilled labour), and highly trainable labour provided a comparative advantage in relatively labour-intensive assembly and delivery processes. This was further expanded to include testing and some processing by the 1990s. By the mid-1980s to the early 1990s another labour-intensive industry, textile and garments, overtook electronics and became the major export commodity for a period.
Figure 18. Electronics share and employment
0%
10%
20%
30%
40%
50%
60%
70%
80%
1985 1989 1993 1997 20010
50
100
150
200
250
300
350
400
Employment (in thousands)% share of electronics to manufacturing GVA (left axis)% share of electronics to total exports (left axis)
Source: National Statistical Coordination Board, National Statistics Office, Board of Investments, Philippine Economic Zone Authority
49. The latter half of the 1990s marked the real takeoff of the industry as the industry’s operations were further expanded to include parts manufacturing, design, and packaging. Shares in total exports exceeded 20 to 30% at this time (Figure 18). Aside from the series of policy changes that further opened up the Philippine economy, the second boom in the industry was largely related to the advent of special economic zones (SEZs). The economic zones enabled investors, both foreign and local, to take advantage
TAD/TC/WP(2007)6/PART2/D/FINAL
28
of the country’s competitive labour force by 1) bypassing infrastructure constraints, 2) streamlining import-export processes17 and 3) providing pockets of free trade.
50. Among the various incentives offered were allowance for full foreign ownership of enterprises within zones with permanent resident status to investors, freer employment of foreign professionals, zero tariffs on imports by export-oriented enterprises (at least 70% of production), income tax holidays and a 5% tax on gross revenues in lieu of all other taxes, and ability to deduct human resource development costs. In addition these zones had self-contained infrastructure support and enjoyed the special attention of the Philippine Economic Zone Authority (PEZA) which coordinated with manufacturers to streamline bureaucratic processes particularly speeding up import and export procedures (see Annex).
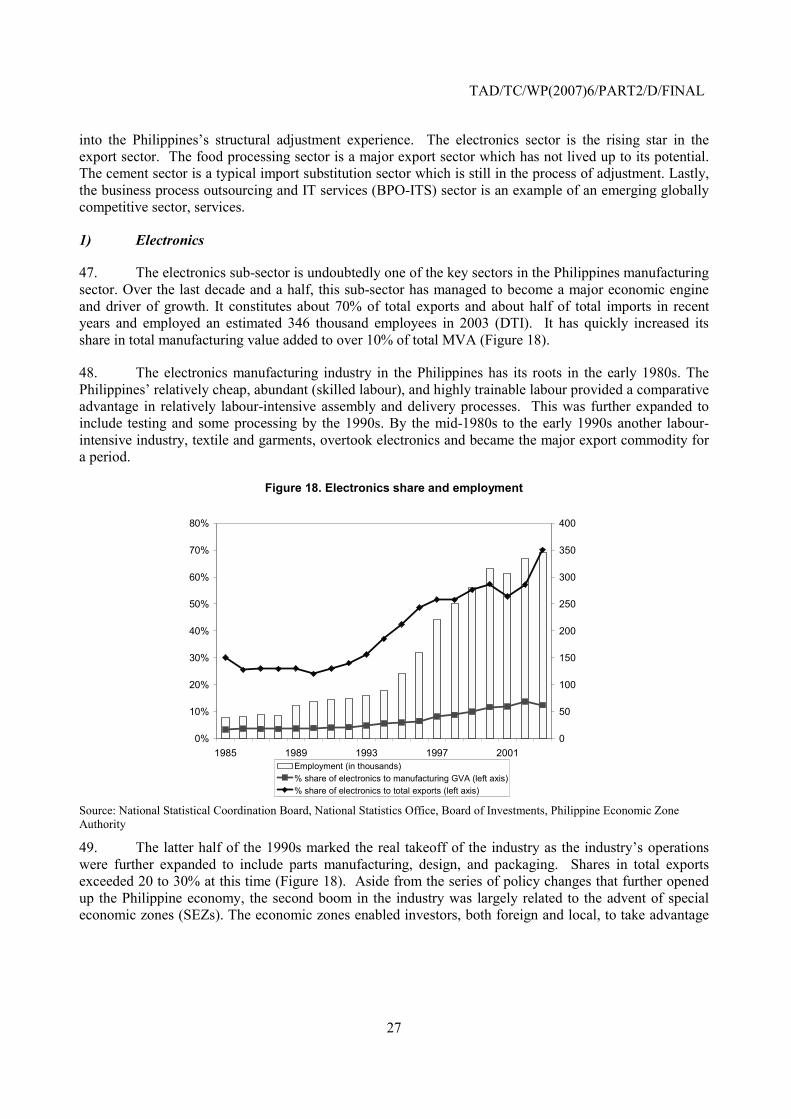
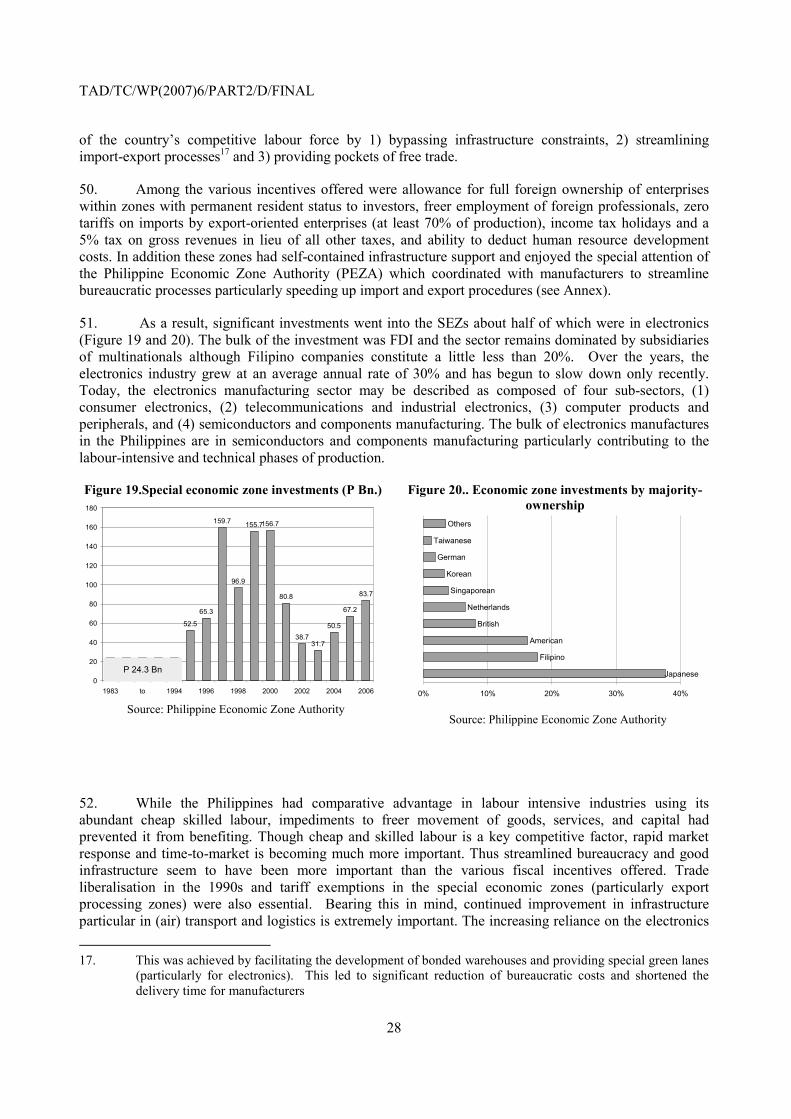
51. As a result, significant investments went into the SEZs about half of which were in electronics (Figure 19 and 20). The bulk of the investment was FDI and the sector remains dominated by subsidiaries of multinationals although Filipino companies constitute a little less than 20%. Over the years, the electronics industry grew at an average annual rate of 30% and has begun to slow down only recently. Today, the electronics manufacturing sector may be described as composed of four sub-sectors, (1) consumer electronics, (2) telecommunications and industrial electronics, (3) computer products and peripherals, and (4) semiconductors and components manufacturing. The bulk of electronics manufactures in the Philippines are in semiconductors and components manufacturing particularly contributing to the labour-intensive and technical phases of production.
Figure 19.Special economic zone investments (P Bn.)
52.5
65.3
159.7
96.9
155.7156.7
80.8
38.731.7
50.5
67.2
83.7
0
20
40
60
80
100
120
140
160
180
1983 to 1994 1996 1998 2000 2002 2004 2006
P 24.3 Bn
Source: Philippine Economic Zone Authority
Figure 20.. Economic zone investments by majority-ownership
Japanese
Filipino
American
British
Netherlands
Singaporean
Korean
German
Taiwanese
Others
0% 10% 20% 30% 40%
Source: Philippine Economic Zone Authority
52. While the Philippines had comparative advantage in labour intensive industries using its abundant cheap skilled labour, impediments to freer movement of goods, services, and capital had prevented it from benefiting. Though cheap and skilled labour is a key competitive factor, rapid market response and time-to-market is becoming much more important. Thus streamlined bureaucracy and good infrastructure seem to have been more important than the various fiscal incentives offered. Trade liberalisation in the 1990s and tariff exemptions in the special economic zones (particularly export processing zones) were also essential. Bearing this in mind, continued improvement in infrastructure particular in (air) transport and logistics is extremely important. The increasing reliance on the electronics 17. This was achieved by facilitating the development of bonded warehouses and providing special green lanes
(particularly for electronics). This led to significant reduction of bureaucratic costs and shortened the delivery time for manufacturers
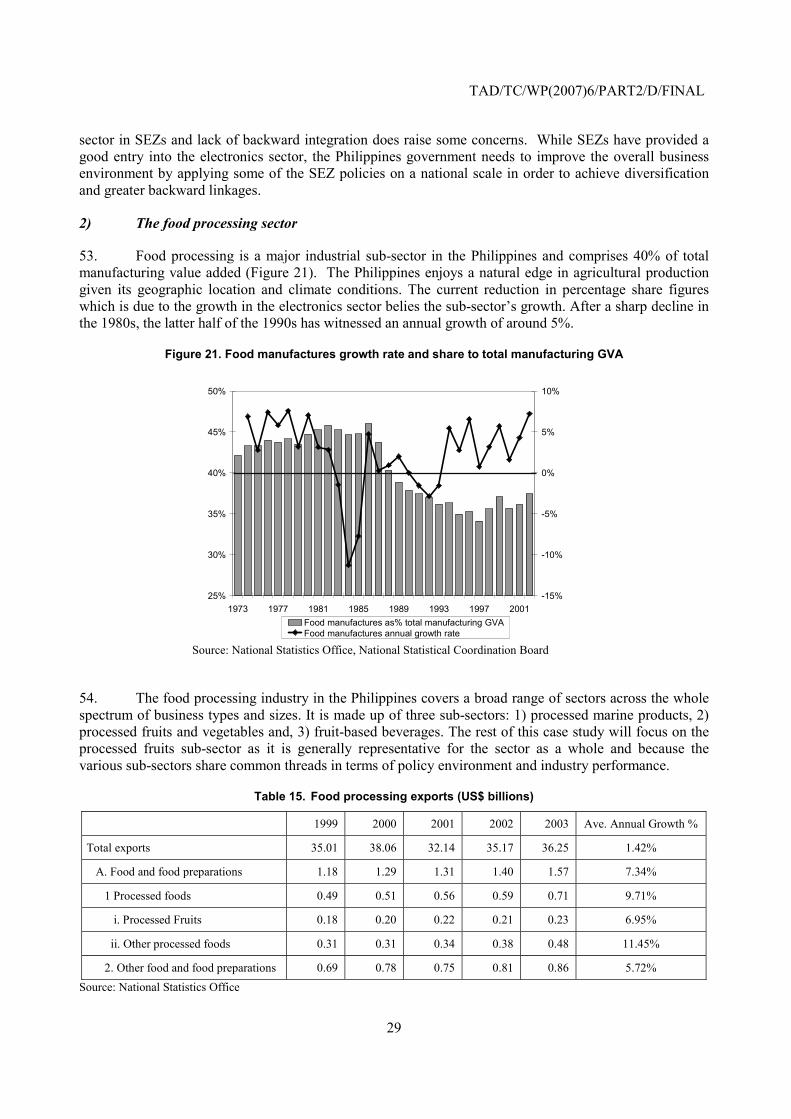
TAD/TC/WP(2007)6/PART2/D/FINAL
29
sector in SEZs and lack of backward integration does raise some concerns. While SEZs have provided a good entry into the electronics sector, the Philippines government needs to improve the overall business environment by applying some of the SEZ policies on a national scale in order to achieve diversification and greater backward linkages.
2) The food processing sector
53. Food processing is a major industrial sub-sector in the Philippines and comprises 40% of total manufacturing value added (Figure 21). The Philippines enjoys a natural edge in agricultural production given its geographic location and climate conditions. The current reduction in percentage share figures which is due to the growth in the electronics sector belies the sub-sector’s growth. After a sharp decline in the 1980s, the latter half of the 1990s has witnessed an annual growth of around 5%.
Figure 21. Food manufactures growth rate and share to total manufacturing GVA
25%
30%
35%
40%
45%
50%
1973 1977 1981 1985 1989 1993 1997 2001-15%
-10%
-5%
0%
5%
10%
Food manufactures as% total manufacturing GVAFood manufactures annual growth rate
Source: National Statistics Office, National Statistical Coordination Board
54. The food processing industry in the Philippines covers a broad range of sectors across the whole spectrum of business types and sizes. It is made up of three sub-sectors: 1) processed marine products, 2) processed fruits and vegetables and, 3) fruit-based beverages. The rest of this case study will focus on the processed fruits sub-sector as it is generally representative for the sector as a whole and because the various sub-sectors share common threads in terms of policy environment and industry performance.
Table 15. Food processing exports (US$ billions)
1999 2000 2001 2002 2003 Ave. Annual Growth %
Total exports 35.01 38.06 32.14 35.17 36.25 1.42%
A. Food and food preparations 1.18 1.29 1.31 1.40 1.57 7.34%
1 Processed foods 0.49 0.51 0.56 0.59 0.71 9.71%
i. Processed Fruits 0.18 0.20 0.22 0.21 0.23 6.95%
ii. Other processed foods 0.31 0.31 0.34 0.38 0.48 11.45%
2. Other food and food preparations 0.69 0.78 0.75 0.81 0.86 5.72% Source: National Statistics Office
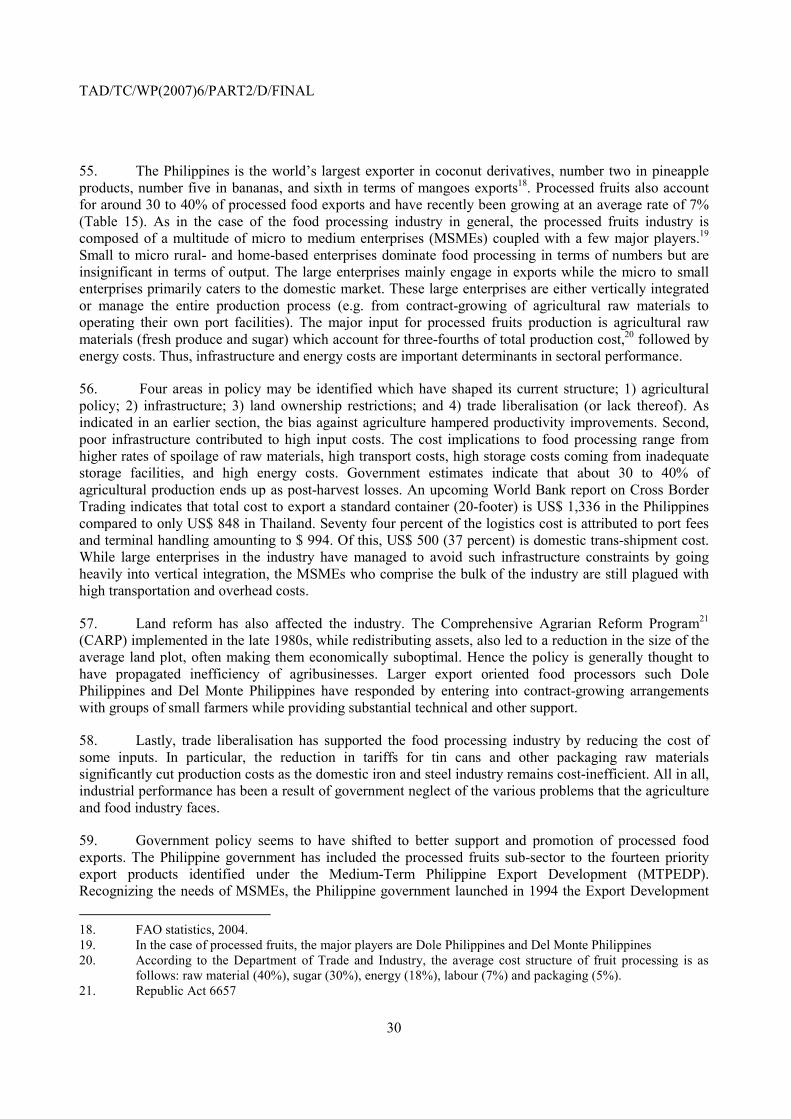
TAD/TC/WP(2007)6/PART2/D/FINAL
30
55. The Philippines is the world’s largest exporter in coconut derivatives, number two in pineapple products, number five in bananas, and sixth in terms of mangoes exports18. Processed fruits also account for around 30 to 40% of processed food exports and have recently been growing at an average rate of 7% (Table 15). As in the case of the food processing industry in general, the processed fruits industry is composed of a multitude of micro to medium enterprises (MSMEs) coupled with a few major players.19 Small to micro rural- and home-based enterprises dominate food processing in terms of numbers but are insignificant in terms of output. The large enterprises mainly engage in exports while the micro to small enterprises primarily caters to the domestic market. These large enterprises are either vertically integrated or manage the entire production process (e.g. from contract-growing of agricultural raw materials to operating their own port facilities). The major input for processed fruits production is agricultural raw materials (fresh produce and sugar) which account for three-fourths of total production cost,20 followed by energy costs. Thus, infrastructure and energy costs are important determinants in sectoral performance.
56. Four areas in policy may be identified which have shaped its current structure; 1) agricultural policy; 2) infrastructure; 3) land ownership restrictions; and 4) trade liberalisation (or lack thereof). As indicated in an earlier section, the bias against agriculture hampered productivity improvements. Second, poor infrastructure contributed to high input costs. The cost implications to food processing range from higher rates of spoilage of raw materials, high transport costs, high storage costs coming from inadequate storage facilities, and high energy costs. Government estimates indicate that about 30 to 40% of agricultural production ends up as post-harvest losses. An upcoming World Bank report on Cross Border Trading indicates that total cost to export a standard container (20-footer) is US$ 1,336 in the Philippines compared to only US$ 848 in Thailand. Seventy four percent of the logistics cost is attributed to port fees and terminal handling amounting to $ 994. Of this, US$ 500 (37 percent) is domestic trans-shipment cost. While large enterprises in the industry have managed to avoid such infrastructure constraints by going heavily into vertical integration, the MSMEs who comprise the bulk of the industry are still plagued with high transportation and overhead costs.
57. Land reform has also affected the industry. The Comprehensive Agrarian Reform Program21 (CARP) implemented in the late 1980s, while redistributing assets, also led to a reduction in the size of the average land plot, often making them economically suboptimal. Hence the policy is generally thought to have propagated inefficiency of agribusinesses. Larger export oriented food processors such Dole Philippines and Del Monte Philippines have responded by entering into contract-growing arrangements with groups of small farmers while providing substantial technical and other support.
58. Lastly, trade liberalisation has supported the food processing industry by reducing the cost of some inputs. In particular, the reduction in tariffs for tin cans and other packaging raw materials significantly cut production costs as the domestic iron and steel industry remains cost-inefficient. All in all, industrial performance has been a result of government neglect of the various problems that the agriculture and food industry faces.
59. Government policy seems to have shifted to better support and promotion of processed food exports. The Philippine government has included the processed fruits sub-sector to the fourteen priority export products identified under the Medium-Term Philippine Export Development (MTPEDP). Recognizing the needs of MSMEs, the Philippine government launched in 1994 the Export Development 18. FAO statistics, 2004. 19. In the case of processed fruits, the major players are Dole Philippines and Del Monte Philippines 20. According to the Department of Trade and Industry, the average cost structure of fruit processing is as follows: raw material (40%), sugar (30%), energy (18%), labour (7%) and packaging (5%). 21. Republic Act 6657
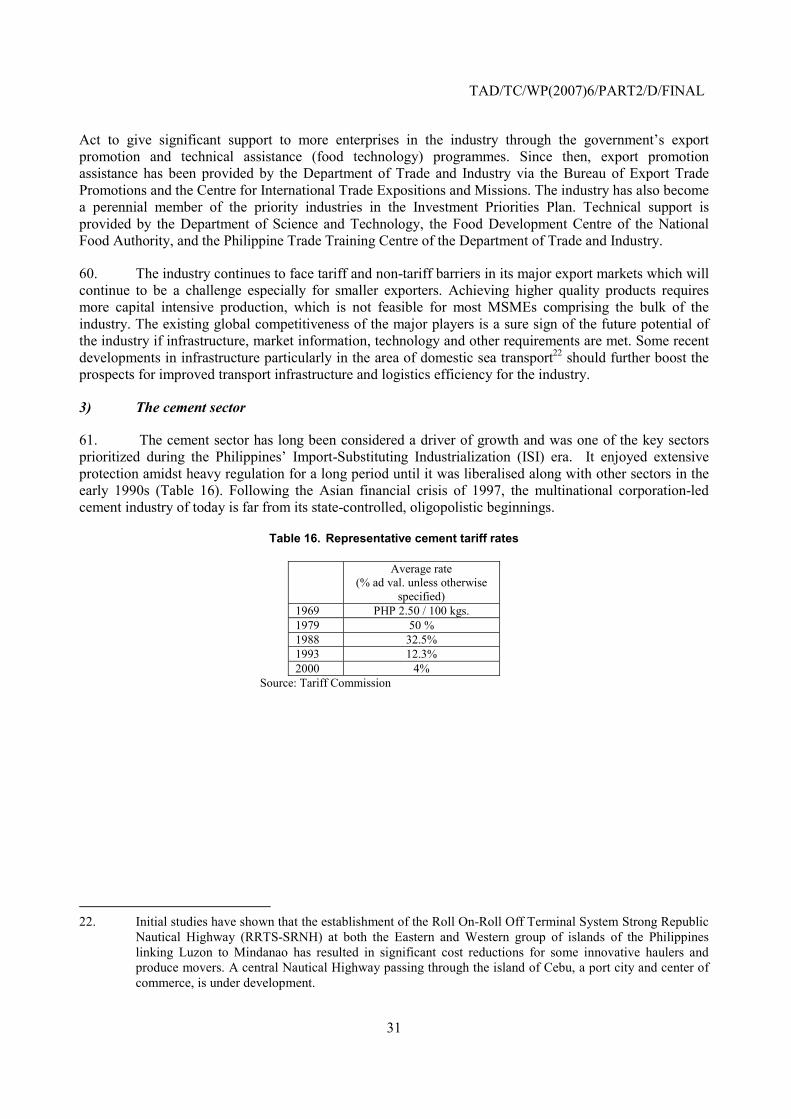
TAD/TC/WP(2007)6/PART2/D/FINAL
31
Act to give significant support to more enterprises in the industry through the government’s export promotion and technical assistance (food technology) programmes. Since then, export promotion assistance has been provided by the Department of Trade and Industry via the Bureau of Export Trade Promotions and the Centre for International Trade Expositions and Missions. The industry has also become a perennial member of the priority industries in the Investment Priorities Plan. Technical support is provided by the Department of Science and Technology, the Food Development Centre of the National Food Authority, and the Philippine Trade Training Centre of the Department of Trade and Industry.
60. The industry continues to face tariff and non-tariff barriers in its major export markets which will continue to be a challenge especially for smaller exporters. Achieving higher quality products requires more capital intensive production, which is not feasible for most MSMEs comprising the bulk of the industry. The existing global competitiveness of the major players is a sure sign of the future potential of the industry if infrastructure, market information, technology and other requirements are met. Some recent developments in infrastructure particularly in the area of domestic sea transport22 should further boost the prospects for improved transport infrastructure and logistics efficiency for the industry.
3) The cement sector
61. The cement sector has long been considered a driver of growth and was one of the key sectors prioritized during the Philippines’ Import-Substituting Industrialization (ISI) era. It enjoyed extensive protection amidst heavy regulation for a long period until it was liberalised along with other sectors in the early 1990s (Table 16). Following the Asian financial crisis of 1997, the multinational corporation-led cement industry of today is far from its state-controlled, oligopolistic beginnings.
Table 16. Representative cement tariff rates
Average rate (% ad val. unless otherwise
specified) 1969 PHP 2.50 / 100 kgs. 1979 50 % 1988 32.5% 1993 12.3% 2000 4%
Source: Tariff Commission
22. Initial studies have shown that the establishment of the Roll On-Roll Off Terminal System Strong Republic
Nautical Highway (RRTS-SRNH) at both the Eastern and Western group of islands of the Philippines linking Luzon to Mindanao has resulted in significant cost reductions for some innovative haulers and produce movers. A central Nautical Highway passing through the island of Cebu, a port city and center of commerce, is under development.
TAD/TC/WP(2007)6/PART2/D/FINAL
32
Figure 22.Cement kiln capacity and utilization
0
5,000
10,000
15,000
20,000
25,000
1965 1970 1975 1984 1989 1995 2000 20050%
10%
20%
30%
40%
50%
60%
70%
80%
90%
100%
Total kiln capacity kiln production Capacity utilization
* Data not available from 1976-1980.
Source: Cement Manufacturer’s Association of the Philippines (various years)
Sources: Central Bank of the Philippines and National Census and Statistics Office as cited in Estanislao and Antonio, 1980 for the period 1970 to 1978; ASEAN Countries Cement Associations as cited in Onoda, 1991 for the period 1980-1989; Cement Manufacturer’s Association of the Philippines from various sources for the period 1993 to 2004
62. Government involvement in the cement industry can be traced back to the 1920s when it controlled two out of three operations. Recognising its role in development, the government was highly protective and supportive towards the industry. Subsidised capital triggered a dramatic increase of cement capacity and production from the 1960s onwards in response to booming domestic construction (Figure 22). Capacity was increased from 372 thousand metric tons in 1952 to 7.2 million metric tons by 1975. This history of government support conditioned the cement industry to its highly leveraged structure23 and also meant that the government had a significant stake on the industry’s future. This close relationship with the state was largely responsible for the industry’s domestic focus and failure to modernise in the succeeding decades.24
63. The economic downturn at the onset of the 1970s marked the end of the expansionary period and caught the industry’s aggressive expansion midstream. The devaluation of the currency in 1970 badly hit the industry through a drastic decline in cement consumption, and higher energy and interest costs.25 Though some firms adapted by exporting cement, the industry as a whole was caught with too much capacity and not enough demand. Furthermore, the Philippines’ cement producers were relatively 23. An in-depth discussion of this development and of the Philippine cement industry during the 1970s is
presented in Estanislao, J.P. and E.T. Antonio, 1980. Comparative Advantage of Textile and Cement Industries in the Philippines. C.A.M. Series No. 4. Institute for Developing Economies.
24. Although globally the more efficient dry process became prevalent (96.7% in Indonesia in 1986), the cement industry in the Philippines continued to use the more inefficient wet process (41% in 1988).
25. Energy constitutes approximately 50% of production costs (Estanislao and Antonio, 1980 and NEDA, 2000).
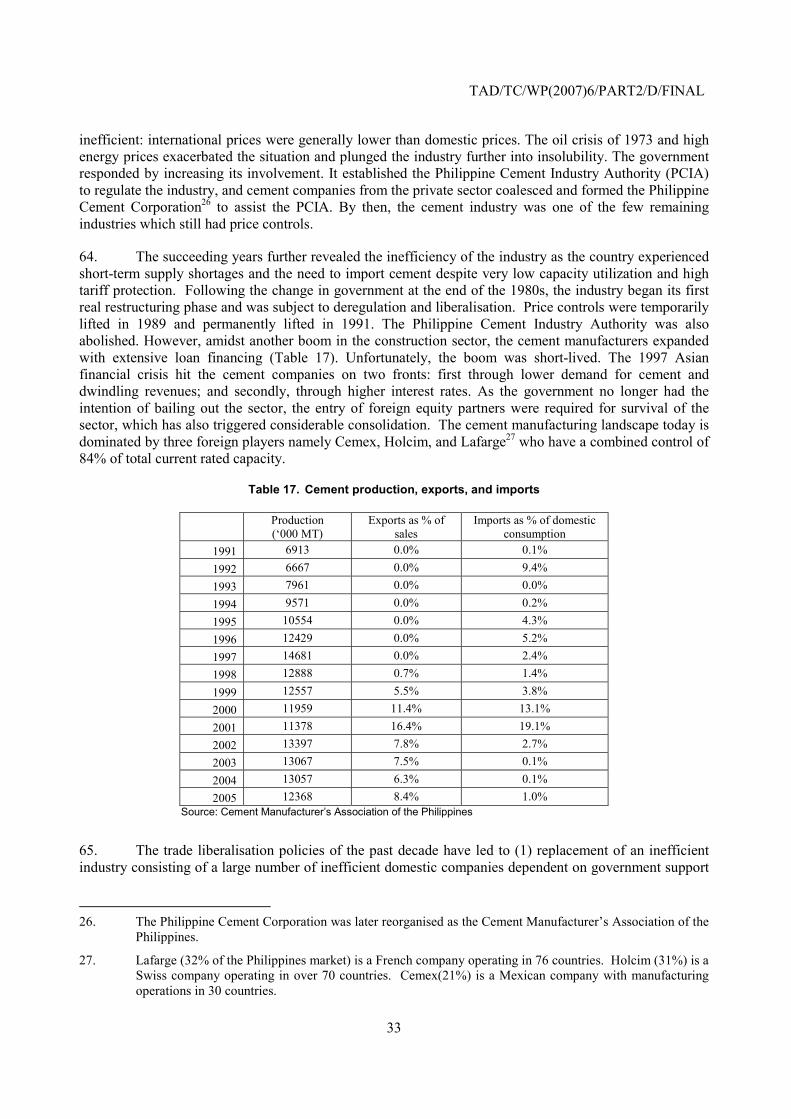
TAD/TC/WP(2007)6/PART2/D/FINAL
33
inefficient: international prices were generally lower than domestic prices. The oil crisis of 1973 and high energy prices exacerbated the situation and plunged the industry further into insolubility. The government responded by increasing its involvement. It established the Philippine Cement Industry Authority (PCIA) to regulate the industry, and cement companies from the private sector coalesced and formed the Philippine Cement Corporation26 to assist the PCIA. By then, the cement industry was one of the few remaining industries which still had price controls.
64. The succeeding years further revealed the inefficiency of the industry as the country experienced short-term supply shortages and the need to import cement despite very low capacity utilization and high tariff protection. Following the change in government at the end of the 1980s, the industry began its first real restructuring phase and was subject to deregulation and liberalisation. Price controls were temporarily lifted in 1989 and permanently lifted in 1991. The Philippine Cement Industry Authority was also abolished. However, amidst another boom in the construction sector, the cement manufacturers expanded with extensive loan financing (Table 17). Unfortunately, the boom was short-lived. The 1997 Asian financial crisis hit the cement companies on two fronts: first through lower demand for cement and dwindling revenues; and secondly, through higher interest rates. As the government no longer had the intention of bailing out the sector, the entry of foreign equity partners were required for survival of the sector, which has also triggered considerable consolidation. The cement manufacturing landscape today is dominated by three foreign players namely Cemex, Holcim, and Lafarge27 who have a combined control of 84% of total current rated capacity.
Table 17. Cement production, exports, and imports
Production (‘000 MT)
Exports as % of sales
Imports as % of domestic consumption
1991 6913 0.0% 0.1% 1992 6667 0.0% 9.4% 1993 7961 0.0% 0.0% 1994 9571 0.0% 0.2% 1995 10554 0.0% 4.3% 1996 12429 0.0% 5.2% 1997 14681 0.0% 2.4% 1998 12888 0.7% 1.4% 1999 12557 5.5% 3.8% 2000 11959 11.4% 13.1% 2001 11378 16.4% 19.1% 2002 13397 7.8% 2.7% 2003 13067 7.5% 0.1% 2004 13057 6.3% 0.1% 2005 12368 8.4% 1.0%
Source: Cement Manufacturer’s Association of the Philippines
65. The trade liberalisation policies of the past decade have led to (1) replacement of an inefficient industry consisting of a large number of inefficient domestic companies dependent on government support
26. The Philippine Cement Corporation was later reorganised as the Cement Manufacturer’s Association of the
Philippines.
27. Lafarge (32% of the Philippines market) is a French company operating in 76 countries. Holcim (31%) is a Swiss company operating in over 70 countries. Cemex(21%) is a Mexican company with manufacturing operations in 30 countries.
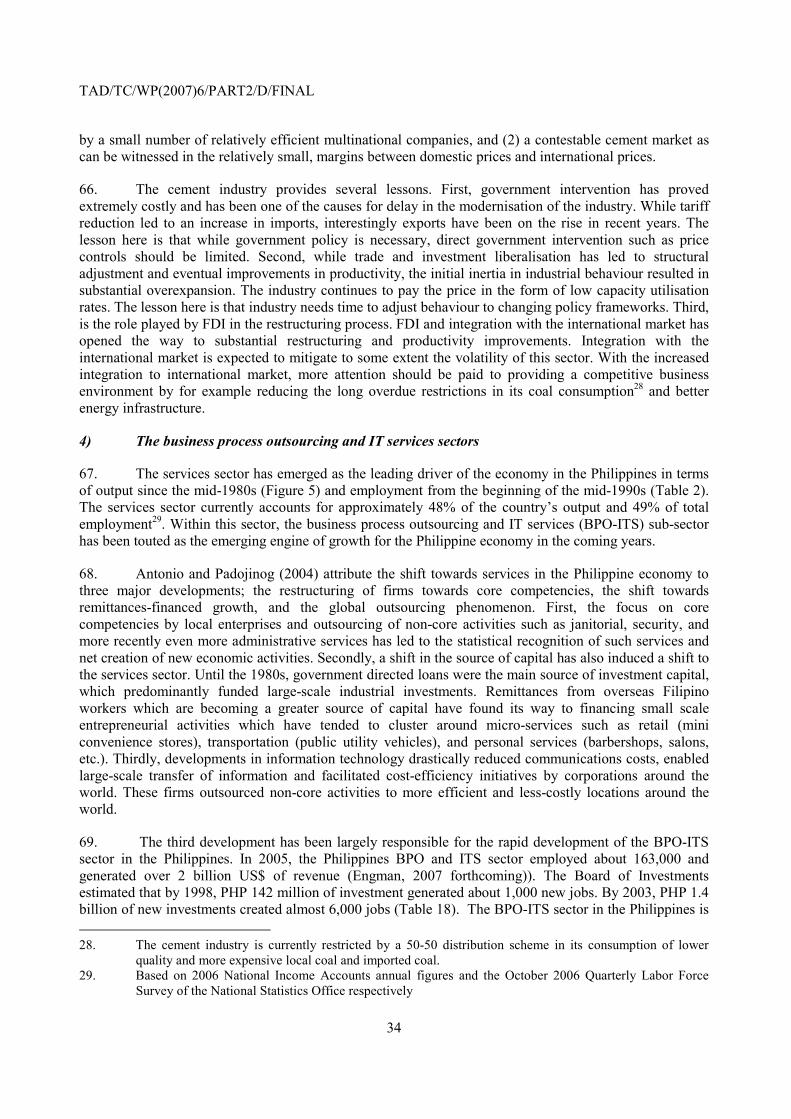
TAD/TC/WP(2007)6/PART2/D/FINAL
34
by a small number of relatively efficient multinational companies, and (2) a contestable cement market as can be witnessed in the relatively small, margins between domestic prices and international prices.
66. The cement industry provides several lessons. First, government intervention has proved extremely costly and has been one of the causes for delay in the modernisation of the industry. While tariff reduction led to an increase in imports, interestingly exports have been on the rise in recent years. The lesson here is that while government policy is necessary, direct government intervention such as price controls should be limited. Second, while trade and investment liberalisation has led to structural adjustment and eventual improvements in productivity, the initial inertia in industrial behaviour resulted in substantial overexpansion. The industry continues to pay the price in the form of low capacity utilisation rates. The lesson here is that industry needs time to adjust behaviour to changing policy frameworks. Third, is the role played by FDI in the restructuring process. FDI and integration with the international market has opened the way to substantial restructuring and productivity improvements. Integration with the international market is expected to mitigate to some extent the volatility of this sector. With the increased integration to international market, more attention should be paid to providing a competitive business environment by for example reducing the long overdue restrictions in its coal consumption28 and better energy infrastructure.
4) The business process outsourcing and IT services sectors
67. The services sector has emerged as the leading driver of the economy in the Philippines in terms of output since the mid-1980s (Figure 5) and employment from the beginning of the mid-1990s (Table 2). The services sector currently accounts for approximately 48% of the country’s output and 49% of total employment29. Within this sector, the business process outsourcing and IT services (BPO-ITS) sub-sector has been touted as the emerging engine of growth for the Philippine economy in the coming years.
68. Antonio and Padojinog (2004) attribute the shift towards services in the Philippine economy to three major developments; the restructuring of firms towards core competencies, the shift towards remittances-financed growth, and the global outsourcing phenomenon. First, the focus on core competencies by local enterprises and outsourcing of non-core activities such as janitorial, security, and more recently even more administrative services has led to the statistical recognition of such services and net creation of new economic activities. Secondly, a shift in the source of capital has also induced a shift to the services sector. Until the 1980s, government directed loans were the main source of investment capital, which predominantly funded large-scale industrial investments. Remittances from overseas Filipino workers which are becoming a greater source of capital have found its way to financing small scale entrepreneurial activities which have tended to cluster around micro-services such as retail (mini convenience stores), transportation (public utility vehicles), and personal services (barbershops, salons, etc.). Thirdly, developments in information technology drastically reduced communications costs, enabled large-scale transfer of information and facilitated cost-efficiency initiatives by corporations around the world. These firms outsourced non-core activities to more efficient and less-costly locations around the world.
69. The third development has been largely responsible for the rapid development of the BPO-ITS sector in the Philippines. In 2005, the Philippines BPO and ITS sector employed about 163,000 and generated over 2 billion US$ of revenue (Engman, 2007 forthcoming)). The Board of Investments estimated that by 1998, PHP 142 million of investment generated about 1,000 new jobs. By 2003, PHP 1.4 billion of new investments created almost 6,000 jobs (Table 18). The BPO-ITS sector in the Philippines is 28. The cement industry is currently restricted by a 50-50 distribution scheme in its consumption of lower
quality and more expensive local coal and imported coal. 29. Based on 2006 National Income Accounts annual figures and the October 2006 Quarterly Labor Force
Survey of the National Statistics Office respectively
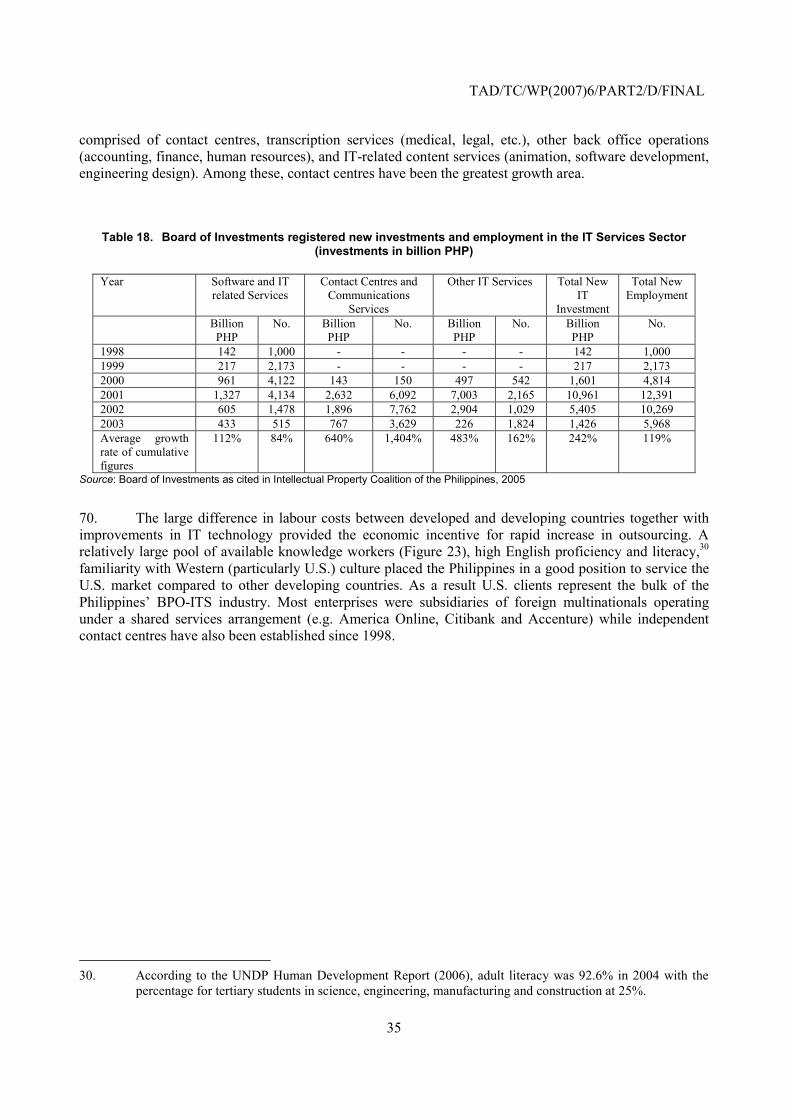
TAD/TC/WP(2007)6/PART2/D/FINAL
35
comprised of contact centres, transcription services (medical, legal, etc.), other back office operations (accounting, finance, human resources), and IT-related content services (animation, software development, engineering design). Among these, contact centres have been the greatest growth area.
Table 18. Board of Investments registered new investments and employment in the IT Services Sector (investments in billion PHP)
Year Software and IT related Services
Contact Centres and Communications
Services
Other IT Services Total New IT
Investment
Total New Employment
Billion PHP
No. Billion PHP
No. Billion PHP
No. Billion PHP
No.
1998 142 1,000 - - - - 142 1,000 1999 217 2,173 - - - - 217 2,173 2000 961 4,122 143 150 497 542 1,601 4,814 2001 1,327 4,134 2,632 6,092 7,003 2,165 10,961 12,391 2002 605 1,478 1,896 7,762 2,904 1,029 5,405 10,269 2003 433 515 767 3,629 226 1,824 1,426 5,968 Average growth rate of cumulative figures
112% 84% 640% 1,404% 483% 162% 242% 119%
Source: Board of Investments as cited in Intellectual Property Coalition of the Philippines, 2005
70. The large difference in labour costs between developed and developing countries together with improvements in IT technology provided the economic incentive for rapid increase in outsourcing. A relatively large pool of available knowledge workers (Figure 23), high English proficiency and literacy,30 familiarity with Western (particularly U.S.) culture placed the Philippines in a good position to service the U.S. market compared to other developing countries. As a result U.S. clients represent the bulk of the Philippines’ BPO-ITS industry. Most enterprises were subsidiaries of foreign multinationals operating under a shared services arrangement (e.g. America Online, Citibank and Accenture) while independent contact centres have also been established since 1998.
30. According to the UNDP Human Development Report (2006), adult literacy was 92.6% in 2004 with the
percentage for tertiary students in science, engineering, manufacturing and construction at 25%.
TAD/TC/WP(2007)6/PART2/D/FINAL
36
Figure 23. Philippine human resources snapshot
Source: Antonio and Padojinog, 2003.
71. Contact centres exhibited the fastest growth and currently dominate the BPO-ITS sector with approximately 112,000 employed in the first quarter of 2006 and US$ 1.7 billion in revenues in 2005, and a growth of 90% from the previous year31. Estimates for other BPO-ITS services show 22,500 employed and total revenues of US$ 180 million (80% growth) for the same period32.
72. Government support has been important for the development of this sub-sector. The Philippine government early on recognized the potential of the sub-sector and has engaged in a number of policy initiatives to promote its growth in terms of development of the telecoms infrastructure, development of human resources, and global marketing efforts.
73. The deregulation of the telecommunications sector was critical for the introduction of global technological innovations and breakthroughs to the local telecommunications infrastructure in the Philippines. Following the privatisation of the Philippine Long Distance Telephone Company in the late 1980s, competition was introduced through mandated compulsory interconnection in 1993 (Executive Order 59). The Public Telecommunications Policy Act of 1995 (Republic Act 7925) further encouraged privatisation of government-owned or operated telecom facilities, deregulated prices, and promoted new entry. The liberalisation efforts were largely a success with nine international carriers at present from only three in 1992 and five cellular operators from two in 1991.
74. Other liberalisation and export and investment promotion efforts in the 1990s such as formation of special economic zones and investments priorities plan (see section on electronics) also afforded various incentives to the BPO-ITS sub-sector. In addition, the BPO-ITS sub-sector was considered an important sub-sector in the National Information Technology Plan in 1998 (NITP or IT21) which sought to create the necessary policy environment for development of the IT sector. This was followed by the formation of the Information Technology and Electronic Commerce Council in 2000 (ITECC) which is headed by the President of the Philippines and acted as an umbrella organization for all government initiatives and agencies involved in the development of the sub-sector.
31. Reyes, Arenas, and Dacanay, 2006.
32. Ibid.
2001 Graduates (Inner Circle) and Enrollment(Outside Circle)
5%13%
1%7%
10%
18%
28%
6%12%
Arts andSciences
3%
Business32%
Law1%
Math &Computer
Science8%
Medical7%
Engineering13%
Teacher andEducation
18%
GeneralEducation
5%Others
13%
Human Resource Pool • 1,378 colleges and universities • 400,000 graduates annually • 1.6 million college students • 38 million labour force • 11% unemployment rate • Rated one of the most competitive
in the world
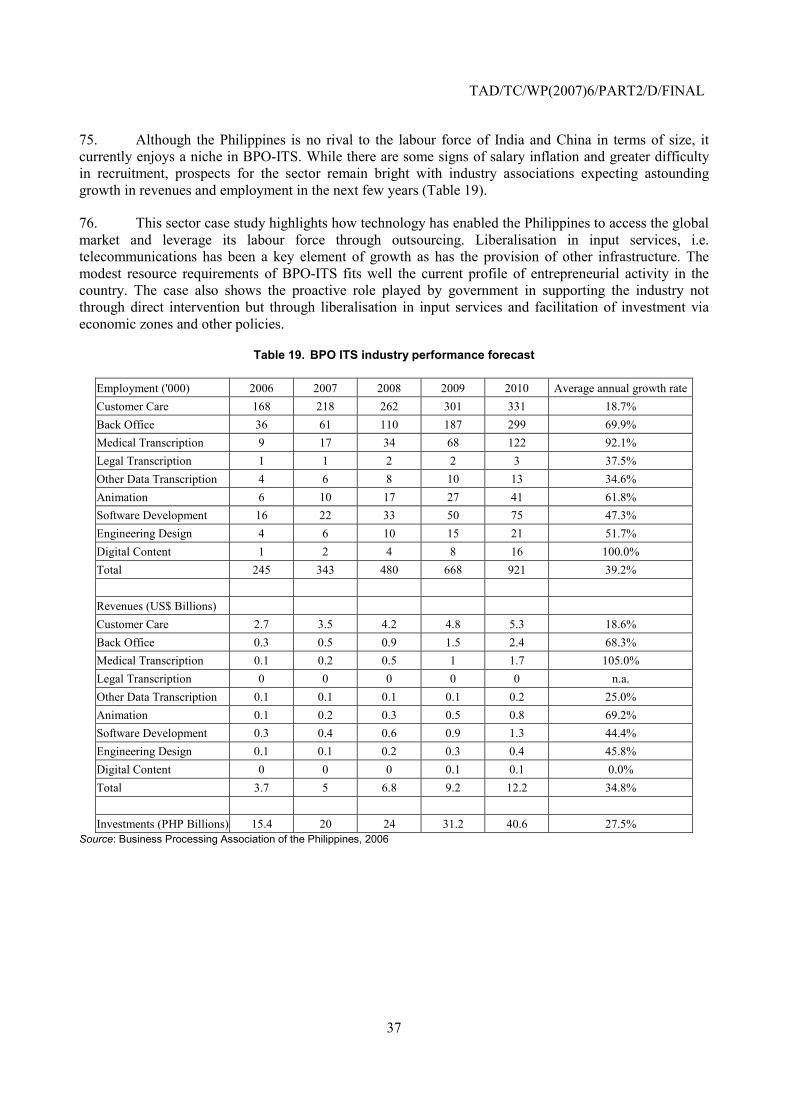
TAD/TC/WP(2007)6/PART2/D/FINAL
37
75. Although the Philippines is no rival to the labour force of India and China in terms of size, it currently enjoys a niche in BPO-ITS. While there are some signs of salary inflation and greater difficulty in recruitment, prospects for the sector remain bright with industry associations expecting astounding growth in revenues and employment in the next few years (Table 19).
76. This sector case study highlights how technology has enabled the Philippines to access the global market and leverage its labour force through outsourcing. Liberalisation in input services, i.e. telecommunications has been a key element of growth as has the provision of other infrastructure. The modest resource requirements of BPO-ITS fits well the current profile of entrepreneurial activity in the country. The case also shows the proactive role played by government in supporting the industry not through direct intervention but through liberalisation in input services and facilitation of investment via economic zones and other policies.
Table 19. BPO ITS industry performance forecast
Employment ('000) 2006 2007 2008 2009 2010 Average annual growth rateCustomer Care 168 218 262 301 331 18.7% Back Office 36 61 110 187 299 69.9% Medical Transcription 9 17 34 68 122 92.1% Legal Transcription 1 1 2 2 3 37.5% Other Data Transcription 4 6 8 10 13 34.6% Animation 6 10 17 27 41 61.8% Software Development 16 22 33 50 75 47.3% Engineering Design 4 6 10 15 21 51.7% Digital Content 1 2 4 8 16 100.0% Total 245 343 480 668 921 39.2% Revenues (US$ Billions) Customer Care 2.7 3.5 4.2 4.8 5.3 18.6% Back Office 0.3 0.5 0.9 1.5 2.4 68.3% Medical Transcription 0.1 0.2 0.5 1 1.7 105.0% Legal Transcription 0 0 0 0 0 n.a. Other Data Transcription 0.1 0.1 0.1 0.1 0.2 25.0% Animation 0.1 0.2 0.3 0.5 0.8 69.2% Software Development 0.3 0.4 0.6 0.9 1.3 44.4% Engineering Design 0.1 0.1 0.2 0.3 0.4 45.8% Digital Content 0 0 0 0.1 0.1 0.0% Total 3.7 5 6.8 9.2 12.2 34.8% Investments (PHP Billions) 15.4 20 24 31.2 40.6 27.5%
Source: Business Processing Association of the Philippines, 2006
TAD/TC/WP(2007)6/PART2/D/FINAL
38
7. Conclusions
Lessons Learnt
77. Looking back at the past three decades, liberalisation measures since the 1980s have led to considerable adjustment in the Philippines economy. The list of reforms include lower tariffs, relaxed investment rules, liberalisation of foreign exchange, establishment of a stronger central bank, the decentralisation of the setting of minimum wages, etc. The lacklustre performance of this period in its entirety may lead some to believe that the reforms did not work. However, one needs to keep in mind that the 1980s was almost entirely spent on paying for past policy mistakes and dismantling inefficient economic structures that were constructed as a result of the misallocation of funds in the 1970s. The acceleration of liberalisation efforts in the 1990s led to a surge in the inflow of capital and higher growth but was interrupted by the Asian financial crisis. It is only in the recent past that some of the reforms is starting to pay off and is expected to lead to better results if complemented with further reforms.
78. The liberalisation experience of the Philippines provides some key lessons:
• A stable political and macroeconomic environment is essential to reap the benefits from trade and investment liberalisation. Political instability has repeatedly interrupted economic reform and has acted as a deterrent to investment which is a necessary ingredient for new growth activities.
• Equally or even more important is the choice of appropriate instruments to cope with macroeconomic imbalances. The strong bias against the use of exchange rates to correct imbalances in foreign exchange led to the use of other instruments (i.e. foreign loans in the 1970s and high interest rates in the 1980s and early 1990s) which arguably created more problems. Foreign loans in an environment where price signals are distorted led to misallocations of investments in the 1970s. The use of high interest rates to stem outward flow of capital in the 1980s and 1990s imposed a heavy burden on domestic investors. Resistance to exchange rate devaluation has been one of the reasons for the lacklustre performance of the export industries and for the sudden and often disruptive downward adjustment in the exchange rate.
• Trade reform has been essential for realigning the incentive structures triggering a reallocation of resources in line with comparative advantage. The gradual reduction and late elimination of quantitative restrictions was one of the elements which prolonged the adjustment process.
• While the Philippines government did have a number of safety net programmes such as food subsidies in place to mitigate some of the effects of economic reform especially on the poor. While such intent is to be commended, some analyses find that there was considerable room for these programmes to be improved in terms of targeting and cost-effectiveness. There is some evidence that the private sector and market forces acted as “social safety nets” of trade reform and structural adjustment as evidenced in the increased role of OFWs and their remittances to the Philippines economy.
• The relative delay in the deregulation on FDI restrictions together with the unstable political situation proved costly for the Philippines as it was unable to benefit from the initial FDI inflows to the Asian region in the early to mid 1980s. As illustrated in the electronics case, export processing zones did allow the Philippines to benefit from FDI in the 1990s. While economic reform and infrastructure development on a national basis was clearly the first best option, in light of the expected resistance to change and high costs of implementation on a national basis, EPZs were considered an acceptable second best option. However, this should not lead to the conclusion that fiscal incentives were the key elements in its success. Far more important were
TAD/TC/WP(2007)6/PART2/D/FINAL
39
the better infrastructure and the simplified customs procedures which allowed companies to have a fast turnaround in processing the imported materials that they worked on.
• Reforms are difficult to implement in a political-economic environment dominated by rent seekers who are not expected to understand how the correction of price signals would lead to more efficient allocation of resources. The cement industry case illustrated how expensive government intervention can be and has been. While deregulation and liberalisation have led to consolidation, higher productivity and lower prices, the case also showed that the transition from a regulated economy to a market based economy poses many challenges and inertia led to over investment. FDI played a key role in providing the know-how and capital in this transition period.
Opportunities and challenges of further trade liberalisation
79. The Philippines faces many challenges as it tries to achieve more balanced growth in the future. As we have seen, structural adjustment (defined as movement of labour and capital from declining industries to growing industries) owing to trade liberalisation was delayed due to various factors including macroeconomic instability until the mid 1990s. The macroeconomic instability observed prior to the 1980s was largely due to misguided policy. Although the Import Substitution Industrialisation strategy sought in the 1950s and 1960s was not necessarily erroneous, the use of import restrictions, selective tariff protection distorted and price controls distorted the incentive structure so much that improvements in productivity and competitive advantages were not realised. The bias against a peso devaluation exacerbated the situation. Reform in the early 1980s was delayed when the nation’s policymakers opted to adjust the interest rate rather than devalue the peso. Even up to the 1990s, a bias towards a strong peso was apparent and as a result, export growth did not expand as rapidly as imports until the Asian financial crisis such that structural adjustments due to trade liberalisation were delayed.
80. Subsequent corrections and reforms towards a more market-oriented incentives structure and more liberal economy have reduced the impact and importance of government on Philippine markets. As a result, the current progress in policy reform in macroeconomic stability (fiscal balance) seems to be bearing fruit as the economy has led a stable growth path in the past few years. However, the issue of insufficient infrastructure is looming in the horizon and will no doubt become a growth constraint in the near future if not handled urgently. On this note, the current administration’s agenda of aggressively pursuing infrastructure development in light of the apparent success in overcoming the fiscal crisis is definitely most welcome. However, the issue of rent seeking and corruption especially in the government budget which had receded into the background under the tight budget situation may surface again as the necessary government spending in infrastructure and safety nets are increased.
81. It is unlikely that the Philippines will revert to a manufacturing led growth path similar to other countries in the region: it is apparently staking out a new path of service sector led growth. In any case, it is important to keep the right incentives for private sector investment in place by maintaining macroeconomic stability, political stability, ensuring property rights, and maintaining an open trade and investment regime. As is increasingly becoming clear, the competitive advantage of the country seems to revolve around its labour resources. Continued growth in the labour-intensive services sector such as the booming Business Process Outsourcing (BPO) sector is most likely. As communications technology progresses, more and more labour-intensive functions have been outsourced. Since it has fewer infrastructure requirements (as against the manufacturing sector), is less dependent on further reforms in trade policies, and with the high differences in labour costs, all forecasts indicate strong growth for the sector.
TAD/TC/WP(2007)6/PART2/D/FINAL
40
82. Breakthroughs achieved in the manufacturing sector as exemplified in the electronics industry indicate the growing role of special economic zones. In particular, its function in cutting through import-export bureaucracies, providing adequate infrastructure, and even relaxation of tariff duties, foreign ownership, and fiscal incentives, in general – fast-tracking liberalisation and government deregulation, could show the way on how the industrial sector as a whole should be treated in order for it to develop. It should be noted that the first-best option would have been for the whole country to be treated as a special economic zone. In light of the complexity of the task and the accompanying abrupt changes as well as the expected resistance to change that this would entail (in a political-economic environment not conducive to it), the development of special economic zones are thus a practical second-best alternative. At the least, these special economic zones provide “windows” of liberalization and showcase its benefits.
83. What is clear looking at the high population in the agricultural sector and low productivity therein is that economic take off will be extremely difficult without further agricultural reform. Keeping in mind the evolving economic landscapes in the Asian region, the potential for agricultural exports remain bright. However, it seems necessary to reach some closure to the issue of land ownership reform so that incentives will be put in place for much needed investment in this sector. Infrastructure developments which directly service the sector are also very much required. On this note, the next few years should prove very crucial as several infrastructure projects have been identified and are slated for completion by the end of the current administration’s term.
84. There is a general fear that further trade liberalisation especially tariff reductions in agricultural products may lead to declines in rural income and increases in poverty, may aggravate unemployment and lead to social instability. This need not be the case. Tariff reforms are meant to remove the distortions in the relative prices of goods to avoid wrong signals on where investments should flow. To avoid losing competitiveness in the international market, the lowering of tariffs can be complemented by an upward adjustment in the exchange rate. This, of course, is not an easy task given the historical bias against such policy move.
TAD/TC/WP(2007)6/PART2/D/FINAL
41
REFERENCES
Aldaba R.M. (2005), “The Impact of Market Reforms on Competition, Structure and Performance of the Philippine Economy”, Philippine Institute for Development Studies Discussion Paper Series No. 2005-24, Philippine Institute for Development, Manila
Antonio, E.T. (forthcoming), The Philippine Electronics Industry, paper presented at the ADB Consultation Meeting on International Competitiveness of Asian Economies
Antonio, E.T. and W. C. Padojinog. (2003), IT-Enabled Services in the Philippines: Prospects and Issues, paper presented at the Tokyo Club Foundation for Global Studies Conference on Innovation and Promotion Policies for the Service Sector in Asia held in Tokyo, Japan, February 20-21, 2003.
Asian Development Bank (2005), “Labour Markets in Asia: Promoting Full, Productive and Decent Employment”, ADB, Manila
Austria, M. S. (1998), “Productivity Growth in the Philippines After the Industrial Reforms”, Philippine Institute for Development Studies Discussion Paper Series No.98-26, Philippine Institute for Development Studies, Manila, Philippines.
Clarete, R.L. (2005), “Philippines: Ex-post effects of trade liberalisation in the Philippines”, in UNCTAD ed. “Coping with Trade Reforms – A Developing Country Perspective on the WTO Industrial Tariff Negotiations”
Balboa, B. and E. Medalla (2006), “State of Trade and Investment in the Philippines”, Discussion Paper series No. 2006-15, Philippine Institute of Development Studies.
Balisacan, A.. and H. Hill (2003), “Chapter 1 An Introduction to the Key Issues” in Baliscan, A. and H.Hill ed. The Philippines Economy-Development, Policies and Challenges, Oxford Univesity Press, NY
Bautista, R. and G. Tecson (2003), “Chapter 4 International Dimensions” in Baliscan, A. and H.Hill ed. The Philippines Economy-Development, Policies and Challenges, Oxford Univesity Press, NY
Food and Agriculture Organisation of the United Nations (2003), “Philippines” in WTO Agreement on Agriculture: The Implementation Experience, FAO, Rome
Heston, A. Robert Summers and Bettina Aten, “Penn World Table Version 6.2”, Center for International Comparisons of Production, Income and Prices at the University of Pennsylvania
Hill, H. (2003), “Chapter 7 Industry” ” in Baliscan, A. and H.Hill ed. The Philippines Economy-Development, Policies and Challenges, Oxford Univesity Press, NY
IMF (2006), “Philippines:2005 Article IV Consultation and Post-Program monitoring Discussions”, IMF, Washington D.C.
TAD/TC/WP(2007)6/PART2/D/FINAL
42
David, C.C. (2003), “Chapter 6 Agriculture” ” in Baliscan, A. and H.Hill ed. The Philippines Economy-Development, Policies and Challenges, Oxford Univesity Press, NY
Deininger, K. and Lyn Squire (1998), “New ways of looking at old issues: inequality and growth”, Journal of Development Economics, Volume 57, Issue 2, 1998, Pages 259-287
Dy, R.T. (1990), “Agriculture in the Past Two Decades: A Survey”, Agribusiness Papers. No. 1, Center for Research and Communication, Manila, Philippines
Engman, M. (2007 forthcoming), “Expanding International Supply Chains: The Role of Emerging Economies in Providing IT and Business Process Services” TD/TC/WP(2007)2
Estanislao, J.P. and E.T. Antonio (1980), “Comparative Advantage of Textile and Cement Industries in the Philippines”, C.A.M. Series No. 4. Institute for Developing Economies, Japan.
Habito, C. and R. Briones (2005), “Philippine Agriculture Over the Years: Performance, Policies and Pitfalls”, paper presented at the Policies to Strengthen Productivity in the Philippines conference held in Makati City, Philippines, June 27-28, 2005.
Intal, P. (1985), “The Macroeconomic Policy Environment of Philippine Agricultural Performance”, Journal of Philippine Development No. 22, Vol. XII. (2)
Intellectual Property Coalition of the Philippines. (2005), “Philippine Software Industry Profile.” The SGV Review, 3:2, pp.24-34, June 2005.
Japanese Chamber of Commerce and Industry of the Philippines (2006), Reference on Findings in the Comparative Study of Climate of Investment between the Philippines and Thailand, JCCIP, Manila downloaded from http://www.jccipi.com.ph/ in Feb 2007
Mundlak, Y., D. Larson, and R. Butzer (2002), “Detrminants of Agricultural Growth in Indonesia, the Philippines and Thailand”, Policy Research Working Paper No.2803, World Bank, Washington D.C.
Mundlak, Y., D. Larson, and R. Butzer (2004), “Agricultural dynamics in Thailand, Indonesia and the Philippines”, The Australian Journal of Agricultural and Resource Economics, 48:1, pp.95-126, Blackwell Publishing Ltd
Onoda Engineering and Consulting Co., Ltd (1991), Industrial Restructuring Studies: Cement, Development Bank of the Philippines, Manila
Reyes, R.O., Arenas, M.L., and A.E. Dacanay. (2006), “Piggybacking on China’s Phenomenal Growth: Prospects for the Philippines”, The SGV Review, 4 :2, pp.5-13, September 2006.
Subbarao, K., A.U. Ahmed, and T. Teklu (1996), “Selected Social Safety Net Programs in the Philippines: Targeting, Cost-Effectiveness, and Options for Reform”, World Bank Discussion Papers, No. 317, World Bank, Washington D.C.
Sungcaya, N.G. (2003), “9. Philippines” in Development of Agribusiness Enterprises, Asian Productivity Organization, Tokyo
Tablizo, M. (2002), “Country Paper: Philippines.” in Asian Cases on Supply Chain Management for SMEs, Asian Productivity Organization, Tokyo, Japan
TAD/TC/WP(2007)6/PART2/D/FINAL
43
Tecson, G.R. (1996), “Philippine Manufacturing Industries and the Effects of Trade Policy Reforms on Structure and Efficiency”, in Catching Up with Asia’s Tigers Volume II, Philippine Institute of Development Studies, Manila, Philippines
Villegas, B.V. (2006), The Philippine Advantage, 3rd ed., University of Asia and the Pacific, Manila, Philippines
Vistal, F.A. (2001), VI. Integration of Industrial Activities at the Regional and Global Levels: The Experience of the Philippines” in Industrial and Technological Development News for Asia and the Pacific No.27, United Nations Economic and Social Commission for Asia and the Pacific, Thailand http://www.unescap.org/tid/publication/chap6_2126.pdf#search=%22vistal%20florina%20philippines%22 on September 25, 2006
Yap, J.T. (2002) “6. Trade, competitiveness and finance in the Philippine Manufacturing Sector, 1980-95” in Fanell, J.and R. Medhoraed. Finance and Competitiveness in Developing Countries, International and Development Research Center, Canada downloaded from http://www.idrc.ca/en/ev-9331-201-1-DO_TOPIC.html on September 25, 2006
WTO (2005a), “Trade Policy Review - The Philippines - Report by the Secretariat”, WTO, Geneva
WTO (2005b), World Trade Report 2005, Geneva
TAD/TC/WP(2007)6/PART2/D/FINAL
44
ANNEX SUMMARY OF ECONOMIC ZONE RELATED POLICIES IN THE PHILIPPINES
• Establishment of Foreign Trade Zone in Mariveles, Bataan (1969). Facilitated the creation of Foreign Trade Zone Authority which afforded exemption from tariffs and customs code to eligible industries located in Mariveles, Bataan.
• Creation of Export Processing Zone Authority (1972). Took over the functions of the Foreign Trade Zone Authority. Among incentives offered were:
o Net operating loss carryover o Accelerated depreciation o Exemption from export tax, local taxes, and licenses
• Omnibus Investment Code of 1987. Facilitated the creation of the Board of Investments and the annual formulation of Investments Priorities Plan (IPP). Preferential treatment to exporting industries as stipulated in the more generous share of foreign ownership allowed to be eligible enterprises who export more (full ownership for 100 percent eporters) The IPP classified incentives into pioneer and non-pioneer which were awarded different incentives. Some incentives took the form of the following (limited periods):
o Income tax holiday of: Six years for pioneer firms Four years for non-pioneer firms Three years for expanding firms
o Deductions on labour and training expenses o Tax credits on domestic capital equipment for a period of five years hence (1987 to 1992) o Tax and duties exemptions on imported capital equipment for a period of five years hence (1987 to
1992) o Simplification of customs procedures
The Omnibus Investments Code was amended in 1995 wherein the nationality requirement was suspended for certain activities or institutions such as multilaterals, etc.
• Foreign Investments Act of 1991. With this Act, industries not in the foreign investment negative list allowed firms with up to 100% foreign ownership. Among the industries in the negative list are:
o List A: constitutionally bound and specific laws to Filipino nationals only o List B: particular to national defense, public health, and other national interests
• Bases Conversion Development Act of 1992. Primarily for the development of the Clark and Subic former U.S. bases but including the John Hay Station and Wallace Air Station among others. Facilitated the creation of Bases Conversion Development Authority with a life of 50 years and the Subic Bay Metropolitan Authority and the subsequent creation of Subic Special Economic Zone and Clark Special Economic Zone managed as a separate customs authority
• Investors’ lease act of 1993. Foreign investor may lease private land with no lease contract shall exceed 50 years renewable once up to 25 years
• Export Development Act of 1994. Creation of 3-year Philippine Export Development Plan (PEDP) as part of the Medium Term Philippine Development Plan (MTPDP) and creation of Export Development Council to oversee development of PEDP. The act provided additional incentives to exporters in the form of the following:
o Exemption from advanced payment of import duties for exporters o Zero-tariff importation of machinery equipment and their spare parts until 1997 o Tax credits for imported inputs and raw materials used for production and packaging of export goods for
five years and a export performance-based tax credit (i.e. increases in annual export revenue in increments of five percent translate to tax credits of 2.5 percent of the export revenue also in 2.5 percent increments up to a maximum of 10 percent.
• Foreign Banking Liberalisation Act of 1994. The Monetary Board of the Banko Sentral ng Pilipinas (Central bank) allowed foreign bank entry via one of the following:
o Acquisition of 60% of existing bank o Investing in 60% of new bank o Establishing branches with full banking authority
• Build-Operate-Transfer Law of 1994. Allowed private sector to build, operate, lease, etc. government-funded and/or government-initiated/only projects
TAD/TC/WP(2007)6/PART2/D/FINAL
45
• Special Economic Zone Act of 1995. Establishment of additional special economic zones (SEZs) and the creation of Philippine Economic Zone authority absorbing the Export Processing Zone Authority to be the centralized authority governing and regulating enterprises within the zones. Also outlined possible states of SEZs into three possible categories (wherein an SEZ may have more than one)
o Industrial estates which is established under a centralized continuous management with provisions for basic infrastructure and utilities.
o Export processing zones are specialized industrial estates which are outside regular Philippine customs territory and allows for importation free from duties, taxes, and other import restrictions. Established for exporting enterprises.
o Free trade zones are areas which are again outside Philippine customs territory which enables duty-free importation for transshipment, storage, or processing. However, goods shipped out of the zone into regular Philippine customs territory is subjected to Philippine tariffs and duties.
SEZ locators benefited from a 5 percent gross income tax in lieu of all other taxes to be paid to the government. Tax credits and other incentives established under previous laws also apply to businesses within the SEZs.