fluoroquinolone antibiotics in environmental waters: sample preparation and determination
TRANSCRIPT

Review Article
Fluoroquinolone antibiotics inenvironmental waters: Sample preparationand determination
The aim of this review is to provide a general overview on the analytical methods proposed
in the last decade for trace fluoroquinolone (FQ) determination in environmental waters.
A large number of studies have been developed on this topic in reason of the importance
of their monitoring in the studies of environmental mobility and potential degradation
pathways. Every step of the analysis has been carefully considered, with a particular
attention to sample preparation, in relationship with the problems involved in the analysis
of real matrices. The different strategies to minimise interference from organic matter
and to achieve optimal sensitivity, especially important in those samples with lower FQ
concentrations, were also highlighted. Results and progress in this field have been
described and critically commented. Moreover, a worldwide overview on the presence of
FQs in the environmental waters has been reported.
Keywords: Analytical methods / Environmental waters / Fluoroquinoloneantibiotics / Matrix effect / SPEDOI 10.1002/jssc.200900753
1 Introduction
Recently, up to 80 pharmaceutical and personal care
products have been detected worldwide – in the low range
of nanograms up to micrograms per litre – in surface water,
groundwater, wastewater effluents [1] and also in soil at
concentrations in the microgram per kilogram and milli-
gram per kilogram ranges [2, 3]. There is concern about the
effects of the entry of these compounds into the environ-
ment, as their behaviour and that of their degradation
products are still largely unknown; potential chronic effects
of long-term and low-level exposures on environmental
organisms and on human health are suspected, in particular
regarding the effects on the endocrine system, due to the
ability of several compounds to act as hormones. Even low
concentrations could negatively affect non-target living
organisms or lead to the development of allergenic response
[4], certain is that these cause an increased bacterial
resistance, as reported in several studies [5–8].
Among different groups of pharmaceuticals, antibiotics
are of special concern: they are administrated in large
quantities to humans and animals to treat diseases and
infections and at sub-therapeutic levels for prophylactic,
metaphylactic and therapeutic purposes and as feed addi-
tives to promote growth in livestock. Antibiotics for human
use end up in wastewater coming from hospital and
municipal emissions, whereas veterinary drugs are excreted
by the animals and are released in the manure [1]. For
decades, liquid manure from livestock farming and sewage
sludge from wastewater treatment plants have been applied
to agriculture fields as a sustainable principle of nutrient
Andrea SpeltiniMichela SturiniFederica MaraschiAntonella Profumo
Department of GeneralChemistry, University of Pavia,Pavia, Italy
Received November 19, 2009Revised December 23, 2009Accepted December 24, 2009
Abbreviations: BMIm-BF4, 1-butyl-3-methylimidazoliumtetrafluoroborate; Chromabond tetracycline, C18-modifiedsilica; C2/ENV1, mixed-phase adsorbent; CIP, ciprofloxacin;
DAN, danofloxacin; DIF, difloxacin; DOC, dissolved organiccarbon; ENO, enoxacin; ENR, enrofloxacin; ENVI Chrom P,
non-ionic highly cross-linked styrene-divinylbenzenecopolymer; ENV, poly(styrene-divinylbenzene) copolymer;ENV1, hyper cross-link hydroxylated poly(styrene-divinylbenzene) copolymer; EN, polystyrene reversedphase; FD, fluorescence detection; FLU, flumequine; FQs,
fluoroquinolones; HLB, hydrophilic–lipophilic-balancedpolymers; LOM, lomefloxacin; MAX, mixed-mode stronganion exchange reverse phase; MCX, mixed-mode strongcation exchange reverse phase; MDL, method detectionlimit; MAR, marbofloxacin; MeOH, methanol; MEP, silicadivinylbenzene–vinylpyrrolidone copolymer; MIP,
molecularly imprinted polymer; MOX, moxifloxacin; MPC,
silica-based mixed-mode strong cation exchange reversephase; MQL, method quantification limit; NOM, naturalorganic matter; NOR, norfloxacin; ODS, octadecylsilylresin; OFL, ofloxacin; PPL, styrene–divinylbenzenecopolymer; SAR, sarafloxacin; SDB-2,
styrene–divinylbenzene copolymer; SPME, solid-phasemicroextraction; STPs, sewage treatment plants; Strata-X,
surface-modified styrene–divinylbenzene polymericadsorbent; TEA, triethylamine; UPLC, ultra-performance LC;
WAX, mixed-mode weak anion exchange reverse phase;
WCX, mixed-mode weak cation exchange reverse phase;
WWTPs, wastewater treatment plants
Correspondence: Professor Antonella Profumo, Department ofGeneral Chemistry, University of Pavia, via Taramelli 12, 27100Pavia, ItalyE-mail: [email protected]: 139-382-528544
& 2010 WILEY-VCH Verlag GmbH & Co. KGaA, Weinheim www.jss-journal.com
J. Sep. Sci. 2010, 33, 1115–1131 1115
recycling. It is well known that the main way for surface
water contamination derives from direct wastewater treat-
ment plants (WWTPs) release, but leaching from soil
cannot be excluded although strong adsorption in soil [9]
seems to indicate a substantial immobility of these
compounds [2]. However, with the rapidly increasing
knowledge about pharmaceuticals entering the environment
via liquid manure and thus probably contaminating our
feed, food and groundwater resources, there is increasing
concern about the potential risks associated with this
common practice [1].
Fluoroquinolones (FQs) are highly useful antibacterial
agents, particularly because of their broad activity spectrum
against bacteria (both Gram positive and negative) and
mycoplasma and for their good oral intake.
The target proteins of FQs are bacterial DNA gyrase
and topoisomerase IV enzymes, essential for DNA replica-
tion and transcription. FQs have a common 4-oxo-1,4-dihy-
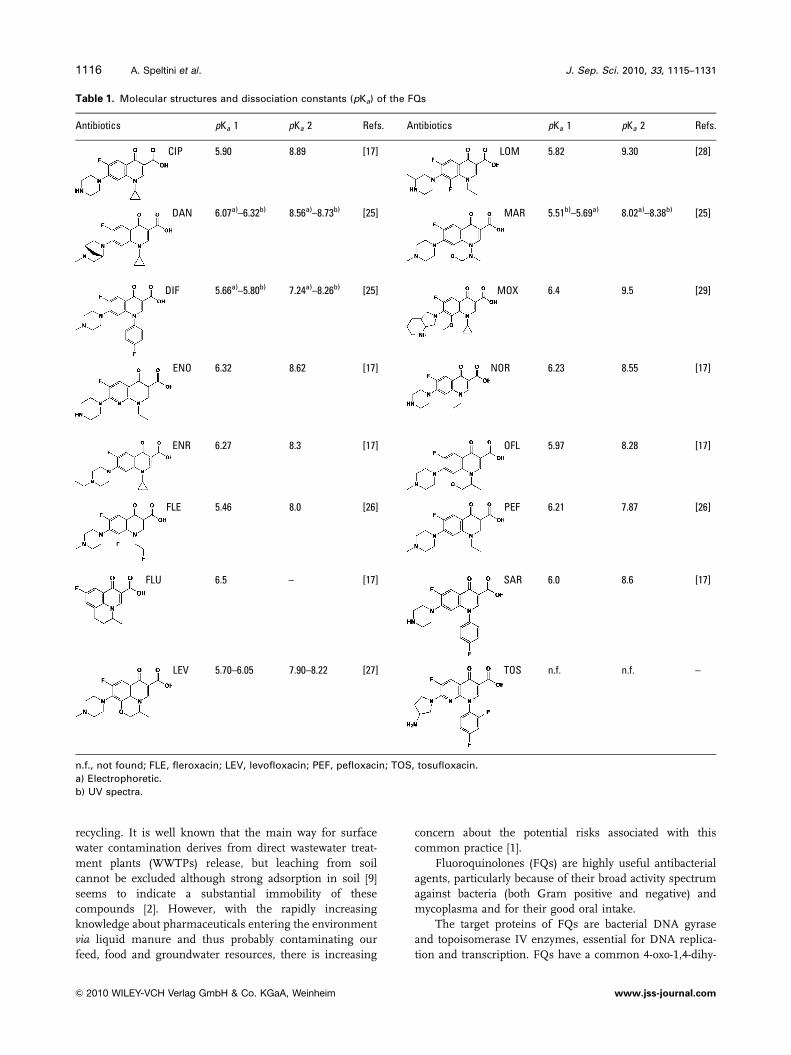
Table 1. Molecular structures and dissociation constants (pKa) of the FQs
Antibiotics pKa 1 pKa 2 Refs. Antibiotics pKa 1 pKa 2 Refs.
CIP 5.90 8.89 [17] LOM 5.82 9.30 [28]
DAN 6.07a)–6.32b) 8.56a)–8.73b) [25] MAR 5.51b)–5.69a) 8.02a)–8.38b) [25]
DIF 5.66a)–5.80b) 7.24a)–8.26b) [25] MOX 6.4 9.5 [29]
ENO 6.32 8.62 [17] NOR 6.23 8.55 [17]
ENR 6.27 8.3 [17] OFL 5.97 8.28 [17]
FLE 5.46 8.0 [26] PEF 6.21 7.87 [26]
FLU 6.5 – [17] SAR 6.0 8.6 [17]
LEV 5.70–6.05 7.90–8.22 [27] TOS n.f. n.f. –
n.f., not found; FLE, fleroxacin; LEV, levofloxacin; PEF, pefloxacin; TOS, tosufloxacin.
a) Electrophoretic.
b) UV spectra.
J. Sep. Sci. 2010, 33, 1115–11311116 A. Speltini et al.
& 2010 WILEY-VCH Verlag GmbH & Co. KGaA, Weinheim www.jss-journal.com

droquinoline skeleton, where the pharmacophore unit
consists of a pyridine ring with a carboxyl group, a piper-
azinyl group and a fluorine atom placed at positions 3, 7
and 6, respectively [10]. In Europe and in the USA, these
were introduced for human use in the mid-1980s and
approved for therapeutic treatment of livestock in the
mid-1990s [11].
Both human and veterinary FQs are expected to enter
the environment, as after oral or parenteral application;
most of these are excreted in active form [12], renally
(�80%) and via the faeces (20%). A growing interest is given
to the environmental fate of these compounds since detec-
tion of FQ residues in the natural environment has been
reported in many countries (Section 4), and a number of
analytical methods are currently available to determine
human FQs in urban wastewater, where they are only
partially removed [11, 13] and veterinary FQs in sewage
sludge and sludge-treated soil, because of their strong
adsorption properties [11]. For the time being, however, no
indicative tolerable value of antibiotics has been fixed for the
different environmental compartments [14], although in the
year 1996 the EMEA (European Agency for the Evaluation of
Medicinal products) guideline set a threshold value of
0.1 mg/kg for residues of veterinary pharmaceuticals in soil
and 0.1 mg/L for groundwater [15]. A revised guideline on
environmental impact assessment for veterinary medicinal
products has been published in the year 2008 [16].
Analytical procedures for accurate determination of FQs
in environmental waters have been overviewed. All the steps
of FQ analysis, from sample treatment to final detection,
have been evaluated, highlighting the critical points. The
analytical methods, the different solid-phase extractants and
the sample pre-treatments reported in the literature are
summarised in detail in Tables 1–4. Special attention is
given to the various adsorbent phases to be used depending
on the sample matrix and FQs to be determined, as well as
to the chromatographic conditions. Looking at these tables,
it would be easier to individuate selected studies that in fact
could quite work in relationship with the origin of the
sample to be investigated and the nature of FQs to be
determined.
2 Physical–chemical properties of FQs
Knowledge of the physical–chemical properties of these
drugs is crucial for the development of appropriate trace
analysis methods. This is especially true for those proce-
dures – in fact the majority – that are based on SPE. FQs are
molecules with a zwitterionic behaviour, as they have
functional ionisable groups. Their corresponding pKa values
are reported in Table 1. Contrary to flumequine (FLU), that
presents only the 3-carboxyl group functionality as ionisable
group, many FQs also have the N-4 of the piperazine
substituent (Fig. 1). Under what has been said, the nature of
the solvent can significantly affect the acid-base behaviour of
these compounds. From an environmental standpoint,
considering ecological pH ranges, the acid-base properties
of nitrogen atoms at positions 1, 8 and N-1 of the piperazine
ring can be neglected [17]. Instead, it is worthy of
considering their relatively good solubility in water, due to
polar groups bonded to a lipophilic core. Such structure
determines the strong interaction with natural organic
matter (NOM), as well as the adsorption on soil, due to both
hydrophobic and electrostatic interactions and hydrogen
bonds [9]. In fact, high adsorption coefficients (Kd,solid)
characterise FQs, among which ciprofloxacin (CIP), norflox-
acin (NOR) and ofloxacin (OFL) stand out, showing values
in the range 496–61 000 L/kg [17]. In confirmation of this,
strong adsorption of FQs to sewage sludge was observed,
suggesting it is the main removal pathway of such
compounds from the water stream during wastewater
treatment [13, 18] (Section 4). In aqueous media, stable
1:1 complexes with several cations, i.e. Ca21, Mg21 and
Al31, are formed by ion–dipole interaction with the 4-keto
oxygen and the ionised 3-carboxylic acid groups [3, 17]. FQs
show resistance to hydrolysis and to heat coupled to the
great chemical stability due to heterocyclic ring that makes
them highly persistent contaminants [19, 20]. Furthermore,
resistance to biodegradation is another important factor to
be considered [21], favoured by strong adsorption onto
various types of solid matrices, such as faeces, soil, sludge
and sediments [2]. In support of this, the persistence of FLU
in an artificial marine sediment was proved [22]: no
degradation occurred and moreover, preservation of anti-
bacterial activity in the sediment for at least 180 days was
observed. In contrast to thermal stability, these drugs are
known to be liable to photodegradation. Irradiation in water
leads to loss of fluoride and/or to oxidative degradation of
the amine side chain [23, 24].
3 Analytical methods for environmentaldetermination of FQs
Presented hereafter are the researches published in the last
decade that deal with the determination of FQs in
environmental samples, including urban wastewater,
sewage treatment plant (STP) and WWTP influents/
effluents, ground, natural and surface water. Besides SPE
procedure, other sample preparation methods have been
explored newly, including solid-phase microextraction
Figure 1. Ionisable groups of two FQs showing differentmolecular structures.
J. Sep. Sci. 2010, 33, 1115–1131 Sample Preparation 1117
& 2010 WILEY-VCH Verlag GmbH & Co. KGaA, Weinheim www.jss-journal.com
Tab
le2.
Meth
od
sfo
rth
ed
ete
rmin
ati
on
of
FQ
sin
en
vir
on
men
tal
wate
rsa
mp
les
FQs
Sam
ple
type
SP
E/S
PM
E
sorb
ent
phas
e
Spi
ke(n
g/L)
Rec
over
y(%
)D
etec
tion
LOD
(ng/
L)R
efer
ence
CIP
,D
AN
,D
IF,
ENR
,
FLE,
LEV,
LOM
,N
OR
,
OFL
Urb
anw
aste
wat
erM
PC
50–4
00fo
rpr
imar
yan
d
16–1
33fo
rse
cond
ary
WW
TPs
efflu
ents
72–9
7FD
,
MS
/MS
45–1
35,
prim
ary
efflu
ent;
15–4
5,te
rtia
ryef
fluen
ta)
[38]
CIP
,D
IF,
ENR
,LO
M,
NO
R,O
FL,
SA
R,
TOS
Sur
face
wat
erM
PC
200
75–1
07FD
,M
S8.
6–49
[39]
CIP
,D
AN
,D
IF,
ENR
,
FLE
LOM
,S
AR
Tap
and
min
eral
wat
er
HLB
9–10
0087
–116
inta
pw
ater
;84
–99
inm
iner
alw
ater
FD1–
29[4
]
CIP
,EN
R,
NO
R,
OFL
Was
tew
ater
HLB
200–
1000
85–9
6M
S/M
S1–
8[3
3]
CIP
,N
OR
,O
FLS
urfa
ce,
grou
ndan
d
sew
age
wat
er
HLB
100
for
grou
ndan
dsu
rfac
e
wat
er;
2000
for
STP
influ
ents
;
1000
for
STP
efflu
ents
75–7
8in
grou
ndan
dsu
rfac
ew
ater
MS
1.6–
163a
)[4
7]
CIP
,EN
R,
NO
RR
iver
wat
erH
LB25
–100
78,
79,
76FD
25a
)[3
2]
CIP
,EN
R,
NO
RR
iver
and
was
te
wat
er
HLB
1000
75,
79,
72in
rive
rw
ater
;60
,
91,
49in
seco
ndar
yan
do
60in
prim
ary
WW
TPs
efflu
ents
MS
6.5–
13.2
[35]
CIP
,N
OR
,O
FLR
iver
and
urba
n
was
tew
ater
HLB
500
63,
73,
73in
rive
rw
ater
and
STP
efflu
ents
;99
,93
,93
inS
TPin
fluen
ts
FD,
UV
35in
rive
rw
ater
and
STP
efflu
ent,
100–
120
inS
TPin
fluen
ta)
[31]
CIP
,D
AN
,D
IF,
ENO
,
ENR
LOM
,N
OR
,O
FL,
SA
R
Nat
ural
wat
erH
LB50
060
–111
MS
/MS
1.2–
7.7
[21]
CIP
,EN
R,
NO
R,
SA
RC
hlor
inat
eddr
ink-
able
wat
er
HLB
5045
–67
MS
/MS
0.5–
2[3
6]
CIP
,D
AN
,D
IF,
ENR
,
FLU
,M
AR
,N
OR
,S
AR
Sea
wat
er,
grou
nd
wat
er
HLB
20–2
5010
–60
for
DA
N10
0–25
0
for
MA
R
72–9
9in
seaw
ater
;70
–96
in
grou
ndw
ater
FD0.
4–8
[34]
OFL
Riv
erw
ater
,w
aste
wat
er
HLB
––
MS
500
(was
tew
ater
)[5
7]
CIP
,O
FLS
urfa
cew
ater
HLB
-SD
B2
100
92,
66in
drin
king
wat
erM
S/M
S2–
5a
)[4
8]
CIP
Riv
erw
ater
MC
X10
102
inul
trap
ure
wat
erM
S/M
S0.
082
[41]
CIP
,O
FLW
aste
wat
erM
CX
20�
30in
min
eral
wat
erM
S1.
3–1.
8,S
TPs
efflu
ents
a)
[43]
CIP
Sur
face
wat
erM
CX
200
82.5
inul
trap
ure
wat
erM
S/M
S–
[42]
CIP
,N
OR
,O
FLS
TPs
efflu
ents
WC
X50
–100
087
–94
MS
/MS
2–10
a)
[30]
CIP
,EN
R,
NO
R,
OFL
Was
tew
ater
WC
X,
HLB
1000
80–1
00in
ultr
apur
ew
ater
MS
/MS
3.5–
5.8
(WC
X),
10–1
6.5
(HLB
)a)
[50]
CIP
,EN
R,
NO
R,
OFL
Hos
pita
lw
aste
wat
erC
2/EN
V1
2500
61,
64,
70,
78M
S/M
S15
–25a
)[1
2]
CIP
,EN
O,
LOM
,
NO
R,
OFL
STP
sef
fluen
tsC
2/EN
V1
5000
–100
0034
,34
,76
,35
,85
MS
/MS
–[4
0]
CIP
,EN
R,
FLU
,
MA
R,
NO
R,
OFL
,P
EF
Sur
face
and
grou
nd
wat
er
C18
10–1
0080
–100
MS
/MS
0.8–
4.3
[59]
J. Sep. Sci. 2010, 33, 1115–11311118 A. Speltini et al.
& 2010 WILEY-VCH Verlag GmbH & Co. KGaA, Weinheim www.jss-journal.com

Tab
le2.
Co
nti
nu
ed
FQs
Sam
ple
type
SP
E/S
PM
E
sorb
ent
phas
e
Spi
ke(n
g/L)
Rec
over
y(%
)D
etec
tion
LOD
(ng/
L)R
efer
ence
CIP
,D
AN
,D
IF,
ENR
,
LOM
,N
OR
,P
EF,
SA
R
Was
tew
ater
MEP
1000
inin
fluen
tsan
d100
in
tert
iary
WW
TPs
efflu
ents
79–1
09in
influ
ents
and
80–1
05
inte
rtia
ryW
WTP
sef
fluen
ts
FD6.
6–63
.5,
prim
ary
efflu
ents
;
1.3–
12.7
,te
rtia
ryef
fluen
ts
[44]
CIP
,EN
R,
NO
R,
OFL
Was
tew
ater
WA
X-H
LB10
0090
–129
inse
cond
ary
and
95–1
14
infin
alW
WTP
sef
fluen
ts
MS
20–4
0,fin
alef
fluen
t[2
8]
CIP
,EN
R,
NO
R,
OFL
Hos
pita
lan
dm
unic
ipal
s
was
tew
ater
SA
X-H
LB10
0–50
0075
–121
FD8.
5–85
[45]
ENR
,M
AR
Sur
face
wat
erW
AX
–HLB
2090
,11
6FD
0.7–
2[3
7]
CIP
,EN
R,
FLE,
LOM
MO
X,
NO
R,
OFL
Sur
face
wat
erH
LB,
Chr
oma-
bond
,Te
trac
y
clin
e
400
93–1
07,
83–1
07FD
1–50
[46]
CIP
,EN
R,
FLE,
LOM
,M
OX
,N
OR
,
OFL
Sur
face
and
was
tew
ater
,
sew
age
slud
ge
Chr
omab
ond
Tetr
acyc
line
400
80–1
05in
surf
ace
wat
erFD
,M
S11
–55
(FD
),0.
3–7.
5(S
IM),
0.6–
6.4
(SR
M)a
)
[49]
CIP
,D
AN
,EN
R,
FLU
LOM
,N
OR
,S
AR
Riv
erw
ater
MIP
-SP
Ead
sor-
bent
50–1
000
15–1
05FD
10–3
00[5
3]
CIP
,N
OR
,O
FL,
LOM
,EN
O
Riv
erw
ater
,w
aste
wat
erC
arbo
xen
1010
PLO
T
100
81.8
–98.
0M
S/M
S7–
29[5
5]
CIP
,EN
R,
LEV,
NO
RS
AR
Sew
age,
seaw
ater
and
grou
ndw
ater
CW
-TP
Rfib
er10
00–5
0000
81–9
2,se
wag
e;85
–112
,se
awat
er;
81–1
16,
grou
ndw
ater
FD10
–200
[54]
FLE
,fl
ero
xaci
n.
a)
LO
Q.
J. Sep. Sci. 2010, 33, 1115–1131 Sample Preparation 1119
& 2010 WILEY-VCH Verlag GmbH & Co. KGaA, Weinheim www.jss-journal.com

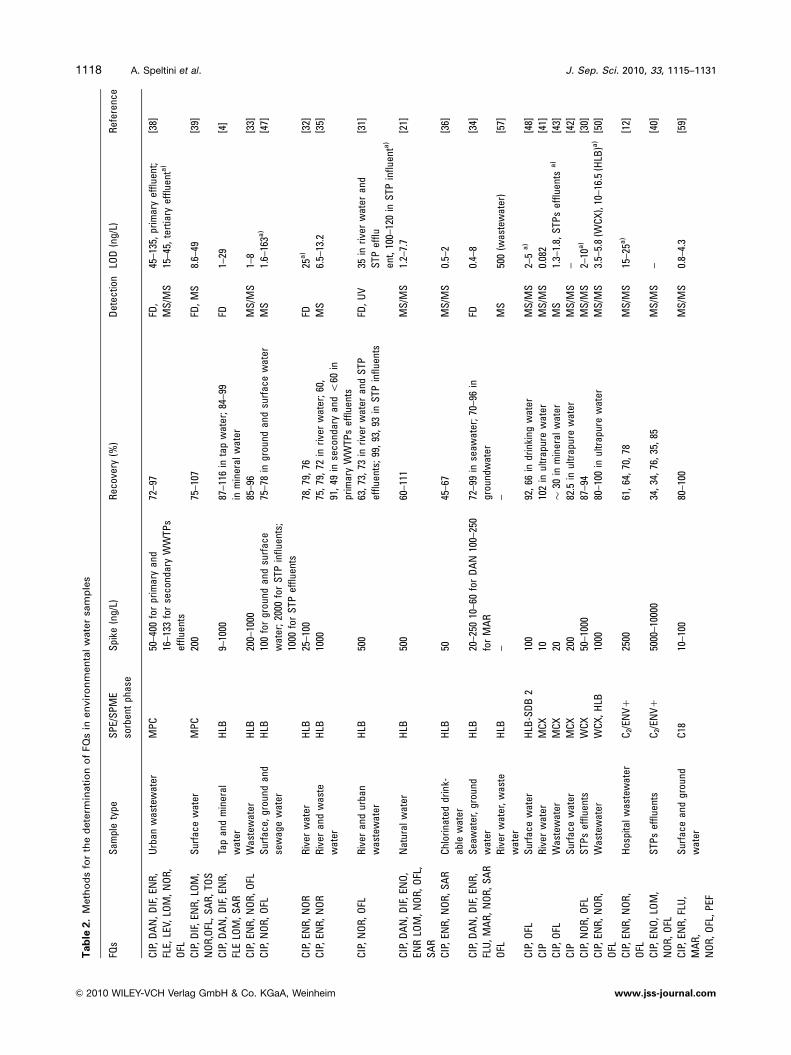
(SPME) and molecularly imprinted polymer (MIP) SPE
(MIP-SPE) for the determination of FQs in environmental
waters. A summary of the analytical methods is reported in
Table 2. The literature mainly refers to SPE of FQs from
water samples coupled with HPLC or CZE analysis followed
by fluorescence detection (FD) and UV or MS detection. In
effect, nowadays SPE is the most used preparation method
for the pre-treatment of liquid samples [21]. A wide range of
adsorbent phases have been tested, based on their different
chemical properties and affinity towards analytes: mixed
anionic and cationic exchange-reverse-phase, hydrophilic–
lipophilic-balanced (HLB), polymeric, copolymeric and
apolar adsorbents. Depending on the kind of cartridge,
extraction and elution were performed under acidic or
alkaline conditions, because of the zwitterionic properties
of FQs. However, the general main trouble to overcome
turned out to be the removal of interferences: as well-
known environmental waters contain variable amounts of
NOM, including humic acids, compounds naturally spread
in soil and water sediments that derive from the decom-
position of organic matter. These constitute a grave
interference in the determination of FQs, because they
involve the decrease both in the recovery rate due to FQ
NOM adsorption and in sensitivity. An approach generally
adopted to prevent the saturation of the solid phase caused
by NOM is the utilisation of appropriate sample volumes
depending on its origin [28, 30–32]. Therefore, the analytical
method to be considered must be able to minimise matrix
effect according to the physical–chemical properties of the
FQs to be determined.
The choice of a suitable eluting solution is equally
essential: in fact, the possibility to co-extract part of the
organic matter compromises chromatogram quality and
therefore separation, with consequent decrease of both
selectivity and accuracy. The ideal eluting solution should
assure quantitative FQ extraction from the SPE and, at the
same time, no elution of interferences. In this context, the
nature of adsorbent phases is fundamental to selectively
adsorb FQs, leaving organic matter in solution.
As proved [21, 33–36], pH is an important parameter,
not only in terms of efficiency in the antibiotics adsorption/
desorption, but also in regard to the enhancement or
suppression of matrix effects. For example, with a polymeric
adsorbent, a reduction of the co-extracted NOM was
achieved working at pH 6. This kind of adsorbent is known
to retain the hydrophobic portion of NOM in minor extent at
neutral pH. On the contrary, no reduction of matrix effects
was observed in finished drinkable water. This can be
justified considering that the hydrophobic fraction of NOM
is more easily removed than the hydrophilic one through
conventional drinking water treatments [36].
According to these considerations, it is evident how
significant is the optimisation of each step throughout the
analytical procedure: the choice of sample pH, the char-
acteristics of the adsorbent phase, the SPE washing solu-
tions, the composition and the pH of the eluent, the
concentration factor.
Another critical step in the sample preparation is
represented by filtration, performed to remove suspended
particles from sample: in fact most studies first filtered the
sample (Table 3), then adjusted pH before SPE, without
considering that filter could strongly influence the recovery,
both in terms of total and dissolved FQ concentration.
Consistent percentages of antibiotics were proved to be
adsorbed on hydrophilic-mixed cellulose esters and cellulose
nitrate, whereas glass fibre and nylon filters assured no
significant loss of analytes [37].
As the ability of some antibiotics to react with free
chlorine, an investigation on its role in their determina-
tion was recently developed [36]. Experiments carried out
on source and treated water demonstrated that ascorbic
acid is an effective chlorine-quenching agent that does not
affect the analysis and the stability of the antibiotics in
water.
3.1 SPE experimental procedures
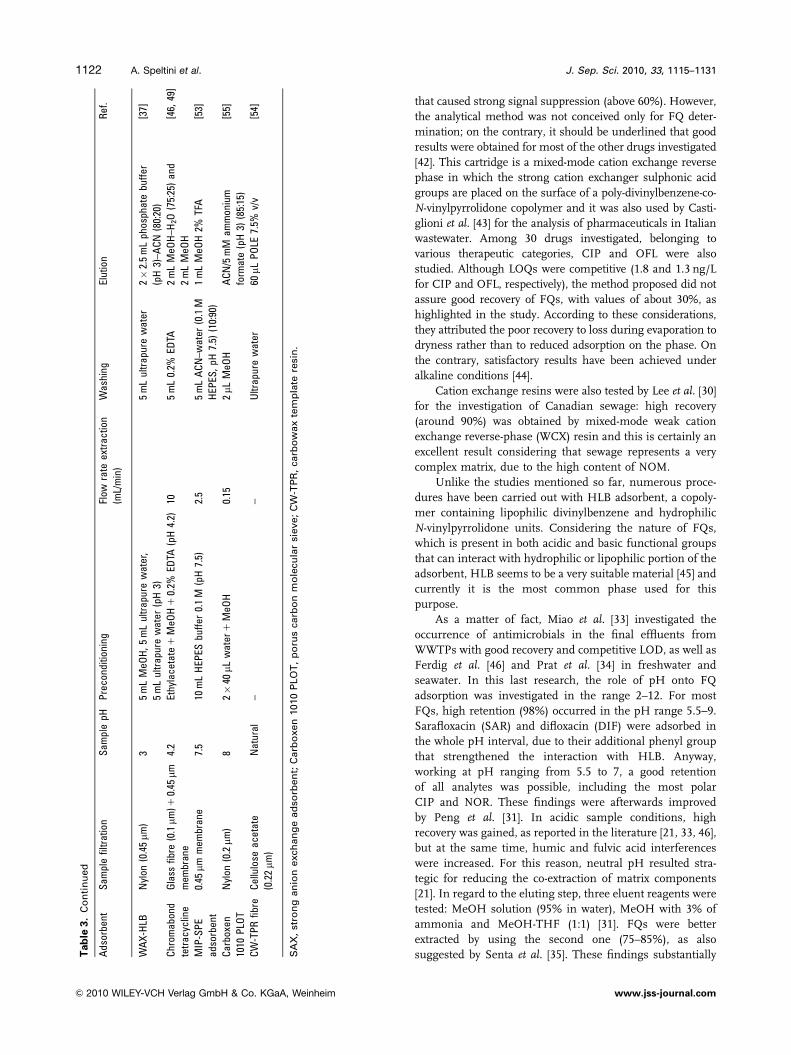
A large number of methods has been developed based on
SPE followed by LC or CZE separation: an overview of the
extraction details is given in Table 3.
Golet et al. [38] were among the first to investigate the
presence of trace FQs in urban wastewater, in the region of
Zurich (Switzerland). FQs were pre-concentrated on silica-
based mixed-mode strong cation exchange reverse phase
(MPC) disk cartridge, a mixed-mode silica-based material
consisting of a special non-polar octyl-phase and benzene-
sulphonate as a strong cation exchanger, not currently
commercially available. The same adsorbent phase was also
used for the analysis in wastewater effluents and surface
samples by Nakata et al. [39], with a similar extraction
procedure.
C2/ENV1-mixed phase columns were used for extrac-
tion of pharmaceuticals from European STP effluents [40]
and from hospital sewage water [12]. Good results were
obtained [40] only for OFL and lomefloxacin (LOM) (85 and
76%), but not for CIP, enoxacin (ENO) and NOR (around
35%). This drawback was attributed to the large amount of
sodium chloride discharged in sewer that prevents the
employment of MPC cartridges, usable at very low salt
content [40]. Even if C2/ENV1 adsorbent does not show ion
exchange properties, recovery can be strongly improved by
using triethylamine (TEA) in methanol (MeOH), rather
than 100% MeOH. This effect is probably due to secondary
interactions between the drugs and the residual silanol
groups on the particles surface, particularly the ones of the
C2 adsorbent material [12].
A different adsorbent phase, the polymer-based mixed-
mode strong cation exchange reverse phase (MCX), was
employed for the extraction of various therapeutic drugs
including CIP FQ from river water [41] and surface water
[42]. In both studies, good recovery was obtained only in
ultrapure water. Certainly, the reason of the poor recovery in
the environmental samples has to be related to matrix effect
J. Sep. Sci. 2010, 33, 1115–11311120 A. Speltini et al.
& 2010 WILEY-VCH Verlag GmbH & Co. KGaA, Weinheim www.jss-journal.com

Tab
le3.
Su
mm
ary
of
the
SP
Eco
nd
itio
ns
Ads
orbe
ntS
ampl
efil
trat
ion
Sam
ple
pHP
reco
nditi
onin
gFl
owra
teex
trac
tion
(mL/
min
)
Was
hing
Elut
ion
Ref
.
MP
CC
ellu
lose
nitr
ate
(0.4
5mm
)3
2m
LM
eOH
12
mL
ultr
apur
ew
ater
(pH
3)1
–2.
5m
Lof
5%N
H3
in15
%M
eOH
[38]
MP
CC
ellu
lose
nitr
ate
(0.4
5mm
)3
8m
LM
eOH
18
mL
ultr
apur
ew
ater
(pH
3)1–
2–
4m
L5%
NH
4OH
inM
eOH
[39]
HLB
–4
5m
LM
eOH
15
mL
ultr
apur
ew
ater
––
10m
LM
eOH
1.5%
acet
icac
id[4
]
HLB
Gla
ssm
icro
fibre
(1mm
)3
6m
Lac
eton
e16
mL
MeO
H1
6m
L50
mM
Na 2
EDTA
(pH
3)
10–
3�
2m
LM
eOH
[33]
HLB
Gla
ssfib
re(0
.45mm
)10
2m
Lof
n-h
exan
e,2
mL
ofac
eton
e,10
mL
ofM
eOH
and
10m
Lof
non-
cont
amin
ated
grou
ndw
ater
(pH
10)
2–20
2m
Lof
5%M
eOH
in
2%aq
ueou
sam
mon
ia
4�
1m
LM
eOH
[47]
HLB
Gla
ssfib
re(0
.2mm
)4
5m
LM
eOH
,4
mL
ultr
apur
ew
ater
–U
ltrap
ure
wat
er(p
H4)
4m
LM
eOH
[32]
HLB
Gla
ssfib
re(0
.45mm
)3
10m
LM
eOH
,10
mL
ultr
apur
ew
ater
55
mL
ultr
apur
ew
ater
4m
LM
eOH
1%N
H3
[35]
HLB
Gla
ssm
icro
fibre
4.2
3�
2m
LM
eOH
–eth
ylac
etat
e(1
:1),
3�
2m
L
MeO
Han
d3�
2m
Lac
idifi
edul
trap
ure
wat
er(p
H4.
2),
52–
5m
L5%
MeO
H3�
2m
LM
eOH
3%N
H3
[31]
HLB
Gla
ssfib
re(0
.47mm
)7
1m
LM
eOH
,1
mL
ultr
apur
ew
ater
32
mL
wat
er–M
eOH
(95:
5)5
mL
MeO
H[2
1]
HLB
Nyl
on(0
.45mm
)3
6m
LM
eOH
,3
mL
MeO
H(0
.1%
HC
OO
H),
2�
6m
Lul
trap
ure
wat
er
52�
6m
Lul
trap
ure
wat
er4�
3m
LM
eOH
0.1%
HC
OO
H[3
6]
HLB
0.45
mmm
embr
ane
5.5
5m
LM
eOH
,10
mL
wat
er10
10m
Lw
ater
2m
L0.
01M
NaO
H–A
CN
(75:
25)
[34]
HLB
Gla
ssfib
re(1mm
),
nylo
n(0
.45mm
)
Nat
ural
5m
LM
eOH
,5
mL
deio
nise
dw
ater
105
mL
ofH
PLC
–gra
de
wat
er
2�
4m
LM
eOH
[57]
HLB
-SD
B-2
Gla
ssfib
re4
MeO
H,
ultr
apur
ew
ater
,ul
trap
ure
wat
er(p
H4)
7.5–
10U
ltrap
ure
wat
er(p
H4)
4�
1m
LM
eOH
(HLB
),4�
1m
L
MeO
H–H
CO
OH
(100
:1)
[48]
MC
XG
lass
mic
rofib
reG
F/D
(2.7mm
)
22
mL
MeO
H,
2m
Lul
trap
ure
wat
er–
1m
LH
Cl
0.1
N2
mL
MeO
H,
2m
LM
eOH
5%
NH
4OH
[41]
MC
XG
lass
mic
rofib
reG
F/D
(2.7mm
)
26
mL
MeO
H,
3m
LM
illi-
Qw
ater
and
3m
L
wat
erac
idifi
edto
pH2
20–
2m
LM
eOH
,2
mL
2%N
H4O
H
inM
eOH
,2
mL
0.2%
NaO
Hin
MeO
H
[43]
MC
XG
lass
mic
rofib
reG
F/F
(0.7mm
)
2.5
2m
LM
eOH
,2
mL
2%H
CO
OH
(pH
2.1)
42
mL
2%H
CO
OH
1m
LM
eOH
,2
mL
MeO
H5%
NH
4OH
[42]
WC
XG
F/C
(1.2mm
)3
4m
LM
eOH
,4
mL
wat
er(p
H3)
10–1
510
0m
Lw
ater
(pH
3),
5m
LM
eOH
10m
LM
eOH
–AC
N–H
CO
OH
(20:
75:5
)
[30]
C2/
ENV
10.
45mm
mem
bran
e3
5m
LM
eOH
,5
mL
MeO
H–w
ater
(50:
50)
and
5m
Lw
ater
(pH
3)
35
mL
wat
er(p
H3)
5m
LM
eOH
5%TE
A[1
2]
C2/
ENV
1–
o7
––
Ultr
apur
ew
ater
3�
5m
LM
eOH
2%TE
A[4
0]
C18
–2.
58
mM
amm
oniu
mac
etat
e(p
H2.
5)(A
)
1A
CN
–0.1
%H
CO
OH
(B):
100%
B(2
mL/
min
for
2m
in),
100%
A(2
min
)
2–
4m
L8
mM
amm
oniu
m
acet
ate
(pH
2.5)
[59]
MEP
–3
5m
LM
eOH
,10
mL
wat
er(p
H3)
1–
6m
LM
eOH
2%H
CO
OH
[44]
WA
X-H
LBG
lass
fibre
(0.5mm
)2.
56
mL
ofM
eOH
and
6m
Lof
phos
phor
ic
acid
4.38
mM
�6
–10
mL
MeO
H–H
3PO
44.
38m
M(9
5:5)
[28]
SA
X-H
LB0.
2mm
mem
bran
e4.
52
mL
MeO
H,
2m
Lci
tric
acid
(pH
4)�
32
mL
citr
icac
id(p
H
4)an
d20
mL
ultr
apur
e
wat
er(p
H4.
2)
4m
LM
eOH
[45]
J. Sep. Sci. 2010, 33, 1115–1131 Sample Preparation 1121
& 2010 WILEY-VCH Verlag GmbH & Co. KGaA, Weinheim www.jss-journal.com
that caused strong signal suppression (above 60%). However,
the analytical method was not conceived only for FQ deter-
mination; on the contrary, it should be underlined that good
results were obtained for most of the other drugs investigated
[42]. This cartridge is a mixed-mode cation exchange reverse
phase in which the strong cation exchanger sulphonic acid
groups are placed on the surface of a poly-divinylbenzene-co-
N-vinylpyrrolidone copolymer and it was also used by Casti-
glioni et al. [43] for the analysis of pharmaceuticals in Italian
wastewater. Among 30 drugs investigated, belonging to
various therapeutic categories, CIP and OFL were also
studied. Although LOQs were competitive (1.8 and 1.3 ng/L
for CIP and OFL, respectively), the method proposed did not
assure good recovery of FQs, with values of about 30%, as
highlighted in the study. According to these considerations,
they attributed the poor recovery to loss during evaporation to
dryness rather than to reduced adsorption on the phase. On
the contrary, satisfactory results have been achieved under
alkaline conditions [44].
Cation exchange resins were also tested by Lee et al. [30]
for the investigation of Canadian sewage: high recovery
(around 90%) was obtained by mixed-mode weak cation
exchange reverse-phase (WCX) resin and this is certainly an
excellent result considering that sewage represents a very
complex matrix, due to the high content of NOM.
Unlike the studies mentioned so far, numerous proce-
dures have been carried out with HLB adsorbent, a copoly-
mer containing lipophilic divinylbenzene and hydrophilic
N-vinylpyrrolidone units. Considering the nature of FQs,
which is present in both acidic and basic functional groups
that can interact with hydrophilic or lipophilic portion of the
adsorbent, HLB seems to be a very suitable material [45] and
currently it is the most common phase used for this
purpose.
As a matter of fact, Miao et al. [33] investigated the
occurrence of antimicrobials in the final effluents from
WWTPs with good recovery and competitive LOD, as well as
Ferdig et al. [46] and Prat et al. [34] in freshwater and
seawater. In this last research, the role of pH onto FQ
adsorption was investigated in the range 2–12. For most
FQs, high retention (98%) occurred in the pH range 5.5–9.
Sarafloxacin (SAR) and difloxacin (DIF) were adsorbed in
the whole pH interval, due to their additional phenyl group
that strengthened the interaction with HLB. Anyway,
working at pH ranging from 5.5 to 7, a good retention
of all analytes was possible, including the most polar
CIP and NOR. These findings were afterwards improved
by Peng et al. [31]. In acidic sample conditions, high
recovery was gained, as reported in the literature [21, 33, 46],
but at the same time, humic and fulvic acid interferences
were increased. For this reason, neutral pH resulted stra-
tegic for reducing the co-extraction of matrix components
[21]. In regard to the eluting step, three eluent reagents were
tested: MeOH solution (95% in water), MeOH with 3% of
ammonia and MeOH-THF (1:1) [31]. FQs were better
extracted by using the second one (75–85%), as also
suggested by Senta et al. [35]. These findings substantiallyTab
le3.
Co
nti
nu
ed
Ads
orbe
ntS
ampl
efil
trat
ion
Sam
ple
pHP
reco
nditi
onin
gFl
owra
teex
trac
tion
(mL/
min
)
Was
hing
Elut
ion
Ref
.
WA
X-H
LBN
ylon
(0.4
5mm
)3
5m
LM
eOH
,5
mL
ultr
apur
ew
ater
,
5m
Lul
trap
ure
wat
er(p
H3)
5m
Lul
trap
ure
wat
er2�
2.5
mL
phos
phat
ebu
ffer
(pH
3)–A
CN
(80:
20)
[37]
Chr
omab
ond
tetr
acyc
line
Gla
ssfib
re(0
.1mm
)10.
45mm
mem
bran
e
4.2
Ethy
lace
tate
1M
eOH
10.
2%ED
TA(p
H4.
2)10
5m
L0.
2%ED
TA2
mL
MeO
H–H
2O(7
5:25
)an
d
2m
LM
eOH
[46,
49]
MIP
-SP
E
adso
rben
t
0.45
mmm
embr
ane
7.5
10m
LH
EPES
buff
er0.
1M
(pH
7.5)
2.5
5m
LA
CN
–wat
er(0
.1M
HEP
ES,
pH7.
5)(1
0:90
)
1m
LM
eOH
2%TF
A[5
3]
Car
boxe
n
1010
PLO
T
Nyl
on(0
.2mm
)8
2�
40mL
wat
er1
MeO
H0.
152mL
MeO
HA
CN
/5m
Mam
mon
ium
form
ate
(pH
3)(8
5:15
)
[55]
CW
-TP
Rfib
reC
ellu
lose
acet
ate
(0.2
2mm
)
Nat
ural
––
Ultr
apur
ew
ater
60mL
PO
LE7.
5%v/
v[5
4]
SA
X,
stro
ng
an
ion
exch
an
ge
ad
sorb
en
t;C
arb
oxen
1010
PLO
T,
po
rus
carb
on
mo
lecu
lar
sieve;
CW
-TP
R,
carb
ow
ax
tem
pla
tere
sin
.
J. Sep. Sci. 2010, 33, 1115–11311122 A. Speltini et al.
& 2010 WILEY-VCH Verlag GmbH & Co. KGaA, Weinheim www.jss-journal.com

confirmed what was found previously [34]: ACN-aqueous
buffer pH 4 (89:11) gave poor recovery for all drugs with
with the exception of CIP, marbofloxacin (MAR) and NOR.
An improvement was initially reached by increasing the
content of ACN, but the best elution was gained by
the addition of 0.01 M NaOH (pH 12) to the organic solvent.
In fact, this elution proved to be more efficient in compar-
ison with pure MeOH (75–78%), acetone (around 50%)
and ACN (55–58%) tested by Vieno et al. [47] for ground-
water and surface water samples. In this work, the recovery
rate that did not exceed 80% might be related to the alkaline
pH extraction. Good recovery was also gained with acidified
MeOH [4, 36], rather than non-acidified MeOH [32, 33, 46,
47]. This has been attributed to interaction through
hydrogen bonding between the piperazynic amine group
(protonated at pH 6) and the carbonyl on the vinylpyrroli-
done in the HLB resin [36]. On the contrary, in acidified
MeOH, protons could compete with FQs, breaking down
hydrogen bonding with a subsequent efficient removal of
analyte from the solid phase. In particular, poor recovery of
polar FQs was gained by performing the elution with pure
MeOH [46].
WWTP effluents proved to be difficult to extract, with
average recovery around 60% for primary effluent [35]. For
these samples, matrix effect and ion suppression [47] were
decreased by washing the cartridge with 5% MeOH in 2%
aqueous ammonia, with similar results to 5% MeOH solu-
tion [31].
It is evident that sample origin strongly affects recovery.
At this purpose, an interesting investigation [21] pointed out
that ionic strength and organic matter content powerfully
influenced antibiotics recovery. Briefly, deionised mineral
and river samples were fortified at three concentration levels
(20, 100 and 500 ng/L). By placing the focus on river water,
recovery rate was good only for the highest spike, overall
ranging from 60 to 111%, whereas it was not satisfactory at
lower spikes ranging from 8 to 66% and 10 to 46%, except
for enrofloxacin (ENR), 105%. As explained by Tamtam etal., results obtained were different depending on the origin
of water. At spike of 20 ng/L, recovery was relatively low in
surface and deionised water and higher in mineral water.
On the contrary, for spikes of 100–500 ng/L, higher recovery
was obtained in ground and surface water in comparison
with deionised water, reasonably because organic matter
and cations compete with the reactive sites of glass
hindering FQ adsorption. Even for ‘‘cleaner’’ samples such
as drinkable water [36], SPE step must be optimised to
improve recovery (adsorption/desorption of analytes) and, at
the same time, to neutralise interferences that lead to signal
suppression.
The role of EDTA in the recovery rate is worthy of
comment. As said before, often-variable quantities of this
chelating agent were added to samples before extraction [4,
32, 33, 36, 46, 48] to improve recovery. As also FQs give
complexes with cations (i.e. calcium and magnesium [4]),
solutions of EDTA have also been used to condition [33] and
to wash the adsorbent phase [46, 49]. However, indications
are sometimes in conflict. Zorita et al. [50] found that MCX
resin is not significantly influenced by EDTA in the case of
sewage water analysis, unlike WCX, for which opposite
results were reported [30]. Recovery from HLB was also not
influenced by EDTA [50]. Anyhow, the performance of MCX
and HLB were improved by EDTA for ultrapure, surface
[30], tap and mineral water [46]. We can conclude that by
using a cation exchanger SPE, recovery increases when low
concentration of cations are present in the sample, as
expected. On the contrary, it is not so clear whether
adsorption on HLB resin is equally possible for free and
complexed FQs. Reduction of the complexing capacity of
FQs towards metal ions was got also by adjusting the
sample pH to 5.5 [34].
A polymeric-silica-based material similar to HLB,
containing silica divinylbenzene and vinylpyrrolidone
copolymer (MEP) was also tested [44]. This resin worked
very well for sample with pH around 3: in these conditions,
recovery on fortified wastewater was high (70–100%) and
reproducible. The recovery rate decreased gradually till pH
9, to increase again for values higher than 10. Like for HLB,
acidified MeOH assured the best elution.
Significant improvement in the sample cleanup – the
real challenge in such analysis – was possible using anion
exchanger adsorbents prior to traditional SPE. This method
had been already tested by Jacobsen et al. [51] for the deter-
mination of tetracycline, macrolide, sulphonamide antibiotics
and then adapted by Renew and Huang [28] for the simul-
taneous determination of FQs, sulphonamide and trimetho-
prim antibiotics in wastewater collected from effluent
downstream. Mixed-mode weak anion exchange reverse
phase (WAX) and HLB in tandem have also been utilised by
Sturini et al. [37] for the determination of MAR and ENR in
surface water, precisely river and irrigation ditches samples,
in northern Italy. The choice of WAX in tandem with HLB
was related to the high matrix effect observed by using HLB
alone, in particular referring to chromatograms quality. As a
matter of fact, better sample cleanup was gained: no anti-
biotics were in fact retained on the anion exchange cartridge
(FQs are present in the cationic form, at acidic pH), but only
a large amount of NOM, the main interference, that is
negatively charged. Antibiotics were eluted from HLB with
acidified MeOH and with phosphate buffer (pH 3)/ACN.
Acidic elution, already tested on HLB [33, 36, 47], allowed to
obtain higher FQ recovery in comparison with MeOH 100%.
The use of acidic MeOH instead of phosphate buffer [37] is
reserved to MS detection [28]. Moreover, good LODs can be
achieved avoiding evaporation of the extract to dryness and
solvent exchange [37].
An alternative SPE procedure [48] placed HLB on top of
a second cartridge, an SDB-2 adsorbent, made of styrene-
divinylbenzene units with a selectivity over a wide polarity
spectrum [52]. After sample loading, each cartridge was
separately eluted, with MeOH and acidified MeOH,
respectively.
A strong anion exchanger adsorbent was used by
Seifrtova et al. [45], in tandem with HLB. Citric acid buffer
J. Sep. Sci. 2010, 33, 1115–1131 Sample Preparation 1123
& 2010 WILEY-VCH Verlag GmbH & Co. KGaA, Weinheim www.jss-journal.com
(pH 4) was proved to be better than acetate buffer (pH 5.5)
and phosphoric acid 4.38 mM for the pre-conditioning step,
contrary to that previously found [28]. Samples spiking
(0.1–5 mg/L) gave good recovery in the range 75–121% for all
FQs investigated.
The large number of adsorbents commercially available
suggests that it is functional to have a complete overview of
their properties and of their performance, especially in
reason of the large variety of environmental matrices to be
investigated. It seems right to remark that the various SPEs
show a different behaviour in terms of trapping capacity,
recovery rate, selectivity and capability of removal of inter-
ferences.
The best performance in the sample cleanup was given
by MPC [38] (no more commercially available), strong cation
exchange reverse phase (MM1) [37] and WCX [37, 50], the
last one successfully employed for the extraction of sewage
samples [30]. Carboxylic acid silica-based weak cation
exchanger was found similar to MPC in terms of selectivity,
but with 20% lower recovery. The combination of hydro-
phobic and cation exchange properties was considered the
reason of the more specific FQ adsorption on MPC resin
[38]. HLB and octadecylsilyl resin (ODS) adsorbents did not
assure a complete removal of interferences in samples rich
in organic matter [30, 37, 50].
A better specificity was gained with MCX, although a
quantitative recovery was not possible in sewage [30],
although good results were obtained in WWTP influent/
effluent-spiked samples [44]. In addition, WCX showed good
selectivity and lower LODs than HLB. These instead
exhibited higher trapping capacity and better precision [50].
Other polymeric resins, ENV, ENV1, EN, PPL and HLB, did
not offer selectivity and enrichment efficiency for waste-
water samples [38].
Talking about recovery rate, good performance was
offered by MEP [44], MPC [38, 39], HLB and Strata-X [21, 35,
37] and chromabond tetracycline [49]; HLB was better when
compared with Nexus, MAX and non-ionic highly cross-
linked styrene-divinylbenzene copolymer (ENVI Chrom P)
[21]; MEP turned out to be the most suitable in comparison
with apolar adsorbent, but also with HLB, MAX and ENVI
Chrom P and MCX, although pleasing recovery was
achieved with the last one and on ENVI Chrom P adsor-
bents [44]. Lower extraction of antibiotics was observed on
C18 reverse-phase SPE [35, 37, 38].
3.2 MIP-SPE experimental procedures
Molecular imprinting is a technology to produce polymers
programmed to recognise a target or a class of target
molecules [53]. In SPE based on molecularly imprinted
polymer, the analyte (the template), or closely related
compounds, will remain bound to the polymer allowing
them to be subsequently eluted co-extractives free. Benito-
Pena et al. [53] demonstrated the applicability of a
urea-based MIP for the pre-concentration of seven
FQs in environmental waters followed by HPLC with
FD. SPE cartridges were packed with 150 mg of the
imprinted polymer prepared using ENR as template and
employed for extraction of river water samples: LODs were
found in the range 0.01–0.30 mg/L, comparable to those
reported for the analysis of FQs using commercial SPE
adsorbents. An important advantage is represented by the
preservation of the pre-concentration ability for at least 80
extractions and this is particularly significant considering
that most of the commercial resins once used cannot be re-
activated for a second extraction. These first results are
promising.
3.3 SPME experimental procedures
Recently, several studies have started to use SPME for FQ
determination. SPME offers some advantages with respect
to SPE, among which are little manipulation and smaller
volume of samples [54]. This technique is based on the
adsorption of the analytes on a fibre (extraction step)
followed, in the case of HPLC analysis, by desorption with
organic solvent. As reported in a recent study [55], an
automated on-line in-tube extraction was developed with
good recovery and sensitivity (Tables 2 and 3). Moreover,
today organic solvents are being replaced by surfactant
aqueous solution as desorbing agents. In this case, it is
preferable to use the acronym SPME-MD (SPME with
micellar desorption). A method based on this technique has
been published recently [54] and it was proved to be very
efficient for FQ determination. In particular, better results
were obtained when the POLE surfactant (polyoxyethylene
10 lauryl ether) was used instead of MeOH. Recovery was
good in water samples of different origin and also
competitive LODs were gained. From an analytical point
of view, a very interesting aspect is the possibility to enhance
FQ fluorescence by applying the micellar desorption that
increased the rigidity of the molecules. In fact, this
represents a great advantage in terms of sensitivity.
3.4 Chromatographic separation
As discussed in Section 3.1, the optimisation of the
sample pre-treatment constitutes a very important step
throughout the whole analytical procedure, to which
researchers have devoted many efforts. Besides extraction
and pre-concentration steps, separation is equally important
to completely take advantage of the sensitivity offered by
the detection system. This is especially important when a
large number of analytes has to be simultaneously
chromatographed. An outline of the LC conditions used is
given in Table 4. The optimisation of the HPLC process
was the subject of the study presented by Herrera-Herrera
et al. [4]. They used ionic liquids as additives in mobile
phases for the separation of seven FQs. In particular, four
room-temperature ionic liquids were investigated, differing
J. Sep. Sci. 2010, 33, 1115–11311124 A. Speltini et al.
& 2010 WILEY-VCH Verlag GmbH & Co. KGaA, Weinheim www.jss-journal.com
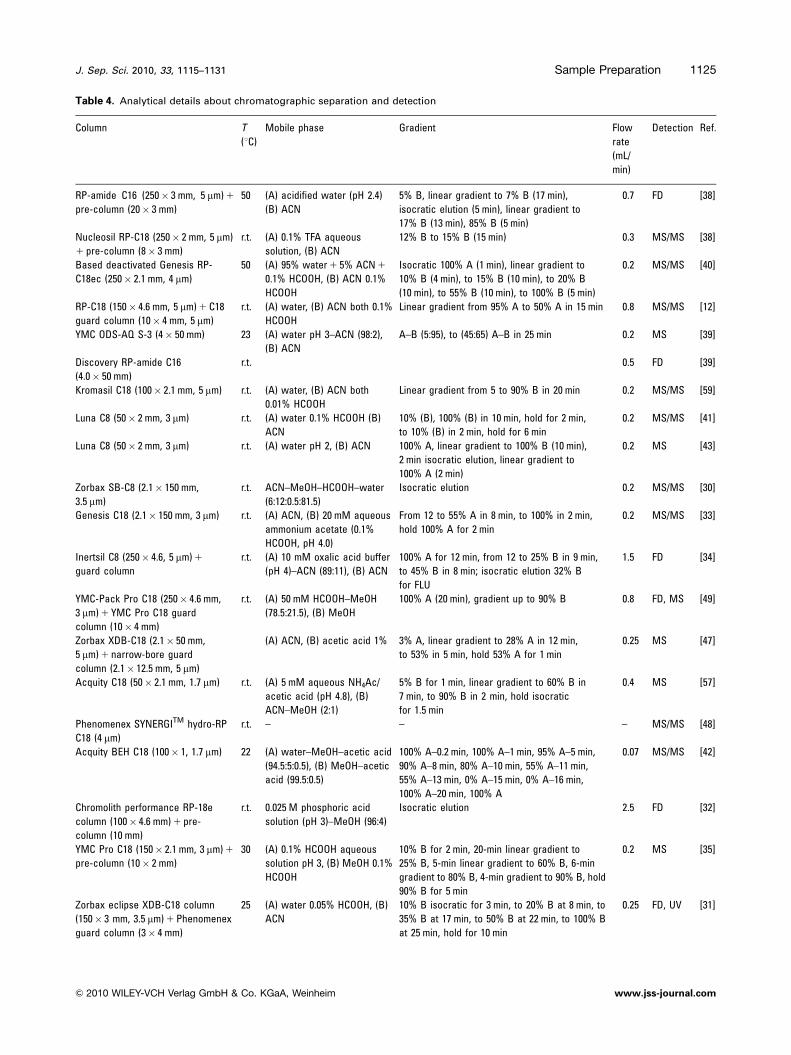
Table 4. Analytical details about chromatographic separation and detection
Column T
(1C)
Mobile phase Gradient Flow
rate
(mL/
min)
Detection Ref.
RP-amide C16 (250� 3 mm, 5 mm) 1
pre-column (20� 3 mm)
50 (A) acidified water (pH 2.4)
(B) ACN
5% B, linear gradient to 7% B (17 min),
isocratic elution (5 min), linear gradient to
17% B (13 min), 85% B (5 min)
0.7 FD [38]
Nucleosil RP-C18 (250� 2 mm, 5 mm)
1 pre-column (8� 3 mm)
r.t. (A) 0.1% TFA aqueous
solution, (B) ACN
12% B to 15% B (15 min) 0.3 MS/MS [38]
Based deactivated Genesis RP-
C18ec (250� 2.1 mm, 4 mm)
50 (A) 95% water 1 5% ACN 1
0.1% HCOOH, (B) ACN 0.1%
HCOOH
Isocratic 100% A (1 min), linear gradient to
10% B (4 min), to 15% B (10 min), to 20% B
(10 min), to 55% B (10 min), to 100% B (5 min)
0.2 MS/MS [40]
RP-C18 (150� 4.6 mm, 5 mm) 1 C18
guard column (10� 4 mm, 5 mm)
r.t. (A) water, (B) ACN both 0.1%
HCOOH
Linear gradient from 95% A to 50% A in 15 min 0.8 MS/MS [12]
YMC ODS-AQ S-3 (4� 50 mm) 23 (A) water pH 3–ACN (98:2),
(B) ACN
A–B (5:95), to (45:65) A–B in 25 min 0.2 MS [39]
Discovery RP-amide C16
(4.0� 50 mm)
r.t. 0.5 FD [39]
Kromasil C18 (100� 2.1 mm, 5 mm) r.t. (A) water, (B) ACN both
0.01% HCOOH
Linear gradient from 5 to 90% B in 20 min 0.2 MS/MS [59]
Luna C8 (50� 2 mm, 3 mm) r.t. (A) water 0.1% HCOOH (B)
ACN
10% (B), 100% (B) in 10 min, hold for 2 min,
to 10% (B) in 2 min, hold for 6 min
0.2 MS/MS [41]
Luna C8 (50� 2 mm, 3 mm) r.t. (A) water pH 2, (B) ACN 100% A, linear gradient to 100% B (10 min),
2 min isocratic elution, linear gradient to
100% A (2 min)
0.2 MS [43]
Zorbax SB-C8 (2.1� 150 mm,
3.5 mm)
r.t. ACN–MeOH–HCOOH–water
(6:12:0.5:81.5)
Isocratic elution 0.2 MS/MS [30]
Genesis C18 (2.1� 150 mm, 3 mm) r.t. (A) ACN, (B) 20 mM aqueous
ammonium acetate (0.1%
HCOOH, pH 4.0)
From 12 to 55% A in 8 min, to 100% in 2 min,
hold 100% A for 2 min
0.2 MS/MS [33]
Inertsil C8 (250� 4.6, 5 mm) 1
guard column
r.t. (A) 10 mM oxalic acid buffer
(pH 4)–ACN (89:11), (B) ACN
100% A for 12 min, from 12 to 25% B in 9 min,
to 45% B in 8 min; isocratic elution 32% B
for FLU
1.5 FD [34]
YMC-Pack Pro C18 (250� 4.6 mm,
3 mm) 1 YMC Pro C18 guard
column (10� 4 mm)
r.t. (A) 50 mM HCOOH–MeOH
(78.5:21.5), (B) MeOH
100% A (20 min), gradient up to 90% B 0.8 FD, MS [49]
Zorbax XDB-C18 (2.1� 50 mm,
5 mm) 1 narrow-bore guard
column (2.1� 12.5 mm, 5 mm)
(A) ACN, (B) acetic acid 1% 3% A, linear gradient to 28% A in 12 min,
to 53% in 5 min, hold 53% A for 1 min
0.25 MS [47]
Acquity C18 (50� 2.1 mm, 1.7 mm) r.t. (A) 5 mM aqueous NH4Ac/
acetic acid (pH 4.8), (B)
ACN–MeOH (2:1)
5% B for 1 min, linear gradient to 60% B in
7 min, to 90% B in 2 min, hold isocratic
for 1.5 min
0.4 MS [57]
Phenomenex SYNERGITM hydro-RP
C18 (4 mm)
r.t. – – – MS/MS [48]
Acquity BEH C18 (100� 1, 1.7 mm) 22 (A) water–MeOH–acetic acid
(94.5:5:0.5), (B) MeOH–acetic
acid (99.5:0.5)
100% A–0.2 min, 100% A–1 min, 95% A–5 min,
90% A–8 min, 80% A–10 min, 55% A–11 min,
55% A–13 min, 0% A–15 min, 0% A–16 min,
100% A–20 min, 100% A
0.07 MS/MS [42]
Chromolith performance RP-18e
column (100� 4.6 mm) 1 pre-
column (10 mm)
r.t. 0.025 M phosphoric acid
solution (pH 3)–MeOH (96:4)
Isocratic elution 2.5 FD [32]
YMC Pro C18 (150� 2.1 mm, 3 mm) 1
pre-column (10� 2 mm)
30 (A) 0.1% HCOOH aqueous
solution pH 3, (B) MeOH 0.1%
HCOOH
10% B for 2 min, 20-min linear gradient to
25% B, 5-min linear gradient to 60% B, 6-min
gradient to 80% B, 4-min gradient to 90% B, hold
90% B for 5 min
0.2 MS [35]
Zorbax eclipse XDB-C18 column
(150� 3 mm, 3.5 mm) 1 Phenomenex
guard column (3� 4 mm)
25 (A) water 0.05% HCOOH, (B)
ACN
10% B isocratic for 3 min, to 20% B at 8 min, to
35% B at 17 min, to 50% B at 22 min, to 100% B
at 25 min, hold for 10 min
0.25 FD, UV [31]
J. Sep. Sci. 2010, 33, 1115–1131 Sample Preparation 1125
& 2010 WILEY-VCH Verlag GmbH & Co. KGaA, Weinheim www.jss-journal.com

in the length of the alkyl chain on the imidazolium cation
and one ionic liquid containing tetraethylammonium, all
with the same counterion: 1-ethyl-3-methylimidazolium
tetrafluoroborate, 1-butyl-3-methylimidazolium tetrafluoro-
borate (BMIm-BF4), 1-hexyl-3-methylimidazolium tetra-
fluoroborate, 1-methyl-3-octylimidazolium tetrafluoroborate
and tetraethylammonium tetrafluroborate. It is well known
that separation of basic compounds on reverse-phase
silica-based columns is quite difficult, as a result of
strong interaction of analyte cationic sites with the anionic
silanols of the stationary phase, which causes peak tailing.
Therefore, elution at low pH is the best choice to separate
FQs, as in the acidic medium, they are in the cationic form.
TEA is the most popular silanol-suppressing agent and, for
this reason, it was initially used by Herrera-Herrera et al., in
comparison with formic and acetic acids as additives to
mobile phase. The use of TEA allowed a complete
separation of the seven drugs, but peak shape of the last
eluted FQs (SAR, DIF) was not satisfactory and much time
(about 40 min) was necessary for their separation. Similar
results were obtained with formic and acetic acids.
Increasing the length of the chain present in the ionic
liquids, a better resolution was possible. As suggested in the
literature, the repulsion between the imidazolium cation
and the ionised FQs also plays an important role in
shortening FQ retention time. Better separation, shorter
retention times and good peak shape were achieved with
BMIm-BF4.
The field of chromatographic separation was also
investigated by Kumar et al. [56], who focused their experi-
ments on comparison between C18 and RP-amide columns
evaluating different parameters: LODs, intra- and interday
RSD%, selectivity factor and resolution. Results suggest that
RP-amide is better than C18 stationary phase. In the last few
years, significant progress has been made in chromato-
graphic analyses by the introduction of ultra-performance
LC (UPLC) [21, 42, 57], associated with sub-2 mm porous
stationary phases (versus 3–5 mm HPLC). This withstands
higher pressures than traditional HPLC and allows higher
peak capacity, greater resolution, increased sensitivity and
shorter analysis time. For instance, in 10-min chromato-
graphic run, 23 [57] and 17 [21] compounds have been easily
Table 4. Continued
Column T
(1C)
Mobile phase Gradient Flow
rate
(mL/
min)
Detection Ref.
Acquity UPLC BEH C18
(100� 2.1 mm, 1.7 mm)
50 (A) water, (B) ACN both 0.01%
HCOOH
90% A for 3 min, to 70% A at 9 min, to
10% A at 10 min, hold for 2 min, to 90% A
in 1 min
0.5 MS/MS [21]
Kromasil ODS C18 (250� 4.5 mm,
5 mm)
r.t. (A) ACN, 10 mM TBAB pH 3
(B)
4% A, 8 min isocratic elution, 8 min
liner gradient to 15% B, 5 min linear
gradient to 25% B
1 FD [44]
C18 (150� 2 mm, 3 mm) 1 C18
guard column (30� 2 mm, 3 mm)
r.t. (A) water 0.1% HCOOH,
(B) ACN
Linear gradient from 10 to 100% B
in 20 min and then held for 2 min
0.2 MS/MS [36]
SB-C18 (150� 2.1 mm, 5 mm) 30 1 mM ammonia acetate,
0.007% glacial acetic acid,
10% ACN (A), ACN (B)
100% A for 2 min, to 8.5% B in 8 min,
18% in 20 min, 50% in 25 min and 10% in
30 min
0.25 MS [28]
Polaris C18-A (150� 2.0 mm,
5 mm) 1 MetaGuard Polaris
(2.0 mm, 5 mm) C18-A pre-column
25 (A) ACN, B (water 0.005%
HCOOH)
10% A for 2 min, linear gradient to
30% A in 13 min
0.2 MS/MS [50]
Nova-Pak C18 (150� 3.9 mm,
4 mm) 1 Guard-Pak C18 (4 mm)
5 mM BMIm-BF4 1 10 mM
NH4Ac (pH 3.0)–ACN (87:13)
Isocratic elution 1 FD [4]
Hypersil C18 (250 mm� 4.6 mm,
5 mm)
r.t. Phosphate buffer (pH 3) –
ACN (80:20)
Isocratic elution 1 FD [37]
AscentisTM RP-amide (150� 4.6,
5 mm)
�25 (A) citrate buffer 0.001 M (pH
4.5), (B) MeOH, (C) ACN
A–B (60:40) for 7 min, to A–C (60:40)
in 2 min
1 UV [56]
Chromolith performance RP-18e
(100� 4.6 mm) 1 pre-column 10 mm
r.t. Phosphoric acid (pH 3)–
MeOH–ACN (92:7:1)
Isocratic elution 1.2 FD [45]
Aqua C18ec (250� 4.6 mm, 5 mm)
1 RP 18 guard column
(4.0� 3 mm, 5 mm)
25 (A) 25 mM H3PO4 (pH 3), (B)
ACN, (C) MeOH
17% B 83% A for 8 min (1 mL/min), to
66% B and 15% C in 17 min (2 mL/min),
hold for 10 min
1–2 FD [53]
Water symmetry C18
(150� 3.9 mm, 4 mm)
r.t. MeOH–water (15:85), pH 2.5 Isocratic elution 1 FD [54]
Capcell Pack C8 (100� 2.1, 5 mm) 40 5 mM aqueous ammonium
formate (pH 3.0)–ACN (85:15)
Isocratic elution 0.2 MS/MS [55]
TBAB, tetrabutyl ammonium bromide.
J. Sep. Sci. 2010, 33, 1115–11311126 A. Speltini et al.
& 2010 WILEY-VCH Verlag GmbH & Co. KGaA, Weinheim www.jss-journal.com
separated, with optimal efficiency; similar retention times
(within about 15 min) were achieved [42] for the analysis of
28 different drugs. A typical UPLC chromatogram is shown
in Fig. 2.
3.5 CZE analysis
The applicability of CZE-ESI-MS/MS for the separation of
FQs was proved [58]. The process was optimised so that by
using 120 mM ammonium carbonate (pH 9.12) as buffer
solution, eight FQs have been separated within a single run
with good reproducibility.
Ferdig et al. [46] published a CZE combined with FD
method for the determination of FQs in biological and
environmental water samples. Instead of laser, a continuum
light source was used in the FD. Phosphate electrolytes were
investigated as carrier obtaining the best separation with
50 mM phosphate buffer pH 7.55 in ACN–water (40:60). By
coupling CZE with SPE (extraction details are reported in
Table 3), LOQ in the nanogram per litre range have been
achieved (Table 2).
3.6 Detection: Fluorescence and MS
Analysis of real-water samples revealed that sensitivity of
detector is heavily affected by the matrix components. The
choice of the detection system principally fell on MS or FD,
but in the literature there are conflicting opinions on this
topic. Considering the high fluorescence shown by most of
the FQs, FD was often adopted (Table 2) and was considered
suitable for its specificity and its sensitivity [44]. However,
for the analysis of sewage influents/effluents, mass detec-
tion was proved to be best suited as it provided the highest
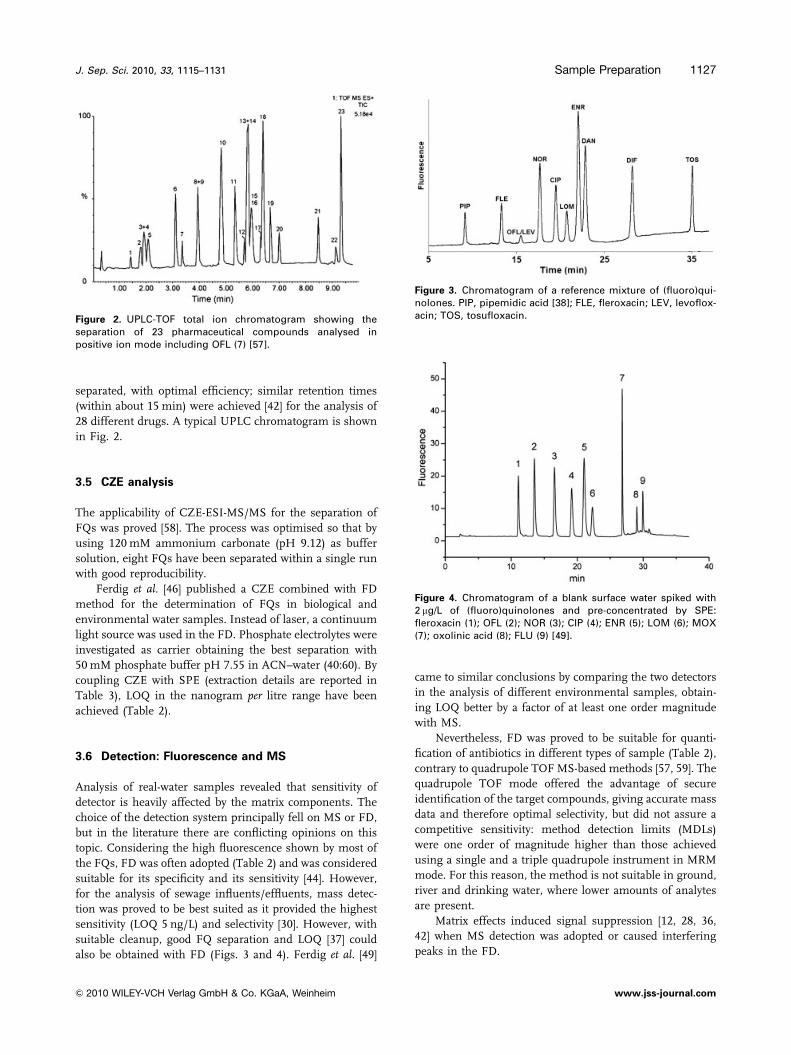
sensitivity (LOQ 5 ng/L) and selectivity [30]. However, with
suitable cleanup, good FQ separation and LOQ [37] could
also be obtained with FD (Figs. 3 and 4). Ferdig et al. [49]
came to similar conclusions by comparing the two detectors
in the analysis of different environmental samples, obtain-
ing LOQ better by a factor of at least one order magnitude
with MS.
Nevertheless, FD was proved to be suitable for quanti-
fication of antibiotics in different types of sample (Table 2),
contrary to quadrupole TOF MS-based methods [57, 59]. The
quadrupole TOF mode offered the advantage of secure
identification of the target compounds, giving accurate mass
data and therefore optimal selectivity, but did not assure a
competitive sensitivity: method detection limits (MDLs)
were one order of magnitude higher than those achieved
using a single and a triple quadrupole instrument in MRM
mode. For this reason, the method is not suitable in ground,
river and drinking water, where lower amounts of analytes
are present.
Matrix effects induced signal suppression [12, 28, 36,
42] when MS detection was adopted or caused interfering
peaks in the FD.
Figure 3. Chromatogram of a reference mixture of (fluoro)qui-nolones. PIP, pipemidic acid [38]; FLE, fleroxacin; LEV, levoflox-acin; TOS, tosufloxacin.Figure 2. UPLC-TOF total ion chromatogram showing the
separation of 23 pharmaceutical compounds analysed inpositive ion mode including OFL (7) [57].
Figure 4. Chromatogram of a blank surface water spiked with2 mg/L of (fluoro)quinolones and pre-concentrated by SPE:fleroxacin (1); OFL (2); NOR (3); CIP (4); ENR (5); LOM (6); MOX(7); oxolinic acid (8); FLU (9) [49].
J. Sep. Sci. 2010, 33, 1115–1131 Sample Preparation 1127
& 2010 WILEY-VCH Verlag GmbH & Co. KGaA, Weinheim www.jss-journal.com

Signal suppression was evaluated [28] as the percentage
decrease in signal intensity in a wastewater matrix versusdeionised water, according to the following equation:
Signal suppression ð%Þ ¼ 1� Is � Ix
IDI
� �� 100
where Is is the antibiotic signal intensity in a sample extract
spiked with S amount, Ix the signal related to an unspiked
extract and IDI the signal in deionised water matrix
MeOH–phosphoric acid 4.38 mM (20:80), fortified with Samount of each FQs. Signal suppression was appreciable for
FQs and it caused a decrease of sensitivity: MDLs rose from
2–7 ng/L in ultrapure water to 20–50 ng/L in final effluents
and to 30–90 ng/L in secondary effluents. It is evident that
NOM is the main cause of signal suppression in wastewater,
as indicated by the good correlation between absorbance
(254 nm) and organic carbon content in water. The
concentration of organic matter was also found determinant
[21] in the processing of river water samples with dissimilar
dissolved organic carbon (DOC). No signal suppression was
registered for samples containing 2 mg/L DOC, unlike
samples containing 4 mg/L DOC. Suppression reached a
maximum of 60% for danofloxacin (DAN) and a minimum
of 30% for OFL and ENR.
No signal suppression was noticed in groundwater
extracts, whereas a signal intensity decrease was observed in
the case of STP influents, where over 40% of the signal
intensity was lost for the compounds having retention times
longer than 10 min [47]. At high ACN percentage, the more
hydrophobic components were probably the major cause of
the signal suppression.
In support of the above, low recovery and high method
quantification limits in STP effluents were found to be a
consequence of the consistent amount of the organic matter
in this kind of samples [35].
4 Environmental occurrence of FQs
The presence of these antibiotics in superficial and
municipal water is correlated to the density of population:
municipal and hospital wastewater are the main sources of
pharmaceuticals emission [45].
In fact, variable amounts of FQ antibacterial agents have
been detected in European, American and Asian surface
water. Very dissimilar concentrations are reported in the
literature [59, 32]: in the first investigation, carried out on
surface water and groundwater from Holland and the
Spanish Mediterranean area, NOR, CIP and FLU turned out
to be the most commonly detected FQs, with concentration
of 7.6, 5.5 and 5.8 ng/L, respectively.
On the contrary, in Mondego river (Portugal), ENR and
CIP were found at higher concentrations (from 67.0 to
102.5 ng/L ENR and 79.6 and 119.2 ng/L CIP). CIP and
NOR were quantified in the range 5–18 ng/L in the Glatt
river (Switzerland) [18]. Analysis of surface water in
North Rhine-Westphalia (Germany) confirmed the sporadic
presence of CIP and OFL [48], at concentrations generally
below 10 ng/L, with the exception of one single sample
(20 ng/L OFL).
Higher levels of CIP, between 14.36 and 26.15 ng/L,
were determined in river Po (Italy) [41].
The Ile-de-France region, in northern France, has been
recently investigated by Tamtam et al. [21]. Samples were
collected from Marne, Oise and Seine rivers: 10.5 ng/L OFL
and 13 ng/L NOR were detected in Oise river; NOR was also
quantified in Seine river (18.6 ng/L).
Antibiotics were also analysed in the south of Finland
[47] and in the rivers of the Croatian region, Drava, Sava and
Danube [35]. In comparison with the surveys just
mentioned, FQs were present at lower amounts. In the
Finnish rivers, NOR, OFL and CIP were proved to be
present, although mostly non-quantifiable, except CIP that
has been quantified in 25 ng/L. Otherwise, FQs in Croatia
resulted below MDLs.
Investigation in the territory between Canada and the
USA revealed that lake and river water samples collected
from Detroit, Lansing and Petoskey (Michigan) and from
western Lake Ontario (Canada) showed FQ concentrations
oLOD [39].
Recently, direct contamination of surface water, by
release of farming wastes into irrigation ditches, has been
proved [37]. MAR and ENR have been detected in rivers and
ditches in the flat land of northern Italy. Water collected
from Po and Ticino rivers contained 37 and 27 ng/L of ENR,
respectively, whereas MAR, although detectable, was not
quantifiable. Samples of irrigation ditches, located close to
farms, showed MAR around 9 ng/L and ENR between 11
and 34 ng/L.
Chinese waters have also been explored. In Pearl river,
the largest one in south China, OFL and NOR were present
at concentrations of 439 and 459 ng/L for CIP [31].
As expected, pharmaceuticals in wastewater are present
in greater quantity than in rivers and lakes, where dilution
of waste occurred [49]. WWTPs are able to eliminate a
substantial fraction in the range 70–80% of the total enter-
ing amount [38]. CIP and NOR were proved to be taken
away at different percentages: between 79 and 87% [18], 54
and 76%, and 85 and 92%, respectively [45]. About half ENR
was eliminated [45]. However, the efficiency depends on the
treatment process and, till date, biological treatment allows
the highest removal [60]. In confirmation of this, adsorption
to sewage sludge has been suggested as the main removal
pathway during secondary wastewater treatment [45], as
supported by the high concentrations of OFL (510 mg/kg),
NOR (150 mg/kg), CIP (230 mg/kg) and moxifloxacin (MOX)
(30 mg/kg) found in sewage sludge samples [49].
Two WWTPs that differed from the secondary activated
sludge treatment – UV and chlorination, respectively – have
been compared in terms of removal performance. In the
secondary effluents, drugs concentrations were comparable:
NOR was detected at less than 60 ng/L and the median
concentrations of CIP and OFL were 100–160 and
205–305 ng/L, respectively. In the tertiary effluents, FQ
J. Sep. Sci. 2010, 33, 1115–11311128 A. Speltini et al.
& 2010 WILEY-VCH Verlag GmbH & Co. KGaA, Weinheim www.jss-journal.com

concentration turned out to be very dissimilar, indicating
that a more efficient removal of FQs occurred by chlorine
treatment [28].
The incomplete elimination of antibiotics has been
extensively proved: NOR, LOM and CIP were quantified as
56–1163, 24–735 and 14–444 ng/L, respectively, in Chinese
urban wastewater collected from primary (after primary
clarification) and tertiary effluents after advanced treatment
with contact filtration [44]; in two raw wastewater samples,
NOR was quantified as 3131 and 240 ng/L, whereas in the
corresponding secondary effluents, concentration decreased
to 1035 and 54 ng/L. CIP was determined at concentration
levels of 1343 and 143 ng/L in raw samples and 427 and
46 ng/L in secondary effluents [35]; analysis of water
samples collected from several WWTPs in the territory of
Zurich (Switzerland) revealed the presence of CIP and
NOR, the most used human FQs in that area, at concen-
tration between 249–405 and 45–120 ng/L, respectively. On
the contrary, no veterinary FQs were detected [38]; OFL was
quantified in WWTP effluents in Michigan, USA [39]: its
concentration in the final effluent was approximately 50%
lower than that found in the secondary treatment effluent,
204 ng/L.
CIP, NOR and OFL are also the most diffused FQs in
the Canadian territory. They have been detected in the final
effluents of eight WWTPs presenting either primary or
secondary treatment processes and either chlorine or UV
disinfection: median concentrations varied from 0.118,
0.050 and 0.094 mg/L, respectively [33].
High amounts of pharmaceuticals were observed in raw
sewage hospital water, where CIP was in the range 3.6–101
and 0.2–7.6 mg/L OFL. Large temporal variability throughout
a 13-h monitoring time was observed as function of flow
rate, indicating that results can be strongly affected by the
sampling strategy [12].
Hospital emission is the primary source of trace FQs in
municipality wastewater [45]. Relatively, high concentra-
tions were observed, generally ranging from about a few
tens of nanogram per litre up to a ten of microgram per litre.
Hospital wastewater sampled in the area around Asahi river
and Sasagase river in Okayama city (Japan) showed
concentration of OFL ranging from 17.5 to 59.2 ng/L,
whereas OFL was quantified in the range 128.1–186.2 ng/L
in STP wastewater of that region [55].
As the affinity of FQs to sludge, important amounts of
such compounds are expected to enter the environment viaSTP effluents. It has been suggested that the main route of
transportation of human antibiotics into the environment is
via STPs [13]. In this study, a screening of human drugs was
conducted both on aqueous matrices (raw sewage water and
STP final effluents) and on solid sludge. In support of the
above, the highest quantity of substances was determined in
sludge. The water treatment applied in the considered STPs,
which included chemical removal of phosphorous, primary
clarification, active sludge treatment with nitrogen removal
and secondary clarification, was proved to significantly
reduce FQs in water. The main degree of removal for CIP,
NOR and OFL was 87% for the first two drugs and 86% for
the last.
The presence of ENO, LOM and OFL in STP effluents
was for the first time attested in the year 2003 [40], in a
monitoring campaign carried out in four European coun-
tries (France, Greece, Italy and Sweden). The survey, aimed
to the identification of more than 20 pharmaceuticals
belonging to different classes, found that OFL and LOM
were the two most abundant FQs and, in particular, OFL
was present in the range 0.12–0.58 mg/L.
Similar concentrations (150–1081 ng/L) were found in
Italian STP effluents [43], whereas CIP was in the range
27–514 ng/L.
Additional data came from southern Ontario, Canada
[30]: the three detected FQs showed concentrations ranging
from the low to the high nanogram per litre levels in all
samples, suggesting the widespread use of these anti-
bacterial agents in that area. With median concentrations of
34 ng/L in the final and 60 ng/L in the primary effluents,
NOR was usually present at lower concentration than the
other two compounds. In comparison, the median concen-
trations of CIP and OFL in these samples were 146 and
179 ng/L (for final effluent samples) and 251 and 148 ng/L
(for primary effluent samples), respectively. The higher
value for OFL found in the final effluents, in comparison
with the primary effluents, was attributed to a de-conjuga-
tion of metabolites due to microbial activity in the sewage
treatment processes.
The FQ occurrence in three Finnish STP effluents was
studied: the drugs considered, and mainly CIP, were
detected and quantified in the influents, but in the effluent
samples, they were present in concentrations near or under
the quantification limit (5.7–36 ng/L) [47]. Higher concen-
trations of antibiotics were determined in the region of
Upper Austria [49]: STP influents contained OFL 1875 ng/L,
NOR 355 ng/L, CIP 340 ng/L and MOX 2175 ng/L; the same
FQs were found in the STP effluents at somewhat lower
concentrations: OFL 240 ng/L, NOR 340 ng/L, CIP 395 ng/L
and MOX 370 ng/L. Some 20 m downstream of the sewage
plant discharge, the river water contained 28 ng/L OFL,
25 ng/L NOR, 28 ng/L CIP and 17 ng/L MOX.
5 Concluding remarks
The determination of FQ antibiotics in environmental
waters at very low concentrations (from the nanogram perlitre to the microgram per litre range) was proved to be a
hard task, being affected by strong matrix effects. These
involved drawbacks throughout the entire analytical proce-
dure, preventing an efficient sample cleanup and lowering
the sensitivity of the detection system. Independently of the
detection techniques following the HPLC separation, the
most critical step is sample preparation and, in particular,
filtration. SPE methods, the most used to pre-concentrate
and to clean the sample, are strongly influenced by the
matrix: salinity and NOM content play a significant role and
J. Sep. Sci. 2010, 33, 1115–1131 Sample Preparation 1129
& 2010 WILEY-VCH Verlag GmbH & Co. KGaA, Weinheim www.jss-journal.com
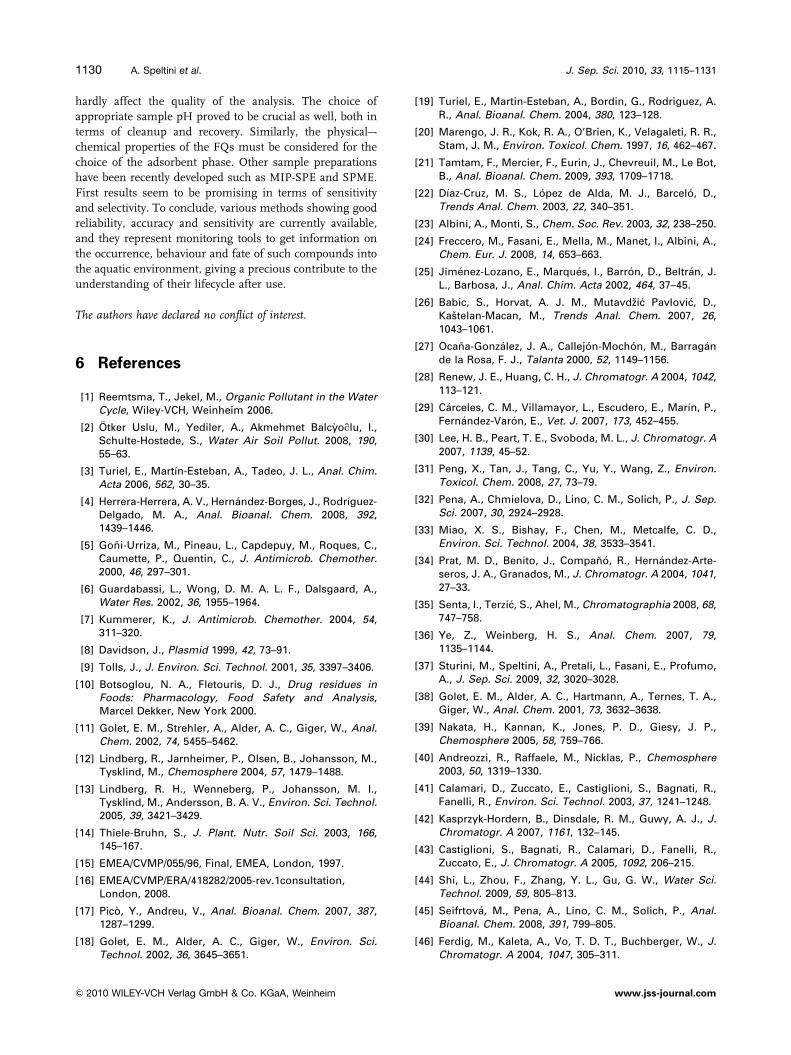
hardly affect the quality of the analysis. The choice of
appropriate sample pH proved to be crucial as well, both in
terms of cleanup and recovery. Similarly, the physical–-
chemical properties of the FQs must be considered for the
choice of the adsorbent phase. Other sample preparations
have been recently developed such as MIP-SPE and SPME.
First results seem to be promising in terms of sensitivity
and selectivity. To conclude, various methods showing good
reliability, accuracy and sensitivity are currently available,
and they represent monitoring tools to get information on
the occurrence, behaviour and fate of such compounds into
the aquatic environment, giving a precious contribute to the
understanding of their lifecycle after use.
The authors have declared no conflict of interest.
6 References
[1] Reemtsma, T., Jekel, M., Organic Pollutant in the WaterCycle, Wiley-VCH, Weinheim 2006.
[2] Otker Uslu, M., Yediler, A., Akmehmet Balcyoqlu, I.,Schulte-Hostede, S., Water Air Soil Pollut. 2008, 190,55–63.
[3] Turiel, E., Martın-Esteban, A., Tadeo, J. L., Anal. Chim.Acta 2006, 562, 30–35.
[4] Herrera-Herrera, A. V., Hernandez-Borges, J., Rodrıguez-Delgado, M. A., Anal. Bioanal. Chem. 2008, 392,1439–1446.
[5] Goni-Urriza, M., Pineau, L., Capdepuy, M., Roques, C.,Caumette, P., Quentin, C., J. Antimicrob. Chemother.2000, 46, 297–301.
[6] Guardabassi, L., Wong, D. M. A. L. F., Dalsgaard, A.,Water Res. 2002, 36, 1955–1964.
[7] Kummerer, K., J. Antimicrob. Chemother. 2004, 54,311–320.
[8] Davidson, J., Plasmid 1999, 42, 73–91.
[9] Tolls, J., J. Environ. Sci. Technol. 2001, 35, 3397–3406.
[10] Botsoglou, N. A., Fletouris, D. J., Drug residues inFoods: Pharmacology, Food Safety and Analysis,Marcel Dekker, New York 2000.
[11] Golet, E. M., Strehler, A., Alder, A. C., Giger, W., Anal.Chem. 2002, 74, 5455–5462.
[12] Lindberg, R., Jarnheimer, P., Olsen, B., Johansson, M.,Tysklind, M., Chemosphere 2004, 57, 1479–1488.
[13] Lindberg, R. H., Wenneberg, P., Johansson, M. I.,Tysklind, M., Andersson, B. A. V., Environ. Sci. Technol.2005, 39, 3421–3429.
[14] Thiele-Bruhn, S., J. Plant. Nutr. Soil Sci. 2003, 166,145–167.
[15] EMEA/CVMP/055/96, Final, EMEA, London, 1997.
[16] EMEA/CVMP/ERA/418282/2005-rev.1consultation,London, 2008.
[17] Pico, Y., Andreu, V., Anal. Bioanal. Chem. 2007, 387,1287–1299.
[18] Golet, E. M., Alder, A. C., Giger, W., Environ. Sci.Technol. 2002, 36, 3645–3651.
[19] Turiel, E., Martin-Esteban, A., Bordin, G., Rodriguez, A.R., Anal. Bioanal. Chem. 2004, 380, 123–128.
[20] Marengo, J. R., Kok, R. A., O’Brien, K., Velagaleti, R. R.,Stam, J. M., Environ. Toxicol. Chem. 1997, 16, 462–467.
[21] Tamtam, F., Mercier, F., Eurin, J., Chevreuil, M., Le Bot,B., Anal. Bioanal. Chem. 2009, 393, 1709–1718.
[22] Dıaz-Cruz, M. S., Lopez de Alda, M. J., Barcelo, D.,Trends Anal. Chem. 2003, 22, 340–351.
[23] Albini, A., Monti, S., Chem. Soc. Rev. 2003, 32, 238–250.
[24] Freccero, M., Fasani, E., Mella, M., Manet, I., Albini, A.,Chem. Eur. J. 2008, 14, 653–663.
[25] Jimenez-Lozano, E., Marques, I., Barron, D., Beltran, J.L., Barbosa, J., Anal. Chim. Acta 2002, 464, 37–45.
[26] Babic, S., Horvat, A. J. M., Mutavdzic Pavlovic, D.,Kastelan-Macan, M., Trends Anal. Chem. 2007, 26,1043–1061.
[27] Ocana-Gonzalez, J. A., Callejon-Mochon, M., Barragande la Rosa, F. J., Talanta 2000, 52, 1149–1156.
[28] Renew, J. E., Huang, C. H., J. Chromatogr. A 2004, 1042,113–121.
[29] Carceles, C. M., Villamayor, L., Escudero, E., Marın, P.,Fernandez-Varon, E., Vet. J. 2007, 173, 452–455.
[30] Lee, H. B., Peart, T. E., Svoboda, M. L., J. Chromatogr. A2007, 1139, 45–52.
[31] Peng, X., Tan, J., Tang, C., Yu, Y., Wang, Z., Environ.Toxicol. Chem. 2008, 27, 73–79.
[32] Pena, A., Chmielova, D., Lino, C. M., Solich, P., J. Sep.Sci. 2007, 30, 2924–2928.
[33] Miao, X. S., Bishay, F., Chen, M., Metcalfe, C. D.,Environ. Sci. Technol. 2004, 38, 3533–3541.
[34] Prat, M. D., Benito, J., Compano, R., Hernandez-Arte-seros, J. A., Granados, M., J. Chromatogr. A 2004, 1041,27–33.
[35] Senta, I., Terzic, S., Ahel, M., Chromatographia 2008, 68,747–758.
[36] Ye, Z., Weinberg, H. S., Anal. Chem. 2007, 79,1135–1144.
[37] Sturini, M., Speltini, A., Pretali, L., Fasani, E., Profumo,A., J. Sep. Sci. 2009, 32, 3020–3028.
[38] Golet, E. M., Alder, A. C., Hartmann, A., Ternes, T. A.,Giger, W., Anal. Chem. 2001, 73, 3632–3638.
[39] Nakata, H., Kannan, K., Jones, P. D., Giesy, J. P.,Chemosphere 2005, 58, 759–766.
[40] Andreozzi, R., Raffaele, M., Nicklas, P., Chemosphere2003, 50, 1319–1330.
[41] Calamari, D., Zuccato, E., Castiglioni, S., Bagnati, R.,Fanelli, R., Environ. Sci. Technol. 2003, 37, 1241–1248.
[42] Kasprzyk-Hordern, B., Dinsdale, R. M., Guwy, A. J., J.Chromatogr. A 2007, 1161, 132–145.
[43] Castiglioni, S., Bagnati, R., Calamari, D., Fanelli, R.,Zuccato, E., J. Chromatogr. A 2005, 1092, 206–215.
[44] Shi, L., Zhou, F., Zhang, Y. L., Gu, G. W., Water Sci.Technol. 2009, 59, 805–813.
[45] Seifrtova, M., Pena, A., Lino, C. M., Solich, P., Anal.Bioanal. Chem. 2008, 391, 799–805.
[46] Ferdig, M., Kaleta, A., Vo, T. D. T., Buchberger, W., J.Chromatogr. A 2004, 1047, 305–311.
J. Sep. Sci. 2010, 33, 1115–11311130 A. Speltini et al.
& 2010 WILEY-VCH Verlag GmbH & Co. KGaA, Weinheim www.jss-journal.com

[47] Vieno, N. M., Tuhkanen, T., Kronberg, L., J. Chroma-togr. A 2006, 134, 101–111.
[48] Christian, T., Schneider, R. J., Farber, H. A., Skutlarek,D., Meyer, M. T., Goldbach, H. E., Acta Hydrochim.Hydrobiol. 2003, 31, 36–44.
[49] Ferdig, M., Kaleta, A., Buchberger, W., J. Sep. Sci. 2005,28, 1448–1456.
[50] Zorita, S., Larsson, L., Mathiasson, L., J. Sep. Sci. 2008,31, 3117–3121.
[51] Jacobsen, A. M., Halling-Sørensen, B., Ingerslev, F.,Honore Hansen, S., J. Chromatogr. A 2004, 1038,157–170.
[52] GeiX, S., Gebert, S., Acta Hydrochim. Hydrobiol. 2006,34, 464–473.
[53] Benito-Pena, E., Urraca, J. L., Sellergren, B., Moreno-Bondi, M. C., J. Chromatogr. A 2008, 1208, 62–70.
[54] Montesdeoca Esponda, S., Torres Padron, M. E., SosaFerrera, Z., Santana Rodrıguez, J. J., Anal. Bioanal.Chem. 2009, 394, 927–935.
[55] Mitani, K., Kataoka, H., Anal. Chim. Acta 2006, 562,16–22.
[56] Kumar, A., Kumar Malik, A., Kumar Tewary, D., Singh,B., J. Sep. Sci. 2008, 31, 294–300.
[57] Petrovic, M., Gros, M., Barcelo, D., J. Chromatogr. A2006, 1124, 68–81.
[58] McCourt, J., Bordin, G., Rodrıguez, A. R., J. Chroma-togr. A 2003, 990, 259–269.
[59] Pozo, O. J., Guerrero, C., Sancho, J. V., Ibanez, M.,Pitarch, E., Hogendoorn, E., Hernandez, F., J. Chroma-togr. A 2006, 1103, 83–93.
[60] Golet, E., Xifra, I., Siegrist, H., Alder, A., Giger, W.,Environ. Sci. Technol. 2003, 37, 3243–3249.
J. Sep. Sci. 2010, 33, 1115–1131 Sample Preparation 1131
& 2010 WILEY-VCH Verlag GmbH & Co. KGaA, Weinheim www.jss-journal.com