flour biscut feasibility study
TRANSCRIPT

1
A
L
E
M
G
E
N
A
LOCATED AT ALEMGENA TOWN
Table of Contents
1. PROJECT DESCRIPTION.................................................................5
1.1 PROJECT LOCATION....................................................................5
1.2 PROJECT RATIONALE...................................................................6
1.3 PROJECT STATUS......................................................................6
1.4 PROJECT IMPLEMENTATION SCHEDULE.....................................................7
1.5 BENEFITS OF THE PROJECT.............................................................7
2. PROMOTER’S BACKGROUND...............................................................8
3. PRODUCT DEFINITION..................................................................8
2
4. PROJECT MANAGEMENT AND HUMAN RESOURCE..............................................10
4.1 PROJECT MANAGEMENT.................................................................10
4.2 HUMAN RESOURCE REQUIREMENT.........................................................10
4.3 TRAINING REQUIREMENT...............................................................11
5 MARKET ANALYSIS....................................................................12
5.1 WHY AGRO-PROCESSING IS CRITICAL TO THE ETHIOPIAN ECONOMY?..........................12
5.2 SUPPLY.............................................................................12
5.3 DEMAND.............................................................................15
5.4 DEMAND AND SUPPLY GAP..............................................................16
5.5 MARKETING STRATEGY.................................................................16
5.6 PRICE..............................................................................16
6 TECHNICAL STUDIES..................................................................19
6.1 RAW MATERIAL AND INPUTS............................................................19
6.2 PRODUCTION PROCESS.................................................................21
6.3 CIVIL WORKS........................................................................23
6.4 PRODUCTION MACHINERY...............................................................23
6.5 VEHICLES...........................................................................24
6.6 OFFICE EQUIPMENT AND FURNITURE....................................................24
6.7 UTILITY SUPPLY.....................................................................25
6.8 ENVIRONMENTAL IMPACT ASSESSMENT....................................................26
7 FINANCIAL APPRAISAL................................................................27
7.1 INITIAL INVESTMENT COST............................................................27
3
7.2 FINANCING STRUCTURE................................................................27
7.3 APPLIED FINANCIAL ASSUMPTIONS:.....................................................28
7.4 WORKING CAPITAL....................................................................28
7.5 OPERATING COST, VOLUME AND REVENUE................................................29
7.5.1 OPERATING COST................................................................29
7.5.2 PRODUCTION VOLUME AND REVENUE.................................................30
7.6 PROJECT PROFITABILITY..............................................................31
7.7 PROJECT LIQUIDITY AND PAYBACK PERIOD...............................................32
7.8 NPV & IRR..........................................................................33
7.9 SENSITIVITY TO COST AND REVENUE VARIATIONS.........................................34
7.10 DEBT SERVICING SCHEDULE............................................................35
Executive SummaryThe prevailing project is food complex that produces wheat flour
and biscuit in an integrated way. Food processing is among the
oldest of Ethiopia’s manufacturing industries. Currently, the food
complex processing industry employed about 26% of all employees in
the manufacturing sector. The food processing industry can be
broken into eight major subsectors: one of these categories is the
wheat-based products manufacturing which is the subject matter of
this feasibility study.
The project promoter, with trade name of ‘Rodis Enriched Food
processing and flour mill’ is a sole proprietorship business owned
4
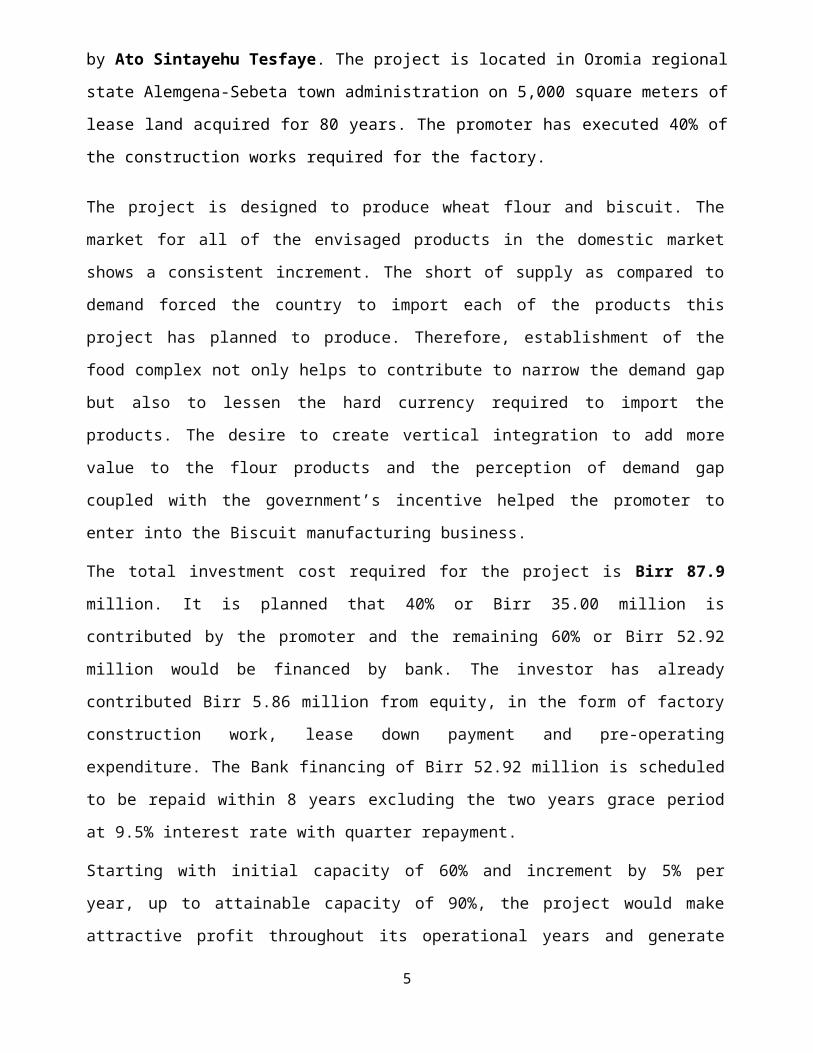
by Ato Sintayehu Tesfaye. The project is located in Oromia regional
state Alemgena-Sebeta town administration on 5,000 square meters of
lease land acquired for 80 years. The promoter has executed 40% of
the construction works required for the factory.
The project is designed to produce wheat flour and biscuit. The
market for all of the envisaged products in the domestic market
shows a consistent increment. The short of supply as compared to
demand forced the country to import each of the products this
project has planned to produce. Therefore, establishment of the
food complex not only helps to contribute to narrow the demand gap
but also to lessen the hard currency required to import the
products. The desire to create vertical integration to add more
value to the flour products and the perception of demand gap
coupled with the government’s incentive helped the promoter to
enter into the Biscuit manufacturing business.
The total investment cost required for the project is Birr 87.9
million. It is planned that 40% or Birr 35.00 million is
contributed by the promoter and the remaining 60% or Birr 52.92
million would be financed by bank. The investor has already
contributed Birr 5.86 million from equity, in the form of factory
construction work, lease down payment and pre-operating
expenditure. The Bank financing of Birr 52.92 million is scheduled
to be repaid within 8 years excluding the two years grace period
at 9.5% interest rate with quarter repayment.
Starting with initial capacity of 60% and increment by 5% per
year, up to attainable capacity of 90%, the project would make
attractive profit throughout its operational years and generate
5
positive net cash inflows. Within its assumed 10 years life it
would return more than 53% of IRR and more than Birr 241 million
net present value.
Establishment of the food complex factory is a contribution to the
country’s real GDP as it has positive impact in fixed asset
generation and output quantity increments. Apart from creating
employment opportunity for the domestic labor, the project would
reduce hard currency outlay.
The realization of the project as ascertained in the financial
appraisal result enables the promoter to generate higher net
benefits, employment benefit to domestic labor, indirect
employment for input suppliers, tax revenue benefit and import
substitution effect on saving hard currency. These parameters are
basic indications of the projects social desirability and economic
feasibility. Therefore, it is advisable to finance it either with
equity or with debt or in a combination of both.
1. PROJECT DESCRIPTIONThe envisaged project is an integrated manufacturing of food
complex. The factory produces Wheat Flour and Biscuit by processing
raw wheat. The installed plant capacity of wheat flour is 30,000
and Biscuit 3,600 tons per year, respectively. 89% of the wheat
flour manufactured in the factory shall be sold in the local
market, while the remaining 11% will be used for the production of
biscuit. The percentage proportion is determined based on the
production capacity of the biscuit production machinery.
1.1 Project Location
6
The food complex plant is located in Alemgena town. Alemgena is
located about 20 Kilometer South West of Addis Ababa on the Main
Road from Addis Ababa to Djima. While selecting location for such
food complex factory; availability of raw material, adequate
storage and operation space, water and power supply, market outlet
for finished products and availability of labor are among the major
factors to be considered. The town is the host of other labor-
intensive factories due to its preferable attribute and proximity
to the capital Addis Ababa.
1.2 Project Rationale
Food item is a commodity; its demand exists whenever human being
exists. The demand increases as population increases disregarding
preference of consumers over the type of feeds and their catering
culture. Wheat flour based products such as biscuit are among the
well-known and commonly available products in the Ethiopian Market.
Food self-sufficiency is one of the prime objectives of the
country. Labor intensive agro processing industries play
significant role in absorbing the large labor force and thus
contribute their share to the food self sufficiency move. The
Agricultural products like wheat and the semi processed flour shall
be traded in a vertically integrated marketing methodology in order
to ensure better wage to the farmer and more value adding produces
that preferably involve many labor to deploy the cheap labor force
of the country in productive sectors. The industry is a distinct
sector of the economy, which makes its direct contributions to the
enhancement of social well being of productive citizens.7
Apart from its attractive return, existence of stable demand and
employment generation as well as tax revenue to the government,
establishment of such agro processing industry is a good
opportunity to the grain market stimulation and thus to the
framers. It is rationale, therefore, to involve into an activity
that helps to tap the well-known business opportunity.
1.3 Project Status
The existing investment is begun after signing of the lease
contract with Oromiya Regional Government in the year 2003 E.C
aiming to establish Food complex factory. So far the project owner
has invested about Birr 5.8 million on the existing project. Among
others, the following are the major investments made within the
project compound.
Civil Works 40% of the civil works for the factory have been accomplished
Machinery All required production machinery is being selected.
Vehicles, Equipment and Furniture
Vehicles, equipments and furniture are not purchased.
Raw Materials
The major raw materials are wheat and packaging materials.Communication with suppliers is underway.
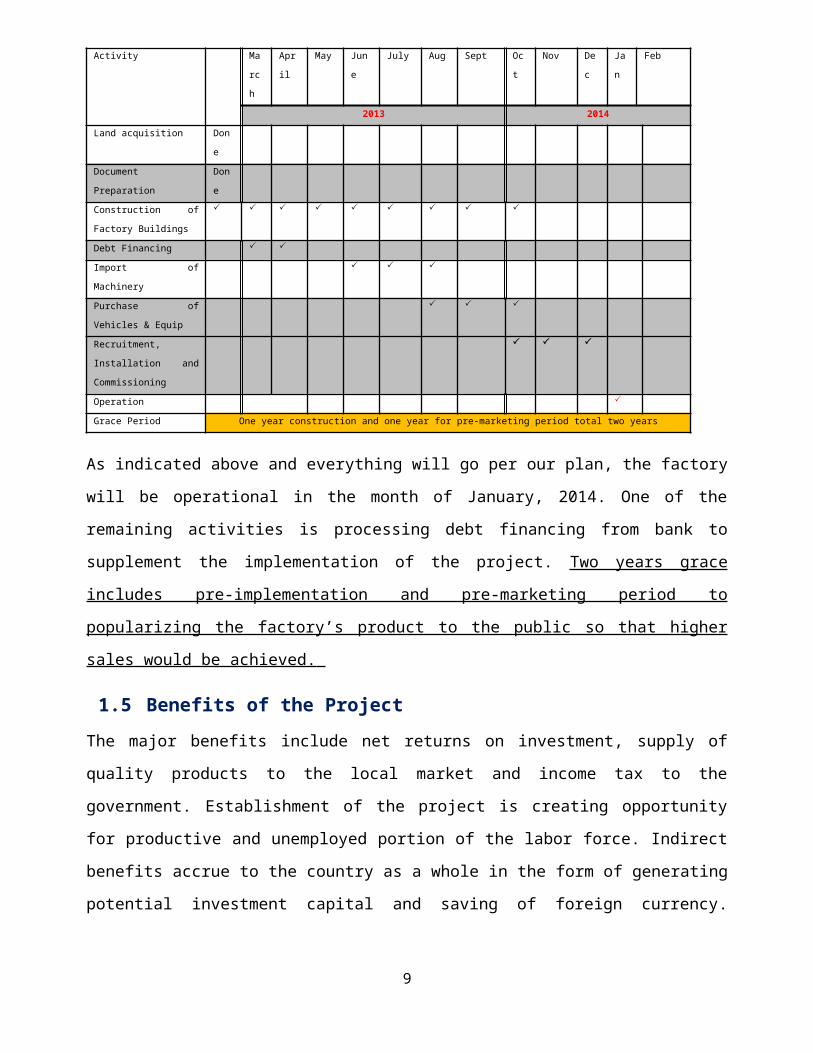
1.4 Project Implementation ScheduleThe following chart shows major activities to be done during the
implementation period.8
Activity Ma
rc
h
Apr
il
May Jun
e
July Aug Sept Oc
t
Nov De
c
Ja
n
Feb
2013 2014
Land acquisition Don
e
Document
Preparation
Don
e
Construction of
Factory Buildings
Debt Financing
Import of
Machinery
Purchase of
Vehicles & Equip
Recruitment,
Installation and
Commissioning
Operation
Grace Period One year construction and one year for pre-marketing period total two years
As indicated above and everything will go per our plan, the factory
will be operational in the month of January, 2014. One of the
remaining activities is processing debt financing from bank to
supplement the implementation of the project. Two years grace
includes pre-implementation and pre-marketing period to
popularizing the factory’s product to the public so that higher
sales would be achieved.
1.5 Benefits of the ProjectThe major benefits include net returns on investment, supply of
quality products to the local market and income tax to the
government. Establishment of the project is creating opportunity
for productive and unemployed portion of the labor force. Indirect
benefits accrue to the country as a whole in the form of generating
potential investment capital and saving of foreign currency.
9
Experience of this project may be extended to the grain market by
creating market the agricultural produce.
2. PROMOTER’s BACKGROUND
Ato Sintayehu is very experienced business man who has been in
business for the last 16 years starting from salesman position at
B.S.T Plastic Industry to his current position general manager and
co-owner of sintu trading PLC and Bekalus General Trading PLC.
Sintu Trading PLC has been engaged in importing and distributing
plastic raw materials since 1999EC and Bekalus General Trading PLC
has been engaged in manufacturing of house hold plastic goods since
2001EC. Ato Sintayehu run his business in Merkato and expanded the
size and volume of it to reach the current Sintu Trading PLC and
Bekalus General Trading PLC and also to the captioned Project,
RODIS ENRICHED FOOD PROCESSING AND FLOUR MILL. He is young
business man who thoroughly studied all the end to end production
and marketing process and already started implementation of the
project and also has accomplished more than 40% of the building.
3. PRODUCT DEFINITION
Wheat flourIt is a powder made from the grinding of wheat used for human
consumption. More wheat flour is produced than any other flour. In terms
of the parts of the grain (the grass fruit) used in flour—the endosperm
or protein/starchy part, the germ or protein/fat/vitamin-rich part, and
the bran or fibre part—there are three general types of flours. White
flour is made from the endosperm only. Whole grain or whole meal flour is
10
made from the entire grain, including bran, endosperm and germ. Germ
flour is made from the endosperm and germ, excluding the bran. The
project planned to produce germ flour type.
Biscuits
A small, flat cake that is dry and usually sweet. Biscuit is a
family of candy group, which is largely, consumed by children and
teenagers. Biscuits can be savory, sweet, plain-baked, filled, or
coated (or a mixture of several of these options). Some biscuits
supply special dietary needs such as those for high fiber protein
or external vitamins. Biscuit also contain fat and often sugar and
are cut or molded into layers and baked rapidly thoroughly. When
they packed with moisture proof material, they can have long shelf
life.
4. GTP plan
The agro-processing industry sector is one of the emphases areas of
the GTP plan aiming to increase the capacity utilization of the
industries to 90% at the end of the GTP plan 2014/15 from 60% in
the year 2009/10.
In achieving this target the government has also set a plan to
increase the productivity of in industrial crop which are the main
inputs like wheat to 1,174.70 metric tons in the year 2014/15 from
629.7 metric ton in the year 2009/10 used as a base period. This
simply shows that the project is one of the government emphasis
areas to meet the ultimate goal of food sufficiency; otherwise the
11
GTP plan has left only one and half year period which may be short
as we compared with the project life of 10 years. The following two
tables of extract from the GTP plan portray the above facts.
5. PROJECT MANAGEMENT AND HUMAN RESOURCE
5.1. Project Management
The technical aspect of Wheat flour and biscuit production is a
well-known profession in the Ethiopian food-processing sector. As a
result, qualified professionals are available in the market hence;
all the technical, marketing, finance & Administration and
Production functions are supervised and managed by Ethiopians. The12
owner is also member of the top management group of the factory and
other qualified professionals assume the Production, Marketing &
Procurement as well as Finance & Administration functions.
The would be organizational structure of the factory is as shownbelow:-
5.2. Human Resource RequirementA total number of 300 permanent local employees are projected for
the managerial, professional, technical, and non-professional posts
of the project. The 20% staff benefit includes, 8% pension,
transportation and other benefits. Monthly and annual salary
expense is Birr 650,400 and Birr 7,804,800, respectively. The
detail including the salary expense is shown in the following
table.
Position No. of posts Monthly Pay Monthly Salary Expense Annual PayGeneral Manager 1 10,000 10,000 120,000
13
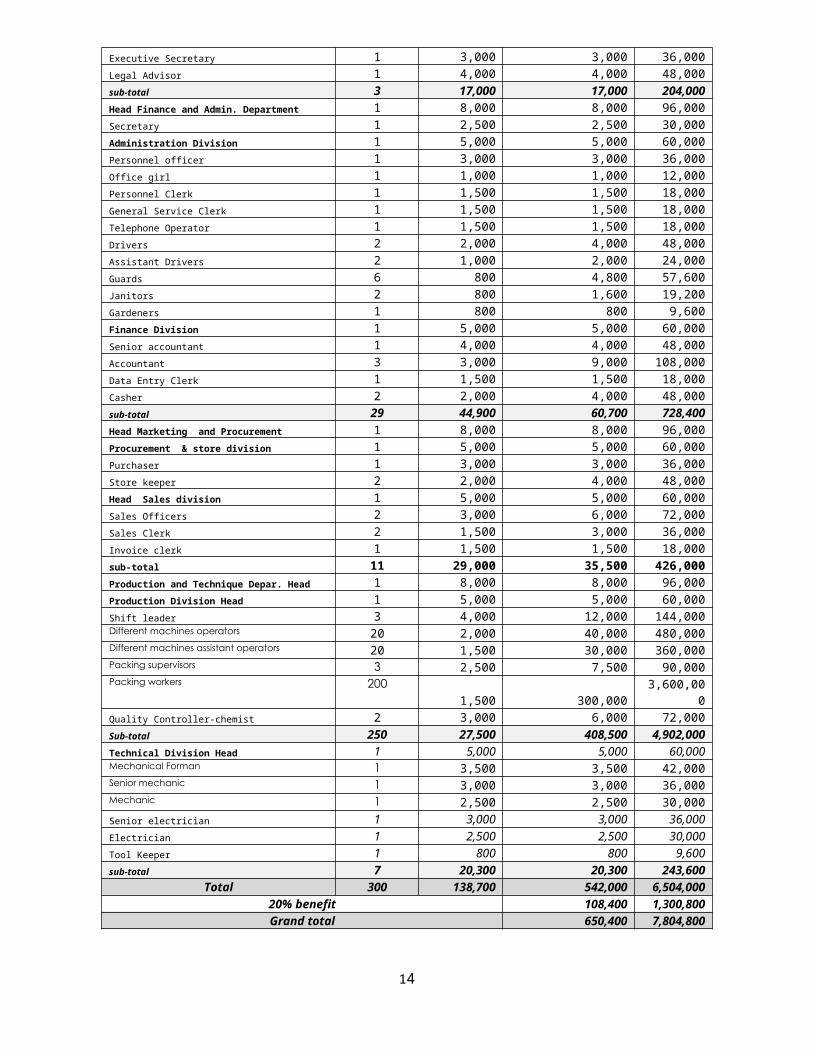
Executive Secretary 1 3,000 3,000 36,000Legal Advisor 1 4,000 4,000 48,000sub-total 3 17,000 17,000 204,000Head Finance and Admin. Department 1 8,000 8,000 96,000Secretary 1 2,500 2,500 30,000Administration Division 1 5,000 5,000 60,000Personnel officer 1 3,000 3,000 36,000Office girl 1 1,000 1,000 12,000Personnel Clerk 1 1,500 1,500 18,000General Service Clerk 1 1,500 1,500 18,000Telephone Operator 1 1,500 1,500 18,000Drivers 2 2,000 4,000 48,000Assistant Drivers 2 1,000 2,000 24,000Guards 6 800 4,800 57,600Janitors 2 800 1,600 19,200Gardeners 1 800 800 9,600Finance Division 1 5,000 5,000 60,000Senior accountant 1 4,000 4,000 48,000Accountant 3 3,000 9,000 108,000Data Entry Clerk 1 1,500 1,500 18,000Casher 2 2,000 4,000 48,000sub-total 29 44,900 60,700 728,400Head Marketing and Procurement 1 8,000 8,000 96,000Procurement & store division 1 5,000 5,000 60,000Purchaser 1 3,000 3,000 36,000Store keeper 2 2,000 4,000 48,000Head Sales division 1 5,000 5,000 60,000Sales Officers 2 3,000 6,000 72,000Sales Clerk 2 1,500 3,000 36,000Invoice clerk 1 1,500 1,500 18,000sub-total 11 29,000 35,500 426,000Production and Technique Depar. Head 1 8,000 8,000 96,000Production Division Head 1 5,000 5,000 60,000Shift leader 3 4,000 12,000 144,000Different machines operators 20 2,000 40,000 480,000Different machines assistant operators 20 1,500 30,000 360,000Packing supervisors 3 2,500 7,500 90,000Packing workers 200
1,500 300,0003,600,00
0Quality Controller-chemist 2 3,000 6,000 72,000Sub-total 250 27,500 408,500 4,902,000Technical Division Head 1 5,000 5,000 60,000Mechanical Forman 1 3,500 3,500 42,000Senior mechanic 1 3,000 3,000 36,000Mechanic 1 2,500 2,500 30,000Senior electrician 1 3,000 3,000 36,000Electrician 1 2,500 2,500 30,000Tool Keeper 1 800 800 9,600sub-total 7 20,300 20,300 243,600
Total 300 138,700 542,000 6,504,00020% benefit 108,400 1,300,800Grand total 650,400 7,804,800
14
Training RequirementTraining shall be carried out during plant erection and
commissioning by machinery supplier. The training and erecting
period is scheduled to be for 90 days. The cost of installation and
training cost is included in the cost of production machinery.
6. MARKET ANALYSIS
6.1. Why agro-processing is critical to the Ethiopian
Economy?It is obvious that Ethiopia, which depends on agriculture of nearly
half of its GDP should give top priority to the development of its
agricultural sector. To this effect, the government has adopted an
Agricultural-Development Led Industrialization (ADLI) strategy to
ensure sustainable agricultural production for food self reliance
and promote industrialization. The rigorous implementation of the
ADLI strategy is recognized to result in surplus production of
agricultural products. Rather than exporting surplus primary
products such as cereals, pulses, oilseeds and fresh produce,
Ethiopia will increasingly realize the benefits of exporting
processed foods that add value to primary agricultural products.
Therefore, the prospects for expansion of the food processing sub-
sector are considerable. Food processing factories of cereals,
oilseeds, pulses, sugarcane, vegetables, fruits, meat, dairy
products and spices are expected to be established in large
numbers. In all, agro-industry in general and food processing in
particular will play an increasingly important role in the
Ethiopian economy.
15
In order to be competitive in the market, the Ethiopian food
processing industry should increase the degree of transformation of
primary agricultural products and improve upon the quality of food
packaging. Therefore, use of modern technology will be very
critical element in food processing and packaging. In this
connection, market access, management knows how and transfer of
technology would take up most.
Given the large agricultural resources potential of the country and
relatively under developed status of the manufacturing sector, the
Ethiopian Government should as part of its ADLI strategy, initially
focus on the development of the country’s agro-industry, especially
the food processing industry, both for the export and the domestic
markets. The domestic market is important because growth in income
of the general population, combined with increased urbanization,
will in time translate into increased domestic demand for processed
foods.
6.2. Supply
The food processing industry in Ethiopia consists of three scale-
based classes; the dominant core, which consists of large-scale
manufacturers producing well-known brands account for a significant
share of the market when it comes to packaged foods such as
biscuits and pasta/macaroni. The second & third class is the
competitive fringe consisting of medium and small scale enterprises
that collectively account for a larger share of the market for
unbranded, staple (commodity) food items such as flour & bread. The
2012 CSA Manufacturing Business Survey reports the total production
16
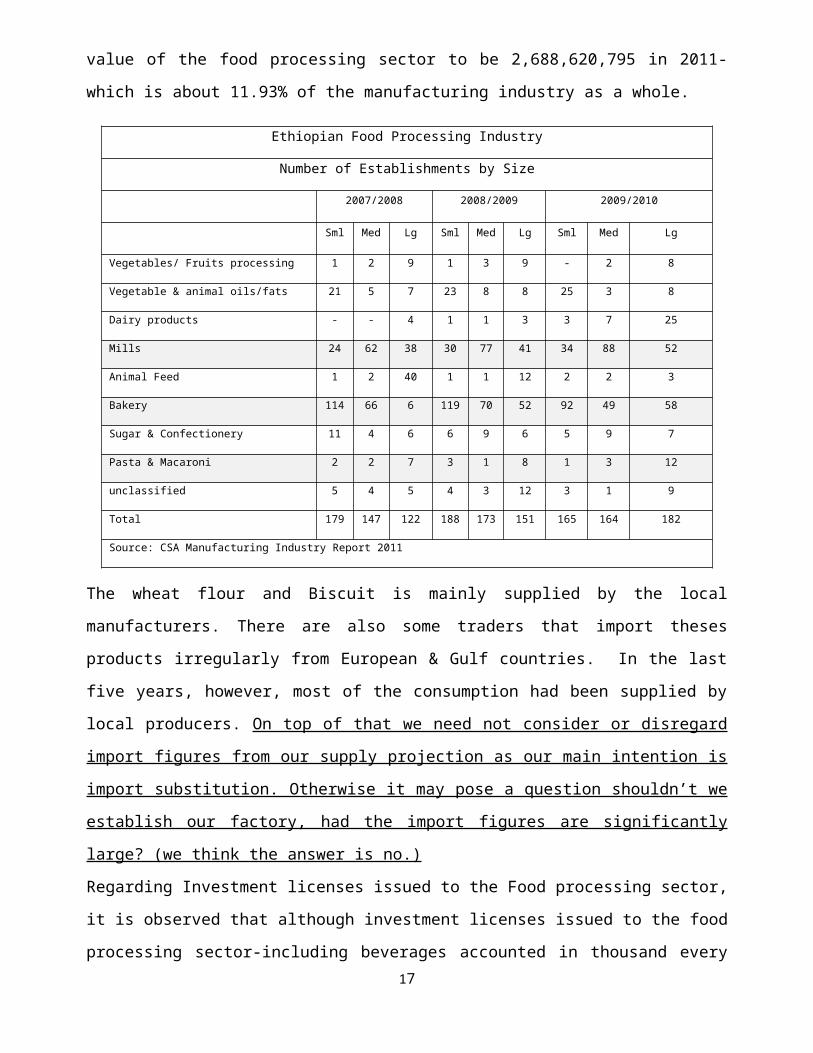
value of the food processing sector to be 2,688,620,795 in 2011-
which is about 11.93% of the manufacturing industry as a whole.
Ethiopian Food Processing Industry
Number of Establishments by Size
2007/2008 2008/2009 2009/2010
Sml Med Lg Sml Med Lg Sml Med Lg
Vegetables/ Fruits processing 1 2 9 1 3 9 - 2 8
Vegetable & animal oils/fats 21 5 7 23 8 8 25 3 8
Dairy products - - 4 1 1 3 3 7 25
Mills 24 62 38 30 77 41 34 88 52
Animal Feed 1 2 40 1 1 12 2 2 3
Bakery 114 66 6 119 70 52 92 49 58
Sugar & Confectionery 11 4 6 6 9 6 5 9 7
Pasta & Macaroni 2 2 7 3 1 8 1 3 12
unclassified 5 4 5 4 3 12 3 1 9
Total 179 147 122 188 173 151 165 164 182
Source: CSA Manufacturing Industry Report 2011
The wheat flour and Biscuit is mainly supplied by the local
manufacturers. There are also some traders that import theses
products irregularly from European & Gulf countries. In the last
five years, however, most of the consumption had been supplied by
local producers. On top of that we need not consider or disregard
import figures from our supply projection as our main intention is
import substitution. Otherwise it may pose a question shouldn’t we
establish our factory, had the import figures are significantly
large? (we think the answer is no.)
Regarding Investment licenses issued to the Food processing sector,
it is observed that although investment licenses issued to the food
processing sector-including beverages accounted in thousand every17
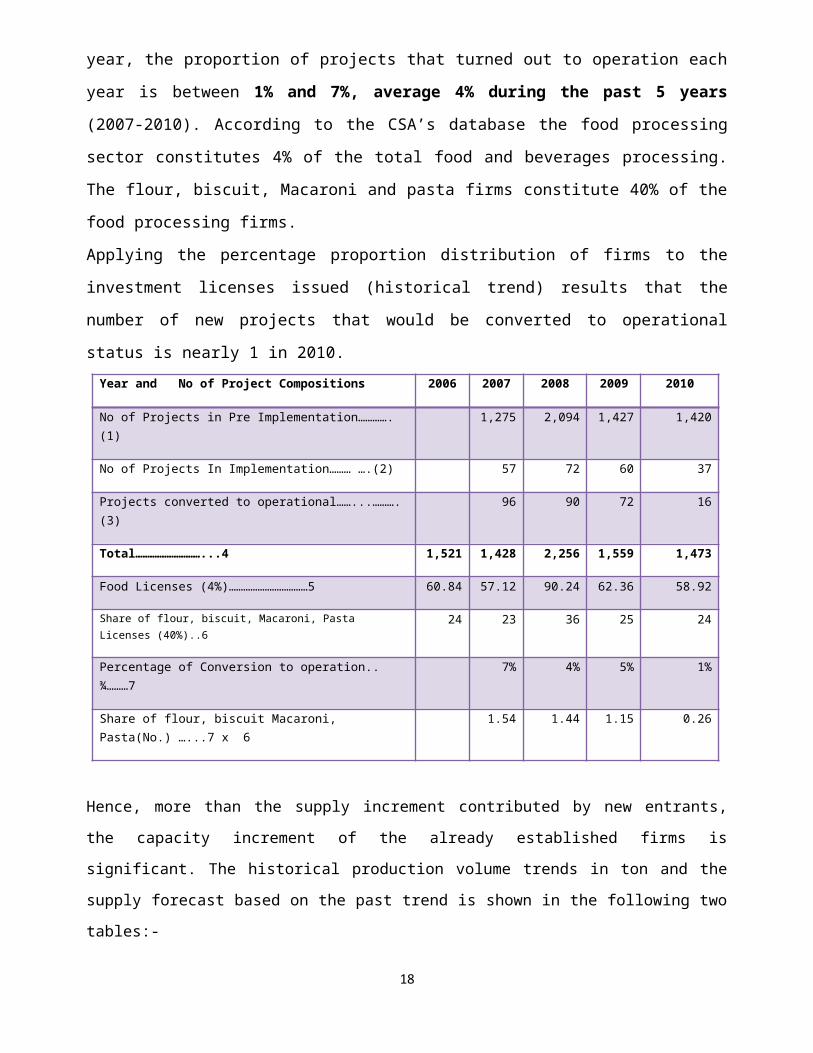
year, the proportion of projects that turned out to operation each
year is between 1% and 7%, average 4% during the past 5 years
(2007-2010). According to the CSA’s database the food processing
sector constitutes 4% of the total food and beverages processing.
The flour, biscuit, Macaroni and pasta firms constitute 40% of the
food processing firms.
Applying the percentage proportion distribution of firms to the
investment licenses issued (historical trend) results that the
number of new projects that would be converted to operational
status is nearly 1 in 2010.Year and No of Project Compositions 2006 2007 2008 2009 2010
No of Projects in Pre Implementation…………. (1)
1,275 2,094 1,427 1,420
No of Projects In Implementation……… ….(2) 57 72 60 37
Projects converted to operational……...……….(3)
96 90 72 16
Total………………………...4 1,521 1,428 2,256 1,559 1,473
Food Licenses (4%)……………………………5 60.84 57.12 90.24 62.36 58.92
Share of flour, biscuit, Macaroni, Pasta Licenses (40%)..6
24 23 36 25 24
Percentage of Conversion to operation.. ¾………7
7% 4% 5% 1%
Share of flour, biscuit Macaroni, Pasta(No.) …...7 x 6
1.54 1.44 1.15 0.26
Hence, more than the supply increment contributed by new entrants,
the capacity increment of the already established firms is
significant. The historical production volume trends in ton and the
supply forecast based on the past trend is shown in the following two
tables:-
18
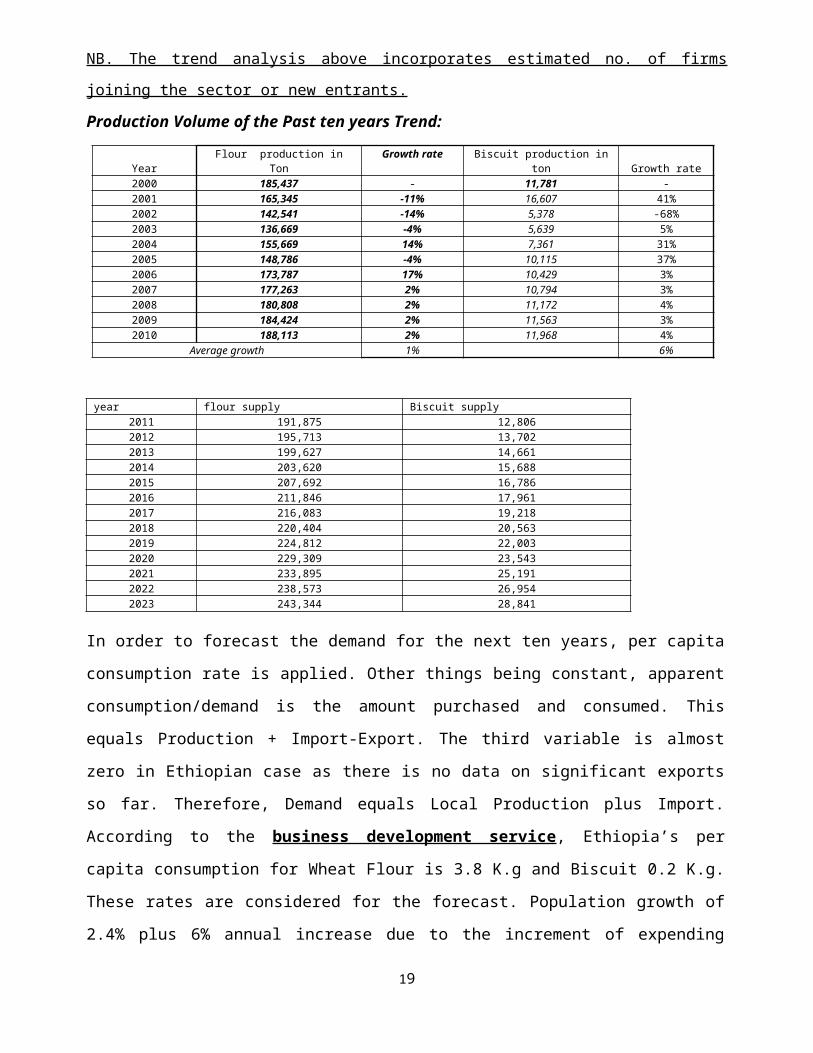
NB. The trend analysis above incorporates estimated no. of firms
joining the sector or new entrants.
Production Volume of the Past ten years Trend:
YearFlour production in
TonGrowth rate Biscuit production in
ton Growth rate2000 185,437 - 11,781 -2001 165,345 -11% 16,607 41%2002 142,541 -14% 5,378 -68%2003 136,669 -4% 5,639 5%2004 155,669 14% 7,361 31%2005 148,786 -4% 10,115 37%2006 173,787 17% 10,429 3%2007 177,263 2% 10,794 3%2008 180,808 2% 11,172 4%2009 184,424 2% 11,563 3%2010 188,113 2% 11,968 4%
Average growth 1% 6%
year flour supply Biscuit supply2011 191,875 12,8062012 195,713 13,7022013 199,627 14,6612014 203,620 15,6882015 207,692 16,7862016 211,846 17,9612017 216,083 19,2182018 220,404 20,5632019 224,812 22,0032020 229,309 23,5432021 233,895 25,1912022 238,573 26,9542023 243,344 28,841
In order to forecast the demand for the next ten years, per capita
consumption rate is applied. Other things being constant, apparent
consumption/demand is the amount purchased and consumed. This
equals Production + Import-Export. The third variable is almost
zero in Ethiopian case as there is no data on significant exports
so far. Therefore, Demand equals Local Production plus Import.
According to the business development service, Ethiopia’s per
capita consumption for Wheat Flour is 3.8 K.g and Biscuit 0.2 K.g.
These rates are considered for the forecast. Population growth of
2.4% plus 6% annual increase due to the increment of expending
19
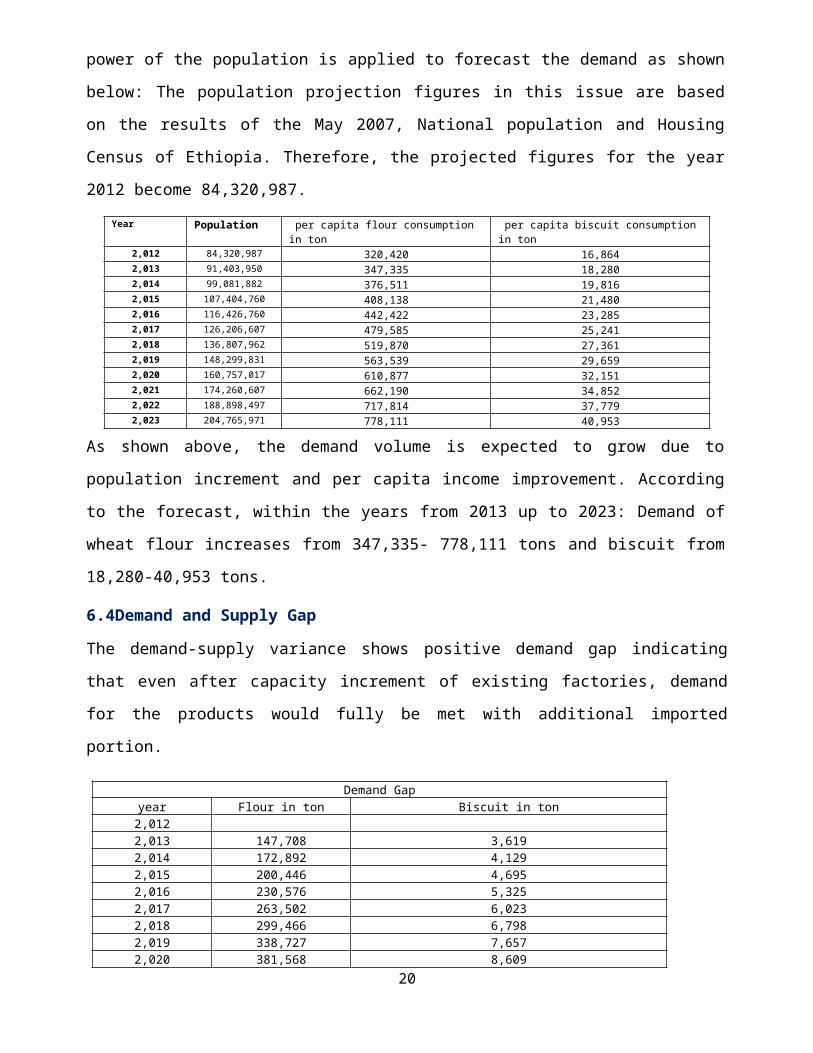
power of the population is applied to forecast the demand as shown
below: The population projection figures in this issue are based
on the results of the May 2007, National population and Housing
Census of Ethiopia. Therefore, the projected figures for the year
2012 become 84,320,987.Year Population per capita flour consumption
in ton per capita biscuit consumption in ton
2,012 84,320,987 320,420 16,8642,013 91,403,950 347,335 18,2802,014 99,081,882 376,511 19,8162,015 107,404,760 408,138 21,4802,016 116,426,760 442,422 23,2852,017 126,206,607 479,585 25,2412,018 136,807,962 519,870 27,3612,019 148,299,831 563,539 29,6592,020 160,757,017 610,877 32,1512,021 174,260,607 662,190 34,8522,022 188,898,497 717,814 37,7792,023 204,765,971 778,111 40,953
As shown above, the demand volume is expected to grow due to
population increment and per capita income improvement. According
to the forecast, within the years from 2013 up to 2023: Demand of
wheat flour increases from 347,335- 778,111 tons and biscuit from
18,280-40,953 tons.
6.4Demand and Supply Gap
The demand-supply variance shows positive demand gap indicating
that even after capacity increment of existing factories, demand
for the products would fully be met with additional imported
portion.
Demand Gapyear Flour in ton Biscuit in ton2,0122,013 147,708 3,6192,014 172,892 4,1292,015 200,446 4,6952,016 230,576 5,3252,017 263,502 6,0232,018 299,466 6,7982,019 338,727 7,6572,020 381,568 8,609
20
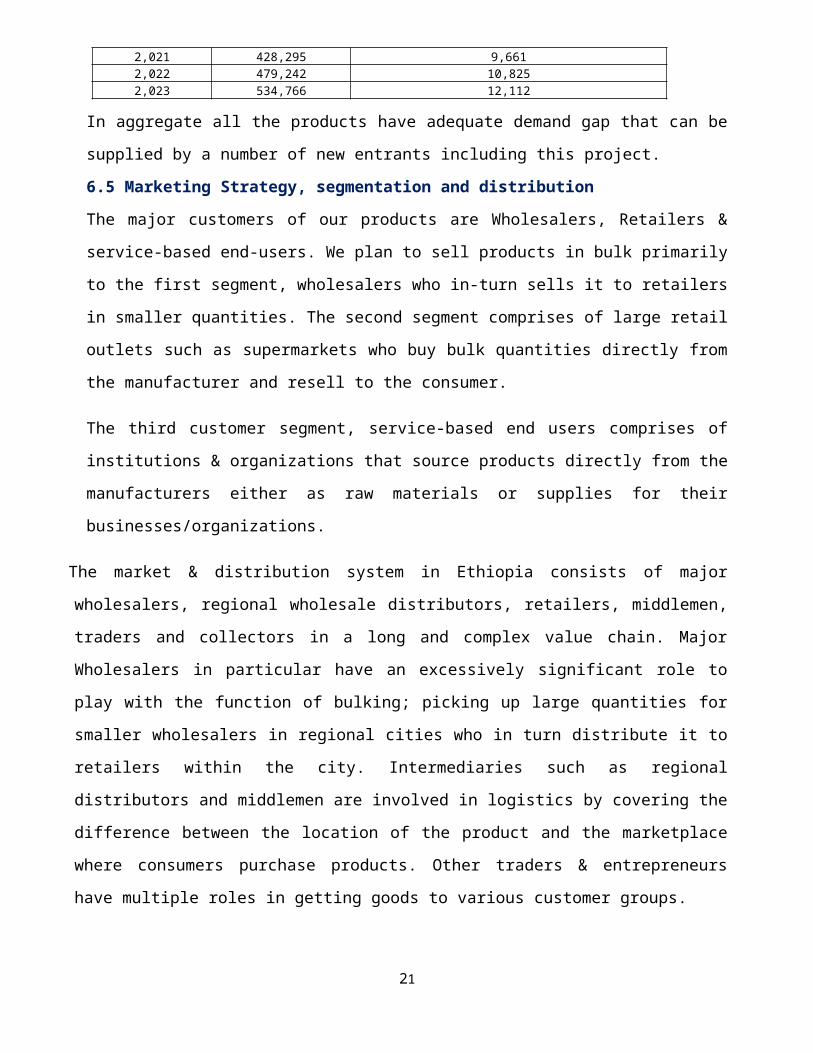
2,021 428,295 9,6612,022 479,242 10,8252,023 534,766 12,112
In aggregate all the products have adequate demand gap that can be
supplied by a number of new entrants including this project.
6.5 Marketing Strategy, segmentation and distribution
The major customers of our products are Wholesalers, Retailers &
service-based end-users. We plan to sell products in bulk primarily
to the first segment, wholesalers who in-turn sells it to retailers
in smaller quantities. The second segment comprises of large retail
outlets such as supermarkets who buy bulk quantities directly from
the manufacturer and resell to the consumer.
The third customer segment, service-based end users comprises of
institutions & organizations that source products directly from the
manufacturers either as raw materials or supplies for their
businesses/organizations.
The market & distribution system in Ethiopia consists of major
wholesalers, regional wholesale distributors, retailers, middlemen,
traders and collectors in a long and complex value chain. Major
Wholesalers in particular have an excessively significant role to
play with the function of bulking; picking up large quantities for
smaller wholesalers in regional cities who in turn distribute it to
retailers within the city. Intermediaries such as regional
distributors and middlemen are involved in logistics by covering the
difference between the location of the product and the marketplace
where consumers purchase products. Other traders & entrepreneurs
have multiple roles in getting goods to various customer groups.
12
Major Wholesalers are concentrated in Merkato, the wholesale center
of the country. Smaller wholesalers are scattered throughout
regional cities and work in specific territories. The regional
wholesalers seldom buy directly from the manufacturers as they often
distribute a number of goods and merkato is a one-stop destination
for all goods distributed in the Country.
The smaller wholesalers are highly sensitive to price and local
competition so they may or may not carry the same type of products
for a significant period. Thus, Merkato becomes an ideal destination
for the smaller wholesalers as it provides them with variety and
information on price comparisons as well as market intelligence in
terms of the volume of a particular product that has been sold to
their competitors. Using this information, the smaller wholesalers
choose the brands and/or product mix they are willing to take back
to their respective markets. This causes consistent fluctuations in
sales and production schedule for a manufacturer if regular market
intelligence is not conducted. Large-scale food processors have an
advantage to determine price points if they have penetrated the
market well. For this purpose we will use penetration price
strategy.
The development of the retail sector in terms of the emergence
organized businesses with high volume sales and high-traffic
locations etc has fostered a growing direct-to-retailer sales trend
amongst manufacturers. Large-scale manufacturers are now
distributing their products to supermarkets and mini-marts through
door-to-door sales/delivery route system. This system allows the
manufacturer and retailer to earn a higher margin by cutting out the
22
middlemen. Despite the benefits its offers, manufacturers generate
low volume from the route sales system since the addressable
customer size is very small. The majority of the Country’s retailers
are inaccessible neighborhood kiosks with low-volume sales. Thus,
the Merkato-wholesale distribution system, although very costly to
local manufacturers is assumed to be the most efficient way to
deliver products making the intermediary group ‘the primary
distribution channel’.
The promoter will use aggressive promotion and product
popularization through use of electronic media especially via TV as
visualizing the product will be more convincing. For the purpose
0.5% of sales are allotted.
6.6.Price Presently there are different types of flours and biscuits in the
market both imported and locally manufactured. Per our market survey
currently, the factory gate price of flour ranges from birr 900-
1,000 and for locally manufactured biscuit it ranges from birr
4,500-5,000 per quintal or 100 kg, respectively. As a penetration
price the average lowest price of birr 900 and birr 4,500 for flour
and biscuit is considered in the analysis. The minimum market price
for the by-product bran is birr 300 per quintal.
6.7Future Prospects
The project has an excellent and promising future since the lifestyle of the consumer base is changing in its favor. The followingfactors are expected to contribute positively to the sustainablegrowth of the food sector in general.
Urbanization:-Increased urbanization results in increased consumer demand for processed food products like wheat flour,
23
bread, pasta &biscuits. Increased number of catering companies, hotels, universities, and Army consumption is also expected to increase.
Urban consumer trends:
Decrease in consumption of home-produced Injera due to the rising prices of Teff.
Wheat bread replace traditional bread More food & drinks consumed outside from home Real income growth due to declining inflation rates Increased employment rates due to robust economic activity.
Other Forces:- Population growth results in overall demand increase
7. TECHNICAL STUDIES
The most important technical considerations for this project is raw
materials type and selection, technology and capacity of plant,
power source, water source, production process and production
support facilities like land and factory buildings. Each of them
is discussed in the subsequent parts.
7.1 Raw material and inputsThe major raw material is wheat. Ethiopia is the largest wheat
producer in sub-Sahara Africa. Wheat production is the fourth
largest production in Ethiopia with 3,075,640 ton in area of 1.5
million hectare in the year 2010.
24
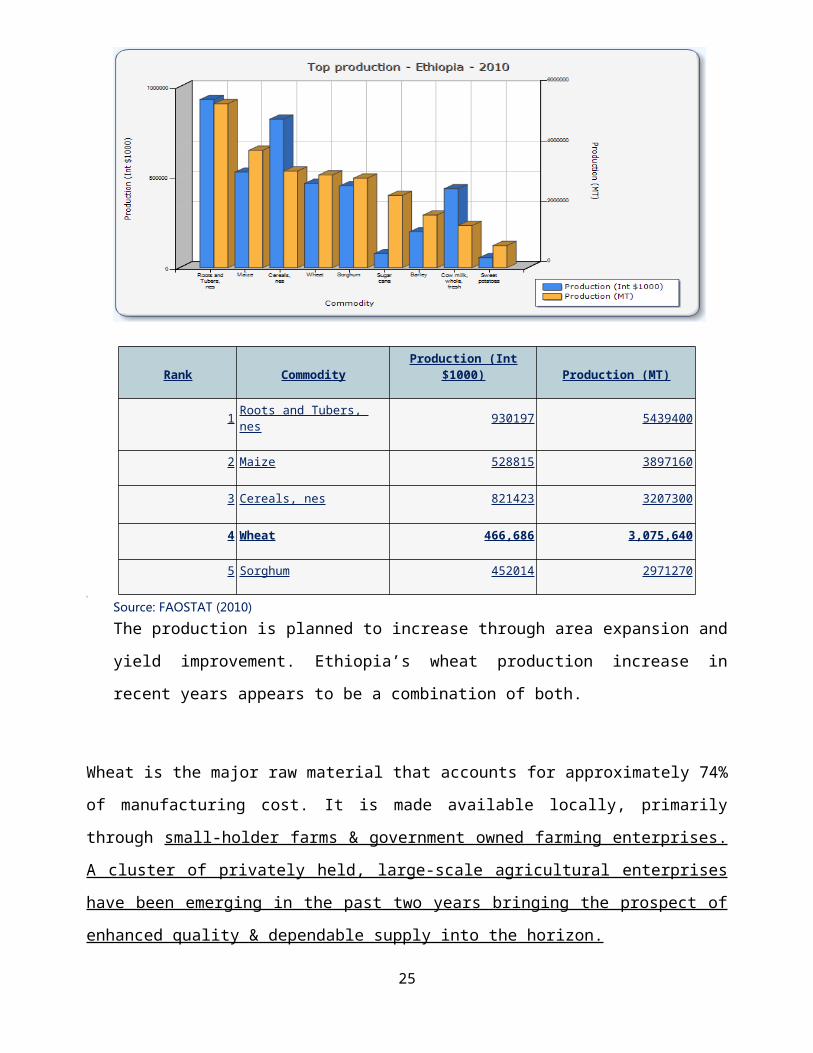
Rank CommodityProduction (Int
$1000) Production (MT)
1 Roots and Tubers, nes 930197 5439400
2 Maize 528815 3897160
3 Cereals, nes 821423 3207300
4 Wheat 466,686 3,075,640
5 Sorghum 452014 29712705
Source: FAOSTAT (2010)
The production is planned to increase through area expansion and
yield improvement. Ethiopia’s wheat production increase in
recent years appears to be a combination of both.
Wheat is the major raw material that accounts for approximately 74%
of manufacturing cost. It is made available locally, primarily
through small-holder farms & government owned farming enterprises.
A cluster of privately held, large-scale agricultural enterprises
have been emerging in the past two years bringing the prospect of
enhanced quality & dependable supply into the horizon.
25
It is not legal for the private sector to import wheat. However,
the government supplies wheat for food manufacturers.
Packing materials, flavors & food chemicals such as preservatives,
improvers, colors etc. are not available locally making imports the
only option.
Manufacturers can import any raw materials except for wheat and
sugar. A discounted import duty of 10% is afforded to local
manufacturers to boost the competitiveness of local products as
opposed to the 30-35%% duty imposed on importers in other sectors
such as traders, service-based enterprises & distributors.
Some raw materials and packaging such as sugar and cartons are
normally sourced locally although frequent shortages and price
fluctuations cause a significant instability within the supply
chain.
The other raw material is water. Usually for biscuit about 30% of
the dough weight is constituted by water. However, the water
content removed back after the required shape is formed/Extruded/.
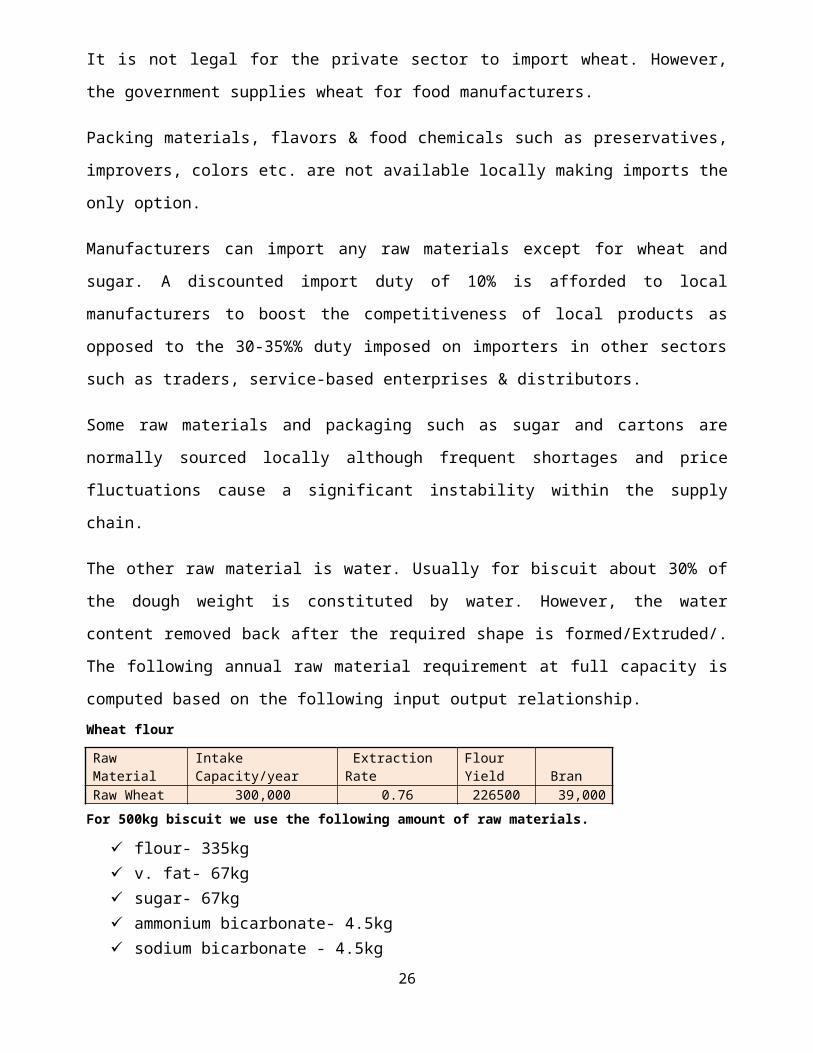
The following annual raw material requirement at full capacity is
computed based on the following input output relationship.Wheat flour
Raw Material
Intake Capacity/year
Extraction Rate
Flour Yield Bran
Raw Wheat 300,000 0.76 226500 39,000 For 500kg biscuit we use the following amount of raw materials.
flour- 335kg v. fat- 67kg sugar- 67kg ammonium bicarbonate- 4.5kg sodium bicarbonate - 4.5kg
26
milk powder- 11kg flavors- 0.5kg glucose- 11kg
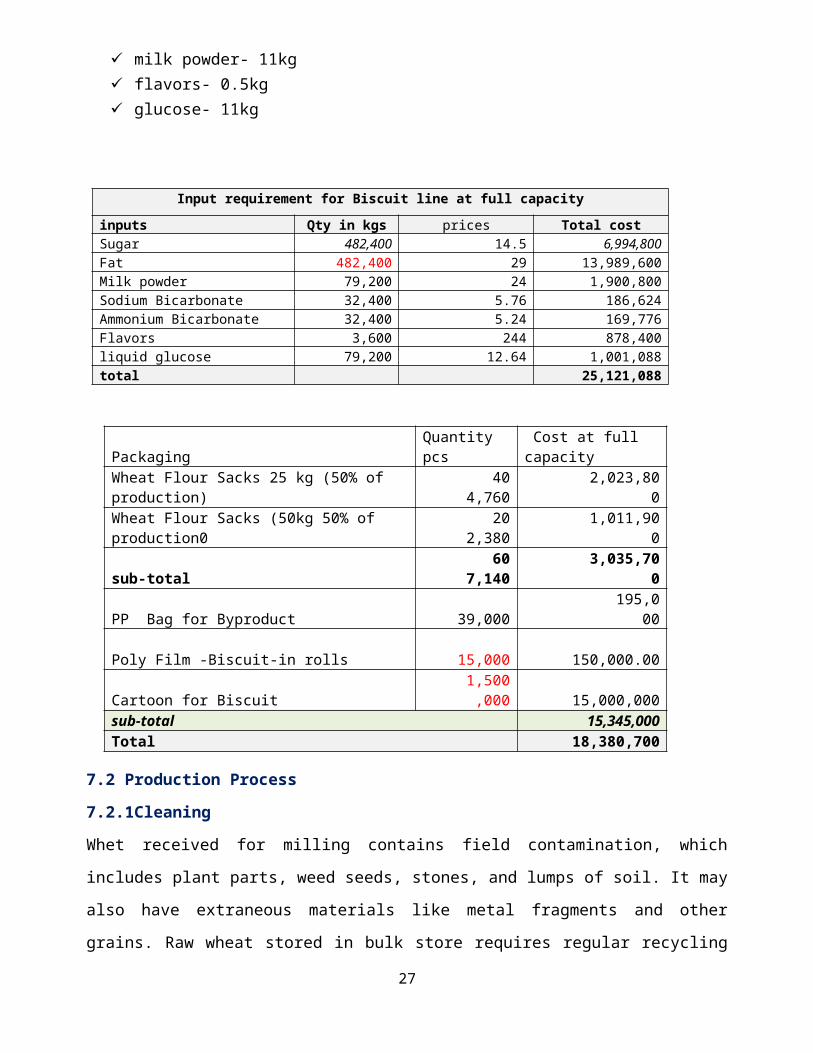
Input requirement for Biscuit line at full capacityinputs Qty in kgs prices Total costSugar 482,400 14.5 6,994,800Fat 482,400 29 13,989,600Milk powder 79,200 24 1,900,800Sodium Bicarbonate 32,400 5.76 186,624Ammonium Bicarbonate 32,400 5.24 169,776Flavors 3,600 244 878,400liquid glucose 79,200 12.64 1,001,088total 25,121,088
PackagingQuantity pcs
Cost at full capacity
Wheat Flour Sacks 25 kg (50% of production)
404,760
2,023,800
Wheat Flour Sacks (50kg 50% of production0
202,380
1,011,900
sub-total 60
7,140 3,035,70
0
PP Bag for Byproduct
39,000 195,0
00
Poly Film -Biscuit-in rolls
15,000 150,000.00
Cartoon for Biscuit 1,500
,000 15,000,000 sub-total 15,345,000 Total 18,380,700
7.2 Production Process
7.2.1Cleaning
Whet received for milling contains field contamination, which
includes plant parts, weed seeds, stones, and lumps of soil. It may
also have extraneous materials like metal fragments and other
grains. Raw wheat stored in bulk store requires regular recycling
27
and dosing of fumigation tablets. The wheat from the dumping pit,
via bucket elevator is fed to the vibro separator. Materials to be
separated fall freely through the inlet onto the coarse screen of
the vibiro separator, which removes coarse impurities as string,
straws, and stones. Fine sieves further remove broken kernels,
sands and other fine impurities. Tailing from sieve layer cleaned
water is used at the outlet to separate light particles by an
aspiration channel.
7.2.2 Conditioning
Prior to milling water is added in process known as “tempering”.
Hard wheat is normally brought to 15-16% moisture, soft wheat 13-
14% moisture. Tempered wheat is held 18-24 hourse at ambient
temperature in conditioning bins. The process toughness the seed
coat /bran/ and softens the starchy endosperm so that an efficient
separation of bran and endosperm can take place.
7.2.3 Milling/Grinding/
The process of wheat milling is a complex procedure of repetitive
grinding and sieving. The grinding process is divided into the
break, scratch and reduction operations.
The tempered wheat is grounded on a serious of corrugated break
rolls, the objective being to open up and scrap the wheat kernel to
release endosperm from the bran. Each grinding operation is
followed by sifting operation, in which the coarse branny stock
from the sifter is fed on successive break rolls. Each grinding and
bolting operation results in stream of flour of various breaks
(1st, 2nd, etc) that are collected from finest sieves as
intermediate granular particles. The final products of wheat flour
are ready to go for the biscuit line and to store.82
An average well-matured grain of wheat has 55% endosperm, 13% bran,
and 2% germ. It is the endosperm of the wheat grain that is
converted to flour in milling. In theory, it should be possible to
remove or extract approximately 85% of the grains flour, however
other structural features makes it an impossible task in actual
fact, the amount of flour produced may have some amount of bran,
while some flour is lost with the bran. Therefore, the commercial
flour may have extraction rate in the ranges of 73%-80%.
Biscuit
Biscuit manufacturing involves mixing of flour and other
ingredients into homogenous dough, forming the dough into a pre-
established shape, backing the dough pieces into biscuit. Cooling
the biscuit and packaging it. These processes are performed on
artisanal or industrial scale. The biscuit manufacturing to be
employed is fully automatic. Flour from the silos is pneumatically
transported to the mixing unit; the dough from the mixer is then
automatically transferred to the forming unit, from the forming
unit to the oven then the final product through the cooling tunnel
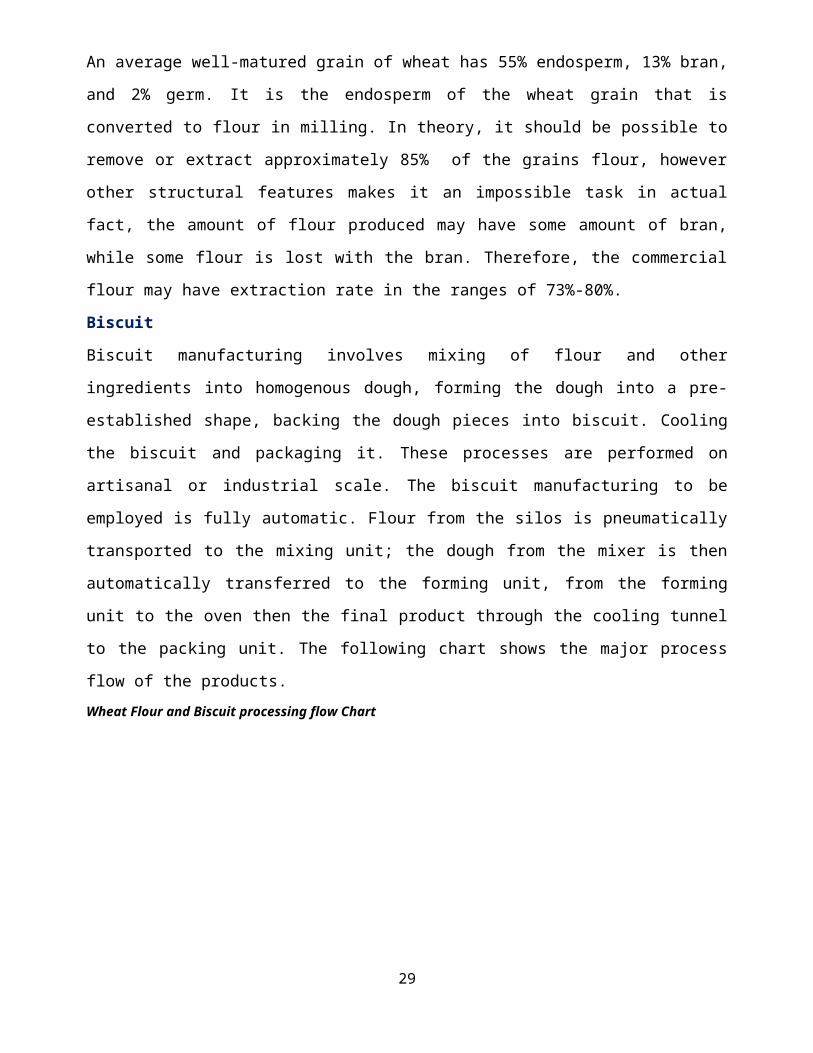
to the packing unit. The following chart shows the major process
flow of the products. Wheat Flour and Biscuit processing flow Chart
29
7.3 Civil Works Land
The land at which the food complex plant is located is acquired on
lease base from Sebeta town Administration Office. The lease
agreement for 5,000 m2 was concluded in the 2003 E.C and valid
until the year 2083 E.C. i.e. for 80 years. The promoter has to pay
Birr 6.5 per meter square or Birr 2,600,000 in total within 40
years payment period. So far he has paid Birr 319,215 Including 10%
down payment.
The project is located at the industrial zone of Sebeta-Alemgena
town which is being selected by the government considering
infrastructure, proximity to the market, availability of manpower,
etc. In this case it seems that the decision for site selection is
being made by the government instead of the promoter.
Building
The factory requires bigger production, raw material and finished
products hall. Such store and other construction works are already
started and 40% completed. Among others, the factory building
consists of the following parts.
30
CLEANING -RAW WHEATCONDITIONING RAW WHEATGRINDING/MILLINGBISCUT LINE
Raw material store , Finished goods store, Offices, Two
separate dressing rooms
The factory building is estimated to cost total of birr13,534,233.41, so far the promoter has made 40% or about birr5,541,379.
7.4 Production Machinery and lay out
Both the flour and Biscuit processing machinery are already been
selected from different China suppliers; namely HEBEI AFRICA
MACHINERY CO.LTD and SHUNDE LIGHT INDUSTRIAL PRODUCTS COM.LTD,
respectively. Among others, the following points are our selection
criteria.
Lower price
They supply the complete plant while the others don’t supply
the complete plant
The main parts of the plant are from very popular and reliable
suppliers like Siemens
The type of material from which the machineries made are the
best quality
They have been in the business for the long time and have good
reputation. Moreover they have supplied to many countries
including Ethiopia and we have learnt from their customers
that they provide good quality machineries.
They provide reliable spare parts
The machineries run by latest technology.
The flour making machine has a designed production capacity of
30,000 ton per year while the Biscuit machine can produce 3600 ton
per year assuming 300 working days in a year.
13
The under shown table portrays the machinery and its associated
costs per the proforma invoice plus transaction costs computed
based on Ethiopian investment agency, factor cost publication of
the year 2012 & access capital price data base.production machinery cost break down
Wheat Flour Machinery Biscuit machinery Total flour & BiscuitProduction Machinery 551,570 587,700 1,139,270Sea freight 29,200 28,175 57,375Port clearing & Delivery charge 8,640 7,560 16,200Installation cost 26,400 18,000 44,400Total in USD 615,810 641,435 1,257,245Exchange rate 18.5 18.5 18.5Sub-total in Birr 11,392,485 11,866,548 23,259,033Insurance 17,089 17,800 34,889Inland freight 40,000 35,000 75,000Bank charge 171,744 178,790 350,534Ticket and accommodation 370,000 185,000 555,000Grand Total 11,991,317 12,283,138 24,274,455 For flour machine-Two expatriate engineers and 2 technicians with monthly salary of
USD 2,000 and USD 2,400 per month shall stay in Addis for three months forinstallation.
For Biscuit Machine-2 expatriate engineers from Supplier Company with daily rate ofUSD 100 will stay for 90 days for installation.
Round trip air ticket costs birr 25,000 each expatriate. Accommodation and foodcharge is estimated to be birr 750 per day.
NB. The production machinery lay out is annexed.
7.5 Vehicles
The total output (flour, biscuit and the by product) at 60%
capacity is more than 53 ton per day. An Isuzu NPR truck can load
3.5 ton at a time. Assuming a single truck can make two trips per
day, the project demands at least 7 trucks. However, with the
assumption that most of the sales will be made at factory gate and
the promoter will use some vehicles on rental basis, it is planned
to purchase only two ISUZU trucks. Own vehicles will be used to
reach far areas and address urgent deliveries. The detail type and
price of the vehicles is shown in the table below.
Vehicles
32
Type quantity Unit/price TotalISUZU NPR truck model
2012/3.5ton 2 725,000 1,450,0002% registration fee 29,000
Total 1,479,000
7.6 Office Equipment and Furniture
The factory has to be equipped with the necessary office equipment,
furniture for the administrative, and finance staffs as well as for
market integration of input supply and finished product quality
control. The details with related costs are shown in the table
below. Furniture, Generator and Transformer
Description Unit cost/unit TotalGenerator, transformer and electric work one each 6,771,119 6,771,119Dell computers with LCD monitor &Speaker 25 14347.83 358,696HP laser Jet printer 15 6086.96 91,304Canon IR 2420 photo copy machine 1 27826.09 27,826Managerial table-one side arch 5 3302.61 16,513managerial table-bean type 180x90x75 8 3144.35 25,155Single Pedestal table 140x80 21 2151.3 45,177Executive Book shelf 4 4538.26 18,153Gust chair 12 499.13 5,990managerial swivel chair 5 2049.57 10,248managerial swivel chair 8 1763.48 14,108managerial swivel chair 21 1669.57 35,061Dixon shelf 3 1466.09 4,398sub-total 6,839,964 7,423,74815% VAT 1,113,562Total 8,537,310
As indicated from the table the project requires total investment
of birr 8,537,310 for furniture, transformer and generator
acquisition.
7.7 Utility Supply
Power Supply
33
The factory requires total 840KW (for flour mill 290+biscut line
550) power. The electric installation cost including power
transformer is indicated in the table above under part 6.6
supported by valid proforma invoice. The following table shows the
computation of annual power cost to the factory.
POWER KWAnnual Consumption at 24 hrs/day, @100%
capacity
Rate Per
Unit Birr
Flour Mill
Line 290 2,088,000 0.58
1,211,0
40
Biscuit Line 550 3,960,000 0.58
2,296,8
00Total 840 6,048,000 3,507,840
Water
Water line is not availed to the project as a result estimated cost
of birr 3,000 is allotted in the pre-operating expenditure. For
Flour and Biscuit production, water is an essential input.
Including the requirement for human use, the factory’s annual water
consumption reaches 3,000-m3 at birr 3.25/m3 consumption per day.
The detail is shown below.
Water m3/DAY Annual Consumption Rate/ m33 total
Flour Mill and biscuit
line 10 3,000 3.25 9,750
Fuel Consumption Fuel Consumption
KM/daykm. distance
/litter price Total200 6 20 400,000
5% oil & Lubricant 20,000Estimated hours power
offfuel consumption
liter/hr price Total2 5 20 60,000
34
Total 480,000
As indicated above on average each vehicle is assumed to travel 200
km per day and will travel 6 kilometers per liter of fuel. Price of
fuel is birr 20/litter. The annual fuel consumption for the two
trucks will, thus, be birr 400,000. Oil and lubricant expense is
estimated to be 5 % of fuel. Likewise, a stand by generator on
average will work for 2 hours per day with 5 litter consumption per
hour at birr 20/litter, the annual fuel cost will be birr 60,000.
Communication and Stationery
Telecommunication, Internet and fax service in today’s business
world have great importance in exchanging information between raw
material suppliers, intermediaries, consumers and producers. The
area is equipped with mobile network, landline, and internet
service. Total cost for communication and stationery is considered
3% of salary expense.
7.8 Environmental Impact Assessment
The project will not have an adverse impact on the environment as
it is not associated with process that emits hazardous effluents
that can potentially endanger the working or surrounding
environment.
35
8. FINANCIAL APPRAISAL
8.1 Initial Investment Cost
The total initial investment cost required for the project is 87.92
million. The items and cost breakdown is shown in the following
table.
Investment Cost Schedule Description Unit Total Investment cost
Land use tax Advance Payment Birr
319,215
Factory Building Birr
13,853,449
Production Machinery Birr
24,274,455
Vehicles Birr
1,479,000
Generator, transformer and office Equipment
Birr
8,537,310
Sub-total Birr 48,463,429
Pre-operating Expenditure(water 3,000) Birr
14,660
Pre operating Interest Birr
10,055,145
Initial Working Capital Birr
29,437,446
Sub Total Birr 39,507,252 Total Birr 87,970,680
NB. Different legal expenses paid plus birr 3,000 water line installation cost to be
paid) (10,180.48+200+105+10+25+360+780+3000).
8.2 Financing Structure
Item
Total Initial InvestmentCost Equity Contribution Debt Finance
Unit Amount % Amount %
Amount
Land - Payment Birr 319,215 100% 319,215 0% -
Factory Building Birr13,853,449 40%
5,541,379 60% 8,312,069
Production Birr 24,274,4 30% 7,282,33 70% 16,992,118
36
Machinery 55 6
Vehicles Birr1,479,000 30% 443,700 70% 1,035,300
Generator, transformer and office Equipment Birr
8,537,310 30%
2,561,193 70% 5,976,117
Sub-total Birr48,463,429 33%
16,147,824 67% 32,315,604
Pre-operating Expenditure Birr 14,660 100% 14,660 0% -
Pre operating Interest Birr
10,055,145 100%
10,012,679 0% -
Initial Working Capital Birr
29,437,446 30%
8,831,234 70% 20,606,212
Sub Total Birr39,464,786 48%
18,858,573 52% 20,606,212
Total Birr
87,970,680 40%
35,006,397 60% 52,921,817
As indicated in the above table, it is planned that the promoter
would contribute 40% of the total investment cost and the remaining
60% would be financed by debt. Out of the equity requirement of
Birr 35 million, the promoter has so far committed more than birr
5.86 million for construction of building, lease payment and pre-
operating expenditures. The 60% bank financing, which is birr 52.92
million would be payable within 8 years exclusive of 2 years grace
period at quarterly repayments with 9.5% interest rate.
8.3 Applied Financial Assumptions:1. Project life: Ten operational years excluding implementation
period2. Capacity Utilization Rate: Starts at 60% and increases by 5%
every additional year up to attainable capacity of 90%.3. Working days per year: 300 4. Number of shifts: at full capacity = 3, 5. Working hours per shift : 8, total working hours per day, 24,6. Tax holiday period: Nil, 7. Profit tax: 35% of IBIT and 15% VAT on sales.
37
8. Salvage value: Buildings 50%, Vehicles, Machinery, and MajorEquipment, 20%.
9. Recovery rate: Full amount of the ending working capitalamount,
10. Cost of Capital for discounting: 9.5%11. Grace period: 2 years.12. Financial Expense on debt finance: Fixed 9.5%,13. Loan Repayment: Principal plus interest is paid per quarter
within 8. years, however, interest alone would be paid duringgrace period of 2 years,
14. Water average Rate Birr 3.25 Per M3
15. Power: average rate Birr 0.58 per KWH,16. Stationery and Communication: 3% of salary expense,17. Marketing and Promotion: 0.5% of sales revenue,18. Uniform and miscellaneous : Birr 400 per employee/year,19. Miscellaneous expense birr 20,000 per annum.20. Salary Expense: Per the schedule shown in item 4.2,21. Wage: Birr 50 per ton,22. Depreciation: Buildings 5%, Machinery, Vehicle, Equipment and
furniture 20%, land lease 1% based lease life.23. Amortization: Pre-operating expense : 20%,
83
24. Property Insurance premium: would be 1.75 % for the buildingscost and 2.5% for Machinery and Vehicles,
25. Repair including tier, spare parts, etc: 0.10% of the cost ofbuilding, Machinery, vehicle and equipment for the first 5
years, then will increase by 10% then after.
26. Lease Fee: Birr 58,500 per year per lease agreement.
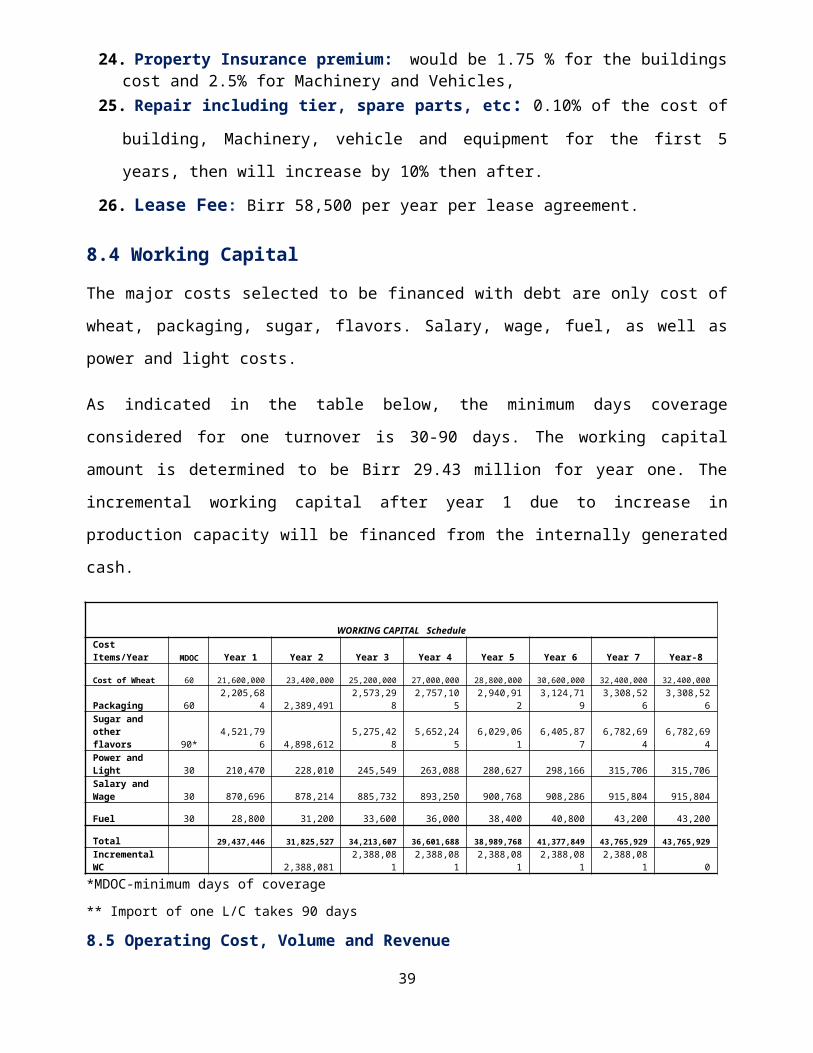
8.4 Working Capital
The major costs selected to be financed with debt are only cost of
wheat, packaging, sugar, flavors. Salary, wage, fuel, as well as
power and light costs.
As indicated in the table below, the minimum days coverage
considered for one turnover is 30-90 days. The working capital
amount is determined to be Birr 29.43 million for year one. The
incremental working capital after year 1 due to increase in
production capacity will be financed from the internally generated
cash.
WORKING CAPITAL ScheduleCost Items/Year MDOC Year 1 Year 2 Year 3 Year 4 Year 5 Year 6 Year 7 Year-8
Cost of Wheat 60 21,600,000 23,400,000 25,200,000 27,000,000 28,800,000 30,600,000 32,400,000 32,400,000
Packaging 602,205,68
4 2,389,4912,573,29
82,757,10
52,940,91
23,124,71
93,308,52
63,308,52
6Sugar and other flavors 90*
4,521,796 4,898,612
5,275,428
5,652,245
6,029,061
6,405,877
6,782,694
6,782,694
Power and Light 30 210,470 228,010 245,549 263,088 280,627 298,166 315,706 315,706Salary and Wage 30 870,696 878,214 885,732 893,250 900,768 908,286 915,804 915,804
Fuel 30 28,800 31,200 33,600 36,000 38,400 40,800 43,200 43,200
Total 29,437,446 31,825,527 34,213,607 36,601,688 38,989,768 41,377,849 43,765,929 43,765,929Incremental WC 2,388,081
2,388,081
2,388,081
2,388,081
2,388,081
2,388,081 0
*MDOC-minimum days of coverage
** Import of one L/C takes 90 days
8.5 Operating Cost, Volume and Revenue
39
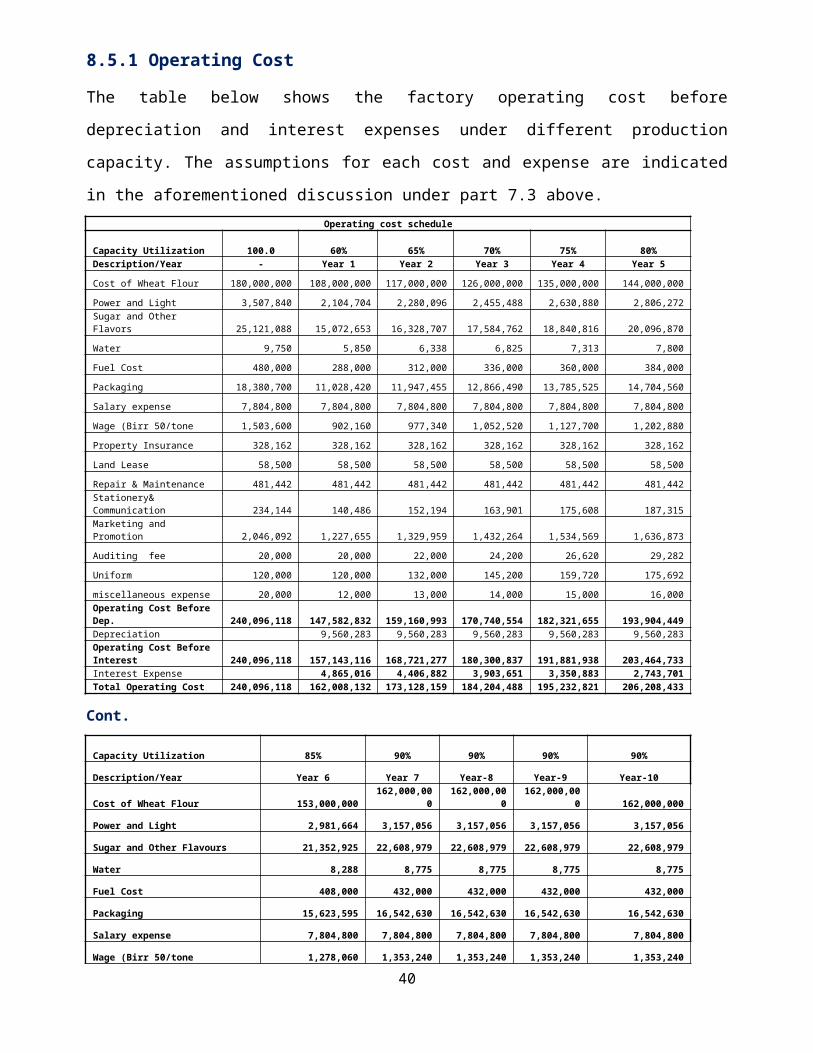
8.5.1 Operating Cost
The table below shows the factory operating cost before
depreciation and interest expenses under different production
capacity. The assumptions for each cost and expense are indicated
in the aforementioned discussion under part 7.3 above.Operating cost schedule
Capacity Utilization 100.0 60% 65% 70% 75% 80%Description/Year - Year 1 Year 2 Year 3 Year 4 Year 5
Cost of Wheat Flour 180,000,000 108,000,000 117,000,000 126,000,000 135,000,000 144,000,000
Power and Light 3,507,840 2,104,704 2,280,096 2,455,488 2,630,880 2,806,272Sugar and Other Flavors 25,121,088 15,072,653 16,328,707 17,584,762 18,840,816 20,096,870
Water 9,750 5,850 6,338 6,825 7,313 7,800
Fuel Cost 480,000 288,000 312,000 336,000 360,000 384,000
Packaging 18,380,700 11,028,420 11,947,455 12,866,490 13,785,525 14,704,560
Salary expense 7,804,800 7,804,800 7,804,800 7,804,800 7,804,800 7,804,800
Wage (Birr 50/tone 1,503,600 902,160 977,340 1,052,520 1,127,700 1,202,880
Property Insurance 328,162 328,162 328,162 328,162 328,162 328,162
Land Lease 58,500 58,500 58,500 58,500 58,500 58,500
Repair & Maintenance 481,442 481,442 481,442 481,442 481,442 481,442Stationery& Communication 234,144 140,486 152,194 163,901 175,608 187,315Marketing and Promotion 2,046,092 1,227,655 1,329,959 1,432,264 1,534,569 1,636,873
Auditing fee 20,000 20,000 22,000 24,200 26,620 29,282
Uniform 120,000 120,000 132,000 145,200 159,720 175,692
miscellaneous expense 20,000 12,000 13,000 14,000 15,000 16,000Operating Cost Before Dep. 240,096,118 147,582,832 159,160,993 170,740,554 182,321,655 193,904,449Depreciation 9,560,283 9,560,283 9,560,283 9,560,283 9,560,283Operating Cost Before Interest 240,096,118 157,143,116 168,721,277 180,300,837 191,881,938 203,464,733Interest Expense 4,865,016 4,406,882 3,903,651 3,350,883 2,743,701Total Operating Cost 240,096,118 162,008,132 173,128,159 184,204,488 195,232,821 206,208,433
Cont.
Capacity Utilization 85% 90% 90% 90% 90%
Description/Year Year 6 Year 7 Year-8 Year-9 Year-10
Cost of Wheat Flour 153,000,000162,000,00
0162,000,00
0162,000,00
0 162,000,000
Power and Light 2,981,664 3,157,056 3,157,056 3,157,056 3,157,056
Sugar and Other Flavours 21,352,925 22,608,979 22,608,979 22,608,979 22,608,979
Water 8,288 8,775 8,775 8,775 8,775
Fuel Cost 408,000 432,000 432,000 432,000 432,000
Packaging 15,623,595 16,542,630 16,542,630 16,542,630 16,542,630
Salary expense 7,804,800 7,804,800 7,804,800 7,804,800 7,804,800
Wage (Birr 50/tone 1,278,060 1,353,240 1,353,240 1,353,240 1,353,240
40
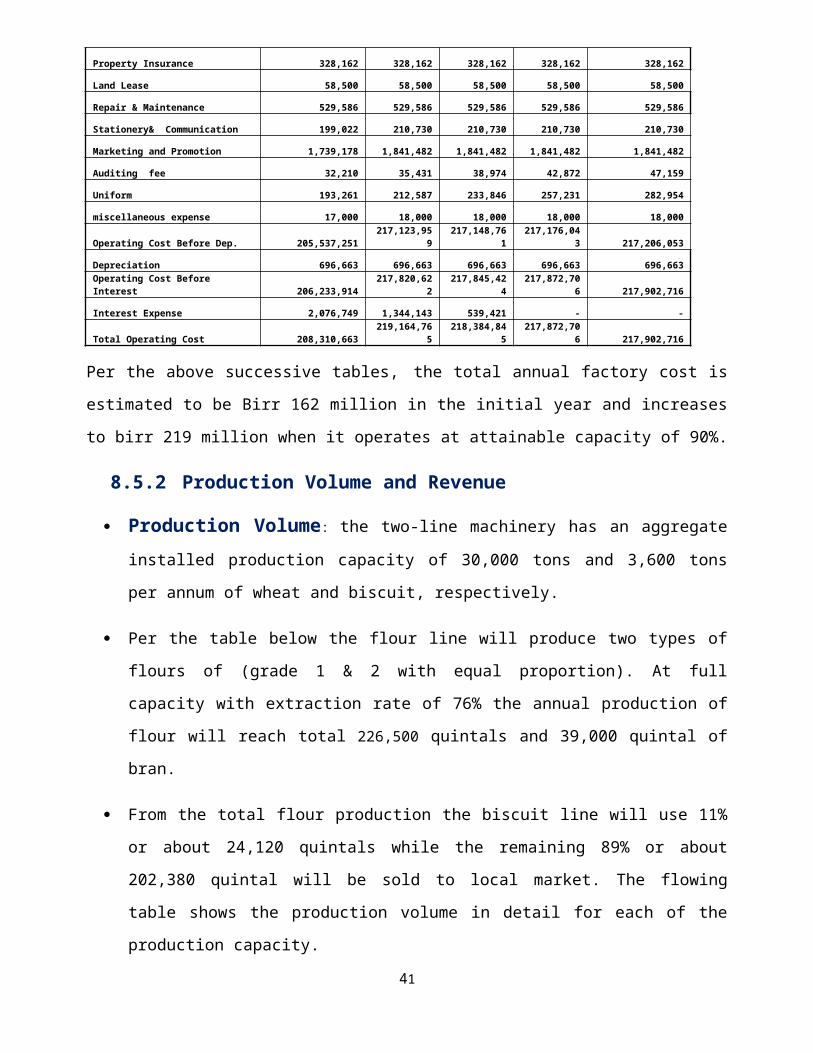
Property Insurance 328,162 328,162 328,162 328,162 328,162
Land Lease 58,500 58,500 58,500 58,500 58,500
Repair & Maintenance 529,586 529,586 529,586 529,586 529,586
Stationery& Communication 199,022 210,730 210,730 210,730 210,730
Marketing and Promotion 1,739,178 1,841,482 1,841,482 1,841,482 1,841,482
Auditing fee 32,210 35,431 38,974 42,872 47,159
Uniform 193,261 212,587 233,846 257,231 282,954
miscellaneous expense 17,000 18,000 18,000 18,000 18,000
Operating Cost Before Dep. 205,537,251217,123,95
9217,148,76
1217,176,04
3 217,206,053
Depreciation 696,663 696,663 696,663 696,663 696,663Operating Cost Before Interest 206,233,914
217,820,622
217,845,424
217,872,706 217,902,716
Interest Expense 2,076,749 1,344,143 539,421 - -
Total Operating Cost 208,310,663219,164,76
5218,384,84
5217,872,70
6 217,902,716
Per the above successive tables, the total annual factory cost isestimated to be Birr 162 million in the initial year and increases
to birr 219 million when it operates at attainable capacity of 90%.
8.5.2 Production Volume and Revenue
Production Volume: the two-line machinery has an aggregateinstalled production capacity of 30,000 tons and 3,600 tons
per annum of wheat and biscuit, respectively.
Per the table below the flour line will produce two types of
flours of (grade 1 & 2 with equal proportion). At full
capacity with extraction rate of 76% the annual production of
flour will reach total 226,500 quintals and 39,000 quintal of
bran.
From the total flour production the biscuit line will use 11%
or about 24,120 quintals while the remaining 89% or about
202,380 quintal will be sold to local market. The flowing
table shows the production volume in detail for each of the
production capacity.
14
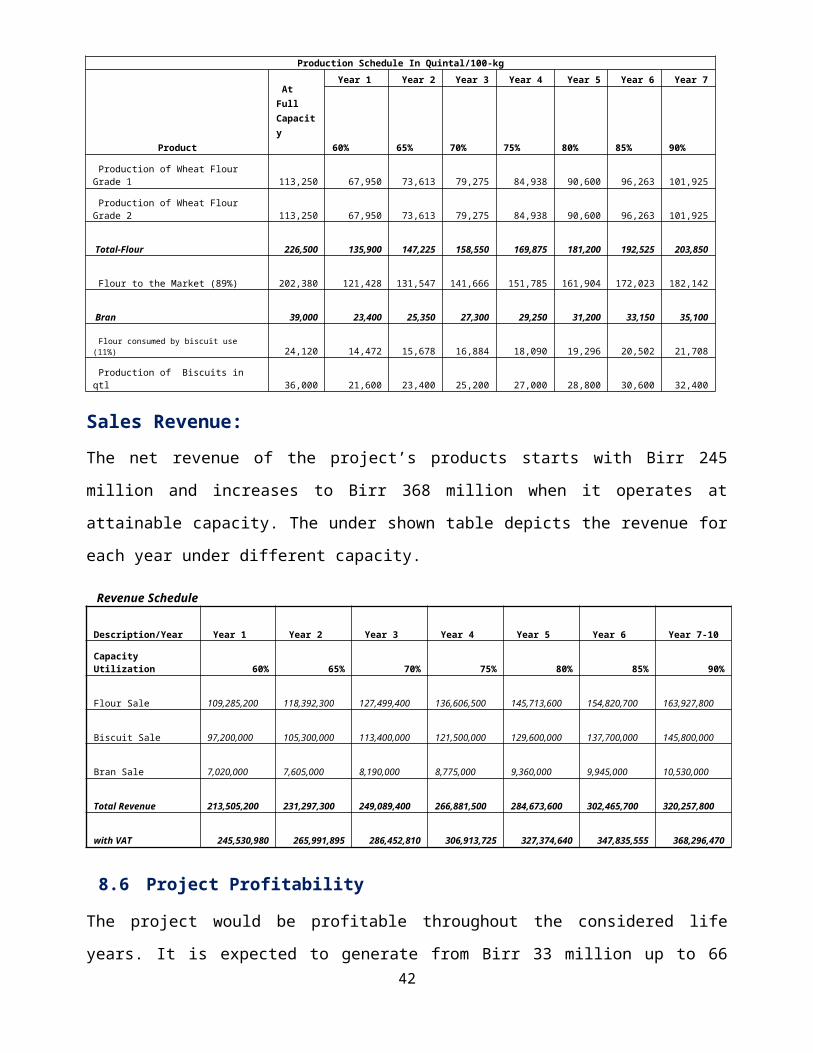
Production Schedule In Quintal/100-kg
Product
At Full Capacity
Year 1 Year 2 Year 3 Year 4 Year 5 Year 6 Year 7
60% 65% 70% 75% 80% 85% 90%
Production of Wheat Flour Grade 1
113,250
67,950
73,613
79,275
84,938
90,600
96,263
101,925
Production of Wheat Flour Grade 2
113,250
67,950
73,613
79,275
84,938
90,600
96,263
101,925
Total-Flour
226,500
135,900
147,225
158,550
169,875
181,200
192,525
203,850
Flour to the Market (89%)
202,380
121,428
131,547
141,666
151,785
161,904
172,023
182,142
Bran
39,000
23,400
25,350
27,300
29,250
31,200
33,150
35,100
Flour consumed by biscuit use (11%)
24,120
14,472
15,678
16,884
18,090
19,296
20,502
21,708
Production of Biscuits in qtl
36,000
21,600
23,400
25,200
27,000
28,800
30,600
32,400
Sales Revenue:The net revenue of the project’s products starts with Birr 245
million and increases to Birr 368 million when it operates at
attainable capacity. The under shown table depicts the revenue for
each year under different capacity.
Revenue Schedule
Description/Year Year 1 Year 2 Year 3 Year 4 Year 5 Year 6 Year 7-10
Capacity Utilization 60% 65% 70% 75% 80% 85% 90%
Flour Sale 109,285,200
118,392,300
127,499,400
136,606,500
145,713,600
154,820,700
163,927,800
Biscuit Sale 97,200,000
105,300,000
113,400,000
121,500,000
129,600,000
137,700,000
145,800,000
Bran Sale 7,020,000
7,605,000
8,190,000
8,775,000
9,360,000
9,945,000
10,530,000
Total Revenue 213,505,200
231,297,300
249,089,400
266,881,500
284,673,600
302,465,700
320,257,800
with VAT 245,530,980 265,991,895 286,452,810 306,913,725 327,374,640 347,835,555 368,296,470
8.6 Project Profitability
The project would be profitable throughout the considered life
years. It is expected to generate from Birr 33 million up to 6642
million net profits. The following table shows the forecasted
income statement of the project within its ten operational years.
Projected Income/Loss Statement
Description/Year Year 1 Year 2 Year 3 Year 4 Year 5
Revenue
213,505,200
231,297,30
0
249,089,400
266,881,50
0
284,673,60
0
Total Expense Before Interest
157,143,116
168,721,27
7
180,300,837
191,881,93
8
203,464,73
3
Gross profit
56,362,084
62,576,023
68,788,563
74,999,562
81,208,867
Interest Expenses
4,865,016
4,406,882
3,903,651
3,350,883
2,743,701
Net Income
51,497,068
58,169,141
64,884,912
71,648,679
78,465,167
Profit Tax
18,016,024
20,351,249
22,701,769
25,069,088
27,454,858
Net Income After Tax
33,481,044
37,817,892
42,183,143
46,579,592
51,010,308
Projected Income/Loss Statement –connt.
Description/Year Year 6 Year 7 Year-8 Year-9 Year-10
Revenue
302,465,700
320,257,800
320,257,800
320,257,800
320,257,800
Total Expense Before Interest
206,233,914
217,820,622
217,845,424
217,872,706
217,902,716
Gross profit 96,231,786
102,437,178
102,412,376
102,385,094
102,355,084
Interest Expenses 2,076,749
1,344,143
539,421
-
Net Income 94,155,037
101,093,035
101,872,955
102,385,094
102,355,084
Profit Tax 32,946,313
35,374,612
35,647,584
35,826,833
35,816,329
Net Income After Tax 61,208,724
65,718,423
66,225,371
66,558,261
66,538,755
8.7 Project Liquidity and Payback period43
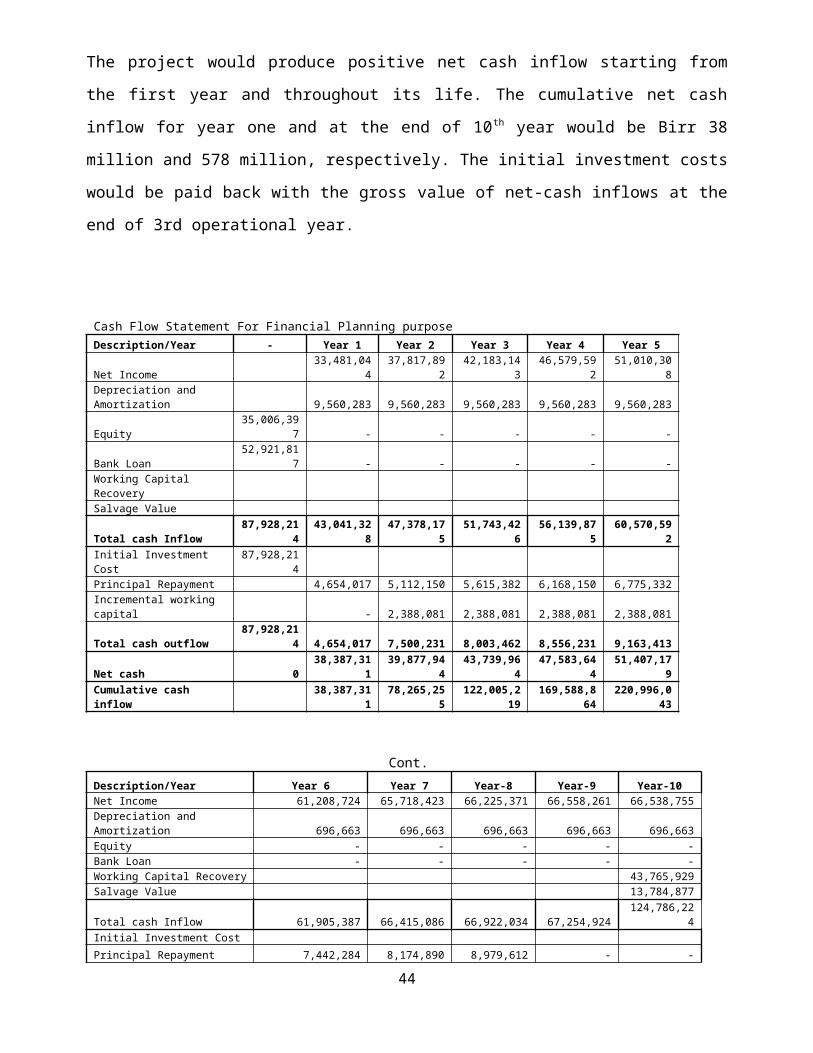
The project would produce positive net cash inflow starting from
the first year and throughout its life. The cumulative net cash
inflow for year one and at the end of 10th year would be Birr 38
million and 578 million, respectively. The initial investment costs
would be paid back with the gross value of net-cash inflows at the
end of 3rd operational year.
Cash Flow Statement For Financial Planning purposeDescription/Year - Year 1 Year 2 Year 3 Year 4 Year 5
Net Income33,481,04
437,817,89
242,183,14
346,579,59
251,010,30
8Depreciation and Amortization 9,560,283 9,560,283 9,560,283 9,560,283 9,560,283
Equity35,006,39
7 - - - - -
Bank Loan52,921,81
7 - - - - -Working Capital RecoverySalvage Value
Total cash Inflow87,928,21
443,041,32
847,378,17
551,743,42
656,139,87
560,570,59
2Initial Investment Cost
87,928,214
Principal Repayment 4,654,017 5,112,150 5,615,382 6,168,150 6,775,332Incremental working capital - 2,388,081 2,388,081 2,388,081 2,388,081
Total cash outflow87,928,21
4 4,654,017 7,500,231 8,003,462 8,556,231 9,163,413
Net cash 038,387,31
139,877,94
443,739,96
447,583,64
451,407,17
9Cumulative cash inflow
38,387,311
78,265,255
122,005,219
169,588,864
220,996,043
Cont.Description/Year Year 6 Year 7 Year-8 Year-9 Year-10Net Income 61,208,724 65,718,423 66,225,371 66,558,261 66,538,755Depreciation and Amortization 696,663 696,663 696,663 696,663 696,663Equity - - - - -Bank Loan - - - - -Working Capital Recovery 43,765,929Salvage Value 13,784,877
Total cash Inflow 61,905,387 66,415,086 66,922,034 67,254,924124,786,22
4Initial Investment CostPrincipal Repayment 7,442,284 8,174,890 8,979,612 - -
44
Incremental working capital 2,388,081 2,388,081 - - -Total cash outflow 9,830,365 10,562,970 8,979,612 0 0
Net cash 52,075,022 55,852,115 57,942,422 67,254,924124,786,22
4
Cumulative cash inflow 273,071,065328,923,18
0386,865,60
2454,120,52
6578,906,75
0
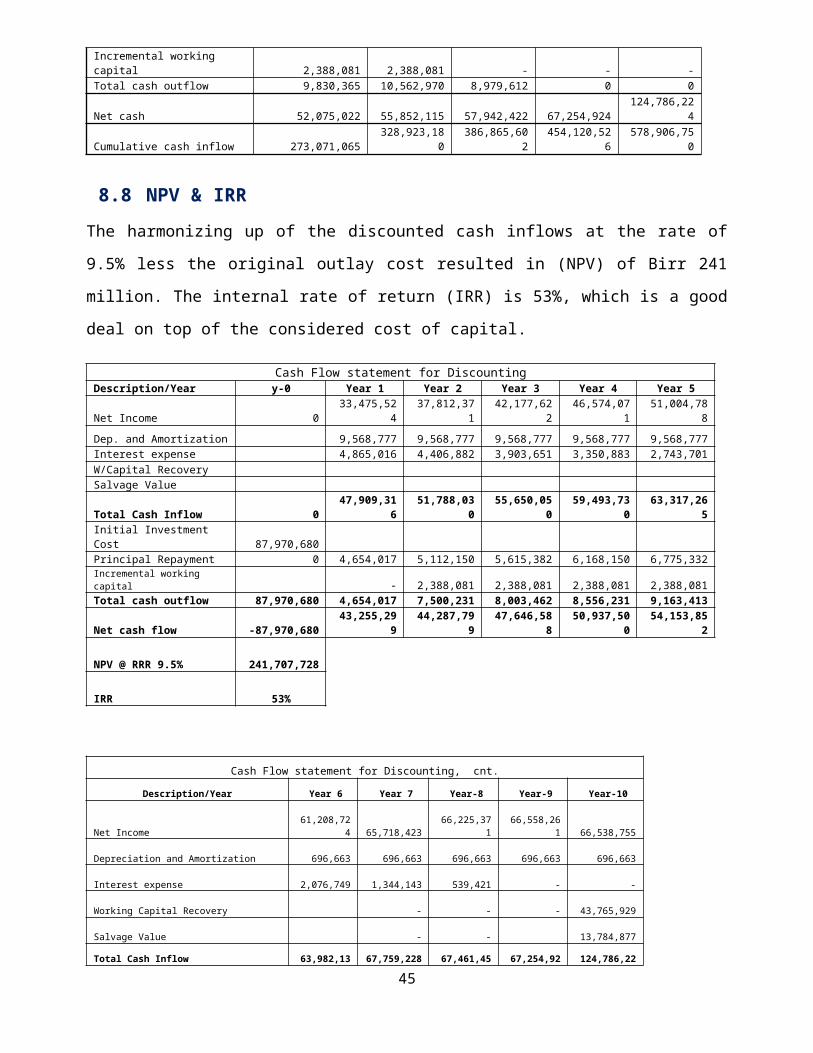
8.8 NPV & IRRThe harmonizing up of the discounted cash inflows at the rate of
9.5% less the original outlay cost resulted in (NPV) of Birr 241
million. The internal rate of return (IRR) is 53%, which is a good
deal on top of the considered cost of capital.
Cash Flow statement for DiscountingDescription/Year y-0 Year 1 Year 2 Year 3 Year 4 Year 5
Net Income 033,475,52
437,812,37
142,177,62
246,574,07
151,004,78
8Dep. and Amortization 9,568,777 9,568,777 9,568,777 9,568,777 9,568,777Interest expense 4,865,016 4,406,882 3,903,651 3,350,883 2,743,701W/Capital RecoverySalvage Value
Total Cash Inflow 047,909,31
651,788,03
055,650,05
059,493,73
063,317,26
5Initial Investment Cost 87,970,680Principal Repayment 0 4,654,017 5,112,150 5,615,382 6,168,150 6,775,332Incremental working capital - 2,388,081 2,388,081 2,388,081 2,388,081Total cash outflow 87,970,680 4,654,017 7,500,231 8,003,462 8,556,231 9,163,413
Net cash flow -87,970,68043,255,29
944,287,79
947,646,58
850,937,50
054,153,85
2
NPV @ RRR 9.5% 241,707,728
IRR 53%
Cash Flow statement for Discounting, cnt.
Description/Year Year 6 Year 7 Year-8 Year-9 Year-10
Net Income
61,208,72
4
65,718,423
66,225,37
1
66,558,26
1
66,538,755
Depreciation and Amortization
696,663
696,663
696,663
696,663
696,663
Interest expense
2,076,749
1,344,143
539,421 -
-
Working Capital Recovery -
-
-
43,765,929
Salvage Value -
-
13,784,877
Total Cash Inflow 63,982,13 67,759,228 67,461,45 67,254,92 124,786,22
45
5 4 4 4
Initial Investment Cost
Principal Repayment 7,442,284 8,174,890 8,979,612 0 0
Incremental working capital
2,388,081
2,388,081 -
-
-
Total cash outflow 9,830,365 10,562,970 8,979,612 0 0
Net cash flow54,151,77
1 57,196,25858,481,84
367,254,92
4124,786,22
4
8.9 Sensitivity to Cost and Revenue Variations Four scenarios are tested to assess how the net benefits of the
project behave towards adverse changes each by 10%. That is.
Revenue decline
fixed cost increment
Operating cost increment, and
Simultaneous increase in investment and operating cost
No. Scenario NPV inmillions of
Birr
IRR in%
Base 241 53
Decrease in revenue 140 36
Increase in Operating cost 172 42
Increase in fixed investment cost 233 49
Simultaneous increase in investment andoperating cost
164 38
Relatively, the project is not sensitive to increments in fixed
investment cost but it is sensitive to revenue and cost,
suggesting a parallel decrease in operating cost and increase
in revenue, respectively. In all cases the however, NPV is
positive with minimum IRR 36% which is far from the discount
rate of 9.5%.
46
8.10 Debt Servicing Schedule
The anticipated bank loan would be paid within 8 years
excluding 2 years grace period, at quarterly repayments and
9.5% nominal interest rate per annum. The two years grace
period includes one year construction period per implementation
plan indicated in part_1.4 above and one year pre-marketing
period. The schedule is shown in the following table.
Loan Amortization, Equal Quarterly RepaymentPrincipal Payments Balance
Principal InterestYear 0, 24 Months Grace
period. 52,921,817 - 10,055,145 52,921,817
52,921,8171,122,86
5 1,256,893 51,798,952
51,798,9521,149,53
3 1,230,225 50,649,419
50,649,4191,176,83
4 1,202,924 49,472,584
49,472,5841,204,78
4 1,174,974 48,267,800Year 1,Sub Total 4,654,017 4,865,016
48,267,8001,233,39
8 1,146,360 47,034,402
47,034,4021,262,69
1 1,117,067 45,771,711
45,771,7111,292,68
0 1,087,078 44,479,031
44,479,0311,323,38
1 1,056,377 43,155,650Year 2,Sub Total 5,112,150 4,406,882
43,155,6501,354,81
1 1,024,947 41,800,838
41,800,8381,386,98
8 992,770 40,413,850
40,413,8501,419,92
9 959,829 38,993,921
38,993,9211,453,65
3 926,106 37,540,268Year 3,Sub Total 5,615,382 3,903,651
37,540,2681,488,17
7 891,581 36,052,091
36,052,0911,523,52
1 856,237 34,528,570
34,528,5701,559,70
5 820,054 32,968,866
32,968,8661,596,74
8 783,011 31,372,118Year 4,Sub Total 6,168,150 3,350,883
31,372,1181,634,67
0 745,088 29,737,448
29,737,4481,673,49
4 706,264 28,063,954
28,063,9541,713,23
9 666,519 26,350,715
47
26,350,7151,753,92
9 625,829 24,596,786Year 5 Sub Total 6,775,332 2,743,701
24,596,786 1,795,585 584,174 22,801,201
22,801,2011,838,23
0 541,529 20,962,972
20,962,9721,881,88
8 497,871 19,081,084
19,081,0841,926,58
2 453,176 17,154,502Year 6 Sub Total 7,442,284 2,076,749
17,154,5021,972,33
9 407,419 15,182,163
15,182,1632,019,18
2 360,576 13,162,981
13,162,9812,067,13
7 312,621 11,095,844
11,095,8442,116,23
2 263,526 8,979,612Year 7 Sub Total 8,174,890 1,344,143
8,979,6122,166,49
2 213,266 6,813,120
6,813,1202,217,94
7 161,812 4,595,173
4,595,1732,270,62
3 109,135 2,324,550
2,324,5502,324,55
0 55,208 (0)Year 8 Sub Total 8,979,612 539,421
52,921,817 23,230,445 76,152,262
Depreciation and Amortization Cost Item Original Cost Rates Applied Year 1-5 Year 6-10
Building
13,853,449 5%
692,672
692,672 Machinery, Equipment, Furniture & Vehicles
34,290,765 20%
6,858,153
Land Lease-over lease period of 80 years
319,215 1%
3,990
3,990
Pre-operating Expenditure
10,069,805 20%
2,013,961
Total
58,533,234
9,568,777
696,663
84