feasibility study universal affordable day care
TRANSCRIPT

FEASIBILITY STUDY of
UNIVERSAL AFFORDABLE DAY CARE in the
NORTHWEST TERRITORIES
Kerry McCuaig, Fellow in Early Childhood Policy
Atkinson Centre/University of Toronto
Zeenat Janmohamed, Ph.d. Visiting Scholar Atkinson
Centre/University of Toronto
Elizabeth Dhuey, Ph.d.
Centre for Industrial Relations and Human Resources, UT
Emis Akbari, Ph.d. Postdoctoral Fellow Atkinson Centre/University of Toronto

Feasibility study of universal, affordable daycare in the Northwest Territories
2
Acknowledgements The researchers would like to thank the parents, early childhood
and school staff and administrators, community leaders and
GNWT officials who gave so generously of their time and
resources to assist in the development of this study.

Feasibility study of universal, affordable daycare in the Northwest Territories
3
Definition: This feasibility study takes a broad view of “day care” and uses
the term “early childhood education and child care” (ECEC), which
is more commonly found in the literature and is increasingly used
by the sector. ECEC includes all arrangements providing care and
education for children prior to compulsory schooling (Grade 1),
regardless of setting, funding, auspice, opening hours or program
content. In the context of the Northwest Territories (NWT), ECEC
includes licensed day care centres, family day homes, nursery
schools, Aboriginal Head Start, family resource programs,
preschool and Junior Kindergarten.

Feasibility study of universal, affordable daycare in the Northwest Territories
4
TABLE OF CONTENTS
A. Project overview……………………………………………………………………………………………………………………………………. 5
B. Getting it right from the start………………………………………………………………………………………………………………… 10
C. Review of the NWT’s day care funding, governance and service delivery………………………………………………. 14
D. Developing a qualified early childhood workforce for the NWT……………………………………………………………… 24
E. Funding and policy frameworks in Denmark, Norway, Sweden and Québec………………………………………….. 27
F. Current child care capacity in the NWT……………………………………………….…………………………………………………. 39
G. Day care service providers’ capacity for change……………………………………………….……………………………………. 51
H. The costs and benefits of public spending on child care……………………………………………….………………………… 54
Conclusions……………………………………………….……………………………………………….…………………………………………..……. 87
References……………………………………………….……………………………………………….………………………………………….………. 89
Appendices……………………………………………….……………………………………………….…………………………………………………. 97

Feasibility study of universal, affordable daycare in the Northwest Territories
5 B. GETTING IT RIGHT FROM THE START
A. THE PROJECT OVERVIEW
1. PROJECT TITLE:
Feasibility Study – Universal Affordable Day Care in the Northwest Territories
Reference Number: 442798
2. PURPOSE and DELIVERABLES:
Motion 2617(4) called for the Government of the Northwest Territories (GNWT) to provide a feasibility
study on the concept of universal and affordable child care delivered by people trained in early childhood
development and education, similar to the systems in Québec and Scandinavia.
The contractor (hereafter called the “researchers”) was asked to:
Review the NWT’s child care governance and funding structures, assessing strengths, limitations
and compatibility with the new direction outlined in the Right from the Start: A Framework for
Early Childhood Development in the Northwest Territories and the associated Action Plan.
Explore options for child care delivery and funding mechanisms in the NWT to streamline
administration and better support program stability.
Define options for developing the capacity of a workforce trained in early childhood development
and education for the NWT.
Analyze funding and policy frameworks in the Scandinavian countries and Québec.
Use document analysis and key informant interviews to compare service delivery and funding
mechanisms that support early education and care in Québec, Sweden, Denmark and Norway to
produce a profile that describes, governance, operators, funding, parental contributions and
budgets.
Assess current early education and child care capacity in the NWT. Using document and
demographic analysis supplied by the department and through a survey of child care operators,
analyze current child care service capacity in the NWT to establish current enrolment in child care
programs by region, auspice, age of child and family types using the service (i.e., number of lone
parent families, by family size and age distribution of children and by the labour force participation
of parents).
Assess parents’ child care preferences.
Assess stakeholder capacity for service change.
Conduct a workforce needs analysis.
Develop a cost/benefit analysis including identifying potential changes in workforce participation
among mothers of young children when quality child care is available and quantify the resulting
impact on NWT tax revenue and social transfers; assess the child care sector as a source of local
economic development in two regions of the NWT; and assess the GDP and workforce implication
for public spending on early education and child care in the NWT.
The above is to inform a written report inclusive of:
o Comparison of the NWT funding formula/policy framework to the Québec and Scandinavia
funding formula/policy frameworks
o A cost/benefit analyses of implementing universal child care across the NWT
o An impact analysis of implementing universal child care across the NWT inclusive of
impacts on existing programs

Feasibility study of universal, affordable daycare in the Northwest Territories
6 B. GETTING IT RIGHT FROM THE START
o A summary of the cost/benefits and impacts of implementing universal child care in the
NWT with a list of opportunities/challenges/barriers that would need to be addressed to
move forward.
3. METHODOLOGY
This study uses a mixed methodology, including:
Selected review of the relevant research literature on the impact of ECEC on child, family and
socioeconomic outcomes;
Document analyses of the Right from the Start Framework for Early Childhood Development in the NWT
and the associated Action Plan; NWT Child Daycare Act Standards and Regulations; the Education
Renewal and Innovation Framework: and documents provided by the Department of Education,
Culture and Employment (DECE), on licensed day care availability, program funding and parent subsidy
eligibility;
Reviews of ECEC policy and funding frameworks by the Organisation for Economic Cooperation and
Development (OECD) and the Nordic Council of Ministers.
A profile of Québec’s early childhood policy framework, funding programs and service design
compiled by the researchers;
Updates of two documents prepared for the Department of Education, Culture and Employment:
Review of the NWT’s Child Care governance and Funding (McCuaig, 2014) and Early Childhood
Development Professional Education Strategy (Janmohamed, 2014);
Analyses of NWT statistical and financial data provided by the Department of Education, Culture and
Employment and NWT Bureau of Statistics; and
Qualitative data collection and analysis using informant interviews, focus groups and an online parent
survey to gather perceptions about ECEC, the concept of universal day care and potential opportunities
and barriers to implementing such a program in the NWT.
Focus Groups and Interviews: The NWT Department of Education, Culture and Employment (DECE) developed
a list of key informants based on the sectors suggested by the researchers. The department distributed the
invitations to informants and advertised the focus groups through its communication networks. Three focus
groups were held: one each with home day care providers and parents, and one that included day care centre
and Aboriginal Head Start (AHS) operators and Aboriginal Government administrators. All groups were held
between November 4 and 6, 2014 in the DECE’s main Yellowknife offices. A total of 29 individuals participated
the focus groups, in person or via teleconference.
Twenty-one (21), face-to-face or phone interviews were conducted between November 4 and 6, 2014. In-
person interviews took place in the DECE’s Yellowknife offices or at the informant’s location. Informants
included officials with the GNWT, an AHS director, representatives of non-governmental organizations, school
board staff and trustees, school principals, Kindergarten teachers, day care centre operators and a parent.
An additional 14 telephone interviews were conducted with parents, day care centre and AHS operators
between December 21, 2014 and February 18, 2015, and two written submissions were received, for a total of
66 participants. Table A1 lists the number and type of focus group and key informant participants by category.

Feasibility study of universal, affordable daycare in the Northwest Territories
7 B. GETTING IT RIGHT FROM THE START
Parents’ child care preferences and perceptions of universal day care were supplement by an online parent
survey. The survey was advertised thorough the DECE’s communication channels and available from December
18, 2014 to January 30, 2015. A total of 168 parents completed the survey. Upon completion, participants were
given the option of providing an email address if they wanted a follow-up interview with a researcher. The
researchers emailed 13 participants who made the request. Four participants responded, and phone interviews
were conducted starting the week of February 2, 2015. In total, 19 parents participated in focus groups and
interviews.
Highlights of the key informant and focus group feedback appear in the appendices (see Appendix A).
Interviews for the study were conducted with participants from Yellowknife, Hay River, Inuvik, N'Dilo, Fort
Simpson, Tlicho, Fort MacPherson and Dettah.
The researcher began the focus groups and interviews by outlining the purpose and format of the feasibility
study. The same set of questions was used for all sessions. The language of each question may have been
adapted for the audience, but the core principles remained consistent. Participants received a letter describing
the study and signed a consent form as part of the research process (see Appendix B). Consent forms were
received in person or electronically from those interviewed by phone. The research team agreed to maintain
full confidentiality of the participants and no identifying markers are included in this report. An external party
transcribed all interviews. Raw data are only available to the researchers.
Table A1. Focus group and key informant participants in the NWT by sector and number
Informant area Number of participants
Department of Education, Culture and Employment: Division of Early Childhood and School Services; Policy, Planning and Information Unit; Labour Market Services; Planning Research and Evaluation
8
NWT Bureau of Statistics 1
Trustees and staff of the Yellowknife Catholic School Board 4
Parents with children ages 0–11 years, using and not using licensed day care 19
Licensed day care centre operators 10
Licensed family day home providers 10
Aboriginal Head Start (AHS) directors 7
Aboriginal government administrators 2
Non-governmental organizations 4
Elementary school principals outside the Yellowknife Catholic board 2
Kindergarten teachers 2
Note: Total does not add to 66 because respondents may appear in more than one category
In addition to OECD and related document reviews, the following key informants were interviewed by
researchers to assist in the development of profiles of ECEC policy and funding frameworks in the Scandinavian
countries and Québec:

Feasibility study of universal, affordable daycare in the Northwest Territories
8 B. GETTING IT RIGHT FROM THE START
Anne-Lise Arnesen, Østfold University College, NORDCRIT network (Nordic Research Network: Critical Perspectives on Children, Young People, Welfare and Education). Halden, Norway.
Jan-Erik Johansson, Department of Early Childhood Education, Faculty of Education and International
Studies, Akershus University College of Applied Sciences. Oslo, Norway.
Jan Kampmann, director at the Centre in Childhood, Youth and Family Life Research, Department of Psychology and Educational Studies, Roskilde University. Roskilde, Denmark.
Jill Mehlbye, KORA Danish Institute of Governmental Research. Copenhagen, Denmark.
Anne Kjær Olsen, Director of Projects, Unit for Daycare and Preschool, The Danish Evaluation Institute, EVA. Copenhagen, Denmark.
Tove Mogstad Slinde, Senior Advisor, Department of Early Childhood Education and Care, Ministry of Education and Research Oslo, Norway and representative to the OECD Network on Early Childhood Education and Care.
Alexis Gagné, Strategic Analyst, Foundation Lucie and André Chagnon. Montréal, Québec.
Denis Hébert, Ministry of the Family. Montréal, Québec.
Quantitative data collection: The study used data provided by the NWT Bureau of Statistics and the
Department of Education, Culture, and Employment.
Economic analysis: Input-output analysis, GDP growth predictions and employment predictions were used.
Input-output models capture the interdependence of industries and measure the flow of goods and services
through the economy. Using multipliers and intensity ratios from an input-output model is standard practice in
public policy decision making, and it is common for these models to be used in settings where the impact of an
industry-specific change is of interest. In particular, it can be used to measure the effect of a particular
company expanding its facilities, or the effects of exports increasing in a particular industry, or the effect of a
publicly funded construction project. The analysis in this report uses the same tools and techniques to measure
the effect of an increase in investment of child care as would have been used to measure the effect of an
increase in the construction or mining sector. Relevant economic literature on the economic analysis of child
care was also reviewed and summarized.
Cost analysis: Data were provided by the Department of Education, Culture, and Employment and the NWT’s
Capital Planning Manager. There are upfront costs and benefits to providing job skills training to enhance the
employability of low educated mothers. There are also costs and benefits to raising the qualifications of the
early childhood workforce. These estimations were outside the scope of this study.
Study Limitations: The qualitative data in this study were gathered from informants identified and recruited by
the Department of Education, Culture and Employment. Regional representation was solicited by invitation and
interviews were conducted by phone or in focus groups via teleconference. While efforts were made by DECE
staff to recruit a representative sample of stakeholders, not everyone invited was able to participate. This led
to unevenness in representation from some sectors. For example, the Yellowknife Catholic School Board was
the only board that took part in the study. Costs made it prohibitive to travel outside the Yellowknife area to

Feasibility study of universal, affordable daycare in the Northwest Territories
9 B. GETTING IT RIGHT FROM THE START
hold focus groups or face-to-face interviews. Similarly, participation in the online survey would be limited by
knowledge of the survey, Internet access, literacy levels, survey design and the self-selection of participants.
Ultimately, in studies of this type, a bias exists where communities of regional, cultural or socioeconomic
isolation are underrepresented.
The researchers were unable to create a profile of families using licensed day care. This information was to
have been collected through a survey of day care programs, but scheduling conflicts with another DECE survey
of day care centres and family day homes prevented administration of study’s survey.
The quantitative data in this study were primarily obtained from the NWT Bureau of Statistics and the
Department of Education, Culture and Employment. The quantitative data used in the input-output analysis
were only available at the territory level and were from 2008. No newer data or data from smaller geographical
areas were available. The precise measure of the child care industry was not available and a proxy was used
instead.
In addition, much of the analysis of the labour market effects was hindered by the lack of data available on
labour supply and labour demand in the NWT. Therefore, the analysis includes bounds of estimates—low and
high—based on closest comparable jurisdictions for which data were available. All the analysis was conducted
at the territory level because data to examine smaller geographical areas were not available. The NWT
Community Survey data do not include information regarding family links. As a result, the analysis could not be
done using only mothers and fathers, but instead included all adults. As such, adult siblings, grandparents,
other family members or roommates may have been counted as parents. Assuming a higher prevalence of
multi-family and extended family households in the NWT, this may distort employment estimates. Much of the
data gathered from the NWT Community Survey were suppressed due to small sample size and therefore were
unusable.
Finally, information regarding the scaling formula to estimate capital costs precisely was not available.
PROJECT PERSONNEL
Principal researchers:
Kerry McCuaig, Fellow in Early Childhood Policy, Atkinson Centre/University of Toronto1
Elizabeth Dhuey, Ph.D., Centre for Industrial Relations and Human Resources, University of Toronto2
Zeenat Janmohamed, Ph.D., Visiting Scholar, Atkinson Centre/University of Toronto3
Emis Akbari, Ph.D., Postdoctoral Fellow, Atkinson Centre/University of Toronto4
1 www.oise.utoronto.ca/atkinson/AboutUs/StaffFaculty/KerryMcCuaig/index.html
2 homes.chass.utoronto.ca/~edhuey/index.php
3 www.oise.utoronto.ca/atkinson/AboutUs/StaffFaculty/ZeenatJanmohamed/index.html
4 www.oise.utoronto.ca/atkinson/AboutUs/StaffFaculty/EmisAkbari.html

Feasibility study of universal, affordable daycare in the Northwest Territories
10 B. GETTING IT RIGHT FROM THE START
B. GETTING IT RIGHT FROM THE START
Our children are our future and we should be investing heavily in our future. Start early and give our
children the best chance to be as successful as they can be.
~ From respondent to the online parent survey
This study builds on a wide body of research from across disciplines that documents the benefits of early
childhood education and care (ECEC) for children, families and society. The evidence suggests that accessible,
quality ECEC would deliver similar benefits to the Northwest Territories. The key informant and survey and
focus group participants who shared their views as part of the study were aware of the connections between
ECEC and child, family and societal well-being. Using NWT data, the economic analysis predicts a similar ratio of
costs to benefits from public spending on ECEC as found in studies of comparable regions. The GNWT motion
commissioning this study on the feasibility of universal day care reflects the attention policy-makers across
Canada and internationally are affording early childhood education and care.
Socioeconomic benefits of ECEC
As illustrated in Figure B1, ECEC is associated with a wide range of benefits. ECEC is a job creator in its own
right, while supporting parents as they work or upgrade their skills (Fortin, 2012; Fairholm, 2010; Barnett,
2007). It provides a means of welcoming new immigrant and minority families as it offers opportunities for
inclusion (Bennett, 2011; Winsler, 2008). By identifying problems and intervening early, ECEC decreases special
education costs (Peters,
2010).5 Improved education
ultimately helps to reduce
skills shortages and
expenditures in health,
justice and social services
(Heckman, 2000, 2008;
Fortin, 2012). These, in turn,
have a positive effect on
income inequality leading to
a stronger society and
economy. These goals are
found in the strategic
directions of several
documents of the GNWT,
including but not limited to:
Right from the Start: A
5 Longitudinal research found a $5000/student saving in special education associated with attendance in early childhood education
programs.

Feasibility study of universal, affordable daycare in the Northwest Territories
11 B. GETTING IT RIGHT FROM THE START
Framework for Early Childhood Development in the NWT (2013); Education Renewal and Innovation Framework
(2013); and, NWT Labour Force Development Framework 2011.
ECEC and human development
A significant number of studies indicate that quality ECEC programs can lead to positive effects with respect to
individual academic achievement. Yoshikawa’s 2013 meta-analysis of 40 years of international research
identifies advantages from regular ECEC attendance that persist into adulthood.
Policy-makers now recognize that waiting for the school years to improve academic and social outcomes is
often too late. This realization is grounded in evidence documenting the rapid brain development that takes
place before children start school. It is during these earliest years that children are particularly sensitive to their
environments. Nurturing, stimulation and nutrition interact with genetic predispositions to sculpt the
architecture of the brain and its neural pathways, influencing learning, behaviour and physical and mental
health over the life course.
As illustrated in Figure B2, adversity in early childhood in the form of harsh, neglectful or inconsistent
parenting, combined with poor social demographic factors, has an impact on brain development. This creates a
cascading effect that manifests throughout the life cycle:
In preschoolers: Aggression or withdrawal; developmental delays
In adolescents and young adults: Poor academic performance; greater school dropout rates;
early pregnancy; risky behaviour, including substance abuse; and mental health problems
In adults: Obesity; type 2 diabetes; cancers and heart disease
These in turn create
intergenerational cycles
of poor outcomes.
Quality ECEC programs
have been found to help
mitigate the detrimental
effects of adverse home
and other environmental
factors on early
development (Walker et
al., 2011; Allen, 2011).
The home environment
has the strongest
influence on children’s
competencies prior to
school entry (Sammons,
et al., 2007, 2011; Sylvia
et al., 2008). These
competencies include

Feasibility study of universal, affordable daycare in the Northwest Territories
12 B. GETTING IT RIGHT FROM THE START
language skills, cognitive abilities and the ability to interact with other people. Assessments of Kindergarten-
aged children in the NWT using the Early Development Instrument (EDI) indicate 38 percent of children are
vulnerable in at least one of the above areas of development (DECE, draft). These differences often increase
during the child’s school years. For example, research from the University of British Columbia links vulnerability
as measured by the EDI in Kindergarten to poorer performance on provincial testing in Grades 4 and 7
(Mustard, 2007). Manitoba research links vulnerability in Kindergarten with poor academic results, including
increased grade repetition and early school leaving, at Grades 10 and 12 (Mustard, 2007). Reducing academics
gaps and their resulting long-term social inequities are dependent on improving the competencies of children
before they start school. Quality ECEC programs have been found to amplify benefits for all children and help
to mitigate the detrimental effects of adverse home and neighbourhood environments on school readiness
(Schweinhart, 2012; Magnuson, et al., 2007; Pianta & Howes, 2009). Children who benefit most from
participation in quality ECEC programs, but who are the least likely to attend, are those living in families
disadvantaged by poverty (Prentice, 2007).
A large study from the United Kingdom shows the effect size of home versus outside factors, by age 11 (Sylva
et al., 2008, Sammons et al., 2011). As shown in Figure B3, the home environment, including the health of
family members and family income and socioeconomic factors, exert the most influence on child outcomes.
However, the strongest outside-the-home influencers are participation in ECEC and the quality of early
schooling. The effect size of ECEC was found to be stronger than home visiting, neighbourhood factors or
parenting programs alone. Work from North Carolina even indicates that good quality early education can
compensate children for lower quality primary schooling (Campbell, 2001). These studies provide important
information for policy-makers. While it is difficult for public policy to alter family dynamics, it does exert
considerable influence over the availability and quality of ECEC and primary schooling.
Public policy influences on ECEC
ECEC programs are most effective when they are universally
available; are part of a children’s service network; include
health and parenting supports; and are accompanied by
adequate paid parental leave and income transfers
(Commission on Social Determinants of Health, 2008).
Improving access to ECEC and better integrating it with other
children’s services are existing goals of the NWT’s Right from
the Start ECD framework document.
The GNWT’s feasibility study motion highlighting universal
access and staff training in early childhood development
reflects the international trends. The OECD Quality Network
(Organisation for Economic Cooperation and Development,
2011) lists four factors required for effective ECEC programs:
1. The children regularly attend early childhood
programs. The effect size is greater when programs are
available to all children rather than targeted to children in
low-income families.

Feasibility study of universal, affordable daycare in the Northwest Territories
13 B. GETTING IT RIGHT FROM THE START
2. ECEC programs are adequately staffed.
3. Sufficient numbers of educators have a degree in early childhood education.
4. The teaching approach is child-centred, with a high portion of child initiated activities.
The Network does not set targets for staffing levels or educator qualifications, nor does it specifically define the
curricula. Rather, it finds a correlation between these factors and outcomes for children. These are
considerations for policy-makers as they grow access to ECEC services.
Results from the International Programme for International Student Assessment (PISA)6 tests support these
findings. The 2009 reading assessment of students at age 15 shows that, in most countries, pupils who
attended ECEC programs perform better than those who did not attend. Here public policy makes a difference.
Longer attendance in ECEC programs, smaller child-to-staff ratios and higher public expenditures per child
during the preschool years all enhanced the reading scores of pupils at age 15, as shown in Figure B4. The
largest differences are associated with a higher portion of preschoolers attending ECEC and the number of
years children attend. Increasing the duration of preschool programming is associated with an average 10 point
score increase for each year of ECEC attendance by children ages 3–6 years. These findings would support the
NWT’s consideration of 4-year-old Kindergarten.
The persuasive evidence of the
widespread benefits of ECEC creates a
strong rationale for an efficient, high-
quality service system accessible to all
children and affordable for parents.
ECEC’s positive influence on educational
outcomes makes it a compelling area for
investment. Education is the ultimate
tool to address many economic and
social challenges. It creates wider
options for careers, raises employment
and lowers chronic unemployment,
leading to higher standards of living and
a reduction in the social ills associated
with poverty. A more educated
workforce creates a more innovative and
productive economy.
6 PISA is a triennial survey of the knowledge and skills of 15-year- olds near the end of their compulsory schooling. PISA provides comparative international data in three core-learning areas: mathematics, reading and science. Sixty-five jurisdictions participate in PISA. In Canada, only the 10 provinces participate in PISA.

Feasibility study of universal, affordable daycare in the Northwest Territories
14 C. REVIEW OF THE NWT’S DAY CARE FUNDING, GOVERNANCE AND SERVICE DELIVERY
C. REVIEW OF THE NWT’S DAY CARE FUNDING, GOVERNANCE AND SERVICE DELIVERY
This section7 reviews the NWT’s child governance and funding structures, assessing strengths, limitations and
compatibility with the new directions outlined in Right from the Start: A Framework for Early Childhood
Development in the Northwest Territories and Shared Action Plan, specifically Action Areas 15 & 16.
Action Area 15 of the Shared Action Plan states:
Restructure administration and finance processes for all ECD programs to promote, equity, inclusion,
quality and program stability.
Action Area 16 states:
Provide access to high quality early education programs.
This section also touches on Action Area 9, which states: Support communities to improve the coordination and
alignment between early childhood programs, and Action Area 14, which states: Address the infrastructure
challenges of finding safe and appropriate locations for early programs and child care services as identified by
each community. This section of the feasibility study makes suggestions for ECEC funding mechanisms,
governance and service delivery consistent with the above action area and with the goals of streamlining
administration, better supporting program stability and improving equity of access.
Program Funding
Why do I need to apply year after year when nothing changes? I should be on the floor with the kids. Instead I’m on the phone to ECE.
~ From the interviews
Nine different funding streams support licensed day care in the NWT. As shown in Table C1, three are
reoccurring grants to eligible programs; four respond to specific programming or facility needs; and two
supplement parent fees and the wages of day care centre care staff. The Small Communities Initiative and the
Rent/Mortgage Contribution provide small but predictable amounts to day care operations. The Program
Contributions grant is the major source of public funding, paying a regionally-based per diem according to
attendance. The amounts have not changed since 2007. This is a precarious funding source over which the day
care operator has little control. The major operating cost for a day care centre is staffing. Enrolment will
fluctuate daily, but staffing requirements do not. Home day care providers must operate regardless of the
number of children in daily attendance. The most vulnerable communities are likely to have the greatest
absenteeism rates, placing a particular penalty on programs serving families who could most benefit.
The Early Childhood Staff Grant Program is directed at improving the recruitment and retention of trained staff
in child care centres. The program does not address training incentives for home day care providers, who
supply almost a quarter of the licensed care in the NWT and are less likely to have early childhood
qualifications than day care centre staff.
Designed to reduce administration, the grant is administratively heavy. The application is a three-step process
7 This section updates a March 2014 internal document developed by Kerry McCuaig for the Department of Education, Culture and
Employment covering the same areas of interest.

Feasibility study of universal, affordable daycare in the Northwest Territories
15 C. REVIEW OF THE NWT’S DAY CARE FUNDING, GOVERNANCE AND SERVICE DELIVERY
for eligible staff, to be repeated quarterly when fully operational. Staff register online with the GNWT payroll
system and complete federal tax forms, employers verify hours worked and applications are delivered, mailed
or faxed to regional program consultants for processing. In focus groups, day care operators were concerned
with the process. As employers they feel payroll is their responsibility. Accounting for staff hours and dealing
with the many inevitable questions will add to, rather than reduce, their administrative burden. Operators
question whether already stretched child care program consultants will be able to provide adequate support.
Table C1: Funding streams for licensed daycare in the NWT Funding stream:
Purpose Allocations Eligibility Process Amount (annual)
REOCCURRING FUNDING
Program contribution
Support for day care services
Per diem: Infants $15.60–$26.50 Preschool $10.40–$17.50 School age $2.60–$4.40
Licensed non-profit (NP) day care centres and family day homes. Amounts vary by region.
Renewed annually. Payments based on quarterly attendance records.
$1,995,093
Small communities initiative
Offset high food and programming costs
$15,000 per program NP day care centres in remote communities
By application Single payment
$243,210
Rent/ mortgage contribution
Equalize facility costs Pays up to 25% of rent/mortgage. 50% of allocation to programs in public buildings such as schools
NP day care centres
Annual application Quarterly payments
$75,000
Total reoccurring funding $2,313,303
SPECIAL PROGRAM FUNDING
Health and Safety
Minor capital support for health and safety
Maximum $10,000 annually for centres; $5,000 for homes
Licensed NP day care centres and homes
By application with quotes
$61,663
Healthy Children Initiative
Family/special needs support
Negotiated Licensed NP day care centres and day homes
By application Payment schedule determined by size of contract
$1,050,016
Aboriginal Language Nests
Promote local Aboriginal culture and language
Varies Licensed NP day care with Aboriginal learners
Administered by Aboriginal governments
$972, 000
Startup contributions: Day care centres
Supplies and equipment for new day care centres
Per space funding: Infant $2,340–$3,978 Preschool $1,560–$2,652 School age $390–$663
Licensed NP day care centres. Amounts vary by region.
One-time funding $166,904
Startup contributions: Day care homes
Supplies and equipment for new day care homes
Per space funding: Infant $1,463–$2,487 Preschool $975–$1,658 School age $244–$415
Licensed home day care. Amounts vary by region.
One-time funding
Total program funding $2,250,583
EXTERNAL FUNDING
Income Assistance Child Care Benefit
To offset day care costs of low-income parents
Per diem maximums: Infants (0–24 months) licensed/unlicensed $42/$33
Parents working or going to school full time Determined by a
Paid monthly to parents with receipts and proof of full-time employment or schooling, or
$66,380

Feasibility study of universal, affordable daycare in the Northwest Territories
16 C. REVIEW OF THE NWT’S DAY CARE FUNDING, GOVERNANCE AND SERVICE DELIVERY
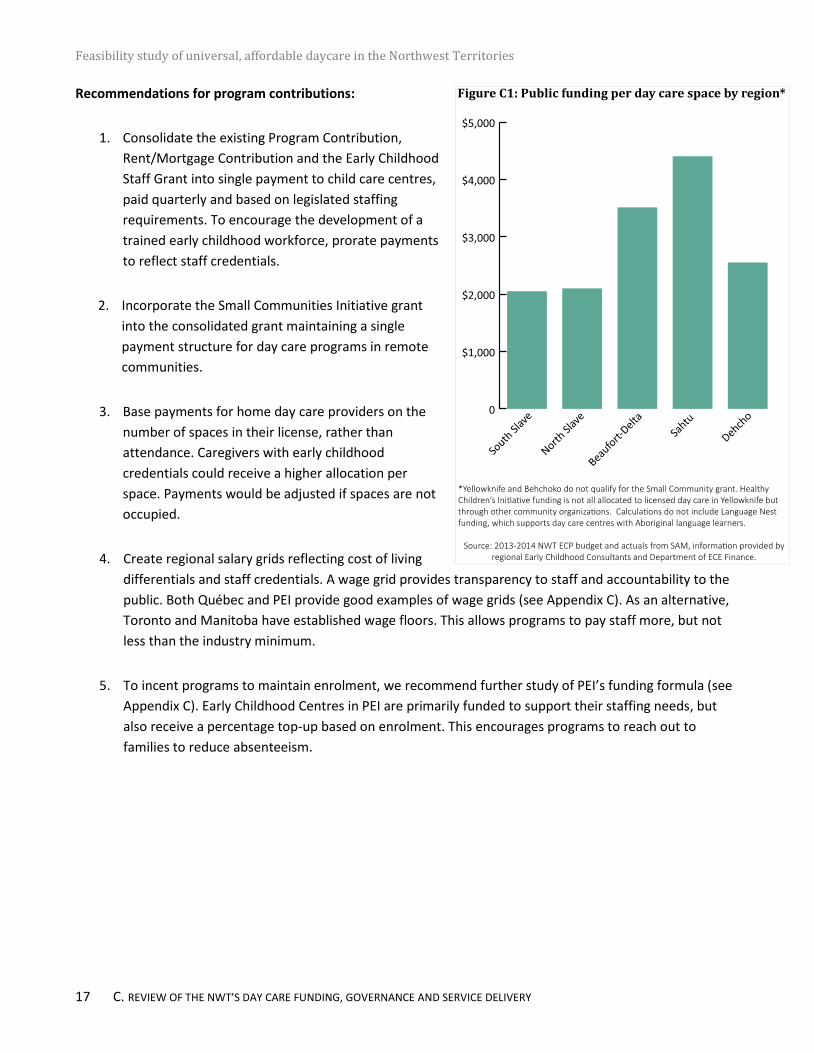
If a day care centre was positioned to apply for every grant, it would involve nine different application
processes for relatively small payments. Figure C1 shows funding per space if a day care centre received all the
grants it is potentially entitled to.
Growing child care in the NWT requires a more stable funding base and a less burdensome grant process.
Consolidating the Program Contribution, Rent/Mortgage Contribution and the Staff Grant Program would
refocus operational funding into a single payment stream to programs. The Small Communities Initiative fund
could also be rolled into the consolidated grant, providing predictable funding for programs in remote
communities. Multi-year grants would allow for program planning and reduce the administrative burden.
Rather than allocating consolidated grant payments on spaces or enrolment, payments should be based on
legislated staffing levels, which are the major reoccurring, non-flexible costs in day care. To ensure funding
improves staff wages, regional wage grids would provide transparency to staff and accountability to the public
and allow for differences in living costs. Tying payments levels to staff credentials and a wage grid would
encourage capacity in the workforce. Consolidated grant payments could be paid quarterly or as deemed
appropriate in consultation with operators.
The above approaches are funding neutral; in other words, they can be implemented without additional funds.
They address deliverables in the Action Plan, including reducing the administrative workload and promoting
program stability by providing predictable funding. At the same time they address wage levels, which impact
the ability of programs to recruit and retain trained staff. Ultimately they provide the coherent base necessary
if the NWT is to grow funding to expand ECEC access and improve program quality.
Others (2–11 years) licensed/unlicensed $39/$28 Part-time preschool: licensed/unlicensed $26/$13 School age/school days: licensed/unlicensed $15/$8
needs test Administered by Income Assistance (IA)
arrangements can be made for IA to directly pay the day care provider
Early Childhood Staff Grant Program
Increase wages of child care staff and encourage training
Approximately $2/ hour 2014/15 – full-time, permanent care staff in day care centre 2015/16 – care staff with ECE credentials
Paid directly to staff upon application. Calculated quarterly. Employer must verify hours worked.
$511,200
Total external funding $577,200
Sources: GNWT. Facts on NWT Licensed Early Childhood Programs, February 19, 2014. GNWT Budget and Estimates 2013-14. Source for wage grant estimate, DECE, October 2013.
Feasibility study of universal, affordable daycare in the Northwest Territories
17 C. REVIEW OF THE NWT’S DAY CARE FUNDING, GOVERNANCE AND SERVICE DELIVERY
Recommendations for program contributions:
1. Consolidate the existing Program Contribution,
Rent/Mortgage Contribution and the Early Childhood
Staff Grant into single payment to child care centres,
paid quarterly and based on legislated staffing
requirements. To encourage the development of a
trained early childhood workforce, prorate payments
to reflect staff credentials.
2. Incorporate the Small Communities Initiative grant
into the consolidated grant maintaining a single
payment structure for day care programs in remote
communities.
3. Base payments for home day care providers on the
number of spaces in their license, rather than
attendance. Caregivers with early childhood
credentials could receive a higher allocation per
space. Payments would be adjusted if spaces are not
occupied.
4. Create regional salary grids reflecting cost of living
differentials and staff credentials. A wage grid provides transparency to staff and accountability to the
public. Both Québec and PEI provide good examples of wage grids (see Appendix C). As an alternative,
Toronto and Manitoba have established wage floors. This allows programs to pay staff more, but not
less than the industry minimum.
5. To incent programs to maintain enrolment, we recommend further study of PEI’s funding formula (see
Appendix C). Early Childhood Centres in PEI are primarily funded to support their staffing needs, but
also receive a percentage top-up based on enrolment. This encourages programs to reach out to
families to reduce absenteeism.

Feasibility study of universal, affordable daycare in the Northwest Territories
18 C. REVIEW OF THE NWT’S DAY CARE FUNDING, GOVERNANCE AND SERVICE DELIVERY
Income Assistance Child Care Benefit Funding
I am a single mother with three children and the GNWT will not help me. I pay $1775 a month for child care, that is not including PD days. I got a subsidy but still pay the caregiver $8 a day. How can I afford that as a student? I’m using my bursary to pay for child care. Child care is not affordable nor accessible and subsidies come with all kinds of craziness. Working and middle class families also need access to subsidies.
~ From the interviews
Parents engaged in full-time work or education may be eligible for day care fee subsidies through the Income
Assistance Child Care Benefit. Several problems have been identified with the program. During interviews,
respondents remarked on the intrusive nature of the application process, the monthly reporting burden, the
low thresholds for eligibility and the low rates paid, leaving too large a gap between the subsidy received and
rates charged. None of the day care program operators interviewed in Yellowknife currently have families
receiving subsidies as clients, and they expressed reluctance to take subsidized families because of payment
difficulties. A few families receiving subsidies were reportedly using day care centres in smaller communities.
The GNWT does not collect information on day care fees. Based on parent and operator interviews, it can be
deduced that parent fees vary across the NWT, with communities such as Tlicho charging no fees, and both
large and small communities charging daily rates up to $62. Parents and operators report that a $6–$18 a day
gap exists between the $42/day subsidy provided for infants and actual costs and a $6–$9 daily gap exists for
older children, depending on program location.
Table C2 summarizes the reported gap between the daily subsidy rates for licensed day care and the daily rates
charged by day care program operators.
Table C2: Gap between day care subsidy rates and fees charged, as reported by operators and parents
Age group Daily subsidy rate licensed day care
Daily fee charged* Daily gap
Infants (0–1 years) $42 $48–$62 $6–$20
Full day (2–12 years) $39 $45–$48 $6–$9
* As reported by operators and parents during key informant interviews and focus groups.
A spending breakdown of fee assistance for licensed and unlicensed care was not available. However, parents
receiving fee subsidies reported using unlicensed care due to its availability, their desire to help out friends or
family members who are caregivers and because unlicensed caregivers were less likely to apply a surcharge. A
policy that steers low-income families to unmonitored care arrangements is contrary to the equity goals of the
Action Plan. Table C3 shows the differential in daily subsidy rates paid to licensed and unlicensed day care
providers based on the age of the child and duration of care.

Feasibility study of universal, affordable daycare in the Northwest Territories
19 C. REVIEW OF THE NWT’S DAY CARE FUNDING, GOVERNANCE AND SERVICE DELIVERY
Table C3: Daily subsidy rates paid in licensed and unlicensed day care
Day care daily rates Licensed Unlicensed
Infant (0–1) $42.00 $33.00
Full-time (2–12) $39.00 $28.00
Part-time (0–5) $26.00 $13.00
Afterschool (6–12) $15.00 $8.00
The prohibition against licensed home day care operating in social housing provided by the NWT Housing
Corporation may limit some of the socioeconomic benefits of day care. For example, under Québec’s universal
child care plan, home day care became a source of employment and a route off social assistance for many lone
parents (Fortin, 2012). Residents of Québec social housing may work as home child care providers. An
evaluation of home day care in New York City public housing found that locating home day care in social
housing was not only a source of child care and employment, it also had a positive impact on community
cohesion and safety (McCuaig, 2000).
The restriction of day care fee subsides to parents in full-time employment or schooling can be
counterproductive. Part-time employment or schooling can be an important transition from social assistance to
work and a critical support to parents addressing health issues or other family responsibilities. Expanding
eligibility for fee subsidies to include families where children are at risk, in the primary care of a grandparent or
other relative and children in foster care would support child protection goals by refocusing resources to
upstream interventions.
Subsidy funding makes up only 1 percent of total public spending on licensed day care in the NWT and served
only 51 families in 2013–14. Given the almost universal agreement that day care fees are high and exclude
many parents from using licensed care, the low uptake indicates barriers exist.
Recommendations to reform the Income Assistance Child Care Benefit:
1. Convert the current needs test for the Income Assistance Child Care Benefit to an income test,
sensitive to family size. This would greatly reduce the administrative burden both for the
department and families. The City of Toronto provides a workable model.8
2. Align Child Care Benefits payments with the actual cost of day care.
3. Expand eligibility to day care fee subsidies to families requiring part-time care, families at risk, non-
parental primary care providers and foster parents.
4. Examine the feasibility of removing restrictions on home day care in social housing.
8www1.toronto.ca/wps/portal/contentonly?vgnextoid=198b5f2bda51f310VgnVCM10000071d60f89RCRD&vgnextchannel=6d3e8ed34c
e9e310VgnVCM10000071d60f89RCRD&vgnextfmt=default

Feasibility study of universal, affordable daycare in the Northwest Territories
20 C. REVIEW OF THE NWT’S DAY CARE FUNDING, GOVERNANCE AND SERVICE DELIVERY
Options for ECEC governance and service delivery
While Kindergarten, child care and family resource programs are administered under a single department,
there remains a schism in the delivery of services. Day care is designed to support parent employment, while
Kindergarten focuses on child development. Separate funding, mandates and oversight for family support and
intervention programs create further divisions and challenges for families. Families, particularly those with
multiple children and/or children with special needs, get their children’s care in one place, education in
another, parenting supports in still another and travel further afield for special needs supports. Reviews of
delivery models in Ontario (Corter et al., 2012; Janmohamed et al., 2014) and Atlantic Canada (HERG, 2012)
found that when programs were consolidated at a single site (usually the school), absenteeism decreased,
there was greater compliance addressing special needs and parental stress was reduced. Staff members
benefited from working in inter-disciplinary teams. Strategies for children with special needs were shared and
applied by all staff working with the children, often reducing the amount of time special interventions were
required. Moreover, integrated programming was found to serve more families for the same costs.
In Yellowknife, home day care is a major service provider. Building a stable system around home day care is
difficult. Sustainability requires an institutional infrastructure that can be grown and maintained during
personnel change over. Public funding devoted to start up, health and safety, operations and quality in home
day care is lost when a provider ceases to operate. Results from Québec and other Canadian studies (Japel, et
al., 2005; Doherty et al., 2000) also indicate that home day care is more likely to provide custodial rather than
developmental care. This is highly likely in the NWT where there are no training requirements for home
caregivers and the maximum number of children per provider ranks among the highest in Canada (see Table
C4).
Table C4: Number of children (0–12 years) per caregiver in regulated day care homes (including provider’s own children) by province/territory
Jurisdiction Max #
Age Breakdown
British Columbia 7 Maximum five preschoolers; three under age 3; one under age 1
Alberta 6 Maximum three under age 3; two under age 2
Saskatchewan 8 Maximum five under age 6; two under age 30 months
Manitoba 8/12 Maximum five under age 6; three under age 2; 12 with two adults
Ontario 6 Maximum two under age 2; three under age 3
Québec 6/9 No more than two under 18 months; nine with two adults
New Brunswick 6/9 Maximum three under age 2; nine if all over 6 years
Nova Scotia 6/8 Maximum six under age 6; eight if all over 6 years
Prince Edward Island 7 Maximum three under age 2
Newfoundland 6 Maximum six under age 3; two under age 2
Nunavut 8 Maximum six under age 6; three under age 3; two under age 2
Yukon 8 Maximum four infants; six preschool children with three infants; eight preschool children with no infants
Northwest Territories 8 Maximum six under age 3; two under age 2
Source: McCuaig (2014)

Feasibility study of universal, affordable daycare in the Northwest Territories
21 D. DEVELOPING A QUALIFIED EARLY CHILDHOOD WORKFORCE FOR THE NWT
Given the underdeveloped infrastructure for day care in the NWT, it would be both difficult and expensive to
build a universal system from the current base. However, there is strength in the NWT school system. Schools
exist in every community. They are designed for children and many have surplus space. There is capacity within
the school infrastructure to directly operate child care and to align child care/early childhood services for
younger children, creating a continuum of care from infancy through Kindergarten and into school.
School boards are also well also placed to address access inequities. As day care licence holders they can
provide options, particularly in small communities where no child care providers exist. The school’s classrooms,
libraries, gyms, playgrounds and kitchens and lunchrooms are able to serve children and families during and
outside regular school hours.
Concerns about schools institutionalizing the care and playtime of children are acknowledged. However,
considerable national and international evidence documents that when schools expand their mandates to
include programming for younger children, after-hours care and family activities, they become more
responsive to the communities they serve. In turn, community trust in schools is enhanced (Corter et al., 2012;
Janmohamed et al., 2014; HERG, 2012).
The following recommendations would operationalize this direction and assumes the continued expansion of
full-day Kindergarten for 4 year olds as an important step in the expansion of ECEC options for families.
Recommendations for ECEC programs for children 4–12 years old:
1. Operators: Direct school boards to offer before- and after- school and holiday programs for
children ages 4 to 12 years. Schools would also be responsible for the provision of holiday and
summer programming but have the option of contracting out summer operations to recreational
centres, summer camps, etc., where available. Schools in consultation with parents would establish
the hours of operation.
2. Staffing: Staff programs for school-aged children with persons with a range of qualifications
responsive to the ages and interests of the children, including cultural and language workers,
recreationists, early childhood educators, child and youth workers, teachers and high school
students; supervised by staff knowledgeable of child development.
3. Curriculum: Use the NWT’s new Integrated Kindergarten Curriculum: A Holistic Approach to
Children’s Learning to guide after-school hours programming for younger children to reduce
transitions for children. The document is grounded in an experiential, play-based approach to child
development. Use validated program approaches to guide programs for older children. High Five is
an example of a developmental program for middle childhood.9
4. Funding and fees: Have schools assume the facilities costs for after school programs, and cover
staff wages and benefits, program supplies, and food with parent fees. Schools could recoup
reasonable administrative costs but would not generate excess revenue from the provision of
9 http://highfive.org/what-high-five/mission-vision-and-principles

Feasibility study of universal, affordable daycare in the Northwest Territories
22 D. DEVELOPING A QUALIFIED EARLY CHILDHOOD WORKFORCE FOR THE NWT
after-school programs. School boards could establish centralized billing and fee collection systems
to reduce the administrative burden. The Region of Waterloo provides an effective example.10
5. Provide school boards with the same Program Contribution funding as available to day care
centres.
Right from the Start Programs for children ages 0–3 years and their families
Existing early childhood programs serving younger children would have the option of becoming Right from the
Start Programs (RSPs). RSPs consolidate existing early childhood services within a community or catchment,
including day care centres, Aboriginal Head Start and home day care, child/parent drop-in, and family resource
and information programs. RSPs would also provide a base for the delivery of pre- and post-natal and special
needs programs and interventions. Programs would follow the RSP curriculum framework (adapted from the
Integrated Kindergarten Curriculum: A Holistic Approach to Children’s Learning), employ appropriately qualified
staff, adhere to an established wage scale and have a parent advisory board.
Home day care providers would be attached to an RSP to participate in professional development and access
programming support and resources. RSPs would also provide an accessible location used by families for the
delivery of intervention and special needs supports. In this way, intervention programs come to families, rather
than requiring stressed parents to bring multiple children to multiple appointments.
Aboriginal Head Start could also join or become the lead agency for RSPs.
Recommendations for programming for children ages 0–3 years:
1. Consolidate current early childhood service and funding streams, including licensed day care centres,
Aboriginal Head Start and home day care homes, child/parent drop-in, resource and information
programs into Right From the Start Programs (RSPs). RSPs provide full-, part-time and occasional child
care for children ages 0–3 years; drop-in play programs for children with their parents/guardians and/or
caregivers; parenting information and resources; and are a platform to deliver public health and
intervention services.
2. Operators: Non-profit agencies and school boards operate RSPs. RSPs could evolve from new agencies or
by expanding the mandates of existing early childhood programs.
3. Staffing: Ensure RSPs employ early childhood educators, family support workers and special needs and
intervention staff. The mix of qualifications responds to the varied needs of families, allows for staffing
efficiencies and provides staff with opportunities to broaden their skill sets to encompass both child care
and family supports.
10
www.wcdsb.ca/schools/Register for School/Elementary Registration/kinder/pdf/FAQ_-_OneList_Billing_Invoices.pdf

Feasibility study of universal, affordable daycare in the Northwest Territories
23 D. DEVELOPING A QUALIFIED EARLY CHILDHOOD WORKFORCE FOR THE NWT
4. Curriculum framework: Adapt the curriculum approach from Integrated Kindergarten Curriculum: A
Holistic Approach to Children’s Learning to meet the developmental needs of younger children and
their families and to provide a developmental continuum into Kindergarten.
5. Location: To support families the preferred location for RSPs is in schools. Newly built and
renovated schools would include designated space for RSPs. RSPs would have priority over surplus
space in schools and enjoy security of tenure.
6. Funding and fees: Consolidate current operational funding streams for day care and family
resource centres, information and referral programs into a single grant to RSPs based on staffing
needs, plus a top-up determined by enrolment. This promotes program stability while encouraging
the RSPs to maximize outreach to families. It reflects the type of funding formula used for after
school care —another step in aligning the two systems.
7. Home day care: Reduce the maximum number of children per home to six as child care access
expands. Per-space funding would be adjusted to avoid financially penalizing providers who lose
clients as a result of the change.
8. Allow programs that choose not to convert to, or merge into, a RSP to continue operating under
current funding and regulatory rules, but ensure all service expansion takes place using the model
of school-operated education and care for 4–12 year olds and integrated Right From the Start
Programs for children 0–3 years.
Recommendations for infrastructure supports:
1. Infrastructure support: Keep policy, development and planning with the Division of Early Childhood and
School Services. Move the child care consultants and their role providing program support and
regulatory compliance from the employment branch to the schools branch to work with school
superintendents. The alignment of child care/early childhood programs with schools requires a single
reporting stream. Superintendents working with program consultants also have the capacity to better
coordinate school and community-based programs within the school environment.
2. Quality assessment: ECERS-R11 is widely used, validated, tool for assessing the quality of early childhood
environments. The department may want to explore other user-friendly tools that can be adapted for
use by day care centres and homes. The DECE may consider posting the quality ratings of programs on its
website to inform parents as they make their child care choices.
3. Transition team: Establish a transition team with representatives in and outside government to provide
expert support to school boards and non-profit agencies adapting to the new service delivery model.
11
http://ers.fpg.unc.edu

Feasibility study of universal, affordable daycare in the Northwest Territories
24 D. DEVELOPING A QUALIFIED EARLY CHILDHOOD WORKFORCE FOR THE NWT
D. DEVELOPING A QUALIFIED EARLY CHILDHOOD WORKFORCE FOR THE NWT
Quality in child care programs is related to staff training and knowledge of early childhood development. A
large portion of the day care workforce in the NWT does not have post-secondary training in ECD. A recent
survey12 of child care staff and operators indicated 69 percent of home day care providers and 49 percent of
centre staff lack formal training. The ECD Action Plan (Action area 21) seeks to raise the qualifications of staff
working in licensed early childhood programs.
A core feature of high quality early childhood programs is practice grounded in the most current research in
childhood development and family engagement. In the NWT, an understanding of the cultural context that
considers both Aboriginal knowledge and the interests of newcomers to the territory are also paramount. The
NWT has a growing population of working families that requires child care alongside an ongoing challenge
where high numbers of children struggle with the language and social competencies necessary for school
success. This context requires educator training responsive to the wide spectrum of families using ECEC
programs.
While the one-year early childhood certificate program delivered through Aurora College has met some
training needs, there have been challenges. These include the length of time students take to complete the
program and the low number of graduates. Staff wanting to obtain an ECE diploma or degree must leave the
NWT. This can be prohibitive, particularly for those with children. In addition, limited capacity within the early
childhood faculty has necessitated the contracting out of teaching to instructors from outside the NWT.
Teaching through teleconference has become the norm in a professional environment that is poised to deliver
courses through online training. Here the NWT is advantaged with a number of media-ready locations to
address access to training in more remote areas.
Meeting ECE training goals
The NWT is not alone in its desire to increase the qualifications of its ECE workforce. Many Canadian
jurisdictions provide scholarships and wage enhancements to incent training. These have had mixed results.
Time and family responsibilities are barriers to training for many in the workforce, and these barriers are
compounded if educators must leave their home community to study.
In 2014, 31 staff were working with children in licensed day care programs with no post-secondary education;
an additional 33 staff were enrolled in ECE courses (Table D1). These staff may have professional and family
experience that could be evaluated for early childhood application. Assuming these individuals have either
completed a high-school diploma or are mature staff members, the DECE could establish a plan of prior
learning assessment (PLAR) that evaluates and certifies previous work experience toward post-secondary
credits. Most Canadian jurisdictions have developed PLAR procedures that could be adapted for the NWT
(CCSHRC, 2009).
12
DECE conducted an online survey of child care staff and operators from December 1, 2014 through January 19, 2015.

Feasibility study of universal, affordable daycare in the Northwest Territories
25 D. DEVELOPING A QUALIFIED EARLY CHILDHOOD WORKFORCE FOR THE NWT
Table D1: Profile of day care staff in the NWT
Region No Post-
Secondary
Early Childhood Course in Progress
Early Childhood Certificate
Early Childhood Diploma
Early Childhood
Degree
Bachelor of
Education
Other Degree
Other Cert. or Diploma
South Slave
3 6 6 1 1 4 0 1
North Slave
18 4 11 12 2 3 1 2
Sahtu 0 0 0 2 0 0 0 1
Inuvik 4 13 6 0 0 0 0 2
Deh Cho 6 10 4 0 0 0 0 2
Total: 31 33 27 15 3 7 1 8
Figures supplied by DECE, 2014
Approaches used in Manitoba have produced promising results and are worthy of consideration. Manitoba
requires home day care providers and assistants working in licensed programs to complete a 40-hour course in
ECD within their first year in the sector. Working with Red River College, Manitoba’s family ministry designed
an interactive, online 40-hour course using the Science of Early Childhood Development (SECD) resource.
Employing a combination of the online SECD course for some staff and classroom options for others, Manitoba
has met its minimum training goals. The DECE has provided day care staff with access to the SECD. Working
with Red River College to develop an online certificate course for the NWT is recommended.
To support workforce needs for diploma level certification, Manitoba funded release time for staff working in
child care centres. Staff members were given one week off per month to focus on their studies. By rotating the
study weeks, the programs were able to provide an opportunity for all their staff to participate. Student staff
members were partnered with trained staff in their program to mentor them through their studies. More than
85 percent of staff enrolled in the work/study program graduated on time. This approach was more successful
than providing paid scholarships alone, than reimbursing staff for their education costs or than forgiving
student loans if graduates remained working in the sector for a minimum period of time. This method could be
adapted to fast-track NWT staff to an ECE certificate.
During key informant interviews, educators and program supervisors expressed an interest in intensive face-to-
face courses over evening or weekend sessions provided via teleconference. Regional one-week institutes
could be structured to provide participants with one course credit toward their ECD certificate. These could be
combined with classroom study and teleconferencing to expedite graduation. We recommend holding two to
three institutes a year.
ECE training recommendations:
Establish an ECE certificate satellite program of Aurora College in Yellowknife to address the growing
need for qualified early childhood practitioners in the city.

Feasibility study of universal, affordable daycare in the Northwest Territories
26 D. DEVELOPING A QUALIFIED EARLY CHILDHOOD WORKFORCE FOR THE NWT
Offer content model courses accredited by other institutions. For example, Yukon College (YC) ECE
Department and the Hanen Centre jointly developed a Children and Language course that is recognized
as a credit in year one of YC’s ECE diploma.13
Establish a mentoring program for ECE students to receive support from qualified early childhood
educators and elementary school teachers.
Attracting and retaining ECE entrants
Raising the qualifications of the ECE workforce requires a commitment of time and resources both for the
educator and for the public. It is therefore important to attract the best entrants to the sector and to create
the conditions for them to stay.
Canadian reviews of the ECE workforce (Doherty, 2000; Janmohamed, 2014) find recruitment and retention are
closely linked to professionalism and remuneration.
Canadian jurisdictions have taken steps to raise the professionalism of the workforce through processes for
professional certification, the development of ECE curriculum and enhancement of training requirements and
compensation levels (McCuaig & Akbari, 2014). The NWT does not track the wages of staff working in licensed
day care, but focus group respondents cited low levels of pay as a challenge to recruiting and keeping staff. A
more universal approach to child care provision will require greater levels of public accountability. As
previously suggested, a wage grid reflecting regional costs of living and qualifications would support
accountability goals. A trained educator working full-time in a Quebéc child care centre earns $39,000 annually.
Adjusted to reflect NWT living costs, an ECE would earn $42,000 on average. Estimates of workforce needs and
costs for universal child care are included in Section H.
Professional recognition is as important as earnings. ECEs often complain that they are dismissed as
“babysitters” and rank very far down the list of jobs with status. Here public education campaigns on the value
of early childhood education and the role of educators have been found to have a positive impact, as have
public sector employment, professional membership and unionization (Janmohamed, 2014). In this regard, the
ECD Action Plan, Area 11 recommending public education campaigns on the importance of early childhood
development could integrate the important contribution early childhood educators make to children and
families.
Recommendations for attracting and retaining ECE entrants:
Implement a professional certification process for early childhood educators.
Support the development of a professional association for ECEs.
Integrate child development into the secondary school curriculum, allowing students to develop dual
credits toward their ECE certificate.
Promote early childhood programs as desired co-op placements for secondary school students.
13
www.hanen.org/SiteAssets/_3_Areas-of-Expertise/Language-and-Literacy/Yukon-College.aspx

Feasibility study of universal, affordable daycare in the Northwest Territories
27 E. FUNDING AND POLICY FRAMEWORKS IN DENMARK, NORWAY, SWEDEN AND QUÉBEC
E. FUNDING AND POLICY FRAMEWORKS IN DENMARK, NORWAY, SWEDEN AND QUÉBEC
Using document analysis and key informant interviews, this section compares the policy and funding
mechanisms that support early education and care in Denmark, Norway, Sweden and Québec. The
Scandinavian countries’ journey to universal child care began in the 1970s with the expansion of the public and
service sectors and the increased demand for women’s labour. Family well-being is supported through tax and
income transfers, family leaves and labour policies to accommodate parents, while child care is offered to
support children’s early development. Québec launched its plan for universal child care in 1997 and has since
added a comprehensive parental leave plan and reformed its child benefit system.
Sweden and Norway share many similarities with the Northwest Territories. They are northern states with up
to half of their territory above the sixtieth parallel. Each has Indigenous populations who are determined to
maintain the integrity of their territory, language, culture and economy. The population is split between major
urban centres, and small, rural and remote communities. In addition, in recent years the population has
changed in Sweden, Norway and the NWT as a result of new immigrants and refugees, and the newcomers are
largely visible minorities. Like the NWT, Québec has worked to take child care to remote areas and has
developed agreements with First Nations governments to support child care in Aboriginal communities.
Governance frameworks
Oversight
The ECEC systems in Denmark, Norway and Sweden are characterized as public models. Public policy plays the
dominant role in the management, funding and delivery of ECEC. Québec’s child care model is a mixed. Child
care policy and funding reside in the public sphere, while service delivery is entirely privatized. In contrast, child
care in the NWT is a market service. Public involvement is limited to regulating private services, and the
majority of funding is derived from parent fees.
Norway and Sweden provides consolidated oversight for early childhood programs. Education and child care
for children ages 0–6 years reside with Sweden’s education ministry. Norway’s family ministry is responsible for
all programming for children prior to school entry at age 6 years. Denmark and Québec have split oversight.
Danish child care is offered for children 0–6 years of age, but non-compulsory preschool, overseen and
financed by education authorities, is also available for children ages 3–6 years. Child care for 0–4 year olds is
the responsibility of Québec’s family ministry, while the Ministry of Education offers Kindergarten for 4 and 5
year olds. In the NWT, the DECE establishes day care standards and program funding, while individual day care
operators set staff wages and parent fees. Aboriginal governments may also provide additional funding and
supports to day care programs. DECE also oversees 4 and 5 year old kindergarten in cooperation with school
boards.
In Denmark, Norway and Sweden, the overall policy direction resides at the national level, while operations are
decentralized to local authorities that are responsible for the planning, delivery and setting and enforcing of
standards. Local authorities also have funding responsibilities, paying a portion of the public cost of child care
and establishing staff wages and parent fees. Service standards and access and parent costs therefore vary by
region.

Feasibility study of universal, affordable daycare in the Northwest Territories
28 E. FUNDING AND POLICY FRAMEWORKS IN DENMARK, NORWAY, SWEDEN AND QUÉBEC
Oversight of child care is highly centralized in Québec. The ministry sets policy, regulatory standards,
operational budgets, parent fees and staff wages for the entire province. School boards oversee Kindergarten.
Unlike the Scandinavian countries, municipalities in Québec have no legislated role. The NWT has a mixed
model. The DECE establishes day care standards and program funding. Individual day care operators set staff
wages and parent fees. Aboriginal governments may also provide additional funding and supports to day care
programs.
Eligibility In Norway and Sweden, the policy goal is to provide child care within a reasonable timeframe for parents who
are working or studying. Unemployed parents and parents on leave are not eligible for child care. Swedish
schools provide a transition year for 6 year olds before the start of compulsory education at age 7. To
accommodate the large numbers of refugee newcomers whose maternal unemployment rates are high,
Sweden offers 20 hours a week of free preschool for children from the age of 3 years in immigrant
neighbourhoods.
Child care is reserved for working parents in Denmark and is widely available. Kindergarten, administered by
education authorities, is available for all 3–6 year olds. Québec aims to provide child care for all children, but
depending on location, wait lists can be long. Québec does not restrict access to working parents, but only a
small number of children of unemployed parents are enrolled. It is common, however, for parents on leave
keep their preschoolers in care while they are home with their new babies. Québec schools provide non-
compulsory Kindergarten for all 5 year olds, while 4-year-old Kindergarten is available in some low-income
neighbourhoods. Over 20,000 children now attend 4-year-old Kindergarten and there are plans to further
expand the program. Funding is available to child care centres to provide 23 hours a week of free programming
for children ages 2–4 years whose families are on income assistance. A minority of eligible families is able to
take advantage of this provision because of limited capacity in child care centres. In the NWT, children are
entitled to 5-year-old Kindergarten, and to 4-year-old Kindergarten where available. Child care is not viewed as
an entitlement service. Child care subsidies are restricted to parents in full-time work or study.
Service delivery Regional authorities in Sweden, Norway and Denmark have considerable autonomy in terms of how they
manage child care. The majority of child care (75 percent Sweden, 85 percent Denmark, 50 percent Norway) is
directly operated by municipalities, but authorities may outsource child care to private agencies. The local
authority retains overall responsibility, and the contracted child care facility must observe all standards and
charge the established parent fee. Private operators are usually churches, parent cooperatives and community
agencies, and include a small number of commercial operators. Private operators are eligible for public
subsidies but are not allowed to make a profit from providing child care. They may take a reasonable
management fee or sell additional services not covered by the rules on parent payment, such as laundering or
grocery shopping. Kindergarten in Denmark for 3 to 6 year olds is overseen and financed by the education
ministry, but may be offered in child care centres, in schools or as a freestanding program.
There is no publicly-operated child care in Québec. Services are provided by non-profit agencies and
commercial operators distinguished by their names. Non-profit child care centres are called Centres de la petite
enfance; commercial centres are Garderies. Child care is provided by non-profit agencies in the NWT. School
boards provide Kindergarten, and some Yellowknife schools offer licensed preschool for a fee.

Feasibility study of universal, affordable daycare in the Northwest Territories
29 E. FUNDING AND POLICY FRAMEWORKS IN DENMARK, NORWAY, SWEDEN AND QUÉBEC
Home child care Family or home child care is a major provider of Québec’s child care services, accounting for 38 percent of all
child care spaces. Family child care agencies under contract with the Ministry of the Family are responsible for
recruiting and supporting caregivers and monitoring day care homes. Family child care agencies may be child
care centres or freestanding non-profit organizations. Caregivers must take 45 hours of pre-service training. In
the NWT, family home care is also a major provider, delivering 26 percent of all spaces. Caregivers are
independently licensed, with DECE regional child care coordinators licensing homes, monitoring regulatory
compliance and administering public funding. No pre-service training is required for providers.
Home child care plays a minor role in Sweden and hardly exists in Norway. In Denmark it supplies 50 percent of
the care for infants and toddlers. In the Scandinavian countries, caregivers are salaried employees of the
municipality. Supervisors with degrees in early childhood education monitor and support the caregivers and
organize training. Pre-service training ranges from one to six weeks.
The NWT is the only jurisdiction in the study to license child care for school-aged children. In the other
jurisdictions under review, education authorities are responsible for out-of-school programs for their students.
The exception is Sweden where municipalities provide “leisure” centres for older children, usually located in
schools. Table E1 summarizes the governance, administration and service delivery options for early childhood
programs in Denmark, Norway, Sweden, Québec and the Northwest Territories.
Table E1: Governance, administration and service providers of early childhood programs by jurisdiction
Jurisdiction Governance and Policy
Administration:
Centralized/
Decentralized
Local authority
Ages served
(years)
Eligibility/
Entitlement
Service providers
Public/Private
Denmark
Child care:
Ministry of Family and Consumer
Affairs Decentralized
Municipalities 0–6 Working parents
Public 85%/ Private 15%
Home child care (HCC) providers are municipal employees
Kindergarten:
Ministry of Education
School authorities
3–6 All Kindergarten-aged children
Schools, child care centres
Norway Ministry of
Children and Family Affairs
Decentralized Municipalities 0–6 Working parents Public 50%/Private 50%
Very little home day care
Sweden Ministry of Education
Decentralized Municipalities 0–6
Working parents and 3–6 year olds in new immigrant communities
Public 75%/Private 25%
Home child care (HCC) providers are municipal employees

Feasibility study of universal, affordable daycare in the Northwest Territories
30 E. FUNDING AND POLICY FRAMEWORKS IN DENMARK, NORWAY, SWEDEN AND QUÉBEC
Funding mechanisms
The majority of funding for child care in Demark, Norway, Sweden and Québec is provided through public
revenues. In the NWT, funding for child care is largely generated by parent fees. As discussed in other sections
of this study, there is a correlation between public funding for child care and maternal labour force
participation and family poverty. In the Scandinavian countries, national governments provide a block grant to
municipalities to support local programs and services, including child care. Municipalities also contribute to
program funding from their own tax base. On occasions when national governments want to address particular
policy concerns, such as improved access for toddlers or preschool for disadvantaged children, specific grants
are offered to incent municipalities to participate.
There is no “funding formula” for child care in the Scandinavian countries. Each municipality determines how
and to what levels it will fund services. Since there are hundreds of municipalities throughout the region
(Denmark alone has 98 municipalities providing child care), there are variations in services. However, there is
also a remarkable similarity. Child care in the Scandinavian countries shares similarities with education in
Canada where each province/territory has its own policy, funding and administrative systems, yet schools in
Saint John’s look and operate very much like those in Whitehorse.
Municipalities are expected to address national goals for child care, but these are aspirational rather than
prescriptive and are focused on promoting child and family well-being rather than legislating staffing levels or
facility requirements. As such, municipal spending is not driven by national regulatory requirements;
municipalities set their own standards. Here again an analogy can be made with education in Canada. For
example, education ministries may have guidelines for class sizes, but school boards and ultimately principals
Schools provide age 6 transition year
Québec
Child Care:
Ministry of the Family
Centralized
Regional offices of the
ministry 0–4
All children but wait lists exist
Private 100%
HCC providers are contracted to non-profit agencies
Kindergarten:
Ministry of Education
School boards 4–6 All Kindergarten-aged children
Schools
Northwest Territories
Department of Education, Culture and Employment (DECE)
Mixed
Regional offices DECE
Day care:
0–6 No entitlement
Private 100%
Home day care is independently licensed
School Districts
Kindergarten:
4–6
All Kindergarten-aged children
Schools
Sources: OECD (2012b; 2013); McCuaig & Akbari (2014)

Feasibility study of universal, affordable daycare in the Northwest Territories
31 E. FUNDING AND POLICY FRAMEWORKS IN DENMARK, NORWAY, SWEDEN AND QUÉBEC
decide how many children are in a class. In the Scandinavian countries, unions representing child care staff play
a deciding role. It is through labour negotiations that local standards are often determined, including wages,
staffing levels and programming supports. Since staffing is the major driver of child care costs, labour
negotiations exert a major influence on municipal child care budgets. It must also be noted that citizens are
vested in their early childhood programs. ECEC is
an integral part of civic identity in the
Scandinavian countries, entwined with promoting
gender equality and a good life for children.15
Local policy-makers respond by ensuring child care
is available.
Since the majority of child care services are
publicly delivered in the Scandinavian countries,
administrative tasks such as payroll, parent fee
collection and ordering program supplies are
centralized with the municipality. Contracted
programs operated by community and
commercial agencies receive the same level of
funding as municipal programs. In general,
municipalities follow a model where staff wages
and benefits are covered by general revenues,
while parent fees are set to cover facility costs,
food, program supplies and equipment.
In addition, national guidelines influence parent
fees. Depending on the jurisdiction, parents
contribute 11–35 percent of overall program
costs. Child care fees account for less than 11
percent of net family income, and fees are further
reduced for low-income families.
Québec’s comprehensive child care network is 85
percent publicly financed. In funded programs,
parents pay $7/day. Parents using private child
care outside the $7/day network may apply for a
tax rebate, which brings their payments in line
with the $7/day care. Québec does not offer further fee reductions for low-income families using child care,
14
In 2015, the MFA transferred $17.9-million to the Government of the Cree Nation to assist with the development, oversight and management of child care services. 15
Scandinavian discourse on child care is more focused on young children in the present as citizens with rights and obligations, as opposed to the Anglo-American focus on children as future workers and citizens.
Québec child care funding
The Ministry of the Family provides funding through basic, supplementary and specific mechanisms. Child care centre basic allowance
Facility cost calculated per space
Occupancy costs calculated per space with a supplement for children 17 months and younger
Funds are paid to the centres on a monthly basis. With the exception of new or expanded facilities, a deduction is made from the grant if the annual occupancy rate falls below 85 percent in some parts of the province and 80 percent in others. Family child care basic allowance
An annualized occupancy rate per space
A daily rate for children aged 59 months and younger, with a supplement for children 17 months and younger
With the exception of new or expanded family child care services, a deduction is made from the grant if the annual occupancy rate falls below 80 percent in some parts of the province and 75 percent in others. Supplementary allowances
Compensate for the fees of parents receiving income security whose children are entitled to 23 hours/week of child care at no fee
One-time funding for equipment and occupancy supplement for children with special needs
Support for additional expenses of facilities in disadvantaged areas
Support for staff professional development Specific allowances
For group insurance plans and maternity leaves
For special projects in northern or Aboriginal communities
14

Feasibility study of universal, affordable daycare in the Northwest Territories
32 E. FUNDING AND POLICY FRAMEWORKS IN DENMARK, NORWAY, SWEDEN AND QUÉBEC
but is expanding access to 4-year-old Kindergarten in disadvantaged neighbourhoods. It also funds child care
programs to provide 23 hours a week of free programming for children ages 2–4 years whose families are on
income assistance. Québec is undergoing a social policy review. Pending legislation could tie fees to family
income with a $15/day cap. On average, programs receive $10,500 per preschool space and $13,500 for an
infant space (>17 months).
Table E2 shows the portion of public funding for child care in each jurisdiction, along with parent fee information, maternal labour force participation and child poverty rates.
Table E2: Funding of early childhood services, parent fees, maternal labour force participation, child poverty rates
Jurisdiction
% of program
costs covered by public funding
Parent fees as a % cost of the program
Parent fees, as % of net
family income*
Public spending
on ECEC as a % of GDP
Maternal labour force participation
(youngest child >6 years)
% children living in poverty
Denmark 80%
Maximum 25%
Low income and single parents pay 0–25%
8.9% 2.1% 84% 6.5%
Norway 85%
Maximum 35%
Low income and single parents pay 0–35%
10.8% 1.7% 84% 6.1%
Sweden 95%
11%
Low income families pay 3%
4.7% 1.9% 80.4% 7.3%
Québec
85%
15% (flat fee, no subsidies)
23 hours free to families on income assistance
5% 1.1% 80.7% 16.1%
Northwest Territories
20% 80% with limited subsidies for low income families
13% 0.4% 68% 24.4%
Sources: OECD (2012b; 2013); McCuaig & Akbari (2014)
Women’s labour force participation is usually associated with higher maternal education levels, greater levels
of equity in families and society and reduced levels of family poverty (OECD, 2008). The correlation between
maternal labour force participation, family poverty and public spending on child care holds for the NWT. An
estimated 68 percent of mothers with children younger than 6 years of age are in the paid labour force in the
NWT, which is 12–16 percentage points behind the participation rate of mothers in Québec and the

Feasibility study of universal, affordable daycare in the Northwest Territories
33 E. FUNDING AND POLICY FRAMEWORKS IN DENMARK, NORWAY, SWEDEN AND QUÉBEC
Scandinavian countries. Child poverty rates are also higher—50 percent higher than in Québec and 225 percent
higher than in Sweden.
Enrolment in early childhood programs
Enrolment in early childhood programs varies by age and service type. Fewer infants are in child care as parents
take advantage of paid leave opportunities. In Denmark, Norway and Sweden, almost all children are in a child
care or Kindergarten program by age 3 (Figure E1).
Quality in early childhood programs
Quality of preschool and child care programs is influenced by
a number of factors. Public policy may include regulations
and standards governing elements such as hygiene and
safety, staff-to-child ratios, group sizes, parental
involvement, training and remuneration of staff, and
curriculum.
Day care legislation in the NWT is consistent with sector
standards for hygiene and safety; staff-to-child ratios; group
sizes and parental involvement. It lags in comparison to
Canadian jurisdictions on program content and staff training.
Curriculum frameworks in place across Canada and in the
Scandinavian countries can be characterized as holistic—
providing equal consideration to all the domains of child
development—and play-based, where learning is guided by
educators and emanates from the child’s interests. The NWT
has a curriculum for its school-based Kindergarten program
but does not offer a program guide for licensed child care.
Table E3 provides an overview of curriculum frameworks for
young children in the Scandinavian countries and Canadian
provinces.
Programs for indigenous populations
Sweden and Norway’s indigenous group, the Sami people, are about 1.8 per cent of the population. Legislation
requires programs to take account of children’s social, ethnic and cultural background, including the language
and culture of Sami children. Early childhood programs in Sami districts must be based on the Sami language
and culture. In other municipalities steps must be taken to enable Sami children to develop their language and
their culture.
Sami statutes must include the aim of strengthening children’s identity as Sami people through use of Sami
language, and by teaching children about Sami culture, ways of life and society. In programs with Sami children
but outside Sami districts, staff are expected to be familiar with Sami culture, and to emphasize it as part of the
curriculum. The Sami Assembly has special grants to establish material and information to and about Sami
preschool programs.. These would be similar to funding to Aboriginal governments in the NWT for Language
Figure E1: Percentage of 0-4 year olds in ECEC
0
20
40
60
80
100
SwedenNorwayDenmarkQuebecNWT
Note: By age 3 over 90% of children in Scandinavian countries are an ECEC program. Enrolment figures for NWT do NOT include 4 year olds in junior kindergarten nor in preschool provided by Yellowknife school boards.

Feasibility study of universal, affordable daycare in the Northwest Territories
34 E. FUNDING AND POLICY FRAMEWORKS IN DENMARK, NORWAY, SWEDEN AND QUÉBEC
Nests in early childhood programs. Quebec also has funding agreements with First Nations to promote
culturally responsive programming for Aboriginal children.
Table E3: Early years curriculum frameworks, NWT, Scandinavian countries, Canadian provinces
Jurisdiction
Age
(years) Early years curriculum framework
Age of compulsory
school (years)
NWT 4–5
Integrated Kindergarten Curriculum: A Holistic Approach to Children’s Early Learning – for Kindergarten only 6
Denmark 0–6 Preschool curriculum Laereplaner 7
Norway 0–5 Framework plan for the content and tasks of Kindergarten 6
Sweden 0–6 Läroplan för förskolan Lpfö 98 7
Québec 0–4 Meeting Early Childhood Needs
6
4 Full-Day Kindergarten for 4-Year-Olds From Disadvantaged Areas (draft)
5 Québec Education Program, Chapter 4, Preschool Education
British Columbia
0-6
Early Learning Framework for 0–5 year olds
Early Learning Framework for 5–6 year olds (used in Grade 1) 6
Saskatchewan 0–5
Play and Exploration: Early Learning Program Guide (also adapted for infants and toddlers)
6 4 Better Beginnings, Better Futures (for pre-K programs in schools)
Manitoba
0–5
Early Returns: Manitoba’s Early Learning and Child Care Curriculum Framework for Preschool Centres and Nursery Schools (also adapted for infants) 6
Ontario 4–5 Full-Day Early Learning – Kindergarten Program
6 0–5 How Learning Happens (Licensed child care)
New Brunswick
0–5
New Brunswick Curriculum Framework for Early Learning and Child Care: English
Le Curriculum éducatif pour la petite enfance francophone du Nouveau- runswick: Fran ais 5
Prince Edward Island 0–4
PEI Early Learning Framework: Relationships, Environments, and Experiences.
5 5 The PEI Integrated Kindergarten Curriculum
Newfoundland In development 6
Alberta In development 6
NU, YK, NS Not available
Sources: OECD (2011); McCuaig & Akbari (2014)

Feasibility study of universal, affordable daycare in the Northwest Territories
35 E. FUNDING AND POLICY FRAMEWORKS IN DENMARK, NORWAY, SWEDEN AND QUÉBEC
Staff to child ratios
Children benefit when adults provide nurturing, stimulating education and respond to their needs in a timely
way. Staff-to-child ratios give a quantitative indication of the frequency of contact between
caregivers/educators and children. Québec legislates child-to-staff ratios in licensed child care programs, while
municipalities set staffing levels in Denmark, Norway and Sweden. In most cases, the younger the child, the
more educators are required. It is not common for children younger than 12 months to be in child care due to
the comprehensive parental leave policies in the Scandinavian countries.
Each jurisdiction has different age groupings. Figure E2 shows the average number of staff per children ages 0–
3 years in child care centres. Staff-to-child ratios in home child care settings are also regulated and are shown
in Figure E3. Ratios in NWT day care centres are within the sector norm but are high for home child care.
Educator training and density by setting
No single indicator reflects the quality of early childhood programming and the quality of interactions between
staff and children. Among the quality factors already discussed, educator training in early childhood
development, and the number of educators are considered leading influencers.
In the jurisdictions under study, the type of service, the service provider and the age of the children influence
Figure E2: Average number of children (0–3 years) to staff in child care centres
0
2
4
6
8
10
NWTQuebecNorwaySweden Denmark
OECD (2010); Akbari & McCuaig (2014)
Figure E3: Maximum number of children per caregiver in home child care
0
2
4
6
8
10
NWTQuebecNorwaySwedenDenmark
Halling-Illum, K. (2009); OECD (2006); McCuaig & Akbari (2014)

Feasibility study of universal, affordable daycare in the Northwest Territories
36 E. FUNDING AND POLICY FRAMEWORKS IN DENMARK, NORWAY, SWEDEN AND QUÉBEC
the training required. Four types of professional groups tend to work with children in ECEC group programs:
Early childhood educators: ECEs in Canada typically have a college level (2–3 year) diploma.
Support staff: Different types of support staff are trained to different levels. On one end of the scale are
support staff with no formal qualifications. At the other end are staff with 1–2 years of vocational level
training, as well as those with an advanced credential to support children with special needs.
Pre-primary/primary/Kindergarten teachers: Pre-primary teachers generally have the same training as
elementary school teachers. In Scandinavian counties, pedagogues working in Kindergarten programs have
university level training with a focus on early childhood development rather than primary teaching. This
level of training is also required for supervisors in child care facilities.
Home/family child care providers: Individuals who provide care for groups of children in their own home
may be part of a network connected to a group child care program or agency (Québec); operate as
independent contractors (NWT); or be employees of a municipality (Sweden, Denmark, Norway). Formal
qualifications are not required, but supervising agencies usually provide orientation training and continuing
professional development.
Table E4 summarizes the qualifications of educators, age group taught, place of work and professional
development required.
Table E4: Qualifications of educators by age group and place of work
Jurisdiction Title Initial training requirements
Age range
(years)
Density of trained
staff Place of work
Continuous training
Denmark
Pedagogue
3–5 year vocational or university education (depending on prior experience)
0–6
70%
Kindergartens and in child care as supervisors Provided by
municipalities
Assistant
2 years vocational school 90% Child care
Norway
Preschool teacher
4 year university degree
0–5 30%
Program leaders in child care
Not specified
Assistant 3 year post-secondary with a 20 week apprenticeship for staff
0-5 50% Child care
Sweden
Preschool teacher
4 year degree 0–7
100% in schools, 60% in
child care
Schools and in child care as supervisors Provided by
municipalities
Assistant 2 year diploma plus 16 week apprenticeship
80% Child care

Feasibility study of universal, affordable daycare in the Northwest Territories
37 E. FUNDING AND POLICY FRAMEWORKS IN DENMARK, NORWAY, SWEDEN AND QUÉBEC
Québec
Early childhood educator
3 year Diplôme d’études collégiales (DEC) or 1 year Attestation d’études collégiales combined with 3 years’ experience
0–4
67% Child care Not required
Northwest Territories
Early childhood educator
1 year certificate 0–12
Goal: 50% staff with certificate
or equivalent
Child care, nursery school, preschool, school-age child care
Required but hours not stipulated
Sources: OECD (2010b); McCuaig & Akbari (2014)
The NWT is alone with Nunavut in having no legislated requirement for post-secondary ECE training for staff
working in child care centres. Recent DECE policy calls for all family home day care operators and primary staff
in centre to have a one-year certificate in early child development or equivalency. According to figures
compiled from a recent survey by the DECE of child care operators and staff,16 only 51 percent of staff working
in child care centres and only 31 percent of home child care providers have any post-secondary ECE training. At
present, 17 of the 111 licensed day care centres are staffed by people with no early childhood training, and
only nine of the 111 centres have the 50:50 ratio of primary staff to support staff required. The Early Childhood
Staff Grant is intended as an incentive to encourage staff to obtain training. Scholarships to support educator
training are also available. The NWT is nevertheless challenged to reach its own training goals, let alone meet
the industry norms in Canada or the Scandinavian countries.
ECEC and the NWT: The gaps
Canada performs poorly on international assessments of access to ECEC and program quality. It is among the
bottom spenders in ECEC, and our children are among the least likely to attend an ECEC program (OECD,
2013a). Among Canadian jurisdictions, the NWT spends below the Canadian average as a portion of its GDP
(Gross Domestic Product) and far below Québec and the Scandinavian countries. To meet Québec’s level of
spending, the NWT’s child care budget would need to increase 175 percent. To spend at the same rate as
Sweden, it would need to increase by 375 percent. To even meet the Canadian average—which is low by OECD
standards (see Figure E4)—would require a 50 percent bump in spending. The NWT also ranks below the
Canada average in terms of spending per child care space. There is almost a $10,000 per space gap between
what Québec allocates and what the NWT spends (see Figure E5).
Providing universal day care with the same rate of enrolment as Québec would require a 56 percent increase in
spaces; at the same rate as Sweden would require an 111 percent increase. The cost of expansion is discussed
in Section H. Concerted efforts are underway in the NWT to raise the qualifications of the early childhood
workforce, and recommendations in Section D are offered to support that goal. It would be opportune to
develop a made-in-the-NWT early years programming guide to embed in educator training.
16
The DECE conducted an online survey of child care staff and operators from December 1, 2014 to January 19, 2015.

Feasibility study of universal, affordable daycare in the Northwest Territories
38 E. FUNDING AND POLICY FRAMEWORKS IN DENMARK, NORWAY, SWEDEN AND QUÉBEC
Figure E5: Spending per child care space 2014
0
$2,000
$4,000
$6,000
$8,000
$10,000
$12,000
QuebecCanada NWT
McCuaig & Akbari (2014)
Figure E4: Public spending on ECEC as a % of GDP
0.0
0.5%
1.0%
1.5%
2.0%
2.5%
OECD Average
DenmarkSwedenNorwayQuebecNWTCanada
OECD (2013a); McCuaig & Akbari (2014)

Feasibility study of universal, affordable daycare in the Northwest Territories
39 F. CURRENT CHILD CARE CAPACITY IN THE NWT
F. CURRENT CHILD CARE CAPACITY IN THE NWT
Child care is available for 39 percent of 0–4 year olds and 13 percent of 5-11 year olds in the NWT. Table FI
shows the number of licensed child care spaces in the NWT for children ages 0–4 years. Table F2 shows
availability for children ages 5–11 years, while Table F3 shows the number of licensed child care programs by
region. Data are based on DECE day care utilization reports for February 2015. Twelve communities in the NWT
have no licensed day care. Of these, Jean Marie River, Kakisa, Trout Lake and Nahanni Butte have no children.
Eight communities with a total population of 162 0–4 year olds are without any licensed day care (Fort Liard,
Colville Lake, Dettah, Enterprise, Lutselk’e, Norman Wells, Tsiigehtchic and Wrigley). These communities are
discussed in more detail in Section H under child care costing.
Table F1: Number of licensed child care spaces for children ages 0–4 years and percentage served
Region Infant Preschool Total # Children 0–4 % served
Beaufort Delta 50 172 222 621 36
Deh Cho 8 49 57 174 33
North Slave 119 614 733 1879 39
Sahtu 4 45 49 361 30
South Slave 35 178 213 473 45
Source: Department of Education, Employment and Culture, GNWT (2015)
Table F2: Number of licensed child care spaces for children ages 5–11 years and percentage served
Region Out of School # children 5–11 years % served
Beaufort Delta 92 725 12.7
Deh Cho 30 329 9.1
North Slave 374 442 84.6
Sahtu 0 261 0.0
South Slave 50 1964 2.5
Total 546 4467 12.2
Source: Department of Education, Employment and Culture, GNWT (2015)

Feasibility study of universal, affordable daycare in the Northwest Territories
40 F. CURRENT CHILD CARE CAPACITY IN THE NWT
Parents surveyed for this study reported being forced to move from their communities to find child care.
Respondents provided accounts of long wait lists, particularly for infant spaces—a particular worry for parents
returning to work after parental leave. Finding part-time care and care in their neighbourhood was a challenge
for some. Those with more than one child cited difficulties finding space for their children with the same
caregiver. Multiple caregivers often lead to long commutes and work conflicts. Considering these were the
respondents willing to pay the fees charged by licensed child care, it can be assumed that the barriers are
compounded for low income families.
From the interviews:
We are forced to leave our community this year due to lack of child care.
I work part-time, and it was very difficult to find a licensed day home that would take on a part-time child
under 2.
Finding child care in this community is almost impossible. The cancellation of JK for next year is making it
even more difficult.
We’re expecting and with two children at two facilities it will be a problem. Working standard hours 8:30
to 5:00 makes multiple drop offs and pick ups impossible given traffic patterns.
There are no day cares/day homes or Head Start Programs available in our community. Going back to work
next year is going to be a struggle, as we currently have zero options for child care.
As a single mom to a 10 month old child I can say that my career as a teacher will most likely need to be
put on hold because there are little to no child care spots in licensed day homes within our community.
I’m out the door with the two youngest by 7:15. My dad waits with my 5 year old until the bus comes at
7:55 bus. I’m at the day home by 7:30 and rush to make to work by 8. Don’t know what I would do without
my dad.
I typically have 10 to 15 families on my waitlist (Family child care provider).
Table F3: Number of licensed child care programs by region
Region Centre Out of school Family Home Preschool Total
Beaufort Delta 1 1 1 1 11
Deh Cho 1 1 0 2 4
North Slave 12 12 32 4 71
Sahtu 1 0 0 2 3
South Slave 2 2 13 5 22
Total 35 16 46 14 111
Source: Department of Education, Employment and Culture, GNWT (2015)

Feasibility study of universal, affordable daycare in the Northwest Territories
41 F. CURRENT CHILD CARE CAPACITY IN THE NWT
Parent child care preferences
Through focus groups, key informant interviews and an online survey, respondents were asked about parents’
child care preferences and the barriers to their participation in licensed day care. Participants were asked their
views of universal child care and what a universal system means to them, including such areas as costs,
availability, location, hours of service, staffing, cultural responsiveness, funding and governance. The online
survey, directed to parents with children ages 0–11 years, solicited parent views on the cost, availability and
quality of child care. It also asked parents about the types of children’s services they use and how frequently
they use them. During the interviews, parents reported using school and community programs to supplement
care arrangements and the researchers wanted to explore this further in the survey.
Feedback was gathered from November 4, 2014 to February 18, 2015. In total, 168 parents responded to the
survey and 19 participated through focus groups and interviews. The methodology is discussed in Section A. In
studies where participants self-select, there is a bias toward an overrepresentation of more highly educated
respondents and those living in larger communities. This holds true for this study. To help compensate, efforts
were made to hold more in-depth interviews with respondents who did not fit the dominant profile.
Demographic profile of respondents
Respondents were mainly Canadian-born (90 percent) women (84 percent), living in Yellowknife (80 percent),
with a married or common-law spouse (86 percent). Over 85 percent had post-secondary education, with over
half of those holding a university degree (54 percent). Six percent of respondents identified as Aboriginal.
The majority (74 percent) worked full-time, 6 percent worked part-time and 9 percent were on parental leave.
Only 1 percent was unemployed or studying, and 9 percent were at home parents.
English was the first language for 90 percent of respondents, while 8 percent reported French as their first
language, 1 percent reported an Aboriginal language and the remaining 1 percent spoke Chinese, German or
another language. However, 5 percent spoke an Aboriginal language as a second language and 40 percent of
respondents identified French as their second language. About 12 percent spoke more than one language in
the home; most respondents in this category reported they used one language when addressing a spouse and
the other when speaking with the children.
More respondents had preschool-aged children than school-aged children. The ages of the preschool children
were evenly distributed, an indication that the issues raised persist across the preschool years and well into
early primary grades. The following graphs show demographic information about the respondents.

Feasibility study of universal, affordable daycare in the Northwest Territories
42 F. CURRENT CHILD CARE CAPACITY IN THE NWT

Feasibility study of universal, affordable daycare in the Northwest Territories
43 F. CURRENT CHILD CARE CAPACITY IN THE NWT
Services used
Parents made good use of the services available to them. Almost 38 percent used a child care centre, most of them
full-time. Home child care was the pick of 42 percent of respondents, while school-age programs served 23 percent.
These percentages are consistent with the availability of licensed care for children 0–4 years in the NWT, but are
above the availability rate for school-aged care. This higher reported use of school-age care likely reflects the large
number of respondents from Yellowknife who have access to care programs offered by schools.
Use of Aboriginal Head Start is under reported, which would be expected given the small number of Aboriginal
respondents. Junior Kindergarten and nursery school served 19 percent and 18 percent of respondents respectively.
Parents reported heavy use of community services, with 78 percent regularly using recreation programs, 62 percent
using a public library and 20 percent using family resource or drop in programs. As indicated in the following graphs,
given the number of hours per week some children are enrolled in AHS, JK and nursery school, it could be assumed
that these programs are also meeting child care needs. It could also be assumed that community services are
supplementing other care arrangements. This would be consistent with the feedback received during the focus
groups and interviews.

Feasibility study of universal, affordable daycare in the Northwest Territories
44 F. CURRENT CHILD CARE CAPACITY IN THE NWT

Feasibility study of universal, affordable daycare in the Northwest Territories
45 F. CURRENT CHILD CARE CAPACITY IN THE NWT
Service satisfaction
As shown in the following set of graphs, the majority (76 percent) of parents were aware of the programs in their
community, but their satisfaction with those programs was mixed. Almost 40 percent were not able to access the
programs they wanted. And while 70 percent felt their child benefited from the programs they attended, only 55
percent were satisfied with program quality. Most respondents (70 percent) said early childhood programs helped
them as a parent, but they would like staff to engage more. Only 27 percent felt staff consulted them, while 35
percent felt staff members kept them informed about available programs and services in the community.
From the parent survey and interviews:
Language barriers are huge issues, as is the lack of fully educated child care providers.
I rely on unlicensed child care because my experience with licensed child care has not always
been up to par. The “safeguards” for many licensed facilities is lacking.
Perhaps the GNWT could consider giving more money to the parents with children in day care,
and less money to the licensed day homes that do not always put the money into the day
home.
A quality day home or day care is very hard to find because there are no quality standards
(such as cleanliness, providers who have qualifications, being able to actually care for children
instead of having the television on). To find a perfect day home is very rare and those that take
pride in their work are always full.
I have expectations of care, like no junk food, no TV, etc. and this was hard to find. The ones
that we did find were really expensive.
I would like staff to be professional. I had to break apart two staff fighting at my son’s day care.
My child is going to one of the better ones but it is going to be a huge issue for me if/when I
have another child and do not get into the same day home as there are very few day homes
with the same standard of care.

Feasibility study of universal, affordable daycare in the Northwest Territories
46 F. CURRENT CHILD CARE CAPACITY IN THE NWT

Feasibility study of universal, affordable daycare in the Northwest Territories
47 F. CURRENT CHILD CARE CAPACITY IN THE NWT
Impact of service cost on family life
Coupled with the limited availability of child care, parents were most likely to cite the high cost of care and the
impact on their family life as a problem (see the following graph). The vast majority of respondents (90 percent) said
finding child care was difficult, while 82 percent reported that paying for it caused them stress. Despite the
overrepresentation of highly educated parents who are unlikely to qualify for child care fee subsidies, 38 percent of
respondents still found it very difficult to access a fee subsidy. Respondents reported spending half their income on
child care, sometimes as much as their monthly mortgage payment or rent. Some changed their work or left jobs
because of costs. Others took on debt, while still others struggled to complete their own education as they tried to
pay for their children’s early education and care. Parents who had managed care with one child found the
complications of finding and paying for care for two children very difficult.
From the parent survey and interviews:
Child care is so expensive. As a single parent, I pay $800 per month but when I need alternate
child care, I use a day care centre and get charged $67/day.
The cost of child care is prohibitive and is the reason why I had to take a leave of absence from
a well-paying job for a year.
Child care is very expensive and my husband and I work opposite schedules so that we do not
have to pay for this service.
I struggle with getting jobs and the most difficult obstacle to returning to my education is
finding child care. The living cost in the NWT is crazy, but it is my home and I want to support
my children to further their goals and education to have a better life than myself. Having free
programs would benefit a lot of parents.
My 7 year old and my 4 year old attend preschool at (school) and we will be putting our twins
there when they are of age into preschool. Hoping preschool will be subsidized by then. Child
care costs are so high in Yellowknife.
Child care is very expensive here in the North. There is no cap on how much to charge the
parents. The day home charges between $45 and $55 a day—that’s more than half of a single
family’s income.
There are many months that I live off my MasterCard. My MasterCard hasn’t seen a zero
balance in a long time.
A day care spot came up two months before my mat leave was up. I paid the two months
otherwise the spot would have been gone.
I had a good job but with three children, I couldn’t afford child care. I had to quit my job.

Feasibility study of universal, affordable daycare in the Northwest Territories
48 F. CURRENT CHILD CARE CAPACITY IN THE NWT
Full-day Kindergarten for 4 year olds
Many of the parent comments concerned Junior Kindergarten. While only 19 percent of parents had a child
attending Junior Kindergarten, support for the program was high. Almost three quarters (73 percent) would like to
see Kindergarten for 4 year olds in their local school, while 11 percent disagreed. A total of 73 percent also felt
children would benefit from Junior Kindergarten. About two-thirds (65 percent) felt Junior Kindergarten would be a
support to their family and help reduce the high costs of child care. (See the following figures.)
Those with reservations about Junior Kindergarten supported the concept but want increased resources for the
program. They were worried about its potential impact on day care operators or feared it would detract from
existing school programs and add to the workload of teachers.
Few parents disagreed (4 percent) with schools playing a more active role in providing child care and other
children’s services.
From the parent survey:
Before putting Junior Kindergarten in here you need to look at the other preschools to make
sure you are not going to close them. People will chose free over paying hundreds of dollars a
month regardless if it is the program they want for their child.
Having Junior Kindergarten in the schools will effectively destroy the fabulous day homes that
are running in the city, which will leave me with no one to care for my infant!
I do agree with offering preschool/Junior Kindergarten but not at the expense of taking funds
away from other areas in the school system.
I agree with Junior Kindergarten; I do not agree with how they implemented it without any
extra funding to the school boards. The teachers are already overworked as it is.
I agree with Junior Kindergarten; I do not agree in the way it was presented or the funding

Feasibility study of universal, affordable daycare in the Northwest Territories
49 F. CURRENT CHILD CARE CAPACITY IN THE NWT
limitations it faced. My older kids should not suffer because of fewer funds.
Preschool is a good program but it needs to be funded properly. New programs must come with
new money.
Quality early childhood programs and facilities can have a massive and integral impact on
children's lives but that is only true if the programs are staffed, funded and run appropriately.
Junior Kindergarten is a wonderful idea, with bad implementation. Had the GNWT wanted full
buy-in from all then it should have just taken the money from the Road to Tuk that is costing
WAY too much money for what it will bring to the North. Having JK will bring far more to the
North than that road will and it costs way less.
No Junior Kindergarten! It's time the government stops trying to get involved with the
parenting of our kids! Didn't they get enough with Residential schools? Children should be
home with their parents.
I was dismayed to see that during the discussion of Junior Kindergarten there was a lot of
discussion surrounding the financial impact to existing child care providers and very little
discussion surrounding the financial impact to families.
I believe that Junior Kindergarten would be a great addition to our education system for ALL
NWT children.
To hear politicians talk you would think there was a massive child care market that would be
disrupted by JK programming. Instituting this from my perspective as a parent would save me
12K a year in child care costs, and give the opportunity to other parents who are not as
fortunate as I am to have a good job, to give their kids a chance.
I believe very strongly that there are different demographic groups that would STRONGLY
benefit from this early childhood development program. I hope that it comes into fruition and
was disappointed to hear that it was being delayed/pushed back/possibly cancelled altogether.
FDK would save me $325 a month.

Feasibility study of universal, affordable daycare in the Northwest Territories
50 F. CURRENT CHILD CARE CAPACITY IN THE NWT

Feasibility study of universal, affordable daycare in the Northwest Territories
51 G. DAY CARE SERVICE PROVIDERS’ CAPACITY FOR CHANGE
G. DAY CARE SERVICE PROVIDERS’ CAPACITY FOR CHANGE
A total of 15 day care centre and Aboriginal Head Start operators and 10 home day care providers took part in
this study through focus groups and interviews. In addition to soliciting their views on universal child care and
how it might look in the NWT, the study also explored operator/provider views on the actual and perceived
impacts of universal child care on current day care service delivery.
Perceptions about universal child care differed by program type. Home care providers were less likely to see
advantages in system change. Limited child care options have generated a large client group of parent who will
pay market fees. Providers report sizeable wait lists. Particularly in Yellowknife, this offers them a choice in the
families they serve. Some providers expressed concern that universal child care would hurt their business
plans, depress fees or require them to acquire an ECE certification.
Home care respondents are interested in regulation changes that would allow them to specialize in different
age groups—for example, all infants or all preschoolers—or to hire an assistant to expand the number of
children in care. Home child care providers have a difficult time envisioning how they would fit into a broader,
more integrated service system. For example, none of the caregivers interviewed provide care to children with
special needs. Some even felt it is risky to discuss children’s possible developmental delays because parents
may withdraw their child.
Providers from outside Yellowknife expressed interested in the Scandinavian model of home care, where
providers are municipal employees.
Comments from the home daycare focus group:
If child care was universal it would hurt my business.
There’s money to be made in child care in the NWT. Not everyone will like this.
NWT parents are accustomed to paying for child care. Free or low cost care will lead to closures of day
homes and parents won’t be able to afford to the increase in taxes.
I would like to specialize, just preschool or just infants, but I would need four infants to be viable.
Day care centre and Aboriginal Head Start operators were more concerned with improving the current system
than contemplating a universal one. They felt program grants should reflect cost of living changes, with multi-
year contracts rather than annual applications: “Create multiyear funding agreements. Why do it annually
when nothing changes?”
Operators indicated they are frustrated by the delayed roll out of the wage grant. As employers, they feel they
should be responsible for payroll. Most were concerned that staff will have difficulty keeping on top of the
filing requirements and will ultimately come to them as supervisors, adding to their administrative load: “It’s
hard enough for us to get answers from [the Department of] ECE. I can’t imagine how it is going to handle
hundreds of phone calls.” Others felt the wage subsidy needs to recognize cost of living differences in the
regions. Some day care operators are already paying the increase to their staff in the hope they will be
reimbursed.

Feasibility study of universal, affordable daycare in the Northwest Territories
52 G. DAY CARE SERVICE PROVIDERS’ CAPACITY FOR CHANGE
Day care centre operators, particularly the smaller-sized centres, are seeking more pedagogical support. They
want improved communications with DECE and better program resources and guides. Some reported adapting
the new NWT Kindergarten curriculum to meet the needs of younger children. Operators value ECE
qualifications and training, not only for staff but for directors (and many mentioned Kindergarten teachers) as
well. Some cautioned that expanding access to child care should not come at the expense of trained staff: “If
universal child care proceeds, focus on training at the front end.”
Recruiting and retaining qualified staff was a constantly raised concern, as was low salaries. But just as
problematic was finding the time for staff to participate in workshops and courses. Many centre and AHS
operators provide their own off-hours training and incent their staff to engage by tying training to
compensation. They want their staff to be paid to participate in professional development provided by DECE
and to have training count toward a certificate or diploma. They also recommend consistent program
standards for courses and practicum and intensive training sessions to be held in the communities. Pre-service
training should be split between community locations and college locations to incent more diversity among
new entrants to the field.
Operators recognized that parents struggle to pay for their children’s care. They differed modestly in their
views about how much parents should pay. Many maintained, “It should be free, like school,” while other
would support fees “based on the family’s ability to pay.”
Some AHS operators feel they already provide universal child care, either because the programming they offer
charges no parent fee or they already provide both AHS and child care and want to integrate further with
family resource and prevention and intervention services.
Assessing service providers’ capacity for change is speculative in the absence of a detailed plan for universal
child care. Based on limited feedback, it could be suggested that day care centre and AHS operators are more
receptive to the concept than home day care providers. During system change of this type, previous studies
indicate that stakeholder cooperation is directly related to the incentives offered and the quality of the
communications before, during and after the transition (Pascal, 2009; Flanagan, 2010).
Table G1 provides a summary of the areas of interest and comments provided by the study’s participants in
relation to their perceptions of universal child care and what it might look in the NWT.
Table G1: Summary of focus group, interview and parent survey opinion on universal child care in the NWT
What respondents want Comments
More clarity about “universal” day care
What does it mean?
Should include all early childhood programs: Aboriginal Head Start, Family Resource Programs, Kindergarten
Support the concept with caveats
Child care to be valued For children, for families, for society, for the economy
Parents to be involved in their children’s early learning
More opportunities to participate and to access parenting supports
Holistic programming Playful environments that respond to the whole child, not narrow

Feasibility study of universal, affordable daycare in the Northwest Territories
53 G. DAY CARE SERVICE PROVIDERS’ CAPACITY FOR CHANGE
academic outcomes
Child assessments Not testing, but assessments to identify and intervene if potential developmental delays
Program transparency Quality monitoring and results posted so parents are informed
More flexible hours and hours that meet parent work schedules
But properly funded
More coherent service delivery More service integration between health, education, community and social services
Schools acting as service hubs
Easier access to intervention programs for children with special needs
Fostering respect and diversity For each other and for the land
Qualified staff Who are adequately paid, nurturing and knowledgeable, not only about early childhood development but about the North, its people, culture and traditions
Better training opportunities for staff
Staff appreciates the Science of Early Childhood Development as a training resource but want paid time for upgrading and more intensive group learning opportunities
A common program guide Developed by the broad early childhood workforce for the NWT
Fair fees Free access or reasonable fees determined through a sliding scale with a cap
More accessible fee subsidies
More public funding To support quality, educator training and more affordable fees
Full-day Kindergarten Important because it’s for all children
Adequately funded to support children’s school readiness and relieve parents of high child care costs
See Appendix A for highlights from the participant comments.

Feasibility study of universal, affordable daycare in the Northwest Territories
54 H. THE COSTS AND BENEFITS OF PUBLIC SPENDING ON CHILD CARE
H. THE COSTS AND BENEFITS OF PUBLIC SPENDING ON CHILD CARE
This section examines the impact of child care spending on government budgets and on the economy. It
considers the potential of the child care sector as a stimulus for economic growth, as a creator of jobs in its
own right and as a labour market support for women with young children. Using the jurisdictions discussed in
this study as comparators, it calculates a low-end cost for universal child care in the NWT along with a high-end
cost. It also conservatively estimates potential high and low end benefits measured by the impact of increased
spending on the GDP, on changes to employment and on government revenues.
The Child Care Sector as a Source of Local Economic Development
The benefits and costs of the child care sector can be illustrated by calculating multiplier effects. Public money
for child care creates a ripple effect of spending; in other words, a dollar invested in child care leads to
increased spending in other industries. For instance, child care programs spend money on supplies, food and
rent, which in turn impacts other businesses. Therefore, it is important to quantify all the effects of spending in
an industry on the entire economy.
An input-output analysis can be used to estimate the effect of child care spending on local economic
development. This analysis is a quantitative economic technique that estimates the interdependencies
between different industries in an economy. Government and private industry commonly use these estimates
to determine the effects of investing in a particular industry. The child care sector’s impact on local economic
development can be estimated using an input-output model. The multiplier estimated from this type of model
will illustrate the rise in overall economic activity in the short- or medium-run per dollar increase in child care
spending.
Table H1 lists the multipliers calculated for child care from a wide variety of sources and for a range of regions.
These multipliers do not include estimates of the money spent in households on other goods due to a change
in child care services. For example, they do not include the effect of a family buying more food, clothing and
supplies as a result of the increased government spending on child care. If these induced effects were included,
the estimates would be significantly greater, however there is some debate regarding the magnitude of the
bias of these estimates. Therefore, to be conservative, we did not include these effects in the analysis for this
report.
Table H1 lists both a GDP (gross domestic product17) multiplier and an employment multiplier. A GDP multiplier
for the child care industry estimates the total value added to the entire economy by each dollar of increased
direct spending on child care services. The employment multiplier is an estimate of the number of jobs that
would be created by the addition of one new job in the child care industry.
For example, Prentice and McCracken (2004) calculated a 1.16 GDP multiplier and 2.15 job multiplier for
Winnipeg, Manitoba. This means that for every dollar spent on child care in Winnipeg, $1.16 is returned to the
economy in increased spending. Every additional job in child care creates or sustains 2.15 jobs.
As can be estimated from the data in Table H1, the average GDP multiplier for North America is 1.56; the
17 The GDP is the monetary value of all the finished goods and services produced within a particular region during a specific time
period.

Feasibility study of universal, affordable daycare in the Northwest Territories
55 H. THE COSTS AND BENEFITS OF PUBLIC SPENDING ON CHILD CARE
minimum multiplier is 1.16 and the maximum multiplier is 2.02. In addition, the average employment multiplier
is 1.34, the minimum is 1.17 and the maximum is 2.15. The magnitude of the multipliers varies due to the
differing levels of interconnectedness of various industries in particular regions. The most relevant comparisons
for the NWT that have been calculated in the literature would be the multipliers for Thompson, Manitoba (1.58
GDP and 1.49 employment), Alaska (1.47 GDP and 1.27 employment) and North Dakota (1.53 GDP and 1.31
employment). None of these are exact matches, but were chosen based on the comparative population size
and disbursement, Aboriginal identity and per capita GDP.

Feasibility study of universal, affordable daycare in the Northwest Territories
56 H. THE COSTS AND BENEFITS OF PUBLIC SPENDING ON CHILD CARE
Table H1: Multipliers calculated from various regions in Canada and the United States
Reference Region GDP
Multiplier Employment
Multiplier
Prentice & McCracken (2004)1 Winnipeg, Manitoba 1.16 2.15
Prentice (2007a)1 Parkland, Manitoba 1.58 1.49
Prentice (2007b)1 St. Pierre Jolys, Manitoba 1.58 1.49
Prentice (2007c)1 Thompson, Manitoba 1.58 1.49
Fairholm (2010)2
Ontario 2.02 1.85
Greater Toronto Area 1.9 1.85
Toronto 1.9 1.85
Centre for Spatial Economics (2009)2 Canada 1.9 2.11
Bartik (2006) United States 3.79
Pratt & Kay (2006) New York State 1.35
Warner (2009) United States 1.49
Liu, Ribeiro & Warner (2004)
United States 1.94 1.41
Alabama 1.44 1.24
Alaska 1.47 1.27
Arizona 1.52 1.27
Arkansas 1.51 1.3
California 1.52 1.25
Colorado 1.54 1.27
Connecticut 1.51 1.25
Washington D.C. 1.42 1.19
Delaware 1.44 1.25
Florida 1.48 1.25
Georgia 1.45 1.2
Hawaii 1.48 1.29
Idaho 1.53 1.33
Illinois 1.59 1.28
Indiana 1.43 1.23
Iowa 1.52 1.29
Kansas 1.56 1.32
Kentucky 1.46 1.25
Louisiana 1.47 1.26
Maine 1.46 1.29
Maryland 1.5 1.26
Massachusetts 1.49 1.26
Michigan 1.5 1.25
Minnesota 1.6 1.32
Mississippi 1.32 1.18
Missouri 1.6 1.31
Montana 1.53 1.32
Nebraska 1.51 1.28
Nevada 1.37 1.17
New Hampshire 1.49 1.28
New Jersey 1.46 1.21
New Mexico 1.56 1.34
New York 1.52 1.26
North Carolina 1.43 1.22

Feasibility study of universal, affordable daycare in the Northwest Territories
57 H. THE COSTS AND BENEFITS OF PUBLIC SPENDING ON CHILD CARE
To examine the NWT in particular, this report will use intensity ratios calculated by the NWT Bureau of
Statistics (these ratios are slightly different than the multipliers in Table H1 and the magnitudes are not directly
comparable).18 These intensity ratios are from models based on 2008 input-output tables and include the most
up-to-date information currently available.19 The NWT Bureau of Statistics calculates an open version of the
input-output model which provides estimates of the direct and indirect economic effects of 42 industries on
the territory’s economy.20 Similar to the multipliers in Table H1, the effect of increased household
expenditures, or the induced effects, is not included. The intensity ratio includes both the direct and indirect
effects. The direct effects can be considered the first round of impacts. This first round includes the potential
impact on the GDP of those industries that expand production to satisfy the increased demand for their
product. The indirect effects result from backwards linkages in the economy, when the firms producing the
commodity purchase additional goods and services from other firms. In the case of child care, the direct effects
are the effects from the child care industry itself. The indirect effects are the effects of the child care industry
on other industries through the purchase of food, janitorial services and supplies.
Table H2 lists the industry intensity ratios calculated by the Bureau of Statistics for 42 industries in the NWT.
The table includes the ratios for GDP per dollar of output, income per dollar and jobs per million dollars. It also
includes the relative ranking of the industry by those metrics. The intensity ratios are calculated by dividing the
18
The multipliers in Table H1 are calculated by taking the total impact observed for a change in an economic variable and dividing it by the direct change. The intensity ratios in Table H2 are calculated by dividing the total economic impact by the change in output. 19
No more recent data currently exists. 20
A closed version of the model would calculate the induced impacts. Induced impacts are obtained from the spending of increased household income that results from the change in the economic activity. However, closed models are often criticized because of potential bias. In particular, many economists do not believe that induced effects should be included because households would have spent their money on something else if child care was not available. Therefore, Statistics Canada does not produce closed multipliers. If induced effects exist from child care spending, the estimates shown may be considered lower bounds.
North Dakota 1.53 1.31
Ohio 1.5 1.28
Oklahoma 1.55 1.31
Oregon 1.52 1.31
Pennsylvania 1.6 1.29
Rhode Island 1.43 1.24
South Carolina 1.38 1.2
South Dakota 1.45 1.27
Tennessee 1.5 1.24
Texas 1.5 1.22
Utah 1.59 1.3
Vermont 1.51 1.3
Virginia 1.46 1.22
Washington 1.55 1.28
West Virginia 1.45 1.28
Wisconsin 1.54 1.31
Wyoming 1.45 1.3
1Used primary education as industry in input-out analysis.
2These multipliers include induced effects. This report will not be reporting any
induced effects as they are often criticised for being biased

Feasibility study of universal, affordable daycare in the Northwest Territories
58 H. THE COSTS AND BENEFITS OF PUBLIC SPENDING ON CHILD CARE
total (direct plus indirect) economic impact due to change in consumption or output by the change in
consumption or output. For instance, if an industry increased its output by $4 million and this leads to an
increase of $2 million in GDP, the GDP intensity ratio would be 0.5.21
Unfortunately, we were not able to calculate an intensity ratio for child care services specifically, so this report
will use two different proxies. The first proxy is the social assistance industry. This industry category is
comprised of child care services (40 percent) and individual and family services (50 percent). The remaining 10
percent of the industry is from additional services provided in other categories. This industry is a bit broader
than child care services alone, but is still valid. The industry category is from the North American Industry
Classification System (NAICS) Canada—the standard used across North America to classify industries and the
standard used by Statistics Canada.
21
Most intensity ratios are less than 1 because of the reliance on imports. Imports include items such as food and machinery.
Table H2: Intensity Ratios
Industry GDP per dollar of output
Labour Income
per dollar of output
Jobs per $million
GDP rank Income
rank Jobs rank
Crop and Animal Production 1.01 0.53 8.5 1 15 16
Oil and Gas Extraction 0.92 0.06 0.5 2 42 42
Forestry and Logging 0.87 1.11 23.4 3 1 1
Waste Management and Remediation Services
0.82 0.47 6.7 4 19 19
Social Assistance (Includes child care) 0.80 0.74 9.86 5 2 13
Grant-Making, Civic and Professional and Similar Organizations
0.80 0.66 9.5 5 6 15
Natural Gas Distribution, Water, Sewage and Other Systems
0.80 0.15 2.2 5 38 34
Support Activities for Mining and Oil and Gas Extraction
0.79 0.57 5.5 8 12 26
Administrative and Support, Waste Management and Remediation
0.78 0.70 10.7 9 4 10
Administrative and Support Services 0.77 0.73 11.3 10 3 9
Warehousing and Storage 0.76 0.16 2 11 37 35
Mining and Oil and Gas Extraction 0.76 0.15 1.3 11 38 39

Feasibility study of universal, affordable daycare in the Northwest Territories
59 H. THE COSTS AND BENEFITS OF PUBLIC SPENDING ON CHILD CARE
Federal Government Services 0.75 0.58 5.3 13 7 27
Pipeline Transportation 0.75 0.11 1 13 41 41
Provincial and Territorial Government Services
0.74 0.58 6 15 7 24
Publishing, Broadcasting and Telecommunications
0.74 0.26 3.9 15 31 31
Retail Trade 0.73 0.58 12.4 17 7 6
Government Sector 0.73 0.57 6.4 17 12 22
Information and Cultural Industries 0.73 0.26 4.1 17 31 28
Personal and Laundry Services and Private Households
0.72 0.52 11.9 20 17 8
Educational Services 0.72 0.58 6.8 20 7 18
Wholesale Trade 0.71 0.42 6.5 22 24 21
Finance, Insurance, Real Estate and Renting and Leasing
0.71 0.36 2 22 27 35
Diamond Mining 0.71 0.13 1.1 22 40 40
Other Services (Except Public Administration)
0.69 0.55 12.1 25 14 7
Transit and Ground Passenger Transportation
0.65 0.47 13.7 26 19 3
Professional, Scientific and Technical Services
0.65 0.52 6.6 26 17 20
Municipal Government Services 0.64 0.47 10.7 28 19 10
Health Care and Social Assistance 0.63 0.53 6.4 29 15 22
Repair and Maintenance 0.62 0.58 12.9 30 7 5
Accommodation and Food Services 0.58 0.45 10.7 31 22 10
Utilities 0.57 0.17 1.6 32 35 37
Electric Power Generation, Transmission and Distribution
0.57 0.17 1.6 32 35 37
Truck Transportation 0.55 0.44 5.7 34 23 25

Feasibility study of universal, affordable daycare in the Northwest Territories
60 H. THE COSTS AND BENEFITS OF PUBLIC SPENDING ON CHILD CARE
In their economic analysis of child care in different Manitoba communities, Prentice and co-authors used
education as a proxy for child care. We will also use a proxy in this report. By using a proxy we are making the
assumption that the social assistance industry (or primary education) has similar levels of interconnectedness
between industries as child care alone. This is a reasonable assumption.
The data in Table H2 can be interpreted as follows. Using social assistance as an example, every $1 million
spent on child care in the NWT is predicted to have an $800,000 impact on GDP, a $740,000 impact on labour
income22 and the potential creation of 9.86 person-years of employment.23 Compare these numbers to what
would happen if those same million dollars were spent on diamond mining in the NWT. In that case, it would
only have an effect of $710,000 on GDP ($90,000 less than child care), $130,000 on labour income ($610,000
less than child care) and 1.1 person-years of employment (8.76 person-years less than child care). It is
important to note that these effects are at the territory level and do not indicate that the benefits would be
uniformly distributed across the territory. In fact, many regions may see little to no benefit from the increased
investment, but we were not able to estimate this with the data available.
When using intensity ratios, it is often preferable to make relative versus absolute comparisons. Social
assistance, which includes child care, is ranked 5th out of 42 industries in terms of creating economic growth,
2nd in terms of creating labour income growth and 13th in employment impact. Educational services, the
second proxy for child care services, is ranked 20th out of 42 in terms of creating economic growth, 7th in
terms of creating labour income growth and 18th in employment impact.
This analysis indicates that investing in child care is a better economic prospect than investing in other
industries, such as diamond mining, construction and manufacturing. These findings are in line with other
22
Labour income is the compensation for labour and is made up of wages and salaries and supplementary income based on labour. 23
This estimate does not indicate how this employment will be realized. It could be 9.86 full-time jobs for one year, or one full-time job for 9.86 years, or 19.72 part-time jobs for a year. It could be any permutation of full-time/part-time year combinations that would equal 9.86 person-years.
Arts, Entertainment and Recreation 0.54 0.39 13.3 35 25 4
Support Activities For Agriculture and Forestry
0.53 0.69 9.7 36 5 14
Motion Picture and Sound Recording Industries
0.53 0.18 7 36 33 17
Fishing, Hunting and Trapping 0.50 0.39 15.9 38 25 2
Construction 0.46 0.33 3.5 39 28 32
Transportation and Warehousing 0.45 0.30 4.1 40 29 28
Other Transportation 0.36 0.27 3.5 41 30 32
Manufacturing 0.34 0.18 4 42 33 30
Source: NWT Bureau of Statistics, July 2012 and Special Tabulation by the Bureau of Statistics on March 5, 2015

Feasibility study of universal, affordable daycare in the Northwest Territories
61 H. THE COSTS AND BENEFITS OF PUBLIC SPENDING ON CHILD CARE
studies from different regions comparing industry multiplier effects.24 An important note is the analysis does
not include the positive impact on the economy from more parents who are freed from child care duty being
available to work. This will be discussed later in this section.
To get a sense of the difference between multipliers for child care and education, Fairholm (2010) reported the
indirect and direct multipliers for both industries in Canada (see Table H3). It is reasonable to expect similar
magnitude differences between education and child care multipliers in the NWT. Because proxies are being
used instead of exact measures of the child care industry, the assumption is that primary education or the
broader category of social assistance would have similar effects on the economy as would child care
specifically. This is a reasonable assumption and is supported by the comparisons in the table.
Changes in Workforce Participation Due to Child Care
Family favourable policies, such as child care, can free up parents to enter the work force. As seen in Table H4,
about one in four families in the NWT have children under the age of 5 years. Child care programs or lack of
programs may affect the labour market participation of these individuals. In addition, 600 families are lone-
parent families with at least one child between 0 and 5 years of age. A total of 470 families have a female head
of household and 130 have a male head of household. These families will be even more affected by child care
availability or lack of availability than will other families.
24
See Centre for Spatial Economics (2009) and Liu, Ribeiro, and Warner (2004) for examples.
Table H3: Statistics Canada Multipliers for Canada
Multiplier Child care outside the home Education
GDP – Direct 0.96 0.85
GDP – Indirect 0.04 0.09
Labour Income – Direct 0.90 0.79
Labour Income – Indirect 0.02 0.06
Employment – Direct 25.63 13.50
Employment – Indirect 0.42 1.39
Source: Fairholm (2010)

Feasibility study of universal, affordable daycare in the Northwest Territories
62 H. THE COSTS AND BENEFITS OF PUBLIC SPENDING ON CHILD CARE
Table H5: Number of Lone – Parent Census Families by Age of Child, Northwest Territories, 2011
All Female Head of Household Male Head of
Household
No 0–5 year old children at home 1,730 1,255 480
At least one 0–5 year old child at home 600 470 130
Sources: 2011 National Household Survey; Prepared by: NWT Bureau of Statistics
The following figure illustrates the labour force characteristics of the population of the NWT between the ages
of 15 and 54 years and living with at least one child ages 0–5 years.25 The traditional economic way to report
the labour force participation rate is to add up all the people in the economy who are employed and all the
people in the economy who are unemployed but actively looking for work. These two numbers are then
divided by the count of the entire population. Figure H1 shows that in 2014, the labour force participation rate
was 76 percent in the NWT, 85 percent in Yellowknife, 75 percent in the regional centres and 67 percent in
smaller communities. The second set of graphs in Figure H1 includes individuals who are not looking for work
but want a job (discouraged workers). These individuals were specifically asked in the Community Survey if
they want to work. Including these individuals as part of the labour force will naturally increase the labour
force participation rate, but it will also highlight the unemployment problem in the territory and the fact that
many individuals who are living with children have given up looking for work despite wanting to work. These
people would not be seen in the traditional measure of labour force participation.
25
The NWT Community Survey does not have information regarding family links in the data. Therefore, the analysis cannot be done using only mothers and fathers, but instead includes all adults. As a result, other adults living in households with children will be counted as parents. This may include older siblings, other family members or roommates.
Table H4: Number of Census Families by Age of Child, Northwest Territories, 2011
No children at home 30%
No 0–5 year old children at home 45%
At least one 0–5 year old child at home 24%
Sources: 2011 National Household Survey; Prepared by: NWT Bureau of Statistics

Feasibility study of universal, affordable daycare in the Northwest Territories
63 H. THE COSTS AND BENEFITS OF PUBLIC SPENDING ON CHILD CARE
As seen in Figures H2 and H3, males are significantly more likely to be in the labour force and females are more
likely to be unemployed in the territory as a whole. Approximately one in four females in smaller communities
is unemployed.

Feasibility study of universal, affordable daycare in the Northwest Territories
64 H. THE COSTS AND BENEFITS OF PUBLIC SPENDING ON CHILD CARE

Feasibility study of universal, affordable daycare in the Northwest Territories
65 H. THE COSTS AND BENEFITS OF PUBLIC SPENDING ON CHILD CARE
Figure H4 highlights the differences in labour force characteristics between Aboriginal and non-Aboriginal
peoples in the Northwest Territories. In particular, the labour force participation rate is lower and the
unemployment rate is higher for Aboriginal parents with a child age 5 years or younger. Figure H5 expands the
analysis to examine the difference between individuals with differing educational backgrounds. The
unemployment rate is fairly low for individuals with a college or university diploma or degree and quite high for
individuals with less than a high school diploma. Figure H6 looks at the labour market status of females only by
level of education. The higher rates of unemployment are an indication of the barriers to work mothers with
young children encounter.

Feasibility study of universal, affordable daycare in the Northwest Territories
66 H. THE COSTS AND BENEFITS OF PUBLIC SPENDING ON CHILD CARE

Feasibility study of universal, affordable daycare in the Northwest Territories
67 H. THE COSTS AND BENEFITS OF PUBLIC SPENDING ON CHILD CARE
Finally, Figures H7 and H8 examine how many people are
working full-time and how many people are working most of
the year. Overall, of the NWT population that is working, 88
percent are working full-time and 72 percent have worked
more than 26 weeks in the past year. Women living with at
least one child ages 0–5 years are more likely to work part-time
and work less than 26 weeks per year compared to males. In
addition, individuals living in smaller communities are also
significantly more likely to work part-time and part-year. This
may simply be due to job availability in those communities.
All of these labour statistics are important when examining the
effects of introducing universal child care because it is
important to understand who might be affected by its
introduction and how they might be affected. In particular, it is
evident that there are a significant number of discouraged
workers—individuals who want to work but are not actively
looking for work—who would take jobs if they were available
and at the proper skill level. The statistics also indicate that
there are large differences across the territory in labour market
activities and skills. Finally, many women are only working part-
time or part-year. Therefore there may be room for growth in
the labour market by tapping into this market of females,
assuming they would work if appropriate work was available.
Many studies have estimated the impact of subsidized child
care on mothers’ employment rates, as shown in Table H6.
These studies have spanned a number of different countries
and timeframes. Although none are perfectly comparable to
the NWT, there is still a lot to learn about overall effects by
examining the literature. Overall, evidence of the impact of
subsidized child care on the labour supply of mothers is mixed
across countries, with some reporting large effects, such as
Kentucky, U.S., California, U.S., and Québec, Canada. Other
countries such as Germany and the Netherlands report
moderate effects, while subsidizing child care in Norway and
Sweden has had very little impact on mothers’ labour supply. In
particular, the lowest effect size was found in Sweden. This is
because at the time of Sweden’s child care reform, over 80
percent of children ages 3–6 years were already in child care
and there was a very high rate of maternal employment. In
contrast, in Québec, where there was a low maternal labour
supply prior, the reforms to child care produced a much larger
the effect size. In addition, single parents and individuals with

Feasibility study of universal, affordable daycare in the Northwest Territories
68 H. THE COSTS AND BENEFITS OF PUBLIC SPENDING ON CHILD CARE
low levels of education tend to react more positively to subsidization of child care. This is important, as the
lowest levels of maternal employment in the NWT are among women with low levels of education in remote
communities.
Table H6: Summary Table of Studies Estimating the Impact of Subsidized Child Care on Mothers’ Employment Rate
Location Study Data Source Employment Rate percentage point increase of mothers
Canada (Québec)
Haeck et al. (2013) National Longitudinal Survey of Children and Youth (1998-2008)
Overall: 6–13 % Two Parent: 5–14% Single H.S. Education: 27%
Canada (Québec)
Lefevbre (2009) Survey of Labour and Income Dynamics (2002–2004)
Overall: 4.7–7.0% Low Education: 10.1–19.2%
Canada (Québec)
Baker et al (2008) National Longitudinal Survey of Children and Youth (1994–2003)
Married: 7.7 %
Canada (Québec)
Lefevbre & Merrigan (2008)
Survey of Labour and Income Dynamics (1993–2002)
Overall period: 7.3%
1999-2002: 7.6–8.1%
Germany Bauernschuster & Schlotter (2015)
German Socio Economic Panel (1996–2001)
5–8.2%
Netherlands Bettendorf et al. (2012)
Labour Force Survey of Statistics Netherlands (1995–2009)
Overall: 1.5–3.4%
Short-run effect: 1.5–2.3%
Medium-run effect: 2.3–3.4%
Norway Havnes & Mogstad (2011)
Administrative Registrars from Statistics Norway (1976–1979)
Overall: 1.1%
Sweden Lundin et al. (2008) Statistics SE (2001, 2003) 0.68%
United States (Kentucky)
Berger & Black (1992) Survey of single mothers in Kentucky; Current population survey May 1988
8.4–25.3%
United States Blau & Teken (2007) National Survey of America’s Families (1999)
33%
Another source of evidence of the impact of child care subsidies comes from studies on the effect of the price
of child care on mothers’ labour supply. These studies examine how much the cost of child care affects
whether mothers enter the labour force. In particular, they measure elasticity or how responsive women’s
labour supply is to a change in price. Elasticity is defined as the percentage change in the quantity supplied
divided by the percentage change in price. An elasticity of –0.5 means that a 1 percent increase in the price of
child care will result in a decrease of 0.5 percent in women working. Or conversely, a 1 percent decrease in the
price of child care will result in an increase of 0.5 percent in women working.
Table H7 summarizes the elasticity estimates of the price of child care on mothers’ labour supply from a

Feasibility study of universal, affordable daycare in the Northwest Territories
69 H. THE COSTS AND BENEFITS OF PUBLIC SPENDING ON CHILD CARE
number of studies. Elasticity estimates range between –0.0004 and –0.467 for European countries, between –
0.0494 and –0.923 for the United States and between –3.6 and –0.38 for Canada. Elasticity estimates vary
substantially over time and across countries, however recent estimates indicate that price changes in child care
have little impact on the total hours that employees work. When informal care is modelled, elasticity estimates
appear smaller than other estimates for the United States made at that time. In addition, elasticity estimates
appear to be smaller in countries that already have high labour participation rates, such as Sweden and the
Netherlands.
Labour force participation is rising across developed and developing countries. While price-based policies may
work well when labour force participation is still climbing, there is evidence to suggest that price-based policies
may not be effective in countries that already have high labour force participation among mothers. However,
that is not the case in many areas of the NWT and with mothers with low levels of education.
Table H7: Summary Table of Studies Estimating Effect of the Price of Child Care on Mothers’ Labour Supply
Location Study Data Source Estimated Elasticity
Australia Gong et al. (2010) Household, Income and Living Dynamics in Australia (2005–2007)
–0.29
Canada Powell (2002) Canadian National Child Care Survey (1988)
Non-relative care: –3.60:
Centre care: –1.40:
Canada Powell (1997) Canadian National Child Care Survey (1988)
–0.38
Sweden Lundin et al. (2008) Statistics SE (2002) –0.01
Sweden Gustaffson & Stafford (1992)
Swedish Household Survey (1984) –1.88, net elasticity of full-time work to price of unrationed public child care
United Kingdom
Viitanen (2005) Family Resource Survey (1997–2004)
–0.14
United Kingdom
Jenkins & Symons (2001) Lone Parent Survey (1989) –0.09
United States Tekin (2004) National Survey of American Families (1997)
Full-time: –0.15
Part-time: –0.07
United States Han & Waldfogel (2001) Current Population Survey (1991–1994)
Married: –0.30 to –0.40
Single: –0.50 to –0.73
United States Anderson & Levine (1999) Survey of Income and Program Participation (1990–1993)
–0.05 to –0.35
United States Connelly & Kimmel (1999) Survey of Income and Program Participation (1992–1993)
Married: –0.16
Single: –0.32
United States Blau & Hagy (1998) National Child Care Survey (1990) –0.20
United States Kimmel (1998) Survey of Income and Program Participation (1987)
Married: –0.92
Single: –0.22

Feasibility study of universal, affordable daycare in the Northwest Territories
70 H. THE COSTS AND BENEFITS OF PUBLIC SPENDING ON CHILD CARE
United States Ribar (1995) Survey of Income and Program Participation (1984)
–0.07 to –0.09
United States U.S. GAO (1992) National Child Care Survey (1990) Poor: –0.50
Near poor: –0.34
Not poor: –0.19
United States Conelly (1992) Survey of Income and Program Participation (1984)
–0.20
United States Ribar (1992) Survey of Income and Program Participation (1984)
–0.74
United States Blau & Robins (1988) 1980 Baseline Household Survey of Employment Opportunity Pilot Project
–0.38
Unfortunately, due to differences in policies and geography, it is impossible to exactly predict what would
occur in the NWT if universal child care was implemented. However, it is possible to make educated guesses on
the bounds of changes that may occur based on what has happened in other jurisdictions in the past. For
instance, to be conservative, if the employment rate of mothers increased between 1 and 7 percentage points,
then between 76 and 727 more mothers would be employed in the NWT. Many of these new entrants would
be women with low educational backgrounds. Therefore, an important component of the discussion of
increasing the labour supply of women due to the expansion of child care programs involves labour demand.
Can the women who are freed up from child care duties find work? And if they can find work, will they chose to
work?
A large majority of mothers in the NWT who are unemployed also do not hold high educational qualifications.
The occupations that will see the highest growth in demand over the next decade are listed in Table H8 as
determined by using the NWT Job Futures website. They were determined for each occupation relative to all
other occupations based on how future demand compares to current levels by the NWT Bureau of Statistics.

Feasibility study of universal, affordable daycare in the Northwest Territories
71 H. THE COSTS AND BENEFITS OF PUBLIC SPENDING ON CHILD CARE
Table H8: Top Jobs from NWT Job Futures
Education Required % of Current Workforce
Occupation High School Degree
Apprentice-ship
University Degree
Graduate Degree
Women Yellowknife Regional Centres
Other Areas
Architects, Urban Planners and Land Surveyors
yes maybe maybe - - - -
Carpenters and Cabinetmakers yes yes 3.6 19.1 41.4 39.5
Central Control and Process Operators in Manufacturing and Processing
yes 2.9 52.9 11.8 36.8
Clerical Supervisors yes maybe maybe maybe - - - -
Contractors and Supervisors, Trades and Related Workers
yes maybe 2.3 40.6 34.3 24.9
Electrical Trades and Telecommunication Occupations
yes yes 0 52.8 30.6 16.5
Finance and Insurance Administrative Occupations
yes yes maybe 70.7 58.3 30.6 10.7
Heavy Equipment Operators yes 3.4 18.9 20.8 60.3
Legislators and Senior Management yes yes maybe 26.6 49.5 21.7 28.7
Machinery and Transportation Equipment Mechanics (Except Motor Vehicle)
no yes 5.8 73.9 18.2 7.9
Managers in Construction and Transportation
yes maybe yes 12.5 68.1 18.5 13.4
Managers in Manufacturing and Utilities yes maybe maybe - - - -

Feasibility study of universal, affordable daycare in the Northwest Territories
72 H. THE COSTS AND BENEFITS OF PUBLIC SPENDING ON CHILD CARE
Managers in Primary Production (Except Agriculture)
yes yes - - - -
Metal Forming, Shaping and Erecting Trades
yes yes 10.2 39.8 49.1 10.2
Motor Vehicle and Transit Drivers yes 10.1 43.3 27.7 29
Other Installers, Repairers and Servicers yes 2.4 51.6 19 29.4
Plumbers, Pipefitters and Gas Fitters yes yes 0.8 46 34.1 19.8
Primary Production Labourers yes 2.8 64.2 10.8 25.6
Public Works and Other Labourers, n.e.c. yes 0 19.4 33.3 48.4
Trades Helpers and Labourers yes 5.6 39.7 25.5 34.9
Source: Data collected from http://jobfutures.statsnwt.ca

Feasibility study of universal, affordable daycare in the Northwest Territories
73 H. THE COSTS AND BENEFITS OF PUBLIC SPENDING ON CHILD CARE
The take-home point of these data is that only one of the most in-demand occupations in the next decade does
not need a high school degree or higher (machinery and transportation equipment mechanics – except motor
vehicle), and the occupation that has historically employed the most women needs at least a university degree
and maybe a graduate degree (finance and insurance administrative occupations). Therefore, this information
hints at an occupational mismatch between the women potentially entering the labour market due to universal
child care and the jobs in demand. To realize the full potential of these new labour market entrants, more job
training and educational programs may be needed.
However, the occupations highlighted in the table do not take into account the potential of universal child care
as a job creator. Also, most of the jobs created by the child care sector stay in the community as educators,
support staff, cooks, maintenance and so on. As discussed, investment in child care creates more jobs than
does investment in many other industries, including mining and oil, pipeline construction, diamond mining and
manufacturing. Many of the jobs created by the child care sector would be suited for the women who are freed
up to work by that sector.
Assuming that all the new entrants into the job market are high school dropouts, this would increase territory
tax revenue by $773 per worker, which would translate into $59,748 in tax revenue for the low end of labour
market effect (76 new workers) to a $561,971 tax increase based on the high-end estimate (727 new mothers
entering the workforce). If all the new entrants into the job market are average workers and earn the average
wage for the territory, this would increase tax revenue by $2,825 per worker, or an increase of $214,700 if the
labour force increased by 76 new workers and $2,052,775 it if increased by 727 workers.
The Effect of the Child Care Sector on GDP
The GDP of the NWT was $3,587,000,000 in 2013. The GDP is the monetary value of all the finished goods and
services produced within a particular region during a specific time period. The GDP is used to gauge the health
of the economy by examining its increase or decrease over time. If the GDP grows by 5 percent, it means that
the economy has grown by 5 percent.
An important economic fact (Solow, 1956) is that the GDP basically reacts in proportion to the increase in the
number of persons employed, provided that the new individuals hired are just as productive as existing
workers. Therefore, the increase in labour force created by universal child care will proportionally increase the
GDP if the entering workers are similarly productive as existing workers.
Numerous studies26 of the impact of Québec’s child care programs have estimated that women who are
induced to enter the labour market are as productive as the average worker already in the labour force, based
on the number of weeks and the number of annual hours worked. In addition, Lefebvre, Merrigan and Roy-
Desrosiers (2011) found that available, affordable child care had the same impact on the employment rate of
mothers of children ages 0–5 years as for women with and without a university degree. Therefore, for women
with children 5 years old and younger, it can be assumed that their average productivity is similar to currently-
employed workers.
We can create conservative estimates of GDP growth using a range of productivity estimates to estimate the
overall effect of universal child care on GDP. To estimate the lower bound, we assume that the impact on
26
Lefebvre & Merrigan (2008); Baker, Gruber & Milligan (2008); and Lefebvre, Merrigan & Verstraete (2009)

Feasibility study of universal, affordable daycare in the Northwest Territories
74 H. THE COSTS AND BENEFITS OF PUBLIC SPENDING ON CHILD CARE
employment is concentrated on those with a lower level of education (those who did not complete high
school) and therefore we can assume that the level of productivity is also lower. The average high school
dropout in the NWT earned $26,774 in 2011 according to the 2011 National Household Survey. The average
total income for the territory was $54,717. Therefore, we can assume that if only high school dropouts were
induced to enter the labour market due to universal child care, the average productivity would be 49 percent
of the average productivity of other employed NWT workers. To estimate a conservative upper bound, we can
assume that the impact of employment on average women in the territory and therefore their productivity
would be similar to the average productivity of other employed NWT workers.
This information can be used to calculate bounds on the effect of increased employment on GDP. An estimated
76 to 727 more mothers will work, which represents an increase of 1–7 percent.27 This in turn will increase GDP
by between 0.49 percent and 3.43 percent in the most conservative estimates, and between 1 percent and 7
percent using the conservative upper bound estimates. Therefore, GDP is calculated to increase by between
$17,576,300 and $123,034,100 with the most conservative estimates, and between $35,870,000 and
$251,090,000 with the conservative upper bound estimates.
However, it is important to note that these estimates are based on what has been previously observed in other
jurisdictions which may not be representative of what would happen in NWT. These GDP growth figures based
on employment increases are modeled based on numbers found in Table H6. In addition, it is also assuming
that the between 1 and 7 percent more woman who would want to work, would be able to find employment in
their regions or communities. As mentioned above, there may be skills mismatch between the women who
want to find employment and the jobs available. There also may just be a lack of jobs available in the region or
community for the women.
The Child Care Sector’s Other Effects
Child care not only affects GDP and employment, it has also been shown to affect the use of social assistance.
In particular, Andren (2005) and Connelly and Kimmel (2003) both found that a reduction in child care costs has
a large effect on the use of social assistance. This has implications for the NWT as there were 493 individuals
with children ages 4 years and younger on income assistance in 2013–2014. The provision of universal child
care in the NWT will significantly reduce the cost of child care for these individuals, and therefore it is predicted
that there will be a decrease in the number of individuals with children using social assistance. However, it is
still possible that child care would not have an effect on some individuals using social assistance due to the
higher cost of living in smaller remote communities. Child care might, however, help recruit and retain
essential workers such as teachers, health care and police in smaller communities.
The lack of child care can significantly hinder the acquisition of education for parents. This is especially true for
younger mothers and fathers who have children before they finish schooling. The NWT has a large number of
teen births (mothers 19 years of age or younger). For example, in 2011 there were 690 births in the territory
and 56 of them were to a teen mother (8.1 percent). These rates are more than double the average rate of
teen births in Canada (3.6 percent in 2011). When teenage parents do not receive the support and resources
they need, a variety of detrimental consequences often occur. In particular, many teenage mothers do not
graduate from high school, which affects later life outcomes such as employment and earnings. Providing
27
This is estimated at the territory level. The data do not exist to estimate the increase at any level of geography lower than the territory.

Feasibility study of universal, affordable daycare in the Northwest Territories
75 H. THE COSTS AND BENEFITS OF PUBLIC SPENDING ON CHILD CARE
universal child care will therefore help ameliorate these effects of early parenthood by providing support to
continue schooling or enter the labour market.
Child care availability can also help parents attain higher levels of education. Herbst and Tekin (2011) found
that child care subsidies increase the chance a single mother will enrol in post-secondary education by 13
percentage points. In addition, they showed that child care subsidies increase the chance a single mother will
participate in a job training program by 8 percentage points. Since mothers’ educational levels are directly
linked to child outcomes, educating mothers is one way of breaking intergenerational cycles of poverty.
Costs of Child Care – Program Costs
In 2014 in Québec, 40 percent of children ages 0–24 months and 74 percent of children ages 2–4 years were
enrolled in child care and 4 year old Kindergarten. Sweden has the highest rate of uptake in child
care/preschool, with 65 percent of children ages 0–24 months and 92 percent of children ages 2–6 years old
enrolled. Therefore, the costs of child care for the NWT will be calculated for the lower bound seen in Québec
and the upper bound seen in Sweden.
The NWT has a roughly 16/1000 person birth rate each year, and the current population of the NWT is
estimated to be 43,795. Therefore, it can be estimated that approximately 700 babies will be born each year
and the population of 0–4 year olds will be roughly 3,500 each year. Table H9 illustrates the percentage and
number of children predicted to use child care if a universal system was in place based on the enrolment
information from Québec (lower bound) and Sweden (upper bound). Using this information, 60–81 percent of
children ages 0–4 years will demand child care spots if universal care were implemented. This represents
between 2,114 and 2,842 children.
Currently there are only 1,273 licensed preschool and infant child care spaces. Using the lower bound
estimates predicted by the Québec experience, there would be a demand for 2,114 infant and preschool spots
if universal care was implemented, resulting in a demand of 841 additional child care spaces. However, using
the Swedish experience to predict the number of children needing child care, 2,842 children would use child
care, resulting in a need for 1,569 more spaces.
Table H9: Predicted use of child care based on Québec and Swedish Experience
Predicted NWT Population
Predicted % in Childcare –
Lower Bound
Predicted % in Child Care –
Upper Bound
Predicted Number of Children in Child Care –
Lower Bound
Predicted Number of Children in Child Care –
Lower Bound
0–24 months 1400 40 65 560 910
2–4 year olds 2100 74 92 1554 1932
Total (0-4 year olds)
3500 60 81 2114 2842
To examine the demand across the NWT, the estimated number of children ages 0–4 years old in each
community/region is presented in Table H10. The predicted number of children in child care based on the

Feasibility study of universal, affordable daycare in the Northwest Territories
76 H. THE COSTS AND BENEFITS OF PUBLIC SPENDING ON CHILD CARE
Québec experience is listed as the lower bound and the predicted number based on the Swedish experience is
listed as the upper bound. In particular, Table H10 shows that between about 121 and 163 children will need
child care spaces in the Deh Cho region. This is an increase of between 64 and 106 spaces. Overall, the NWT
would need an additional 718–1,415 more spaces. This would represent an increase of child care spaces by
between 56 and 111 percent.
Table H10: Predicted Use of Children Care Based on Québec and Swedish Experience, by Community/Region
Community/Region Total # of
Licensed
Preschool
and Infant
Spaces
Estimated
# of 0–4
year old
Children
Predicted
Number of
Children
in Child
Care –
Lower
Bound
Predicted
Number of
Children in
Child Care
– Upper
Bound
Predicted
Number of
New
Spaces
Needed –
Lower
Bound
Predicted
Number of New
Spaces Needed –
Upper Bound
Beaufort Delta 222 633 380 513 158 291
Aklavik 17 53 32 43 15 26
Ft. McPherson 27 59 35 48 8 21
Inuvik 106 339 203 275 97 169
Paulatuk 14 30 18 24 4 10
Sachs Harbour 12 6 4 5 0 0
Tsiigehtchic 0 19 11 15 11 15
Tuktoyaktuk 23 89 53 72 30 49
Ulukhaktok 23 38 23 31 0 8
Deh Cho 57 201 121 163 64 106
Fort Liard 0 41 25 33 25 33
Fort Providence 16 49 29 40 13 24
Fort Simpson 41 71 43 58 2 17
Jean Marie River 0 0 0 0 0 0
Kakisa 0 0 0 0 0 0

Feasibility study of universal, affordable daycare in the Northwest Territories
77 H. THE COSTS AND BENEFITS OF PUBLIC SPENDING ON CHILD CARE
Nahanni Butte 0 0 0 0 0 0
Trout Lake 0 0 0 0 0 0
Wrigley 0 9 5 7 5 7
North Slave 732 1844 1106 1494 374 762
Yellowknife 586 1497 898 1213 312 627
Dettah 0 9 5 7 5 7
ehchoko 74 236 142 191 68 117
Gam t 20 34 20 28 0 8
Wekweètì 12 9 5 7 0 0
What 40 54 32 44 0 4
Sahtu 49 176 106 143 57 94
Colville Lake 0 15 9 12 9 12
Délįnę 15 30 18 24 3 9
Fort Good Hope 14 47 28 38 14 24
Norman Wells 0 44 26 36 26 36
Tul ta 20 40 24 32 4 12
South Slave 213 465 279 377 66 164
Enterprise 0 10 6 8 6 8
Fort Resolution 17 36 22 29 5 12
Fort Smith 54 177 106 143 52 89
Hay River 96 227 136 184 40 88
Hay River Reserve 46 17 10 14 0 0
Łutselk’e 0 15 9 12 9 12
Total for NWT 1273 3319 1991 2688 718 1415

Feasibility study of universal, affordable daycare in the Northwest Territories
78 H. THE COSTS AND BENEFITS OF PUBLIC SPENDING ON CHILD CARE
Table H11 lists the number of new staff positions required for the increase in child care spaces predicted in
Table H10. Based on NWT legislated staff:child ratios in daycare centres, between 221 and 299 new staff would
need to be trained and hired to accommodate the increased enrolment.
Table H11: Predicted Number of Staff Positions Required Based on Québec and Swedish Experience, by Community/Region
Community/Region Predicted Number of Staff Positions Required – Lower Bound
Predicted Number of Staff Positions Required – Upper Bound
Beaufort Delta 42 57
Aklavik 4 5
Ft. McPherson 4 5
Inuvik 23 31
Paulatuk 2 3
Sachs Harbour 0 1
Tsiigehtchic 1 2
Tuktoyaktuk 6 8
Ulukhaktok 3 3
Deh Cho 13 18
Fort Liard 3 4
Fort Providence 3 4
Fort Simpson 5 6
Jean Marie River 0 0
Kakisa 0 0
Nahanni Butte 0 0
Trout Lake 0 0
Wrigley 1 1
North Slave 123 166
Yellowknife 100 135
Dettah 1 1
ehchoko 16 21
Gam t 2 3
Wekweètì 1 1
What 4 5
Sahtu 12 16

Feasibility study of universal, affordable daycare in the Northwest Territories
79 H. THE COSTS AND BENEFITS OF PUBLIC SPENDING ON CHILD CARE
Colville Lake 1 1
Délįnę 2 3
Fort Good Hope 3 4
Norman Wells 3 4
Tul ta 3 4
South Slave 31 42
Enterprise 1 1
Fort Resolution 2 3
Fort Smith 12 16
Hay River 15 20
Hay River Reserve 1 2
Łutselk’e 1 1
Total for NWT 221 299
Two different costs per capita will be used to model the costs of universal child care in the NWT. First, the per
capita costs from Québec will be used, where approximately $13,000 is spent for an infant spot and $10,500 is
spent for a preschool spot. Second, the per capita costs from the Lord Selkirk day care in north Winnipeg will be
used, which spends approximately $17,000 per spot for their high quality program based on the Abecedarian
model. The Abecedarian is an intensive program. At Lord Selkirk, it is designed to meet the needs of families
suffering the intergenerational trauma of residential schooling. Highly trained staff members focus on child
literacy and parental mentoring. The program has been shown to have significant positive outcomes for both
the children and the parents of the children. This type of high intensity program may be a way to mitigate some
of the issues faced by communities with low enrolment in child care centres. The costs of the Lord Selkirk
program are comparable to the per child costs for ECEC in the Scandinavian countries.
Table H12 lists the predicted yearly expenditures of universal child care in the NWT. It includes estimates for a
lower and upper bound of enrolment based on the Québec and Swedish experiences. It also includes lower and
upper bound expenditures based on lower intensity or higher intensity programs. It is predicted that a lower
intensity child care program for the enrolment levels seen in Québec will cost approximately $25.6 million
dollars per year. A high intensity program will increase that figure by approximately $12 million dollars per
year. Using the upper bound of enrolment, similar to what is experienced in Sweden, the expenditures would
range from between $32 million to $48 million per year.
Not all families require the level of intervention offered by an Abecedarian model program. However, a plan for
universal child care should include this type of programming in communities experiencing higher levels of
trauma. Referred to as “targeted universality,” this approach provides equity of access for a broader range of
families. In particular, in three NWT regions where parents do not pay child care fees (Beaufort Delta, Sahtu
and Tlicho), attendance in these child care facilities is low, with only 30–50 percent of children attending (Early
Childhood Program Review, 2015). Therefore, a high-intensity program such as the program at Lord Selkirk
might be beneficial to help with community outreach and parental mentoring.

Feasibility study of universal, affordable daycare in the Northwest Territories
80 H. THE COSTS AND BENEFITS OF PUBLIC SPENDING ON CHILD CARE
Table H12: Predicted Total Yearly Expenditures for Universal Child Care in NWT
Lower Bound Expenditures Upper Bound Expenditures
Lower bound enrolment $23,597,000 $35,938,000
Upper bound enrolment $32,116,000 $48,314,000
Even in jurisdictions with universal child care, public funds do not cover all the program costs. For instance, in
Québec public funds cover 85 percent of the program, and in Sweden public funds cover 95 percent of program
costs. Table H13 displays the predicted yearly expenditures for universal child care that would need to be
covered by public money.
Table H13: Predicted Public Yearly Expenditures for Universal Child Care in NWT
Lower Bound Expenditures Upper Bound Expenditures
Lower bound enrolment $20,057,450 – $22,417,150 $30,547,300 – $34,141,100
Upper bound enrolment $27,298,600 – $30,510,200 $41,066,900 – $45,898,300
The NWT spent $2,181,000 in 2013–2014 on licensed day care. Table H14 lists the predicted public yearly
expenditures needed to provide universal child care in the NWT over and above what is currently spent. For
instance, if the number of children who attended child care was similar to the Québec experience, and the per
capita spending on students was in line with Québec’s spending, it would cost the NWT an additional
$17,876,450 and $20,236,150 to provide universal child care. If enrolment reflected Swedish levels, and all
programs were as intensive as Lord Selkirk’s, between $38,885,900 and $43,712,300 would be required. In
other words if the NWT was to spend like Québec, at Québec’s current level of enrolment, an additional
$17,876,450 would be required for universal day care. If the NWT was to spend like Sweden, at Sweden’s level
of enrolment, an additional $43,712,300 would be required.
Table H14: Predicted Public Yearly Additional Expenditures Needed for Universal Child Care in NWT
Lower Bound Expenditures Upper Bound Expenditures
Lower bound enrolment $17,876,450 – $20,236,150 $28,366,300 – $31,960,100
Upper bound enrolment $25,117,600 – $28,329,200 $38,885,900 – $43,712,300
Costs of Child Care – Capital Costs
Despite the significant economic benefits of child care, there are also potentially significant costs. In particular,
the capital costs could be quite large if there is no space to house the additional demand for child care. In the
NWT, unused school and community spaces could be used, along with licensed home child care.
Table H15 lists the predicted number of new spaces, both lower and upper bounds, along with the elementary
school capacity and the current elementary school enrolment in each community and region. It also lists the
total number of “empty spaces” that are available at the school. A large number of child care programs around
the world use space in elementary schools. The NWT Child Day Care Act and Regulation 2013 16.1 require a

Feasibility study of universal, affordable daycare in the Northwest Territories
81 H. THE COSTS AND BENEFITS OF PUBLIC SPENDING ON CHILD CARE
“minimum of 2.75 square metres of free and usable indoor floor space per child.” If we conservatively assume
that a child care program needs 50 percent more room (for play areas, etc.) than is required by students in
school, all communities have enough capacity in their schools to house the upper bound of new child care
spaces. If it is assumed that a child care space is 100 percent larger than the space allocated to an elementary
school student, then only four regions, Inuvik, Yellowknife, Colville Lake and Norman Wells, would need
additional space to accommodate the upper bound of children requiring care. If the lower bound was used, all
communities could house the increased demand for child care in their vacant school space.
Table H15: Elementary School Capacity for Child Care Programs
Community/Region
Predicted Number of New Spaces Needed – Lower Bound
Predicted Number of New Spaces Needed – Upper Bound
Elementary School Capacity
Elementary School
Enrolment
Number of Empty Spaces
Beaufort Delta 158 291 2093 1046 1047
Aklavik 15 26 332 151 181
Ft. McPherson 8 21 350 176 174
Inuvik 97 169 550 325 225
Paulatuk 4 10 154 50 104
Sachs Harbour 0 0 55 16 39
Tsiigehtchic 11 15 88 24 64
Tuktoyaktuk 30 49 330 203 127
Ulukhaktok 0 8 234 101 133
Deh Cho 64 106 1091 450 641
Fort Liard 25 33 242 116 126
Fort Providence 13 24 266 156 110
Fort Simpson 2 17 330 123 207
Jean Marie River 0 0 44 7 37
Kakisa 0 0 22 3 19
Nahanni Butte 0 0 44 11 33
Trout Lake 0 0 33 20 13
Wrigley 5 7 110 14 96
North Slave 374 762 4320 2810 1510
Yellowknife 312 627 3060 2004 1056
Dettah 5 7 55 33 22
ehchoko 68 117 792 546 246
Gam t 0 8 118 70 48
Wekweètì 0 0 75 34 41
What 0 4 220 123 97
Sahtu 57 94 922 548 374
Colville Lake 9 12 62 51 11

Feasibility study of universal, affordable daycare in the Northwest Territories
82 H. THE COSTS AND BENEFITS OF PUBLIC SPENDING ON CHILD CARE
Délįnę 3 9 275 116 159
Fort Good Hope 14 24 176 114 62
Norman Wells 26 36 209 142 67
Tul ta 4 12 200 125 75
South Slave 66 164 1531 760 771
Enterprise 6 8 - - -
Fort Resolution 5 12 198 93 105
Fort Smith 52 89 572 285 287
Hay River 40 88 519 254 265
Hay River Reserve 0 0 110 64 46
Łutselk’e 9 12 132 64 68
Total for NWT 718 1415 9957 5614 4343
Twelve communities in the NWT have no licensed child care centres. Four of these communities (Jean Marie
River, Kakisa, Trout Lake and Nahanni Butte) currently have no children. That leaves eight communities
currently without any licensed child care (Fort Liard, Colville Lake, Dettah, Enterprise, Lutselk’e, Norman Wells,
Tsiigehtchic and Wrigley). There are 162 children ages 0–4 years with no access to child care in these eight
communities combined. The largest communities of children without access are Norman Wells (44 children)
and Fort Liard (41 children). The remaining six communities have fewer than 20 children each.
A large capital expense would occur if child care centres were built in all eight communities. As noted above,
most of the increased enrolment could be accommodated in surplus school space. However, in two
communities, Norman Wells and Fort Liard, the underused school space may not be enough. If the GNWT
thought it was important for separate child care facilities to be located in all communities, the remaining eight
communities would also need to have facilities constructed.
The median cost per square metre for a child centre is $3,254 and the median size is 450 square metres.28
Given the current regulations, approximately 163 children could be served in a facility this large. The median
cost to build a child centre in the NWT that could house 163 children based on the regulations would be
$1,464,300. However, these rates are based on Yellowknife costs, and adjustments need to be made based on
community factors. Table H16 includes the adjustment factors needed for the eight communities without child
care. The two communities most likely to need a newly constructed child care centre are highlighted.
Table H16: Child Care Centre Costs by Communities without any Child Care
Community Adjustment Factor
Median Cost of Child Care Centre
Colville Lake 1.90 $ 2,782,170.00
Detah 1.05 $ 1,537,515.00
Enterprise 1.10 $ 1,610,730.00
28
These figures were provided by the NWT’s Capital Planning Manager.

Feasibility study of universal, affordable daycare in the Northwest Territories
83 H. THE COSTS AND BENEFITS OF PUBLIC SPENDING ON CHILD CARE
Fort Liard 1.15 $ 1,683,945.00
Lutselk’e 1.50 $ 2,196,450.00
Norman Wells 1.35 $ 1,976,805.00
Tsiigehtchic 1.57 $ 2,298,951.00
Wrigley 1.40 $ 2,050,020.00
Therefore, if only two child care centres were built to accommodate the communities of Fort Liard and Norman
Wells, it would cost approximately $3,660,750. Finally, if child care space was built for every child at the
legislated size requirements, it would cost between $8 million and $15 million dollars to build brand new child
care centres depending on enrolment (See Table H17).29
Table H17: Cost to Build Child Care Centres at Legislated Amount of Space
Community/Region
Predicted Number of
New Spaces Needed –
Lower Bound
Predicted Number of
New Spaces Needed –
Upper Bound
Legislated Required Space –
Lower Bound (m²)
Legislated Required
Space – Upper Bound
(m²)
Community Adjustment
Factors
Cost – Lower Bound
Cost – Upper Bound
Beaufort Delta 158 291 435 800 $2,060,750 $3,747,632
Aklavik 15 26 41 72 1.50 $201,341 $348,992
Ft. McPherson 8 21 22 58 1.40 $100,223 $263,086
Inuvik 97 169 267 465 1.30 $1,128,406 $1,965,985
Paulatuk 4 10 11 28 1.68 $60,134 $150,335
Sachs Harbour 0 0 0 0 1.68 $0 $0
Tsiigehtchic 11 15 30 41 1.57 $154,541 $210,737
Tuktoyaktuk 30 49 83 135 1.55 $416,105 $679,639
Ulukhaktok 0 8 0 22 1.80 $0 $128,858
Deh Cho 64 106 176 292 $480,982 $867,557
Fort Liard 25 33 69 91 1.15 $257,269 $339,596
Fort Providence 13 24 36 66 1.20 $139,597 $257,717
Fort Simpson 2 17 6 47 1.20 $21,476 $182,549
Jean Marie River 0 0 0 0 1.40 $0 $0
Kakisa 0 0 0 0 1.15 $0 $0
Nahanni Butte 0 0 0 0 1.45 $0 $0
29
This is based on the $3,254 per square metre adjusted using the community adjustment factor. However, as the size of the building is decreased, the unit rate may increase. Unfortunately, the scaling formula for this calculation was not available from the Capital Planning Manager.

Feasibility study of universal, affordable daycare in the Northwest Territories
84 H. THE COSTS AND BENEFITS OF PUBLIC SPENDING ON CHILD CARE
Trout Lake 0 0 0 0 1.50 $0 $0
Wrigley 5 7 14 19 1.40 $62,640 $87,695
North Slave 374 762 1029 2096 $3,538,684 $7,029,047
Yellowknife 312 627 858 1724 1.00 $2,791,932 $5,610,710
Dettah 5 7 14 19 1.05 $46,980 $65,771
ehchoko 68 117 187 322 1.15 $699,773 $1,204,021
Gam t 0 8 0 22 1.30 $0 $93,064
Wekweètì 0 0 0 0 1.55 $0 $0
What 0 4 0 11 1.55 $0 $55,481
Sahtu 57 94 157 259 $754,806 $1,252,343
Colville Lake 9 12 25 33 1.90 $153,019 $204,026
Délįnę 3 9 8 25 1.55 $41,611 $124,832
Fort Good Hope 14 24 39 66 1.55 $194,182 $332,884
Norman Wells 26 36 72 99 1.35 $314,092 $434,897
Tul ta 4 12 11 33 1.45 $51,901 $155,704
South Slave 66 164 182 451 $1,164,647 $2,156,141
Enterprise 6 8 17 22 1.10 $59,060 $78,747
Fort Resolution 5 12 14 33 1.25 $55,928 $134,228
Fort Smith 52 89 143 245 1.15 $535,120 $915,879
Hay River 40 88 110 242 1.10 $393,734 $866,215
Hay River Reserve 0 0 0 0 1.15 $0 $0
Łutselk’e 9 12 25 33 1.50 $120,805 $161,073
Total for NWT 718 1415 1975 3891 $7,999,870 $15,052,719
If the legislated required space was to be built for all eight communities that do not currently have any child
care facilities, it would cost less than if a larger facility was constructed. In particular, as shown in Table H18,
according to the legislated standards, it would cost between $1.168 and $1.582 million to construct child care
centres in all eight communities that currently do not have centres.
Table H18: Cost to Build Child Care Centres at Legislated Amount of Space in Communities with no Child Care Centres
Community Cost – Lower Bound Cost – Upper Bound
Tsiigehtchic $154,541 $210,737
Fort Liard $257,269 $339,596
Wrigley $62,640 $87,695

Feasibility study of universal, affordable daycare in the Northwest Territories
85 H. THE COSTS AND BENEFITS OF PUBLIC SPENDING ON CHILD CARE
Dettah $46,980 $65,771
Colville Lake $153,019 $204,026
Norman Wells $314,092 $434,897
Enterprise $59,060 $78,747
Łutselk’e $120,805 $161,073
Total $1,168,406 $1,582,542
It is important to note that capital expenses will also have a multiplier effect. For every million dollars in
construction investment, it would have an effect of $460,000 on GDP, $330,000 on labour income and 3.5
person-years of employment.
Summary of Economic Costs and Benefits
BENEFITS
Every $1 million spent on child care in the Northwest Territories is predicted to have an $800,000
impact on GDP, a $740,000 impact on labour and the potential creation of 9.86 person-years of
employment.
The employment rate of mothers is predicted to increase between 1 and 7 percentage points,
which translates to 76 to 727 more mothers in the workforce. Some of these new entrants would
be women with low educational backgrounds. Skills upgrading would be needed to support their
transition into the workforce. The information was not available to calculate this cost.
An increase in tax revenue of between $59,748 and $561,971 is predicted if all new workers did not
complete high school. This increase in tax revenue would range from $214,700 to $2,052,775 if all
new workers are similar to the average NWT worker.
Due to the predicted increase in employment based on other jurisdictions’ experience and
assuming job availability, GDP is calculated to increase by between $17,576,300 and $123,034,100
with the most conservative estimates and between $35,870,000 and $251,090,000 with upper
bound estimates.
COSTS
Between 221 and 299 additional early childhood educators would need to be trained and hired to
accommodate the increase in children enrolled in child care programs.
Predicted total yearly public expenditures would be between $20 million (reflecting Québec’s
level of spending and enrolment) and $45 million (reflecting Sweden’s level of spending and
enrolment) depending on the number of children in the system and the intensity of the program
offered. This includes approximately $17 - $43 million of new expenditures.
Predicted capital expenses of $8–$15 million would be required if new child care centres are built
to accommodate all increased demand. However, most increased demand could be housed in
surplus space in elementary schools.

Feasibility study of universal, affordable daycare in the Northwest Territories
86 CONCLUSIONS
Conclusions
Early childhood education and care provides multiple benefits to children, families and societies. Its
documented outcomes have led rich countries and poor to enhance programming opportunities for young
children. The NWT’s Early Childhood Development Framework and associated Action Plan reflect global trends
aimed at improving access to quality early childhood programs. The deliverables outlined in the Action Plan are
steps on the journey to universal child care, however the journey is not without its challenges.
The NWT’s child care system is immature, more closely resembling a cottage industry than a universal
service. Spending per child space is low, certainly when ranked against the comparator jurisdictions in this
study—Denmark, Norway, Sweden and Québec—but also by Canadian standards, which are substandard on
the international stage. The task of building a qualified early childhood workforce is confronted by a weak post-
secondary structure that would need considerable attention before it could meet new training demands. Day
care programs in the NWT lack some of the basic infrastructure supports found elsewhere, such as a common
curriculum guide and programming materials, professional associations, public quality assurance systems and
regulatory control over parent fees and staff salaries. This is not to say the NWT does not have great child care
programs, doing great things for children and families. However, without a trained and resourced workforce,
these will be the exception rather than the rule. Sections C and D provides recommendations to address some
of the shortcomings. The NWT also confronts the legacy of residential schools, which has created challenging
health and educational outcomes. Many of the new labour force entrants will come from the affected
population. To realize the full potential of these new workers, upfront investments in job training and
education will be required.
The tasks are great but not impossible. The NWT has a higher proportion of children using licensed day care
today than Québec did when it launched its plan for universal care in 1997. Two decades ago, fewer than one
in three staff in Québec child care programs had any early childhood training. Québec mothers had a lower
labour force participation rate in 1997 than NWT mothers do today. Québec’s 1997 child poverty rates equaled
those for the NWT in 2014 and its budget was in deep deficit reeling from major cuts in federal transfer
payments..
A plan and a major commitment of resources set Québec on the road to universal child care, a journey that is
still incomplete and one that has come with its own set of challenges. The centerpiece of Quebec’s plan was
first $5 a day, and then $7 a day, child care. The low fees created hyper demand leading to unintended
consequences. Québec’s original vision was to grow a system of non-profit child care programs. Community
agencies could not keep pace, and by 2003 the government turned to commercial and home child care to
speed expansion. Québec has been struggling with issues of equity, quality and cost containment ever since.
Looking to other Canadian jurisdictions for change models was outside the scope of this study, but PEI is
worthy of consideration. In 2010, PEI’s day care terrain closely resembled the NWT’s. Since then, a planned
transformation of child care services has created a coherent base to build on and has avoided many of
Québec’s problems. A summary of the Québec and PEI approaches is available in Appendix C.
A feature of universal systems of early childhood education and care is resolving divisions between “education”
and “care.” The goal is to provide all children with a core program while offering additional hours to
accommodate parents’ workforce needs. Just as important is the integration of child care with education and
intervention services as a means to reduce risk, address vulnerabilities at an early age and build a healthy

Feasibility study of universal, affordable daycare in the Northwest Territories
87 CONCLUSIONS
foundation for school and life experiences. Partnerships between early childhood programs and schools are the
norm across the globe. Three of the four jurisdictions in the study are building on their school systems to
provide universal preschool for children starting at age 3 or 4 years. Full-day Kindergarten for 4 year olds is one
of the stepping stones toward universal child care in the NWT’s Action Plan. NWT schools also hold
considerable surplus space. This space is a public asset that could be repurposed to meet the education and
care needs of younger children.
While there are benefits to more and better child care, there are also costs. The predicted public expenditures
to provide child care to all 0–4 year olds would be $20-million per year if funded at the same levels as
Québec and $45-million per year if funded at levels comparable to the Scandinavian countries. This would
require an increase of funds of between $17-million and $43-million. That investment would have many
economic benefits, including: increasing GDP by $16–36 million; increasing labour income by between $14.8
and $33.3 million; and supporting between 197 and 444 person-years of employment. In addition, there would
be an increase in women entering the labour force, which in turn would increase tax revenue and decrease
social assistance costs.
Predictions of the costs and benefits of universal child care made in this study are not guarantees. They were
however developed using the same tools that finance departments in modern economies use whenever new
program costs are estimated. Perhaps cost and cost recovery options should not be the main policy driver
when confronted with Kindergarten assessments indicating 2 out of 5 children are entering school with delays
that will likely compromise their academic and life chances. No society can prosper when such a huge portion
of its youngsters are left behind.
The role of researchers is to gather the evidence. We have done this using the data available to us. Ultimately
the decision to proceed with creating a universal system of child care in the NWT will be made by policy-
makers in consultation with their citizens.

Feasibility study of universal, affordable daycare in the Northwest Territories
88 REFERENCES
References
Allen, G. (2011). Early intervention: Smart investment, Massive savings: The second independent report to Her Majesty’s Government. London, UK: Cabinet Office.
Anderson, P. M., & Levine, P. B. (1999). Child care and mothers’ employment decisions. Report prepared for Joint Center for Poverty Research Conference. NBER Working Paper No. 7058. Cambridge, MA: National Bureau of Economic Research.
Andrén, T. (2003). The choice of paid childcare, welfare, and labor supply of single mothers. Labour Economics, 10(2), 133-147.
Auditor General Canada. (Feb. 2012). Status report of the Auditor General of Canada to the Northwest Territories Legislative Assembly. Ottawa, ON: Office of the Auditor General Canada.
Baker, M., Gruber, J., & Milligan, K. (2005). Universal childcare, maternal labour supply and family well being, NEBER Working Paper No. 11832. Retrieved from www.nber.org/papers/w11832
Baker, M., Gruber, J., & Milligan, K. (2008). Universal child care, maternal labor supply, and family well being. Journal of Political Economy, 116(4), 709-745.
Barnett, W. S. (2010). Universal and targeted approaches to preschool education in the United States. International Journal of Child Care and Education Policy, 4(1), 112.
Barnett, W. S. (2008). Preschool education and its lasting effects: Research and policy implications. New Brunswick, NJ: Rutgers University, National Institute for Early Education Research.
Barnett, W. S. (2007). Benefits and costs of quality early childhood education. The Children’s Legal Rights Journal (CLRJ), 27, 723.
Barnett, W. S., & Frede, E. C. (2010). The promise of preschool: Why we need early education for all. American Educator, 34(1), 2140.
Barnett, W. S., & Masse, L. N. (2007a). Early childhood program design and economic returns: Comparative benefit-cost analysis of the Abecedarian program and policy implications. Economics of Education Review, 26, 113-125.
Barnett, W. S., & Masse, L. N. (2007b). Comparative benefit–cost analysis of the Abecedarian program and its policy implications. Economics of Education Review, 26(1), 113-125.
auernschuster, S., & Schlotter, M. (2015). Public child care and mothers’ labor supply: Evidence from two quasi-experiments. Journal of Public Economics, 123, 1-16.
Berger, M. C., & Black, D. A. (1992). Child care subsidies, quality of care and the labour supply of low income mothers. Review of Economics & Statistics, 74(4), 635-642.
Bettendorf, L., Jongen, E., & Muller, P. (2012). Childcare subsidies and labour supply: Evidence from a large Dutch reform. Tinbergen Institute Discussion Paper No. 12-093/I. Retrieved from http://nbn-resolving.de/urn:NBN:nl:ui:31-1871/38506
Blau, D. M., & Hagy, A. P. (1998). The demand for quality in child care. Journal of Political Economy, 106(1), 104.

Feasibility study of universal, affordable daycare in the Northwest Territories
89 REFERENCES
Blau, D. M., & Robins, P. K. (1988). Child-care costs and family labor supply. The Review of Economics and Statistics, 374-381.
Blau, D., & Tekin, E. (2007). The determinants and consequences of child care subsidies for single mothers in the USA. Journal of Population Economics, 20, 719-741.
Campaign 2000. (2014). 2014 report card on child and family poverty in Canada. Toronto, ON: Campaign 2000. Retrieved from www.campaign2000.ca/anniversaryreport/CanadaRC2014EN.pdf
Campbell, F. A., Pungello, S., Miller-Johnson, S., Burchinal, M., & Ramey, C. (2001). The development of cognitive and academic abilities: Growth curves from an early childhood educational experiment. Developmental Psychology, 37(2), 231-242.
Carey Consulting Evaluations. (2010). Northern women in mining, oil and gas (nwmog): Summative project evaluation. Report prepared for the Status of Women Council NWT. Yellowknife, NWT: Status of Women Council NWT.
Caspi, A., Moffitt, T. E., Newman, D. L., & Silva, P. A. (1996). Behavioral observations at age 3 years predict adult psychiatric disorders: Longitudinal evidence from a birth cohort. Archives of General Psychiatry, 53(11), 1033-1039.
Centre for Spatial Economics. (2009). Literature review of the socioeconomic effects and benefits. Understanding and addressing workforce shortages in early childhood education and care (ECEC) project. Ottawa, ON: Child Care Human Resources Sector Council. Cleveland, G., & Krashinsky, M. (2003). Financing ECEC services in OECD countries. Research Paper for Conference on Financing ECEC Services. Rotterdam, Netherlands. Connelly, R. (1992). The effect of child care costs on married women’s labor force participation. The Review of Economics and Statistics, 74(1), 83-90.
Connelly, R., & Kimmel, J. (1999). Marital status and full-time/part-time work status in child care choices. Upjohn Institute Working Paper No. 99-58. Kalamazoo, MI: W.E. Upjohn Institute for Employment Research.
Connelly, R., & Kimmel, J. (2003). The effect of child care costs on the labor force participation and welfare recipiency of single mothers: Implications for welfare reform. Southern Economic Journal, 69(3), 498-519.
Corter, C., Janmohamed, Z., & Pelletier, J. (Eds.). (2012). Toronto first duty: Phase 3 report. Toronto, ON: Atkinson Centre for Society and Child Development, OISE/University of Toronto.
Commission on Social Determinants of Health. (2008). Closing the gap in a generation: Health equity through action on the social determinants of health: Final report of the Commission on Social Determinants of Health. Geneva, CH: World Health Organization.
Department of Education, Culture and Employment, GNWT. (September 2014). JK demonstration evaluation executive summary. Yellowknife, NWT: Ministry of Education, Culture and Employment.
Department of Education, Culture and Employment, GNWT. (2013–2014). Junior Kindergarten demonstration implementation evaluation technical report. Yellowknife, NWT: Ministry of Education, Culture and Employment.

Feasibility study of universal, affordable daycare in the Northwest Territories
90 REFERENCES
Department of Education, Culture and Employment, GNWT. (2011). ECE Response to the standing committee on government operations report on the review of the report of the auditor general on education in the NWT. Yellowknife, NWT: Ministry of Education, Culture and Employment.
Department of Education, Culture and Employment, GNWT. (2005). Building on our success: Strategic plan 2005–2015. Yellowknife, NWT: Ministry of Education, Culture and Employment.
Dishion, T. J., French, D. C., & Patterson, G. R. (1995). The development and ecology of antisocial behavior. In D. Cicchetti & D. J. Cohen (Eds.), Developmental psychopathology, vol. 2: Risk, disorder, and adaptation. Oxford, UK: John Wiley and Sons.
Doherty, G., Lero, D., Goelman, H., LaGrange, A., & Tougas, J. (2000). You bet I care! Guelph, ON: Centre for Families, Work and Well-Being, University of Guelph, Ontario.
Doherty, G., Lero, D., Goelman, H., Tougas, J., & LaGrange, A. (2000). Caring and learning environments: Quality in regulated family child care across Canada. Guelph, ON: Centre for Families, Work and Well-Being, University of Guelph, Ontario.
Duncan, G. J., Brooks-Gunn, J., & Klebanov, P. K. (1994). Economic deprivation and early childhood development. Child Development, 65(2), 296-318.
Duncan, G. J., Dowsett C. J., Claessens, A., Magnuson, K., Huston, A. C., Klebanov, P.& Japel, C. (2007). School readiness and later achievement. Developmental Psychology, 43(6), 1428-1446.
Fairholm, R. (2010). Early learning and care impact analysis. Toronto, ON: Atkinson Centre for Society and Child Development. OISE/University of Toronto.
Flanagan, K. (2010). The early years report: Early learning in PEI: An investment in the Island’s future. Retrieved from www.gov.pe.ca/photos/original/eduearlyyrsRpt.pdf
Flanagan, K., Beach, J., Michal, D., & Cormier, S. (2009). Pathways to early childhood credentialing in Canada. Ottawa, ON: Child Care Human Resources Sector Council.
Fortin, P., Godbout, L., & St-Cerny, S. (2012). Economic consequences of Québec’s educational childcare policy. Toronto, ON: Early Years Economic Forum, University of Toronto.
Garner, A., & Shonkoff, P. (2012). Early childhood adversity, toxic stress, and the role of the pediatrician: Translating developmental science into lifelong health. Pediatrics, 129, e224.
Gislason, I., & Eydal, G. (Eds.). (2011). Parental leave, child care and gender equality in the Nordic countries. Copenhagen, DK: Nordic Council of Ministers, TemaNord.
Gong, X., Breunig, R., & King, A. (2010). How responsive is female labour supply to child care costs: New Australian estimates, (5119, i-vii, 1-56). Treasury Working Paper. Bonn, Germany: Institute for the Study of Labour.
Gustaffson, S., & Stafford, F. (1992). Child care subsidies and labor supply in Sweden. The Journal of Human Resources, 27(1), 204-230.
Haeck, C., Lefebvre, P., & Merrigan P. (2013). Canadian evidence on ten years of universal preschool policies : The good and the bad. Working Paper No. 13-34. Montreal, QC: Centre Interuniversitaire sur le Risque, les

Feasibility study of universal, affordable daycare in the Northwest Territories
91 REFERENCES
Politiques Economiques et l’Emploi.
Halling-Illum, K. (2009). Family day-care in Denmark. Labour FOA – Trade and Labour. Copenhagen, DNK: Childcare Education Services Sector.
Han, W., & Waldfogel, J. (2001). Child care costs and women’s employment: A comparison of single and married mothers with pre-school-aged children. Social Science Quarterly, 82(3), 552-568.
Havnes, T., & Mogstad, M. (2011). Money for nothing? Universal child care and maternal employment. Journal of Public Economics, 95(11-12), 1455-1465.
Health and Education Research Group. (2012, Jan.) Year two report: New Brunswick Early Childhood Centres. Fredericton, NB: HERG.
Heckman, J. (2000). Policies to foster human capital. Research in Economics, 54(1), 3-56.
Heckman, J. (2008). Return on Investment: Cost vs. Benefits. Retrieved from www.heckmanequation.org
Herbst, C. M., & Tekin, E. (2011). Do child care subsidies influence single mothers’ decision to invest in human capital? Economics of Education Review, 30(5), 901-912.
Hofferth, S., & Collins, N. (2000). Child care and employment turnover. Population Research and Policy Review, 19(4), 357-395.
Janmohamed, Z. (2014). Early childhood education professional education strategy. Report prepared for the Department of Education. Toronto, ON: Atkinson Centre for Society and Child Development, OISE/University of Toronto.
Janmohamed, J., McCuaig, K., Akbari, E., Gananathan, R., & Jenkins, J. (2014). Schools at the Centre: Findings from Case Studies Exploring Seamless Early Learning in Ontario. Toronto, ON: Atkinson Centre for Society and Child Development, OISE/University of Toronto.
Japel, C., Tremblay, R., & Côté, S. (2005). Quality counts! Assessing the quality of daycare services based on the Québec longitudinal study of child development. RPP Choices, 11(5). Montreal, QC: Institute for Research on Public Policy.
Jenkins, S. P., & Symons E. J. (2001). Child care costs and lone mothers’ employment rates: UK evidence. The Manchester School. 69(2), 121-147.
Kandel, E., Schwartz, J., & Jessell, T., Eds. (2000). Principles of neural science. New York, NY: McGraw-Hill.
Kimmel, J. (1998). Child care costs as a barrier to employment for single and married mothers. Review of Economics and Statistics, 80(2), 287-299.
Lefebvre, P., & Merrigan, P. (2008). Child-care policy and the labor supply of mothers with young children: A natural experiment from Canada. Journal of Labour Economics, 26(3), 519-548.
Lefebvre, P., Merrigan, P., & Roy-Desrosiers, F. (2011). Québec’s Childcare Universal Low Fees Policy 10 Years After: Effects, Costs and Benefits: Working paper 11-01. Retrieved from www.cirpee.org/fileadmin/documents/Cahiers_2011/CIRPEE11-01.pdf

Feasibility study of universal, affordable daycare in the Northwest Territories
92 REFERENCES
Lefebvre, P., Merrigan, P., & Verstraete, M. (2009). Dynamic labour supply effects of childcare subsidies: Evidence from a Canadian natural experiment on low-fee universal child care. Labour Economics, 16(5), 490-502.
Liu, Z., Ribeiro, R., & Warner, M. E. (2004). Comparing child care multipliers in the regional economy: Analysis from 50 states. Ithaca, NY: Cornell University, Department of City and Regional Planning.
Lundin, D., Mörk, E., & Öckert, B. (2008). How far can reduced childcare prices push female labour supply? Labour Economics, 15, 647-659.
Macdonald, D., & Friendly, M. (November 2014). The Parent trap: Child care fees in Canada’s big cities. Ottawa, ON: Canadian Centre for Policy Alternatives.
Macdonald, D., & Wilson, D. (2013). Poverty or prosperity: Indigenous children in Canada. Retrieved from http://savethechildren.ca/document.doc?id=361
Magnuson, K., Ruhm, C. J., & Waldfogel, J. (2007). Does pre-Kindergarten improve school preparation and performance? Economics of Education Review, 26(1), 3351.
McCuaig, K. (March 2014). Review of the NWT’s child care governance and funding. Toronto: ON: Atkinson Centre, Ontario Institute for Studies in Education, University of Toronto.
McCuaig, K., & Akbari, E. (2014a). Early childhood education report 2014. Toronto, ON: Ontario Institute for Studies in Education/University of Toronto. Retrieved from http://timeforpreschool.ca/en/fullreport/
McCuaig, K., & Akbari, E. (2014b). Québec 2014. Toronto, ON: Ontario Institute for Studies in Education/University of Toronto. Retrieved from http://timeforpreschool.ca/media/uploads/profileseng/qcprofileeng.pdf
McCuaig, K., & Akbari, E. (2014c). Northwest Territories 2014. Toronto, ON: Ontario Institute for Studies in Education/University of Toronto. Retrieved from http://timeforpreschool.ca/media/uploads/profiles-eng/nt_profile-eng.pdf
McCuaig, K., & Akbari, E. (2014d). Prince Edward Island 2014. Toronto, ON: Ontario Institute for Studies in Education/University of Toronto. Retrieved from http://timeforpreschool.ca/media/uploads/profiles-eng/pe_profile-eng.pdf
McCuaig, K., Bertrand, J., & Shanker, S. (2012). Trends in early education and child care. Toronto, ON: Atkinson Centre of Society and Child Development, OISE/University of Toronto.
McCuaig K., & Hughes, C. (2000). When mom must work: Home daycare as welfare to work option. Toronto, ON: Ontario Coalition for Better Child Care.
McCain, M., Mustard, F., & McCuaig, K. (2011). Early Years Study 3. Toronto: ON: Margaret and Wallace McCain Family Foundation.
Mustard, F., McCain, M., & Shanker, S. (2007). Early Years Study 2. Toronto, ON: Council for Early Childhood Development.
Northwest Territories Bureau of Statistics. (2012). NWT Economic Multipliers – Overview and Results. Retrieved from www.statsnwt.ca/economy/multipliers/Multiplier%20Report-2012.pdf

Feasibility study of universal, affordable daycare in the Northwest Territories
93 REFERENCES
Organisation for Economic and Co-operative Development (OECD). (2014a). PF3.2: Enrolment in childcare and preschools. OECD Family database. Paris, FR: OECD Social Policy Division, Directorate of Employment, Labour and Social Affairs. Retrieved from http://www.oecd.org/social/family/database
OECD. (2014b). PF3.4: Childcare support. OECD Family database. Social Policy Division, Directorate of Employment, Labour and Social Affairs. Paris, FR: OECD Social Policy Division, Directorate of Employment, Labour and Social Affairs. Retrieved from http://www.oecd.org/social/family/database
OECD. (2013a). PF3.1: Public spending on childcare and early education. OECD Family database. OECD Social Policy Division Directorate of Employment, Labour and Social Affairs. Retrieved from http://www.oecd.org/social/family/database
OECD. (2013b). LMF1.2: Maternal employment rates. OECD Family database. OECD Social Policy Division Directorate of Employment, Labour and Social Affairs. Paris, FR: OECD Social Policy Division, Directorate of Employment, Labour and Social Affairs. Retrieved from http://www.oecd.org/social/family/database
OECD. (2012a). Access to early childhood education. In Education at a glance 2012: Highlights. OECD Publishing.
OECD. (2012b). Starting strong III: A quality toolbox for early childhood education and care. Country policy profiles. OECD Publishing. Retrieved from http://www.oecd.org/edu/school/startingstrongiiiaqualitytoolboxforearlychildhoodeducationandcare.htm
OECD. (2011). Encouraging Quality in Early Childhood Education and Care (ECEC). OECD Network on ECEC’s Survey for the Quality Toolbox and ECEC Portal. Retrieved from http://www.oecd.org/edu/school/48623811.pdf
OECD. (2010a). Excellence through equity: Giving every student the chance to succeed (Volume II). PISA, OECD Publishing. Retrieved from www.oecd.org/pisa/keyfindings/pisa2012 resultsvolumeii.htm. Also see OECD (2013). PISA 2012 Results.
OECD. (2010b). PF4.2: Quality of childcare and early education services. OECD Family database. OECD Social Policy Division Directorate of Employment, Labour and Social Affairs. Retrieved from http://www.oecd.org/social/family/database
OECD. (2008). Growing unequal? Income distribution and poverty in OECD countries. Country note: Canada. Paris, FR: OECD Publishing.
OECD. (2006). Starting Strong II: Early Childhood Education and Care, OECD Publishing, Paris. DOI: http://dx.doi.org/10.1787/9789264035461-en
Pascal, C. E. (2009). With our best future in mind: Implementing early learning in Ontario. Toronto, ON: Queen’s Printer. Retrieved from http://www.ontario.ca/en/initiatives/earlylearning/ONT06018865.html
Peters. R. D., Nelson, G., et al. (2010). Investing in our future: Highlights of Better Beginnings, Better Futures research findings at Grade 12. Kingston, ON: Better Beginnings, Better Futures Research Coordination Unit, Queen’s University.
Pianta, R. C., & Howes, C. (Eds.). (2009). The promise of pre-K. Baltimore, MD: Brookes Publishing.

Feasibility study of universal, affordable daycare in the Northwest Territories
94 REFERENCES
Powell, L. M. (1997). The Impact of child care costs on the labour supply of married mothers: Evidence from Canada. The Canadian Journal of Economics/Revue Canadienne d’Economique, 30(3), 577-594.
Powell, L. M. (2002). Joint labor supply and childcare choice decisions of married mothers. The Journal of Human Resources, 37(May), 106-128.
Pratt, J., & Kay, D. (2006). Beyond looking backward: Is child care a key economic sector? Community Development, 37(2), 23-37. Prentice, S. (2007a). Rural childcare: Childcare as economic and social development in Parkland. Winnipeg, MB: Child Care Coalition of Manitoba.
Prentice, S. (2007b). Franco-Manitoban childcare: Childcare as economic, social, and language development in St.Pierre-Jolys. Winnipeg, MB: Child Care Coalition of Manitoba.
Prentice, S. (2007c). Northern childcare: Childcare as economic and social development in Thomson. Winnipeg, MB: Child Care Coalition of Manitoba.
Prentice, S. (2007d). Less access, worse quality: New evidence about poor children and regulated child care in Canada. Journal of Children & Poverty, 13(1), 57-73.
Prentice, S., & McCracken, M. (2004). Time for action: An economic and social analysis of childcare in Winnipeg. Winnipeg, MB: Child Care Coalition of Manitoba.
Ribar, D. C. (1992). Child care and the labor supply of married women: Reduced form evidence. Journal of Human Resources, 27(1), 134-165.
Ribar, D. C. (1995). A structural model of child care and the labor supply of married women. Journal of Labor Economics, 13(3), 558-597.
Rolnick, A., & Grunewald, R. (2003). Early childhood development: Economic with a high public return. fedgazette. Minneapolis, MN: Federal Reserve Bank of Minneapolis.
Sammons, P., Sylva, K., Melhuish, E., Siraj-Blatchford, I., Taggart, B., Grabbe, Y., & Barreau, S. (2007). Effective preschool and primary education 311 project (EPPE 311) Influences on children’s attainment and progress in key stage 2: Cognitive outcomes in Year 5. London, UK: Institute of Education, University of London/Department for Education.
Sammons, P. K., Sylva, E., Melhuish, E., Siraj-Blatchford, B., Taggart, K., Toth, D., & Draghici, R. (2011). Effective Pre-School, Primary and Secondary Education Project (EPPSE 3–14): Influences on students’ attainment and progress in Key Stage 3: Academic outcomes in English, maths and science in Year 9. London, UK: Institute of Education, University of London/Department for Education.
Schweinhart, L. J. (2012). Preschool programs for children in disadvantaged families. Encyclopedia on Early Childhood Development. Retrieved from http://www.child-encyclopedia.com/documents/SchweinhartANGxp2.pdf
Sibley, E., Dearing, E., Toppelberg, C. O., Mykletun, A., & Zachrisson, H. D. (2015). Do increased availability and reduced cost of early childhood care and education narrow social inequality gaps in utilization? Evidence from Norway. International Journal of Child Care and Education Policy, 9:1. DOI 10.1007/s40723-014-0004-5.

Feasibility study of universal, affordable daycare in the Northwest Territories
95 REFERENCES
Solow, R. M. (1956). A contribution to the theory of economic growth. The Quarterly Journal of Economics, 65-94.
Statistics Canada. (2014). Aboriginal Peoples in Canada: First Nations People, Métis and Inuit. Retrieved from www12.statcan.gc.ca/nhsenm/2011/assa/99 011x/99011x2011001eng.cfm
Statistics Canada. (2010). Aboriginal statistics at a glance. Retrieved from www.statcan.gc.ca/pub/89645x/89645x2010001eng.htm
Statistics Canada and Status of Women Canada. (2013). Fact sheet: Economic Security. Retrieved from http://www.swccfc.gc.ca/initiatives/wespsepf/fsfi/esseeng.html
Sylva, K., Melhuish, E., Sammons, P. Siraj, I., & Taggart, B. (2008). Final report from the primary phase: Preschool, school and family influences on children's development during key stage 2. DCSF Research Report 61. Nottingham, UK: Institute of Education, University of London.
Tekin, E. (2004). Child care subsidy receipt, employment, and child care choices of single mothers (No. 10459). Cambridge, MA: National Bureau of Economic Research.
United Nations Children’s Fund. (May 2012). Measuring child poverty: New league tables of child poverty in the world’s rich countries. Rome, Italy: UNICEF.
United States General Accounting Office. (1994). Child care subsidies increase likelihood that low-income mothers will work. Education Information Resources Centre.
Viitanen, T. K. (2005). Cost of childcare and female employment in the UK. Labour, 19(2005), 149-170.
Walker, S. P., Wachs, T. D., Grantham-McGregor, S., lack, M. M., Nelson, C. M., Huffman, S., …, Richter, L. (2011). Inequality in early childhood: Risk and protective factors for early child development. The Lancet, 378(9799), 1325-1338.
Warner, M. (2009). Child care multipliers: Stimulus for the States. Linking Economic Development and Child Care Research Project. Ithaca, NY: Cornell University.
Winsler, A., Tran, H., Hartman, S., Madigan, A., Manfra, L., & Bleiker, C. (2008). School readiness gains made by ethnically diverse children in poverty attending center based childcare and public school pre-Kindergarten programs. Early Childhood Research Quarterly, 23, 314-329.
Yoshikawa, H., Weiland, C., Brooks-Gunn, J., Burchinal, M. R., Espinosa, L. M., Gormley, V., Zaslow, M. (2013). Investing in our future: The evidence base on preschool education. Ann Arbor, MI: Society for Research in Child Development and New York, Foundation for Child Development. Retrieved from http://goo.gl/2gxwtS

Feasibility study of universal, affordable daycare in the Northwest Territories
96 APPENDIX A: FOCUS GROUP AND KEY INFORMANT RESPONSES
APPENDIX A: FOCUS GROUP AND KEY INFORMANT RESPONSES
The study used key informant interviews and focus groups to gather perceptions of universal child care and
how it might look in the NWT. The Department of Education, Culture and Employment developed the list of key
informants based on the sectors suggested by the researchers. The department distributed the invitations and
advertised the focus groups through its communication networks. Not everyone invited to take part in the
study did. Those who participated signed a consent form as part of the research process. The research team
agreed to maintain full confidentiality of the participants and no identifying markers are included.
Three focus groups (N 31) and 23 key informant interviews were conducted between November 4 and 6, 2014.
In-person participation was limited to the Yellowknife area. Regional participation occurred via teleconference.
An additional 12 interviews were conducted via phone and through written submissions between November 7,
2014 and February 18, 2015. All the focus groups were recorded and transcribed by an external party. Raw
data are only available to the research team.
A total of 66 participants took part in the study, including parents, day care centre operators, home day care
providers, Aboriginal Head Start (AHS) directors, Kindergarten (JK) teachers, school administrators, community
leaders and Aboriginal Government and GNWT officials. Participants were from Yellowknife, Hay River, Inuvik,
N'Dilo, Tlicho, Fort Simpson, Fort MacPherson and Dettah.
The researcher outlined the purpose and format of the feasibility study, followed by introductions. The same
set of questions was used for all focus groups and interviews. The language of each question may have been
adapted for the audience, but the core principles remained consistent.
The following summarizes the responses to each question posed by the researcher, capturing the most agreed
upon feedback and noting outliers. Participant quotes are provided to illustrate the range of feedback received
and are not intended to suggest a consensus position. More feedback was provided to some questions than to
others and this is reflected in the number of quotes provided. When a quote is identified, care was taken to
avoid participant identification.
Q: What does universal affordable day care mean to you?
The term “universal child day care” was confusing for participants. Many respondents defined what it was not.
Universal should not mean “mandatory” and it should not mean “free.” Most were aware that Québec offers
low cost child care, but associated the Québec program with quality and access problems and with high costs
for government. With caveats, participants supported the concept of universal child care. Some raised
concerns about the public costs of a universal program, while others noted it could expand the economy and
the tax base by enabling more parents to work. Some home day care providers were apprehensive that an
increase in the supply of child care would hurt their business model. A small number questioned the purpose of
universal day care: “If it is about supporting working parents, then it’s child care. If it’s about early learning, it
needs another name.”
From the interviews and focus groups:
For everyone. It should be available. Every child could attend.
Like school, but parents would decide if their child goes.

Feasibility study of universal, affordable daycare in the Northwest Territories
97 APPENDIX A: FOCUS GROUP AND KEY INFORMANT RESPONSES
Fair. Provides equal opportunities for all children to have some kind of ECE program.
It shouldn’t be free. Parents should pay what they can.
A nice idea. I don’t know if it’s practical.
Who is going to pay for it?
There are 13 communities with no licensed child care. No doubt there is a need.
Schools provide positive feedback about kids who enter school from child care. If that is the goal, then it’s
worthwhile.
Universality is not standardization. Regional differences should be built into design.
Young children should be home with their parents.
Q: Is child care a program primarily for children? Parents? Others?
For most respondents, child care is a program for parents in the workforce. Many shared their own stories and
the stories of others relating the difficulties in finding and paying for child care. Most worried that children who
“need child care most, don’t get it.” It was called “a life line” for children living in chaotic or neglectful
circumstances. Some saw child care as particularly important to women fleeing domestic violence or needing
to address their own health issues.
Many participants remarked on the social benefits offered by child care—as a job creator, particularly for
women in smaller communities where jobs are scarce; as a contributor to local economies by increasing
purchasing power and giving back in taxes; in the skills development of early childhood educators; in reducing
family dysfunction and related social costs; and in promoting school readiness.
From the interviews and focus groups:
Every child should get something—part-time and drop-in programs for parents at home and safe, caring
environments for those who work.
Look at the EDI results for the NWT. We must deal with vulnerable children’s needs. ECD investment is
critical.
Upper middle class families have the best access but the kids who need it most are not able to access child
care. That’s why Junior Kindergarten is important.
Low income isn’t the only problem. Parents are struggling with the legacy of residential schools and their
own emotional challenges or substance abuse. Their kids need a respite from the dysfunction. Parents need
child care to access help.
The growth industry is in nannies. There is just not enough care, particularly for infants.

Feasibility study of universal, affordable daycare in the Northwest Territories
98 APPENDIX A: FOCUS GROUP AND KEY INFORMANT RESPONSES
It should be open to all families. All children may have some challenges — hiccups that are best dealt with
early.
Families are forced into separation to access services for their children.
Women shouldn’t have to choose abject poverty as an alternative to violence.
Child care is key to alleviating poverty. Every child should be entitled to good child care. It creates a level
playing field.
We have a 25 percent graduation rate. That is proof that we’re not getting it right in the early years.
On Mondays we just feed, feed, feed. Many haven’t eaten all weekend.
Assume there would be requirements for parents to either work or be in school—not just unemployed and
sitting at home but I am concerned about the lack of parenting skills and support from extended family.
Young moms would significantly benefit from universal child care. They could return to school. It would
remove the isolation and promote communication skills for parents and children.
Child care is to support the workforce and it can support learning through social interactions with other
children to establish learning and listening skills.
Primarily for children to support their development. And for parents to help them be better parents
Q: How should parents be involved in child care?
Respondents were strongly in favour of significant parent involvement in their child’s program, and saw it as
important to reinforce learning in the home and to support parenting skills. They felt staff should make a
conscious effort to “meet and greet” parents on a daily basis. Programs should do more than just provide care,
but need to include family supports and early intervention as well. The importance of engaging parents as early
as possible was stressed, noting the success of the healthy babies programs.
Participants saw a major role for elders and for parents to take part on child care boards, to volunteer in the
program to share cultural experiences, to read to the children and to help out with lunches and field trips.
“Communications books” and calendars were suggested as a way for parents and staff to document children’s
progress and share information. Some found social media a useful medium. Transportation was cited as a
barrier to parent participation in many communities. However, some administrators raised caution about an
“open door” policy for parents, noting that sometimes parent behaviour can be disruptive.
From the interviews and focus groups:
The success of ECD intervention is short lived unless there is also support in the home.
We need to look at child care and family support jointly starting with toddlers. It can be beneficial for
infants as well, particularly if the child is at risk, with more engagement when the child is more mobile.
I would like a model that provides family support initiatives and supports parenting skills. Mothers need
to be seen as capable and able.
It is important to remember that family life can be dysfunctional and kids are safer here. Sometimes
having those parents here is risky for other kids.

Feasibility study of universal, affordable daycare in the Northwest Territories
99 APPENDIX A: FOCUS GROUP AND KEY INFORMANT RESPONSES
Schools are often the only safe place in the child’s life.
Parent participation should be mandatory, particularly language classes to make sure parents know how
to talk to their kids.
Some elders won’t even come into the school. We get better attendance if we hold events in the band
building.
Parents should take part in programs where possible. When parents and children are together, we can
model how raising their child can be fun and help parents see that children don’t raise themselves.
Q: What goals should parents and program staff have for children attending child care?
There was a strong consensus among educators that child care should focus on creating playful environments
for children to develop their social and emotional skills. Educators were concerned that parents and some
operators were too focused on the “3Rs” and didn’t see the role of play in children’s development. School
readiness was seen as an important goal by both parents and educators.
From the interviews and focus groups:
To develop life long learning strategies, to reach their potential and be whatever they want to be.
When children are socially and emotionally ready for school, the academics will follow.
There needs to be an understanding that play is learning.
Goals change as children grow. At age 2–3, group peer exposure and developing play skills are important.
Cognitive skills are developed in the process of active learning and active participation.
Parents should be made aware of developmental milestones and how they can support their child to
reach them.
Kindergarten teachers noted the advantages of children participating in early childhood programs.
I can tell on day one the children who have been to child care or Head Start compared to those who
stayed home.
I was unbelievably impressed with how the new JK kids (who came from child care) participated in circle
ceremony.
Kids from child care are open to being in the group, know how to play with other children and are more
engaged with one other.
Kids that don’t attend child care don’t talk or use baby talk. They don’t know how to play with other
children.
58 percent of our kids are in the extremely vulnerable EDI range. We’re expecting results to change with
new crop of JK kids.
Q: Should children’s progress in child care be assessed? How?
Respondents felt children should be assessed for developmental challenges to allow for early intervention.
Parents and staff should have regular formal and informal discussions of children’s progress. Respondents also

Feasibility study of universal, affordable daycare in the Northwest Territories
100 APPENDIX A: FOCUS GROUP AND KEY INFORMANT RESPONSES
felt that checklists that staff could use on a regular basis and share the results with parents would be useful. All
agreed that young children should not be tested or graded.
From the interviews and focus groups:
Assessment at entry should include rehab practitioners to identify speech and social challenges.
Assessing children early for motor, FAS, hearing, sight and other problems and developing a longer term
action plan would have unlimited benefits.
Children should be assessed at entry and a plan made around improving that baseline throughout the
year.
It shouldn’t be a priority to assess except it is helpful to assess hearing and speech when the child is
young.
Q: How do staff know if they are doing a good job? For example: Are there quality tools and monitoring?
How are findings shared?
Respondents supported the use of a common quality monitoring tool such as the Early Childhood Environment
Rating Scale (ECERS). Parents in particular wanted more information about child care quality, suggesting online
posting of licensing results, accreditation of programs that met top standards and “restaurant type” reviews.
Many felt the views of parents should form part of the evaluation (e.g., parent surveys). Others felt
government should be more proactive in addressing bad practices in programs.
From the interviews and focus groups:
Licensing results should be posted for transparency—like public health.
Government funding has to be tied to basic standards of training and quality.
If you contact ECE with a complaint you’re told to speak to the daycare. As a parent you feel if you
complain it may be held against your child.
You can complain but risk having no child care.
Q: Should programs be required to offer flexible hours?
Respondents agreed there should be the option of full and part-time hours to support parents involved in
wellness, schooling or part-time work. Operators were anxious about the extra staffing costs and who would
pay. Larger child care centres noted that they already offer flexible care. Smaller centres and home care
operators didn’t feel it was a viable option under the current funding model.
From the interviews and focus groups:
There should be core hours that all children attend. Some families may need more hours and those
could be offered if there was enough demand.
Not too flexible. Children need the structure of regular programming.
Structure does help alleviate the home stress of lack of structure.

Feasibility study of universal, affordable daycare in the Northwest Territories
101 APPENDIX A: FOCUS GROUP AND KEY INFORMANT RESPONSES
There should be some part time care, but not every program should be required to be flexible.
It would be nice if they operated to cover traditional work hours. My daughter’s afterschool program
ended at 5 p.m. -- that is when my work ended. I would feel sick everyday waiting for the clock to hit 5
and I could run out the door.
Q: Should programs operate during nontraditional hours, such as on weekends or overnight?
Respondents were anxious that small children not spend too much time out of the home. They were more
comfortable with care to cover for parents who need to work on Saturday, but didn’t feel child care was
appropriate for overnight care unless it was a home environment. Operators felt non-traditional programming
would be hard to staff and would not be financially viable. Others want school hours to better support parents
work schedules.
From the interviews and focus groups:
If a parent must work nights it would be better for a family member to take the child.
It would be nice to have regular daycare. Never mind for Saturday shopping or date night.
I already work long days. I need time for my family on weekends and evenings.
We can’t find staff to work regular shifts.
Why does school start at 8:45 when most parents start work at 8:30?
Q: How should the child care program connect children to services and activities in their community? For
example: recreation, drop in programs, libraries, health clinics, etc.
Many respondents saw the benefits of a more integrated approach to the delivery of children’s services.
Schools were seen as potential community hubs offering a range of family services and a more convenient
place for families to access intervention services, such as occupational therapy and speech and language.
Operators, educators and parents noted the challenges involved in obtaining special needs assessments and
supports. This area in particular would benefit from more integration between health, education and social
services. Others saw the need to create a continuum of services for families, noting the success of the healthy
babies program. However that contact ends after the baby turns 12 months and no other programs are
available until age 3 with Aboriginal Head Start or age 5 when children may attend Kindergarten. Others felt
programs should be better resourced to outreach to families.
From the interviews and focus groups:
Integrate health, social services, education. There is too much overlap.
Set up schools as community hubs offering a range of early childhood programs like baby classes, drop
in, resources, preschool, child care and health services.
Include health practitioners in child care to observe the child interactions with parents.
We can be more flexible—AHS can provide a universal program while bridging to child care and school

Feasibility study of universal, affordable daycare in the Northwest Territories
102 APPENDIX A: FOCUS GROUP AND KEY INFORMANT RESPONSES
programs.
All the child development meetings take place at the hospital. It’s too clinical. There’s too many forms;
too many signatures. Parents don’t understand and give up.
Need doctor’s referral to get extra funding from GNWT ECE department (for children with special
needs). Then you need to write a proposal to access funding. It’s too cumbersome; takes too long.
Special education should be based out of a joint health/education system. Speech pathologists should
work out of schools—but instead parents are expected to take children for a hospital visit. If they miss
an appointment, they are dropped to the bottom of the wait list. If they miss three, they are dropped
completely. Why make it so difficult for parents
This is the ideal situation. It would help children be aware of what and who is in their community, to
connect with the elders.
Q: How does the child care program foster respect for the differences each child and family brings including
appearance, culture, ethnicity, race, language, gender, sexual orientation, religion, family environment and
developmental abilities?
Most respondents focused on an inclusive culture in the classroom, where different holidays are celebrated,
Aboriginal languages are taught and diversity is seen in toys, books, photos, dolls, etc. Some also felt there
should be specific training for staff in this area. AHS programs in particular draw on the resources that elders
provide. A minority felt including diversity in the program was unnecessary.
From the interviews and focus groups:
We integrate our culture into everything—our food, our language, our stories. The children were
interested in superheroes. We developed stories of Aboriginal superheroes.
This is a very important role of the teachers and the program. By bringing elders in, we are exposing
children to people in their community. They begin by respecting each other and their differences. We
are all special and we are all different. This is an important thing to learn.
We don’t need to teach why a child has two moms. Kids are accepting of differences.
Q: How would universal child care adapt to the challenges of geographic distance and isolation in rural and
remote communities?
Most respondents suggested that transportation would be required, but concerns were also raised about
young children spending too much time travelling or travelling unsupervised with older children. Some
suggested partnering with other programs, such as schools, that may provide bus services for students. Others
suggested using the Internet to facilitate communications between staff and parents and to open up
opportunities for staff to connect with programs in other regions.
From the interviews and focus groups:
Could use churches, community centres, band buildings if no daycare or school exist. Little kids
shouldn’t be spending an hour each way on buses.
Older students could be trained to act as bus monitors and look out for the little ones. It would teach

Feasibility study of universal, affordable daycare in the Northwest Territories
103 APPENDIX A: FOCUS GROUP AND KEY INFORMANT RESPONSES
responsibility.
The NWT has good video conferencing that could be better used for staff training and special needs
consultations.
Q: How many children should a staff member in a child care program be responsible for?
Most felt that current ratios for day care centres are satisfactory but want extra staff when there are children
with special needs. Home day care providers felt ratios are too high. Most home day care respondents
operated with fewer children than the maximum allowed. The allowance for unlicensed caregivers to enrol
more infants was cited as a reason for home care providers dropping their licence. Some home care providers
would like to hire an assistant, allowing them to care for more children or to hire replacement staff to cover for
them when they are unavailable.
From the interviews and focus groups:
There is a baby boom the NWT. You can operate providing infant care alone.
Five to six children per home would be good enough.
We hire extra help when there are children with special needs.
Q: What qualifications should the staff employed in the program have?
Formal qualifications were more important to operators and educators than to parents and family child care
providers. Parents felt caring and compassion are the most important qualities for staff. Home care providers
saw the need for child development knowledge but did not feel a diploma or certificate was necessary.
Operators and educators referenced the shortage of trained staff. This group saw the one-year certificate as a
minimum but would prefer lead staff to have more training. Yellowknife operators reported going outside the
NWT to find ECE trained staff or taking steps to provide specialized training in house for their staff. AHS and
child care operators also recommended additional training for program supervisors, particularly in business
management, human relations and cultural awareness. A small number would like to see a professional college
or registration process as a condition of practice. The importance of early childhood training for JK teachers
was seen as important.
From the interviews and focus groups:
It’s important to know about child development, interactions and research, but an ECD diploma is not
necessary. Some people are naturally gifted for this work.
AHS staff often have no formal education. They tend to focus on language and literacy based on their
own previous learning experiences.
Preschool teachers don’t need a full degree in education. Some child development training is good
enough but they need to understand that play is learning.
Day home providers earn a high income, often with the most minimal qualifications. They need a
diploma too.
Kindergarten teachers should focus on children 5 and up. Preschool and JK should include ECEs with

Feasibility study of universal, affordable daycare in the Northwest Territories
104 APPENDIX A: FOCUS GROUP AND KEY INFORMANT RESPONSES
child development training.
Training should be encouraged but not mandatory. Otherwise you’re threating people’s livelihood.
We need a combination of formal training and a special northern education. Teachers need to listen to
people who know the North and know their way of learning. We need to also change the school
curriculum, to adapt to the North and traditional ways.
Q: What is needed to grow the number of ECE trained staff?
Respondents named high living costs in the NWT and low pay in child care as barriers to recruiting trained staff.
They suggested attracting new entrants through a public campaign and co-op placements in AHS and child care
programs. An “Intro to ECD” course now being piloted as a dual credit program in high schools is seen as
promising. Programs are investing in professional development (PD) for their staff, but they want it to count
toward a certificate or diploma. Providers like the Science of Early Childhood Development online resource but
respondents noted that online training can be difficult because of connection speed, reliability and the high
cost of Internet services.
Many felt it took too long to complete the Aurora College certificate through distance learning. Others wanted
better connections between Aurora College and AHS. Generally staff wanted intensive weeklong courses in or
near their own communities. They were pleased with the department training offered in September (2014) but
would have appreciated more advanced notice. Training for directors and Kindergarten teachers was also
highlighted as a need. Some cautioned that expanding access to child care should not come at the expense of
trained staff: “if universal child care proceeds, focus on training at the front end.”
From the interviews and focus groups:
Average salary for an ECE should be a living wage, which is $75,000 in the NWT.
We pay for our staff to take courses and our wage scale is linked to training as an incentive.
There are long wait lists and college training courses only operate during the school year when it’s difficult
for staff to get time off.
Set up satellite courses in the community—send the instructors out.
PD is important but it needs to be paid for and should be counted toward a certificate or diploma.
Aurora College is offering a good balance of teleconference classes. It is a solid idea but it takes forever to
finish.
Provide intensive institutes—one week per course
It’s more effective to deliver (training) in the community with a lead ECD expert that can do both theory
and practice.
It is very hard to access in-service training with your colleagues. Replacement staff is very difficult to find.
Program standards are inconsistent for courses and practicum. They need to be standardized.
Training would work if it was delivered in the community, was cost effective and child care was provided.
Establish a 1–2 year program offering alternate training delivery in the community for the first year and

Feasibility study of universal, affordable daycare in the Northwest Territories
105 APPENDIX A: FOCUS GROUP AND KEY INFORMANT RESPONSES
then add distance and online learning.
Establish an alternate delivery of early childhood training that combines face-to-face, online and video
conferencing.
August is the best time to provide intensive training in the community
We need a centralized bank of replacement staff so we can offer training during working hours.
Q: How can diversity be encouraged in the early childhood staffing?
Of those who responded, some said the field should be promoted to a broader range of potential applicants.
Applicants are often parents of young children themselves, therefore child care during training is seen as
essential. Mentoring and training in home communities was frequently mentioned, as was attracting new
entrants out of high school through co-op programs that count toward a certificate. Some respondents wanted
more emphasis on recruiting male educators.
From the interviews and focus groups:
There are 120 countries represented in Yellowknife. Our services need to reflect this new reality.
Q: Who should operate child care?
Respondents offered a range of options including child care boards, multiservice agencies such as the Y,
Aboriginal Governments, schools and municipalities. Some felt schools already had enough responsibilities for
K–12. Others felt schools could act as a service hub for child care and family supports, providing additional
resources are made available. Participants noted that schools in Yellowknife have already stepped up to offer
child care through their preschool programs.
From the interviews and focus groups:
Schools would be my first choice with adequate resources and similar legislation and regulations to child
care.
School boards should do it but schools and staff are maxed out.
There should be incentives for schools and workplaces.
Schools already have large scale issues of what needs to be achieved between K–12. There are too many
existing pressures with enrolment rates, attendance problems, inclusion, behaviour.
May be too much time in one building for the children.
Programs can be located in the school but schools should not operate child care because they are
overwhelmed and teachers aren’t trained in ECD.
Schools would like to be more involved but space and cost are a challenge as is the low level of subsidy and
government bureaucracy.

Feasibility study of universal, affordable daycare in the Northwest Territories
106 APPENDIX A: FOCUS GROUP AND KEY INFORMANT RESPONSES
Q: Do the staff in the program follow a defined programming guide? For example: How do members of staff
plan the children’s day?
Most respondents drew on existing program frameworks including AHS, Montessori and modified versions of
the NWT Kindergarten Program. They saw benefits in a made-in-the NWT program developed by AHS, existing
practitioners and specialists in speech, occupational therapy and nutrition, guided by college faculty. A few
were concerned a curriculum would lead to child care becoming “too much like school.”
From the interviews and focus groups:
NWT uses a variety of curriculum frameworks. We should all work within program standards but with
individualized approaches.
NWT’s curriculum comes from Alberta. It needs to be developed in-house.
Q: Should parents pay fees? How much? How should fees be determined?
With few exceptions, respondents worried about the high cost of child care in the NWT and felt it posed a
hardship for parents and children. Most felt parents could pay a nominal fee based on a sliding scale. Parents
reported that many child care programs do not accept families on subsidy. There was considerable concern
about how intrusive the subsidy process was and how difficult it was for families to qualify for and retain a
child care subsidy. ecause subsidies don’t cover the actual cost of care, eligible families often cannot use
them. Some felt that AHS should be expanded so all children could have some child care at no cost. Others
noted the benefits of JK in providing a no fee preschool program for all children.
From the interviews and focus groups:
0–5 is the most important period of brain development. The philosopher in me says it should be free.
Parents should be given some responsibility. Perhaps $100–$150 a month, but don’t deny a child care if the
family can’t pay.
Parents should pay based on a sliding scale with a nominal fee. In a perfect world, ECE should be free.
Child care should be free. Even as a working parent it is still very expensive. I pay $1200 per month.
Our parents are able to pay. If they paid less they would just go on more vacations.
We don’t want the Québec model here. It would just create competition
The military is looking at ways to lower the cost of child care for its members. They are shocked, especially if
they are from Québec, by the cost of care.
There needs to be places reserved for low-income families so they don’t get pushed out.
Even if the government could subsidize 20 percent to 90 percent of the costs depending on the total
household income, that would help if universal childcare isn’t feasible.
In smaller communities there are no jobs; parents shouldn’t have pay.

Feasibility study of universal, affordable daycare in the Northwest Territories
107 APPENDIX A: FOCUS GROUP AND KEY INFORMANT RESPONSES
Q: Who should fund child care? Parents? Government? At what proportion? For example in the NWT parents
pay approximately 80 percent of the cost of care while public funding accounts for 20 percent. Is that a good
split? If not, what would you suggest?
Respondents generally felt more public funding is needed to support child care. A few home care providers felt
that more government funding leading to more child care availability would interfere with their business.
From the interviews and focus groups:
Let’s reverse that to the GNWT paying 75 percent and parents paying 25 percent.
Children are more expensive in the NWT. Government systems need to recognize this.
Both territorial and federal government funding needs to be collapsed. The money would be adequate if
there was a merger.
Any new funding added should be added to programs or paying for more training. We need to pay
attention to quality and need to pay attention to staff development.
Maybe we could aim for $20 per day rather than Québec model.
If the shift could was toward more public funding, like Québec, it would require liberal increases to
operating grants.
If government is going to give more funding to child care, it should also fund AHS and family resource
programs.
Q: How is the program planned and administered? For example, who does the planning, policy development,
quality assessment and other infrastructure supports?
Respondents focused their frustration with what they see as unneeded bureaucracy and lack of support from
DECE. They asked for more clarity around policy changes, more coherence between regions about what is and
is not acceptable. Suggestions included the need for a better communication strategy using social media and a
website updated regularly.
Other comments
Respondents often referenced Junior Kindergarten and its roll out. It was seen as controversial because school
budgets were not increased and because of its potential impact on Aboriginal Head Start programs and home
day care operations. This was primarily due to concerns related to loss of child enrolment and potential loss of
cultural learning as four year olds moved to the school system. However, the majority of respondents saw it as
generally positive move and hoped the discussion would refocus on the benefits of Junior Kindergarten for
children.
Teachers and school administrators were encouraged by the potential of Junior Kindergarten to boost school
readiness and improve EDI results. They reported the large number of children arriving without verbal skills and
unable to play with other children or to follow instructions or routines, and saw Junior Kindergarten playing a
beneficial role. They value child care and AHS, and Kindergarten teachers in particular remarked on the school
readiness benefits when children have group preschool experiences.

Feasibility study of universal, affordable daycare in the Northwest Territories
108 APPENDIX B: COVER LETTER AND CONSENT FORM
APPENDIX B: COVER LETTER AND CONSENT FORM
November 2014
Dear Participant:
The Government of the Northwest Territories passed a motion to review the feasibility of developing a
universal, affordable child day care system operated by qualified early childhood educators. The purpose of this
roundtable/interview is to offer input into study.
You are being asked to provide your perspective and your advice on how to move from current early years
service delivery to universal child day care, considering the opportunities and barriers.
As members of the Atkinson Centre at the University of Toronto, we are conducting interviews and focus group
discussions with key stakeholders in the early childhood community, the school sector, with educators and
family members.
The Government of the Northwest Territories has given permission for this project to take place subject to the
informed consent of all participants. We would like to request your participation in this study.
The name of the school, day care organization and participants who choose to participate will NOT be used in
this project in any way. All information collected during the interviews will be kept strictly confidential.
Your participation in this project is completely voluntary. If you have any questions about the project, please
feel free to contact me. Please read and sign the attached consent form.
Thank you kindly for your consideration.
Sincerely,
Kerry McCuaig, Fellow in Early Childhood Policy, Atkinson Centre, University of Toronto

Feasibility study of universal, affordable daycare in the Northwest Territories
109 APPENDIX B: COVER LETTER AND CONSENT FORM
Letter of Consent
Project Title: Feasibility Report of Universal, Affordable child day care in the Northwest Territories
Project Leaders:
Kerry McCuaig, Fellow in Early Childhood Policy, Atkinson Centre, University of Toronto
Zeenat Janmohamed, Visiting Scholar, Atkinson Centre, University of Toronto
Please take the time to read this and the information sheet carefully. Feel free to ask questions about
anything that is unclear before you sign.
I, , understand that this project is examining the feasibility of universal, affordable, child
day care in the Northwest Territories. The project will also analyse the impact of implementing the program on
existing services. Policy experts from the University of Toronto are carrying out the project.
I understand I will now take part in an interview/focus group that will last around 60 minutes. I know I do not
have to answer any questions I do not want to. I may skip questions that I feel uncomfortable with or stop the
interview at any time.
As part of the interview, I know I will be asked to discuss my organization and the community’s role in the
development of early learning services. I am assured that all information collected from me will be kept
confidential. Any results will be reported on a group level. I understand if I have questions about this form or
the project, I can contact the project lead, Kerry McCuaig, at [email protected] or (647) 2952808.
I agree to take part in this project.
Signature: Date:(DD/MM/YY)
Name: (PLEASE PRINT)

Feasibility study of universal, affordable daycare in the Northwest Territories
110 APPENDIX C: EXAMPLES OF SERVICE DELIVERY AND FUNDING MECHANISMS FROM QUÉBEC AND PRINCE EDWARD ISLAND
APPENDIX C: EXAMPLES OF SERVICE DELIVERY AND FUNDING MECHANISMS FROM
QUÉBEC AND PRINCE EDWARD ISLAND
Québec and Prince Edward Island provide examples of comprehensive service delivery each containing
elements informative for early childhood service reform in the NWT.
Québec:
Spending and access: Québec ’s low-cost child care services are the envy of parents across Canada. Québec invests heavily in its
services. In 2014 it spend $3.2-billion to deliver 251,000 spaces, meeting the needs of about two-thirds of
families seeking care. The 2011 and 2012 budgets committed to an additional 28,000 spaces.
How it works: Governance: The Ministère de la Famillie et des Aines (MFA) administers child care services for children 0-4
years. The Ministère de l’Education, du Loisir et du Sport directs school boards to provide school age care for
5–12 year olds and is now expanding 4-year-old Kindergarten.
Legislation: 30 Educational Childcare Act covers care for more than six children 0–4 years. Education Act, R.S.Q.,
chapter I–13, requires school boards to provide care for children from age 4 or 5 to 12 years where there is
sufficient parental demand.
Local service delivery: The MFA local offices license and inspect child care centres (every 5 years). The MFA
contracts with regional coordinating offices to issue and renew the permits of home child care providers and
monitor compliance.
Several organizations receive financial support from the government and represent the interest of centres and
educators. Operator associations are funded to consult with the ministry regarding funding, regulations and
service operations and levels. Québec’s child care workforce is largely unionized. Unions negotiate with
operator associations regarding working conditions. Staff are paid according to a provincial salary scale.
Operators:31 Publicly subsidized care for children 0–4 years consist of three types of child care: centre-based
operated by stand-alone non-profit agencies (Centres de la petite enfance - CPE); stand-alone for-profit centres
(garderies); and home day cares that are regulated and managed through regional non-profit or private
agencies. The maximum size of a centre is 80 children. A CPE may operate one centre plus 250 day care homes.
Québec does not permit private day care chains.
There are a small number of private centres that charge market rates, as well as unlicensed home care. Parents
without access to low cost child care are eligible for tax credits resulting in the same after tax advantage as
parents who receive low fee care. Parents whose children are enrolled in subsidized child care are not allowed
to claim the tax credit. There is no fee subsidy program in Québec. All parents pay the same flat fee regardless
of income.
30
Educational Childcare Act, R.S.Q., chapter S-4.1.1 Reduced Contribution Regulation, chapter S-4.1.1, r. 1 Educational Childcare Regulation, chapter S-4.1.1, r. 2 Education Act, R.S.Q., chapter I-13. 31
www.immigration-Québec.gouv.qc.ca/en/education/childcare-services.html

Feasibility study of universal, affordable daycare in the Northwest Territories
111 APPENDIX C: EXAMPLES OF SERVICE DELIVERY AND FUNDING MECHANISMS FROM QUÉBEC AND PRINCE EDWARD ISLAND
Seventeen school districts offer both 4- or 5-year-old Kindergarten (not mandatory) and school-age child care
for children 4 or 5 years to 12-years-old. Schools fund the facilities. Parent fees ($7/day) cover staffing and
supplies. Few schools operate programs over the summer months. Parents rely on summer camps.
Funding: Funded spaces receive annual subsidies of $10,500 per preschool space and $13,000 for infant spaces
with parents contributing $1,700 annually, or $7 a day, regardless of the age of the child. Home day cares are
compensated based on enrolment.32 Parent fees may be adjusted to a $15/day maximum as a result of a social
service review.
Staffing: Qualified Early Childhood Educators have a three-year diploma in early childhood development. At
least two-thirds of educators in child care centres must hold a diploma. Staff members are compensated
according to a provincial salary grid. As of April 2014, qualified educators earn $23.09/hour.33
There are no specified qualifications for staff in after-school programs. Family child care providers have up-to-
date first aid certification, a clear criminal reference check and 45 hours of training in child development and
administration. 34
Quality: Child:staff ratios are 1:5 for children up to 18 months, 1:8 for children 18 months to 4 years, 1:10 for 4
year olds and 1:20 for children ages 5–12 years. A home child care provider may care for a maximum of six
children including the provider’s own children under 9 years of age. If the person is assisted by another adult,
up to nine children, among whom not more than four may be under the age of 18 months, may be in care.35
32
Recurring funding
MFE provides funding through basic, supplementary and specific mechanisms.
Child care centre basic allowance
– Facility cost calculated per space
– Occupancy costs calculated per space with a supplement for children 17 months and younger
Funds are paid to the centres on a monthly basis.
With the exception of new or expanded facilities, a deduction is made from the grant if the annual occupancy rate falls below 85 percent in some parts of the province and 80 percent in others.
Family child care basic allowance
– An annualized occupancy rate per space
– A daily rate for children aged 59 months and younger, with a supplement for children 17 months and younger
With the exception of new or expanded family child care services, a deduction is made from the grant if the annual occupancy rate falls below 80 percent in some parts of the province and 75 percent in others.
Supplementary allowances
- Compensate for the fees of parents receiving income security whose children are entitled to 23 hours/week of child care at no fee
- One time funding for equipment and occupancy supplement for children with special needs
- Support the additional expenses of facilities in disadvantaged areas
- Support professional development of staff
Specific allowances
– For group insurance plans and maternity leaves – For special projects, such as northern or Aboriginal communities 33
www.mfa.gouv.qc.ca/fr/publication/Documents/SG_guide_administratif_classification.pdf. retrieved on 2014-03-11 34
www2.publicationsduQuébec .gouv.qc.ca/dynamicSearch/telecharge.php?type=3&file=/S411/S411R2A.HTM. Retrieved on 2014-03-11 35
An Act respecting childcare centres and childcare services, RSQ, c C-8.2, <http://canlii.ca/t/hcdr> retrieved on 2014-03-11. www.servicecanada.gc.ca/eng/qc/jobfutures/statistics/4214.shtml

Feasibility study of universal, affordable daycare in the Northwest Territories
112 APPENDIX C: EXAMPLES OF SERVICE DELIVERY AND FUNDING MECHANISMS FROM QUÉBEC AND PRINCE EDWARD ISLAND
All child care centres follow Meeting Child Care Needs: Updated, Québec’s program (curriculum) guide.36
Considerations Low fees created hyper demand in Québec’s child care system, leading to unintended consequences. Québec’s
original plan was to grow a system of community-based, non-profit programs. In 2003, public funding was
made available to for-profit providers who accepted lower subsidies but until 2010 were also allowed to
operate with lower standards. The government also relied heavily on home-based providers who are subject to
less stringent regulations and require only minimal training.
In an effort to keep pace with workforce demands, staff without qualifications were grandfathered or fast-
tracked to credentials. As wages increased, these workers were reluctant to leave, creating a drag on efforts to
improve quality.
The program relies heavily on agencies and workplaces to organize and apply for the public funding to develop
new spaces. Politically active parents know how to get funding for a child care centre and where to find centres
with open spots. Parents with limited means and connections are disadvantaged. Their communities are also
prey to for-profit operators who take advantage of subsidies to set up facilities in poorer neighbourhoods.
Evaluations consistently find lower quality in for-profit operations.37
A 2011 report from the Québec Auditor-General found the awards process for licensing new facilities was
vulnerable to political influence, with one-fifth of the permits going to operators who had not met minimum
standards.38
Subsidized child care has had a positive impact on the labour force attachment of mothers, resulting in an
increased tax base for the province, a drop in family poverty and a decrease in welfare use among single
parents. A study analyzing Québec’s longitudinal data for children and youth found positive developmental
outcomes for children attending non-profit child care centres (CPEs), but these represent only 18 percent of all
child care spaces. Similar results were not found for private centres (garderies) or home care, indicating
Québec is not achieving the full benefits of its sizeable child care investment.
Prince Edward Island
Instituted in 2010, PEI’s transformation of its child care services is newer than Québec’s and has not been
subjected to the same level of evaluation. Nevertheless, PEI may hold lessons for the NWT due to its the size
and similar starting point. Prior to the reforms, community and private child care operators were funded to
provide 5-year-old Kindergarten. In 2010, Kindergarten became a mandatory program delivered by schools.
The transition impacted the financial viability of child care. The PEI government responded with one-time
funding to buy out operator licences. Capital funding was also made available to convert available space in
schools for child care. A transition team was established with experts to help existing centres transition to the
new service model.
36
Meeting Early Childhood Needs, Updated. www.mfa.gouv.qc.ca/fr/publication/Documents/programmeeducatifen.pdf> retrieved on 2014-03-11. 37
Japel, C., Tremblay, R.E., & Côté, S. (2005). “Quality Counts! Assessing the Quality of Daycare Services Based on the Québec
Longitudinal Study of Child Development.” IRPP Choices, 11(5). Montreal: IRPP. 38
www.vgq.qc.ca/en/en_salle-de-presse/en_Presentations/en_Fichiers/en_Presentation20111130.pdf

Feasibility study of universal, affordable daycare in the Northwest Territories
113 APPENDIX C: EXAMPLES OF SERVICE DELIVERY AND FUNDING MECHANISMS FROM QUÉBEC AND PRINCE EDWARD ISLAND
Spending and access Spending of $14.7-million (2014) covers access for about 45 percent of 0–4 year olds.
How it works: Governance: The Department of Education and Early Childhood Development is responsible for child care
services for children ages 0–12 years. Programs operate under the Child Care Faculties Act (updated 2012).39
Local service delivery: The arms-length PEI Child Care Facilities Board40 licenses and ensures regulatory
compliance of child care/early childhood programs and certifies child care staff. The Early Child Development
section of the ministry is responsible for curriculum development and program funding. The Early Child
Development Association of PEI, a non-profit organization, is contracted by the province to provide staff
training and operate a child care registry allowing parents to search and register for available child care online.
Operations:41 Type I Licence: Early Childhood Centres serve a minimum of 40 children42 0–4 years including
infants and children with special needs. These license holders are required to have a parent advisory
committee, meet provincial regulations, follow the provincial curriculum, maintain legislated levels of certified
staff, adhere to a province-wide parent fee and wage grid for staff and make their financial records public.43
Type II Licence: Day care Centres and Home, School Age Child Care Centre
Private child care centres and day homes operated by commercial or non-profit agents and Individuals must
meet regulatory requirements but set their own parent fees and staff wages and follow their own curriculum.
Funding to Early Childhood Centres is based on the total wages and benefits for all program staff according to
the provincial wage scale, divided by .78, less 90 percent of parent fee revenue, according to the provincial fee
schedule.
Parent fees are capped at $32/day for infants, $26/day for toddlers and $25/day for preschoolers.
Staffing: A 90-hour entry level Certification Program is the minimum requirement for staff in Early Childhood
Centres and Infant Homes. Two thirds of staff must have a Level 1 (one-year certificate) or Level 2 (two-year
diploma). Directors have Level 3 (post-diploma credential in ECE Administration). Staff are paid according to a
province-wide fee scale. An ECE with a two-year diploma earns $16.88/hour.
Quality: The staff:child ratio for infants (0–2 years) is 1:3 with a maximum group size of six; for preschool (2–3
years) the ratio is 1:5; for –5 year olds the ratio is 1:10; and for school-age children (5– 6 years) the ratio is 1:12.
A home child care provider may care a maximum of six children, including the provider’s own children under 10
years of age.
All Early Childhood Centres must follow the Early Learning Framework/Curriculum.
39
http://www.gov.pe.ca/law/statutes/pdf/c-05.pdf 40
Composed of 7 persons chosen from government, the ECEC sector and public. 41
http://www.gov.pe.ca/eecd/index.php3?number=1027705 42
Enrolment exceptions may be modified for rural areas 43
www.gov.pe.ca/photos/original/edu_ExcellIniti.pdf

Feasibility study of universal, affordable daycare in the Northwest Territories
114 APPENDIX C: EXAMPLES OF SERVICE DELIVERY AND FUNDING MECHANISMS FROM QUÉBEC AND PRINCE EDWARD ISLAND
Considerations:
PEI’s move to the planned management of child care services won broad approval. The government was seen
to address the concerns of child care operators who lost revenue when Kindergarten moved into schools.
Parents were won over by the promise of increased service quality and stable fees. Operators appreciated the
funding predictability and staff welcomed the employment stability and the greater emphasis on
professionalism. The first year evaluation44 found high levels of satisfaction continued through the first year of
implementation.
While most parents are paying less than before the provincial fee cap, costs still present a barrier to many
families. The evaluation recommends more generous fee subsidy criteria. Set at current levels, the fee cap has
allowed the province to manage expectations and costs.
PEI’s planned management of child care services has avoided many of the equity issues that have plagued
Québec’s model. Service levels reflect the population distribution on the island, showing advantages for rural,
remote and Aboriginal communities over urban areas.
The transition team composed of government and community members played a dual role in championing the
new service model and supporting programs to adopt the model. It played a pivotal role in allying concerns
about the government’s new directions.
The funding formula developed for the early childhood centres is very innovative. Based on staffing costs, it
provides stability during periods of fluctuating enrolment. By allowing centres to benefit from a portion of
parent fees, it encourages programs to operate near capacity.
PEI’s original plan was to develop more home day care to meet the demand for infant care. This element of the
initiative was not successful. There was little interest on the part of providers to exclusively offer infant care.
44
http://www.mwmccain.ca/media/cms_page_media/136/PEI's Preschool Excellence Initiative-1st Year Implementation Rpt.pdf