flood forecasting and warning network performance appraisal
TRANSCRIPT
GOVERNMENT OF INDIA CENTRAL WATER COMMISSION
FLOOD FORECAST MONITORING DIRECTORATE
Submerged National Highway near Fatuha Patna district Bihar
August 2016
FLOOD FORECASTING AND WARNING
NETWORK PERFORMANCE APPRAISAL REPORT 2016
NEW DELHI – 110066 April 2018
i
Member (RM) Central Water Commission Sewa Bhawan, R. K. Puram
New Delhi-110066
PREFACE
Central Water Commission had started Flood Forecasting & Warning service in India in November 1958 by setting one forecasting station at Old Delhi Bridge, for the national capital, on the river Yamuna. Today, its network of Flood Forecasting and Warning Stations gradually extended covering almost all the major inter-state flood prone river basins throughout the country. Under the XII Plan Scheme “Flood Forecasting” the flood forecasting services of CWC were to be expanded to 100 new stations taking the total to 275 flood forecast stations. As the SFC memo for the scheme was approved in December 2015, during 2016, the flood forecasting services were expanded to 24 out of the 100 identified sites. With this expansion, the flood forecasting network of CWC comprised of 199 Flood Forecasting Stations including 48 inflow forecast in 19 major river basins. It covered 20 states besides NCT Delhi and UT of Dadra & Nagar Haveli. The flood forecasting activities of the Commission are being performed every year from May to December through its 24 field divisions which issue flood forecasts and warnings to the civil authorities of the states as well as to other organizations of the central & state governments, as and when the river water level touches or is expected to cross the warning level at the flood forecasting stations. Inflow Forecasts are issued for 48 reservoir/dam/barrages. The forecasts are formulated whenever the inflow into the dam exceeds the threshold value fixed by the respective project authorities for reservoir regulation as well as flood moderation. The flood season 2016 witnessed unprecedented flood events at 4 stations on the river Ganga in the country. High Flood Situation was witnessed at 21 stations on Rivers Brahmaputra, Jia-Bharali, Kopili, Beki and Sankosh in Assam; River Ganga in Uttar Pradesh and Bihar and its tributaries Sone, Burhi Gandak, Kosi and Mahananda in Bihar and River Rapti in Uttar Pradesh. The year witnessed moderate to low intensity floods in many other parts of India. The highlight was the floods in Ganga and its south bank tributaries including Yamuna, Sone during August 2016. There was one High Flood event in river Desang during April 2016.
During the year 2016, 6239 forecasts were issued out of which 5948 forecasts (97.8%) were found to be within the limits of accuracy. The number of level forecasts issued during the year 2016 were 4969 out of which 4891 (98.43%) was within the limit of accuracy of ± 0.15 m. The number of inflow forecasts issued was 1270 out of which 1057 (83.23%) were within limits of accuracy of ±20%.
ii
The expansion of flood forecasting activity was done using the rainfall runoff model by developing MIKE 11 model using the daily rainfall received through India Meteorological Department (IMD) and 3-day Quantitative Precipitation Forecasts received from various Flood Meteorological Offices (FMO) of IMD. CWC wishes to place its acknowledgements for the services provided by IMD through its various FMOs.
The level of performance achieved, has been possible as a result of the dedicated team work of the officers and staff manning the various activities of hydrometeorological observations & flood forecasting and monitoring the flood forecasting activities of the field offices.
Flood Forecast Monitoring (FFM) Directorate plays an important role in
compiling the information received from various field offices at Headquarters and issues daily bulletins which are sent to various offices of the MOWR, MHA, Railway Board, Transport Ministry and Ministry of Agriculture. I wish to place on record my deep appreciations of the efforts put in by the officers and staff of FFM Directorate in carrying out the work with utmost devotion & dedication in bringing out this report. The staff of this Directorate, along with other supporting staff from other Directorates during flood duties in the flood season of 2016 also deserves all appreciation in keeping the control room fully functional on all the week days, including holidays, Saturdays & Sundays. The control room was kept operational round the clock throughout the flood season.
It is hoped that the momentum gained in expanding the flood forecasting
network, improving performance modernization as well as computerization, year after year, will be further accelerated to achieve greater effectiveness of each and every forecast especially in high and unprecedented flood situations with the help of mathematical modelling supported by real-time data from telemetry.
Suggestions/comments of the Users of this report with a view to further
enhance its usefulness are welcomed and will be incorporated in the next edition.
New Delhi (Pradeep Kumar) April, 2018 Member (RM)
iii
CONTENTS
EXECUTIVE SUMMARY
0.1 General 1
0.2 Flood Situation 1
0.3 Flood Forecasting Performance 2
Salient features of Flood Forecasting System 3
CHAPTER- 1 NATIONAL FLOOD FORECASTING NETWORK 4 1.1 Flood forecasting services 4 1.2 Flood forecasting network in the country 4 1.3 Classifications of various flood situations 6 1.4 Standard Operating Procedure for Flood Forecasting &
Warning 7
1.5 Inflow Forecast 8 1.6 Expansion of the network of flood forecasting sites 8 1.7 1.7a 1.7b
Data Communication System Wireless Communication Telemetry
9 9 9
1.8 Damage due to floods/ heavy rains between 1953 to 2016 10 1.9 Analysis of Performance of Flood Forecasting Network 11 1.10 Organisational set-up of Flood Forecasting Network 11
CHAPTER-2 ROLE OF IMD IN FF ACTIVITIES AND SOUTHWEST MONSOON ACTIVITIES
17
2.1 2.1.a 2.1.b
Role of IMD & SOUTHWEST MONSOON Role of IMD Southwest Monsoon
17 17 18
2.2 Highlights of south-west monsoon 2016 19
2.3 Onset of south-west monsoon 2016 20
2.4 Chief Synoptic features 22
2.5 2.6
Withdrawal of Southwest Monsoon North East Monsoon
25 27
CHAPTER -3 FLOOD FORECAST PERFORMANCE 29
3.1 Flood forecasting evaluation - Present criteria and procedure
29
3.2 Evaluation Criteria for stage/ inflow forecasting 29
3.3 Flood forecasting activities 29
3.4 Riverwise Details Of Flood Forecasting Activities & Accuracy Of Forecast
29
3.4.1 Indus Basin 29
3.4.2 Brahmaputra Basin 30
3.4.3 Barak and other Basin 30
3.4.4 Ganga Basin 30
3.4.5 Godavari Basin 30
3.4.6 Krishna Basin 30
3.4.7 Cauvery Basin 30
3.4.8 Subarnarekha including Burhabalang Basin 31
3.4.9 Brahmani & Baitarni Basin 31
3.4.10 Mahanadi Basin 31
3.4.11 East Flowing Rivers between Mahanadi and Pennar Basins 31
iv
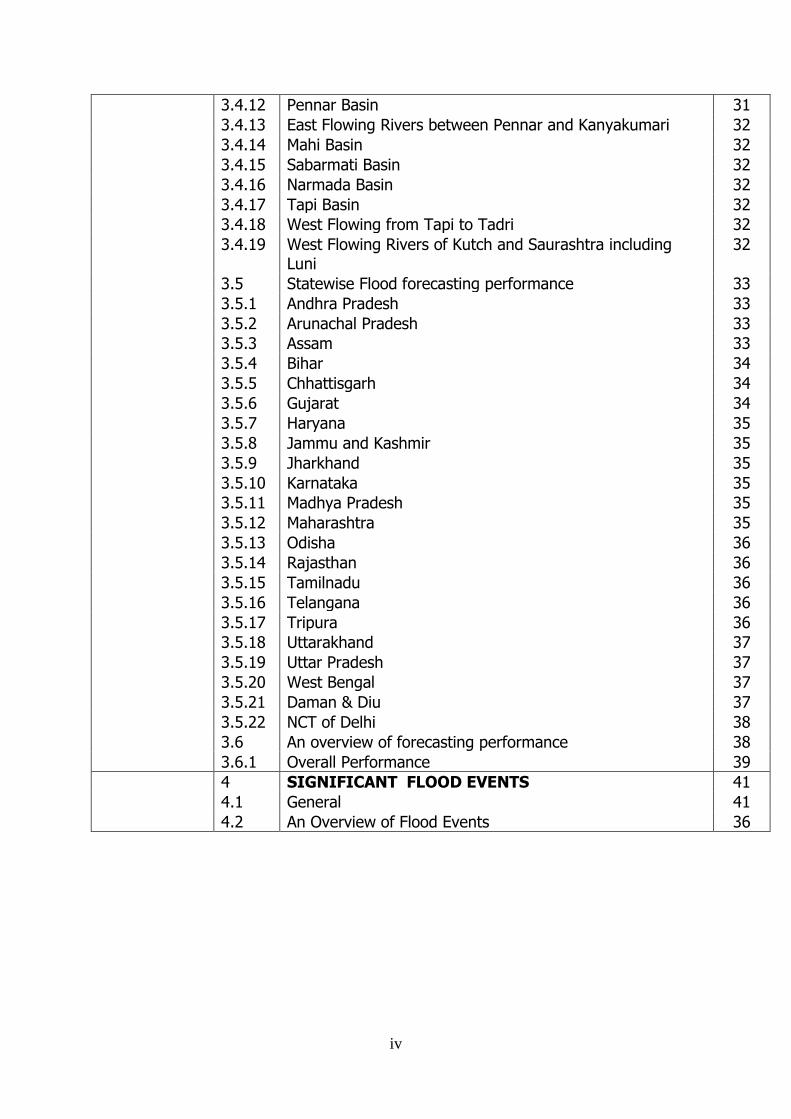
3.4.12 Pennar Basin 31
3.4.13 East Flowing Rivers between Pennar and Kanyakumari 32
3.4.14 Mahi Basin 32
3.4.15 Sabarmati Basin 32
3.4.16 Narmada Basin 32
3.4.17 Tapi Basin 32
3.4.18 West Flowing from Tapi to Tadri 32
3.4.19 West Flowing Rivers of Kutch and Saurashtra including Luni
32
3.5 Statewise Flood forecasting performance 33
3.5.1 Andhra Pradesh 33
3.5.2 Arunachal Pradesh 33
3.5.3 Assam 33
3.5.4 Bihar 34
3.5.5 Chhattisgarh 34
3.5.6 Gujarat 34
3.5.7 Haryana 35
3.5.8 Jammu and Kashmir 35
3.5.9 Jharkhand 35
3.5.10 Karnataka 35
3.5.11 Madhya Pradesh 35
3.5.12 Maharashtra 35
3.5.13 Odisha 36
3.5.14 Rajasthan 36
3.5.15 Tamilnadu 36
3.5.16 Telangana 36
3.5.17 Tripura 36
3.5.18 Uttarakhand 37
3.5.19 Uttar Pradesh 37
3.5.20 West Bengal 37
3.5.21 Daman & Diu 37
3.5.22 NCT of Delhi 38
3.6 An overview of forecasting performance 38
3.6.1 Overall Performance 39
4 SIGNIFICANT FLOOD EVENTS 41
4.1 General 41
4.2 An Overview of Flood Events 36
v
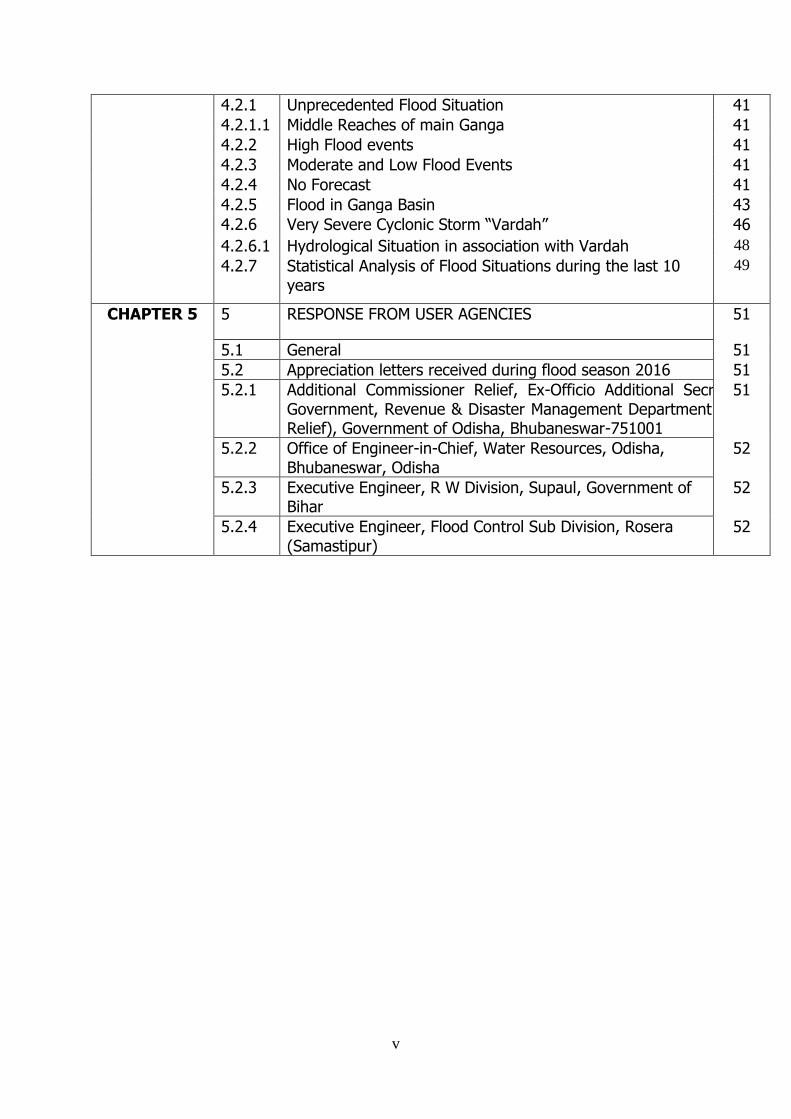
4.2.1 Unprecedented Flood Situation 41
4.2.1.1 Middle Reaches of main Ganga 41
4.2.2 High Flood events 41
4.2.3 Moderate and Low Flood Events 41
4.2.4 No Forecast 41
4.2.5 Flood in Ganga Basin 43
4.2.6 Very Severe Cyclonic Storm “Vardah” 46
4.2.6.1 Hydrological Situation in association with Vardah 48
4.2.7 Statistical Analysis of Flood Situations during the last 10 years
49
CHAPTER 5 5 RESPONSE FROM USER AGENCIES 51
5.1 General 51
5.2 Appreciation letters received during flood season 2016 51
5.2.1 Additional Commissioner Relief, Ex-Officio Additional Secretary to Government, Revenue & Disaster Management Department (Special Relief), Government of Odisha, Bhubaneswar-751001
51
5.2.2 Office of Engineer-in-Chief, Water Resources, Odisha, Bhubaneswar, Odisha
52
5.2.3 Executive Engineer, R W Division, Supaul, Government of Bihar
52
5.2.4 Executive Engineer, Flood Control Sub Division, Rosera (Samastipur)
52
vi
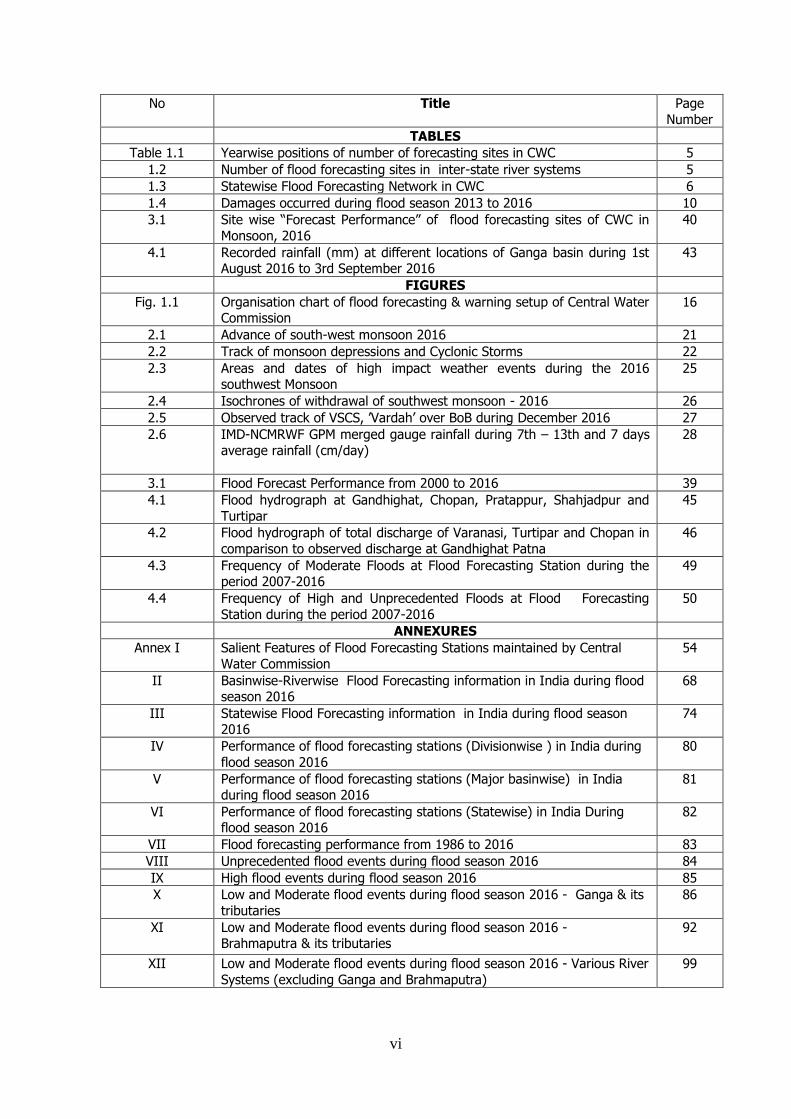
No Title Page
Number
TABLES
Table 1.1 Yearwise positions of number of forecasting sites in CWC 5
1.2 Number of flood forecasting sites in inter-state river systems 5
1.3 Statewise Flood Forecasting Network in CWC 6
1.4 Damages occurred during flood season 2013 to 2016 10
3.1 Site wise “Forecast Performance” of flood forecasting sites of CWC in
Monsoon, 2016
40
4.1 Recorded rainfall (mm) at different locations of Ganga basin during 1st August 2016 to 3rd September 2016
43
FIGURES
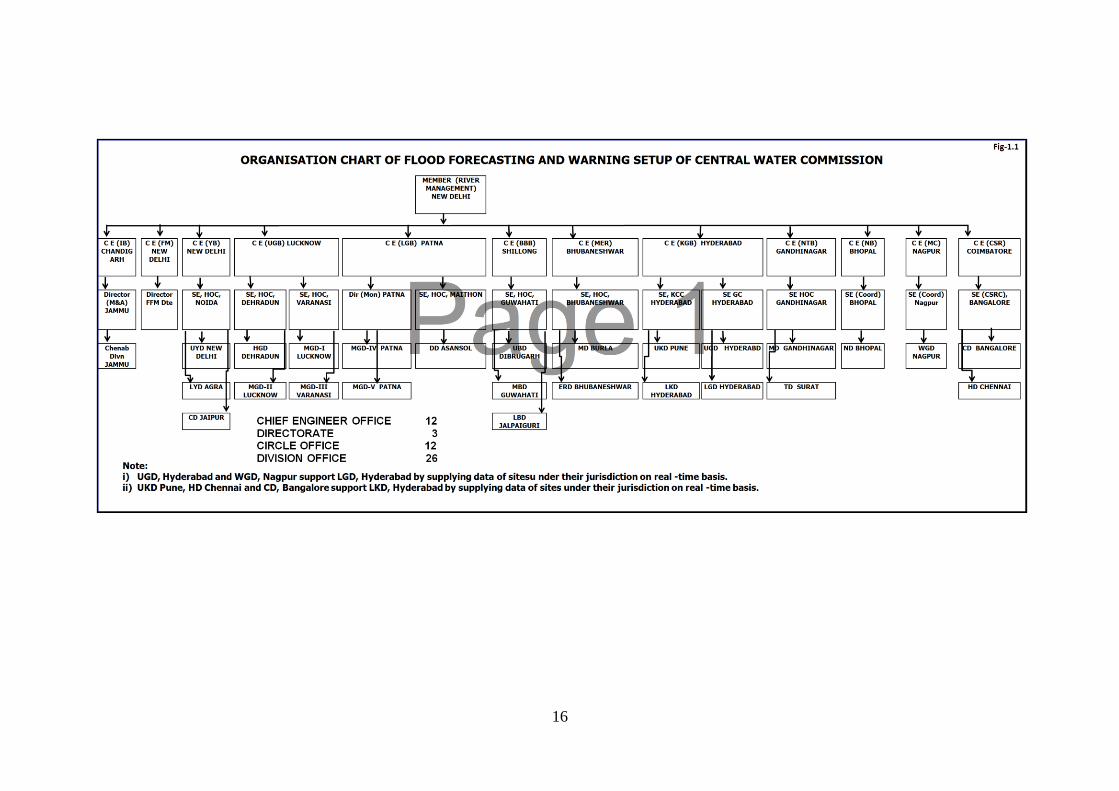
Fig. 1.1 Organisation chart of flood forecasting & warning setup of Central Water Commission
16
2.1 Advance of south-west monsoon 2016 21
2.2 Track of monsoon depressions and Cyclonic Storms 22
2.3 Areas and dates of high impact weather events during the 2016 southwest Monsoon
25
2.4 Isochrones of withdrawal of southwest monsoon - 2016 26
2.5 Observed track of VSCS, ’Vardah’ over BoB during December 2016 27
2.6 IMD-NCMRWF GPM merged gauge rainfall during 7th – 13th and 7 days
average rainfall (cm/day)
28
3.1 Flood Forecast Performance from 2000 to 2016 39
4.1 Flood hydrograph at Gandhighat, Chopan, Pratappur, Shahjadpur and
Turtipar
45
4.2 Flood hydrograph of total discharge of Varanasi, Turtipar and Chopan in
comparison to observed discharge at Gandhighat Patna
46
4.3 Frequency of Moderate Floods at Flood Forecasting Station during the period 2007-2016
49
4.4 Frequency of High and Unprecedented Floods at Flood Forecasting
Station during the period 2007-2016
50
ANNEXURES
Annex I Salient Features of Flood Forecasting Stations maintained by Central
Water Commission
54
II Basinwise-Riverwise Flood Forecasting information in India during flood season 2016
68
III Statewise Flood Forecasting information in India during flood season 2016
74
IV Performance of flood forecasting stations (Divisionwise ) in India during
flood season 2016
80
V Performance of flood forecasting stations (Major basinwise) in India during flood season 2016
81
VI Performance of flood forecasting stations (Statewise) in India During flood season 2016
82
VII Flood forecasting performance from 1986 to 2016 83
VIII Unprecedented flood events during flood season 2016 84
IX High flood events during flood season 2016 85
X Low and Moderate flood events during flood season 2016 - Ganga & its
tributaries
86
XI Low and Moderate flood events during flood season 2016 - Brahmaputra & its tributaries
92
XII Low and Moderate flood events during flood season 2016 - Various River
Systems (excluding Ganga and Brahmaputra)
99
vii
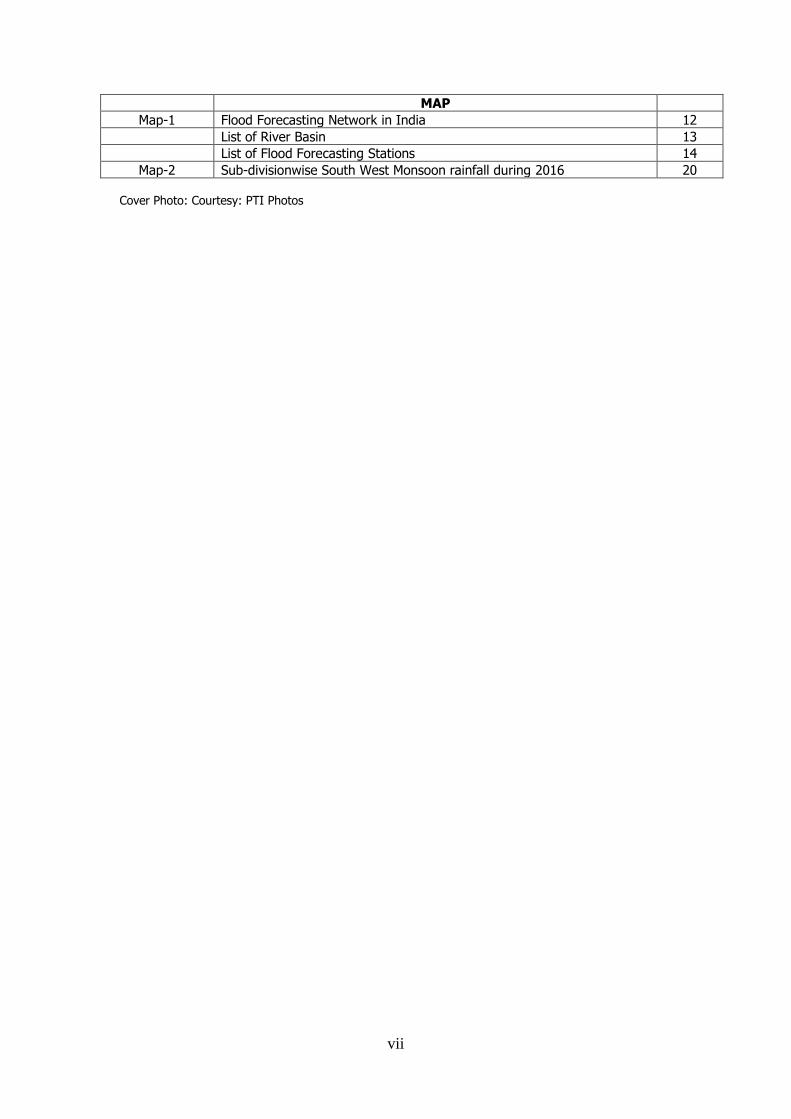
MAP
Map-1 Flood Forecasting Network in India 12
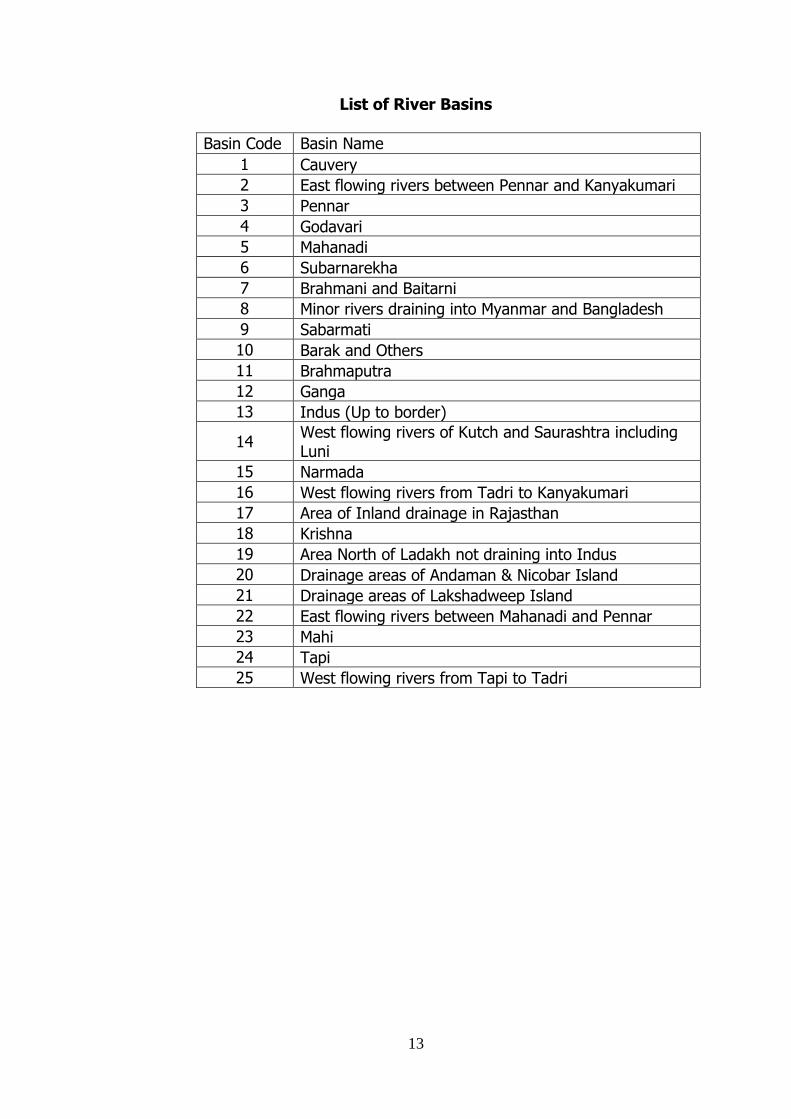
List of River Basin 13
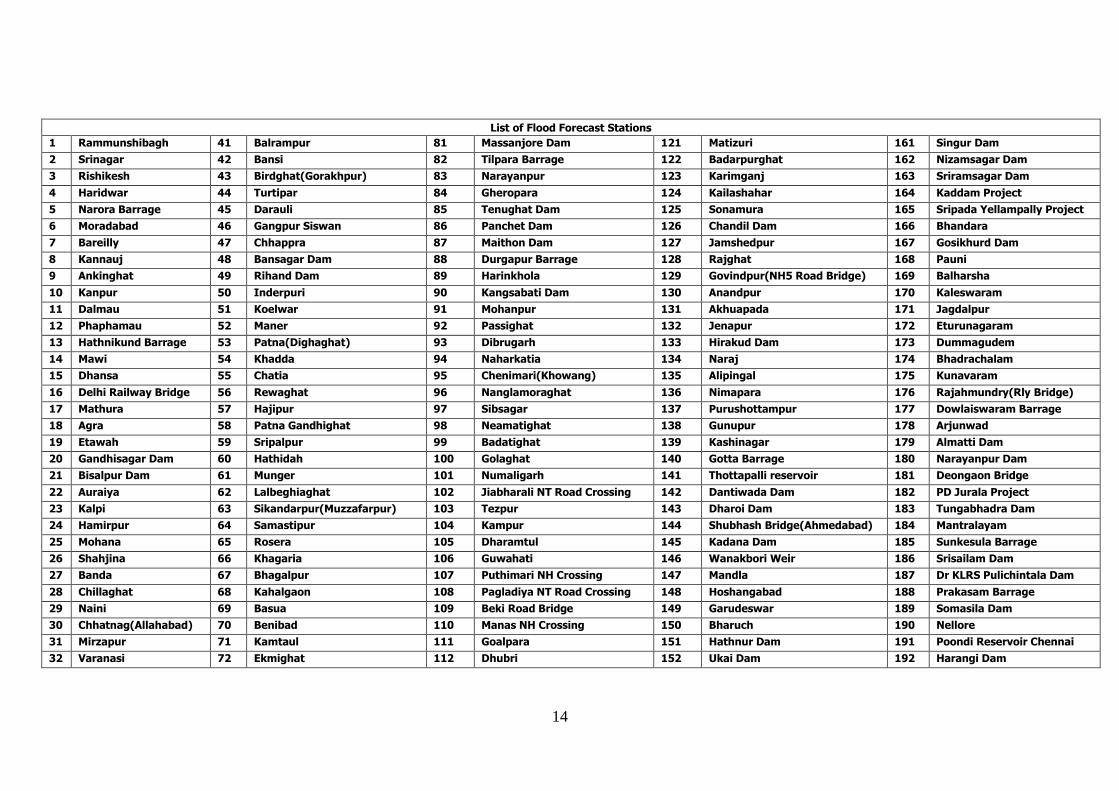
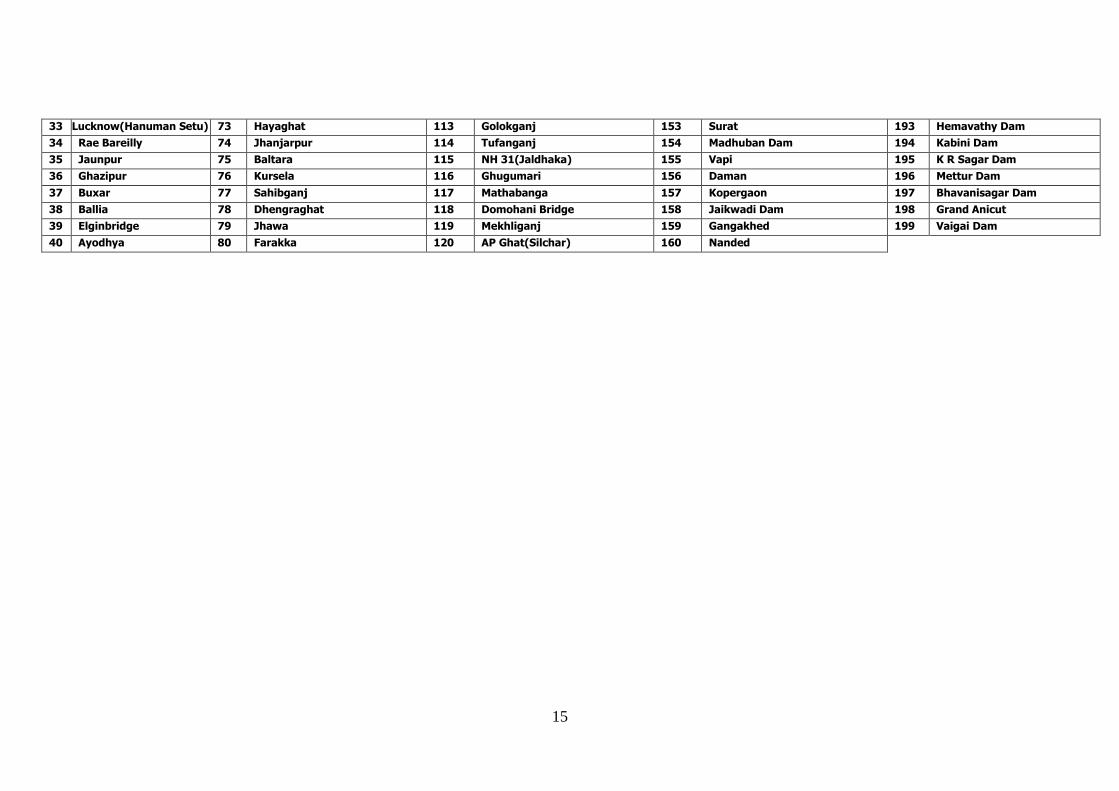
List of Flood Forecasting Stations 14
Map-2 Sub-divisionwise South West Monsoon rainfall during 2016 20 Cover Photo: Courtesy: PTI Photos
1
EXECUTIVE SUMMARY 0.1 Meteorological Situation During 2016, the south west monsoon performance was as given below:
0.2 Flood Situation During the year 2016, 4 Flood Forecast station namely Ballia in Ballia district
of Uttar Pradesh, Patna Gandhighat and Hathidah in Patna district and Bhagalpur in Bhagalpur district all in Bihar flowed in Unprecedented flood situation during the period 20th to 29th August 2016. High Floods were witnessed in 17 Flood Forecasting Stations namely., River Brahmaputra at Dibrugarh, Neamatighat, Tezpur, Goalpara and Dhubri, river Jia-Bharali at N T Road Crossing, river Kopili at Kampur, river Beki at Road Bridge, river Sankosh at Golokganj in Assam. River
The rainfall during monsoon season (June-September) over the country as a whole was 97% of its long period average (LPA).
Seasonal rainfalls over Northwest India, Central India, South Peninsula and Northeast India were 95%, 106%, 92% and 89% of respective LPA.
Out of the total 36 meteorological subdivisions, 23 sub-divisions constituting 72% of the total area of the country received normal rainfall and 4 sub-divisions received excess rainfall (13% of the total area) during the season. However, 9 sub-divisions constituting 15% of the total area of the country received deficient seasonal rainfall.
Monthly rainfall over the country as a whole was 89% of LPA in June, 107% of LPA in July, 91% of LPA in August and 97% of LPA in September.
Southwest monsoon advanced into south Andaman Sea and Nicobar Islands on 18th May (2 days ahead of its normal date). However, further advance was sluggish. It set in over Kerala on 8th June (7 days behind the normal schedule of 1st June) and covered the entire country by 13th July (against the normal date of 15th July).
Monsoon withdrawal commenced from West Rajasthan on 15th September with a delay of 2 weeks. It withdrew from the entire country on 26th October, 2016.
Movement of Depression and Low Pressures over East and Central India during July and August gave rise to very heavy rainfall in Jharkhand, Madhya Pradesh, Uttar Pradesh and Rajasthan.
During the North East Monsoon even though rainfall was deficient in South Peninsular India, Very Severe Cyclonic Storm “Vardah” crossed North Tamilnadu Coast near Chennai on 12th December
2
Ganga at Patna-Dighaghat and Kahalgaon, river Sone at Maner, river Mahananda at Jhawa, river Burhi Gandak at Khagaria and river Kosi at Kursela in Bihar also flowed in High Flood Situation. River Rapti at Balrampur and River Ganga at Ghazipur in Uttar Pradesh also flowed in High Flood Situation. River Desang at Nanglamoraghat in Assam flowed in High Flood Situation during April 2017 which is considered beyond the normal flood season which normally starts on 1st May every year in association with heavy to very heavy rainfall over its catchment areas. Moderate flood situation was witnessed in 55 Flood Forecasting Stations and 32 Flood forecast stations witnessed Low Flood Situation. No floods were witnessed in 42 flood forecasting stations. Out of the 48 reservoirs in the network, inflow forecasts were issued at 40 reservoirs and in 8 reservoirs the inflows did not exceed the criteria for issuing inflow forecasts. The highlight of this year flood was the Unprecedented Floods in Ganga in the reach from Ballia to Bhagalpur was in association with the movement of depression over Jharkhand, Madhya Pradesh and Uttar Pradesh during the period 18th to 27th August. 0.3 Flood Forecasting Performance
During the year 2016, 6239 forecasts were issued out of which 5948 forecasts (95.34%) were found to be within the limits of accuracy. The number of level forecasts issued during the year 2016 were 4969 out of which 4891 (98.43%) was within the limit of accuracy of ± 0.15 m. The number of inflow forecasts issued was 1270 out of which 1057 (83.23%) were within limits of accuracy of ±20%. During the unprecedented floods, CWC issued 3 to 5 advanced flood advisories for taking up relief and rescue operations in advance at flood affected areas which were well appreciated by the beneficiaries at Both National and State Levels.
3
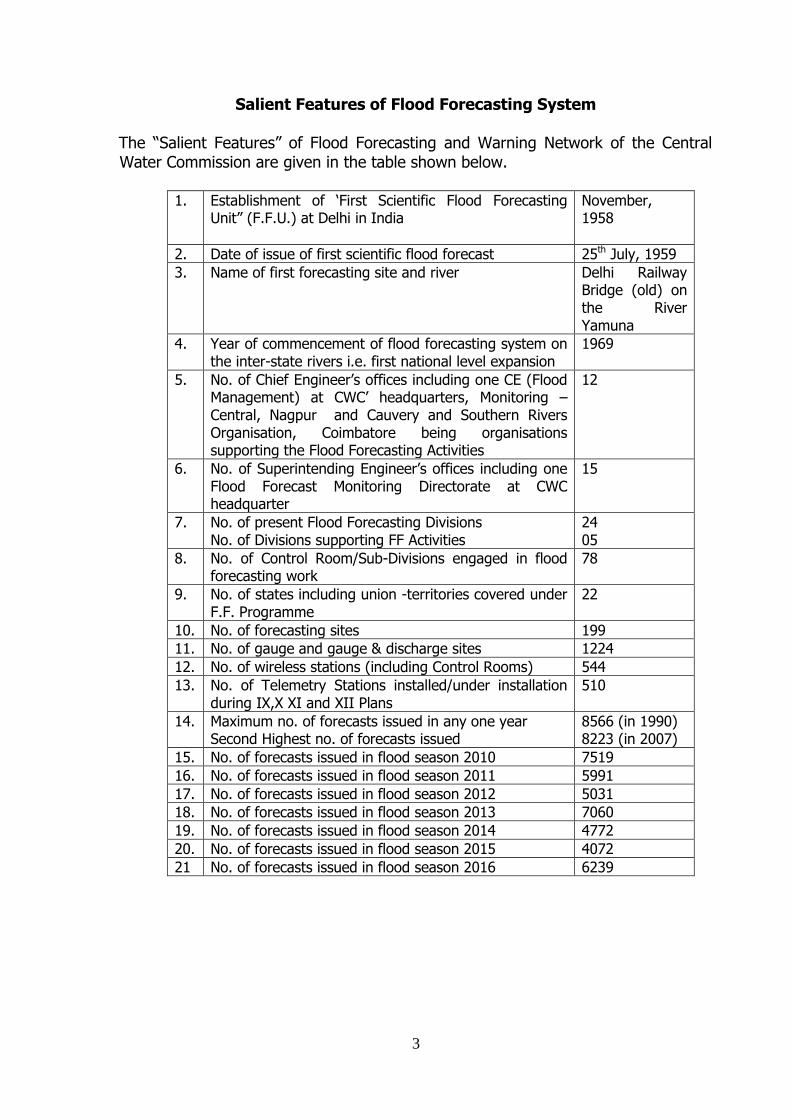
Salient Features of Flood Forecasting System The “Salient Features” of Flood Forecasting and Warning Network of the Central Water Commission are given in the table shown below.
1. Establishment of „First Scientific Flood Forecasting
Unit” (F.F.U.) at Delhi in India November, 1958
2. Date of issue of first scientific flood forecast 25th July, 1959
3. Name of first forecasting site and river Delhi Railway Bridge (old) on the River Yamuna
4. Year of commencement of flood forecasting system on the inter-state rivers i.e. first national level expansion
1969
5. No. of Chief Engineer‟s offices including one CE (Flood Management) at CWC‟ headquarters, Monitoring – Central, Nagpur and Cauvery and Southern Rivers Organisation, Coimbatore being organisations supporting the Flood Forecasting Activities
12
6. No. of Superintending Engineer‟s offices including one Flood Forecast Monitoring Directorate at CWC headquarter
15
7. No. of present Flood Forecasting Divisions No. of Divisions supporting FF Activities
24 05
8. No. of Control Room/Sub-Divisions engaged in flood forecasting work
78
9. No. of states including union -territories covered under F.F. Programme
22
10. No. of forecasting sites 199
11. No. of gauge and gauge & discharge sites 1224
12. No. of wireless stations (including Control Rooms) 544
13. No. of Telemetry Stations installed/under installation during IX,X XI and XII Plans
510
14. Maximum no. of forecasts issued in any one year Second Highest no. of forecasts issued
8566 (in 1990) 8223 (in 2007)
15. No. of forecasts issued in flood season 2010 7519
16. No. of forecasts issued in flood season 2011 5991
17. No. of forecasts issued in flood season 2012 5031
18. No. of forecasts issued in flood season 2013 7060
19. No. of forecasts issued in flood season 2014 4772
20. No. of forecasts issued in flood season 2015 4072
21 No. of forecasts issued in flood season 2016 6239
4
CHAPTER-1
NATIONAL FLOOD FORECASTING NETWORK
1.1 FLOOD FORECASTING SERVICES
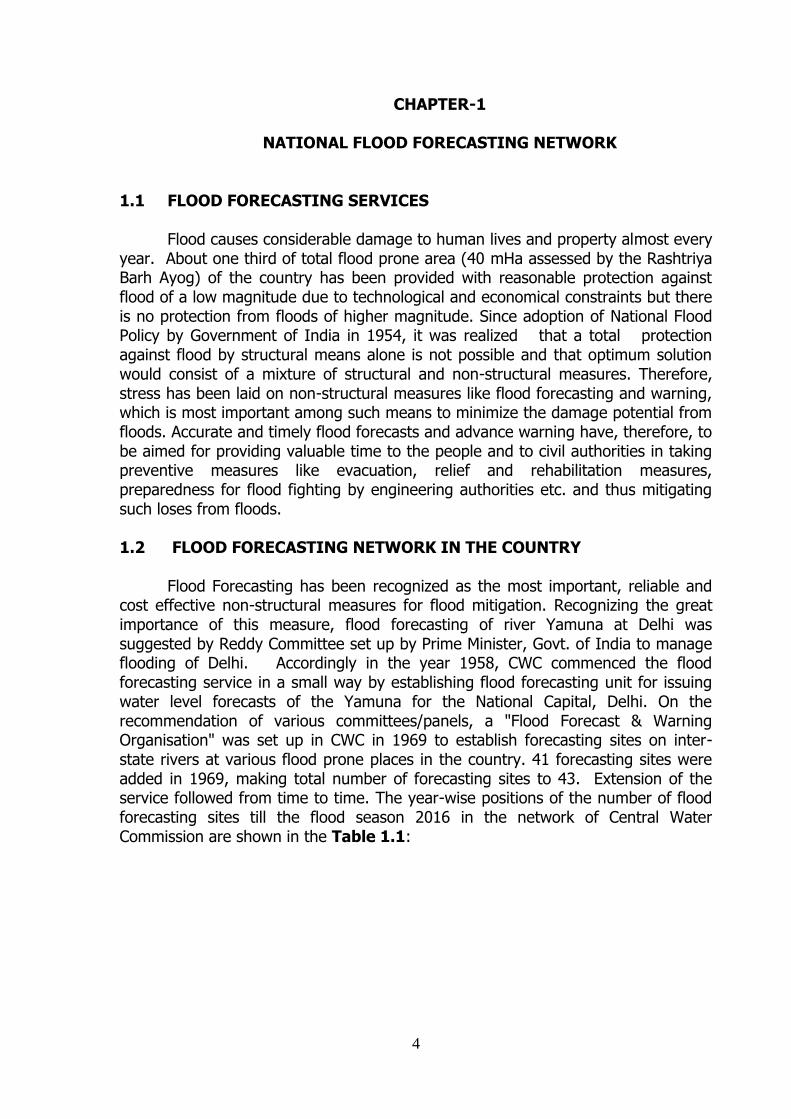
Flood causes considerable damage to human lives and property almost every year. About one third of total flood prone area (40 mHa assessed by the Rashtriya Barh Ayog) of the country has been provided with reasonable protection against flood of a low magnitude due to technological and economical constraints but there is no protection from floods of higher magnitude. Since adoption of National Flood Policy by Government of India in 1954, it was realized that a total protection against flood by structural means alone is not possible and that optimum solution would consist of a mixture of structural and non-structural measures. Therefore, stress has been laid on non-structural measures like flood forecasting and warning, which is most important among such means to minimize the damage potential from floods. Accurate and timely flood forecasts and advance warning have, therefore, to be aimed for providing valuable time to the people and to civil authorities in taking preventive measures like evacuation, relief and rehabilitation measures, preparedness for flood fighting by engineering authorities etc. and thus mitigating such loses from floods.
1.2 FLOOD FORECASTING NETWORK IN THE COUNTRY
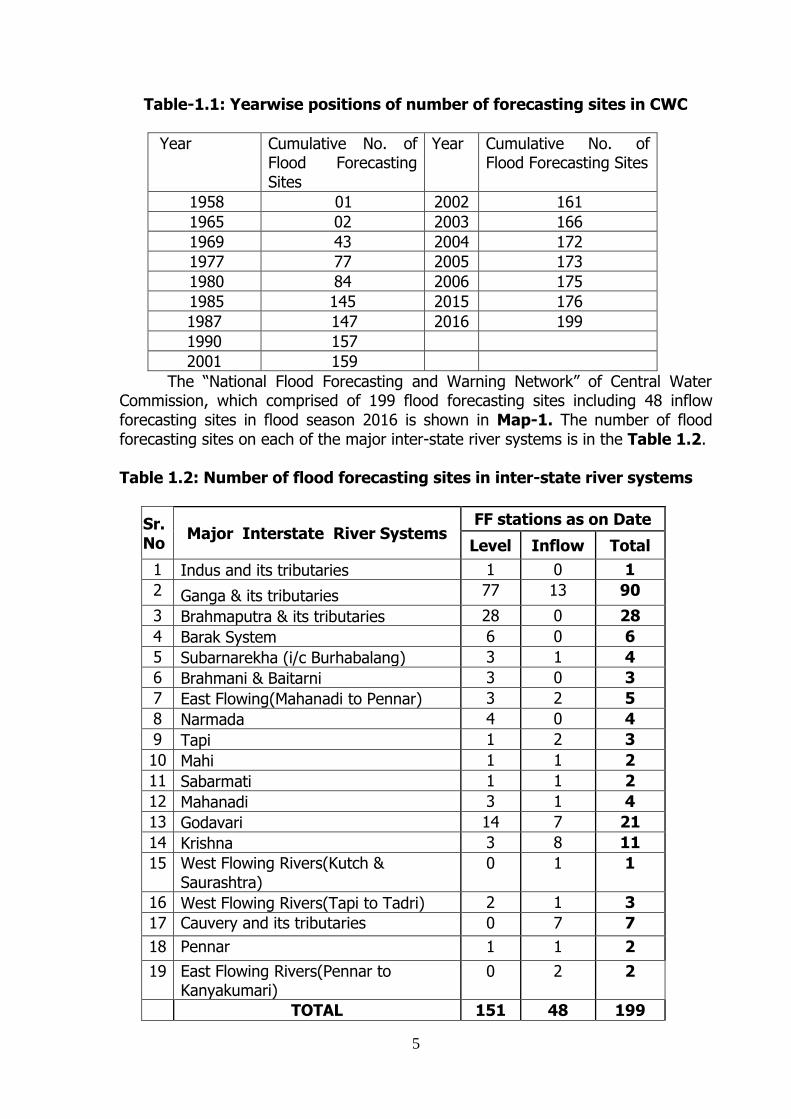
Flood Forecasting has been recognized as the most important, reliable and cost effective non-structural measures for flood mitigation. Recognizing the great importance of this measure, flood forecasting of river Yamuna at Delhi was suggested by Reddy Committee set up by Prime Minister, Govt. of India to manage flooding of Delhi. Accordingly in the year 1958, CWC commenced the flood forecasting service in a small way by establishing flood forecasting unit for issuing water level forecasts of the Yamuna for the National Capital, Delhi. On the recommendation of various committees/panels, a "Flood Forecast & Warning Organisation" was set up in CWC in 1969 to establish forecasting sites on inter-state rivers at various flood prone places in the country. 41 forecasting sites were added in 1969, making total number of forecasting sites to 43. Extension of the service followed from time to time. The year-wise positions of the number of flood forecasting sites till the flood season 2016 in the network of Central Water Commission are shown in the Table 1.1:
5
Table-1.1: Yearwise positions of number of forecasting sites in CWC
Year Cumulative No. of Flood Forecasting Sites
Year Cumulative No. of Flood Forecasting Sites
1958 01 2002 161
1965 02 2003 166
1969 43 2004 172
1977 77 2005 173
1980 84 2006 175
1985 145 2015 176
1987 147 2016 199
1990 157
2001 159
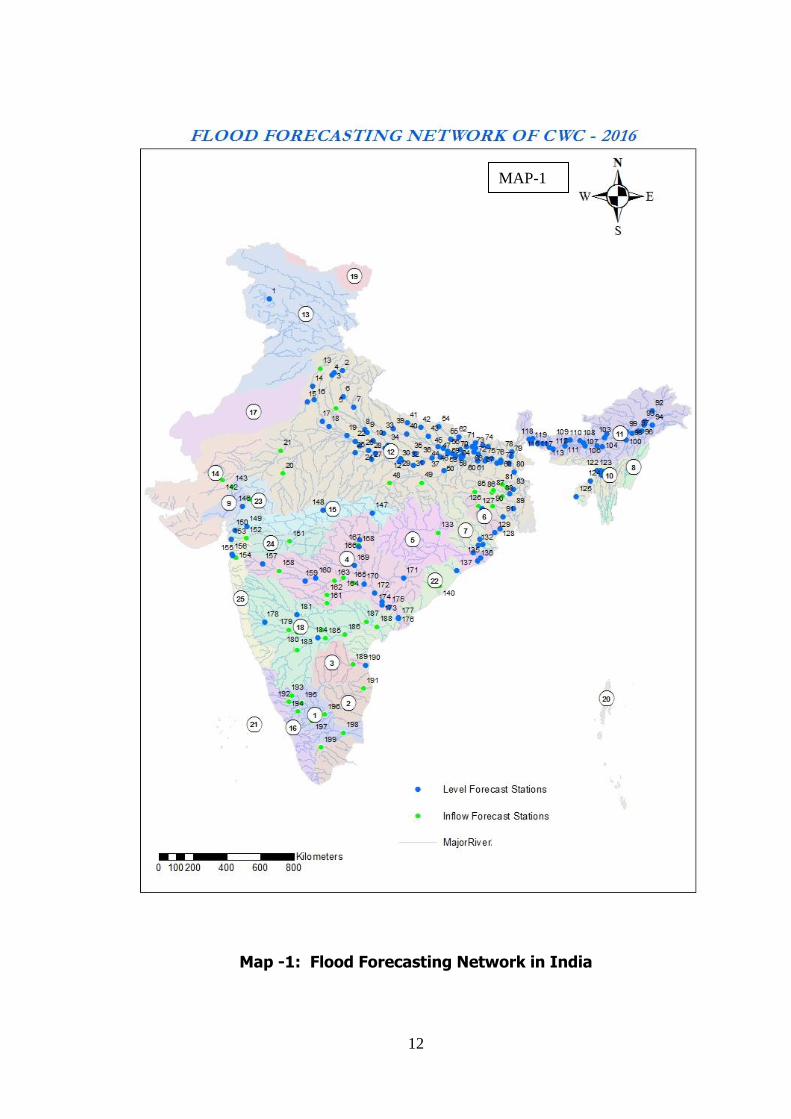
The “National Flood Forecasting and Warning Network” of Central Water Commission, which comprised of 199 flood forecasting sites including 48 inflow forecasting sites in flood season 2016 is shown in Map-1. The number of flood forecasting sites on each of the major inter-state river systems is in the Table 1.2. Table 1.2: Number of flood forecasting sites in inter-state river systems
Sr. No
Major Interstate River Systems FF stations as on Date
Level Inflow Total
1 Indus and its tributaries 1 0 1
2 Ganga & its tributaries 77 13 90
3 Brahmaputra & its tributaries 28 0 28
4 Barak System 6 0 6
5 Subarnarekha (i/c Burhabalang) 3 1 4
6 Brahmani & Baitarni 3 0 3
7 East Flowing(Mahanadi to Pennar) 3 2 5
8 Narmada 4 0 4
9 Tapi 1 2 3
10 Mahi 1 1 2
11 Sabarmati 1 1 2
12 Mahanadi 3 1 4
13 Godavari 14 7 21
14 Krishna 3 8 11
15 West Flowing Rivers(Kutch & Saurashtra)
0 1 1
16 West Flowing Rivers(Tapi to Tadri) 2 1 3
17 Cauvery and its tributaries 0 7 7
18 Pennar 1 1 2
19 East Flowing Rivers(Pennar to Kanyakumari)
0 2 2
TOTAL 151 48 199
6
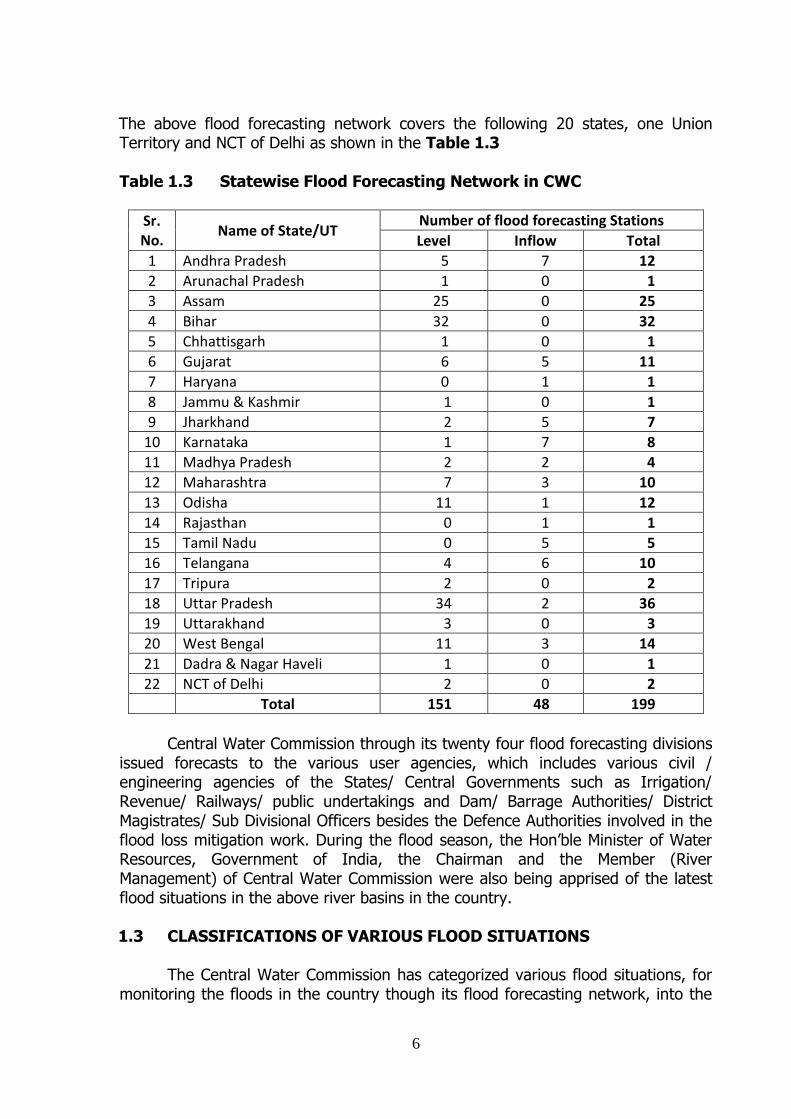
The above flood forecasting network covers the following 20 states, one Union Territory and NCT of Delhi as shown in the Table 1.3 Table 1.3 Statewise Flood Forecasting Network in CWC
Sr. No.
Name of State/UT Number of flood forecasting Stations
Level Inflow Total
1 Andhra Pradesh 5 7 12
2 Arunachal Pradesh 1 0 1
3 Assam 25 0 25
4 Bihar 32 0 32
5 Chhattisgarh 1 0 1
6 Gujarat 6 5 11
7 Haryana 0 1 1
8 Jammu & Kashmir 1 0 1
9 Jharkhand 2 5 7
10 Karnataka 1 7 8
11 Madhya Pradesh 2 2 4
12 Maharashtra 7 3 10
13 Odisha 11 1 12
14 Rajasthan 0 1 1
15 Tamil Nadu 0 5 5
16 Telangana 4 6 10
17 Tripura 2 0 2
18 Uttar Pradesh 34 2 36
19 Uttarakhand 3 0 3
20 West Bengal 11 3 14
21 Dadra & Nagar Haveli 1 0 1
22 NCT of Delhi 2 0 2
Total 151 48 199
Central Water Commission through its twenty four flood forecasting divisions
issued forecasts to the various user agencies, which includes various civil / engineering agencies of the States/ Central Governments such as Irrigation/ Revenue/ Railways/ public undertakings and Dam/ Barrage Authorities/ District Magistrates/ Sub Divisional Officers besides the Defence Authorities involved in the flood loss mitigation work. During the flood season, the Hon‟ble Minister of Water Resources, Government of India, the Chairman and the Member (River Management) of Central Water Commission were also being apprised of the latest flood situations in the above river basins in the country.
1.3 CLASSIFICATIONS OF VARIOUS FLOOD SITUATIONS The Central Water Commission has categorized various flood situations, for monitoring the floods in the country though its flood forecasting network, into the
7
following four different categories, depending upon the severity of floods i.e. based on floods magnitudes. 1.3a Level Forecast
(i) LOW FLOOD
The river is said to be in “LOW FLOOD” situation at any flood forecasting sites when the water level of the river touches or crosses the warning level, but remains below the danger level of the forecasting site. (ii) MODERATE FLOOD If the water level of the river touches or crosses its danger level, but remains 0.50 m below the Highest Flood Level of the site (commonly known as “HFL”) then the flood situation is called the “MODERATE FLOOD” situation.
(iii) HIGH FLOOD If the water level of the river at the forecasting site is below the Highest Flood Level of the forecasting site but still within 0.50m of the HFL then the flood situation is called “HIGH FLOOD” situation. In “High Flood Situations” a special “Orange Bulletin” is being issued by the Central Water Commission to the users agencies which contains the “special flood message” related to the high flood.
(iv) UNPRECEDENTED FLOOD
The flood situation is said to be “UNPRECEDENTED” when the water level of the river touches or crosses the “HIGHEST FLOOD LEVEL” recorded at any forecasting site so far. In “Unprecedented Flood Situations” a special “Red Bulletin” is being issued by the Central Water Commission to the users agencies which contains the “special flood message” related to the unprecedented flood. 1.4 Standard Operating Procedure (SOP) for Flood Forecasting &
Warning The basic activity of data collection, its transmission and dissemination of flood forecasts to the local administration is carried out by the field divisions of CWC. The modelling centres and Divisional Flood Control Rooms (DFCR) are located in the premises of the field divisions. The field divisions perform these activities as per existing Manual on Flood Forecasting which contains the following critical activities as the general SOPs 1. Nomination of Nodal Officers of CWC for interaction with the Nodal Officers
of concerned State Governments before monsoon every year. 2. Gearing up of flood forecasting network before monsoon every year. 3. Operation of Divisional Flood Control Room during monsoon every year 4. Operation of Central Flood Control Room (CFCR) during monsoon every year.
8
5. Issue of flood forecasts to designated officers of concerned State and transmission thereof through FAX/Telephone/E-mail/ through Special Messengers during monsoon every year.
6. Sending flood alerts through SMS on Mobile Phones to the concerned officers of State/ Central Government during high (12 hourly updates) and unprecedented ( 3 hourly updates) flood situations and uploading of Flood Forecasts and hourly water level data in CWC‟s Flood Forecasting Website as per Standard Operating procedure (SOP) for issuing alerts and electronic messaging in the event of disaster situations issued by National Disaster Management Division, Ministry of Home Affairs, vide letter No: 31-32/2003-NDM-III / II dated 10th April 2006, made effective from 24th April 2010.
For the purpose of dissemination of alerts to PMO/ Cabinet Secretariat, a
uniform system has been devised by categorizing each type of alert in stages- Yellow, Orange and Red.
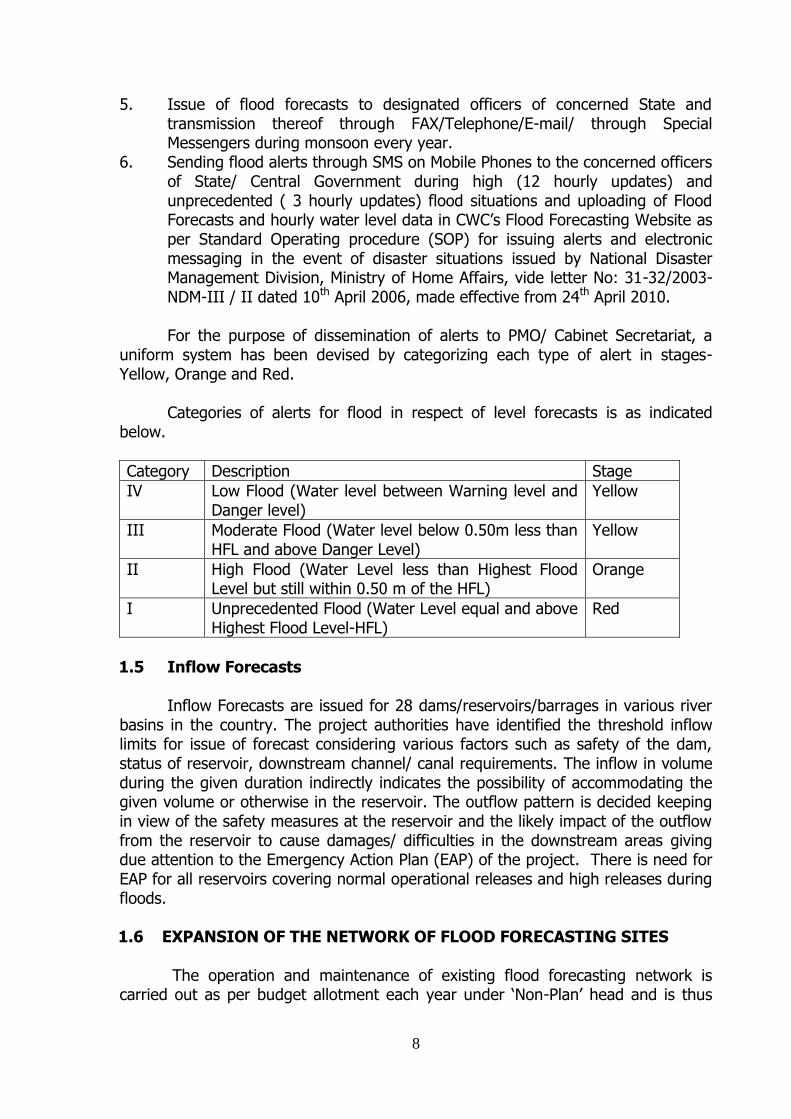
Categories of alerts for flood in respect of level forecasts is as indicated below.
Category Description Stage
IV Low Flood (Water level between Warning level and Danger level)
Yellow
III Moderate Flood (Water level below 0.50m less than HFL and above Danger Level)
Yellow
II High Flood (Water Level less than Highest Flood Level but still within 0.50 m of the HFL)
Orange
I Unprecedented Flood (Water Level equal and above Highest Flood Level-HFL)
Red
1.5 Inflow Forecasts
Inflow Forecasts are issued for 28 dams/reservoirs/barrages in various river
basins in the country. The project authorities have identified the threshold inflow limits for issue of forecast considering various factors such as safety of the dam, status of reservoir, downstream channel/ canal requirements. The inflow in volume during the given duration indirectly indicates the possibility of accommodating the given volume or otherwise in the reservoir. The outflow pattern is decided keeping in view of the safety measures at the reservoir and the likely impact of the outflow from the reservoir to cause damages/ difficulties in the downstream areas giving due attention to the Emergency Action Plan (EAP) of the project. There is need for EAP for all reservoirs covering normal operational releases and high releases during floods. 1.6 EXPANSION OF THE NETWORK OF FLOOD FORECASTING SITES
The operation and maintenance of existing flood forecasting network is carried out as per budget allotment each year under „Non-Plan‟ head and is thus
9
subject to such restrictions and cuts applied to items under `Non-Plan'. The allocation during the year 2016-17 was Rs. 100.20 Crore including Rs. 1.71 Crore for payment to Government of Bhutan for maintaining hydrometeorological stations in river common to India and Bhutan and strengthening & Modernization of FF and Hyd. Obs. Network in Brahmaputra and Barak Basin. The expansion of the network with a view to cover additional flood prone areas is proposed to be covered under „Plan‟ head. Work on such Plan schemes is subject to approval of specific schemes by the Government and the budget allocation of funds. The activity was expanded to Tamilnadu and Rajasthan during 2016.
The salient features of all Flood Forecasting Sites, the details of all the sites
basin-wise as well as Statewise during the flood season 2016, is shown at Annex-I, Annex-II and Annex-III respectively. 1.7 Data Communication System Central Water Commission maintains 544 Wireless Stations for near real –time data communication. In addition, satellite based Telemetry System has been installed at 445 stations for sensor based automatic data collection and satellite based communication. As the wireless works on pre-fixed schedules and the Telemetry transmit the data at pre-fixed time intervals only, telephone/mobile phone, fax and internet in particular was also used for receiving the vital hydro-meteorological data immediately after its observation and dissemination of flood forecasts to user agencies. 1.7.a Wireless Communication
Wireless network in CWC consists of HF (3 to 30 MHz) and VHF (30 to 300MHz) sets. The HF sets are used for long distance communication between Site and Division (15 to 20Watts), Division to Division (20 to 100 Watts). VHF sets are used for short distance communication (i.e. from river to Site office). 1.7b Telemetry Sensor based data collection and satellite based communication was installed at 445 sites upto end of XI Plan and another 56 stations have been installed during 2012-13 to 2013-14 under XII Plan for real time hourly water levels, hourly rainfall and other important meteorological parameters, established in Krishna, Godavari, Mahanadi, Chambal, Damodar, Ganga, Yamuna, Brahmaputra, Tapi, Mahi and Sutlej Basins. Three earth stations (DDRGS) located at Jaipur and Burla (in PRBS mode) and New Delhi (TDMA mode) are receiving through INSAT satellite. The data from remote stations received in DDRGS are further transmitted to the respective modelling centre through VSAT. The data received was used mainly by the divisions issuing forecast by MIKE-11.
10
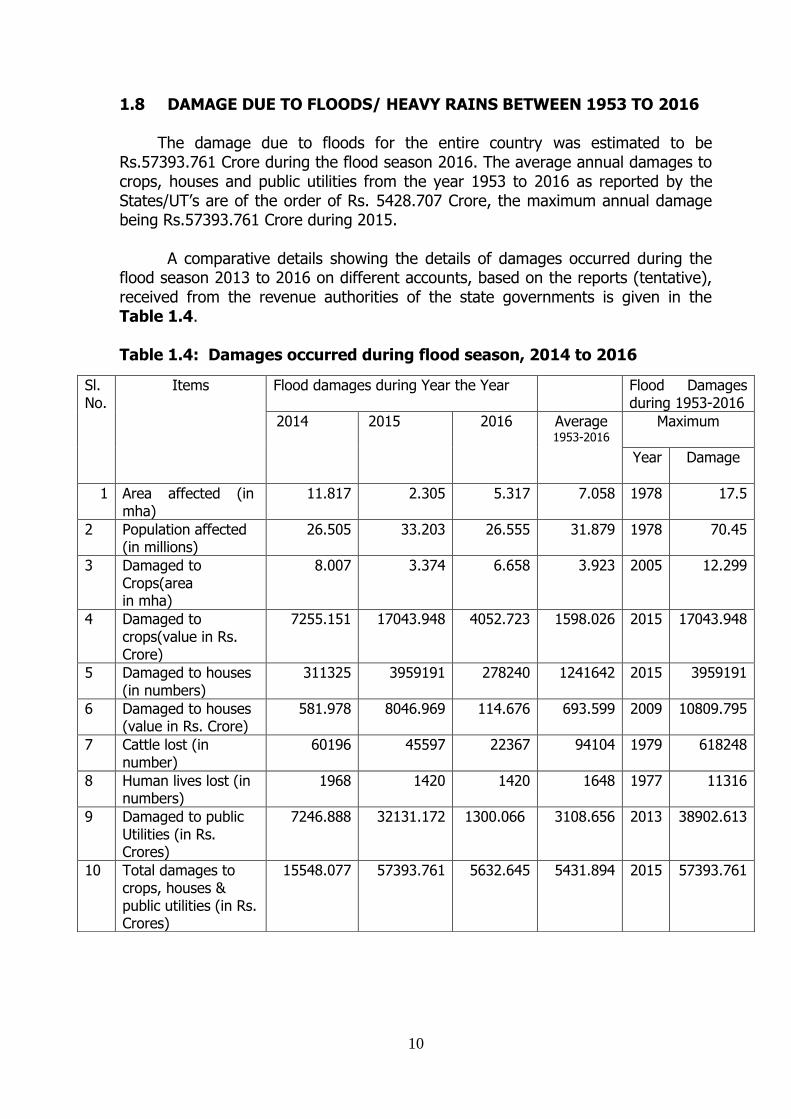
1.8 DAMAGE DUE TO FLOODS/ HEAVY RAINS BETWEEN 1953 TO 2016
The damage due to floods for the entire country was estimated to be Rs.57393.761 Crore during the flood season 2016. The average annual damages to crops, houses and public utilities from the year 1953 to 2016 as reported by the States/UT‟s are of the order of Rs. 5428.707 Crore, the maximum annual damage being Rs.57393.761 Crore during 2015. A comparative details showing the details of damages occurred during the flood season 2013 to 2016 on different accounts, based on the reports (tentative), received from the revenue authorities of the state governments is given in the Table 1.4. Table 1.4: Damages occurred during flood season, 2014 to 2016
Sl. No.
Items Flood damages during Year the Year Flood Damages during 1953-2016
2014
2015
2016
Average 1953-2016
Maximum
Year Damage
1 Area affected (in mha)
11.817 2.305 5.317 7.058 1978 17.5
2
Population affected (in millions)
26.505 33.203 26.555 31.879 1978 70.45
3 Damaged to Crops(area in mha)
8.007 3.374 6.658 3.923 2005 12.299
4 Damaged to crops(value in Rs. Crore)
7255.151 17043.948 4052.723 1598.026 2015 17043.948
5 Damaged to houses (in numbers)
311325 3959191 278240 1241642 2015 3959191
6 Damaged to houses (value in Rs. Crore)
581.978 8046.969 114.676 693.599 2009 10809.795
7 Cattle lost (in number)
60196 45597 22367 94104 1979 618248
8 Human lives lost (in numbers)
1968 1420 1420 1648 1977 11316
9 Damaged to public Utilities (in Rs. Crores)
7246.888 32131.172 1300.066 3108.656 2013 38902.613
10 Total damages to crops, houses & public utilities (in Rs. Crores)
15548.077 57393.761 5632.645 5431.894 2015 57393.761
11
1.9 ANALYSIS OF PERFORMANCE OF FLOOD FORECASTING NETWORK
CWC carried out analysis and appraisal of the forecasting work, at the end of monsoon season. Based on this, measures for improvements, if necessary, are identified. A summary of the performance of the work carried out by the field divisions during the flood season 2016 presented in Chapter-3. While the performance of the flood forecasting system is satisfactory, yet there is constant endeavor for improving the performance especially for additional warning time as new technology and more data are becoming available. 1.10 ORGANISATIONAL SET-UP OF FLOOD FORECASTING NETWORK
The present organizational set up of Flood-forecasting & Warning Establishment of Central Water Commission under the Member (River-Management) is spread over regional offices of CWC each headed by a Chief Engineer. Fifteen Circle Offices and twenty six Divisions in its field formations carry out flood forecasting activities. Chief Engineer (Flood Management) and Flood Forecast Monitoring Directorate monitor the Flood Forecasting activities in the headquarters. It also issues flood bulletins at national level.
The organizational chart of Flood Forecasting and Warning set up of the Central Water Commission is given at Figure-1.1
12
Map -1: Flood Forecasting Network in India
MAP-1
13
List of River Basins
Basin Code Basin Name
1 Cauvery
2 East flowing rivers between Pennar and Kanyakumari
3 Pennar
4 Godavari
5 Mahanadi
6 Subarnarekha
7 Brahmani and Baitarni
8 Minor rivers draining into Myanmar and Bangladesh
9 Sabarmati
10 Barak and Others
11 Brahmaputra
12 Ganga
13 Indus (Up to border)
14 West flowing rivers of Kutch and Saurashtra including Luni
15 Narmada
16 West flowing rivers from Tadri to Kanyakumari
17 Area of Inland drainage in Rajasthan
18 Krishna
19 Area North of Ladakh not draining into Indus
20 Drainage areas of Andaman & Nicobar Island
21 Drainage areas of Lakshadweep Island
22 East flowing rivers between Mahanadi and Pennar
23 Mahi
24 Tapi
25 West flowing rivers from Tapi to Tadri
14
List of Flood Forecast Stations
1 Rammunshibagh 41 Balrampur 81 Massanjore Dam 121 Matizuri 161 Singur Dam
2 Srinagar 42 Bansi 82 Tilpara Barrage 122 Badarpurghat 162 Nizamsagar Dam
3 Rishikesh 43 Birdghat(Gorakhpur) 83 Narayanpur 123 Karimganj 163 Sriramsagar Dam
4 Haridwar 44 Turtipar 84 Gheropara 124 Kailashahar 164 Kaddam Project
5 Narora Barrage 45 Darauli 85 Tenughat Dam 125 Sonamura 165 Sripada Yellampally Project
6 Moradabad 46 Gangpur Siswan 86 Panchet Dam 126 Chandil Dam 166 Bhandara
7 Bareilly 47 Chhappra 87 Maithon Dam 127 Jamshedpur 167 Gosikhurd Dam
8 Kannauj 48 Bansagar Dam 88 Durgapur Barrage 128 Rajghat 168 Pauni
9 Ankinghat 49 Rihand Dam 89 Harinkhola 129 Govindpur(NH5 Road Bridge) 169 Balharsha
10 Kanpur 50 Inderpuri 90 Kangsabati Dam 130 Anandpur 170 Kaleswaram
11 Dalmau 51 Koelwar 91 Mohanpur 131 Akhuapada 171 Jagdalpur
12 Phaphamau 52 Maner 92 Passighat 132 Jenapur 172 Eturunagaram
13 Hathnikund Barrage 53 Patna(Dighaghat) 93 Dibrugarh 133 Hirakud Dam 173 Dummagudem
14 Mawi 54 Khadda 94 Naharkatia 134 Naraj 174 Bhadrachalam
15 Dhansa 55 Chatia 95 Chenimari(Khowang) 135 Alipingal 175 Kunavaram
16 Delhi Railway Bridge 56 Rewaghat 96 Nanglamoraghat 136 Nimapara 176 Rajahmundry(Rly Bridge)
17 Mathura 57 Hajipur 97 Sibsagar 137 Purushottampur 177 Dowlaiswaram Barrage
18 Agra 58 Patna Gandhighat 98 Neamatighat 138 Gunupur 178 Arjunwad
19 Etawah 59 Sripalpur 99 Badatighat 139 Kashinagar 179 Almatti Dam
20 Gandhisagar Dam 60 Hathidah 100 Golaghat 140 Gotta Barrage 180 Narayanpur Dam
21 Bisalpur Dam 61 Munger 101 Numaligarh 141 Thottapalli reservoir 181 Deongaon Bridge
22 Auraiya 62 Lalbeghiaghat 102 Jiabharali NT Road Crossing 142 Dantiwada Dam 182 PD Jurala Project
23 Kalpi 63 Sikandarpur(Muzzafarpur) 103 Tezpur 143 Dharoi Dam 183 Tungabhadra Dam
24 Hamirpur 64 Samastipur 104 Kampur 144 Shubhash Bridge(Ahmedabad) 184 Mantralayam
25 Mohana 65 Rosera 105 Dharamtul 145 Kadana Dam 185 Sunkesula Barrage
26 Shahjina 66 Khagaria 106 Guwahati 146 Wanakbori Weir 186 Srisailam Dam
27 Banda 67 Bhagalpur 107 Puthimari NH Crossing 147 Mandla 187 Dr KLRS Pulichintala Dam
28 Chillaghat 68 Kahalgaon 108 Pagladiya NT Road Crossing 148 Hoshangabad 188 Prakasam Barrage
29 Naini 69 Basua 109 Beki Road Bridge 149 Garudeswar 189 Somasila Dam
30 Chhatnag(Allahabad) 70 Benibad 110 Manas NH Crossing 150 Bharuch 190 Nellore
31 Mirzapur 71 Kamtaul 111 Goalpara 151 Hathnur Dam 191 Poondi Reservoir Chennai
32 Varanasi 72 Ekmighat 112 Dhubri 152 Ukai Dam 192 Harangi Dam
15
33 Lucknow(Hanuman Setu) 73 Hayaghat 113 Golokganj 153 Surat 193 Hemavathy Dam
34 Rae Bareilly 74 Jhanjarpur 114 Tufanganj 154 Madhuban Dam 194 Kabini Dam
35 Jaunpur 75 Baltara 115 NH 31(Jaldhaka) 155 Vapi 195 K R Sagar Dam
36 Ghazipur 76 Kursela 116 Ghugumari 156 Daman 196 Mettur Dam
37 Buxar 77 Sahibganj 117 Mathabanga 157 Kopergaon 197 Bhavanisagar Dam
38 Ballia 78 Dhengraghat 118 Domohani Bridge 158 Jaikwadi Dam 198 Grand Anicut
39 Elginbridge 79 Jhawa 119 Mekhliganj 159 Gangakhed 199 Vaigai Dam
40 Ayodhya 80 Farakka 120 AP Ghat(Silchar) 160 Nanded
16
17
CHAPTER – 2
ROLE OF IMD IN FF ACTIVITIES AND SOUTHWEST MONSOON ACTIVITIES
2.1 Role of IMD & SOUTHWEST MONSOON 2.1a Role of IMD
India Meteorological Department (IMD) provides various Meteorological inputs for formulation of Flood Forecast in Divisional Flood Control Rooms (DFCR) of CWC. The inputs include rainfall in stations other than those operated by CWC on different sub-catchments of river basins, providing Quantitative Precipitation Forecast (QPF) for 24 hours, Weather Situation and Heavy Rainfall Warnings over various basins and outlook for further 48 hours. The QPFs are issued by 0930 hours daily and are modified if necessary around 1230 hours. For this purpose, IMD is operating Flood Meteorological Offices (FMO) in different river basins. These are located at Agra, Ahmedabad, Asansol, Bhubaneshwar, Delhi, Guwahati, Hyderabad, Jalpaiguri, Lucknow and Patna. These FMOs provide all the weather related inputs to the concerned DFCR by fastest available modes of communication. The FMOs are also provided the rainfall figures observed by the stations operated by CWC as well as the water level in the flood forecast stations in the basin by the concerned DFCR.
During the year 2016, the Hydromet division of IMD provided online QPF by
using two Numerical Weather Prediction (NWP) models namely WRF ARW (9km x 9km) and Multi Model Ensemble (MME) for various sub-basins of different river basins.
The FMO at Hyderabad uploaded the daily weather summaries, QPF and rainfall
figures issued in the web site of Meteorological Centre Hyderabad during the flood season from 1st June to 31st October. During the expansion of flood forecasting network under the XII Plan, it was also agreed that the concerned Regional/ Meteorological Centre falling within a basin will issue the QPF and provide Meteorological inputs for the additional basins where expansion is contemplated.
The INSAT-DRT secretariat of IMD looks after the works of allocation of Station
Index number, Time slot allotment and frequency allocation for the various Automatic Weather Stations setup by different organisations. CWC is one of the members of INSAT-DRT User and officers of CWC attend the INSAT-DRT User meetings convened by the INSAT DRT Secretariat of IMD. CWC has so far installed 501 Satellite based Automatic Data Collection Units for collection of Hourly Water Level and Rainfalls from remote stations. IMD has allocated the Station Index Numbers and other parameters for all these stations. During the 12th Plan there is a proposal to install 458 additional automatic data collection units in various river basins and IMD has provided the Station Index numbers/ Time slot/ Frequency for these 458 stations. There is a provision in XII Plan to upgrade the telemetry equipments installed in IX Plan as well as to convert the mode of communication from Pseudo Random Burst System to Time Division Multiple Access System for the stations installed under X Plan. Accordingly,
18
IMD was approached for providing Satellite ID and Time slot allotment for these 223 stations which have been allotted by IMD AWS lab Pune. 2.1b Southwest Monsoon
India gets about 80% of its Annual rainfall during the south-west monsoon from June to September except some portions of south-eastern parts of peninsular India where the main rains occur during the period of north-east monsoon from October to December, which overlap with the receding stage of the south-west monsoon in October. Occasionally, cyclonic storm develop in the south-west bay and move into the Peninsula and produces heavy rain during north-east monsoon season. Southwest monsoon advances from Kerala in the beginning of June. It produces spell of heavy rainfall along the western coast of the peninsula and on the southern slopes of Khasi and Jaintia hills in north- eastern region. In association with the depression which occasionally form in the North Bay of Bengal and move north-westwards, heavy rains are produced in the central parts of the country, Orissa, Gangetic West Bengal, southern districts of Bihar, Gujarat region, and East Rajasthan and in the later monsoon months in and around North Deccan.
A very important characteristic of southwest monsoon is the occurrence of "break". The break situations arise when the monsoon trough shifts to the Himalayas and are very important as these cause floods in the rivers rising from the Eastern Himalayas. Sometimes, the phenomenon of break sets in immediately after a monsoon depression has occurred. These two causes occurring in succession serve to intensify the floods.
The whole India has been divided into 36 meteorological sub-divisions by India Meteorological Department (IMD) for the purpose of studies of rainfall/monsoon activities.
The progress of monsoon rainfall over the country is monitored by evaluating
the departures of total rainfall from the normal rainfall in respect of meteorological sub-divisions and districts. The IMD has classified the rainfall as excess, normal, deficient and scanty, according to the following criteria. Excess : + 20% or more than normal Normal : + 19% to - 19% of the normal Deficient : - 20% to - 59% of the normal Scanty : - 60% to - 99% of the normal No Rain (N.R.) : - 100% of the normal
Normal is defined as the Long Period Average say for 50 years for the period from 1st June to 30th September. Presently Long Period average for the years 1951 to 2000 is being used to define normal. For the country as a whole the normal rainfall during the period 1st June to 30th September is 89 cm.
19
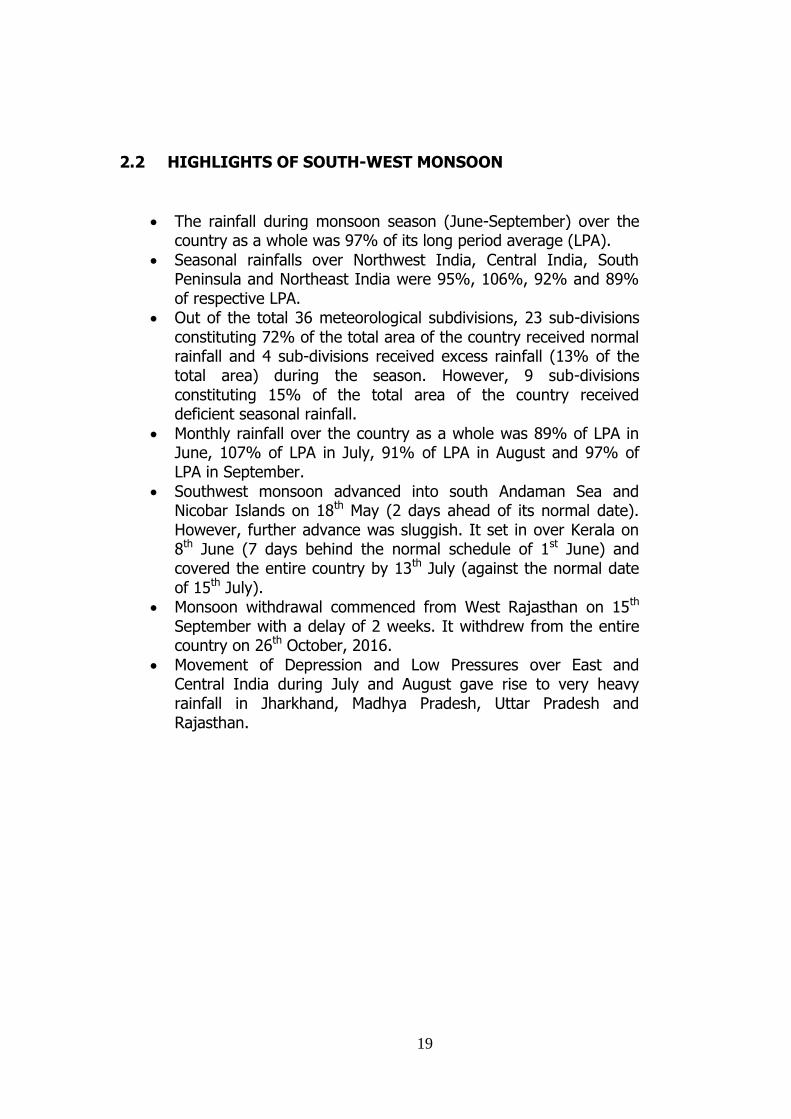
2.2 HIGHLIGHTS OF SOUTH-WEST MONSOON
The rainfall during monsoon season (June-September) over the country as a whole was 97% of its long period average (LPA).
Seasonal rainfalls over Northwest India, Central India, South Peninsula and Northeast India were 95%, 106%, 92% and 89% of respective LPA.
Out of the total 36 meteorological subdivisions, 23 sub-divisions constituting 72% of the total area of the country received normal rainfall and 4 sub-divisions received excess rainfall (13% of the total area) during the season. However, 9 sub-divisions constituting 15% of the total area of the country received deficient seasonal rainfall.
Monthly rainfall over the country as a whole was 89% of LPA in June, 107% of LPA in July, 91% of LPA in August and 97% of LPA in September.
Southwest monsoon advanced into south Andaman Sea and Nicobar Islands on 18th May (2 days ahead of its normal date). However, further advance was sluggish. It set in over Kerala on 8th June (7 days behind the normal schedule of 1st June) and covered the entire country by 13th July (against the normal date of 15th July).
Monsoon withdrawal commenced from West Rajasthan on 15th September with a delay of 2 weeks. It withdrew from the entire country on 26th October, 2016.
Movement of Depression and Low Pressures over East and Central India during July and August gave rise to very heavy rainfall in Jharkhand, Madhya Pradesh, Uttar Pradesh and Rajasthan.
20
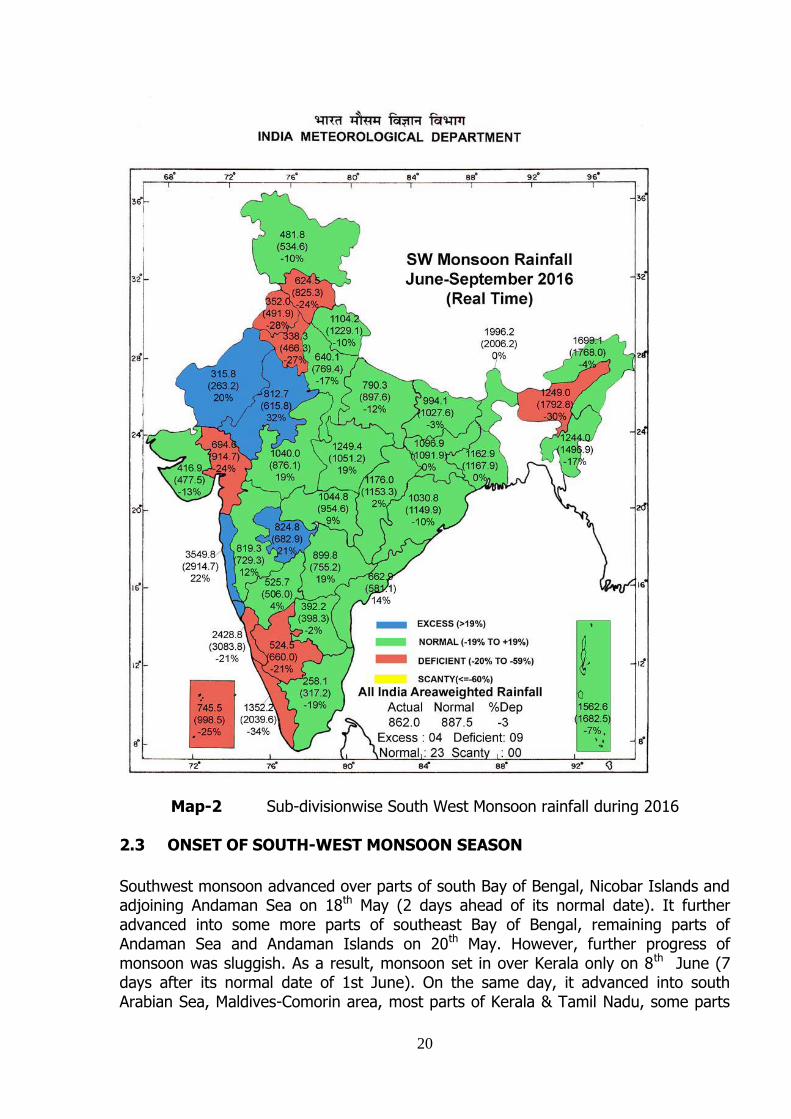
Map-2 Sub-divisionwise South West Monsoon rainfall during 2016 2.3 ONSET OF SOUTH-WEST MONSOON SEASON
Southwest monsoon advanced over parts of south Bay of Bengal, Nicobar Islands and adjoining Andaman Sea on 18th May (2 days ahead of its normal date). It further advanced into some more parts of southeast Bay of Bengal, remaining parts of Andaman Sea and Andaman Islands on 20th May. However, further progress of monsoon was sluggish. As a result, monsoon set in over Kerala only on 8th June (7 days after its normal date of 1st June). On the same day, it advanced into south Arabian Sea, Maldives-Comorin area, most parts of Kerala & Tamil Nadu, some parts
21
of south interior Karnataka, remaining parts of south Bay of Bengal and some more parts of central Bay of Bengal.
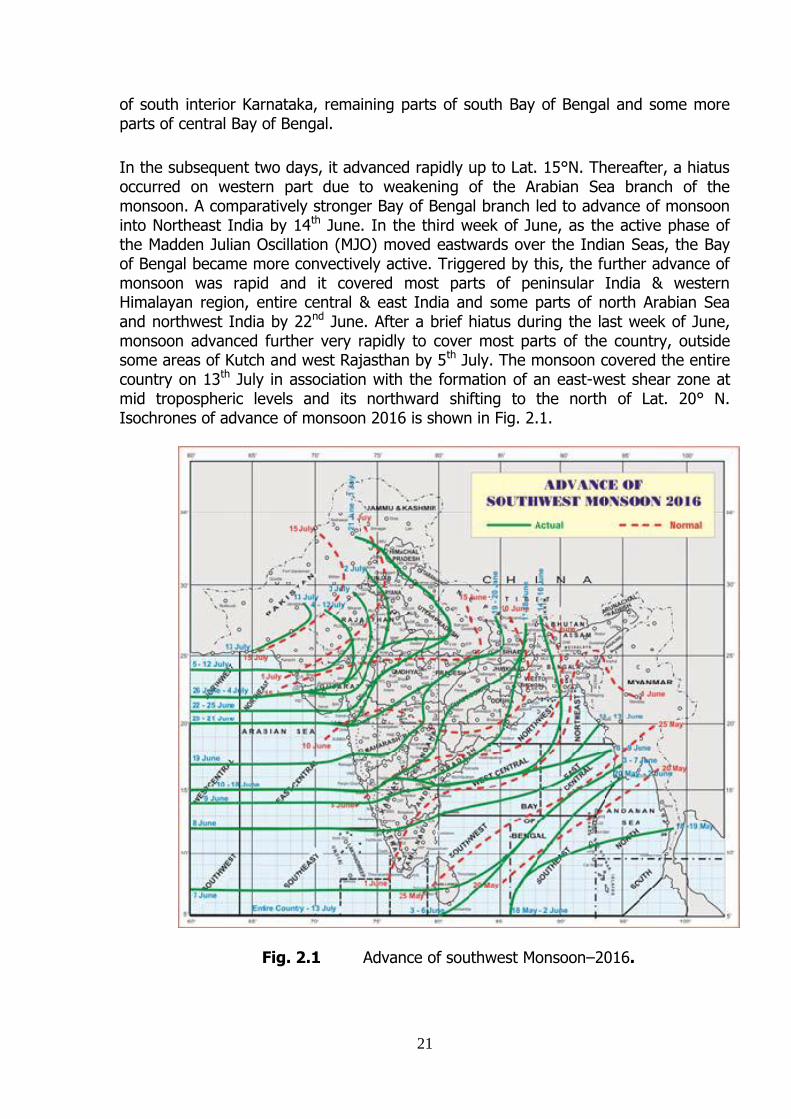
In the subsequent two days, it advanced rapidly up to Lat. 15°N. Thereafter, a hiatus occurred on western part due to weakening of the Arabian Sea branch of the monsoon. A comparatively stronger Bay of Bengal branch led to advance of monsoon into Northeast India by 14th June. In the third week of June, as the active phase of the Madden Julian Oscillation (MJO) moved eastwards over the Indian Seas, the Bay of Bengal became more convectively active. Triggered by this, the further advance of monsoon was rapid and it covered most parts of peninsular India & western Himalayan region, entire central & east India and some parts of north Arabian Sea and northwest India by 22nd June. After a brief hiatus during the last week of June, monsoon advanced further very rapidly to cover most parts of the country, outside some areas of Kutch and west Rajasthan by 5th July. The monsoon covered the entire country on 13th July in association with the formation of an east-west shear zone at mid tropospheric levels and its northward shifting to the north of Lat. 20° N. Isochrones of advance of monsoon 2016 is shown in Fig. 2.1.
Fig. 2.1 Advance of southwest Monsoon–2016.
22
2.4 CHIEF SYNOPTIC FEATURES
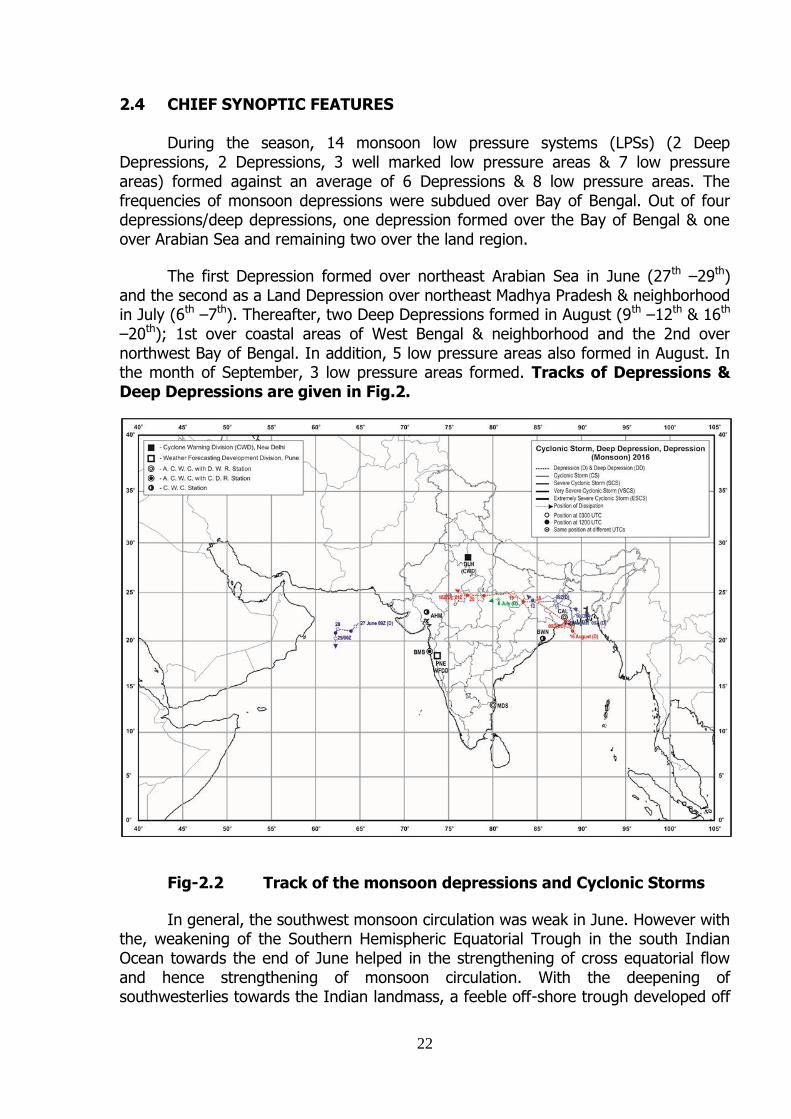
During the season, 14 monsoon low pressure systems (LPSs) (2 Deep Depressions, 2 Depressions, 3 well marked low pressure areas & 7 low pressure areas) formed against an average of 6 Depressions & 8 low pressure areas. The frequencies of monsoon depressions were subdued over Bay of Bengal. Out of four depressions/deep depressions, one depression formed over the Bay of Bengal & one over Arabian Sea and remaining two over the land region.
The first Depression formed over northeast Arabian Sea in June (27th –29th) and the second as a Land Depression over northeast Madhya Pradesh & neighborhood in July (6th –7th). Thereafter, two Deep Depressions formed in August (9th –12th & 16th –20th); 1st over coastal areas of West Bengal & neighborhood and the 2nd over northwest Bay of Bengal. In addition, 5 low pressure areas also formed in August. In the month of September, 3 low pressure areas formed. Tracks of Depressions & Deep Depressions are given in Fig.2.
Fig-2.2 Track of the monsoon depressions and Cyclonic Storms
In general, the southwest monsoon circulation was weak in June. However with the, weakening of the Southern Hemispheric Equatorial Trough in the south Indian Ocean towards the end of June helped in the strengthening of cross equatorial flow and hence strengthening of monsoon circulation. With the deepening of southwesterlies towards the Indian landmass, a feeble off-shore trough developed off
23
Karnataka-Kerala coasts in the last week of June. The Heat Low gradually strengthened and got established over Pakistan along with a shallow „heat trough‟ extending along the Indo-Gangetic plains during the week.
Also, the MJO moved eastwards over the Indian Seas, the Bay of Bengal
became more convectively active. The formation and movement of cyclonic vortices at upper levels off both the coasts and one over central India during the third week of June triggered the monsoon activity over most parts of the country. The first Depression (27th – 29th June) and first Low pressure area (26th – 28th June) of the season formed over northeast Arabian Sea and over westcentral & adjoining northwest Bay of Bengal off north Andhra Pradesh-south Odisha coasts respectively. However, the Depression over Arabian Sea weakened in-situ over the Sea area due to a large vertical wind shear. An east-west shear zone was also observed along Lat. 15°N. All these systems enhanced the rainfall activity over northern plains, Peninsular India and central India towards the end of the June.
A cyclonic circulation extending between lower & mid tropospheric levels lay
over Kutch & neighborhood during 1st - 5th July, which increased the rainfall activity over the Gujarat Region and West Rajasthan. A Land Depression (6th – 7th July) formed over northeast Madhya Pradesh & neighbourhood, which caused active to vigorous monsoon conditions over Madhya Pradesh and East Rajasthan. Two low pressure areas (on 30th June- 5th July & 7th July -8th July) along the east-west trough caused fairly widespread to widespread rainfall activity with heavy to very heavy rain at few places and extremely heavy at isolated places mainly over east & central India. The presence of an off-shore trough along the west coast caused active to vigorous monsoon conditions over western parts of central India during the 2nd week of July. The deep convection over central & western parts of peninsular India due to northward shifting of an east-west shear zone during 10th – 13th July increased the rainfall activity over the extreme western parts during same period.
In third week of July, the monsoon trough shifted northwards closes to the
foothills of the Himalayas and led to weak monsoon conditions over major parts of India. Thus, a lull in the monsoon activity was noticed over major parts of the country and break like situation prevailed. The monsoon trough remained close to the foothills of the Himalayas up to 21st July and shifted back to its normal position from 22nd July. However, the instability in the basic flow generated several cyclonic circulations which helped in maintaining near normal rainfall for the country as a whole. Towards the end of July and beginning of August, due to active monsoon trough and the enhanced convection over major parts of the country, triggered with the Somali Low Level Jet, there was formation of a couple of low pressure areas over north Bay of Bengal. These systems moved nearly west-northwestwards along the monsoon trough and caused active to vigorous monsoon conditions over parts of north & central India as well as northern parts of peninsular India with extremely heavy rainfall activity at isolated places over northern parts of Peninsular & Central India.
Thereafter, with the formation of a Depression over the coastal areas of West
Bengal & neighborhood on 9th of August and its immediate intensification into a Deep Depression on next day, the rainfall activity shifted northwards. Due to movement of
24
Deep Depression and formation of two more low pressure areas during 2nd week of August led to active to vigorous monsoon activity over Gangetic West Bengal, Odisha, Jharkhand, Madhya Pradesh, Rajasthan and Gujarat State.
In mid-August, the western end of the monsoon trough gradually shifted
northwards and lay close to the foothills of the Himalayas on 17th August. However, the eastern end of the trough continued to remain active with the formation of a Deep Depression on 16th August over northwest Bay of Bengal & neighbourhood. The system followed the west-northwestward track after crossing the coast and traversed up to East Rajasthan. While moving west-northwestwards, it caused fairly widespread to widespread rainfall with isolated extremely heavy falls and caused flood situations all along its track. However, the subdued rainfall activity continued to prevail over south peninsular India since second week of August. Thereafter, the weakening of cross equatorial flow led to weak monsoon flow pattern over the Indian regime during the last week of August. The troughs in mid- latitude westerlies which intruded more southwards affected the monsoon flow. However, it maintained the rainfall activity mainly over the northwestern parts. The remnant cyclonic circulation of the low pressure area formed over westcentral Bay of Bengal off Andhra Pradesh coast caused fairly widespread to widespread rainfall activity with isolated extremely heavy falls over the eastern parts of south Peninsular India towards the end of August. During the first half of September, the monsoon trough shifted to the foothills of the Himalayas, which led to weak monsoon activity over the country. However, due to formation of three low pressure areas over the Bay of Bengal active to vigorous monsoon activity prevailed over many parts of east, central and Peninsular India. In the third week, in association with the strong MJO activity over the Maritime continent, strengthening of the monsoon circulation and increased convective activity, active to vigorous monsoon activity prevailed mainly over north peninsular India.
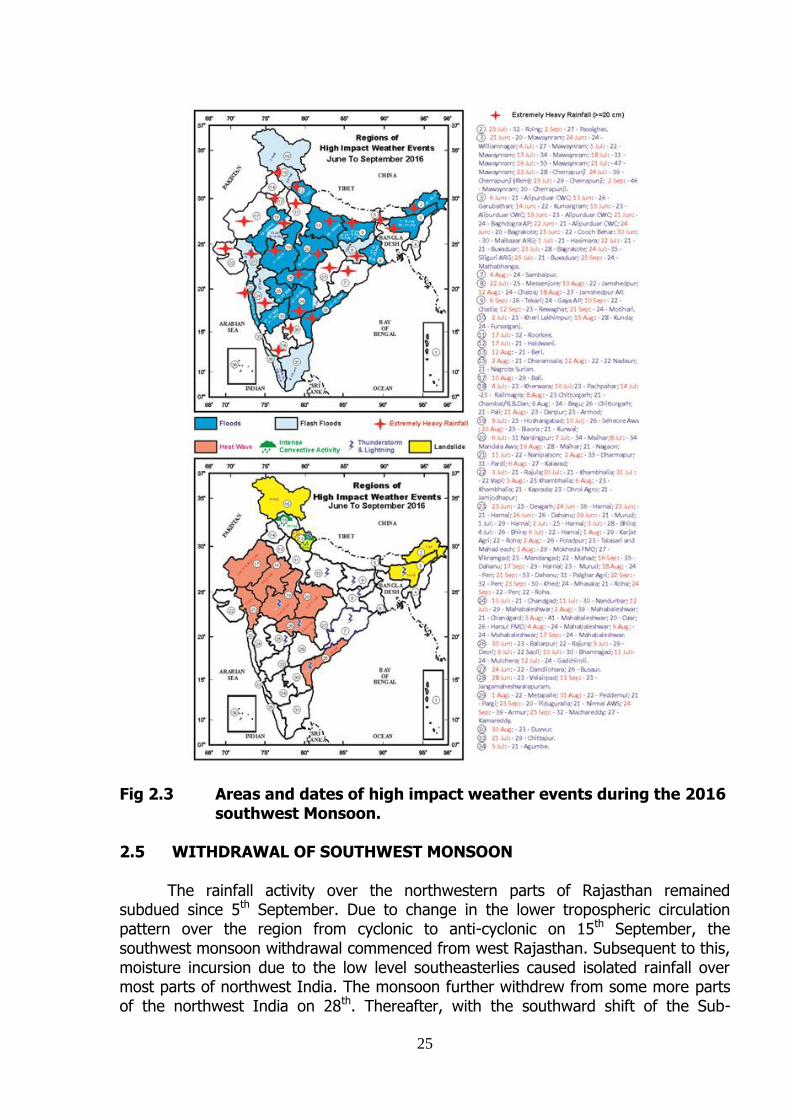
2.4.1 High Impact Weather Events
Fig. 2.3 depicts the met. Sub-divisions or parts thereof, which experienced high impact weather events like, floods, landslides during the southwest monsoon season (June- September) along with the dates. Fig. 2.3 also indicates areas that experienced isolated extremely heavy rainfall (Rainfall amount ≥20 cm reported during the 24 hours ending at 0830 hrs IST) events during the season without any reference to the dates of these occurrences. Incessant rainfall associated with the formation and movement of the monsoon low pressure systems in the presence of strong cross equatorial flow often caused flood situations over various areas during different parts of the season.
25
Fig 2.3 Areas and dates of high impact weather events during the 2016 southwest Monsoon.
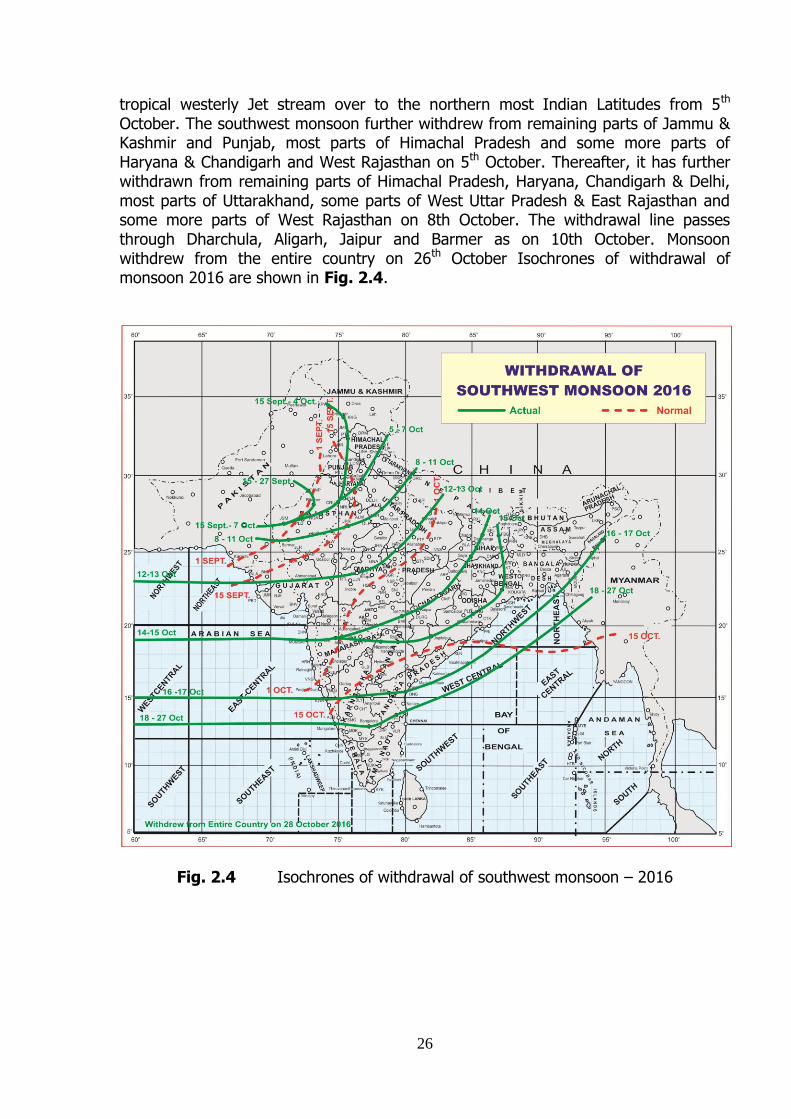
2.5 WITHDRAWAL OF SOUTHWEST MONSOON
The rainfall activity over the northwestern parts of Rajasthan remained subdued since 5th September. Due to change in the lower tropospheric circulation pattern over the region from cyclonic to anti-cyclonic on 15th September, the southwest monsoon withdrawal commenced from west Rajasthan. Subsequent to this, moisture incursion due to the low level southeasterlies caused isolated rainfall over most parts of northwest India. The monsoon further withdrew from some more parts of the northwest India on 28th. Thereafter, with the southward shift of the Sub-
26
tropical westerly Jet stream over to the northern most Indian Latitudes from 5th October. The southwest monsoon further withdrew from remaining parts of Jammu & Kashmir and Punjab, most parts of Himachal Pradesh and some more parts of Haryana & Chandigarh and West Rajasthan on 5th October. Thereafter, it has further withdrawn from remaining parts of Himachal Pradesh, Haryana, Chandigarh & Delhi, most parts of Uttarakhand, some parts of West Uttar Pradesh & East Rajasthan and some more parts of West Rajasthan on 8th October. The withdrawal line passes through Dharchula, Aligarh, Jaipur and Barmer as on 10th October. Monsoon withdrew from the entire country on 26th October Isochrones of withdrawal of monsoon 2016 are shown in Fig. 2.4.
Fig. 2.4 Isochrones of withdrawal of southwest monsoon – 2016
27
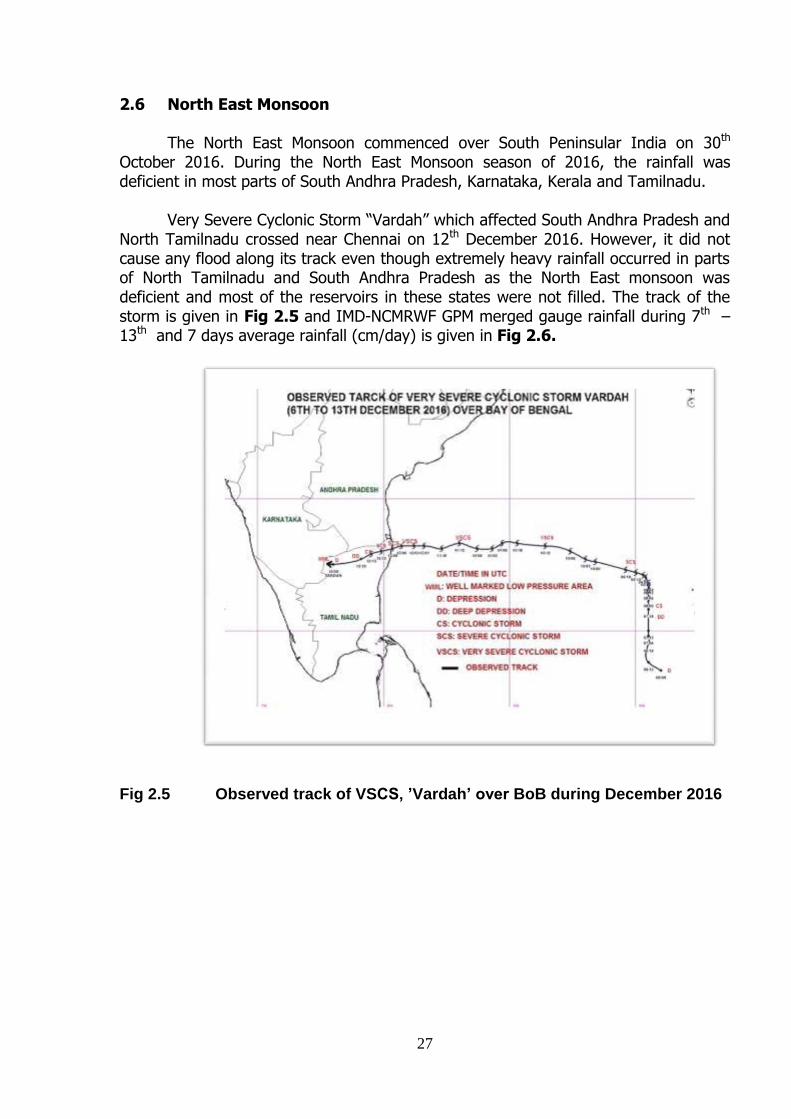
2.6 North East Monsoon The North East Monsoon commenced over South Peninsular India on 30th
October 2016. During the North East Monsoon season of 2016, the rainfall was deficient in most parts of South Andhra Pradesh, Karnataka, Kerala and Tamilnadu.
Very Severe Cyclonic Storm “Vardah” which affected South Andhra Pradesh and
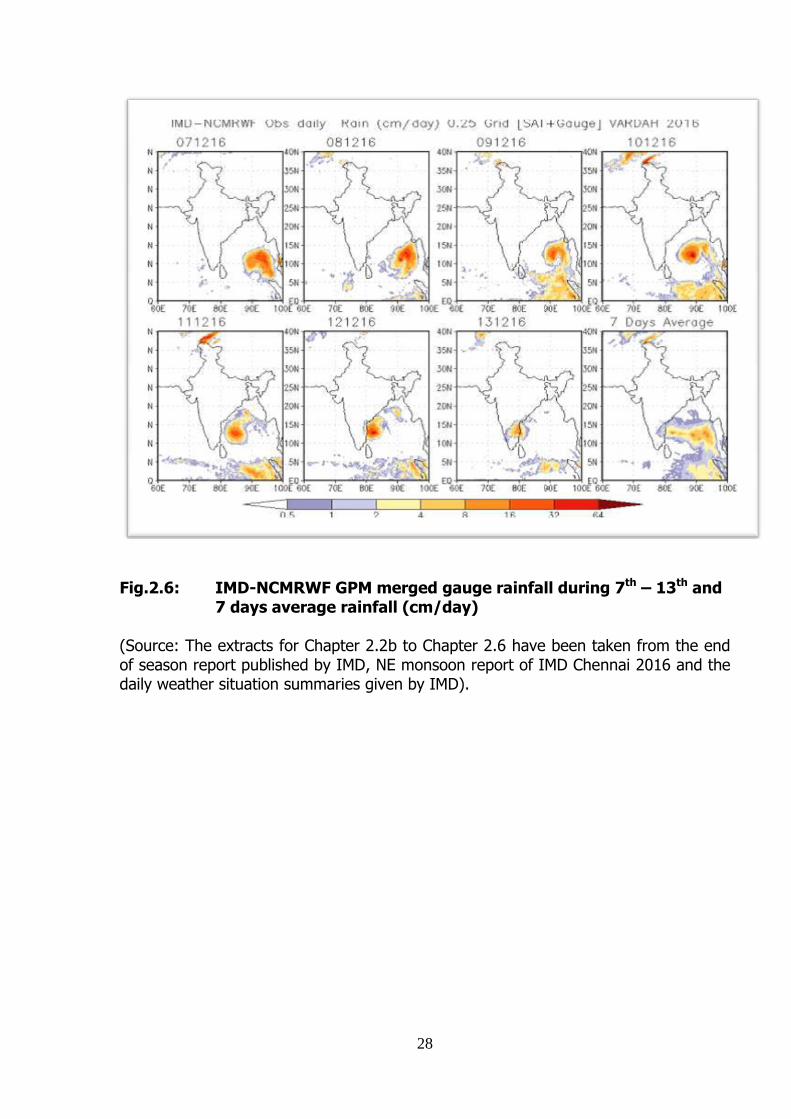
North Tamilnadu crossed near Chennai on 12th December 2016. However, it did not cause any flood along its track even though extremely heavy rainfall occurred in parts of North Tamilnadu and South Andhra Pradesh as the North East monsoon was deficient and most of the reservoirs in these states were not filled. The track of the storm is given in Fig 2.5 and IMD-NCMRWF GPM merged gauge rainfall during 7th – 13th and 7 days average rainfall (cm/day) is given in Fig 2.6.
Fig 2.5 Observed track of VSCS, ’Vardah’ over BoB during December 2016
28
Fig.2.6: IMD-NCMRWF GPM merged gauge rainfall during 7th – 13th and
7 days average rainfall (cm/day) (Source: The extracts for Chapter 2.2b to Chapter 2.6 have been taken from the end of season report published by IMD, NE monsoon report of IMD Chennai 2016 and the daily weather situation summaries given by IMD).
29
CHAPTER 3
FLOOD FORECAST PERFORMANCE
3.1 FLOOD FORECASTING EVALUATION - PRESENT CRITERIA AND PROCEDURE
A number of techniques are being utilised for formulation of river stage and inflow forecasts by Central Water Commission. While inflow forecast is being provided for assisting project authorities in reservoir regulation, the stage forecast is done for warning the civil and engineering authorities about the predicted water level well ahead of its occurrence. An accurate forecast is one where the forecast level and corresponding actual observed level exactly synchronize or have such a small difference that it can be taken as reasonably accurate. In an ideal situation, not only the forecast and the corresponding observed value of river stage/ inflow should be the same but also the time of such occurrence should be the same as that predicted.
3.2 EVALUATION CRITERIA FOR STAGE/ INFLOW FORECASTING
As per present practice, all the level and inflow forecasts are being judged by the single criteria of accuracy i.e. the actual level attained is within ± 15cm of forecasted value for stage forecasts and the actual inflow/ volume received in the dam/ barrage is within ± 20% of the forecasted value for inflow forecast.
The forecast of incoming flood gives the water level or inflow and “time” of occurrences. It is also observed that in many cases the levels attained were found within permissible limit of accuracy but the time of occurrence was not the same. 3.3 FLOOD FORECASTING ACTIVITIES
The flood forecasting activities like data collection, forecast formulation and its
dissemination during 2016 covered various river basins and States. There was an expansion of Flood Forecasting activity to the States of Tamilnadu and Rajasthan under the Plan Scheme “Flood Forecasting” besides expansion of activity in existing States covered in the network. Cauvery and East Flowing rivers between Pennar and Kanyakumari were also brought into the flood forecasting activity beside additional forecasting sites in existing basins. A total of 6239 forecast were issued during 2016. The performance of flood forecasting Divisionwise, Major Basinwise, Statewise and for the period 2000 to 2016 are given from Annex-IV to VII.
3.4 RIVERWISE DETAILS OF FLOOD FORECASTING ACTIVITES &
ACCURACY OF FORECAST
3.4.1 Indus Basin
During the flood season 2016, no forecasts were issued in Jhelum basin for Rammunshibagh site in Jammu and Kashmir.
30
3.4.2 Brahmaputra Basin
One new Flood Forecast Site namely Passighat on river Siang in Arunachal Pradesh was added during 2016 flood season. During the flood season 2016, analysis of the flood forecasts issued reveals that 2328 forecasts (37.31% of 6239 forecast) were issued for 28 sites (28 Level Forecast Sites) located on the main Brahmaputra and tributaries. Out of these, 2309 forecasts (99.18%) were found within permissible limit of accuracy.
3.4.3 Barak and other Basin
One new Flood Forecasting Site namely Badarpurghat on river Barak was added during 2016 flood season. During the flood season 2016, 199 forecasts (3.19% of 6239) were issued for four sites out of 6 (6 Level) Sites. Out of these, 198 forecasts (99.5%) were found within permissible limit of accuracy. No forecast was issued for two sites.
3.4.4 Ganga Basin
Three new inflow forecast stations namely, Bisalpur Dam, Bansagar Project and Rihand Dam were added during 2016 flood season. During the flood season 2016, 2712 forecasts (43.47% of 6239) were issued for 75 sites (63 Level and 12 Inflow), out of total 90 sites (77 Level and 13 Inflow Forecast) located on the main Ganga and its tributaries. No forecast was issued for the remaining 15 sites. Out of these, 2644 forecasts (97.49%) were found within permissible limit of accuracy. 3.4.5 Godavari
Three new Inflow Forecast Sites namely, Gosikhurd Dam, Kaddam Dam and
Sripada Yellampally Project were added during flood season 2016. During the flood season 2016, 132 forecasts (2.12% of 6239) were issued for 13(7 Level and 6 Inflow) of the 21 sites (14 Level and 7 Inflow) on Godavari Basin and 120 (90.91%) forecasts were found within permissible limit of accuracy. No forecasts were issued for remaining 8 sites.
3.4.6 Krishna Basin
Two new inflow forecast sites namely, Sunkesula Barrage and Dr K L Rao Sagar Pulichintala Project were added during flood season 2016. During the flood season 2016, 246 forecasts (3.94% of 6239) were issued for 8 forecasting sites out of 11 sites. All the sites where forecasts were issued are inflow forecasting sites. Out of 246 forecasts issued, 216 forecasts were found to be within limit with an accuracy of 87.80%. No level forecasts were issued for the remaining 3 sites. 3.4.7 Cauvery Basin
Seven new inflow forecast sites were added for the first time to the Flood Forecasting network of Central Water Commission in the Cauvery Basin. A rainfall
31
runoff based mathematical model was developed for the basin which was run on daily basis for formulation of inflow forecasts. During the flood season 2016, 308 forecasts (4.94% of 6239) were issued for six forecasting sites out of seven sites and 167 forecasts (54.22 %) were found within permissible limit of accuracy. No forecast was issued for one site in Cauvery basin. 3.4.8 Subarnarekha Basin including Burhabalang
One Level Forecasting and One Inflow Forecasting sites were added during the
flood season 2016. During the flood season 2016, 22 forecasts (0.35% of 6239) were
issued for 3 forecasting sites (2 level and 1 inflow) out of 4 (3 level and 1 inflow)
sites. Out of 22 (13 are level and 9 are inflow forecasts) forecasts issued, 16 (11 Level
and 5 Inflow) forecasts were found to be within limit with an accuracy of 72.73%. No
level forecasts were issued for the remaining site.
3.4.9 Brahmani and Baitarni Basin
During the flood season 2016, 1 forecast (0.02% of 6239) was issued for 1 forecasting sites (1 Level) out of 3 (3 level) sites. Out of 1 (1 Level forecast Site) forecast issued, 1 forecast was found to be within limit with an accuracy of 100%. No level forecasts were issued for the remaining sites.
3.4.10 Mahanadi Basin
During the flood season 2016, 67 forecasts (1.07% of 6239) were issued for 1 forecasting sites (1 Inflow) out of 4 (3 level and 1 inflow) sites. Out of 67 (1 Inflow forecast Site) forecast issued, 66 forecasts was found to be within limit with an accuracy of 98.51%. No forecasts were issued for the remaining sites.
3.4.11 East Flowing between Mahanadi and Pennar Basin
One new inflow forecast site was added during flood season 2016. During the flood season 2016, 4 forecasts (0.06% of 6239) were issued for 1 forecasting site (1 Level) out of 5 (3 level and 2 inflow) sites. Out of 4 (4 Level) forecast issued, 4 forecasts was found to be within limit with an accuracy of 100%. No forecasts were issued for the remaining sites (2 Level and 2 Inflow).
3.4.12 Pennar Basin
One new inflow forecast site was added during flood season 2016. During the flood season 2016, 4 forecasts (0.06% of 6239) were issued for 1 forecasting sites (1 Inflow) out of 2 (1 level and 1 inflow) sites. Out of 4 (4 Inflow) forecast issued, 3 forecasts was found to be within limit with an accuracy of 75%. No forecasts were issued for the remaining sites.
32
3.4.13 East Flowing between Pennar and Kanyakumari Basin
Two new inflow forecast site was added during flood season 2016. During the flood season 2016, 10 forecasts (0.16% of 6239) were issued for 1 forecasting sites (1 Inflow) out of 2 (2 inflow) sites. Out of 10 Inflow forecasts issued, 6 forecasts were found to be within limit with an accuracy of 60%. No forecasts were issued for the remaining site.
3.4.14 Mahi Basin
During the flood season 2016, 19 forecasts (0.3% of 6239) were issued for 2 forecasting sites (1 Level and 1 Inflow) out of 2 (1 level and 1 inflow) sites. Out of 19 (3 Level and 16 Inflow) forecast issued, 17 ( 1 Level and 16 Inflow) forecasts were found to be within limit with an accuracy of 89.47%. 3.4.15 Sabarmati Basin
During the flood season 2016, 19 forecasts (0.3% of 6239) were issued for 1 forecasting sites (1 Inflow) out of 2 (1 level and 1 inflow) sites. Out of 19 (19 Inflow) forecast issued, 18 (18 Inflow) forecasts were found to be within limit with an accuracy of 94.74%. No forecast was issued for one level forecast station in the basin.
3.4.16 Narmada Basin
During the flood season 2016, 14 forecasts (0.22% of 6239) were issued for 2 forecasting sites (2 Level) out of 4 (4 level) sites. Out of 14 forecast issued, 14 forecasts were found to be within limit with an accuracy of 100%. No forecast was issued for remaining two level forecast station in the basin.
3.4.17 Tapi Basin
During the flood season 2016, 137 forecasts (2.19% of 6239) were issued for 2 forecasting sites (2 Inflow) out of 3 (1 level and 2 Inflow) sites. Out of 137 forecast issued, 133 forecasts were found to be within limit with an accuracy of 97.08%. No forecast was issued for remaining one level forecast station in the basin.
3.4.18 West Flowing from Tapi to Tadri Basin
During the flood season 2016, 17 forecasts (0.27% of 6239) were issued for 2 forecasting sites (1 Level and 1 Inflow) out of 3 (2 level and 1 Inflow) sites. Out of 17 forecasts 4 Level and 13 Inflow) issued, 16 forecasts (3 Level and 13 Inflow) were found to be within limit with an accuracy of 94.12%. No forecast was issued for remaining one level forecast station in the basin.
3.4.19 West flowing rivers of Kutch and Saurashtra including Luni
During the flood season 2016, no inflow forecast was issued for 1 forecasting sites (1 Inflow).
33
The Basinwise – Riverwise flood forecasting information in India during flood season 2016 is given in Annex-II. 3.5 STATEWISE FLOOD FORECASTING PERFORMANCE
There are 20 states, one Union Territory of the Dadra & Nagar Haveli, and
National Capital Territory of Delhi so far covered under the Flood Forecast and Warning Network of the Central Water Commission. The Statewise flood forecasting information in India during the flood season 2016, is given in Annex –III. Their salient features are as under:
3.5.1 Andhra Pradesh In state of Andhra Pradesh, there were 12 (5 Level and 7 Inflow) forecasting sites. Forecasts were issued for 6 (2 Level and 4 Inflow) forecasting sites.
It is revealed that 92 forecasts (13 level and 79 inflow) were issued out of
which 78 forecasts (13 level and 65 inflow) were within limits (84.78%). No forecasts were issued for 6 stations.
3.5.2 Arunachal Pradesh Flood Forecasting activity was expanded to Arunachal Pradesh during 2016 flood season. One Level Forecast Station was operationalised at Passighat on river Siang during 2016. 94 Level Forecasts were issued for Passighat out of which 92 were within limit of accuracy (97.87%). 3.5.3 Assam Flood Forecasting activity was expanded by one additional station at Badarpurghat in Barak Basin during 2016. In the state of Assam, there were 25 forecasting sites and all of them were level forecasting sites during 2016. Forecasts were issued for 26 sites. It is seen that during 2016 season, 2257 forecasts were issued out of which 2248 forecasts (99.60%) were found within limit of accuracy.
River Desang at Desangpani a flood monitoring station flowed in Unprecedented Flood Situation and at Flood Forecasting Station Nanglamoraghat flowed in High Flood Situation between 23rd and 26th April 2016 due to passage of severe weather system in the last week of April 2016 which was considered as pre-monsoon flood events.
Following Flood Forecast Stations River Brahmaputra at Dibrugarh,
Neamatighat, Tezpur, Goalpara and Dhubri, River Jia-Bharali at N T Road Crossing, River Kopili at Kampur, River Beki at Road Bridge and River Sankosh at Golokganj flowed in High Flood Situation during the designated monsoon period.
34
Flood Monitoring Station on river Aie at N H Crossing also flowed in
High Flood Situation during designated flood season 2016. 3.5.4 Bihar In the state of Bihar, there were 32 level forecasting sites. Forecasts were issued for 28 sites during the year 2016. Out of 1451 forecasts issued during the flood season 2016, 1437 forecasts (99.04%) were found within limit of accuracy. No forecasts were issued for 4 sites. River Ganga at Patna Gandhighat, Hathidah and Bhagalpur flowed in Unprecedented Flood Situation during 3rd week of August 2016.
Following Flood Forecasting Stations on Rivers Ganga at Patna Dighaghat, Kahalgaon, Sone at Maner, Burhigandak at Khagaria, River Kosi at Kursela, River Mahananda at Jhawa also flowed in High Flood Situation during 2016.
Following Flood Monitoring stations on River Gandak at Dumariaghat, River Bagmati at Runisaidpur, River Mahananda at Taibpur also flowed in High Flood Situation during 2016. 3.5.5 Chhattisgarh
In the state of Chhattisgarh there was one level flood forecasting site (i.e. Jagdalpur) on the Indravathi River (a tributary of the Godavari River). 4 flood forecast were issued for this station during the flood season 2016 out of which 4 (100%) were within the limits of accuracy.
One Flood Monitoring Site namely Kharra on river Rihand flowed in High Flood Situation during August 2016.
3.5.6 Gujarat
There were 11 (6 Level and 5 Inflow) forecasting sites in the state of Gujarat including five inflow forecasting sites. However, forecasts were issued for only 6 (2 Level and 4 Inflow) sites. Out of 86 forecasts issued (7 level and 79 inflow), 80 forecasts (4 level and 76 inflow) (93.20 %) were found within limits of accuracy during the flood season 2016. No forecasts were issued for 5 ( 4 Level and 1 Inflow) sites.
River Wakal at Jotasan a flood monitoring station flowed in High Flood Situation during August 2016.
35
3.5.7 Haryana
Data from Hathnikund Barrage were collected. However, no inflow forecasts were issued due to very little travel time available from base station. 3.5.8 Jammu and Kashmir In the State of Jammu and Kashmir, one FF Site namely Rammunshibagh remained operationalised during 2016. However, as the water level did not cross warning level, no forecast was issued for the one FF site. 3.5.9 Jharkhand
Flood Forecasting Activity was expanded to two additional stations in Subarnarekha Basin of Jharkhand during 2016. In the state of Jharkhand, there were five inflow and two level flood forecasting sites due to the expansion of the activity. Flood forecasts were issued for all of them. During the flood season 2016, Out of 249 (63 level and 186 inflow) forecasts issued, 244 (62 level and 182 inflow) forecasts (97.99 %) were found within limit of accuracy.
One Flood Monitoring Site namely Japla on river Sone flowed in High Flood Situation during August 2016. 3.5.10 Karnataka
Flood Forecasting Activity was expanded to four additional stations in Cauvery Basin during 2016 by using rainfall runoff based mathematical model. There were 8 (1 Level and 7 Inflow) forecasting sites in the state of Karnataka. During the flood season 2016, forecasts were issued for 7 inflow forecast sites. Out of 351 forecasts (0 level and 351 inflow) issued, 221 (0 level and 221 inflow) forecasts (62.96%) were found within limit of accuracy. 3.5.11 Madhya Pradesh
Flood Forecasting Activity was expanded to one additional inflow forecast site in Sone basin during 2016. In the state of Madhya Pradesh, there were two level forecasting sites on the river Narmada and two inflow forecast sites at Gandhisagar on river Chambal and Bansagar Dam on river Sone during 2016. During the flood season 2016, forecasts were issued for all sites. Out of 36 forecasts issued (14 level and 22 inflow), 24 (14 level and 10 inflow) (66.67%) forecasts were found within the limit of accuracy.
3.5.12 Maharashtra
Flood Forecasting Activity was expanded to one inflow forecast site on river Wainganga with this there were 10 (& Level and 3 Inflow) forecasting sites, in the state of Maharashtra. During the flood season 2016, forecasts were issued for 3 (1 Level and 2 Inflow forecast) sites. Total 123 forecasts were issued (12 Level 111
36
inflow) during 2016 out of which 119 (11 Level and 108 inflow) were within limit (96.75%). No forecasts were issued for 7 stations. One Flood Monitoring Site namely Nasik on river Godavari flowed in Unprecedented Flood Situation during first week of August 2016. 3.5.13 Odisha
In the state of Odisha, there were 12 (11 Level 1 Inflow) forecasting site. During the flood season 2016, 82 (15 level and 67 inflow) forecasts were issued for 4 forecast sites (3 Level and 1 Inflow) out of which 80 (14 level and 66 inflow) (97.56 %) were found within limit of accuracy. No forecasts were issued for remaining 8 flood forecasting sites. 3.5.14 Rajasthan
Flood Forecasting activity was expanded to Rajasthan during 2016 flood season. One Inflow Forecast Station was operationalised at Bisalpur Dam on river Banas (tributary of Chambal in Ganga Basin) during 2016. 7 Inflow Forecasts were issued out of which 7 were within limit of accuracy (100%).
Flood Monitoring Site on River Jakham at Dhariawad flowed in
Unprecedented Flood Situation during August 2016. 3.5.15 Tamilnadu
Flood Forecasting activity was expanded to Tamilnadu during 2016 flood season. 5 Inflow Forecast sites were operationalised by using rainfall runoff based mathematical model. during 2016. 82 Inflow Forecasts were issued out of which 60 were within limit of accuracy (73.17%). 3.5.16 Telangana
Flood Forecasting activities were expanded to additional two sites with this there are 10 forecast stations (4 level and 6 inflow forecast stations) in the state of Telangana. Forecasts were issued for 9 (4 Level and 5 Inflow) Sites. 154 forecasts (28 Level and 126 Inflow) were issued in the State of Telangana during 2016. Out of which 134 (28 Level and 106 Inflow) were within limit of accuracy (87.01%). No forecasts were issued for the remaining site. 3.5.17 Tripura
There were two level forecasting sites in the state of Tripura namely,
Kailashahar on river Manu and Sonamura on river Gumti. Forecast was not issued to both these stations as they did not cross warning level during the year 2016.
37
3.5.18 Uttarakhand
There were three level forecasting sites in the state of Uttarakhand, namely, Srinagar on the Alaknanda, Rishikesh and Haridwar on the main river Ganga. Forecasts were issued for all three stations in 2016. 25 forecasts were issued out of which 25 (100%) were within limit of accuracy. 3.5.19 Uttar Pradesh
Flood Forecasting Activity was expanded to one inflow forecast site in Rihand Sub-basin of Ganga Basin during 2016. With this expansion there were 36 (34 Level and 2 Inflow) flood forecasting sites in the state of Uttar Pradesh. During the flood season 2016, forecasts were issued for 30 stations (28 level and 2 inflow). Out of 676 forecasts (613 level and 63 inflow), 636 forecasts (577 level and 59 inflow) (94.08%) were found within limit of accuracy. No forecasts were issued for 6 sites. Flood Forecasting Site Ballia on river Ganga flowed in Unprecedented Flood Situation during August 2016. Flood Monitoring Sites at Duddhi on river Kanhur and Kaimaha on river Urmil flowed in Unprecedented Flood Situation during August 2016. Flood Forecasting Site Ghazipur on river Ganga and Balrampur on Rapti flowed in High Flood Situation during August 2016. Flood Monitoring Station at Kachhla Bridge and Sitamarhi on river Ganga, Paliakalan on river Sharda, Bhinga on river Ghaghra also flowed in High Flood Situation during August 2016.
Flood Monitoring Site Naugaon on river Yamuna flowed in High Flood
Situation during July 2016.
3.5.20 West Bengal
In the state of West Bengal, there were 14 (11 Level and 3 Inflow) flood forecasting sites. During the flood season 2016, forecasts were issued for 11 sites (8 level and 3 inflow stations). Out of 449 forecasts (352 level and 97 inflow), 439 forecasts (342 level and 97 inflow) (97.77%) were found within limit of accuracy. No forecasts were issued for three level forecast sites.
3.5.21 Daman & Diu
In the Union Territory of Daman & Diu, there was one flood forecasting site at Daman on river Damanganga. No flood forecast was issued for the site during the flood season 2016.
38
3.5.22 NCT of Delhi
There are two flood forecasting sites in the National Capital Territory of Delhi (NCT of Delhi), namely, Delhi Railway Bridge on the Yamuna River and Dhansa Regulator at Delhi and Haryana border on the Sahibi river, a tributary of Yamuna River which is commonly known by name of Najafgarh drain within Delhi town. Both the sites are level forecasting sites. Forecast was issued for Delhi Railway Bridge only. During the flood season 2016, Out of 21 forecasts, 20 forecasts (95.24%) were within limits of accuracy. The performance of flood forecasting Stations (Divisionwise) in India during flood season 2016 is given in Annex-IV.
The Major Basin/Statewise performance of flood forecasting stations in India during flood season is given in Annex-V to VI. Details of unprecedented and high flood events in the various river systems covered under the Flood Forecasting & Warning Network are given in Annex- VIII and Annex-IX respectively for the year 2016. Moderate and low flood events were observed as listed at Annex-X to XII, for the year 2016. 3.6 AN OVERVIEW OF FLOOD FORECASTING PERFORMANCE
During the flood season 2016, an average number of flood forecasts issued per forecasting site were 31.35. The number of forecasting sites where the performance accuracy of the issued forecasts was found to be above 95.35 % (National average for flood season 2016) was 107 sites (53.76 %) which include 82 sites (41.21 %) where flood forecasting stations having 100% accurate forecasts. The number of forecasting sites where the performance accuracy was found greater than 97% as fixed in the Results Framework Document (RFD) of Ministry of Water Resources is 102 (51.26%).
The flood forecasting performance of the level forecasting as well as inflow
forecasting sites from 2000 to 2016 is given in Annex-VII and from 2000 to 2016 as Fig.3.1.
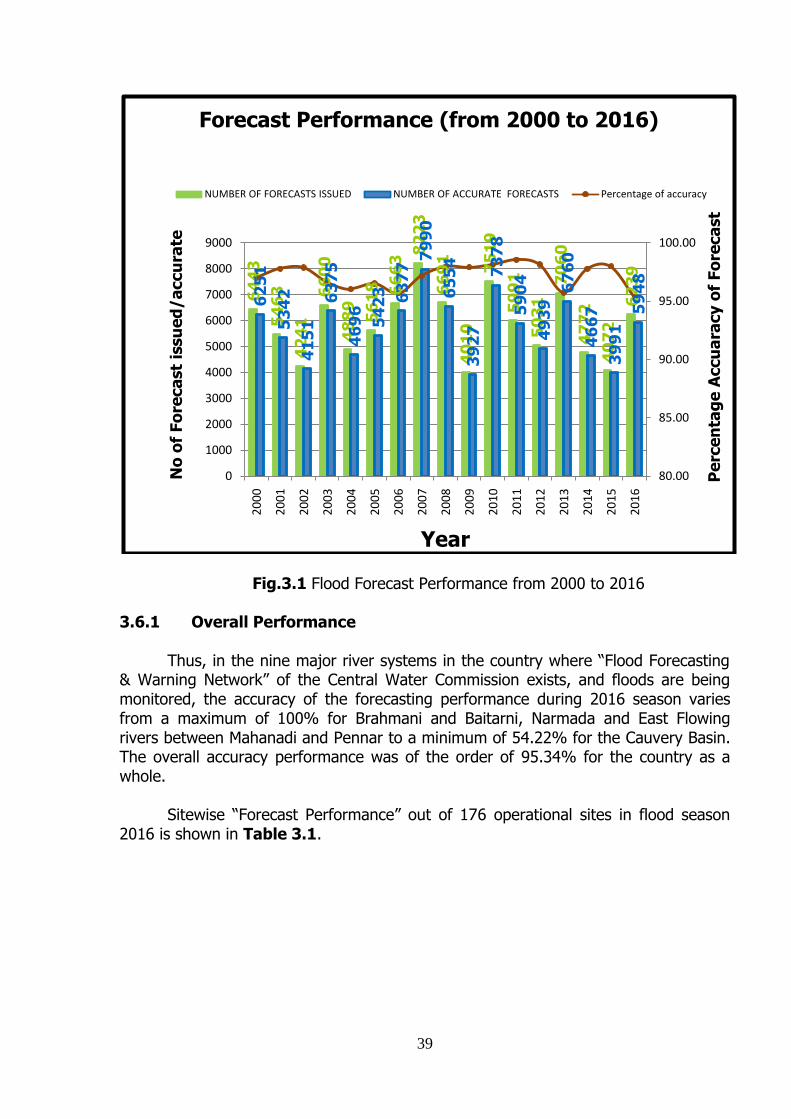
39
Fig.3.1 Flood Forecast Performance from 2000 to 2016
3.6.1 Overall Performance
Thus, in the nine major river systems in the country where “Flood Forecasting & Warning Network” of the Central Water Commission exists, and floods are being monitored, the accuracy of the forecasting performance during 2016 season varies from a maximum of 100% for Brahmani and Baitarni, Narmada and East Flowing rivers between Mahanadi and Pennar to a minimum of 54.22% for the Cauvery Basin. The overall accuracy performance was of the order of 95.34% for the country as a whole.
Sitewise “Forecast Performance” out of 176 operational sites in flood season
2016 is shown in Table 3.1.
64
43
54
63
42
41
66
00
48
89
56
18 66
63
82
23
66
91
40
10
75
19
59
91
50
31
70
60
47
72
40
72
62
39
62
51
53
42
41
51
63
75
46
96
54
23 63
77
79
90
65
54
39
27
73
78
59
04
49
39
67
60
46
67
39
91
59
48
80.00
85.00
90.00
95.00
100.00
0
1000
2000
3000
4000
5000
6000
7000
8000
90002
00
0
20
01
20
02
20
03
20
04
20
05
20
06
20
07
20
08
20
09
20
10
20
11
20
12
20
13
20
14
20
15
20
16
Pe
rce
nta
ge
Accu
ara
cy o
f Fo
reca
st
No
of
Fo
reca
st
issu
ed
/a
ccu
rate
Year
Forecast Performance (from 2000 to 2016)
NUMBER OF FORECASTS ISSUED NUMBER OF ACCURATE FORECASTS Percentage of accuracy
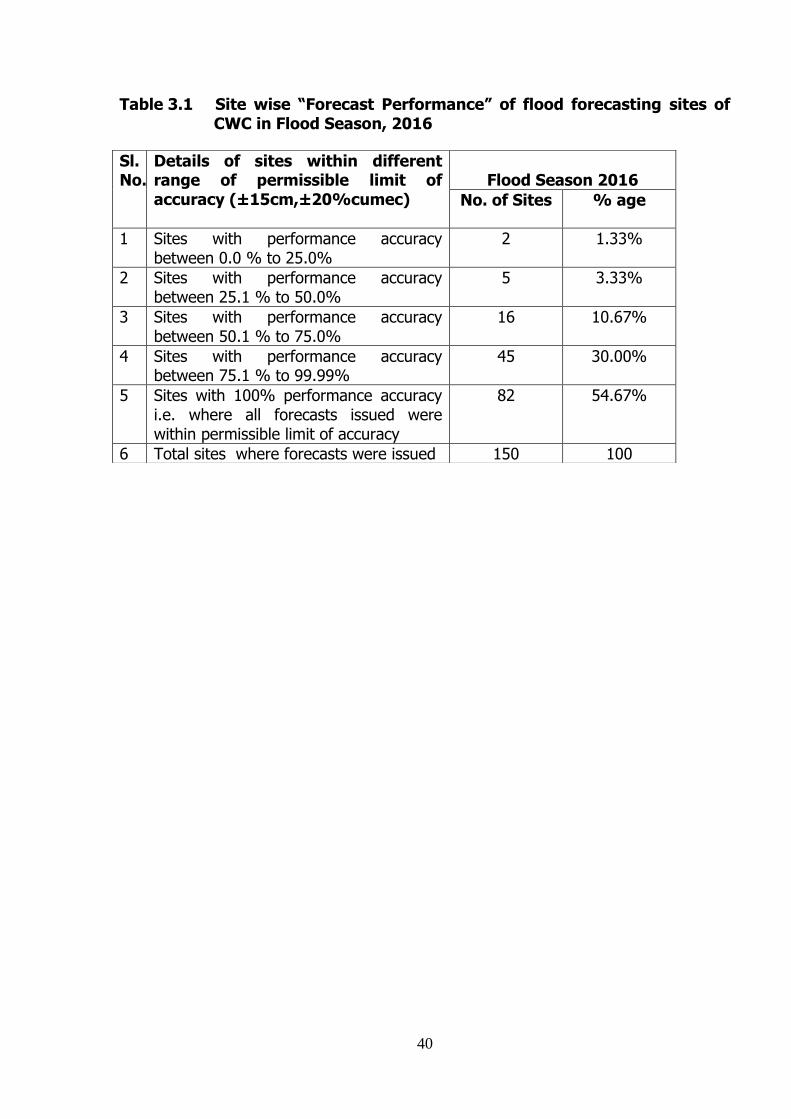
40
Table 3.1 Site wise “Forecast Performance” of flood forecasting sites of CWC in Flood Season, 2016
Sl. No.
Details of sites within different range of permissible limit of accuracy (±15cm,±20%cumec)
Flood Season 2016
No. of Sites % age
1 Sites with performance accuracy between 0.0 % to 25.0%
2 1.33%
2 Sites with performance accuracy between 25.1 % to 50.0%
5 3.33%
3 Sites with performance accuracy between 50.1 % to 75.0%
16 10.67%
4 Sites with performance accuracy between 75.1 % to 99.99%
45 30.00%
5 Sites with 100% performance accuracy i.e. where all forecasts issued were within permissible limit of accuracy
82
54.67%
6 Total sites where forecasts were issued 150 100
41
CHAPTER – 4 SIGNIFICANT FLOOD EVENTS
4.1 GENERAL
The Flood Forecasting Activity was expanded to 199 locations as explained in previous Chapter. All the 199 flood forecasting sites including 48 inflow forecasting sites were operational i.e. where desired hydro-meteorological data was observed/ collected, during the flood season 2016. Unprecedented floods, exceeding previous highest flood levels (HFL), were observed in four sites namely Ballia in Ballia district of Uttar Pradesh, Patna Gandhighat and Hathidah in Patna district and Bhagalpur in Bhagalpur district of Bihar during the year 2016. The levels were recorded within 0.5 m of their respective H.F.L at 18 Flood Forecasting sites. 4.2 AN OVERVIEW OF FORECAST EVENTS
The highlight of this year is as follows: 4.2.1 Unprecedented Flood Situation 4.2.1.1 Middle Reaches of main Ganga Very heavy to exceptionally very heavy rainfall recorded during the period 18th to 22nd August in southern catchment areas of Ganga and its southern tributaries in association with movement of severe weather system River Ganga flowed in Unprecedented Flood Situation at 4 FF stations namely Ballia in Ballia district of Uttar Pradesh, Patna Gandhighat, Hathidah in Patna district and Bhagalpur in Bhagalpur district of Bihar during 20th to 30th August 2016. 4.2.2 High Flood events
High Flood Situation was witnessed in 17 flood forecasting stations in the rivers Brahmaputra at Dibrugarh, Neamatighat, Tezpur, Goalpara and Dhubri, Kopili at Kampur, River Jia-Bharali at N T Road Crossing, River Beki at Road Bridge and River Sankosh at Golokganj in Assam, River Sone at Maner, River Ganga at Patna Dighaghat, Kahalgaon, River Burhi Gandak at Khagaria, River Kosi at Kursela, River Mahananda at Jhawa in Bihar, River Ganga at Ghazipur, River Rapti at Balrampur during designated Flood Season 2016.
River Desang at Nanglamoraghat flowed in High Flood Situation during April 2016 which was pre-flood season in association with very heavy rainfall during last week of April 2016.
4.2.3 Moderate to Low flood events and inflow forecasts
Moderate to low flood events were witnessed in 89 stations and inflow forecasts were issued in 40 Stations.
4.2.4 No Forecasts
No flood forecasts were issued at 49 flood forecast stations (41 level and 8inflow) as they did not cross warning level or flows above criteria in case of inflow forecasts.
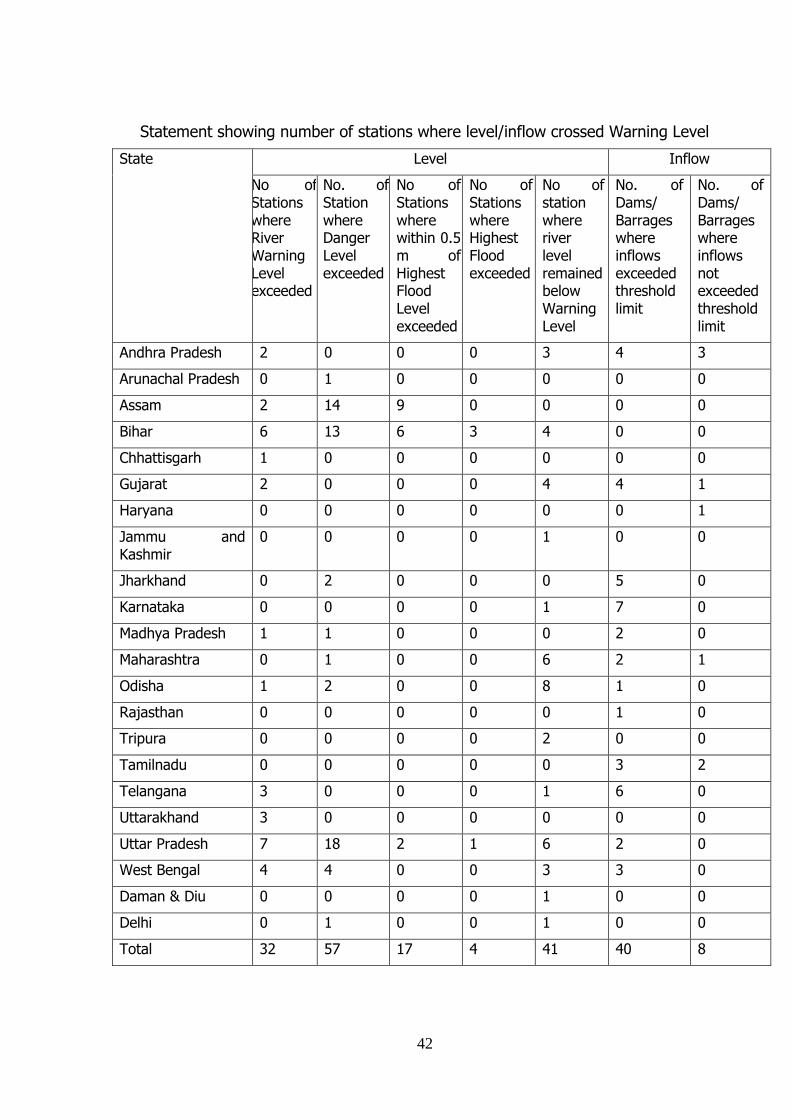
42
Statement showing number of stations where level/inflow crossed Warning Level
State Level Inflow
No of Stations where River Warning Level exceeded
No. of Station where Danger Level exceeded
No of Stations where within 0.5 m of Highest Flood Level exceeded
No of Stations where Highest Flood exceeded
No of station where river level remained below Warning Level
No. of Dams/ Barrages where inflows exceeded threshold limit
No. of Dams/ Barrages where inflows not exceeded threshold limit
Andhra Pradesh 2 0 0 0 3 4 3
Arunachal Pradesh 0 1 0 0 0 0 0
Assam 2 14 9 0 0 0 0
Bihar 6 13 6 3 4 0 0
Chhattisgarh 1 0 0 0 0 0 0
Gujarat 2 0 0 0 4 4 1
Haryana 0 0 0 0 0 0 1
Jammu and Kashmir
0 0 0 0 1 0 0
Jharkhand 0 2 0 0 0 5 0
Karnataka 0 0 0 0 1 7 0
Madhya Pradesh 1 1 0 0 0 2 0
Maharashtra 0 1 0 0 6 2 1
Odisha 1 2 0 0 8 1 0
Rajasthan 0 0 0 0 0 1 0
Tripura 0 0 0 0 2 0 0
Tamilnadu 0 0 0 0 0 3 2
Telangana 3 0 0 0 1 6 0
Uttarakhand 3 0 0 0 0 0 0
Uttar Pradesh 7 18 2 1 6 2 0
West Bengal 4 4 0 0 3 3 0
Daman & Diu 0 0 0 0 1 0 0
Delhi 0 1 0 0 1 0 0
Total 32 57 17 4 41 40 8
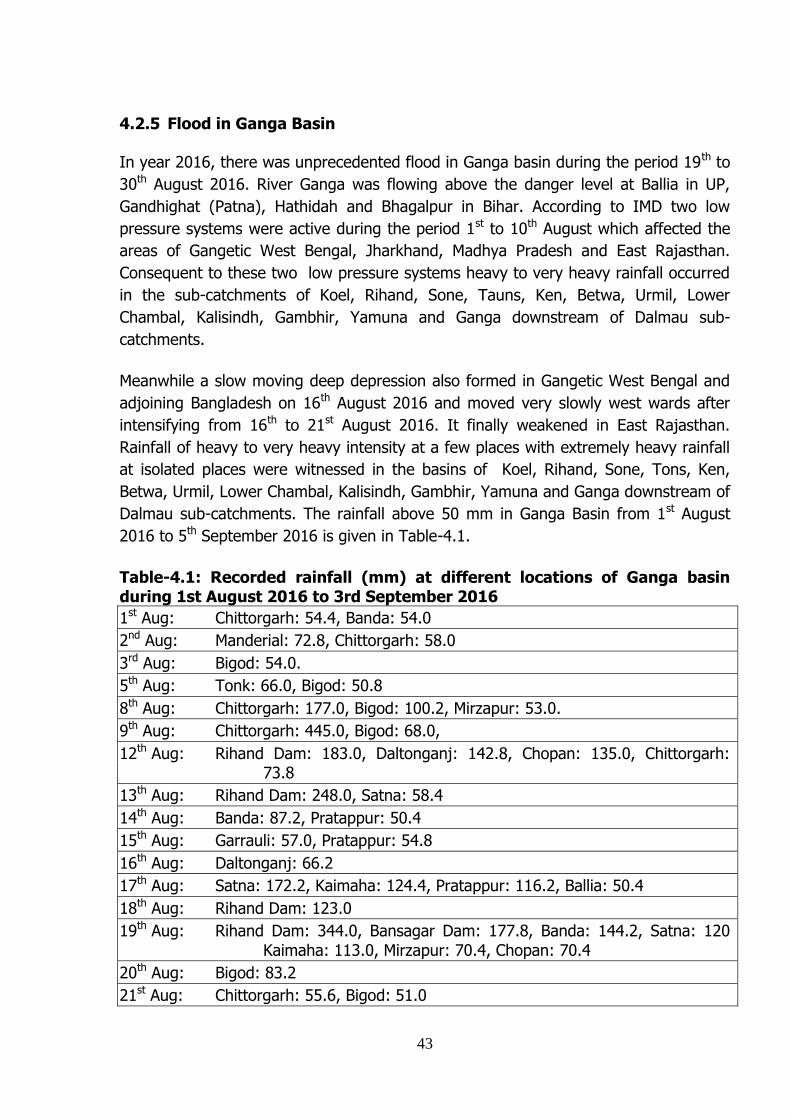
43
4.2.5 Flood in Ganga Basin In year 2016, there was unprecedented flood in Ganga basin during the period 19th to
30th August 2016. River Ganga was flowing above the danger level at Ballia in UP,
Gandhighat (Patna), Hathidah and Bhagalpur in Bihar. According to IMD two low
pressure systems were active during the period 1st to 10th August which affected the
areas of Gangetic West Bengal, Jharkhand, Madhya Pradesh and East Rajasthan.
Consequent to these two low pressure systems heavy to very heavy rainfall occurred
in the sub-catchments of Koel, Rihand, Sone, Tauns, Ken, Betwa, Urmil, Lower
Chambal, Kalisindh, Gambhir, Yamuna and Ganga downstream of Dalmau sub-
catchments.
Meanwhile a slow moving deep depression also formed in Gangetic West Bengal and
adjoining Bangladesh on 16th August 2016 and moved very slowly west wards after
intensifying from 16th to 21st August 2016. It finally weakened in East Rajasthan.
Rainfall of heavy to very heavy intensity at a few places with extremely heavy rainfall
at isolated places were witnessed in the basins of Koel, Rihand, Sone, Tons, Ken,
Betwa, Urmil, Lower Chambal, Kalisindh, Gambhir, Yamuna and Ganga downstream of
Dalmau sub-catchments. The rainfall above 50 mm in Ganga Basin from 1st August
2016 to 5th September 2016 is given in Table-4.1.
Table-4.1: Recorded rainfall (mm) at different locations of Ganga basin during 1st August 2016 to 3rd September 2016
1st Aug: Chittorgarh: 54.4, Banda: 54.0
2nd Aug: Manderial: 72.8, Chittorgarh: 58.0
3rd Aug: Bigod: 54.0.
5th Aug: Tonk: 66.0, Bigod: 50.8
8th Aug: Chittorgarh: 177.0, Bigod: 100.2, Mirzapur: 53.0.
9th Aug: Chittorgarh: 445.0, Bigod: 68.0,
12th Aug: Rihand Dam: 183.0, Daltonganj: 142.8, Chopan: 135.0, Chittorgarh: 73.8
13th Aug: Rihand Dam: 248.0, Satna: 58.4
14th Aug: Banda: 87.2, Pratappur: 50.4
15th Aug: Garrauli: 57.0, Pratappur: 54.8
16th Aug: Daltonganj: 66.2
17th Aug: Satna: 172.2, Kaimaha: 124.4, Pratappur: 116.2, Ballia: 50.4
18th Aug: Rihand Dam: 123.0
19th Aug: Rihand Dam: 344.0, Bansagar Dam: 177.8, Banda: 144.2, Satna: 120
Kaimaha: 113.0, Mirzapur: 70.4, Chopan: 70.4
20th Aug: Bigod: 83.2
21st Aug: Chittorgarh: 55.6, Bigod: 51.0
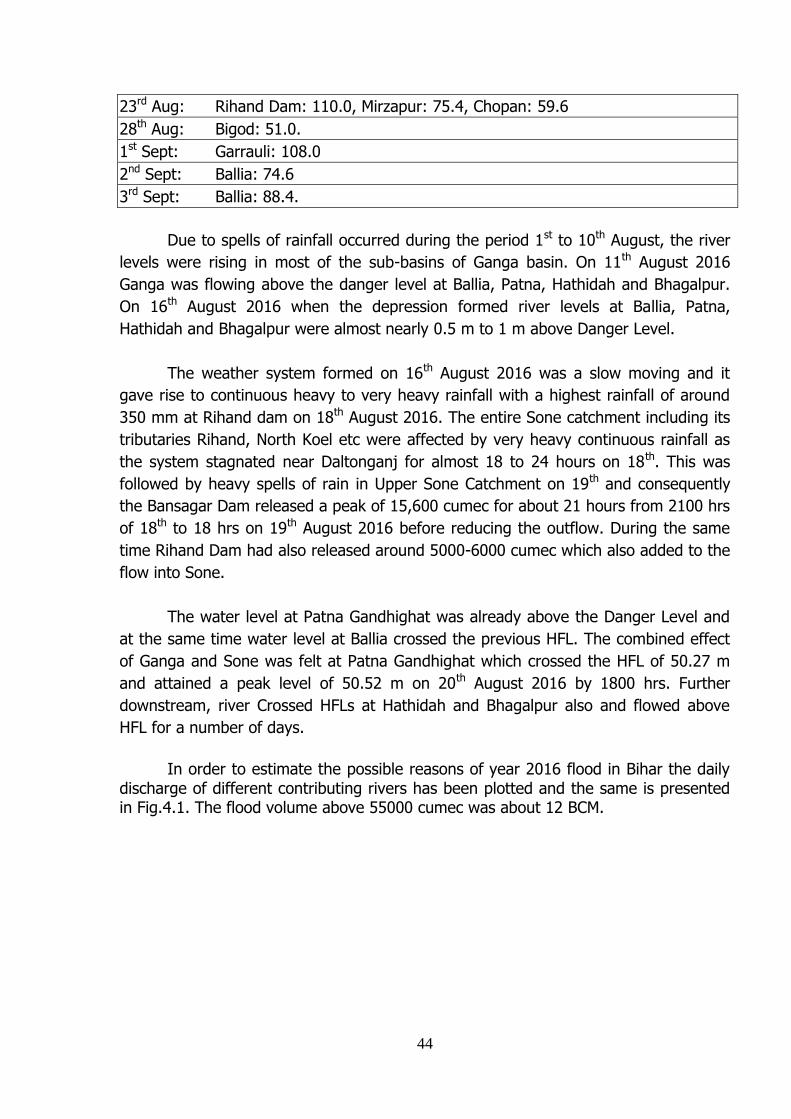
44
23rd Aug: Rihand Dam: 110.0, Mirzapur: 75.4, Chopan: 59.6
28th Aug: Bigod: 51.0.
1st Sept: Garrauli: 108.0
2nd Sept: Ballia: 74.6
3rd Sept: Ballia: 88.4.
Due to spells of rainfall occurred during the period 1st to 10th August, the river
levels were rising in most of the sub-basins of Ganga basin. On 11th August 2016
Ganga was flowing above the danger level at Ballia, Patna, Hathidah and Bhagalpur.
On 16th August 2016 when the depression formed river levels at Ballia, Patna,
Hathidah and Bhagalpur were almost nearly 0.5 m to 1 m above Danger Level.
The weather system formed on 16th August 2016 was a slow moving and it
gave rise to continuous heavy to very heavy rainfall with a highest rainfall of around
350 mm at Rihand dam on 18th August 2016. The entire Sone catchment including its
tributaries Rihand, North Koel etc were affected by very heavy continuous rainfall as
the system stagnated near Daltonganj for almost 18 to 24 hours on 18th. This was
followed by heavy spells of rain in Upper Sone Catchment on 19th and consequently
the Bansagar Dam released a peak of 15,600 cumec for about 21 hours from 2100 hrs
of 18th to 18 hrs on 19th August 2016 before reducing the outflow. During the same
time Rihand Dam had also released around 5000-6000 cumec which also added to the
flow into Sone.
The water level at Patna Gandhighat was already above the Danger Level and
at the same time water level at Ballia crossed the previous HFL. The combined effect
of Ganga and Sone was felt at Patna Gandhighat which crossed the HFL of 50.27 m
and attained a peak level of 50.52 m on 20th August 2016 by 1800 hrs. Further
downstream, river Crossed HFLs at Hathidah and Bhagalpur also and flowed above
HFL for a number of days.
In order to estimate the possible reasons of year 2016 flood in Bihar the daily
discharge of different contributing rivers has been plotted and the same is presented in Fig.4.1. The flood volume above 55000 cumec was about 12 BCM.
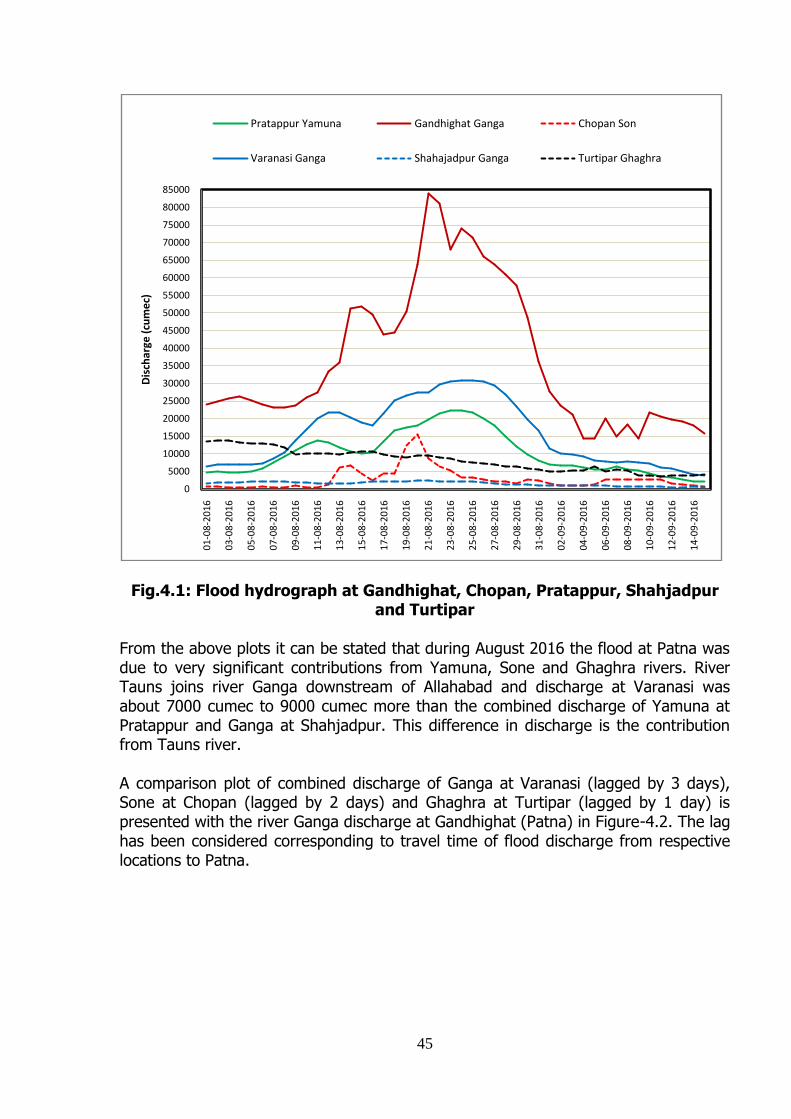
45
Fig.4.1: Flood hydrograph at Gandhighat, Chopan, Pratappur, Shahjadpur and Turtipar
From the above plots it can be stated that during August 2016 the flood at Patna was due to very significant contributions from Yamuna, Sone and Ghaghra rivers. River Tauns joins river Ganga downstream of Allahabad and discharge at Varanasi was about 7000 cumec to 9000 cumec more than the combined discharge of Yamuna at Pratappur and Ganga at Shahjadpur. This difference in discharge is the contribution from Tauns river. A comparison plot of combined discharge of Ganga at Varanasi (lagged by 3 days), Sone at Chopan (lagged by 2 days) and Ghaghra at Turtipar (lagged by 1 day) is presented with the river Ganga discharge at Gandhighat (Patna) in Figure-4.2. The lag has been considered corresponding to travel time of flood discharge from respective locations to Patna.
0
5000
10000
15000
20000
25000
30000
35000
40000
45000
50000
55000
60000
65000
70000
75000
80000
85000
01
-08
-20
16
03
-08
-20
16
05
-08
-20
16
07
-08
-20
16
09
-08
-20
16
11
-08
-20
16
13
-08
-20
16
15
-08
-20
16
17
-08
-20
16
19
-08
-20
16
21
-08
-20
16
23
-08
-20
16
25
-08
-20
16
27
-08
-20
16
29
-08
-20
16
31
-08
-20
16
02
-09
-20
16
04
-09
-20
16
06
-09
-20
16
08
-09
-20
16
10
-09
-20
16
12
-09
-20
16
14
-09
-20
16
Dis
char
ge (
cum
ec)
Pratappur Yamuna Gandhighat Ganga Chopan Son
Varanasi Ganga Shahajadpur Ganga Turtipar Ghaghra
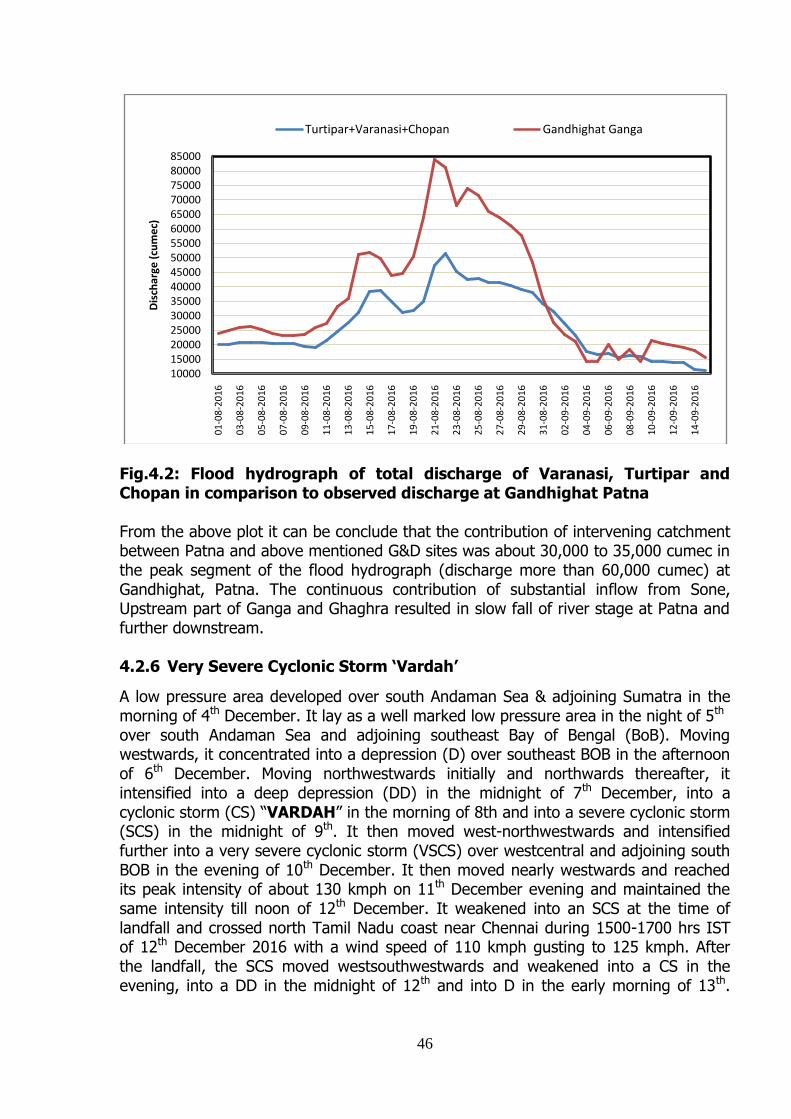
46
Fig.4.2: Flood hydrograph of total discharge of Varanasi, Turtipar and Chopan in comparison to observed discharge at Gandhighat Patna From the above plot it can be conclude that the contribution of intervening catchment between Patna and above mentioned G&D sites was about 30,000 to 35,000 cumec in the peak segment of the flood hydrograph (discharge more than 60,000 cumec) at Gandhighat, Patna. The continuous contribution of substantial inflow from Sone, Upstream part of Ganga and Ghaghra resulted in slow fall of river stage at Patna and further downstream. 4.2.6 Very Severe Cyclonic Storm „Vardah‟
A low pressure area developed over south Andaman Sea & adjoining Sumatra in the morning of 4th December. It lay as a well marked low pressure area in the night of 5th over south Andaman Sea and adjoining southeast Bay of Bengal (BoB). Moving westwards, it concentrated into a depression (D) over southeast BOB in the afternoon of 6th December. Moving northwestwards initially and northwards thereafter, it intensified into a deep depression (DD) in the midnight of 7th December, into a cyclonic storm (CS) “VARDAH” in the morning of 8th and into a severe cyclonic storm (SCS) in the midnight of 9th. It then moved west-northwestwards and intensified further into a very severe cyclonic storm (VSCS) over westcentral and adjoining south BOB in the evening of 10th December. It then moved nearly westwards and reached its peak intensity of about 130 kmph on 11th December evening and maintained the same intensity till noon of 12th December. It weakened into an SCS at the time of landfall and crossed north Tamil Nadu coast near Chennai during 1500-1700 hrs IST of 12th December 2016 with a wind speed of 110 kmph gusting to 125 kmph. After the landfall, the SCS moved westsouthwestwards and weakened into a CS in the evening, into a DD in the midnight of 12th and into D in the early morning of 13th.
10000150002000025000300003500040000450005000055000600006500070000750008000085000
01
-08
-20
16
03
-08
-20
16
05
-08
-20
16
07
-08
-20
16
09
-08
-20
16
11
-08
-20
16
13
-08
-20
16
15
-08
-20
16
17
-08
-20
16
19
-08
-20
16
21
-08
-20
16
23
-08
-20
16
25
-08
-20
16
27
-08
-20
16
29
-08
-20
16
31
-08
-20
16
02
-09
-20
16
04
-09
-20
16
06
-09
-20
16
08
-09
-20
16
10
-09
-20
16
12
-09
-20
16
14
-09
-20
16
Dis
char
ge (
cum
ec)
Turtipar+Varanasi+Chopan Gandhighat Ganga
47
Continuing its west-southwestwards movement, it weakened into a well marked low pressure area in the forenoon of 13th December. The salient features of the system are as follows. (i) It was the first severe cyclonic storm of the year 2016. (ii) Vardah was the fourth consecutive cyclone with recurving track after cyclones Roanu, Kyant and Nada during the year, as it changed its track from initial northwards movement to west-northwestwards and then west-southwestwards after landfall. (iii) Unlike the previous two cyclones in the post-monsoon season, it crossed the coast with the cyclone intensity. (iv) The peak maximum sustained wind speed of the cyclone was 130 kmph gusting to 145 kmph over westcentral BOB. However, the maximum sustained wind speed of the cyclone was 110 kmph gusting to 125 kmph at the time of landfall. (v) The life period of cyclone was 159 hours (6.6 days) against the normal of 4.7 days over north Indian Ocean during post-monsoon season for VSCS category. (vi) The track length of the cyclone was 1795 km. (vii) The 12 hour average translational speed of the cyclone was 5.2 kmph against normal of 13 kmph over BOB for post-monsoon season. However, prior to landfall, the cyclone moved with a speed of about 15-20 kmph. (viii) Lowest estimated central pressure (ECP) was 975.0 hPa with a pressure drop of 26 hPa. (ix) The Accumulated Cyclone Energy (ACE) which is a measure of damage potential was about 5.99 X 10⁴ knot2. (x) The Power Dissipation Index which is a measure of loss due to a CS was 3.61 X 10⁶ knot3. (xi) There was rapid weakening of the system from 0600 to 1800 UTC of 12th Dec as the maximum sustained wind speed decreased from 70 knots to 30 knots during this period. (xii) During genesis stage cyclone Vardah caused heavy to very heavy rainfall over Andaman & Nicobar Islands and squally wind speed reaching 50-60 kmph prevailed along and off Andaman & Nicobar Islands. (xiii) It caused heavy to very heavy rainfall at many places with isolated extremely heavy rainfall over Chennai, Thiruvallur, Kanchipuram districts of Tamil Nadu and heavy to very heavy rainfall at a few places over Nellore district of Andhra Pradesh
48
The maximum gale wind of about 100-110 kmph gusting to 125 kmph has been reported in these districts. Chief Amounts of Rainfall on 13th December 2016 in Tamilnadu and Andhra Pradesh (in cm) is given as Under: Tamilnadu Satyabama University (Kanchipuram)-38, Kattukuppam (Kanchipuram)-34, Kanchipuram (Kanchipuram)-28, Kalavai (Vellore)-23, Poonamallee (Thiruvallur)-22, Chembarabakkam (Thiruvallur)-21, Meenambakkam-20, Sriperumbudur (Kanchipuram)- 17, Chembarabakkam (Thiruvallur)-16, Yercaud (Salem)-15, Alangayam (Vellore)-15, Tambaram (Kanchipuram)-14, Nungambakkam-12, Vellore-11, Melalathur (Vellore)-9, Tirppattur-8, Poondi (Thiruvallur)-9, Mahabalipuram (Kanchipuram), Uthiramerur (Kanchipuram), Tirupattur (Vellore), Maduranthagam (Kanchipuram), Krishnagiri (Krishnagiri), Shoolagiri (Krishnagiri), Hosur (Krishnagiri), Vandavasi (Tiruvannamalai), Marakkanam (Villupraum), Vaniyambadi (Vellore), Gudiyatham (Vellore) and Cheyyur (Kanchipuram) -7 each
Andhra Pradesh: Atmakur (Nellore) 13, Vinjamur (Nellore) 12, Udayagiri (Nellore) 11, Sullurpeta (Nellore) 9, Kandukur (Prakasam) 9, Kavali (Nellore) 8, Nellore (Nellore) 8, Veligandla ( Prakasam) 8, Rapur (Nellore) 7, Gudur (Nellore) 7, Venkatagiri (Nellore) 7, Shar ( Nellore) 7, Tirumalla (Chittoor) 15, Puttur (Chittoor) 14, Nagari (Chittoor) 12, Chittoor 10, Kodur (Cuddapah) 10, Satyavedu (Chittoor) 10, Venkatagiri Kota (Chittoor) 9, Palasamudram (Chittoor) 9, Nambulipulikunta (Anantapur) 7, Thottambedu (Chittoor) 7, Tirupati Aero (Chittoor) 7, Atlur (Cuddapah) 7, Rajamet (Cuddapah) 7, Mandapalle (Chittoor) 7, Kuppam (Chittoor) 7, Pakala (Chittoor) 7, Sambepalle (Cuddapah) 7, Royachoti (Cuddapah) 7. (xiv) The maximum storm surge of about 1 meter inundated low lying areas of Chennai, Thiruvallur districts of Tamil Nadu and Nellore district of Andhra Pradesh at the time of landfall. 4.2.6.1 Hydrological Situation in association with Vardah
In spite of the heavy to very heavy rainfall with isolated extremely heavy rainfall in the catchment areas of Chembarampakkam Lake as the reservoir level was very low, no major flooding occurred during the passage of Vardah in Chennai city. An advisory forecast indicating the unlikelihood of flood was issued to all concerned beneficiaries during the above period. Advisory inflow forecasts for Poondi Satyamurthy Reservoir and Chembarampakkam Lake in Thiruvallur district of Tamilnadu was also issued during the above period. River Palar at Chengalpattu an Hydrological Observation Station maintained by Central Water Commission in Kanchipuram district also flowed very near to High Flood Situation.
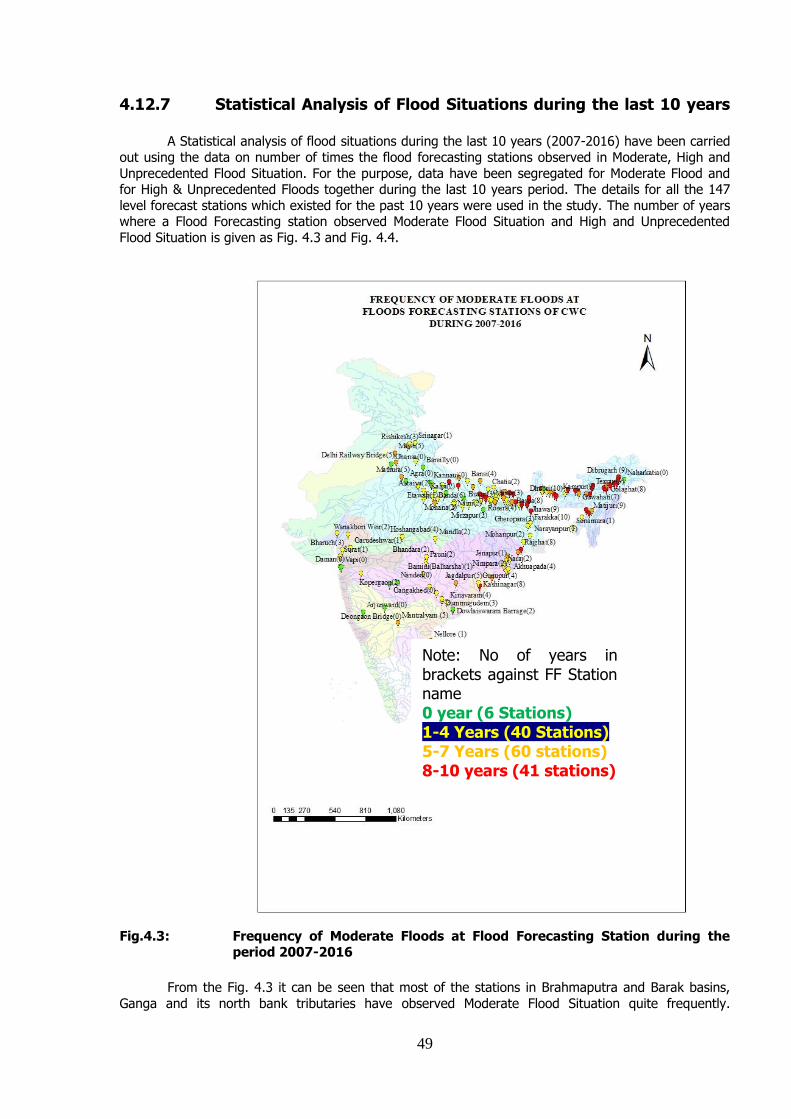
49
4.12.7 Statistical Analysis of Flood Situations during the last 10 years
A Statistical analysis of flood situations during the last 10 years (2007-2016) have been carried
out using the data on number of times the flood forecasting stations observed in Moderate, High and
Unprecedented Flood Situation. For the purpose, data have been segregated for Moderate Flood and for High & Unprecedented Floods together during the last 10 years period. The details for all the 147
level forecast stations which existed for the past 10 years were used in the study. The number of years where a Flood Forecasting station observed Moderate Flood Situation and High and Unprecedented
Flood Situation is given as Fig. 4.3 and Fig. 4.4.
Fig.4.3: Frequency of Moderate Floods at Flood Forecasting Station during the
period 2007-2016
From the Fig. 4.3 it can be seen that most of the stations in Brahmaputra and Barak basins,
Ganga and its north bank tributaries have observed Moderate Flood Situation quite frequently.
Note: No of years in brackets against FF Station name 0 year (6 Stations) 1-4 Years (40 Stations) 5-7 Years (60 stations) 8-10 years (41 stations)
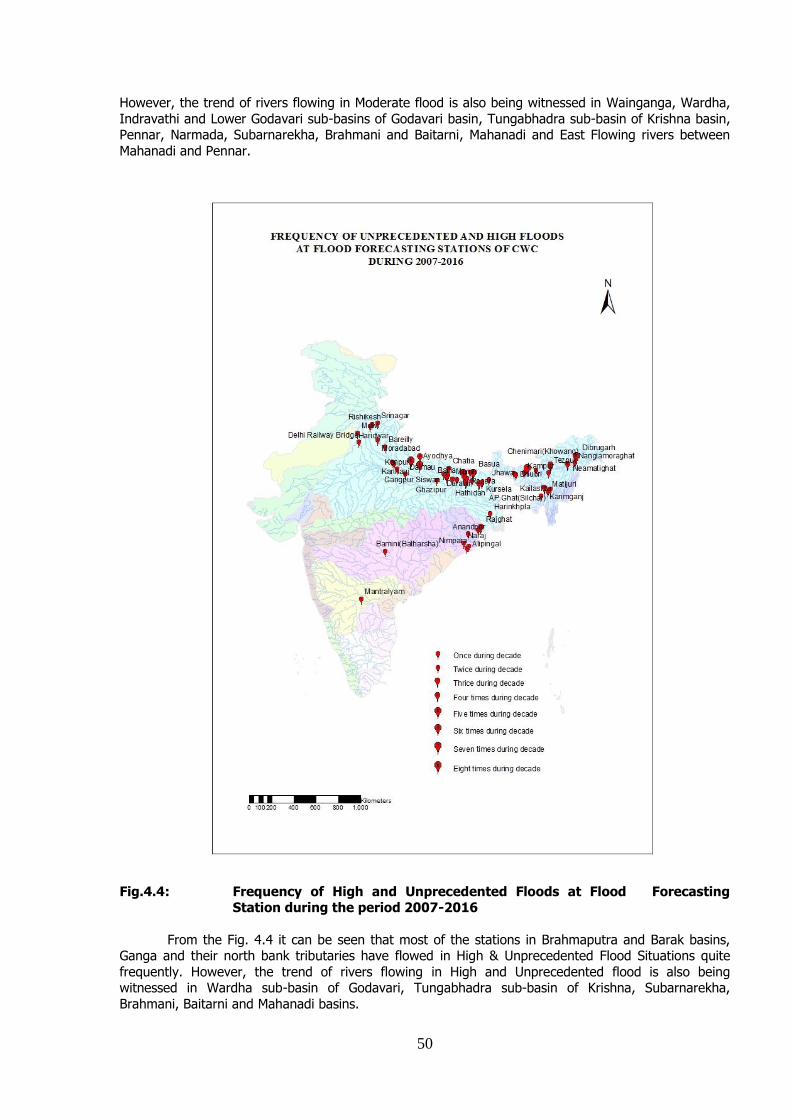
50
However, the trend of rivers flowing in Moderate flood is also being witnessed in Wainganga, Wardha,
Indravathi and Lower Godavari sub-basins of Godavari basin, Tungabhadra sub-basin of Krishna basin, Pennar, Narmada, Subarnarekha, Brahmani and Baitarni, Mahanadi and East Flowing rivers between
Mahanadi and Pennar.
Fig.4.4: Frequency of High and Unprecedented Floods at Flood Forecasting
Station during the period 2007-2016
From the Fig. 4.4 it can be seen that most of the stations in Brahmaputra and Barak basins, Ganga and their north bank tributaries have flowed in High & Unprecedented Flood Situations quite
frequently. However, the trend of rivers flowing in High and Unprecedented flood is also being witnessed in Wardha sub-basin of Godavari, Tungabhadra sub-basin of Krishna, Subarnarekha,
Brahmani, Baitarni and Mahanadi basins.
51
CHAPTER 5
RESPONSE FROM USER AGENCIES
5.1 General
Central Water Commission performs the Flood Forecasting and Warning job on flood prone interstate river basins in the country. It issues the forecast to the users such as various civil and engineering departments of the state and central governments including, railway, defense, revenues authorities, public sector undertakings besides National Disaster Management Cell in the Ministry of Home Affairs, who are responsible for taking timely flood fighting measures, rescue operations including shifting of flood affected people to safer places etc.
Though the various state government agencies in-charge of the flood management and relief operations generally do not give their views in writing on usefulness of the flood forecasting activities of CWC, yet some of them do write to the Central Water Commission conveying their views on the usefulness of the flood forecasts received by them.
5.2 Appreciation letters received during flood season 2016 Abstract of some of the messages received by our field unit during the flood season 2016 are given below:
5.2.1 Additional Commissioner Relief, Ex-Officio Additional Secretary to Government, Revenue & Disaster Management Department (Special Relief), Government of Odisha, Bhubaneswar-751001. Lr. no: 5475/R&DM (SR) dated 01.12.2016
“Inviting reference to the above, I am directed to say that monsoon 2016, CWC has constantly monitored the water level in different major rivers and shared the information with State Emergency Operation Centre every 3 hours. Water Level Forecasts were also received from CWC in High Flood Situations. These helped the Govt. authorities remain updated and prepared to face the flood situation. Suggestion: The flood warning with water levels at the time of floods at different gauge stations of major rivers, no. of sluice gates opened/to be opened and areas to be inundated may be transmitted every hours by WAYSMS to SRC and DRC.”
5.2.2 Office of Engineer-in-Chief, Water Resources, Odisha, Bhubaneshwar, Odisha Lr. No: FC-II-CWC-28/10/41489 dated 26/11/2016.
“I am directed to furnish herewith the utility of flood forecasts as per your letter under reference that the the flood wing of Department of Water Resources dealing with flood problems of State has always sought inputs like flood information and flood warnings to combat the gigantic task of flood control and flood management in all river basins of the state. For the flood 2016, we have received the forecast for different rivers of the State. The same
52
has been distributed to all concerned authorities in time. I feel great to mention here that the availability of such facilities in form of supply of hydro-meteorological information and situation forecast etc (round the clock) from pioneer organisations like CWC & IMD have made it possible time and again to overcome successfully the flood exigencies in time and with better preparedness. As an active user of online data and forecast of CWC, I do express my deep thanks and gratitude to CWC organisation. It is to further request that to make the system little more efficient, consideration to the following points may be given: 1. Some additional forecasting stations in flood prone areas of Odisha are needed. 2. The flood data i.e. river gauges, discharge, flood forecasts and rainfall data etc may please be provided to this office through e-mail service. Our e-mail address is [email protected]
5.2.3 Executive Engineer, R W Division, Supaul, Government of Bihar. Lr. no: 462/ Supaul dated 21.03.2017 (Translated from Hindi Version) On the above subject, it is stated that timely availability of flood forecasting related information and Daily Flood Water Level Report for year 2016 was very useful for flood preparedness related activities. The work done by your office is extremely appreciable.
5.2.4 Executive Engineer, Flood Control Sub Division, Rosera (Samastipur) Letter No. 159, dated 17/03/2017 (translated from Hindi).
On the above subject, it is stated that information provided by your office in respect of water level and flood forecast is very satisfactory and appreciable. Hope that, same cooperation shall continue in future too.

53
ANNEXURES-I to XIII
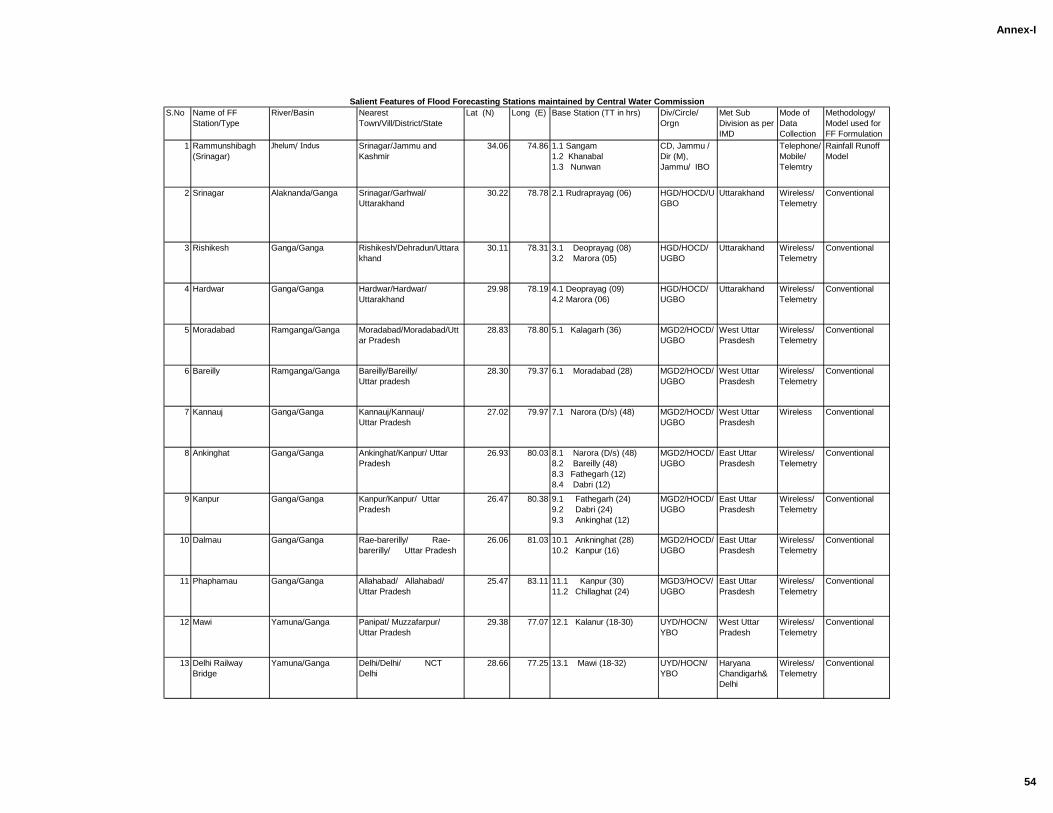
Annex-I
1 Rammunshibagh
(Srinagar)
Jhelum/ Indus Srinagar/Jammu and
Kashmir
34.06 74.86 1.1 Sangam
1.2 Khanabal
1.3 Nunwan
CD, Jammu /
Dir (M),
Jammu/ IBO
Telephone/
Mobile/
Telemtry
Rainfall Runoff
Model
2 Srinagar Alaknanda/Ganga Srinagar/Garhwal/
Uttarakhand
30.22 78.78 2.1 Rudraprayag (06) HGD/HOCD/U
GBO
Uttarakhand Wireless/
Telemetry
Conventional
3 Rishikesh Ganga/Ganga Rishikesh/Dehradun/Uttara
khand
30.11 78.31 3.1 Deoprayag (08)
3.2 Marora (05)
HGD/HOCD/
UGBO
Uttarakhand Wireless/
Telemetry
Conventional
4 Hardwar Ganga/Ganga Hardwar/Hardwar/
Uttarakhand
29.98 78.19 4.1 Deoprayag (09)
4.2 Marora (06)
HGD/HOCD/
UGBO
Uttarakhand Wireless/
Telemetry
Conventional
5 Moradabad Ramganga/Ganga Moradabad/Moradabad/Utt
ar Pradesh
28.83 78.80 5.1 Kalagarh (36) MGD2/HOCD/
UGBO
West Uttar
Prasdesh
Wireless/
Telemetry
Conventional
6 Bareilly Ramganga/Ganga Bareilly/Bareilly/
Uttar pradesh
28.30 79.37 6.1 Moradabad (28) MGD2/HOCD/
UGBO
West Uttar
Prasdesh
Wireless/
Telemetry
Conventional
7 Kannauj Ganga/Ganga Kannauj/Kannauj/
Uttar Pradesh
27.02 79.97 7.1 Narora (D/s) (48) MGD2/HOCD/
UGBO
West Uttar
Prasdesh
Wireless Conventional
8 Ankinghat Ganga/Ganga Ankinghat/Kanpur/ Uttar
Pradesh
26.93 80.03 8.1 Narora (D/s) (48)
8.2 Bareilly (48)
8.3 Fathegarh (12)
8.4 Dabri (12)
MGD2/HOCD/
UGBO
East Uttar
Prasdesh
Wireless/
Telemetry
Conventional
9 Kanpur Ganga/Ganga Kanpur/Kanpur/ Uttar
Pradesh
26.47 80.38 9.1 Fathegarh (24)
9.2 Dabri (24)
9.3 Ankinghat (12)
MGD2/HOCD/
UGBO
East Uttar
Prasdesh
Wireless/
Telemetry
Conventional
10 Dalmau Ganga/Ganga Rae-barerilly/ Rae-
barerilly/ Uttar Pradesh
26.06 81.03 10.1 Ankninghat (28)
10.2 Kanpur (16)
MGD2/HOCD/
UGBO
East Uttar
Prasdesh
Wireless/
Telemetry
Conventional
11 Phaphamau Ganga/Ganga Allahabad/ Allahabad/
Uttar Pradesh
25.47 83.11 11.1 Kanpur (30)
11.2 Chillaghat (24)
MGD3/HOCV/
UGBO
East Uttar
Prasdesh
Wireless/
Telemetry
Conventional
12 Mawi Yamuna/Ganga Panipat/ Muzzafarpur/
Uttar Pradesh
29.38 77.07 12.1 Kalanur (18-30) UYD/HOCN/
YBO
West Uttar
Pradesh
Wireless/
Telemetry
Conventional
13 Delhi Railway
Bridge
Yamuna/Ganga Delhi/Delhi/ NCT
Delhi
28.66 77.25 13.1 Mawi (18-32) UYD/HOCN/
YBO
Haryana
Chandigarh&
Delhi
Wireless/
Telemetry
Conventional
Salient Features of Flood Forecasting Stations maintained by Central Water Commission
S.No Name of FF
Station/Type
River/Basin Nearest
Town/Vill/District/State
Lat (N) Long (E) Base Station (TT in hrs) Div/Circle/
Orgn
Met Sub
Division as per
IMD
Mode of
Data
Collection
Methodology/
Model used for
FF Formulation
54
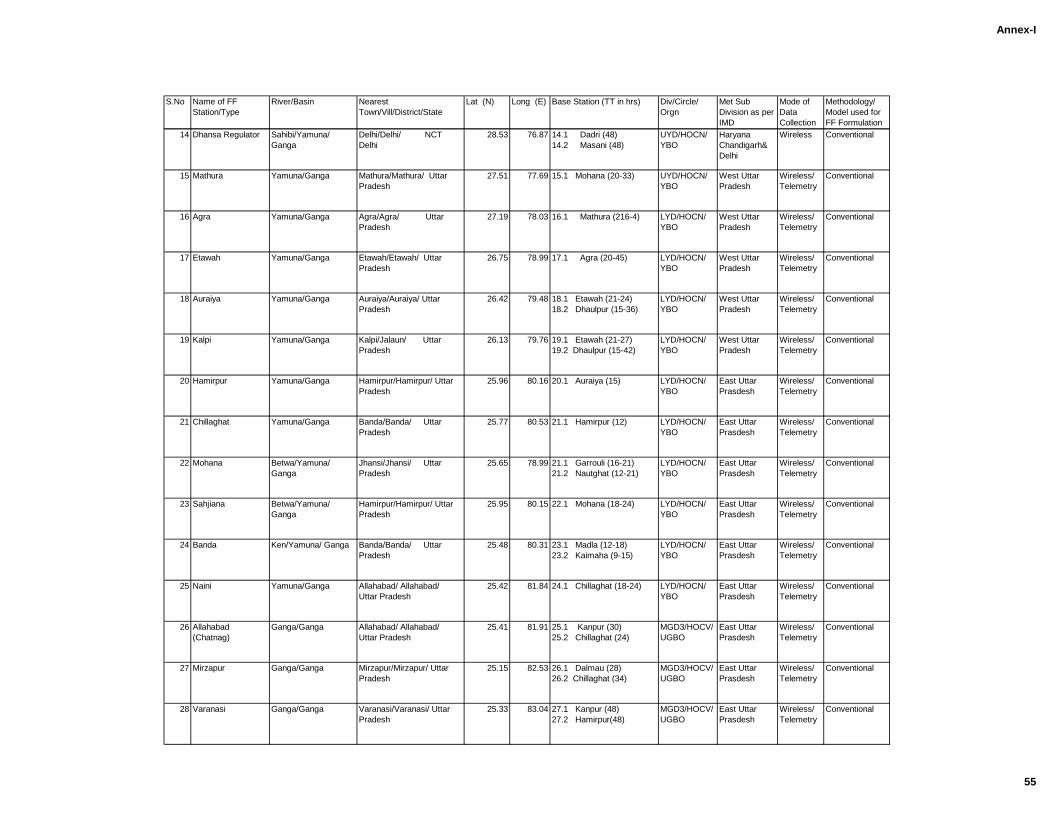
Annex-I
S.No Name of FF
Station/Type
River/Basin Nearest
Town/Vill/District/State
Lat (N) Long (E) Base Station (TT in hrs) Div/Circle/
Orgn
Met Sub
Division as per
IMD
Mode of
Data
Collection
Methodology/
Model used for
FF Formulation
14 Dhansa Regulator Sahibi/Yamuna/
Ganga
Delhi/Delhi/ NCT
Delhi
28.53 76.87 14.1 Dadri (48)
14.2 Masani (48)
UYD/HOCN/
YBO
Haryana
Chandigarh&
Delhi
Wireless Conventional
15 Mathura Yamuna/Ganga Mathura/Mathura/ Uttar
Pradesh
27.51 77.69 15.1 Mohana (20-33) UYD/HOCN/
YBO
West Uttar
Pradesh
Wireless/
Telemetry
Conventional
16 Agra Yamuna/Ganga Agra/Agra/ Uttar
Pradesh
27.19 78.03 16.1 Mathura (216-4) LYD/HOCN/
YBO
West Uttar
Pradesh
Wireless/
Telemetry
Conventional
17 Etawah Yamuna/Ganga Etawah/Etawah/ Uttar
Pradesh
26.75 78.99 17.1 Agra (20-45) LYD/HOCN/
YBO
West Uttar
Pradesh
Wireless/
Telemetry
Conventional
18 Auraiya Yamuna/Ganga Auraiya/Auraiya/ Uttar
Pradesh
26.42 79.48 18.1 Etawah (21-24)
18.2 Dhaulpur (15-36)
LYD/HOCN/
YBO
West Uttar
Pradesh
Wireless/
Telemetry
Conventional
19 Kalpi Yamuna/Ganga Kalpi/Jalaun/ Uttar
Pradesh
26.13 79.76 19.1 Etawah (21-27)
19.2 Dhaulpur (15-42)
LYD/HOCN/
YBO
West Uttar
Pradesh
Wireless/
Telemetry
Conventional
20 Hamirpur Yamuna/Ganga Hamirpur/Hamirpur/ Uttar
Pradesh
25.96 80.16 20.1 Auraiya (15) LYD/HOCN/
YBO
East Uttar
Prasdesh
Wireless/
Telemetry
Conventional
21 Chillaghat Yamuna/Ganga Banda/Banda/ Uttar
Pradesh
25.77 80.53 21.1 Hamirpur (12) LYD/HOCN/
YBO
East Uttar
Prasdesh
Wireless/
Telemetry
Conventional
22 Mohana Betwa/Yamuna/
Ganga
Jhansi/Jhansi/ Uttar
Pradesh
25.65 78.99 21.1 Garrouli (16-21)
21.2 Nautghat (12-21)
LYD/HOCN/
YBO
East Uttar
Prasdesh
Wireless/
Telemetry
Conventional
23 Sahjiana Betwa/Yamuna/
Ganga
Hamirpur/Hamirpur/ Uttar
Pradesh
25.95 80.15 22.1 Mohana (18-24) LYD/HOCN/
YBO
East Uttar
Prasdesh
Wireless/
Telemetry
Conventional
24 Banda Ken/Yamuna/ Ganga Banda/Banda/ Uttar
Pradesh
25.48 80.31 23.1 Madla (12-18)
23.2 Kaimaha (9-15)
LYD/HOCN/
YBO
East Uttar
Prasdesh
Wireless/
Telemetry
Conventional
25 Naini Yamuna/Ganga Allahabad/ Allahabad/
Uttar Pradesh
25.42 81.84 24.1 Chillaghat (18-24) LYD/HOCN/
YBO
East Uttar
Prasdesh
Wireless/
Telemetry
Conventional
26 Allahabad
(Chatnag)
Ganga/Ganga Allahabad/ Allahabad/
Uttar Pradesh
25.41 81.91 25.1 Kanpur (30)
25.2 Chillaghat (24)
MGD3/HOCV/
UGBO
East Uttar
Prasdesh
Wireless/
Telemetry
Conventional
27 Mirzapur Ganga/Ganga Mirzapur/Mirzapur/ Uttar
Pradesh
25.15 82.53 26.1 Dalmau (28)
26.2 Chillaghat (34)
MGD3/HOCV/
UGBO
East Uttar
Prasdesh
Wireless/
Telemetry
Conventional
28 Varanasi Ganga/Ganga Varanasi/Varanasi/ Uttar
Pradesh
25.33 83.04 27.1 Kanpur (48)
27.2 Hamirpur(48)
MGD3/HOCV/
UGBO
East Uttar
Prasdesh
Wireless/
Telemetry
Conventional
55
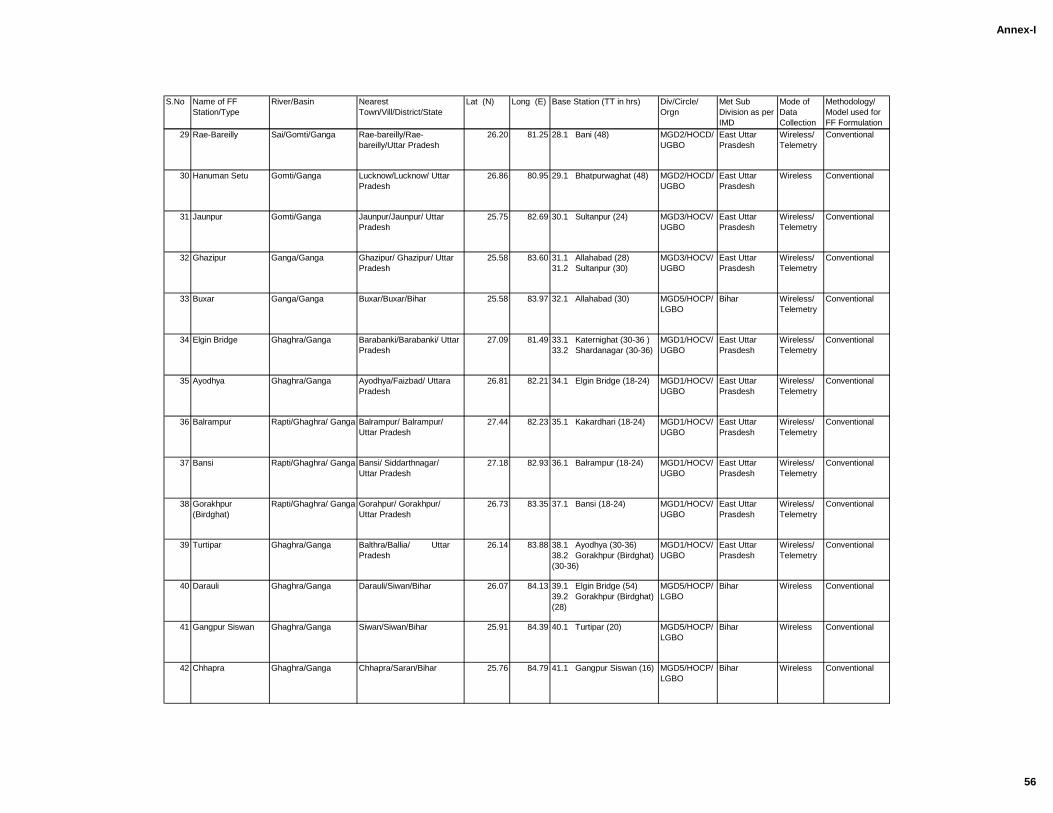
Annex-I
S.No Name of FF
Station/Type
River/Basin Nearest
Town/Vill/District/State
Lat (N) Long (E) Base Station (TT in hrs) Div/Circle/
Orgn
Met Sub
Division as per
IMD
Mode of
Data
Collection
Methodology/
Model used for
FF Formulation
29 Rae-Bareilly Sai/Gomti/Ganga Rae-bareilly/Rae-
bareilly/Uttar Pradesh
26.20 81.25 28.1 Bani (48) MGD2/HOCD/
UGBO
East Uttar
Prasdesh
Wireless/
Telemetry
Conventional
30 Hanuman Setu Gomti/Ganga Lucknow/Lucknow/ Uttar
Pradesh
26.86 80.95 29.1 Bhatpurwaghat (48) MGD2/HOCD/
UGBO
East Uttar
Prasdesh
Wireless Conventional
31 Jaunpur Gomti/Ganga Jaunpur/Jaunpur/ Uttar
Pradesh
25.75 82.69 30.1 Sultanpur (24) MGD3/HOCV/
UGBO
East Uttar
Prasdesh
Wireless/
Telemetry
Conventional
32 Ghazipur Ganga/Ganga Ghazipur/ Ghazipur/ Uttar
Pradesh
25.58 83.60 31.1 Allahabad (28)
31.2 Sultanpur (30)
MGD3/HOCV/
UGBO
East Uttar
Prasdesh
Wireless/
Telemetry
Conventional
33 Buxar Ganga/Ganga Buxar/Buxar/Bihar 25.58 83.97 32.1 Allahabad (30) MGD5/HOCP/
LGBO
Bihar Wireless/
Telemetry
Conventional
34 Elgin Bridge Ghaghra/Ganga Barabanki/Barabanki/ Uttar
Pradesh
27.09 81.49 33.1 Katernighat (30-36 )
33.2 Shardanagar (30-36)
MGD1/HOCV/
UGBO
East Uttar
Prasdesh
Wireless/
Telemetry
Conventional
35 Ayodhya Ghaghra/Ganga Ayodhya/Faizbad/ Uttara
Pradesh
26.81 82.21 34.1 Elgin Bridge (18-24) MGD1/HOCV/
UGBO
East Uttar
Prasdesh
Wireless/
Telemetry
Conventional
36 Balrampur Rapti/Ghaghra/ Ganga Balrampur/ Balrampur/
Uttar Pradesh
27.44 82.23 35.1 Kakardhari (18-24) MGD1/HOCV/
UGBO
East Uttar
Prasdesh
Wireless/
Telemetry
Conventional
37 Bansi Rapti/Ghaghra/ Ganga Bansi/ Siddarthnagar/
Uttar Pradesh
27.18 82.93 36.1 Balrampur (18-24) MGD1/HOCV/
UGBO
East Uttar
Prasdesh
Wireless/
Telemetry
Conventional
38 Gorakhpur
(Birdghat)
Rapti/Ghaghra/ Ganga Gorahpur/ Gorakhpur/
Uttar Pradesh
26.73 83.35 37.1 Bansi (18-24) MGD1/HOCV/
UGBO
East Uttar
Prasdesh
Wireless/
Telemetry
Conventional
39 Turtipar Ghaghra/Ganga Balthra/Ballia/ Uttar
Pradesh
26.14 83.88 38.1 Ayodhya (30-36)
38.2 Gorakhpur (Birdghat)
(30-36)
MGD1/HOCV/
UGBO
East Uttar
Prasdesh
Wireless/
Telemetry
Conventional
40 Darauli Ghaghra/Ganga Darauli/Siwan/Bihar 26.07 84.13 39.1 Elgin Bridge (54)
39.2 Gorakhpur (Birdghat)
(28)
MGD5/HOCP/
LGBO
Bihar Wireless Conventional
41 Gangpur Siswan Ghaghra/Ganga Siwan/Siwan/Bihar 25.91 84.39 40.1 Turtipar (20) MGD5/HOCP/
LGBO
Bihar Wireless Conventional
42 Chhapra Ghaghra/Ganga Chhapra/Saran/Bihar 25.76 84.79 41.1 Gangpur Siswan (16) MGD5/HOCP/
LGBO
Bihar Wireless Conventional
56
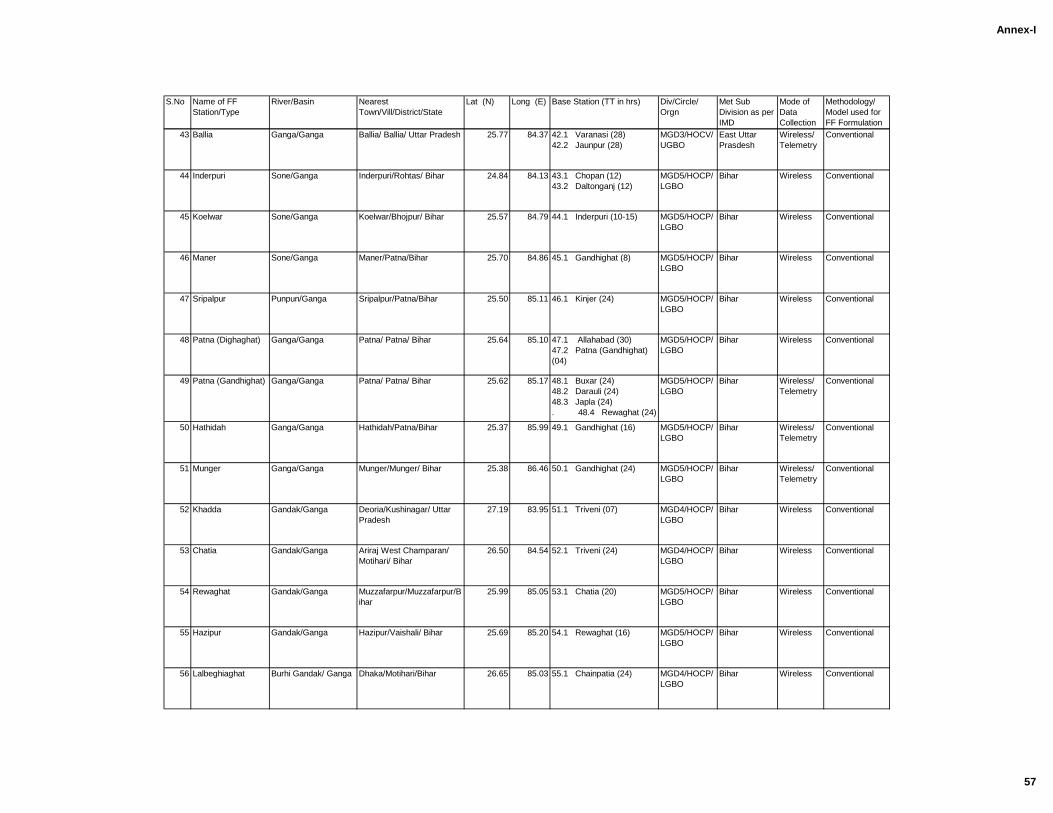
Annex-I
S.No Name of FF
Station/Type
River/Basin Nearest
Town/Vill/District/State
Lat (N) Long (E) Base Station (TT in hrs) Div/Circle/
Orgn
Met Sub
Division as per
IMD
Mode of
Data
Collection
Methodology/
Model used for
FF Formulation
43 Ballia Ganga/Ganga Ballia/ Ballia/ Uttar Pradesh 25.77 84.37 42.1 Varanasi (28)
42.2 Jaunpur (28)
MGD3/HOCV/
UGBO
East Uttar
Prasdesh
Wireless/
Telemetry
Conventional
44 Inderpuri Sone/Ganga Inderpuri/Rohtas/ Bihar 24.84 84.13 43.1 Chopan (12)
43.2 Daltonganj (12)
MGD5/HOCP/
LGBO
Bihar Wireless Conventional
45 Koelwar Sone/Ganga Koelwar/Bhojpur/ Bihar 25.57 84.79 44.1 Inderpuri (10-15) MGD5/HOCP/
LGBO
Bihar Wireless Conventional
46 Maner Sone/Ganga Maner/Patna/Bihar 25.70 84.86 45.1 Gandhighat (8) MGD5/HOCP/
LGBO
Bihar Wireless Conventional
47 Sripalpur Punpun/Ganga Sripalpur/Patna/Bihar 25.50 85.11 46.1 Kinjer (24) MGD5/HOCP/
LGBO
Bihar Wireless Conventional
48 Patna (Dighaghat) Ganga/Ganga Patna/ Patna/ Bihar 25.64 85.10 47.1 Allahabad (30)
47.2 Patna (Gandhighat)
(04)
MGD5/HOCP/
LGBO
Bihar Wireless Conventional
49 Patna (Gandhighat) Ganga/Ganga Patna/ Patna/ Bihar 25.62 85.17 48.1 Buxar (24)
48.2 Darauli (24)
48.3 Japla (24)
. 48.4 Rewaghat (24)
MGD5/HOCP/
LGBO
Bihar Wireless/
Telemetry
Conventional
50 Hathidah Ganga/Ganga Hathidah/Patna/Bihar 25.37 85.99 49.1 Gandhighat (16) MGD5/HOCP/
LGBO
Bihar Wireless/
Telemetry
Conventional
51 Munger Ganga/Ganga Munger/Munger/ Bihar 25.38 86.46 50.1 Gandhighat (24) MGD5/HOCP/
LGBO
Bihar Wireless/
Telemetry
Conventional
52 Khadda Gandak/Ganga Deoria/Kushinagar/ Uttar
Pradesh
27.19 83.95 51.1 Triveni (07) MGD4/HOCP/
LGBO
Bihar Wireless Conventional
53 Chatia Gandak/Ganga Ariraj West Champaran/
Motihari/ Bihar
26.50 84.54 52.1 Triveni (24) MGD4/HOCP/
LGBO
Bihar Wireless Conventional
54 Rewaghat Gandak/Ganga Muzzafarpur/Muzzafarpur/B
ihar
25.99 85.05 53.1 Chatia (20) MGD5/HOCP/
LGBO
Bihar Wireless Conventional
55 Hazipur Gandak/Ganga Hazipur/Vaishali/ Bihar 25.69 85.20 54.1 Rewaghat (16) MGD5/HOCP/
LGBO
Bihar Wireless Conventional
56 Lalbeghiaghat Burhi Gandak/ Ganga Dhaka/Motihari/Bihar 26.65 85.03 55.1 Chainpatia (24) MGD4/HOCP/
LGBO
Bihar Wireless Conventional
57
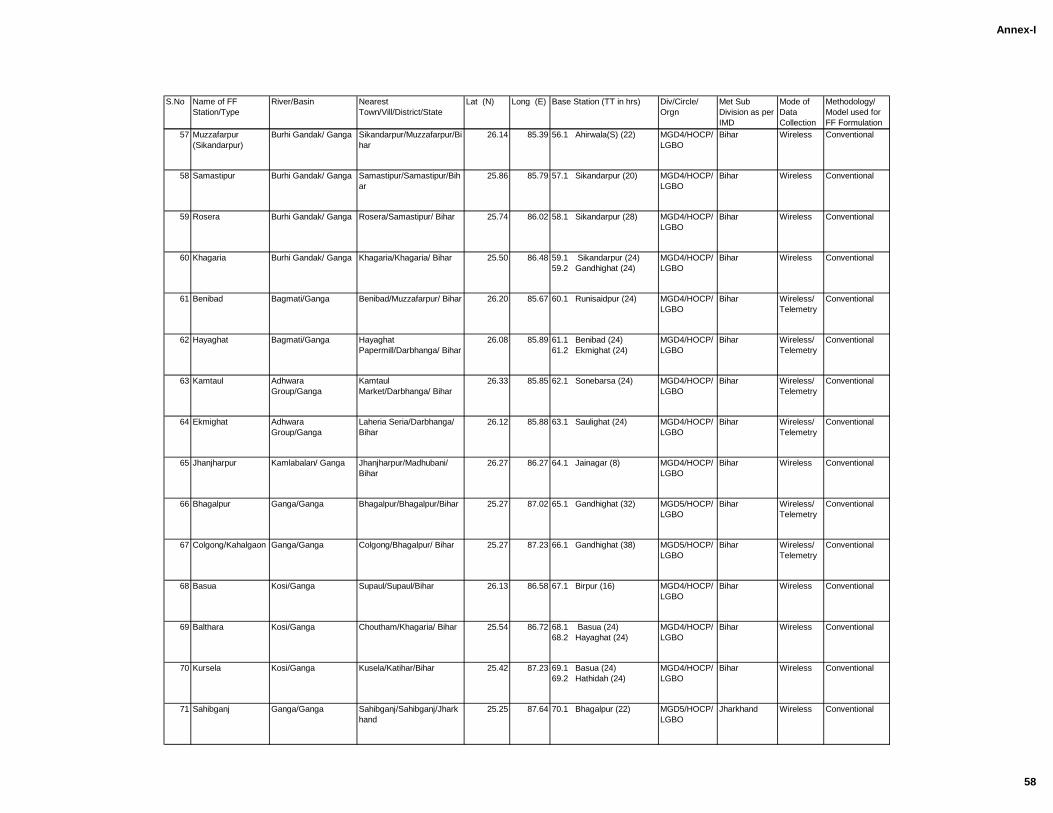
Annex-I
S.No Name of FF
Station/Type
River/Basin Nearest
Town/Vill/District/State
Lat (N) Long (E) Base Station (TT in hrs) Div/Circle/
Orgn
Met Sub
Division as per
IMD
Mode of
Data
Collection
Methodology/
Model used for
FF Formulation
57 Muzzafarpur
(Sikandarpur)
Burhi Gandak/ Ganga Sikandarpur/Muzzafarpur/Bi
har
26.14 85.39 56.1 Ahirwala(S) (22) MGD4/HOCP/
LGBO
Bihar Wireless Conventional
58 Samastipur Burhi Gandak/ Ganga Samastipur/Samastipur/Bih
ar
25.86 85.79 57.1 Sikandarpur (20) MGD4/HOCP/
LGBO
Bihar Wireless Conventional
59 Rosera Burhi Gandak/ Ganga Rosera/Samastipur/ Bihar 25.74 86.02 58.1 Sikandarpur (28) MGD4/HOCP/
LGBO
Bihar Wireless Conventional
60 Khagaria Burhi Gandak/ Ganga Khagaria/Khagaria/ Bihar 25.50 86.48 59.1 Sikandarpur (24)
59.2 Gandhighat (24)
MGD4/HOCP/
LGBO
Bihar Wireless Conventional
61 Benibad Bagmati/Ganga Benibad/Muzzafarpur/ Bihar 26.20 85.67 60.1 Runisaidpur (24) MGD4/HOCP/
LGBO
Bihar Wireless/
Telemetry
Conventional
62 Hayaghat Bagmati/Ganga Hayaghat
Papermill/Darbhanga/ Bihar
26.08 85.89 61.1 Benibad (24)
61.2 Ekmighat (24)
MGD4/HOCP/
LGBO
Bihar Wireless/
Telemetry
Conventional
63 Kamtaul Adhwara
Group/Ganga
Kamtaul
Market/Darbhanga/ Bihar
26.33 85.85 62.1 Sonebarsa (24) MGD4/HOCP/
LGBO
Bihar Wireless/
Telemetry
Conventional
64 Ekmighat Adhwara
Group/Ganga
Laheria Seria/Darbhanga/
Bihar
26.12 85.88 63.1 Saulighat (24) MGD4/HOCP/
LGBO
Bihar Wireless/
Telemetry
Conventional
65 Jhanjharpur Kamlabalan/ Ganga Jhanjharpur/Madhubani/
Bihar
26.27 86.27 64.1 Jainagar (8) MGD4/HOCP/
LGBO
Bihar Wireless Conventional
66 Bhagalpur Ganga/Ganga Bhagalpur/Bhagalpur/Bihar 25.27 87.02 65.1 Gandhighat (32) MGD5/HOCP/
LGBO
Bihar Wireless/
Telemetry
Conventional
67 Colgong/Kahalgaon Ganga/Ganga Colgong/Bhagalpur/ Bihar 25.27 87.23 66.1 Gandhighat (38) MGD5/HOCP/
LGBO
Bihar Wireless/
Telemetry
Conventional
68 Basua Kosi/Ganga Supaul/Supaul/Bihar 26.13 86.58 67.1 Birpur (16) MGD4/HOCP/
LGBO
Bihar Wireless Conventional
69 Balthara Kosi/Ganga Choutham/Khagaria/ Bihar 25.54 86.72 68.1 Basua (24)
68.2 Hayaghat (24)
MGD4/HOCP/
LGBO
Bihar Wireless Conventional
70 Kursela Kosi/Ganga Kusela/Katihar/Bihar 25.42 87.23 69.1 Basua (24)
69.2 Hathidah (24)
MGD4/HOCP/
LGBO
Bihar Wireless Conventional
71 Sahibganj Ganga/Ganga Sahibganj/Sahibganj/Jhark
hand
25.25 87.64 70.1 Bhagalpur (22) MGD5/HOCP/
LGBO
Jharkhand Wireless Conventional
58
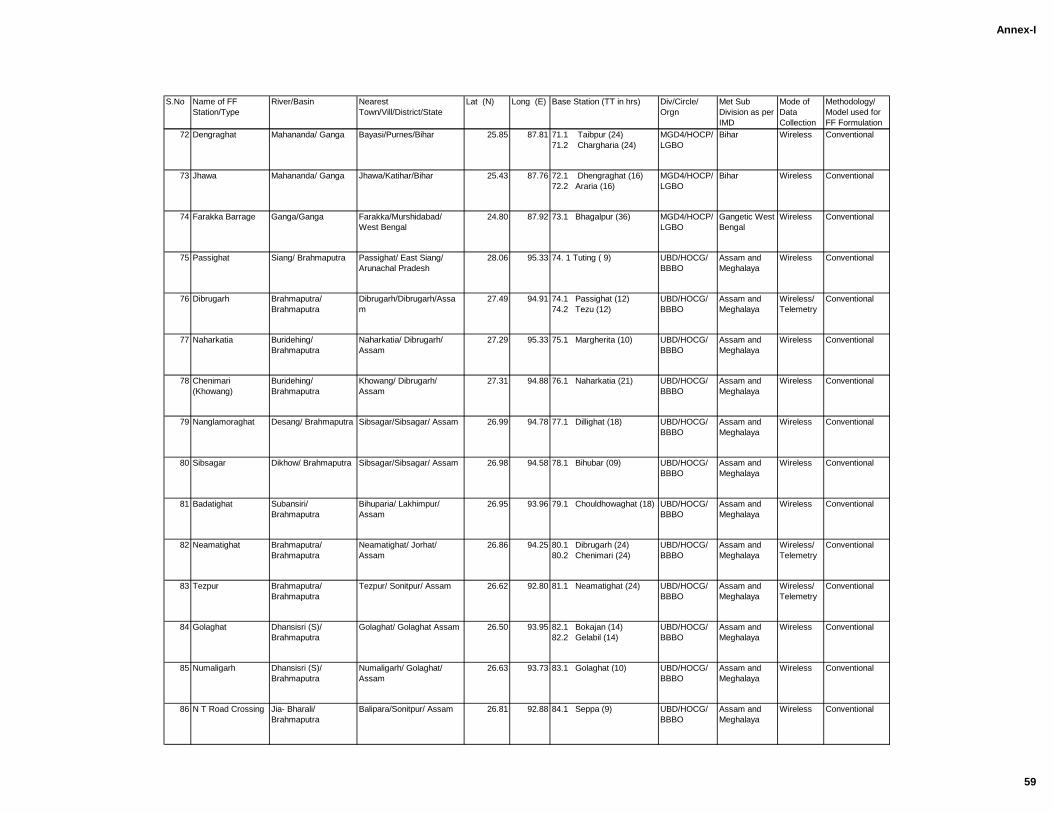
Annex-I
S.No Name of FF
Station/Type
River/Basin Nearest
Town/Vill/District/State
Lat (N) Long (E) Base Station (TT in hrs) Div/Circle/
Orgn
Met Sub
Division as per
IMD
Mode of
Data
Collection
Methodology/
Model used for
FF Formulation
72 Dengraghat Mahananda/ Ganga Bayasi/Purnes/Bihar 25.85 87.81 71.1 Taibpur (24)
71.2 Chargharia (24)
MGD4/HOCP/
LGBO
Bihar Wireless Conventional
73 Jhawa Mahananda/ Ganga Jhawa/Katihar/Bihar 25.43 87.76 72.1 Dhengraghat (16)
72.2 Araria (16)
MGD4/HOCP/
LGBO
Bihar Wireless Conventional
74 Farakka Barrage Ganga/Ganga Farakka/Murshidabad/
West Bengal
24.80 87.92 73.1 Bhagalpur (36) MGD4/HOCP/
LGBO
Gangetic West
Bengal
Wireless Conventional
75 Passighat Siang/ Brahmaputra Passighat/ East Siang/
Arunachal Pradesh
28.06 95.33 74. 1 Tuting ( 9) UBD/HOCG/
BBBO
Assam and
Meghalaya
Wireless Conventional
76 Dibrugarh Brahmaputra/
Brahmaputra
Dibrugarh/Dibrugarh/Assa
m
27.49 94.91 74.1 Passighat (12)
74.2 Tezu (12)
UBD/HOCG/
BBBO
Assam and
Meghalaya
Wireless/
Telemetry
Conventional
77 Naharkatia Buridehing/
Brahmaputra
Naharkatia/ Dibrugarh/
Assam
27.29 95.33 75.1 Margherita (10) UBD/HOCG/
BBBO
Assam and
Meghalaya
Wireless Conventional
78 Chenimari
(Khowang)
Buridehing/
Brahmaputra
Khowang/ Dibrugarh/
Assam
27.31 94.88 76.1 Naharkatia (21) UBD/HOCG/
BBBO
Assam and
Meghalaya
Wireless Conventional
79 Nanglamoraghat Desang/ Brahmaputra Sibsagar/Sibsagar/ Assam 26.99 94.78 77.1 Dillighat (18) UBD/HOCG/
BBBO
Assam and
Meghalaya
Wireless Conventional
80 Sibsagar Dikhow/ Brahmaputra Sibsagar/Sibsagar/ Assam 26.98 94.58 78.1 Bihubar (09) UBD/HOCG/
BBBO
Assam and
Meghalaya
Wireless Conventional
81 Badatighat Subansiri/
Brahmaputra
Bihuparia/ Lakhimpur/
Assam
26.95 93.96 79.1 Chouldhowaghat (18) UBD/HOCG/
BBBO
Assam and
Meghalaya
Wireless Conventional
82 Neamatighat Brahmaputra/
Brahmaputra
Neamatighat/ Jorhat/
Assam
26.86 94.25 80.1 Dibrugarh (24)
80.2 Chenimari (24)
UBD/HOCG/
BBBO
Assam and
Meghalaya
Wireless/
Telemetry
Conventional
83 Tezpur Brahmaputra/
Brahmaputra
Tezpur/ Sonitpur/ Assam 26.62 92.80 81.1 Neamatighat (24) UBD/HOCG/
BBBO
Assam and
Meghalaya
Wireless/
Telemetry
Conventional
84 Golaghat Dhansisri (S)/
Brahmaputra
Golaghat/ Golaghat Assam 26.50 93.95 82.1 Bokajan (14)
82.2 Gelabil (14)
UBD/HOCG/
BBBO
Assam and
Meghalaya
Wireless Conventional
85 Numaligarh Dhansisri (S)/
Brahmaputra
Numaligarh/ Golaghat/
Assam
26.63 93.73 83.1 Golaghat (10) UBD/HOCG/
BBBO
Assam and
Meghalaya
Wireless Conventional
86 N T Road Crossing Jia- Bharali/
Brahmaputra
Balipara/Sonitpur/ Assam 26.81 92.88 84.1 Seppa (9) UBD/HOCG/
BBBO
Assam and
Meghalaya
Wireless Conventional
59
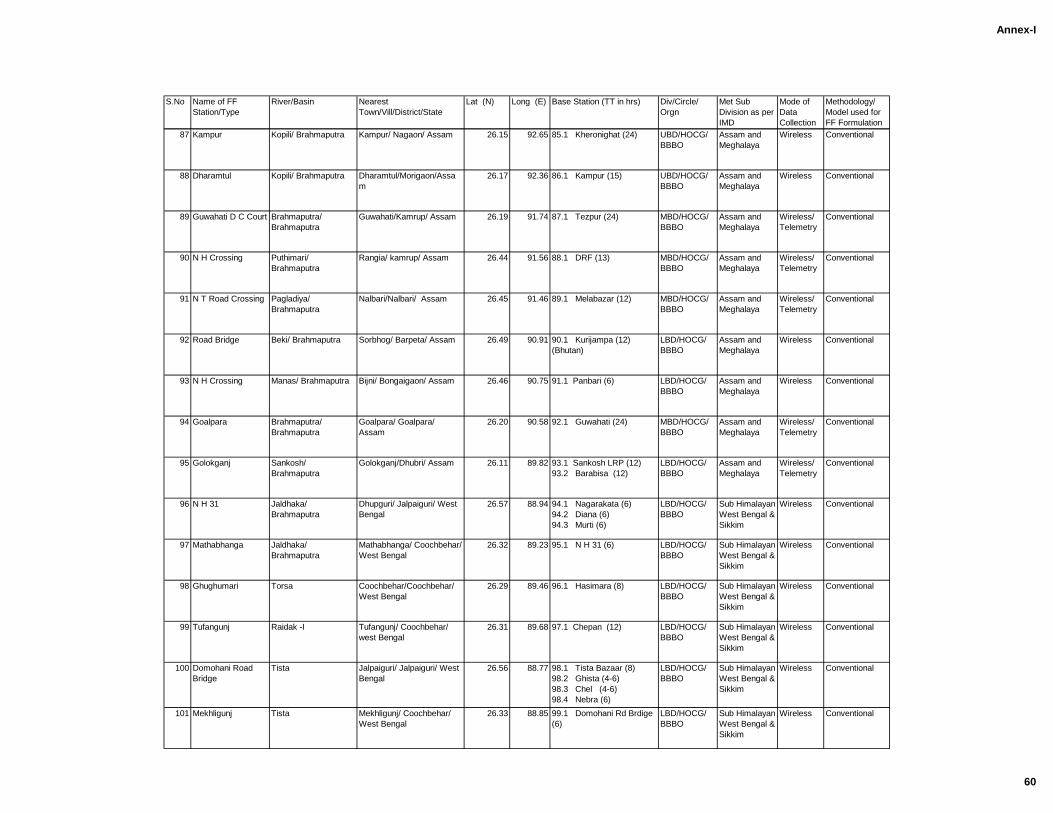
Annex-I
S.No Name of FF
Station/Type
River/Basin Nearest
Town/Vill/District/State
Lat (N) Long (E) Base Station (TT in hrs) Div/Circle/
Orgn
Met Sub
Division as per
IMD
Mode of
Data
Collection
Methodology/
Model used for
FF Formulation
87 Kampur Kopili/ Brahmaputra Kampur/ Nagaon/ Assam 26.15 92.65 85.1 Kheronighat (24) UBD/HOCG/
BBBO
Assam and
Meghalaya
Wireless Conventional
88 Dharamtul Kopili/ Brahmaputra Dharamtul/Morigaon/Assa
m
26.17 92.36 86.1 Kampur (15) UBD/HOCG/
BBBO
Assam and
Meghalaya
Wireless Conventional
89 Guwahati D C Court Brahmaputra/
Brahmaputra
Guwahati/Kamrup/ Assam 26.19 91.74 87.1 Tezpur (24) MBD/HOCG/
BBBO
Assam and
Meghalaya
Wireless/
Telemetry
Conventional
90 N H Crossing Puthimari/
Brahmaputra
Rangia/ kamrup/ Assam 26.44 91.56 88.1 DRF (13) MBD/HOCG/
BBBO
Assam and
Meghalaya
Wireless/
Telemetry
Conventional
91 N T Road Crossing Pagladiya/
Brahmaputra
Nalbari/Nalbari/ Assam 26.45 91.46 89.1 Melabazar (12) MBD/HOCG/
BBBO
Assam and
Meghalaya
Wireless/
Telemetry
Conventional
92 Road Bridge Beki/ Brahmaputra Sorbhog/ Barpeta/ Assam 26.49 90.91 90.1 Kurijampa (12)
(Bhutan)
LBD/HOCG/
BBBO
Assam and
Meghalaya
Wireless Conventional
93 N H Crossing Manas/ Brahmaputra Bijni/ Bongaigaon/ Assam 26.46 90.75 91.1 Panbari (6) LBD/HOCG/
BBBO
Assam and
Meghalaya
Wireless Conventional
94 Goalpara Brahmaputra/
Brahmaputra
Goalpara/ Goalpara/
Assam
26.20 90.58 92.1 Guwahati (24) MBD/HOCG/
BBBO
Assam and
Meghalaya
Wireless/
Telemetry
Conventional
95 Golokganj Sankosh/
Brahmaputra
Golokganj/Dhubri/ Assam 26.11 89.82 93.1 Sankosh LRP (12)
93.2 Barabisa (12)
LBD/HOCG/
BBBO
Assam and
Meghalaya
Wireless/
Telemetry
Conventional
96 N H 31 Jaldhaka/
Brahmaputra
Dhupguri/ Jalpaiguri/ West
Bengal
26.57 88.94 94.1 Nagarakata (6)
94.2 Diana (6)
94.3 Murti (6)
LBD/HOCG/
BBBO
Sub Himalayan
West Bengal &
Sikkim
Wireless Conventional
97 Mathabhanga Jaldhaka/
Brahmaputra
Mathabhanga/ Coochbehar/
West Bengal
26.32 89.23 95.1 N H 31 (6) LBD/HOCG/
BBBO
Sub Himalayan
West Bengal &
Sikkim
Wireless Conventional
98 Ghughumari Torsa Coochbehar/Coochbehar/
West Bengal
26.29 89.46 96.1 Hasimara (8) LBD/HOCG/
BBBO
Sub Himalayan
West Bengal &
Sikkim
Wireless Conventional
99 Tufangunj Raidak -I Tufangunj/ Coochbehar/
west Bengal
26.31 89.68 97.1 Chepan (12) LBD/HOCG/
BBBO
Sub Himalayan
West Bengal &
Sikkim
Wireless Conventional
100 Domohani Road
Bridge
Tista Jalpaiguri/ Jalpaiguri/ West
Bengal
26.56 88.77 98.1 Tista Bazaar (8)
98.2 Ghista (4-6)
98.3 Chel (4-6)
98.4 Nebra (6)
LBD/HOCG/
BBBO
Sub Himalayan
West Bengal &
Sikkim
Wireless Conventional
101 Mekhligunj Tista Mekhligunj/ Coochbehar/
West Bengal
26.33 88.85 99.1 Domohani Rd Brdige
(6)
LBD/HOCG/
BBBO
Sub Himalayan
West Bengal &
Sikkim
Wireless Conventional
60
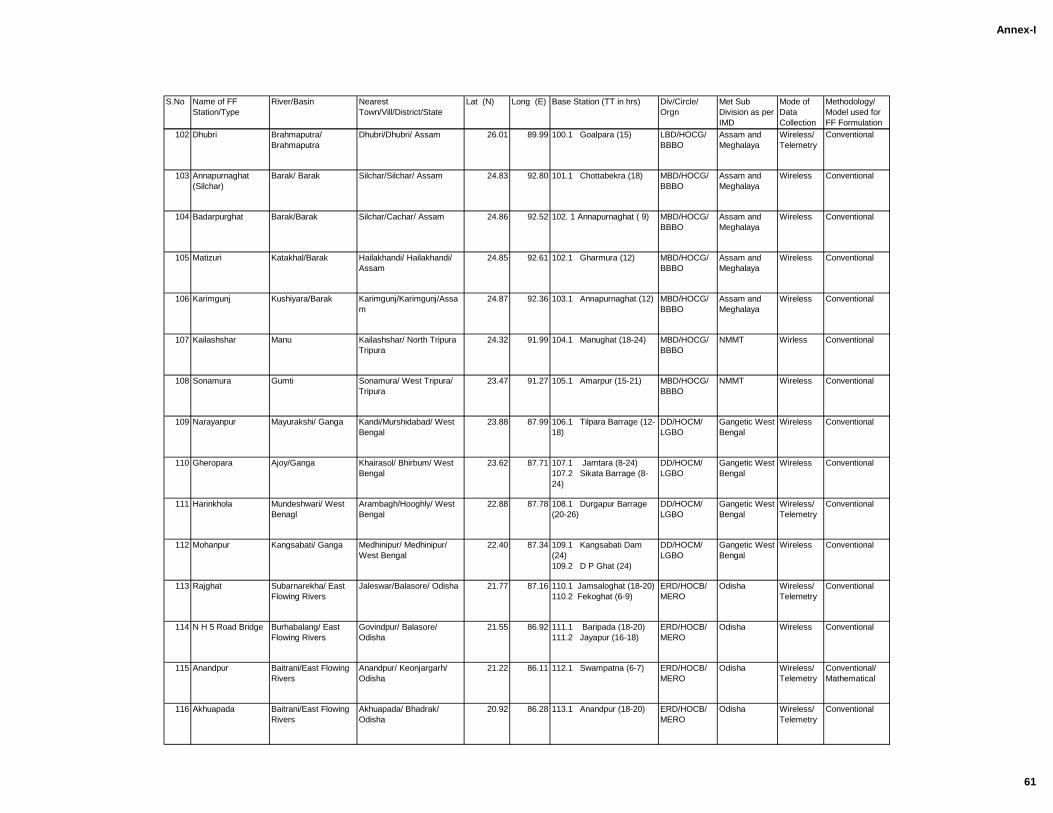
Annex-I
S.No Name of FF
Station/Type
River/Basin Nearest
Town/Vill/District/State
Lat (N) Long (E) Base Station (TT in hrs) Div/Circle/
Orgn
Met Sub
Division as per
IMD
Mode of
Data
Collection
Methodology/
Model used for
FF Formulation
102 Dhubri Brahmaputra/
Brahmaputra
Dhubri/Dhubri/ Assam 26.01 89.99 100.1 Goalpara (15) LBD/HOCG/
BBBO
Assam and
Meghalaya
Wireless/
Telemetry
Conventional
103 Annapurnaghat
(Silchar)
Barak/ Barak Silchar/Silchar/ Assam 24.83 92.80 101.1 Chottabekra (18) MBD/HOCG/
BBBO
Assam and
Meghalaya
Wireless Conventional
104 Badarpurghat Barak/Barak Silchar/Cachar/ Assam 24.86 92.52 102. 1 Annapurnaghat ( 9) MBD/HOCG/
BBBO
Assam and
Meghalaya
Wireless Conventional
105 Matizuri Katakhal/Barak Hailakhandi/ Hailakhandi/
Assam
24.85 92.61 102.1 Gharmura (12) MBD/HOCG/
BBBO
Assam and
Meghalaya
Wireless Conventional
106 Karimgunj Kushiyara/Barak Karimgunj/Karimgunj/Assa
m
24.87 92.36 103.1 Annapurnaghat (12) MBD/HOCG/
BBBO
Assam and
Meghalaya
Wireless Conventional
107 Kailashshar Manu Kailashshar/ North Tripura
Tripura
24.32 91.99 104.1 Manughat (18-24) MBD/HOCG/
BBBO
NMMT Wirless Conventional
108 Sonamura Gumti Sonamura/ West Tripura/
Tripura
23.47 91.27 105.1 Amarpur (15-21) MBD/HOCG/
BBBO
NMMT Wireless Conventional
109 Narayanpur Mayurakshi/ Ganga Kandi/Murshidabad/ West
Bengal
23.88 87.99 106.1 Tilpara Barrage (12-
18)
DD/HOCM/
LGBO
Gangetic West
Bengal
Wireless Conventional
110 Gheropara Ajoy/Ganga Khairasol/ Bhirbum/ West
Bengal
23.62 87.71 107.1 Jamtara (8-24)
107.2 Sikata Barrage (8-
24)
DD/HOCM/
LGBO
Gangetic West
Bengal
Wireless Conventional
111 Harinkhola Mundeshwari/ West
Benagl
Arambagh/Hooghly/ West
Bengal
22.88 87.78 108.1 Durgapur Barrage
(20-26)
DD/HOCM/
LGBO
Gangetic West
Bengal
Wireless/
Telemetry
Conventional
112 Mohanpur Kangsabati/ Ganga Medhinipur/ Medhinipur/
West Bengal
22.40 87.34 109.1 Kangsabati Dam
(24)
109.2 D P Ghat (24)
DD/HOCM/
LGBO
Gangetic West
Bengal
Wireless Conventional
113 Rajghat Subarnarekha/ East
Flowing Rivers
Jaleswar/Balasore/ Odisha 21.77 87.16 110.1 Jamsaloghat (18-20)
110.2 Fekoghat (6-9)
ERD/HOCB/
MERO
Odisha Wireless/
Telemetry
Conventional
114 N H 5 Road Bridge Burhabalang/ East
Flowing Rivers
Govindpur/ Balasore/
Odisha
21.55 86.92 111.1 Baripada (18-20)
111.2 Jayapur (16-18)
ERD/HOCB/
MERO
Odisha Wireless Conventional
115 Anandpur Baitrani/East Flowing
Rivers
Anandpur/ Keonjargarh/
Odisha
21.22 86.11 112.1 Swampatna (6-7) ERD/HOCB/
MERO
Odisha Wireless/
Telemetry
Conventional/
Mathematical
116 Akhuapada Baitrani/East Flowing
Rivers
Akhuapada/ Bhadrak/
Odisha
20.92 86.28 113.1 Anandpur (18-20) ERD/HOCB/
MERO
Odisha Wireless/
Telemetry
Conventional
61
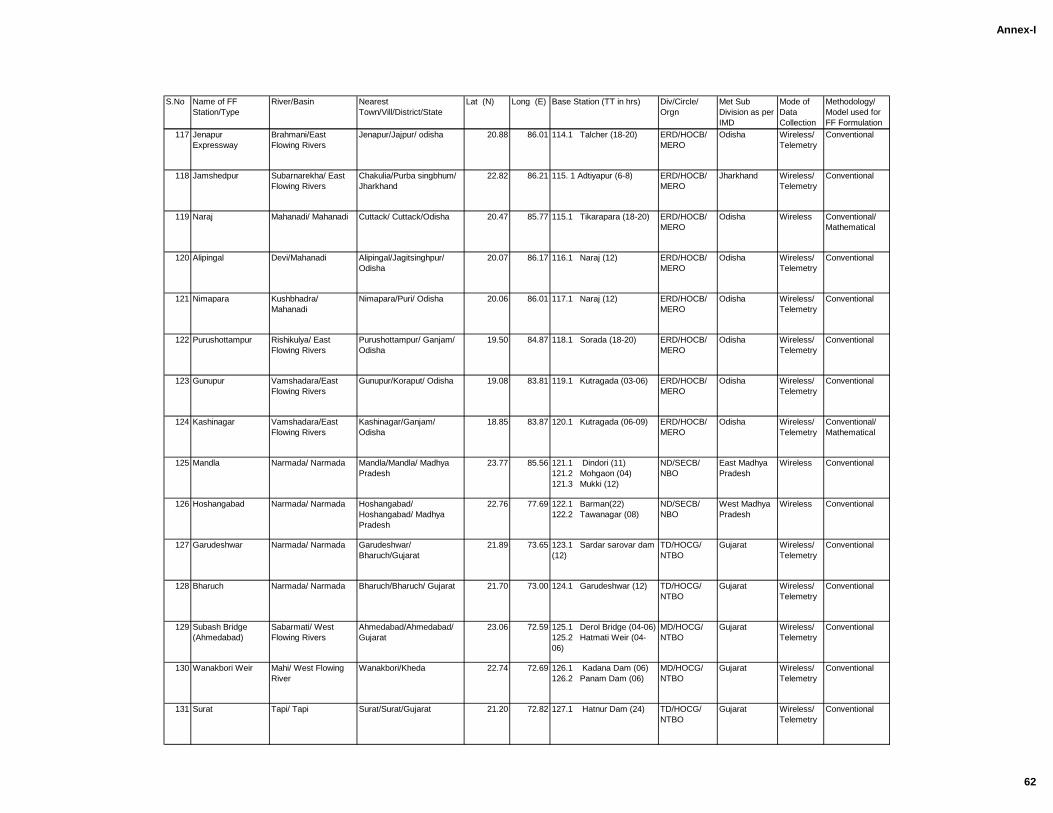
Annex-I
S.No Name of FF
Station/Type
River/Basin Nearest
Town/Vill/District/State
Lat (N) Long (E) Base Station (TT in hrs) Div/Circle/
Orgn
Met Sub
Division as per
IMD
Mode of
Data
Collection
Methodology/
Model used for
FF Formulation
117 Jenapur
Expressway
Brahmani/East
Flowing Rivers
Jenapur/Jajpur/ odisha 20.88 86.01 114.1 Talcher (18-20) ERD/HOCB/
MERO
Odisha Wireless/
Telemetry
Conventional
118 Jamshedpur Subarnarekha/ East
Flowing Rivers
Chakulia/Purba singbhum/
Jharkhand
22.82 86.21 115. 1 Adtiyapur (6-8) ERD/HOCB/
MERO
Jharkhand Wireless/
Telemetry
Conventional
119 Naraj Mahanadi/ Mahanadi Cuttack/ Cuttack/Odisha 20.47 85.77 115.1 Tikarapara (18-20) ERD/HOCB/
MERO
Odisha Wireless Conventional/
Mathematical
120 Alipingal Devi/Mahanadi Alipingal/Jagitsinghpur/
Odisha
20.07 86.17 116.1 Naraj (12) ERD/HOCB/
MERO
Odisha Wireless/
Telemetry
Conventional
121 Nimapara Kushbhadra/
Mahanadi
Nimapara/Puri/ Odisha 20.06 86.01 117.1 Naraj (12) ERD/HOCB/
MERO
Odisha Wireless/
Telemetry
Conventional
122 Purushottampur Rishikulya/ East
Flowing Rivers
Purushottampur/ Ganjam/
Odisha
19.50 84.87 118.1 Sorada (18-20) ERD/HOCB/
MERO
Odisha Wireless/
Telemetry
Conventional
123 Gunupur Vamshadara/East
Flowing Rivers
Gunupur/Koraput/ Odisha 19.08 83.81 119.1 Kutragada (03-06) ERD/HOCB/
MERO
Odisha Wireless/
Telemetry
Conventional
124 Kashinagar Vamshadara/East
Flowing Rivers
Kashinagar/Ganjam/
Odisha
18.85 83.87 120.1 Kutragada (06-09) ERD/HOCB/
MERO
Odisha Wireless/
Telemetry
Conventional/
Mathematical
125 Mandla Narmada/ Narmada Mandla/Mandla/ Madhya
Pradesh
23.77 85.56 121.1 Dindori (11)
121.2 Mohgaon (04)
121.3 Mukki (12)
ND/SECB/
NBO
East Madhya
Pradesh
Wireless Conventional
126 Hoshangabad Narmada/ Narmada Hoshangabad/
Hoshangabad/ Madhya
Pradesh
22.76 77.69 122.1 Barman(22)
122.2 Tawanagar (08)
ND/SECB/
NBO
West Madhya
Pradesh
Wireless Conventional
127 Garudeshwar Narmada/ Narmada Garudeshwar/
Bharuch/Gujarat
21.89 73.65 123.1 Sardar sarovar dam
(12)
TD/HOCG/
NTBO
Gujarat Wireless/
Telemetry
Conventional
128 Bharuch Narmada/ Narmada Bharuch/Bharuch/ Gujarat 21.70 73.00 124.1 Garudeshwar (12) TD/HOCG/
NTBO
Gujarat Wireless/
Telemetry
Conventional
129 Subash Bridge
(Ahmedabad)
Sabarmati/ West
Flowing Rivers
Ahmedabad/Ahmedabad/
Gujarat
23.06 72.59 125.1 Derol Bridge (04-06)
125.2 Hatmati Weir (04-
06)
MD/HOCG/
NTBO
Gujarat Wireless/
Telemetry
Conventional
130 Wanakbori Weir Mahi/ West Flowing
River
Wanakbori/Kheda 22.74 72.69 126.1 Kadana Dam (06)
126.2 Panam Dam (06)
MD/HOCG/
NTBO
Gujarat Wireless/
Telemetry
Conventional
131 Surat Tapi/ Tapi Surat/Surat/Gujarat 21.20 72.82 127.1 Hatnur Dam (24) TD/HOCG/
NTBO
Gujarat Wireless/
Telemetry
Conventional
62
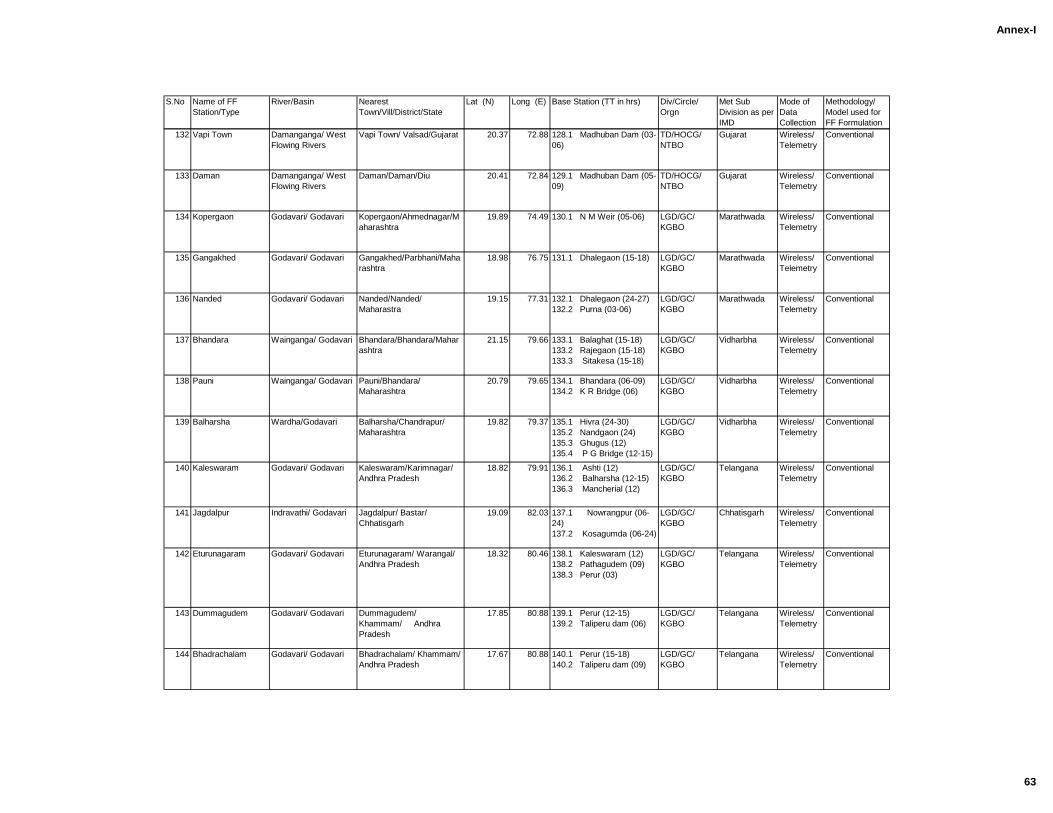
Annex-I
S.No Name of FF
Station/Type
River/Basin Nearest
Town/Vill/District/State
Lat (N) Long (E) Base Station (TT in hrs) Div/Circle/
Orgn
Met Sub
Division as per
IMD
Mode of
Data
Collection
Methodology/
Model used for
FF Formulation
132 Vapi Town Damanganga/ West
Flowing Rivers
Vapi Town/ Valsad/Gujarat 20.37 72.88 128.1 Madhuban Dam (03-
06)
TD/HOCG/
NTBO
Gujarat Wireless/
Telemetry
Conventional
133 Daman Damanganga/ West
Flowing Rivers
Daman/Daman/Diu 20.41 72.84 129.1 Madhuban Dam (05-
09)
TD/HOCG/
NTBO
Gujarat Wireless/
Telemetry
Conventional
134 Kopergaon Godavari/ Godavari Kopergaon/Ahmednagar/M
aharashtra
19.89 74.49 130.1 N M Weir (05-06) LGD/GC/
KGBO
Marathwada Wireless/
Telemetry
Conventional
135 Gangakhed Godavari/ Godavari Gangakhed/Parbhani/Maha
rashtra
18.98 76.75 131.1 Dhalegaon (15-18) LGD/GC/
KGBO
Marathwada Wireless/
Telemetry
Conventional
136 Nanded Godavari/ Godavari Nanded/Nanded/
Maharastra
19.15 77.31 132.1 Dhalegaon (24-27)
132.2 Purna (03-06)
LGD/GC/
KGBO
Marathwada Wireless/
Telemetry
Conventional
137 Bhandara Wainganga/ Godavari Bhandara/Bhandara/Mahar
ashtra
21.15 79.66 133.1 Balaghat (15-18)
133.2 Rajegaon (15-18)
133.3 Sitakesa (15-18)
LGD/GC/
KGBO
Vidharbha Wireless/
Telemetry
Conventional
138 Pauni Wainganga/ Godavari Pauni/Bhandara/
Maharashtra
20.79 79.65 134.1 Bhandara (06-09)
134.2 K R Bridge (06)
LGD/GC/
KGBO
Vidharbha Wireless/
Telemetry
Conventional
139 Balharsha Wardha/Godavari Balharsha/Chandrapur/
Maharashtra
19.82 79.37 135.1 Hivra (24-30)
135.2 Nandgaon (24)
135.3 Ghugus (12)
135.4 P G Bridge (12-15)
LGD/GC/
KGBO
Vidharbha Wireless/
Telemetry
Conventional
140 Kaleswaram Godavari/ Godavari Kaleswaram/Karimnagar/
Andhra Pradesh
18.82 79.91 136.1 Ashti (12)
136.2 Balharsha (12-15)
136.3 Mancherial (12)
LGD/GC/
KGBO
Telangana Wireless/
Telemetry
Conventional
141 Jagdalpur Indravathi/ Godavari Jagdalpur/ Bastar/
Chhatisgarh
19.09 82.03 137.1 Nowrangpur (06-
24)
137.2 Kosagumda (06-24)
LGD/GC/
KGBO
Chhatisgarh Wireless/
Telemetry
Conventional
142 Eturunagaram Godavari/ Godavari Eturunagaram/ Warangal/
Andhra Pradesh
18.32 80.46 138.1 Kaleswaram (12)
138.2 Pathagudem (09)
138.3 Perur (03)
LGD/GC/
KGBO
Telangana Wireless/
Telemetry
Conventional
143 Dummagudem Godavari/ Godavari Dummagudem/
Khammam/ Andhra
Pradesh
17.85 80.88 139.1 Perur (12-15)
139.2 Taliperu dam (06)
LGD/GC/
KGBO
Telangana Wireless/
Telemetry
Conventional
144 Bhadrachalam Godavari/ Godavari Bhadrachalam/ Khammam/
Andhra Pradesh
17.67 80.88 140.1 Perur (15-18)
140.2 Taliperu dam (09)
LGD/GC/
KGBO
Telangana Wireless/
Telemetry
Conventional
63
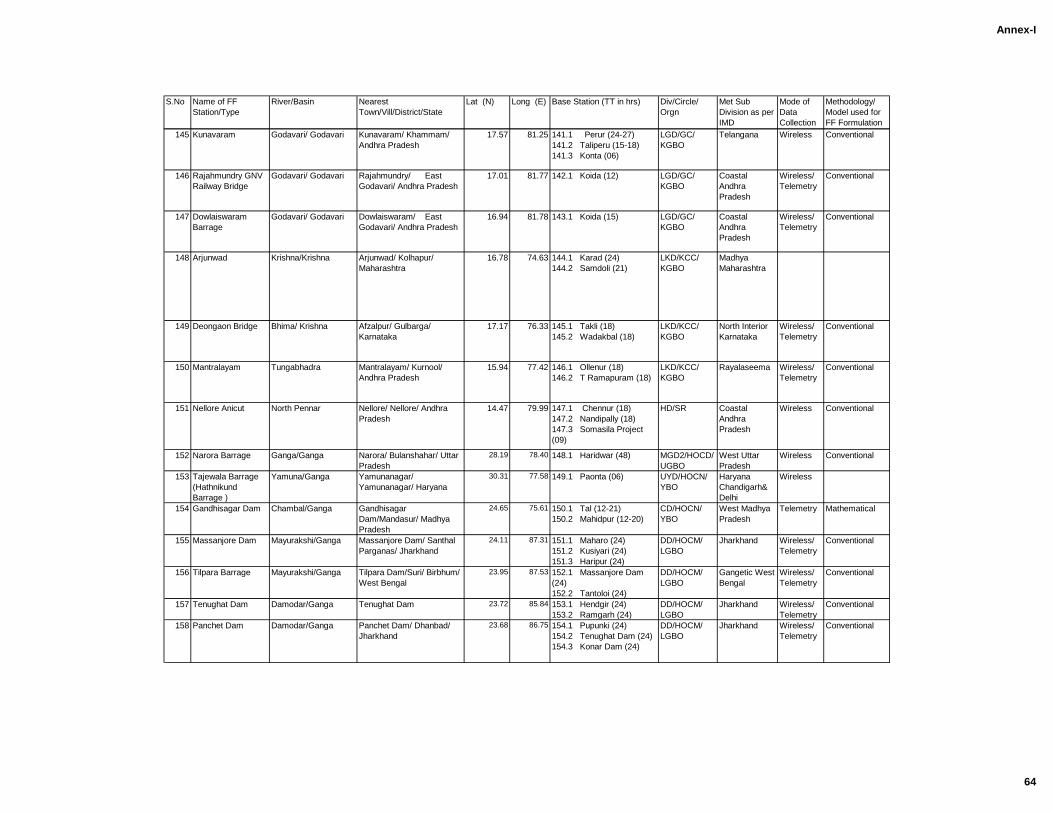
Annex-I
S.No Name of FF
Station/Type
River/Basin Nearest
Town/Vill/District/State
Lat (N) Long (E) Base Station (TT in hrs) Div/Circle/
Orgn
Met Sub
Division as per
IMD
Mode of
Data
Collection
Methodology/
Model used for
FF Formulation
145 Kunavaram Godavari/ Godavari Kunavaram/ Khammam/
Andhra Pradesh
17.57 81.25 141.1 Perur (24-27)
141.2 Taliperu (15-18)
141.3 Konta (06)
LGD/GC/
KGBO
Telangana Wireless Conventional
146 Rajahmundry GNV
Railway Bridge
Godavari/ Godavari Rajahmundry/ East
Godavari/ Andhra Pradesh
17.01 81.77 142.1 Koida (12) LGD/GC/
KGBO
Coastal
Andhra
Pradesh
Wireless/
Telemetry
Conventional
147 Dowlaiswaram
Barrage
Godavari/ Godavari Dowlaiswaram/ East
Godavari/ Andhra Pradesh
16.94 81.78 143.1 Koida (15) LGD/GC/
KGBO
Coastal
Andhra
Pradesh
Wireless/
Telemetry
Conventional
148 Arjunwad Krishna/Krishna Arjunwad/ Kolhapur/
Maharashtra
16.78 74.63 144.1 Karad (24)
144.2 Samdoli (21)
LKD/KCC/
KGBO
Madhya
Maharashtra
149 Deongaon Bridge Bhima/ Krishna Afzalpur/ Gulbarga/
Karnataka
17.17 76.33 145.1 Takli (18)
145.2 Wadakbal (18)
LKD/KCC/
KGBO
North Interior
Karnataka
Wireless/
Telemetry
Conventional
150 Mantralayam Tungabhadra Mantralayam/ Kurnool/
Andhra Pradesh
15.94 77.42 146.1 Ollenur (18)
146.2 T Ramapuram (18)
LKD/KCC/
KGBO
Rayalaseema Wireless/
Telemetry
Conventional
151 Nellore Anicut North Pennar Nellore/ Nellore/ Andhra
Pradesh
14.47 79.99 147.1 Chennur (18)
147.2 Nandipally (18)
147.3 Somasila Project
(09)
HD/SR Coastal
Andhra
Pradesh
Wireless Conventional
152 Narora Barrage Ganga/Ganga Narora/ Bulanshahar/ Uttar
Pradesh
28.19 78.40 148.1 Haridwar (48) MGD2/HOCD/
UGBO
West Uttar
Pradesh
Wireless Conventional
153 Tajewala Barrage
(Hathnikund
Barrage )
Yamuna/Ganga Yamunanagar/
Yamunanagar/ Haryana
30.31 77.58 149.1 Paonta (06) UYD/HOCN/
YBO
Haryana
Chandigarh&
Delhi
Wireless
154 Gandhisagar Dam Chambal/Ganga Gandhisagar
Dam/Mandasur/ Madhya
Pradesh
24.65 75.61 150.1 Tal (12-21)
150.2 Mahidpur (12-20)
CD/HOCN/
YBO
West Madhya
Pradesh
Telemetry Mathematical
155 Massanjore Dam Mayurakshi/Ganga Massanjore Dam/ Santhal
Parganas/ Jharkhand
24.11 87.31 151.1 Maharo (24)
151.2 Kusiyari (24)
151.3 Haripur (24)
DD/HOCM/
LGBO
Jharkhand Wireless/
Telemetry
Conventional
156 Tilpara Barrage Mayurakshi/Ganga Tilpara Dam/Suri/ Birbhum/
West Bengal
23.95 87.53 152.1 Massanjore Dam
(24)
152.2 Tantoloi (24)
DD/HOCM/
LGBO
Gangetic West
Bengal
Wireless/
Telemetry
Conventional
157 Tenughat Dam Damodar/Ganga Tenughat Dam 23.72 85.84 153.1 Hendgir (24)
153.2 Ramgarh (24)
DD/HOCM/
LGBO
Jharkhand Wireless/
Telemetry
Conventional
158 Panchet Dam Damodar/Ganga Panchet Dam/ Dhanbad/
Jharkhand
23.68 86.75 154.1 Pupunki (24)
154.2 Tenughat Dam (24)
154.3 Konar Dam (24)
DD/HOCM/
LGBO
Jharkhand Wireless/
Telemetry
Conventional
64
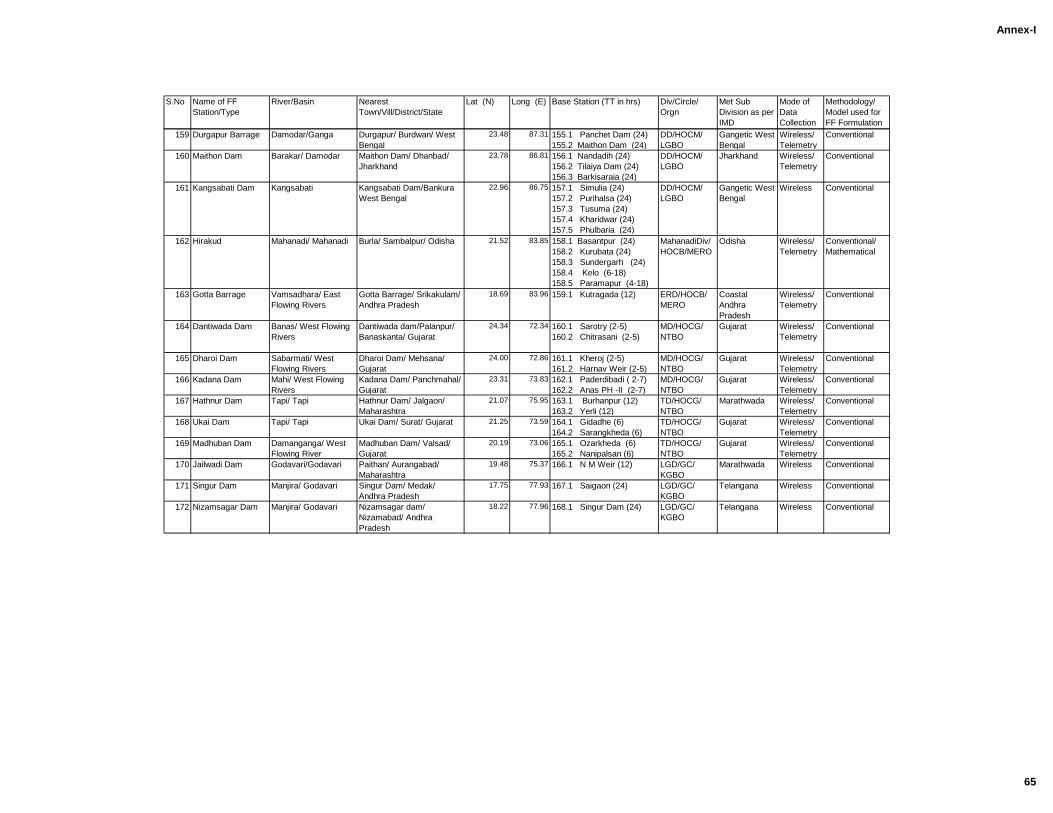
Annex-I
S.No Name of FF
Station/Type
River/Basin Nearest
Town/Vill/District/State
Lat (N) Long (E) Base Station (TT in hrs) Div/Circle/
Orgn
Met Sub
Division as per
IMD
Mode of
Data
Collection
Methodology/
Model used for
FF Formulation
159 Durgapur Barrage Damodar/Ganga Durgapur/ Burdwan/ West
Bengal
23.48 87.31 155.1 Panchet Dam (24)
155.2 Maithon Dam (24)
DD/HOCM/
LGBO
Gangetic West
Bengal
Wireless/
Telemetry
Conventional
160 Maithon Dam Barakar/ Damodar Maithon Dam/ Dhanbad/
Jharkhand
23.78 86.81 156.1 Nandadih (24)
156.2 Tilaiya Dam (24)
156.3 Barkisaraia (24)
DD/HOCM/
LGBO
Jharkhand Wireless/
Telemetry
Conventional
161 Kangsabati Dam Kangsabati Kangsabati Dam/Bankura
West Bengal
22.96 86.75 157.1 Simulia (24)
157.2 Purihalsa (24)
157.3 Tusuma (24)
157.4 Kharidwar (24)
157.5 Phulbaria (24)
DD/HOCM/
LGBO
Gangetic West
Bengal
Wireless Conventional
162 Hirakud Mahanadi/ Mahanadi Burla/ Sambalpur/ Odisha 21.52 83.85 158.1 Basantpur (24)
158.2 Kurubata (24)
158.3 Sundergarh (24)
158.4 Kelo (6-18)
158.5 Paramapur (4-18)
MahanadiDiv/
HOCB/MERO
Odisha Wireless/
Telemetry
Conventional/
Mathematical
163 Gotta Barrage Vamsadhara/ East
Flowing Rivers
Gotta Barrage/ Srikakulam/
Andhra Pradesh
18.69 83.96 159.1 Kutragada (12) ERD/HOCB/
MERO
Coastal
Andhra
Pradesh
Wireless/
Telemetry
Conventional
164 Dantiwada Dam Banas/ West Flowing
Rivers
Dantiwada dam/Palanpur/
Banaskanta/ Gujarat
24.34 72.34 160.1 Sarotry (2-5)
160.2 Chitrasani (2-5)
MD/HOCG/
NTBO
Gujarat Wireless/
Telemetry
Conventional
165 Dharoi Dam Sabarmati/ West
Flowing Rivers
Dharoi Dam/ Mehsana/
Gujarat
24.00 72.86 161.1 Kheroj (2-5)
161.2 Harnav Weir (2-5)
MD/HOCG/
NTBO
Gujarat Wireless/
Telemetry
Conventional
166 Kadana Dam Mahi/ West Flowing
Rivers
Kadana Dam/ Panchmahal/
Gujarat
23.31 73.83 162.1 Paderdibadi ( 2-7)
162.2 Anas PH -II (2-7)
MD/HOCG/
NTBO
Gujarat Wireless/
Telemetry
Conventional
167 Hathnur Dam Tapi/ Tapi Hathnur Dam/ Jalgaon/
Maharashtra
21.07 75.95 163.1 Burhanpur (12)
163.2 Yerli (12)
TD/HOCG/
NTBO
Marathwada Wireless/
Telemetry
Conventional
168 Ukai Dam Tapi/ Tapi Ukai Dam/ Surat/ Gujarat 21.25 73.59 164.1 Gidadhe (6)
164.2 Sarangkheda (6)
TD/HOCG/
NTBO
Gujarat Wireless/
Telemetry
Conventional
169 Madhuban Dam Damanganga/ West
Flowing River
Madhuban Dam/ Valsad/
Gujarat
20.19 73.06 165.1 Ozarkheda (6)
165.2 Nanipalsan (6)
TD/HOCG/
NTBO
Gujarat Wireless/
Telemetry
Conventional
170 Jailwadi Dam Godavari/Godavari Paithan/ Aurangabad/
Maharashtra
19.48 75.37 166.1 N M Weir (12) LGD/GC/
KGBO
Marathwada Wireless Conventional
171 Singur Dam Manjira/ Godavari Singur Dam/ Medak/
Andhra Pradesh
17.75 77.93 167.1 Saigaon (24) LGD/GC/
KGBO
Telangana Wireless Conventional
172 Nizamsagar Dam Manjira/ Godavari Nizamsagar dam/
Nizamabad/ Andhra
Pradesh
18.22 77.96 168.1 Singur Dam (24) LGD/GC/
KGBO
Telangana Wireless Conventional
65
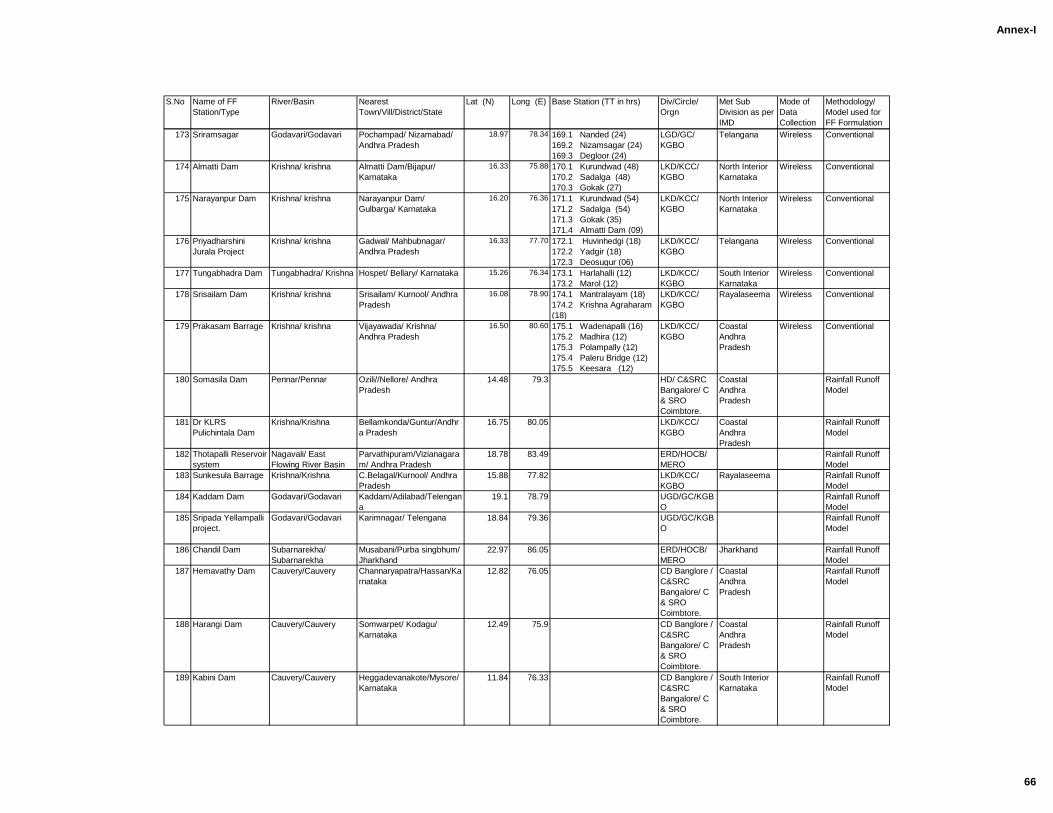
Annex-I
S.No Name of FF
Station/Type
River/Basin Nearest
Town/Vill/District/State
Lat (N) Long (E) Base Station (TT in hrs) Div/Circle/
Orgn
Met Sub
Division as per
IMD
Mode of
Data
Collection
Methodology/
Model used for
FF Formulation
173 Sriramsagar Godavari/Godavari Pochampad/ Nizamabad/
Andhra Pradesh
18.97 78.34 169.1 Nanded (24)
169.2 Nizamsagar (24)
169.3 Degloor (24)
LGD/GC/
KGBO
Telangana Wireless Conventional
174 Almatti Dam Krishna/ krishna Almatti Dam/Bijapur/
Karnataka
16.33 75.88 170.1 Kurundwad (48)
170.2 Sadalga (48)
170.3 Gokak (27)
LKD/KCC/
KGBO
North Interior
Karnataka
Wireless Conventional
175 Narayanpur Dam Krishna/ krishna Narayanpur Dam/
Gulbarga/ Karnataka
16.20 76.36 171.1 Kurundwad (54)
171.2 Sadalga (54)
171.3 Gokak (35)
171.4 Almatti Dam (09)
LKD/KCC/
KGBO
North Interior
Karnataka
Wireless Conventional
176 Priyadharshini
Jurala Project
Krishna/ krishna Gadwal/ Mahbubnagar/
Andhra Pradesh
16.33 77.70 172.1 Huvinhedgi (18)
172.2 Yadgir (18)
172.3 Deosugur (06)
LKD/KCC/
KGBO
Telangana Wireless Conventional
177 Tungabhadra Dam Tungabhadra/ Krishna Hospet/ Bellary/ Karnataka 15.26 76.34 173.1 Harlahalli (12)
173.2 Marol (12)
LKD/KCC/
KGBO
South Interior
Karnataka
Wireless Conventional
178 Srisailam Dam Krishna/ krishna Srisailam/ Kurnool/ Andhra
Pradesh
16.08 78.90 174.1 Mantralayam (18)
174.2 Krishna Agraharam
(18)
LKD/KCC/
KGBO
Rayalaseema Wireless Conventional
179 Prakasam Barrage Krishna/ krishna Vijayawada/ Krishna/
Andhra Pradesh
16.50 80.60 175.1 Wadenapalli (16)
175.2 Madhira (12)
175.3 Polampally (12)
175.4 Paleru Bridge (12)
175.5 Keesara (12)
LKD/KCC/
KGBO
Coastal
Andhra
Pradesh
Wireless Conventional
180 Somasila Dam Pennar/Pennar Ozili//Nellore/ Andhra
Pradesh
14.48 79.3 HD/ C&SRC
Bangalore/ C
& SRO
Coimbtore.
Coastal
Andhra
Pradesh
Rainfall Runoff
Model
181 Dr KLRS
Pulichintala Dam
Krishna/Krishna Bellamkonda/Guntur/Andhr
a Pradesh
16.75 80.05 LKD/KCC/
KGBO
Coastal
Andhra
Pradesh
Rainfall Runoff
Model
182 Thotapalli Reservoir
system
Nagavali/ East
Flowing River Basin
Parvathipuram/Vizianagara
m/ Andhra Pradesh
18.78 83.49 ERD/HOCB/
MERO
Rainfall Runoff
Model
183 Sunkesula Barrage Krishna/Krishna C.Belagal/Kurnool/ Andhra
Pradesh
15.88 77.82 LKD/KCC/
KGBO
Rayalaseema Rainfall Runoff
Model
184 Kaddam Dam Godavari/Godavari Kaddam/Adilabad/Telengan
a
19.1 78.79 UGD/GC/KGB
O
Rainfall Runoff
Model
185 Sripada Yellampalli
project.
Godavari/Godavari Karimnagar/ Telengana 18.84 79.36 UGD/GC/KGB
O
Rainfall Runoff
Model
186 Chandil Dam Subarnarekha/
Subarnarekha
Musabani/Purba singbhum/
Jharkhand
22.97 86.05 ERD/HOCB/
MERO
Jharkhand Rainfall Runoff
Model
187 Hemavathy Dam Cauvery/Cauvery Channaryapatra/Hassan/Ka
rnataka
12.82 76.05 CD Banglore /
C&SRC
Bangalore/ C
& SRO
Coimbtore.
Coastal
Andhra
Pradesh
Rainfall Runoff
Model
188 Harangi Dam Cauvery/Cauvery Somwarpet/ Kodagu/
Karnataka
12.49 75.9 CD Banglore /
C&SRC
Bangalore/ C
& SRO
Coimbtore.
Coastal
Andhra
Pradesh
Rainfall Runoff
Model
189 Kabini Dam Cauvery/Cauvery Heggadevanakote/Mysore/
Karnataka
11.84 76.33 CD Banglore /
C&SRC
Bangalore/ C
& SRO
Coimbtore.
South Interior
Karnataka
Rainfall Runoff
Model
66
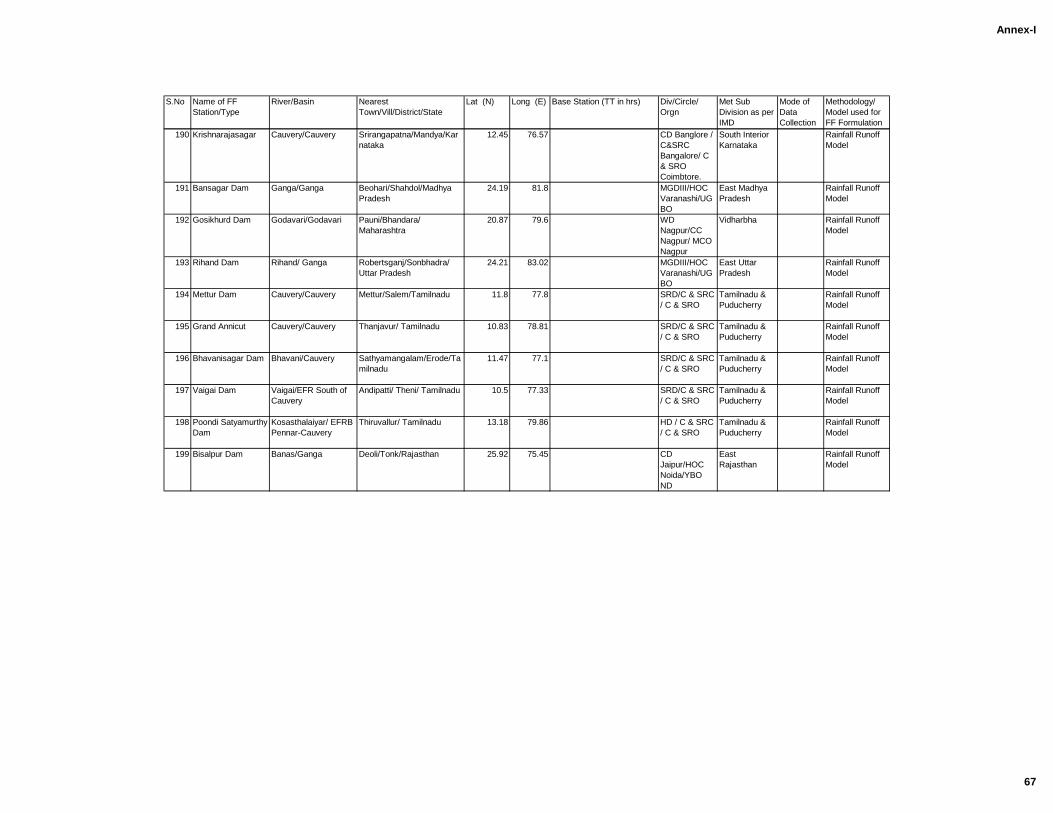
Annex-I
S.No Name of FF
Station/Type
River/Basin Nearest
Town/Vill/District/State
Lat (N) Long (E) Base Station (TT in hrs) Div/Circle/
Orgn
Met Sub
Division as per
IMD
Mode of
Data
Collection
Methodology/
Model used for
FF Formulation
190 Krishnarajasagar Cauvery/Cauvery Srirangapatna/Mandya/Kar
nataka
12.45 76.57 CD Banglore /
C&SRC
Bangalore/ C
& SRO
Coimbtore.
South Interior
Karnataka
Rainfall Runoff
Model
191 Bansagar Dam Ganga/Ganga Beohari/Shahdol/Madhya
Pradesh
24.19 81.8 MGDIII/HOC
Varanashi/UG
BO
East Madhya
Pradesh
Rainfall Runoff
Model
192 Gosikhurd Dam Godavari/Godavari Pauni/Bhandara/
Maharashtra
20.87 79.6 WD
Nagpur/CC
Nagpur/ MCO
Nagpur
Vidharbha Rainfall Runoff
Model
193 Rihand Dam Rihand/ Ganga Robertsganj/Sonbhadra/
Uttar Pradesh
24.21 83.02 MGDIII/HOC
Varanashi/UG
BO
East Uttar
Pradesh
Rainfall Runoff
Model
194 Mettur Dam Cauvery/Cauvery Mettur/Salem/Tamilnadu 11.8 77.8 SRD/C & SRC
/ C & SRO
Tamilnadu &
Puducherry
Rainfall Runoff
Model
195 Grand Annicut Cauvery/Cauvery Thanjavur/ Tamilnadu 10.83 78.81 SRD/C & SRC
/ C & SRO
Tamilnadu &
Puducherry
Rainfall Runoff
Model
196 Bhavanisagar Dam Bhavani/Cauvery Sathyamangalam/Erode/Ta
milnadu
11.47 77.1 SRD/C & SRC
/ C & SRO
Tamilnadu &
Puducherry
Rainfall Runoff
Model
197 Vaigai Dam Vaigai/EFR South of
Cauvery
Andipatti/ Theni/ Tamilnadu 10.5 77.33 SRD/C & SRC
/ C & SRO
Tamilnadu &
Puducherry
Rainfall Runoff
Model
198 Poondi Satyamurthy
Dam
Kosasthalaiyar/ EFRB
Pennar-Cauvery
Thiruvallur/ Tamilnadu 13.18 79.86 HD / C & SRC
/ C & SRO
Tamilnadu &
Puducherry
Rainfall Runoff
Model
199 Bisalpur Dam Banas/Ganga Deoli/Tonk/Rajasthan 25.92 75.45 CD
Jaipur/HOC
Noida/YBO
ND
East
Rajasthan
Rainfall Runoff
Model
67
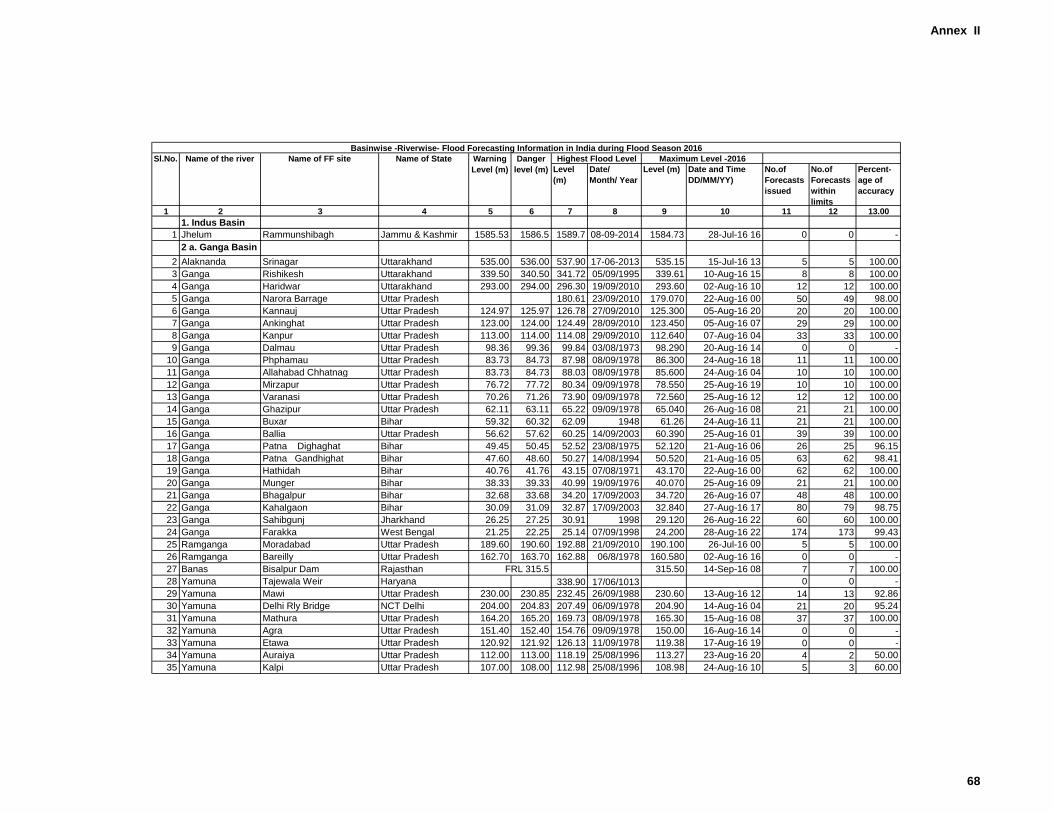
Annex II
Level
(m)
Date/
Month/ Year
Level (m) Date and Time
DD/MM/YY)
No.of
Forecasts
issued
No.of
Forecasts
within
limits
Percent-
age of
accuracy
1 2 3 4 5 6 7 8 9 10 11 12 13.00
1. Indus Basin
1 Jhelum Rammunshibagh Jammu & Kashmir 1585.53 1586.5 1589.7 08-09-2014 1584.73 28-Jul-16 16 0 0 -
2 a. Ganga Basin
2 Alaknanda Srinagar Uttarakhand 535.00 536.00 537.90 17-06-2013 535.15 15-Jul-16 13 5 5 100.00
3 Ganga Rishikesh Uttarakhand 339.50 340.50 341.72 05/09/1995 339.61 10-Aug-16 15 8 8 100.00
4 Ganga Haridwar Uttarakhand 293.00 294.00 296.30 19/09/2010 293.60 02-Aug-16 10 12 12 100.00
5 Ganga Narora Barrage Uttar Pradesh 180.61 23/09/2010 179.070 22-Aug-16 00 50 49 98.00
6 Ganga Kannauj Uttar Pradesh 124.97 125.97 126.78 27/09/2010 125.300 05-Aug-16 20 20 20 100.00
7 Ganga Ankinghat Uttar Pradesh 123.00 124.00 124.49 28/09/2010 123.450 05-Aug-16 07 29 29 100.00
8 Ganga Kanpur Uttar Pradesh 113.00 114.00 114.08 29/09/2010 112.640 07-Aug-16 04 33 33 100.00
9 Ganga Dalmau Uttar Pradesh 98.36 99.36 99.84 03/08/1973 98.290 20-Aug-16 14 0 0 -
10 Ganga Phphamau Uttar Pradesh 83.73 84.73 87.98 08/09/1978 86.300 24-Aug-16 18 11 11 100.00
11 Ganga Allahabad Chhatnag Uttar Pradesh 83.73 84.73 88.03 08/09/1978 85.600 24-Aug-16 04 10 10 100.00
12 Ganga Mirzapur Uttar Pradesh 76.72 77.72 80.34 09/09/1978 78.550 25-Aug-16 19 10 10 100.00
13 Ganga Varanasi Uttar Pradesh 70.26 71.26 73.90 09/09/1978 72.560 25-Aug-16 12 12 12 100.00
14 Ganga Ghazipur Uttar Pradesh 62.11 63.11 65.22 09/09/1978 65.040 26-Aug-16 08 21 21 100.00
15 Ganga Buxar Bihar 59.32 60.32 62.09 1948 61.26 24-Aug-16 11 21 21 100.00
16 Ganga Ballia Uttar Pradesh 56.62 57.62 60.25 14/09/2003 60.390 25-Aug-16 01 39 39 100.00
17 Ganga Patna Dighaghat Bihar 49.45 50.45 52.52 23/08/1975 52.120 21-Aug-16 06 26 25 96.15
18 Ganga Patna Gandhighat Bihar 47.60 48.60 50.27 14/08/1994 50.520 21-Aug-16 05 63 62 98.41
19 Ganga Hathidah Bihar 40.76 41.76 43.15 07/08/1971 43.170 22-Aug-16 00 62 62 100.00
20 Ganga Munger Bihar 38.33 39.33 40.99 19/09/1976 40.070 25-Aug-16 09 21 21 100.00
21 Ganga Bhagalpur Bihar 32.68 33.68 34.20 17/09/2003 34.720 26-Aug-16 07 48 48 100.00
22 Ganga Kahalgaon Bihar 30.09 31.09 32.87 17/09/2003 32.840 27-Aug-16 17 80 79 98.75
23 Ganga Sahibgunj Jharkhand 26.25 27.25 30.91 1998 29.120 26-Aug-16 22 60 60 100.00
24 Ganga Farakka West Bengal 21.25 22.25 25.14 07/09/1998 24.200 28-Aug-16 22 174 173 99.43
25 Ramganga Moradabad Uttar Pradesh 189.60 190.60 192.88 21/09/2010 190.100 26-Jul-16 00 5 5 100.00
26 Ramganga Bareilly Uttar Pradesh 162.70 163.70 162.88 06/8/1978 160.580 02-Aug-16 16 0 0 -
27 Banas Bisalpur Dam Rajasthan 315.50 14-Sep-16 08 7 7 100.00
28 Yamuna Tajewala Weir Haryana 338.90 17/06/1013 0 0 -
29 Yamuna Mawi Uttar Pradesh 230.00 230.85 232.45 26/09/1988 230.60 13-Aug-16 12 14 13 92.86
30 Yamuna Delhi Rly Bridge NCT Delhi 204.00 204.83 207.49 06/09/1978 204.90 14-Aug-16 04 21 20 95.24
31 Yamuna Mathura Uttar Pradesh 164.20 165.20 169.73 08/09/1978 165.30 15-Aug-16 08 37 37 100.00
32 Yamuna Agra Uttar Pradesh 151.40 152.40 154.76 09/09/1978 150.00 16-Aug-16 14 0 0 -
33 Yamuna Etawa Uttar Pradesh 120.92 121.92 126.13 11/09/1978 119.38 17-Aug-16 19 0 0 -
34 Yamuna Auraiya Uttar Pradesh 112.00 113.00 118.19 25/08/1996 113.27 23-Aug-16 20 4 2 50.00
35 Yamuna Kalpi Uttar Pradesh 107.00 108.00 112.98 25/08/1996 108.98 24-Aug-16 10 5 3 60.00
Basinwise -Riverwise- Flood Forecasting Information in India during Flood Season 2016
Sl.No. Name of the river Name of FF site Name of State Warning
Level (m)
Danger
level (m)
Highest Flood Level Maximum Level -2016
FRL 315.5
68
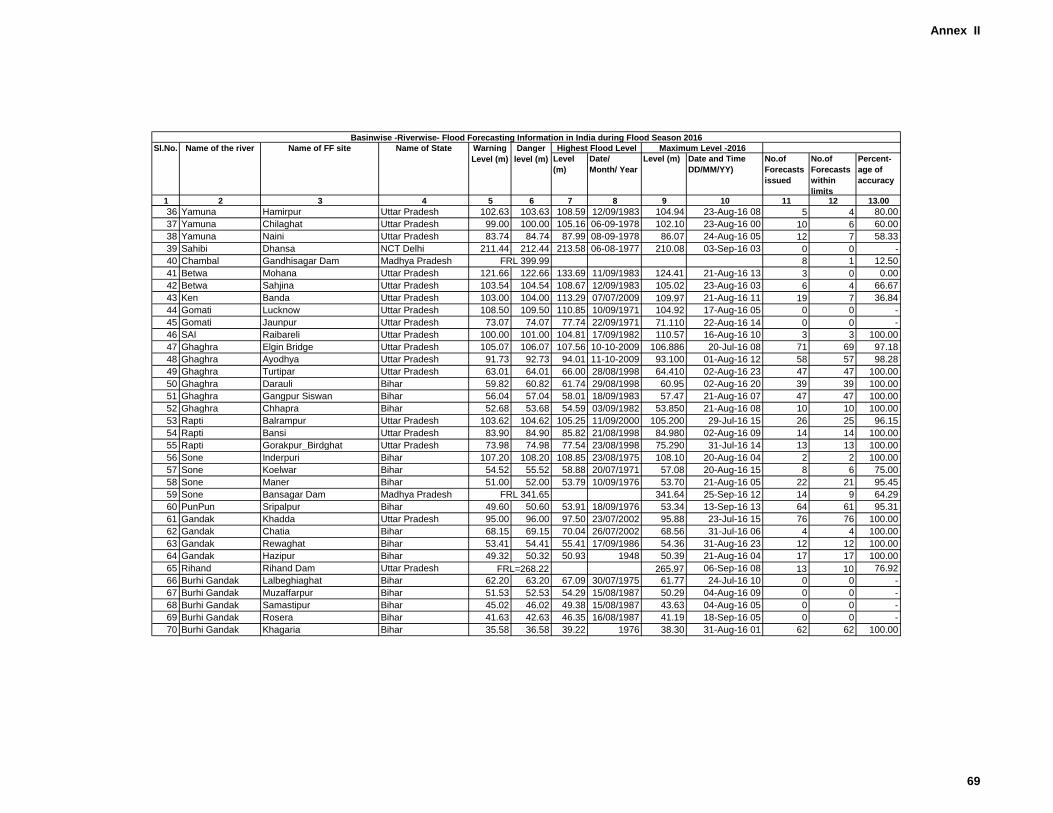
Annex II
Level
(m)
Date/
Month/ Year
Level (m) Date and Time
DD/MM/YY)
No.of
Forecasts
issued
No.of
Forecasts
within
limits
Percent-
age of
accuracy
1 2 3 4 5 6 7 8 9 10 11 12 13.00
Basinwise -Riverwise- Flood Forecasting Information in India during Flood Season 2016
Sl.No. Name of the river Name of FF site Name of State Warning
Level (m)
Danger
level (m)
Highest Flood Level Maximum Level -2016
36 Yamuna Hamirpur Uttar Pradesh 102.63 103.63 108.59 12/09/1983 104.94 23-Aug-16 08 5 4 80.00
37 Yamuna Chilaghat Uttar Pradesh 99.00 100.00 105.16 06-09-1978 102.10 23-Aug-16 00 10 6 60.00
38 Yamuna Naini Uttar Pradesh 83.74 84.74 87.99 08-09-1978 86.07 24-Aug-16 05 12 7 58.33
39 Sahibi Dhansa NCT Delhi 211.44 212.44 213.58 06-08-1977 210.08 03-Sep-16 03 0 0 -
40 Chambal Gandhisagar Dam Madhya Pradesh 8 1 12.50
41 Betwa Mohana Uttar Pradesh 121.66 122.66 133.69 11/09/1983 124.41 21-Aug-16 13 3 0 0.00
42 Betwa Sahjina Uttar Pradesh 103.54 104.54 108.67 12/09/1983 105.02 23-Aug-16 03 6 4 66.67
43 Ken Banda Uttar Pradesh 103.00 104.00 113.29 07/07/2009 109.97 21-Aug-16 11 19 7 36.84
44 Gomati Lucknow Uttar Pradesh 108.50 109.50 110.85 10/09/1971 104.92 17-Aug-16 05 0 0 -
45 Gomati Jaunpur Uttar Pradesh 73.07 74.07 77.74 22/09/1971 71.110 22-Aug-16 14 0 0 -
46 SAI Raibareli Uttar Pradesh 100.00 101.00 104.81 17/09/1982 110.57 16-Aug-16 10 3 3 100.00
47 Ghaghra Elgin Bridge Uttar Pradesh 105.07 106.07 107.56 10-10-2009 106.886 20-Jul-16 08 71 69 97.18
48 Ghaghra Ayodhya Uttar Pradesh 91.73 92.73 94.01 11-10-2009 93.100 01-Aug-16 12 58 57 98.28
49 Ghaghra Turtipar Uttar Pradesh 63.01 64.01 66.00 28/08/1998 64.410 02-Aug-16 23 47 47 100.00
50 Ghaghra Darauli Bihar 59.82 60.82 61.74 29/08/1998 60.95 02-Aug-16 20 39 39 100.00
51 Ghaghra Gangpur Siswan Bihar 56.04 57.04 58.01 18/09/1983 57.47 21-Aug-16 07 47 47 100.00
52 Ghaghra Chhapra Bihar 52.68 53.68 54.59 03/09/1982 53.850 21-Aug-16 08 10 10 100.00
53 Rapti Balrampur Uttar Pradesh 103.62 104.62 105.25 11/09/2000 105.200 29-Jul-16 15 26 25 96.15
54 Rapti Bansi Uttar Pradesh 83.90 84.90 85.82 21/08/1998 84.980 02-Aug-16 09 14 14 100.00
55 Rapti Gorakpur_Birdghat Uttar Pradesh 73.98 74.98 77.54 23/08/1998 75.290 31-Jul-16 14 13 13 100.00
56 Sone Inderpuri Bihar 107.20 108.20 108.85 23/08/1975 108.10 20-Aug-16 04 2 2 100.00
57 Sone Koelwar Bihar 54.52 55.52 58.88 20/07/1971 57.08 20-Aug-16 15 8 6 75.00
58 Sone Maner Bihar 51.00 52.00 53.79 10/09/1976 53.70 21-Aug-16 05 22 21 95.45
59 Sone Bansagar Dam Madhya Pradesh 341.64 25-Sep-16 12 14 9 64.29
60 PunPun Sripalpur Bihar 49.60 50.60 53.91 18/09/1976 53.34 13-Sep-16 13 64 61 95.31
61 Gandak Khadda Uttar Pradesh 95.00 96.00 97.50 23/07/2002 95.88 23-Jul-16 15 76 76 100.00
62 Gandak Chatia Bihar 68.15 69.15 70.04 26/07/2002 68.56 31-Jul-16 06 4 4 100.00
63 Gandak Rewaghat Bihar 53.41 54.41 55.41 17/09/1986 54.36 31-Aug-16 23 12 12 100.00
64 Gandak Hazipur Bihar 49.32 50.32 50.93 1948 50.39 21-Aug-16 04 17 17 100.00
65 Rihand Rihand Dam Uttar Pradesh 265.97 06-Sep-16 08 13 10 76.92
66 Burhi Gandak Lalbeghiaghat Bihar 62.20 63.20 67.09 30/07/1975 61.77 24-Jul-16 10 0 0 -
67 Burhi Gandak Muzaffarpur Bihar 51.53 52.53 54.29 15/08/1987 50.29 04-Aug-16 09 0 0 -
68 Burhi Gandak Samastipur Bihar 45.02 46.02 49.38 15/08/1987 43.63 04-Aug-16 05 0 0 -
69 Burhi Gandak Rosera Bihar 41.63 42.63 46.35 16/08/1987 41.19 18-Sep-16 05 0 0 -
70 Burhi Gandak Khagaria Bihar 35.58 36.58 39.22 1976 38.30 31-Aug-16 01 62 62 100.00
FRL 341.65
FRL 399.99
FRL=268.22
69
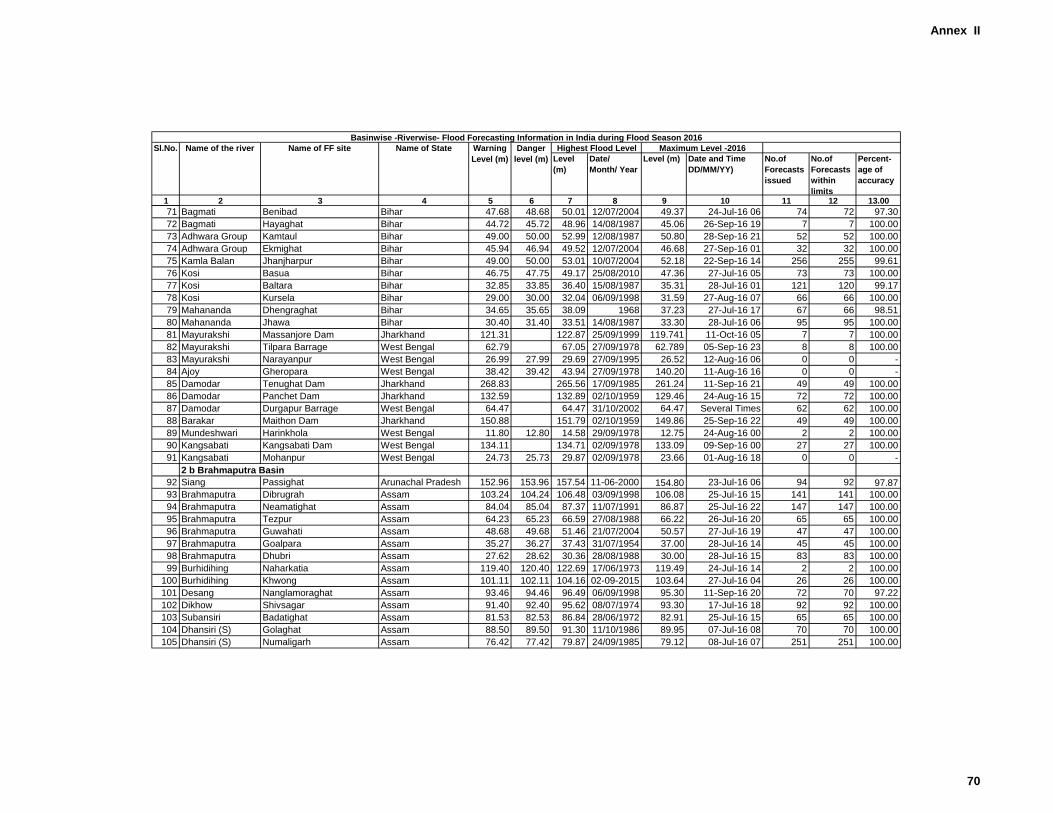
Annex II
Level
(m)
Date/
Month/ Year
Level (m) Date and Time
DD/MM/YY)
No.of
Forecasts
issued
No.of
Forecasts
within
limits
Percent-
age of
accuracy
1 2 3 4 5 6 7 8 9 10 11 12 13.00
Basinwise -Riverwise- Flood Forecasting Information in India during Flood Season 2016
Sl.No. Name of the river Name of FF site Name of State Warning
Level (m)
Danger
level (m)
Highest Flood Level Maximum Level -2016
71 Bagmati Benibad Bihar 47.68 48.68 50.01 12/07/2004 49.37 24-Jul-16 06 74 72 97.30
72 Bagmati Hayaghat Bihar 44.72 45.72 48.96 14/08/1987 45.06 26-Sep-16 19 7 7 100.00
73 Adhwara Group Kamtaul Bihar 49.00 50.00 52.99 12/08/1987 50.80 28-Sep-16 21 52 52 100.00
74 Adhwara Group Ekmighat Bihar 45.94 46.94 49.52 12/07/2004 46.68 27-Sep-16 01 32 32 100.00
75 Kamla Balan Jhanjharpur Bihar 49.00 50.00 53.01 10/07/2004 52.18 22-Sep-16 14 256 255 99.61
76 Kosi Basua Bihar 46.75 47.75 49.17 25/08/2010 47.36 27-Jul-16 05 73 73 100.00
77 Kosi Baltara Bihar 32.85 33.85 36.40 15/08/1987 35.31 28-Jul-16 01 121 120 99.17
78 Kosi Kursela Bihar 29.00 30.00 32.04 06/09/1998 31.59 27-Aug-16 07 66 66 100.00
79 Mahananda Dhengraghat Bihar 34.65 35.65 38.09 1968 37.23 27-Jul-16 17 67 66 98.51
80 Mahananda Jhawa Bihar 30.40 31.40 33.51 14/08/1987 33.30 28-Jul-16 06 95 95 100.00
81 Mayurakshi Massanjore Dam Jharkhand 121.31 122.87 25/09/1999 119.741 11-Oct-16 05 7 7 100.00
82 Mayurakshi Tilpara Barrage West Bengal 62.79 67.05 27/09/1978 62.789 05-Sep-16 23 8 8 100.00
83 Mayurakshi Narayanpur West Bengal 26.99 27.99 29.69 27/09/1995 26.52 12-Aug-16 06 0 0 -
84 Ajoy Gheropara West Bengal 38.42 39.42 43.94 27/09/1978 140.20 11-Aug-16 16 0 0 -
85 Damodar Tenughat Dam Jharkhand 268.83 265.56 17/09/1985 261.24 11-Sep-16 21 49 49 100.00
86 Damodar Panchet Dam Jharkhand 132.59 132.89 02/10/1959 129.46 24-Aug-16 15 72 72 100.00
87 Damodar Durgapur Barrage West Bengal 64.47 64.47 31/10/2002 64.47 Several Times 62 62 100.00
88 Barakar Maithon Dam Jharkhand 150.88 151.79 02/10/1959 149.86 25-Sep-16 22 49 49 100.00
89 Mundeshwari Harinkhola West Bengal 11.80 12.80 14.58 29/09/1978 12.75 24-Aug-16 00 2 2 100.00
90 Kangsabati Kangsabati Dam West Bengal 134.11 134.71 02/09/1978 133.09 09-Sep-16 00 27 27 100.00
91 Kangsabati Mohanpur West Bengal 24.73 25.73 29.87 02/09/1978 23.66 01-Aug-16 18 0 0 -
2 b Brahmaputra Basin
92 Siang Passighat Arunachal Pradesh 152.96 153.96 157.54 11-06-2000 154.80 23-Jul-16 06 94 92 97.87
93 Brahmaputra Dibrugrah Assam 103.24 104.24 106.48 03/09/1998 106.08 25-Jul-16 15 141 141 100.00
94 Brahmaputra Neamatighat Assam 84.04 85.04 87.37 11/07/1991 86.87 25-Jul-16 22 147 147 100.00
95 Brahmaputra Tezpur Assam 64.23 65.23 66.59 27/08/1988 66.22 26-Jul-16 20 65 65 100.00
96 Brahmaputra Guwahati Assam 48.68 49.68 51.46 21/07/2004 50.57 27-Jul-16 19 47 47 100.00
97 Brahmaputra Goalpara Assam 35.27 36.27 37.43 31/07/1954 37.00 28-Jul-16 14 45 45 100.00
98 Brahmaputra Dhubri Assam 27.62 28.62 30.36 28/08/1988 30.00 28-Jul-16 15 83 83 100.00
99 Burhidihing Naharkatia Assam 119.40 120.40 122.69 17/06/1973 119.49 24-Jul-16 14 2 2 100.00
100 Burhidihing Khwong Assam 101.11 102.11 104.16 02-09-2015 103.64 27-Jul-16 04 26 26 100.00
101 Desang Nanglamoraghat Assam 93.46 94.46 96.49 06/09/1998 95.30 11-Sep-16 20 72 70 97.22
102 Dikhow Shivsagar Assam 91.40 92.40 95.62 08/07/1974 93.30 17-Jul-16 18 92 92 100.00
103 Subansiri Badatighat Assam 81.53 82.53 86.84 28/06/1972 82.91 25-Jul-16 15 65 65 100.00
104 Dhansiri (S) Golaghat Assam 88.50 89.50 91.30 11/10/1986 89.95 07-Jul-16 08 70 70 100.00
105 Dhansiri (S) Numaligarh Assam 76.42 77.42 79.87 24/09/1985 79.12 08-Jul-16 07 251 251 100.00
70
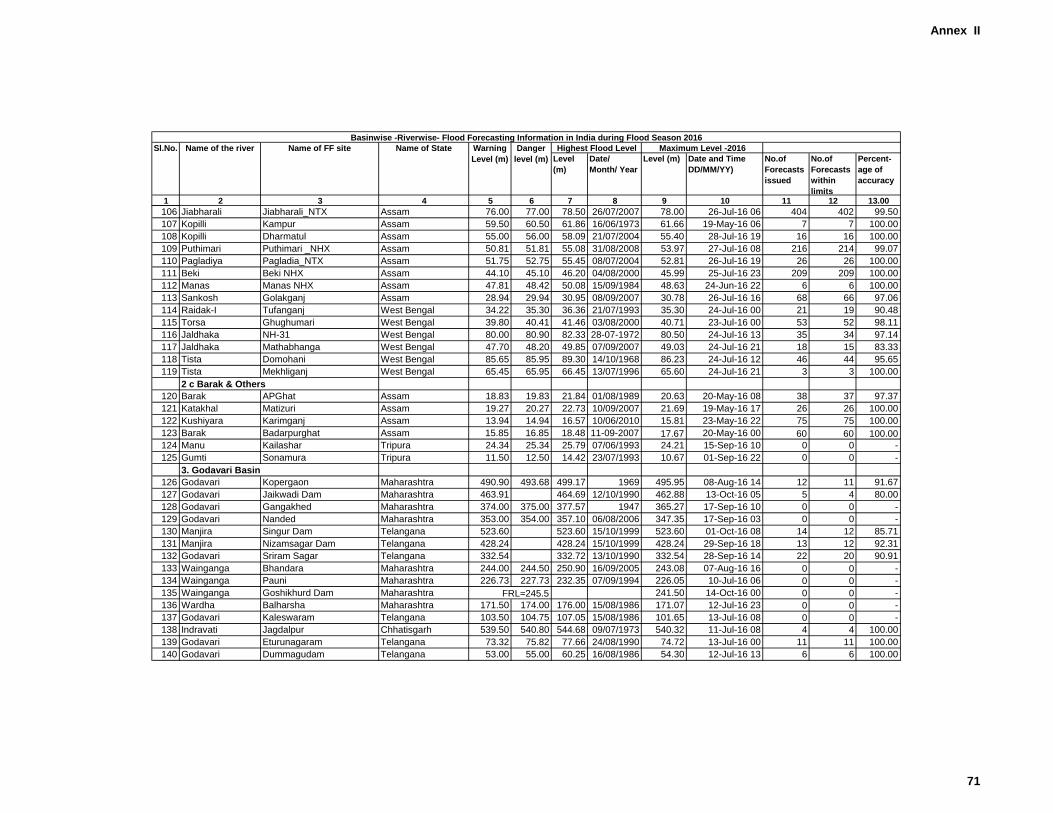
Annex II
Level
(m)
Date/
Month/ Year
Level (m) Date and Time
DD/MM/YY)
No.of
Forecasts
issued
No.of
Forecasts
within
limits
Percent-
age of
accuracy
1 2 3 4 5 6 7 8 9 10 11 12 13.00
Basinwise -Riverwise- Flood Forecasting Information in India during Flood Season 2016
Sl.No. Name of the river Name of FF site Name of State Warning
Level (m)
Danger
level (m)
Highest Flood Level Maximum Level -2016
106 Jiabharali Jiabharali_NTX Assam 76.00 77.00 78.50 26/07/2007 78.00 26-Jul-16 06 404 402 99.50
107 Kopilli Kampur Assam 59.50 60.50 61.86 16/06/1973 61.66 19-May-16 06 7 7 100.00
108 Kopilli Dharmatul Assam 55.00 56.00 58.09 21/07/2004 55.40 28-Jul-16 19 16 16 100.00
109 Puthimari Puthimari _NHX Assam 50.81 51.81 55.08 31/08/2008 53.97 27-Jul-16 08 216 214 99.07
110 Pagladiya Pagladia_NTX Assam 51.75 52.75 55.45 08/07/2004 52.81 26-Jul-16 19 26 26 100.00
111 Beki Beki NHX Assam 44.10 45.10 46.20 04/08/2000 45.99 25-Jul-16 23 209 209 100.00
112 Manas Manas NHX Assam 47.81 48.42 50.08 15/09/1984 48.63 24-Jun-16 22 6 6 100.00
113 Sankosh Golakganj Assam 28.94 29.94 30.95 08/09/2007 30.78 26-Jul-16 16 68 66 97.06
114 Raidak-I Tufanganj West Bengal 34.22 35.30 36.36 21/07/1993 35.30 24-Jul-16 00 21 19 90.48
115 Torsa Ghughumari West Bengal 39.80 40.41 41.46 03/08/2000 40.71 23-Jul-16 00 53 52 98.11
116 Jaldhaka NH-31 West Bengal 80.00 80.90 82.33 28-07-1972 80.50 24-Jul-16 13 35 34 97.14
117 Jaldhaka Mathabhanga West Bengal 47.70 48.20 49.85 07/09/2007 49.03 24-Jul-16 21 18 15 83.33
118 Tista Domohani West Bengal 85.65 85.95 89.30 14/10/1968 86.23 24-Jul-16 12 46 44 95.65
119 Tista Mekhliganj West Bengal 65.45 65.95 66.45 13/07/1996 65.60 24-Jul-16 21 3 3 100.00
2 c Barak & Others
120 Barak APGhat Assam 18.83 19.83 21.84 01/08/1989 20.63 20-May-16 08 38 37 97.37
121 Katakhal Matizuri Assam 19.27 20.27 22.73 10/09/2007 21.69 19-May-16 17 26 26 100.00
122 Kushiyara Karimganj Assam 13.94 14.94 16.57 10/06/2010 15.81 23-May-16 22 75 75 100.00
123 Barak Badarpurghat Assam 15.85 16.85 18.48 11-09-2007 17.67 20-May-16 00 60 60 100.00
124 Manu Kailashar Tripura 24.34 25.34 25.79 07/06/1993 24.21 15-Sep-16 10 0 0 -
125 Gumti Sonamura Tripura 11.50 12.50 14.42 23/07/1993 10.67 01-Sep-16 22 0 0 -
3. Godavari Basin
126 Godavari Kopergaon Maharashtra 490.90 493.68 499.17 1969 495.95 08-Aug-16 14 12 11 91.67
127 Godavari Jaikwadi Dam Maharashtra 463.91 464.69 12/10/1990 462.88 13-Oct-16 05 5 4 80.00
128 Godavari Gangakhed Maharashtra 374.00 375.00 377.57 1947 365.27 17-Sep-16 10 0 0 -
129 Godavari Nanded Maharashtra 353.00 354.00 357.10 06/08/2006 347.35 17-Sep-16 03 0 0 -
130 Manjira Singur Dam Telangana 523.60 523.60 15/10/1999 523.60 01-Oct-16 08 14 12 85.71
131 Manjira Nizamsagar Dam Telangana 428.24 428.24 15/10/1999 428.24 29-Sep-16 18 13 12 92.31
132 Godavari Sriram Sagar Telangana 332.54 332.72 13/10/1990 332.54 28-Sep-16 14 22 20 90.91
133 Wainganga Bhandara Maharashtra 244.00 244.50 250.90 16/09/2005 243.08 07-Aug-16 16 0 0 -
134 Wainganga Pauni Maharashtra 226.73 227.73 232.35 07/09/1994 226.05 10-Jul-16 06 0 0 -
135 Wainganga Goshikhurd Dam Maharashtra 241.50 14-Oct-16 00 0 0 -
136 Wardha Balharsha Maharashtra 171.50 174.00 176.00 15/08/1986 171.07 12-Jul-16 23 0 0 -
137 Godavari Kaleswaram Telangana 103.50 104.75 107.05 15/08/1986 101.65 13-Jul-16 08 0 0 -
138 Indravati Jagdalpur Chhatisgarh 539.50 540.80 544.68 09/07/1973 540.32 11-Jul-16 08 4 4 100.00
139 Godavari Eturunagaram Telangana 73.32 75.82 77.66 24/08/1990 74.72 13-Jul-16 00 11 11 100.00
140 Godavari Dummagudam Telangana 53.00 55.00 60.25 16/08/1986 54.30 12-Jul-16 13 6 6 100.00
FRL=245.5
71
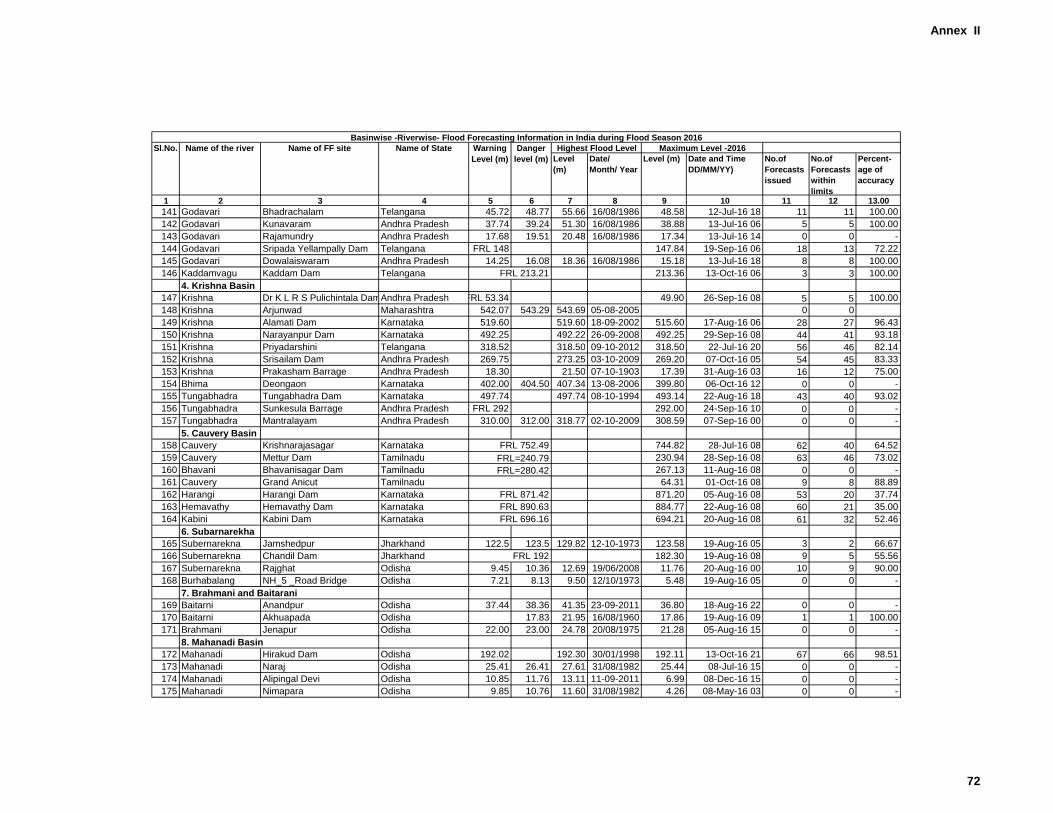
Annex II
Level
(m)
Date/
Month/ Year
Level (m) Date and Time
DD/MM/YY)
No.of
Forecasts
issued
No.of
Forecasts
within
limits
Percent-
age of
accuracy
1 2 3 4 5 6 7 8 9 10 11 12 13.00
Basinwise -Riverwise- Flood Forecasting Information in India during Flood Season 2016
Sl.No. Name of the river Name of FF site Name of State Warning
Level (m)
Danger
level (m)
Highest Flood Level Maximum Level -2016
141 Godavari Bhadrachalam Telangana 45.72 48.77 55.66 16/08/1986 48.58 12-Jul-16 18 11 11 100.00
142 Godavari Kunavaram Andhra Pradesh 37.74 39.24 51.30 16/08/1986 38.88 13-Jul-16 06 5 5 100.00
143 Godavari Rajamundry Andhra Pradesh 17.68 19.51 20.48 16/08/1986 17.34 13-Jul-16 14 0 0 -
144 Godavari Sripada Yellampally Dam Telangana FRL 148 147.84 19-Sep-16 06 18 13 72.22
145 Godavari Dowalaiswaram Andhra Pradesh 14.25 16.08 18.36 16/08/1986 15.18 13-Jul-16 18 8 8 100.00
146 Kaddamvagu Kaddam Dam Telangana 213.36 13-Oct-16 06 3 3 100.00
4. Krishna Basin
147 Krishna Dr K L R S Pulichintala DamAndhra Pradesh FRL 53.34 49.90 26-Sep-16 08 5 5 100.00
148 Krishna Arjunwad Maharashtra 542.07 543.29 543.69 05-08-2005 0 0
149 Krishna Alamati Dam Karnataka 519.60 519.60 18-09-2002 515.60 17-Aug-16 06 28 27 96.43
150 Krishna Narayanpur Dam Karnataka 492.25 492.22 26-09-2008 492.25 29-Sep-16 08 44 41 93.18
151 Krishna Priyadarshini Telangana 318.52 318.50 09-10-2012 318.50 22-Jul-16 20 56 46 82.14
152 Krishna Srisailam Dam Andhra Pradesh 269.75 273.25 03-10-2009 269.20 07-Oct-16 05 54 45 83.33
153 Krishna Prakasham Barrage Andhra Pradesh 18.30 21.50 07-10-1903 17.39 31-Aug-16 03 16 12 75.00
154 Bhima Deongaon Karnataka 402.00 404.50 407.34 13-08-2006 399.80 06-Oct-16 12 0 0 -
155 Tungabhadra Tungabhadra Dam Karnataka 497.74 497.74 08-10-1994 493.14 22-Aug-16 18 43 40 93.02
156 Tungabhadra Sunkesula Barrage Andhra Pradesh FRL 292 292.00 24-Sep-16 10 0 0 -
157 Tungabhadra Mantralayam Andhra Pradesh 310.00 312.00 318.77 02-10-2009 308.59 07-Sep-16 00 0 0 -
5. Cauvery Basin
158 Cauvery Krishnarajasagar Karnataka 744.82 28-Jul-16 08 62 40 64.52
159 Cauvery Mettur Dam Tamilnadu 230.94 28-Sep-16 08 63 46 73.02
160 Bhavani Bhavanisagar Dam Tamilnadu 267.13 11-Aug-16 08 0 0 -
161 Cauvery Grand Anicut Tamilnadu 64.31 01-Oct-16 08 9 8 88.89
162 Harangi Harangi Dam Karnataka 871.20 05-Aug-16 08 53 20 37.74
163 Hemavathy Hemavathy Dam Karnataka 884.77 22-Aug-16 08 60 21 35.00
164 Kabini Kabini Dam Karnataka 694.21 20-Aug-16 08 61 32 52.46
6. Subarnarekha
165 Subernarekna Jamshedpur Jharkhand 122.5 123.5 129.82 12-10-1973 123.58 19-Aug-16 05 3 2 66.67
166 Subernarekna Chandil Dam Jharkhand 182.30 19-Aug-16 08 9 5 55.56
167 Subernarekna Rajghat Odisha 9.45 10.36 12.69 19/06/2008 11.76 20-Aug-16 00 10 9 90.00
168 Burhabalang NH_5 _Road Bridge Odisha 7.21 8.13 9.50 12/10/1973 5.48 19-Aug-16 05 0 0 -
7. Brahmani and Baitarani
169 Baitarni Anandpur Odisha 37.44 38.36 41.35 23-09-2011 36.80 18-Aug-16 22 0 0 -
170 Baitarni Akhuapada Odisha 17.83 21.95 16/08/1960 17.86 19-Aug-16 09 1 1 100.00
171 Brahmani Jenapur Odisha 22.00 23.00 24.78 20/08/1975 21.28 05-Aug-16 15 0 0 -
8. Mahanadi Basin
172 Mahanadi Hirakud Dam Odisha 192.02 192.30 30/01/1998 192.11 13-Oct-16 21 67 66 98.51
173 Mahanadi Naraj Odisha 25.41 26.41 27.61 31/08/1982 25.44 08-Jul-16 15 0 0 -
174 Mahanadi Alipingal Devi Odisha 10.85 11.76 13.11 11-09-2011 6.99 08-Dec-16 15 0 0 -
175 Mahanadi Nimapara Odisha 9.85 10.76 11.60 31/08/1982 4.26 08-May-16 03 0 0 -
FRL 213.21
FRL 871.42
FRL 890.63
FRL 752.49
FRL 696.16
FRL=240.79
FRL=280.42
FRL 192
72
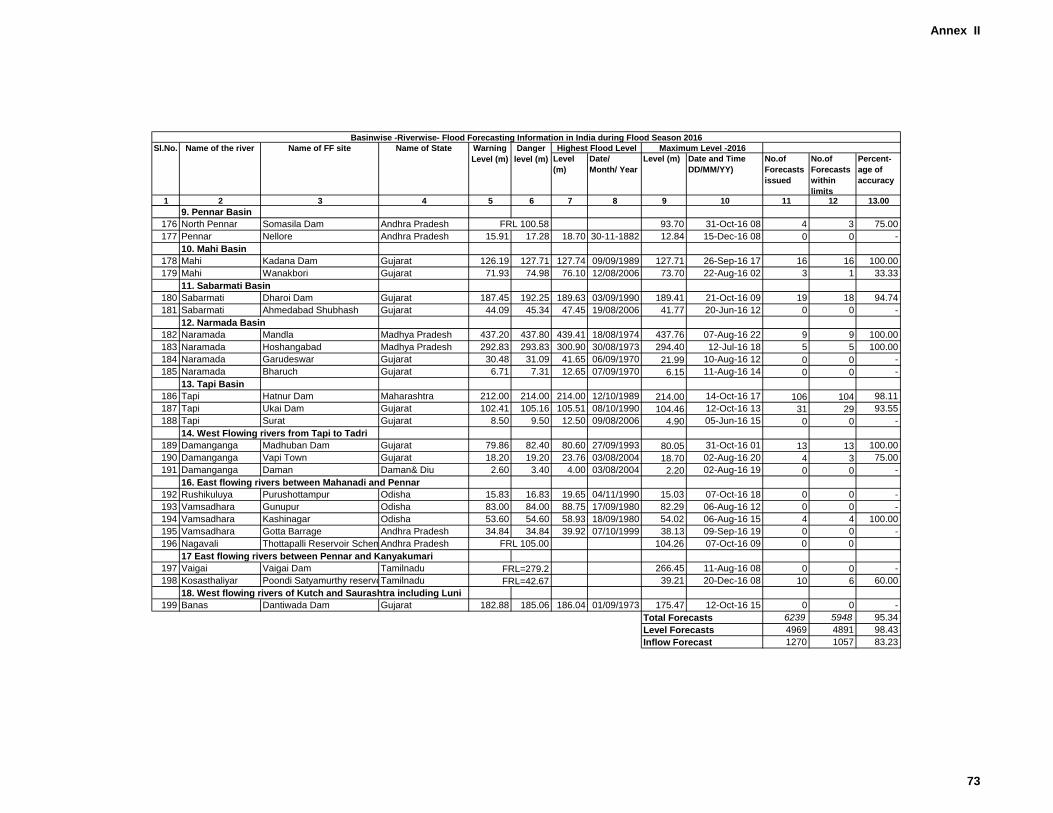
Annex II
Level
(m)
Date/
Month/ Year
Level (m) Date and Time
DD/MM/YY)
No.of
Forecasts
issued
No.of
Forecasts
within
limits
Percent-
age of
accuracy
1 2 3 4 5 6 7 8 9 10 11 12 13.00
Basinwise -Riverwise- Flood Forecasting Information in India during Flood Season 2016
Sl.No. Name of the river Name of FF site Name of State Warning
Level (m)
Danger
level (m)
Highest Flood Level Maximum Level -2016
9. Pennar Basin
176 North Pennar Somasila Dam Andhra Pradesh 93.70 31-Oct-16 08 4 3 75.00
177 Pennar Nellore Andhra Pradesh 15.91 17.28 18.70 30-11-1882 12.84 15-Dec-16 08 0 0 -
10. Mahi Basin
178 Mahi Kadana Dam Gujarat 126.19 127.71 127.74 09/09/1989 127.71 26-Sep-16 17 16 16 100.00
179 Mahi Wanakbori Gujarat 71.93 74.98 76.10 12/08/2006 73.70 22-Aug-16 02 3 1 33.33
11. Sabarmati Basin
180 Sabarmati Dharoi Dam Gujarat 187.45 192.25 189.63 03/09/1990 189.41 21-Oct-16 09 19 18 94.74
181 Sabarmati Ahmedabad Shubhash
Bridge
Gujarat 44.09 45.34 47.45 19/08/2006 41.77 20-Jun-16 12 0 0 -
12. Narmada Basin
182 Naramada Mandla Madhya Pradesh 437.20 437.80 439.41 18/08/1974 437.76 07-Aug-16 22 9 9 100.00
183 Naramada Hoshangabad Madhya Pradesh 292.83 293.83 300.90 30/08/1973 294.40 12-Jul-16 18 5 5 100.00
184 Naramada Garudeswar Gujarat 30.48 31.09 41.65 06/09/1970 21.99 10-Aug-16 12 0 0 -
185 Naramada Bharuch Gujarat 6.71 7.31 12.65 07/09/1970 6.15 11-Aug-16 14 0 0 -
13. Tapi Basin
186 Tapi Hatnur Dam Maharashtra 212.00 214.00 214.00 12/10/1989 214.00 14-Oct-16 17 106 104 98.11
187 Tapi Ukai Dam Gujarat 102.41 105.16 105.51 08/10/1990 104.46 12-Oct-16 13 31 29 93.55
188 Tapi Surat Gujarat 8.50 9.50 12.50 09/08/2006 4.90 05-Jun-16 15 0 0 -
14. West Flowing rivers from Tapi to Tadri
189 Damanganga Madhuban Dam Gujarat 79.86 82.40 80.60 27/09/1993 80.05 31-Oct-16 01 13 13 100.00
190 Damanganga Vapi Town Gujarat 18.20 19.20 23.76 03/08/2004 18.70 02-Aug-16 20 4 3 75.00
191 Damanganga Daman Daman& Diu 2.60 3.40 4.00 03/08/2004 2.20 02-Aug-16 19 0 0 -
16. East flowing rivers between Mahanadi and Pennar
192 Rushikuluya Purushottampur Odisha 15.83 16.83 19.65 04/11/1990 15.03 07-Oct-16 18 0 0 -
193 Vamsadhara Gunupur Odisha 83.00 84.00 88.75 17/09/1980 82.29 06-Aug-16 12 0 0 -
194 Vamsadhara Kashinagar Odisha 53.60 54.60 58.93 18/09/1980 54.02 06-Aug-16 15 4 4 100.00
195 Vamsadhara Gotta Barrage Andhra Pradesh 34.84 34.84 39.92 07/10/1999 38.13 09-Sep-16 19 0 0 -
196 Nagavali Thottapalli Reservoir SchemeAndhra Pradesh 104.26 07-Oct-16 09 0 0
17 East flowing rivers between Pennar and Kanyakumari
197 Vaigai Vaigai Dam Tamilnadu 266.45 11-Aug-16 08 0 0 -
198 Kosasthaliyar Poondi Satyamurthy reservoirTamilnadu 39.21 20-Dec-16 08 10 6 60.00
18. West flowing rivers of Kutch and Saurashtra including Luni
199 Banas Dantiwada Dam Gujarat 182.88 185.06 186.04 01/09/1973 175.47 12-Oct-16 15 0 0 -
Total Forecasts 6239 5948 95.34
Level Forecasts 4969 4891 98.43
Inflow Forecast 1270 1057 83.23
FRL 105.00
FRL=279.2
FRL=42.67
FRL 100.58
73
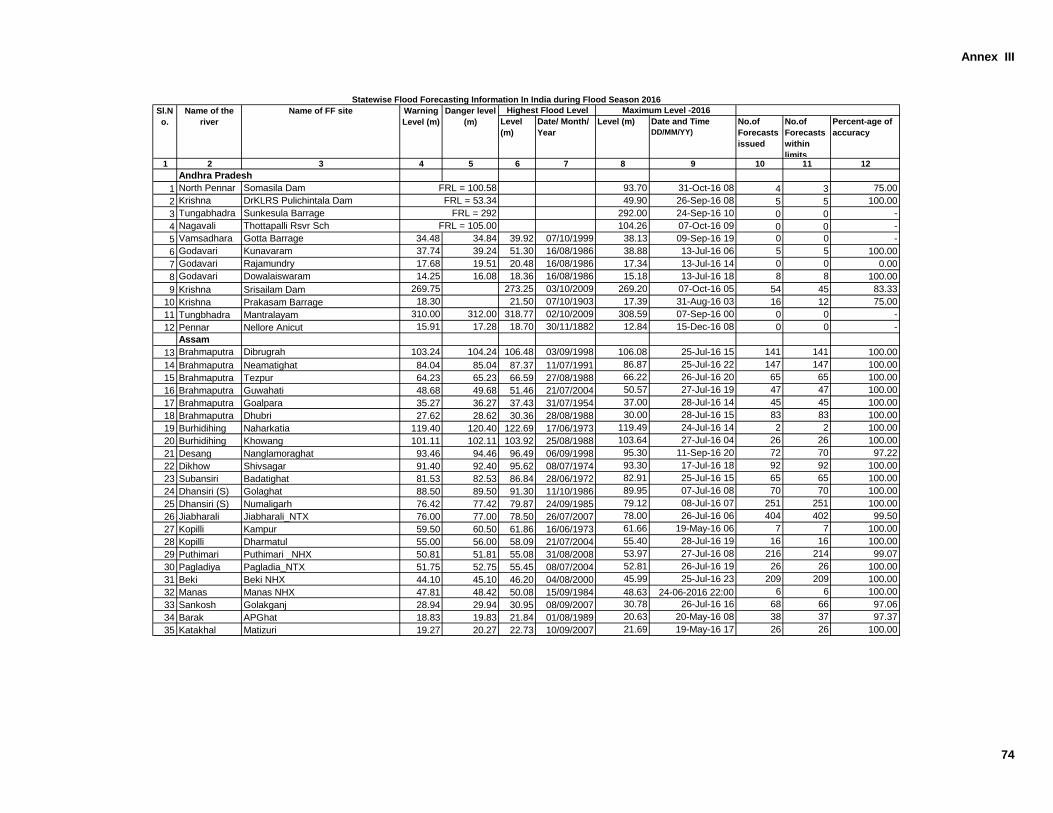
Annex III
Level
(m)
Date/ Month/
Year
Level (m) Date and Time
DD/MM/YY)
No.of
Forecasts
issued
No.of
Forecasts
within
limits
Percent-age of
accuracy
1 2 3 4 5 6 7 8 9 10 11 12
Andhra Pradesh
1 North Pennar Somasila Dam 93.70 31-Oct-16 08 4 3 75.00
2 Krishna DrKLRS Pulichintala Dam 49.90 26-Sep-16 08 5 5 100.00
3 Tungabhadra Sunkesula Barrage 292.00 24-Sep-16 10 0 0 -
4 Nagavali Thottapalli Rsvr Sch 104.26 07-Oct-16 09 0 0 -
5 Vamsadhara Gotta Barrage 34.48 34.84 39.92 07/10/1999 38.13 09-Sep-16 19 0 0 -
6 Godavari Kunavaram 37.74 39.24 51.30 16/08/1986 38.88 13-Jul-16 06 5 5 100.00
7 Godavari Rajamundry 17.68 19.51 20.48 16/08/1986 17.34 13-Jul-16 14 0 0 0.00
8 Godavari Dowalaiswaram 14.25 16.08 18.36 16/08/1986 15.18 13-Jul-16 18 8 8 100.00
9 Krishna Srisailam Dam 269.75 273.25 03/10/2009 269.20 07-Oct-16 05 54 45 83.33
10 Krishna Prakasam Barrage 18.30 21.50 07/10/1903 17.39 31-Aug-16 03 16 12 75.00
11 Tungbhadra Mantralayam 310.00 312.00 318.77 02/10/2009 308.59 07-Sep-16 00 0 0 -
12 Pennar Nellore Anicut 15.91 17.28 18.70 30/11/1882 12.84 15-Dec-16 08 0 0 -
Assam
13 Brahmaputra Dibrugrah 103.24 104.24 106.48 03/09/1998 106.08 25-Jul-16 15 141 141 100.00
14 Brahmaputra Neamatighat 84.04 85.04 87.37 11/07/1991 86.87 25-Jul-16 22 147 147 100.00
15 Brahmaputra Tezpur 64.23 65.23 66.59 27/08/1988 66.22 26-Jul-16 20 65 65 100.00
16 Brahmaputra Guwahati 48.68 49.68 51.46 21/07/2004 50.57 27-Jul-16 19 47 47 100.00
17 Brahmaputra Goalpara 35.27 36.27 37.43 31/07/1954 37.00 28-Jul-16 14 45 45 100.00
18 Brahmaputra Dhubri 27.62 28.62 30.36 28/08/1988 30.00 28-Jul-16 15 83 83 100.00
19 Burhidihing Naharkatia 119.40 120.40 122.69 17/06/1973 119.49 24-Jul-16 14 2 2 100.00
20 Burhidihing Khowang 101.11 102.11 103.92 25/08/1988 103.64 27-Jul-16 04 26 26 100.00
21 Desang Nanglamoraghat 93.46 94.46 96.49 06/09/1998 95.30 11-Sep-16 20 72 70 97.22
22 Dikhow Shivsagar 91.40 92.40 95.62 08/07/1974 93.30 17-Jul-16 18 92 92 100.00
23 Subansiri Badatighat 81.53 82.53 86.84 28/06/1972 82.91 25-Jul-16 15 65 65 100.00
24 Dhansiri (S) Golaghat 88.50 89.50 91.30 11/10/1986 89.95 07-Jul-16 08 70 70 100.00
25 Dhansiri (S) Numaligarh 76.42 77.42 79.87 24/09/1985 79.12 08-Jul-16 07 251 251 100.00
26 Jiabharali Jiabharali_NTX 76.00 77.00 78.50 26/07/2007 78.00 26-Jul-16 06 404 402 99.50
27 Kopilli Kampur 59.50 60.50 61.86 16/06/1973 61.66 19-May-16 06 7 7 100.00
28 Kopilli Dharmatul 55.00 56.00 58.09 21/07/2004 55.40 28-Jul-16 19 16 16 100.00
29 Puthimari Puthimari _NHX 50.81 51.81 55.08 31/08/2008 53.97 27-Jul-16 08 216 214 99.07
30 Pagladiya Pagladia_NTX 51.75 52.75 55.45 08/07/2004 52.81 26-Jul-16 19 26 26 100.00
31 Beki Beki NHX 44.10 45.10 46.20 04/08/2000 45.99 25-Jul-16 23 209 209 100.00
32 Manas Manas NHX 47.81 48.42 50.08 15/09/1984 48.63 24-06-2016 22:00 6 6 100.00
33 Sankosh Golakganj 28.94 29.94 30.95 08/09/2007 30.78 26-Jul-16 16 68 66 97.06
34 Barak APGhat 18.83 19.83 21.84 01/08/1989 20.63 20-May-16 08 38 37 97.37
35 Katakhal Matizuri 19.27 20.27 22.73 10/09/2007 21.69 19-May-16 17 26 26 100.00
FRL = 105.00
Statewise Flood Forecasting Information In India during Flood Season 2016
Sl.N
o.
Name of the
river
Name of FF site Warning
Level (m)
Danger level
(m)
Highest Flood Level Maximum Level -2016
FRL = 100.58
FRL = 53.34
FRL = 292
74
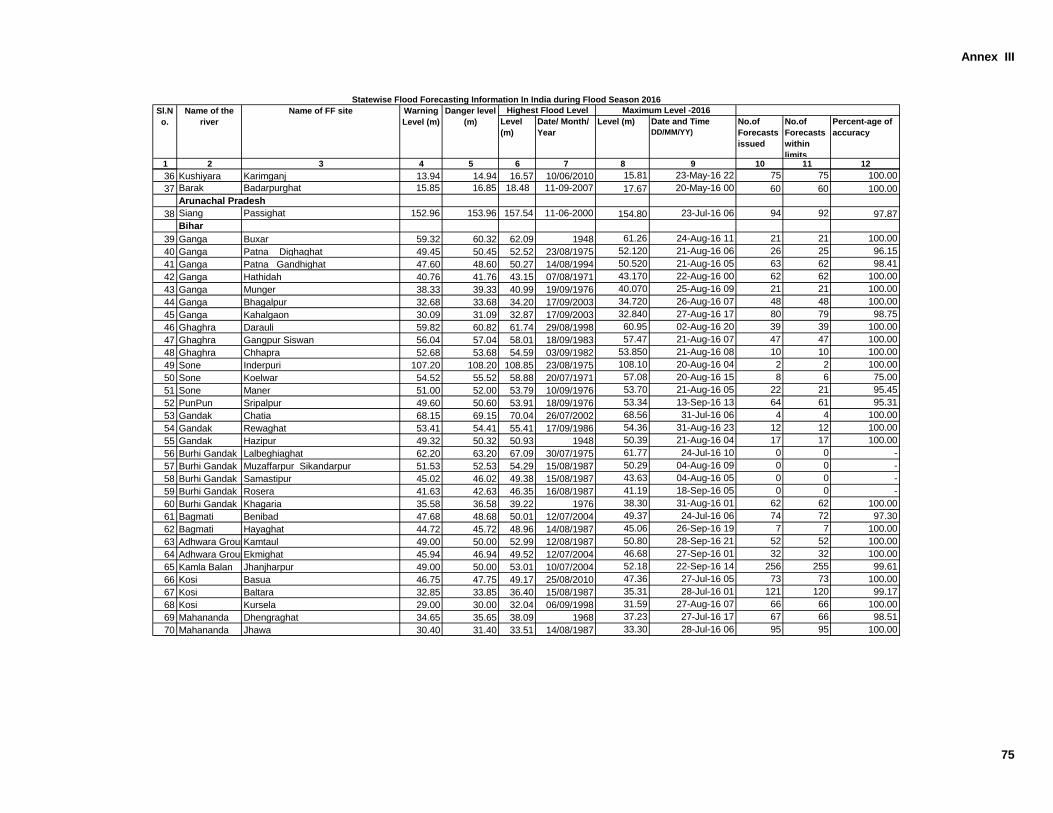
Annex III
Level
(m)
Date/ Month/
Year
Level (m) Date and Time
DD/MM/YY)
No.of
Forecasts
issued
No.of
Forecasts
within
limits
Percent-age of
accuracy
1 2 3 4 5 6 7 8 9 10 11 12
Statewise Flood Forecasting Information In India during Flood Season 2016
Sl.N
o.
Name of the
river
Name of FF site Warning
Level (m)
Danger level
(m)
Highest Flood Level Maximum Level -2016
36 Kushiyara Karimganj 13.94 14.94 16.57 10/06/2010 15.81 23-May-16 22 75 75 100.00
37 Barak Badarpurghat 15.85 16.85 18.48 11-09-2007 17.67 20-May-16 00 60 60 100.00
Arunachal Pradesh
38 Siang Passighat 152.96 153.96 157.54 11-06-2000 154.80 23-Jul-16 06 94 92 97.87
Bihar
39 Ganga Buxar 59.32 60.32 62.09 1948 61.26 24-Aug-16 11 21 21 100.00
40 Ganga Patna Dighaghat 49.45 50.45 52.52 23/08/1975 52.120 21-Aug-16 06 26 25 96.15
41 Ganga Patna Gandhighat 47.60 48.60 50.27 14/08/1994 50.520 21-Aug-16 05 63 62 98.41
42 Ganga Hathidah 40.76 41.76 43.15 07/08/1971 43.170 22-Aug-16 00 62 62 100.00
43 Ganga Munger 38.33 39.33 40.99 19/09/1976 40.070 25-Aug-16 09 21 21 100.00
44 Ganga Bhagalpur 32.68 33.68 34.20 17/09/2003 34.720 26-Aug-16 07 48 48 100.00
45 Ganga Kahalgaon 30.09 31.09 32.87 17/09/2003 32.840 27-Aug-16 17 80 79 98.75
46 Ghaghra Darauli 59.82 60.82 61.74 29/08/1998 60.95 02-Aug-16 20 39 39 100.00
47 Ghaghra Gangpur Siswan 56.04 57.04 58.01 18/09/1983 57.47 21-Aug-16 07 47 47 100.00
48 Ghaghra Chhapra 52.68 53.68 54.59 03/09/1982 53.850 21-Aug-16 08 10 10 100.00
49 Sone Inderpuri 107.20 108.20 108.85 23/08/1975 108.10 20-Aug-16 04 2 2 100.00
50 Sone Koelwar 54.52 55.52 58.88 20/07/1971 57.08 20-Aug-16 15 8 6 75.00
51 Sone Maner 51.00 52.00 53.79 10/09/1976 53.70 21-Aug-16 05 22 21 95.45
52 PunPun Sripalpur 49.60 50.60 53.91 18/09/1976 53.34 13-Sep-16 13 64 61 95.31
53 Gandak Chatia 68.15 69.15 70.04 26/07/2002 68.56 31-Jul-16 06 4 4 100.00
54 Gandak Rewaghat 53.41 54.41 55.41 17/09/1986 54.36 31-Aug-16 23 12 12 100.00
55 Gandak Hazipur 49.32 50.32 50.93 1948 50.39 21-Aug-16 04 17 17 100.00
56 Burhi Gandak Lalbeghiaghat 62.20 63.20 67.09 30/07/1975 61.77 24-Jul-16 10 0 0 -
57 Burhi Gandak Muzaffarpur Sikandarpur 51.53 52.53 54.29 15/08/1987 50.29 04-Aug-16 09 0 0 -
58 Burhi Gandak Samastipur 45.02 46.02 49.38 15/08/1987 43.63 04-Aug-16 05 0 0 -
59 Burhi Gandak Rosera 41.63 42.63 46.35 16/08/1987 41.19 18-Sep-16 05 0 0 -
60 Burhi Gandak Khagaria 35.58 36.58 39.22 1976 38.30 31-Aug-16 01 62 62 100.00
61 Bagmati Benibad 47.68 48.68 50.01 12/07/2004 49.37 24-Jul-16 06 74 72 97.30
62 Bagmati Hayaghat 44.72 45.72 48.96 14/08/1987 45.06 26-Sep-16 19 7 7 100.00
63 Adhwara GroupKamtaul 49.00 50.00 52.99 12/08/1987 50.80 28-Sep-16 21 52 52 100.00
64 Adhwara GroupEkmighat 45.94 46.94 49.52 12/07/2004 46.68 27-Sep-16 01 32 32 100.00
65 Kamla Balan Jhanjharpur 49.00 50.00 53.01 10/07/2004 52.18 22-Sep-16 14 256 255 99.61
66 Kosi Basua 46.75 47.75 49.17 25/08/2010 47.36 27-Jul-16 05 73 73 100.00
67 Kosi Baltara 32.85 33.85 36.40 15/08/1987 35.31 28-Jul-16 01 121 120 99.17
68 Kosi Kursela 29.00 30.00 32.04 06/09/1998 31.59 27-Aug-16 07 66 66 100.00
69 Mahananda Dhengraghat 34.65 35.65 38.09 1968 37.23 27-Jul-16 17 67 66 98.51
70 Mahananda Jhawa 30.40 31.40 33.51 14/08/1987 33.30 28-Jul-16 06 95 95 100.00
75
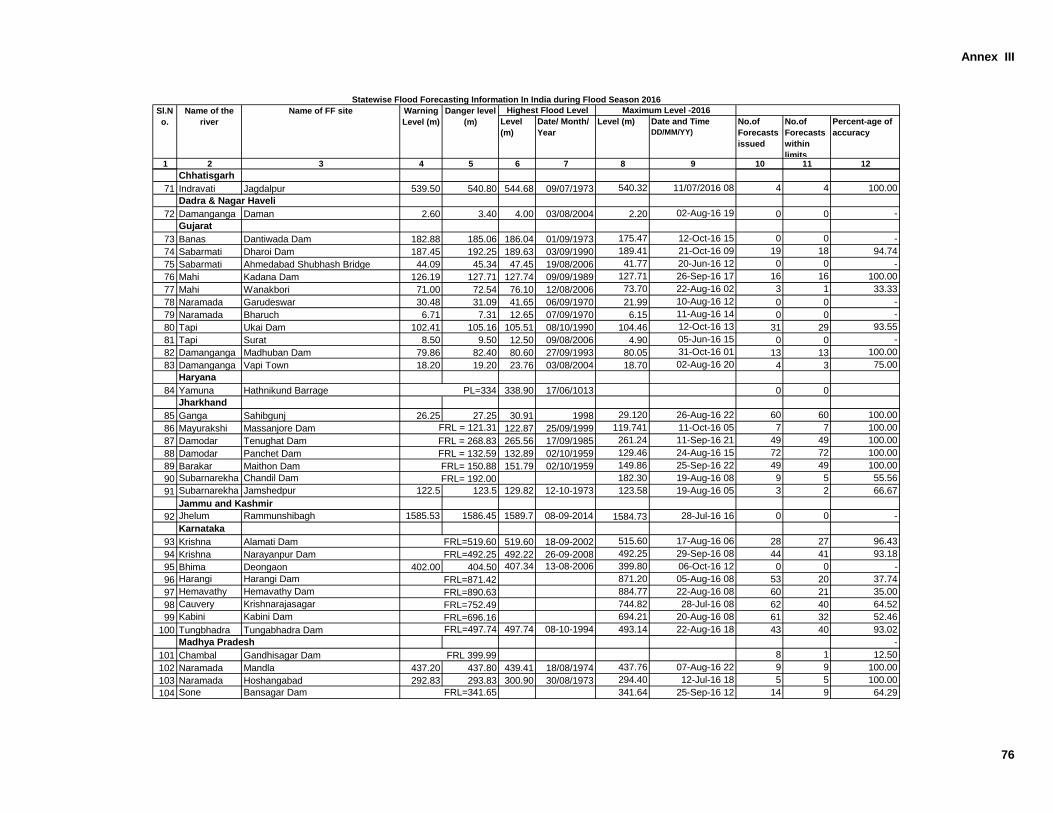
Annex III
Level
(m)
Date/ Month/
Year
Level (m) Date and Time
DD/MM/YY)
No.of
Forecasts
issued
No.of
Forecasts
within
limits
Percent-age of
accuracy
1 2 3 4 5 6 7 8 9 10 11 12
Statewise Flood Forecasting Information In India during Flood Season 2016
Sl.N
o.
Name of the
river
Name of FF site Warning
Level (m)
Danger level
(m)
Highest Flood Level Maximum Level -2016
Chhatisgarh
71 Indravati Jagdalpur 539.50 540.80 544.68 09/07/1973 540.32 11/07/2016 08 4 4 100.00
Dadra & Nagar Haveli
72 Damanganga Daman 2.60 3.40 4.00 03/08/2004 2.20 02-Aug-16 19 0 0 -
Gujarat
73 Banas Dantiwada Dam 182.88 185.06 186.04 01/09/1973 175.47 12-Oct-16 15 0 0 -
74 Sabarmati Dharoi Dam 187.45 192.25 189.63 03/09/1990 189.41 21-Oct-16 09 19 18 94.74
75 Sabarmati Ahmedabad Shubhash Bridge 44.09 45.34 47.45 19/08/2006 41.77 20-Jun-16 12 0 0 -
76 Mahi Kadana Dam 126.19 127.71 127.74 09/09/1989 127.71 26-Sep-16 17 16 16 100.00
77 Mahi Wanakbori 71.00 72.54 76.10 12/08/2006 73.70 22-Aug-16 02 3 1 33.33
78 Naramada Garudeswar 30.48 31.09 41.65 06/09/1970 21.99 10-Aug-16 12 0 0 -
79 Naramada Bharuch 6.71 7.31 12.65 07/09/1970 6.15 11-Aug-16 14 0 0 -
80 Tapi Ukai Dam 102.41 105.16 105.51 08/10/1990 104.46 12-Oct-16 13 31 29 93.55
81 Tapi Surat 8.50 9.50 12.50 09/08/2006 4.90 05-Jun-16 15 0 0 -
82 Damanganga Madhuban Dam 79.86 82.40 80.60 27/09/1993 80.05 31-Oct-16 01 13 13 100.00
83 Damanganga Vapi Town 18.20 19.20 23.76 03/08/2004 18.70 02-Aug-16 20 4 3 75.00
Haryana
84 Yamuna Hathnikund Barrage 338.90 17/06/1013 0 0
Jharkhand
85 Ganga Sahibgunj 26.25 27.25 30.91 1998 29.120 26-Aug-16 22 60 60 100.00
86 Mayurakshi Massanjore Dam 122.87 25/09/1999 119.741 11-Oct-16 05 7 7 100.00
87 Damodar Tenughat Dam 265.56 17/09/1985 261.24 11-Sep-16 21 49 49 100.00
88 Damodar Panchet Dam 132.89 02/10/1959 129.46 24-Aug-16 15 72 72 100.00
89 Barakar Maithon Dam 151.79 02/10/1959 149.86 25-Sep-16 22 49 49 100.00
90 Subarnarekha Chandil Dam 182.30 19-Aug-16 08 9 5 55.56
91 Subarnarekha Jamshedpur 122.5 123.5 129.82 12-10-1973 123.58 19-Aug-16 05 3 2 66.67
Jammu and Kashmir
92 Jhelum Rammunshibagh 1585.53 1586.45 1589.7 08-09-2014 1584.73 28-Jul-16 16 0 0 -
Karnataka
93 Krishna Alamati Dam 519.60 18-09-2002 515.60 17-Aug-16 06 28 27 96.43
94 Krishna Narayanpur Dam 492.22 26-09-2008 492.25 29-Sep-16 08 44 41 93.18
95 Bhima Deongaon 402.00 404.50 407.34 13-08-2006 399.80 06-Oct-16 12 0 0 -
96 Harangi Harangi Dam 871.20 05-Aug-16 08 53 20 37.74
97 Hemavathy Hemavathy Dam 884.77 22-Aug-16 08 60 21 35.00
98 Cauvery Krishnarajasagar 744.82 28-Jul-16 08 62 40 64.52
99 Kabini Kabini Dam 694.21 20-Aug-16 08 61 32 52.46
100 Tungbhadra Tungabhadra Dam 497.74 08-10-1994 493.14 22-Aug-16 18 43 40 93.02
Madhya Pradesh -
101 Chambal Gandhisagar Dam 8 1 12.50
102 Naramada Mandla 437.20 437.80 439.41 18/08/1974 437.76 07-Aug-16 22 9 9 100.00
103 Naramada Hoshangabad 292.83 293.83 300.90 30/08/1973 294.40 12-Jul-16 18 5 5 100.00
104 Sone Bansagar Dam 341.64 25-Sep-16 12 14 9 64.29
FRL= 192.00
FRL=519.60
PL=334
FRL = 121.31
FRL = 268.83
FRL = 132.59
FRL= 150.88
FRL=492.25
FRL=497.74
FRL 399.99
FRL=341.65
FRL=871.42
FRL=890.63
FRL=752.49
FRL=696.16
76
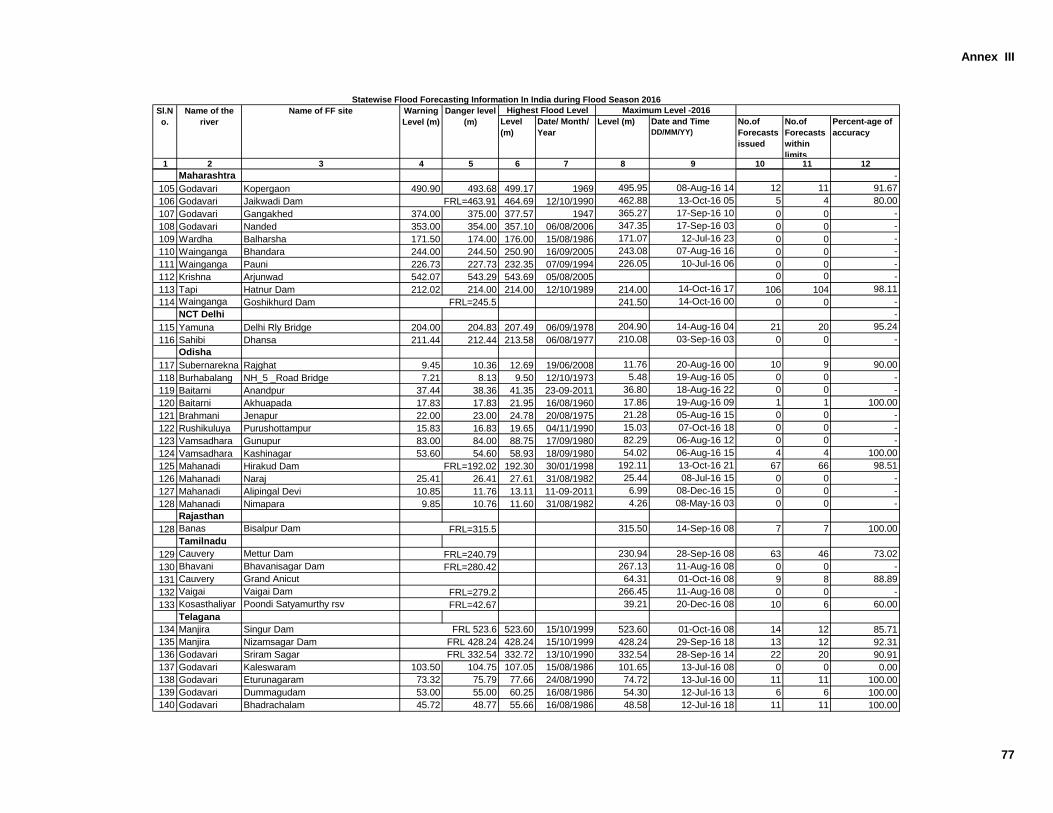
Annex III
Level
(m)
Date/ Month/
Year
Level (m) Date and Time
DD/MM/YY)
No.of
Forecasts
issued
No.of
Forecasts
within
limits
Percent-age of
accuracy
1 2 3 4 5 6 7 8 9 10 11 12
Statewise Flood Forecasting Information In India during Flood Season 2016
Sl.N
o.
Name of the
river
Name of FF site Warning
Level (m)
Danger level
(m)
Highest Flood Level Maximum Level -2016
Maharashtra -
105 Godavari Kopergaon 490.90 493.68 499.17 1969 495.95 08-Aug-16 14 12 11 91.67
106 Godavari Jaikwadi Dam 464.69 12/10/1990 462.88 13-Oct-16 05 5 4 80.00
107 Godavari Gangakhed 374.00 375.00 377.57 1947 365.27 17-Sep-16 10 0 0 -
108 Godavari Nanded 353.00 354.00 357.10 06/08/2006 347.35 17-Sep-16 03 0 0 -
109 Wardha Balharsha 171.50 174.00 176.00 15/08/1986 171.07 12-Jul-16 23 0 0 -
110 Wainganga Bhandara 244.00 244.50 250.90 16/09/2005 243.08 07-Aug-16 16 0 0 -
111 Wainganga Pauni 226.73 227.73 232.35 07/09/1994 226.05 10-Jul-16 06 0 0 -
112 Krishna Arjunwad 542.07 543.29 543.69 05/08/2005 0 0 -
113 Tapi Hatnur Dam 212.02 214.00 214.00 12/10/1989 214.00 14-Oct-16 17 106 104 98.11
114 Wainganga Goshikhurd Dam 241.50 14-Oct-16 00 0 0 -
NCT Delhi -
115 Yamuna Delhi Rly Bridge 204.00 204.83 207.49 06/09/1978 204.90 14-Aug-16 04 21 20 95.24
116 Sahibi Dhansa 211.44 212.44 213.58 06/08/1977 210.08 03-Sep-16 03 0 0 -
Odisha
117 Subernarekna Rajghat 9.45 10.36 12.69 19/06/2008 11.76 20-Aug-16 00 10 9 90.00
118 Burhabalang NH_5 _Road Bridge 7.21 8.13 9.50 12/10/1973 5.48 19-Aug-16 05 0 0 -
119 Baitarni Anandpur 37.44 38.36 41.35 23-09-2011 36.80 18-Aug-16 22 0 0 -
120 Baitarni Akhuapada 17.83 17.83 21.95 16/08/1960 17.86 19-Aug-16 09 1 1 100.00
121 Brahmani Jenapur 22.00 23.00 24.78 20/08/1975 21.28 05-Aug-16 15 0 0 -
122 Rushikuluya Purushottampur 15.83 16.83 19.65 04/11/1990 15.03 07-Oct-16 18 0 0 -
123 Vamsadhara Gunupur 83.00 84.00 88.75 17/09/1980 82.29 06-Aug-16 12 0 0 -
124 Vamsadhara Kashinagar 53.60 54.60 58.93 18/09/1980 54.02 06-Aug-16 15 4 4 100.00
125 Mahanadi Hirakud Dam 192.30 30/01/1998 192.11 13-Oct-16 21 67 66 98.51
126 Mahanadi Naraj 25.41 26.41 27.61 31/08/1982 25.44 08-Jul-16 15 0 0 -
127 Mahanadi Alipingal Devi 10.85 11.76 13.11 11-09-2011 6.99 08-Dec-16 15 0 0 -
128 Mahanadi Nimapara 9.85 10.76 11.60 31/08/1982 4.26 08-May-16 03 0 0 -
Rajasthan
128 Banas Bisalpur Dam 315.50 14-Sep-16 08 7 7 100.00
Tamilnadu
129 Cauvery Mettur Dam 230.94 28-Sep-16 08 63 46 73.02
130 Bhavani Bhavanisagar Dam 267.13 11-Aug-16 08 0 0 -
131 Cauvery Grand Anicut 64.31 01-Oct-16 08 9 8 88.89
132 Vaigai Vaigai Dam 266.45 11-Aug-16 08 0 0 -
133 Kosasthaliyar Poondi Satyamurthy rsv 39.21 20-Dec-16 08 10 6 60.00
Telagana
134 Manjira Singur Dam 523.60 15/10/1999 523.60 01-Oct-16 08 14 12 85.71
135 Manjira Nizamsagar Dam 428.24 15/10/1999 428.24 29-Sep-16 18 13 12 92.31
136 Godavari Sriram Sagar 332.72 13/10/1990 332.54 28-Sep-16 14 22 20 90.91
137 Godavari Kaleswaram 103.50 104.75 107.05 15/08/1986 101.65 13-Jul-16 08 0 0 0.00
138 Godavari Eturunagaram 73.32 75.79 77.66 24/08/1990 74.72 13-Jul-16 00 11 11 100.00
139 Godavari Dummagudam 53.00 55.00 60.25 16/08/1986 54.30 12-Jul-16 13 6 6 100.00
140 Godavari Bhadrachalam 45.72 48.77 55.66 16/08/1986 48.58 12-Jul-16 18 11 11 100.00
FRL=279.2
FRL=42.67
FRL 523.6
FRL 428.24
FRL 332.54
FRL=463.91
FRL=192.02
FRL=315.5
FRL=240.79
FRL=280.42
FRL=245.5
77
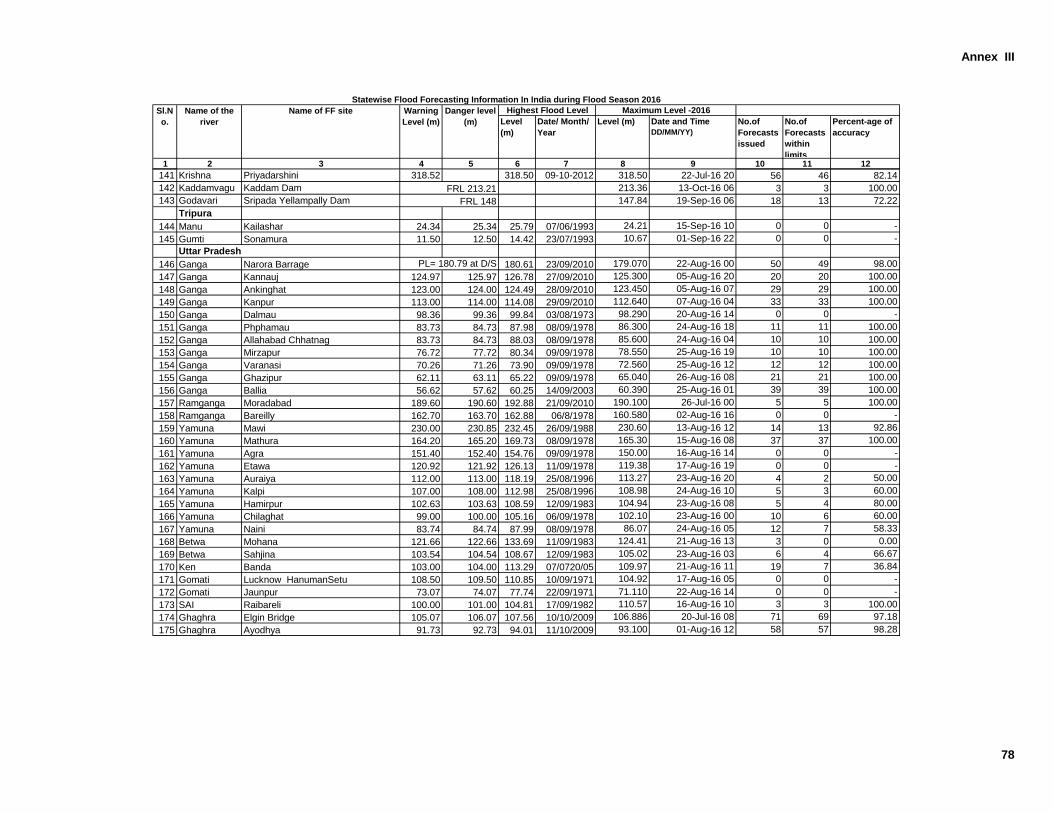
Annex III
Level
(m)
Date/ Month/
Year
Level (m) Date and Time
DD/MM/YY)
No.of
Forecasts
issued
No.of
Forecasts
within
limits
Percent-age of
accuracy
1 2 3 4 5 6 7 8 9 10 11 12
Statewise Flood Forecasting Information In India during Flood Season 2016
Sl.N
o.
Name of the
river
Name of FF site Warning
Level (m)
Danger level
(m)
Highest Flood Level Maximum Level -2016
141 Krishna Priyadarshini 318.52 318.50 09-10-2012 318.50 22-Jul-16 20 56 46 82.14
142 Kaddamvagu Kaddam Dam 213.36 13-Oct-16 06 3 3 100.00
143 Godavari Sripada Yellampally Dam 147.84 19-Sep-16 06 18 13 72.22
Tripura
144 Manu Kailashar 24.34 25.34 25.79 07/06/1993 24.21 15-Sep-16 10 0 0 -
145 Gumti Sonamura 11.50 12.50 14.42 23/07/1993 10.67 01-Sep-16 22 0 0 -
Uttar Pradesh
146 Ganga Narora Barrage 180.61 23/09/2010 179.070 22-Aug-16 00 50 49 98.00
147 Ganga Kannauj 124.97 125.97 126.78 27/09/2010 125.300 05-Aug-16 20 20 20 100.00
148 Ganga Ankinghat 123.00 124.00 124.49 28/09/2010 123.450 05-Aug-16 07 29 29 100.00
149 Ganga Kanpur 113.00 114.00 114.08 29/09/2010 112.640 07-Aug-16 04 33 33 100.00
150 Ganga Dalmau 98.36 99.36 99.84 03/08/1973 98.290 20-Aug-16 14 0 0 -
151 Ganga Phphamau 83.73 84.73 87.98 08/09/1978 86.300 24-Aug-16 18 11 11 100.00
152 Ganga Allahabad Chhatnag 83.73 84.73 88.03 08/09/1978 85.600 24-Aug-16 04 10 10 100.00
153 Ganga Mirzapur 76.72 77.72 80.34 09/09/1978 78.550 25-Aug-16 19 10 10 100.00
154 Ganga Varanasi 70.26 71.26 73.90 09/09/1978 72.560 25-Aug-16 12 12 12 100.00
155 Ganga Ghazipur 62.11 63.11 65.22 09/09/1978 65.040 26-Aug-16 08 21 21 100.00
156 Ganga Ballia 56.62 57.62 60.25 14/09/2003 60.390 25-Aug-16 01 39 39 100.00
157 Ramganga Moradabad 189.60 190.60 192.88 21/09/2010 190.100 26-Jul-16 00 5 5 100.00
158 Ramganga Bareilly 162.70 163.70 162.88 06/8/1978 160.580 02-Aug-16 16 0 0 -
159 Yamuna Mawi 230.00 230.85 232.45 26/09/1988 230.60 13-Aug-16 12 14 13 92.86
160 Yamuna Mathura 164.20 165.20 169.73 08/09/1978 165.30 15-Aug-16 08 37 37 100.00
161 Yamuna Agra 151.40 152.40 154.76 09/09/1978 150.00 16-Aug-16 14 0 0 -
162 Yamuna Etawa 120.92 121.92 126.13 11/09/1978 119.38 17-Aug-16 19 0 0 -
163 Yamuna Auraiya 112.00 113.00 118.19 25/08/1996 113.27 23-Aug-16 20 4 2 50.00
164 Yamuna Kalpi 107.00 108.00 112.98 25/08/1996 108.98 24-Aug-16 10 5 3 60.00
165 Yamuna Hamirpur 102.63 103.63 108.59 12/09/1983 104.94 23-Aug-16 08 5 4 80.00
166 Yamuna Chilaghat 99.00 100.00 105.16 06/09/1978 102.10 23-Aug-16 00 10 6 60.00
167 Yamuna Naini 83.74 84.74 87.99 08/09/1978 86.07 24-Aug-16 05 12 7 58.33
168 Betwa Mohana 121.66 122.66 133.69 11/09/1983 124.41 21-Aug-16 13 3 0 0.00
169 Betwa Sahjina 103.54 104.54 108.67 12/09/1983 105.02 23-Aug-16 03 6 4 66.67
170 Ken Banda 103.00 104.00 113.29 07/0720/05 109.97 21-Aug-16 11 19 7 36.84
171 Gomati Lucknow HanumanSetu 108.50 109.50 110.85 10/09/1971 104.92 17-Aug-16 05 0 0 -
172 Gomati Jaunpur 73.07 74.07 77.74 22/09/1971 71.110 22-Aug-16 14 0 0 -
173 SAI Raibareli 100.00 101.00 104.81 17/09/1982 110.57 16-Aug-16 10 3 3 100.00
174 Ghaghra Elgin Bridge 105.07 106.07 107.56 10/10/2009 106.886 20-Jul-16 08 71 69 97.18
175 Ghaghra Ayodhya 91.73 92.73 94.01 11/10/2009 93.100 01-Aug-16 12 58 57 98.28
FRL 213.21
FRL 148
PL= 180.79 at D/S
78
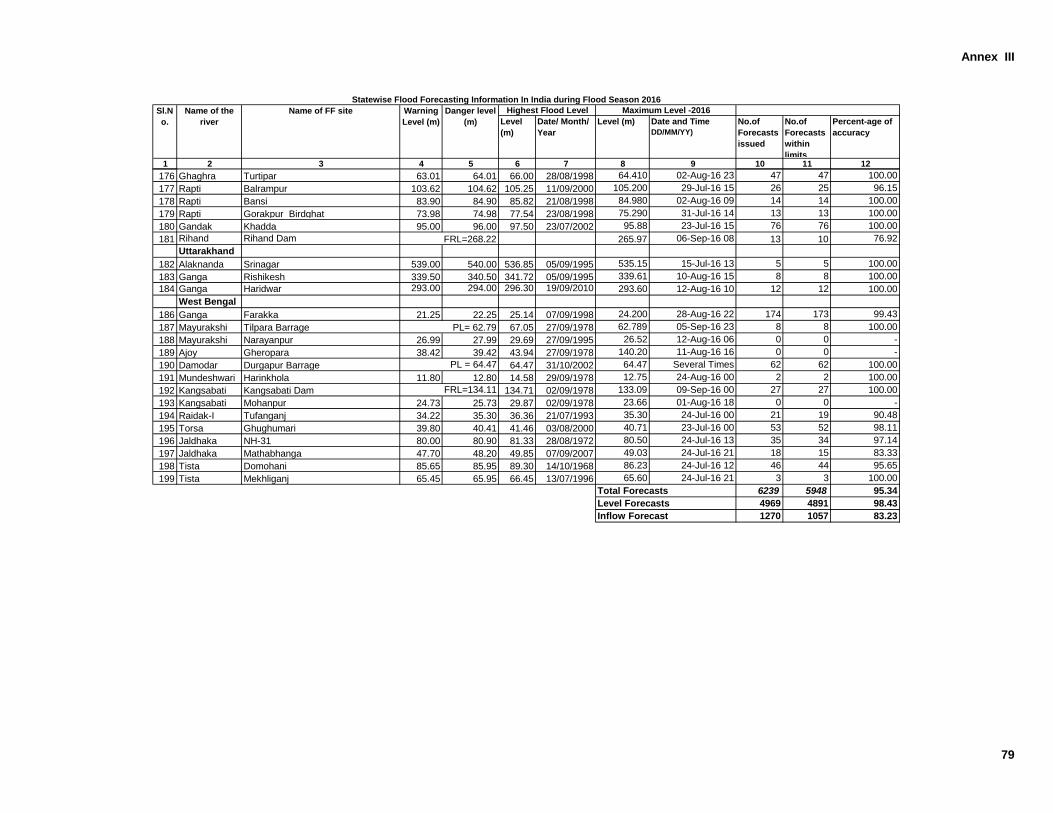
Annex III
Level
(m)
Date/ Month/
Year
Level (m) Date and Time
DD/MM/YY)
No.of
Forecasts
issued
No.of
Forecasts
within
limits
Percent-age of
accuracy
1 2 3 4 5 6 7 8 9 10 11 12
Statewise Flood Forecasting Information In India during Flood Season 2016
Sl.N
o.
Name of the
river
Name of FF site Warning
Level (m)
Danger level
(m)
Highest Flood Level Maximum Level -2016
176 Ghaghra Turtipar 63.01 64.01 66.00 28/08/1998 64.410 02-Aug-16 23 47 47 100.00
177 Rapti Balrampur 103.62 104.62 105.25 11/09/2000 105.200 29-Jul-16 15 26 25 96.15
178 Rapti Bansi 83.90 84.90 85.82 21/08/1998 84.980 02-Aug-16 09 14 14 100.00
179 Rapti Gorakpur Birdghat 73.98 74.98 77.54 23/08/1998 75.290 31-Jul-16 14 13 13 100.00
180 Gandak Khadda 95.00 96.00 97.50 23/07/2002 95.88 23-Jul-16 15 76 76 100.00
181 Rihand Rihand Dam 265.97 06-Sep-16 08 13 10 76.92
Uttarakhand
182 Alaknanda Srinagar 539.00 540.00 536.85 05/09/1995 535.15 15-Jul-16 13 5 5 100.00
183 Ganga Rishikesh 339.50 340.50 341.72 05/09/1995 339.61 10-Aug-16 15 8 8 100.00
184 Ganga Haridwar 293.00 294.00 296.30 19/09/2010 293.60 12-Aug-16 10 12 12 100.00
West Bengal
186 Ganga Farakka 21.25 22.25 25.14 07/09/1998 24.200 28-Aug-16 22 174 173 99.43
187 Mayurakshi Tilpara Barrage 67.05 27/09/1978 62.789 05-Sep-16 23 8 8 100.00
188 Mayurakshi Narayanpur 26.99 27.99 29.69 27/09/1995 26.52 12-Aug-16 06 0 0 -
189 Ajoy Gheropara 38.42 39.42 43.94 27/09/1978 140.20 11-Aug-16 16 0 0 -
190 Damodar Durgapur Barrage 64.47 31/10/2002 64.47 Several Times 62 62 100.00
191 Mundeshwari Harinkhola 11.80 12.80 14.58 29/09/1978 12.75 24-Aug-16 00 2 2 100.00
192 Kangsabati Kangsabati Dam 134.71 02/09/1978 133.09 09-Sep-16 00 27 27 100.00
193 Kangsabati Mohanpur 24.73 25.73 29.87 02/09/1978 23.66 01-Aug-16 18 0 0 -
194 Raidak-I Tufanganj 34.22 35.30 36.36 21/07/1993 35.30 24-Jul-16 00 21 19 90.48
195 Torsa Ghughumari 39.80 40.41 41.46 03/08/2000 40.71 23-Jul-16 00 53 52 98.11
196 Jaldhaka NH-31 80.00 80.90 81.33 28/08/1972 80.50 24-Jul-16 13 35 34 97.14
197 Jaldhaka Mathabhanga 47.70 48.20 49.85 07/09/2007 49.03 24-Jul-16 21 18 15 83.33
198 Tista Domohani 85.65 85.95 89.30 14/10/1968 86.23 24-Jul-16 12 46 44 95.65
199 Tista Mekhliganj 65.45 65.95 66.45 13/07/1996 65.60 24-Jul-16 21 3 3 100.00
Total Forecasts 6239 5948 95.34
Level Forecasts 4969 4891 98.43
Inflow Forecast 1270 1057 83.23
FRL=268.22
PL= 62.79
PL = 64.47
FRL=134.11
79
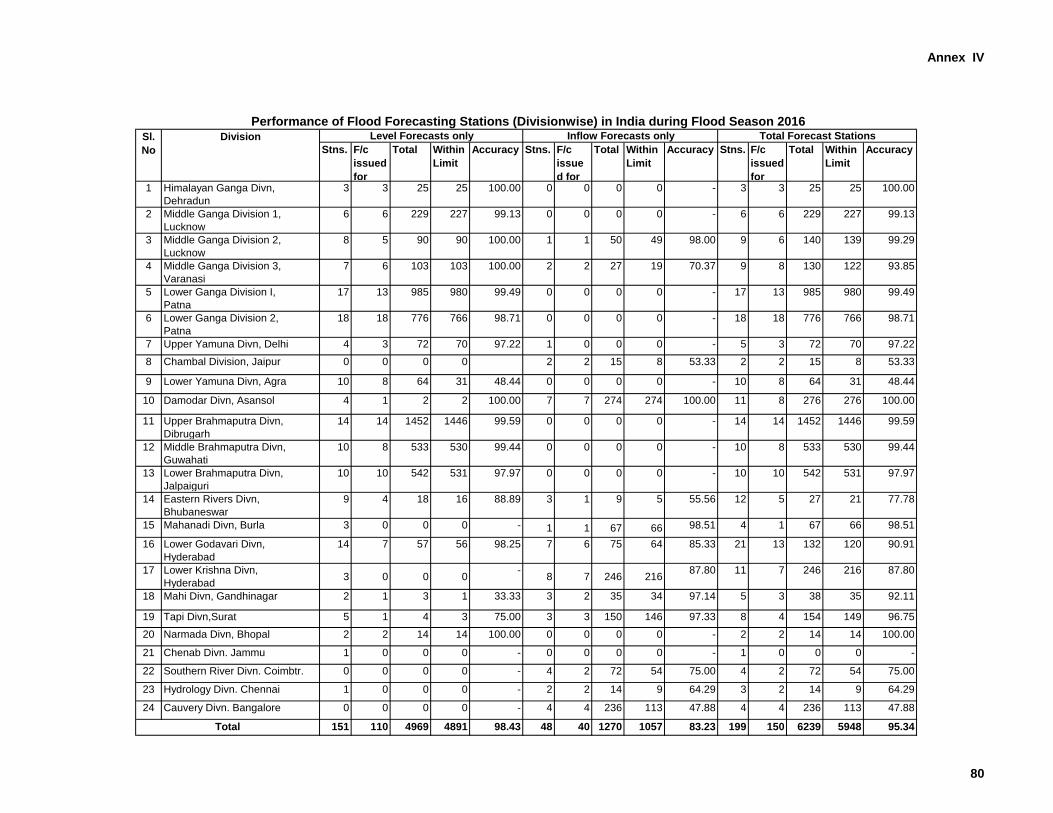
Annex IV
Stns. F/c
issued
for
Total Within
Limit
Accuracy Stns. F/c
issue
d for
Total Within
Limit
Accuracy Stns. F/c
issued
for
Total Within
Limit
Accuracy
1 Himalayan Ganga Divn,
Dehradun
3 3 25 25 100.00 0 0 0 0 - 3 3 25 25 100.00
2 Middle Ganga Division 1,
Lucknow
6 6 229 227 99.13 0 0 0 0 - 6 6 229 227 99.13
3 Middle Ganga Division 2,
Lucknow
8 5 90 90 100.00 1 1 50 49 98.00 9 6 140 139 99.29
4 Middle Ganga Division 3,
Varanasi
7 6 103 103 100.00 2 2 27 19 70.37 9 8 130 122 93.85
5 Lower Ganga Division I,
Patna
17 13 985 980 99.49 0 0 0 0 - 17 13 985 980 99.49
6 Lower Ganga Division 2,
Patna
18 18 776 766 98.71 0 0 0 0 - 18 18 776 766 98.71
7 Upper Yamuna Divn, Delhi 4 3 72 70 97.22 1 0 0 0 - 5 3 72 70 97.22
8 Chambal Division, Jaipur 0 0 0 0 2 2 15 8 53.33 2 2 15 8 53.33
9 Lower Yamuna Divn, Agra 10 8 64 31 48.44 0 0 0 0 - 10 8 64 31 48.44
10 Damodar Divn, Asansol 4 1 2 2 100.00 7 7 274 274 100.00 11 8 276 276 100.00
11 Upper Brahmaputra Divn,
Dibrugarh
14 14 1452 1446 99.59 0 0 0 0 - 14 14 1452 1446 99.59
12 Middle Brahmaputra Divn,
Guwahati
10 8 533 530 99.44 0 0 0 0 - 10 8 533 530 99.44
13 Lower Brahmaputra Divn,
Jalpaiguri
10 10 542 531 97.97 0 0 0 0 - 10 10 542 531 97.97
14 Eastern Rivers Divn,
Bhubaneswar
9 4 18 16 88.89 3 1 9 5 55.56 12 5 27 21 77.78
15 Mahanadi Divn, Burla 3 0 0 0 - 1 1 67 66 98.51 4 1 67 66 98.51
16 Lower Godavari Divn,
Hyderabad
14 7 57 56 98.25 7 6 75 64 85.33 21 13 132 120 90.91
17 Lower Krishna Divn,
Hyderabad3 0 0 0
-8 7 246 216
87.80 11 7 246 216 87.80
18 Mahi Divn, Gandhinagar 2 1 3 1 33.33 3 2 35 34 97.14 5 3 38 35 92.11
19 Tapi Divn,Surat 5 1 4 3 75.00 3 3 150 146 97.33 8 4 154 149 96.75
20 Narmada Divn, Bhopal 2 2 14 14 100.00 0 0 0 0 - 2 2 14 14 100.00
21 Chenab Divn. Jammu 1 0 0 0 - 0 0 0 0 - 1 0 0 0 -
22 Southern River Divn. Coimbtr. 0 0 0 0 - 4 2 72 54 75.00 4 2 72 54 75.00
23 Hydrology Divn. Chennai 1 0 0 0 - 2 2 14 9 64.29 3 2 14 9 64.29
24 Cauvery Divn. Bangalore 0 0 0 0 - 4 4 236 113 47.88 4 4 236 113 47.88
151 110 4969 4891 98.43 48 40 1270 1057 83.23 199 150 6239 5948 95.34Total
Performance of Flood Forecasting Stations (Divisionwise) in India during Flood Season 2016Sl.
No
Division Level Forecasts only Inflow Forecasts only Total Forecast Stations
80
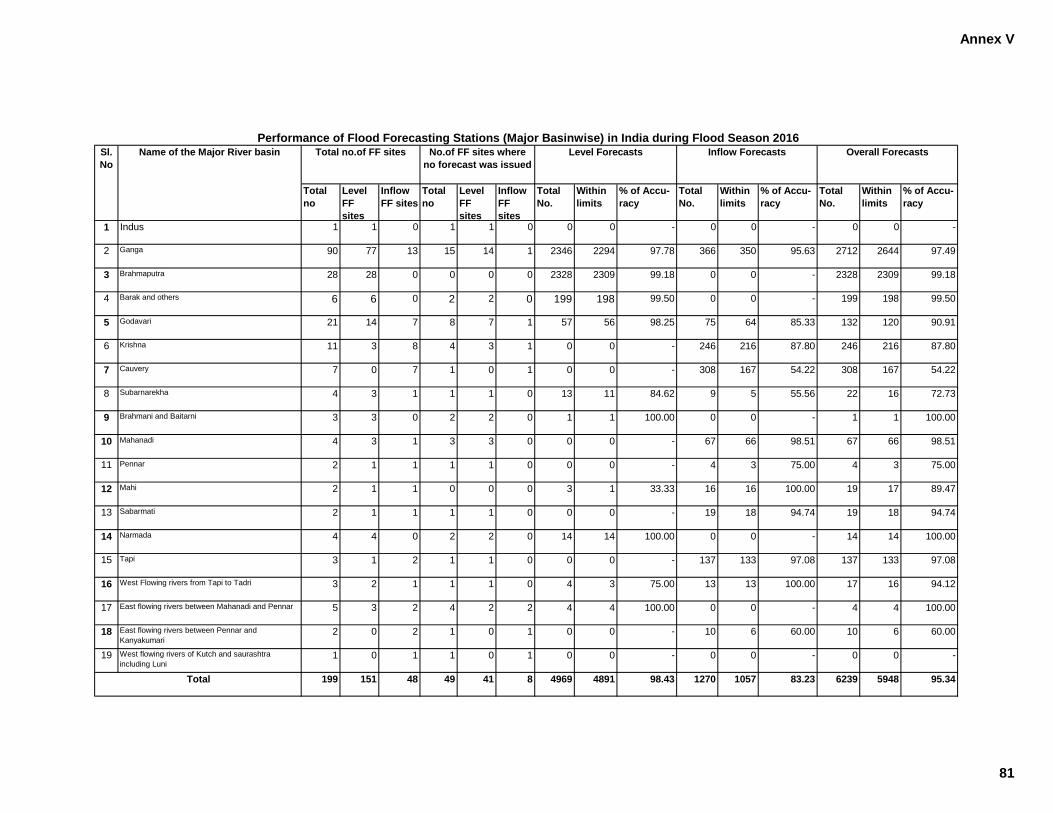
Annex V
Total
no
Level
FF
sites
Inflow
FF sites
Total
no
Level
FF
sites
Inflow
FF
sites
Total
No.
Within
limits
% of Accu-
racy
Total
No.
Within
limits
% of Accu-
racy
Total
No.
Within
limits
% of Accu-
racy
1 Indus 1 1 0 1 1 0 0 0 - 0 0 - 0 0 -
2 Ganga 90 77 13 15 14 1 2346 2294 97.78 366 350 95.63 2712 2644 97.49
3 Brahmaputra 28 28 0 0 0 0 2328 2309 99.18 0 0 - 2328 2309 99.18
4 Barak and others 6 6 0 2 2 0 199 198 99.50 0 0 - 199 198 99.50
5 Godavari 21 14 7 8 7 1 57 56 98.25 75 64 85.33 132 120 90.91
6 Krishna 11 3 8 4 3 1 0 0 - 246 216 87.80 246 216 87.80
7 Cauvery 7 0 7 1 0 1 0 0 - 308 167 54.22 308 167 54.22
8 Subarnarekha 4 3 1 1 1 0 13 11 84.62 9 5 55.56 22 16 72.73
9 Brahmani and Baitarni 3 3 0 2 2 0 1 1 100.00 0 0 - 1 1 100.00
10 Mahanadi 4 3 1 3 3 0 0 0 - 67 66 98.51 67 66 98.51
11 Pennar 2 1 1 1 1 0 0 0 - 4 3 75.00 4 3 75.00
12 Mahi 2 1 1 0 0 0 3 1 33.33 16 16 100.00 19 17 89.47
13 Sabarmati 2 1 1 1 1 0 0 0 - 19 18 94.74 19 18 94.74
14 Narmada 4 4 0 2 2 0 14 14 100.00 0 0 - 14 14 100.00
15 Tapi 3 1 2 1 1 0 0 0 - 137 133 97.08 137 133 97.08
16 West Flowing rivers from Tapi to Tadri 3 2 1 1 1 0 4 3 75.00 13 13 100.00 17 16 94.12
17 East flowing rivers between Mahanadi and Pennar 5 3 2 4 2 2 4 4 100.00 0 0 - 4 4 100.00
18 East flowing rivers between Pennar and
Kanyakumari2 0 2 1 0 1 0 0 - 10 6 60.00 10 6 60.00
19 West flowing rivers of Kutch and saurashtra
including Luni1 0 1 1 0 1 0 0 - 0 0 - 0 0 -
199 151 48 49 41 8 4969 4891 98.43 1270 1057 83.23 6239 5948 95.34Total
Performance of Flood Forecasting Stations (Major Basinwise) in India during Flood Season 2016Sl.
No
Name of the Major River basin Total no.of FF sites No.of FF sites where
no forecast was issued
Level Forecasts Inflow Forecasts Overall Forecasts
81
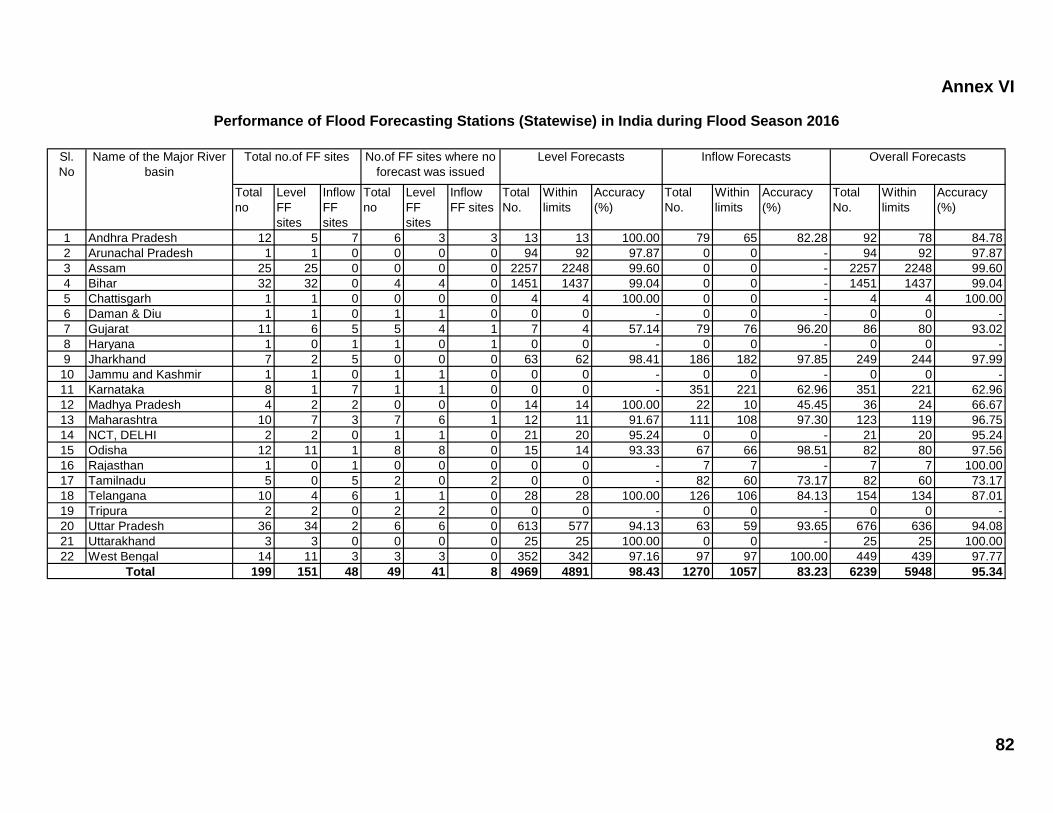
Annex VI
Total
no
Level
FF
sites
Inflow
FF
sites
Total
no
Level
FF
sites
Inflow
FF sites
Total
No.
Within
limits
Accuracy
(%)
Total
No.
Within
limits
Accuracy
(%)
Total
No.
Within
limits
Accuracy
(%)
1 Andhra Pradesh 12 5 7 6 3 3 13 13 100.00 79 65 82.28 92 78 84.78
2 Arunachal Pradesh 1 1 0 0 0 0 94 92 97.87 0 0 - 94 92 97.87
3 Assam 25 25 0 0 0 0 2257 2248 99.60 0 0 - 2257 2248 99.60
4 Bihar 32 32 0 4 4 0 1451 1437 99.04 0 0 - 1451 1437 99.04
5 Chattisgarh 1 1 0 0 0 0 4 4 100.00 0 0 - 4 4 100.00
6 Daman & Diu 1 1 0 1 1 0 0 0 - 0 0 - 0 0 -
7 Gujarat 11 6 5 5 4 1 7 4 57.14 79 76 96.20 86 80 93.02
8 Haryana 1 0 1 1 0 1 0 0 - 0 0 - 0 0 -
9 Jharkhand 7 2 5 0 0 0 63 62 98.41 186 182 97.85 249 244 97.99
10 Jammu and Kashmir 1 1 0 1 1 0 0 0 - 0 0 - 0 0 -
11 Karnataka 8 1 7 1 1 0 0 0 - 351 221 62.96 351 221 62.96
12 Madhya Pradesh 4 2 2 0 0 0 14 14 100.00 22 10 45.45 36 24 66.67
13 Maharashtra 10 7 3 7 6 1 12 11 91.67 111 108 97.30 123 119 96.75
14 NCT, DELHI 2 2 0 1 1 0 21 20 95.24 0 0 - 21 20 95.24
15 Odisha 12 11 1 8 8 0 15 14 93.33 67 66 98.51 82 80 97.56
16 Rajasthan 1 0 1 0 0 0 0 0 - 7 7 - 7 7 100.00
17 Tamilnadu 5 0 5 2 0 2 0 0 - 82 60 73.17 82 60 73.17
18 Telangana 10 4 6 1 1 0 28 28 100.00 126 106 84.13 154 134 87.01
19 Tripura 2 2 0 2 2 0 0 0 - 0 0 - 0 0 -
20 Uttar Pradesh 36 34 2 6 6 0 613 577 94.13 63 59 93.65 676 636 94.08
21 Uttarakhand 3 3 0 0 0 0 25 25 100.00 0 0 - 25 25 100.00
22 West Bengal 14 11 3 3 3 0 352 342 97.16 97 97 100.00 449 439 97.77
199 151 48 49 41 8 4969 4891 98.43 1270 1057 83.23 6239 5948 95.34Total
Performance of Flood Forecasting Stations (Statewise) in India during Flood Season 2016
Sl.
No
Name of the Major River
basin
Total no.of FF sites No.of FF sites where no
forecast was issued
Level Forecasts Inflow Forecasts Overall Forecasts
82
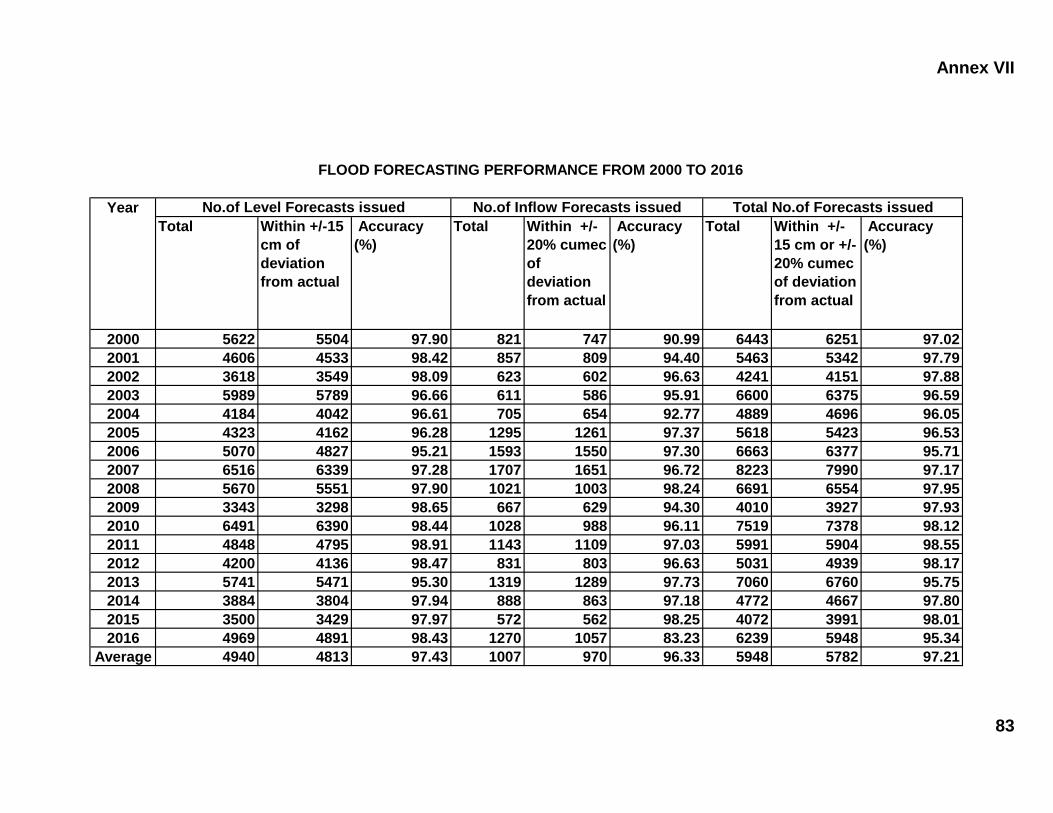
Annex VII
Total Within +/-15
cm of
deviation
from actual
Accuracy
(%)
Total Within +/-
20% cumec
of
deviation
from actual
Accuracy
(%)
Total Within +/-
15 cm or +/-
20% cumec
of deviation
from actual
Accuracy
(%)
2000 5622 5504 97.90 821 747 90.99 6443 6251 97.02
2001 4606 4533 98.42 857 809 94.40 5463 5342 97.79
2002 3618 3549 98.09 623 602 96.63 4241 4151 97.88
2003 5989 5789 96.66 611 586 95.91 6600 6375 96.59
2004 4184 4042 96.61 705 654 92.77 4889 4696 96.05
2005 4323 4162 96.28 1295 1261 97.37 5618 5423 96.53
2006 5070 4827 95.21 1593 1550 97.30 6663 6377 95.71
2007 6516 6339 97.28 1707 1651 96.72 8223 7990 97.17
2008 5670 5551 97.90 1021 1003 98.24 6691 6554 97.95
2009 3343 3298 98.65 667 629 94.30 4010 3927 97.93
2010 6491 6390 98.44 1028 988 96.11 7519 7378 98.12
2011 4848 4795 98.91 1143 1109 97.03 5991 5904 98.55
2012 4200 4136 98.47 831 803 96.63 5031 4939 98.17
2013 5741 5471 95.30 1319 1289 97.73 7060 6760 95.75
2014 3884 3804 97.94 888 863 97.18 4772 4667 97.80
2015 3500 3429 97.97 572 562 98.25 4072 3991 98.01
2016 4969 4891 98.43 1270 1057 83.23 6239 5948 95.34
Average 4940 4813 97.43 1007 970 96.33 5948 5782 97.21
FLOOD FORECASTING PERFORMANCE FROM 2000 TO 2016
Year No.of Level Forecasts issued No.of Inflow Forecasts issued Total No.of Forecasts issued
83
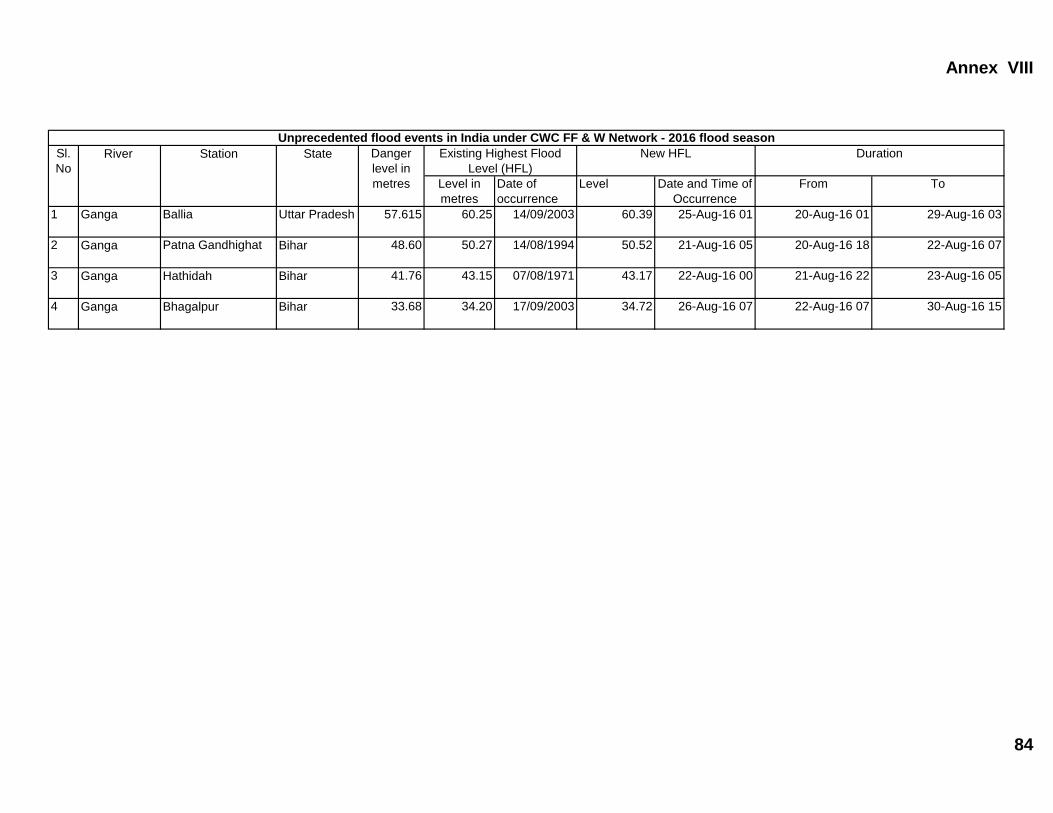
Annex VIII
Level in
metres
Date of
occurrence
Level From To
1 Ganga Ballia Uttar Pradesh 57.615 60.25 14/09/2003 60.39 20-Aug-16 01 29-Aug-16 03
2 Ganga Patna Gandhighat Bihar 48.60 50.27 14/08/1994 50.52 20-Aug-16 18 22-Aug-16 07
3 Ganga Hathidah Bihar 41.76 43.15 07/08/1971 43.17 21-Aug-16 22 23-Aug-16 05
4 Ganga Bhagalpur Bihar 33.68 34.20 17/09/2003 34.72 22-Aug-16 07 30-Aug-16 15
Sl.
No
River Station
Date and Time of
Occurrence
State Danger
level in
metres
Existing Highest Flood
Level (HFL)
DurationNew HFL
21-Aug-16 05
22-Aug-16 00
26-Aug-16 07
Unprecedented flood events in India under CWC FF & W Network - 2016 flood season
25-Aug-16 01
84
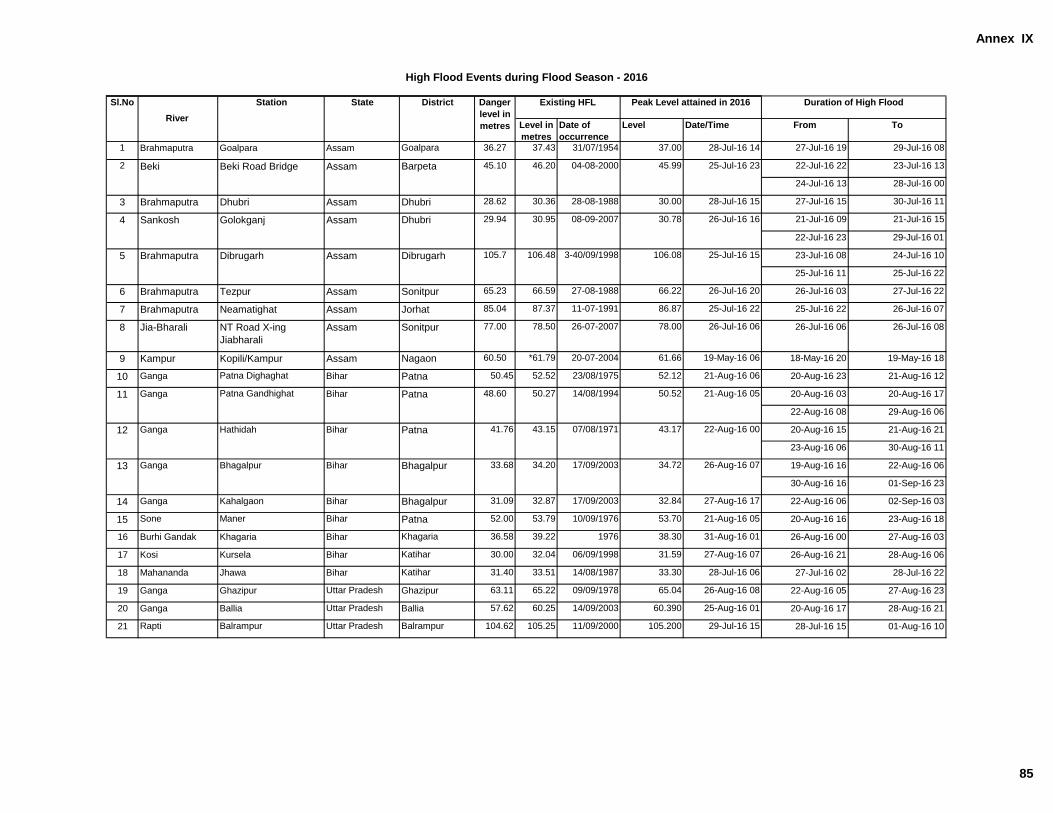
Annex IX
Level in
metres
Date of
occurrence
Level Date/Time From To
1 Brahmaputra Goalpara Assam Goalpara 36.27 37.43 31/07/1954 37.00 28-Jul-16 14 27-Jul-16 19 29-Jul-16 08
22-Jul-16 22 23-Jul-16 13
24-Jul-16 13 28-Jul-16 00
3 Brahmaputra Dhubri Assam Dhubri 28.62 30.36 28-08-1988 30.00 28-Jul-16 15 27-Jul-16 15 30-Jul-16 11
21-Jul-16 09 21-Jul-16 15
22-Jul-16 23 29-Jul-16 01
23-Jul-16 08 24-Jul-16 10
25-Jul-16 11 25-Jul-16 22
6 Brahmaputra Tezpur Assam Sonitpur 65.23 66.59 27-08-1988 66.22 26-Jul-16 20 26-Jul-16 03 27-Jul-16 22
7 Brahmaputra Neamatighat Assam Jorhat 85.04 87.37 11-07-1991 86.87 25-Jul-16 22 25-Jul-16 22 26-Jul-16 07
8 Jia-Bharali NT Road X-ing
Jiabharali
Assam Sonitpur 77.00 78.50 26-07-2007 78.00 26-Jul-16 06 26-Jul-16 06 26-Jul-16 08
9 Kampur Kopili/Kampur Assam Nagaon 60.50 *61.79 20-07-2004 61.66 19-May-16 06 18-May-16 20 19-May-16 18
10 Ganga Patna Dighaghat Bihar Patna 50.45 52.52 23/08/1975 52.12 21-Aug-16 06 20-Aug-16 23 21-Aug-16 12
20-Aug-16 03 20-Aug-16 17
22-Aug-16 08 29-Aug-16 06
20-Aug-16 15 21-Aug-16 21
23-Aug-16 06 30-Aug-16 11
19-Aug-16 16 22-Aug-16 06
30-Aug-16 16 01-Sep-16 23
14 Ganga Kahalgaon Bihar Bhagalpur 31.09 32.87 17/09/2003 32.84 27-Aug-16 17 22-Aug-16 06 02-Sep-16 03
15 Sone Maner Bihar Patna 52.00 53.79 10/09/1976 53.70 21-Aug-16 05 20-Aug-16 16 23-Aug-16 18
16 Burhi Gandak Khagaria Bihar Khagaria 36.58 39.22 1976 38.30 31-Aug-16 01 26-Aug-16 00 27-Aug-16 03
17 Kosi Kursela Bihar Katihar 30.00 32.04 06/09/1998 31.59 27-Aug-16 07 26-Aug-16 21 28-Aug-16 06
18 Mahananda Jhawa Bihar Katihar 31.40 33.51 14/08/1987 33.30 28-Jul-16 06 27-Jul-16 02 28-Jul-16 22
19 Ganga Ghazipur Uttar Pradesh Ghazipur 63.11 65.22 09/09/1978 65.04 26-Aug-16 08 22-Aug-16 05 27-Aug-16 23
20 Ganga Ballia Uttar Pradesh Ballia 57.62 60.25 14/09/2003 60.390 25-Aug-16 01 20-Aug-16 17 28-Aug-16 21
21 Rapti Balrampur Uttar Pradesh Balrampur 104.62 105.25 11/09/2000 105.200 29-Jul-16 15 28-Jul-16 15 01-Aug-16 10
25-Jul-16 23Barpeta 45.10 46.20 04-08-2000 45.99
Danger
level in
metres
Existing HFL
High Flood Events during Flood Season - 2016
Peak Level attained in 2016District Duration of High FloodSl.No
River
Station State
2 Beki Beki Road Bridge Assam
AssamGolokganjSankosh4
AssamDibrugarh
Ganga
Dhubri 26-Jul-16 1630.7808-09-200730.9529.94
5 Brahmaputra Dibrugarh 105.7 106.48
Patna
Patna 48.60 50.27
25-Jul-16 153-40/09/1998 106.08
14/08/1994 50.52 21-Aug-16 05
41.76 43.15 07/08/1971 43.17 22-Aug-16 00
Bihar
13 Ganga Bhagalpur Bihar
12 Ganga Hathidah Bihar
11 Patna Gandhighat
26-Aug-16 07Bhagalpur 33.68 34.20 17/09/2003 34.72
85
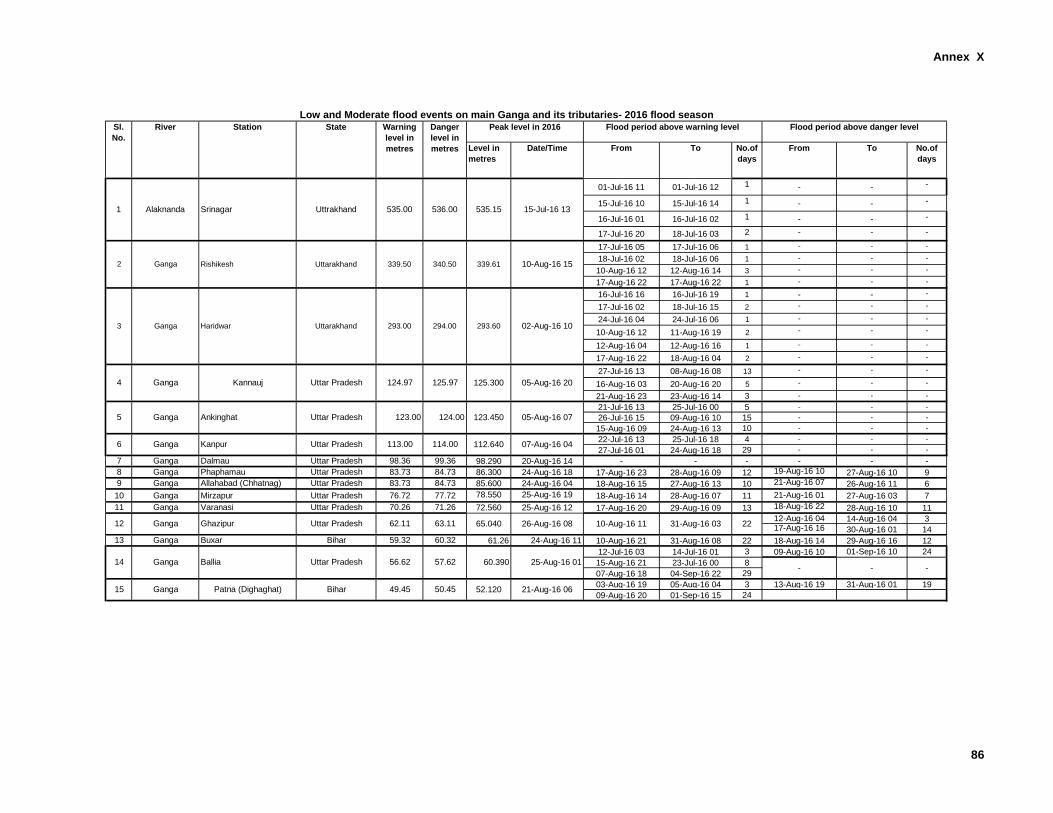
Annex X
Level in
metres
Date/Time From To No.of
days
From To No.of
days
01-Jul-16 11 01-Jul-16 12 1 - - -
15-Jul-16 10 15-Jul-16 14 1 - - -
16-Jul-16 01 16-Jul-16 02 1 - - -
17-Jul-16 20 18-Jul-16 03 2 - - -
17-Jul-16 05 17-Jul-16 06 1 - - -
18-Jul-16 02 18-Jul-16 06 1 - - -
10-Aug-16 12 12-Aug-16 14 3 - - -
17-Aug-16 22 17-Aug-16 22 1 - - -
16-Jul-16 16 16-Jul-16 19 1 - - -
17-Jul-16 02 18-Jul-16 15 2 - - -
24-Jul-16 04 24-Jul-16 06 1 - - -
10-Aug-16 12 11-Aug-16 19 2 - - -
12-Aug-16 04 12-Aug-16 16 1 - - -
17-Aug-16 22 18-Aug-16 04 2 - - -
27-Jul-16 13 08-Aug-16 08 13 - - -
16-Aug-16 03 20-Aug-16 20 5 - - -
21-Aug-16 23 23-Aug-16 14 3 - - -
21-Jul-16 13 25-Jul-16 00 5 - - -
26-Jul-16 15 09-Aug-16 10 15 - - -
15-Aug-16 09 24-Aug-16 13 10 - - -
22-Jul-16 13 25-Jul-16 18 4 - - -
27-Jul-16 01 24-Aug-16 18 29 - - -
7 Ganga Dalmau Uttar Pradesh 98.36 99.36 98.290 20-Aug-16 14 - - - - - -
8 Ganga Phaphamau Uttar Pradesh 83.73 84.73 86.300 24-Aug-16 18 17-Aug-16 23 28-Aug-16 09 12 19-Aug-16 10 27-Aug-16 10 9
9 Ganga Allahabad (Chhatnag) Uttar Pradesh 83.73 84.73 85.600 24-Aug-16 04 18-Aug-16 15 27-Aug-16 13 10 21-Aug-16 07 26-Aug-16 11 6
10 Ganga Mirzapur Uttar Pradesh 76.72 77.72 78.550 25-Aug-16 19 18-Aug-16 14 28-Aug-16 07 11 21-Aug-16 01 27-Aug-16 03 7
11 Ganga Varanasi Uttar Pradesh 70.26 71.26 72.560 25-Aug-16 12 17-Aug-16 20 29-Aug-16 09 13 18-Aug-16 22 28-Aug-16 10 11
12-Aug-16 04 14-Aug-16 04 317-Aug-16 16 30-Aug-16 01 14
13 Ganga Buxar Bihar 59.32 60.32 61.26 24-Aug-16 11 10-Aug-16 21 31-Aug-16 08 22 18-Aug-16 14 29-Aug-16 16 12
12-Jul-16 03 14-Jul-16 01 3 09-Aug-16 10 01-Sep-16 10 24
15-Aug-16 21 23-Jul-16 00 8
07-Aug-16 18 04-Sep-16 22 29
03-Aug-16 19 05-Aug-16 04 3 13-Aug-16 19 31-Aug-16 01 19
09-Aug-16 20 01-Sep-16 15 24
4 Ganga Kannauj Uttar Pradesh 124.97 125.97 125.300 05-Aug-16 20
6 Ganga Kanpur Uttar Pradesh 113.00 114.00 112.640 07-Aug-16 04
10-Aug-16 11 31-Aug-16 03 22
- - -
Ghazipur 63.1162.11Uttar Pradesh 65.040 26-Aug-16 08Ganga12
15 Ganga Patna (Dighaghat) Bihar 49.45 50.45 52.120 21-Aug-16 06
535.15 15-Jul-16 13
2 Ganga Rishikesh Uttarakhand 339.50 340.50
Alaknanda Srinagar1 Uttrakhand 535.00 536.00
339.61 10-Aug-16 15
Flood period above danger level Peak level in 2016 Flood period above warning level
Low and Moderate flood events on main Ganga and its tributaries- 2016 flood seasonSl.
No.
River Station State Warning
level in
metres
Danger
level in
metres
3 Ganga Haridwar Uttarakhand 293.00 294.00 293.60 02-Aug-16 10
14 Ganga Ballia Uttar Pradesh 56.62 57.62 60.390 25-Aug-16 01
5 Ganga Ankinghat Uttar Pradesh 123.00 124.00 123.450 05-Aug-16 07
86
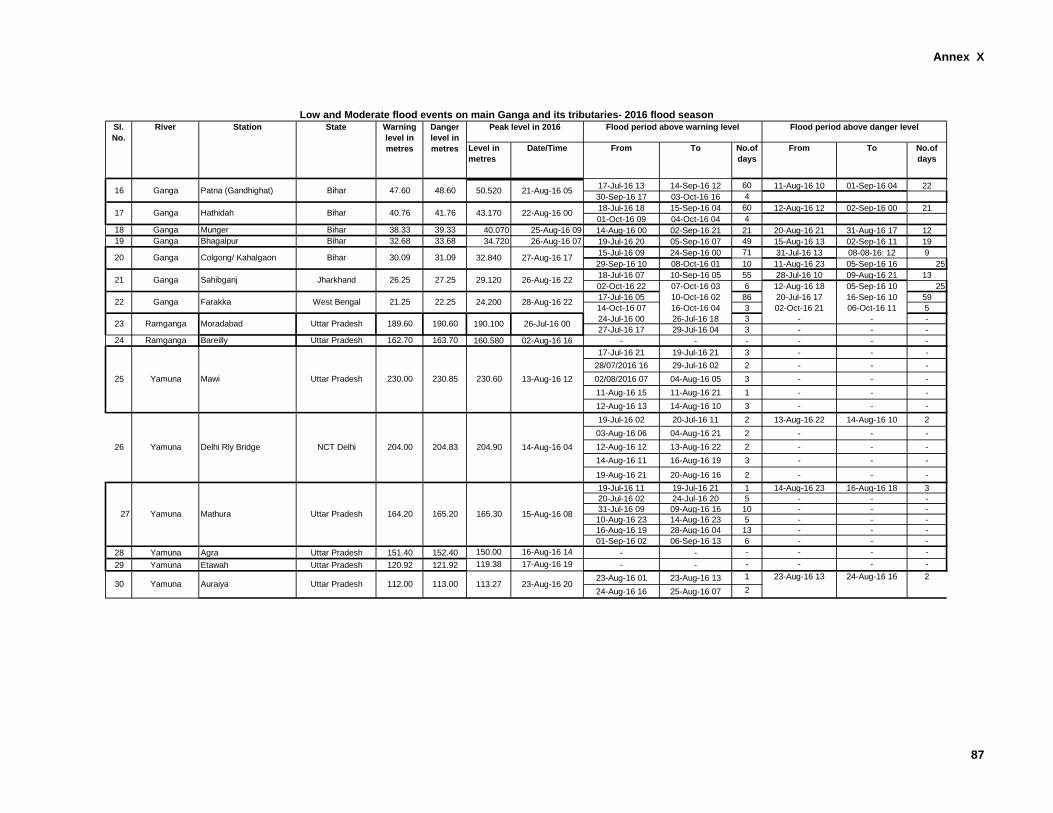
Annex X
Level in
metres
Date/Time From To No.of
days
From To No.of
days
535.15 15-Jul-16 13Alaknanda Srinagar1 Uttrakhand 535.00 536.00
Flood period above danger level Peak level in 2016 Flood period above warning level
Low and Moderate flood events on main Ganga and its tributaries- 2016 flood seasonSl.
No.
River Station State Warning
level in
metres
Danger
level in
metres
17-Jul-16 13 14-Sep-16 12 60 11-Aug-16 10 01-Sep-16 04 22
30-Sep-16 17 03-Oct-16 16 4
18-Jul-16 18 15-Sep-16 04 60 12-Aug-16 12 02-Sep-16 00 21
01-Oct-16 09 04-Oct-16 04 4
18 Ganga Munger Bihar 38.33 39.33 40.070 25-Aug-16 09 14-Aug-16 00 02-Sep-16 21 21 20-Aug-16 21 31-Aug-16 17 12
19 Ganga Bhagalpur Bihar 32.68 33.68 34.720 26-Aug-16 07 19-Jul-16 20 05-Sep-16 07 49 15-Aug-16 13 02-Sep-16 11 19
15-Jul-16 09 24-Sep-16 00 71 31-Jul-16 13 08-08-16: 12 9
29-Sep-16 10 08-Oct-16 01 10 11-Aug-16 23 05-Sep-16 16 25
18-Jul-16 07 10-Sep-16 05 55 28-Jul-16 10 09-Aug-16 21 13
02-Oct-16 22 07-Oct-16 03 6 12-Aug-16 18 05-Sep-16 10 25
17-Jul-16 05 10-Oct-16 02 86 20-Jul-16 17 16-Sep-16 10 59
14-Oct-16 07 16-Oct-16 04 3 02-Oct-16 21 06-Oct-16 11 5
24-Jul-16 00 26-Jul-16 18 3 - - -
27-Jul-16 17 29-Jul-16 04 3 - - -
24 Ramganga Bareilly Uttar Pradesh 162.70 163.70 160.580 02-Aug-16 16 - - - - - -
17-Jul-16 21 19-Jul-16 21 3 - - -
28/07/2016 16 29-Jul-16 02 2 - - -
02/08/2016 07 04-Aug-16 05 3 - - -
11-Aug-16 15 11-Aug-16 21 1 - - -
12-Aug-16 13 14-Aug-16 10 3 - - -
19-Jul-16 02 20-Jul-16 11 2 13-Aug-16 22 14-Aug-16 10 2
03-Aug-16 06 04-Aug-16 21 2 - - -
12-Aug-16 12 13-Aug-16 22 2 - - -
14-Aug-16 11 16-Aug-16 19 3 - - -
19-Aug-16 21 20-Aug-16 16 2 - - -
19-Jul-16 11 19-Jul-16 21 1 14-Aug-16 23 16-Aug-16 18 3
20-Jul-16 02 24-Jul-16 20 5 - - -
31-Jul-16 09 09-Aug-16 16 10 - - -
10-Aug-16 23 14-Aug-16 23 5 - - -
16-Aug-16 19 28-Aug-16 04 13 - - -
01-Sep-16 02 06-Sep-16 13 6 - - -
28 Yamuna Agra Uttar Pradesh 151.40 152.40 150.00 16-Aug-16 14 - - - - - -
29 Yamuna Etawah Uttar Pradesh 120.92 121.92 119.38 17-Aug-16 19 - - - - - -
23-Aug-16 01 23-Aug-16 13 1
24-Aug-16 16 25-Aug-16 07 2
21 Ganga Sahibganj Jharkhand 26.25 27.25 29.120 26-Aug-16 22
230.60 13-Aug-16 12
26 Yamuna Delhi Rly Bridge NCT Delhi 204.00
23-Aug-16 13 24-Aug-16 16 2
204.83 204.90
165.3027 Yamuna Mathura Uttar Pradesh 164.20 165.20
113.00 113.27
43.170 22-Aug-16 0017 Ganga Hathidah Bihar 40.76 41.76
24.200 28-Aug-16 22
16 Ganga Patna (Gandhighat) Bihar 47.60 48.60 50.520 21-Aug-16 05
20 Ganga Colgong/ Kahalgaon Bihar 30.09 31.09 32.840 27-Aug-16 17
22 Ganga Farakka West Bengal 21.25 22.25
190.100 26-Jul-16 00
14-Aug-16 04
25 Yamuna Mawi Uttar Pradesh 230.00 230.85
23 Ramganga Moradabad Uttar Pradesh 189.60 190.60
15-Aug-16 08
30 Yamuna Auraiya Uttar Pradesh 112.00 23-Aug-16 20
87
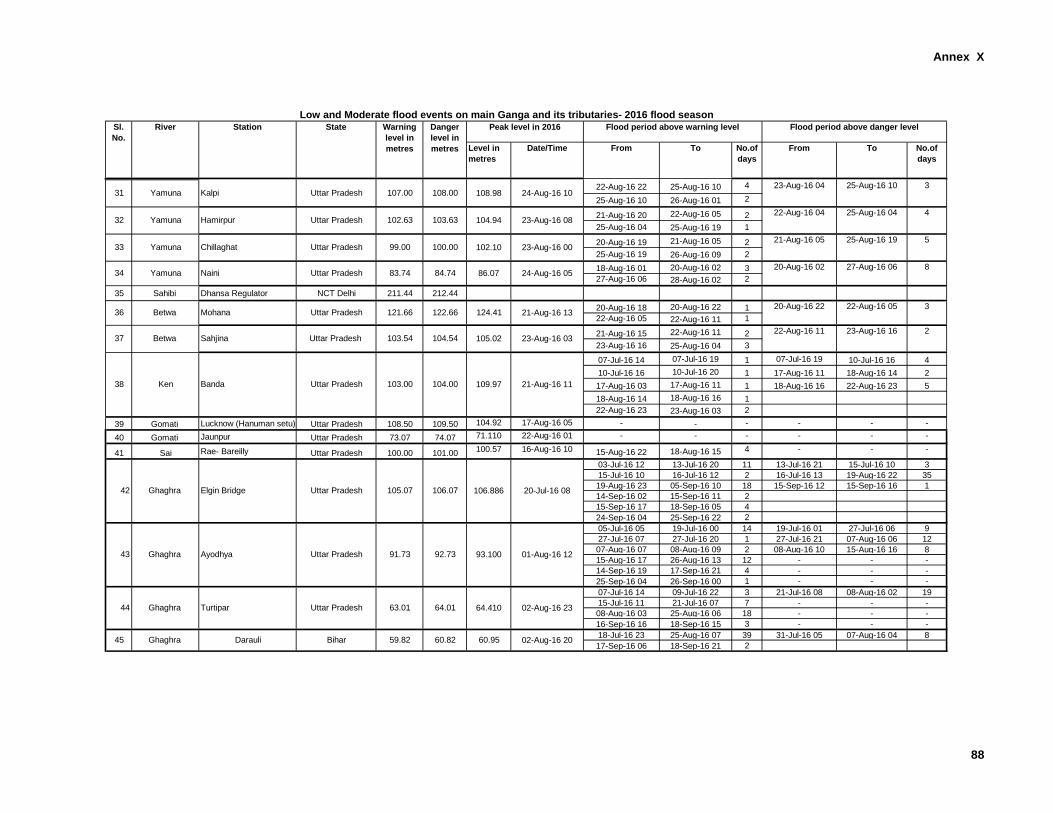
Annex X
Level in
metres
Date/Time From To No.of
days
From To No.of
days
535.15 15-Jul-16 13Alaknanda Srinagar1 Uttrakhand 535.00 536.00
Flood period above danger level Peak level in 2016 Flood period above warning level
Low and Moderate flood events on main Ganga and its tributaries- 2016 flood seasonSl.
No.
River Station State Warning
level in
metres
Danger
level in
metres
22-Aug-16 22 25-Aug-16 10 4
25-Aug-16 10 26-Aug-16 01 2
21-Aug-16 20 22-Aug-16 05 2
25-Aug-16 04 25-Aug-16 19 1
20-Aug-16 19 21-Aug-16 05 2
25-Aug-16 19 26-Aug-16 09 2
18-Aug-16 01 20-Aug-16 02 3
27-Aug-16 06 28-Aug-16 02 2
35 Sahibi Dhansa Regulator NCT Delhi 211.44 212.44
20-Aug-16 18 20-Aug-16 22 1
22-Aug-16 05 22-Aug-16 11 1
21-Aug-16 15 22-Aug-16 11 2
23-Aug-16 16 25-Aug-16 04 3
07-Jul-16 14 07-Jul-16 19 1 07-Jul-16 19 10-Jul-16 16 4
10-Jul-16 16 10-Jul-16 20 1 17-Aug-16 11 18-Aug-16 14 2
17-Aug-16 03 17-Aug-16 11 1 18-Aug-16 16 22-Aug-16 23 5
18-Aug-16 14 18-Aug-16 16 1
22-Aug-16 23 23-Aug-16 03 2
39 Gomati Lucknow (Hanuman setu) Uttar Pradesh 108.50 109.50 104.92 17-Aug-16 05 - - - - - -
40 Gomati Jaunpur Uttar Pradesh 73.07 74.07 71.110 22-Aug-16 01 - - - - - -
41 Sai Rae- Bareilly Uttar Pradesh 100.00 101.00100.57 16-Aug-16 10 15-Aug-16 22 18-Aug-16 15 4 - - -
03-Jul-16 12 13-Jul-16 20 11 13-Jul-16 21 15-Jul-16 10 3
15-Jul-16 10 16-Jul-16 12 2 16-Jul-16 13 19-Aug-16 22 35
19-Aug-16 23 05-Sep-16 10 18 15-Sep-16 12 15-Sep-16 16 1
14-Sep-16 02 15-Sep-16 11 2
15-Sep-16 17 18-Sep-16 05 4
24-Sep-16 04 25-Sep-16 22 2
05-Jul-16 05 19-Jul-16 00 14 19-Jul-16 01 27-Jul-16 06 9
27-Jul-16 07 27-Jul-16 20 1 27-Jul-16 21 07-Aug-16 06 12
07-Aug-16 07 08-Aug-16 09 2 08-Aug-16 10 15-Aug-16 16 8
15-Aug-16 17 26-Aug-16 13 12 - - -
14-Sep-16 19 17-Sep-16 21 4 - - -
25-Sep-16 04 26-Sep-16 00 1 - - -
07-Jul-16 14 09-Jul-16 22 3 21-Jul-16 08 08-Aug-16 02 19
15-Jul-16 11 21-Jul-16 07 7 - - -
08-Aug-16 03 25-Aug-16 06 18 - - -
16-Sep-16 16 18-Sep-16 15 3 - - -
18-Jul-16 23 25-Aug-16 07 39 31-Jul-16 05 07-Aug-16 04 8
17-Sep-16 06 18-Sep-16 21 2
20-Aug-16 22 22-Aug-16 05 3
22-Aug-16 11 23-Aug-16 16 2
22-Aug-16 04 25-Aug-16 04 4
21-Aug-16 05 25-Aug-16 19 5
20-Aug-16 02 27-Aug-16 06 8
23-Aug-16 04 25-Aug-16 10 3
Uttar Pradesh
Uttar Pradesh
103.00Uttar Pradesh
HamirpurYamuna32
Banda Ken38
93.100
105.0742 20-Jul-16 08
02-Aug-16 23
23-Aug-16 08104.94103.63102.63
24-Aug-16 0586.0784.7483.74
21-Aug-16 11109.97104.00
63.01 64.01 64.410
106.07 106.886
91.73 92.73 01-Aug-16 12
24-Aug-16 10108.98108.00107.00Uttar PradeshKalpiYamuna31
23-Aug-16 00102.10100.0099.00Uttar PradeshChillaghat Yamuna33
Naini Yamuna34
23-Aug-16 03105.02104.54103.54Uttar Pradesh SahjinaBetwa 37
21-Aug-16 13124.41122.66121.66Uttar PradeshMohana Betwa 36
Ghaghra Elgin Bridge Uttar Pradesh
43
44
Ghaghra Ayodhya Uttar Pradesh
Ghaghra Turtipar Uttar Pradesh
45 Ghaghra Darauli Bihar 59.82 60.82 60.95 02-Aug-16 20
88
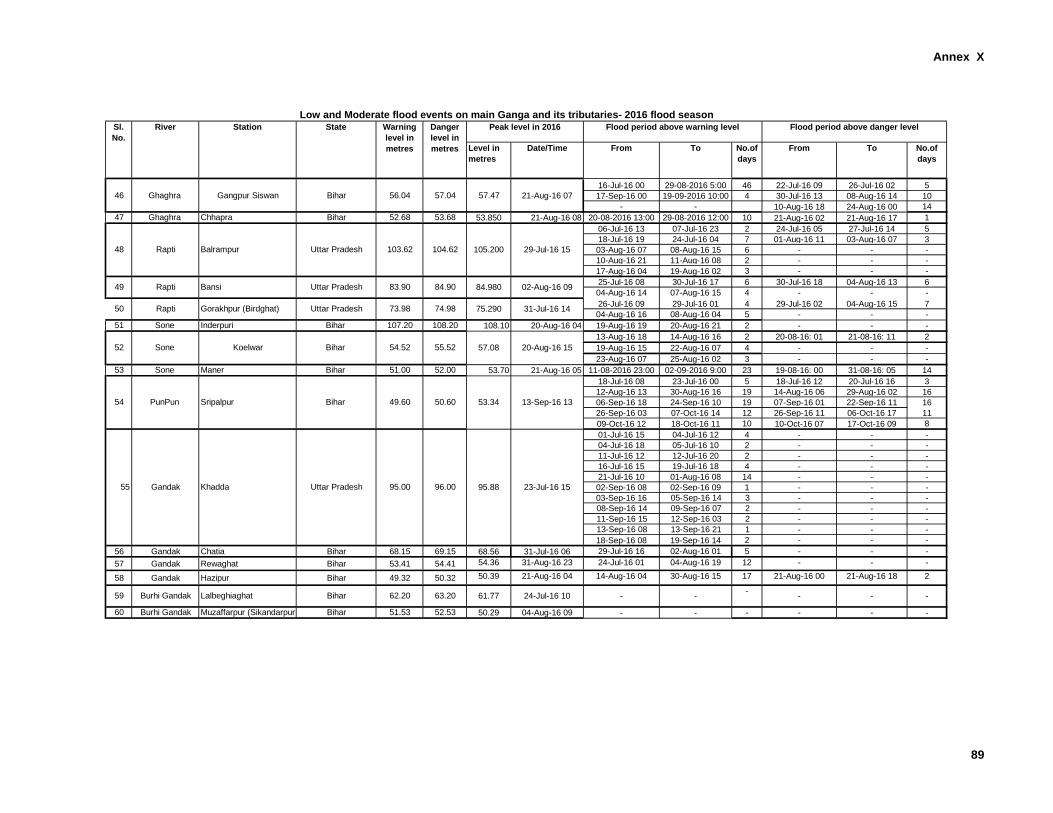
Annex X
Level in
metres
Date/Time From To No.of
days
From To No.of
days
535.15 15-Jul-16 13Alaknanda Srinagar1 Uttrakhand 535.00 536.00
Flood period above danger level Peak level in 2016 Flood period above warning level
Low and Moderate flood events on main Ganga and its tributaries- 2016 flood seasonSl.
No.
River Station State Warning
level in
metres
Danger
level in
metres
16-Jul-16 00 29-08-2016 5:00 46 22-Jul-16 09 26-Jul-16 02 5
17-Sep-16 00 19-09-2016 10:00 4 30-Jul-16 13 08-Aug-16 14 10
- - 10-Aug-16 18 24-Aug-16 00 14
47 Ghaghra Chhapra Bihar 52.68 53.68 53.850 21-Aug-16 08 20-08-2016 13:00 29-08-2016 12:00 10 21-Aug-16 02 21-Aug-16 17 1
06-Jul-16 13 07-Jul-16 23 2 24-Jul-16 05 27-Jul-16 14 5
18-Jul-16 19 24-Jul-16 04 7 01-Aug-16 11 03-Aug-16 07 3
03-Aug-16 07 08-Aug-16 15 6 - - -
10-Aug-16 21 11-Aug-16 08 2 - - -
17-Aug-16 04 19-Aug-16 02 3 - - -
25-Jul-16 08 30-Jul-16 17 6 30-Jul-16 18 04-Aug-16 13 6
04-Aug-16 14 07-Aug-16 15 4 - - -
26-Jul-16 09 29-Jul-16 01 4 29-Jul-16 02 04-Aug-16 15 7
04-Aug-16 16 08-Aug-16 04 5 - - -
51 Sone Inderpuri Bihar 107.20 108.20 108.10 20-Aug-16 04 19-Aug-16 19 20-Aug-16 21 2 - - -
13-Aug-16 18 14-Aug-16 16 2 20-08-16: 01 21-08-16: 11 2
19-Aug-16 15 22-Aug-16 07 4 - - -
23-Aug-16 07 25-Aug-16 02 3 - - -
53 Sone Maner Bihar 51.00 52.00 53.70 21-Aug-16 05 11-08-2016 23:00 02-09-2016 9:00 23 19-08-16: 00 31-08-16: 05 14
18-Jul-16 08 23-Jul-16 00 5 18-Jul-16 12 20-Jul-16 16 3
12-Aug-16 13 30-Aug-16 16 19 14-Aug-16 06 29-Aug-16 02 16
06-Sep-16 18 24-Sep-16 10 19 07-Sep-16 01 22-Sep-16 11 16
26-Sep-16 03 07-Oct-16 14 12 26-Sep-16 11 06-Oct-16 17 11
09-Oct-16 12 18-Oct-16 11 10 10-Oct-16 07 17-Oct-16 09 8
01-Jul-16 15 04-Jul-16 12 4 - - -
04-Jul-16 18 05-Jul-16 10 2 - - -
11-Jul-16 12 12-Jul-16 20 2 - - -
16-Jul-16 15 19-Jul-16 18 4 - - -
21-Jul-16 10 01-Aug-16 08 14 - - -
02-Sep-16 08 02-Sep-16 09 1 - - -
03-Sep-16 16 05-Sep-16 14 3 - - -
08-Sep-16 14 09-Sep-16 07 2 - - -
11-Sep-16 15 12-Sep-16 03 2 - - -
13-Sep-16 08 13-Sep-16 21 1 - - -
18-Sep-16 08 19-Sep-16 14 2 - - -
56 Gandak Chatia Bihar 68.15 69.15 68.56 31-Jul-16 06 29-Jul-16 16 02-Aug-16 01 5 - - -
57 Gandak Rewaghat Bihar 53.41 54.41 54.36 31-Aug-16 23 24-Jul-16 01 04-Aug-16 19 12 - - -
58 Gandak Hazipur Bihar 49.32 50.32 50.39 21-Aug-16 04 14-Aug-16 04 30-Aug-16 15 17 21-Aug-16 00 21-Aug-16 18 2
60 Burhi Gandak Muzaffarpur (Sikandarpur) Bihar 51.53 52.53 50.29 04-Aug-16 09 - - - - - -
-
54 PunPun Sripalpur Bihar 49.60 50.60 13-Sep-16 13
--
- - -
Uttar Pradesh
95.00 96.00 95.88
53.34
104.62 105.200
57.04 57.47
Bihar 62.20 63.20 61.77Lalbeghiaghat
23-Jul-16 15
31-Jul-16 1475.29074.9873.98
55 Gandak Khadda Uttar Pradesh
24-Jul-16 1059 Burhi Gandak
Gorakhpur (Birdghat)Rapti50
Ghaghra 46 Gangpur Siswan Bihar
48 Rapti Balrampur Uttar Pradesh 29-Jul-16 15103.62
56.04 21-Aug-16 07
52 Sone Koelwar Bihar 54.52 55.52 57.08 20-Aug-16 15
49 02-Aug-16 0984.98084.9083.90Uttar PradeshBansi Rapti
89
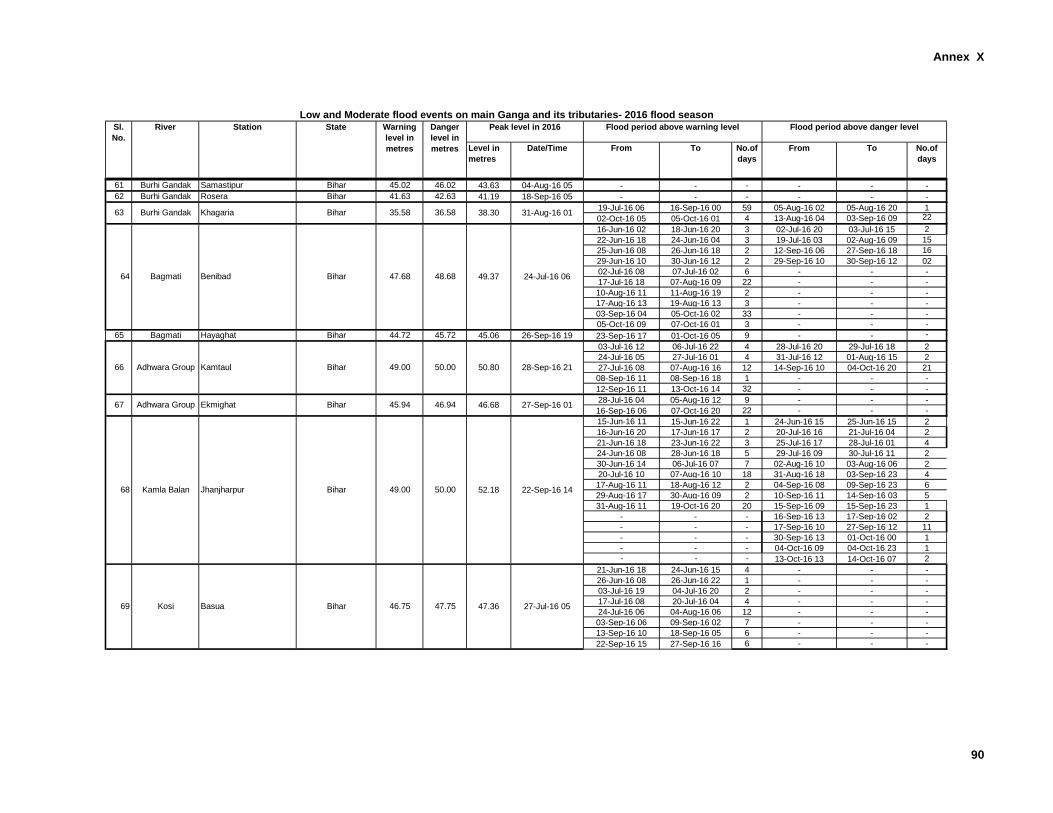
Annex X
Level in
metres
Date/Time From To No.of
days
From To No.of
days
535.15 15-Jul-16 13Alaknanda Srinagar1 Uttrakhand 535.00 536.00
Flood period above danger level Peak level in 2016 Flood period above warning level
Low and Moderate flood events on main Ganga and its tributaries- 2016 flood seasonSl.
No.
River Station State Warning
level in
metres
Danger
level in
metres
61 Burhi Gandak Samastipur Bihar 45.02 46.02 43.63 04-Aug-16 05 - - - - - -
62 Burhi Gandak Rosera Bihar 41.63 42.63 41.19 18-Sep-16 05 - - - - - -
19-Jul-16 06 16-Sep-16 00 59 05-Aug-16 02 05-Aug-16 20 1
02-Oct-16 05 05-Oct-16 01 4 13-Aug-16 04 03-Sep-16 09 22
16-Jun-16 02 18-Jun-16 20 3 02-Jul-16 20 03-Jul-16 15 2
22-Jun-16 18 24-Jun-16 04 3 19-Jul-16 03 02-Aug-16 09 15
25-Jun-16 08 26-Jun-16 18 2 12-Sep-16 06 27-Sep-16 18 16
29-Jun-16 10 30-Jun-16 12 2 29-Sep-16 10 30-Sep-16 12 02
02-Jul-16 08 07-Jul-16 02 6 - - -
17-Jul-16 18 07-Aug-16 09 22 - - -
10-Aug-16 11 11-Aug-16 19 2 - - -
17-Aug-16 13 19-Aug-16 13 3 - - -
03-Sep-16 04 05-Oct-16 02 33 - - -
05-Oct-16 09 07-Oct-16 01 3 - - -
65 Bagmati Hayaghat Bihar 44.72 45.72 45.06 26-Sep-16 19 23-Sep-16 17 01-Oct-16 05 9 - - -
03-Jul-16 12 06-Jul-16 22 4 28-Jul-16 20 29-Jul-16 18 2
24-Jul-16 05 27-Jul-16 01 4 31-Jul-16 12 01-Aug-16 15 2
27-Jul-16 08 07-Aug-16 16 12 14-Sep-16 10 04-Oct-16 20 21
08-Sep-16 11 08-Sep-16 18 1 - - -
12-Sep-16 11 13-Oct-16 14 32 - - -
28-Jul-16 04 05-Aug-16 12 9 - - -
16-Sep-16 06 07-Oct-16 20 22 - - -
15-Jun-16 11 15-Jun-16 22 1 24-Jun-16 15 25-Jun-16 15 2
16-Jun-16 20 17-Jun-16 17 2 20-Jul-16 16 21-Jul-16 04 2
21-Jun-16 18 23-Jun-16 22 3 25-Jul-16 17 28-Jul-16 01 4
24-Jun-16 08 28-Jun-16 18 5 29-Jul-16 09 30-Jul-16 11 2
30-Jun-16 14 06-Jul-16 07 7 02-Aug-16 10 03-Aug-16 06 2
20-Jul-16 10 07-Aug-16 10 18 31-Aug-16 18 03-Sep-16 23 4
17-Aug-16 11 18-Aug-16 12 2 04-Sep-16 08 09-Sep-16 23 6
29-Aug-16 17 30-Aug-16 09 2 10-Sep-16 11 14-Sep-16 03 5
31-Aug-16 11 19-Oct-16 20 20 15-Sep-16 09 15-Sep-16 23 1
- - - 16-Sep-16 13 17-Sep-16 02 2
- - - 17-Sep-16 10 27-Sep-16 12 11
- - - 30-Sep-16 13 01-Oct-16 00 1
- - - 04-Oct-16 09 04-Oct-16 23 1
- - - 13-Oct-16 13 14-Oct-16 07 2
21-Jun-16 18 24-Jun-16 15 4 - - -
26-Jun-16 08 26-Jun-16 22 1 - - -
03-Jul-16 19 04-Jul-16 20 2 - - -
17-Jul-16 08 20-Jul-16 04 4 - - -
24-Jul-16 06 04-Aug-16 06 12 - - -
03-Sep-16 06 09-Sep-16 02 7 - - -
13-Sep-16 10 18-Sep-16 05 6 - - -
22-Sep-16 15 27-Sep-16 16 6 - - -
69 27-Jul-16 05Kosi Basua Bihar 46.75 47.75
31-Aug-16 01
22-Sep-16 14
24-Jul-16 06
Bihar 45.94 46.94 46.68 27-Sep-16 01
Bihar 35.58 36.58 38.30
68 Kamla Balan Jhanjharpur Bihar 49.00 50.00 52.18
47.36
63 Burhi Gandak Khagaria
66 Adhwara Group Kamtaul Bihar 49.00 50.00
49.37
67 Adhwara Group Ekmighat
50.80 28-Sep-16 21
64 Bagmati Benibad Bihar 47.68 48.68
90
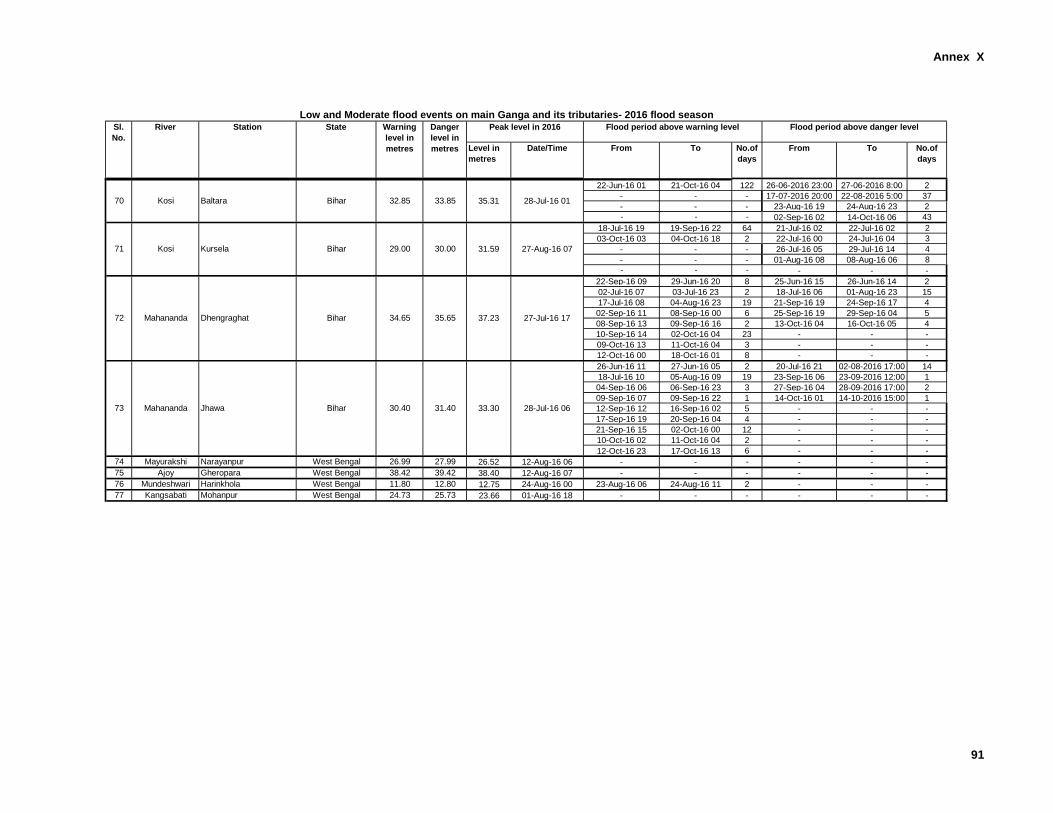
Annex X
Level in
metres
Date/Time From To No.of
days
From To No.of
days
535.15 15-Jul-16 13Alaknanda Srinagar1 Uttrakhand 535.00 536.00
Flood period above danger level Peak level in 2016 Flood period above warning level
Low and Moderate flood events on main Ganga and its tributaries- 2016 flood seasonSl.
No.
River Station State Warning
level in
metres
Danger
level in
metres
22-Jun-16 01 21-Oct-16 04 122 26-06-2016 23:00 27-06-2016 8:00 2
- - - 17-07-2016 20:00 22-08-2016 5:00 37
- - - 23-Aug-16 19 24-Aug-16 23 2
- - - 02-Sep-16 02 14-Oct-16 06 43
18-Jul-16 19 19-Sep-16 22 64 21-Jul-16 02 22-Jul-16 02 2
03-Oct-16 03 04-Oct-16 18 2 22-Jul-16 00 24-Jul-16 04 3
- - - 26-Jul-16 05 29-Jul-16 14 4
- - - 01-Aug-16 08 08-Aug-16 06 8
- - - - - -
22-Sep-16 09 29-Jun-16 20 8 25-Jun-16 15 26-Jun-16 14 2
02-Jul-16 07 03-Jul-16 23 2 18-Jul-16 06 01-Aug-16 23 15
17-Jul-16 08 04-Aug-16 23 19 21-Sep-16 19 24-Sep-16 17 4
02-Sep-16 11 08-Sep-16 00 6 25-Sep-16 19 29-Sep-16 04 5
08-Sep-16 13 09-Sep-16 16 2 13-Oct-16 04 16-Oct-16 05 4
10-Sep-16 14 02-Oct-16 04 23 - - -
09-Oct-16 13 11-Oct-16 04 3 - - -
12-Oct-16 00 18-Oct-16 01 8 - - -
26-Jun-16 11 27-Jun-16 05 2 20-Jul-16 21 02-08-2016 17:00 14
18-Jul-16 10 05-Aug-16 09 19 23-Sep-16 06 23-09-2016 12:00 1
04-Sep-16 06 06-Sep-16 23 3 27-Sep-16 04 28-09-2016 17:00 2
09-Sep-16 07 09-Sep-16 22 1 14-Oct-16 01 14-10-2016 15:00 1
12-Sep-16 12 16-Sep-16 02 5 - - -
17-Sep-16 19 20-Sep-16 04 4 - - -
21-Sep-16 15 02-Oct-16 00 12 - - -
10-Oct-16 02 11-Oct-16 04 2 - - -
12-Oct-16 23 17-Oct-16 13 6 - - -
74 Mayurakshi Narayanpur West Bengal 26.99 27.99 26.52 12-Aug-16 06 - - - - - -
75 Ajoy Gheropara West Bengal 38.42 39.42 38.40 12-Aug-16 07 - - - - - -
76 Mundeshwari Harinkhola West Bengal 11.80 12.80 12.75 24-Aug-16 00 23-Aug-16 06 24-Aug-16 11 2 - - -
77 Kangsabati Mohanpur West Bengal 24.73 25.73 23.66 01-Aug-16 18 - - - - - -
72
73
70
27-Jul-16 17
Kosi
28-Jul-16 06Mahananda Jhawa Bihar 30.40 31.40 33.30
Mahananda Dhengraghat
28-Jul-16 01
Bihar 34.65 35.65 37.23
Bihar 32.85 33.85 35.31Baltara
71 Kosi Kursela Bihar 29.00 30.00 31.59 27-Aug-16 07
91
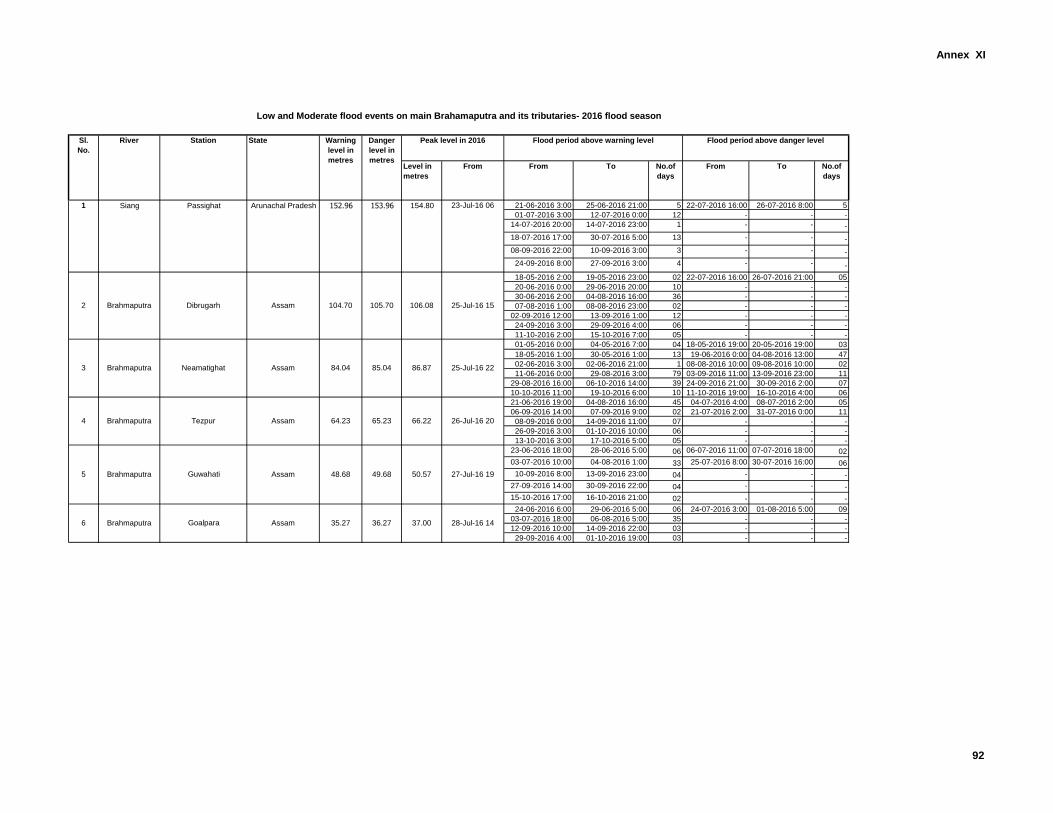
Annex XI
Level in
metres
From From To No.of
days
From To No.of
days
21-06-2016 3:00 25-06-2016 21:00 5 22-07-2016 16:00 26-07-2016 8:00 5
01-07-2016 3:00 12-07-2016 0:00 12 - - -
14-07-2016 20:00 14-07-2016 23:00 1 - - -
18-07-2016 17:00 30-07-2016 5:00 13 - - -
08-09-2016 22:00 10-09-2016 3:00 3 - - -
24-09-2016 8:00 27-09-2016 3:00 4 - - -
18-05-2016 2:00 19-05-2016 23:00 02 22-07-2016 16:00 26-07-2016 21:00 05
20-06-2016 0:00 29-06-2016 20:00 10 - - -
30-06-2016 2:00 04-08-2016 16:00 36 - - -
07-08-2016 1:00 08-08-2016 23:00 02 - - -
02-09-2016 12:00 13-09-2016 1:00 12 - - -
24-09-2016 3:00 29-09-2016 4:00 06 - - -
11-10-2016 2:00 15-10-2016 7:00 05 - - -
01-05-2016 0:00 04-05-2016 7:00 04 18-05-2016 19:00 20-05-2016 19:00 03
18-05-2016 1:00 30-05-2016 1:00 13 19-06-2016 0:00 04-08-2016 13:00 47
02-06-2016 3:00 02-06-2016 21:00 1 08-08-2016 10:00 09-08-2016 10:00 02
11-06-2016 0:00 29-08-2016 3:00 79 03-09-2016 11:00 13-09-2016 23:00 11
29-08-2016 16:00 06-10-2016 14:00 39 24-09-2016 21:00 30-09-2016 2:00 07
10-10-2016 11:00 19-10-2016 6:00 10 11-10-2016 19:00 16-10-2016 4:00 06
21-06-2016 19:00 04-08-2016 16:00 45 04-07-2016 4:00 08-07-2016 2:00 05
06-09-2016 14:00 07-09-2016 9:00 02 21-07-2016 2:00 31-07-2016 0:00 11
08-09-2016 0:00 14-09-2016 11:00 07 - - -
26-09-2016 3:00 01-10-2016 10:00 06 - - -
13-10-2016 3:00 17-10-2016 5:00 05 - - -
23-06-2016 18:00 28-06-2016 5:00 06 06-07-2016 11:00 07-07-2016 18:00 02
03-07-2016 10:00 04-08-2016 1:00 33 25-07-2016 8:00 30-07-2016 16:00 06
10-09-2016 8:00 13-09-2016 23:00 04 - - -
27-09-2016 14:00 30-09-2016 22:00 04 - - -
15-10-2016 17:00 16-10-2016 21:00 02 - - -
24-06-2016 6:00 29-06-2016 5:00 06 24-07-2016 3:00 01-08-2016 5:00 09
03-07-2016 18:00 06-08-2016 5:00 35 - - -
12-09-2016 10:00 14-09-2016 22:00 03 - - -
29-09-2016 4:00 01-10-2016 19:00 03 - - -
6
4
25-Jul-16 15
3 Brahmaputra Neamatighat Assam 84.04 85.04 86.87
65.23 66.22
2 Brahmaputra Dibrugarh Assam 104.70 105.70
25-Jul-16 22
106.08
Brahmaputra Tezpur Assam 64.23 26-Jul-16 20
Low and Moderate flood events on main Brahamaputra and its tributaries- 2016 flood season
State Warning
level in
metres
Danger
level in
metres
Peak level in 2016 Flood period above warning level Flood period above danger level Sl.
No.
River Station
27-Jul-16 1949.68
36.27 37.00 28-Jul-16 14
50.57
Brahmaputra Goalpara
Brahmaputra Guwahati Assam 48.68
Assam 35.27
Siang Passighat Arunachal Pradesh 152.96 153.96 154.80 23-Jul-16 061
5
92
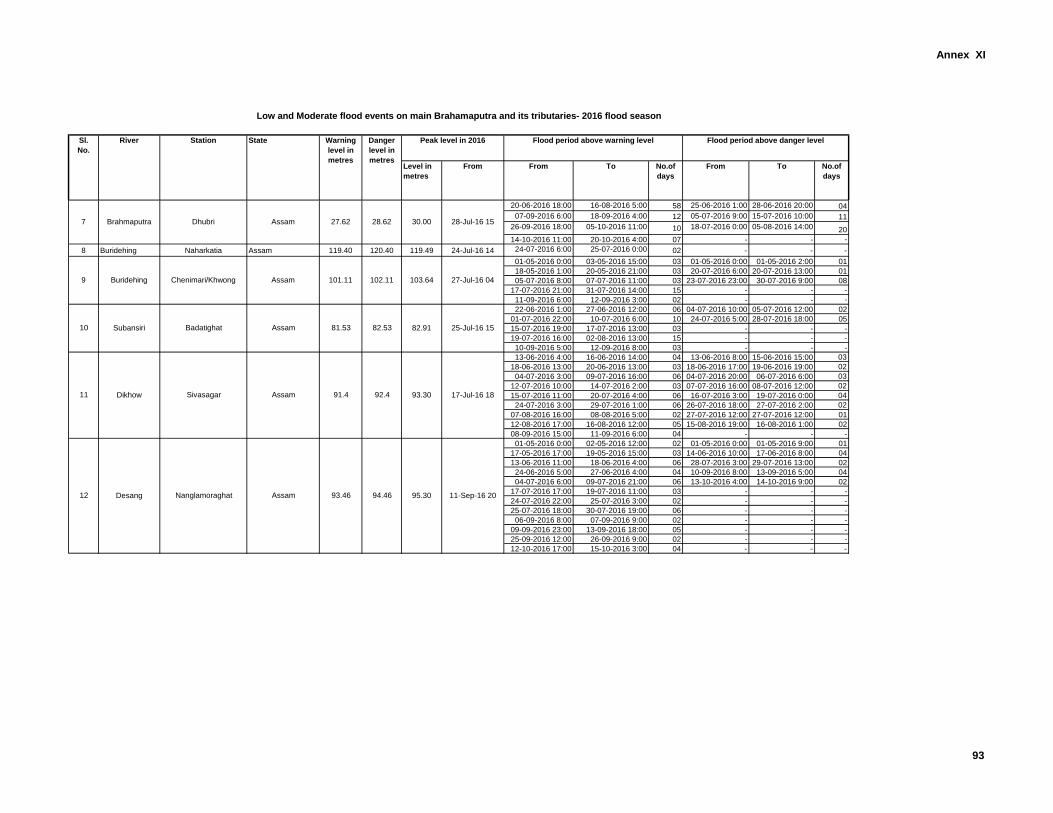
Annex XI
Level in
metres
From From To No.of
days
From To No.of
days
Low and Moderate flood events on main Brahamaputra and its tributaries- 2016 flood season
State Warning
level in
metres
Danger
level in
metres
Peak level in 2016 Flood period above warning level Flood period above danger level Sl.
No.
River Station
20-06-2016 18:00 16-08-2016 5:00 58 25-06-2016 1:00 28-06-2016 20:00 04
07-09-2016 6:00 18-09-2016 4:00 12 05-07-2016 9:00 15-07-2016 10:00 11
26-09-2016 18:00 05-10-2016 11:00 10 18-07-2016 0:00 05-08-2016 14:00 20
14-10-2016 11:00 20-10-2016 4:00 07 - - -
8 Buridehing Naharkatia Assam 119.40 120.40 119.49 24-Jul-16 14 24-07-2016 6:00 25-07-2016 0:00 02 - - -
01-05-2016 0:00 03-05-2016 15:00 03 01-05-2016 0:00 01-05-2016 2:00 01
18-05-2016 1:00 20-05-2016 21:00 03 20-07-2016 6:00 20-07-2016 13:00 01
05-07-2016 8:00 07-07-2016 11:00 03 23-07-2016 23:00 30-07-2016 9:00 08
17-07-2016 21:00 31-07-2016 14:00 15 - - -
11-09-2016 6:00 12-09-2016 3:00 02 - - -
22-06-2016 1:00 27-06-2016 12:00 06 04-07-2016 10:00 05-07-2016 12:00 02
01-07-2016 22:00 10-07-2016 6:00 10 24-07-2016 5:00 28-07-2016 18:00 05
15-07-2016 19:00 17-07-2016 13:00 03 - - -
19-07-2016 16:00 02-08-2016 13:00 15 - - -
10-09-2016 5:00 12-09-2016 8:00 03 - - -
13-06-2016 4:00 16-06-2016 14:00 04 13-06-2016 8:00 15-06-2016 15:00 03
18-06-2016 13:00 20-06-2016 13:00 03 18-06-2016 17:00 19-06-2016 19:00 02
04-07-2016 3:00 09-07-2016 16:00 06 04-07-2016 20:00 06-07-2016 6:00 03
12-07-2016 10:00 14-07-2016 2:00 03 07-07-2016 16:00 08-07-2016 12:00 02
15-07-2016 11:00 20-07-2016 4:00 06 16-07-2016 3:00 19-07-2016 0:00 04
24-07-2016 3:00 29-07-2016 1:00 06 26-07-2016 18:00 27-07-2016 2:00 02
07-08-2016 16:00 08-08-2016 5:00 02 27-07-2016 12:00 27-07-2016 12:00 01
12-08-2016 17:00 16-08-2016 12:00 05 15-08-2016 19:00 16-08-2016 1:00 02
08-09-2016 15:00 11-09-2016 6:00 04 - - -
01-05-2016 0:00 02-05-2016 12:00 02 01-05-2016 0:00 01-05-2016 9:00 01
17-05-2016 17:00 19-05-2016 15:00 03 14-06-2016 10:00 17-06-2016 8:00 04
13-06-2016 11:00 18-06-2016 4:00 06 28-07-2016 3:00 29-07-2016 13:00 02
24-06-2016 5:00 27-06-2016 4:00 04 10-09-2016 8:00 13-09-2016 5:00 04
04-07-2016 6:00 09-07-2016 21:00 06 13-10-2016 4:00 14-10-2016 9:00 02
17-07-2016 17:00 19-07-2016 11:00 03 - - -
24-07-2016 22:00 25-07-2016 3:00 02 - - -
25-07-2016 18:00 30-07-2016 19:00 06 - - -
06-09-2016 8:00 07-09-2016 9:00 02 - - -
09-09-2016 23:00 13-09-2016 18:00 05 - - -
25-09-2016 12:00 26-09-2016 9:00 02 - - -
12-10-2016 17:00 15-10-2016 3:00 04 - - -
Buridehing Chenimari/Khwong Assam 101.119
10 Subansiri Badatighat
102.11
93.30 17-Jul-16 18
94.46 95.30 11-Sep-16 20
30.00 28-Jul-16 15
25-Jul-16 15
103.64 27-Jul-16 04
82.53 82.91
Assam 93.46
81.53Assam
Brahmaputra Dhubri Assam 27.627
92.4
12 Desang
28.62
11 Dikhow Sivasagar Assam 91.4
Nanglamoraghat
93
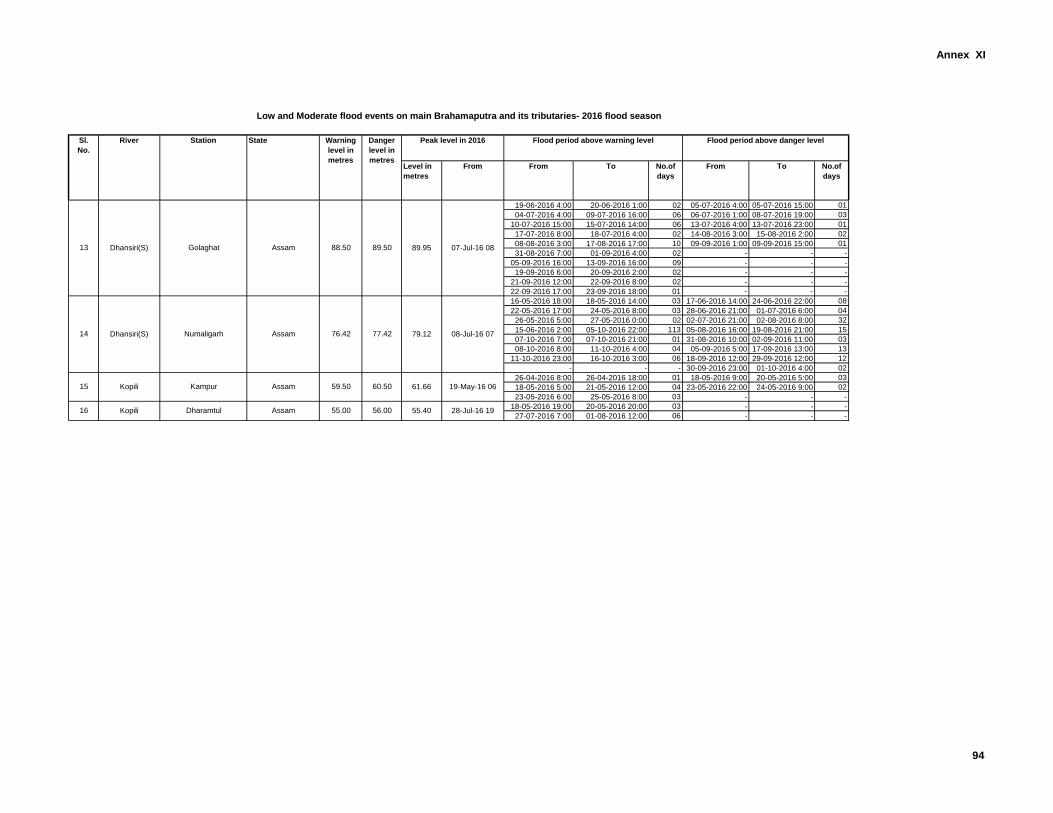
Annex XI
Level in
metres
From From To No.of
days
From To No.of
days
Low and Moderate flood events on main Brahamaputra and its tributaries- 2016 flood season
State Warning
level in
metres
Danger
level in
metres
Peak level in 2016 Flood period above warning level Flood period above danger level Sl.
No.
River Station
19-06-2016 4:00 20-06-2016 1:00 02 05-07-2016 4:00 05-07-2016 15:00 01
04-07-2016 4:00 09-07-2016 16:00 06 06-07-2016 1:00 08-07-2016 19:00 03
10-07-2016 15:00 15-07-2016 14:00 06 13-07-2016 4:00 13-07-2016 23:00 01
17-07-2016 8:00 18-07-2016 4:00 02 14-08-2016 3:00 15-08-2016 2:00 02
08-08-2016 3:00 17-08-2016 17:00 10 09-09-2016 1:00 09-09-2016 15:00 01
31-08-2016 7:00 01-09-2016 4:00 02 - - -
05-09-2016 16:00 13-09-2016 16:00 09 - - -
19-09-2016 6:00 20-09-2016 2:00 02 - - -
21-09-2016 12:00 22-09-2016 8:00 02 - - -
22-09-2016 17:00 23-09-2016 18:00 01 - - -
16-05-2016 18:00 18-05-2016 14:00 03 17-06-2016 14:00 24-06-2016 22:00 08
22-05-2016 17:00 24-05-2016 8:00 03 28-06-2016 21:00 01-07-2016 6:00 04
26-05-2016 5:00 27-05-2016 0:00 02 02-07-2016 21:00 02-08-2016 8:00 32
15-06-2016 2:00 05-10-2016 22:00 113 05-08-2016 16:00 19-08-2016 21:00 15
07-10-2016 7:00 07-10-2016 21:00 01 31-08-2016 10:00 02-09-2016 11:00 03
08-10-2016 8:00 11-10-2016 4:00 04 05-09-2016 5:00 17-09-2016 13:00 13
11-10-2016 23:00 16-10-2016 3:00 06 18-09-2016 12:00 29-09-2016 12:00 12
- - - 30-09-2016 23:00 01-10-2016 4:00 02
26-04-2016 8:00 26-04-2016 18:00 01 18-05-2016 9:00 20-05-2016 5:00 03
18-05-2016 5:00 21-05-2016 12:00 04 23-05-2016 22:00 24-05-2016 9:00 02
23-05-2016 6:00 25-05-2016 8:00 03 - - -
18-05-2016 19:00 20-05-2016 20:00 03 - - -
27-07-2016 7:00 01-08-2016 12:00 06 - - -
Assam13 Dhansiri(S)
Assam
15 Assam 59.50 60.50 61.66 19-May-16 06
14
16 Kopili Dharamtul Assam 55.00 56.00
89.50 07-Jul-16 0889.95
Dhansiri(S) Numaligarh
Kopili Kampur
79.12 08-Jul-16 0776.42 77.42
55.40 28-Jul-16 19
Golaghat 88.50
94
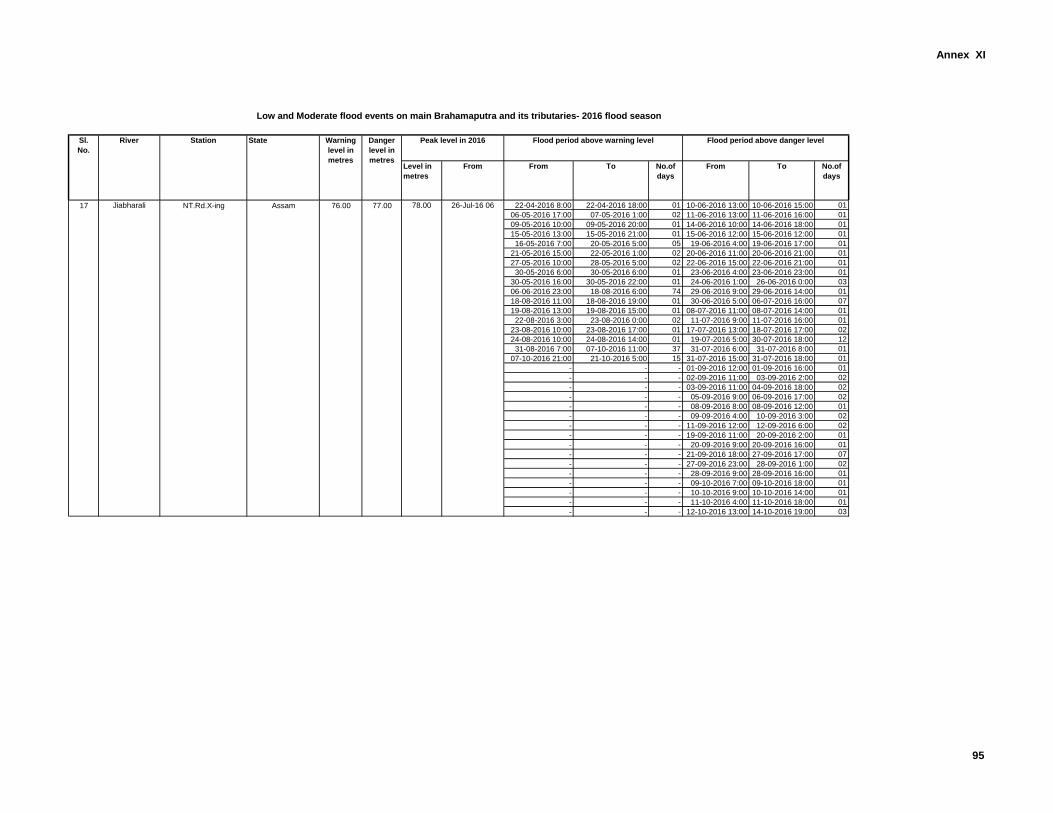
Annex XI
Level in
metres
From From To No.of
days
From To No.of
days
Low and Moderate flood events on main Brahamaputra and its tributaries- 2016 flood season
State Warning
level in
metres
Danger
level in
metres
Peak level in 2016 Flood period above warning level Flood period above danger level Sl.
No.
River Station
22-04-2016 8:00 22-04-2016 18:00 01 10-06-2016 13:00 10-06-2016 15:00 01
06-05-2016 17:00 07-05-2016 1:00 02 11-06-2016 13:00 11-06-2016 16:00 01
09-05-2016 10:00 09-05-2016 20:00 01 14-06-2016 10:00 14-06-2016 18:00 01
15-05-2016 13:00 15-05-2016 21:00 01 15-06-2016 12:00 15-06-2016 12:00 01
16-05-2016 7:00 20-05-2016 5:00 05 19-06-2016 4:00 19-06-2016 17:00 01
21-05-2016 15:00 22-05-2016 1:00 02 20-06-2016 11:00 20-06-2016 21:00 01
27-05-2016 10:00 28-05-2016 5:00 02 22-06-2016 15:00 22-06-2016 21:00 01
30-05-2016 6:00 30-05-2016 6:00 01 23-06-2016 4:00 23-06-2016 23:00 01
30-05-2016 16:00 30-05-2016 22:00 01 24-06-2016 1:00 26-06-2016 0:00 03
06-06-2016 23:00 18-08-2016 6:00 74 29-06-2016 9:00 29-06-2016 14:00 01
18-08-2016 11:00 18-08-2016 19:00 01 30-06-2016 5:00 06-07-2016 16:00 07
19-08-2016 13:00 19-08-2016 15:00 01 08-07-2016 11:00 08-07-2016 14:00 01
22-08-2016 3:00 23-08-2016 0:00 02 11-07-2016 9:00 11-07-2016 16:00 01
23-08-2016 10:00 23-08-2016 17:00 01 17-07-2016 13:00 18-07-2016 17:00 02
24-08-2016 10:00 24-08-2016 14:00 01 19-07-2016 5:00 30-07-2016 18:00 12
31-08-2016 7:00 07-10-2016 11:00 37 31-07-2016 6:00 31-07-2016 8:00 01
07-10-2016 21:00 21-10-2016 5:00 15 31-07-2016 15:00 31-07-2016 18:00 01
- - - 01-09-2016 12:00 01-09-2016 16:00 01
- - - 02-09-2016 11:00 03-09-2016 2:00 02
- - - 03-09-2016 11:00 04-09-2016 18:00 02
- - - 05-09-2016 9:00 06-09-2016 17:00 02
- - - 08-09-2016 8:00 08-09-2016 12:00 01
- - - 09-09-2016 4:00 10-09-2016 3:00 02
- - - 11-09-2016 12:00 12-09-2016 6:00 02
- - - 19-09-2016 11:00 20-09-2016 2:00 01
- - - 20-09-2016 9:00 20-09-2016 16:00 01
- - - 21-09-2016 18:00 27-09-2016 17:00 07
- - - 27-09-2016 23:00 28-09-2016 1:00 02
- - - 28-09-2016 9:00 28-09-2016 16:00 01
- - - 09-10-2016 7:00 09-10-2016 18:00 01
- - - 10-10-2016 9:00 10-10-2016 14:00 01
- - - 11-10-2016 4:00 11-10-2016 18:00 01
- - - 12-10-2016 13:00 14-10-2016 19:00 03
76.00 26-Jul-16 06Jiabharali17 NT.Rd.X-ing Assam 78.0077.00
95
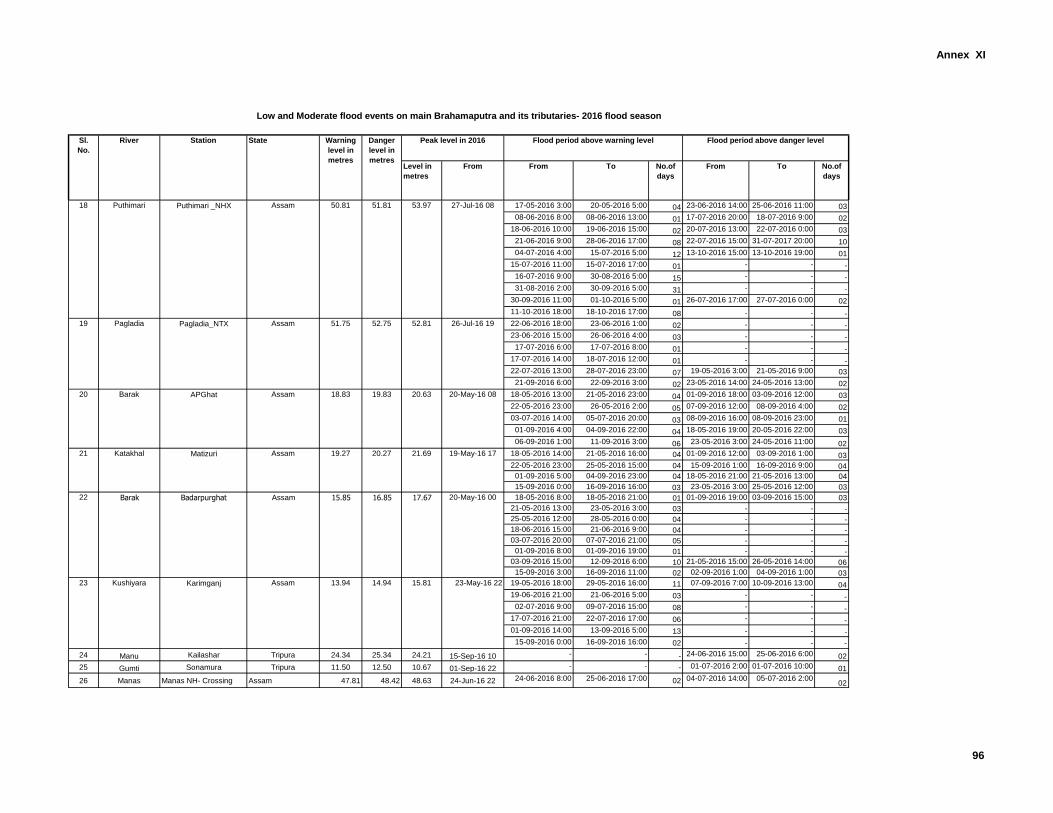
Annex XI
Level in
metres
From From To No.of
days
From To No.of
days
Low and Moderate flood events on main Brahamaputra and its tributaries- 2016 flood season
State Warning
level in
metres
Danger
level in
metres
Peak level in 2016 Flood period above warning level Flood period above danger level Sl.
No.
River Station
17-05-2016 3:00 20-05-2016 5:00 04 23-06-2016 14:00 25-06-2016 11:00 03
08-06-2016 8:00 08-06-2016 13:00 01 17-07-2016 20:00 18-07-2016 9:00 02
18-06-2016 10:00 19-06-2016 15:00 02 20-07-2016 13:00 22-07-2016 0:00 03
21-06-2016 9:00 28-06-2016 17:00 08 22-07-2016 15:00 31-07-2017 20:00 10
04-07-2016 4:00 15-07-2016 5:00 12 13-10-2016 15:00 13-10-2016 19:00 01
15-07-2016 11:00 15-07-2016 17:00 01 - - -
16-07-2016 9:00 30-08-2016 5:00 15 - - -
31-08-2016 2:00 30-09-2016 5:00 31 - - -
30-09-2016 11:00 01-10-2016 5:00 01 26-07-2016 17:00 27-07-2016 0:00 02
11-10-2016 18:00 18-10-2016 17:00 08 - - -
22-06-2016 18:00 23-06-2016 1:00 02 - - -
23-06-2016 15:00 26-06-2016 4:00 03 - - -
17-07-2016 6:00 17-07-2016 8:00 01 - - -
17-07-2016 14:00 18-07-2016 12:00 01 - - -
22-07-2016 13:00 28-07-2016 23:00 07 19-05-2016 3:00 21-05-2016 9:00 03
21-09-2016 6:00 22-09-2016 3:00 02 23-05-2016 14:00 24-05-2016 13:00 02
18-05-2016 13:00 21-05-2016 23:00 04 01-09-2016 18:00 03-09-2016 12:00 03
22-05-2016 23:00 26-05-2016 2:00 05 07-09-2016 12:00 08-09-2016 4:00 02
03-07-2016 14:00 05-07-2016 20:00 03 08-09-2016 16:00 08-09-2016 23:00 01
01-09-2016 4:00 04-09-2016 22:00 04 18-05-2016 19:00 20-05-2016 22:00 03
06-09-2016 1:00 11-09-2016 3:00 06 23-05-2016 3:00 24-05-2016 11:00 02
18-05-2016 14:00 21-05-2016 16:00 04 01-09-2016 12:00 03-09-2016 1:00 03
22-05-2016 23:00 25-05-2016 15:00 04 15-09-2016 1:00 16-09-2016 9:00 04
01-09-2016 5:00 04-09-2016 23:00 04 18-05-2016 21:00 21-05-2016 13:00 04
15-09-2016 0:00 16-09-2016 16:00 03 23-05-2016 3:00 25-05-2016 12:00 03
18-05-2016 8:00 18-05-2016 21:00 01 01-09-2016 19:00 03-09-2016 15:00 03
21-05-2016 13:00 23-05-2016 3:00 03 - - -
25-05-2016 12:00 28-05-2016 0:00 04 - - -
18-06-2016 15:00 21-06-2016 9:00 04 - - -
03-07-2016 20:00 07-07-2016 21:00 05 - - -
01-09-2016 8:00 01-09-2016 19:00 01 - - -
03-09-2016 15:00 12-09-2016 6:00 10 21-05-2016 15:00 26-05-2016 14:00 06
15-09-2016 3:00 16-09-2016 11:00 02 02-09-2016 1:00 04-09-2016 1:00 03
19-05-2016 18:00 29-05-2016 16:00 11 07-09-2016 7:00 10-09-2016 13:00 04
19-06-2016 21:00 21-06-2016 5:00 03 - - -
02-07-2016 9:00 09-07-2016 15:00 08 - - -
17-07-2016 21:00 22-07-2016 17:00 06 - - -
01-09-2016 14:00 13-09-2016 5:00 13 - - -
15-09-2016 0:00 16-09-2016 16:00 02 - - -
24 Manu Kailashar Tripura 24.34 25.34 24.21 15-Sep-16 10 - - - 24-06-2016 15:00 25-06-2016 6:00 02
25 Gumti Sonamura Tripura 11.50 12.50 10.67 01-Sep-16 22 - - - 01-07-2016 2:00 01-07-2016 10:00 01
26 Manas Manas NH- Crossing Assam 47.81 48.42 48.63 24-Jun-16 22 24-06-2016 8:00 25-06-2016 17:00 02 04-07-2016 14:00 05-07-2016 2:0002
17.67 20-May-16 00
15.8114.9423 Kushiyara Karimganj Assam 13.94
51.75 52.75 52.81 26-Jul-16 19
18 Puthimari Puthimari _NHX Assam 50.81
22 Barak Badarpurghat Assam 15.85 16.85
21 Katakhal Matizuri Assam 19.27
20-May-16 08
27-Jul-16 08
20 Barak APGhat Assam 18.83 19.83 20.63
20.27 21.69 19-May-16 17
23-May-16 22
19 Pagladia Pagladia_NTX Assam
53.9751.81
96
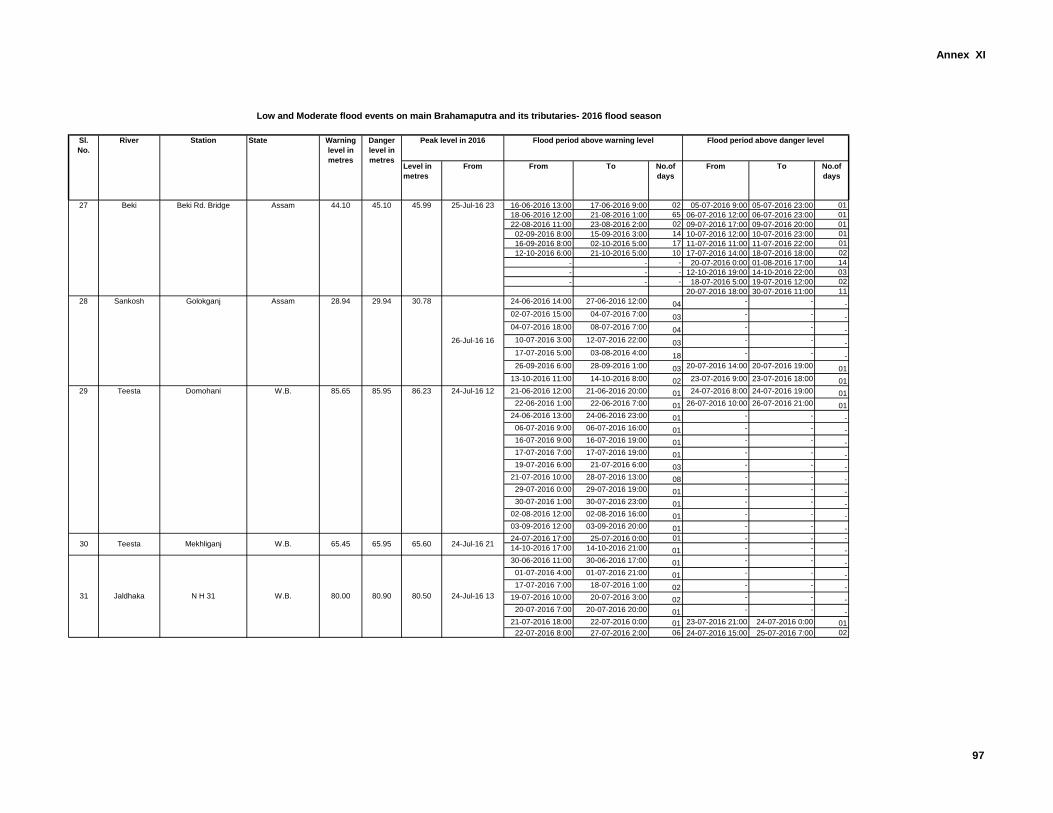
Annex XI
Level in
metres
From From To No.of
days
From To No.of
days
Low and Moderate flood events on main Brahamaputra and its tributaries- 2016 flood season
State Warning
level in
metres
Danger
level in
metres
Peak level in 2016 Flood period above warning level Flood period above danger level Sl.
No.
River Station
16-06-2016 13:00 17-06-2016 9:00 02 05-07-2016 9:00 05-07-2016 23:00 01
18-06-2016 12:00 21-08-2016 1:00 65 06-07-2016 12:00 06-07-2016 23:00 01
22-08-2016 11:00 23-08-2016 2:00 02 09-07-2016 17:00 09-07-2016 20:00 01
02-09-2016 8:00 15-09-2016 3:00 14 10-07-2016 12:00 10-07-2016 23:00 01
16-09-2016 8:00 02-10-2016 5:00 17 11-07-2016 11:00 11-07-2016 22:00 01
12-10-2016 6:00 21-10-2016 5:00 10 17-07-2016 14:00 18-07-2016 18:00 02
- - - 20-07-2016 0:00 01-08-2016 17:00 14
- - - 12-10-2016 19:00 14-10-2016 22:00 03
- - - 18-07-2016 5:00 19-07-2016 12:00 02
20-07-2016 18:00 30-07-2016 11:00 11
24-06-2016 14:00 27-06-2016 12:00 04 - - -
02-07-2016 15:00 04-07-2016 7:00 03 - - -
04-07-2016 18:00 08-07-2016 7:00 04 - - -
10-07-2016 3:00 12-07-2016 22:00 03 - - -
17-07-2016 5:00 03-08-2016 4:00 18 - - -
26-09-2016 6:00 28-09-2016 1:00 03 20-07-2016 14:00 20-07-2016 19:00 01
13-10-2016 11:00 14-10-2016 8:00 02 23-07-2016 9:00 23-07-2016 18:00 01
21-06-2016 12:00 21-06-2016 20:00 01 24-07-2016 8:00 24-07-2016 19:00 01
22-06-2016 1:00 22-06-2016 7:00 01 26-07-2016 10:00 26-07-2016 21:00 01
24-06-2016 13:00 24-06-2016 23:00 01 - - -
06-07-2016 9:00 06-07-2016 16:00 01 - - -
16-07-2016 9:00 16-07-2016 19:00 01 - - -
17-07-2016 7:00 17-07-2016 19:00 01 - - -
19-07-2016 6:00 21-07-2016 6:00 03 - - -
21-07-2016 10:00 28-07-2016 13:00 08 - - -
29-07-2016 0:00 29-07-2016 19:00 01 - - -
30-07-2016 1:00 30-07-2016 23:00 01 - - -
02-08-2016 12:00 02-08-2016 16:00 01 - - -
03-09-2016 12:00 03-09-2016 20:00 01 - - -
24-07-2016 17:00 25-07-2016 0:00 01 - - -
14-10-2016 17:00 14-10-2016 21:00 01 - - -
30-06-2016 11:00 30-06-2016 17:00 01 - - -
01-07-2016 4:00 01-07-2016 21:00 01 - - -
17-07-2016 7:00 18-07-2016 1:00 02 - - -
19-07-2016 10:00 20-07-2016 3:00 02 - - -
20-07-2016 7:00 20-07-2016 20:00 01 - - -
21-07-2016 18:00 22-07-2016 0:00 01 23-07-2016 21:00 24-07-2016 0:00 01
22-07-2016 8:00 27-07-2016 2:00 06 24-07-2016 15:00 25-07-2016 7:00 02
25-Jul-16 23
Assam 28.94
27 Beki Beki Rd. Bridge Assam 44.10
80.50
W.B.
28
30 Teesta Mekhliganj W.B. 65.45 65.95
29.94
85.65
31 Jaldhaka N H 31 W.B. 80.00 80.90 24-Jul-16 13
45.10
29 Teesta Domohani
Sankosh
85.95 86.23 24-Jul-16 12
Golokganj 30.78
26-Jul-16 16
65.60 24-Jul-16 21
45.99
97
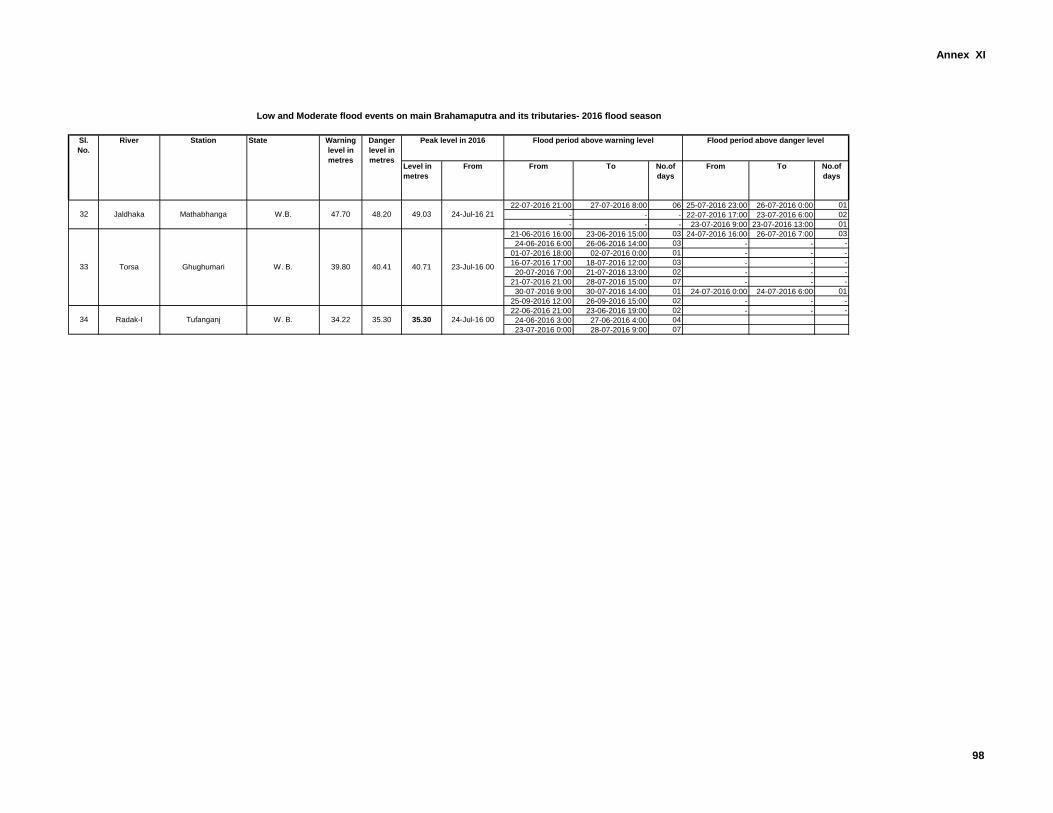
Annex XI
Level in
metres
From From To No.of
days
From To No.of
days
Low and Moderate flood events on main Brahamaputra and its tributaries- 2016 flood season
State Warning
level in
metres
Danger
level in
metres
Peak level in 2016 Flood period above warning level Flood period above danger level Sl.
No.
River Station
22-07-2016 21:00 27-07-2016 8:00 06 25-07-2016 23:00 26-07-2016 0:00 01
- - - 22-07-2016 17:00 23-07-2016 6:00 02
- - - 23-07-2016 9:00 23-07-2016 13:00 01
21-06-2016 16:00 23-06-2016 15:00 03 24-07-2016 16:00 26-07-2016 7:00 03
24-06-2016 6:00 26-06-2016 14:00 03 - - -
01-07-2016 18:00 02-07-2016 0:00 01 - - -
16-07-2016 17:00 18-07-2016 12:00 03 - - -
20-07-2016 7:00 21-07-2016 13:00 02 - - -
21-07-2016 21:00 28-07-2016 15:00 07 - - -
30-07-2016 9:00 30-07-2016 14:00 01 24-07-2016 0:00 24-07-2016 6:00 01
25-09-2016 12:00 26-09-2016 15:00 02 - - -
22-06-2016 21:00 23-06-2016 19:00 02 - - -
24-06-2016 3:00 27-06-2016 4:00 04
23-07-2016 0:00 28-07-2016 9:00 07
35.30 24-Jul-16 00
32 Jaldhaka
33 Torsa Ghughumari W. B. 39.80 40.41 40.71 23-Jul-16 00
34 Radak-I Tufanganj W. B. 34.22 35.30
Mathabhanga W.B. 47.70 48.20 49.03 24-Jul-16 21
98
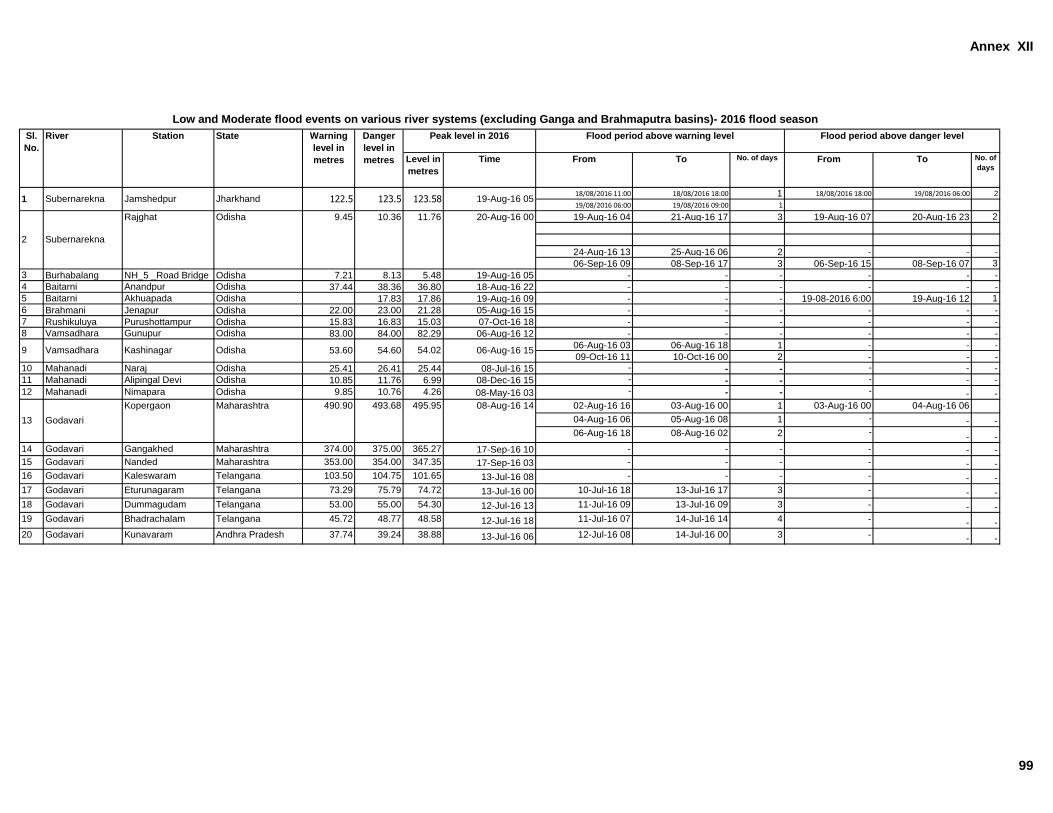
Annex XII
Level in
metres
Time From To No. of days From To No. of
days
18/08/2016 11:00 18/08/2016 18:00 1 18/08/2016 18:00 19/08/2016 06:00 2
19/08/2016 06:00 19/08/2016 09:00 1
19-Aug-16 04 21-Aug-16 17 3 19-Aug-16 07 20-Aug-16 23 2
24-Aug-16 13 25-Aug-16 06 2 - - -
06-Sep-16 09 08-Sep-16 17 3 06-Sep-16 15 08-Sep-16 07 3
3 Burhabalang NH_5 _Road Bridge Odisha 7.21 8.13 5.48 19-Aug-16 05 - - - - - -
4 Baitarni Anandpur Odisha 37.44 38.36 36.80 18-Aug-16 22 - - - - - -
5 Baitarni Akhuapada Odisha 17.83 17.86 19-Aug-16 09 - - - 19-08-2016 6:00 19-Aug-16 12 1
6 Brahmani Jenapur Odisha 22.00 23.00 21.28 05-Aug-16 15 - - - - - -
7 Rushikuluya Purushottampur Odisha 15.83 16.83 15.03 07-Oct-16 18 - - - - - -
8 Vamsadhara Gunupur Odisha 83.00 84.00 82.29 06-Aug-16 12 - - - - - -
06-Aug-16 03 06-Aug-16 18 1 - - -
09-Oct-16 11 10-Oct-16 00 2 - - -
10 Mahanadi Naraj Odisha 25.41 26.41 25.44 08-Jul-16 15 - - - - - -
11 Mahanadi Alipingal Devi Odisha 10.85 11.76 6.99 08-Dec-16 15 - - - - - -
12 Mahanadi Nimapara Odisha 9.85 10.76 4.26 08-May-16 03 - - - - - -
02-Aug-16 16 03-Aug-16 00 1 03-Aug-16 00 04-Aug-16 06
04-Aug-16 06 05-Aug-16 08 1 - - -
06-Aug-16 18 08-Aug-16 02 2 -- -
14 Godavari Gangakhed Maharashtra 374.00 375.00 365.27 17-Sep-16 10 - - - - - -
15 Godavari Nanded Maharashtra 353.00 354.00 347.35 17-Sep-16 03 - - - - - -
16 Godavari Kaleswaram Telangana 103.50 104.75 101.65 13-Jul-16 08 - - - - - -
17 Godavari Eturunagaram Telangana 73.29 75.79 74.72 13-Jul-16 00 10-Jul-16 18 13-Jul-16 17 3 - - -
18 Godavari Dummagudam Telangana 53.00 55.00 54.30 12-Jul-16 13 11-Jul-16 09 13-Jul-16 09 3 - - -
19 Godavari Bhadrachalam Telangana 45.72 48.77 48.58 12-Jul-16 18 11-Jul-16 07 14-Jul-16 14 4 - - -
20 Godavari Kunavaram Andhra Pradesh 37.74 39.24 38.88 13-Jul-16 06 12-Jul-16 08 14-Jul-16 00 3 - - -
1 Subernarekna Jamshedpur Jharkhand 122.5 123.5 123.58 19-Aug-16 05
10.36 11.76 20-Aug-16 00
13 Godavari
08-Aug-16 14Kopergaon Maharashtra 490.90 493.68 495.95
9 Vamsadhara 54.02 06-Aug-16 1554.60Kashinagar Odisha 53.60
Low and Moderate flood events on various river systems (excluding Ganga and Brahmaputra basins)- 2016 flood season
Sl.
No.
River Danger
level in
metres
Peak level in 2016State Warning
level in
metres
Flood period above danger level Flood period above warning levelStation
2 Subernarekna
Rajghat Odisha 9.45
99
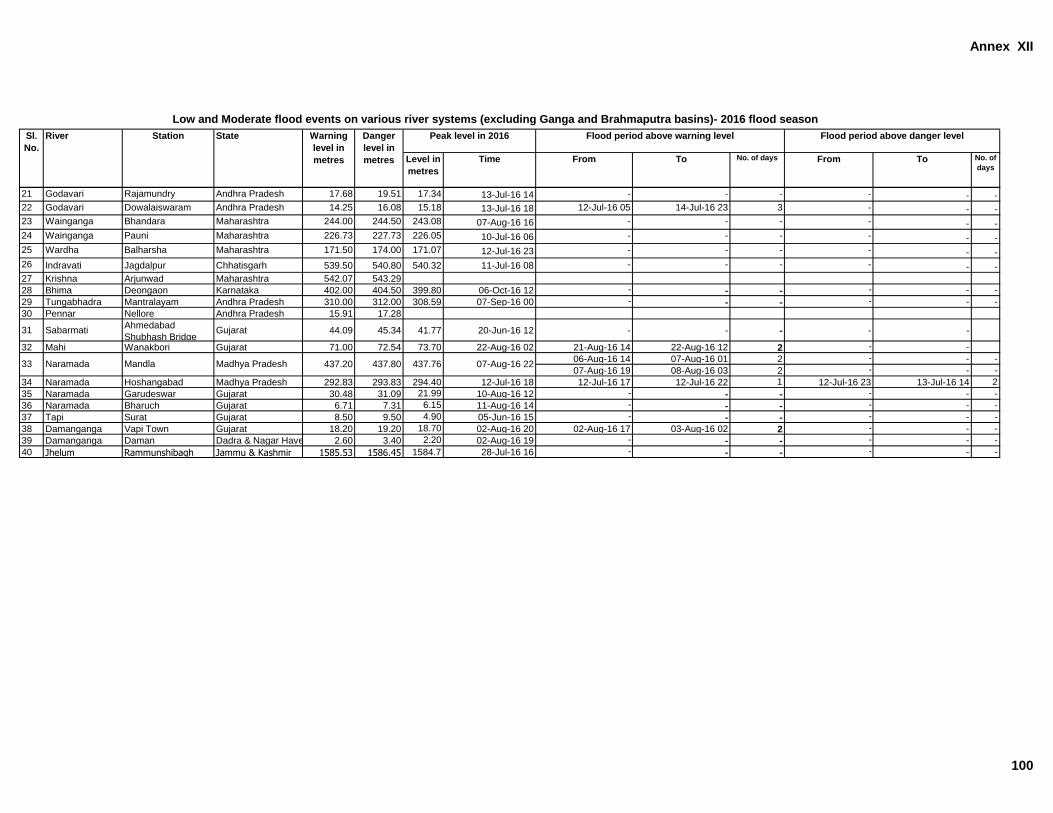
Annex XII
Level in
metres
Time From To No. of days From To No. of
days
Low and Moderate flood events on various river systems (excluding Ganga and Brahmaputra basins)- 2016 flood season
Sl.
No.
River Danger
level in
metres
Peak level in 2016State Warning
level in
metres
Flood period above danger level Flood period above warning levelStation
21 Godavari Rajamundry Andhra Pradesh 17.68 19.51 17.34 13-Jul-16 14 - - - - - -
22 Godavari Dowalaiswaram Andhra Pradesh 14.25 16.08 15.18 13-Jul-16 18 12-Jul-16 05 14-Jul-16 23 3 - - -
23 Wainganga Bhandara Maharashtra 244.00 244.50 243.08 07-Aug-16 16 - - - - - -
24 Wainganga Pauni Maharashtra 226.73 227.73 226.05 10-Jul-16 06 - - - - - -
25 Wardha Balharsha Maharashtra 171.50 174.00 171.07 12-Jul-16 23 - - - - - -
26 Indravati Jagdalpur Chhatisgarh 539.50 540.80 540.32 11-Jul-16 08 - - - - - -
27 Krishna Arjunwad Maharashtra 542.07 543.29
28 Bhima Deongaon Karnataka 402.00 404.50 399.80 06-Oct-16 12 - - - - - -
29 Tungabhadra Mantralayam Andhra Pradesh 310.00 312.00 308.59 07-Sep-16 00 - - - - - -
30 Pennar Nellore Andhra Pradesh 15.91 17.28
31 SabarmatiAhmedabad
Shubhash BridgeGujarat 44.09 45.34 41.77 20-Jun-16 12 - - - - -
32 Mahi Wanakbori Gujarat 71.00 72.54 73.70 22-Aug-16 02 21-Aug-16 14 22-Aug-16 12 2 - -
06-Aug-16 14 07-Aug-16 01 2 - - -
07-Aug-16 19 08-Aug-16 03 2 - - -
34 Naramada Hoshangabad Madhya Pradesh 292.83 293.83 294.40 12-Jul-16 18 12-Jul-16 17 12-Jul-16 22 1 12-Jul-16 23 13-Jul-16 14 2
35 Naramada Garudeswar Gujarat 30.48 31.09 21.99 10-Aug-16 12 - - - - - -
36 Naramada Bharuch Gujarat 6.71 7.31 6.15 11-Aug-16 14 - - - - - -
37 Tapi Surat Gujarat 8.50 9.50 4.90 05-Jun-16 15 - - - - - -
38 Damanganga Vapi Town Gujarat 18.20 19.20 18.70 02-Aug-16 20 02-Aug-16 17 03-Aug-16 02 2 - - -
39 Damanganga Daman Dadra & Nagar Haveli 2.60 3.40 2.20 02-Aug-16 19 - - - - - -
40 Jhelum Rammunshibagh Jammu & Kashmir 1585.53 1586.45 1584.7 28-Jul-16 16 - - - - - -
437.80 437.76 07-Aug-16 2233 Naramada Mandla Madhya Pradesh 437.20
100