baguio city smart flood warning, information
TRANSCRIPT

PHI: BAGUIO CITYSMART FLOOD WARNING, INFORMATION AND MITIGATION SYSTEM
BASELINE ASSESSMENT REPORTJANUARY 2021


Project no. 1100040737-002 Recipient Asian Development Bank Document type Report - FINAL Version 2.0 Date 28/01/2021 Prepared by Alvaro Fonseca, Melvin Solomon, Prajnya Nayak, Manir Ryne, Ida Bülow Gregersen, Lara Alvarez, Mads Terkelsen, Trine Munk, Francis Funa, Miguel Guioguio, Paul Rivera, Edward Lucero, Maria Asmussen, Mirlinda Sulejmani, Benjamin Holm, Isabella Baum Checked by Hillarie Cania
Approved by Richard Ward
Description This Baseline Assessment Report is first deliverable in the project “PHI: Baguio City
Smart Flood Warning, Information and Mitigation System” as part of the trust fund.

i
CONTENTS
List of Figures iii
List of Tables v
Abbreviations v
Executive Summary vii
1. Introduction 11.1 Programme (AASCTF) 21.2 Project rationale 31.3 Project overall approach 51.4 Project Study Area 71.5 Report Structure 9
2. Project initiation 112.1 Mobilisation and project working group 122.2 Project Kick-Off 122.3 BLISTT 122.4 Baseline Assessment Workshop 132.5 Twinning and Networking 15
3. Collection and review of data and information 193.1 Methodology for data collection and review 203.2 GIS inventory 213.3 Review of local reports and plans 213.4 Local Settings 23
4. Climate Change Baseline 414.1 Methodology for climate change assessment 424.2 Historical and present climate conditions 434.3 Main Climate Hazards 464.4 Trend analysis 474.5 Climate scenarios 49
Table of Contents

iiTable of Contents
5. Flood Early Warning System and Hydraulic Modelling 515.1 FEWS framework 525.2 Project area for FEWS 545.3 Methodology for hydrodynamic modelling 555.4 Gaps identified 575.5 On-the-job training 57
6. Hazard and risk mapping 596.1 Framework 606.2 Assessment of previous studies and available data 616.3 Methodology for risk and impact assessment 646.4 Gaps identified 66
7. Flood Mitigation Action Plan 677.1 Methodology for the project 697.2 Gaps identified 70
8. Conclusion and gap analysis 71
References 73

Figure 1: Public space, Baguio.................................................................................................................................................1Figure 2: Delineation of project study areas, comprising the FEWS project area (466 km2) and the Risk Assessment / Action Plan project area (58 km2)............................................................................................1Figure 3: Baguio City Hall.........................................................................................................................................................11Figure 4: Picture taken during the Baseline Assessment Workshop...............................................................13-14Figure 5: Twinning and Networking arrangements................................................................................................15-16Figure 6: Data collection and review...................................................................................................................................19Figure 7: Location maps showing different administrative areas; from local to regional boundaries..........................................................................................................................................................23-24Figure 8: Topographic Map of Baguio City...............................................................................................................25-26Figure 9: Existing land use......................................................................................................................................................28Figure 10: Future land use.........................................................................................................................................................28Figure 11: Critical infrastructure include utilities, health units and evacuation centres....................................30Figure 12: Social infrastructure include businesses, cultural sites, and the airport...............................................30Figure 13: Educational institute include elementary, secondary and tertiary level institutes.........................32Figure 14: Existing road network............................................................................................................................................32Figure 15: Location of informal settlement in Baguio city.....................................................................................33-34Figure 16: Population Density in Baguio..............................................................................................................................36Figure 17: 5-year Flood Hazard Map.....................................................................................................................................36Figure 18: Location of Sinkhole in Baguio City..................................................................................................................39Figure 19: Landslide Susceptibility Zone.............................................................................................................................39Figure 20: Benguet pine trees..................................................................................................................................................41Figure 21: Locations of Meteorological Stations..............................................................................................................44Figure 22: Average monthly relative humidity and number of rainy days in Baguio City (1981-2010).......45Figure 23: Average monthly rainfall and temperature in Baguio City (1981-2010)............................................45Figure 24: Summary of climate hazards that impact Baguio City..............................................................................46Figure 25: Mean annual temperature from 1949-2019, measured at station 328 – Baguio...........................48Figure 26: Accumulated annual rainfall depths for the city of Baguio.....................................................................48Figure 27: Annual maxima of accumulated daily rainfall for the city of Baguio...................................................48Figure 28: Night market, Baguio City....................................................................................................................................51Figure 29: FEWS Framework.....................................................................................................................................................52Figure 30: FEWS project area and river basins..................................................................................................................56Figure 31: Modelling components-summary....................................................................................................................49Figure 32: Landscape, Northern Luzon.................................................................................................................................59 Figure 33: Overall approach to a risk assessment based on AR5 WGII and overall approach to an impact assessment inspired by AR5 WGII....................................................................................................................60Figure 34: People affected due to flood and landslide from 2001 to 2018............................................................63
iii List of Tables and Figures
LIST OF FIGURES

Figure 35: Methodology for the flood risk assessment of Baguio............................................................................64Figure 36: Methodology for the landslide impact assessment of Baguio..............................................................66Figure 37: Market Stands, Baguio City..................................................................................................................................67Figure 38: Visualized process for selecting three high risk areas for further studies.........................................68Figure 39: Ramboll’s four-step process for cost-benefit analyses.............................................................................69Figure 40: Baguio City Centre...................................................................................................................................................71
LIST OF TABLESTable 1: Project tasks and associated activities and deliverables.............................................................................6Table 2: Schematic summary of key local reports and plans reviewed in this report.....................................22Table 3: Projected seasonal change in mean temperature for 2036-2065 compared to baseline 1971- 2000 in CLIRAM for the province of Benguet...............................................................................................50Table 4: Projected seasonal change in mean temperature for 2036-2065 compared to baseline 1971- 2000 in CLIRAM for the province of Benguet...............................................................................................50
ivList of Tables and Figures iv

v
AASCTF ASEAN Australia Smart Cities Trust FundADB Asian Development BankASTI Advanced Science and Technology InstituteBLISTT Baguio City, La Trinidad, Itogon, Sablan, Tuba, TublayCAR Cordillera Administrative RegionCBA Cost Benefit AnalysisCBAO City Building and Architecture OfficeCDP Comprehensive Development Plan CDRA Climate and Disaster Risk AssessmentCDRRMO City Disaster Risk Reduction and Management OfficeCEPMO City Environment and Parks ManagementCSIRO Commonwealth Scientific and Industrial Research OrganisationCSIRO-CCAM CSIRO’s Conformal-Cubic Atmospheric ModelCDS Chicago Design StormCEO City Engineering OfficeCLUP Comprehensive Land Use Plan 2013-2023CPDO City Planning and Development OfficeCSWDO City Social Welfare and Development OfficeDEM Digital elevation modelDFAT Department of Foreign Affairs and Trade, AustraliaDPWH Department of Public Works and HighwaysDOST Department of Science and TechnologyENSO El Niño-Southern OscillationFEWS Flood Early Warning SystemGESI Gender Equality and Social InclusionGFS Global Forecasting System HLURB Housing and Land Use Regulatory Board
v Abbreviations
ABBREVIATIONS

vi
IDF Intensity-Duration-FrequencyIFSAR Interferometric Synthetic Aperture RadarIPCC Intergovernmental Panel on Climate ChangeITBS Information Technology Business SolutionsLGU Local Government UnitLCCAP Local Climate Change Adaptation PlanLDRRMP Local Disaster Risk Reduction Management PlanLiPAD LiDAR Portal for Archiving and DistributionLULC Land Use Land CoverMCA Multi-Criteria AnalysisM&E Monitoring & EvaluationNAM Nedbor Afstromnings ModelNbS Nature-based SolutionsNCIP National Commission on Indigenous PeopleNEDA National Economic Development AuthorityNSO National Statistics OfficeNWRB National Water Resources Board, Groundwater Management Plan of Baguio CityRA Risk AssessmentRCP Representative Concentration PathwaysRIDF Rainfall intensity duration frequencyOCD Office of Civil DefenceOJT On-the-job trainingOSM OpenStreetMapPAGASA Philippine Atmospheric Geophysical and Astronomical Services AdministrationPSA Philippine Statistic AuthoritySLU Saint Louis UniversityUNFCCC United Nations Framework Convention on Climate Change
Abbreviations

vii
The occurrence of flooding and landslides, both regular phenomena in Baguio City, threaten Baguio’s sustained and long-term economic development. Baguio City is considered the “summer capital of the Philippines”, attracting 1.8 million tourists in 2018, with an annual growth rate of ca. 16%. By being exposed and having a high vulnerability to climate hazards, combined with the expansion of impervious paved areas within the city and its surroundings, Baguio is experiencing increasing runoff volumes and flood damages. All these impacts are expected to be compounded by climate change, which will very likely cause an increase in the frequency and intensity of rainfall events and further exacerbate pluvial and fluvial flooding and rain-induced landslides.
In April 2019, the Asian Development Bank (ADB) approved the establishment of the ASEAN Australia Smart Cities Trust Fund (AASCTF or the Fund) under the Urban Financing Partnership Facility, with financing provided by the Government of Australia, through its Department of Foreign Affairs and Trade (DFAT). Through this mechanism, the ADB is supporting Baguio City in implementing the Smart Flood Early Warning, Information and Mitigation System project, which will include four outputs: (i) smart flood early warning information system (FEWS) established and operational; (ii) real-time data capture system established in four river basins in Baguio City; (iii) flood mitigation action plan prepared; and (iv) city twinning programme for smart flood warning and mitigation implemented.
This Baseline Assessment report is the first out of six reports to be produced in this project and documents the work to date within the past 3 months since 30 September when the project kick-off meeting took place in Baguio. Several datasets and information have been collected and reviewed, leading to the development of a GIS inventory which will support all upcoming project tasks until December 2021 when the project is expected to finalize. An overall Gap Analysis has also been developed through preliminary assessments cutting across the overarching project components: climate change; hydrodynamic modelling; FEWS design; risk assessment; and flood mitigation action plan.
Executive Summary
EXECUTIVE SUMMARY

viiiExecutive Summary
Key outputs or findings in this report comprise a detailed analysis of the Digital Elevation Model (DEM) to be used moving forward; identification of key social and critical infrastructure to shape the risk assessment; climate change trend analysis of historical temperature and rainfall records to understand past and future climate change developments together with an analysis of climate scenarios; definition of the FEWS framework that will guide all hydrodynamic modelling activities; delineation of the FEWS project area (ca. 466 km2) based on the DEM and the gauging stations available in the catchment; selection of the Balili river to pilot the FEWS on the basis of flood predominance and available data; definition of the methods driving the risk assessment and cost-benefit analyses (CBA), both to be contained within the boundaries of Baguio city; and a preliminary on-the-job (OTJ) training plan which will be fine-tuned in the upcoming months together with four people selected by the LGU to participate.
Key data and information gaps relate to all project components, the most critical being lack of bathymetry data, i.e. river cross-sections. A river survey to bridge this gap is already ongoing and is expected to finish in February 2021. Other critical gaps relate to the lack of river discharge data within the FEWS project area, the lack of gauging stations in the river Ambalanga and the apparent lack of urban drainage system data. Contingency measures for these gaps are provided. Regardless, all gaps will be further assessed in detail in the upcoming task.
A Baseline Assessment Workshop took place on 16 December 2020 at Baguio City Hall with the project’s working group. A total of 21 people from different stakeholders participated in the workshop, where this report’s findings and identified gaps were presented and discussed in an interactive and participative setup. The workshop was hosted by the LGU and facilitated by the Consultant, together with ADB. Project objectives, current findings and upcoming activities were discussed, and gap mitigation actions were jointly identified by the Consultant and stakeholders.

1 Introduction
Figure 1: Public space, BaguioSource: Eryka Raton, unsplash
1. INTRODUCTION

2Introduction
In April 2019, the Asian Development Bank (ADB) approved the establishment of the ASEAN Australia Smart Cities Trust Fund (AASCTF or the Fund) under the Urban Financing Partnership Facility, with financing provided by the Government of Australia, through its Department of Foreign Affairs and Trade (DFAT). The Fund’s envisioned impact aligns with ADB’s Strategy 2030, as well as ASEAN’s Sustainable Urbanization Strategy which aims to promote high quality of life, competitive economies, and sustainable environments. The expected outcome of the Fund will be that through the adaptation and adoption of digital solutions, across three core functional areas (planning systems, service delivery and financial management), systems and governance in participating ASEAN cities are improved, in particular by way of:
• Strengthening city planning processes by enhancing the collection, storage, analysis and utilization of data on geospatial platforms.
• Promoting the use of integrated and smart network management systems to strengthen operational systems and to improve quality and efficiency of service delivery.
• Introducing integrated financial management information systems to improve institutional credit worthiness and fiscal standing.
The Fund acts as a mechanism for facilitating and channelling resources and financing for eligible projects, as well as activities agreed between DFAT and ADB for project preparation, implementation, and capacity development.
1.1 PROGRAMME (AASCTF)

3 Introduction
The occurrence of flooding and landslides, both regular phenomena in Baguio City, threaten Baguio’s sustained and long-term economic development. Baguio City is considered the “summer capital of the Philippines”, attracting 1.8 million tourists in 2018, with an annual growth rate of ca. 16%. In 2009, Baguio was significantly impacted by Typhoons Ondoy and Pepeng, resulting in more than 3,000 people being affected by flooding, and almost 2,500 people being affected by landslides. Japanese researchers from the International Centre for Water Hazard and Risk Management (ICHARM) under the auspices of UNESCO have concluded that the underlying causes behind the 2009 flooding were related to a limited drainage capacity due to obstructions caused by the accumulation of waste, and also by the presence of built-up structures (urban sprawl). In addition, the presence of illegal settlers in flood prone areas worsens Baguio’s exposure and vulnerability towards flood disasters.
By being exposed and having a high vulnerability to climate hazards, combined with the expansion of impervious paved areas within the city and its surroundings, Baguio is experiencing increasing runoff volumes and flood damages. All these impacts are expected to be compounded by climate change, which will very likely cause an increase in the frequency and intensity of rainfall events and further exacerbate flooding events and rain-induced landslides.
The ADB, through the AASCTF, will support Baguio City in implementing the Smart Flood Early Warning, Information and Mitigation System project. The project will assist the city with both the planning for flood mitigation and the delivery of the services of flood early warning and responses, using smart technologies. The project outcome is improved flood early warning system, responses, and mitigation measures of Baguio City. It has four outputs: (i) smart flood early warning information system (FEWS) established and operational; (ii) real-time data capture system established in four river basins in Baguio City; (iii) flood mitigation action plan prepared; and (iv) city twinning programme for smart flood warning and mitigation implemented.
1.2 PROJECT RATIONALE

4Introduction
The FEWS will be developed with Baguio Local Government Unit (LGU) and other key stakeholders to improve community disaster preparedness, raise awareness, and ensure ownership. The FEWS is also set to become an integral element within the overall vision of Baguio City to become a truly resilient, dynamic, and smart city.
Furthermore, under the twinning and networking component of the project a “mentor” city, along with a select number of interested participating cities, will be identified and a subsequent programme of exchange and capacity building activities will be developed and agreed with ADB and the LGU. Synergies will be sought with other partners and events under the AASCTF. The elaboration of the twinning and networking programme is targeted to be achieved in the first quarter of 2021.

5
The overall approach followed in producing this project’s four outputs (outlined in section 1.2) is to breakdown the project into working tasks, with each task containing key activities, and where inter-dependencies between tasks/activities are accounted for by defining milestones and keeping close contact with the project’s working group. The overall project tasks and associated key activities and deliverables are shown in Table 1.
Under the AASCTF programme, overall frameworks to guide critical cross-cutting aspects of Monitoring & Evaluating (M&E) and Gender Equality and Social Inclusion (GESI) are currently being finalised. Subsequent to the finalisation of these two guiding documents, an action plan for Baguio City covering these activities will be developed in consultation and agreement with ADB and Baguio City LGU. The action plan, once finalized, will guide the subsequent activities relating to M&E and GESI to be undertaken throughout the remaining project period. Thus, while the gender/social dimension of the FEWS is not addressed explicitly in this Baseline Assessment report, it is indeed acknowledged to be a crucial component which will be elaborated and addressed in subsequent project activities and outputs.
Introduction
1.3 PROJECT OVERALL APPROACH

6Introduction
Task Key activities and deliverables
Task 1 – Baseline Assessment (this report)
• Setup working group, conduct scope consultations, revise workplan• Data and Information Collection• Establish baseline on climate change data and information• Plan of the on-the-job (OTJ) training component• D1: Baseline Assessment Report (this report)
Task 2 – Hydraulic model setup, including hazard and risk mapping
• Collect additional data, if needed, incl. river surveys• Confirm boundary conditions and target design levels for the hydraulic model and
for inclusion of potential nature-based solutions (NbS) and gray infrastructure• Develop hydrologic model for all 4 rivers• Develop hydraulic model for the primary drainage system, incl. calibration• Hazard and Risk Assessment• OTJ training • D2: Hydraulic Model and Hazard and Risk Mapping Assessment Report
Task 3 – Design of a Flood Early Warning System (FEWS)
• Planning the framework of the FEWS • Procuring and installing measurement devices in selected locations for pilot river• Development of the pilot river real-time data acquisition system • Design the data storage and management system• Overall forecast system framework (database)• Setting up of FEWS at the LGU, and start of real-time online simulations, before the
monsoon• OTJ training• Twinning activities, including digital solutions survey questionnaire dissemination,
initial needs assessment workshop, matchmaking events, detailed action plan for 3-4 twinning events
• D3: Flood Early Warning System report
Task 4 – Data dissemination andoutreach plan
• Design dissemination and outreach activities, including: Website/Dashboard, web applications – SMS alerts, mobile apps, e-mail chimps, etc.
• Define dissemination roles and responsibilities among key stakeholders• Development and dissemination of FEWS O&M plan. Maintenance will be
undertaken during the monsoon period• OTJ training • Twinning and Networking activities – implementation of action plan• D4: Data Dissemination and Outreach Plan
Task 5 – Flood Mitigation Action Plan
• Outline NbS to address flood risks, including: (i) key enabling criteria for implementation; and (ii) conceptual plans
• Conduct hydrodynamic simulations of selected NbS and/ or gray infrastructure• Prepare an NbS action/implementation plan with options for mitigation measures for
future investments, including cost-benefit analysis• OTJ training • Twinning and Networking activities – implementation of action plan• D5: Flood Mitigation Action Plan
Task 6 – Replication of real-time data capture, and Monitoring & Evaluation
• Procuring and installing measurement devices in the remaining three rivers• Evaluation of the FEWS (post-monsoon period)• Finalize data assimilation and forecast modelling• System Performance Assessment• OTJ training • Twinning and Networking activities – implementation of action plan
Task 7 – Project completion
• Wrapping up everything• D6: Final report
Table 1: Project tasks and associated activities and deliverables
Sources:[1] ADB and Egis. 2020. Baguio City Sanitation Improvement Project. Main Report. Manila.[2] ADB and Egis. 2020. Baguio City Sanitation Improvement Project. Volume 3 Sanitation Situation. Manila.[3] ADB and Egis. 2020. Baguio City Sanitation Improvement Project. Volume 6 Institutional Effectiveness and Financing Assessment. Manila.[4] ADB and Egis. 2020. Baguio City Sanitation Improvement Project. Volume 7 Climate Change and Natural Hazard Assessment. Manila.[5] ADB and Egis. 2020. Baguio City Sanitation Improvement Project. Volume 1 Urban Development and Growth. Manila.[6] Woodfields Consultants, Inc. 2017. Consultancy Services for the Development of Groundwater Management Plan (GMP) for Highly Urbanized Water Constraint cities in Baguio City and Surrounding Areas. National Water Resources Board. Baguio.[7] LGU. 2018. Comprehensive Development Plan 2018-2022. Baguio.[8] LGU. 2016. Comprehensive Land Use Plan 2013-2023. Baguio.[9] LGU. n.d. City Disaster Risk Reduction and Management Plan 2020. Baguio.[10] LGU. n.d. Local Climate Change Action Plan (LCCAP). Baguio.

7 Introduction
This project has two main study areas: the FEWS project area (described in detail in section 5) and the Risk Assessment/Action Plan project area, defined by the City of Baguio’s administrative boundaries as shown on Figure 7. These two areas are shown in the figure below. More details about each area are provided in upcoming sections.
Following the scope outlined for this project, a pilot river will be selected to drive the full setup and implementation of a FEWS, which will include real-time testing of the system during the 2021 monsoon season. The FEWS will also cover the other three rivers through incorporation of methods and learnings from the pilot river, but without testing the system in real time in 2021. The reason for this is time and budget constraints, as real-time testing of all four rivers contained in the project area would require significant amount of extra data collection and processing (e.g. more detailed surveys) and a level of detail in the setup and operation of hydrodynamic modelling not feasible to achieve under the current timeline and budget constraints. Focus on the remaining three rivers will instead be on establishing data assimilation processes and replicating the FEWS framework (as tested for the pilot river), so that it’s ready to be used/tested during the 2022 monsoon season.
Delineation of the project area for the Risk Assessment/Action Plan is contained within the city boundaries of Baguio, as described in the scope for this project.
1.4 PROJECT STUDY AREA

8Introduction
Figure 2: Delineation of project study areas, comprising the FEWS project area (466 km2) and the Risk Assessment / Action Plan project area (58 km2)

9
This Baseline Assessment report is the first report out of six reports to be produced in this project. The intended audience covers all key stakeholders forming the project working group. This report aims at answering the following questions:
• What is the current situation in Baguio with regard to the main project components, i.e. climate change assessment, hazard mapping, FEWS, etc.?
• Which data and information are available to support the implementation of the project tasks and activities as outlined in Table 1? And, is the quality of that data sufficient to support this project?
• What are the data and information gaps that could impact the overall project results, and which actions can or will be taken to fill those gaps?
Section 1 in this report introduces the AASCTF programme, describes this project’s rationale and overall approach, as well as the description of the study area. Section 2 describes the key project initiation tasks since project kick-off, including the latest Baseline Assessment Workshop and a description of twinning and networking activities. Section 3 deals with the data and information collection process, including a review of key local reports and plans. Section 4 describes the climate change baseline assessment and associated main gaps. Section 5 introduces the FEWS framework, the on-the-job training component and the main gaps associated to the FEWS. Section 6 describes the hazard and risk mapping framework and information and the main gaps identified. Section 7 introduces Ramboll’s four-step process for cost-benefit analyses, as well as the approach for undertaking the flood mitigation action plan. And section 8 outlines the main conclusions of this report, anchored through a gap analysis.
Introduction
1.5 REPORT STRUCTURE

Source: Gian Paul Guinto, unsplash

11 Project initiation
Figure 3: Baguio City HallSource: Melvin Solomon
2. PROJECT INITIATION

12Project initiation
The consultant’s team mobilized mid-August 2020; holding a preliminary kick-off meeting on 9 September 2020 and the official project kick-off meeting with all key stakeholders on 30 September 2020. The local team includes a project administrator based in Baguio (the rest of the local experts are based in Manila), who helps in keeping close contact with the LGU and other local stakeholders.
The project working group is composed of the key stakeholders that attended the kick-off meeting and have continued being active in the project. A list of all stakeholders as well as the minutes of the kick-off meeting can be found in Appendix A.
2.2 PROJECT KICK-OFF
A kick-off meeting with key stakeholders was held on 30 September 2020 at Baguio City Hall, hosted byMayor Benjamin Magalong and virtually attended by several organizations. The details of this meeting are given in Appendix A.1. The overall project objectives; expected outputs and project’s approach were presented and discussed in the meeting, as well as the overall workplan and high-priority activities for the project initiation phase.
2.3 BLISTT
The BLISTT is the metropolitan area which includes Baguio City and the adjoining municipalities of La Trinidad, Itogon, Sablan, Tuba, and Tublay of the Province of Benguet. Together, these municipalities form the BLISTT Governing Council. Upon the initiative of Mayor Benjamin Magalong of Baguio City, a meeting with the BLISTT Governing Council was held on 1 October 2020. The meeting served the purpose of presenting and discussing the overall project objectives and expected outputs, specifically the details of the FEWS. For more details about this meeting, please refer to Appendix A.
2.1 MOBILISATION AND PROJECT WORKING GROUP

13
A Baseline Assessment Workshop took place on 16 December 2020 at Baguio City Hall with the project’s working group. A total of 21 people (excluding the Consultant’s team) participated in the workshop, which purpose was to: i) create a common understanding of this project’s scope, objectives and main tasks; ii) obtain feedback from participants on the key highlights from the Baseline Assessment Report; iii) discuss the main gaps identified, and to commonly identify ways to deal with them; and iv) align expectations as to the upcoming tasks and activities.
The workshop included several participatory questions with the aim of engaging participants in the topics presented, motivating them to actively participate in the discussions. Several maps were presented (see section 3), as well as key findings from e.g. the climate change baseline as well as the FEWS framework and the risk mapping methodology, among others. A summary of the key gaps was likewise introduced and discussed. The proceedings of the workshop will be documented in a minutes of meeting, which will be circulated among all workshop attendees.
Figure 4 shows participants at CDRRMO Multi-purpose Hall during the workshop.
Project initiation
2.4 BASELINE ASSESSMENT WORKSHOP

14
Figure 4: Picture taken during the Baseline Assessment Workshop
Project initiation

15 Project initiation
Twinning and networking arrangements between Baguio City and relevant sister cities across ASEAN and Australian cities will be developed in close collaboration with the project team and city officials during the first quarter of 2021.
Initial activities have focused on developing a generic twinning needs and digital solutions assessment workshop and questionnaire format for all AASCTF cities. An initial needs assessment at city level was initially foreseen for Q4 2020, but was postponed until Q1 2021, as the AASCTF introduction videos and the digital solutions survey questionnaires were still being revised.
Following the digital solutions survey questionnaire finalisation and dissemination in January 2021, an initial needs assessment workshop is foreseen in February 2021, where Baguio city representatives will identify specific challenges and needs.
Following this workshop, matchmaking events with one or more mentor cities will elaborate on lessons learned and develop ideas for specific twinning arrangements. Subsequently, a detailed action plan for 3-4 twinning events, possibly including physical visits in a post-Covid-19 era, will be developed. In the 2nd and 3rd quarter of 2021 twinning events will be implemented, either on-line or physical. To the extent possible these events will also be open to other interested/participating AASCTF bronze cities as part of the networking arrangements foreseen under the programme.
2.5 TWINNING AND NETWORKING

16Project initiation
Figure 5: Twinning and Networking arrangements

17
Mentor cities in Australia and ASEAN countries with longer-term experience within design and implementation of a Flood Early Warning Systems (FEWS), Hydraulic modelling, Hazard and Risk mapping, Data dissemination and outreach planning and Flood Mitigation Action Planning will be sought.
To enable other AASCTF cities to gain from the activities and lessons learned in the Baguio project, a series of networking events, primarily webinars and on-line training, will be offered to other AASCTF cities with inputs from Baguio city and mentor cities.
Specific curricula will be developed focusing on technical issues relating to table 1, as well as on cross-cutting issue relating to e.g. Gender Equality and Social Inclusion and Climate Change, both high on the agenda in a Baguio city context.
Videos on the lessons learned from Baguio city will also be developed and used in the networking activities.
Project initiation

Source: Asian Development Bank

19 Collection and Review of Data and Information
Figure 6: Data collection and reviewSource: Scott Graham, unsplash
3. COLLECTION AND REVIEW OF DATA AND INFORMATION

20Collection and Review of Data and Information
A number of different local reports, studies and datasets have been collected and reviewed with the purpose of gaining a deep understanding of the local knowledge, constraints and possibilities in key specific areas related to the purposes of this project. This process has followed a tailored methodology(briefly explained below), focusing on the collection and assessment of technical and non-technical dataand information. A summary of all data and information gaps can be found in Appendix D. It should bementioned that the data collection process is not finished yet and will continue as a high-priority task onTask 2 (Hydraulic Modelling, Hazard and Risk Mapping).
3.1 METHODOLOGY FOR DATA COLLECTION AND REVIEW
This project applies a data management strategy that enables stakeholders/project members to work in acohesive and streamlined way. While the majority of the data collected is or needs to be GIS-data, i.e. datawith a spatial (and sometimes temporal) dimension, some other non-spatial data has also been collected.For this reason, the process has from the outset followed an iterative and still on-going approach wherebyidentification of knowledge/information gaps can be done through a technique called Front Loading. Thisinvolves:
1. Identifying the data/information needed to reach the project objectives;2. Collecting the data/information from official sources and categorizing it through primary and
secondary filters. For this, a data and information registry has been created and is continuously been updated as more data is collected;
3. Assessing the data by corresponding technical international and national experts;4. Creating a GIS inventory for all GIS-data, which is effectively a spatial database supporting production
of maps. More details are given in section 3.2.;5. Identifying data and information gaps; and6. Defining the actions to fill the gap
The data and information registry allows proper data tracing and is updated regularly as the knowledgebase of this project is expanded and fine-tuned with time. By the end of this project, this registry will bean important tool for the LGU, as it will not only directly be linked to the FEWS, but also to many otherdisciplines and important planning mechanisms within the periphery of all works to be implemented in thisproject.

21 Collection and Review of Data and Information
The bulk of data collected so far comes from the following sources:
• PHL: Baguio City Sanitation Improvement Project, Egis-ADB 2020• Local Government Unit (LGU) of Baguio• Websites: ADB Spade, LiPAD (hazard data)• DOST – ASTI Philsensors (Water Level and Rainfall)• PAGASA – Baguio Synoptic Station and RIDF Curve• NAMRIA – IFSAR DEM and other Datasets• PSA – Baguio City Population and Distribution Statistics• DPWH – Roads, Bridges, and Rivers• NEDA – CAR Regional Development Plans
A GIS inventory (see Appendix B) has been created to support the ongoing and upcoming tasks. The inventory contains information on types of data (shape/raster, or any other format), as well as key descriptions and source information (and metadata, if relevant). The inventory also applies a naming convention for all the data and maps produced in this report (and in the upcoming reports), so that local stakeholders can always trace back the maps and corresponding data upon completion of the project. The GIS inventory will be passed onto the LGU at completion of project.
3.3 REVIEW OF LOCAL REPORTS AND PLANS
Several reports have been reviewed with the purpose to properly understand the knowledge baseline in Baguio. Each report or plan was reviewed in terms of the type of information and the contextual support it could provide for the purposes of this project. This includes an assessment of GIS information and datasets; socio-economics; hydrology & hydraulics; hazard and risk assessments; climate change; and disaster risk reduction (DRR). Table 2 shows the relevant contents found in the reports reviewed. More details can be found in Appendix F.
3.2 GIS INVENTORY

22Collection and Review of Data and Information
ReportsPHL: Baguio City Sanitation Improvement Project Reports.Egis-ADB 2020
NWRBBag CDP
Bag CLUP
LDRRMP LCCAP
Main[1]
V3
[2]
V6
[3]
V7
[4]
V1
[5]
WCI GW 2017[6]
2018- 2022[7]
2013-2023[8]
2020
[9]
2020-2030
[10]
GIS dataStudy Area X X X X X
Land Use X X X X X
Demography X X X X X X
Flood Hazards X X X X
Geology X X X X
Landslides X X X X X
Socio-economy
Development Plans
X X X X
Employment X X
Health X X X
Education X X X
Poverty X X
Gender X X
Hydrology
Meteorology X X X
Climate X X X X
Soil X X X
HydraulicsRiver SectionsDischarges X
Water LevelsFlood Infrastructure
X X
City planHazards X X X
Climate Change X X
Disaster Risks X X X
Table 2: Schematic summary of key local reports and plans reviewed in this report
Collection and Review of Data and Information
Sources:[1] ADB and Egis. 2020. Baguio City Sanitation Improvement Project. Main Report. Manila.[2] ADB and Egis. 2020. Baguio City Sanitation Improvement Project. Volume 3 Sanitation Situation. Manila.[3] ADB and Egis. 2020. Baguio City Sanitation Improvement Project. Volume 6 Institutional Effectiveness and Financing Assessment. Manila.[4] ADB and Egis. 2020. Baguio City Sanitation Improvement Project. Volume 7 Climate Change and Natural Hazard Assessment. Manila.[5] ADB and Egis. 2020. Baguio City Sanitation Improvement Project. Volume 1 Urban Development and Growth. Manila.[6] NWRB: Woodfields Consultants, Inc. 2017. Consultancy Services for the Development of Groundwater Management Plan (GMP) for Highly Urbanized Water Constraint cities in Baguio City and Surrounding Areas. National Water Resources Board. Baguio.[7] Bag CDP: LGU. 2018. Comprehensive Development Plan 2018-2022. Baguio.[8] Bag CLUP: LGU. 2016. Comprehensive Land Use Plan 2013-2023. Baguio.[9] LDRRMP: LGU. n.d. City Disaster Risk Reduction and Management Plan 2020. Baguio.[10] LCCAP: LGU. n.d Local Climate Change Action Plan (LCCAP). Baguio.

23 Collection and Review of Data and Information
The following sub-sections provide an overview of the local settings for the city with a view to inform the design of the FEWS and the preparation of the Flood Mitigation Action Plan, where NbS options will be assessed.
3.4.1 LOCATION
The location of Baguio and the main administrative boundaries (from local to regional) can be seen in Figure 7. Baguio City is located in the middle of the BLISTT, which is likewise part of a bigger regional administrative area within The Philippines.
3.4 LOCAL SETTINGS

24Collection and Review of Data and Information
Figure 7: Location maps showing different administrative areas; from local to regional boundaries

25 Collection and Review of Data and Information
Several investigations, meetings and iterations have taken place to obtain the most accurate representation of the topography in Baguio, through preparation of a combined Digital Elevation Model (DEM), see Figure 8. Details about this process can be found in Appendix D.1.
As seen from the figure below, the city of Baguio is mostly mountainous with some valleys and plateaus. The elevation within the Baguio administrative boundary ranges between 850m to 2930m, with 4 rivers originating here. The Balili river drains populated parts of the city and flows northwards. Similarly, the Bued and Galiano rivers drain the city and flow southwards and westward. The Ambalanga river drains less populated regions and flows eastward out of the city boundaries. Due to the steep slopes most of the city should not remain inundated for long periods during and post the storm events. However, some of the low-lying areas may face flooding which will be assessed during this project. The steep slopes also increase the vulnerability to landslides and flash floods which will be considered.
3.4.2 TOPOGRAPHY

26Collection and Review of Data and Information
Figure 8: Topographic Map of Baguio CitySource: Figure based on data from NAMRIA. 2013. IFSAR dataset.

27 Collection and Review of Data and Information
Existing land uses for Baguio based on the city’s CLUP1 (Comprehensive Land Use Plan 2013-2023) are depicted in Figure 9. Residential Zones have the largest existing land use share at 56%. Commercial and Institutional Zones comprise 6% and 4% of the existing land use, respectively, whereas parks and recreation zones account for 1% of the land use. However, some data conflicts in the CLUP have been identified, specifically related to the Planned Unit Development Zone: the “Planned Unit Development Zone” and the “Camp John Hay - Planned Unit Development Zone (Special Tourism Economic Zone).
Due to this inconsistency, it has not been possible to fully understand the characteristics of the Camp John Hay in the CLUP. Information and data collected from Egis showed also the same inconsistencies. These inconsistencies are reported in the Gap Analysis and will be dealt with accordingly in Task 2 of this project. The map below will therefore need to be revised once these doubts have been addressed.
Baguio City’s future land use as proposed in its CLUP is depicted in Figure 10. The proposed land use shows a decrease in the total area under each of the three categories of Residential Zones. This is consistent with the recent trend which has seen the gradual conversion of residential areas to commercial areas. Low- and medium-density Commercial Zones, which include retail and services, will be expanded whereas the high-density Commercial Zone, which comprises commercial activities within the Baguio City Country Club, will see a contraction.
The total area dedicated to Institutional Zones will also be increased. Since most of the existing facilities are found in the Central Business District, with very limited capacity for expansion, the city is already considering alternative sites for future developments.
The area under Planned Unit Development Zone use will remain unchanged although the city will be particularly encouraging environmental-friendly and low volume/high value production activities. The areas under Watershed and Protected Forest Zone use will also remain unchanged, however the area under Vacant Forested Zone use will be reduced and replaced with multiple land use zones.
The main changes in land use will be between residential area and commercial area, where land use for commercial purpose will increase and residential areas will decrease. The maximum increase of land use will be on the multiple land use zone by approximately 140 hectares whereas the maximum decrease will be in the high density residential by approximately 100 hectares.
1 LGU. 2016. Comprehensive Land Use Plan 2013-2023. Baguio.
3.4.3 LAND USE

28
Figure 9: Existing land useSource: Figure based on the LGUs. 2016. Comprehensive Land Use Plan 2013-2023. Baguio.
Figure 10: Future land useSource: Figure based on the LGUs. 2016. Comprehensive Land Use Plan 2013-2023. Baguio.
Collection and Review of Data and Information

29 Collection and Review of Data and Information
Data of infrastructure is particularly important in the risk assessment, the development of the FEWS and the flood mitigation action plan. Critical infrastructure covers hospitals and other health units, evacuation centres and utilities zones. Baguio City has six hospitals that cater to the tertiary health care needs of the community as well as other neighbouring provinces, two of which are government owned. The remaining four are private hospitals. Other health units include medical centres and smaller clinics.
Utilities include water utilities, such as water treatment plants, water distribution facilities and pumping stations, and electrical utilities such as power stations and electricity distribution centres. Transportation network covers roads, bus lines and bus stations.
It has not been possible to collect data on pumping stations; water supply reservoirs; power distribution centres; and hydroelectric power plants. Actions will be taken in Task 2 to get the most updated and detailed information.
3.4.5 SOCIAL INFRASTRUCTURE
Social infrastructure covers law enforcement establishments, businesses, cultural sites, the airport, and teaching institutions. Available data for social infrastructure can be seen in Figure 12 excluding educational institutes.
3.4.4 CRITICAL INFRASTRUCTURE

30Collection and Review of Data and Information
Figure 12: Social infrastructure include businesses, cultural sites, and the airportSource: Figure based on OpenStreetMap. 2020. https://www.openstreetmap.org/ and LGU, Department of the Interior and Local Government. 2020. Climate and Disaster Risk Assessment (CDRA) workshop dataset, NAMRIA. 2013. IFSAR dataset.
Figure 11: Critical infrastructure include utilities, health units and evacuation centresSource: Figure based on OpenStreetMap. 2020. https://www.openstreetmap.org/ and LGU, Department of the Interior and Local Govern-ment. 2020. Climate and Disaster Risk Assessment (CDRA) workshop dataset.

31 Collection and Review of Data and Information
The data representing businesses only includes restaurants and stadiums. Ramboll will in Task 2 look into finding more data. Educational institutes are shown in Figure 13, but conflicting data sources point to the need of looking at this deeper in Task 2. Tertiary level educational institutes include colleges and universities. In 2018, there were a total of 540 educational facilities in Baguio encompassing pre-school to tertiary education, largely privately owned. The University of the Philippines, which is the leading institution of higher learning in the Philippines, has an autonomous campus in the city which also houses the Philippine Military Academy.
3.4.6 TRANSPORTATION NETWORK
The Department of Public Works and Highways (DPWH) typically classify roads into national roads (primary, secondary, and tertiary), city roads, and barangay roads. The former is maintained by the DPWH, whilst the two latter are maintained by the LGU. Figure 14 shows the existing road network data downloaded from DPWH and OSM. The hazard and risk mapping to be undertaken in Task 2 will use data from DPWH and supplement the data set with data from OSM. Classifications of primary, secondary, and tertiary will remain.

32
Figure 8: Educational institutes, including elementary, secondary and tertiary level institutesSource: Figure based on the LGUs. 2016. Comprehensive Land Use Plan 2013-2023. Baguio, Department of Education. 2020. https://deped.carto.com/.
Figure 14: Existing road networkSource: Figure based on DPWH. n.d. Road data. Baguio, OpenStreetMap. 2020. https://www.openstreetmap.org/.
Collection and Review of Data and Information
Figure 13: Educational institutes, including elementary, secondary and tertiary level institutesSource: Figure based on the LGUs. 2016. Comprehensive Land Use Plan 2013-2023. Baguio, Department of Education. 2020. https://deped.carto.com/.

33 Collection and Review of Data and Information
No other classes of roads (e.g. service, residential, bike paths, etc.) will be considered in the hazard and risk mapping, as those roads are not deemed critical or disastrous if impacted. In later deliverables such as the development of a flood mitigation plan for selected areas, a more detailed road network including residential roads and paths may be necessary and will be downloaded from OSM. Facilities related to public transportation have currently not been located. This will be looked at in Task 2.
3.4.7 POVERTY AND INFORMAL SETTLEMENTS
It has not been possible to collect spatially distributed poverty data, but Appendix E contains key information from the 2018 official Poverty Statistics released by the Philippine Statistics Authority (PSA) (the latest data available). Regarding informal settlements, this project aims at looking at wider wealth distribution and living standards spatially, as this will enable targeting businesses/livelihoods and poverty reduction in the selection of the NbS areas (Task 5 in the project), or at least understand the relationship between NbS and poverty alleviation. Better baseline information on extreme poverty will be necessary later in the project, e.g. low income but not poor, lower middle-income household. GIS-data on distribution of income in the city will also be needed.
The majority of the informal settlers are situated in the areas of Philippine Military Academy (PMA) Fort Del Pilar Naval Reservation, Camp John Hay Reservation, Forbes Park Parcel III, and Philippine Economic Zone Authority (PEZA) Baguio. This is shown in Figure 15.

34Collection and Review of Data and Information
Figure 15: Location of informal settlement in Baguio citySource: Figure based on the LGUs. 2016. Comprehensive Land Use Plan 2013-2023. Baguio, NAMRIA. 2013. IFSAR dataset.

35 Collection and Review of Data and Information
3.4.8 POPULATION, DEMOGRAPHICS AND MIGRATION
Baguio City has a diverse population comprising the native population of Ilocanos and Igorots along with other native groups like Pangasinenses, Tagalogs, and Kapampangans from across the country as well as foreign nationals. Ilocano is the most common dialect, spoken by 50% of households, whereas all the households are relatively conversant in English.
The 2015 population census of Baguio recorded a population of 345,366. This represents a 1.54% growth relative to 2010 and is a slightly higher growth rate than that of the Cordillera Administrative Region (CAR, at 1.21%) although lower than that of the Benguet province (1.91%) and the Philippines average (1.72%). Historically, Baguio’s annual average population growth rate accelerated from 1975 until 1990, then slowly decelerated between 1990 and 2015.
The map below shows the population densities per barangay, the most populated being Irisan with 30,507 (9%) of the total population.
3.4.9 FLOOD PRONE AREAS
Data depicting flood prone areas and flood exposure have been collected from Egis and from the CDRA workshop2, respectively. These two datasets show divergent information. From the LiPAD website3 flood hazard maps are available for 5-, 25- and 100-year return periods. The assessment is that these maps, despite only covering 50% of Baguio city, offer a more accurate representation of flooding in Baguio. An example for a 5-year flooding is given below. The remaining maps can be seen in Appendix D.11.
As part of the activities planned in this project, new hazard maps will be produced following the setup and calibration of hydrological and hydraulic models for the main river systems in Baguio. This is further explained in section 5.
2 Department of the Interior and Local Government. 2020. Climate and Disaster Risk Assessment (CDRA) workshop dataset.
3 National Engineering Center. 2020. LiDAR Portal for Archiving and Distribution. https://lipad.dream.upd.edu.ph/.

36Collection and Review of Data and Information
Figure 17: 5-year Flood Hazard MapSource: Figure based on DOST-UP DREAM and Phil-LiDAR Program. 2020. https://lipad.dream.upd.edu.ph/.
Figure 16: Population Density in BaguioSource: Figure based on Philippine Statistical Authority. 2015. POPCEN 2015. Census of Population.

37 Collection and Review of Data and Information
Sinkholes are formed when water erodes the underlying rock layer stabilizing the topsoil. There are 4 barangays in Baguio City where sinkholes have been observed for the past decades4, see Figure 18. Sinkholes can have both manmade causes, like leaking water pipes or other construction flaws, and natural causes, like quakes.
Two datasets on sinkholes have been collected from Egis and from the CDRA Workshop. A distinct discrepancy is observed between these datasets (Figure 18). The current assessment is that the CDRA data is more updated and of better quality. However, as sinkholes are not part of the scope in this project, no further actions will be taken in the upcoming project tasks.
3.4.11 LANDSLIDES
Almost 80% of Baguio City area is susceptible to landslides which occur during heavy rainfall events or in connection with earthquakes. Human activities like deforestation and non-adequate constructions in already unstable terrain, increase susceptibility. The map below illustrates Baguio’s landslide susceptibility. The susceptibility rating for landslide was mainly based on terrain slope and underlying strength of materials of the rocks. It also accounted presence of tension cracks and escarpments, previous landslide records, and soil creep for possible landslide indications.
The landslide susceptibility used is defined accordingly5:
• Very High: Areas usually with steep to very steep slopes and underlain by weak materials.• Recent landslides, escarpments, and tension cracks are present.• High: Areas with steep to very steep slopes with numerous old and inactive landslides.• Moderate: Areas with moderate slope but with soil creep and indicative possible landslide
occurrence.• Low: Areas with gentle slopes
4 ADB and Egis. 2020. Baguio City Sanitation Improvement Project. Volume 7 Climate Change and Natural Hazard Assessment. Manila.
5 Department of Environment and Natural Resources, Mines and Geosciences Bureau. 2015. Detailed landslide and flood susceptibility map of Benguet province,
Philippines. Quezon City.
3.4.10 SINKHOLES

38
More insights are needed in order to properly shape the landslide assessment in Task 2. In this regard, the historical data from the CDRA workshop is important, but more work needs to be done in Task 2 to better understand the mechanisms of landslides in Baguio. Ramboll will look at this in more detail right at the start of Task 2.
3.4.12 HYDROLOGY
Data for four water level stations La Trinidad, Camp 6 Bridge, City Camp Lagoon and Asin bridge has been received. A preliminary analysis indicates that the data period covered is between 2013 to 2020. An in-depth analysis of the data will be carried out in Task 2.
The location of the stations and the basins delineated with respect to these locations is indicated later in this report in 5.2.
Collection and Review of Data and Information

39 Collection and Review of Data and Information
Figure 18: Location of Sinkhole in Baguio CitySource: Figure based on LGU. Department of the Interior and Local Government. 2020. Climate and Disaster Risk Assessment (CDRA) workshop dataset, NAMRIA. 2013. IFSAR dataset.
Figure 19: Landslide Susceptibility ZoneSource: Figure based on the LGUs. 2016. Comprehensive Land Use Plan 2013-2023.

Source: Kharl Anthony Paica, unsplash

41 Climate Change Baseline
Figure 20: Benguet pine treesSource: Carmela Asistio, unsplash
4. CLIMATE CHANGE BASELINE

42Climate Change Baseline
To provide recommendations on climate change adaptation measures it is important to understand both the present climate in the city of Baguio and the main climate hazards that the city is facing today. The overall assessment of climate change is initiated by an evaluation of current indications of a changing climate. This evaluation focuses on precipitation and temperature using available long-term records and is followed by a description of the projected future changed.
In the development of a flood mitigation action plan this project will outline different climate change adaptation measures, and illustrate their effect using hydraulic simulations. These types of simulations require a high-resolution rainfall input generated from observed rainfall statistics. The uncertainty of the future climate and/or large natural variability will be accounted for in the conceptual design by including safety factors. The method for generating synthetic design storm is outlined in Appendix C, together with suggested steps for determining appropriate safety factors.
A wide number of different sources have been revised to properly assess the climate change baseline in Baguio. Appendix C contains an exhaustive list of sources. The locations of the DOST-ASTI rain gauge stations are shown in Figure 21 together with the PAGASA weather station 328.
4.1 METHODOLOGY FOR CLIMATE CHANGE ASSESSMENT

43
The Philippines has a humid equatorial climate, along the west coasts of the Islands, clearly characterized by two seasons; the dry season from November to April and the rainy season from May to October where the south-west monsoon brings heavy rainfall often accompanied by tropical cyclones. There are about 20 storms affecting the Philippines each year and Baguio City has a high incidence rate of tropical cyclone occurrence. Annual precipitation depth varies greatly across the country.
The city of Baguio is in the Cordillera Central mountain range of Luzon and is the highest city in the Philippines. The average temperature in Baguio is 19.6°C, which is much lower than the national average (26.6°C), and the average annual rainfall is 3,841 mm which is well above the country average (2,350 mm). Average monthly climate statistics for Baguio are shown in Figure 22 and Figure 23. The minimum and maximum temperatures recorded in Baguio are 6.3°C (registered in January 1961)6 and 30.0°C (registered in April 1991)7, respectively. The maximum daily rainfall on record is 1,086 mm (registered in July 2001).
Climate Change Baseline
6 Minimum temperature in Baguio, baguio.gov.ph, [Online]. Available: https://www.baguio.gov.ph/content/baguio-records-4th-lowest-temperature-72-degrees-cel
sius. [Accessed 21.1.2021].
7 Maximum temperature in Baguio, sunstar.com.ph, [Online]. Available: https://www.sunstar.com.ph/article/136103 [Accessed 21.1.2021].
4.2 HISTORICAL AND PRESENT CLIMATE CONDITIONS

44Climate Change Baseline
Figure 21: Locations of Meteorological StationsNote: DOST ASTI stations (blue), measurement from 2010 or later, resolution 15 min. PAGASA station (green), measurement from 1949, resolution 1 hour.

45 Climate Change Baseline
Figure 23: Average monthly rainfall and temperature in Baguio City (1981-2010)Source: Climatological Normal Values, data.gov.ph, [Online]. Available: https://data.gov.ph/?q=dataset/climatological-normal-values . [Accessed 4.12.2020].
Figure 22: Average monthly relative humidity and number of rainy days in Baguio City (1981-2010)Source: Climatological Normal Values, data.gov.ph, [Online]. Available: https://data.gov.ph/?q=dataset/climatological-normal-values . [Accessed 4.12.2020].

46Climate Change Baseline
The figure below synthetizes the information collected pertaining the main climate hazards in Baguio. For more detailed descriptions, please refer to Appendix C.
Figure 24: Summary of climate hazards that impact Baguio City
• Local reports• Meterological data
DATA DRIVER ANDFREQUENCY EXPOSURE IMPACT TRENDS
• Hazard maps• Local reports
• Human design flaws and accidents • Quakes • Rainfall
Frequency: • Rainy season
• Properties• Infrastructure• People
• Mortalities• Injuries• Local disruption of critical infrastructure• Local damage to infrastructure
• Observed last decade• Link to rainfall uncertain
• Hazards map from hazard hunter• LiPAD• Egis vol. 7 report• Meterological data
• Short duration • Rainfall extremes • High suscreptibility locally Baguio city center
Frequency: • Rainy season, flooding more than 5 year on average
• Local disruption of infrastructure• Damage to properties• Injuries• Sickness
• Hazards maps from hazard hunter• LiPAD• Meteorologial data
• Properties• Critical Infrastructure• People• Agriculture
• Mortalities• Injuries• Disruption of critical infrastructure• Damage to properties and agricultural areas
• Observed last decade• Climate driver affected by ENSO and climate change • Trend uncertain, must be explored
• Human activities concurrent with droughts Frequency: • December-February • Dry season
• Properties• People• Agriculture
• Mortalities• Injuries• Damage to properties and agricultural areas
• Observed in 2020• Climate driver affected by ENSO and climate change
• Hazard maps from hazard hunter• Egis vol. 7 report• Meteorologial data
• Properties• Critical Infrastructure• People
• Mortalities• Injuries• Disruption of critical infrastructure• Damage to properties
• Several landslides 2006-2015• Climate driver affected by ENSO and climate change • Trend is uncertain and must be explored
• Long duration • Rainfall extremes • High suscreptibility along the rivers Frequency: • Rainy season, flooding more than 5 year on average, severity increase with return period
• Earthquakes, rainfall• Suscreptibility depends on driver
Frequency: • Rainy season (earthquakes all year)
• Observed last decade• Climate driver affected by ENSO and climate change• Trend uncertain, must be explored
• Properties• Infrastructure• People
WILDFIRES
SINK HOLES
PLUVIALFLOODING
FLUVIALFLOODING
LANDSLIDES
4.3 MAIN CLIMATE HAZARDS

47 Climate Change Baseline
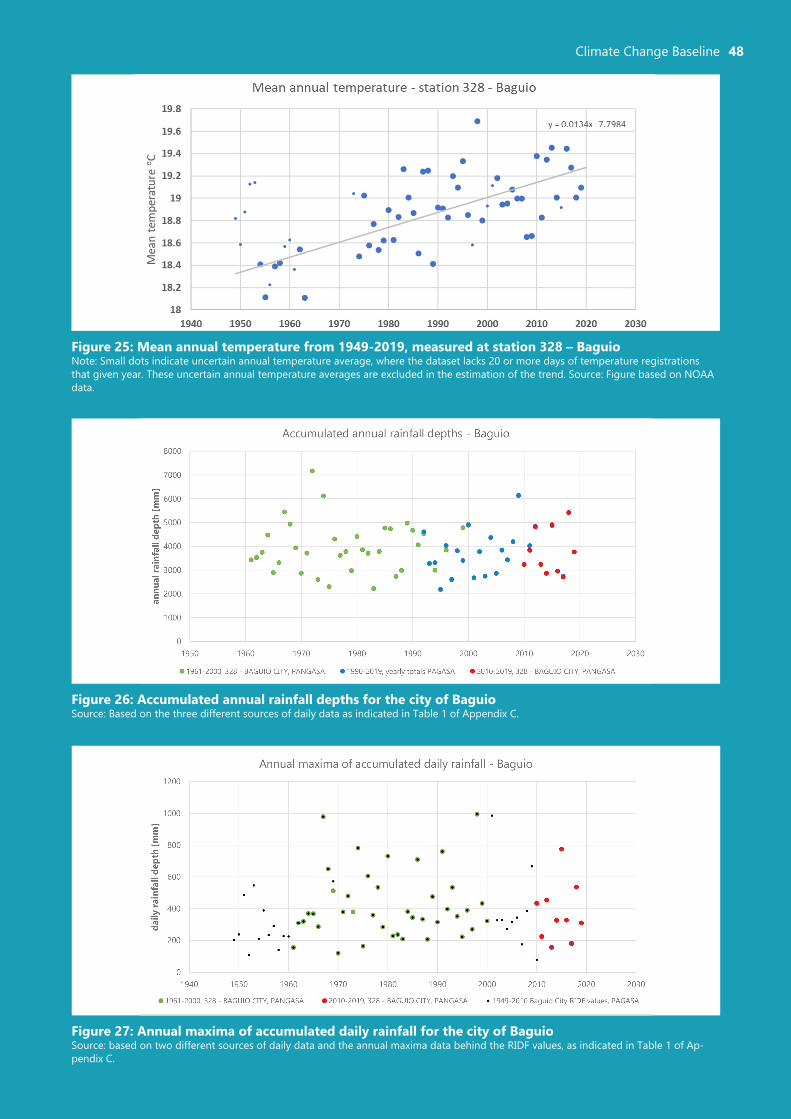
Daily rainfall depths and temperature have been registered at the meteorological station 328 in Baguio since 1949, but sporadic data gaps in the recorded data. The temperature record has no data between 1956 and 1963, both years included. The dataset shows an increasing trend (see Figure 25) of approximately 0.1 °C/decade, similar to the observed temperature increase nationally8. Nationally, PAGASA also reports an increase in the annual minimum and annual maximum temperature9. However, this tendency cannot be confirmed by the local temperature measurement in Baguio city, most likely due to the mountainous climate, that differentiates Baguio from the rest of the country.
Analysis of the daily rainfall depths at the metrological station 328 in Baguio focuses on the accumulated annual rainfall depths (Figure 26) and the annual maxima of accumulated daily rainfall (Figure 27). The data is patched together by several different sources, affecting the interpretation. A clear increase is not evident in any of the figures. This will be further looked at in more detail in Task 2.
8,9 PAGASA. 2018. Observed and Projected Climate Change in the Philippines. Quezon City.
4.4 TREND ANALYSIS
48Climate Change Baseline
Figure 25: Mean annual temperature from 1949-2019, measured at station 328 – BaguioNote: Small dots indicate uncertain annual temperature average, where the dataset lacks 20 or more days of temperature registrations that given year. These uncertain annual temperature averages are excluded in the estimation of the trend. Source: Figure based on NOAA data.
Figure 26: Accumulated annual rainfall depths for the city of BaguioSource: Based on the three different sources of daily data as indicated in Table 1 of Appendix C.
Figure 27: Annual maxima of accumulated daily rainfall for the city of BaguioSource: based on two different sources of daily data and the annual maxima data behind the RIDF values, as indicated in Table 1 of Ap-pendix C.

49 Climate Change Baseline
PAGASA has made available the Climate Information Risk Analysis Matrix (CLIRAM) tool10. This tool summarizes all available climate model simulations for the Philippines forced by the Representative Concentration Pathways (RCPs), in particular changes in average seasonal temperatures and average seasonal rainfall. The results are given as a range with a lower and upper bound, to better communicate the uncertainty on the climate change projections and thereby ensure robust and transparent adaptation strategies. The results are available for all regions and provinces in the Philippines. From a climate perspective, it seems sensible to assume that the average climate change of Benguet adequately represents the climate change in the city of Baguio. The present-day climate of Baguio is better described by local observations, and the observed seasonal averages for the province of Benguet given in Table 3 and Table 4 deviates from Figure 22 and Figure 23.
Projected seasonal change in mean temperature for 2036-2065 compared to baseline 1971-2000 shows a robust increase for all seasons, in the range of 1.1-2.4 °C, across all models and both RCP scenarios, see Table 3.
The projected seasonal change in rainfall depth (mm) for 2036-2065 compared to baseline period 1971-2000 shows high divergence between the climate model simulations. In the rainfall season (here June-November) the projected change in seasonal mean rainfall lies in the range -25% to +26%, see Table 4. Based on the literature studied so far it is expected that the year-to-year variability on the average seasonal rainfall lies in the same range, but this is to be verified.
PAGASA has further assessed that the climate change will likely decrease the frequency of tropical cyclones in the Western North Pacific but increase their intensity11.
10 PAGASA. 2018. Observed and Projected Climate Change in the Philippines. Quezon City.
11 PAGASA. 2018. Observed and Projected Climate Change in the Philippines. Quezon City.
4.5 CLIMATE SCENARIOS

50Climate Change Baseline
Table 4: The projected seasonal change in rainfall depth (mm) as an average over 2036-2065 compared to baseline period 1971-2000 in CLIRAM for the province of Benguet
Table 3: Projected seasonal change in mean temperature (°C) as an average over 2036-2065 compared to baseline 1971-2000 in CLIRAM for the province of Benguet
Reg
ion
Pro
vin
ce
Observed (1971-2000) Projected (2036-2065)
DJF
MA
M
JJA
SON
Scen
ario
Ran
ge
DJF(Dec-Jan-Feb)
MAM(Mar-Apr-May)
MAM(Mar-Apr-May)
SON(Sep-Oct-Nov)
Cha
nge
(%)
Proj
ecte
dva
lue
Cha
nge
(%)
Proj
ecte
dva
lue
Cha
nge
(%)
Proj
ecte
dva
lue
Cha
nge
(%)
Proj
ecte
dva
lue
CA
R
Ben
gu
et
19.4
21.9
22.0
21.2
Mod
erat
e Em
issi
on
(RC
P4.5
)
Lower Bound
1.1 20.5 1.1 23.0 1.1 23.1 1.1 22.3
Median 1.3 20.7 1.3 23.2 1.4 23.4 1.3 22.5
Upper Bound
1.8 21.2 1.9 23.8 1.9 23.9 1.9 23.1
Hig
h Em
issi
on
(RC
P8.5
)
Lower Bound
1.3 20.7 1.5 23.4 1.4 23.4 1.4 22.6
Median 1.8 21.2 1.8 23.7 1.7 23.7 1.7 22.9
Upper Bound
2.1 21.5 2.4 24.3 2.5 24.5 2.3 23.5
Source: PAGASA. 2018. Observed and Projected Climate Change in the Philippines. Quezon City.
Reg
ion
Pro
vin
ce
Observed (1971-2000) Projected (2036-2065)
DJF
MA
M
JJA
SON
Scen
ario
Ran
ge
DJF(Dec-Jan-Feb)
MAM(Mar-Apr-May)
MAM(Mar-Apr-May)
SON(Sep-Oct-Nov)
Cha
nge
(%)
Proj
ecte
dva
lue
Cha
nge
(%)
Proj
ecte
dva
lue
Cha
nge
(%)
Proj
ecte
dva
lue
Cha
nge
(%)
Proj
ecte
dva
lue
CA
R
Ben
gu
et
47.7
422.
3
1,73
4.9
931.
8
Mod
erat
e Em
issi
on
(RC
P4.5
)
Lower Bound
6.5 50.8 -11.0 376.0 -24.6 1,308.3 -24.8 700.5
Median 9.7 52.3 -3.3 408.4 -15.4 1,467.9 -6.1 875.0
Upper Bound
35.6 64.7 27.0 536.2 5.9 1,836.6 15.6 1,077.1
Hig
h Em
issi
on
(RC
P8.5
)
Lower Bound
-10.7 42.6 -14.2 362.5 -24.3 1,312.8 -16.1 782.0
Median 5.1 50.1 -5.5 399.2 -10.8 1,548.4 -5.2 882.9
Upper Bound
38.0 65.8 34.5 567.9 18.5 2,055.2 26.3 1,176.5
Source: PAGASA. 2018. Observed and Projected Climate Change in the Philippines. Quezon City.

51 Flood Early Warning System and Hydraulic Modelling
Figure 28: Night market, Baguio CitySource: John Lorenz Tajonera, unsplash
5. FLOOD EARLY WARNINGSYSTEM AND HYDRAULICMODELLING

52Flood Early Warning System and Hydraulic Modelling
A flood forecasting system essentially hosts calibrated hydrological and hydraulic models based uponhistorical measurements which take in real time and forecasted inputs to predict time series of flows andwater levels in a river system. Figure 29 indicates a simplified framework of an FEWS system.
Figure 29: FEWS Framework
Historical Rain, Water levels, Discharge and surveyed
cross section data
Data Acquisition System: Real time monitoring data - WL from gauging sites
Meteorological data: Rainfall forecast data & observed rainfall data
Calibrated Hydrodynamic +
Hydrological model
Database
Email alerts
SMS alerts
Webpage
FEWS System
5.1 FEWS FRAMEWORK

53 Flood Early Warning System and Hydraulic Modelling
Modelling components of an FEWS may be briefly described as:
• 1D Hydrodynamic module (HD): The 1D hydrodynamic model takes the runoff inputs from the RR model and routes it through the defined river network.
• Hydrological Rainfall-Runoff module (RR): The hydrological model simulates the catchment reactions and essentially routes rainwater to the rivers and drains.
• Data assimilation module (DA): The data assimilation uses the available real time measurements on the river to calculate error patterns and then applies the same to the water level and discharge forecasts. Real time data assimilation is an essential prerequisite for an accurate flow forecasting system.
• Flood module: The flood module couples the 1D forecasting model to a 2D model for calculation of flood inundation in flood prone areas. Using this integrated approach makes it possible to work with more realistic calculation of flood inundation caused. For forecasting systems, the 2D models should be kept small so that the run time maybe reduced in order to allow sufficient lead times. When the module is not run for near real time or forecasting, it can be used to develop flood maps for various flooding events.

54
Four river systems have been identified within Baguio City:
1. North flowing Balili River which converges with the Bauang River Basin. Surface water in the Central Business District in the Baguio city is drained into an underground drainage system along Magsaysay Avenue constructed by the DPWH which drains into Balili River.
2. To the south, the Bued River flowing and converging with the Patalan River and the Lingayen Gulf. 3. Western flowing Galiano river draining into the Aringay River. 4. To the east, the Ambalanga River draining into the Agno River.
The Balili river has been chosen for the pilot FEWS system, as it is one of the important rivers that drains the city, and also upon initial analysis of the existing flood hazard maps for the 5-year, 25-year and 100-year return periods (see Figure 17 and Appendix D.11). Areas in this basin were also identified to be predominantly flooded in comparison to the other basins. Once the system has been setup for the Balili river, the methods and learnings will be applied for the remaining river systems in the city, Bued, Galiano and Ambalanga. However, during the monsoon of 2021 the FEWS system for these three remaining rivers will not be tested in real time, as time and budget constraints do now allow it. Focus will instead be on establishing data assimilation and replicating FEWS framework setup for them.
Delineation of the project area for the FEWS has been heavily dependent on the location of the water level stations in the 4 rivers. The aim is to have historically observed data within the area against which the base hydrological and hydrodynamic models for the FEWS system can be calibrated. The Balili area for the FEWS has been extended up to station Mamat-ing Bridge in La-Union as this would allow for an additional point of calibration and allow the inclusion of the more flood-prone regions in the downstream reaches.
Appendix G offers more details on the water level stations and the DEM files used to properly delineate the FEWS project area, which can be seen in Figure 30.
Flood Early Warning System and Hydraulic Modelling
5.2 PROJECT AREA FOR FEWS

55 Flood Early Warning System and Hydraulic Modelling
To capture the flooding scenarios in the FEWS project area, it is planned that four types of models will be created:
• 1-D River models: one model for each river• Hydrological models: one for each river basin with smaller sub-basins wherever required.
NAM modelling will be used for the setup of the hydrological models.• Urban models: to include primary drains from the highly urbanized area in the city. The division of
these models will be based upon the outfall locations of the city’s drainage network. This model will be included based upon the extent of data available.
• 2-D Flood models: one for each river basin within the city boundaries.
The river model and hydrological model, once calibrated with respect to the observed data from the gauging stations, will be run with forecasted rainfall as input from withing the FEWS system. Real time water level/discharge data obtained from the gauges installed (in the project) will be connected to the model while running in real-time to allow data assimilation. Data assimilation will allow the model to be initialized with the latest measured data and automatically update error patterns and corrections before each model run.
The FEWS system will run the calibrated models with forecasted rainfall data for the region. The downloading, processing and linking of data (Rainfall- observed and forecasted, water levels, discharge) will be automated in the FEWS and models run at decided times daily. The model outputs processing and uploading to website will be automated and the warnings, in the form of email and SMS alerts, will be sent out based upon pre-decided rules.
It is planned that MIKE software suite will be used to setup the models and establish the FEWS. The MIKE software is worldwide recognized as a state-of-art hydrodynamic modelling tool, and its software used for FEWS (MIKE Hydro) is one of the most tested and well-established software in this field. Moreover, the Consultant has vast experience and expertise using MIKE software, which will come in handy when setting up and operating all the models and the FEWS setup.
5.3 METHODOLOGY FOR HYDRODYNAMIC MODELLING

56Flood Early Warning System and Hydraulic Modelling
Figure 30: FEWS project area and river basins

57 Flood Early Warning System and Hydraulic Modelling
5.4 GAPS IDENTIFIED
Six main gaps have been identified through this assessment: i) lack of river bathymetry data; ii) lack of additional water level station at Mamat-ing Bridge in La-Union; iii) lack of gauging stations on the River Ambalanga; iv) lack of discharge station data within the project area; v) absence of data on urban drainage system; vi) lack of data or information regarding existing hydrological or/and hydraulic models. These gaps are described in Appendix D and will be looked at in more detail in Task 2.
5.5 ON-THE-JOB TRAINING
The On-the job training (OTJ) is planned within the project duration in order to equip the LGU with skills and knowledge for operating and maintaining the FEWS system. This system will be installed at and operated from a location within the LGU, but this is yet to be defined in detail. Identified persons to be trained to understand the development process of the FEWS system, the data constraints, assumptions and modelling methodologies early on include:
• King Guinid (CDRRMO)• Stephanie Trinidad (CDRRMO)• Chester Comicho (City Engineering Office)• Jhomer Samoranos (City Environment and Parks Management)
A regular OTJ training will be more robust and will ensure a more thorough understanding and capacity development for the persons who will eventually be expected to operate and maintain the FEWS. Appendix G includes an indicative timeline of activities connected to the OTJ training. These activities and the overall timeline and training methods will be properly discussed with trainees and the LGU in Task 2.
The nature of the OTJ training is that it will follow the project’s development as it evolves with time. Hence, any training plan will eventually be dependent on project progress, as opposed to traditional capacity building activities which have a somewhat more independent agenda in terms of the project they’re embedded into. Hence, the OTJ training will need to evolve over time to accomodate project progress and participant’s needs herein.

58Flood Early Warning System and Hydraulic Modelling
Figure 31: Modelling Components- summary
• NAM models to cover the complete FEWS project area
• Rainfall input - GFS (Global Forecasting System) data - corrected against real time station rainfall data
• Calibrated against discharge data generated using derived rating curves and water level data. If historical data proves unreliable, rating curves to be readjusted with respect to data collected in monsoon 2021.
• MIKE Hydro River model for river stretches indicated in Figure 30
• Detailed cross-sections in stretches of Balili river (pilot)
• Less detailed cross-sections for the other 3 rivers - only initial HD models
• Inflow inputs from NAM models
• Calibrated against water levels (if reliable). Else to be fine-tuned with data collected in monsoon 2021.
• Urban 1D model (MIKE Urban) scenarios (mainly to be coupled with flood model) within the Baguio city depending on data availability
• Terrain model within Baguio city coupled with the river and urban models to generate different flood scenarios.
• Rain to be added to terrain in order to identify low lying areas requiring drainage solutions.
HYDROLOGICAL MODEL (REAL-TIME)
1D HYDRODYNAMIC MODEL (REAL-TIME)
URBAN MODEL (NOT REAL-TIME)
FLOOD MODEL (NOT REAL-TIME)
• NAM models to cover the complete FEWS project area
• Rainfall input - GFS (Global Forecasting System) data - corrected against real
time station rainfall data
• Calibrated against discharge data generated using derived rating curves and
water level data. If historical data proves unreliable, rating curves to be
readjusted with respect to data collected in monsoon 2021.
• MIKE Hydro River model for river stretches indicated in Figure 29
• Detailed cross-sections in stretches of Balili river (pilot)
• Less detailed cross-sections for the other 3 rivers - only initial HD models
• Inflow inputs from NAM models
• Calibrated against water levels (if reliable). Else to be fine-tuned with data
collected in monsoon 2021.
• Urban 1D model (MIKE Urban) scenarios (mainly to be coupled with flood
model) within the Baguio city depending on data availability
• Terrain model within Baguio city coupled with the river and urban models to generate different flood scenarios.
• Rain to be added to terrain in order to identify low lying areas requiring drainage solutions
HYDROLOGICALMODEL
(REAL-TIME)
FEWS DESIGN
URBAN MODEL(NOT REAL-TIME)
FLOOD MODEL(NOT REAL-TIME)
RISK ASSESSMENT AND ACTION PLAN
1-DHYDRODYNAMIC
MODEL(REAL-TIME)

59 Hazard and Risk Mapping
Figure 32: Landscape, Northern LuzonSource: Rosan Harmens, unsplash
6. HAZARD AND RISK MAPPING

60
Mapping hazards and risks is an essential step in building business cases for informed decision-making when creating a resilient and smart city. By mapping hazards and risks from flooding and landslides in Baguio City, pilot areas for mitigation actions can be identified and information of priority areas can improve the effects of the FEWS.
6.1 FRAMEWORK
As defined by the Fifth Assessment Report (AR5) of IPCC Working Group II (WGII), risk is the probability of adverse events multiplied by the consequences12. The consequences are defined by the sensitivity of the people and the physical assets exposed, and the adaptive capacity of the people.
If hazard probabilities are not available, an impact assessment can be made instead of a risk assessment. An impact assessment evaluates the consequences when a hazard occurs, see Figure 33.
Hazard and Risk Mapping
12 IPCC. 2014. Climate Change 2014: Impacts, Adaptation, and Vulnerability. Part A: Global and Sectoral Aspects. Contribution of Working Group II to the Fifth Assessment Report of the Intergovernmental Panel on Climate Change. Cambridge University Press, Cambridge, United Kingdom and New York.
Figure 33: Overall approach to a risk assessment based on AR5 WGII and overall approach to an impactassessment inspired by AR5 WGII.
Impact
Risk
Sensitivity Adaptive capacity
Intensity
Probability
Hazard
Vulnerability
Hazard
Impact
Risk
Vulnerability
Sensitivity Adaptive capacity

61 Hazard and Risk Mapping
Four documents related to climate risk and impact assessments in Baguio City have been reviewed:
• The most recent climate and disaster risk assessment (CDRA) was facilitated by the Department of Human Settlements and Urban Development (DHSUD) – Policy Development Group and Ramboll has received the presentation13. Maps and data presented in the presentation have also been made available;
• From the Egis Situation Assessment, volume 7 (Climate change and Natural Hazard Assessment) two hazard exposure maps are available: A landslide susceptibility map and a map of flood prone areas14;
• A presentation on a sample cost-benefit analysis has also been made available. The presentation originates from a Cost-Benefits Analysis Workshop held on 18 July 201915, under the project Philippines: Infrastructure preparation and innovation facility (project number 50288-001) financed by ADB.
• Finally, Ramboll received a spreadsheet summary on previous disasters in Baguio16.
No sources were found online regarding climate risk and impact assessments for Baguio specifically. The CDRA presentation lists mapping of flooding, but the maps received mainly show exposure to landslide, fault lines and sinkholes. The two latter are not relevant within the scope of this project. Flood exposure will be developed in this project as an output from the hydraulic modelling, but this will be compared with the flood data from the CDRA workshop.
A landslide susceptibility map has been obtained from Egis. This might be possible to use for the landslide impact assessment proposed in this project but needs a deeper assessment in Task 2.
13 I. C. Padao. 2020. Climate and Disaster Risk Assessment (CDRA) Overview. HLURB - Policy Devlopment Group. Baguio.
14 ADB and Egis. 2020. Baguio City Sanitation Improvement Project. Volume 7 Climate Change and Natural Hazard Assessment. Manila.
15 Phi_infrastructure preparation and innovation facility. Output 2_water projects. Costs-Benefits Analysis Workshop on July 18th 2019.
16 CDRRMO. 2020. Disaster data analysis. Baguio.
6.2 ASSESSMENT OF PREVIOUS STUDIES AND AVAILABLE DATA

62Hazard and Risk Mapping
The presentation on cost-benefit analyses does not apply to Baguio City specifically, but it outlines examples of damage costs to different types of structures and different types of crops, which will likely be incorporated in the assessment moving forward. This will be further discussed with the LGU.
The final document reviewed was the summary of previous disasters in Baguio, i.e.17. Besides identifying exposed barangays after specific event, the spreadsheet also lists casualties and missing people, and some damage costs. As the distribution of hazard mapping is done on barangay level, erroneous conclusions may be drawn, as barangays with large areas have (potentially) more hazard exposed areas and as such will have more casualties. This will be looked at in more detail in Task 2.
Moreover, the CDRA workshop material also shows the number of people affected due to flood and landslide, as well as the number of houses affected due to flood and landslide. This data has been reorganized and normalized, so as to be able to express the data graphically to facilitate understanding. The figure below is an example showing the number of people affected due to flood and landslide. It is evident that in 2009 the impact of flood was severe, which also led to massive landslide. However, in the graph, data for some years are missing because it was not possible to obtain data for those years. Remaining figures and maps can be found in Appendix H.
17 CDRRMO. 2020. Disaster data analysis. Baguio.

63 Hazard and Risk Mapping
Figure 34: People affected due to flood and landslide from 2001 to 2018Source: The figure is based on data from CDRRMO. 2020. Disaster Data Analysis. Baguio City.
Ramboll will use the data on previous disasters to validate Ramboll’s results where possible. The data cannot be used to calibrate the model as the scales differ and calibration is out of scope.

64
18 J. Huizinga, H. d. Moel and W. Szewczyk. 2017. Global flood depth-damage functions. Methodology and the database with guidelines Publications Office of the European Union. Luxembourg.19 L. Olesen, R. Löwe and K. Arnbjerg-Nielsen. 2017. Flood damage assessment. Literature review and recommended procedure.
Cooperative Research Centre for Water Sensitive Cities, Clayton.
Figure 35: Methodology for the flood risk assessment of Baguio
Hazard and Risk Mapping
In this project Ramboll will follow the four-step methodology of ADB (see Appendix H) and perform a GIS-based flood risk assessment and a GIS-based landslide impact assessment. Both assessments will be defined within the Baguio City boundary. The assessments will be done via a multi-criteria analysis (MCA), which is a decision-making tool that evaluates multiple (potentially conflicting) criteria as part of the decision-making process.
An MCA resembles a cost-benefit analysis, but with the notable advantage of not being limited to monetary units for its comparisons. Instead, criteria may be evaluated on a scale according to different parameters relevant for the context of the study, for instance economic importance of a given asset. This is an advantage in both that some assets are deemed intangible and impossible to price, e.g. injuries or loss of life, and when there is little data available for estimating monetary costs of damage or loss.
An MCA is relevant in this project, as climate risk assessments are a relatively new field of study, and as such there are no exhaustive thresholds or inventories for damage and/or loss costs available for assessing the monetary effects of landslides in particular. Currently, there are several studies investigating the economic impacts of flooding18 19, but to be able to compare the two assessments, it is suggested to assess asset sensitivities to both flooding and landslide in the same manner.
6.3.1 FLOODING
The methodology specifically defined for the flood risk assessment can be seen in Figure 35.
Receive output from hydraulic modelling (four different flood events in baseline
scenario present and future)
Define assetssensitive to flooding(critical, social and
transportationinfrastructure)
Define flood sensitivity from three parame-ters: Criticality, level of destruction and
time to be operational again
Overlay maps fromthree previous steps
Hazard (Potential)Exposure
Sensitivity &Vulnerability
Risk
6.3 METHODOLOGY FOR RISK AND IMPACT ASSESSMENT

65 Hazard and Risk Mapping
The flood risk assessment will use flood exposure results of the hydraulic modelling performed in this project. Flood risk will be assessed for the current baseline scenario in 2020 and in a future baseline scenario (specific year is dependent on outputs from the climate change assessment described in Section 4).
Four different return periods will be used in the hazard assessment for both points in time (Step 1 in the ADB methodology, see Appendix H). Figure 34 suggests significant damages occur every 3-5 years. Hence, Ramboll suggests assessing risk on a 3-year event, a 10-year event, a 20-year event and a 100-year event in 2020. In a risk assessment it is important to consider events with high probabilities, because even though damage costs of a singular 5-year event will be lower than less probable events, the accumulated costs of twenty 5-year events over 100 years, typically far outweigh the damage costs of one 100-year event in 100 years.
Probabilities of the four selected events in 2020, will be re-calculated to new probabilities in a future scenario, i.e. the exposure of each event remains, but the probabilities increase, causing an increase in risk. More information regarding suggested sensitivity parameters and corresponding weights can be found in Appendix H. Note that the future scenario will include projected future climate and potentially future land use and/or future population. The options will be evaluated in Task 2.
An assessment of how to include adaptive capacities will be done in Task 2, in consultation with the LGU. Finally, the hazard assessment will be combined with the vulnerability assessment and the output will be a risk map of Baguio in a 50m × 50m grid. The risk map will on a colour graded, numerical scale, visualise areas in Baguio City on a no and low risk scale to medium and high risk.

66
6.3.2 LANDSLIDES
The methodology specifically defined for the landslide impact assessment is shown below.
The landslide impact assessment will follow much the same methodology as the flood risk assessment. However, as landslides cannot be statistically evaluated in the same manner as flood events with statistical probabilities, there will only be one input hazard map in the landslide assessment, e.g. the landslide susceptibility map; and the assessment can only be done for one point in time.
The same assets will be assessed for landslide impact as flood risk. The sensitivity, however, may differ as assets aren’t necessarily affected the same way in a landslide as during a flood. Hence, a new sensitivity analysis might be necessary, but this will be consulted with key stakeholders. An assessment of how to include adaptive capacities will be done in Task 2, also in consultation with the LGU. The vulnerability assessment will eventually be overlapped with the landslide susceptibility map, and landslide impact map in a 50m × 50m grid will be produced.
6.4 GAPS IDENTIFIED
The hazard and risk mapping assessment has so far not identified any particular gaps beyond the gaps outlined in previous chapters, especially regarding the GIS data outlined in section 3 (e.g. utilities, businesses, shops, etc.) and in Appendix D. To complete a flood risk and landslide impact assessment, at least four flood hazard data are needed, which will be the outcome of the modelling work to be carried out in Task 2.
Figure 36: Methodology for the landslide impact assessment of Baguio
Hazard and Risk Mapping
Evaluate landslidesusceptibility mapreceived from EGIS
Define assetssensitive to landslide
(critical, social andtransportationinfrastructure)
Hazard
(Potential)Exposure
Sensitivity &Vulnerability
Impact
Overlay maps fromthree previous steps
Define landslidesensitivity from threeparameters: Criticality,
level of destruction and time to be
operational again

67 Flood Mitigation Action Plan
Figure 37: Market Stands, Baguio CitySource: Michael Syoma, unsplash
7. FLOOD MITIGATION ACTION PLAN

68Flood Mitigation Action Plan
The flood mitigation action plan will include long- and short-term measures and nature-based solutions (NbS), so that structural flood damages and losses are prevented and/or minimised. The action plan will aim at improving community disaster preparedness, raise awareness, and ensure ownership.
NbS connect urban hydrological functions with vegetation systems and offer valuable solutions for urban areas facing the challenges of climate change. NbS typically mimic natural systems offering terrain-based solutions for stormwater management. When conceptualized appropriately NbS generate social, economic and environmental value for the local area and may often reduce the need for traditional gray infrastructure.
Based on the city-wide flood risk assessment for Baguio City, three high risk areas will be selected as focus areas for a flood mitigation action plan. A high-risk area could be a park, a plaza, a street section, a block, or 2-3 of these elements in connection. The three high-risk areas will be selected based on a combination of their size, level of risk and hazard history, in close consultation with key stakeholders. Figure 38 shows an example of a risk assessment and how three areas are identified.
Figure 38: Visualised process for selecting three high risk areas for further studies. In this example red visualis-es high risk areas. The visualisation of the risk map will depend on the quantified results.

69 Flood Mitigation Action Plan
7.1 METHODOLOGY FOR THE PROJECT
The flood mitigation action plan will be developed through Ramboll’s four-step process for Cost-Benefit Analyses (CBA), see Figure 39.
A short description of each step is given below. For more in-depth details, please refer to Appendix I.
• Determine monetized risk: application of flood depth-damage functions. Ramboll suggests using flood depth-damage functions from the report “Global flood depth-damage functions: Methodology and the database with guidelines” from the European Commission20. This will be consulted with key stakeholders in due time.
• Plan and design: high level conceptual plans of the NbS design and high level estimates of capital investment requirements and on-going operational and maintenance costs will be provided.
• Measure effect: interface between the hydraulic modelling and the level of the conceptual design with well-defined targets, i.e. acceptable levels of flood protection.
• Evaluate cost & benefit: for costs estimation, the CBA will consider capital investments as well as long-term maintenance and operational costs associated to each NbS over its lifetime. For the
20 J. Huizinga, H. d. Moel and W. Szewczyk. 2017. Global flood depth-damage functions. Methodology and the database with guidelines
Publications Office of the European Union. Luxembourg.
Figure 39: Ramboll’s four-step process for cost-benefit analyses
Design solutions with NbS and secure own-ership and community
engagement
Implement solutions in hydraulic models
and measure effects in each area
Plan & design Measure effect Evaluate costs& benefits
Evaluate CAPEX and OPEX vs. avoided
risk and co-benefits
Determinemonetised risk
Use flood depth-dam-age functions to assess
monetised risk inthe three areas

70Flood Mitigation Action Plan
calculation of benefits, the socio-economic benefits of the reduced flooding (i.e. avoided direct and indirect damage costs and other effects on intangible effects such as health and wellbeing impacts) will be estimated over the lifetime of the NbS, along with the co-benefits and potential unintended consequences anticipated to be material and resulting from the nature-based and liveable solutions proposed. Since co-benefits are context specific and conditioned by the NbS design and location, for each CBA benefit screening will be conducted by mapping economic, societal and environmental impacts and dependences with due consideration of the causal links associated to each NbS, and a materiality assessment will be conducted to prioritise co-benefits for inclusion in the CBA. Up to 5 co-benefits per area of sustainability (social, economic, environmental) will be selected for inclusion into the CBA.
7.2 GAPS IDENTIFIED
At this point in time, the flood mitigation action plan has not been initiated in practical terms, and the work presented in this report relates more to a roadmap which is yet to be followed and fine-tuned in the upcoming stages in the project. Hence, no specific gaps have been identified for this component of the project. However, there is a lack of income distribution data on the city and therefore, the spatial distribution of the poor, low-income lower middle class and middle-class income groups in Baguio could not be established. This data is required to inform the location and design of the NbS in order to protect vulnerable groups.

71 Conclusion and Gap Analysis
Figure 40: Baguio City CentreSource: Solomon Melvin
8. CONCLUSION AND GAP ANALYSIS

72Conclusion and Gap Analysis
This report has aimed at answering the following questions:
• What is the current situation in Baguio with regard to the main project components, i.e. climate change assessment, hazard mapping, FEWS, etc.?
• Which data and information are available to support the implementation of the project tasks and activities as outlined in Table 1? And, is the quality of that data sufficient to support this project?
• What are the data and information gaps that could impact the overall project results, and which actions can or will be taken to fill those gaps?
Overall, all main questions have been answered through the development of this report. The current situation in Baguio is described in detail by presenting and assessing the data and information collected up till now, with an emphasis on key local settings which will be part of the upcoming activities in Task 2 of this project. This relates to, among other things, critical infrastructure, social infrastructure, land use and economic development. Where possible and reasonable, maps have been produced to show the spatial extent of the data collected and provide a more integrated understanding of the local conditions supporting the overall implementation of this project.
The outline, description and characterization of technical and non-technical gaps has been introduced in different sections, covering gaps related to GIS data, climate change baseline, FEWS, hazard and risk mapping, and flood mitigation action plan. For each of these project components, actions to bridge those gaps have been described.
The final outcome of this report is the summary of all gaps and associated proposed actions, which can be seen in Appendix E.

73 References
ADB and Egis. 2020. Baguio City Sanitation Improvement Project. Main Report. Manila.
ADB and Egis. 2020. Baguio City Sanitation Improvement Project. Volume 1 Urban Development and Growth. Manila.
ADB and Egis. 2020. Baguio City Sanitation Improvement Project. Volume 3 Sanitation Situation. Manila.
ADB and Egis. 2020. Baguio City Sanitation Improvement Project. Volume 6 Institutional Effectiveness and Financing Assessment. Manila.
ADB and Egis. 2020. Baguio City Sanitation Improvement Project. Volume 7 Climate Change and Natural Hazard Assessment. Manila.
City Disaster Risk Reduction and Management Office (CDRRMO). 2020. Disaster data analysis. Baguio.
Climatological Normal Values, data.gov.ph, [Online]. Available: https://data.gov.ph/?q=dataset/climatological-normal-values . [Accessed 4.12.2020].
Contribution of Working Group II to the Fifth Assessment Report of the Intergovernmental Panel on Climate Change. Cambridge University Press, Cambridge, United Kingdom and New York.
Department of Environment and Natural Resources, Mines and Geosciences Bureau. 2015. Detailed landslide and flood susceptibility map of Benguet province, Philippines. Quezon City.
Department of the Interior and Local Government. 2020. Climate and Disaster Risk Assessment (CDRA) workshop dataset.
I. C. Padao. 2020. Climate and Disaster Risk Assessment (CDRA) Overview. HLURB - Policy Devlopment Group. Baguio.
IPCC. 2014. Climate Change 2014: Impacts, Adaptation, and Vulnerability. Part A: Global and Sectoral As-pects.
J. Huizinga, H. d. Moel and W. Szewczyk. 2017. Global flood depth-damage functions. Methodology and the
REFERENCES

74References
database with guidelines. Publications Office of the European Union. Luxembourg.
LGU. 2016. Comprehensive Land Use Plan 2013-2023. Baguio.
LGU. 2018. Comprehensive Development Plan 2018-2022. Baguio.
LGU. n.d. City Disaster Risk Reduction and Management Plan 2020. Baguio.
LGU. n.d. Local Climate Change Action Plan (LCCAP). Baguio.
L. Olesen, R. Löwe and K. Arnbjerg-Nielsen. 2017. Flood damage assessment. Literature review and recom-mended procedure. Cooperative Research Centre for Water Sensitive Cities, Clayton.National Engineering Center. 2020. LiDAR Portal for Archiving and Distribution. https://lipad.dream.upd.edu.ph/.
Maximum temperature in Baguio, sunstar.com.ph, [Online]. Available: https://www.sunstar.com.ph/article/136103 [Accessed 21.1.2021].
Minimum temperature in Baguio, baguio.gov.ph, [Online]. Available: https://www.baguio.gov.ph/content/baguio-records-4th-lowest-temperature-72-degrees-celsius. [Accessed 21.1.2021].
PAGASA. 2018. Observed and Projected Climate Change in the Philippines. Quezon City.
Phi_infrastructure preparation and innovation facility. Output 2_water projects. Costs-Benefits Analysis Workshop on July 18th 2019.
Woodfields Consultants, Inc. 2017. Consultancy Services for the Development of Groundwater Management Plan (GMP) for Highly Urbanized. Water Constraint cities in Baguio City and Surrounding Areas. National Water Resources Board. Baguio.

ABOUT THE ASEAN AUSTRALIA SMART CITIES TRUST FUND
The ASEAN Australia Smart Cities Trust Fund (AASCTF) assists ASEAN cities in enhancing their planning systems, service delivery, and financial management by developing and testing appropriate digital urban solutions and systems. By working with cities, AASCTF facilitates their transformation to become more livable, resilient, and inclusive, while in the process identifying scalable best and next practices to be replicated across cities in Asia and the Pacific.