familial hyper-alpha-lipoproteinemia: studies in eighteen kindreds
TRANSCRIPT

Familial Hyper-alpha-lipoproteinemia: Studies in Eighteen Kindreds
C. J. Glueck, R. W. Fallat, F. Millett, P. Gartside, R. C. Elston and R. C. P. Go
A newly recognized familial hyperlipo- proteinemio, familial hyper-alpha-lipo- proteinemia, is described in 18 kindreds. Affected probands and relatives had dis- tinctive elevations of alpha-lipoprotein cholesterol (C-HDL), slight elevations of total cholesterol, no elevation of LDL and VLDL cholesterol, and normal triglyceride levels. The proband and at least one addi- tional first degree relative had distinctive elevations of C-HDL in 16 of 18 kindreds. Simple segregation analysis involving 84 offspring of 22 hyper-alpha x normal- alpha matings from these 16 kindreds revealed a ratio of hyper-alpha to normal of 37:47, a ratio not significantly differ-
ant from 1:l (xi = 1.2), the ratio con- sistent with autosomal dominant trans- . mission. Despite the suggestion of a major gene effect by this analysis, evaluation of the C-HDL distribution in kindred mem- bers failed to reveal bimodality, and familial correlation analysis revealed no parent-offspring correlation. The present data suggest that an environmental cause common to sibships is possibly important in causing the disorder. longevity analysis demonstrated elongation of life expectancy for kindred members, and there was an apparent rarity of premature cardiac events.
L IKE OTHER LIPOPROTEINS, alpha-lipoprotein cholesterol (C-HDL) is
subject to genetic control’-3 and is influenced by environmental factors,4
drugs,5 ethanolic excess,6p7 and diabetes.8 The only previously reported familial disorder which involved C-HDL is Tangier disease, familial HDL deficiency,‘v3
characterized by deficient or absent plasma C-HDL and tissue storage of cholesteryl esters. ‘s3 Tangier disease appears to be transmitted by a mutant
autosomal recessive gene. Heterozygote carriers may have C-HDL levels below
the normal lower 5% limits.‘v3 If genetic control of C-HDL parallels that for low-density lipoprotein cho-
lesterol (C-LDL), one might group the following pairs of familial lipoprotein
disorders:
A-beta-lipoproteinemia’ A-alpha-lipoproteinemia”
Hypo-beta-lipoproteinemia’T9 Hypo-alpha-lipoproteinemia
Hyper-beta-lipoproteinemia’ Hyper-alpha-lipoproteinemia lo
Complete deficiency of C-LDL,’ 50x-70% reduction in C-LDL,‘s9 and major
From the Department of Medicine, General Clinical Research Center, Lipid Research Center,
University of Cincinnati, College of Medicine, Cincinnati, Ohio and the Department of Biostatistics.
Genetics Curriculum and Biological Sciences Research Center, University of North Carolina, Chapel
Hill, N.C.
Received for publication May 3, 1975.
Supported in part by the General Clinical Research Center (RR ooo68-13). Public Health Service
Research Career Development Award (I-K3-GM-31, 172). a research grant from the National Insti-
tute of General Medical Sciences (GM-16697). and NHLI contract 71-2243 (Elston and Go). A
portion of this work was done during C. J. Glueck’s tenure as an Established Investigator of the
American Heart Association.
Reprint requests should be addressed to Dr. Charles J. Glueck, General Clinical Research Center,
Cincinnati General Hospital, 234 Goodman Street, CZ-3. Cincinnati, Ohio 45267.
Q 1975 by Grune & Stratton, Inc.
Metabolism, Vol. 24, No. 11 (November), 1975 1243

1244 GLUECK ET Al.
primary increments of C-LDL’ have been well documented as the a-beta-, hypo- beta-, and hyper-beta-lipoproteinemias. Obligate heterozygotes’s3 from Tangier kindreds often have C-HDL below the 5% limit for controls. Familial hyper-
alpha-lipoproteinemia in our preliminary report appeared to be transmitted as
an autosomal dominant trait,” involved 52% of kindred members at genetic risk, and was characterized by elevated C-HDL and decreased C-LDL.
Hyper-alpha-lipoproteinemia may also be acquired by exposure to chlori-
nated hydrocarbon pesticides,4 in biliary cirrhosis,z in alcoholism,6*7 and by exogenous estrogen supplementation,5 and may be associated with mature- onset diabetes mellitus.E
An assessment of hyper-alpha-lipoproteinemia in 18 kindreds is summarized in this report. The disorder was characterized by distinctive elevations of
C-HDL and was associated with increased longevity and an apparent rarity of atherosclerotic vascular events. Although simple segregation analyses in off- spring of critical matings of hyper-alpha by normal-alpha subjects were con- sistent with a pattern of autosomal dominant inheritance, the presence of a
major gene effect could not be confirmed by analysis of the distribution of C-HDL. Studies of familial correlations, which can detect sex linkage” but can- not distinguish a major gene from a polygenic hypothesis, indicated no sug-
gestion of X-linkage. While some form of dominant hereditary transmission should not be completely ruled out, the major cause of the familial aggregation appears to be due to an environmental cause that is common to siblings.
MATERIALS AND METHODS
Lipid and lipoprotein quantitation. Blood samples were drawn in the recumbent position after
a 12-hr overnight fast into tubes containing EDTA (I mg/ml). All patients were receiving their
usual diets without recent weight loss. The plasma lipoproteins were evaluated using a system”
employing paper electrophoresis,‘3 heparin-manganese precipitation,14 and preparative ultra-
centrifugation, I5 allowing for measurement of high-density lipoprotein (HDL), very-low-density
lipoprotein (VLDL) and low-density lipoprotein (LDL) cholesterol. Both cholesterol’6 and
triglyceride” levels were quantitated by a modification of Auto Analyzer I methodology.”
Lipid and lipoprotein levels for probands and kindreds are summarized in the Appendix (kindred
charts) and Figs. 1-4.
Normal limits for lipid and lipoprotein levels. In a lipid and lipoprotein screening study of
3C00 unselected, free-living family units in the greater Cincinnati area, data were available for
C-HDL distribution in the first 168 subjects sampled (88 females, 80 males). The 20th to 80th
percentile distribution for age for the 88 females was IO-42 yr and for the 80 males was 12-47 yr.
C-HDL levels were approximately normally distributed in these 168 subjects. Since we had previ-
ously observed apparent aggregations of elevated C-HDL in several local kindreds, we wished to
establish some putative “normal” limits for C-HDL from our 168 subjects. The 90th percentile
for C-HDL in these 168 subjects was 70 mg/lOCl ml, and mean f 1 SD C-HDL was 55 + 12. For
the current study, we arbitrarily chose to use 70 mg/lOO ml as an “upper normal limit” for
C-HDL. This upper normal limit would be in very close agreement with that published by Carlson
et al. in 19 healthy males4 but would be slightly lower than the NHLI suggested normal limits.2
Assessment of the C-HDL distributions from other groups of control subjects obtained later in
the temporal sequence of sampling of the 3000 family units revealed insubstantial changes in the
90th percentile for C-HDL. The selection of a 90th percentile limit for identification of this dis-
order is, as noted above, essentially arbitrary, and it is possible that if a 95th, 99th, or 99.9th percentile cut-off for C-HDL were used, differing results with respect to genetic transmission
might be obtained.
Age-adjusted normal limits for total, LDL, VLDL cholesterol, and triglyceride of Fredrick-
son et al.’ were used for identification of other hyperlipoproteinemias in family members.

HYPER-ALPHA-LIPOPROTEINEMIA 1245
Table 1. Ascertainment of living First-degree Relatives, Siblings, Childmn, and Parents of Probands with Hyper-alpha-lipoproteinemia
Number
Number sampled
Percentage sampled
living First-degree living Relatives Siblings
127 53
110 41
87% 77%
Living Parents
25
24
96%
living Children
49
45
92%
Additional laboratory studies. All family members were studied while taking their habitual diet at stable weight. None had a history of excessive ethanol intake.6F7 None had mature-onset diabetes.8 Only one hyper-alpha-lipoproteinemic subject (H-3, kindred #14, Appendix), the wife of the proband, took estrogens or estrogen-progestin oral contraceptives. When she discon- tinued oral contraceptives, her C-HDL levels fell to normal. No family members had been more than casually exposed to chlorinated hydrocarbon pesticides4 Liver, thyroid, and renal func- tion tests were normal in all kindred members, and none had elevated fasting blood sugars. There was then no evidence for acquired elevations of C-HDL in affected family members.
Family srudies, 18 kindreds. The IS probands were ascertained by virtue of C-HDL 1 70 mg/lOO ml during an 1%mo period, in population survey studies of 3000 free-living family units (mother, father, children; mother, father, neonate) in the greater Cincinnati area. Total, HDL, VLDL, and LDL cholesterol, and triglyceride had been determined routinely in the family units. Since the I8 kindreds were chosen from 2400 of the 3000 family units, with sampling still under- way, the prevalence of kindreds with aggregates of elevated C-HDL is currently unknown. The I8 kindreds in this report were studied in the temporal order of their appearance, without known systematic biases in their selection.
Major attempts were made to contact all first-degree relatives and as many second and third degree relatives as possible in the I8 kindreds, either by direct sampling in the local areas or by mailed, iced samples. Lipids were sampled in IlO/ (87%) living, first degree relatives, in 41/53 (77%) of living siblings, in 24/25 (96%) of living parents, and in 45/49 (92%) of living children of probands (Table I).
In I6 of the I8 kindreds, apart from the proband, at least one first-degree relative had pri- mary elevations of C-HDL. In these I6 kindreds, there were 22 matings of hyper-alpha by normal- alpha subjects, with 84 living offspring, all of whom were sampled (Table 2).
Longevity analysis. Longevity, coupled with an apparent diminution of cardiac events, appeared to be a characteristic of many of the families with familial hyper-alpha-lipoproteinemia. To further investigate this apparent longevity, we examined the health history of all of the follow- ing kindred members: probands and their siblings, parents, and grandparents. The current age if living, and age and cause of death if deceased, were recorded. To perform this analysis we at- tempted to obtain death certificates or reviewed the physicians’ or hospitals’ records for the I8 kindreds and their members. As indicated in Table 3, in many cases accurate data on either age or cause of death was unavailable in maternal and paternal grandparents of probands. After tabular grouping of longevity records (Table 3), analyses of longevity (Table 4) were performed by the method of Chianglg using a one-yr interval. All of the probands and their siblings, parents, and grandparents who were or had been living at age 35 were included in this analysis, provided the relevant information was available.
The computation of life expectancy uses all of the life expectancies in the group, including those living and well, to provide an estimate of the average number of years lived beyond age 35 (Table 4). This age was used for computations since it was the youngest age recorded among parents and grandparents of the probands and also represented an age which is generally a threshold for increasing cardiac events in later years. The estimated expectations of life (Table 4) were then compared with those for white males and females, age 35, for both l949-1951” and l9692o from the D.H.E.W. vital statistics of the United States.
Mortality and morbidity ascribed to arteriosclerotic cardiac and peripheral vascular disease in parents and grandparents of probands were evaluated (Table 5).
Statistical methods. Standard regression and correlation analyses were used.22 Scatter dia- grams were inspected to be sure that there were no significant nonlinear relationships. Studies

1246 GLUECK ET Al.
Table 2. Breakdown of Gffspring into Highs (HDL 1 70 mg/l DO ml) and Normals (HDL I 70 mg/ 100 ml) for the 22 Hyper-alpha x Normal-alpha Matings
Kindred Number Mating High Normal Total
1 III-1 x III-4
5 II-1 x II-2
5 II-4 x II-5
6 I-1 x l-2
6 II-1 x II-7
6 II-3 x II-8
6 II-4 x II-9
6 II-6 x II-10
10 II-3 x II-4
12 II-4 x II-5
13 I-1 x l-4
14 II-2 x II-3
15 II-1 x II-8
16 II-1 x II-2
18 II-1 x II-2
19 I-1 x l-2
20 II-3 x II-9
21 II-3 x II-4
23 I-1 x l-2
23 II-3 x II-4
27 I-l x l-2
27 II-1 x II-4
Totals 37 47 84
1
1
3
4
2
4
2
0
1
1
2
1
1
2
1
2
2
2
1
2
1
0
0
2 1 1 3 6 2 4 2 4 8 0 1 0 1 4
0
5
1
1
2
3
6
3
5
5
6
3
5
4
5
9
2
2
2
3
6
1
7
2
2
fable 3. Age and Cause of Death in Parents and Gmndparents of Probands with Hyper-alpha-lipoproteinemia
Kindred # Mother Father Maternal
Grandmother Maternal
Grandfather Paternal
Grandmother Paternal
Grandfather
1 65 65 94 80 + ? ? ? 3 93 + cvo 86 + Cva 7 ? ? ? 5 65 66 89 54 + MI 64 + MI 66 + ? 6 71 76 92 + ? 94 + ? ? ?
10 65 61 +Co 80 + ? 60 + ? 91 +? 90 + ? 12 70 47 + co ? ? ? ? 13 73 + Ccl 59+Dm ? ? ? ? 14 64 59 + Cva 80 + ? 86 + ? ? ? 15 70 42 + Hbp 41 + Rhd 71 + Cva ? ? 16 39 45 65 69 ? ? 18 35 36 75 76 ? ? 19 46 41 ? ? ? ? 20 60 + Ca 65 ? ? ? ? 21 38 37 70 68 63 65 22 67 + Hbp 68 + MI ? ? ? ? 23 40 40 69 68 62 + Ca 58 + ? 27 35 35 75 72 ? ? 28 43 45 ? ? 79 + Ca 82 + Cva
Abbreviations: ? = age and/or cause of death unknown; + = death at indicated age; Cva =
cerebrovascular accident; Dm = diabetes mellitus; MI = myocardial infarction; Rhd = rheumatic heart
disease; Hbp = high blood pressure; Ca = cancer.

1247 HYPER-ALPHA-UPOPROTEINEMIA
Table 4. longevity Anolysis: Expectation of life at Age 35 (in years)
Life Tables for 1949-51” Life Tables for 1969m
Moles U.S. white population 70.66 71.30
18 kindreds with hyper-alpha 75.48 75.48
“Z” value* 2.336 2.063
P= 0.02 0.04
Females U.S. white population 74.98 77.50
18 kindreds with hyper-alpha 81.38 81.38
“Z” value* 3.072 1.86
P= 0.002 0.06
*Difference between observed longevity and tabular longevity divided by the observed standard
deviation.
of the distributions of original, not age-corrected, C-HDL levels in normals and in selected kindred members were carried out using the null hypothesis of no difference in the distribution functions, by use of the Kolmogorov-Smirnov Statistic.23 Familial correlations were estimated for each type of correlation (e.g., father-son, brother-sister) by taking all possible pairs of values for the particular type and calculating the ordinary product moment correlation from these pairs. The resulting estimates are consistent and give more weight to the larger kindreds. Since the pairs from the same kindred are themselves correlated, a conservative confidence inter- val was obtained (using Fisher’s z-transformation) assuming the number of pairs to be the same as the number of kindreds contributing at least one pair of the specified type. Analyses of the number of affected, normal offspring at genetic risk were performed following the example of Kwiterovich et al.”
RESULTS
Family Study of the Transmission of Hyper-alpha-lipoproteinemia by Simple Traditional Methods
In four of the 18 kindreds (Nos. 6, 14, 23, 27; Figs. l-4) there was three- generation vertical transmission of hyper-alpha-lipoproteinemia. In 16 of the 18 kindreds at least one other family member in addition to the index case had dis- tinctive primary elevations of C-HDL. In the absence of secondary causes of hyper-alpha-lipoproteinemia, the aggregations of elevated C-HDL in these 16 kindreds were thought to be primary and possibly heritable. To examine the transmission of C-HDL and the potential modes of inheritance, initial studies of critical matings (hyper-alpha by normal) and their offspring were made, and studies of the distribution of C-HDL in selected subsets of the 18 kindreds and in the total group were made.
In the 16 kindreds where the index case and at least one first degree family
Table 5. Mortality and Morbidity Ascribed to Arteriosclerotic Cardiovosculor Disease in Parents and Grandparents of Pmbands With Hyper-alpha-lipoproteinemio
Total Mean f I SD % Mortality Total Mean f 1 SD % Morbidity
Available Age of Death MI Available Aw Ml
Parents of probandr 11 65 f 15 9 25 52 f 14 0
Grandparents of probands 18 73 f 15 11 14 72 f 9 0
Total 39 39 0

1248 GLUECK ET AL.
member had elevated C-HDL, there were 22 critical matings of hyper-alpha by normal subjects, with 84 offspring, all of whom were sampled (Table 2). Thirty- seven of the 84 offspring had elevated C-HDL, while 47 had “normal” C-HDL
(Table 2). In these 84 offspring at direct genetic risk, the ratio of those with hyper-alpha to those with normal-alpha was 37:47, a ratio not significantly different from 1: 1 (xi = 1.2) the ratio predicted for autosomal dominant trans-
mission of a rare gene. 24 When segregation analyses were performed within sib- ships of given sizes,14 none of the resultant chi-square analyses indicated sig- nificant departures from binomial distributions.
The distribution of the C-HDL levels in these 84 offspring was compared with the distribution of the C-HDL values in 168 free-living subjects. This was accomplished by testing the null hypothesis of no difference in the distribution functions using the Kolmogorov-Smirnov statistic.” The hypothesis was re- jected atp < 0.001. Next, a histogram was constructed for the 84 HDL values, using 15 equispaced subintervals over the interval (35,110) mg/lOO ml. Two
modes were observed, one centered at 72.5 mg/lOO ml with a frequency of 13, and the second one centered at 52.5 mg/ 100 ml with a frequency of Il. How- ever, when this set of data was tested for normality by the Kolmogorov-Smir-
B DECEASED
q NORMAL
@I HYPER -
HYPER -
cl TYPE II-A Fl NOT SAMPLED
Fig. 1. Kindreds with hyper-alpha-lipoproteinemia.

HYPER-ALPHA-LIPOPROTEINEMIA 1249
I
II
Qs .’ ;::....* 3 5 , 4:: 7
Fig. 2. Kindreddr with hyper-alpha-lipopmteinemia.
nov statistic,23 the hypothesis that the data were normally distributed could not be rejected.
In the 84 offspring, the 37 with C-HDL > 70 and the 47 with C-HDL < 70 had similar LDL cholesterol levels, respectively (a f SEM), 107 A 5, and
103 + 7 mg/lOO ml. Plasma triglycerides in the two groups were also similar,
56 f 3, and 64 f 5 mg/lOO ml, respectively. Total cholesterol was 198 f 6 in the 37 offspring with hyper-alpha, higher than total cholesterol (173 + 7, p < .Ol) in the 47 normal offspring. Since C-LDL and C-VLDL did not differ between the two groups, increased C-HDL accounted for the slightly increased total cholesterol levels and a higher C-HDL:C-LDL ratio in the offspring with hyper-alpha-lipoproteinemia.
Family Analyses and Relation of C-HDL to Other Lipid and Lipoprotein Levels
Efict of sex. The distribution of C-HDL for all subjects in the 18 kindreds was examined for males and females separately. The cumulative plots of C-HDL distribution (Fig. 5 for males and Fig. 6 for females) show that the male values are lognormally distributed, whereas the female values are normally distributed.

1250
@
I 2
I 7 7
3
II l ' I2
m % d l z 3
f
2@
I .' 7"
Fz = f.
l 2
I
I 3 P 2 @
h
2 4 II7 7 ;
GLUECK ET AL.
nl
Fig. 3. Kindreds with hypebalpha-lipaproteinemia.
For the males, it might be thought that the lognormality is perhaps due solely
to the four highest values, but this is not the case. For the females, there is per- haps a suggestion of bimodality, but this is not significant, since a mixture of
two normal distributions does not fit significantly better than one. The sexes do
not differ in variance, but there is a significant difference in means:
Males
n - 93
Mean
57.68
Variance
317.40 Females 94 68.17 254.17
t = 4.41 F = 1.25
< .OOl > .l
Age e$Pct. For males there is a significant regression (p < .Ol) on age, whether the original value of the C-HDL levels or their logarithms are used. On the original scale, 7.2% of the total variance is accounted for by regression on age, as compared to 9.2% on the log scale. The log scale is therefore more appropriate, and on this scale there is no significant quadratic effect. The re- gression equation for males is:
log,C-HDL = 4.131 - 0.00437 (age in years)

HYPER-ALPHA-LlPOPROTElNEMlA 1251
0 #27
Fig. 4. Kindreds with hype+olpho-lipoproteinemio.
Note that the regression is negative. Figure 7 shows how the C-HDL values, corrected for age, give an almost perfect fit to the theoretically best-fitting single lognormal distribution. There is now only one “outlying” high value, and elim- inating this would make no difference to the fit.
For females there is no significant regression on age (p - 5). Familial correlations. Since after age-correction there is no evidence for two
distinct groups in the C-HDL distribution, familial correlations were calculated in order to uncover the genetic mechanism. ,These were calculated on the orig- inal scale and on the log scale (after age-correction), and also on the original scale for females and the log scale for males-which Figs. 5 and 7 suggest is the most appropriate. The correlations obtained hardly differed for the different scales, and we quote here those obtained when log values are taken for both sexes-this has the advantage of making it easy to obtain pooled estimates for the two sexes, and it should be noted that on the log scale there is virtually no sex difference in variance. The correlations (together with very conservative 95% confidence intervals) are as follows:
husband-wife -0.21 (-0.57,0.31) father-son 0.28 (-0.26,0.55) father-daughter -0.05 (-0.52,0.44) mother-son -0.03 (-0.50,0.46) mother-daughter -0.08 (-0.54,0.42) brother-brother 0.48 (-0.21,0.83)

1252 GLUECK ET Al.
I
0 0 20 0 40 a 60 0 eo 0 100 120 190 160
C-HDL, mg/lOOml
Fig. 5. Empirical cumulative plot, together with the best-fitting normal and lognormal distribu- tions, of C-HDL values for all moles in the 18 kindreds. Each cross is the C-HM value for one individual, and the ordinate is (rank C-HDL value)/(sample size +l). Note the distribution is approximately lognormal.
sister-sister 0.45 (-0.09,0.76) brother-sister 0.15 (-0.38,0.60)
It can be seen that the confidence intervals are very wide, but it must be remem- bered that this is because only the number of kindreds has been taken into ac- count in their calculation; the true 95% confidence intervals are narrower. The only parent-offspring correlation that is estimated to be positive is the father- son correlation-the very correlation that should be smallest if there is X-link- age. The other parent-offspring correlations are consistently near zero, and the sibling correlations are consistently positive.
The pooled parent-offspring correlation is 0.001, and the pooled sibling cor- relation is 0.36. If the negative assortative mating (-0.21) is really significant,

HYPER-ALPHA-LIPOPROTEINEMIA 1253
0 0. 20.0 40.0 60.0 00.0
f 120. 140. 160.
C-HDL, mg/lOOml
Fig. 6. Empirical cumulative plot, together with the best-fittmg normal and lognormal distribu- tions, of C-HDL values for all females in the 18 kindreds. Each cross is the CHDL value for one individual, and the ordinate is (rank C-HDL value)/(sample size +l). Note the data points fit a normal distribution more closely than they flt a lognormal distribution.
then a zero parent-offspring correlation could be an indication of a hereditary component; and the fact that the sibling correlation is larger than the parent- offspring correlation would suggest dominance. Thus, while X-linkage is ex- tremely unlikely, we cannot rule out the possibility of an autosomal gene, with dominance, accounting for part of the variability of C-HDL in these families. A much more plausible inference from this analysis, however, is that a major part of the variability is due to an environmental cause that is common to sib- ships but not to the whole nuclear family; at this point we can only speculate as to what that cause might be.
Relationships among all lipids in these kindreds. The correlations between various lipid and lipoprotein classes were calculated after controlling for age by using the log values of each lipid to regress out (1) age, and (2) age and (age)2.

1254 GLUECK ET AL.
LOGNORMAL-
0 0. 20.0 to. 0 60.0 60.0 100. 120. 1+0. 160.
C-HDL , mg/iOO ml, ADJUSTED to AGE 30
Fig. 7. Empirical plot (males), together with the best-fitting normal and lognormal distribu- tions, of C-HDL values after adiustin@ for age. linear regression has been used to adjust the log C-HDLvalues to age 30, and antilogs of these adjusted values taken; otherwise this plot is the same as in Fig. 5. The data points It a lognormal distribution extremely well.
In either case, the result is the same, and scatter diagrams (between age-cor- rected values for each pair of variables) were examined to check that no major nonlinear trend was being overlooked.
For males, only LDL cholesterol is not significantly related to age. After age- correcting all the variables, seven of the ten correlations are significant (Table 6). For females, both LDL and HDL cholesterol are not significantly related to age. The relation between VLD cholesterol and age is weak (p - 0.08). After age-correcting all the variables, six of the ten correlations are significant.
The correlations for the log values after age-correction are given in Table 6. In addition to the well-known correlations of total and LDL cholesterol, VLDL cholesterol and triglyceride, and total cholesterol and triglyceride, sex differ-

HYPER-ALPHA-LIPOPROTEINEMIA 1255
Table 6. Correlations Between Various lipid and lipoprotein Level,: Pairwise Correlations After Controlling for Age, Males and Females (Males Above the Diagonal, Females Below)
HDL Total VLD LO1 Trialvcerides
HDL
TOTAL
VLD
LDL
Triglycerides
.12 -.30t -.lO - .24’
.02 .39$ .75$ .34$
.47f .07 .45$ .89$
.64$ .23* .75$ .17
- .05 .25* .63$ .15
log values of each lipid were used after regressing out sex-specific age effects.
l .01 < p < .05.
t.001 <p < .Ol.
$p<.Dol.
ences were observed in the following correlations: HDL and VLDL, HDL and LDL, total and VLDL, and total and LDL. We do not know whether these sex differences in correlations, which appear to be very significant, have any
generality.
Longevity Analysis, Cause of Death in Parents and Grandparents of Probands
In an attempt to determine the potential clinical significance of familial hy- per-alpha-lipoproteinemia, the family history was examined in each of the 18
kindreds with special attention to age (if living) and age and cause of death in parents, grandparents, and siblings of probands, as well as probands themselves
(Tables 3,4, and 5). Longevity analysislg was focused on the kindred members who were, or had been, alive at age 35.
Adequate health and mortality data was available in all 36 parents of pro- bands, and in 32 of 72 maternal and paternal grandparents (Table 3). Similar data was also available for 62 of 68 of the proband’s siblings, as well as for the 18 probands themselves. The expectation of life at age 35 for both males and females from kindreds with hyper-alpha-lipoproteinemia was longer than that
indicated by population statistics for U.S. white populations for the 1949-1951 Life Tables (Table 4).*’ Using the 1969 Life Tables2’ this added longevity re- tained significance for males but was of borderline significance for females. In
each case, the life expectancy at age 35 for the state of Ohio is at least as large
as for the whole U.S. population, so the latter is a conservative figure for com- parison with our sample.
The use of two different sets of Life Tables (Table 4) was dictated by the difficulty in choice of control populations to compare with the expectation of life calculated from probands, siblings, parents, and grandparents for whom sufficient information was available. We calculated for our kindreds that “aver- age year” in which the males became 35 (1950) and in which the females became 35 (1948). This suggests an appropriate control is the earlier (1949-1951) Life
Table, which reveals a lower life expectancy for the “control” white population (Table 4).
As indicated in Table 4, the difference in longevity between kindreds with familial hyper-alpha-lipoproteinemia and the U.S. white population is more marked for both males and females using the 1949-1951 Tables. However, a bias arises from the fact that the 1949-1951 Life Tables are calculated on the

1256 GLUECK ET Al.
assumption that the force of mortality is constant over time. In fact, there has been an improvement in mortality over the years,25 so calculations based on the 1969 Life Table data may be more appropriate. The decline in mortality over
the years has taken place primarily at the younger ages,2s and in “the last few years, the mortality rate after age 35 of later born cohorts has risen above those
of earlier born cohorts, demonstrating a crossover effect. Also, the age range in which substantial improvements in mortality are possible is narrowing. At the
moment, this age range is from birth to about age 30 years. Unless major break- throughs are achieved, further declines in mortality will be small compared with past improvements. For this it follows that future period Life Tables should become better predictors of the mortality experience of a cohort than past period life tables have been. This should be more true of whites than of races other than white and more true for females than for males.“25 In view of this, the calculations in Table 4, based on the 1969 Life Table data, are probably quite conservative.
In the 11 parents of probands who were deceased (average age of death 65), cancer and stroke accounted for seven deaths, and myocardial infarction for
only one death (at age 68), (Table 5). Four of 68 siblings of probands were de- ceased, one with trauma and three with carcinoma. There was no mortality
from atherosclerosis. For the living parents and grandparents of probands, no morbidity from ischemic heart disease has been registered.
Clinical and Chemical Features in Subjects with Elevated C-HDL
The kindred members with elevated C-HDL levels had no unique physical or neurological features and no xanthomas. No unusual or unique symptoms
referable to any organ system were present.
On lipoprotein electrophoresis (paper), there was a single alpha-lipoprotein band with normal electrophoretic mobility and increased staining intensity. Agarose electrophoresis of the supernate of the heparin-manganese precipita- tion was studied in a subset of ten subjects with hyper-alpha-lipoproteinemia
to determine whether beta, pre-beta, or Lp(a) lipoproteins were completely precipitated. There was no evidence for any beta, pre-beta, or Lp(a) lipopro- tein in any of the supernates. The triglyceride:cholesterol ratio in very-low- density lipoproteins from subjects with elevated C-HDL was close to the 5/l ratio reported by Friedewald26 in normal and hypercholesterolemic subjects.
Preliminary studies of the cholesterol, triglyceride, phospholipid, and protein content of HDL-2 and HDL-3 were carried out in four males and six females with hyper-alpha-lipoproteinemia, from kindred #6.27 The total plasma concen- tration of the entire HDL molecule was elevated due to an increase in HDL-2 only. There were individual increases in cholesterol, triglyceride, phospholipid, and total protein concentrations in HDL-2, while HDL-3 concentrations ap-
proximated those of normals. 27 The per cent composition for HDL-2 and HDL-3 for these ten subjects was similar to that reported for humans by Scanu et al.,2s with the consistent exception of an elevated per cent composition in HDL-2 for triglyceride of 7.2% in males and 12.6% in females. In preliminary studies in one subject with familial hyper-alpha-lipoproteinemia, polyacrylamide gel electrophoresis revealed comparable patterns to those of normals for HDL-2, but the R-Glutamine- band was missing in the HDL-3 fraction.

HYPER-ALPHA-LIPOPROTEINEMIA 1257
DISCUSSION
Major emphasis on familial hyperlipoproteinemias has been primarily con- centrated on familial and acquired hypercholesterolemia2 because of the close association of elevations of C-LDL with premature atherosclerosis and the fre- quency of the condition. A major phylogenetic step taken by humans involved redistribution of plasma cholesterol from alpha to beta lipoproteins.2g Non- primate animals generally have higher C-HDL than C-LDL, and humans re- semble these animal species only at birth, when C-HDL and C-LDL are nearly equivalent. 30 The current report focuses on a newly recognized hyperlipopro- teinemia characterized by familial aggregations of elevated C-HDL and ac- companied by extended longevity.
C-HDL may rarely be elevated by chlorinated hydrocarbons,4 estrogens,5 or ethanolic excess,6*7 and has been reported to be elevated in three subjects with mature-onset diabetes.8 Naito and Lewis3’ briefly mentioned a father and son who apparently had isolated elevations of C-HDL and were otherwise healthy. The 18 index cases in the current study had no evidence for secondary hyper- alpha-lipoproteinemia. 4~8 In four of 18 kindreds, there was three-generation vertical transmission of hyper-alpha-lipoproteinemia. In 16 of 18 kindreds, at least one other family member in addition to the index case had distinctive primary elevations of C-HDL. In these 16 kindreds, there were 84 offspring born to 22 matings of hyper-alpha by normal-alpha individuals; 37 had normal and 47 elevated C-HDL. The ratio of “affected to normal,” 37:47, was not sig- nificantly different from 1: 1 (x2 = 1.2) a ratio consistent with a rare autosomal dominant trait.
Despite this suggestion of a major gene effect, the distribution of C-HDL in these 84 offspring was not bimodal. Cumulative plots of C-HDL distribution for all male and female subjects in the 18 kindreds also failed to show bi- modality, and the parent-offspring correlation appeared to be near zero. This apparent paradox can be explained when we scrutinize the data more closely. In the first place, there are four kindreds in which individuals with hyper-alpha- lipoproteinemia have both parents in the normal range (kindreds 1, 5, 18, and 28); and in one of these (kindred 28), five of the six children have hyper-alpha- lipoproteinemia. By itself, however, this would not be sufficient to produce a zero correlation between parents and offspring. Nor can the fact that the 1:l segregation was determined without first correcting for age effects be impli- cated; we find a similar segregation after correcting for age, and the pooled parent-offspring correlation is still near zero if it is calculated from the data before correcting for age. Before age-correction, the brother-sister correlation is 0.02; all the other correlations are approximately the same before as after age- correction.
The important thing to note is that the finding of an overall 1:l segregation ratio in presumed heterozygote by homozygote matings (which has so often been interpreted in the past as evidence for a major gene) may be totally ir- relevant. If all the offspring in 11 of the matings listed in Table 2 had high val- ues for C-HDL, and all of the offspring in the remaining 11 matings had values in the normal range, the overall segregation could remain approximately l:l, although a genetic mechanism for such data would be unlikely; and this in it- self would lead to a zero parent-offspring correlation and a positive sibling cor-

1258 GLUECK ET AL.
relation. In other words, to implicate a major gene there should be a ho- mogeneous 1:1 segregation in all the critical sibships. The within-sibship analysis illustrated by Kwiterovich et al.24 is a test for such homogeneity, but it cannot be very powerful with the relatively small number of sibships which
are listed in Table 2. In actual fact, these 22 sibships are significantly hetero- geneous (p - .Ol) as determined by application of Pothoff and Whittinghill’s
(1966) more powerful V test3’ (x2.= 33.1, with 17.5 df). By this test we see that a Mendelian hereditary mechanism in these I8 kindreds is unlikely, and the
zero parent-offspring correlation indicates that any hereditary mechanism is unlikely. This does not, of course, preclude the possibility of a genetic mecha- nism for a rarer, more extreme form of hyper-alpha-lipoproteinemia, such as might be detected if a much higher cutoff were used to select the index cases.
In actual fact, using a cutoff of 74 and 77 mg/IOO ml for C-HDL, the 95th and 97.5th percentiles respectively, 17 and 14 of the 18 kindreds would have been identified with similar results.
Longevity analysis” revealed an elongation of life span for kindred members
of both sexes (Table 4). The evidence for prolonged longevity in the kindreds
was most significant when the appropriate control population data was ob-
tained from the 194991951 Life Tables (Table 4). Using much more conserva- tive estimates for longevity in the control population (the 1969 Life Tables), longevity was significantly extended in males and was of borderline significance
in females (Table 4). There appeared to be an apparent rarity in atherosclerotic events (Table 5).
The prolongation in life span and reduction in cardiac events is hypotheti-
cally explained by an absolute increase in C-HDL, a nonatherogenic lipoprotein cholesterol, and an increase in the C-HDL:C-LDL ratio. In affected kindred
members, total plasma cholesterol is slightly elevated, by virtue of markedly elevated C-HDL, with normal C-LDL, C-VLDL, and triglyceride.
It will be interesting to eventually compare longevity analysis in kindreds
with familial hyper-alpha-lipoproteinemia’0~33 and those with familial hypo-
beta-lipoproteinemia,‘” a rare heritable lipoprotein disorder characterized by a
reduction in C-LDL, maintenance of normal levels of C-HDL, and an increased C-HDL to C-LDL ratio.
Studies of the physical, chemical, electron-microscopic, tissue tibroblast, and kinetic properties of C-HDL in affected subjects remain to be performed. The apparent percentage increase in triglyceride in HDL-2 from subjects with hyper- alpha-lipoproteinemia27 will require further evaluation. The hypothesis that familial elevations of C-HDL are associated with longevity and may confer protection against atherosclerotic risk needs to be validated. Studies of addi- tional, larger, and perhaps more homogeneous kindreds with hyper-alpha- lipoproteinemia may, in the future, provide additional details necessary for better understanding of the transmission of this trait.
REFERENCES
1. Fredrickson DS, Gotto AM, Levy RI: JB, Fredrickson DS (eds): The Metabolic Basis
Familial lipoprotein deficiency, in Stanbury JB, of Inherited Disease (ed 3). New York, Mc-
Wyngaarden JB, Fredrickson DS (eds): The Graw-Hill, 1972, p 545-614
Metabolic Basis of Inherited Disease (ed 3). 3. Fredrickson DS: Inheritance of high
New York, McGraw-Hill, 1972. p 493-530 density lipoprotein deficiency (Tangier Disease).
2. Fredrickson DS, Levy RI: Familial hyper- J Clin Invest 43:228-236, 1964
lipoproteinemias, in Stanbury JB, Wyngaarden 4. Carlson LA, Kolomodin-Hedman B:

HYPER-ALPHA-LIPOPROTEINEMIA 1259
Hyper-alpha-lipoproteinemia in men exposed to chlorinated hydrocarbon pesticides. Acta Med Stand 19229-32.1972
5. Gustafson A, Svanborg A: Gonadal steroid effects on plasma lipoproteins and individual phospholipids. Endocrinology 35: 203-207, 1972
6. Johansson BG, Laurel1 CB: Disorders of serum alpha-lipoproteins after alcoholic intoxi- cation. Stand J Clin Lab Invest 23:231-233, 1969
7. Mishkel MA. Alcohol and alpha-lipo- protein cholesterol. Ann Int Med 81564-565, 1974
8. Wille LE, Aarseth S: Demonstration of hyper-alpha-lipoproteinemia in three diabetic patients. Clin Genet 4:281-285, 1973
9. Cottrill C, Glueck CJ, Leuba V, Millett F, Puppione D, Brown WV: Familial homozygous hypo-beta-lipoproteinemia. Metabolism 23:779- 79l,1974
10. Glueck CJ, Fallat RW, Millett F, Brown WV, Puppione D: Familial hyper-alpha-lipo- proteinemia. Clin Res 22:649-A, 1974
11. Bock RD, Kolakowski D: Further evi- dence of sex-linked major gene influence on human spatial visualizing ability. Am J Hum Genet 25: l-14, 1973
12. Frederickson DS, Levy RI, Lindgren FT: A comparison of heritable abnormal lipopro- tein patterns as defined by two different tech- niques. J Clin Invest 47:2446-2457, 1968
13. Lees RS, Hatch FT: Sharper separation of lipoprotein species by paper electrophoresis in albumin-containing buffer. J Lab Clin Med 61:518-528,1963
14. Burstein M, Samaille J: Sur un dosage rapide du cholesterol lie aux alpha et aux /I lipoproteines du serum. Clin Chim Acta 5609, 1960
15. Have1 RJ, Eder HA, Bragdon JH: Dis- tribution and chemical composition of ultra- centrifugally separated lipoproteins in human serum. J Clin Invest 34:1345-1353, 1955
16. Total cholesterol procedure N-24, in AutoAnalyzer Manual. Chauncey, Technicon Instruments, 1964
17. Kessler G, Lederer H: Fluorimetric measurement of triglycerides, in Skeggs LT Jr, (ed): Automation in Analytical Chemistry (Technicon Symposia, 1965). White Plains, Mediad, 1966, p 341
18. Lipid Research Clinics Program, Manual of Laboratory Operations (vol 1) Washington, D.C., U.S. Government Printing Office, 1974
19. Chiang CL: Introduction to Stochastic
Processes in Biostatistics. New York, Wiley, 1968, p 277-279
20. Vital statistics of the United States, 1969 (vol 12). Rockville, U.S. Dept. of Health, Edu- cation, and Welfare, 1974
21. Life Tables for 1949-51 (vol 41). U.S. Dept. of Health, Education, and Welfare, Pub- lic Health Service, National Office of Vital Statistics, #l, 1954
22. Snedecor GR, Cochran WG: Statistical Methods (ed 6). Ames, Iowa State College Press, 1967, p 135-198
23. Holland M, Wolfe DA: Nonparametric Statistical Methods. New York, Wiley, 1973, p 219-227
24. Kwiterovich PO Jr, Fredrickson DS, Levy RI: Familial hypercholesterolemia (one form of familial type 11 hyperlipoproteinemia): A study of its biochemical, genetic, and clin- ical presentation in childhood. J Clin Invest 53:1237-1249, 1974
25. Moriyama IM, Gustavus SO: Cohort mortality and survivorship: United States death-registration states, 1900-1968. Vital health statistics, Series #3, #l6. National Center for Health Statistics, U.S. Dept. Health, Educa- tion, and Welfare publication (HSM)#73-1400
26. Friedewald WT, Levy RI, Fredrickson DS: Estimation of the concentration of low density lipoprotein cholesterol in plasma with- out use of the preparative ultracentrifuge. Clin Chem 18:499-502, 1972
27. Mendoza S, Lutmer R, Chen CY, Kash- yap M, Glueck CJ: HDL-2 and HDL-3 in familial hyper-alpha-lipoproteinemia. Circ Suppl 1975 (in press)
28. Scanu AM, Edelstein C, Vitello L, Jones R, Wissler R. The serum high density lipo- proteins of Macacus rhesus. J Biol Chem 218: 7648-7652, 1973
29. Brunner D, Menelis G, Altman S: Physi- cal activity, lipoproteins, and ischemic heart disease. Pathol Microbial 30648-652, 1967
30. Tsang RC, Fallat RW, Glueck CJ: Cho- lesterol at birth and age I, comparison of nor- mal and hypercholesterolemic neonates. Pedi- atrics 53:458-470, 1974
31. Naito HK, Lewis LA: Recognizing un- usual serum lipoprotein electrophoretic pat- terns. Clin Chem 196441973
32. Pothoff RF, Whittinghill W: Testing for homogeneity. 1. The binomial and multinomial distributions. Biometrika 53:167-182, 1966
33. Glueck CJ, Fallat RW, Millett F, Steiner PM: Familial hyper-alpha-lipoproteinemia (studies in 1 kindred). Arch Intern Med 1975 (in press)

1260
Kindred #
GCUECK ET AL.
APPENDIX
Kindred Chart: Hyper-alpha-lipoproteinemia
Kindred CCWE Position Age/Sex CHOL VLDL HDL LDL TG of Death
Kindred #l
l-1
l-2
II-1
II-2
Ill-1
Ill-2
Ill-3
Ill-4
IV-1
Kindred #3
l-l
l-2
l-3
l-4
l-5
l-6
l-7
11-l
II-2
II-3
II-4
Kindred #!i
I-1
l-2
II-1
II-2
II-3
II-4
II-5
Ill-1
Ill-2
Ill-3
Ill-4
Ill-5
Kindred #6 I-1
l-2
II-1
II-2
II-3
II-4
II-5
94 F
80 M
65 F
65 M
32 M
34 F
36 F
32 F
1.5 F
205 18 69 118 - - - -
206 32 41 133
143 14 53 76
170 3 133 34
165 11 62 92
141 9 57 75
200 16 52 133
117 8 78 32
92 - + ?Couse
160
70
53
57
43
80
48
70 F
64F
62 F
58 M
56 M
56 M
57 F
30 F
27 M
24 F
19 F
-
-
-
-
-
162
205
-
-
-
-
-
5
17
-
-
-
85
61
- -
- -
- - + co - - + Ca - - + co 72 51
127 85
- - - -
188 15 53 120
165 10 45 110
181 12 62 107
-
60
82
56
65 F 281 36 53 192 179
66M 250 38 54 158 208
28 F
28 M
35 F
30 F
34 M
9M
4F
7M
5M
4M
190
178
169
162
284
11
7
9
5
17
5
4
15 11
7
30
35
15
20
20
20 19
91 88 55
41 130 40
65 95 46
86 71 26
65 202 96
118
153
252
218
208
63 50 23
76 73 22
110 127 75
100 107 57
106 95 38
71 F
76 M
33 F
37 M
40 F
42 F
48 M
211
242 73 108 156
38 169 176
220
187
214
226 194
81 124 84
54 113 106
85 109 126
75 131 99
36 139 93
+ = death at indicated age;& = cancer.

HYPER-ALPHA-LIPOPROTEINEMIA 1261
Kindred #
Kindred
Position Age/Sex CHOL VLDL HDL LDL TG CCWW
of Death
II-6 II-7 II-8 II-9 II-10
Ill-1 Ill-2 Ill-3 Ill-4 Ill-5 Ill-6 Ill-7 III-8 Ill-9 111-10 Ill-1 1 Ill-12 Ill-13 Ill-14 Ill-15 Ill-16 Ill-17 Ill-18 Ill-19
46F 35 M 43 M 49 M 47 M
10 F 9M 6F
16 F 15 M 12 M 10 M 8F
17 M 15 F 13 F 12 F 8M
22 F 21 M 19 M 17 F 13 M 11 M
Kindred #10 l-l l-2
II-1 II-2 II-3 II-4
65 F 61 M
17 F 23 M 37 M 40F
Ill-l 13 M Ill-2 PM Ill-3 2.5 F
Kindred #12 I-1 l-2
II-1 II-2 II-3 II-4 II-5
Ill-l Ill-2 Ill-3 Ill-4 Ill-5
47 M 70 F
30 F 51 M 38 M 47 F 45M
19 M 181 12 51 118 62 18 F 156 12 51 93 60 16 F 174 10 72 92 52 15 F 154 9 57 88 46 13 F 143 8 58 77 42
173 16 104 53 54 190 14 38 138 71 189 12 51 126 62 201 16 43 142 79 308 20 48 240 98
186 11 97 78 57 181 15 76 90 76 153 8 64 81 38 138 18 64 56 90 194 15 73 106 76 193 10 76 107 50 214 13 70 131 63 164 5 80 79 27 149 4 66 79 19 144 9 66 69 44 186 15 69 104 74 195 14 76 105 68 142 7 73 62 36 306 12 57 237 60 275 15 57 203 76 142 16 48 78 82 195 17 65 113 84 280 10 47 223 50 290 8 48 234 41
- -
- -
- -
- -
- - - -
232 4 102 15
137 8 180 8 144 11
- - - -
74 154 29 58
57 72 70 102 53 80
- - + ccl
- -
56 78
39 41 56
-
190
-
18
-
64
-
108
- + Co 88
194 20 52 122 I10 208 15 64 129 75 235 12 71 152 58 232 17 78 137 104 203 18 57 128 92
+ = death at indicated age; Co = cancer.

1262
Kindred # Kindred Position
GCUECK ET AL.
CoUSe Age/k CHOL VLDL HDL LDL TG of Death
Kindred #13
I-1
l-2
l-3
l-4
II-1
II-2
II-3
II-4
II-5
II-6
Kindred A(14
l-l
l-2
II-1
II-2
II-3 l
Ill-1
Ill-2
Ill-3
III-4
Ill-5
Ill-6
Kindred #lS
I-1
l-2
II-1
II-2
II-3
II-4
II-5
II-6
II-7
II-8
II-9
II-10
II-1 1
Ill-1
Ill-2
Ill-3
Ill-4
Ill-5
Ill-6
Ill-7
Ill-8
58 M 272 20
47 F - -
43 F - -
51 F 214 19
23 F 184 8
22 F 180 15
20 M - -
19 F 194 8
16 M 190 11
13 F - -
64F
59 M
39 M
37 M
37 F
15 F
13 F
12 M
11 F
9M
6M
301 -
20 -
166 7 85 74
253 16 75 162
211 11 W/56* 110
- - - -
161 8 43 110
173 6 48 119
181 19 35 127
166 10 70 86
134 45 56 33
70 F
42 M
40 F
48F
42 F
45 M
24 M
37 M
39 M
46 M
48 M
39 F
47 F
12 F
17 F
15 M
14 F
13 F
11 M
10 M
0M
247 -
201
206 -
173 -
19 -
14
24 -
23 -
-
183
262 -
-
26
97 -
- -
- -
160 16 63 81 78
110 6 44 60 30
110 8 53 49 38
162 7 64 91 35
125 6 72 47 30
151 9 64 78 44
145 8 68 69 42
143 7 64 72 35
74 -
-
69
76
53 -
86
51
-
178
126
100
112 -
100
128
-
80 -
200 -
57 -
87
52 -
33 -
171 -
100
130 -
117 -
- -
33 124
38 127 - -
- -
- -
93 -
-
94
42
76 -
50
55
-
82 - + CVA
36
115
54
-
40
32
94
50
226
96 - + HBP
89
120 -
114 - + Trauma -
128
484 -
-
-
+ = death at indicated age; Co = cancer; CVA = cerebrovascular accident; HBP = high blood pressure.
l C-HDL 90 with subiect taking oral contraceptives. When oral contraceptives discontinued, C-HDC
fell to 55 mg/lOO ml.
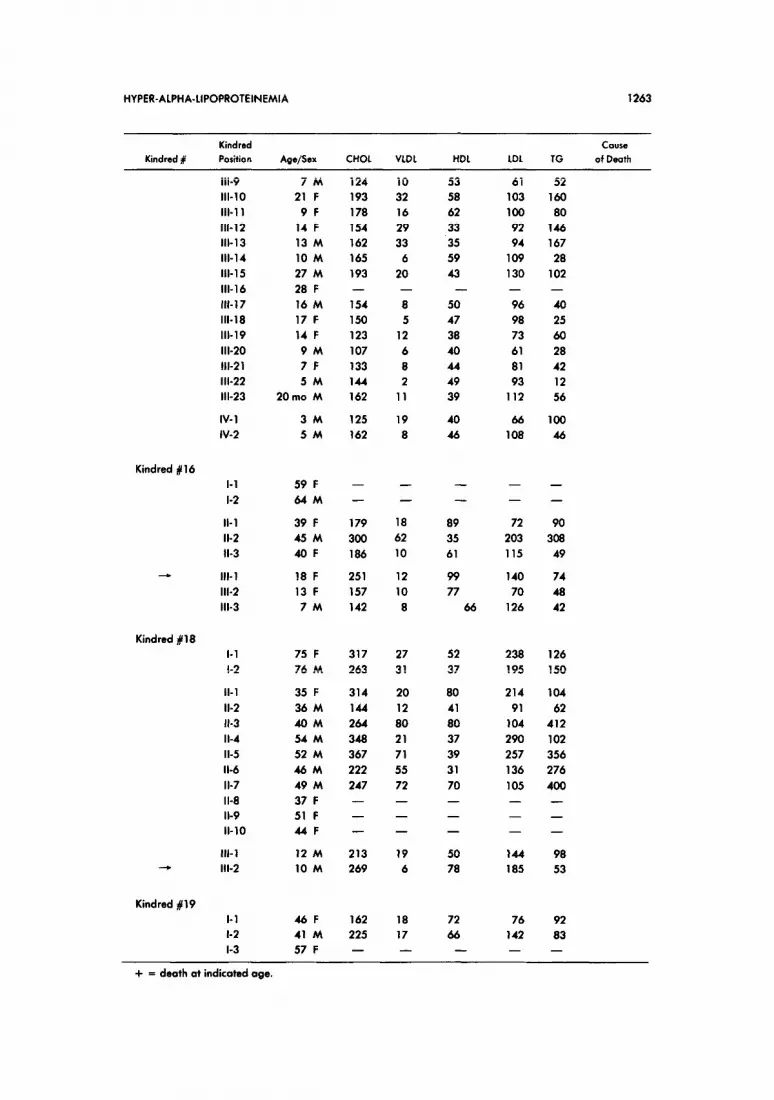
HYPER-ALPHA-LIPOPROTEINEMIA 1263
Kindred # Kindred Cause Position Age/Sex CHOL VLDL HDL LDL TG of Death
Ill-9 7M 111-10 21 F Ill-l 1 9F Ill-12 14 F Ill-13 13 M Ill-14 10 M Ill-15 27 M III-16 28 F 111-17 16 M Ill-18 17 F Ill-19 14 F Ill-20 9M Ill-21 7F Ill-22 5M Ill-23 20mo M
IV- 1 3M IV-2 5M
124 10 53 61 193 32 58 103 178 16 62 100 154 29 33 92 162 33 35 94 165 6 59 109 193 20 43 130 - - - -
154 8 50 96 150 5 47 98 123 12 38 73 107 6 40 61 133 8 44 81 144 2 49 93 162 11 39 112
125 19 40 66 162 8 46 108
52 160 80
146 167 28
102 -
40 25 60 28 42 12 56
100 46
Kindred #16 I-1 l-2
59 F 64M
39 F 45 M 40F
18 F 13 F 7M
- -
- -
- -
- -
- -
II-1 II-2 II-3
Ill-l Ill-2 Ill-3
179 18 89 72 90 300 62 35 203 308 186 10 61 115 49
251 12 99 140 74 157 10 77 70 48 142 8 66 126 42
Kindred #18 l-l l-2
II-1 II-2 II-3 II-4 II-5 II-6 II-7 II-8 II-9 II-10
75 F 317 27 52 238 76 M 263 31 37 195
35 F 314 20 80 214 36 M 144 12 41 91 40M 264 80 80 104 54 M 348 21 37 290 52 M 367 71 39 257 46M 222 55 31 136 49 M 247 72 70 105 37 F - - - -
51 F - - - -
44F - - - -
126 150
104 62
412 102 356 276 400 - - -
Ill-1 12 M 213 19 50 144 98 --W Ill-2 10 M 269 6 78 185 53
Kindred 119 I-1 l-2 l-3
46F 162 18 72 76 41 M 225 17 66 142 57 F - - - -
92 83 -
+ = death at indicated age.

1264 GLUECK ET AL.
Kindred #
Kindred
Position Age/Sex CHOL VLDL HDL LDL TG
CWW
of Death
Kindred 820
Kindred #21
Kindred #22
Kindred #23
II-1 16 F 161 10 77 74 64 II-2 19 F 148 6 77 65 32
I-1
l-2
60F
65 M
II-1 23 M
II-2 37 M
II-3 35 F
II-4 46F
II-5 40 F
II-6 33 F
II-7 30 F
II-8 44F
II-9 36 M
-
49
48
51
90 -
Ill-l
Ill-2
Ill-3
13 F
12 M
10 F
- -
222 20
203 14
203 18
183 8
260 -
204 -
212 11
205 12
227 9
240 24
172 9
151 8
201 10
101
71
87
57
86
69
74
- - + co
153 104
141 68
134 80
85 39 - 54 - 79
100 57
122 58
131 44
159 121
77 46
74 38
117 51
I-1
l-2
II-1
II-2
II-3
II-4
Ill-l
Ill-2
Ill-3
Ill-4
Ill-5
Ill-6
62 F
68M
37 F
35 F
38 F
37 M
2M
8F
PM
14 F
17 F
11 F
- - - -
- - - -
- - - -
- - - -
211 12 79 120
219 15 59 145
108 28 48 32
229 12 74 143
153 12 65 76
124 11 59 74
195 13 64 118
238 11 91 136
-
-
-
59
76
138
59
58
54
63
39
I-1
l-2
II-1
II-2
II-3
Ill-l
Ill-2
Ill-3
I-1
l-2
II-1
II-2
67 F
68 M
37 M
37 F
35 M
9M
12 F
19 F
-
-
-
-
-
-
-
77 -
49
59
59
44
79
-
-
-
-
- -
176 15 - -
170 8.4
178 14
197 20
-
84 -
113
105
118
- + Stroke - + Ml
-
60 -
42
70
102
69 M 113
68 F 240
33 F
38 M
-
-
-
-
-
-
-
-
-
-
68
84
-
-
+ = death at indicated oge;Ca = concer;MI = myocardiolinfarcfion.

HYPER-ALPHA-LIPOPROTEINEMIA 1265
Kindred # Kindred Position Age/Sex CHOL VLDL HDL LDL TG
Cause of Death
II-3 40F 241
II-4 40M 278
ill-1 12 M 193
III-2 14 M 211
Ill-3 15 M 177
Ill-4 17 M 226
Ill-5 9M 238
Ill-6 10 F 153
Ill-7 15 F 232
Kindred #27
I-1
l-2
II-1
II-2
II-3
II-4 Ill-l
Ill-2
Ill-3
Kindred #28
I-1
l-2
II-1 18 M 134 15.2 73 46 76 II-2 15 M 128 16 68 44 82 II-3 16 F 150 15 85 50 76 II-4 13 F 141 17 76 48 83 II-5 8F 123 15 72 36 75 II-6 5M 154 14 70 70 68
75 F
72 M
35 F
43 M
33 F
35 M
9F 11 F
8F
43 F 188 16 21 151 80
45 M 193 31 51 111 154
271
163
225
218 -
157
230 189 -
4 80
34 48
13 56
11 58
8 54
18 63
15 82
12 51
12 70
13 75
16 56
9 73
20 50 - -
20 41
9 85 17 58 - -
157
196
134
142
115
145
141
90
150
183
91
143
145 -
96
136 114 -
64
168
64
55
40
88
44
58
60
66
78
46
116 -
102
69
83 -
+ = death at indicated age