extraction and characterisation of pectin from the peel - de
TRANSCRIPT
Research Article
Isobel Lerato Gosh Lekhuleni, Tsietsie Ephraim Kgatla, Mpho Edward Mashau*,Afam Israel Obiefuna Jideani
Physicochemical properties of South Africanprickly pear fruit and peel: Extraction andcharacterisation of pectin from the peel
https://doi.org/10.1515/opag-2021-0216received October 14, 2020; accepted January 15, 2021
Abstract: The aim of this study was to determine thephysicochemical properties, extract and characterisepectin from green (Morado), purple (Algerian), and orange(Gymno carpo) varieties of South African prickly pear (PP)(Opuntia ficus-indica) fruit peel. Pectin was extractedusing sulphuric acid at four different pH levels (1, 2, 3,and 4) and three different microwave power levels (low300W, medium 400W, and high 500W) at a fixed time of10 min. Yield of pectin for purple ranged from 2.9 to13.8%, orange from 1.4 to 9.8%, and from 2.3 to 10.0%for green prickly pear peel (PPP). Maximum yield of13.8% on purple, 10.0% on green, and 9.8% on orangewas obtained at pH 1.0 and medium power level. Ashcontent of the extracted pectin was significantly high at25.16, 34.26, and 36.30% for green, orange and purplePPP, respectively. However, pectin showed lower moisturecontent and equivalent weight. The methoxyl contentswere 2.28, 2.38, and 3.86%, for anhydrouronic acid con-tents were 25.58, 25.93, and 38.84%, and degree of ester-ification was 49.87, 50.63, and 56.39% across the orange,purple, and green varieties. The PPP pectin spectra exhib-ited similarities in their absorption pattern to that of com-mercial citrus pectin.
Keywords: prickly pear, pectin, extraction, yield, func-tional group
1 Introduction
Fruits processing industries generate solid wastes such aspeel, core, unripe, and over-ripe fruits, as high as 50% ofraw materials (Virk and Sogi 2004). These solid wastesare cheap sources of raw materials for animal feed; more-over, the peel also contains high amounts of pectin.Therefore, the utilisation of prickly pear peels (PPP)will be beneficial in both decreasing the amount of solidwastes and adding the value of agricultural by-products(Padam et al. 2014). Prickly pear (PP) (Opuntia spp.)belongs to the family of Cactaceae. PP cultivars cangrow in harsh, rocky, and dry environmental conditions.It has gained the attention of consumers because of its highnutritional value that has a positive health benefit (López-Palacios et al. 2012). PP fruit is oval shaped with thick,waxy, and thorny peel and is available in different col-ours ranging from green, yellow, purple, red, and orange(Gengatharan et al. 2015; Khatabi et al. 2016). It has a highand unique composition of nutrients including B-familyvitamins, magnesium, calcium, potassium, copper, dietaryfibre, flavonoids, carotenoids, betalain, amino acids, andlipids (Panda et al. 2016). The fruit has a high level of sugarand low acidity which gives it the sweet acidic taste and hasa short shelf life of approximately 2–4 weeks (Yahia 2012).PP fruit components and extracts are being used in thetreatment of diabetes, cholesterol, and immune systemhealth (Ncibi et al. 2008; Patel 2015). The pulp and seedsare themost edible parts of the PP fruit that constitute about40–60% of the fruit (Ncibi et al. 2008). During the produc-tion of pulp, wine, and juice, the PP fruit peel is regarded asa by-product. However, the peel contains high antioxidantsand pectin that can be used as an alternative source ofpectin in the production of jam (Chan and Choo 2013).
Pectin is a linear polysaccharide which is madeup of 1,4 linked α-D-galacturonic acid (Hosseini et al.2016). Pectin is naturally present in fruits and is foundbetween adjacent plant cells in the layers of middle
Isobel Lerato Gosh Lekhuleni, Tsietsie Ephraim Kgatla, Afam IsraelObiefuna Jideani: Department of Food Science and Technology,School of Agriculture, University of Venda, Private Bag X5050,Thohoyandou, Limpopo Province, 0950, South Africa
* Corresponding author: Mpho Edward Mashau, Department of FoodScience and Technology, School of Agriculture, University of Venda,Private Bag X5050, Thohoyandou, Limpopo Province, 0950,South Africa, e-mail: [email protected]
Open Agriculture 2021; 6: 178–191
Open Access. © 2021 Isobel Lerato Gosh Lekhuleni et al., published by De Gruyter. This work is licensed under the Creative CommonsAttribution 4.0 International License.
lamella (Lefsih et al. 2016). The functional properties ofpectin depend on the degree of esterification (DE), andthese are characterised as low methoxyl pectin with DE<50% and high methoxyl pectin with DE >50% (Jafariet al. 2016). Low and high methoxyl pectin have differentDE and therefore different physicochemical properties andapplication (Ngouémazong et al. 2012). The important pro-cess in pectin production is extraction which is usuallyachieved by hot acid extraction (Guo et al. 2012). Pectin isextracted from fruit peel which is acidified with organic ormineral acids such as sulphuric, nitric, and hydrochloricacids, which are the commonly used extractants (Oliveiraet al. 2016; Pereira et al. 2016).
Pectin is mainly used as a stabiliser, emulsifier, tex-turiser, and thickener in the production of jams, jellies, con-fectionery products, beverages, and acidified milk drinks(Petkowics et al. 2017). Theyield andquality of pectindependmainly on the source as well as the method used for theextraction of pectin. In recent years, substantial researchefforts have been conducted to search for high-quality pectinfrom peels of plant materials, such as peels of passion fruit,pomelo, and mango, to be used as a substitute for commer-cial pectin (deOliveira et al. 2016). However, the utilisation ofpectin from these sources remains limited in food industry.Indigenous fruits and their by-products have the potential tobeused in commercial pectinproduction, especially indevel-oping countries.
Extraction and characterisation of pectin have beenstudied for many plant materials. However, extraction ofpectin using conventional methods at acidic pH and hightemperature beyond 80°C decreases the quality of pectinextracted (Pagan et al. 2001). Therefore, there is a needfor researchers to use other extraction methods such asmicrowave to prevent low quality pectin. When com-pared to conventional extraction techniques, microwaveis reliable because it decreases the consumption ofenergy and solvent as well as reducing extraction time(Wang et al. 2007). The objective of this study was todetermine the physicochemical properties of PP fruit,extraction of pectin from the peel, and to determine itsyield, physicochemical, and structural properties.
2 Materials and methods
2.1 Raw materials
Fresh PP fruits of green (Morado), purple (Algerian), andorange (Gymno carpo) were harvested from BothlokwaMphakane village in Limpopo province, South Africa.All the selected fruits were at physiological maturity
stage and were assessed by the external colour index.All fruits were cleaned with tap water and stored in acold room for 10 days at 5°C for further processing.
2.2 Prickly pear peel (PPP) powderpreparation
PP fruits were thoroughly cleaned with distilled waterand peeled with knife to separate the peels from thepulp. The peels were then sliced (1–2 cm thickness) andplaced on trays divided into three batches according tothe variety. The three batches of PP peels were immedi-ately dried using oven (EcoTherm 278 Digital oven, SouthAfrica) at 60°C for 72 h. After drying, the samples werecooled in a desiccator, milled using a milling machine(Polymix PX-MFC 90 D, Kinematic AG, Switzerland),and sieved through a 500 µm sized aperture sieve, andthe powder was stored in polyethylene bags in a desic-cator until further analysis (Castillo-Israel et al. 2015).
2.3 Extraction process of pectin from PPP
Extraction was carried out using sulphuric acid. Sampleof 5 g of PP peel powder and 150mL of distilled water wasadded into a 500mL glass beaker, and 0.5 N sulphuricacid was added to adjust the pH levels of 1, 2, 3, and 4.The solution was placed and heated in a microwave for10min at low (300W), medium (400W), and high power(500W) levels. The solution was then cooled and centri-fuged (Universal 320 R, Herttich, Germany) at 3,000 rpmfor 15 min. Ethanol (95%) was added to the supernatant ata ratio of 1:2 (v/v) and was allowed to cool at 4°C for 2 h. Toseparate the coagulated pectin, the sample was filteredand washed with an equal amount of 95% ethanol. Thewet pectin was dried in an oven at 35°C for 24 h. Afterdrying, the pectin was weighed using weighing balanceBOECO Germany BPS 51, and the percentage yield wascalculated using equation (1) (Altaf et al. 2015):
PPectin yield %Bi
100,( ) = × (1)
where P is the amount (g) of the pectin extracted and Bi isthe initial amount of PP dry peel (5 g).
2.4 Physical properties of PP fruits
The length, width of the fruit, and peel thickness weremeasured using a digital Vernier calliper (Zarei et al.2011). The weight was measured using a weighing bal-ance BOECO Germany BPS 51 plus.
Extraction and characterisation of pectin from the peel 179
2.5 Texture analysis of PP fruits
The hardness of PP fruits was measured using TextureAnalyser (model TA.XT.Plus, from Stable Micro Systems,UK) with mode of measure force in compression usingP/75 probe. The determination parameters were pre-testspeed = 1.0 mm/s, test speed = 0.02 mm/s, post-testspeed = 10.0 mm/s, target mode = distance = 16 mm,and trigger type = 100 g (force). Hardness was expressedin Newtons (N).
2.6 Colour analysis of PPP
Colour parameters were measured using the colorimeter(HunterLab ColorFlex, USA) (L*, a*, b*) system. Theinstrument was calibrated with a standard white andblack plate. The parameter L* represents the brightness,a* represents redness (+) and greenness (−), and b*represents yellowness (+) and blueness (−). Three mea-surements were made on the surface of fresh prickly pearpeel (PPP) and dried PPP powder. From the colour values,Chroma (C), hue angle (H°), and total colour change (ΔE)were calculated using equations (2–4) (Maskan 2001):
a bChroma ,2 2= ( ) + ( ) (2)
ba
Hue angle tan ,1= − (3)
E L a bΔ Δ Δ Δ ,2 2 2= ( ) + ( ) + ( ) (4)
where ΔL, Δa, and Δb are the differences between freshand dried values.
2.7 pH value of PP fruits
The pH of fruit pulp was determined using a digital pHmeter (Crison Basic 20) following AOAC (2002) standardprocedure.
2.8 Total soluble solids of PP fruits
A digital refractometer (Atago SMART-1, Japan) was usedto measure the total soluble solids (TSS), and the resultswere directly recorded following AOAC (2002) standardprocedure. A drop of the fruit pulp was placed on therefractometer prism, and results expressed as °Brix andreadings were recorded.
2.9 Titratable acidity of PP fruits
Titratable acid (TA), as % citric acid, was determinedusing the direct titration method; 20mL of fruit pulpwas placed in a 100mL conical flask and three drops ofphenolphthalein indicator was added. Thereafter, thesample was titrated with 0.1 N NaOH to an endpointwhere the colour changed to pink and the volume ofNaOH used was recorded. TA was calculated using equa-tion (5):
% Citric acidmL of NaOH 0.1N NaOH 0.064 100
mL of sample.=
( )( )( )( ) (5)
2.10 Characterisation of PPP pectin
2.10.1 Moisture content
Moisture content was determined following the AOAC(2002) standard procedure. A dried clean metal dishwas weighed, and 2 g of pectin sample was placedon the dish. The sample was dried in an oven at105°C for overnight and cooled in a desiccator andweighed. The moisture content was determined usingequation (6):
Moisture content % weight of dried sampleweight of pectin
100.
( ) =
×
(6)
2.10.2 Ash content
Approximately 2 g of pectin sample was weighed, placedinto tared crucibles and in a muffle furnace (Lasec modelEMF 035) for 4 h at 550°C, cooled in a desiccator, andweighed. The ash content was determined according toAOAC (2002) by applying equation (7):
Ash content % weight of ashweight of pectin
100.( ) = × (7)
2.10.3 Equivalent weight
Pectin sample of 0.5 g was taken into a 250mL conicalflask, and 5mL of ethanol (95%) was added. Approxi-mately 1 g of NaCl and 100mL of distilled water wereadded, and finally six drops of phenol red indicator
180 Isobel Lerato Gosh Lekhuleni et al.
were added against 0.1 N NaOH. Titration point was indi-cated by purple colour. The neutralised solution wasstored for further determination of methoxyl content.The equivalent weight was calculated by applying equa-tion (8) (Ranganna 1995):
Equivalent weight EWweight of sample g
mL of alkali N of alkali100.
( )
=( )
××
(8)
2.10.4 Methoxyl content
A solution of 25 mL of 0.25 N NaOH was added to theneutralised solution from the equivalent weight titration,and the solution was stirred and kept for 30min at roomtemperature in a flask with a stopper. A solution of 25 mLof 0.25 N HCl was added and titrated with 0.1 N NaOHuntil the colour changed to purple (pH: 7.5). The meth-oxyl content was calculated using equation (9) (López-Palacios et al. 2012):
Methoxyl content %mL alkali N alkali 3.1
weight of sample.
( )
=× ×
(9)
2.10.5 Total anhydrouronic acid
Estimating the content of anhydrouronic acid (AUA) iscrucial for determining the purity, degree of esterification(DE), and the physical characteristics of the extractedpectin. AUA was calculated by making use of theequivalent weight and methoxyl content using equa-tion (10) (Mohamed and Hasan 1995):
zw
yw
AUA % 176 0.1 1001, 000
176 0.1 1001, 000
,( ) =× ×
×+
× ×
×(10)
where z = mL of NaOH from equivalent weight, y = mL ofNaOH from methoxyl content, and w = sample weight (g).
2.10.6 Degree of esterification
The pectin DE was determined according to equation (11)(Shaha et al. 2013):
DE 176 MeC %31 AUA %
100,=× ( )
× ( )× (11)
where %MeC = methoxyl content and %AUA = anhydro-uronic acid content.
2.11 Structural analysis of PPP pectin usingFourier transform infrared (FTIR)spectra
The Fourier transform infrared (FTIR) spectrum wasused to acquire information on chemical structure ofthe extracted and commercial pectin. The pectin powderwas encapsulated in KBr at 1:100 ratio. FTIR data wereobtained using Spectrum 65 FT-IR (Bruker) in the range400–4,000 cm−1, scanning rate at 32 at resolution rate4 cm−1 (Dehbi et al. 2014).
2.12 Statistical analysis
The experimental data for this study were captured inMicrosoft excel, and all analyses were done in triplicate.The data obtained were analysed and interpreted by one-way analysis of variance using SPSS Statistics version 25.Values were expressed in mean standard deviation, andthe significance level was set at p < 0.05.
Ethical approval: The conducted research is not related toeither human or animal use.
3 Results and discussion
3.1 Physicochemical properties of PP fruitand peel
The physicochemical properties of PP fruit are presentedin Table 1. Fruit size is the ratio of weight, length, andwidth. Dehbi et al. (2014) reported that the fruit size isaffected by the seed content and weight. The average PPfruit size varied from 153.58 to 222.58 g. The orange PPfruit had significantly (p < 0.05) larger size compared tothat of purple and green PP; however, the orange PP hadthe lowest pectin yield. The fruit size differed significantlyamong varieties. There are many PP varieties, which areidentified through size, shape, and colour. These resultsare in line with the study by Dehbi et al. (2014) whopointed out that size, weight, and length of PP fruitsdiffer significantly among cultivars and genetic constitu-tion. For this reason, it is necessary to correlate PP sizewith the yield of pectin. Moreover, PP variety with largerfruit size had lower pectin yield, whereas variety with
Extraction and characterisation of pectin from the peel 181
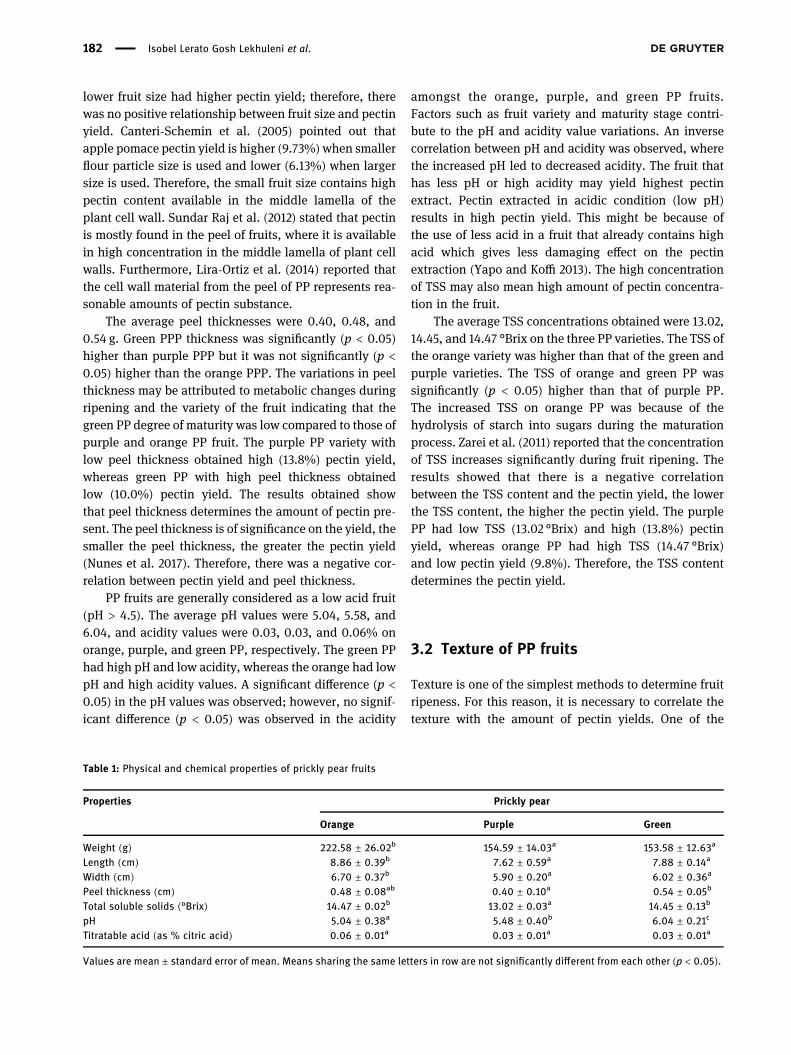
lower fruit size had higher pectin yield; therefore, therewas no positive relationship between fruit size and pectinyield. Canteri-Schemin et al. (2005) pointed out thatapple pomace pectin yield is higher (9.73%)when smallerflour particle size is used and lower (6.13%) when largersize is used. Therefore, the small fruit size contains highpectin content available in the middle lamella of theplant cell wall. Sundar Raj et al. (2012) stated that pectinis mostly found in the peel of fruits, where it is availablein high concentration in the middle lamella of plant cellwalls. Furthermore, Lira-Ortiz et al. (2014) reported thatthe cell wall material from the peel of PP represents rea-sonable amounts of pectin substance.
The average peel thicknesses were 0.40, 0.48, and0.54 g. Green PPP thickness was significantly (p < 0.05)higher than purple PPP but it was not significantly (p <0.05) higher than the orange PPP. The variations in peelthickness may be attributed to metabolic changes duringripening and the variety of the fruit indicating that thegreen PP degree of maturity was low compared to those ofpurple and orange PP fruit. The purple PP variety withlow peel thickness obtained high (13.8%) pectin yield,whereas green PP with high peel thickness obtainedlow (10.0%) pectin yield. The results obtained showthat peel thickness determines the amount of pectin pre-sent. The peel thickness is of significance on the yield, thesmaller the peel thickness, the greater the pectin yield(Nunes et al. 2017). Therefore, there was a negative cor-relation between pectin yield and peel thickness.
PP fruits are generally considered as a low acid fruit(pH > 4.5). The average pH values were 5.04, 5.58, and6.04, and acidity values were 0.03, 0.03, and 0.06% onorange, purple, and green PP, respectively. The green PPhad high pH and low acidity, whereas the orange had lowpH and high acidity values. A significant difference (p <0.05) in the pH values was observed; however, no signif-icant difference (p < 0.05) was observed in the acidity
amongst the orange, purple, and green PP fruits.Factors such as fruit variety and maturity stage contri-bute to the pH and acidity value variations. An inversecorrelation between pH and acidity was observed, wherethe increased pH led to decreased acidity. The fruit thathas less pH or high acidity may yield highest pectinextract. Pectin extracted in acidic condition (low pH)results in high pectin yield. This might be because ofthe use of less acid in a fruit that already contains highacid which gives less damaging effect on the pectinextraction (Yapo and Koffi 2013). The high concentrationof TSS may also mean high amount of pectin concentra-tion in the fruit.
The average TSS concentrations obtained were 13.02,14.45, and 14.47 °Brix on the three PP varieties. The TSS ofthe orange variety was higher than that of the green andpurple varieties. The TSS of orange and green PP wassignificantly (p < 0.05) higher than that of purple PP.The increased TSS on orange PP was because of thehydrolysis of starch into sugars during the maturationprocess. Zarei et al. (2011) reported that the concentrationof TSS increases significantly during fruit ripening. Theresults showed that there is a negative correlationbetween the TSS content and the pectin yield, the lowerthe TSS content, the higher the pectin yield. The purplePP had low TSS (13.02 °Brix) and high (13.8%) pectinyield, whereas orange PP had high TSS (14.47 °Brix)and low pectin yield (9.8%). Therefore, the TSS contentdetermines the pectin yield.
3.2 Texture of PP fruits
Texture is one of the simplest methods to determine fruitripeness. For this reason, it is necessary to correlate thetexture with the amount of pectin yields. One of the
Table 1: Physical and chemical properties of prickly pear fruits
Properties Prickly pear
Orange Purple Green
Weight (g) 222.58 ± 26.02b 154.59 ± 14.03a 153.58 ± 12.63a
Length (cm) 8.86 ± 0.39b 7.62 ± 0.59a 7.88 ± 0.14a
Width (cm) 6.70 ± 0.37b 5.90 ± 0.20a 6.02 ± 0.36a
Peel thickness (cm) 0.48 ± 0.08ab 0.40 ± 0.10a 0.54 ± 0.05b
Total soluble solids (°Brix) 14.47 ± 0.02b 13.02 ± 0.03a 14.45 ± 0.13b
pH 5.04 ± 0.38a 5.48 ± 0.40b 6.04 ± 0.21c
Titratable acid (as % citric acid) 0.06 ± 0.01a 0.03 ± 0.01a 0.03 ± 0.01a
Values are mean ± standard error of mean. Means sharing the same letters in row are not significantly different from each other (p < 0.05).
182 Isobel Lerato Gosh Lekhuleni et al.
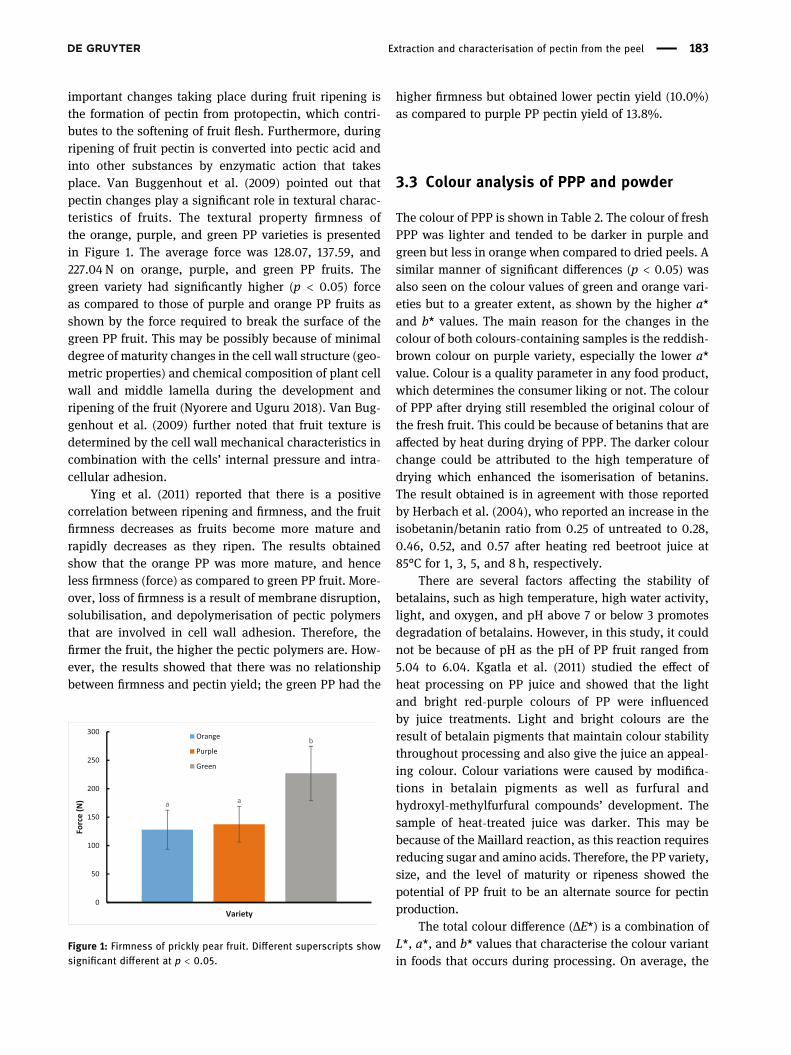
important changes taking place during fruit ripening isthe formation of pectin from protopectin, which contri-butes to the softening of fruit flesh. Furthermore, duringripening of fruit pectin is converted into pectic acid andinto other substances by enzymatic action that takesplace. Van Buggenhout et al. (2009) pointed out thatpectin changes play a significant role in textural charac-teristics of fruits. The textural property firmness ofthe orange, purple, and green PP varieties is presentedin Figure 1. The average force was 128.07, 137.59, and227.04 N on orange, purple, and green PP fruits. Thegreen variety had significantly higher (p < 0.05) forceas compared to those of purple and orange PP fruits asshown by the force required to break the surface of thegreen PP fruit. This may be possibly because of minimaldegree of maturity changes in the cell wall structure (geo-metric properties) and chemical composition of plant cellwall and middle lamella during the development andripening of the fruit (Nyorere and Uguru 2018). Van Bug-genhout et al. (2009) further noted that fruit texture isdetermined by the cell wall mechanical characteristics incombination with the cells’ internal pressure and intra-cellular adhesion.
Ying et al. (2011) reported that there is a positivecorrelation between ripening and firmness, and the fruitfirmness decreases as fruits become more mature andrapidly decreases as they ripen. The results obtainedshow that the orange PP was more mature, and henceless firmness (force) as compared to green PP fruit. More-over, loss of firmness is a result of membrane disruption,solubilisation, and depolymerisation of pectic polymersthat are involved in cell wall adhesion. Therefore, thefirmer the fruit, the higher the pectic polymers are. How-ever, the results showed that there was no relationshipbetween firmness and pectin yield; the green PP had the
higher firmness but obtained lower pectin yield (10.0%)as compared to purple PP pectin yield of 13.8%.
3.3 Colour analysis of PPP and powder
The colour of PPP is shown in Table 2. The colour of freshPPP was lighter and tended to be darker in purple andgreen but less in orange when compared to dried peels. Asimilar manner of significant differences (p < 0.05) wasalso seen on the colour values of green and orange vari-eties but to a greater extent, as shown by the higher a*and b* values. The main reason for the changes in thecolour of both colours-containing samples is the reddish-brown colour on purple variety, especially the lower a*value. Colour is a quality parameter in any food product,which determines the consumer liking or not. The colourof PPP after drying still resembled the original colour ofthe fresh fruit. This could be because of betanins that areaffected by heat during drying of PPP. The darker colourchange could be attributed to the high temperature ofdrying which enhanced the isomerisation of betanins.The result obtained is in agreement with those reportedby Herbach et al. (2004), who reported an increase in theisobetanin/betanin ratio from 0.25 of untreated to 0.28,0.46, 0.52, and 0.57 after heating red beetroot juice at85°C for 1, 3, 5, and 8 h, respectively.
There are several factors affecting the stability ofbetalains, such as high temperature, high water activity,light, and oxygen, and pH above 7 or below 3 promotesdegradation of betalains. However, in this study, it couldnot be because of pH as the pH of PP fruit ranged from5.04 to 6.04. Kgatla et al. (2011) studied the effect ofheat processing on PP juice and showed that the lightand bright red-purple colours of PP were influencedby juice treatments. Light and bright colours are theresult of betalain pigments that maintain colour stabilitythroughout processing and also give the juice an appeal-ing colour. Colour variations were caused by modifica-tions in betalain pigments as well as furfural andhydroxyl-methylfurfural compounds’ development. Thesample of heat-treated juice was darker. This may bebecause of the Maillard reaction, as this reaction requiresreducing sugar and amino acids. Therefore, the PP variety,size, and the level of maturity or ripeness showed thepotential of PP fruit to be an alternate source for pectinproduction.
The total colour difference (ΔE*) is a combination ofL*, a*, and b* values that characterise the colour variantin foods that occurs during processing. On average, the
a a
b
0
50
100
150
200
250
300
Variety
Forc
e (N
)
Orange
Purple
Green
Figure 1: Firmness of prickly pear fruit. Different superscripts showsignificant different at p < 0.05.
Extraction and characterisation of pectin from the peel 183
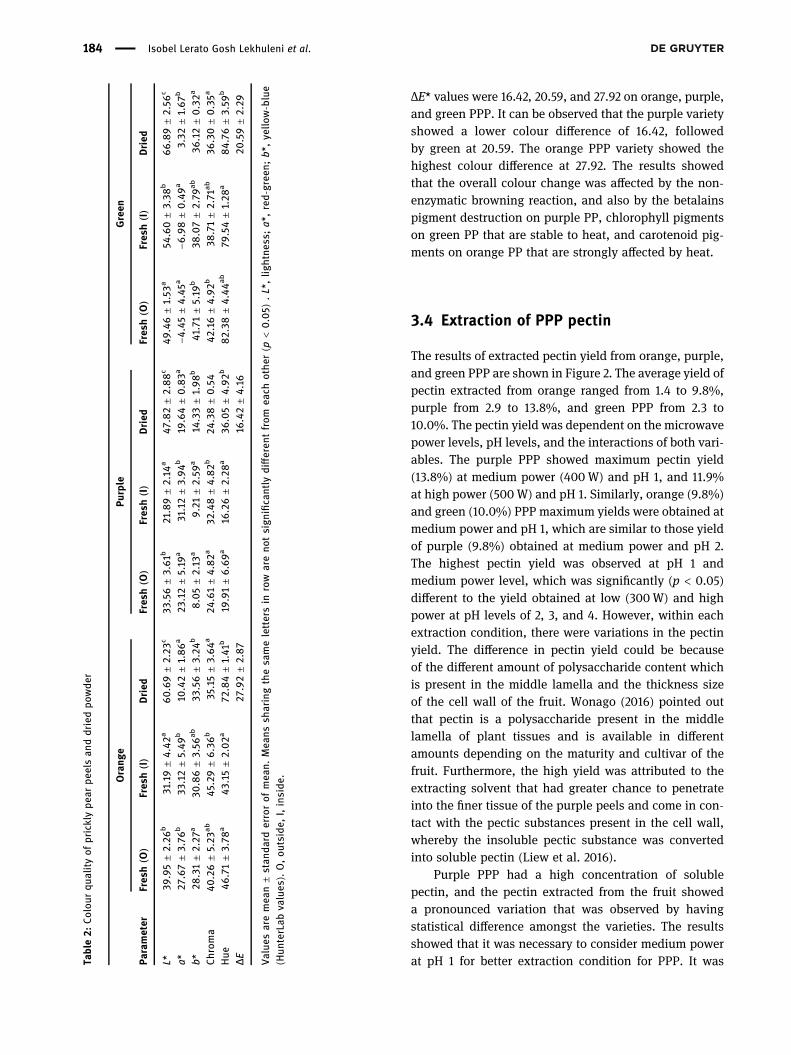
ΔE* values were 16.42, 20.59, and 27.92 on orange, purple,and green PPP. It can be observed that the purple varietyshowed a lower colour difference of 16.42, followedby green at 20.59. The orange PPP variety showed thehighest colour difference at 27.92. The results showedthat the overall colour change was affected by the non-enzymatic browning reaction, and also by the betalainspigment destruction on purple PP, chlorophyll pigmentson green PP that are stable to heat, and carotenoid pig-ments on orange PP that are strongly affected by heat.
3.4 Extraction of PPP pectin
The results of extracted pectin yield from orange, purple,and green PPP are shown in Figure 2. The average yield ofpectin extracted from orange ranged from 1.4 to 9.8%,purple from 2.9 to 13.8%, and green PPP from 2.3 to10.0%. The pectin yield was dependent on the microwavepower levels, pH levels, and the interactions of both vari-ables. The purple PPP showed maximum pectin yield(13.8%) at medium power (400W) and pH 1, and 11.9%at high power (500W) and pH 1. Similarly, orange (9.8%)and green (10.0%) PPP maximum yields were obtained atmedium power and pH 1, which are similar to those yieldof purple (9.8%) obtained at medium power and pH 2.The highest pectin yield was observed at pH 1 andmedium power level, which was significantly (p < 0.05)different to the yield obtained at low (300W) and highpower at pH levels of 2, 3, and 4. However, within eachextraction condition, there were variations in the pectinyield. The difference in pectin yield could be becauseof the different amount of polysaccharide content whichis present in the middle lamella and the thickness sizeof the cell wall of the fruit. Wonago (2016) pointed outthat pectin is a polysaccharide present in the middlelamella of plant tissues and is available in differentamounts depending on the maturity and cultivar of thefruit. Furthermore, the high yield was attributed to theextracting solvent that had greater chance to penetrateinto the finer tissue of the purple peels and come in con-tact with the pectic substances present in the cell wall,whereby the insoluble pectic substance was convertedinto soluble pectin (Liew et al. 2016).
Purple PPP had a high concentration of solublepectin, and the pectin extracted from the fruit showeda pronounced variation that was observed by havingstatistical difference amongst the varieties. The resultsshowed that it was necessary to consider medium powerat pH 1 for better extraction condition for PPP. It wasTa
ble2:
Colou
rqu
alityof
pricklype
arpe
elsan
ddriedpo
wde
r
Orang
ePu
rple
Green
Parameter
Fres
h(O
)Fres
h(I)
Dried
Fres
h(O
)Fres
h(I)
Dried
Fres
h(O
)Fres
h(I)
Dried
L*39
.95±2.26
b31.19±4.42
a60.69±2.23
c33
.56±3.61b
21.89±2.14
a47
.82±2.88c
49.46±1.53
a54
.60±3.38
b66.89±2.56
c
a*27
.67±3.76
b33
.12±5.49
b10
.42±1.86a
23.12±5.19
a31.12±3.94
b19.64±0.83a
−4.45±4.45
a−6
.98±0.49a
3.32
±1.67b
b*28
.31±2.27
a30
.86±3.56
ab
33.56±3.24
b8.05±2.13
a9.21
±2.59
a14.33±1.98
b41.71±5.19
b38
.07±2.79
ab
36.12±0.32a
Chrom
a40
.26±5.23
ab
45.29±6.36b
35.15±3.64a
24.61±4.82a
32.48±4.82b
24.38±0.54
42.16±4.92
b38
.71±2.71
ab
36.30±0.35a
Hue
46.71±3.78
a43
.15±2.02a
72.84±1.41
b19.91±6.69a
16.26±2.28
a36
.05±4.92
b82.38
±4.44
ab
79.54±1.28
a84.76
±3.59
b
ΔE27
.92±2.87
16.42±4.16
20.59±2.29
Value
saremea
n±stan
dard
errorof
mea
n.Mea
nssh
aringthesa
melettersin
row
areno
tsign
ificantly
differen
tfrom
each
othe
r(p
<0.05)
.L*,lig
htne
ss;a*
,red-gree
n;b*
,yello
w-blue
(Hun
terLab
values
).O,ou
tside,
I,inside
.
184 Isobel Lerato Gosh Lekhuleni et al.

observed that the change in microwave power level andpH had a greater impact on the pectin extraction. Thehigh yields were obtained when PPP were extractedunder medium power level and at a very low pH of 1 ormore acidic conditions. Pectin yield obtained at pH 1 wassignificantly higher (p < 0.05) than that of pH 2–4 atmedium power.
The results also revealed that as the pH increased,the pectin yield decreased. At higher pH, there is an accu-mulation of pectin that retards the release of pectin fromthe plant material. Devi et al. (2014) reported that proto-pectin is made by the combination of cellulose and pectinmolecules. Therefore, during acid hydrolysis, protopectinis separated up producing soluble pectin and celluloseby the removal of water molecules. At the same time,removal of calcium and magnesium ions occurredresulting in protopectin being converted to soluble pectin(Liew et al. 2016). The hydrated carboxylate groups are,however, repressed at lower pH in the large hydrogen ion
concentrations and transformed into slightly hydratedgroups of carboxylic acids. The loss of charge reducesthe repulsion of the polysaccharide molecules, whichaccelerates the pectin gelation characteristics, resultingin higher pectin precipitation at lower pH as observed inthis study. Thus, the decrease in pH promotes the releaseof pectin molecules from the peel because the interactionof pectins to the hemicelluloses fractions is split.
The results obtained are supported by Yeoh et al. (2008)who reported that orange peel pectin yield increased by4.5% at pH 1 using microwave extraction. The increasein pectin yield was because of the acid-enhanced cellwall disruption and hence increases pectin release(Kirtchev et al. 1989). A lower pH enhanced the releaseof glucose from starch hydrolysis and disintegrated thepolysaccharides that could co-precipitate with pectin inethanol. The large standard deviations proposed differ-ences in the PPP components from distinctive varietiesand their extraction conditions. However, according to
a
a
a
a
bb
b
b
aa
a b
0
2
4
6
8
10
12
pH 1 pH 2 pH 3 pH 4
Yiel
d %
Orange
Purple
Green
a
a
a
aa
b
b
b
a
a
a ab
a
0
2
4
6
8
10
12
14
16
18
pH 1 pH 2 pH 3 pH 4
Yiel
d %
Orange
Purple
Green
b
aa
aab
b
b
b
b
aab
ab
a
0
2
4
6
8
10
12
14
16
pH 1 pH 2 pH 3 pH 4
Yiel
d %
OrangePurpleGreen
c
Figure 2: Pectin yield at different microwave levels: (a) low, (b) medium, and (c) high power levels at different pH levels on orange, purple,and green prickly pear peels (low = 300W, medium = 400W, high = 500W). Different superscripts show significant different within same pHlevel at p < 0.05.
Extraction and characterisation of pectin from the peel 185
Liew et al. (2016), strong acids such as sulphuric acid arecorrosive and potentially pose a danger to human health.
3.5 Characterisation of extracted PPP pectin
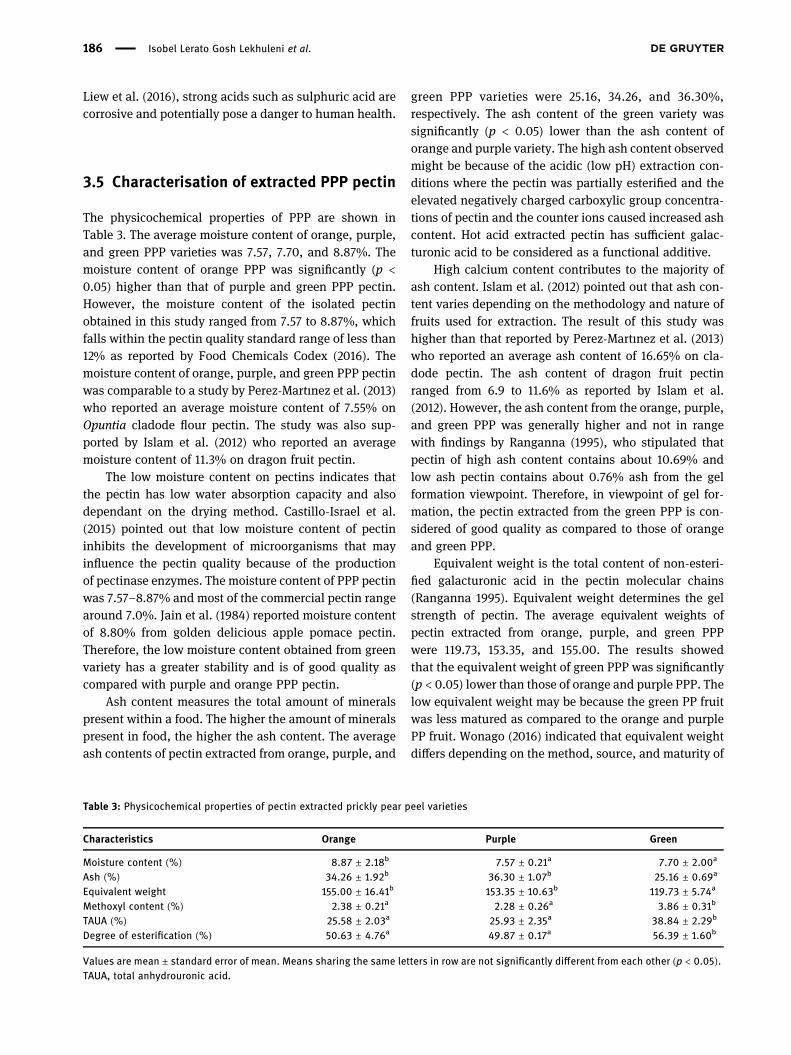
The physicochemical properties of PPP are shown inTable 3. The average moisture content of orange, purple,and green PPP varieties was 7.57, 7.70, and 8.87%. Themoisture content of orange PPP was significantly (p <0.05) higher than that of purple and green PPP pectin.However, the moisture content of the isolated pectinobtained in this study ranged from 7.57 to 8.87%, whichfalls within the pectin quality standard range of less than12% as reported by Food Chemicals Codex (2016). Themoisture content of orange, purple, and green PPP pectinwas comparable to a study by Perez-Martınez et al. (2013)who reported an average moisture content of 7.55% onOpuntia cladode flour pectin. The study was also sup-ported by Islam et al. (2012) who reported an averagemoisture content of 11.3% on dragon fruit pectin.
The low moisture content on pectins indicates thatthe pectin has low water absorption capacity and alsodependant on the drying method. Castillo-Israel et al.(2015) pointed out that low moisture content of pectininhibits the development of microorganisms that mayinfluence the pectin quality because of the productionof pectinase enzymes. The moisture content of PPP pectinwas 7.57–8.87% and most of the commercial pectin rangearound 7.0%. Jain et al. (1984) reported moisture contentof 8.80% from golden delicious apple pomace pectin.Therefore, the low moisture content obtained from greenvariety has a greater stability and is of good quality ascompared with purple and orange PPP pectin.
Ash content measures the total amount of mineralspresent within a food. The higher the amount of mineralspresent in food, the higher the ash content. The averageash contents of pectin extracted from orange, purple, and
green PPP varieties were 25.16, 34.26, and 36.30%,respectively. The ash content of the green variety wassignificantly (p < 0.05) lower than the ash content oforange and purple variety. The high ash content observedmight be because of the acidic (low pH) extraction con-ditions where the pectin was partially esterified and theelevated negatively charged carboxylic group concentra-tions of pectin and the counter ions caused increased ashcontent. Hot acid extracted pectin has sufficient galac-turonic acid to be considered as a functional additive.
High calcium content contributes to the majority ofash content. Islam et al. (2012) pointed out that ash con-tent varies depending on the methodology and nature offruits used for extraction. The result of this study washigher than that reported by Perez-Martınez et al. (2013)who reported an average ash content of 16.65% on cla-dode pectin. The ash content of dragon fruit pectinranged from 6.9 to 11.6% as reported by Islam et al.(2012). However, the ash content from the orange, purple,and green PPP was generally higher and not in rangewith findings by Ranganna (1995), who stipulated thatpectin of high ash content contains about 10.69% andlow ash pectin contains about 0.76% ash from the gelformation viewpoint. Therefore, in viewpoint of gel for-mation, the pectin extracted from the green PPP is con-sidered of good quality as compared to those of orangeand green PPP.
Equivalent weight is the total content of non-esteri-fied galacturonic acid in the pectin molecular chains(Ranganna 1995). Equivalent weight determines the gelstrength of pectin. The average equivalent weights ofpectin extracted from orange, purple, and green PPPwere 119.73, 153.35, and 155.00. The results showedthat the equivalent weight of green PPP was significantly(p < 0.05) lower than those of orange and purple PPP. Thelow equivalent weight may be because the green PP fruitwas less matured as compared to the orange and purplePP fruit. Wonago (2016) indicated that equivalent weightdiffers depending on the method, source, and maturity of
Table 3: Physicochemical properties of pectin extracted prickly pear peel varieties
Characteristics Orange Purple Green
Moisture content (%) 8.87 ± 2.18b 7.57 ± 0.21a 7.70 ± 2.00a
Ash (%) 34.26 ± 1.92b 36.30 ± 1.07b 25.16 ± 0.69a
Equivalent weight 155.00 ± 16.41b 153.35 ± 10.63b 119.73 ± 5.74a
Methoxyl content (%) 2.38 ± 0.21a 2.28 ± 0.26a 3.86 ± 0.31b
TAUA (%) 25.58 ± 2.03a 25.93 ± 2.35a 38.84 ± 2.29b
Degree of esterification (%) 50.63 ± 4.76a 49.87 ± 0.17a 56.39 ± 1.60b
Values are mean ± standard error of mean. Means sharing the same letters in row are not significantly different from each other (p < 0.05).TAUA, total anhydrouronic acid.
186 Isobel Lerato Gosh Lekhuleni et al.

the fruit used for extraction. Nonetheless, the equivalentweight of pectin extracted from orange, purple, and greenPPP was generally lower than that reported by Wonago(2016), who reported that the average equivalent weightof lime and lemon was 326.79 and 396.82. The low equiva-lent weight obtained in this study may be caused bythe use of sulphuric acid (strong acid) as an extractantthat strongly influenced the pectins macromolecularand gelling characteristics by depolymerising the galac-turonan chain and decreases the free acid content asreported by Devi et al. (2014). However, increased anddecreased equivalent weight depends on the amountof free (non-esterified) galacturonic acid (GalA); further-more, high equivalent weight would have high gel for-mation, whereas low equivalent weight would have lowgel formation because the pectin would be highly degraded(Ramli 2011). The pectin extracted from PPP varieties gen-erally showed lower equivalent weight, and therefore, itwill have a lower gel formation.
The average methoxyl contents obtained were 2.28,2.38, and 3.86% for orange, purple, and green PPP. Themethoxyl content of green PPP variety was significantly(p < 0.05) higher than that of orange and purple PPPpectin. The low methoxyl content obtained may be attri-buted by the low pH and medium extraction powerthat depolymerised galacturonan chains into shorter
polygalacturonic acid chains. The results are comparableto those reported by Islam et al. (2012) on dragon fruitpectin with methoxyl content ranging from 2.98 to 4.34%.Salma et al. (2012) reported methoxyl content of 1.56% onlemon peel pectin. According to Aina et al. (2012), themethoxyl content varies from 0.2 to 12% depending onthe pectin source and extraction method. Kanmani et al.(2014) pointed out that pectins that have less than 7%methoxyl content are classified as low methoxyl pectins,and they form gels with lower sugar concentrations or inthe absence of sugar. Generally, the methoxyl content ofPPP was below 7%; therefore, the pectin is characterisedas of low ester, indicating that they are desirable in termsof quality.
The total anhydrouronic (AUA) content determinesthe purity and DE. It also evaluates the physical charac-teristics of extracted pectin, and it should be not less than65% as suggested (Food Chemicals Codex 2016). Theaverage AUA content for pectin extracted from orange,purple, and green PPP was 25.58, 25.93, and 38.84%. TheAUA content of green PPP was significantly (p < 0.05)higher than those of orange and green PPP pectin. Thepurity of pectin obtained from green variety is higherwhen compared with those from orange and purple vari-eties as shown by the lower ash content. Generally, theAUA content obtained was less than 65% which point out
500100015002000250030003500Wavenumber cm-1
7075
8085
9095
Tran
smitt
ance
[%]
b
c
d
a
Figure 3: Fourier transform infrared spectra of (a) green, (b) purple, (c) commercial citrus, and (d) orange prickly pear pectin.
Extraction and characterisation of pectin from the peel 187
that the pectin may not be adequately pure because of theexistence of proteins, starch, and sugars in the extractedpectin. Furthermore, PPP pectin has high content of neu-tral sugars, consisting mainly of galactose, arabinose,and rhamnose. However, the GalA and neutral sugarcontent in pectin rely on the conditions of extraction.Hot acid extracted pectin has sufficient GalA as a func-tional additive. Pectins that are partially esterified contain10% or more organic materials composed of arabinose,galactose, and other sugars. However, the AUA valuesobtained in this study are significantly different fromthose reported by Islam et al. (2012) from dragon fruitpectin of 45.3–52.2%.
DE is the proportion of esterified GalA groups to thetotal GalA groups present in pectin. It is a significantfactor that determines the pectins gel formation (Lira-Ortiz et al. 2016). The DE of pectin from orange, purple,and green PPP varieties obtained was 49.87, 50.63, and56.39%. The DE of pectin from green variety was signifi-cantly (p < 0.05) higher than those of orange and purplePPP varieties. The high DE values of green PPP may beattributed to the degree of maturity, source, tissues, andmethod of extraction. Moreover, the galacturonan chainsof green PPP pectin were probably less depolymerisedinto short polygalacturonic acid chains as compared tothose of purple and orange PPP. The DE values obtainedare comparable to those reported by Islam et al. (2012)whereby the DE values of 31.05–46.96% from dragon fruitwere obtained. Therefore, the pectin obtained from greenand orange varieties can be classified as high methoxylpectin because it has DE higher than 50%. The highmethoxyl pectin form gels with high amounts of sugaras well as low pH value and is used as thickeners forsoft drinks. With these characteristics, pectin builds acomparable mouthfeel to that of fruit juices and is there-fore helpful in juice and low calorie or diet beverages.Purple PPP pectin can be classified as low methoxylpectin because the DE is less than 50%. They will forma thermo-irreversible gel that even when heated to higher
temperatures will remain gelled. Low methoxyl pectin isused in the production of low-sugar jams because it gelsin the absence of sugar.
3.6 Characterisation of PPP pectin usingFTIR spectroscopy
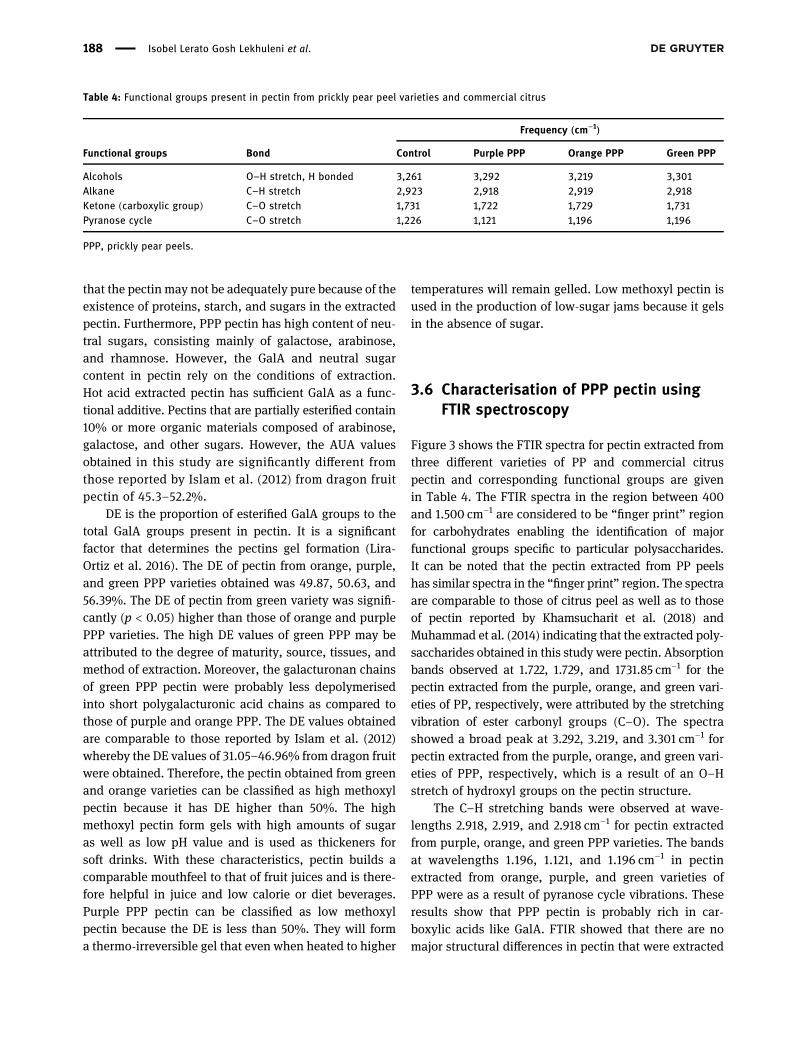
Figure 3 shows the FTIR spectra for pectin extracted fromthree different varieties of PP and commercial citruspectin and corresponding functional groups are givenin Table 4. The FTIR spectra in the region between 400and 1.500 cm−1 are considered to be “finger print” regionfor carbohydrates enabling the identification of majorfunctional groups specific to particular polysaccharides.It can be noted that the pectin extracted from PP peelshas similar spectra in the “finger print” region. The spectraare comparable to those of citrus peel as well as to thoseof pectin reported by Khamsucharit et al. (2018) andMuhammad et al. (2014) indicating that the extracted poly-saccharides obtained in this study were pectin. Absorptionbands observed at 1.722, 1.729, and 1731.85 cm−1 for thepectin extracted from the purple, orange, and green vari-eties of PP, respectively, were attributed by the stretchingvibration of ester carbonyl groups (C–O). The spectrashowed a broad peak at 3.292, 3.219, and 3.301 cm−1 forpectin extracted from the purple, orange, and green vari-eties of PPP, respectively, which is a result of an O–Hstretch of hydroxyl groups on the pectin structure.
The C–H stretching bands were observed at wave-lengths 2.918, 2.919, and 2.918 cm−1 for pectin extractedfrom purple, orange, and green PPP varieties. The bandsat wavelengths 1.196, 1.121, and 1.196 cm−1 in pectinextracted from orange, purple, and green varieties ofPPP were as a result of pyranose cycle vibrations. Theseresults show that PPP pectin is probably rich in car-boxylic acids like GalA. FTIR showed that there are nomajor structural differences in pectin that were extracted
Table 4: Functional groups present in pectin from prickly pear peel varieties and commercial citrus
Frequency (cm−1)
Functional groups Bond Control Purple PPP Orange PPP Green PPP
Alcohols O–H stretch, H bonded 3,261 3,292 3,219 3,301Alkane C–H stretch 2,923 2,918 2,919 2,918Ketone (carboxylic group) C–O stretch 1,731 1,722 1,729 1,731Pyranose cycle C–O stretch 1,226 1,121 1,196 1,196
PPP, prickly pear peels.
188 Isobel Lerato Gosh Lekhuleni et al.
from orange, purple, and green varieties of PPP. The PPPpectin spectra exhibited similarities in its absorption pat-tern to that of commercial pectin.
4 Conclusions
Physicochemical properties of the PP fruit such aspH, titratable acidity, total soluble solids, texture, andpeel thickness had effects on pectin yield and quality.Extraction of pectin using microwave medium powerlevel and pH 1 produced a higher pectin yield than higherpH and higher microwave power levels and lower levels.Pectin extraction from different varieties of PPP did notshow any significant effect on pectin yield as comparedwith common fruit sources such as citrus peels and applepomace. All PPP pectins were within the acceptablequality range in terms of moisture content, ash content,methoxyl content, equivalent weight, AUA, and DE. TheFTIR spectroscopy confirmed the presence of differentfunctional groups in extracted PPP pectin similar tothose of commercial citrus pectin. The present researchrevealed that PPP is a good source of pectin and has thepotential to be used in food processing industries as asignificant raw material for pectin. It has the potentialapplication as citrus replacement for high-quality pectinand has potential for use in the processing of jamsand jellies, and for use in the food and pharmaceuticalindustries.
Funding information: This work was supported byUniversity of Venda Work Study and Research andPublication Committee grant (SARDF/18/FST/05).
Author contribution: ILGL and TEK: conceptualisation;ILGL: formal analysis and investigation; MEM, TEK, andAIOJ: project administration, resources, and supervision;ILGL, TEK, MEM, and AIOJ: validation; MEM and ILGL:writing – original draft; TEK, MEM, and AIOJ: writing –review and editing. All authors have read and agreedto the published version of the manuscript.
Conflict of interest: The authors state no conflict ofinterest.
Data availability statement: The datasets generatedduring and/or analyzed during the current study areavailable from the corresponding author on reasonablerequest.
References
[1] Aina VO, Barau MM, Mammam OA, Zakari A, Haruna H, Hauwa-Umar MS, et al. Extraction and characterisation of pectin frompeels of lemon (Citrus limon), grape fruit (Citrus paradise) andsweet orange (Citrus sinensis). Br J Pharmacol Toxicol.2012;3(6):259–62.
[2] Altaf U, Immanuel G, Iftikhar F. Extraction and characterisationof pectin derived from papaya (Carica papaya Linn.) peel. Int JSci Eng Technol. 2015;3(4):970–4.
[3] AOAC. Official methods of analysis of association of analyticalchemists, international. Horwits Dr William, ed., 17th edn.Washington, DC, USA: AOAC; 2002.
[4] Canteri-Schemin MH, Fertonani HCR, Waszczynskyj N,Wosiacki G. Extraction of pectin from apple pomace. Int J BrazArch Biol Technol. 2005;48(2):259–66.
[5] Castillo-Israel KAT, Baguio SF, Diasanta MDB, Lizardo RCM,Dizon EI, Majico MIF. Extraction and characterisation of pectinfrom Saba banana [(Musa ‘saba’ (Musa-acuminata x Musabalbisiana)] peel wastes: a preliminary study. Int Food Res J.2015;22(1):202–7.
[6] Chan S, Choo W. Effect of extraction conditions on the yieldand chemical properties of pectin from cocoa husks. FoodChem. 2013;141:3752–8.
[7] de Oliveira CF, Giordani D, Lutckemier R, Gurak PD, Cladera-Olivera F, Marczak LDF. Extraction of pectin from passion fruitpeel assisted by ultrasound. LWT Food Sci Technol.2016;71:110–5.
[8] Dehbi F, Hasib A, Ouatmane A, Elbatal H, Jaouad A.Physicochemical characteristics of Moroccan prickly pear juice(Opuntia ficus indica L.). Int J Emerg Technol Adv Eng.2014;4(4):300–6.
[9] Devi WE, Shukla RN, Abraham A, Japula S, Kaushik U.Optimized extraction condition and characterisation of pectinfrom orange peel. Int J Res Eng Adv Technol.2014;2(2):1–9.
[10] Food Chemicals Codex. Including suppl 1, 2 3. 10th edn.Deutscher Apotheker Doktor Roland Schmiedel; 2016.
[11] Gengatharan A, Dykes DA, Choo WS. Betalains: natural plantpigments with potential application in functional foods. LWTFood Sci Technol. 2015;64(2):645–9.
[12] Guo X, Meng H, Zhu S, Tang Q, Pan R, Yu S. Developing pre-cipitation modes for preventing the calcium-oxalate contami-nation of sugar beet pectin. Food Chem. 2012;182:64–71.
[13] Herbach KM, Stintzing FC, Carle R. Impact of thermal treatmenton colour and pigment pattern of red beet (Beta vulgaris L.)preparations. J Food Sci. 2004;69:491–8.
[14] Hosseini SS, Khodaiyan F, Yarmand MS. Aqueous extraction ofpectin from sour orange peel and its preliminary physico-chemical properties. Int J Biol Macromol. 2016;82:920–6.
[15] Islam MZ, Monalisa K, Hoque MM. Effect of pectin on theprocessing and preservation of strawberry (Fragaria ana-nassa) jam and jelly. Int J Nat Sci. 2012;2(1):8–14.
[16] Jafari F, Khodaiyan F, Kiani H, Hosseini SS. Pectin from carrotpomace: optimisation of extraction and physicochemicalproperties. Carbohyd Polym. 2017;157:1315–22.
[17] Jain RK, Ghankrokta SS, Agrawal JD. Isolation and character-isation of pectin from apple pomace. Indian Food Pack.1984;38:65–70.
Extraction and characterisation of pectin from the peel 189

[18] Kanmani P, Dhivya E, Aravind J, Kumaresan K. Extraction andanalysis of pectin from citrus peels: augmenting the yield fromcitrus lemon using statistical experimental design. Iran JEnergy Environ. 2014;5(3):303–12.
[19] Kgatla TE, Howard SS, Hiss DC. Colour stability of wild cactuspear juice. Int J Nutr Food Eng. 2011;5(8):435–40.
[20] Khamsucharit P, Laohaphatanalert K, Gavinlertvatana P,Sangseethong K. Characterisation of pectin extracted frombanana peels of different varieties. Food Sci Biotechnol.2018;27:623–9.
[21] Khatabi O, Hanine H, Elothmani D, Hasib A. Extraction anddetermination of polyphenols and betalain pigments inMoroccan prickly pear fruits (Opuntia ficus indica). Arab JChem. 2016;9:S278–81.
[22] Kirtchev N, Panchev I, Kratchanov CHRy. Kinetics of acid‐cat-alysed de‐esterification of pectin in a heterogeneous medium.Int J Food Sci Technol. 1989;24:479–86.
[23] Lefsih K, Delattre C, Pierre G, Michaud P, Aminabhavi TM,Dahmoune F, et al. Extraction, characterisation and gellingbehavior enhancement of pectin from cladodes of Opuntiaficus indica. Int J Biol Macromol. 2016;82:645–52.
[24] Liew SQ, Chin NL, Yusof YA, Sowndhararajan K. Comparison ofacid and enzymatic pectin extraction from passion fruit peelsand its gel properties. J Food Process Eng. 2016;39:501–11.
[25] Liew SQ, Ngoh GC, Yusoff R, Teoh WH. Sequential ultrasound-microwave assisted acid extraction (UMAE) of pectin frompomelo peels. Int J Biol Macromol. 2016;93:426–35.
[26] Lira-Ortiz AL, Reséndiz-Vega F, Ríos-Leal E, Contreras-Esquivel JC, Chavarría-Hernández N, Vargas-Torres A, et al.Pectins from waste of prickly pear fruits (Opuntia albicarpaScheinvar ‘Reyna’): chemical and rheological properties. FoodHydrocoll. 2014;37:93–9.
[27] López-Palacios C, Peña-Valdivia CB, Reyes-Agüero JA,Rodríguez-Hernández AI. Effects of domestication on struc-tural polysaccharides and dietary fiber in nopalitos (Opuntiaspp.). Genet Resour Crop Ev. 2012;59:1015–26.
[28] Maskan M. Kinetics of colour change of kiwifruits during hotair and microwave drying. J Food Eng. 2001;48(2):169–75.
[29] Mohamed S, Hasan Z. Extraction and characterisation of pectinfrom various tropical agrowastes. Asean Food J.1995;10(3):43–50.
[30] Muhammad K, Zahari NIM, Gannasin SP, Adzahan NM, Bakar J.High methoxyl pectin from dragon fruit (Hylocereus polyrhizus)peel. Food Hydrocoll. 2014;42:289–97.
[31] Ncibi S, Othman MB, Akacha A, Krifi MN, Zourgui L. Opuntiaficus indica extracts prospects against chlorpyrifos-induceddamage on mice liver. Food Chem Toxicol.2008;46(2):797–802.
[32] Ngouémazong DE, Tengweh FF, Fraeye I, Duvetter T,Cardinaels R, Van, et al. Effect of de-methylesterification onnetwork development and nature of Ca2+ pectin gels: towardsunderstanding structure-function relations of pectin. FoodHydrocoll. 2012;26(1):89–98.
[33] Nunes CS, Rufato KB, Souza PR, de Almeida EA, da Silva MJ,Scariot DB, et al. Chitosan/chondroitin sulfate hydrogelsprepared in (Hmim) [HSO4] ionic liquid. Carbohyd Polym.2017;170:99–106.
[34] Nyorere O, Uguru H. Instrumental texture profile analysis (TPA)of cucumber fruit as influenced by its part and maturity stage.Am J Eng Technol Manag. 2018;3(4):54–60.
[35] Oliveira TÍS, Rosa MF, Cavalcante FL, Pereira PHF, Moates GK,Wellner N, et al. Optimisation of pectin extraction from bananapeels with citric acid by using response surface methodology.Food Chem. 2016;198:113–8.
[36] Padam BS, Tin HS, Chye FY, Abdullah MI. Banana by-products:an under-utilized renewable food biomass with great poten-tial. J Food Sci Technol. 2014;51(12):3527–45.
[37] Pagan J, Ibarz A, Llorca M, Pagan A, Barbosa-Cánovas G.Extraction and characterization of pectin from stored peachpomace. Food Res Int. 2001;34(7):605–12.
[38] Panda SK, Behera SK, Qaku XW, Sekar S, Ndinteh DT,Nanjundaswamy HM, et al. Quality enhancement of pricklypears (Opuntia sp) juice through probiotic fermentation usingLactobacillus fermentation – ATCC 9338. LWT Food SciTechnol. 2016;75:453–9.
[39] Patel S. Opuntia fruits as a source of inexpensive functionalfood. Emerging bioresources with nutraceutical and pharma-ceutical prospects. Cham: Springer; 2015. p. 15–20.
[40] Pereira PHF, Oliveira TIS, Rosa MF, Cavalcante FL, Moates GK,Wellner N, et al. Pectin extraction from pomegranate peelswith citric acid. Int J Biol Macromol. 2016;88:373–9.
[41] Perez-Martınez JD, Sanchez-Becerril M, Ornelas-Paz JJ,Gonzalez-Chavez MM, Ibarra-Junquera V, Escalante-Minakata P. The effect of extraction conditions on the chemicalcharacteristics of pectin from Opuntia ficus indica cladodeflour. J Polym Environ. 2013;21:1040–51.
[42] Petkowics CLO, Vriesmann LC, Williams PA. Pectins from foodwaste: extraction, characterisation and properties of water-melon rind pectin. Food Hydrocoll. 2017;65:57–67.
[43] Ramli NA. Effect of ammonium oxalate and acetic acid at sev-eral extraction time and pH on some physicochemical prop-erties of pectin from cocoa husk (Theobroma cacao). Afr J FoodSci. 2011;5:790–8.
[44] Ranganna S. Hand book of analysis and quality control for fruitsand vegetable products. Vegetable products. Vol. 12–16, 2ndedn. New Delhi: McGraw Hill Publishing Co. Ltd.; 1995. p. 83–8.
[45] Salma MA, Jahan N, Islam MA, Hoque MM. Extraction of pectinfrom lemon peel: technology development. J Chem Eng.2012;27(2):25–30.
[46] Shaha RK, Nayagi Y, Punichelvana A, Afadi A. Optimisedextraction condition and characterisation of pectin from Kaffirlime (Citrus hystrix). Res J Agric Fores Sci. 2013;1(2):1–11.
[47] Sundar Raj AA, Rubila S, Jayabalan R, Ranganathan TV. Areview on pectin: chemistry due to general properties of pectinand its pharmaceutical uses. Sci Rep. 2012;1(12):1–3.
[48] Van Buggenhout S, Sila DN, Duvetter T, Van Loey A,Hendrick M. Pectins in processed fruits and vegetables: partIII- texture engineering. Compr Rev Food Sci F. 2009;8:105–17.
[49] Virk BS, Sogi DS. Extraction and characterization of pectinfrom apple (Malus Pumila. Cv Amri) peel waste. Int J Food Prop.2004;7(3):693–703.
[50] Wang S, Chen F, Wu J, Wang Z, Liao X, Hu X. Optimization ofpectin extraction assisted by microwave from apple pomaceusing response surface methodology. J Food Eng.2007;78(2):693–700.
[51] Wonago W. Pectin development from citrus peels and theeffect of processing conditions on the extraction. Doctoraldissertation. Ethiopia: Addis Ababa University; 2016.
[52] Yahia EM. Prickly pear fruit and cladodes. Crop post-harvest:science and technology. UK: Wiley-Blackwell; 2012. p. 264–85.
190 Isobel Lerato Gosh Lekhuleni et al.

[53] Yapo B, Koffi K. Extraction and characterisation of highly gel-ling low methoxyl pectin from cashew apple pomace. Foods.2013;3(1):1–12.
[54] Yeoh S, Shi J, Langrish TAG. Comparisons between differenttechniques for water based extraction of pectin from orangepeels. Desalination. 2008;218:229–37.
[55] Ying Z, Han X, Li J. Ultrasound-assisted extraction ofpolysaccharides from mulberry leaves. Food Chem.2011;127:1273–9.
[56] Zarei M, Azizi M, Bashir-Sadr Z. Evaluation of physicochemicalcharacteristics of pomegranate (Punica granatum L.) fruitduring ripening. Fruits. 2011;66(2):121–9.
Extraction and characterisation of pectin from the peel 191