chemical characterization of pectin from green tea (camellia sinensis)
TRANSCRIPT

C
JL
a
ARR1AA
KGCPHEP
1
wm&yvtl(TsrcpeoTotTan
0d
Carbohydrate Polymers 83 (2011) 1232–1239
Contents lists available at ScienceDirect
Carbohydrate Polymers
journa l homepage: www.e lsev ier .com/ locate /carbpol
hemical characterization of pectin from green tea (Camellia sinensis)
ean-Pierre Ele-Ekouna, Corinne Pau-Roblot ∗, Bernard Courtois, Josiane Courtoisaboratoire des Polysaccharides Microbiens et Végétaux, Université de Picardie Jules Verne, IUT d’Amiens, dept GB, Avenue des Facultés, Le Bailly, 80025 Amiens cedex, France
r t i c l e i n f o
rticle history:eceived 31 May 2010eceived in revised form0 September 2010ccepted 16 September 2010vailable online 25 September 2010
a b s t r a c t
From green tea leaves, two distinct pectin fractions were obtained based on their solubility in water.Polyphenols were detected only in the easily water soluble fraction (P1). The estimated uronicacids/neutral sugars ratio was 1.7 in the easily water soluble pectin fraction (P1), and 1.0 in the lesswater soluble fraction (P2). Homogalacturonan sequences (HGAs) corresponded to about 62% of the P1pectin fraction but only 47% of the P2 fraction. After degradation of the two pectin fractions by pectinlyase, chemical studies revealed rhamnogalacturonan RG I and RG II regions present in the P1 pectin
eywords:reen teaamellia sinensisectinomogalacturonan
fraction, whereas only RG I sequences were detected in the P2 pectin fraction. The degree of substitutionwas lower for HGAs of the P1 pectin fraction than P2. Different acetylation patterns for the two fractionswere observed. Polyphenols extracted simultaneously with pectins were present only in HGA fractionsfrom P1.
© 2010 Elsevier Ltd. All rights reserved.
sterificationolyphenol. Introduction
Pectins are polysaccharides present in all plant primary cellalls and in the middle lamella of dicotyledons, where, the poly-ers are involved in plant growth and development (Ridley, O’Neill,Mohnen, 2001). Numerous scientific reports, for more than 50
ears, have described the composition of pectins obtained fromarious plants. However, the complete structure determination ofhese molecules remains difficult in view of their high molecu-ar mass, the lack of homogeneity and absence of repeating unitsMohnen, 2008; Voragen, Pilnik, Thibault, Axelos, & Renard, 1995).hree sequences are identified in all pectins. The first one corre-ponds to a linear chain of �-(1 → 4)-linked d-galacturonic acidesidues partially substituted by methyl and acetyl groups. In thisase, the degree of methylation and acetylation varies relative to theectin origin (Bédouet, Denys, Courtois, & Courtois, 2006; Parronet al., 2002; Ralet et al., 2005) and also throughout the plant devel-pment (Bédouet et al., 2006; Stewart, Iannetta, & Davies, 2001).his sequence noted smooth region or homogalacturonan (HGA) is
ccasionally interrupted by two hairy regions noted rhamnogalac-uronans (RG): RG I and RG II (O’Neill, Albersheim, & Darvill, 1997).he RG I sequence is composed of alternating �-d-galacturoniccid and �-l-rhamnose with side chains linked to C-4 of rham-ose. These RG I side chains are composed mainly of arabinose and∗ Corresponding author. Tel.: +33 0322534092; fax: +33 0322534094.E-mail address: [email protected] (C. Pau-Roblot).
144-8617/$ – see front matter © 2010 Elsevier Ltd. All rights reserved.oi:10.1016/j.carbpol.2010.09.028
galactose and depending on the pectin origin, various concentra-tions of minor components such as xylose or glucose are observed(Duan, Wang, Dong, Fang, & Li, 2003). The RG II sequence corre-sponds to a main chain made of �-(1 → 4)-linked galacturonic acidresidues, similar to a HGA sequence, associated with four differentoligosaccharide side chains containing common monosaccharidessuch as Rha, Fuc, Ara, Xyl, Gal and GlcA and also rare ones as Kdo,Api and Dha (Herve du Penhoat, Gey, Pellerin, & Perez, 1999). TheRG II structure is maintained whatever the pectin origin (O’Neill etal., 1996; Thomas, Darvill, & Albersheim, 1989). In addition to thethree sequences present in all pectins, a fourth one correspondingto a xylogalacturonan has been detected in apple pectins (Schols,Bakx, Schipper, & Voragen, 1995).
Several properties are allotted to pectins as cementing agentsin plant cell walls (Rees & Wight, 1969) or during fruit ripen-ing (Knee, 1978), but they are mainly known for their roles infood processing (Rombouts & Pilnik, 1978) and as dietary fibre.When extracted from plants, these pectins are used as thickeningagents in the food and in the pharmaceutical industries (Drusch,2007; Kim & Fassihi, 1997; May, 1990). The quality of thickeningdepends on the presence of sucrose for high-methoxyl pectins oran adequate concentration of a divalent cation such as calcium forlow-methoxyl pectins (Pilgim, Walter, & Oakenfull, 1991). In plantfoods, pectins are often classified as indigestible dietary fibres;
by increasing the viscosity of the chyme in the upper tract, theyencourage regular bowel movement and take part in the absorp-tion of nutriments such as glucose (Kim, 2005; Vervuert, Klein, &Coenen, 2009). Besides, pectins are considered as preventing agentsagainst hyperlipidemia (Chau, Chen, & Wang, 2004; Sudheesh &
drate P
Vp
rpSsd&1a(2oKpaftrts
2
2
Fs
2
goW(aampaw
w3tn(aca(atcd(a
aspt
The column was a HP1 polydimethylsiloxane capillary column
J.-P. Ele-Ekouna et al. / Carbohy
ijayalakshmi, 1999), and activities against bowel cancer have beenroposed (Kritchevsky, 1995).
Numerous studies are available for pectins from fruits as cit-us, apple or grape, but limited information is available for pectinsresent in tea infusions, the most consumed beverage in the world.tudies concerning the health benefit of tea have been reportedince 1992 (Huang et al., 1992), and concern mainly polyphenolsiffusing from the plant to the water (Chung, Wong, Wie, Huang,Lin, 1998; Ferrara, Montesano, & Senatore, 2001; Huang et al.,
992; Kilmartin & Hsu, 2003; Perva-Uzunalic et al., 2006). In fact,nti-oxidant properties have been described for these polyphenolsAlmajano, Carbó, López Jiménez, & Gordon, 2008; Frei & Higdon,003; Lu, Lee, Maud, & Lin, 2010), in addition to other activitiesn cancer and cardiovascular diseases (Khan & Mukhtar, 2007;ris-Etherton & Keen, 2002). More recently, tea extracts have beenroposed as natural preservatives in food due to their anti-oxidantnd anti-microbial activities (Almajano et al., 2008). In contrast,ew studies are available on tea pectins. The aim of this study waso characterize pectin molecules found in green tea beverages. Theesults obtained could serve as foundation for further research onhe potential bioactivity of tea pectins in relation to the polymertructure.
. Materials and methods
.1. Plant material
Green tea (Camellia sinensis; white Monkey) was from China,ujian province. It corresponds to tea leaves only submitted toteam, prior to drying.
.2. Pectin extraction and fractionation
To remove lipids and pigments, green tea leaves (3 g) were firstrinded to a powder and suspended during 5 min at 4 ◦C in 100 mlf sodium acetate buffer (50 mM, pH 5). After filtration through ahatman filter (no. 3), the retained material was washed twice
30 min) with 100 ml of a CH3OH–CHCl3 (1:1, v/v) mixture. Then,new filtration through a Whatman filter (no. 3) was performed
nd the retained material was suspended in a 60% (v/v) aqueousethanol solution (100 ml). After 35 min-stirring at ambient tem-
erature, filtration through a Whatman filter (no. 3) was performednd the retained material, called the insoluble tea leaf fraction (TLF),as collected for subsequent pectin extraction.
Two extraction procedures were applied. For the first one, pectinas first obtained from TLF by distilled water (100 ml) upon a
0 min-stirring at 70 ◦C. The suspension was then cooled at roomemperature and centrifuged (10 min, 12,000 × g, 15 ◦C). The super-atant was recovered, supplemented with three volumes of a 95%v/v) aqueous ethanol solution, and finally the mixture was storedt 4 ◦C overnight. The precipitate formed called F was recovered byentrifugation (10 min, 10,000 × g, 4 ◦C), dried in an oven (40 ◦C)nd weighted. The dried extract was then suspended in water10 ml), and the solution was stirred at ambient temperature. After
3 h-stirring, the precipitate was not completely dissolved, so,he solution was centrifuged (10,000 × g, 4 ◦C, 10 min) in order toollect the supernatant called F1 representing the fraction easilyissolved in water. The pellet called F2 was suspended in water10 ml), which was stirred during 10 h for complete dissolution. F1nd F2 fractions were dried by lyophilisation and weighted.
A second procedure was applied: 100 ml of HCl (50 mM) wasdded to the TLF material instead of distilled water. After 30 min-tirring at 70 ◦C as above, the preparation was cooled, and theH was adjusted to 5 with 1 M NH4OH. The preparation was cen-rifuged, and the supernatant was supplemented with ethanol as
olymers 83 (2011) 1232–1239 1233
above. A precipitate called P was obtained, dried as described pre-viously for F and weighted. The P product was suspended in water,and the preparation was stirred as for F. After a 3 h-stirring the dis-solution was incomplete, the solution was centrifuged as for F, thesupernatant was called P1 and a complete dissolution of the pelletcalled P2 was obtained after a 10 h-stirring as for F2. Fractions P1and P2 were dried and weighted as F1 and F2.
2.3. Quantitative determination of protein and polyphenolcontents
The protein content of pectin extracts was estimated accordingthe method described by Bradford (Bradford, 1976) using bovineserum albumin (BSA) as a standard.
For polyphenol assays, 4 ml of pectin extracts (5 g/l) were addedto 5 ml of a ferrous tartrate tetrahydrate solution in water (fer-rous sulphate and potassium sodium tartrate tetrahydrate 0.1%and 0.5% (w/v), respectively), and then 15 ml of potassium phos-phate buffer (0.067 M, pH 7.5) was added (Ruan & Li, 1983; Songet al., 1987). The mixture was maintained at ambient temperatureduring 10 min. The polyphenol content of the mixtures was deter-mined by comparison of its absorbance at 540 nm to the absorbancefrom a calibration curve obtained with quercetin (Sigma–AldrichChimie S.a.r.l., Saint Quentin Fallavier, France) solutions from 0.1 to1.0 mg/ml. Analyses were carried out in duplicate for three differentsamples.
2.4. Determination of sugar composition
The uronic acid (UA) and neutral sugar (NS) content ofthe pectin extracts was determined using, respectively, meta-hydroxybiphenyl (m-HBP) (Thibault, 1979; Van den Hoogen etal., 1998) and resorcinol (Monsigny, Petit, & Roche, 1998) onmicrotitration plates (nunc, Maxisorp, VWR international S.A.S.,Fontenay-sous-bois, France) further analysed with a microplatespectrophotometer (Opsis MR; Dynex technologies, VA, USA). l-Arabinose and d-galacturonic acid (Sigma–Aldrich Chimie S.a.r.l.,Saint Quentin Fallavier, France) were used as standards. The UAcontent was directly determined with the m-HBP test. The NS quan-tification was calculated after correction of the interference due touronic acid for the resorcinol assay. All analyses were performed intriplicate.
2.5. Polysaccharide hydrolysis and trimethylsilylation of sugars
Pectins and pectin oligomers (5 mg/ml) were methanol-ysed with 0.5 M HCl in methanol (2.5 ml), under argon, at80 ◦C during 20 h, and then the methanolysates were driedunder argon. O-methylglycosides were dissolved in 400 �l of apyridine/BSTFA [N,O-bis (trimethylsilyl)-trifluoroacetamide withtrimethylchlorosilane] mixture (1:1, v/v) provided by PierceThermo Scientific Inc., Rockford, IL. The preparation was incubatedat 4 ◦C for 10 h before GC–MS analysis.
2.6. GC–MS analysis
The sugar composition was determined by gas chromatog-raphy (GC) (HP 6890) coupled with a mass spectrometer (MS)(Agilent Technologies, Massy, France) operating in EI-MS mode.
(25 m × 200 �m). The GC temperature program was 120 ◦C for10 min, linear temperature gradient of 5 ◦C/min to 240 ◦C, and holdat 240 ◦C for 10 min. The carrier gas was helium at flow rate of0.9 ml/min (inlet 250 ◦C, transfer line 280 ◦C, source 220 ◦C, electronimpact ionization (EI) 70 eV).

1234 J.-P. Ele-Ekouna et al. / Carbohydrate Polymers 83 (2011) 1232–1239
dure o
2
Asswloreb
2
(aDf
Scheme 1. Extraction proce
.7. NMR analysis
1H NMR spectra of pectin extracts dissolved in D2O (99.9% D,ldrich) (10 mg/ml) were recorded at 80 ◦C on a Bruker Avance 300pectrometer (Bruker BioSpin S.A., Wissembourg, France) with pre-aturation of the residual water signal. 1H spectra were obtainedith a spectral window of 3000 Hz for 16 k data points with a pulse
ength of 7 �s, an acquisition time of 2.74 s, and a relaxation delayf 1 s. 1H chemical shifts were expressed in parts per million (ppm)elative to internal 3-trimethylsilylpropionate-d4 (TSP-d4). All NMRxperiments were carried out using the pulse sequences providedy Bruker.
.8. Pectin esterification analysis
The degree of methylation (DM) and the degree of acetylationDA) were determined by quantification of methanol and acetatefter saponification of pectin extracts. Pectins were dissolved in2O (10 mg/ml), and a first 1H NMR experiment at 80 ◦C was per-
ormed in order to check the absence of free methanol and acetate.
f pectin from green tea leaf.
Then, 100 �l of NaOD (1 M) in D2O was added in the NMR tube,and 256 scans were further recorded 10 min after the addition ofNaOD. Under the conditions applied, saponification was complete,and no methanol evaporation was observed. The DM and DA valueswere then calculated as described previously (Bédouet, Courtois, &Courtois, 2003) and expressed in percent per residue.
2.9. Enzymatic digestion and oligosaccharides purification
The endo pectin lyase (PL) (EC 4.2.2.10) from Aspergillus niger(Sigma–Aldrich Chimie S.a.r.l., Saint-Quentin Fallavier, France) wasused to cleave pectins. Oligomers produced by enzymatic hydrol-ysis contained a terminal non-reducing residue with a 4,5-doublebond due to a �-elimination cleavage mechanism. PL (0.02 U/mgof pectin) was added to pectin extracts and dissolved in a sodium
phosphate buffer (50 mM, pH 5). After 8 h of incubation at 37 ◦C,the degradation was stopped by heating at 80 ◦C for 10 min;then, the mixture was cooled to 4 ◦C and centrifuged (10,000 × g,4 ◦C, 5 min). The supernatant containing pectin oligomers wasrecovered, desalted over cation-exchange resins (Dowex 50Wx8
J.-P. Ele-Ekouna et al. / Carbohydrate Polymers 83 (2011) 1232–1239 1235
Table 1Yield and composition of pectin fractions extracted from green tea leaves with hot water (F1 and F2) and acidic (P1 and P2) extraction. Values were obtained from five distinctanalyses.
F1 F2 P1 P2
Yield (%)a 0.050 ± 0.010 0.015 ± 0.010 2.000 ± 0.100 1.200 ± 0.050
Protein (%)b Tracec Tracec 0.13 ± 0.01 Tracec
Polyphenol (%)b 13.0 ± 0.1 nd 11.0 ± 0.1 ndSugar (%)b 87.0 ± 0.2 12.8 ± 0.1 88.9 ± 0.2 11.0 ± 0.1
UA (%)d 62.6 ± 0.2 50.2 ± 0.2 62.1 ± 0.2 49.5 ± 0.2NS (%)d 36.9 ± 0.2 49.7 ± 0.2 36.8 ± 0.2 50.1 ± 0.2
nd: not detected.
mF
aBaat(
3
3
dtetFartptUFrdtmdtomSdaanmataecAy3
fractions were rich in galactose, arabinose, rhamnose, xylose andfucose in decreasing order. The ratio of galacturonic acid residueswas about 25% lower in P2 than in P1 (Table 2), but the propor-tion of the two deoxyoses, rhamnose and fucose, was higher in the
Table 2Degree of substitution by methyl groups (DM) and acetyl groups (DA) and monosac-charide composition (mol%) for pectin fractions obtained from green tea leavesunder acidic extraction. Values were obtained from five distinct analyses.
P1 P2
DMa 52.0 ± 0.2 61.0 ± 0.2DAa 36.0 ± 0.2 32.0 ± 0.2
GalA 60.70 ± 0.20 48.40 ± 0.10Ara 14.50 ± 0.05 17.50 ± 0.05Gal 14.10 ± 0.05 18.90 ± 0.05Rha 3.40 ± 0.02 7.30 ± 0.02Xyl 0.60 ± 0.01 2.50 ± 0.01GlcA 1.20 ± 0.01 nd
a Calculated as weight % of initial material.b Calculated as weight % of extracted fractions.c Present at trace levels and not quantified.d Uronic acid (UA) and neutral sugar (NS) contained in the sugar fraction.
iniature columns, Sigma–Aldrich Chimie S.a.r.l., Saint-Quentinallavier, France) and dried by lyophilisation.
Size fractionation of the degraded pectins was carried out incolumn (21.5 × 300 mm) filled with TSK G 2000 SW gel (Tosohioscience GmbH, Stuttgart, Germany). The eluent was 50 mMmmonium acetate buffer pH 5 operating at a flow rate of 6 ml/min,nd the injected samples were 2 ml of pectin solutions in the elu-ion buffer (5 mg/ml). The detector was a RID10A refractometerShimadzu, Champs-sur-Marne, France).
. Results and discussion
.1. Characterization of pectin fractions
The pectin extraction procedure from green tea leaves isescribed in Scheme 1. The hot water pectin extract produce frac-ion called F which was dried and weighted. From five independentxtractions, fraction F represented only 0.065 ± 0.010% (w/w) of theotal tea leaf fraction (TLF). Two sub-fractions were obtained from: the first one called F1 was dissolved in water more quickly (3 h)nd more easily than the second one called F2 (10 h). These fractionsepresented, respectively, 77% and 23% of the F extract (w/w). In thewo sub-fractions from F, protein was detected as trace, whereasolyphenols were present only in F1 (Table 1). The sugar composi-ion of the two F sub-fractions revealed to be different: in F1, theA/NS ratio was 1.69 ± 0.20 (Table 1) compared to 1.01 ± 0.20 in2. These results indicate the presence of two distinct polysaccha-ides in green tea leaf extracts. Our results were compared to thoseescribed in the literature in order to determine if the presence ofhe two polysaccharides was due to the existence of two distinct
acromolecules in a same organ or to leaves collected on plants atifferent steps of their development. Until now, only the sugar con-ent in pectins, but also the content of alkaloids and catechins in flaxr in tea leaves, have been described to change along the develop-ent of the plant (Bédouet et al., 2006; Perva-Uzunalic et al., 2006).
o, the presence of two sub-fractions in F may correspond to twoistinct macromolecules extracted from leaves harvested on plantst different steps of development, such as nascent leaves in budsnd mature ones. However, at this level of experimentation, it wasot possible to explain the presence of polyphenols in F1. In fact,acromolecules in F1 contaminated by polyphenols were collected
fter precipitation with ethanol, but, normally, under the condi-ions applied, polyphenols should be soluble in this solvent. Furthernalysis of the polysaccharide structure would require more plant
xtracts which was not feasible with the hot water extraction pro-edure used in this study. The polysaccharide yield was too low.nother extraction methodology was considered to increase theield. An acid extraction methodology, HCl (50 mM) at 70 ◦C for0 min, was used and shown not to affect the sugar content andsubstitution of pectin extracts (Bédouet, Courtois, & Courtois, 2005;Bédouet et al., 2006). A fraction called P was extracted, which rep-resented 3.20 ± 0.15% of the TLF (w/w). The P extract was composedof two sub-fractions differing by their water solubility as observedpreviously for the F extract. The sub-fraction quickly and easily dis-solved in water (3 h) was called P1 and represented 62.5 ± 0.2% ofthe P extract (w/w). The second sub-fraction, P2, dissolved in waterafter a 10 h-stirring and corresponded to 37.5 ± 0.1% of the P extract(w/w) (Table 1). Proteins were present as traces in P as in F sub-fractions. Polyphenols were detected only in P1. In sub-fraction P1,the ratio UA/NS was 1.69 ± 0.20, as in F1 and 0.99 ± 0.20 both forF2 and P2 (Table 1). Extraction yield and composition for P1 andP2 after HCl (50 mM) extraction and for F1 and F2 after hot waterextraction revealed to be similar except for the yields (Table 1)where the ratio P1/P2 was lower than that of F1/F2. Due to the smallamount of material derived from F, the characterization of the twodistinct fractions obtained from green tea was further developedfor P1 and P2.
3.2. Polymers composition
1H NMR spectra from P1 and P2 (data not shown) presenteda high similarity except for signals corresponding to protons ofmethyl and acetyl residues. From these spectra, the degree ofmethylation was estimated to be about 17% higher in P2 than in P1,whereas the degree of acetylation of P2 molecules was about 11%lower than that for P1 (Table 2). Sugar analysis revealed that both
Fuc 0.40 ± 0.01 1.40 ± 0.01Glc 0.80 ± 0.01 ndApi Trace nd
nd: not detected.a Calculated as % of sugars fraction methylated or acetylated.

1 drate Polymers 83 (2011) 1232–1239
lgdpttatTfptrct
3
f(dpsTlpPsiaSa
t
Fig. 1. Size-exclusion chromatography on a TSK Gel G2000 SW column of pectinfractions obtained upon pectin-lyase degradation of P1 (a) and P2 (b) (5 mg/ml
236 J.-P. Ele-Ekouna et al. / Carbohy
ess water soluble pectin fraction (P2). In addition, the presence oflucuronic acid and glucose as well as traces of apiose in P1 wasetected. The presence of such carbohydrates led to suspect theresence of RG II sequences in the P1 pectin extract, in additiono the RG I sequences generally found in all pectin extracts. So,he pectin fraction easily dissolved in water (P1) contained highmounts of HGA, some RG I and traces of RG II. In P2, RG II seemedo be absent, and the proportion of HGA was lower than that of RG I.he presence of xylose in RG sequences from the two distinct pectinractions may be due to xylogalacturonan sequences in tea leafectin as described for apple pectins (Schols et al., 1995). Moreover,he methyl esterification of carboxylic groups from galacturonicesidues was higher in P2 than in P1. The differences of the sugaromposition and the substitution degrees for P1 and P2 pectin frac-ions could explain their different water solubility.
.3. Characterization of fractions derived from pectin degradation
In order to characterize the P1 and P2 pectin fractions obtainedrom green tea leaves, the analyses of RG and oligogalacturonanOGA) sequences in the two extracts were considered. A partialegradation of the pectin fractions was carried out using an endo-ectin lyase. The degradation products were then fractionated byize-exclusion chromatography on a TSK SW 2000 column (Fig. 1).he two elution profiles from P1 and P2 pectin fractions were simi-ar, only the ratios between the different fractions varied. The threeeaks obtained were noted A, B, and C. Sub-fractions A from P1 and2 eluted between 7 and 12 min that is in the column void volume,o the molecular weight of molecules contained in sub-fraction As likely to be higher than 3 × 10⁴ according to the column char-
cteristics, and sub-fractions B and C were classified as oligomers.ub-fractions A, B and C from P1 and P2 were collected, lyophilisednd weighted.Monosaccharide sugars composition analysis (Table 3) revealedhat arabinose and galactose were the main components of the
Fig. 2. Chemical structure of tea pectin fractions: (a) structure for P1A and P2A:
in 50 mM CH3COONH4 buffer pH 5). The eluent was 50 mM CH3COONH4 bufferpH 5. The flow rate was 6 ml/min. The detector was a refractometer. A, B and Ccorresponded to the collected fractions.
high-molecular-weight fractions P1A and P2A, suggesting that
these fractions consist mainly of RG I sequences (Fig. 2). However,the detection of apiose and glucuronic acid residues in P1A led usto consider the presence of RG II sequences only in the P1 eas-ily water soluble tea pectin extract. The presence of low amountsRG I sequence and (b) structure for P1B, P2B, P1C and P2C: HGA sequence.
J.-P. Ele-Ekouna et al. / Carbohydrate Polymers 83 (2011) 1232–1239 1237
Table 3Yield and composition of sub-fractions (A, B, C) obtained from P1 and P2 pectin fractions degraded by a pectin lyase. Values were obtained from five distinct analysis.
A B C
P1 P2 P1 P2 P1 P2
Yield (%)a 38.0 ± 0.2 54.0 ± 0.2 32.0 ± 0.2 21.0 ± 0.1 30.0 ± 0.2 26 ± 0.1Polyphenolb – – + – + –
DMc 22.1 ± 0.2 24.4 ± 0.3 23.8 ± 0.2 56.0 ± 0.5 46.0 ± 0.5 73.1 ± 1.0DAc 26.3 ± 0.2 10.3 ± 0.1 47.5 ± 0.5 63.9 ± 0.8 41.5 ± 0.5 63.9 ± 1.0
GalAd 7.20 ± 0.20 13.90 ± 0.30 97.00 ± 2.00 97.00 ± 2.00 98.00 ± 2.00 96.00 ± 2.00Arad 43.20 ± 1.00 37.30 ± 1.00 2.00 ± 0.05 2.00 ± 0.05 1.00 ± 0.05 1.70 ± 0.05Gald 39.10 ± 1.00 34.00 ± 1.00 1.30 ± 0.05 1.50 ± 0.05 1.20 ± 0.05 2.30 ± 0.05Rhad 4.90 ± 0.10 8.90 ± 0.20 nd nd nd ndXyld 1.20 ± 0.05 4.00 ± 0.10 nd nd nd ndGlcAd 1.40 ± 0.05 nd nd nd nd ndFucd 0.80 ± 0.05 1.90 ± 0.05 nd nd nd ndGlcd 1.60 ± 0.05 nd nd nd nd ndApid 0.70 ± 0.05 nd nd nd nd nd
nd: not detected.
ated a
oweCmtia
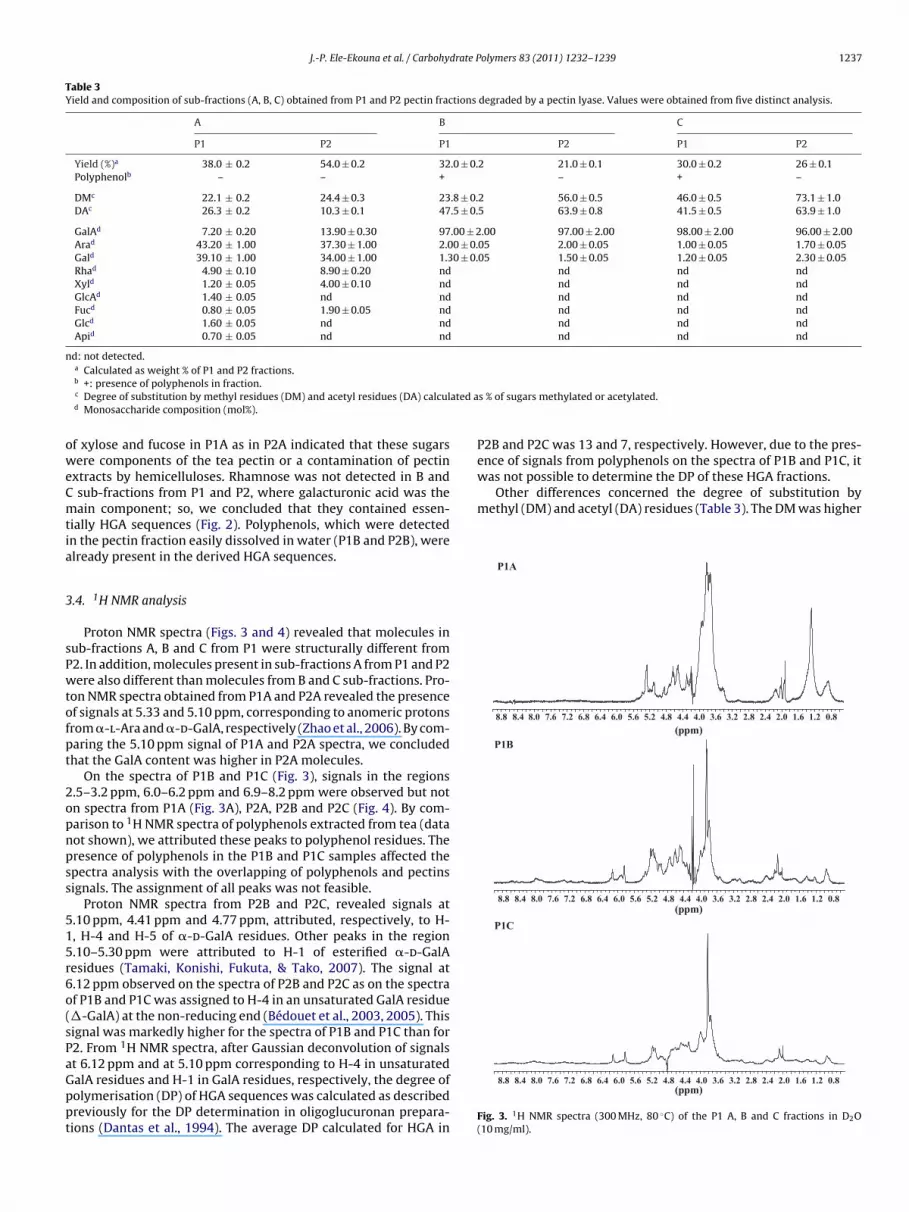
3
sPwtofpt
2opnpss
515r6o(sPaGppt
ence of signals from polyphenols on the spectra of P1B and P1C, itwas not possible to determine the DP of these HGA fractions.
Other differences concerned the degree of substitution bymethyl (DM) and acetyl (DA) residues (Table 3). The DM was higher
P1C
0.8 1.2 1.6 2.0 2.4 2.8 3.2 3.6 4.0 4.4 4.8 5.2 5.6 6.0 6.4 6.8 7.2 7.6 8.0 8.4 8.8
P1B (ppm)
(ppm)
0.8 1.2 1.6 2.0 2.4 2.8 3.2 3.6 4.0 4.4 4.8 5.2 5.6 6.0 6.4 6.8 7.2 7.6 8.0 8.4 8.8
P1A
a Calculated as weight % of P1 and P2 fractions.b +: presence of polyphenols in fraction.c Degree of substitution by methyl residues (DM) and acetyl residues (DA) calculd Monosaccharide composition (mol%).
f xylose and fucose in P1A as in P2A indicated that these sugarsere components of the tea pectin or a contamination of pectin
xtracts by hemicelluloses. Rhamnose was not detected in B andsub-fractions from P1 and P2, where galacturonic acid was theain component; so, we concluded that they contained essen-
ially HGA sequences (Fig. 2). Polyphenols, which were detectedn the pectin fraction easily dissolved in water (P1B and P2B), werelready present in the derived HGA sequences.
.4. 1H NMR analysis
Proton NMR spectra (Figs. 3 and 4) revealed that molecules inub-fractions A, B and C from P1 were structurally different from2. In addition, molecules present in sub-fractions A from P1 and P2ere also different than molecules from B and C sub-fractions. Pro-
on NMR spectra obtained from P1A and P2A revealed the presencef signals at 5.33 and 5.10 ppm, corresponding to anomeric protonsrom �-l-Ara and �-d-GalA, respectively (Zhao et al., 2006). By com-aring the 5.10 ppm signal of P1A and P2A spectra, we concludedhat the GalA content was higher in P2A molecules.
On the spectra of P1B and P1C (Fig. 3), signals in the regions.5–3.2 ppm, 6.0–6.2 ppm and 6.9–8.2 ppm were observed but notn spectra from P1A (Fig. 3A), P2A, P2B and P2C (Fig. 4). By com-arison to 1H NMR spectra of polyphenols extracted from tea (dataot shown), we attributed these peaks to polyphenol residues. Theresence of polyphenols in the P1B and P1C samples affected thepectra analysis with the overlapping of polyphenols and pectinsignals. The assignment of all peaks was not feasible.
Proton NMR spectra from P2B and P2C, revealed signals at.10 ppm, 4.41 ppm and 4.77 ppm, attributed, respectively, to H-, H-4 and H-5 of �-d-GalA residues. Other peaks in the region.10–5.30 ppm were attributed to H-1 of esterified �-d-GalAesidues (Tamaki, Konishi, Fukuta, & Tako, 2007). The signal at.12 ppm observed on the spectra of P2B and P2C as on the spectraf P1B and P1C was assigned to H-4 in an unsaturated GalA residue�-GalA) at the non-reducing end (Bédouet et al., 2003, 2005). Thisignal was markedly higher for the spectra of P1B and P1C than for2. From 1H NMR spectra, after Gaussian deconvolution of signals
t 6.12 ppm and at 5.10 ppm corresponding to H-4 in unsaturatedalA residues and H-1 in GalA residues, respectively, the degree ofolymerisation (DP) of HGA sequences was calculated as describedreviously for the DP determination in oligoglucuronan prepara-ions (Dantas et al., 1994). The average DP calculated for HGA ins % of sugars methylated or acetylated.
P2B and P2C was 13 and 7, respectively. However, due to the pres-
0.8 1.2 1.6 2.0 2.4 2.8 3.2 3.6 4.0 4.4 4.8 5.2 5.6 6.0 6.4 6.8 7.2 7.6 8.0 8.4 8.8 (ppm)
Fig. 3. 1H NMR spectra (300 MHz, 80 ◦C) of the P1 A, B and C fractions in D2O(10 mg/ml).

1238 J.-P. Ele-Ekouna et al. / Carbohydrate P
(ppm)0.81.21.62.02.42.83.23.64.04.44.85.25.66.06.46.87.27.68.08.48.8
P2C
(ppm)0.81.21.62.02.42.83.23.64.04.44.85.25.66.06.46.87.27.68.08.48.8
P2B
(ppm)0.81.21.62.02.42.83.23.64.04.44.85.25.66.06.46.87.27.68.08.48.8
P2A
F(
iPao
awaCpaUiewCwdldhP4ww
fm
ig. 4. 1H NMR spectra (300 MHz, 80 ◦C) of the P2 A, B and C fractions in D2O10 mg/ml).
n galacturonan sub-fractions P2B and P2C and more especially in2C. Moreover, the DA of P1A was at least double than that of P2And the DA of P2B and P2C was at least 1.5 times higher than thatf P1B and P1C.
For the 1H NMR spectra of sub-fractions A, B and C from P1nd P2 (Figs. 3 and 4), signals at 2.14, 2.07, 2.09 and 2.01 ppmere attributed, respectively, to methyl of acetyl group at C-2 in2-O-acetyl residue, at C-3 in a 3-O acetyl residue, at C-2 and at-3 of a 2,3-di-O-acetyl residue by comparison to NMR spectra ofolysaccharide, previously reported in the literature (Courtois etl., 1994; Parrone et al., 2002; Uhrinova, Petrakova, Ruppeldt, &hrin, 1990). The difference in intensity observed for these signals
ndicated that galacturonic residues in P1 and P2 possessed differ-nt acetylation patterns. The P1B fraction obtained from the easilyater-soluble pectin contained mainly residues monoacetylated at-2 (2.14 ppm), whereas for the P1C extract, diacetylated residuesere dominant (2.09 and 2.01 ppm). Regarding the P2B fractionerived from the less water-soluble pectin extract, monoacety-
ated residues at C-3 (2.07 ppm) were predominant, whereas in P2Ciacetylated residues were dominant (2.09 and 2.01 ppm). So, theighest DM and DA (Table 3) were found in HGA sequences P2B and2C of the less water-soluble pectin whereas HGA represented only7% of the pectin sequence; while HGA represented 62% in the moreater soluble pectin. Such differences have probably influenced the
ater solubility of the green tea leaves pectin extracts.In summary, four different HGA sequences were characterizedrom green tea leaf pectin: one HGA sequence with GalA residues
ainly monoacetylated at the C-2 position with a low DM (23.8%), a
olymers 83 (2011) 1232–1239
second HGA sequence with GalA residues mainly acetylated at theC-3 position with a DM value of 56%, a third HGA sequence withGalA residues mainly diacetylated presented DM and DA, respec-tively, of 46% and 41.5% and fourth HGA sequence with residuesmainly diacetylated and high DM and DA.
4. Conclusion
In conclusion, two distinct pectin fractions according to theirrelative solubility were extracted from tea leaves by water or HClaqueous solutions. The chemical characterization showed that thefraction easily soluble in water (P1) contained RG I and RG IIsequences, whereas no RG II typical sugars were detected in thesecond pectin extract less water soluble (P2). In the easily water sol-uble pectin fraction from tea leaves (P1), the proportion of HGA washigher than the less water-soluble pectin fraction (P2). Polyphe-nols were present in the pectin easily soluble fraction (F1 and P1)and surprisingly these polyphenols remained in the galacturonansequences obtained after pectin degradation with a pectin lyase,followed by a SEC chromatography. In addition, different DA andDM as well as acetylation pattern were deduced from NMR stud-ies for the two pectin extracts obtained from tea leaves; the DAand DM were higher in HGA sequences obtained from the lesswater soluble fraction (P2) than in the easily water soluble fraction(P1).
As polyphenols were present only in oligogalacturonansequences (OGA) with specific substitution patterns, we assumedthat interactions between pectins and polyphenols may be present,as previously described for polyphenols and apples cell wall(Renard, Baron, Guyot, & Drilleau, 2001). Further studies on theinteractions of polyphenols with OGAs presenting specific esterifi-cation patterns, as those observed on the OGAs from the tea leafpectins will be completed. Such interactions will be considereddue to the biological properties of polyphenols and the importantconsumption of tea beverage (Muktar & Ahmad, 2000).
References
Almajano, M. P., Carbó, R., López Jiménez, J. A., & Gordon, M. H. (2008). Antioxidantand antimicrobial activities of tea infusions. Food Chemistry, 108, 55–63.
Bédouet, L., Courtois, B., & Courtois, J. (2003). Rapid quantification of O-acetyl andO-methyl residues in pectin extracts. Carbohydrate Research, 338, 379–383.
Bédouet, L., Courtois, B., & Courtois, J. (2005). Methods for obtaining neutral and acidoligosaccharides from flax pectins. Biotechnology Letters, 27, 33–40.
Bédouet, L., Denys, E., Courtois, B., & Courtois, J. (2006). Changes in esterified pectinsduring development in the flax stems and leaves. Carbohydrate Polymers, 65,165–173.
Bradford, H. M. (1976). A rapid and sensitive method for the quantification ofmicrogram quantities of protein utilizing the principal of protein-dye binding.Analytical Biochemistry, 72, 248–254.
Chau, C. F., Chen, C. H., & Wang, Y. T. (2004). Effects of a novel pomace fiber on lipidand cholesterol metabolism in the hamster. Nutrition Research, 24, 337–345.
Chung, K. T., Wong, T. Y., Wie, C. Y., Huang, Y. Y., & Lin, Y. Y. (1998). Tannins and humanhealth: A review. Critical Reviews in Food Science and Nutrition, 38, 421–536.
Courtois, J., Seguin, J. P., Roblot, C., Heyraud, A., Gey, C., Dantas, L., et al. (1994).Exopolysaccharide production by the Rhizobium meliloti M5N1CS strain. Loca-tion and quantitation of the sites of O-acetylation. Carbohydrate Polymer, 25,7–12.
Dantas, L., Courtois, J., Courtois, B., Seguin, J. P., Gey, C., & Heyraud, A. (1994). NMRspectroscopic investigation of oligoglucuronans prepared by enzymic hydrolysisof a (1 → 4)-�-d-glucuronan. Carbohydrate Research, 265, 303–310.
Drusch, S. (2007). Sugar beet pectin: A novel emulsifying wall component formicroencapsulation of lipophilic food ingredients by spray-drying. Food Hydro-colloids, 21, 1223–1228.
Duan, J. Y., Wang, X. S., Dong, Q., Fang, J. N., & Li, X. Y. (2003). Structure featuresof pectin arabinogalactan with the immunological activity from the leaves ofDiospyros kaka. Carbohydrate Research, 338, 1291–1297.
Ferrara, L., Montesano, D., & Senatore, A. (2001). The distribution of minerals and
flavonoids in the tea plant (Camellia sinensis). Il Farmaco, 56, 397–401.Frei, B., & Higdon, J. V. (2003). Antioxidant activity of tea polyphenols in vivo: Evi-dence from animal studies. Journal of Nutrition, 133, 3275S–3284S.
Herve du Penhoat, C., Gey, C., Pellerin, P., & Perez, S. (1999). An NMR solution study ofthe mega-oligosaccharide rhamnogalacturonan II. Journal of Biomolecular NMR,14, 253–271.

drate P
H
K
K
K
K
K
K
K
L
M
M
M
M
O
O
P
P
P
R
Voragen, A. G. J., Pilnik, W., Thibault, J. F., Axelos, M. A. V., & Renard, C. M. G. C. (1995).
J.-P. Ele-Ekouna et al. / Carbohy
uang, M. T., Ho, C. T., Wang, Z. Y., Ferraro, T., Finnegan-Olive, T., Lou, Y. R., et al.(1992). Inhibitory effect of topical application of a green tea polyphenol fractionon tumor initiation and promotion in mouse skin. Carcinogenesis, 13, 947–954.
han, N., & Mukhtar, H. (2007). Tea polyphenols for health promotion. Life Sciences,81, 519–533.
ilmartin, P. A., & Hsu, C. F. (2003). Characterization of polyphenols in green, oolong,and black teas, and in coffee, using cyclic voltammetry. Food Chemistry, 82,501–512.
im, H., & Fassihi, R. (1997). Application of a binary polymer system in drug releaserate modulation. 1. Characterization of release mechanism. Journal of Pharma-ceutical Sciences, 86, 316–322.
im, M. (2005). High-methoxyl pectin has greater enhancing effect on glucoseuptake in intestinal perfused rats. Nutrition, 21, 372–377.
nee, M. (1978). Properties of polygalacturonate and cell cohesion in apple fruitcortical tissue. Phytochemistry, 17, 1257–1261.
ris-Etherton, P. A., & Keen, C. L. (2002). Evidence that the anti-oxidant flavonoidsin tea and cocoa are beneficial for cardiovascular health. Current Opinion inLipidology, 13, 41–49.
ritchevsky, D. (1995). Dietary fibre and its effects on cancer incidence. In J. Arcos(Ed.), Chemical induction of cancer (pp. 357–369). Birkhauser Boston Publisher.
u, T. M., Lee, C. C., Maud, J. L., & Lin, S. D. (2010). Quality and antioxidant propertyof green tea sponge cake. Food Chemistry, 119, 1090–1095.
ay, C. D. (1990). Industrial pectins: Sources, production and applications. Carbo-hydrate Polymers, 12, 79–99.
ohnen, D. (2008). Pectin structure and biosynthesis. Current Opinion in Plant Biol-ogy, 11, 266–277.
onsigny, M., Petit, C., & Roche, A. C. (1998). Colorimetric determination of neutralsugars by a resorcinol sulfuric acid micromethod. Analytical Biochemistry, 175,525–530.
uktar, H., & Ahmad, N. (2000). Tea polyphenols: Prevention of cancer and optimiz-ing health. American Journal of Clinical Nutrition, 71, 1698S–1702S.
’Neill, M, Albersheim, P., & Darvill, A. (1997). Pectic polysaccharides. In P. M. Dey, &J. B. Harbone (Eds.), Methods in carbohydrate chemistry (pp. 478–512). New York:Academic Press.
’Neill, M., Warrenfeltz, D., Kates, K., Pellerin, P., Doco, T., Darvill, A., et al. (1996).Rhamnogalacturonan-II, a pectic polysaccharide in the walls of growing plantcell, forms a dimer that is covalently cross-linked by a borate ester. Journal ofBiological Chemistry, 37, 22923–22930.
arrone, P., Hewage, C., Thomson, A., Bailey, K., Sadler, I., & Fry, S. (2002). Patternsof methyl esterification in spinach pectins: New complexity. Phytochemistry, 60,67–77.
erva-Uzunalic, A., Skerget, M., Knez, Z., Weinreich, B., Otto, F., & Grüner, S. (2006).Extraction of active ingredients from green tea (Camellia sinensis): Extraction
efficiency of major catechins and caffeine. Food Chemistry, 96, 597–605.ilgim, G. W., Walter, R. H., & Oakenfull, D. G. (1991). Jam, jellies and preserves. InR. H. Walter (Ed.), The chemistry and technology of pectin (pp. 23–50). AcademicPress.
alet, M. C., Cabrera, J. C., Bonnin, E., Quemener, B., Hellin, P., & Thibault, J. F. (2005).Mapping sugar beet pectin acetylation pattern. Phytochemistry, 66, 1832–1843.
olymers 83 (2011) 1232–1239 1239
Rees, D. A., & Wight, N. J. (1969). Molecular cohesion in plant cell walls. Methyla-tion analysis of pectic polysaccharides from the cotyledons of white mustard.Biochemical Journal, 115, 431–439.
Renard, C., Baron, A., Guyot, S., & Drilleau, J. F. (2001). Interactions between applecell walls and native polyphenols: Quantification and some consequences. Inter-national Journal of Biological Macromololecules, 29, 115–125.
Ridley, B. L., O’Neill, M. A., & Mohnen, D. (2001). Pectins: Structure, biosynthesis andoligogalacturonide-related signaling. Phytochemistry, 57, 929–967.
Rombouts, F. M., & Pilnik, W. (1978). The occurrence of pectolysis within the genusArthrobacter. Process in Biochemistry, 13, 9–12.
Ruan, Y. C., & Li, M. J. (1983). Regular analytical methods of tea. In Experiment hand-book of tea tree physiology and tea leaves biochemistry (pp. 165–166). Beijing:Press of Chinese Agriculture.
Schols, H. A., Bakx, E. J., Schipper, D., & Voragen, A. G. J. (1995). A xylogalacturo-nan subunit present in the modified hairy region of apple pectin. CarbohydrateResearch, 279, 265–279.
Song, M. G., Yang, F. K., He, N. Y., Fei, R. Y., Wang, J. X., & Wang, L. M. (1987). Deter-mination of tea polyphenols content. China national Standard, GB8313–GB8387.
Stewart, D., Iannetta, P. P. M., & Davies, H. V. (2001). Ripening-related changesin raspberry cell wall composition and structure. Phytochemistry, 56, 423–428.
Sudheesh, S., & Vijayalakshmi, N. R. (1999). Lipid lowering action of pectin fromCucumis sativus. Food Chemistry, 67, 281–286.
Tamaki, Y., Konishi, T., Fukuta, M., & Tako, M. (2007). Isolation and structural char-acterisation of pectin from endocarp of Citrus depressa. Food Chemistry, 107,352–361.
Thibault, J. F. (1979). Automatisation du dosage des substances pectiques par laméthode au métahydroxydiphényle. Lebensmittel Wissenschaft und Technologie,12, 247–251.
Thomas, J., Darvill, A., & Albersheim, P. (1989). Isolation and structural charac-terization of the pectic polysaccharide rhamnogalacturonan II from walls ofsuspension-cultured rice cells. Carbohydrate Research, 185, 261–277.
Uhrinova, S., Petrakova, E., Ruppeldt, J., & Uhrin, D. (1990). Assignment of carbonylcarbon and acetyl methyl proton resonances of acetylated saccharides by theuse of two-dimensional NMR techniques. Magnetic Resonance in Chemistry, 28,979–987.
Van den Hoogen, B. M., Van Weeren, P. R., Lopes-Cardozo, M., Van Golde, L. M. G.,Barneveld, A., & Van de Lest, C. H. A. (1998). A microliter plate assay for thedetermination of uronic acids. Analytical Biochemistry, 257, 107–111.
Vervuert, I., Klein, S., & Coenen, M. (2009). Effect of mixing dietary fiber (purified lig-nocellulose or purified pectin) and a corn meal on glucose and insulin responsesin healthy horses. Journal of Equine Veterinary Science, 29, 380–381.
In A. M. Stephen (Ed.), Food polysaccharides and their applications (pp. 287–339).New York: Dekker.
Zhao, Z., Li, J., Wu, X., Dai, H., Gao, X., Liu, M., et al. (2006). Structures and immuno-logical activities of two pectic polysaccharides from fruits of Ziziphus jujuba Mill.Cv. Jinsixiaozao Hort. Food Research International, 39, 917–923.