analysis of camellia sinensis green and black teas via ultra high performance liquid chromatography...
TRANSCRIPT

All
CGD
a
ARRAA
KCGB2UM
1
ct(eclgtfiadd
ioc
0d
Journal of Chromatography A, 1222 (2012) 29– 37
Contents lists available at SciVerse ScienceDirect
Journal of Chromatography A
jou rn al h om epage: www.elsev ier .com/ locat e/chroma
nalysis of Camellia sinensis green and black teas via ultra high performanceiquid chromatography assisted by liquid–liquid partition and two-dimensionaliquid chromatography (size exclusion × reversed phase)
amila T. Scoparo, Lauro M. de Souza, Nessana Dartora,uilherme L. Sassaki, Philip A.J. Gorin, Marcello Iacomini ∗
epartamento de Bioquímica e Biologia Molecular, Universidade Federal do Paraná, CP 19046, CEP 81531-980, Curitiba, PR, Brazil
r t i c l e i n f o
rticle history:eceived 8 August 2011eceived in revised form 17 October 2011ccepted 20 November 2011vailable online 25 November 2011
eywords:amellia sinensis
a b s t r a c t
Green and black teas (Camellia sinensis) contain compounds ranging from simple phenolics to complexglycosides, many of which have well-recognized health benefits. Here, we describe two methodologiesaiming to achieve a comprehensive analysis of hydro-alcoholic extracts of C. sinensis. In the first step, theextracts were partitioned in water, n-butanol, ethyl acetate and chloroform to separate the compoundsaccording to their polarity, yielding less complex samples to be analyzed by ultra high performanceliquid chromatography coupled with mass spectrometry (UHPLC–MS). Additionally, a comprehensivetwo dimensional liquid chromatography (2D-LC) technique, employing size exclusion chromatography
reen tealack teaD-LCHPLCass spectrometry
(SEC) × reversed phase (BEH-C18) was developed. The following compounds were identified on the basisof retention time, UV-spectra and MS fragmentation patterns: catechins, theaflavins and their gallatederivatives; kaempferol, quercetin and myricetin mono-, di-, tri- and tetraglycosides; esters of quinicacid and gallic or hydroxycinnamic acids; purine alkaloids, such as caffeine and theobromine and manylipids. Additionally, there were many novel compounds that were previously undescribed, such as saponinisomers and gallic acid esters of four glycosides of myricetin, quercetin and kaempferol.
. Introduction
Plant extracts are complex mixtures containing a great variety ofompounds in different amounts. Conventional chromatographicechniques, such as high performance liquid chromatographyHPLC), used to analyze plant extracts are challenging. How-ver, in recent years, a comprehensive two-dimensional liquidhromatography (2D-LC) has been exploited as a powerful ana-ytical technique to study complex matrices. 2D-LC has a muchreater resolving power compared to a single-dimensional LC. Inhe heart-cutting LC × LC system, only selected fractions from therst column are applied to the second dimension, whereas in
comprehensive LC × LC system, all the fractions over the firstimension are continuously sampled and transferred to the secondimension [1–3].
Comprehensive two-dimensional systems have been employed
n the analysis of several natural compounds, such as polymers,rganic acids and aromatics [4–8]. Typically, an LC × LC systemombines two columns with different separation mechanisms in∗ Corresponding author. Tel.: +55 41 3361 1577; fax: +55 41 3266 2042.E-mail addresses: [email protected], [email protected] (M. Iacomini).
021-9673/$ – see front matter © 2011 Elsevier B.V. All rights reserved.oi:10.1016/j.chroma.2011.11.038
© 2011 Elsevier B.V. All rights reserved.
order to achieve better separation, identification and quantifica-tion. Good resolution of compounds prior to MS detection improvesthe reliability of the MS results by decreasing matrix suppression.In any LC × LC combination, the speed of the second dimensiondetermines the overall analytical time. This speed should be as fastas possible, with good resolution. To achieve a fast speed, shortcolumns packed with small particles or monolithic columns areutilized [2,3]. Thus, a combination of HPLC with ultra performanceliquid chromatography (UHPLC) offers a good configuration for acomprehensive 2D system. For example, the separation power ofultra high performance liquid chromatography and comprehensivetwo-dimensional liquid chromatography of phenolic compounds inbeverages were analyzed, and comprehensive 2D-LC proved to giveclearly higher peak capacities compared with 1D HPLC and UHPLCanalyses. Although the use of HPLC monolithic columns in the sec-ond dimension provided good results, employing UHPLC columnswith gradient system was satisfactory in the analysis of selectedphenolic compounds [9].
In another study, a high speed second dimension comprehensive
LC × LC system allowed for the separation of components containedin Stevia rebaudiana extracts. Specifically, 10 glycosides were sepa-rated and identified from these extracts [10]. Also, in a recent studyan ultra rapid chromatography was used in the second dimension
3 omato
fulpsi[
scigmm(uhe
stCtat[
sacH(a
2
2
maSggfi
2
mloeBl
pCsBtoSsB
0 C.T. Scoparo et al. / J. Chr
or a comprehensive LC × LC method, which has been successfullysed in the separation of complex degraded samples of alprazo-
am tablets. The combination of SB-CN and a C18 stationary phaserovided enough orthogonality to build a 2D system. This UHPLCystem has proven to be a promising tool for 2D separations, mainlyn the second dimension where shorter analysis times are critical11].
Historically, teas from Camellia sinensis have provoked muchcientific interest concerning their biological effects and chemi-al composition [12–14]. The difference between the componentsn many tea preparations depends mainly on processing androwth/harvest conditions. Thus, teas are generally classified by theanufacturing process into the following four categories: unfer-ented (white and green), fermented (black), semi-fermented
oolong) and post-fermented (pu-erh tea, dark tea and related prod-cts) [15,16]. Even today, the chemical composition of C. sinensisas been explored, and novel compounds are continuously discov-red [16].
There are numerous studies about the composition of C.inensis demonstrating that teas contain purine alkaloids (xan-hines), phenolic compounds (catechins, O-glycosylated flavonols,-glycosylated flavones, proanthocyanidins and phenolic acids andheir derivatives), terpenoids, fatty acids, essential oils and aminocids [17–23]. Oolong and black teas also contain the oxida-ion products of catechins, theaflavins and polymeric thearubigins22,23].
Considering the great number of compounds, green and black C.inensis teas provide a good model for the development of novelnalytical approaches. Herein, we present the application of aomprehensive 2D-LC with real phytochemical samples, using anPLC × UHPLC system that employs size exclusion chromatography
SEC) as a first dimension followed by reversed phase (BEH-C18) as second.
. Experimental
.1. Chemicals
The following HPLC-grade solvents were purchased from Tedia:ethanol, formic acid, chloroform, ethyl-acetate, n-butanol and
cetonitrile. MilliQ (Millipore) water was used for deionized water.tandards of catechin, flavone, chlorogengic acid, caffeic acid, api-enin, theobromine, rutin, caffeine, myricetin, kaempferol andallic acid were obtained from Sigma. All solvents and samples wereltered through a 0.22 �m membrane prior to chromatography.
.2. Samples, extraction and fractionation
The samples (green and black teas) were purchased in a localarket (Curitiba, State of Paraná, Brazil) as commercially processed
eaves. Samples (15 g of each) were extracted by refluxing in 300 mlf a hydro-alcoholic solution (ethanol, 70%) for 1 h (3 times). Thextracts were combined to give the samples G70 (green tea) and70 (black tea), which were evaporated under reduced pressure,
yophilized and stored in a freezer at −20 ◦C.A portion of each sample (400 mg) was subjected to liquid/liquid
artitioning as follows: the samples were dissolved in H2O (10 ml),HCl3 (10 ml) was then added and the mixture was vigorouslytirred. The organic layer was removed to yield fractions G70C and70C. Some insoluble matter was retained in the aqueous phase,o which ethyl acetate (10 ml) was added and stirred. Similarly, the
rganic layer was removed to yield fractions G70EAc and B70EAc.ubsequently, n-BuOH (10 ml) was added to the aqueous phase,tirred and the layers separated to give fractions G70Aq, G70B,70Aq and B70B. The fractions were dried and stored in freezer.gr. A 1222 (2012) 29– 37
2.3. Instrumentation
2.3.1. Single-dimensional UHPLC analysisUltra high performance LC consisted in a Waters ACQUITY
UPLCTM System (Waters, Milford, MA) equipped with a binarysolvent pump, column oven, auto-sampler, a photodiode arraydetector (PDA) and evaporative light scattering (ELSD) was used. AnAcquity BEH-C18TM column, with 50 mm × 2.1 mm i.d. and 1.7 �mparticle size (Waters), was employed. The separation occurred at60 ◦C (column temperature) using a gradient of 0.1% formic acid(solvent A) and MeOH (solvent B). The following gradient was usedfor separation at flow rate of 0.4 ml min−1: a linear increase of sol-vent B from 0 to 80% over 12 min, 80% to 100% B over the next 2 min(14 min) and held at 100% B for an additional minute (15 min). Afterreturning to the initial conditions (0% B at 16 min), the system wasre-equilibrated for an additional 2 min.
The fractions from the liquid/liquid partition were prepared inMeOH–H2O (1:1, v/v) at 1 mg ml−1. The injection volume was 10 �land detection was provided by ELSD, PDA (200–400 nm) and bymass spectrometry (m/z 100–1600).
2.3.2. Off-line 2D-LC method SEC × LCThe first dimension was carried out using an HPLC LC10A
(Shimadzu) equipped with a SEC-column Ultrahydrogel-120, with300 mm × 7.8 mm and 5 × 10³ Da size exclusion (Waters). The sep-aration was developed in a gradient mode using H2O (solvent A)and acetonitrile (solvent B), at a flow rate of 1 ml min−1 at 60 ◦C.The linear increase of solvent B was from 0 to 50% over 40 min, helduntil 50 min and then B returned to the initial condition at 60 min.Subsequently, the column was reconditioned with solvent A for10 min. The crude samples, each at 50 mg ml−1, were prepared inMeOH–H2O (1:1, v/v) and the injection volume was 200 �l. Aliquotsof 1 ml were collected over the entire running time, dried under N2stream using a Reacti-Vap evaporator (Thermo Scientific) and thentransferred to UHPLC vials with 0.2 ml of MeOH–H2O (1:1, v/v).
The second dimension was carried out using a UHPLC systemequipped with a reversed phase (RP) BEH-C18 column as describedabove. The solvents were the same [formic acid 0.1% (A) and MeOH(B)], but the separation conditions were different. The flow ratewas 1 ml min−1, the column temperature was 80 ◦C and the gra-dient used was the following: 0% B held for 0.2 min, then 40% B at4 min and 100% B at 6 min and held for an additional minute (7 min).The gradient returned to the initial condition (0% B in 8 min) andthe column was reconditioned for an additional 2 min. The datafrom the PDA and ELSD detection, in the second dimension, werecollected as ASCII files and processed by Sigma-Plot 12.
2.3.3. ESI-MS conditionsPositive and negative ESI-MS were carried out at atmospheric
pressure ionization (API) with a triple quadrupole Quattro LC spec-trometer (Waters), using N2 as the nebulizer and desolvation gas.The samples were split post-column and injected into the ESI sourceat a constant flow rate of 100 �l min−1. The energy parameters fornegative and positive detection were the following, respectively:cone 40 V and capillary 2.4 kV; cone 60 V and capillary 2.8 kV withLiCl (5 mM) being added to the solvents. The samples were ana-lyzed in a total ion current (TIC) mode (m/z 100–1600) and thenfragmented using collision induced dissociation (CID) with argonas the collision gas, at energies ranging from 30 to 60 eV.
3. Results and discussion
3.1. Single-dimension UHPLC analysis
C. sinensis can be considered as a model for the development ofanalytical procedures for phytochemical mixtures. Highly complex
C.T. Scoparo et al. / J. Chromatogr. A 1222 (2012) 29– 37 31
cts fro
eipTBliPa[
3
haTve5a
cccaoo
ar34addmts
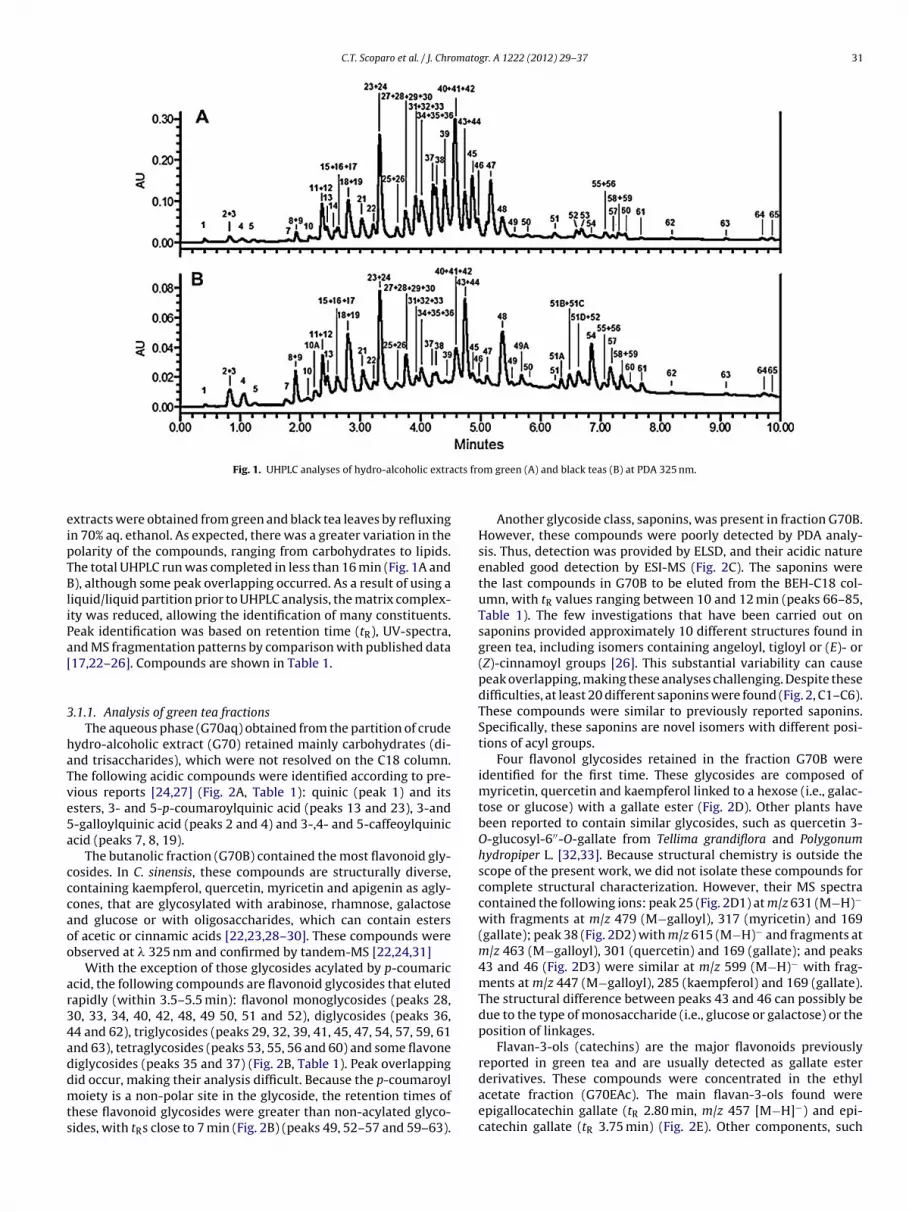
Fig. 1. UHPLC analyses of hydro-alcoholic extra
xtracts were obtained from green and black tea leaves by refluxingn 70% aq. ethanol. As expected, there was a greater variation in theolarity of the compounds, ranging from carbohydrates to lipids.he total UHPLC run was completed in less than 16 min (Fig. 1A and), although some peak overlapping occurred. As a result of using a
iquid/liquid partition prior to UHPLC analysis, the matrix complex-ty was reduced, allowing the identification of many constituents.eak identification was based on retention time (tR), UV-spectra,nd MS fragmentation patterns by comparison with published data17,22–26]. Compounds are shown in Table 1.
.1.1. Analysis of green tea fractionsThe aqueous phase (G70aq) obtained from the partition of crude
ydro-alcoholic extract (G70) retained mainly carbohydrates (di-nd trisaccharides), which were not resolved on the C18 column.he following acidic compounds were identified according to pre-ious reports [24,27] (Fig. 2A, Table 1): quinic (peak 1) and itssters, 3- and 5-p-coumaroylquinic acid (peaks 13 and 23), 3-and-galloylquinic acid (peaks 2 and 4) and 3-,4- and 5-caffeoylquiniccid (peaks 7, 8, 19).
The butanolic fraction (G70B) contained the most flavonoid gly-osides. In C. sinensis, these compounds are structurally diverse,ontaining kaempferol, quercetin, myricetin and apigenin as agly-ones, that are glycosylated with arabinose, rhamnose, galactosend glucose or with oligosaccharides, which can contain estersf acetic or cinnamic acids [22,23,28–30]. These compounds werebserved at � 325 nm and confirmed by tandem-MS [22,24,31]
With the exception of those glycosides acylated by p-coumariccid, the following compounds are flavonoid glycosides that elutedapidly (within 3.5–5.5 min): flavonol monoglycosides (peaks 28,0, 33, 34, 40, 42, 48, 49 50, 51 and 52), diglycosides (peaks 36,4 and 62), triglycosides (peaks 29, 32, 39, 41, 45, 47, 54, 57, 59, 61nd 63), tetraglycosides (peaks 53, 55, 56 and 60) and some flavoneiglycosides (peaks 35 and 37) (Fig. 2B, Table 1). Peak overlapping
id occur, making their analysis difficult. Because the p-coumaroyloiety is a non-polar site in the glycoside, the retention times ofhese flavonoid glycosides were greater than non-acylated glyco-ides, with tRs close to 7 min (Fig. 2B) (peaks 49, 52–57 and 59–63).
m green (A) and black teas (B) at PDA 325 nm.
Another glycoside class, saponins, was present in fraction G70B.However, these compounds were poorly detected by PDA analy-sis. Thus, detection was provided by ELSD, and their acidic natureenabled good detection by ESI-MS (Fig. 2C). The saponins werethe last compounds in G70B to be eluted from the BEH-C18 col-umn, with tR values ranging between 10 and 12 min (peaks 66–85,Table 1). The few investigations that have been carried out onsaponins provided approximately 10 different structures found ingreen tea, including isomers containing angeloyl, tigloyl or (E)- or(Z)-cinnamoyl groups [26]. This substantial variability can causepeak overlapping, making these analyses challenging. Despite thesedifficulties, at least 20 different saponins were found (Fig. 2, C1–C6).These compounds were similar to previously reported saponins.Specifically, these saponins are novel isomers with different posi-tions of acyl groups.
Four flavonol glycosides retained in the fraction G70B wereidentified for the first time. These glycosides are composed ofmyricetin, quercetin and kaempferol linked to a hexose (i.e., galac-tose or glucose) with a gallate ester (Fig. 2D). Other plants havebeen reported to contain similar glycosides, such as quercetin 3-O-glucosyl-6′′-O-gallate from Tellima grandiflora and Polygonumhydropiper L. [32,33]. Because structural chemistry is outside thescope of the present work, we did not isolate these compounds forcomplete structural characterization. However, their MS spectracontained the following ions: peak 25 (Fig. 2D1) at m/z 631 (M−H)−
with fragments at m/z 479 (M−galloyl), 317 (myricetin) and 169(gallate); peak 38 (Fig. 2D2) with m/z 615 (M−H)− and fragments atm/z 463 (M−galloyl), 301 (quercetin) and 169 (gallate); and peaks43 and 46 (Fig. 2D3) were similar at m/z 599 (M−H)− with frag-ments at m/z 447 (M−galloyl), 285 (kaempferol) and 169 (gallate).The structural difference between peaks 43 and 46 can possibly bedue to the type of monosaccharide (i.e., glucose or galactose) or theposition of linkages.
Flavan-3-ols (catechins) are the major flavonoids previouslyreported in green tea and are usually detected as gallate ester
derivatives. These compounds were concentrated in the ethylacetate fraction (G70EAc). The main flavan-3-ols found wereepigallocatechin gallate (tR 2.80 min, m/z 457 [M−H]−) and epi-catechin gallate (tR 3.75 min) (Fig. 2E). Other components, such
32 C.T. Scoparo et al. / J. Chromatogr. A 1222 (2012) 29– 37
Fig. 2. UHPLC chromatograms of the following fractions of hydro-alcoholic extract from green tea: (A) aqueous fraction at 325 nm and (B) butanolic fraction at 325 nm. (C)Negative ESI-MS of butanolic fraction and extracted ions from saponins (C1–C5). (D) UHPLC–MS of extracted glycosides and their corresponding CID-MS spectra (D1–D3).UHPLC chromatograms of the ethyl acetate fraction (E) at 275 nm and the chloroform fraction (F) at 275 nm. (F1 and F2) represent positive and negative ESI-MS of lipids,respectively. Gall: gallate; Hex: hexose; Kaemp: kaempferol; Myr: myricetin; Quer: querctin.

C.T. Scoparo et al. / J. Chromatogr. A 1222 (2012) 29– 37 33
Table 1Identification of the compounds from green and black teas on single-dimension UPLC–MS.
Peak Rt [M−H]−(m/z) Structure Reference Peak Rt [M−H]−(m/z) Structure Reference
1 0.46 191 Quinic acid [19] 32 3.87 787 Myr-3-O-Hex-Rut [19]2 0.82 343 3-Galloylquinic acid [19] 33 3.90 479 Myr-3-O-Gal [19]3 0.82 331 Galloyl-Glc [21] 34 4.02 479 Myr-3-O-Glc [19]4 1.09 343 5-Galloylquinic acid [19] 35 4.03 431 Api-C-Glc [20]5 1.39 305 (+)-Gallocatechin [21] 36 4.06 625 Myr-3-O-Rut [19]6a 1.78 181 Theobromine [19] 37 4.24 563 Api-6-C-Ara-8-C-Glc [20]7 1.82 353 3-Caffeoylquinic acid [19,24] 38 4.25 615 Quer-Galloyl-Hex –8 1.91 353 5-Caffeoylquinic acid [19,24] 39 4.41 771 Quer-3-O-Gal-Rut [19]9 1.97 761 Gallocatechin-(4–8)epigallocatechin-3′-O-gallate [22] 40 4.58 431 Kaemp-Rha [19]
10 2.16 305 (−)-Gallocatechin [19] 41 4.6 771 Quer-3-O-Glc-Rut [19]10A 2.31 913 Theasinensis A [22] 42 4.62 463 Quer-3-O-Gal [19]
11 2.33 633 Strictinin [21] 43 4.72 599 Kaemp-Galloyl-Hex –12 2.34 577 Procyanidin dimer [21] 44 4.74 609 Quer-3-O-Rha-Gal [19]13 2.45 337 3-p-Coumaroylquinic acid [19,24] 45 4.88 755 Kaemp-3-O-Gal-Rut [19]14 2.52 483 Digalloyl-Glc [19] 46 4.96 599 Kaemp-Galloyl-Hex –15 2.62 745 Gallocatechin catechingallate [19] 47 5.18 755 Kaemp-3-O-Glc-Rut [19]16 2.63 290 (+)-Catechin [19] 48 5.40 433 Quer-pentoside [19]17 2.64 577 Procyanidin dimer [21] 49 5.42 593 Kaemp-3-O-pCA-Glc [19]18 2.80 457 (−)-Gallocatechin gallate [19] 49A 5.72 551 Epitheaflagalline-3-gallate [20]19 2.82 353 4-Caffeoylquinic acid [19,24] 50 5.84 417 Kaemp-Pent [19]20a 2.95 195 Caffeine [19] 51 6.26 463 Quer-3-O-Glc [19]21 3.05 289 (−)-Catechin [19] 51A 6.36 563 Theflavin [19]22 3.22 457 (+)-Gallocatechin Gallate [19] 51B 6.46 715 Theflavin-3-gallate [19]23 3.34 337 5-p-coumaroylquinic acid [19,24] 51C 6.49 715 Theflavin-3′-gallate [19]24 3.37 609 Gallocatechin dimer [21] 51D 6.61 867 Teaflavin-3-3′-digalate [19]25 3.56 631 Myr-Galloyl-Hex – 52 6.62 593 Kaemp 3-O-6′′-pCA-Glc [19]26 3.58 635 Trigalloyl-Glc [19] 53 6.72 1049 Quer-3-O-Glc-Rha-(pCA-Ara)-Hex [19]27 3.75 441 (+)(-)-Catechin gallate [19] 54 6.83 901 Quer-3-O-pCA-di Rha-Hex [19]28 3.76 447 Kaemp-3-O-Gal [19] 55 7.05 1049 Quer-3-O-Glc-Rha-(pCA-Ara)- Hex [19]29 3.78 787 Myr-3-O-Hex-Rut [19] 56 7.10 1033 Kaemp-3-O-pCA-Ara-Glc-Rha-Gal [19]30 3.80 447 Kaemp-3-O-Glc [19] 57 7.18 885 Kaemp-3-O-pCA-di Rha-Hex [19]31 3.86 609 (−)-Gallocatechin-3.3′-di-O-gallate [20] 58 7.33 1175 Unknown –59 7.33 901 Quer-3-O-pCA-di Rha-Hex [19] 86 13.69 555 SQMG (C16) [35]60 7.36 1033 Kaemp-3-O-pCA-Ara-Glc-Rha-Gal [19] 87a 13.93 813 MGDG (C20:2/C18:2) –61 7.68 885 Kaemp-3-O-pCA-di Rha-Hex [19] 88a 14.06 797 PC (C18:3/C19) –62 8.15 739 Kaemp-3-O-pCA-Glc-Rha [19] 89a 14.06 813 MGDG (C20:1/C18:3) –63 9.12 781 Kaemp-3-O-acetyl-di Rha-Hex [19] 90 14.08 865 Unknown lipid –64 9.71 1170 Unknown – 91 14.09 825 Unknown lipid –65 9.85 1060 Unknown – 92 14.26 831 PI (C18:3/C16) –66 10.34 1215 Floratheasaponin A isomer [23] 93a 14.32 944 DGDG (C18:3/C18:3) –67 10.36 1257 Foliatheasaponin I isomer [23] 94 14.39 809 PI (C16/C16) –68 10.50 1215 Floratheasaponin A isomer [23] 95 14.45 749 PG (C18/C16) –69 10.57 1257 Foliatheasaponin I isomer [23] 96 14.46 837 SQDG (C18:3/C18:3) [35]70 10.61 1263 Isotheasaponin B1/B2 isomer [23] 97a 14.48 782 PC (C18:2/C18:2) –71 10.75 1257 Foliatheasaponin I isomer [23] 98a 14.48 783 MGDG (C18:3/C18:3) –72 10.80 1263 Isotheasaponin B1/B2 isomer [23] 99a 14.50 781 MGDG (C18:3/C18:3) –73 10.90 1215 Floratheasaponin A isomer [23] 100a 14.56 922 DGDG (C18:3/C16) –74 10.91 1263 Isotheasaponin B1/B2 isomer [23] 101a 14.57 787 PC (C18:2/C18) –75 10.95 1319 Assamsaponin J isomer [23] 102a 14.57 789 PC (C18:1/C18) –76 10.98 1305 Foliatheasaponin IV isomer [23] 103 14.56 815 SQDG (C18:3/C16) [35]77 11.10 1319 Assamsaponin J isomer [23] 104 14.56 817 SQDG (C18:2/C16) [35]78 11.10 1263 Isotheasaponin B1/B2 isomer [23] 105 14.66 819 SQDG(C18:1/C16) [35]79 11.14 1305 Foliatheasaponin IV isomer [23] 106 14.66 793 SQDG (C16/C16) [35]80 11.24 1305 Foliatheasaponin IV isomer [23] 107 14.77 793 SQDG (C14/C18) [35]81 11.26 1263 Isotheasaponin B1/B2 isomer [23] 108 14.81 820 Unknown lipid –82 11.37 1319 Assamsaponin J isomer [23] 109a 14.83 767 Unknown lipid –83 11.58 1303 Isotheasaponin B3 isomer [23] 110 15.10 627 Unknown lipid –84 11.71 1303 Isotheasaponin B3 isomer [23] 111 15.30 528 Unknown lipid –85 11.86 1303 Isotheasaponin B3 isomer [23] 112a 15.33 891 Unknown lipid –
Kaemp: kaempferol; Myr: myricetin; Quer: quercetin; pCA: p-coumaroyl; Ara: arabinose; Gal: galactose; Glc: glucose; Hex: hexoside; Pent: pentoside; Rha: rhamnose; Rut:rutinoside. DGDG: digalactosyldiacylglycerol; MGDG: monogalactosyldiacylglycerol; PC: phosphatidylcholine; PG: phosphatidylglycerol; PI: phosphatidylinositol; SQDG:sulfoquinovosyldiacylglycerol; SQMG: sulfoquinovosylmonoacylglycerol.
alb[(od
a Identified in positive ESI-MS.
s gallocatechin, epigallocatechin, catechin, epicatechin and gal-ocatechin gallate (peaks 5, 10, 16, 21 and 22) were also found,ut in smaller amounts, which is consistent with previous reports17,24,34,35]. In addition to these compounds, condensed tannins
mainly dimers) were also found, which were identified on the basisf tandem-MS (Table 1) by comparison with previously reportedata [36].The chloroform fraction (G70C) from green tea was the last to beexamined. At a first glance of the PDA detection (Fig. 2F), the chro-matogram exhibited two peaks at tR values of 1.78 and 2.95 min,which were identified as theobromine and caffeine, respectively
(peaks 6 and 20), the most common purine alkaloids found inC. sinensis [17,22,24,37]. However, any lipid could be concen-trated in this fraction. Therefore, the fraction was examined using
34 C.T. Scoparo et al. / J. Chromatogr. A 1222 (2012) 29– 37
F ic extp
psawt91dt(S(pplwa
3
sf(2a1
ig. 3. UHPLC chromatograms of the following fractions of black tea hydro-alcoholhase at 275 nm, and (D) chloroform phase at 275 nm and lipids at ELSD (inserted).
ositive and negative ESI-MS and ELSD detection, revealing aeries of phospholipids and glycolipids (peaks 86–112) (Fig. 2F1nd F2). Using positive ion detection, the main lipids identifiedere phosphatidylcholine (PC, peaks 88, 97, 101 and 102) and
he glycolipids monogalactosyldiacylglycerol (MGDG, peaks 87, 89,8 and 99) and digalactosyldiacylglycerol (DGDG, peaks 93 and00), which appeared as Li+ adducts (Table 1). Using negative ionetection, a main glycolipid appeared at m/z 815 and was fur-her confirmed via tandem-MS as a sulfoquinovosyldiacylglycerolSQDG, peak 103) esterified by palmitic and linolenic acids. OtherQDG lipids were identified with different fatty acid combinationspeaks 96, 104–107) [38]. Phosphatidylglycerol (PG, peak 95) andhosphatidylinositol (PI, peaks 92 and 94) were the major phos-holipids found using the negative UHPLC–MS detection. All the
ipids detected contained many fatty acid combinations, mainlyith palmitic (C16:0), stearic (C18:0), oleic (C18:1), linoleic (C18:2)
nd linolenic (C18:3) acids [38].
.1.2. Analysis of black tea fractionsSimilar to green tea, the fractionation of black tea provided good
eparation of compounds based on their polarity. In the aqueousraction (B70Aq), the main compounds identified were quinic acid
peak 1) and their esters, such as 3- and 5-galloylquinic acid (peaksand 4, respectively), 3- and 5-p-coumaroylquinic acid (peaks 13nd 23) (Fig. 3A) and 3-, 4- and 5-caffeoylquinic acid (peaks 7, 8 and9).
ract: (A) aqueous phase at 325 nm, (B) butanolic phase at 325 nm, (C) ethyl acetate
Flavonoid glycosides concentrated in the B70B fraction weresmaller components than those found in green tea, appear-ing as peaks 39, 41, 45 and 47. However, flavonoid glycosidescontaining esters with a p-coumaroyl moiety were more evi-dent in black tea when compared with green tea (peaks 54,57, 59, 61 and 62, Fig. 3B). These flavonoid glycosides aremainly composed of quercetin or kaempferol attached to dif-ferent oligosaccharides from those found in glycosides lackinga p-coumaroyl group. These compounds were identified asquercetin-3-O-p-coumaroyldirhamnosylhexoside (peaks 54 and59), kaempferol-3-O-p-coumaroyl dirhamnosylhexoside (peaks 57and 61), kaempferol-3-O-p-coumaroylglucosylrhamnoside (peak62) and kaempferol-3-O-acetyl-dirhamnosylhexoside (peak 63),which have all been previously reported [22,24]. Furthermore,in contrast to green tea (G70B), this fraction did not containsaponins.
A considerable decrease in flavan-3-ol content occurs in blacktea as a result of enzyme activation (i.e., polyphenoloxidase) ratherthan catechin condensation products, such as theaflavins andthearubigins [39–42]. Here, the following theaflavins were highlyconcentrated in the ethyl acetate fraction (B70EAc), appearingon the RP-UHPLC between 6 and 7 min (Fig. 3C): theasinen-
sis A, epitheaflagalline-3-gallate, theaflavin, theaflavin-3-gallate,theaflavin-3′-gallate and theaflavin-3-3′-digallate (peaks 10A, 49A,51A, 51B, 51C and 51D). However, although previously reported inthe black tea, the thearubugins were not detected.
C.T. Scoparo et al. / J. Chromatogr. A 1222 (2012) 29– 37 35
F ed at 34
btrg
spPmpas
Fw
ig. 4. (A) 2D-chromatogram (SEC × LC) of green tea hydro-alcoholic extract obtain6, stated as novel glycosides; and (C) the region of minor components.
The chloroform fraction (B70C) concentrated caffeine and theo-romine, which appeared at 1.78 and 2.95 min (peaks 6 and 20) onhe UHPLC-PDA (Fig. 3D). Examination by ELSD and MS detectionevealed lipid contents in smaller amounts than those found in thereen tea fraction G70C (Fig. 3D).
Some peaks co-eluted with each other, impairing their analy-is (i.e., peaks 2 and 3; peaks 15, 16 and 17; peaks 18 and 19;eaks 27, 28, 29 and 30, peaks 40, 41 and 42 and many others).eak overlapping associated with MS ion suppression caused by theatrix components is a common problem in phytochemical sam-
les, resulting in serious problems when performing quantitativenalyses. In an attempt to overcome these challenges, comprehen-ive two-dimensional liquid chromatography was applied.
ig. 5. (A) 2D-chromatogram (SEC × LC) of green tea hydro-alcoholic extract at 275 nm, shoith ELSD of: (B) quinic acid and oligosaccharides and (C) saponins and lipids.
25 nm showing mainly the phenolic compounds. (B) Region of peaks 25, 38, 43 and
3.2. Comprehensive two-dimensional LC method
Two-dimensional liquid chromatography is considered to becomprehensive when the entire effluent from the first separation,and not just a selected region, is subjected to further separationin a second chromatographic system [5,6,10]. The chromatogramcan be plotted as a contour graph to display the components ofthe entire sample. This graph can be used to create a map or afingerprint that covers different experimental conditions, such asdifferent sample processing methodologies, which occurs in the
preparation of green and black teas.Considering the complexity of the matrix, we developedan offline 2D system (SEC × LC), combining HPLC × UHPLC. This
wing mainly flanvan-3-ols and xanthines; and partial 2D-chromatograms obtained

36 C.T. Scoparo et al. / J. Chromatogr. A 1222 (2012) 29– 37
ydro-
uwft
3
rtpsyppi
osmc(aaiwtm
aimatidstti
Fig. 6. 2D SEC × LC plot of black tea h
nusual application of SEC column (Ultrahydrogel 120 – Waters)as driven by our previous experience, in which many compounds
rom a plant extract (Maytenus ilicifolia), namely flavoinoids andheir glycosides were well separated by SEC column [43].
.2.1. Analysis of C. sinensis extractsThe higher peak capability and, consequently, the ability to
esolve a more complex matrix, is the major benefit of thewo-dimensional LC employed in the analysis of C. sinensis com-onents. Thus, compounds that were not distinguished in aingle-dimension could be separated and identified by 2D-LC anal-sis, making the results more reliable. Also, the chromatogramslotted in 2D-graphs allow for correlating the position of each com-ound as a function of two retention times, minimizing matrix
nterferences and misinterpretations.Despite the many different types of compounds in crude extracts
f green and black teas, as well as their low abundance, SEC analy-es provided good results. As expected, the compounds were elutedainly in the order of decreasing molecular weight, which allowed
ompounds that co-eluted in the single-dimensional analysisUHPLC) to be distinguished and well resolved in two-dimensionalnalysis (i.e., peaks 18 and 19; 27, 28, 29 and 30; and peaks 40, 41nd 42). Flavonoids and their corresponding glycosides had notablenteractions with the SEC column matrix (Figs. 4A–C and 5A). This
as first reported for flavonol glycosides from M. ilicifolia in whichhe SEC column from Waters was capable of distinguishing between
any compounds, including isomers [43].However, carbohydrates such as di- and trisaccharides observed
s lithiated ions at m/z 349 and 511, respectively, were eluted dur-ng the first 10 min (Fig. 5B). Regardless of their molecular mass,
any other compounds had longer tR values. The basis for SEC sep-ration is not clear. Compound polarizability and, consequently,heir solubility in the separation solvent must be considered as anmportant factor to describe the SEC separation, considering it waseveloped using a water/acetonitrile gradient. Nevertheless, mass
pectrometry detection showed that lipids (i.e., SQDG at m/z 815,he main lipid detected in negative ion mode) were eluted withR values ranging close to 22 min (Fig. 5C). It is also worth not-ng that flavonol triglycosides with deprotonated ions at m/z 755alcoholic extract obtained at 325 nm.
and 771 eluted close to the lipids. Additionally, many saponins,varying in molecular weight (1216–1320 Da) eluted close to lipidsand flavonol triglycosides in the first dimension (Figs. 4A and 5C,Supplementary Table 2). Thus, since the polarities of flavonol gly-cosides, saponins and lipids are quite distinct, the solubility in theeluent was not the main factor leading to SEC separation. Notably,the major components from C. sinensis, the flavan-3-ols, elutedclose to 30 min.
The main products of C. sinensis oxidation (the theaflavins fromblack tea), as detected by SEC analyses, eluted after 30 min andwere well separated by molecular weight: theaflavin 3,3′-digallate(tR 31.28 min, m/z 867), theaflavin 3- and 3′-gallate (tR 32.68 min,m/z 715) and theaflavin (tR 33.18 min, m/z 563). On the other hand,chlorogenic acids, found mainly in the black tea, had lower tR valueson the SEC column even with a molecular mass of 354 Da they wereeluted at 8.5 and 8.86 min (Fig. 6). The acidic characteristics of thesecompounds could be the main reason for the low interaction withthe SEC matrix as observed with free quinic acid, which had a tRvalue of 5.55 min, and other ester derivatives of quinic acids.
The second dimension, based on comprehensive 2D-LC, was per-formed on a UHPLC with gradient 2 (described in the ExperimentalSection). This method was faster than using a RP gradient 1 becauseof the faster flow rate of 1 ml min−1 used now, allowed by the lowercomplexity of each fraction from the first dimension. The use ofsuch a flow rate in a sub-2 �m particle size column can generatehigh backpressures, hindering analyses. In order to overcome this,recent methodologies have been employed using high tempera-tures, resulting in reduced viscosity and, consequently, a reductionin the backpressure [11,44]. Thus, we opted to use a temperature of80 ◦C, which was within the column limit and gave rise to a back-pressure of 11,000 psi (∼750 bar), also within the column limit. Inthis system, degradation of the stationary phase was not observed,considering that no changes in the peak resolution and separationpower were observed after this analysis.
Although the main compounds (typically the phenolics) eluted
before 3 min, in order to have comprehensive analyses of phyto-chemicals, the second dimensional analysis was extended to 8 minto incorporate saponins and lipids, which impair the online com-prehensive 2D-LC analyses.
omato
sdwitsflcm
4
1pctsfl
wioi(1eag
opfiSttcrclo
A
dNFs
A
t
R
[
[
[[[
[
[
[
[[
[
[[[
[
[
[
[
[[[[
[[
[[
[
[[
[
[[[
(1997) 693.[43] L.M. Souza, T.R. Cipriani, C.F. Sant’Ana, M. Iacomini, P.A.J. Gorin, G.L. Sassaki, J.
Chromatogr. A 1216 (2009) 99.[44] P. Dugo, F. Cacciola, T. Kumm, G. Dugo, L. Mondello, J. Chromatogr. A 1184
(2008) 353.
C.T. Scoparo et al. / J. Chr
The chromatograms of hydro-alcoholic extracts from C. sinen-is green and black teas were plotted in 2D graphs. As a result, theifference due to the oxidation compounds present in black teaas evident (Figs. 4A and 5). As described above, the main change
n the composition of black tea was the emergence of condensedheaflavins. However, other changes were the disappearance ofaponins and a drastic decrease in lipid content as well as someavonol glycosides. Thus, similar to 2D gel electrophoresis, 2Dhromatographic graphs could be used to draw a comprehensiveetabolic map.
. Conclusion
The well-studied C. sinensis plant was chosen as a model for aD-LC and comprehensive 2D-LC development. Using liquid–liquidartitioning in single-dimensional analyses (1D), several classes ofompounds were identified and, although outside of the scope ofhe present study, compounds not previously reported in C. sinen-is were found. These compounds were saponin isomers and fouravonol glycosides containing gallic acid esters.
Regarding two-dimensional (2D) analyses, the first dimensionas developed with an unusual SEC system, which proved to have
nteractions with the sample other than simple permeation basedn molecular masses. These interactions were shown by the prox-mity of how many different compounds eluted, notably saponinsMW 1216–1320 Da), lipids (MW 749–944 Da) and caffeine (MW94 Da). Each class of compounds, mainly phenolic classes, hadlution profiles based on their molecular weight, allowing the sep-ration of, for example, many flavonol glycosides with differinglycosyl moieties.
The combination of HPLC (SEC) and UHPLC (RP) provided therthogonality required for a 2D system. As much as possible, UHPLCrovided a fast analysis for complex matrices, making it efficientor second dimension analyses, considering that a reduced timen the second dimension has a key role in comprehensive 2D-LC.maller analysis times already had been achieved using UHPLC sys-em in the second dimension. However, the present work intendedo show the separation of compounds of very different chemi-al nature, yielding an analysis time greater than in previouslyeported [9–11]. Nevertheless, we believe that this is the first studyovering the entire complexity of a plant extract, from sugars toipids, including all the known products of secondary metabolismf C. sinensis.
cknowledgments
We wish to thank the Brazilian funding agencies: Coordenac ãoe Aperfeic oamento de Pessoal de Nível Superior (CAPES), Conselhoacional de Desenvolvimento Científico e Tecnológico (CNPq),undac ão Araucária and PRONEX-Carboidratos, for the financialupport.
ppendix A. Supplementary data
Supplementary data associated with this article can be found, inhe online version, at doi:10.1016/j.chroma.2011.11.038.
eferences
[1] I. Franc ois, A. Villiers, P. Sandra, J. Sep. Sci. 29 (2006) 492.
gr. A 1222 (2012) 29– 37 37
[2] P.J. Schoenmakers, G. Vivo-Truyols, W.C. Decrop, J. Chromatogr. A 1120 (2006)282.
[3] P. Dugo, F. Cacciola, M. Herrero, P. Donato, L. Mondello, J. Sep. Sci. 31 (2008)3297.
[4] A. Horst, P.J. Schoenmakers, G. Vivo-Truyols, W.C. Decrop, J. Chromatogr. A 1000(2003) 693.
[5] E. Blahová, P. Jandera, F. Cacciola, L. Mondello, J. Sep. Sci. 29 (2006) 555.[6] D.R. Stoll, J.D. Cohen, P.W. Carr, J. Chromatogr. A 1122 (2006) 123.[7] F. Cacciola, P. Jandera, Z. Hajdu, P. Cesla, L. Mondello, J. Chromatogr. A 1149
(2007) 73.[8] P. Dugo, F. Cacciola, P. Donato, D. Airado-Rodriguez, M. Herrero, L. Mondello, J.
Chromatogr. A 1216 (2009) 7483.[9] M. Kivilompolo, T. Hyotylainen, J. Sep. Sci. 31 (2008) 3466.10] F. Cacciola, P. Delmonte, K. Jaworska, P. Dugo, L. Mondello, J. Rader, J Chro-
matogr. A 1218 (2011) 2012.11] A.L. Huidobro, P. Pruim, P. Schoenmakers, C. Barbas, J. Chromatogr. A 1190
(2008) 182.12] N. Harold, P.H.D. Graham, Prev. Med. 21 (1992) 334.13] R. Cooper, D.J. Morré, D.M. Morré, J. Altern. Complement. Med. 11 (2005) 521.14] E.G. Mejia, M.V. Ramirez-Mares, S. Puangpraphant, Brain Behav. Immun. 23
(2009) 721.15] C.T. Ho, J.K. Lin, F. Shahidi, Tea and Tea Products. Chemistry and Health-
Promoting Properties, CRC Press, Boca Raton, 2008, p. 305.16] H.Y. Jiang, T. Shii, Y. Matsuo, T. Tanaka, Z.H. Jiang, I. Kouno, Food Chem. 129
(2011) 830.17] D. del Rio, A.J. Stewart, W. Mullen, J. Burns, M.E.J. Lean, F. Brighenti, A. Crozier,
J. Agric. Food Chem. 52 (2004) 2807.18] C. Lakenbrink, U.H. Engelhardt, V. Wray, J. Agric. Food Chem. 47 (1999) 4621.19] P. Miketova, K.H. Schram, J. Whitney, M. Li, R. Huang, E. Kerns, S. Valcic, R.
Rourick, S. Klohr, J. Mass Spectrom. 35 (2000) 860.20] X.L. Zhu, B. Chen, M. Ma, X.B. Luo, F. Zhang, S.Z. Yao, Z. Wan, D. Yang, H. Hang,
J. Pharm. Biomed. 34 (2004) 695.21] Z.H. Zhou, Y.J. Zhang, M. Xu, C.R. Yang, J. Agric. Food Chem. 53 (2005) 8614.22] L.Z. Lin, P. Chen, J.M. Harnly, J. Agric. Food Chem. 56 (2008) 8130.23] U.H. Engelhardt, in: Lew Mander, Hung-Wen (Ben) Liu (Eds.), Chemistry of Tea.
Comprehensive Natural Products II: Chemistry and Biology, Elsevier Scienceand Technology, Oxford, 2010, p. 999.
24] Y. Zhao, P. Chen, L. Lin, J.M. Harnly, L. Yu, Z. Li, Food Chem. 126 (2011)1269.
25] J. Dou, V.S.Y. Lee, T.C.T. Jason, M.R. Lee, J. Agric. Food Chem. 55 (2007)7462.
26] Y. Matsui, K. Kobayashi, H. Masuda, H. Kigoshi, M. Akao, H. Sakurai, H. Kumagai,Biosci. Biotechnol. Biochem. 73 (2009) 1513.
27] N. Dartora, L.M. Souza, A.P. Santana-Filho, M. Iacomini, A.T. Valduga, P.A.J. Gorin,G.L. Sassaki, Food Chem. 129 (2011) 1453.
28] A. Finger, U.H. Engelhardt, V. Wray, Phytochemistry 30 (1991) 2057.29] A. Finger, U.H. Engelhardt, J. Sci. Food Agric. 55 (1991) 313.30] A. Kiehne, U.H. Engelhardt, Z. Lebensm. Unters. Forsch. 202 (1996) 48.31] L.M. Souza, D. Endo, T.R. Cipriani, M. Iacomini, P.A.J. Gorin, G.L. Sassaki, J. Chro-
matogr. A 1207 (2008) 101.32] F.W. Collins, B.A. Bohm, C.K. Wilkins, Phytochem 14 (1975) 1099.33] Z.F. Peng, D. Strack, A. Baumert, R. Subramaniam, N.K. Goh, T.F. Chia, S.N. Tan,
L.S. Chia, Phytochem 62 (2003) 219.34] Z. Spácil, L. Nováková, P. Solich, Talanta 76 (2008) 189.35] A.P. Neilson, R.J. Green, K.V. Wood, M.G. Ferruzzi, J. Chromatogr. A 1132 (2006)
132.36] L.M. Souza, T.R. Cipriani, M. Iacomini, P.A.J. Gorin, G.L. Sassaki, J. Pharm. Biomed.
47 (2008) 59.37] Y. Zuo, H. Chen, Y. Deng, Talanta 57 (2002) 307.38] L.M. de Souza, M. Iacomin, P.A.J. Gorin, R.S. Sari, M.A. Haddad, G.L. Sassaki, Chem.
Phys. Lipids 145 (2007) 85.39] M. Friedman, S.Y. Kim, S.J. Lee, G.P. Han, J.S. Han, K.R. Lee, N. Kozukue, J. Food
Sci. 70 (2005) 550.40] M.J. Lee, S. Prabhu, X. Meng, C. Li, C.S. Yang, Anal. Biochem. 279 (2000) 164.41] A. Finger, S. Kuhr, U.H. Engelhardt, J. Chromatogr. 624 (1992) 293.42] D.A. Balentine, S.A. Wiseman, L.C.M. Bouwens, Crit. Rev. Food Sci. Nutr. 37