a liquid chromatography‐mass spectrometry approach to study “glucosinoloma” in broccoli...
TRANSCRIPT
Research article
Received: 25 January 2012 Revised: 9 May 2012 Accepted: 15 May 2012 Published online in Wiley Online Library
(wileyonlinelibrary.com) DOI 10.1002/jms.3028
1198
A liquid chromatography-mass spectrometryapproach to study “glucosinoloma” inbroccoli sprouts†
Mariateresa Maldini,* Simona Baima, Giorgio Morelli, Cristina Scaccini andFausta Natella
Glucosinolates are an important class of secondary plant metabolites, possessing health-promoting properties. Young broccoliplants are a very good source of glucosinolates with concentrations several times greater than in mature plants. The aim of our
study was to develop a liquid chromatography–mass spectrometry and liquid chromatography/tandem mass spectrometryqualitative and quantitative method for the measure of glucosinolates in broccoli sprouts. The described method provideshigh sensitivity and specificity, allowing a rapid and simultaneous determination of 14 glucosinolates. The proposed methodhas been validated for eight glucosinolates: glucobrassicin, glucoraphanin, glucoiberin, glucoerucin, progoitrin, gluconapin,sinigrin and glucocheirolin. The linear range was 1–150 mg ml�1, the intra-day and inter-day precision values are within 6%and 8% at the lower limit of quantification, while the overall recovery of the eight glucosinolates was 99�9%. This validatedmethod was used successfully for analysis of glucosinolates content of broccoli sprouts grown in different conditions.Copyright © 2012 John Wiley & Sons, Ltd.Supporting information may be found in the online version of this article.
Keywords: broccoli sprouts; glucosinolates; brassicacee; growth condition; LC–MS
* Correspondence to: MariateresaMaldini, INRAN - Via Ardeatina 546 – 00178 Roma,Italy. E-mail: [email protected]
† This article is part of the Journal of Mass Spectrometry special issue entitled“2nd MS Food Day” edited by Gianluca Giorgi.
National Research Institute for Food and Nutrition – INRAN – Via Ardeatina546, 00178 Roma, Italy
Introduction
Recent studies have demonstrated that the regular consumptionof fruits and vegetables is correlated with a decreased risk ofchronic diseases, including cardiovascular disease and differenttypes of cancer.[1–3]
Vegetables belonging to the Brassicaceae family (e.g. broccoli,cabbage, kale and Brussels sprouts), widely consumed in theworld, are considered to have a significant function in humannutrition. In fact, they provide bioactive phytochemicals, suchas vitamins, minerals, phenolic compounds and glucosinolates,all molecules endowed with a variety of biological activities,including antioxidant activity, enzymes regulation and controlof apoptosis and cell cycle.[4–7] Brassica vegetables represent, inparticular, a rich source of glucosinolates, secondary plant metabo-lites, structurally characterized by a b-D-thioglucose unit, a sulfateoxime group and a variable side chain derived from differentaminoacids.[8,9] Glucosinolates are produced almost exclusivelyin Brassica plants, where they are thought to play a role in microbeand insect defence.[10] When plant cells are disrupted (e.g. duringcutting, chewing, cooking and freezing), glucosinolates are hydro-lyzed by a b-thioglucosidase enzyme (myrosinase) to various bioac-tive breakdown products (isothiocyanates, nitriles, thiocyanates,epithicyanates, epithionitriles and oxazolidines).[11]
Glucosinolates and isothiocyanates are known to possessanti-carcinogenic and antioxidant effects and have attractedgreat interest from both toxicological and pharmacologicalpoints of view, as they are able to induce phase 2 enzymes, toinhibit phase 1 activation enzymes and protect animals againstchemically induced cancer.[12–17]
J. Mass Spectrom. 2012, 47, 1198–1206
Young broccoli seedlings (also known as broccoli sprouts) are anespecially good source of glucosinolates, with concentrationsseveral times greater than those of mature plants; then, broccolisprouts could have an important role in diet and human health.[18,19]
For this reason, it is necessary to accurately study and collectinformation on profiles and levels of glucosinolates in broccolisprouts. In the past years, several methods (gas chromatog-raphy, colorimetry, capillary electrophoresis, high performanceliquid chromatography (HPLC)) have been applied to detectand determinate glucosinolates in complex mixtures, but mostof them are elaborate and require a complex and tedious samplepreparation.[20–26] Moreover, all these methods have been devel-oped without reference standard compounds. Most recently, theintroduction and the rapid development in LC–mass spec-rometry (MS) has eliminated some difficulties in the analysis ofglucosinolates. HPLC/tandem mass spectrometry (MS/MS) hasbeen used with considerable success being a technique thatfrequently provide specific, selective and sensitive qualitativeand quantitative results often with reduced sample preparationand analysis time, if compared with other commonly employedtechniques.[14] The majority of these quantitative analyses of
Copyright © 2012 John Wiley & Sons, Ltd.
LC–MS determination of glucosinoloma
glucosinolates has been performed by LC–MS multiple reactionmonitoring methods (MRM), using the parent glucosinolateanion and the product ion atm/z value of 97 as the key ions.[27,28]
However, the selection of more specific transitions from parentions to product ions would be more beneficial.
In the present study, a qualitative and quantitative method forthe measure of glucosinolates in broccoli sprouts extracts has beenset on the basis of electrospray ionization (ESI)–MS and ESI–MS/MSprofiles. Direct flow injection/electrospray ionization/ion trapMS/MS has been used to screen the natural occurring glucosino-lates. In a second stage, a selective LC–MS/MS (MRM) methodwas developed to monitor and determinate the variation of the‘glucosinoloma’ of broccoli sprouts as modulated by modificationsof the growth conditions.
The described method provides high sensitivity and specificity,allowing a fast and simultaneous determination of 14 glucosinolateswith a rapid and simple sample preparation.
The quantitative method, performed by using external standards,was validated for eight glucosinolates (glucobrassicin, glucoraphanin,glucoiberin, glucoerucin, progoitrin, gluconapin, sinigrin andglucocheirolin) in agreement with European Medicines Agency(EMEA) note guidance on validation of analytical methods.[29]
For the other glucosinolates (4-methoxyneoglucobrassicin,neoglucobrassicin, 4-hydroxyglucobrassicin, glucoiberverin,gluconapoleiferin, glucoalysin), just a relative quantificationwas performed.
The method was able to evidence quantitative differencesin the glucosinolates content of broccoli sprouts grown indifferent conditions.
119
Experimental
Materials
Solvents used for extraction were of high purity (Carlo Erba, Milano,Italy). HPLC grademethanol, acetonitrile and formic acid were fromSigma-Aldrich Chemical Company (St Louis, MO). HPLC gradewater(18 mΩ) was prepared using a Millipore (Bedford, MA, USA) Milli-Qpurification system. Glucobrassicin potassium salt, glucoraphaninpotassium salt, glucoiberin potassium salt, glucoerucin potassiumsalt, progoitrin potassium salt, gluconapin potassium salt, sinigrinpotassium salt and glucocheirolin potassium salt were purchasedfrom PhytoLab GmbH & Co. KG (Vestenbergsgreuth, Germany).
Growth conditions of broccoli sprouts
Broccoli seeds (Brassica oleracea L. var. botrytis subvar. cymosa)were purchased from SUBA&UNICO (Longiano, FC, Italy). Seedswere surface sterilized by incubating for 15 min in 40% v/vcommercial bleach (2% sodium hypochlorite) with shaking, thendrained and rinsed ten times with distilled water. After soaking indistilled water for 16–18 h at 21 �C, seeds were rinsed in distilledwater and transferred in the germination cylinder of Vitaseedsprouter (Vitaseed AG, Switzerland). In this system, sprouts wereimmersed in distilled water for 5 min every 2 h. Sprouts weregrown at 21�C in a plant growth chamber (Clf Plant Climatics,Wertingen, Germany) equipped with PHILIPS Master TL-D 36W/840cool-white fluorescent tubes providing a photosynthetic photonflux density of 110 mmol m�2 s�1, under three differentlight regimes: ‘continuous light’, ‘light/dark cycle’ (L/D cycle)(16-h light/8-h dark cycle) and ‘dark’ (achieved by covering thesprouting device with a cardboard box). The sprouts were
J. Mass Spectrom. 2012, 47, 1198–1206 Copyright © 2012 John
allowed to grow for 3, 5, 7 and 10 days after sowing. Sproutssamples were rapidly and gently collected from the surface ofthe germination cylinder at midday, weighed (fresh mass) andimmediately frozen in liquid nitrogen and stored at –80 �C forfurther analysis. Frozen sprouts were ground to a fine powderin a Waring blendor cooled with liquid nitrogen, and aliquots ofsprouts powder were used for humidity content determination.
Extraction and sample preparation
Each sample of broccoli sprouts was extracted with methanol:water (70:30 v/v; sample to solvent ratio 1:25 w/v) at 70 �C for30 min under vortex mixing to facilitate the extraction.[8] Thesamples were successively centrifuged (4000 rpm, 30 min,4 �C), the supernatants were collected and the solvent was com-pletely removed using a rotary evaporator under vacuum at 40�C. The dried samples were dissolved in ultrapure water with thesame volume of extraction and filtered through 0.20-mm syringePVDF filters (Whatmann International Ltd., UK).
ESI-MS and ESI-MS/MS analyses
Full-scan ESI-MS and collision-induced dissociation ESI-MS/MS (byusing both Product Ion and Enhanced Product Ion Scan modes)analyses of standards and samples were performed on an AppliedBiosystems API3200 Q-Trap (Foster City, CA, USA) spectrometer.The analytical parameters were optimised by infusing a standardsolution of Glucoraphanin (1 mg ml�1 in methanol 50%) into thesource at a flow rate of 10 mL min�1. The optimised parameterswere: declustering potential �52 eV, entrance potential �4.7 eV,collision energy�38 eV and collision cell exit potential�4 eV. Datawere acquired in the negative ion MS and MS/MS modes.
HPLC–ESI-MS and HPLC–ESI-MS/MS analyses
Qualitative on-line HPLC-ESI-MS/MS analysis of extracts were per-formed using HPLC system interfaced to an Applied Biosystems(Foster City, CA, USA) API3200 Q-Trap instrument (Q1). LC analy-ses were conducted using a system equipped with a 200 binarypump (Perkin-Elmer, USA). Samples were injected (10 ml) into aLuna C18 column (Phenomenex, USA) (150 � 2.1 mm i.d., 5 mmd) and eluted at flow rate of 0.3 ml min�1. Mobile phase A wasH2O containing 0.1% formic acid, while mobile phase B wasacetonitrile containing 0.1% formic acid. Elution was carried outusing a gradient commencing at 94% A and changing to 88 %A in 15 min, then from 88% A to 75% A in 6 min, then from75% A to 40% A in 9 min and finally to 0% A in 1 min. The columnwas kept at 25 �C, using a Peltier Column Oven Series 200 (PerkinElmer). The flow from the chromatograph was injected directlyinto the ESI source. Qualitative analysis of the compounds was per-formed using information-dependent acquisition (IDA). The IDAmethod created included an IDA criteria (specify the charge state,mass range), enhanced MS scan (EMS), enhanced resolution (ER),enhanced product ion scan (EPI) or MS/MS scan. The source tem-perature was held at 450�C, and MS parameters were those opti-mised for the ESI-MS and ESI-MS/MS analyses with ion spray voltageat �4300. MS data were acquired using the software providedby the manufacturer (Analyst software 1.5.1), and extracted ionchromatogram were elaborated in order to identify glucosinolatesfrom their deprotonated molecule and retention time.
Quantitative on-line HPLC-ESI-MS/MS analyses were per-formed using the same LC-ESI-MS/MS equipment and the samechromatographic conditions described above, but the mass
Wiley & Sons, Ltd. wileyonlinelibrary.com/journal/jms
9
M. Maldini et al.
1200
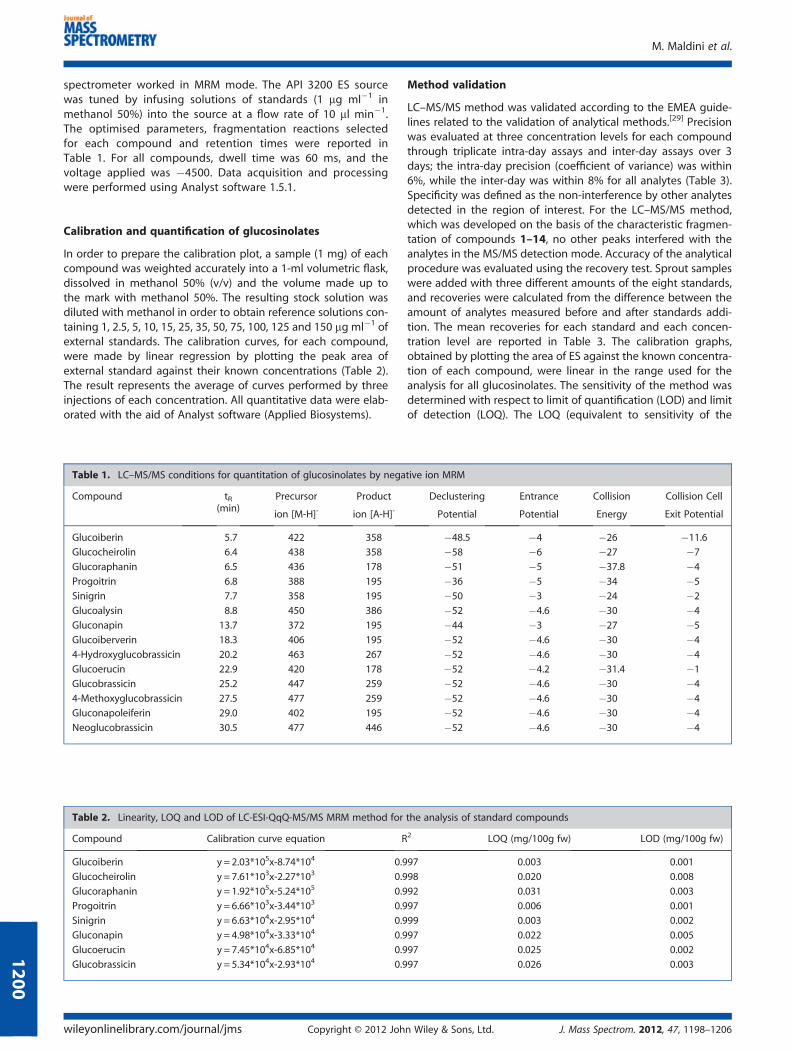
spectrometer worked in MRM mode. The API 3200 ES sourcewas tuned by infusing solutions of standards (1 mg ml�1 inmethanol 50%) into the source at a flow rate of 10 ml min�1.The optimised parameters, fragmentation reactions selectedfor each compound and retention times were reported inTable 1. For all compounds, dwell time was 60 ms, and thevoltage applied was �4500. Data acquisition and processingwere performed using Analyst software 1.5.1.
Calibration and quantification of glucosinolates
In order to prepare the calibration plot, a sample (1 mg) of eachcompound was weighted accurately into a 1-ml volumetric flask,dissolved in methanol 50% (v/v) and the volume made up tothe mark with methanol 50%. The resulting stock solution wasdiluted with methanol in order to obtain reference solutions con-taining 1, 2.5, 5, 10, 15, 25, 35, 50, 75, 100, 125 and 150 mg ml�1 ofexternal standards. The calibration curves, for each compound,were made by linear regression by plotting the peak area ofexternal standard against their known concentrations (Table 2).The result represents the average of curves performed by threeinjections of each concentration. All quantitative data were elab-orated with the aid of Analyst software (Applied Biosystems).
Table 1. LC–MS/MS conditions for quantitation of glucosinolates by nega
Compound tR(min)
Precursor Product
ion [M-H]- ion [A-H]-
Glucoiberin 5.7 422 358
Glucocheirolin 6.4 438 358
Glucoraphanin 6.5 436 178
Progoitrin 6.8 388 195
Sinigrin 7.7 358 195
Glucoalysin 8.8 450 386
Gluconapin 13.7 372 195
Glucoiberverin 18.3 406 195
4-Hydroxyglucobrassicin 20.2 463 267
Glucoerucin 22.9 420 178
Glucobrassicin 25.2 447 259
4-Methoxyglucobrassicin 27.5 477 259
Gluconapoleiferin 29.0 402 195
Neoglucobrassicin 30.5 477 446
Table 2. Linearity, LOQ and LOD of LC-ESI-QqQ-MS/MS MRM method for
Compound Calibration curve equation R
Glucoiberin y = 2.03*105x-8.74*104 0.9
Glucocheirolin y = 7.61*103x-2.27*103 0.9
Glucoraphanin y = 1.92*105x-5.24*105 0.9
Progoitrin y = 6.66*103x-3.44*103 0.9
Sinigrin y = 6.63*104x-2.95*104 0.9
Gluconapin y = 4.98*104x-3.33*104 0.9
Glucoerucin y = 7.45*104x-6.85*104 0.9
Glucobrassicin y = 5.34*104x-2.93*104 0.9
wileyonlinelibrary.com/journal/jms Copyright © 2012 Joh
Method validation
LC–MS/MS method was validated according to the EMEA guide-lines related to the validation of analytical methods.[29] Precisionwas evaluated at three concentration levels for each compoundthrough triplicate intra-day assays and inter-day assays over 3days; the intra-day precision (coefficient of variance) was within6%, while the inter-day was within 8% for all analytes (Table 3).Specificity was defined as the non-interference by other analytesdetected in the region of interest. For the LC–MS/MS method,which was developed on the basis of the characteristic fragmen-tation of compounds 1–14, no other peaks interfered with theanalytes in the MS/MS detection mode. Accuracy of the analyticalprocedure was evaluated using the recovery test. Sprout sampleswere added with three different amounts of the eight standards,and recoveries were calculated from the difference between theamount of analytes measured before and after standards addi-tion. The mean recoveries for each standard and each concen-tration level are reported in Table 3. The calibration graphs,obtained by plotting the area of ES against the known concentra-tion of each compound, were linear in the range used for theanalysis for all glucosinolates. The sensitivity of the method wasdetermined with respect to limit of quantification (LOD) and limitof detection (LOQ). The LOQ (equivalent to sensitivity of the
tive ion MRM
Declustering Entrance Collision Collision Cell
Potential Potential Energy Exit Potential
�48.5 �4 �26 �11.6
�58 �6 �27 �7
�51 �5 �37.8 �4
�36 �5 �34 �5
�50 �3 �24 �2
�52 �4.6 �30 �4
�44 �3 �27 �5
�52 �4.6 �30 �4
�52 �4.6 �30 �4
�52 �4.2 �31.4 �1
�52 �4.6 �30 �4
�52 �4.6 �30 �4
�52 �4.6 �30 �4
�52 �4.6 �30 �4
the analysis of standard compounds
2 LOQ (mg/100g fw) LOD (mg/100g fw)
97 0.003 0.001
98 0.020 0.008
92 0.031 0.003
97 0.006 0.001
99 0.003 0.002
97 0.022 0.005
97 0.025 0.002
97 0.026 0.003
n Wiley & Sons, Ltd. J. Mass Spectrom. 2012, 47, 1198–1206
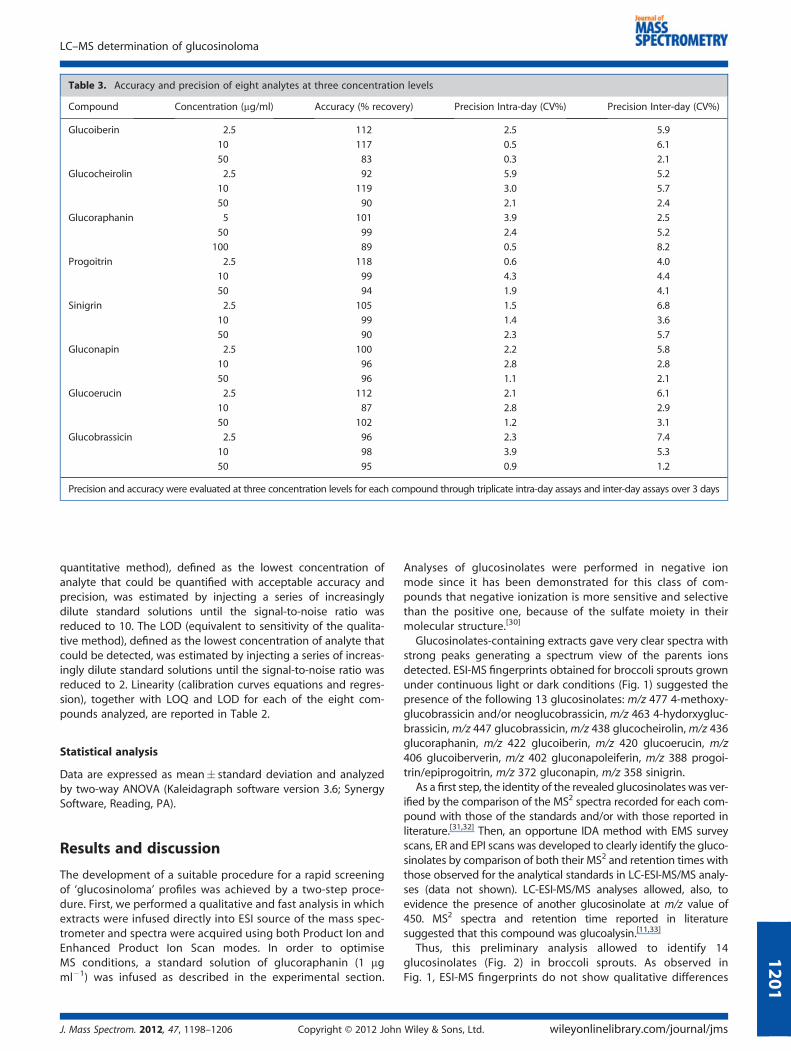
Table 3. Accuracy and precision of eight analytes at three concentration levels
Compound Concentration (mg/ml) Accuracy (% recovery) Precision Intra-day (CV%) Precision Inter-day (CV%)
Glucoiberin 2.5 112 2.5 5.9
10 117 0.5 6.1
50 83 0.3 2.1
Glucocheirolin 2.5 92 5.9 5.2
10 119 3.0 5.7
50 90 2.1 2.4
Glucoraphanin 5 101 3.9 2.5
50 99 2.4 5.2
100 89 0.5 8.2
Progoitrin 2.5 118 0.6 4.0
10 99 4.3 4.4
50 94 1.9 4.1
Sinigrin 2.5 105 1.5 6.8
10 99 1.4 3.6
50 90 2.3 5.7
Gluconapin 2.5 100 2.2 5.8
10 96 2.8 2.8
50 96 1.1 2.1
Glucoerucin 2.5 112 2.1 6.1
10 87 2.8 2.9
50 102 1.2 3.1
Glucobrassicin 2.5 96 2.3 7.4
10 98 3.9 5.3
50 95 0.9 1.2
Precision and accuracy were evaluated at three concentration levels for each compound through triplicate intra-day assays and inter-day assays over 3 days
LC–MS determination of glucosinoloma
quantitative method), defined as the lowest concentration ofanalyte that could be quantified with acceptable accuracy andprecision, was estimated by injecting a series of increasinglydilute standard solutions until the signal-to-noise ratio wasreduced to 10. The LOD (equivalent to sensitivity of the qualita-tive method), defined as the lowest concentration of analyte thatcould be detected, was estimated by injecting a series of increas-ingly dilute standard solutions until the signal-to-noise ratio wasreduced to 2. Linearity (calibration curves equations and regres-sion), together with LOQ and LOD for each of the eight com-pounds analyzed, are reported in Table 2.
Statistical analysis
Data are expressed as mean� standard deviation and analyzedby two-way ANOVA (Kaleidagraph software version 3.6; SynergySoftware, Reading, PA).
120
Results and discussion
The development of a suitable procedure for a rapid screeningof ‘glucosinoloma’ profiles was achieved by a two-step proce-dure. First, we performed a qualitative and fast analysis in whichextracts were infused directly into ESI source of the mass spec-trometer and spectra were acquired using both Product Ion andEnhanced Product Ion Scan modes. In order to optimiseMS conditions, a standard solution of glucoraphanin (1 mgml�1) was infused as described in the experimental section.
J. Mass Spectrom. 2012, 47, 1198–1206 Copyright © 2012 John
Analyses of glucosinolates were performed in negative ionmode since it has been demonstrated for this class of com-pounds that negative ionization is more sensitive and selectivethan the positive one, because of the sulfate moiety in theirmolecular structure.[30]
Glucosinolates-containing extracts gave very clear spectra withstrong peaks generating a spectrum view of the parents ionsdetected. ESI-MS fingerprints obtained for broccoli sprouts grownunder continuous light or dark conditions (Fig. 1) suggested thepresence of the following 13 glucosinolates: m/z 477 4-methoxy-glucobrassicin and/or neoglucobrassicin, m/z 463 4-hydorxygluc-brassicin, m/z 447 glucobrassicin,m/z 438 glucocheirolin,m/z 436glucoraphanin, m/z 422 glucoiberin, m/z 420 glucoerucin, m/z406 glucoiberverin, m/z 402 gluconapoleiferin, m/z 388 progoi-trin/epiprogoitrin, m/z 372 gluconapin, m/z 358 sinigrin.
As a first step, the identity of the revealed glucosinolates was ver-ified by the comparison of the MS2 spectra recorded for each com-pound with those of the standards and/or with those reported inliterature.[31,32] Then, an opportune IDA method with EMS surveyscans, ER and EPI scans was developed to clearly identify the gluco-sinolates by comparison of both their MS2 and retention times withthose observed for the analytical standards in LC-ESI-MS/MS analy-ses (data not shown). LC-ESI-MS/MS analyses allowed, also, toevidence the presence of another glucosinolate at m/z value of450. MS2 spectra and retention time reported in literaturesuggested that this compound was glucoalysin.[11,33]
Thus, this preliminary analysis allowed to identify 14glucosinolates (Fig. 2) in broccoli sprouts. As observed inFig. 1, ESI-MS fingerprints do not show qualitative differences
Wiley & Sons, Ltd. wileyonlinelibrary.com/journal/jms
1
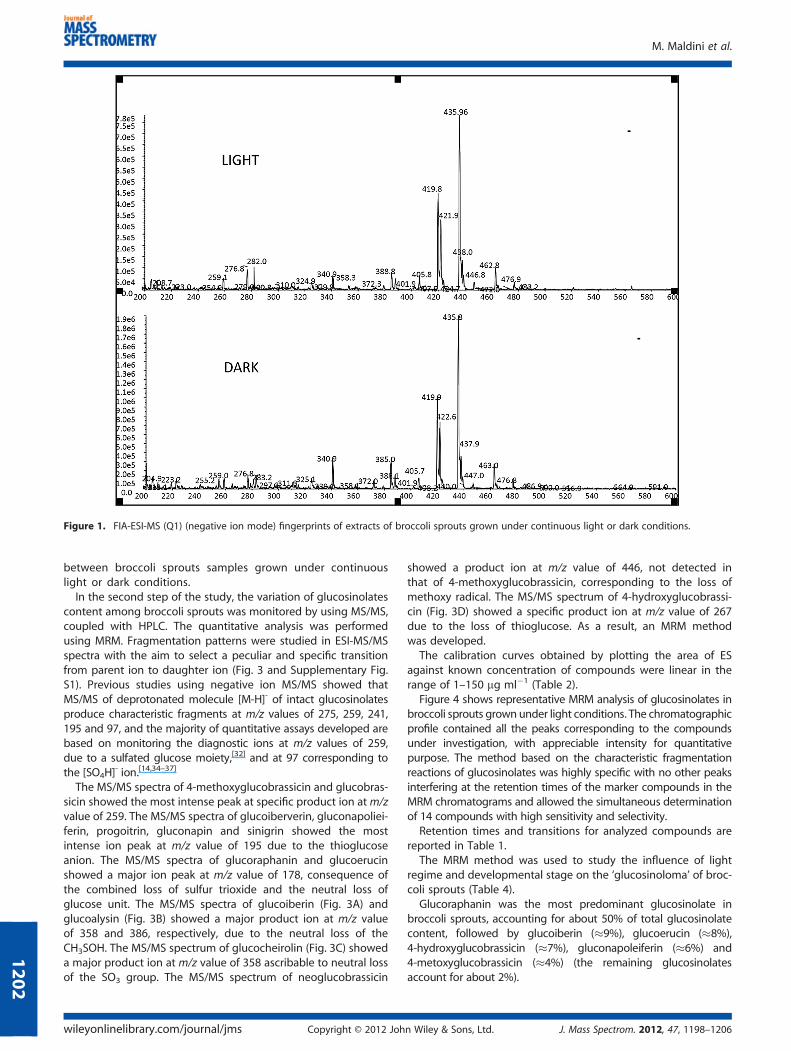
Figure 1. FIA-ESI-MS (Q1) (negative ion mode) fingerprints of extracts of broccoli sprouts grown under continuous light or dark conditions.
M. Maldini et al.
1202
between broccoli sprouts samples grown under continuouslight or dark conditions.In the second step of the study, the variation of glucosinolates
content among broccoli sprouts was monitored by using MS/MS,coupled with HPLC. The quantitative analysis was performedusing MRM. Fragmentation patterns were studied in ESI-MS/MSspectra with the aim to select a peculiar and specific transitionfrom parent ion to daughter ion (Fig. 3 and Supplementary Fig.S1). Previous studies using negative ion MS/MS showed thatMS/MS of deprotonated molecule [M-H]- of intact glucosinolatesproduce characteristic fragments at m/z values of 275, 259, 241,195 and 97, and the majority of quantitative assays developed arebased on monitoring the diagnostic ions at m/z values of 259,due to a sulfated glucose moiety,[32] and at 97 corresponding tothe [SO4H]
- ion.[14,34–37]
The MS/MS spectra of 4-methoxyglucobrassicin and glucobras-sicin showed the most intense peak at specific product ion atm/zvalue of 259. The MS/MS spectra of glucoiberverin, gluconapoliei-ferin, progoitrin, gluconapin and sinigrin showed the mostintense ion peak at m/z value of 195 due to the thioglucoseanion. The MS/MS spectra of glucoraphanin and glucoerucinshowed a major ion peak at m/z value of 178, consequence ofthe combined loss of sulfur trioxide and the neutral loss ofglucose unit. The MS/MS spectra of glucoiberin (Fig. 3A) andglucoalysin (Fig. 3B) showed a major product ion at m/z valueof 358 and 386, respectively, due to the neutral loss of theCH3SOH. The MS/MS spectrum of glucocheirolin (Fig. 3C) showeda major product ion at m/z value of 358 ascribable to neutral lossof the SO3 group. The MS/MS spectrum of neoglucobrassicin
wileyonlinelibrary.com/journal/jms Copyright © 2012 Joh
showed a product ion at m/z value of 446, not detected inthat of 4-methoxyglucobrassicin, corresponding to the loss ofmethoxy radical. The MS/MS spectrum of 4-hydroxyglucobrassi-cin (Fig. 3D) showed a specific product ion at m/z value of 267due to the loss of thioglucose. As a result, an MRM methodwas developed.
The calibration curves obtained by plotting the area of ESagainst known concentration of compounds were linear in therange of 1–150 mg ml�1 (Table 2).
Figure 4 shows representative MRM analysis of glucosinolates inbroccoli sprouts grown under light conditions. The chromatographicprofile contained all the peaks corresponding to the compoundsunder investigation, with appreciable intensity for quantitativepurpose. The method based on the characteristic fragmentationreactions of glucosinolates was highly specific with no other peaksinterfering at the retention times of the marker compounds in theMRM chromatograms and allowed the simultaneous determinationof 14 compounds with high sensitivity and selectivity.
Retention times and transitions for analyzed compounds arereported in Table 1.
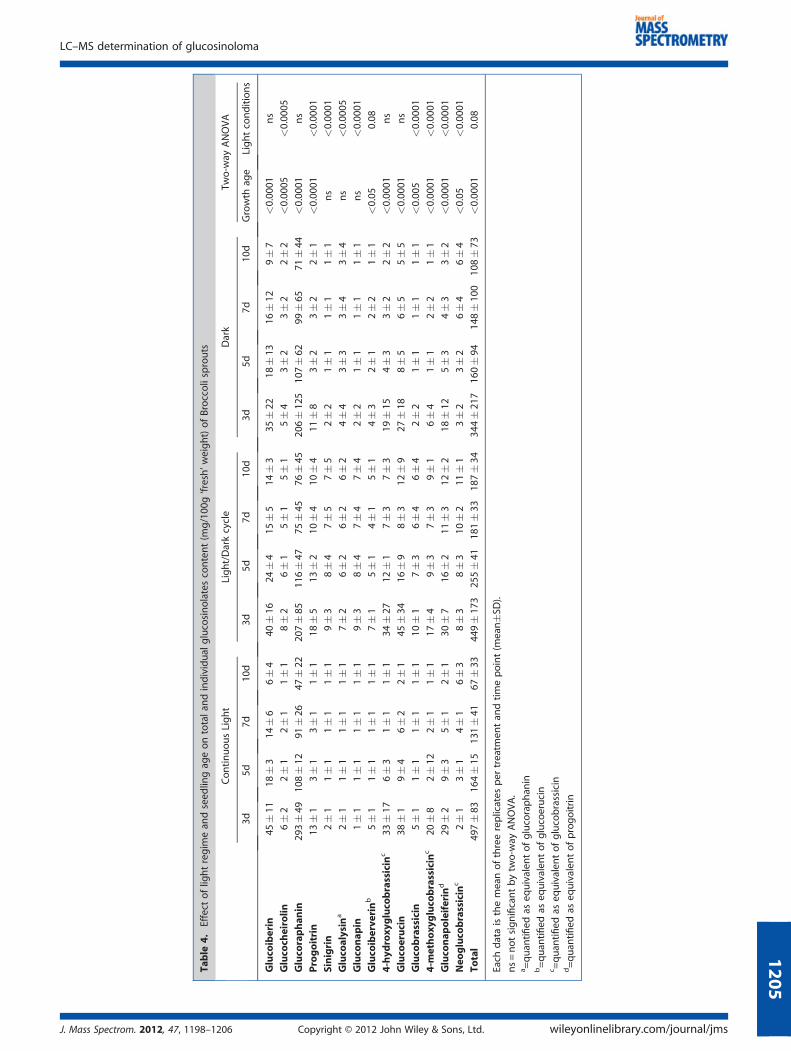
The MRM method was used to study the influence of lightregime and developmental stage on the ‘glucosinoloma’ of broc-coli sprouts (Table 4).
Glucoraphanin was the most predominant glucosinolate inbroccoli sprouts, accounting for about 50% of total glucosinolatecontent, followed by glucoiberin (�9%), glucoerucin (�8%),4-hydroxyglucobrassicin (�7%), gluconapoleiferin (�6%) and4-metoxyglucobrassicin (�4%) (the remaining glucosinolatesaccount for about 2%).
n Wiley & Sons, Ltd. J. Mass Spectrom. 2012, 47, 1198–1206
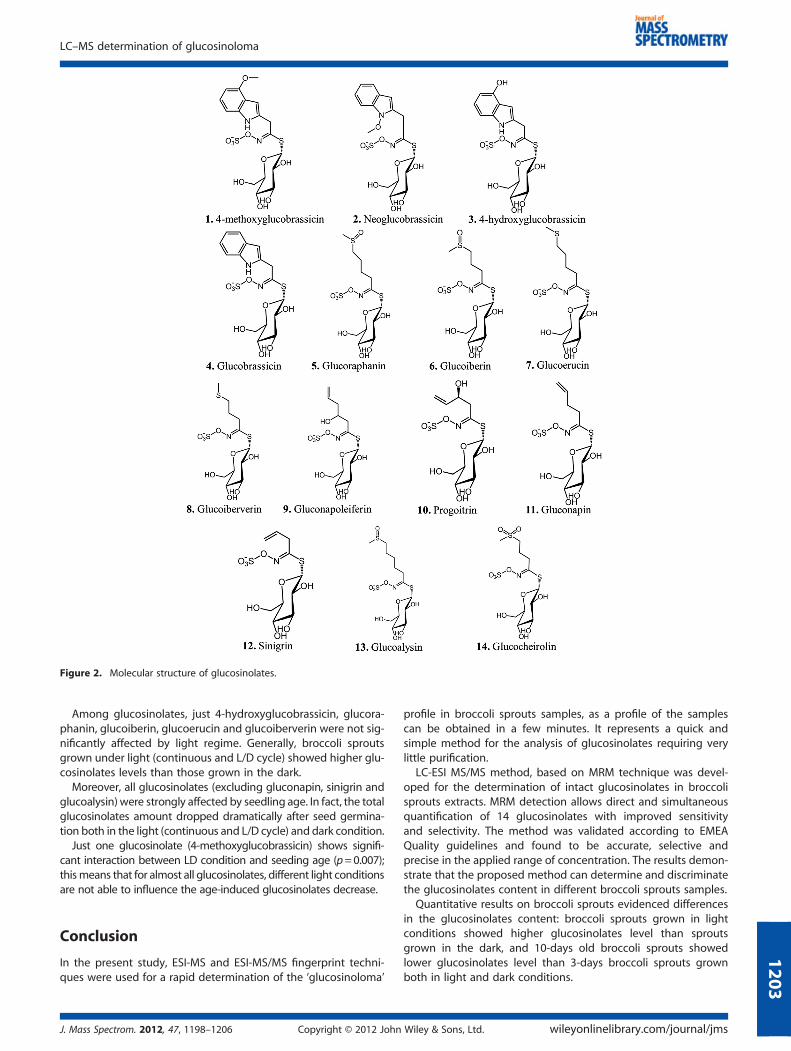
Figure 2. Molecular structure of glucosinolates.
LC–MS determination of glucosinoloma
Among glucosinolates, just 4-hydroxyglucobrassicin, glucora-phanin, glucoiberin, glucoerucin and glucoiberverin were not sig-nificantly affected by light regime. Generally, broccoli sproutsgrown under light (continuous and L/D cycle) showed higher glu-cosinolates levels than those grown in the dark.
Moreover, all glucosinolates (excluding gluconapin, sinigrin andglucoalysin) were strongly affected by seedling age. In fact, the totalglucosinolates amount dropped dramatically after seed germina-tion both in the light (continuous and L/D cycle) and dark condition.
Just one glucosinolate (4-methoxyglucobrassicin) shows signifi-cant interaction between LD condition and seeding age (p=0.007);thismeans that for almost all glucosinolates, different light conditionsare not able to influence the age-induced glucosinolates decrease.
120
Conclusion
In the present study, ESI-MS and ESI-MS/MS fingerprint techni-ques were used for a rapid determination of the ‘glucosinoloma’
J. Mass Spectrom. 2012, 47, 1198–1206 Copyright © 2012 John
profile in broccoli sprouts samples, as a profile of the samplescan be obtained in a few minutes. It represents a quick andsimple method for the analysis of glucosinolates requiring verylittle purification.
LC-ESI MS/MS method, based on MRM technique was devel-oped for the determination of intact glucosinolates in broccolisprouts extracts. MRM detection allows direct and simultaneousquantification of 14 glucosinolates with improved sensitivityand selectivity. The method was validated according to EMEAQuality guidelines and found to be accurate, selective andprecise in the applied range of concentration. The results demon-strate that the proposed method can determine and discriminatethe glucosinolates content in different broccoli sprouts samples.
Quantitative results on broccoli sprouts evidenced differencesin the glucosinolates content: broccoli sprouts grown in lightconditions showed higher glucosinolates level than sproutsgrown in the dark, and 10-days old broccoli sprouts showedlower glucosinolates level than 3-days broccoli sprouts grownboth in light and dark conditions.
Wiley & Sons, Ltd. wileyonlinelibrary.com/journal/jms
3
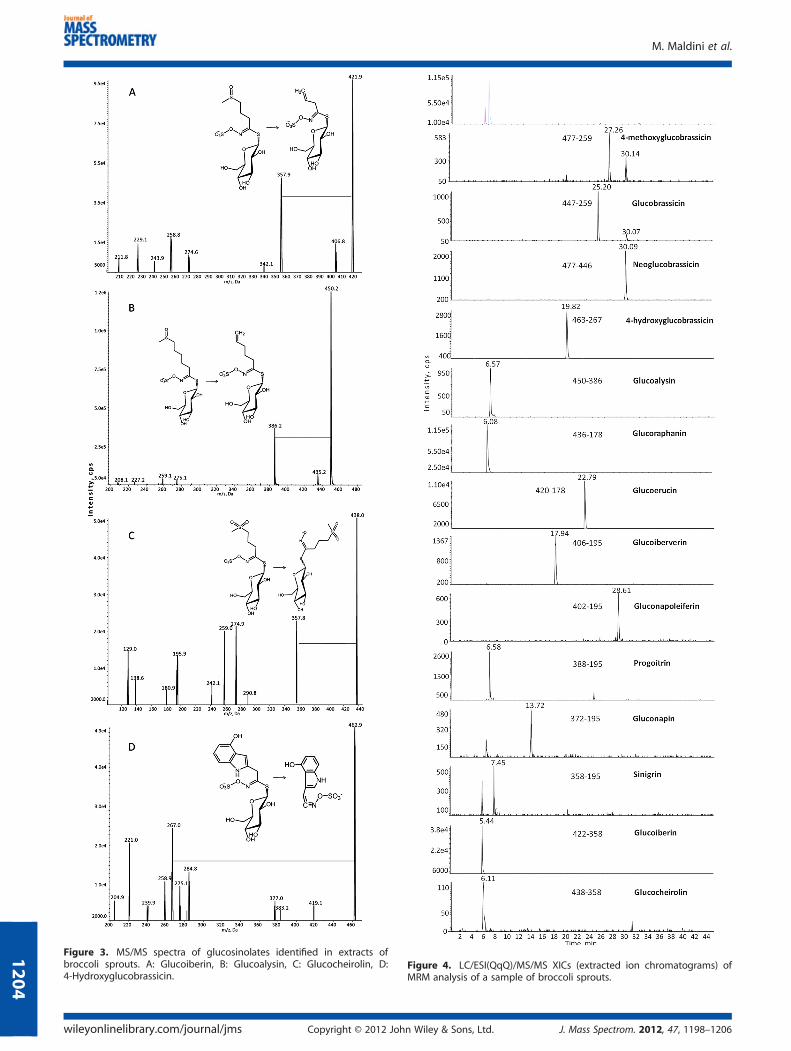
Figure 3. MS/MS spectra of glucosinolates identified in extracts ofbroccoli sprouts. A: Glucoiberin, B: Glucoalysin, C: Glucocheirolin, D:4-Hydroxyglucobrassicin.
Figure 4. LC/ESI(QqQ)/MS/MS XICs (extracted ion chromatograms) ofMRM analysis of a sample of broccoli sprouts.
M. Maldini et al.
wileyonlinelibrary.com/journal/jms Copyright © 2012 John Wiley & Sons, Ltd. J. Mass Spectrom. 2012, 47, 1198–1206
1204
Table
4.Effect
oflig
htregim
ean
dseed
lingag
eontotala
ndindividual
glucosinolatescontent(m
g/100
g‘fresh’weight)ofBroccolisprouts
Con
tinuousLight
Light/Darkcycle
Dark
Two-w
ayANOVA
3d5d
7d10
d3d
5d7d
10d
3d5d
7d10
dGrowth
age
Lightconditions
Gluco
iberin
45�11
18�3
14�6
6�4
40�16
24�4
15�5
14�3
35�22
18�13
16�12
9�7
<0.00
01ns
Gluco
cheirolin
6�2
2�1
2�1
1�1
8�2
6�1
5�1
5�1
5�4
3�2
3�2
2�2
<0.00
05<0.00
05
Gluco
raphan
in29
3�49
108�12
91�26
47�22
207�85
116�47
75�45
76�45
206�12
510
7�62
99�65
71�44
<0.00
01ns
Progoitrin
13�1
3�1
3�1
1�1
18�5
13�2
10�4
10�4
11�8
3�2
3�2
2�1
<0.00
01<0.00
01
Sinigrin
2�1
1�1
1�1
1�1
9�3
8�4
7�5
7�5
2�2
1�1
1�1
1�1
ns
<0.00
01
Gluco
alysin
a2�1
1�1
1�1
1�1
7�2
6�2
6�2
6�2
4�4
3�3
3�4
3�4
ns
<0.00
05
Gluco
nap
in1�1
1�1
1�1
1�1
9�3
8�4
7�4
7�4
2�2
1�1
1�1
1�1
ns
<0.00
01
Gluco
iberve
rinb
5�1
1�1
1�1
1�1
7�1
5�1
4�1
5�1
4�3
2�1
2�2
1�1
<0.05
0.08
4-hyd
roxy
gluco
brassicin
c33
�17
6�3
1�1
1�1
34�27
12�1
7�3
7�3
19�15
4�3
3�2
2�2
<0.00
01ns
Gluco
erucin
38�1
9�4
6�2
2�1
45�34
16�9
8�3
12�9
27�18
8�5
6�5
5�5
<0.00
01ns
Gluco
brassicin
5�1
1�1
1�1
1�1
10�1
7�3
6�4
6�4
2�2
1�1
1�1
1�1
<0.00
5<0.00
01
4-m
ethoxy
gluco
brassicin
c20
�8
2�12
2�1
1�1
17�4
9�3
7�3
9�1
6�4
1�1
2�2
1�1
<0.00
01<0.00
01
Gluco
nap
oleiferin
d29
�2
9�3
5�1
2�1
30�7
16�2
11�3
12�2
18�12
5�3
4�3
3�2
<0.00
01<0.00
01
Neo
gluco
brassicin
c2�1
3�1
4�1
6�3
8�3
8�3
10�2
11�1
3�2
3�2
6�4
6�4
<0.05
<0.00
01
Total
497�83
164�15
131�41
67�33
449�17
325
5�41
181�33
187�34
344�21
716
0�94
148�10
010
8�73
<0.00
010.08
Each
dataisthemeanofthreereplicates
per
treatm
entan
dtimepoint(m
ean�S
D).
ns=notsignificantbytw
o-w
ayANOVA.
a=quan
tified
aseq
uivalentofglucoraphan
inb=quan
tified
aseq
uivalen
tofglucoerucin
c =quan
tified
aseq
uivalen
tofglucobrassicin
d=quan
tified
aseq
uivalen
tofprogoitrin
LC–MS determination of glucosinoloma
J. Mass Spectrom. 2012, 47, 1198–1206 Copyright © 2012 John Wiley & Sons, Ltd. wileyonlinelibrary.com/journal/jms
1205
M. Maldini et al.
1206
The method resulted specific and sensitive for the analytesstudied. Application of this method is suitable for quality controland nutritional quality of broccoli sprouts.Further information could be obtained by using LC-ESI-linear
trap quadrupole and Fourier transform ion cyclotron resonanceMS, that could increase the possibility to identify some minor glu-cosinolates present in broccoli sprouts.
Acknowledgements
This work was supported by Italian Ministry of Agriculture, Food &Forestry (MiPAAF) grants ‘NUME’ (DM 3688/7303/08) and ‘NUTRI-GEA’ (DM 30281 23/12/2009).
Kariklia Pascucci is acknowledged for her kind support in thedaily lab work.
Supporting information
Supporting information may be found in the online version ofthis article.
References[1] K. B. Michels, E. Giovannucci, K. J. Joshipura, B. A. Rosner, M. J. Stampfer,
C. S. Fuchs, G. A. Colditz, F. E. Sperizer, W. C.Willett. Prospective study offruit and vegetable consumption and incidence of colon and rectalcancers. J. Natl. Cancer Inst. 2000, 92, 1740.
[2] N. J. Temple. Antioxidants and diseases: more questions than answers.Nutr. Res. 2000, 20, 449.
[3] A. Scalbert, C. Andres-Lacueva, M. Arita, P. Kroon, C. Manach, M. Urpi-Sarda,D. Wishart. Databases on food phytochemicals and their health-promotingeffects. J. Agr. Food Chem. 2011, 59, 4331.
[4] S. Pérez-Balibrea, D. A. Moreno, C. Garcìa-Viguera. Genotypic effectson the phytochemical quality of seeds and sprouts from commercialbroccoli cultivars. Food Chem. 2011, 125, 348.
[5] J. W. Fahey, T. W. Kensler. Role of dietary supplements/nutraceuticalsin chemioprevention through induction of cytoprotective enzymes.Chem. Res. Toxicol. 2007, 20, 572.
[6] J. Singh, A. K. Upadhyay, K. Prasad, A. Bahadur, M. Rai. Variability ofcarotenes, vitamin C, E and phenolics in Brassica vegetables. J. FoodCompos. Anal. 2007, 20, 106.
[7] L. G. West, K. A. Meyer, B. A. Balach, F. J. Rossi, M. R. Schultz, G. W.Haas. Glucoraphanin and 4-Hydroxyglucobrassicin contents in seedsof 59 cultivars of Broccoli, Raab, Kohlrabi, Radish, Cauliflower,Brussels Sprouts, Kale and Cabbage. J. Agr. Food Chem. 2004, 52, 916.
[8] A. Smiechowska, A. Bartoszek, J. Namiesnik. Determination of gluco-sinolates and their decomposition products-indoles and isothiocya-nates in cruciferous vegetables. Crit. Rev. Anal. Chem. 2010, 40, 202.
[9] M. Jahangir, I. B. Abdel-Farid, H. K. Kim, Y. H. Choi, R. Verpoorte.Healthy and unhealthy plants: The effect of stress on the metabo-lism of Brassicaceae. Environ. Exp. Bot. 2009, 67, 23.
[10] Bednarek P., Osbourn A.. Plant-microbe interactions: chemical diver-sity in plant defense. Science 2009, 324, 746.
[11] R. N. Bennett, F. A. Mellon, P. A. Kroon. Screening crucifer seeds assource of specific intact glucosinolates using ion-pair High-Perfor-mance Liquid Chromatography negative ion electrospray massspectrometry. J. Agr. Food Chem. 2004, 52, 428.
[12] M. E. Cartea, P. Velasco. Glucosinolates in Brassica foods: Bioavailabil-ity in food and significance for human health. Phytochemistry Rev.2008, 7, 213.
[13] J. K. Kim, S. M. Chu, S. J. Kim, D. J. Lee, S. Y. Lee, S. H. Lim, S. H. Ha, S. J.Kweon, H. S. Cho. Variation of glucosinolates in vegetable crops ofBrassica rapa L. ssp. Pekinensis. Food Chem. 2010, 119, 423.
[14] Q. Tian, R. A. Rosselot, J. Schwartz. Quantitative determination ofintact glucosinolates in broccoli, broccoli sprouts, Brussels sprouts,and cauliflower by high-performance liquid chromatography-electrospray ionization-tandem mass spectrometry. Anal. Biochem.2005, 343, 93.
[15] L. Valgimigli, R. Iori. Antioxidant and pro-oxidant capacities of ITCs.Environ. Mol. Mutagen. 2009, 50, 222.
wileyonlinelibrary.com/journal/jms Copyright © 2012 Joh
[16] J. Barillari, D. Canistro, M. Paolini, F. Ferroni, G. F. Pedulli, R. Iori, L. Valgi-migli. Direct antioxidant activity of purified glucoerucin, the dietarysecondary metabolite contained in rocket (Eruca sativa Mill.) seedsand sprouts. J. Agr. Food Chem. 2005, 53, 2475.
[17] G. W. Plumb, N. Lambert, S. J. Chambers, S. Wanigatunga, R. K. Hea-ney, J. A. Plumb, O. I. Aruoma, B. Halliwell, N. J. Miller, G. Williamson.Are whole extracts and purified glucosinolates from cruciferousvegetables antioxidants? Free Rad. Res. 1996, 25, 75.
[18] J. W. Fahey, Y. Zhang, P. Talay. Broccoli sprouts: an exceptionally richsource of inducers of enzymes that protect against chemical carcino-gens. Proc. Natl. Acad. Sci. U.S.A. 1997, 94, 10367.
[19] S. Pérez-Balibrea, D. Moreno, C. Garcìa-Viguera. Influence of light onhealth-promoting phytochemicals of broccoli sprouts. J. Sci. FoodAgr. 2008, 88, 904.
[20] B. A. Slominski, L. D. Campbell. Gas chromatographic determinationof indole glucosinolates—a reexamination. J. Sci. Food Agr. 1987,40, 131.
[21] M. E. Daxenbichler, G. F. Spencer, D. G. Carlson, G. B. Rose, A. M. Brinker,R. G. Powell. Glucosinolate composition of seeds from 297 species ofwild plants. Phytochemistry 1991, 30, 2623.
[22] Nasirullah, M. N. Krishnamurthy. A method for estimating glucosino-lates in mustard/rapeseeds and cake. J. Food Sci. Tech. 1996, 33, 498.
[23] A. Karcher, Z. El Rassi. Capillary electrophoresis of glucosinolates andtheir degradation products. Electrophoresis 1999, 20, 3181.
[24] G. Bringmann, I. Kajahn, C. Neusuess, M. Pelzing, S. Laug, M. Unger,U. Holzgrabe. Analysis of the glucosinolate pattern of Arabidopsisthaliana seeds by capillary zone electrophoresis coupled to electro-spray ionization-mass spectrometry. Electrophoresis 2005, 26, 1513.
[25] N. Kaushik, A. Agnihotri. High-performance liquid chromatographicmethod for separation and quantification of intact glucosinolates.Chromatographia 1999, 49, 281.
[26] K. L. Wade, I. J. Garrard, J. W. Fahey. Improved hydrophilic interactionchromatography method for the identification and quantification ofglucosinolates. J. Chromatogr. A 2007, 1154, 469.
[27] M. Jemal. High-throughput quantitative bioanalysis by LC/MS/MS.Biomed. Chromatogr. 2000, 14, 422.
[28] F. A. Mellon, R. N. Bennett, B. Holst, G. Williamson. Intact glucosinolateanalysis in plant extracts by programmed cone voltage electrosprayLC/MS: performance and comparison with LC/MS/MS methods. Anal.Biochem. 2002, 306, 83.
[29] EMEA. Quality guidelines: Validation of analytical procedures: Textand methodology (ICH Q2). Available at: http://www.emea.europa.eu/pdfs/human/ich/038195en.pdf
[30] D. B. Clarke. Glucosinolates, structures and analysis in food. Anal.Methods 2010, 2, 310.
[31] N. Fabre, V. Poinsot, L. Debrauwer, C. Vigor, J. Tulliez, I. Fourasté, C.Moulis. Characterisation of glucosinolates using electrospray iontrap and electrospray quadrupole time-of-flight mass spectrometry.Phytochem. Anal. 2007, 18, 306.
[32] S. J. Rochfort, V. C. Trenerry, M. Imsic, J. Panozzo, R. Jones. Class tar-geted metabolomics: ESI ion trap screening methods for glucosino-lates based on MSn fragmentation. Phytochemistry 2008, 69, 1671.
[33] E. Njumbe Ediage, J. Diana Di Mavungu, M. L. Scippo, Y. J. Schneider,Y. Larondelle, A. Callebaut, J. Robbens, C. Van Peteghem, S. DeSaeger. Screening, identification and quantification of glucosinolatesin black radish (Raphanus sativus L. niger) based dietary supplementsusing liquid chromatography coupled with a photodiode array andliquid chromatography mass spectrometry. J. Chromatogr. A 2011,1218, 4395.
[34] M. Francisco, D. A. Moreno, M. E. Cartea, F. Ferreres, C. García-Viguera, P.Velasco. Simultaneous identification of glucosinolates and phenoliccompounds in a representative collection of vegetable Brassica rapa.J. Chromatogr. A 2009, 1216, 6611.
[35] S. Millán, M. C. Sampedro, P. Gallejones, A. Castellón, M. L. Ibargoitia,M. Aranzazu Goicolea, R. J. Barrio. Identification and quantification ofglucosinolates in rapeseed using liquid chromatography–ion trapmass spectrometry. Anal. Bioanal. Chem. 2009, 394, 1661.
[36] M. Gratacós-Cubarsí, A. Ribas-Agustí, J. A. García-Regueiro, M. Castel-lari. Simultaneous evaluation of intact glucosinolates and phenoliccompounds by UPLC-DAD-MS/MS in Brassica oleracea L. var. botrytis.Food Chem. 2010, 121, 257.
[37] J. B. Bialecki, J. Ruzicka, C. S. Weisbecker, M. Haribal, A. B. Attygalle.Collision-induced dissociation mass spectra of glucosinolate anions.J. Mass Spec. 2010, 45, 272.
n Wiley & Sons, Ltd. J. Mass Spectrom. 2012, 47, 1198–1206