export behaviour of italian manufacturing firms over the nineties: the role of innovation
TRANSCRIPT
Research Policy 30 (2001) 1185–1201
Export behaviour of Italian manufacturing firms overthe nineties: the role of innovation
Roberto Basile∗ISAE (Istituto di Studi e Analisi Economica — Institute for Studies and Economic Analyses) Piazza Indipendenza, 4 Rome, Italy
Received 6 March 2000; received in revised form 28 April 2000; accepted 2 October 2000
Abstract
This paper analyses the relationship between innovation and export behaviour of Italian manufacturing firms in differentexchange rate regimes. The paper is based on a sample including firms which have carried out an innovative activity throughR&D investments and/or investments in new plants or equipment. Export behaviour is defined in a dual way: as a probabilityfor a firm to export and as the propensity to export for the exporting firms. An empirical model of the determinants of exportbehaviour is estimated using the Cragg’s specification of the Tobit model. The results suggest that innovation capabilitiesare very important competitive factors and help explain heterogeneity in export behaviour among Italian firms. However,the exchange rate devaluation reduces the importance of technological competitiveness in affecting exports because it allowsalso non-innovating firms to enter foreign markets. Moreover, once new firms have entered the market, they continue to beexporters also when the exchange rate returns to its previous level (hysteresis). The export intensity of innovating firms issystematically higher than that of non-innovating firms. The paper provides also specific evidence on export behaviour offirms localised in the south of the country (Mezzogiorno). © 2001 Elsevier Science B.V. All rights reserved.
JEL classification: D21; O31; F10
Keywords: Firm behaviour; Innovation; Trade
1. Introduction
Models of international trade generally assumethat, within a particular industry, all firms in a parti-cular country are symmetrical. 1 That is, they all
∗ Present Address: Roberto Basile, Via Citta di Castello, 14,Roma CAP 00191.E-mail address: [email protected] (R. Basile).
1 The presence of asymmetries among firms in export behaviourhas recently been introduced by Venables (1994) in a model ofmonopolistic competition a la Dixit-Stiglitz to investigate the wayin which the symmetry assumption may bias our assessment of thegains from economic integration. He observed that, by reducingtrade barriers, large firms export while small firms supply only
face the same demand function and have the sametechnology. As a result, all firms set the same priceand produce and supply the same quantities. Thus,if there are exports, all firms in the industry are ex-porters. Yet, a growing body of empirical work hasdocumented the considerable inter-firm differences inexport performance for a variety of countries, bothdeveloped and less developed. This variation seemsto be related to technological advantages, as well as
the domestic market. So, he concludes, ‘by replacing many smallfirms with fewer large firms, integration may have an adverseeffect on product variety, and this may reduce the (still positive)gains from integration’ (p. 131).
0048-7333/01/$ – see front matter © 2001 Elsevier Science B.V. All rights reserved.PII: S0048 -7333 (00 )00141 -4

1186 R. Basile / Research Policy 30 (2001) 1185–1201
to other characteristics of the firm (e.g. employment,shipment, labour cost and capital intensity), the sectorand the country in which it is localised.
Wakelin (1998), Kumar and Siddharthan (1994),Enthorf and Pohlmeier (1990) and Hirsch andBijaoui (1985) have analysed the relationship betweeninnovation and exports at firm level. They generallyconclude that innovation, measured by proxies of in-put (e.g. R&D expenditure) or of output (e.g. numberof innovations), is an important factor in explainingexport performance.
Roberts and Tybout (1997), Bernard and Wagner,1997, 1998 and Bernard and Jensen (1999) haveconsidered the role of entry costs (e.g. investments inexport marketing, new commercial networks, etc.) inthe export decision. These studies generally found thatentry costs, measured by prior exporting experience,increase the probability of exporting.
This paper is concerned with the export behaviourof firms in Italy. During the 1990s, Italian export flowshave been growing very fast. Certainly, this pheno-menon has to be connected to the exit of the Lira fromthe Exchange Rate Mechanism (ERM) in September1992. Generally, indeed, large changes in exchangerates are strongly correlated with large changes of ex-port flows of a country. However, the magnitude ofthese changes in the short run is in part determinedby the ability of firms to adjust their output to thechanges in relative prices. Aggregate output changesresult from two related but distinct activities by firms.First, existing exporters can increase their export in-tensity. This may result either from a redirection ofoutput destined to the domestic market to foreign cus-tomers or from an overall increase in production cou-pled with an expansion of exports. The alternativemechanism for the export response is through entry ofexisting or new firms into the export market. In thispaper we will show that both of these mechanismstook place.
The main focus of the paper is to analyse andcompare the relationship between export behaviourand innovation capabilities of Italian firms in threedifferent periods: (a) in 1991, that is a period charac-terised by a fixed exchange rate regime; (b) in 1994,that is after the exit of the Lira from the ERM andits strong devaluation and (c) in 1997, that is aftera strong appreciation of the real exchange rate andthe return of the Italian currency to the ERM. Thus,
a model of export behaviour is estimated for these 3years and then the results are compared.
Following Wakelin (1998), export behaviour isdefined in a dual way: both as a probability for a firmto export and the propensity to export for the export-ing firms. Different factors are considered as poten-tial determinants of export behaviour: (a) innovationactivity, provided by new product developments andcost saving technical processes; (b) other firm char-acteristics (labour cost per unit of product, firmsize and ownership structure); (c) industry and (d)geographical localisation of the firm.
The paper also analyses the specificity of export be-haviour of firms localised in the south of the countryover the same period. The south of Italy (Mezzog-iorno) plays a marginal role in Italian internationaltrade. During the late 1980s and the early 1990s,Mezzogiorno’s share in manufacturing export of Italywas about 8%, while its share in manufacturing value-added of the country was about 13%. It is frequentlynoted that it is in the area of non-price competitivenessthat Mezzogiorno’s economy is particularly weak,reflecting, among other factors, poor product designand quality, after sales service and reliability. Recently,however, southern regions experienced a higher inter-national involvement, mainly due to a stronger pricecompetitiveness and a depressed domestic demand.Since 1992, indeed, the growth of export flows fromthe south was particularly sharp. While total nationalexports increased 12.1% per year from 1992 to 1997,total southern exports increased 13.7% per year overthe same period. As a result, the share of the southin total export of Italy started to grow. According toViesti (1998) and Bodo and Viesti (1997), the im-proved relative position of southern firms on interna-tional markets has also to be connected to an increasednon-price competitiveness, with southern firms gradu-ally adapting product quality to foreign demand. Thepresent work tries to shed some light on this issue.
Section 2 of the paper presents the theoreticalframework and the a priori expectations of the results.Section 3 describes the data set used. Section 4 con-siders the econometric specification used. Section5 gives the results for the probability for a firm toexport and for the propensity of firms to export in thecase of the country as a whole. Section 6 reports theresults for the south. Finally, Section 7 tries to givesome conclusions.
R. Basile / Research Policy 30 (2001) 1185–1201 1187
2. Theoretical framework
To organise the empirical analysis, a simple shortrun microeconomic model of export behaviour hasbeen developed. The market structure assumed ischaracterised by monopolistic competition. Each firmcan sell its product on the domestic market and onthe foreign market. On the first one, total demandQd = ∑n
i=1qdi will be met by n firms, where qdi is
the output of firm i sold on the domestic market. Thedemand on the foreign market is modelled equiva-lently by Qf = ∑m
i=1qfi , where qfi is the output of
firm i sold abroad. The total output qi of firm i isqdi + qfi .
In addition to the output decision and the decisionof how much to sell on the two markets, firms haveto decide on their level of product-innovative activity.Now, these three decision levels are imagined not tobe simultaneous: firms choose the level of output andthe realisation of new products regardless of the in-tended destination. Only after new products have beendeveloped and the level of output has been decided,firms decide which market, domestic or foreign, willyield the highest profits. 2 Furthermore, it is assumedthat recently introduced product innovations (Ii) leadto higher revenues (R) on both markets: δRd( )/δIi> 0, δRf ( )/δIi > 0.
Following Enthorf and Pohlmeier (1990), revenuesare assumed to be additively separable in the twocomponents: revenues due to unchanged products andrevenues due to product innovations
Ri = {pd(Qd)+ adIi}(1 − yi)qi+{pf (Qf )+ af Ii}yiqi (1)
2 Obviously, one cannot exclude that a firm may innovate orincrease the output in order to export, especially when it facesan increasing foreign demand. Such a “demand pull” point ofview of the firm’s innovation capability appears, however, to betoo limited. Indeed, innovation capabilities are also determined byfactors different from the demand. In particular, a firm’s innovationcapability has to be partly considered as the result of the pastinnovation experience of the firm itself: firms that innovated inthe past are more likely to innovate today and in the future (pathdependence; see, for example, Dosi, 1988). Thus, in a model ofexport behaviour, innovation capability might be considered aspredetermined.
where the parameters ad and af give the relative prof-itability of product innovations in the two markets andyi = q
fi /qi is the export share.
Production costs are given by C(Zi |qi), where Zi is avector of firm specific factors, such as labour cost, pro-ductivity, firm size and ownership structure (see infra,p. 7). These factors together with exogenous factors,such as the exchange rate (X), also affect the costs ofexported output G(X, Zi |yi). There are also specificcosts associated with penetrating foreign markets (Pi).These might include “i) the costs of advertising, iden-tifying appropriate trade partners and obtaining infor-mation about market conditions in export markets; ii)the costs of constructing and maintaining marketingnetworks; iii) the costs of developing new marketingtechniques; iv) the costs of negotiating, writing andenforcing contracts between the parties; v) the costsof information on government regulations and otherpolicies in both foreign and domestic markets” (Yheeet al., 1998, p. 5). These costs are considered as sunkin nature: they recur in full if the firm exits the exportmarket for any amount of time (Bernard and Wagner,1998; Yhee et al., 1998).
Now, the firm is assumed to be always able atproducing at the profit-maximising level of export(qf ∗), that can also be equal to zero. In the short run,the firm receives profits
Πi = {pd(Qd)+ adIi}[(1 − y∗i )qi] + {pf (Qf )
+af Ii}y∗i qi − C(Zi |qi)
−G(X,Zi |y∗i )− Pi (2)
Starting from the objective function (2), a numberof hypothesis on export behaviour determinants maybe intuitively derived. First, if product innovationhas a higher return on the foreign market than onthe domestic market (af > ad ), innovating firms areexpected to be also exporters and to have a higherexport intensity (export/sales ratio). Firm specificfactors affecting export behaviour include labourcost per unit of product (w/q), 3 process innovation(T), firm size, ownership structure (group) and thegeographical localisation of the firm (south).
y = F(af − ad+
, w/q−, T+, size+ , group
+, south− )
3 Labour is assumed to be the only variable input in this shortrun model.
1188 R. Basile / Research Policy 30 (2001) 1185–1201
Labour costs per unit of product are a measureof cost/price competitiveness and thus, are likely tohave a negative impact on exports in cost sensitiveexport markets. Higher process innovations (T) areassumed to reduce production costs and thus, to in-crease the firm’s competitiveness abroad. Firm size isexpected to have a positive relationship with exportas international trade may be a way of extending themarket and allowing exploitation of scale economies(Krugman, 1979). Firms belonging to a businessgroup are expected to be more likely to export, sincethe group allows firms to overcome the problem oflacking resources necessary to export, such as fi-nance, marketing, physical and human capital. Forexample, subsidiaries may exploit export channels ofother firms belonging to the same group. Finally, thegeographical localisation may strongly affect bothefficiency and export propensity of firms. In particu-lar, firms localised in the less developed regions of acountry (south) do not benefit from market and tech-nological knowledge spillovers also, they face highertransport costs than firms localised in the north whentrying to reach foreign markets.
Obviously, the relative importance of innovation,labour costs and other firm specific factors is expectedto change over time because of the change of an exo-genous factor, such as the exchange rate. For example,if af > ad (product innovation has a higher return onthe foreign market than on the domestic market), thenall innovating firms will always export, while a largeexchange rate shock may induce some non-innovatingand non-exporting firms to enter foreign markets. Inother terms, innovation capabilities reduce their roleof non-price advantages when a strong exchange rateshock occurs.
However, the reverse is not necessarily true. Asemphasised before, in order to enter foreign markets,firms might incur in penetration costs. Since thesecosts are sunk, when the exchange rate appreciates andreturns to its original level, not all of the new entrantsexit (Baldwin and Krugman, 1989). This phenomenonhas come to be called hysteresis in trade. Thus, oncenon-innovating firms have become exporters becauseof a large exchange rate shock and have also in-vested in trade penetration (P), as the currency returnsto its previous level, they will find it profitable toremain in the foreign market at least in the shortterm.
3. Data and variables
The empirical work draws on firm-level data col-lected by Mediocredito Centrale in 1992 for the period1989–1991, in 1995 for the period 1992–1994 and in1998 for the period 1995–1997. Mediocredito surveyscover a sample of manufacturing firms operating inItaly with more than 10 employees and all the firmswith more than 500 employees. 4 The sample (morethan 4000 firms) is random and stratified according tothe size of the firm, in terms of the number of employ-ees, the sector and the region. Unfortunately, for thethird survey, the code number of the firm is not avail-able. This precluded a full exploitation of the panelnature of the data.
The dependent variable is the export performance,calculated by the ratio of export and sales in 1991,1994 and 1997. The currency devaluation occurred inSeptember 1992, coupled with a strong reduction ofthe labour cost dynamics, determined a strong depreci-ation of the Lira’s real effective exchange rate. 5 Thislarge exchange rate shock allowed a huge increase ofItalian exports until the 3rd quarter of 1995 (Fig. 1).
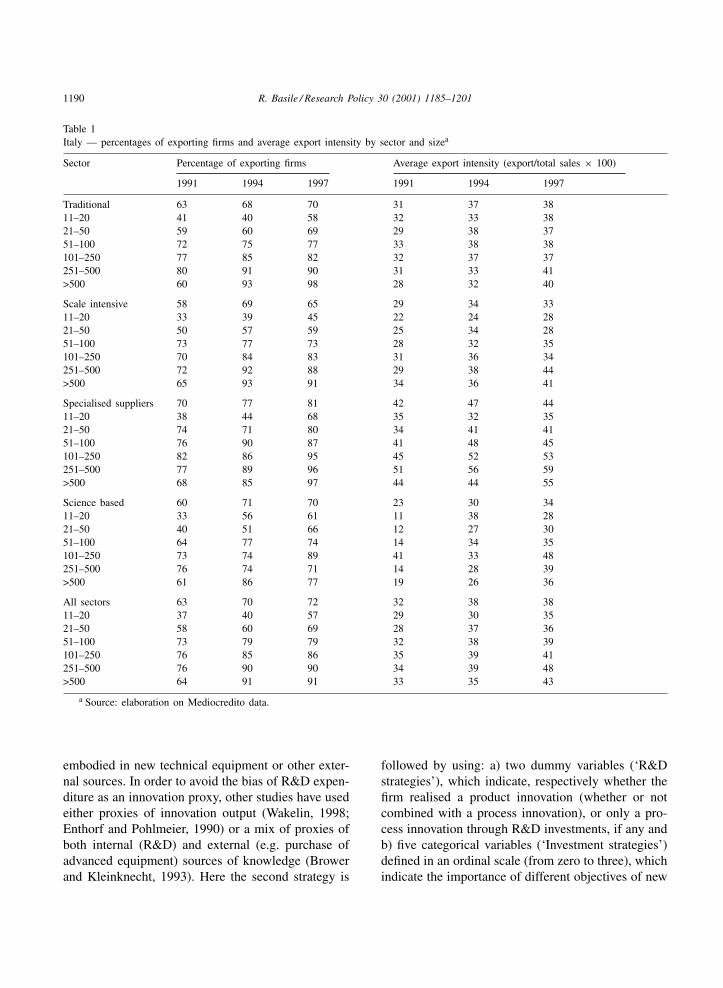
Coherently with this macro evidence and accordingto Mediocredito data, in 1994 both the percentage ofexporting firms and the share of output shipped abroadby the average exporting firm (the export intensity)were higher than in 1991 in all sectors and in all sizeclasses, with very few exceptions 6 (Table 1). The rela-tive presence of exporting firms increased more among
4 The sample procedure used to collect data was the same overthe three surveys.
5 The currency depreciated twice during this period. The firstdepreciation occurred between the 3rd quarter of 1992 and the 1stquarter of 1993, while the second one occurred between the 2ndquarter of 1994 and 1995.
6 Sectors are defined according to Pavitt’s classification. As wellknown, Pavitt (1984) grouped sectors according to different char-acteristics of the firms: innovation behaviour (product and processinnovation, sources of knowledge, appropriability regimes and thelike), production organisation (e.g. degree of vertical integration)and competitive factors. Thus, he individuated four categories ofsectors: 1) traditional or supplier dominated sectors (e.g. footwear,clothing, food); 2) specialised supplier sectors (e.g. machine tools);3) scale intensive sectors (e.g. cars, television set) and 4) sciencebased sectors (e.g. electronics, pharmaceuticals). Technological in-terdependencies among these four categories are very complexand shape a circular process of production and use of technology.Pavitt’s taxonomy has showed to be very useful in many empiricalstudies on trade and competitiveness both at macro and micro level.

R. Basile / Research Policy 30 (2001) 1185–1201 1189
Fig. 1. Italy — export growth and real exchange rates (“export” is the cyclical component of the index of export at constant prices, obtainedremoving the trend with the Hodrick–Presctt’s filter. Data are normalised [X − mean (X)/standard deviation (X)]. Source: elaboration onIstat (National Institute of Statistics) (export) and Bank of Italy (exchange rate) data.
scale intensive and science based sectors, rather thanamong traditional and specialised suppliers sectors,that is sectors in which Italy is highly specialised.
Thus, after the currency devaluation occurred in1992, Italian firms have adjusted their output to thechanges in relative prices in different ways. First,existing exporters increased their export intensity,either through a redirection of output destined for thedomestic market to foreign customers or through anoverall increase in production coupled with an expan-sion of exports. Second, new firms entered into theexport market.
Since the 2nd quarter of 1995, the Lira’s real effec-tive exchange rate strongly appreciated and returnedto the level reached in 1993. In spite of this lower costcompetitiveness, the reduction of the export volumeswas contained. This evidence may be interpreted interms of a persistent effect of the large exchange rateshock (see Baldwin and Krugman, 1989). Moreover,in 1997 an expansion of the world demand allowed afurther increase of exports.
Coherently, in 1997 both export participation andintensity of Italian firms remained at the level reachedin 1994. The existence of sunk costs, necessary topenetrate the foreign market since 1992, has probablyinduced exporting firms to reduce their profit marginsin order to remain into the market. Differently from1994, the fraction of firms exporting increased in thesectors of Italian trade specialisation (traditional and
specialised suppliers), while export intensity increasedin specialised suppliers and in science based sectors.
This simple statistical evidence suggests to comparethe export behaviour of Italian firms over the threedifferent phases of the exchange rate and to analyseboth the export participation and the export intensity,instead of confining the research only to the partici-pation decision, as usually done in recent studies ofexport behaviour (Roberts and Tybout, 1997; Bernardand Wagner, 1997, 1998; Bernard and Jensen, 1999).
Different independent variables are included in theempirical model as suggested by the theoretical frame-work (see Table 2). The innovation variables, as wellas the other firm specific variables, refer to the entireperiods 1989–1991, 1992–1994 and 1994–1996,respectively, that is the 3 years before those of the de-pendent variable (1991, 1994 and 1997). 7 With thistime-lag, possible simultaneity bias may be avoided.
In analysing the impact of innovation on exportbehaviour, different firm level studies have used R&Dexpenditure as proxy of innovation (e.g. Kumar andSiddharthan, 1994; Hirsch and Bijaoui, 1985). Yet,many small firms and firms operating in traditionalsectors do not have a separate R&D department oreven an R&D budget (Pavitt et al., 1987). Never-theless, they innovate through acquiring knowledge
7 Continuous variables, such as SIZE and LCUP, are calculatedas averages over each period.
1190 R. Basile / Research Policy 30 (2001) 1185–1201
Table 1Italy — percentages of exporting firms and average export intensity by sector and sizea
Sector Percentage of exporting firms Average export intensity (export/total sales × 100)
1991 1994 1997 1991 1994 1997
Traditional 63 68 70 31 37 3811–20 41 40 58 32 33 3821–50 59 60 69 29 38 3751–100 72 75 77 33 38 38101–250 77 85 82 32 37 37251–500 80 91 90 31 33 41>500 60 93 98 28 32 40
Scale intensive 58 69 65 29 34 3311–20 33 39 45 22 24 2821–50 50 57 59 25 34 2851–100 73 77 73 28 32 35101–250 70 84 83 31 36 34251–500 72 92 88 29 38 44>500 65 93 91 34 36 41
Specialised suppliers 70 77 81 42 47 4411–20 38 44 68 35 32 3521–50 74 71 80 34 41 4151–100 76 90 87 41 48 45101–250 82 86 95 45 52 53251–500 77 89 96 51 56 59>500 68 85 97 44 44 55
Science based 60 71 70 23 30 3411–20 33 56 61 11 38 2821–50 40 51 66 12 27 3051–100 64 77 74 14 34 35101–250 73 74 89 41 33 48251–500 76 74 71 14 28 39>500 61 86 77 19 26 36
All sectors 63 70 72 32 38 3811–20 37 40 57 29 30 3521–50 58 60 69 28 37 3651–100 73 79 79 32 38 39101–250 76 85 86 35 39 41251–500 76 90 90 34 39 48>500 64 91 91 33 35 43
a Source: elaboration on Mediocredito data.
embodied in new technical equipment or other exter-nal sources. In order to avoid the bias of R&D expen-diture as an innovation proxy, other studies have usedeither proxies of innovation output (Wakelin, 1998;Enthorf and Pohlmeier, 1990) or a mix of proxies ofboth internal (R&D) and external (e.g. purchase ofadvanced equipment) sources of knowledge (Browerand Kleinknecht, 1993). Here the second strategy is
followed by using: a) two dummy variables (‘R&Dstrategies’), which indicate, respectively whether thefirm realised a product innovation (whether or notcombined with a process innovation), or only a pro-cess innovation through R&D investments, if any andb) five categorical variables (‘Investment strategies’)defined in an ordinal scale (from zero to three), whichindicate the importance of different objectives of new
R. Basile / Research Policy 30 (2001) 1185–1201 1191
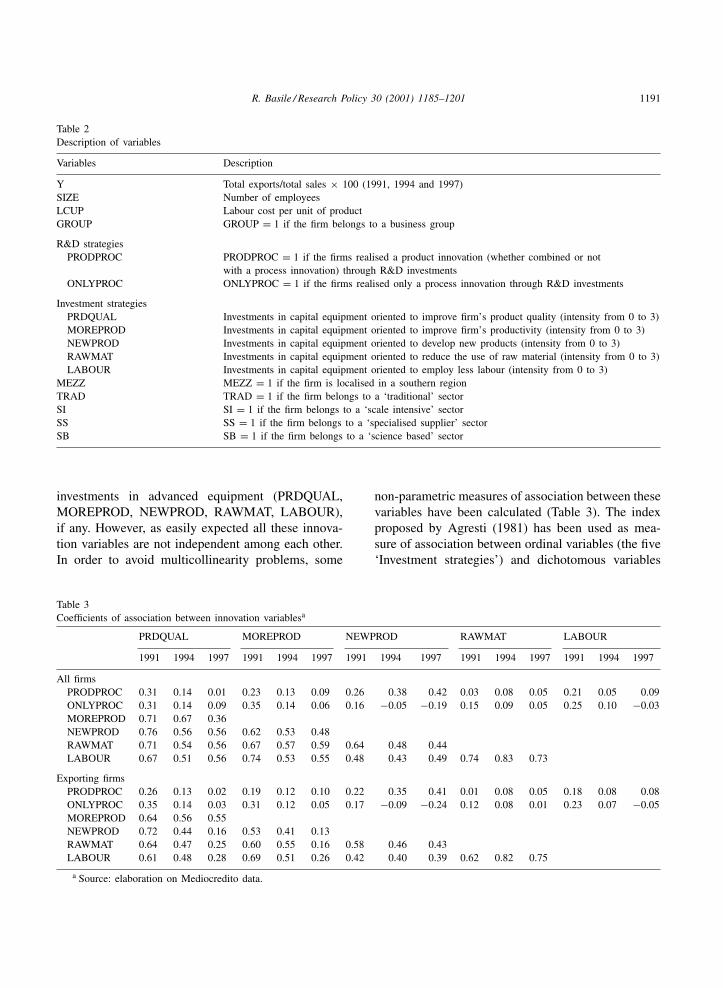
Table 2Description of variables
Variables Description
Y Total exports/total sales × 100 (1991, 1994 and 1997)SIZE Number of employeesLCUP Labour cost per unit of productGROUP GROUP = 1 if the firm belongs to a business group
R&D strategiesPRODPROC PRODPROC = 1 if the firms realised a product innovation (whether combined or not
with a process innovation) through R&D investmentsONLYPROC ONLYPROC = 1 if the firms realised only a process innovation through R&D investments
Investment strategiesPRDQUAL Investments in capital equipment oriented to improve firm’s product quality (intensity from 0 to 3)MOREPROD Investments in capital equipment oriented to improve firm’s productivity (intensity from 0 to 3)NEWPROD Investments in capital equipment oriented to develop new products (intensity from 0 to 3)RAWMAT Investments in capital equipment oriented to reduce the use of raw material (intensity from 0 to 3)LABOUR Investments in capital equipment oriented to employ less labour (intensity from 0 to 3)
MEZZ MEZZ = 1 if the firm is localised in a southern regionTRAD TRAD = 1 if the firm belongs to a ‘traditional’ sectorSI SI = 1 if the firm belongs to a ‘scale intensive’ sectorSS SS = 1 if the firm belongs to a ‘specialised supplier’ sectorSB SB = 1 if the firm belongs to a ‘science based’ sector
investments in advanced equipment (PRDQUAL,MOREPROD, NEWPROD, RAWMAT, LABOUR),if any. However, as easily expected all these innova-tion variables are not independent among each other.In order to avoid multicollinearity problems, some
Table 3Coefficients of association between innovation variablesa
PRDQUAL MOREPROD NEWPROD RAWMAT LABOUR
1991 1994 1997 1991 1994 1997 1991 1994 1997 1991 1994 1997 1991 1994 1997
All firmsPRODPROC 0.31 0.14 0.01 0.23 0.13 0.09 0.26 0.38 0.42 0.03 0.08 0.05 0.21 0.05 0.09ONLYPROC 0.31 0.14 0.09 0.35 0.14 0.06 0.16 −0.05 −0.19 0.15 0.09 0.05 0.25 0.10 −0.03MOREPROD 0.71 0.67 0.36NEWPROD 0.76 0.56 0.56 0.62 0.53 0.48RAWMAT 0.71 0.54 0.56 0.67 0.57 0.59 0.64 0.48 0.44LABOUR 0.67 0.51 0.56 0.74 0.53 0.55 0.48 0.43 0.49 0.74 0.83 0.73
Exporting firmsPRODPROC 0.26 0.13 0.02 0.19 0.12 0.10 0.22 0.35 0.41 0.01 0.08 0.05 0.18 0.08 0.08ONLYPROC 0.35 0.14 0.03 0.31 0.12 0.05 0.17 −0.09 −0.24 0.12 0.08 0.01 0.23 0.07 −0.05MOREPROD 0.64 0.56 0.55NEWPROD 0.72 0.44 0.16 0.53 0.41 0.13RAWMAT 0.64 0.47 0.25 0.60 0.55 0.16 0.58 0.46 0.43LABOUR 0.61 0.48 0.28 0.69 0.51 0.26 0.42 0.40 0.39 0.62 0.82 0.75
a Source: elaboration on Mediocredito data.
non-parametric measures of association between thesevariables have been calculated (Table 3). The indexproposed by Agresti (1981) has been used as mea-sure of association between ordinal variables (the five‘Investment strategies’) and dichotomous variables

1192 R. Basile / Research Policy 30 (2001) 1185–1201
(the two ‘R&D strategies’), 8 while Goodman-Kruskalcoefficients have been used to measure associa-tion between the ordinal variables (‘Investmentstrategies’). 9 Coefficients above 0.50 are consideredto be rather high and are given in bold letters. Onlysome coefficients of ‘Investment strategies’ are higherthan 0.50. These results suggest to consider, within themultivariate analysis, only the two ‘R&D strategies’and the two variables NEWPROD and LABOUR. 10
Finally, LCUP is the ratio between wage per em-ployee and labour productivity. This is a measureof cost competitiveness. Normalising wages per em-ployee by the productivity level is very important:lower wages per employee, by themselves, might notimply a competitive advantage if they are accompa-nied by lower labour productivity. Thus, the inclusionof this variable is considered as a good alternative tothe separated inclusion of wages per employees andlabour productivity variables, as often done in otherstudies of export behaviour (e.g. Bernard and Jensen,1999; Bernard and Wagner, 1998).
4. The econometric specification
Before presenting the results of the multivariateanalysis of export behaviour, some methodologicalissues have to be discussed. The dependent variable,
8 This indicator (δ) is constructed comparing the probability toobserve higher levels of an ordinal variable Y when a dichotomousvariable X equals 0, with that when X = 1. If the variables areindependent, the two probabilities are equal. The values of δ varybetween −1 and 1. If the variables are independent, δ = 0.
9 The association between two ordinal phenomena (X and Y) canbe synthesised by using the concepts of concordance and discor-dance. A couple of observations is defined concordant when thestatistical unit assuming higher levels for the first variable, as-sumes also higher levels for the second one; while it is defineddiscordant when the statistical unit assuming higher levels for thefirst variable, assumes lower levels for the second one. Given thetotal number of concordant (C) and discordant (D) couples ofobservations in a contingency table, a simple indicator of associa-tion between two ordinal variables may be calculated as follows:γ = (C−D)/(C+D) (Goodman and Kruskal, 1954). The valuesof γ vary between −1 and 1. In particular, γ = 1 if D = 0, andγ = −1 if C = 0. Thus, |γ | = 1 suggests a monotonic relationbetween the variables: when X grows, Y does not decrease (γ = 1),or does not increase (γ = −1). If the variables are independent,γ = 0.10 Similar results have been found for the south.
y (export/sales) is a doubly truncated random vari-able: its values vary between 0 and 1 by definition.Moreover, this variable often takes the value of zero.A generally used approach to dealing with the prob-lem of censored samples is the Tobit model (see, forexample, Kumar and Siddharthan, 1994). This modeluses all the available information from the explana-tory variables, including those for which the depen-dent variable is zero.
In the Tobit model, the change of the expectedvalue of the dependent variable y, with respect to eachregressor, has two components. One effect works bychanging the conditional mean of y (intensity) and theother by changing the probability that an observationwill be positive (participation). However, it is reason-able to maintain that the explanatory variables havedifferent effects on the participation decision (export)and on the decision on how much to export conditionalon participation. Since the Tobit constraints the par-ticipation equation and the intensity equation to havethe same parameters, the Tobit may be mis-specifiedin this case, and this mis-specification may haveprofound and undesirable consequences for the esti-mates. This constraint may be relaxed by viewing theproblem as involving two equations.
Cragg (1971) proposed a two-stage specification,which weakens one of the central characteristics ofthe Tobit model. In Cragg’s specification of the Tobitmodel, the probability of a non-limit outcome is deter-mined apart from the level of the non-limit outcome.The first stage of this specification uses the whole setof data and considers the probability to sell abroad.The dependent variable y is binary, taking a value of1 when the firm sells abroad and zero when it doesnot. In this case, a Probit model is appropriate. Forthe second stage, only the subset of firms which sellabroad are considered. A truncated estimation proce-dure is used as the dependent variable is observed onlyif it is greater than zero (i.e. this sub-sample is trun-cated). This double specification can be tested as theunrestricted model against a Tobit model. In the fieldof export behaviour analysis, Wakelin (1998) has usedthe Cragg’s specification of the Tobit model.
The assumption underlying the Cragg’s specifica-tion is that the two stages are independent of eachother, that is the disturbances in the latent regressionunderlying the Probit model and those in the truncatedregression are independent. If the two stages are not
R. Basile / Research Policy 30 (2001) 1185–1201 1193
independent, the resulting estimates cannot hold truefor the population as a whole, because they are basedon a non-randomly selected subset. Thus, the result-ing truncated estimates will be biased estimates of thetrue population parameters and more importantly, theyare also biased estimates of the parameters among thatgroup of the population for whom y > 0.
The sample-selection model extends Cragg’s modelby relaxing the assumption that the two stages areindependent. The basic idea of such a model is thatthe outcome variable, y, is only observed if some cri-terion, defined with respect to a different set of vari-ables is met. The simplest form of such a model hastwo stages: in the first stage, a dichotomous variablez (= 0 or 1) determines whether or not y is observed,y being observed only if z = 1; in the second stage,the expected value of y is modelled, conditional on ithaving been observed. Using Heckman’s (1979) pro-cedure, the Probit results are firstly taken and for thesub-sample for whom z = 1, the estimate of φi/Φi(the inverse of Mill’s ratio, Θi) is computed, whereΦi is the standard normal distribution function andφi is the corresponding standard normal density func-tion. Then, for this same sub-sample, OLS is used toregress y on xi and on the estimate of Θi . However,OLS coefficients, although efficient, are inconsistent.In order to obtain consistent and efficient coefficients,maximum likelihood estimators have to be computed.
5. Estimation results
A sample selection model was firstly applied for theanalysis of export behaviour. Since the correlation be-tween the error term in the Probit equation and in the2SLS equation was found to be low, any problem ofselection bias was rejected and concluded that the twostages were independent. Thus, the Cragg’s specifica-tion of the Tobit model was applied to the analysis ofexport behaviour. The Tobit restriction was rejected atthe 99% probability level using a chi-square test basedon the likelihood ratio test statistics. 11 All this meansthat: i) the subset of firms selling abroad represents anunbiased sample of exporting firms and ii) explanatory
11 The test is the following: λ = −2[lnLt − (lnLp + lnLtr)],where ln Lt is the likelihood for the Tobit model, ln Lp for theProbit model and ln Ltr for the truncated model.
variables have different effects on the participationdecision (whether to sell abroad) and on the intensitydecision (the fraction of output shipped abroad). 12
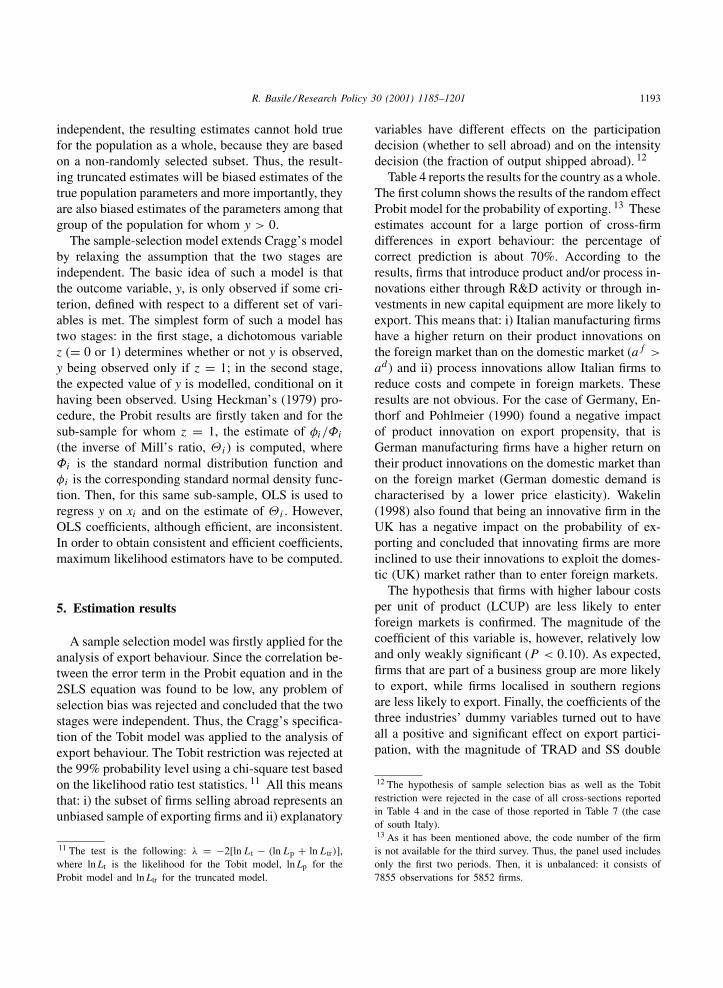
Table 4 reports the results for the country as a whole.The first column shows the results of the random effectProbit model for the probability of exporting. 13 Theseestimates account for a large portion of cross-firmdifferences in export behaviour: the percentage ofcorrect prediction is about 70%. According to theresults, firms that introduce product and/or process in-novations either through R&D activity or through in-vestments in new capital equipment are more likely toexport. This means that: i) Italian manufacturing firmshave a higher return on their product innovations onthe foreign market than on the domestic market (af >ad ) and ii) process innovations allow Italian firms toreduce costs and compete in foreign markets. Theseresults are not obvious. For the case of Germany, En-thorf and Pohlmeier (1990) found a negative impactof product innovation on export propensity, that isGerman manufacturing firms have a higher return ontheir product innovations on the domestic market thanon the foreign market (German domestic demand ischaracterised by a lower price elasticity). Wakelin(1998) also found that being an innovative firm in theUK has a negative impact on the probability of ex-porting and concluded that innovating firms are moreinclined to use their innovations to exploit the domes-tic (UK) market rather than to enter foreign markets.
The hypothesis that firms with higher labour costsper unit of product (LCUP) are less likely to enterforeign markets is confirmed. The magnitude of thecoefficient of this variable is, however, relatively lowand only weakly significant (P < 0.10). As expected,firms that are part of a business group are more likelyto export, while firms localised in southern regionsare less likely to export. Finally, the coefficients of thethree industries’ dummy variables turned out to haveall a positive and significant effect on export partici-pation, with the magnitude of TRAD and SS double
12 The hypothesis of sample selection bias as well as the Tobitrestriction were rejected in the case of all cross-sections reportedin Table 4 and in the case of those reported in Table 7 (the caseof south Italy).13 As it has been mentioned above, the code number of the firmis not available for the third survey. Thus, the panel used includesonly the first two periods. Then, it is unbalanced: it consists of7855 observations for 5852 firms.
1194R
.B
asile/R
esearchPolicy
30(2001)
1185–1201
R. Basile / Research Policy 30 (2001) 1185–1201 1195
Table 5Export and innovationa
Percentage of exporting firms Average export intensity (export/total sales × 100)
1991 1994 1997 1991 1994 1997
PRODPROC 89 88 90 31 37 40No PRODPROC 58 65 68 18 23 26ONLYPROC 83 84 83 28 30 36No ONLYPROC 62 69 70 20 26 27
a Source: elaboration on Mediocredito data.
than that of SI. These results are not surprising, giventhe strong specialisation of Italy in traditional andspecialised supplier sectors and its relative weaknessin science based sectors (the reference category). Fi-nally, a dummy variable for the 1994 was includedand found significantly positive: it caught the effectof the large exchange rate shock.
The rest of the table contains Probit 14 and trun-cated estimates of coefficients for each explanatoryvariable and for the 3 years (1991, 1994 and 1997). Asfar as Probit estimates are concerned, it is interestingto observe that the magnitude of the coefficients of allinnovation variables included is higher in 1991 than in1994. Moreover, the coefficients of the two proxies of‘Investment strategies’ (NEWPROD and LABOUR)are only weakly significant in 1994. This suggests thatnon-innovating firms have been more able to exportin 1994 than in 1991, mainly because of the strongerprice competitiveness offered by the currency deval-uation. Moreover, in 1997 in spite of the exchangerate appreciation, less innovative firms continued tobe exporters: the coefficients of PRODPROC andONLYPROC are lower than in 1994 and 1991.
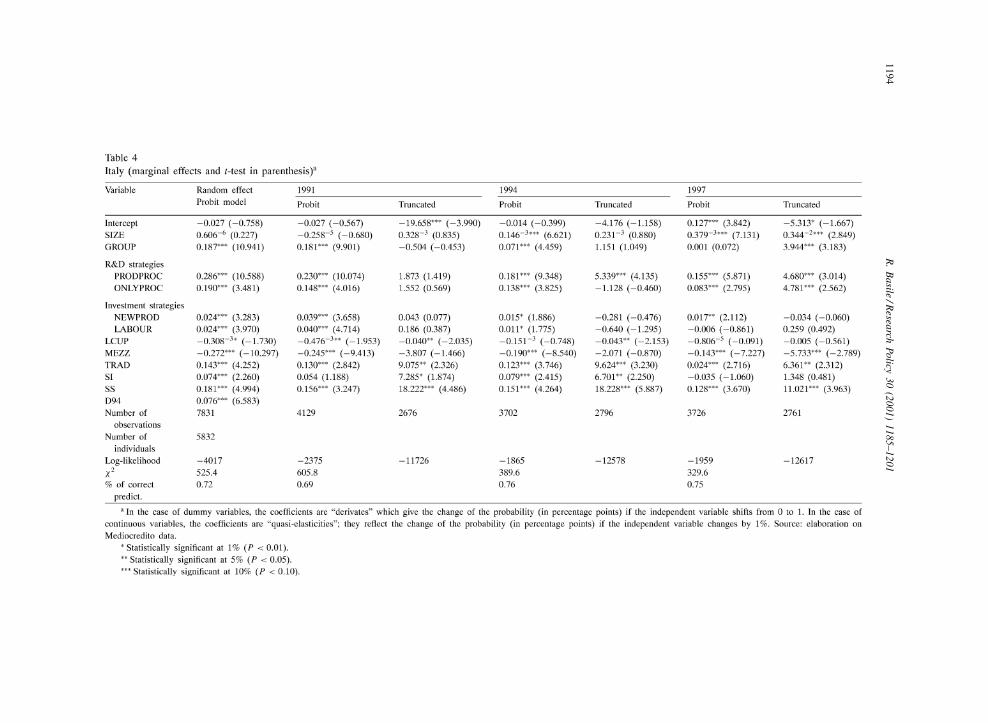
The relationship between innovation and export be-haviour may be easily analysed in a univariate context(Table 5): 90% of firms that have introduced productinnovations (PRODPROC) over each period were also
14 In order to explicitly test whether the Probit coefficients werestable across the two cross-sections (1991 and 1994), a randomeffects probit model was run, which included all the explanatoryvariables, plus the dummy variable D94 and the interactionsbetween each explanatory variable and D94. A likelihood ratiotest was then performed to assess the joint effect of D94 and theinteraction variables. The null hypothesis (no joint effect) wasrejected at the 99% probability level using a chi-square test. Thissuggested running cross-section estimates for each year in orderto compare the marginal effects of explanatory variables.
exporters. Instead, the percentage of non-innovatingfirms exporting was about 58% in 1991, 65% in 1994and 68% in 1997. Similar results were found for thevariable ONLYPROC. As discussed above, the differ-ent export behaviour of non-innovative firms may bepartly explained in terms of entry costs. A large ex-change rate shock may induce some non-innovatingfirms entering foreign markets, investing in entry(sunk) costs and thus, remaining in the foreign marketwhen the exchange rate returns to its previous level(hysteresis).
Turning to Table 4, the coefficient of SIZE issignificantly positive in 1994 and 1997, but not in1991, in the Probit estimates. This does not imply,however, that in 1991 the size was not an importantfactor to enter foreign markets. For 1991, indeed, thecoefficient of size lost significance, only after innova-tion variables have been included. In other words, in1991 the ‘chumpeterian’ positive correlation betweensize and innovation was higher than in 1994 and 1997.
Belonging to a business group increases the like-lihood to export more before than after the devalua-tion: the coefficient of the dummy variable GROUPis higher in 1991 than in 1994 estimation. Thus, astrong improvement of price competitiveness, such asthat derived from the devaluation of the Italian Lira,helps firms reduce financial as well as other resourceconstraints to export. Surprisingly, in 1997 the dummyvariable GROUP is not significant.
The hypothesis that firms with higher labour costsper unit of product are more likely to enter foreignmarkets after a currency devaluation is also confirmed.The coefficient of LCUP is significantly negative onlyin 1991 in the Probit estimates.
The coefficients of sectors TRAD and SS do notshow relevant changes among the 3 years considered,while SI becomes significantly different from zero in

1196 R. Basile / Research Policy 30 (2001) 1185–1201
1994 and returns to be non-significant in 1997. Finally,the negative coefficient for the south appears to bedecreasing, confirming the upgraded relative positionof southern firms in foreign markets.
As far as truncated estimates are concerned, theyshow that R&D related product innovation strategies(PRODPROC) have a positive effect on the exportintensity only in 1994 and 1997. This result may beinterpreted as follows. As discussed above, a largeexchange rate shock helps non-innovating firms en-ter and remain in foreign markets (at least in theshort run) even when the exchange rate returns toits previous level. However, the export intensity ofnon-innovating firms is smaller than that of inno-vating firms (Table 5). Thus, the higher presenceof non-innovative firms among exporters after thecurrency depreciation may help explain the positiverelationship between innovation and export intensityin 1994 and 1997. Finally, the coefficient of LCUP issignificant both in 1991 and 1994, but not in 1997.
6. The export behaviour of southern firms
This section analyses the peculiarities of the ex-port behaviour of firms localised in the south of thecountry. There are some reasons to carry out thisspecific analysis. As discussed above (Section 1),southern regions traditionally play a marginal role intotal national export: about 90% of Italian exports inmanufacturing industries comes from the north of thecountry. Since 1992, however, the growth of southern
Fig. 2. Annual growth rates of exports (percentages): a comparison between Italy and south Italy (source: elaboration on Istat (NationalInstitute of Statistics) data).
exports was particularly strong and the share of thisgeographical area on total national exports increased(Fig. 2). According to some authors (Bodo and Viesti,1997; Viesti, 1998), the recently improved relativeposition of southern firms on the international mar-kets is not only the effect of the large exchange rateshock, but it has also to be connected to an increasednon-price competitiveness of these firms.
According to Mediocredito data, firms localisedin the south show a lower export participation thannorthern firms (Table 6), but, after the currency de-valuation, the percentage of exporting firms increasedmore in the south than in the rest of the country.Differences between north and south in the aver-age export intensity are negligible. The lower exportparticipation of southern firms is due to a numberof reasons. Surely, southern firms suffer from thelack of market knowledge spillovers, while northernfirms, especially those operating within industrialdistricts, may take advantage of the proximity rela-tionships with other exporting firms. Moreover, manysmall and medium sized firms (SMEs) located in thesouth work mainly as subcontractors for medium andlarge firms, localised either in the north or in thesouth, which export the final product. Hence, theseSMEs may be considered only as ‘indirect exporters’.Table 6 clearly shows that being a small firm in thesouth (that is, having less then 50 employees) rep-resents a strong barrier to export. Hence, also in theeconometric model (that is, even controlling for otherfactors) firm size is expected to play a stronger rolein the south than in the country as a whole.

R. Basile / Research Policy 30 (2001) 1185–1201 1197
Table 6North and south — percentage of exporting firms and the average export intensity by sector and sizea
Sector Percentage of exporting firms Average export intensity (export/total sales × 100)
1991 1994 1997 1991 1994 1997
NorthTRAD 67 70 71 21 26 27Scale intensive 62 73 70 18 25 24Specialise suppliers 73 81 83 31 38 37Science based 62 72 75 14 22 26
All 66 73 74 33 38 3911–20 40 42 61 12 13 2221–50 63 64 72 19 24 2651–100 77 80 81 25 32 32101–250 78 88 88 27 35 38251–500 78 91 93 27 35 44>500 65 92 92 22 22 39South
TRAD 44 53 64 32 35 36Scale intensive 31 41 37 23 30 28Specialise suppliers 21 28 56 28 50 27Science based 43 65 53 30 23 28
All 37 47 54 29 34 3211–20 21 25 38 29 24 2521–50 25 35 48 17 30 2851–100 46 63 65 33 30 34101–250 53 49 79 34 41 33251–500 56 79 69 25 44 54>500 42 80 80 37 38 61
a Source: elaboration on Mediocredito data.
Furthermore, firms localised in the south andbelonging to a business group generally have scarcecommercial autonomy from the headquarter. Hence,one may expect a weaker relationship between exportbehaviour and group belonging in the south than thatfound for the country as a whole.
The pattern of international specialisation ofsouthern regions is quite different from that of thenational average. While Italy is strongly specialisedin traditional and machine tools (specialised sup-pliers) sectors, southern regions are specialised intraditional and scale intensive sectors 15 and stronglyde-specialised in machine tools sectors. 16 This last
15 This is partly due to the recent industrial development of thesouth. In the recent past, indeed, in order to exploit public financialincentives, some big (scale intensive) firms (e.g. FIAT) installedproduction plants within southern regions.16 Some evidence on the pattern of trade specialisation of Italianregions according to the Pavitt taxonomy is reported in ISVE(1993).
evidence is particularly important. The export suc-cess of Italian industrial districts localised in thenorth-east-centre of the country (the, so-called, ThirdItaly) during the 1980s and 1990s was indeed partlylinked to the user–producer relationship between tra-ditional and machine tool sectors: firms operating inthese two kinds of sectors have pushed the exportsuccess of each other. Such type of inter-sector tech-nological and market spillover did not work withinthe south because of the lack of specialised suppliers.Recently, however, the growth path of export flowsfrom the south involved different sectors. In particu-lar, after the currency devaluation some non-exportingsectors, such as machine tools, became exporters.Mediocredito data clearly show the low export partic-ipation of specialised suppliers localised in the southbefore the currency devaluation, but also the strongincrease of their average export intensity in 1994 andof their export participation in 1997. All these consid-erations suggest expecting coefficients of sectors for
1198R
.B
asile/R
esearchPolicy
30(2001)
1185–1201
R. Basile / Research Policy 30 (2001) 1185–1201 1199
the south different from those found for the countryas a whole.
As far as LCUP is concerned, it is important toremember that during the, 1990s labour costs peremployee were lower in the south than in the northbecause of the public social contribution to labourcosts in the Mezzogiorno. Over the same period,however, southern firms showed on average a muchlower labour productivity than northern firms. As aresult, LCUP were higher in the south than in thenorth. Mediocredito data confirm this empirical fact:the ratio between the LCUP of the south and theLCUP of the north was 1.03 in 1991, 1.08 in 1994,and 1.13 in 1997. Thus, even controlling for otherfactors, a strong negative relationship between LCUPand export behaviour is expected in the case of thesouth, especially before the currency devaluation.
Finally, it is widely recognised that the participa-tion of southern firms to innovation activity (a veryimportant point of the present analysis) is much lowerthan that of northern firms. 17 In line with theseconsiderations, the relationship between innovationand export behaviour of southern firms is expectedto be much weaker than that found for the nationalaverage.
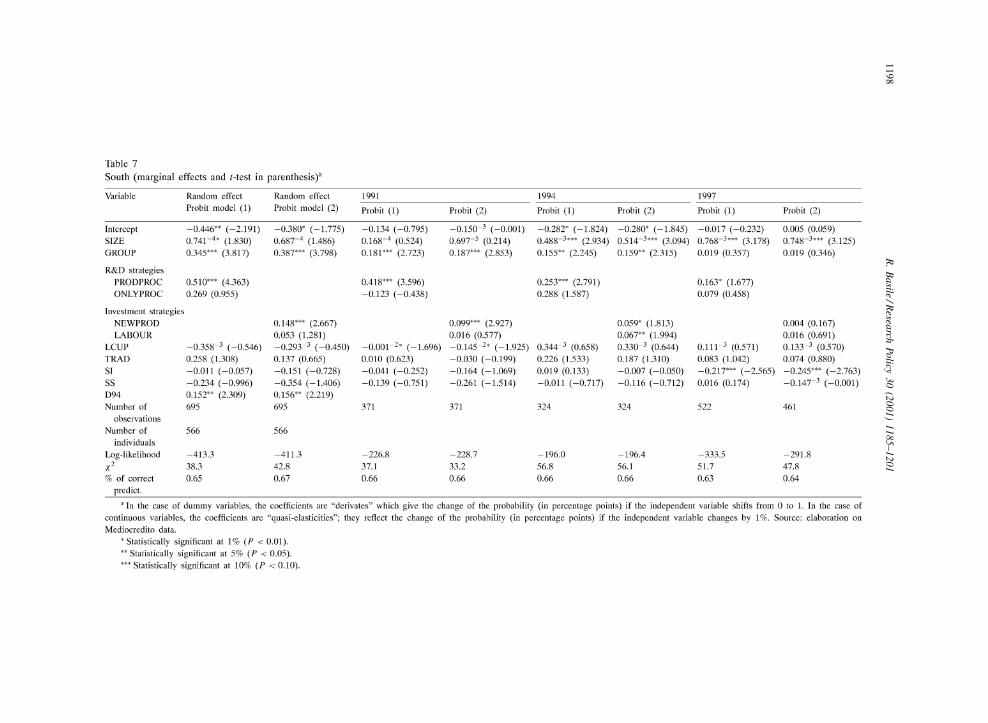
Table 7 shows the results of Probit estimates forthe group of firms localised in the south. 18 Twodifferent specifications are reported in order to avoidcollinearity problems between innovation variables.Again, panel estimates show that af > ad (thecoefficients of PRODPROC and NEWPROD are sig-nificantly positive), that is also southern firms havea higher return on their product innovations on theforeign market than on the domestic market, whileprocess innovations have not a significant effect onthe export participation of southern firms. Moreover,cross-section estimates suggest that, in line withthe results for the country as a whole, the impactof product innovation strategies (PRODPROC and
17 Different studies have documented the extent of regionaldisparities within Italy in technological innovation capacity (e.g.Iammarino et al., 1995).18 Given the small number of southern firms in the sample,truncated estimates have not been reported. Moreover, a testwas performed in order to explicitly assess whether the coeffi-cients were stable across the two cross-sections (1991 and 1994)(see footnote 14). This test confirmed the necessity to reportscross-section results.
NEWPROD) was decreasing. The other coefficientsof innovation variables are not significant, a part fromLABOUR in 1994. Thus, the hypothesis of a weakerrelationship between innovation and export behaviourfor the south is partially confirmed.
Interestingly, labour costs per unit of product(LCUP) have a significant and negative impact onlybefore the currency devaluation. Hence, after deval-uation, labour costs per unit of product do not helpdiscriminate between exporters and non-exporters.
The relationship between group belonging and theexport participation is positive. As in the case of thecountry as a whole, GROUP is not significant in 1997.Surprisingly, even the coefficient of SIZE does notshow relevant differences from that found for the coun-try as a whole.
7. Conclusions
This paper has analysed the role of innovation andother firm specific factors in affecting export behaviourat the microeconomic level. In addition to firm char-acteristics (size, ownership structure, labour costs perunit of product and innovation), characteristics of thesector and of the region in which the firm is locatedhave been included.
The main advantage of examining trade behaviourat the firm level is the potential heterogeneity amongfirms. Studies at the aggregate or sector level abstractfrom variation among firms. The results of the anal-ysis confirm the hypothesis that innovation is a veryimportant competitive factor and helps explain firmlevel heterogeneity in export behaviour among Italianfirms. In contrast to the cost based hypothesis, labourcosts per unit of product seem to play a marginal rolein export behaviour at the firm level.
The main results emerging from this paper concern,however, the effect of a large exchange rate shock onthe relationship between innovation and export beha-viour. As far as the participation decision (whetherto export or not) is concerned, Probit estimates havesuggested that innovation strategies reduce their roleof non-price competitive when a strong devaluationoccurs. A large exchange rate shock, such as thatoccurred between 1992 and 1995 in Italy, allows somenon-innovative firms enter foreign markets. Then, asthe exchange rate returns to its previous level, as it
1200 R. Basile / Research Policy 30 (2001) 1185–1201
happened in 1996, not all of (non-innovating) newentrants exit (hysteresis).
Moreover, truncated estimates have suggested thatproduct innovation strategies have a positive effect onthe export intensity (the fraction of output shippedabroad) only after the currency devaluation. A higherpresence of non-innovating firms (that generally havea lower export intensity) among exporters after thecurrency devaluation help explain the emerging roleof product innovation.
Moreover, the specific case of the south of Italy(Mezzogiorno) has been considered in order to searchthe microeconomic determinants of the unexpectedsuccess of a less developed area on the export mar-kets. It is important, however, to point out that, giventhe small number of southern firms in the sample,the econometric results are not very robust. With thiscaveat in mind, the emerging results suggest that therelationship between innovation strategies and exportbehaviour of southern firms is weaker than that foundfor the national average. Moreover, even in the south,after the devaluation, innovation strategies reducedtheir role of non-price competitive. In general, it canbe concluded that the hypothesis formulated by someauthors (Bodo and Viesti, 1997; Viesti, 1998) on therole of non-price competitiveness in explaining therecent success of southern firms on foreign marketsare not confirmed by the present analysis. Instead,this analysis shows that the currency devaluation al-lowed less efficient firms from the south (that is, firmswith a higher labour cost per unit of product) to enterforeign markets.
Finally, different issues remain open. For exam-ple, which was the role of public support systems inaffecting the export behaviour of Italian firms overthe nineties? What kind of penetration strategies didItalian exporters use before and after the currencydevaluation? What are the consequences of the Mon-etary Union on the export behaviour of Italian firms?These and other questions will be the subject forfuture research.
Acknowledgements
I wish to thank Anna Giunta, Jeffrey Nugent,Almorò Rubin de Cervin and two anonymous refer-ees for useful comments. I remain, however, solely
responsible for any omissions and mistakes, as wellas for the views in the paper, which do not necessarilyreflect those of ISAE.
References
Agresti, A., 1981. Measures of nominal-ordinal association. Journalof the American Statistical Association 76, 524–529.
Baldwin, R., Krugman, P., 1989. Persistent effects of largeexchange rate shocks. Quarterly Journal of Economics 104,635–654.
Bernard, A., Wagner, J., 1997. Exports and success in Germanmanufacturing. Weltwirtschftliches Archiv 133, 134–157.
Bernard, A., Wagner, J., 1998. Export Entry and Exit by GermanFirms, NBER WP, No. 6538.
Bernard, A., Jensen, J.B., 1999. Exceptional export performance:cause, effect, or both? Journal of International Economics 47,1–25.
Bodo, G., Viesti, G., 1997. La grande svolta. Il Mezzogiornonell’Italia degli anni novanta (Rome: Donzelli Editore).
Brower, E., Kleinknecht, A., 1993. Thechnology and a firm’sexport intensity: the need for adequate innovation measurement,Konjunkturpolitik, Vol. 39.
Cragg, J., 1971. Some statistical models for limited dependentvariables with application to the demand for durable goods.Econometrica 39, 829–844.
Dosi, G., 1988. Sources, procedures and microeconomic effectsof innovation. Journal of Economic Literature 26, 1120–1171.
Enthorf, H., Pohlmeier, W., 1990. Employment, innovation andexport activity: evidence from firm-level data. In: Florens et al.(Eds.), Microeconometrics: Surveys and Applications. BasicBlackwell, London.
Goodman, L.A., Kruskal, W.H., 1954. Measures of associationfor cross-classifications. Journal of the American StatisticalAssociation 49, 732–764.
Hirsch, S., Bijaoui, I., 1985. R&D intensity and export perfor-mance: a micro view. Weltwirtschftliches Archiv 121, 138–251.
Iammarino, S., Prisco, M.R., Silvani, A., 1995. On the importanceof regional innovation flows in the EU: some methodologicalissues in the Italian case. Research Evaluation 5 (3), 189–206.
ISVE, 1993. La proiezione internazionale del Mezzogiorno,Rapporto 1993, Il Sole 24ore libri.
Krugman, P., 1979. Increasing returns, monopolistic competitionand international trade. Journal of International Economics 9,469–480.
Kumar, N., Siddharthan, N.S., 1994. Technology, firm size andexport behaviour in developing countries: the case of Indianenterprise. Journal of Development Studies 32 (2), 288–309.
Pavitt, K., 1984. Patterns of technical change: towards a taxonomyand a theory. Research Policy 13, 343–373.
Pavitt, K., Robson, M., Townsend, J., 1987. The size distributionof innovating firms in the UK: 1945–1983, The Journal ofIndustrial Economics 35 (3).
Roberts, M., Tybout, J., 1997. The decision to export in Columbia:an empirical model of entry with sunk cost. American EconomicReview 87, 545–564.

R. Basile / Research Policy 30 (2001) 1185–1201 1201
Venables, A.J., 1994. Integration and the export behaviour of firms:trade costs, trade volumes and welfare, WeltwirtschaftlichesArchiv, 118–132.
Viesti, G., 1998. Esportatori ed esportazioni nel Mezzogiorno1992–1996: un primo confronto (Roma: Rapporto ICE).
Wakelin, K., 1998. Innovation and export behaviour at the firmlevel. Research Policy 26, 829–841.
Yhee, S., Nugent, J.B., Hsiao, C., 1998. A censored switchingregression approach to evaluating the effects of sunk costs andfirm-level disequilibrium on export performance, mimeo.