commodity export diversification in rwanda - many export discoveries with little scaling-up
TRANSCRIPT
October 12, 2007
Document of the World Bank
Report No. 37860-RW
RwandaToward Sustained Growth and Competitiveness(In Two Volumes) Volume II: Main Report
Poverty Reduction and Economic Management 3AFCC2Africa Region
Report N
o. 37860-RW R
wanda
Toward Sustained G
rowth and C
ompetitiveness
Volume II
Pub
lic D
iscl
osur
e A
utho
rized
Pub
lic D
iscl
osur
e A
utho
rized
Pub
lic D
iscl
osur
e A
utho
rized
Pub
lic D
iscl
osur
e A
utho
rized
G2C G2G GDP GoR GNFS GNI GNP HCAP Hv HI ICT IDA IMF IFMIS ISAR ISDN ISPS ITU LT M 2 MDG MINAGRI MINECOFIN MINICOM MFI MSSE MT NBR NGO NIC I NIS NUR NTBs ODA OCIR-CafC
ORTPN PDL HIM0
OCIR-ThC
PPPS PIL PRS PRSC RB PRSP RIA RITA R&D RER R I M S
Government-to-Citizen Government-to-Government Gross Domestic Product Government o f Rwanda Goods and Non Factor Services Gross National Investment Gross National Product Labor Force High Value Herfindahl Index Information Communication Telecommunication International Development Association International Monetary Fund Integrated Financial Management System National Agricultural Research Insti tute Integrated Services Digital Network Internet Service Providers International Telecommunications Unit Low Technology Narrow Money Millennium Development Goals Ministry o f Agriculture Ministry o f Finance and Economic Planning Ministry o f Commerce Microfinance Institutions Micro and Small Scale Enterprises Medium Technology National Bank o f Rwanda Non-Governmental Organization National Information and Communication Infrastructure National Institute o f Statsitics National University o f Rwanda National Tender Board Official Development Assistance Office des Cultures Industrielles Rwandais-CafC Office des Cultures Industrielles Rwandais-ThC Rwandan Office o f Tourism and National Parks Programme de dkveloppement local a haute intensite de main- d’ceuvre, or Labor-Intensive Local Development Program Public-Private Partnerships Partnership in Learning Poverty Reduction Strategy Poverty Reduction Support Credit Resource Based Poverty Reduction Strategy Paper Research ICT Africa Rwanda Information and Technology Authority Research and Development Rural Economy Review (Real Exchange Rate) Rwanda Industrial and Mining Survey
.. 11
RINEX SINELAC SOPYRWA SOWARTHE STABEX TFP TOT UBPR UK-DFID UNDO UTEXIRWA VAT VECM VPP VSAT WDI
Rwanda Internet Exchange Societe Internationale d’Electricite des Grands Lacs Insecticide Processing Plant Tea Associations Import Tendering Board Total Factor Productivity Terms o f Trade Union de Banque Pop. de Rwanda United Kingdom Department for International Development United Nations Industrial Development Organization Textile Company Value Added Tax Vector Error Correction Model Village Pay Phone Very Small Aperture Terminal Satellite World Development Indicators
... 111
7. COMMODITY EXPORT DIVERSIFICATION IN RWANDA - MANY EXPORT DISCOVERIES -WITH LITTLE SCALING-UP
7.1 INTRODUCTION
7.1 Increased diversification o f commodity exports, and increased numbers o f high-value commodity exports, are needed to generate employment and meet Government targets for poverty reduction. This chapter presents evidence that increased diversification o f exports i s linked to increased export and GDP growth. Yet, commodity exports in Rwanda are concentrated in a few commodities. Although a greater proportion o f the population i s engaged in sectors related to commodity exports as opposed to service-related exports, the service sector accounts for close to 50 percent o f Rwanda’s total exports o f goods and services
7.2 Diversification from traditional to non-traditional commodity exports i s imperative for Rwanda. The Government i s focused on generating economic growth to raise incomes above the current level o f $250 per capita, but it faces some challenges. Exports, a key channel of economic growth, are caught in a low-growth trap. Export growth decelerated to only 9 percent nominal growth per year between 1996 and 2004, from i t s level between 1965 and 1990 o f 20 percent per year.89 Worse, excluding 2 or 3 primary commodity-based exports, very few other products have values o f up to US$50,000 in any year. Given the limited prospects o f simply scaling up Rwanda’s leading exports, the country’s policymakers have almost no option but to turn to export diversification in the hope o f accelerating export growth and economic development. Export diversification i s indispensable for enabling Rwanda to graduate from a primary producer to a modern economy.
7.3 The relationship between export diversification and export growth in SSA confirms that for stable, sustainable, and higher export growth, export diversification i s necessary. In addition to export promotion policies such as those which attract FDI, decision makers need to design policies to accelerate diversification o f the export mix. The effect o f diversification on export growth will be maximized if diversification shifts the export mix in the direction o f manufactured or resource-based products (low or medium technology). This implies (i) sector- specific public strategies that can influence the export mix; and (ii) public investments in human capital and supporting infrastructure.
7.4 This chapter finds that in the past five years, East Asia’s burgeoning demand has opened up new markets that are likely to sustain rapid growth for Rwanda’s minerals and metal exports. But, while good for growth, such exports run the risk o f reinforcing the trend in commodity exports based on unprocessed natural resources, relegating Rwanda’s export basket to products defined by i t s natural comparative advantage. A structural transformation o f the export basket, therefore, poses some hard questions. In what direction should Rwanda diversify? Which sectors? Should the Government be indifferent to the types o f products exported, or should it necessarily support higher-value products? Should the Government prefer sector-specific to general export development strategies?
7.5 I n comparison to its neighbors and SSA, Rwanda’s export mix i s concentrated; the share of exports in the economy too small; and export growth i s low, declining, and volatile.
*’ Note that the period 1991-1995 i s excluded due to the deleterious effect o f the genocide.
160
Given that coffee and minerals (two types) account for 91 percent o f i ts exports, these discouraging characteristics can only be altered if the Government implements a drastically different policy aimed at export diversification.
7.6 The challenge of export diversification in Rwanda is not about the paucity of new export discoveries. In light o f i t s endowments, stage o f development, and geography, Rwanda’s export discoveries are many but small. The problem o f export diversification i s primarily a lack o f scale in products other than coffee and minerals. Except for the latter, nearly al l exports have miniscule values, and very few are larger than US$lOO,OOO in any given year. Each US$lOOO increment o f a non-traditional export i s a precious achievement.
7.7 This chapter provides insights into the export sector which policymakers may wish to use to inform an export diversification strategy for Rwanda. The chapter begins by examining how much Rwanda has diversified over the past decade. It then examines the degree o f sophistication o f Rwanda’s exports. Finally, it examines commodity-specific and general constraints to export growth. The chapter concludes with options for reducing the degree o f concentration o f exports in Rwanda, despite the constraint o f limited natural and human capital endowments and the challenge o f developing economies o f scale.
7.1.1 The Case for Export Diversification - T o Promote Growth of Exports and GDP and Reduce Volatility
7.8 The relationship between export diversification and export growth for SSA confirms that for stable, sustainable, and higher-export growth, export diversification is necessary. Analysis o f the links between diversification (measured by the Herfindahl Index, HI) and growth for SSA indicates that diversification helped SSA to transition from low to relatively higher export growth between the 1980s and the ~ O O O S . ~ ~
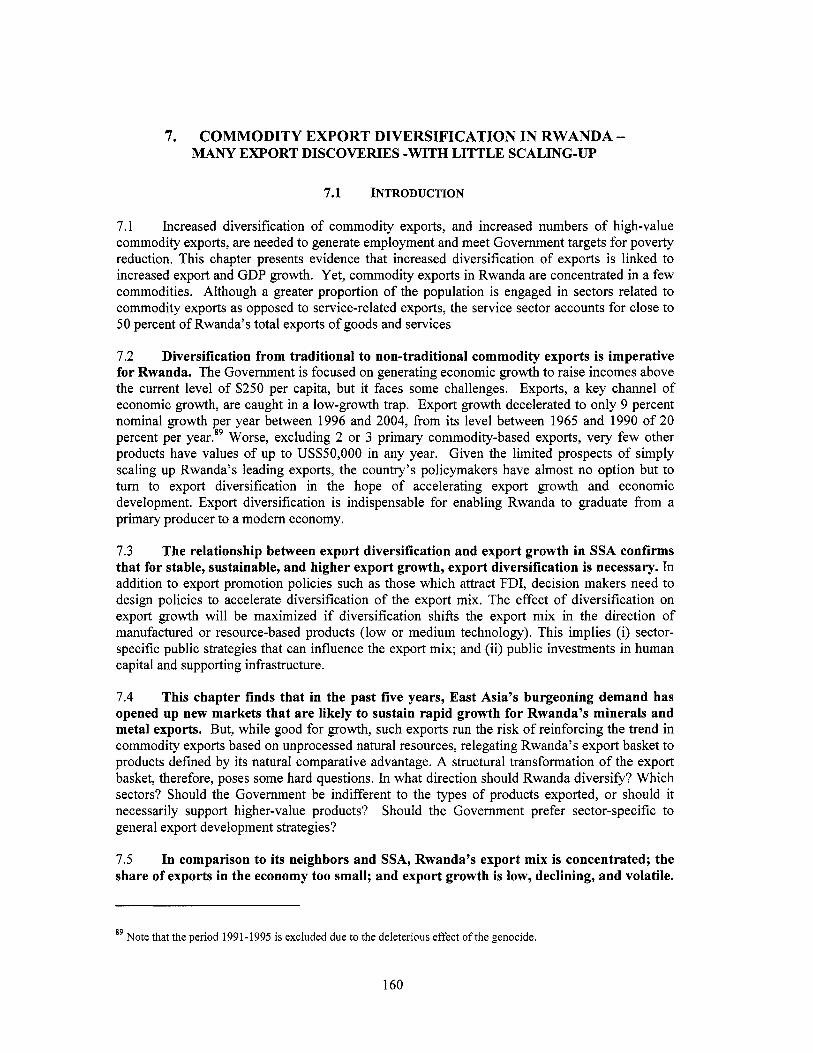
7.9 In the 1980s, Rwanda, Uganda and Burundi had some o f the most concentrated export baskets in their sub-region and, indeed, SSA. Between 1980 and 1989, the share o f coffee, the primary export product in these three economies, ranged between 70 and 95 percent, leading to an extremely high HIS, in the range o f 0.6 and 0.85 (Figure 7.1), and to negative export growth. In comparison, the HI for SSA was just under 0.4 and the average export growth rate was about 3.4 to 4 percent per year. Between 1995 and 2004,91 as the share o f coffee f e l l to about 50 percent, Rwanda and Uganda closed the gap with SSA - their HIS and average export growth rates reached the averages for SSA in the f i r s t period (1980-1989). However, by that time, the average for SSA had moved to the southeast quadrant - with even more diversification, although less than Rwanda and Uganda, SSA achieved significantly higher export growth rates o f 8 to 9 percent per year (southeast quadrant in Figure 7.1).
90
shares o f exports from each industry out of total exports.. 91 By 1995, most countries in SSA had liberalized their trade, 1980-1989 and 1995-2004 are selected as points o f comparison.
The Herfindahl index i s used to measure the degree o f diversification. It i s computed as the sum of the squared
161
Figure 7.1: Export Diversification Causes Export Growth in SSA
Source: Chandra et al, based on UN COMTRADE, SITC-2 3digit.
7.10 I t appears that the gains in export growth from export diversification, in the presence of trade liberalization, are sensitive to the initial level o f export diversification. In the f i rst period, Tanzania and Kenya had far more diversified export baskets than even SSA. Over the two decades, they enjoyed relatively high export growth in return for smaller changes in the HI. In contrast, weak diversifiers such as Rwanda and Uganda did not achieve higher export growth rates until they made significant progress in export diversification.
7.1 1 These observations were tested in a simple model for three time periods for Rwanda and its five neighbors - Uganda, Burundi, DRC, Tanzania, and Kenya (collectively called the sub-region) that share similar economic characteristics. In the fixed-effects model, export growth i s defined as a function o f a lagged change in the Herfindahl, used as a proxy for export diversification; the real exchange rate; and the two main commodity prices that drive exports - the price o f coffee as a proxy for agricultural commodity prices, and the price o f tin as a proxy for mineral prices. In addition, the technology content o f exports, proxied by the share o f primary and resource-based products (pprb), indicates the direction o f export diversification. Various measures o f trade liberalization - years o f trade liberalization experience, economic freedom, freedom to trade internationally, and the level o f trade (trade to GDP) - are included as controls to reflect structural change that affects growth over a longer term.
7.12 The hypothesis tested i s whether export growth was caused by export diversification o r was simply a manifestation of commodity price shocks. Export diversification did not occur in Rwanda and most o f i t s regional neighbors until after structural adjustment in the mid- 1990s. Prior to this period, export growth was driven primarily by the prices o f the primary commodities - coffee and minerals - that dominated exports. High commodity prices led to export concentration. To determine whether non-traditional products contributed to export growth, the effect o f commodity prices was netted out to obtain a non-price Herfindahl. The findings, indicated by the negative sign on the lagged change in the HI, show that over the long te rm (1975-2004), non-commodity price-related export diversification caused export growth in the sub-region, including Rwanda.92 While small, growth in primary and resource-based products93 raised export growth. Diversification toward more sophisticated products with a higher
Note, a negative s ign on the lagged change in the HI denotes an increase in export diversification, 92
93 A l i s t o f products defined by their technology content - primary, resource-based, low tech, medium tech and high tech i s presented in Annex 3 and will be discussed in a later section.
162
manufactured content was low and emerged slowly. For example, in Rwanda, diversification occurred from coffee to tin and other minerals, while in Uganda it was from coffee to fish. The effect o f trade liberalization was insignificant, perhaps because the challenges o f globalization have made it difficult for African exporters o f primary commodities to compete in non-primary products. These findings are robust and indicate that in addition to the conventional export growth-promoting policies, special policies that spur export diversification are necessary.
7.13 Export diversification and growth were unrelated in the pre-structural adjustment period, 1975-1995, when coffee was the dominant export in Rwanda and the sub-region. Closed trading regimes, ad hoc curbs on economic freedom, the genocide in Rwanda, and unstable socio-political conditions in several countries disrupted economic development and stymied diversification. Even though most countries had liberalized by the late 1980s, the implementation o f reforms did not begin until the early 1990s. The post- structural adjustment period, 1996-2004, however, has witnessed a remarkable turnaround. Export diversification has contributed significantly to export growth, although the shift from primary toward more manufactured exports, coveted by governments for greater economic development, has been weak. These findings are robust across a variety o f specifications (Table 7.1).
7.14 A common bel ief i s that special policies are unnecessary and a stable macroeconomic and liberal trading environment that attracts FDI i s sufficient for export diversification. Undoubtedly, FDI has played an important role in the region in developing exports based on the latter’s natural comparative advantage, especially in the mining industry. For example, FDI flows facilitated the boom in Tanzania’s gold exports, which accelerated from a share o f nearly zero in 2000 to more than 15 percent in 2005, and were Tanzania’s largest export product. Similarly, FDI has been critical for Rwanda’s mineral exports. But the crucial point i s that without special export diversification-facilitating incentives, FDI has not flowed into non-traditional, high-value export sectors that are necessary to reduce dependence on primary products. Special incentives to attract FDI to Uganda’s non-traditional ex orts, such as upland roses, fish fillets, organic cotton, textiles and garments, and animal product^!^ i s also a good example. Table 7.1 shows the export growth model for Rwanda, Burundi, DCR, Kenya, Tanzania, and Uganda.
See Chandra and Boccardo (2006) on export diversification and competitiveness in Uganda. 94
163
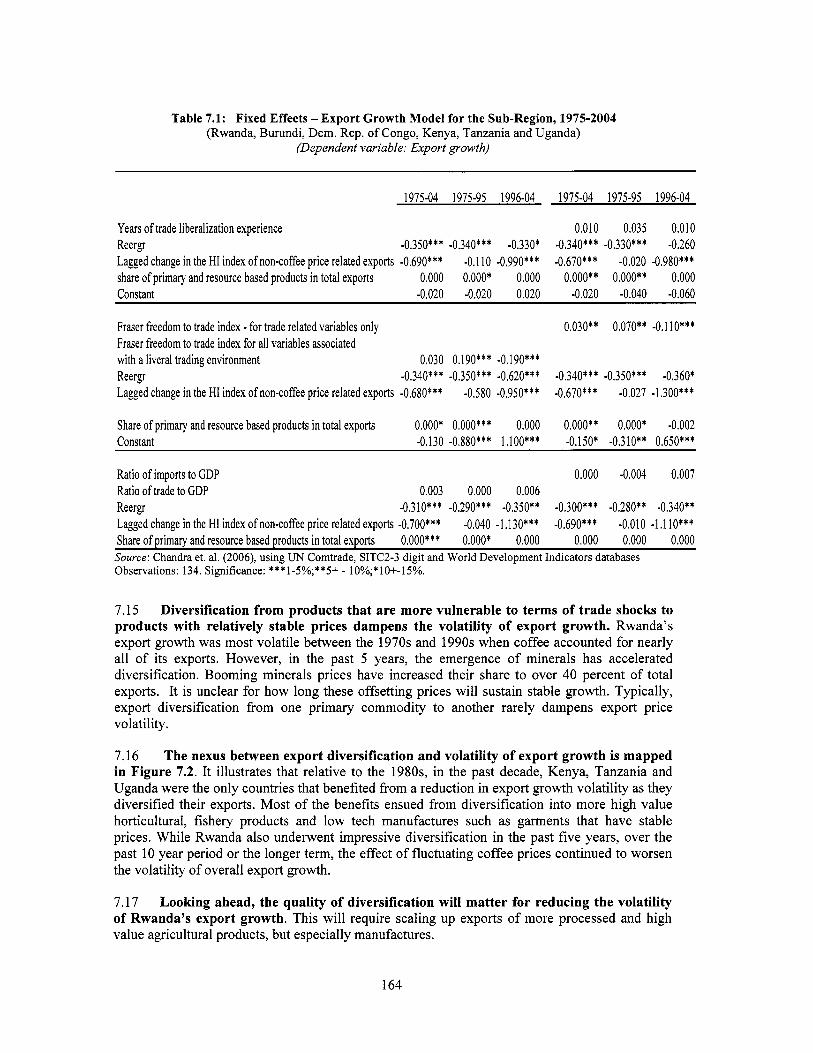
Table 7.1: Fixed Effects - Export Growth Mode l for the Sub-Region, 1975-2004 (Rwanda, Burundi, Dem. Rep. o f Congo, Kenya, Tanzania and Uganda)
(Dependent variable: Export growth)
1975-04 1975-95 1996-04 1975-04 1975-95 1996-04
Years o f trade liberalization experience 0.010 0.035 0.010
Lagged change in the HI index ofnon-coffee price related exports -0.690*** -0.020 -0.980*** Reergr -0.350*** -0.340*** -0.330* -0.340*** -0.330*** -0.260
-0,110 -0.990*** -0.670*** share o f primary and resource based products in total exports 0.000 o.ooo* 0.000 o*ooo** o.ooo** 0.000 Constant -0.020 -0.020 0.020 -0.020 -0.040 -0.060
Fraser freedom to trade index - for trade related variables only 0.030** 0.070** -0.110*** Fraser freedom to trade index for all variables associated with a liveral trading environment Reergr -0,340*** -0.350*** -0.620*** -0.340*** -0.350*** -0.360*
0.030 0.190*** -0.190***
Lagged change in the HI index ofnon-coffee price related exports -0.680*** -0.580 -0.950*** -0.670*** -0.027 -1.300***
Share o f primary and resource based products in total exports o.ooo* o.ooo*** 0.000 o.ooo** o.ooo* -0.002 Constant -0.130 -0.880*** 1.100*** -0.150* -0.310** 0.650***
Ratio o f imports to GDP 0.000 -0.004 0.007 Ratio o f trade to GDP 0.003 0.000 0.006
Lagged change in the HI index of non-coffee price related exports -0.700***
Source: Chandra et. al. (2006), using UN Comtrade, SITC2-3 digit and World Development Indicators databases Observations: 134. Significance: *** 1-5%;**5+ - 1 O%;* IO+-1 5%.
Reergr -0.310*** -0.290*** -0.350" -0.300*** -0.280** -0.340** -0.040 -1.130*** -0.690*** -0.010 -1.1 l o * * *
Share o f primary and resource based products in total exports O.OOO*** O.OOO* 0.000 0.000 0.000 0.000
7.15 Diversification from products that are more vulnerable to terms o f trade shocks to products with relatively stable prices dampens the volatility of export growth. Rwanda's export growth was most volatile between the 1970s and 1990s when coffee accounted for nearly all o f i t s exports. However, in the past 5 years, the emergence o f minerals has accelerated diversification. Booming minerals prices have increased their share to over 40 percent o f total exports. It i s unclear for how long these offsetting prices will sustain stable growth. Typically, export diversification from one primary commodity to another rarely dampens export price volatility.
7.16 The nexus between export diversification and volatility of export growth i s mapped in Figure 7.2. It illustrates that relative to the 1980s, in the past decade, Kenya, Tanzania and Uganda were the only countries that benefited from a reduction in export growth volatility as they diversified their exports. Most o f the benefits ensued from diversification into more high value horticultural, fishery products and low tech manufactures such as garments that have stable prices. Whi le Rwanda also underwent impressive diversification in the past five years, over the past 10 year period or the longer term, the effect o f fluctuating coffee prices continued to worsen the volatility o f overall export growth.
7.17 Looking ahead, the quality of diversification will matter for reducing the volatility of Rwanda's export growth. This will require scaling up exports o f more processed and high value agricultural products, but especially manufactures.
164
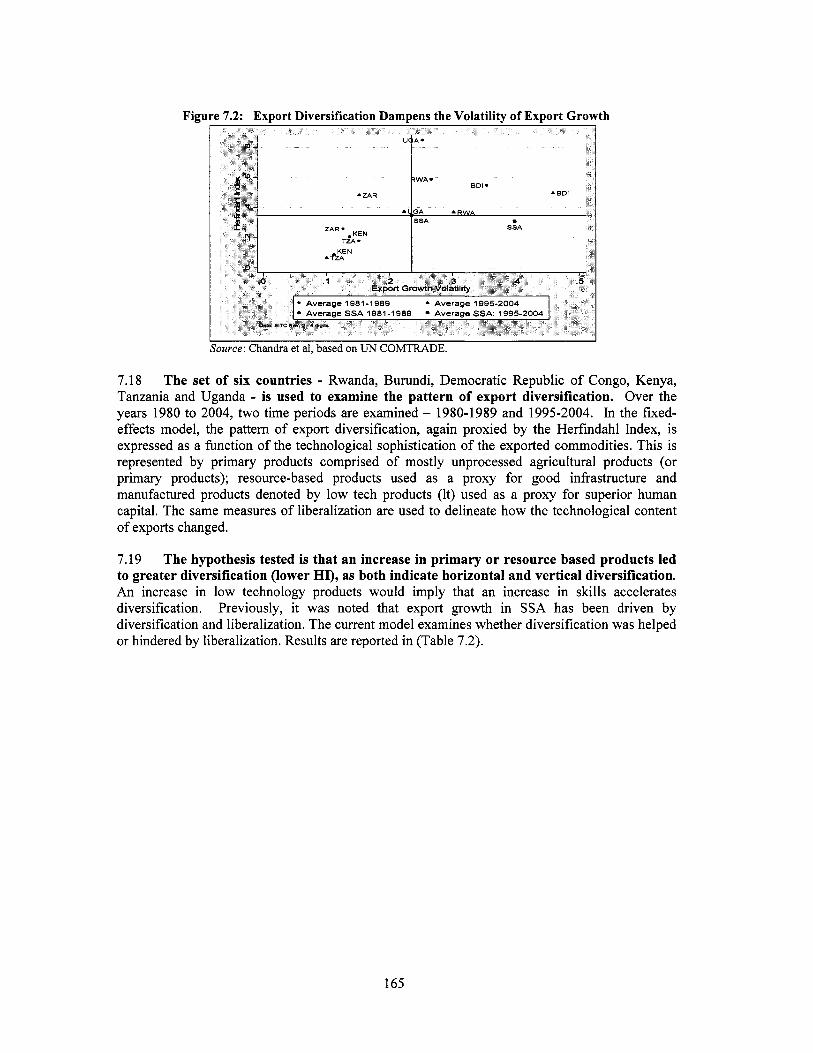
Figure 7.2: Export Diversification Dampens the Volatility o f Export Growth
Source: Chandra et al, based on UN COMTRADE.
7.18 The set of six countries - Rwanda, Burundi, Democratic Republic o f Congo, Kenya, Tanzania and Uganda - i s used to examine the pattern of export diversification. Over the years 1980 to 2004, two time periods are examined - 1980-1989 and 1995-2004. In the fixed- effects model, the pattern o f export diversification, again proxied by the Herfindah1 Index, i s expressed as a function o f the technological sophistication o f the exported commodities. This i s represented by primary products comprised o f mostly unprocessed agricultural products (or primary products); resource-based products used as a proxy for good infrastructure and manufactured products denoted by low tech products (It) used as a proxy for superior human capital. The same measures o f liberalization are used to delineate how the technological content o f exports changed.
7.19 The hypothesis tested i s that an increase in primary o r resource based products led to greater diversification (lower HT), as both indicate horizontal and vertical diversification. An increase in low technology products would imply that an increase in ski l ls accelerates diversification. Previously, it was noted that export growth in SSA has been driven by diversification and liberalization. The current model examines whether diversification was helped or hindered by liberalization. Results are reported in (Table 7.2).
165
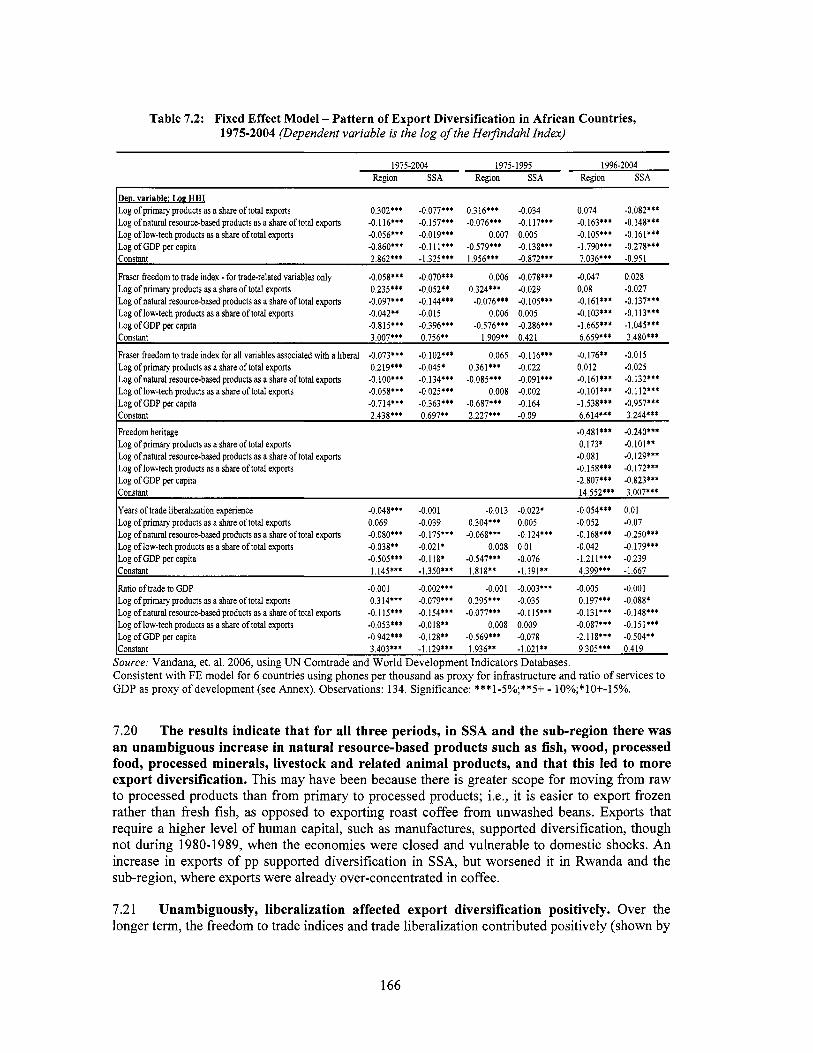
Table 7.2: Fixed Effect Model - Pattern of Export Diversification in African Countries, 1975-2004 (Dependent variable is the log ofthe Herfindahl Index)
1975-2004 1975- 1995 19962004 Recon SSA Region SSA Region SSA
Den variable: Loe HHI Log of primary products as a share o f total exports 0.302*** -0.077*** 0.316*** -0.034 0.074 -0.082*** Log ofnatural resource-basedproducts as a share oftotal exports -0.116*** -0.157*** -0.076*** -0.117*** -0.163*** -0.148*** Log of low-tech products as a share of total exports -0.056*** -0.019*** 0.007 0.005 -0.105*** -0.161*** Log o f GDP per capita -0.860*** -0.111*** -0.579*** -0.138*** -1.790*** -0.278*** Constant 2.862*** -1.325*** 1.956*** -0.872*** 7.036*** -0.951
Fraser keedom to trade index - for trade-related variables only -0.058*** -0.070*** 0.006 -0.078*** -0.047 0.028
Log ofnatural resource-based products as a share oftotal exports -0.097*** -0.144*** -0.076*** -0.105*** -0.161*** -0.137*** Log of low-tech products as a share of total exports -0.042** -0.015 0.006 0.005 -0.103*** -0.113*** Log of GDP per capita -0.815*** -0.396*** -0.576*** -0.286*** -1.665*** -1.045*** Constant 3.007*** 0.756** 1.909** 0.421 6.659*** 3.480***
Log o f primary products as a share of total exports 0.235*** -0.052** 0.324*** -0.029 0.08 -0.027
Fraser fieedom to trade index for all variables associated with a liberal -0.073*** -0.102*** 0.065 -0.116*** -0.176** -0.015 Log of primary products as a share of total exports 0.219*** -0.045* 0.361*** -0.022 0.012 -0.025 Log ofnatural resource-based products as a share of total exports -O.lOO*** -0.134*** -0.085*** -0.091*** -0.161*** -0.132***
Log of GDP per capita -0.714*** -0.363*** -0.687*** -0.164 -1.538*** -0.957*** Constant 2.438*** 0.697** 2.227"' -0.09 6.614*** 3.244***
Log of low-tech products as a share of total exports -0.058*** -0.025*** 0.008 -0.002 -0.101*** -0.112***
Freedom heritage -0.481*** -0.240*** Log of primary products as a share of total exports 0.173* - O . I O l * * Log o f natural resource-based products as a share o f total exports -0.081 -0.129*** Log of low-tech products as a share of total exports -0.158*** -0.172***
Constant 14.552*** 3.007***
Years o f trade liberalization experience -0.048*** -0.001 -0.013 -0.022* -0.054*** 0.01
Log ofnatural resource-based products as a share oftotal exports -0.080*** -0.175*** -0.068*** -0.124*** -0.168*** -0.250*** Log of low-tech products as a share of total exports -0.038** -0.021* 0.008 0.01 -0.042 -0.179*** Log of GDP per capita -0.505*** -0.118* -0.547*** -0.076 -1.211*** -0.239 Constant 1.145*** -1.350*** 1.818** -1.191** 4.399111 -1.667
Log o f GDP per capita -2.807*** -0.823***
Log of primary products as a share of total exports 0.069 -0.039 0.304*** 0.005 -0,052 -0.07
Ratio of trade to GDP -0.001 -0.002*** -0,001 -0.003*** -0.005 -0.001 Log of primary products as a share of total exports 0.314*** -0.079*** 0.295*** -0.035 0.197*** -0.088* Log ofnatural resource-basedproducts as a share oftotal exports -0.115*** -0.154*** -0.077*** -0.115*** -0.131*** -0.148*** Log of low-tech products as a share of total exports -0.053*** -0.018" 0.008 0.009 -0.087*** -0.151*** Log o f GDP per capita -0.942*** -0.128** -0.569*** -0.078 -2.118*** -0.504** . . lconstant 3.403*** -1.129*** 1.936** -1.021** 9.305*** 0.419
Source: Vandana, et. al. 2006, using UN Comtrade and World Development Indicators Databases. . -
Consistent with FE model for 6 countries using phones per thousand a i proxy for infrastructure and ratio o f services to GDP as proxy o f development (see Annex). Observations: 134. Significance: ***1-5%;**5+ - 10%;*10+-15%.
7.20 The results indicate that for all three periods, in SSA and the sub-region there was an unambiguous increase in natural resource-based products such as fish, wood, processed food, processed minerals, livestock and related animal products, and that this led to more export diversification. This may have been because there i s greater scope for moving from raw to processed products than from primary to processed products; Le., it i s easier to export frozen rather than fresh fish, as opposed to exporting roast coffee from unwashed beans. Exports that require a higher level o f human capital, such as manufactures, supported diversification, though not during 1980-1989, when the economies were closed and vulnerable to domestic shocks. An increase in exports o f pp supported diversification in SSA, but worsened it in Rwanda and the sub-region, where exports were already over-concentrated in coffee.
7.2 1 Unambiguously, liberalization affected export diversification positively. Over the longer term, the freedom to trade indices and trade liberalization contributed positively (shown by
166
the decline in the Herfindahl) to export diversification. Concentration in primary products usually worsens diversification, but a shift towards low tech and resource-based products reinforced it. Much o f the latter may have been a coincidence, due more to rapidly growing demand for minerals by China, which boomed after the mid-1990s. The effects o f emerging low-tech products, however small, occurred only in the post-structural period. A cross-section model for Rwanda and the sub-region also showed that land-lockedness was an important constraint to diversification.
7.22 The analysis suggests that there are at least two pointers that can be useful in developing manufactured (low technology) and resource-based exports. These are the development o f ski l ls necessary for manufacturing, and the development o f infrastructure to offset the land-lockedness as a disadvantage faced by Rwandan exporters. A further examination o f the level o f diversification in Rwanda, with a focus on specific commodities, demonstrates the importance o f these factors.
7.2 How MUCH HAS RWANDA DIVERSIFIED?
7.23 Rwanda is far less diversified compared to SSA and five Pigure 7.3) neighboring countries that are quite similar to it in topography, climate, soil, and natural resources. In fact, at least two - Uganda and Burundi - even share i t s geographic disadvantage o f being landlocked. Since the 1960s, the trends in Rwanda’s pattern o f export diversification have tracked a course similar to that o f Uganda and Burundi. The Herfindahl Indices in these three countries moved together and ranged between 0.4 and 0.9, reflecting strongly concentrated export baskets that were dominated by coffee and ores (see Table 7.3 and Figure 7.5). In contrast, Tanzania, the only coastal country in the set and a coffee exporter, consistently enjoyed a well- diversified export basket, with the HI in the range o f 0.3 to 0.1 (Table 7.3).
7.24 Typically, export diversification is a longer term process and Rwanda’s case is a good example. A variety o f export diversification measures jointly show that it has taken almost 35 years for Rwanda’s HI to decline from around 0.5 during 1970-75 to 0.35 in 2004 (Table 7.3). Between the 1980s and 2000, the number o f exported products valued at $10,000 or more in Rwanda was only 37 in the 1970s; by 2000, it had risen to 73; and the share o f the top 5 products in Rwanda’s total exports declined from 93 to 89 percent. In the last five years (2000-2004), there was a slight reversal. The number o f products exported declined and the share o f the top 5 exports increased, pointing toward a potentially rising trend in export concentration. In comparison, Rwanda’s neighbors were more successful in diversifying their exports. Uganda and DRC were as diversified in 1970 as Rwanda was in 2000.
167
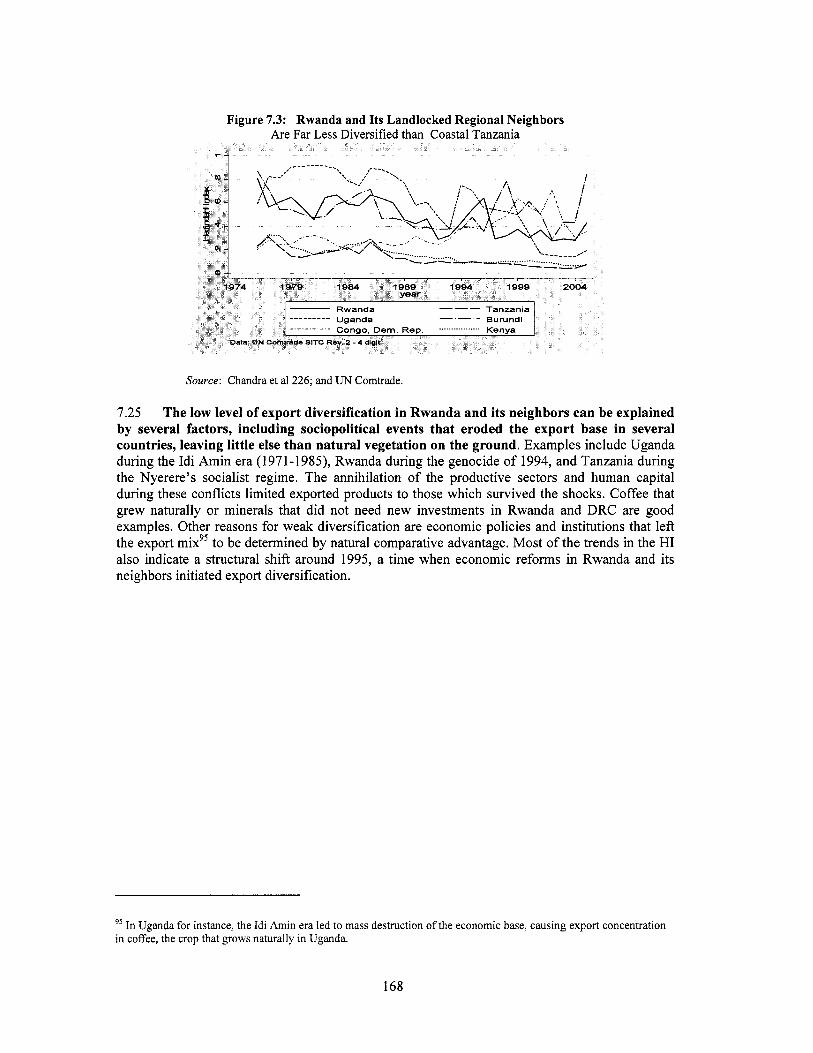
Figure 7.3: Rwanda and Its Landlocked Regional Neighbors A r e Far Less Diversified than Coastal Tanzania
Source: Chandra et a1 226; and UN Comtrade.
7.25 The low level of export diversification in Rwanda and its neighbors can be explained by several factors, including sociopolitical events that eroded the export base in several countries, leaving little else than natural vegetation on the ground. Examples include Uganda during the Idi Amin era (1971-1985), Rwanda during the genocide o f 1994, and Tanzania during the Nyerere’s socialist regime. The annihilation o f the productive sectors and human capital during these conflicts limited exported products to those which survived the shocks. Coffee that grew naturally or minerals that did not need new investments in Rwanda and DRC are good examples. Other reasons for weak diversification are economic policies and institutions that le f t the export mixg5 to be determined by natural comparative advantage. Most o f the trends in the HI also indicate a structural shift around 1995, a time when economic reforms in Rwanda and i t s neighbors initiated export diversification.
95 In Uganda for instance, the Id i Amin era led to mass destruction o f the economic base, causing export concentration in coffee, the crop that grows naturally in Uganda.
168
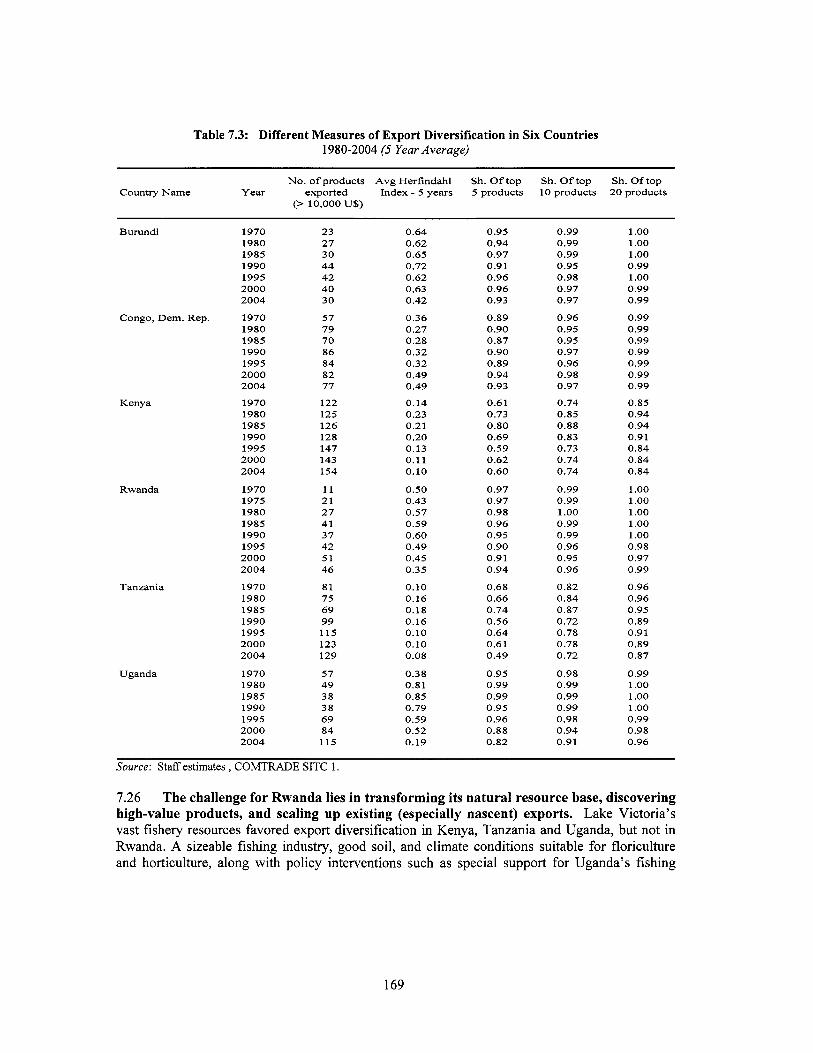
Table 7.3: Different Measures of Export Diversification in Six Countries 1980-2004 (5 Year Average)
No. o f products Avg Herfindahl Sh. O f top Sh. O f top Sh. Of top Country Name Year exported Index - 5 years 5 products 10 products 20 products
(> 10,000 U%)
Kenya
Rwanda
Tanzania
Uganda
Burundi 1970 1980 1985 1990 1995 2000 2004
Congo, Dem. Rep. 1970 1980 1985 1990 1995 2000 2004
1970 1980 1985 1990 1995 2000 2004
1970 1975 1980 1985 1990 1995 2000 2004
1970 1980 1985 1990 1995 2000 2004
1970 1980 1985 1990 1995 2000 2004
23 0.64 27 0.62 30 0.65 44 0.72 42 0.62 40 0.63 30 0.42
57 0.36 79 0.27 70 0.28 86 0.32 84 0.32 82 0.49 77 0.49
122 0.14 125 0.23 126 0.21 128 0.20 147 0.13 143 0.11 154 0.10
11 0.50 21 0.43 27 0.57 41 0.59 37 0.60 42 0.49 51 0.45 46 0.35
81 0.10 75 0.16 69 0.18 99 0.16 115 0.10 123 0.10 129 0.08
57 0.38 49 0.81 38 0.85 38 0.79 69 0.59 84 0.52 115 0.19
0.95 0.94 0.97 0.91 0.96 0.96 0.93
0.89 0.90 0.87 0.90 0.89 0.94 0.93
0.61 0.73 0.80 0.69 0.59 0.62 0.60
0.97 0.97 0.98 0.96 0.95 0.90 0.91 0.94
0.68 0.66 0.74 0.56 0.64 0.61 0.49
0.95 0.99 0.99 0.95 0.96 0.88 0.82
0.99 0.99 0.99 0.95 0.98 0.97 0.97
0.96 0.95 0.95 0.97 0.96 0.98 0.97
0.74 0.85 0.88 0.83 0.73 0.74 0.74
0.99 0.99 1 .oo 0.99 0.99 0.96 0.95 0.96
0.82 0.84 0.87 0.72 0.78 0.78 0.72
0.98 0.99 0.99 0.99 0.98 0.94 0.91
1 .oo 1 .oo 1 .oo 0.99 1 .oo 0.99 0.99
0.99 0.99 0.99 0.99 0.99 0.99 0.99
0.85 0.94 0.94 0.91 0.84 0.84 0.84
1 .oo 1 .oo 1 .oo 1 .oo 1 .oo 0.98 0.97 0.99
0.96 0.96 0.95 0.89 0.91 0.89 0.87
0.99 1 .oo 1 .oo 1 .oo 0.99 0.98 0.96
Source: Staff estimates , COMTRADE SITC 1.
7.26 The challenge for Rwanda lies in transforming i t s natural resource base, discovering high-value products, and scaling up existing (especially nascent) exports. Lake Victoria’s vast fishery resources favored export diversification in Kenya, Tanzania and Uganda, but not in Rwanda. A sizeable fishing industry, good soil, and climate conditions suitable for floriculture and horticulture, along with policy interventions such as special support for Uganda’s fishing
169
industry, and Kenya’s floricultural exports, helped to lower the shares o f the top three products in total exports.96 However, landlocked Burundi, DRC and Rwanda have not had the same fortune.
7.3 EXPORT SOPHISTICATION IN RWANDA I S LOWER THAN ITS NEIGHBORS
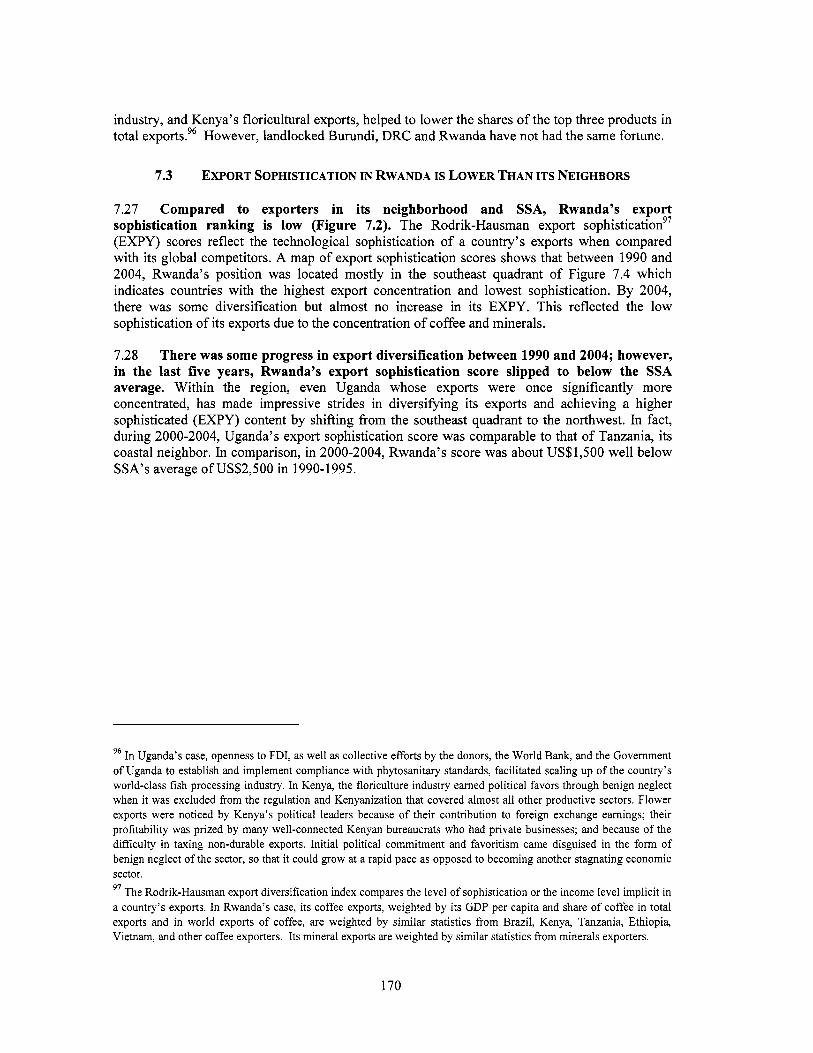
7.27 Compared to exporters in its neighborhood and SSA, Rwanda’s export sophistication ranking i s low (Figure 7.2). The Rodrik-Hausman export soph i~ t ica t ion~~ (EXPY) scores reflect the technological sophistication o f a country’s exports when compared with i t s global competitors. A map o f export sophistication scores shows that between 1990 and 2004, Rwanda’s position was located mostly in the southeast quadrant o f Figure 7.4 which indicates countries with the highest export concentration and lowest sophistication. By 2004, there was some diversification but almost no increase in i t s EXPY. This reflected the low sophistication o f i t s exports due to the concentration o f coffee and minerals.
7.28 There was some progress in export diversification between 1990 and 2004; however, in the last five years, Rwanda’s export sophistication score slipped to below the SSA average. Within the region, even Uganda whose exports were once significantly more concentrated, has made impressive strides in diversifLing i t s exports and achieving a higher sophisticated (EXPY) content by shifting from the southeast quadrant to the northwest. In fact, during 2000-2004, Uganda’s export sophistication score was comparable to that o f Tanzania, i t s coastal neighbor. In comparison, in 2000-2004, Rwanda’s score was about US$1,500 well below SSA’s average o f US$2,500 in 1990-1995.
In Uganda’s case, openness to FDI, as well as collective efforts by the donors, the World Bank, and the Government of Uganda to establish and implement compliance with phytosanitaq standards, facilitated scaling up of the country’s world-class fish processing industry. In Kenya, the floriculture industry earned political favors through benign neglect when it was excluded from the regulation and Kenyanization that covered almost a l l other productive sectors. Flower exports were noticed by Kenya’s political leaders because of their contribution to foreign exchange earnings; their profitability was prized by many well-connected Kenyan bureaucrats who had private businesses; and because o f the difficulty in taxing non-durable exports. Initial political commitment and favoritism came disguised in the form of benign neglect of the sector, so that it could grow at a rapid pace as opposed to becoming another stagnating economic sector. 97 The Rodrik-Hausman export diversification index compares the level of sophistication or the income level implicit in a country’s exports. In Rwanda’s case, i ts coffee exports, weighted by i ts GDP per capita and share of coffee in total exports and in world exports of coffee, are weighted by similar statistics from Brazil, Kenya, Tanzania, Ethiopia, Vietnam, and other coffee exporters. I t s mineral exports are weighted by similar statistics from minerals exporters.
96
170
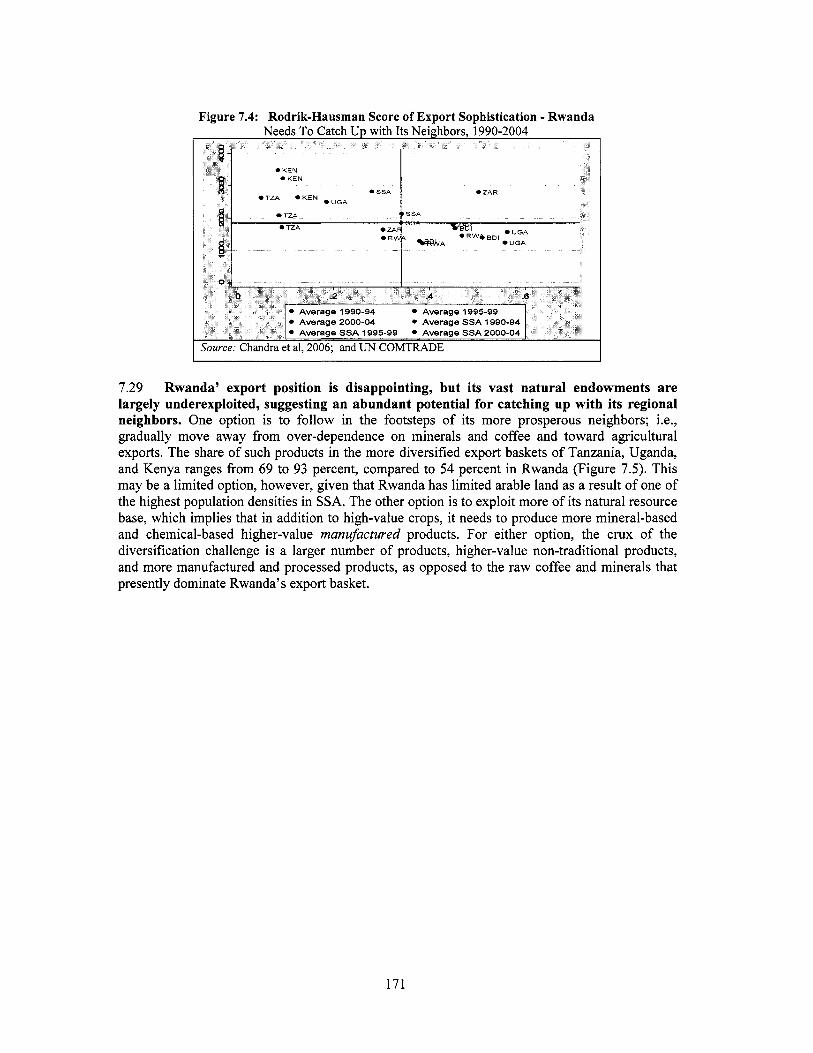
Figure 7.4: Rodrik-Hausman Score of Export Sophistication - Rwanda
7.29 Rwanda’ export position i s disappointing, but its vast natural endowments are largely underexploited, suggesting an abundant potential for catching up with its regional neighbors. One option i s to follow in the footsteps o f i t s more prosperous neighbors; Le., gradually move away from over-dependence on minerals and coffee and toward agricultural exports. The share o f such products in the more diversified export baskets o f Tanzania, Uganda, and Kenya ranges from 69 to 93 percent, compared to 54 percent in Rwanda (Figure 7.5). This may be a limited option, however, given that Rwanda has limited arable land as a result o f one o f the highest population densities in SSA. The other option i s to exploit more o f i ts natural resource base, which implies that in addition to high-value crops, it needs to produce more mineral-based and chemical-based higher-value manufactured products. For either option, the crux o f the diversification challenge i s a larger number o f products, higher-value non-traditional products, and more manufactured and processed products, as opposed to the raw coffee and minerals that presently dominate Rwanda’s export basket.
171
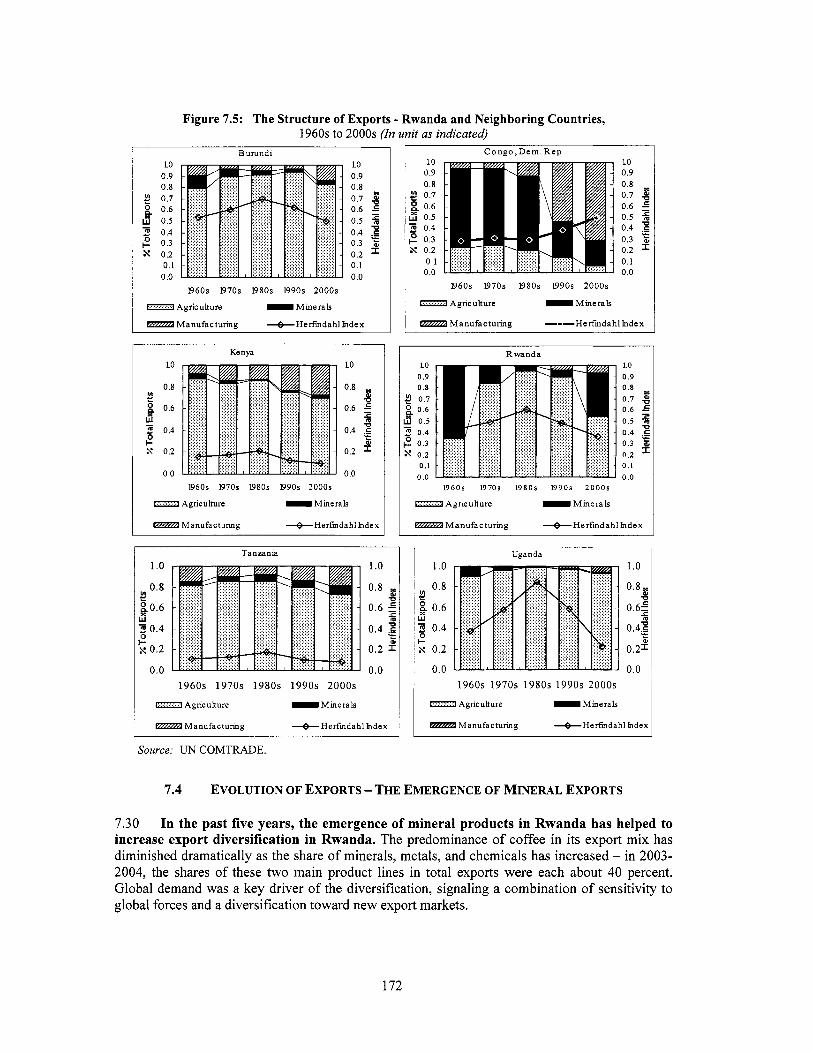
Figure 7.5: The Structure of Exports - Rwanda and Neighboring Countries, 1960s to 2000s (In unit as indicated)
Burundi 10 LO
0.9 0.9 0.8 0.8
g 0.7 0.7 8 g 0.6 0.6 5
0.5 0.5 5 2 0.4 0.4 g E 0.3 0.3 b
0.1 0.1 0 .o 0.0
s 0.2 0.2 =
1960s 1970s 1980s 1990s 2000s
I...............I Agricukure -Minerals
Manu fac tu r ing +HerfmdahlIndex
Kenya LO LO
0.8 0.8 VI E g 0.6 0.6 fi w u J 0.4 0.4 6 I- z x 0.2 0.2 =
- 0
x L
I
0.0 0.0 1960s 1970s 1980s 1990s 2000s
Agriculture B Minerals
Manufacturing +Herfmdahl Index
Tanzania 1 .o 0.8
$0.6 w 9 0.4
x 0.2
0.0
-
c
1960s 1970s 1980s 1990s 2000s
Agriculture -Minerals
I C o n g o , D e m . R e p LO LO
0.9 0.9 0.8 0.8 0.7 0.7 g
g 0.6 0.6 fi d 0.5 0.5 5 2 0.4
0.3 0.3 b
0.1 0.1 0.0 0.0
0.4 - x 0.2 0.2 =
1960s 1970s 1980s 1990s 2000s
r.........l Agriculture D Minerals
----Hefmdahl Index
R w a n d a LO
0.9 0.8
g 0 . 7 0.6
ii 0.5 - 5 0.4 2 0.3
0.1 0.0
x 0.2
Manufactur ing +Herfmdahl Index
Source: UN COMTRADE.
1.0 0 . 9 0 . 8 0 .7 g 0 .6 2 0 . 5 5 0.4 & 0.3 b
0.1 0 .o
V
0.2 = 1960s 1970s 1 9 8 0 s W 9 0 s 2000s
-Agriculture B Minera l s
M a n u f a c t u r i n g d H e r f m d a h l h d e x
1 .o 0.8 E 0.6 fi 0.4 g
b 0.2 = 0.0
0
L 0
Uganda I 1.0 1 .o 0.8 0.8
8 0.6 0.6; w { 0.4 0.48
x 0.2
e u
4
0.2* +
0.0 0.0 1960s 1970s 1980s 1990s 2000s
I.....T.:1 Agricukure B Minerals
Manufactur ing +Herfindah1 Index
7.4 EVOLUTION OF EXPORTS - THE EMERGENCE OF MINERAL EXPORTS
7.30 I n the past five years, the emergence of mineral products in Rwanda has helped to increase export diversification in Rwanda. The predominance o f coffee in i t s export mix has diminished dramatically as the share o f minerals, metals, and chemicals has increased - in 2003- 2004, the shares o f these two main product lines in total exports were each about 40 percent. Global demand was a key driver o f the diversification, signaling a combination o f sensitivity to global forces and a diversification toward new export markets.
172
7.31 Export diversification from coffee to minerals mattered in two ways: it dampened the vulnerability of exports to coffee price shocks; and it introduced a new source of growth for at least the next decade, o r certainly for as long as China continues to grow at double digit rates. Diversification toward minerals in Rwanda has occurred alongside diversification within the minerals category. Exports o f several nascent minerals have emerged in the past few years, mostly in response to the forces o f globalization, dominated by China. The rapid increase in demand from China’s burgeoning industrial sectors boosted the demand for non-ferrous ores, which were previously imported in small quantities by the European Union and the US. Tin ores, imported almost exclusively by Malaysia in the past, got a boost with surging demand from Malaysia, Thailand, Singapore, and China. Demand for tungsten, which earlier came from only the US, increased rapidly as Germany, the Netherlands, and China joined the l is t o f importers
7.32 In addition to coffee and minerals, at a lower98 level of disaggregation in 2003-2004, Rwanda exported about 18 products that had a share of at least 0.05 percent in its export basket. Including miniscule products, the total share o f manufactures was only 6 percent in 2003-2004. Albeit small, this development represents a 50 percent increase in manufactured exports compared to the 1990s. Excluding minerals, Rwanda’s non-traditional exports reflect the diversity o f i t s r ich natural resource base with potential for processing in several directions.
7.33 In Rwanda’s export basket, there were many low-volume, high-value products such as vegetables and fruits, flowers, tubers and foliage, and other materials o f vegetable origin (seeds, oils, and so on). Examples o f crude or unprocessed commodity exports are various types o f raw animal skins; minerals, metals and chemicals; and wood and forestry products such as gums and resins. Rwanda’s export mix also contained miniscule amounts o f processed or manufactured products, including chilled vegetables, dairy products(cream and preserved milk), beer, dried and salted animal hides and processed skins, mineral and chemical fertilizers, polyethylene, cement, leather, paper and products, furniture, yarn, alloys transformed into sheets and rolled metal plates, fabrics and so on. Unmistakably, the defining characteristic o f the non- coffee, tea, and minerals export mix was a lot o f variety and numerous products o f minuscule weight.
7.5 EXPORT DISCOVERIES -MANY, W I T H LITTLE SCALING UP
7.34 In 2004, excluding coffee, tea, and tin, Rwanda exported at least 180 non-traditional commodities, which accounted for roughly less than 9 percent of its exports (Annex Table 12). Export discoveries were examined over two periods: 1976-1989 and 1995-2004. Products with near negligible values were excluded. A product was classified as an export discovery if i t s value doubled between the two periods.99 This methodology shows that there were only about 33-35 export discoveries o f critical mass (Table 7.4). Whi le no single product emerged with a big bang, all added miniscule but increasing values to non-traditional exports. As Rwanda’s total exports were only US$97 mil l ion in 2004, every export discovery, even if as small as US$lOOO, was a significant in relative terms.
At SITC2 - 3 digits, the number of products exported was 18. At a finer level, i.e., SITC2 - 4 digits, the number was
This definition of export discovery has been designed for small countries in Sub-Saharan Africa. Klinger and
98
170.
Ledermen (2006) use a cut-off point o f US$lO,OOO to identify export discoveries.
99
173
7.5.1 Technological Content of Export Discoveries
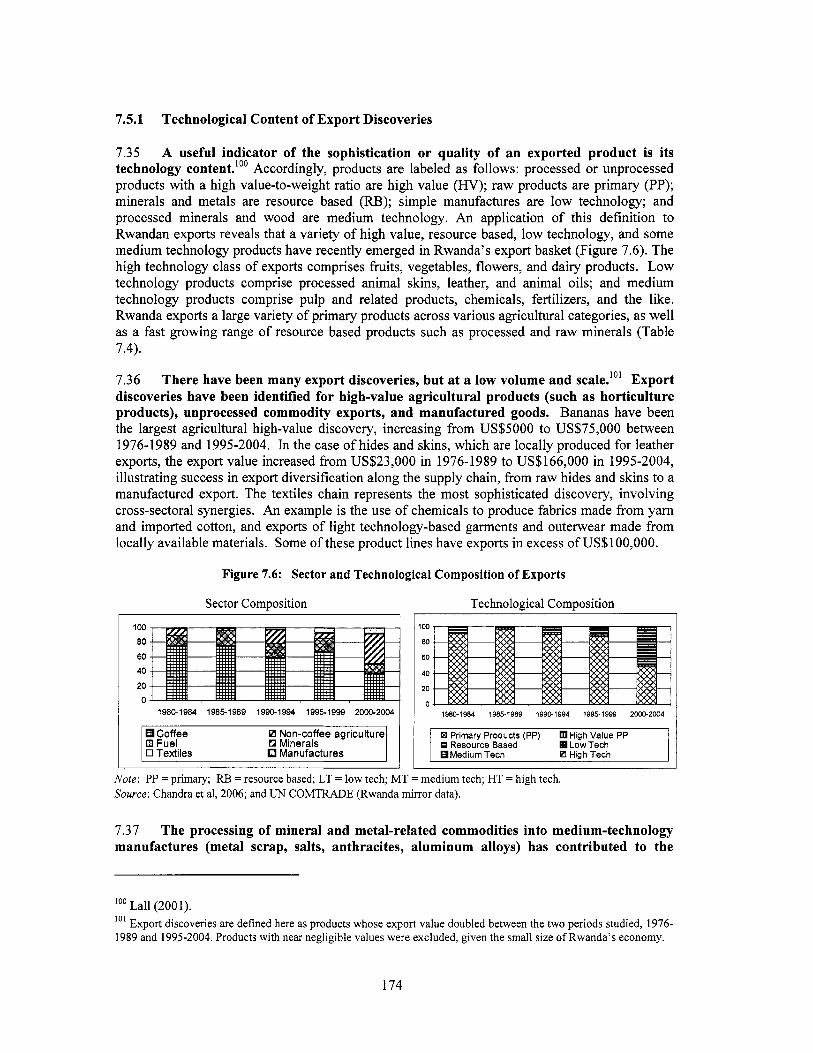
7.35 A useful indicator o f the sophistication or quality of an exported product i s its technology content.'" Accordingly, products are labeled as follows: processed or unprocessed products with a high value-to-weight ratio are high value (HV); raw products are primary (PP); minerals and metals are resource based (RB); simple manufactures are low technology; and processed minerals and wood are medium technology. An application o f this definition to Rwandan exports reveals that a variety o f high value, resource based, low technology, and some medium technology products have recently emerged in Rwanda's export basket (Figure 7.6). The high technology class o f exports comprises fruits, vegetables, flowers, and dairy products. L o w technology products comprise processed animal skins, leather, and animal oils; and medium technology products comprise pulp and related products, chemicals, fertilizers, and the like. Rwanda exports a large variety o f primary products across various agricultural categories, as well as a fast growing range o f resource based products such as processed and raw minerals (Table 7.4).
7.36 There have been many export discoveries, but at a low volume and scale."' Export discoveries have been identified for high-value agricultural products (such as horticulture products), unprocessed commodity exports, and manufactured goods. Bananas have been the largest agricultural high-value discovery, increasing from US$5000 to US$75,000 between 1976-1989 and 1995-2004. In the case o f hides and skins, which are locally produced for leather exports, the export value increased from US$23,000 in 1976-1989 to US$166,000 in 1995-2004, illustrating success in export diversification along the supply chain, from raw hides and skins to a manufactured export. The textiles chain represents the most sophisticated discovery, involving cross-sectoral synergies. An example i s the use o f chemicals to produce fabrics made from yarn and imported cotton, and exports o f light technology-based garments and outerwear made from locally available materials. Some o f these product lines have exports in excess o f US$lOO,OOO.
Figure 7.6: Sector and Technological Composition o f Exports
Sector Composition Technoloeical ComDosition 100 80
60 40
20 0
1980-1984 19851989 1990-1994 19951999 2000-2004
Coffee 0 Non-coffee agriculture E l Fuel 0 Minerals 0 Textiles Manufactures
19801984 19851989 199G1994 19951999 2wO-2004
R Primary Products (PP) R Resource Based
Medium Tech
High Value PP Low Tech
FJ High Tech
Note: PP = primary; RE3 = resource based; LT = low tech; M T = medium tech; H T = high tech. Source: Chandra et al, 2006; and UN COMTRADE (Rwanda mirror data).
7.37 The processing of mineral and metal-related commodities into medium-technology manufactures (metal scrap, salts, anthracites, aluminum alloys) has contributed to the
loo La11 (2001).
1989 and 1995-2004. Products with near negligible values were excluded, given the small size o f Rwanda's economy. Export discoveries are defined here as products whose export value doubled between the two periods studied, 1976- 101
174
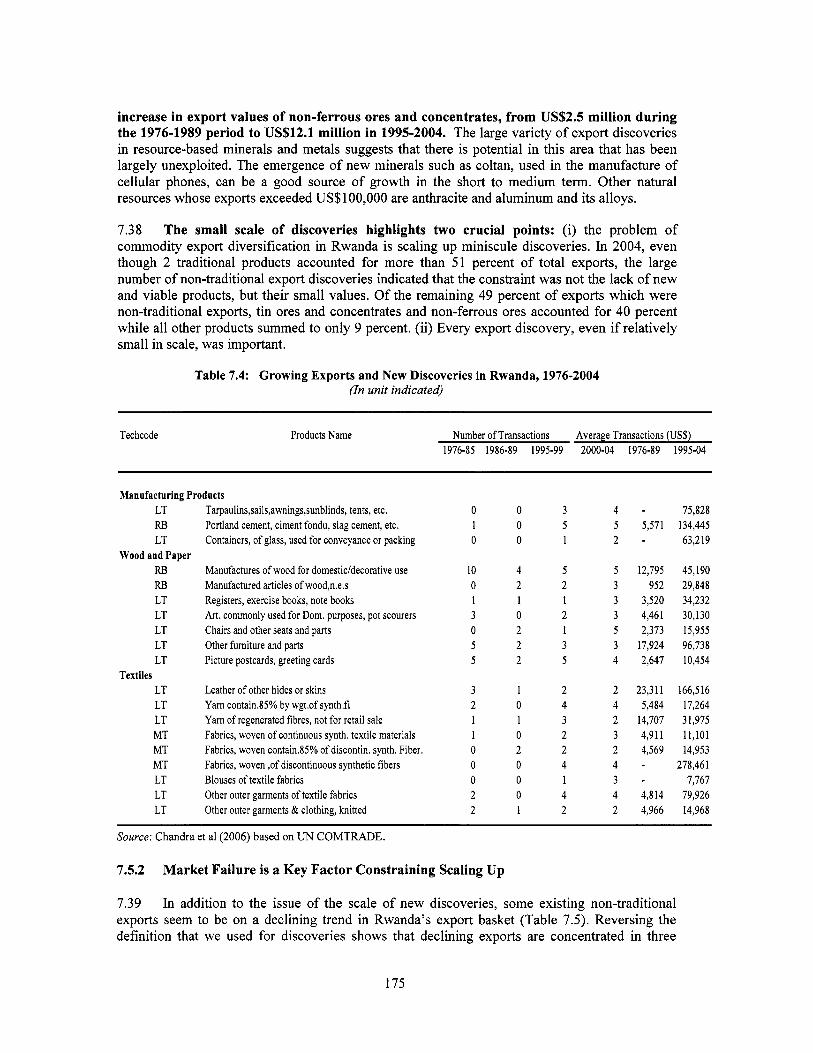
increase in export values of non-ferrous ores and concentrates, from US$2.5 million during the 1976-1989 period to US$12.1 million in 1995-2004. The large variety o f export discoveries in resource-based minerals and metals suggests that there i s potential in this area that has been largely unexploited. The emergence o f new minerals such as coltan, used in the manufacture o f cellular phones, can be a good source o f growth in the short to medium term. Other natural resources whose exports exceeded US$lOO,OOO are anthracite and aluminum and i t s alloys.
7.38 The small scale of discoveries highlights two crucial points: (i) the problem o f commodity export diversification in Rwanda i s scaling up miniscule discoveries. In 2004, even though 2 traditional products accounted for more than 51 percent o f total exports, the large number o f non-traditional export discoveries indicated that the constraint was not the lack o f new and viable products, but their small values. Of the remaining 49 percent o f exports which were non-traditional exports, tin ores and concentrates and non-ferrous ores accounted for 40 percent while all other products summed to only 9 percent. (ii) Every export discovery, even if relatively small in scale, was important.
Table 7.4: Growing Exports and New Discoveries in Rwanda, 1976-2004 (In unit indicated)
Techcode Products Name Number o f Transactions Average Transactions (US$) 1976-85 1986-89 1995-99 2000-04 1976-89 1995-04
Manufacturing Products LT RB LT
RB RB LT LT LT LT LT
LT LT LT MT MT MT LT LT LT
Wood and Paper
Textiles
Tarpaulins,sails,awnings,sunblinds, tents, etc. Portland cement, ciment fondu, slag cement, etc. Containers, o f glass, used for conveyance or packing
Manufactures of wood for domestic/decorative use Manufactured articles of wood,n.e.s Registers, exercise books, note books Art. commonly used for Dom. purposes, pot scourers Chairs and other seats and parts Other furniture and parts Picture postcards, greeting cards
Leather o f other hides or skins Yam contain.85% by wgt.of synth.fi Yam o f regenerated fibres, not for retail sale Fabrics, woven of continuous synth. textile materials Fabrics, woven contain.85% o f discontin. synth. Fiber. Fabrics, woven ,of discontinuous synthetic fibers Blouses of textile fabrics Other outer garments o f textile fabrics Other outer garments & clothing, knitted
0 1 0
10 0 1 3 0 5 5
3 2 1 1 0 0 0 2 2
0 0 0
4 2 1 0 2 2 2
1 0 1 0 2 0 0 0 1
3 5 1
5 2 1 2 1 3 5
2 4 3 2 2 4 1 4 2
4 - 75,828 5 5,571 134,445 2 - 63,219
5 12,795 45,190 3 952 29,848 3 3,520 34,232 3 4,461 30,130 5 2,373 15,955 3 17,924 96,738 4 2,647 10,454
2 23,311 166,516 4 5,484 17,264 2 14,707 31,975 3 4,911 11,101 2 4,569 14,953
3 - 7,767 4 4,814 79,926 2 4,966 14,968
4 - 278,461
Source: Chandra et a1 (2006) based on UN COMTRADE.
7.5.2 Market Failure i s a Key Factor Constraining Scaling Up
7.39 In addition to the issue o f the scale o f new discoveries, some existing non-traditional exports seem to be on a declining trend in Rwanda’s export basket (Table 7.5). Reversing the definition that we used for discoveries shows that declining exports are concentrated in three
175
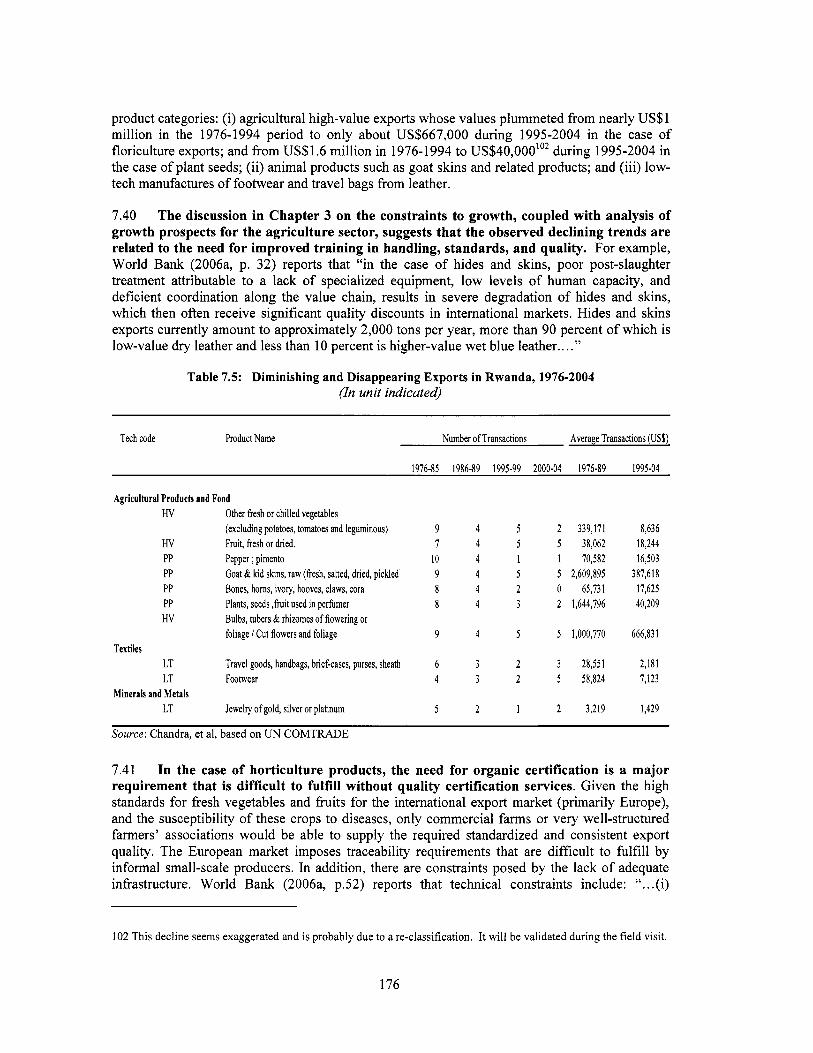
product categories: (i) agricultural high-value exports whose values plummeted from nearly US$ 1 mill ion in the 1976-1994 period to only about US$667,000 during 1995-2004 in the case o f floriculture exports; and from US$1.6 mil l ion in 1976-1994 to US$40,000’02 during 1995-2004 in the case o f plant seeds; (ii) animal products such as goat skins and related products; and (iii) low- tech manufactures o f footwear and travel bags from leather.
7.40 The discussion in Chapter 3 on the constraints to growth, coupled with analysis of growth prospects for the agriculture sector, suggests that the observed declining trends are related to the need for improved training in handling, standards, and quality. For example, World Bank (2006a, p. 32) reports that “in the case o f hides and skins, poor post-slaughter treatment attributable to a lack o f specialized equipment, low levels o f human capacity, and deficient coordination along the value chain, results in severe degradation o f hides and skins, which then often receive significant quality discounts in international markets. Hides and skins exports currently amount to approximately 2,000 tons per year, more than 90 percent o f which i s low-value dry leather and less than 10 percent i s higher-value wet blue leather.. . .”
Table 7.5: Diminishing and Disappearing Exports in Rwanda, 1976-2004 (In unit indicated)
Tech code Product Name Number of Transactions Average Transactions (US$)
1976-85 1986-89 1995-99 2000-04 1976-89 1995-04
Agricultural Products and Food HV Other fiesh or chilled vegetables
(excluding potatoes, tomatoes and leguminous) 9 4 5 2 339,171 8,636 HV Fruit, fiesh or dried. 7 4 5 5 38,062 18,244 PP Pepper ; pimento 10 4 1 1 70,582 16,503 PP Goat ti kid skins, raw (fiesh, salted, dried, pickled 9 4 5 5 2,609,895 387,618 PP Bones, horns, ivory, hooves, claws, Cora 8 4 2 0 65,731 17,625 PP Plants, seeds , h i t used in perfumer 8 4 3 2 1,644,796 40,209 HV Bulbs, tubers & rhizomes of flowering or
foliage /Cut flowers and foliage 9 4 5 5 1,000,770 666,831
LT Travel goods, handbags, brief-cases, purses, sheath 6 3 2 3 28,551 2,181 LT Footwear 4 3 2 5 58,824 7,123
LT Jewelry of gold, silver or platinum 5 2 1 2 3,219 1,429
Textiles
Minerals and Metals
Source: Chandra, et al, based on UN COMTRADE
7.41 In the case of horticulture products, the need for organic certification is a major requirement that i s difficult to fulfill without quality certification services. Given the high standards for fresh vegetables and f ru i t s for the international export market (primarily Europe), and the susceptibility o f these crops to diseases, only commercial farms or very well-structured farmers’ associations would be able to supply the required standardized and consistent export quality. The European market imposes traceability requirements that are difficult to fulfill by informal small-scale producers. In addition, there are constraints posed by the lack o f adequate infrastructure. World Bank (2006a, p.52) reports that technical constraints include: “. . .(i)
102 This decline seems exaggerated and i s probably due to a re-classification. It will be validated during the field visit.
176
infrequent cargo f l ights with limited capacity and high cost o f transport'03; (ii) lack o f cold storage and handling facilities at all stages o f the chain; (iii) lack o f technical knowledge at all levels; (iv) absence o f certification and quality control services and laboratories; and, (v) absence o f specific inputs and cheap packaging material.. . ."
7.42 The scaling up of exports has been constrained by the low base from which the country is starting, and by barriers to trade that have significantly increased costs. The destruction o f property and assets in 1994 put the country at a lower starting base, which was compounded by years o f neglect, lack o f investment, and l i t t le or no maintenance o f economic services. For example, many coffee trees were destroyed, but investments to replace destroyed and low-producing trees, and to develop a stock o f improved varieties, were not made until 2004. The destruction also led to similar declines in exports from other sectors, such as tea and livestock.
7.43 been a significant deterrent to the expansion o f manufacturing and processing activit ie~.' '~
The main barriers to trade have been energy, transport, and ICT. Energy costs have
7.44 In the case of transport, reduced cost would increase access and significantly increase the returns to farmers. Measures to improve roads and generate sufficient competition among transport providers should lead to lower transport costs and translate to higher returns for farmers. Discussions in Chapter 3 o f Volume 2 o f this report also show that for the case o f coffee, improved access to rural roads would greatly increase farmers' income.
7.45 The high cost and unreliability of using corridor routes to reach gateway ports are severe impediments to Rwanda's capacity to access world markets. The cost per ton o f transport from Kigal i to Mombasa can be as much as 70 percent higher than between Kampala and Mombasa. Overall, transportation costs translate to a 30 to 50 percent increase in the cost o f trade. In addition, there are extreme delays in the transit o f goods f iom Rwanda along the corridors. The average transit time between Kigal i and Mombasa i s four weeks. The long delays arise from congestion in the ports as well as procedural obstacles, which account for up to ha l f o f the time in transit. The rehabilitation o f roads and adoption o f measures to reduce congestion and administrative procedures would substantially reduce transit times and costs. Other measures could include development o f a transportation network with neighboring countries, which would lower cost and increase efficiency by reducing border transactions.
7.46 For the transport o f perishable and high-value goods such as horticultural products, the lack of regular flights to major markets and poor handling facilities are major obstacles. Problems with the screening o f airfreight can lead to serious delays; when a scanner breaks down due to electricity surges, a repair crew has to be flown in from South Africa. This leads to manual inspection o f cargo, which can take a substantial number o f days and additional delays for a large container. There are also insufficient cold storage facilities at the airport.
Airfreight rates are about €2.30/kg for the European market and €1.60/kg for the Middle East and South Africa markets. This rate i s relatively high compared to that paid by Rwanda's competitors, mainly South Africa and Zambia, where output i s increasing. Kenyan and Ugandan exporters have direct airline connections. Airfreight rates to Europe are estimated at US$1.57/kg from South Africa and US$1.30-1.50/kg from Zambia. At these rates, Rwandan exporters wil l be starting out at a competitive disadvantage, and the negotiation o f a more beneficial rate wi l l be critical to success (World Bank 2006a). lo4 Diagnostic Trade Integration Investment Survey (DTIS), 2005. See also Chapter 5 o f this volume.
177
7.47 ICT will be an important factor in providing households and firms with access to market information, direct contact with buyers, and linkages to financial institutions and government. These links are particularly important for export diversification. Measures to improve access to low-cost ICT services will be important in determining the f low o f information into and out o f rural areas, as well as the extent to which rural households can effectively participate in trade and shift into market-oriented and commercial activities. Such measures will depend on the availability o f energy in rural areas, and the development o f sk i l ls relevant to the sector.
7.48 Finally, the lack o f research and extension poses a significant barrier to the adoption o f new methods and approaches to increase agriculture production. Farmers will need advice, based on sound research, on ways to move into new initiatives that require new techniques and skills. In the case o f coffee, for example, roughly ha l f a mi l l ion farmers will require extensive training in al l aspects o f production, from planting to care and maintenance to harvesting, handling, and transportation.
7.6 SECTOR-SPECIFIC STRATEGIC Focus To PROMOTE DIVERSIFICATION
7.49 As noted in the Rwandan Development Gateway Project report, “ after independence, the export sector covered agro-industrial companies based on coffee, tea, sugar, processed h i t s and pyrethrum as well as a tannery. Import substituting industries were also introduced. The current generation o f Rwandan industries includes chemical companies, building materials, printing offices, agro-industries, wooden products, textiles and service industries.”
7.50 The abundance of export discoveries in Rwanda suggests that entrepreneurial firms and farmers are able to transform creative ideas into exports. In fact, even in the aftermath o f the genocide, there were many discoveries across sectors (Table 7.4). However, the failure to scale up indicates that the factors driving discovery are different from those necessary for reducing the dominance o f commodities in the export mix.
7.51 Export discoveries are the result o f good fortune; but export discoveries transformed into export product lines are the result o f strategic nurturing, driven by a variety o f factors, including production technologies, technological standards, type o f land or soil, climate, production facilities, transport logistics, and market information. The factors needed to nurture an export discovery are quite distinct and often sector specific, even for seemingly similar products, such as those in the class o f agricultural products. The land, water, new farm technologies, phytosanitary regulations, and air transport that enable high-value horticultural products to be airlifted to the quality-conscious European markets are o f l i t t le use in nurturing the development o f the animal products chain. The latter needs fixed foreign investment in tanneries, as well as electricity, new production technologies, and roadhail transport to transform skins and hides into leather for overseas markets. Diversifying away from wood into higher-value manufactured products, such as pulp, requires factors that are quite different from the sk i l ls required by the furniture sector, which sources wood.
7.52 Each sector has i t s special logistical and marketing requirements. Exploring new markets for coffee and tea with international coffee marketing f i r m s i s very different from, for example, doing business with Asian f i r m s in the market for raw minerals. Skills requirements also vary across sectors. The sk i l ls o f agronomists needed for horticultural production are non-transferable to the leather, minerals, or chemicals export sectors. Such realities suggest that there may be
178
larger gains from focusing on a few sectors with the greatest export potential, given limited resources and capacity.
7.6.1 Which Sectors Have the Greatest Export Potential?
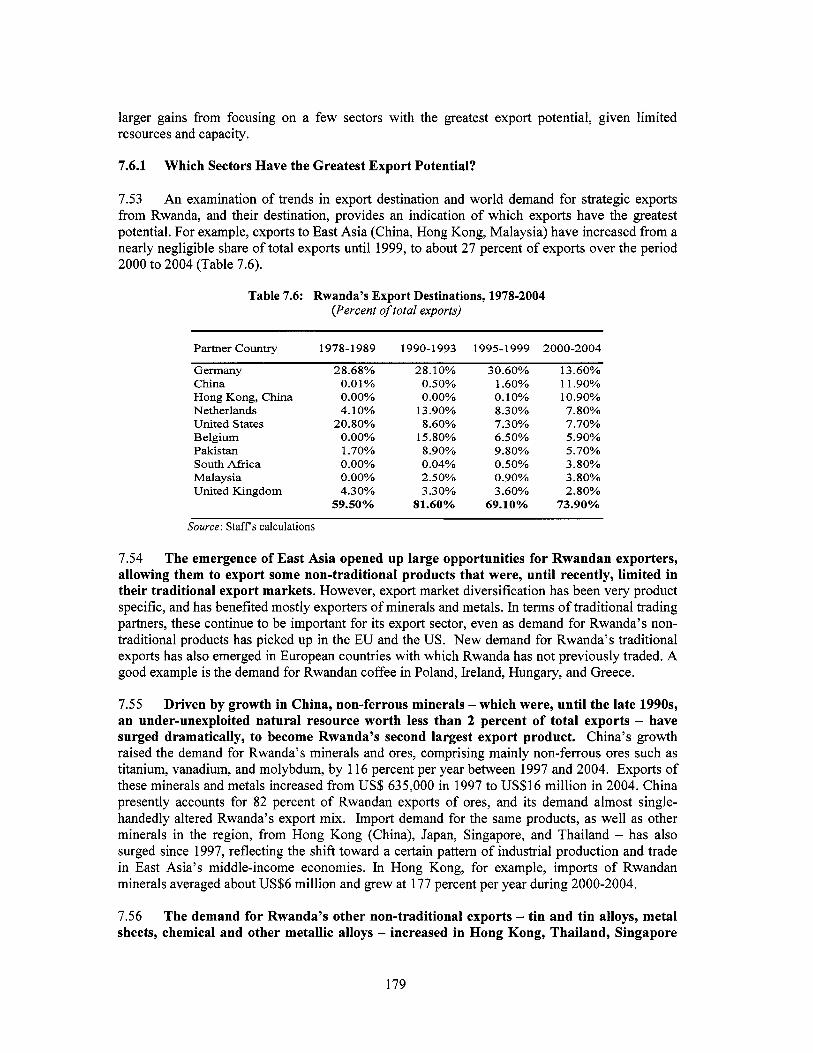
7.53 An examination o f trends in export destination and world demand for strategic exports from Rwanda, and their destination, provides an indication o f which exports have the greatest potential. For example, exports to East Asia (China, Hong Kong, Malaysia) have increased from a nearly negligible share o f total exports until 1999, to about 27 percent o f exports over the period 2000 to 2004 (Table 7.6).
Table 7.6: Rwanda’s Export Destinations, 1978-2004 (Percent of total exports)
Partner Country 1978-1989 1990-1993 1995-1999 2000-2004
Germany 28.68% 28.10% 30.60% 13.60% China Hong Kong, China Netherlands United States Belgium Pakistan South Aftica Malaysia United Kingdom
Source: Staffs calculations
0.01% 0.00% 4.10%
20.80% 0.00% 1.70% 0.00% 0.00% 4.30%
59.50%
0.50% 0.00%
13 .go% 8.60%
15.80% 8.90% 0.04% 2.50% 3.30%
81.60%
1.60% 0.10% 8.30% 7.30% 6.50% 9.80% 0.50% 0.90% 3.60%
69.10%
1 1.90% 10.90% 7.80% 7.70% 5.90% 5.70% 3.80% 3.80% 2.80%
73.90%
7.54 The emergence of East Asia opened up large opportunities for Rwandan exporters, allowing them to export some non-traditional products that were, until recently, limited in their traditional export markets. However, export market diversification has been very product specific, and has benefited mostly exporters o f minerals and metals. In terms o f traditional trading partners, these continue to be important for i t s export sector, even as demand for Rwanda’s non- traditional products has picked up in the EU and the US. New demand for Rwanda’s traditional exports has also emerged in European countries with which Rwanda has not previously traded. A good example i s the demand for Rwandan coffee in Poland, Ireland, Hungary, and Greece.
7.55 Driven by growth in China, non-ferrous minerals -which were, until the late 1990s, an under-unexploited natural resource worth less than 2 percent o f total exports - have surged dramatically, to become Rwanda’s second largest export product. China’s growth raised the demand for Rwanda’s minerals and ores, comprising mainly non-ferrous ores such as titanium, vanadium, and molybdum, by 116 percent per year between 1997 and 2004. Exports of these minerals and metals increased from US$ 635,000 in 1997 to US$16 mil l ion in 2004. China presently accounts for 82 percent o f Rwandan exports o f ores, and i t s demand almost single- handedly altered Rwanda’s export mix. Import demand for the same products, as well as other minerals in the region, from Hong Kong (China), Japan, Singapore, and Thailand - has also surged since 1997, reflecting the shift toward a certain pattern o f industrial production and trade in East Asia’s middle-income economies. In Hong Kong, for example, imports o f Rwandan minerals averaged about US$6 mil l ion and grew at 177 percent per year during 2000-2004.
7.56 The demand for Rwanda’s other non-traditional exports - tin and tin alloys, metal sheets, chemical and other metallic alloys - increased in Hong Kong, Thailand, Singapore
179
(mostly tantalum), and Malaysia long before the surge in the demand for ores. A leading reason for exports o f tin and i t s alloys to Malaysia, at one time a leading producer o f tin, i s due to the increase in wage levels, which have made Malaysia’s tin mining industry uncompetitive. Apparently, instead o f sourcing tin from i t s own mines, it i s more cost effective for Malaysia to import the metal from Rwanda and process it in i t s refineries. East Asia has also opened the doors to Rwanda’s newly discovered manufactured products such as synthetic fibers and hides and skins (leather). Some animal skin product discoveries were, until 2000, exported predominantly to Italy. In 1999, Hong Kong began importing bovine products from Rwanda; by 2001, i t s share equaled Italy’s, and by 2004, it had crowded out Italy.
7.57 About 37 percent of Rwanda’s exports are directed to its traditional European partners - Germany, Belgium, the Netherlands, UK, Germany, and France. In addition to coffee and tea, many export discoveries - fresh f ru i ts and vegetables, plants, saps, extracts, cut flowers, wicker articles, mineral ores and metals (tungsten, anthracite, metals, steel plates) are facing steadily rising demand. Even demand for one o f Rwanda’s old exports - animal products, especially hides and skins - i s s t i l l strong in Italy, i t s oldest trading partner in this product line.
7.58 Beyond its old markets, Rwandan exporters have also discovered new markets in Europe. Whi le the share o f i t s new European trading partners - Ireland, Poland, Hungary, Spain, Greece, the Czeck Republic, and Turkey - i s presently minuscule, their demand for Rwandan exports i s in the rise. Turkish demand for Rwandan yam made o f regenerated fiber, as well as pulp and chemical products and re-rolled iron and steel coils i s typically below close to us$100,000.
7.59 However, Rwanda’s exports to the U.S. have declined from 21 percent of total exports in the 1980s to about 8 percent over the period 2000-04. The bulk o f Rwanda’s exports to the American market have historically comprised coffee, tea, minerals, and metals. Other exports, such as textile-related products (regenerated fibers, textiles, garments, bags, etc.), have rarely been larger than US$4000. Yet, starting in 2005, special USAID efforts to develop Rwanda’s exports boosted exports o f non-traditional products such as basketwork and wickerwork to stores such as Macy’s. A decimal point worth o f Macy’s imports translated into a huge opportunity for Rwanda’s exporters. The jump in the value o f handicrafts from almost zero to US$ 90,000 i s a s i g n o f the enormous untapped opportunities that AGOA offers to Rwanda’s non-traditional products exporters. AGOA has enabled Rwandan exporters to diversify vertically within the coffee product chain. The recent partnership between Starbucks and Rwandan coffee producers, again with the help o f USAID, has enabled exports o f washed coffee beans, a higher- value product. There i s large scope for further exploring the development o f specialty coffee, the demand for which i s rapidly growing, or the long l i s t o f other products that are AGOA eligible and therefore duty free and quota free.
7.60 Regional markets provide another opportunity for the growth o f Rwanda exports; however, it seems far more challenging for Rwanda to export within the region than to export out of Africa. In the past five years, South Africa has emerged as the new African destination for Rwandan minerals, metals, and chemicals-related exports. Within the region, the market i s much smaller, and the natural endowments o f the neighboring economies quite similar. Exporters in Uganda, Tanzania and Kenya produce many o f the same product^,"^ but enjoy far more developed and diversified domestic markets, which enables economies o f scale in production. This creates tough competition for Rwandan exporters, who are also handicapped
Examples are fresh fruits and vegetables, flowers, fabrics, garments, wood and related products, metal products etc.. 105
180
because o f higher transport costs associated with land-lockedness. To al l three markets, Rwanda exports fabrics (synthetics), beer, chemical products (insecticides, fertilizers), and metal products. In Burundi, Rwandan exporters enjoy a larger market and are able to sel l cement. All recorded exports to the immediate region were only US$1.8 mil l ion in 2004, and accounted for percent 2 o f total exports. However, there appears to be a large volume o f unrecorded trade across borders.
7.6.2 Which Sectors Should Government Support?
7.61 The trends in demand for Rwanda exports suggest that the greatest potential lies in horticulture/floriculture products, leather and textiles, processed fruits and vegetables, mining, tea and processed coffee.lo6 Each sector or commodity chain would benefit from a sector-specific export promotion plan to identify and link directly to external buyers - thus bypassing local auction markets, such as those for coffee and tea. This approach has been adopted for coffee for Starbucks and handicrafts for Macy's, and could be explored for the main export discoveries - minerals, chemicals, textiles, pyrethrum, wood, livestock, hides and skins, flowers, and horticultural products.
7.62 Minerals and metals. This sector i s the least diversified vertically - its f i rs t two tiers comprise resource based products, the demand for which has boomed in the past five years due to rising demand for minerals from China and the electronics industry. Thefirst tier's five or six raw c o m m ~ d i t i e s ' ~ ~ have been the main drivers o f overall export diversification and export growth in the past 5 years.'" The diversification story i s dominated by tin and non-ferrous ores, which account for 40 percent o f total export^.'^' No public intervention i s required to develop this tier, except for regulation to address environmental issues.
7.63 The second t ier o f the product chain accounts for several export discoveries with promise o f rapid scaling up - alloys, concentrates, scrap and pulverized products - that have potential for heavy manufacturing, though perhaps not in the medium term, and not in all resource base products. REDEMI, the state-owned mining company, intends to offer i t s undeveloped beryllium, kaolin, and peat deposits, as well as i t s present facilities, for sale in 2007. REDEMI, COPIMAR and other companies operate processing facilities for Columbium (Niobium) and Tantalum at Gatumba; for cassiterite at Rutongo; and for wolframite at Nyakabingo."' Portland cement, a resource base export, i s operated by Cimenva, Rwanda's only producer o f cement. Nearly al l the f i r m s operating in th i s tier, even if only one in each mineral sub-sector, are constrained from scaling up as long as the Government does not take measures to increase the supply o f electricity. Except for power, the Government's other plans to privatize REDEMI's activity in this t ier appear to be adequate for the industry's development. Preserving the status quo or improving the situation - Le., scaling up tiers one and two o f the minerals product chain -simply requires that Government ensure a steady supply o f power to the minerals industry. This would preserve the concentration o f the export mix.
lo6 Tea, coffee, horticulture, and handicrafts were also noted as candidates for sector-specific targeting in the Diagnostic Trade Integration Study (World Bank, 2005). lo7 Rwanda's main mineral exports are columbium, tantalum, tin and tungsten lo* The increase in production was mainly due to greater demand for cassiterite (tin product), coltan, and wolframite. Cassiterite accounted for 16% o f Rwanda's exports in 2004. The demand for tin has been increasing in recent years, especially in China, due to its use in making consumer electronics and the ban imposed by EU on lead solders in electronic devices (Thomas R. Yager, 2004). log Rwanda's exports also include re-exports from sources in DRC, but there i s no clear record o f how much comes from DRC. 'lo Yager (2004).
181
7.64 Unlike the f i rst two tiers, scaling up the third t ier o f manufactured products - metal scrap, waste, plates, sheets, and strip from wrought metal (all medium technology products) - needs special government efSort, as does the rehabilitation o f the Metal Processing Association’s tin smelter at Gisenyi.
7.65 Several entry points are possible to provide an enabling environment for the sector:
0 Outdated technology which in some sectors (i.e. tin smelting in 2004), led to pollution and excessive consumption o f electricity. Given the potential o f tin and i t s products, this disappearing manufactured export provides a perfect example o f a t ier that has scale economies and needs large scale investments for technological upgrading. Shortage o f adequately trained workers. Presence o f scale economies that deter private f i rms as the profitability o f the manufactured metals products i s unknown at this point - i e. information externality. Coordination failure associated with mine-specific dilapidated infrastructure etc. Land-lockedness that raises the costs o f transport to the coast.
0
7.66 The mining sector i s characterized by small producers; and the Government can take advantage of this aspect of the industry to attract investment. First, organizing producers into cooperatives would enable them to take advantage o f economies o f scale. It would also promote investment in the sector and facilitate the provision o f training in modern mining and processing techniques. Facilitating the formation o f partnerships between domestic producers and foreign investors would also help to modernize the sector, given the shortage o f adequately trained workers. Forming public-private partnerships to support prospecting would improve the information base on the stock o f mineral resources. Partnerships would also be o f benefit in establishing the profitability o f manufactured metal products, and would mobilize private investment to rehabilitate dilapidated and outdated machinery. As noted throughout this chapter, improving the transport and electricity infrastructure i s also important for attracting investment.
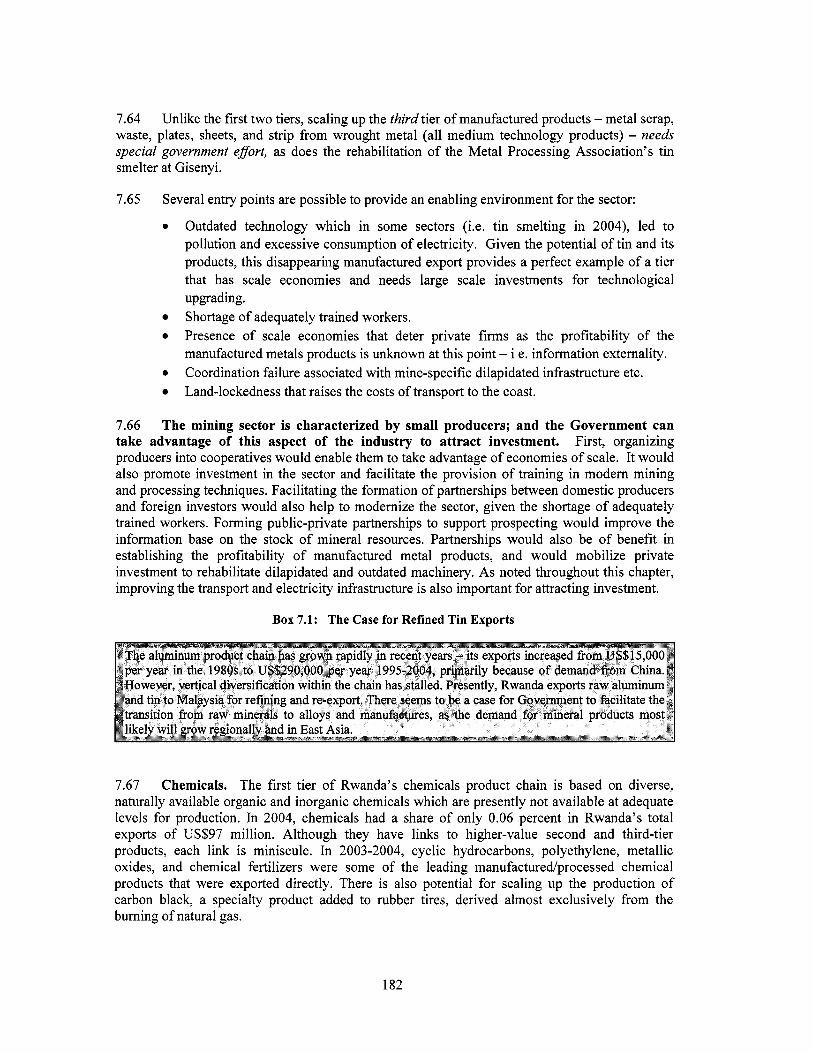
Box 7.1: The Case for Refined Tin Exports
7.67 Chemicals. The f i rst t ier o f Rwanda’s chemicals product chain i s based on diverse, naturally available organic and inorganic chemicals which are presently not available at adequate levels for production. In 2004, chemicals had a share o f only 0.06 percent in Rwanda’s total exports o f US$97 million. Although they have l i n k s to higher-value second and third-tier products, each link i s miniscule. In 2003-2004, cyclic hydrocarbons, polyethylene, metallic oxides, and chemical fertilizers were some o f the leading manufacturedprocessed chemical products that were exported directly. There i s also potential for scaling up the production o f carbon black, a specialty product added to rubber tires, derived almost exclusively from the burning o f natural gas.
182
7.68 Scaling up of this sector i s important for scaling up the overall export sector. Chemical products provide useful inputs for other export sectors - agricultural food, forestry/wood and paper, animal skins and hides, and textiles. They are also used to process products from other sectors for export. For example, the sector processes flowers to produce extracts that are used to manufacture perfumes, pesticides, and fertilizers.
7.69 The most important chemical exports are derived from Rwandan pyrethrum flowers, which have a high concentration o f pyrethrums. Rwanda i s one o f the largest producers o f pyrethrum in the world, and i t s pyrethrum concentrate i s exported mainly to the U S under AGOA, and to Kenya and South Africa. Presently, Sopyrwa, the pyrethrum producing company, exports crude pyrethrum extract to be refined abroad. Rwanda can also use i t s flowers for o i l distillation or solvent extraction o f other products, such as paprika. A pyrethrum spray formulation, which adds value to the product, i s available from the Pyrethrum Board o f Kenya.”’
7.70 Expansion of the Pyrethrum sub-sector i s constrained by a dormant refining unit - due partly to electricity supply -which, if operational, could allow Sopyrwa to complete the refining process and capture significant additional value added. To partly address the electricity issue, a critical sector-specific action would be to introduce solar’’2 dryers to dry f l 0 ~ e r s . l ’ ~ Below-capacity production o f pyrethrum means that Rwanda i s not taking advantage o f high demand in the world market and existing preferential trade arrangements with the United States and the European Union.
7.71 Textiles: Exports from this sector comprise one o f the larger product chains with newly discovered exports o f nearly US$ 500,000 in 2000-04. The potential o f this sector for export diversification far exceeds that o f others, especially because it produces manufactured goods which have a stable and growing demand, it enjoys special preferences in the US market, and i t s growth i s not constrained by Rwanda’s relatively less skilled labor force.
7.72 Rwanda i s one o f the few AGOA eligible countries in SSA that can export textiles, yarn and fabric without cultivating cotton. This should flag it as an attractive location for textile and garments producing multi-national corporations, similar to those in Lesotho, SSA’s largest garment exporter to the U.S. However, currently, there i s only one major privately owned textile firm, UTEXRWA that operates in Kigali. In operation since 1985, the firm employs 1000 workers, in cut make and trim operation to produce up to 6,000 garments each day from fabric made o f raw cotton from Uganda and Tanzania, and polyester fabric made in South Africa. The firm has rapidly expanded in the last few years to become an integrated textile company with spinning, weaving, dyeing, printing, and apparel-making capabilities. I t maintains a designs library o f more than 2,000 products and can easily add to current production and shift manufacturing lines within days to meet new demand.’14 Other small textile weaving companies are also expanding, including a firm that specializes in hand-loomed textile products.
’’ “Agribusiness in Sustainable Natural African Plant Products (ASNAPP) Natural Products Assessment: Potential for Economic Growth and Trade in Rwanda,” Chemonics for USAID (2002). prepared by Chemonics International under ADAR, July 2002.
sustainable environmental management. ‘I3 Agribusiness Development Assistance Project in Rwanda (ADAR), Second Quarter Progress Report, Chemonics for USAID (2004).
mnr.state.~ov/e/eb/ifd/2005/42425.htm.
This would eliminate the need for harvesting fuel wood to fire the ovens, thus contributing to improved and
“Investment Climate Statement - Rwanda,” U S Department o f State (2005).
183
7.73 Exports from the textiles sector comprise one of the larger product chains, with newly discovered exports of nearly US$500,000 in 2000-2004. The potential o f this sector for export diversification far exceeds that o f other sectors, because (i) it produces manufactured goods for which there i s a stable and growing demand; (ii) it enjoys special preferences in the U S market; and (iii) i ts growth i s not constrained by Rwanda’s relatively less skilled labor force. However, high utility costs have been a constraint to production. While export discoveries o f almost US$500,000 in 2000-2004 have triggered rapid growth in the sector, Rwanda i s not yet fully exploiting i t s textiles and garments exports potential, which would enable it to take full advantage o f AGOA and scale up.”’
7.74 One of the potential exports being considered in Rwanda i s silk textiles. The case o f this nascent industry may have lessons for other sectors. Silk i s not native to Rwanda, but with help from the U N ’ s Food and Agricultural Organization (a), and in cooperation with the Institut des sciences agronomiques du Rwanda (ISAR), under the Ministry o f Agriculture,’16 mulberry trees have been planted in the Butare region, as a f i rs t step toward silk production. A similar approach could be adopted for other export sectors.
7.75 Wood. I n 2000-2004, Rwanda exported about US$270,000 worth o f newly discovered second and third-tier manufactured wood products, such as pulp, cellulose, and paper, most o f which were either resource based o r light technology manufactures. Exports o f furniture, a second-tier, low-tech product, have recently exceeded US$lOO,OOO per year, signaling the potential for rapid growth in that sub-sector. Wh i le the sector i s vertically diversified, however, scaling up i s stalling. The low and unreliable supply o f electricity i s one important factor affecting the sector; and an equally important factor i s the availability o f skilled labor.
7.76 Wickerwork exports are a perfect example of how, because of Rwanda’s small size, a single firm’s entry can turn into a large (for Rwanda) export industry. Until 2004, wicker basket and hat exports averaged US$24,000 per year. Through support from a USAID project, one enterprising woman’s contact with the Macy’s department store caused the industry’s exports to increase to US$25,000 in 2005. The challenge wil l be to continue to meet increasing demand while maintaining quality. Special public interventions to create networks and informational externalities have significantly increased exports and investments in new production centers. The recent development o f a handicraft production training program should help to further expand this promising export industry.
7.77 I n the case of handicraft production, there has already been a move to explore more opportunities in the U S market under the umbrella of African Growth and Opportunity Act (AGOA). It should also be possible to explore other markets in Europe. To increase sales, a handicraft marketing program will be needed, as will handicraft production training.
‘15 “The African Growth and Opportunity Act: Achieving Success through the African Global Competitive Initiative,” June 2006, www.agoa.vov l6 “Rwanda: Diagnostic Trade Integrated Study.” World Bank (2005).
184
’ Box 7.2: Rwandan Handicrafts Exports The handicrafts industry in Rwanda i s largely informal; artisans use local material to produce handicrafts and sell them locally. Some of the crafts produced are metal works, stone cuttings, basketwork, pearl work, and some leather products. Women in Rwanda have been weaving baskets for years, mostly for decorative purposes at home or to sell locally. After the genocide, a local woman started organizing the weavers and selling their products in craft fairs in the US. A woman’s r ights activists in the U S presented a proposal to Macy’s, and the baskets were sold for the first time during the 2005 holiday season. Currently, there are 1,500 women weavers employed in this project. They sell the larger, foot-high baskets for about $20 each, and smaller ones for about $5. Since many weavers produce half a dozen o f the large baskets a month, that means they can earn $120, better than the average per capita monthly income o f ~ ~ $ 1 0 0 . ~ ~ ~
7.78 Livestock. Instead o f starting with exports o f live animals and meat, Rwanda’s livestock product chain, which accounted for less than 2 percent o f total exports, begins at the second t ier with high-value animal products (hooves, claws, bones, ivory) and light and medium technlogy manufactures. The five tiers in the livestock chain offer increasing diversification potential, moving up from a large variety o f animal skins and hides to leather and related products. In spite o f the export potential, however, scaling up in this industry i s stymied by two mutually reinforcing forces. First, exports o f higher- value skin products, such as footwear and travel bags, are rapidly slowing down, indicating a loss o f global competitiveness. Further progression in the same direction i s likely to lead to a disappearance o f these two links in the product ladder. Second, raw animal skins, the most lucrative traditional export product, are also disappearing. Rwanda traditionally exported 80 to 90 percent o f skins and hides and leather to Italy, and more recently to some East Asian countries, but shrinking exports suggest that domestic supply constraints are probably to blame. If so, the industry i s threatened from the f i rs t as well as the top tiers and i s unlikely to survive. Leather export discoveries are a rare exception to other export products in the livestock sector.
7.79 What explains the diminishing size o f animal skin-related exports? Market analysis shows that globalization i s pushing the tanning industry from Italy and Spain, the traditional importers to China and Thailand. While some o f this adjustment i s visible in the direction o f Rwandan exports, the diminishing size o f the market remains unexplained. Rwanda and i ts five regional neighbors exported half o f one percent o f total hides and skin exported to Italy in 2004, representing sharp declines in exports, and signaling a regional loss o f competitiveness. Since 2001, China has become the largest importer o f hides and skins. Some analysts believe that China i s trying to cut down i t s import o f raw products due to environmental concerns, and will increase the import o f semi-processed (wet-blue) products.”’ This should open the door to processed skins exports for Rwanda.
7.80 T o take advantage of these global trends in the hides and skins sector, a national strategy i s needed to support production, and to invest in upgrading slaughterhouses and collection systems to ensure consistent quality. A key component o f the strategy would include training in handling, to ensure consistent quality. Organizing small leather producers into
‘17 Poolos (2006), “Rwandan Women Weave New Future from Baskets,” Awakened Woman e-magazine, (March 1). www.awakenedwoman.com. ‘18 Food and Agricultural Organization (2006), “Consultation on Hides and Skins,” Arusha, Tanzania, (February lPut both in bib1
185
production units would also help in establishing a value chain and give them access to market information and finance.
7.8 1 Edible agricultural products. This sector i s well diversified horizontally, to support several product chains that produce high-value fresh fruits, vegetables, legumes, malt, and coffee and tea for export. Wh i le scaling horizontally can be sufficient in the short term, there i s ample scope for vertical diversification toward processed foods in the longer term. Presently, Rwanda exports frozen and chilled products, but potential exists for further transformation into manufactured foods such as jams, canned and bottled products.
7.82 Rwanda’s favorable climate, relatively cheap labor force, and proximity to European markets give it some comparative advantage in producing horticulture products. The demand for horticulture products in the European market has grown very strongly. Compared with year 2000, the demand for fresh vegetables had increased by 61 percent and fresh fruit by 66 percent in 2004.
7.83 Scaling up has several obstacles, however. Perishable horticulture products require post- harvest technologies, and quick and regular transportation. It also needs economies o f scale, which are difficult to achieve in Rwanda because o f i t s small size. Annual exports o f horticulture products in 2002-2004 averaged US$643,000, accounting for one percent o f total ex orts. Further, production patterns have been unstable, usually driven by exports o f one product. USAlD report in 2001120 stated that there was sufficient air capacity out o f Kigal i to Europe and South Africa. However, there were no binding contractual arrangements between air carriers and exporters; and because o f low production o f exporting goods, exporters had no bargaining power to negotiate a favorable schedule.
A
7.84 These externalities provide a case for special support for the horticulture industry. Examples121 o f how Uganda, Kenya, India, and even Chile scaled up in horticultural exports may have some relevance for the Government. Specific interventions in those cases included public provision o f post-harvest technologies for grape growers’ cooperatives (India); refrigeration facilities (Kenya); foreign consultants who brought superior farm technologies (Chile); and government-donor partnership (Uganda).
7.85 There are significant prospects for exports in a number o f key products where global market trends are positive, if yields and quality can be increased. Rwanda has the opportunity to benefit from preferential access to the EU market under the Everything but Arms (EBA) and the US market under AGOA. As an example, consider the case o f scaling up banana, the top cash crop in Rwanda, which has been problematic. Banana growers face declining yields due to poor soil fertility, as well as pests and diseases. Currently, ISAR (Inst i tu t des science agronomique du Rwanda, or the National Agricultural Research Institute)122 i s conducting research to improve productivity and yields for small producers, and i s also promoting cooking and dessert bananas as
‘ I 9 As an example: the United States was the principal importer o f some unspecified vegetable materials (recorded as “other material o f vegetable origin”) from Rwanda. A quick rise o f the US market in late 1980s to early 1990s boosted the sector. But sudden stop of export to US since 1993 dragged it down to the bottom. With very limited capacity, it i s a more easible strategy for exporters to focus on one sector and one market. ‘’O “ATDT Banana Project - Rwanda” mrw.isar.cgiar.org/atdt/Banana/banana.htm.
World Bank Chandra, V (ed.). 2006. Technology, Adaptation andfiports: How some developing counties got it right.
ISAR stands for Znstitut des science agronomique du Rwanda, or the National Agricultural Research Institute ( N M ) .
186
exports ATDT Banana Project). The experience o f developing countries in arresting declining yields as in the case o f maize on small farms in India may be useful for Rwanda
7.86 In Rwanda, sector-specific support for horticulture implies crop-specific support for special crops such as passion fruit, the most highly prized fresh fruit by European consumers. Demand for i ts juice and puree i s also high. But scaling up i s obstructed by crop diseases; the producers are finding it hard to obtain disease-free seeds for cultivation. USAID’S ADAR’23 project has worked with passion fruit producers and Rwandan exporters to increase the production o f export-quality fruit and develop appropriate post-harvest handling and export strategie~’~~; and a local company called S H E M A FRUITS plans to export passion fruit puree to Europe. There are also plans to build a factory to manufacture products such as passion fruit pulp, for export to makers o f ice cream, sherbet, and pastry in Europe and the US. ADAR i s also helping farmers to manage disease with minimum use o f pesticides. These examples illustrate the kinds o f measures that are needed to scale up horticultural exports in Rwanda.
7.87 To some extent, scaling up o f the horticultural exports will depend on the alleviation o f the key constraints to improve access to transport, finance, and energy, and achieve more effective organization o f the rural sector. But most o f the scaling up will depend on the Government’s efforts to identify the sub-sector specific and crop-specific obstacles to exports. Currently, there is no organized strategy to develop Rwanda’s horticulture sector.
7.88 In the case of tea and coffee, priority measures for improving productivity include improving access to finance and inputs; disseminating information; and establishing and enforcing standards. For the coffee sector, measures are also needed to improve the capacity o f
ADAR stands for Agribusiness Development Assistance Project in Rwanda, funded by USAID. 123
lZ4 USAID (2004). Rwanda Integrated Strategic Plan 2004-2009, Volume 1 (January). lZ5 “Considerations for Initiating a Specialty Coffee Industry in Rwanda,” ADAR Project, Chemonics for USAID
“The African Growth and Opportunity Act: Achieving Success through the African Global Competitive Initiative,” (2002).
(2006). www.agoa.gov.
187
washing stations, which often operate below capacity due to water and electricity shortages. Further, the current installed capacity o f washing stations can process only half o f the beans produced, and more washing stations will need to be built.
7.89 Increased productivity in the tea sector will require training on care of the bushes, and a pricing and privatization policy that will provide the right incentives to farmers to improve quality. There i s also a need to improve the business environment to encourage investment in factories currently operating below capacity.
7.6.3 Sector-Specific Policy Obstacles May Be the Critical Constraint
7.90 I n sectors where there are many small exporters, scaling up requires addressing sector-specific obstacles such as pests, diseases, and lack of access to modern technologies. Further, small exporters need assistance in negotiating air transport. In some cases, Government wil l need to intervene, probably with the help o f donors, to reach foreign buyers. Often one buyer i s sufficient - Macy's and Starbucks are examples. Wooing one large firm to start processing f ru i ts and vegetables may be necessary, as this i s unlikely to happen on i t s own. The Government can also enable scaling up by promoting the Rwandan brand name and enacting regulations to maintain quality control, especially in agricultural export^.'^'
7.91 In many cases, Rwandan exporters can benefit from preferential trade arrangements with the EU and the US. Special efforts to unravel what i s needed to scale up imports in each sector may help Rwandan exporters to move faster into more manufactured products. Collaboration with foreign buyers and f i r m s may facilitate this effort.
7.92 Access to investment and working capital for commercial agriculture i s extremely limited. As noted in Chapter 5, currently only 2.3 percent o f bank credit i s used to finance activities in agriculture (which employs more than 90 percent o f the population and produces 40 percent o f GDP).'*' Microcredit by i tse l f will not suffice; it i s necessary to extend bank finance to the rural sector to commercialize farming. This issue needs to be addressed in the context o f the strategy to develop the financial sector, which i s currently being developed and implemented.
7.93 Excessive fragmentation o f farming due to the small size o f farms i s a major constraint for horticulture and floriculture. As land i s consolidated, bank finance can play an important role in helping large-scale farming to become viable. There i s also a need to link rural producers to local, national, regional, and international markets. Cooperatives have the potential to play a strong role, provided they have the legal status to support farmers in marketing their products, as in the case o f MAHA grapes in India.I2'
A good example i s Chilean wine, promoted aggressively by Pro Chile and Chile Vid (Chandra ed., 2006). 127
lZ8 DTIS: Diagnostic and Trade Integration Study, World Bank (2006) lZ9 Bridging the Knowledge Gap in Competitive Agriculture: Grapes in India (V. Chandra ed.), 2006.
188
Box 7.4: The African Growth and Opportunity Act Rwanda i s one o f beneficiary countries o f the African Growth and Opportunity Act (AGOA) o f 2000. AGOA promotes two-way trade between US and Sub-Sahara African countries by providing beneficiary countries with the most liberal access to the US market available to any country or region with which the US has no Free Trade Agreement. AGOA offers Rwanda several special opportunities for export diversification, but these cannot be accomplished with a single stroke of the policy pen. Diversification within each product chain requires concerted effort. Rwandan coffee and wicker basket exports are two examples. By investing in local infrastructure and coffee washing stations, and by supplying technical training and support, USAID fostered the development o f the Rwandan specialty coffee industry. The Rwandan coffee industry went fiom producing no specialty coffees in 2001 to producing 1,200 tons in 2005, yielding approximately US$3 million in sales, mainly to the US. Exports of specialty coffee were projected to reach US$6 million in 2006. Source: www.agoa.org.
7.6.4 General Constraints to Export Diversification
7.94 In almost all sectors, landlockedness and lack of sufficient power are problems. Provision of more energy, probably from Lake Kiwu’s natural gas project, as well as better rail, road, and air transport, seem indispensable for faster export diversification. One way to achieve this may be regional integration, which i s important for Rwanda, not only to expand i t s market, but also to improve the business environment and enhance competition.
7.95 A transportation network with neighboring countries will reduce border transactions and delays, leading to lower cost and greater efficiency. In 2004, the Governments o f Burundi, Congo (Kinshasa), and Rwanda discussed the rehabilitation o f the Ruzizi I hydropower station in Burundi. Repairs to Ruzizi I would increase capacity from 28.2 MW to 39.6 MW, and allow the plant to export power to Rwanda. There have also been discussions to rehabilitate Ruzizi I1 and the possibly construct Ruzizi 111.
7.96 Currently, transportation costs are pushing up the cost o f trade by an estimated 30 to 50 percent. Targeted support for infrastructure will probably help, as the Government cannot improve it economy-wide at once. In particular:
7.97 Better air transport wil l help high-value, low-volume goods to be flown directly to external markets. Ideally, the investment would come from the private sector; however, Government may need to intervene.
7.98 The cost o f transport from Kigal i to Mombasa i s 70 percent higher than from Kampala to Mombasa. There are extreme delays along transport routes, especially main transit corridors. The average time from Mombasa to Kigal i i s 4 weeks. Rural transport costs from the farm gate in Rwanda to Mombasa are 80 percent o f the farm gate price; while from the farm gate to Kiga l i i s about 40 percent. This amounts to an implicit tax on coffee and other exportables (DTIS, 2006).
7.99 and world markets; and provide rural roads that link agricultural areas to local markets.
Two straightforward solutions: build corridor routes that provide access to gateway ports
189
7.100 The regional development of power systems will increase the availability and reduce the cost o f electricity which i s one o f the major deterrents to doing business in the country. Regional capital markets wil l enable government to borrow at lower costs and encourage competition. Rwanda can also benefit by becoming the distribution center for the sub-region. Rwanda has the advantage o f greater security for people and property and a lower level of corruption compared to i ts neighbors. The country i s already re-exporting to DRC, Tanzania, Uganda, and Burundi. The development o f ICT structure will help Rwanda become a regional distribution center for exports. Another benefit may be better employment opportunities for semi- skilled and unskilled labor, due to greater mobility. The country's agriculture sector may benefit from greater demand. However, since most agricultural trade i s informal, it will be hard to assess the benefits to that ~ect0r . l~ '
7.101 Finally, capacity issues are a constraint faced across all sectors. Most entrepreneurs in the private sector do not have the training, experience, and ski l ls needed to manage their business competitively. There i s a need to provide technical, managerial, and international marketing training programs for private entrepreneurs and managers; and to develop sector- specific skills. Examples include ski l ls for managing coffee and tea plantations; applying new agricultural technologies on farms, operating minerals and metals factories, linking to a supply chain, and marketing.
7.102 The Government has established several public sector institutions to support the private sector. However, the private sector needs help in adopting and implementing management, quality, safety, environmental, and other standards and certifications. Currently, Rwanda has no quality certification or management systems, and both have to be in place before the country can enter high-value markets.
7.7 CONCLUSION
7.103 First, eliminate the barriers to trade. Foremost among these i s the electricity problem, which constrains the capacity of processing plants. The recent investment in Lake Kivu methane gas development should help to reduce the cost and increase the reliability o f electricity in the long term. Second, invest in rural roads to link rural households and small producers to markets. Third, identify sector-specific constraints to productivity, to help develop the value chain and increase producers' access to training and finance. Fourth, facilitate and promote engagement o f the private sector. Fifth, provide assistance to producers' organizations, including training in the use o f improved inputs and microfinance, to promote the transition to increased market production or new activities. There would need to be coordination across agencies, with primary responsibility for organizing agricultural producers coming from MINAGRI; and for other producers coming from MINICOM. RIEPA would have the role o f trade promotion outside the country.
7.104 Putting in place measures to link producers to local, national, regional, and international markets will require identifying viable export chains and organizing producers to link them to these value chains. Sectors with growth potential that can benefit from value chains include tourism, textiles and silk production, hides and skins, horticulture, fruit juice manufacturing and processing, furniture making, and mining.
130 Imani Development Group (2006)
190
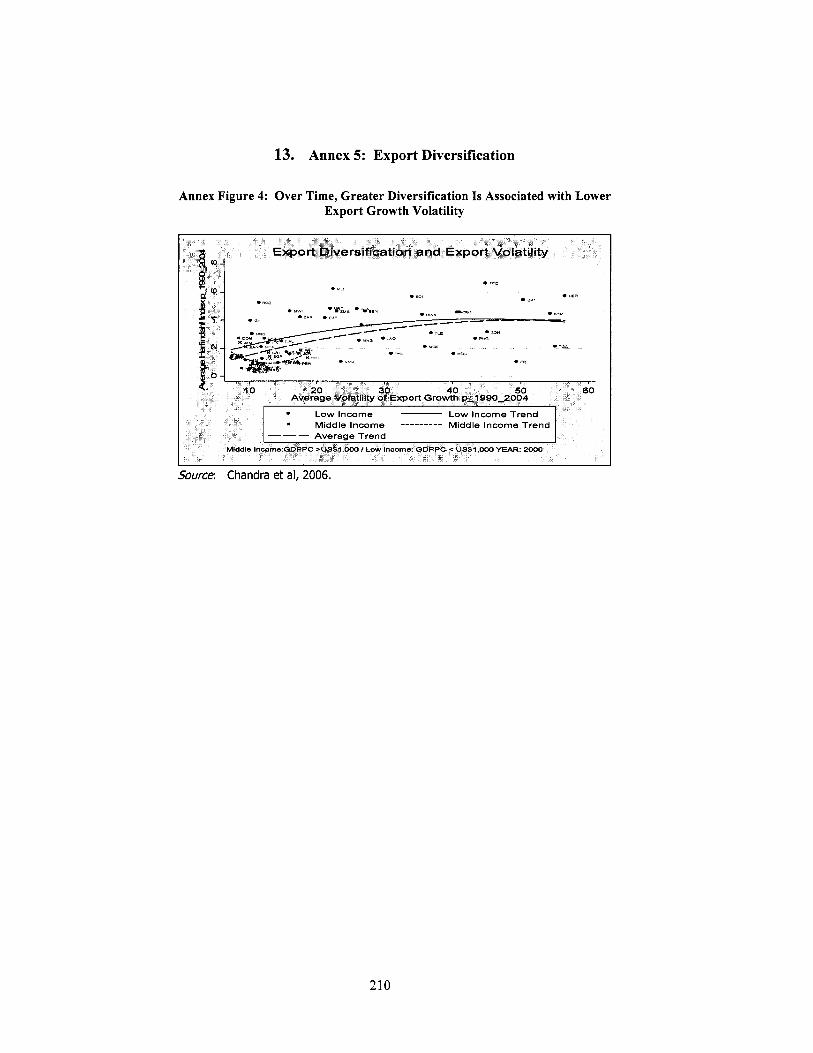
13. Annex 5: Export Diversification
Annex Figure 4: Over Time, Greater Diversification I s Associated with Lower Export Growth Volatility
Source: Chandra et al, 2006.
210
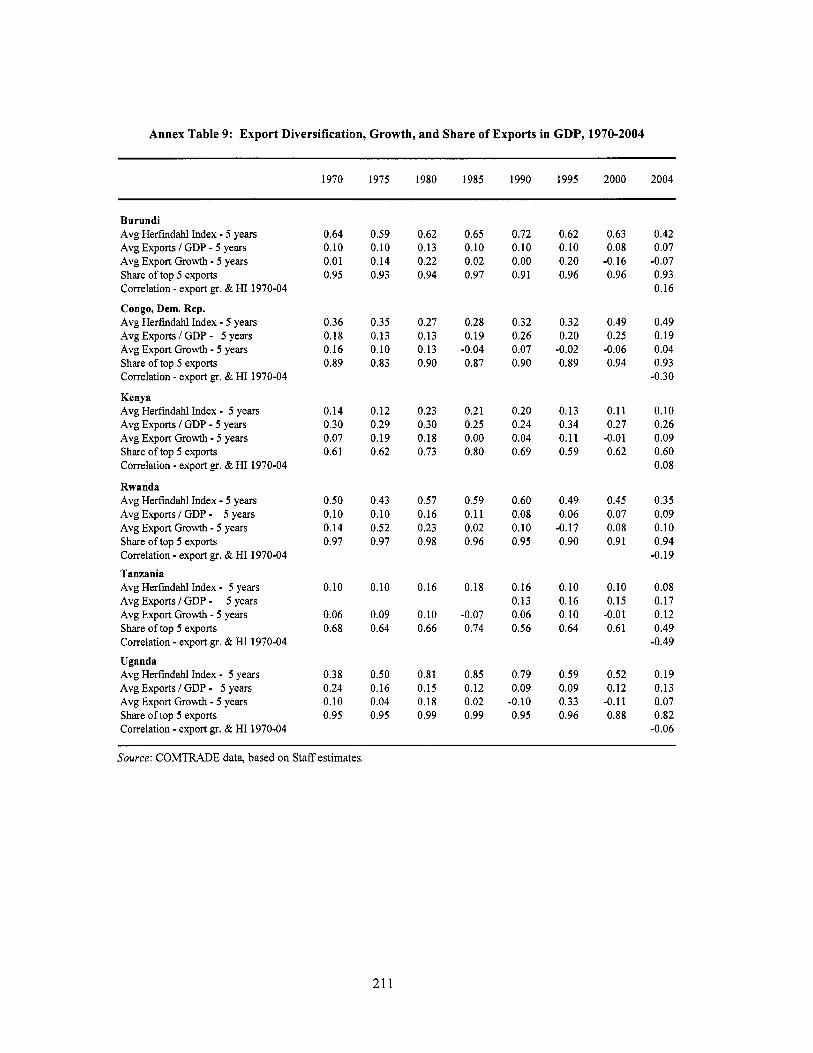
Annex Table 9: Export Diversification, Growth, and Share of Exports in GDP, 1970-2004
1970 1975 1980 1985 1990 1995 2000 2004
Burundi Avg Herfindah1 Index - 5 years Avg Exports I GDP - 5 years Avg Export Growth - 5 years Share o f top 5 exports Correlation - export gr. & HI 1970-04
Congo, Dem. Rep. Avg Herfiidahl Index - 5 years Avg Exports I GDP - 5 years Avg Export Growth - 5 years Share o f top 5 exports Correlation - export gr. & HI 1970-04
Kenya Avg Herfmdahl Index - 5 years Avg Exports / GDP - 5 years Avg Export Growth - 5 years Share o f top 5 exports Correlation - export gr. & HI 1970-04
Rwanda Avg Herfiidahl Index - 5 years Avg Exports / GDP - 5 years Avg Export Growth - 5 years Share o f top 5 exports Correlation - export gr. & HI 1970-04 Tanzania Avg Herfidahl Index - 5 years Avg Exports I GDP - 5 years Avg Export Growth - 5 years Share o f top 5 exports Correlation - export gr. & HI 1970-04
Uganda Avg Herfidahl Index - 5 years Avg Exports I GDP - 5 years Avg Export Growth - 5 years Share o f top 5 exports Correlation - export gr. & HI 1970-04
0.64 0.10 0.01 0.95
0.36 0.18 0.16 0.89
0.14 0.30 0.07 0.61
0.50 0.10 0.14 0.97
0.10
0.06 0.68
0.38 0.24 0.10 0.95
0.59 0.10 0.14 0.93
0.35 0.13 0.10 0.83
0.12 0.29 0.19 0.62
0.43 0.10 0.52 0.97
0.10
0.09 0.64
0.50 0.16 0.04 0.95
0.62 0.13 0.22 0.94
0.27 0.13 0.13 0.90
0.23 0.30 0.18 0.73
0.57 0.16 0.23 0.98
0.16
0.10 0.66
0.81 0.15 0.18 0.99
0.65 0.10 0.02 0.97
0.28 0.19
0.87 -0.04
0.21 0.25 0.00 0.80
0.59 0.11 0.02 0.96
0.18
-0.07 0.74
0.85 0.12 0.02 0.99
0.72 0.10 0.00 0.91
0.32 0.26 0.07 0.90
0.20 0.24 0.04 0.69
0.60 0.08 0.10 0.95
0.16 0.13 0.06 0.56
0.79 0.09
-0.10 0.95
0.62 0.10 0.20 0.96
0.32 0.20
-0.02 0.89
0.13 0.34 0.11 0.59
0.49 0.06
0.90 -0.17
0.10 0.16 0.10 0.64
0.59 0.09 0.33 0.96
0.63 0.08
-0.16 0.96
0.49 0.25
0.94 -0.06
0.11 0.27
-0.01 0.62
0.45 0.07 0.08 0.91
0.10 0.15
-0.01 0.61
0.52 0.12
-0.1 1 0.88
0.42 0.07
0.93 0.16
-0.07
0.49 0.19 0.04 0.93
-0.30
0.10 0.26 0.09 0.60 0.08
0.35 0.09 0.10 0.94
-0.19
0.08 0.17 0.12 0.49
-0.49
0.19 0.13 0.07 0.82
-0.06
Source: COMTRADE data, based on Staff estimates.
21 1
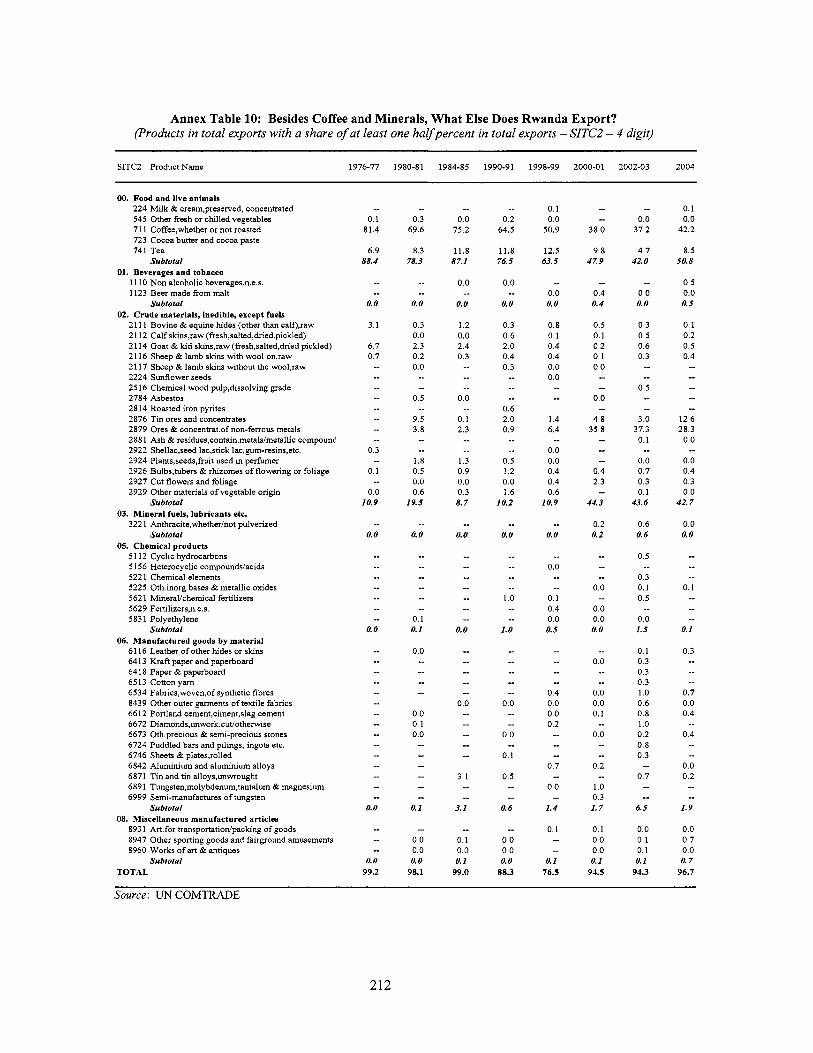
Annex Table 10: Besides Coffee and Minerals, What Else Does Rwanda Export? (Products in total exports with a share of at least one halfpercent in total exports - SITC2 - 4 digit)
SITC2 Product Name 1976-77 1980-81 1984-85 1990-91 1998-99 2000-01 2002-03 2004
00. Food and live animals 224 Milk & cream,preserved, concentrated 545 Other fresh or chilled vegetables 71 1 Coffee,whether or not roasted 723 Cocoa butter and cocoa paste 741 Tea
Subtotal 01. Beverages and tobacco
11 10 Non alcoholic beverages,n.e.s. 1123 Beer made from malt
Subtotal 02. Crude materials, inedible, except fuels
21 11 Bovine & equine hides (other than calf),raw 21 12 Calf skins,raw (fresh,salted,dried,pickled) 2 114 Goat & kid skins,raw (fiesh,salted,dried pickled) 21 16 Sheep & lamb skins with wool oqraw 21 17 Sheep & lamb skins without the wool,raw 2224 Sunflower seeds 25 16 Chemical wood pulp,dissolving grade 2784 Asbestos 2814 Roasted iron pyrites 2876 Tin ores and concentrates 2879 Ores & concentrat.of non-ferrous metals 288 1 Ash & residues,contain.metals/metallic compound 2922 Shellac,seed lac,stick lac,gum-resins,etc. 2924 Plants,seeds,fiuit used in perfumer 2926 Bulbs,tubers & rhizomes o f flowering or foliage 2927 Cut flowers and foliage 2929 Other materials o f vegetable origin
Subtotal 03. Mineral fuels, lubricants etc.
322 1 Anthracite,whether/not pulverized Subtotal
05. Chemical products 51 12 Cyclic hydrocarbons 5 156 Heterocyclic compounds/acids 5221 Chemical elements 5225 0th.inorg.bases & metallic oxides 562 1 MineraVchemical fertilizers 5629 Fertilizers,n.e.s. 583 1 Polyethylene
Subtotal 06. Manufactured goods by material
61 16 Leather o f other hides or skins 6413 Kraft paper and paperboard 6418 Paper & paperboard 6513 Cotton yarn 6534 Fabrics,woven,of synthetic fibres 8439 Other outer garments oftextile fabrics 6612 Portland cement,ciment,slag cement 6672 Diamonds,unwork.cutiotheMise 6673 0th.precious & semi-precious stones 6724 Puddled bars and pilings; ingots etc. 6746 Sheets & plates,rolled 6842 Aluminium and aluminium alloys 6871 Tin and tin alloys,unwought 689 1 Tungsten,molybdenum,tantalum & magnesium 6999 Semi-manufactures o f tungsten
08. Miscellaneous manufactured articles Subtotal
893 1 Art.for transportatiodpacking o f goods 8947 Other sporting goods and fairground amusements 8960 Works o f art & antiques
Subtotal TOTAL
0.1 81.4
6.9 88.4
0.0
3.1
6.7 0.7
-
0.3
0.1
0.0 10.9
-
0.0
-
0.0
-
I
- 0.0
0.0 99.2
0.3 69.6
8.3 78.3
_ _ __ 0.0
0.3 0.0 2.3 0.2 0.0 _- -
0.5
9.5 3.8
_ _
- __ 1.8 0.5 0.0 0.6
19.5
0.0
0.1 0. I
0.0 -- -- _ _ _-
0.0 0.1 0.0
0.1
0.0 0.0 0.0
98.1
_ _ 0.0
75.2
11.8 87.1
0.0
0.0
1.2 0.0 2.4 0.3
_-
_- _ _ _ _ 0.0
0.1 2.3
_ _ _ _ --
1.3 0.9 0.0 0.3 8.7
0.0
_ _ -- -- _ _ __ -_
0.0
_ _
0.0
__ _-
3.1 _ _ _ _ 3.1
_ _ 0.1 0.0 0. I
99.0
_ _ 0.2
64.5
11.8 76.5
0.0
0.0
0.3 0.6 2.0 0.4 0.3 _ _
__ 0.6 2.0 0.9
_- 0.5 1.2 0.0 1.6
10.2
_ _ 0.0
-- _ _ _ _ 1 .o __ _ _
1.0
_- _ _ _ _ _ _
0.0 _ _ _-
0.0
0.1
0.5
_ _
0.6
0.0 0.0 0.0
88.3
0.1 0.0
50.9
12.5 63.5
0.0 0.0
0.8 0.1 0.4 0.4 0.0 0.0
1.4 6.4
0.0 0.0 0.4 0.4 0.6
10.9
0.0
-- 0.0
0.1 0.4 0.0 0.5
0.4 0.0 0.0 0.2 _ _ 0.7
0.0
1.4
0.1
--
0. I 76.5
I
38.0
9.8 47.9
- 0.4 0.4
0.5 0.1 0.2 0.1 0.0
0.0
4.8 35.8
- 0.4 2.3
44.3
0.2 0.2
__ 0.0
0.0 0.0 0.0
0.0
0.0 0.0 0.1
0.0
0.2
1.0 0.3 1.7
0.1 0.0 0.0 0. I
94.5
_ _ 0.0
37.2
4.7 42.0
_ _ 0.0 0.0
0.3 0.5 0.6 0.3 _ _ _ _ 0.5 --
_- 3.0
37.3 0.1
0.0 0.7 0.3 0.1
43.6
0.6 0.6
0.5
0.3 0.1 0.5
0.0 1.5
0.1 0.3 0.3 0.3 1.0 0.6 0.8 1.0 0.2 0.8 0.3
0.7
_ _
-_
_ _
_-
6.5
0.0 0.1 0.1 0.1
94.3
0.1 0.0
42.2
8.5 50.8
0.5 0.0 0.5
0.1 0.2 0.5 0.4 _ _ _ _ _ _ _ _ _ _
12.6 28.3
0.0
0.0 0.4 0.3 0.0
42.7
0.0 0.0
--
_ _ -- -_
0.1 _ _ 0.1
0.3 _ _ _ _ _ _ 0.7 0.0 0.4
0.4
0.0 0.2 _ _ _ _ 1.9
0.0 0.7 0.0 0.7
96.7
Source: UN COMTRADE
212
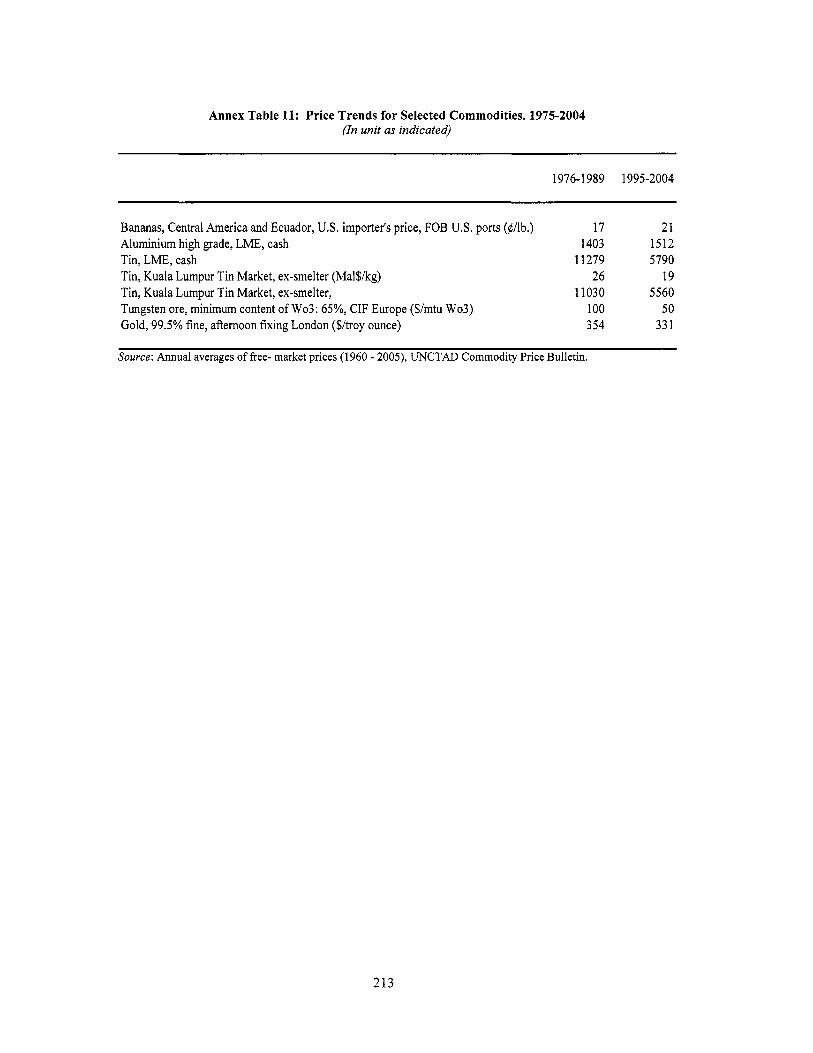
Annex Table 11: Price Trends for Selected Commodities. 1975-2004 (In unit as indicated)
1976-1989 1995-2004
Bananas, Central America and Ecuador, U.S. importer's price, FOB US. ports (#Ab.) Aluminium high grade, LME, cash 1403 1512
17 21
Tin, LME, cash 11279 5790 Tin, Kuala Lumpur Tin Market, ex-smelter (Mal$/kg) 26 19 Tin, Kuala Lumpur Tin Market, ex-smelter, 11030 5560
100 50 Gold, 99.5% fine, afternoon fixing London ($/troy ounce) 354 33 1 Tungsten ore, minimum content o f W03: 65%, CIF Europe ($/mtu Wo3)
Source: Annual averages o f free- market prices (1960 - 2005), UNCTAD Commodity Price Bulletin.
213
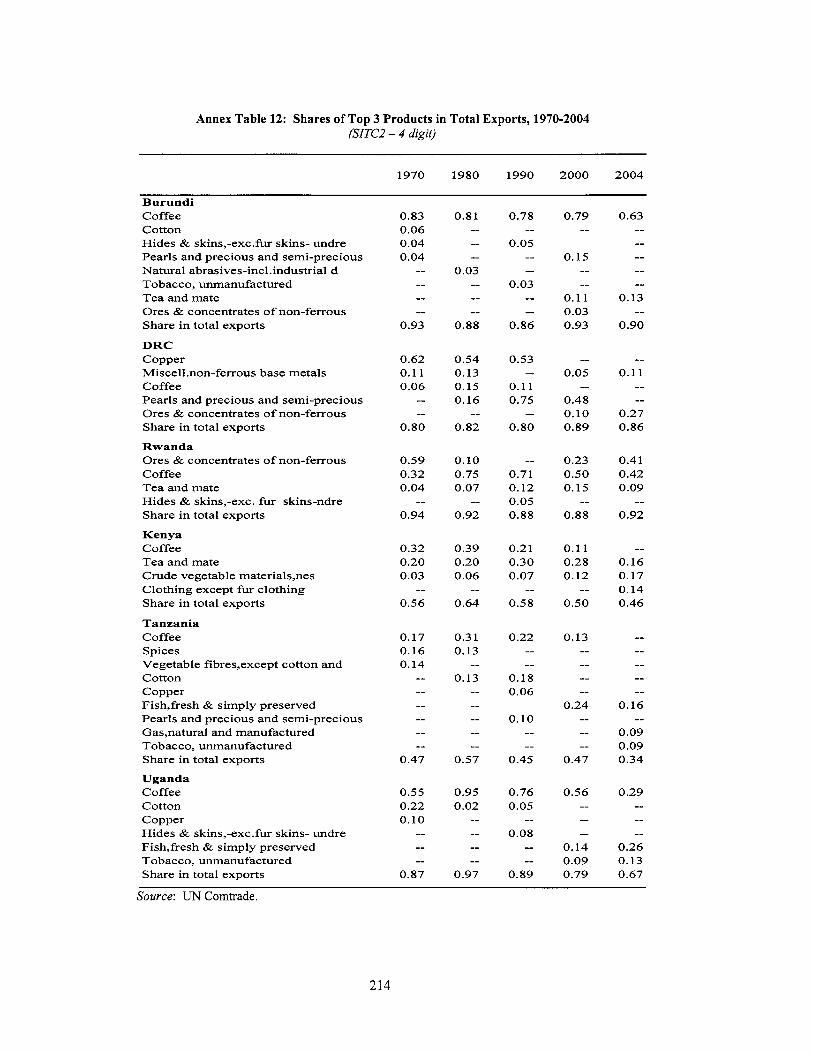
Annex Table 12: Shares of Top 3 Products in Total Exports, 1970-2004 (SITCZ - 4 digit)
1970 1980 1990 2000 2004
Burundi Coffee Cot ton H ides & skins,-exc.fur skins- undre Pearls and precious and semi-precious Natura l abrasives-incl.industria1 d Tobacco, unmanufactured Tea and mate Ores & concentrates o f non-ferrous Share in total exports
DRC Copper Miscell.non-ferrous base metals Coffee Pearls and precious and semi-precious Ores & concentrates o f non-ferrous Share in total exports
Rwanda Ores & concentrates o f non-ferrous Coffee Tea and mate H ides & skins,-exc. fur skins-ndre Share in total exports
Kenya Coffee Tea and mate Crude vegetable materials,nes C lo th ing except fur clothing Share in total exports
Tanzania Coffee Spices Vegetable fibres,except cot ton and Cot ton Copper Fish,fresh & s imply preserved Pearls and precious and semi-precious Gas,natural and manufactured Tobacco , unmanufactured Share in total exports
Uganda Coffee Cotton Copper H ides & skins,-exc.fur skins- undre Fish,fresh & s imply preserved Tobacco, unmanufactured Share in total exports
0.83 0.06 0.04 0.04
-- -- -- --
0.93
0.62 0.1 1 0.06
-- --
0.80
0.59 0.32 0.04
0.94 --
0.32 0.20 0.03
0.56 --
0.17 0.16 0.14
-- -- -- -- -- --
0.47
0.55 0.22 0.10
-- -- --
0.87
0.81 -- -- --
0.03 -- -- --
0.88
0.54 0.13 0.15 0.16
0.82 --
0.10 0.75 0.07
0.92 --
0.39 0.20 0.06
0.64 --
0.3 1 0.13
0.13 --
-- -- -- -- --
0.57
0.95 0.02
_- -- -- --
0.97
0.78
0.05 --
-- --
0.03 -- --
0.86
0.53
0.11 0.75
0.80
--
--
-- 0.71 0.12 0.05 0.88
0.21 0.30 0.07
0.58 --
0.22 -- --
0.18 0.06
0.10 -- --
0.45
0.76 0.05
0.08 --
-- --
0.89
0.79 --
0.15 -- --
0.1 1 0.03 0.93
-- 0.05
0.48 0.10 0.89
--
0.23 0.50 0.15
0.88 --
0.1 1 0.28 0.12
0.50 --
0.13 -- -- -- --
0.24 -- -- --
0.47
0.56 -- -- --
0.14 0.09 0.79
0.63 -- -- -- -- --
0.13
0.90 --
-- 0.11
-- --
0.27 0.86
0.41 0.42 0.09
0.92 --
-- 0.16 0.17 0.14 0.46
-- -- -- -- --
0.16
0.09 0.09 0.34
--
0.29 -- -- --
0.26 0.13 0.67
Source: UN Comtrade.
214
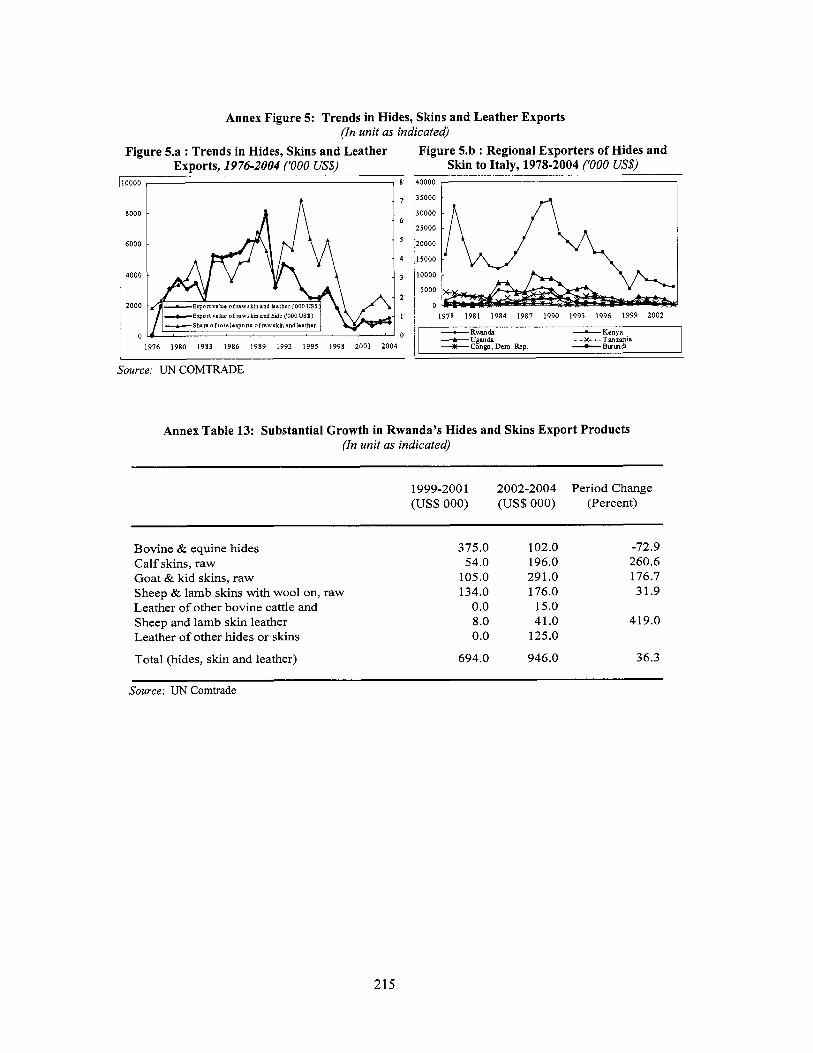
Annex Figure 5: Trends in Hides, Skins and Leather Exports (In unit as indicated)
Figure 5.a : Trends in Hides, Skins and Leather EXDOrtS. 1976-2004 1'000 us$)
0000
8000
6000
4000
2000
0
- C E l q r o r l v i l u e o f n w r k m and hde COO0 US$) --Share o f t o t a l s x p r t s ofrawrkhand kathsr
1976 1980 1983 1986 1989 1992 1995 1998 2001 2004
Figure 5.b : Regional Exporters of Hides and Skin to Italy, 1978-2004 ('000 US$)
io000
A 15000
10000
I5000
10000
5000
0 1978 1981 1984 1987 1990 1993 1996 1999 2002 - Rvmda -Kenya
+Conw. Dem. Reo. --BIUm& -Uganda ......... x Tanzania
Source: UN COMTRADE
Annex Table 13: Substantial Growth in Rwanda's Hides and Skins Export Products (In unit as indicated)
1999-200 1 2002-2004 Period Change (US$ 000) (US$ 000) (Percent)
Bovine & equine hides Ca l f skins, raw Goat & kid skins, raw Sheep & lamb skins with wool on, raw Leather o f other bovine cattle and Sheep and lamb sk in leather Leather o f other hides or skins
Total (hides, sk in and leather)
375.0 54.0
105.0 134.0
0.0 8.0 0.0
694.0
102.0 -72.9 196.0 260.6 29 1 .O 176.7 176.0 31.9
15.0 41.0 419.0
125.0
946.0 36.3
Source: UN Comtrade
215
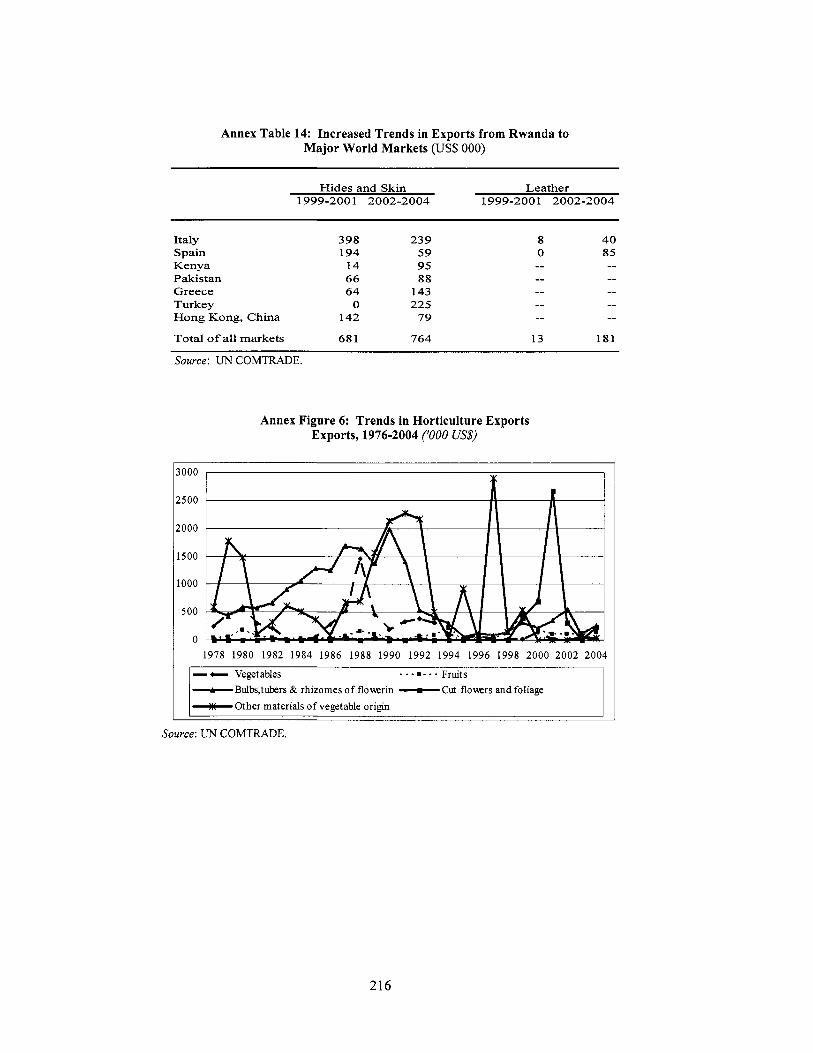
Annex Table 14: Increased Trends in Exports from Rwanda to Major World Markets (US$ 000)
Hides and Skin Leather 1999-2001 2002-2004 1999-2001 2002-2004
Italy Spain Kenya Pakistan Greece Turkey Hong Kong, China
Total o f all markets
398 194
14 66 64
0 142
68 1
239 59 95 88
143 225
79
764
8 0
13
40 85
181
Source: UN COMTRADE.
Annex Figure 6: Trends in Horticulture Exports Exports, 1976-2004 ('000 US$)
3000
2500
2000
1500
1000
500
0 1978 1980 1982 1984 1986 1988 1990 1992 1994 1996 1998 2000 2002 2004
Fruits - c Vegetables . . . . . . . -Bulbs,tubers & rhizomes o f flowrin -Cut flowrs and foliage -Other materials o f vegetable origin
Source: UN COMTRADE.
216
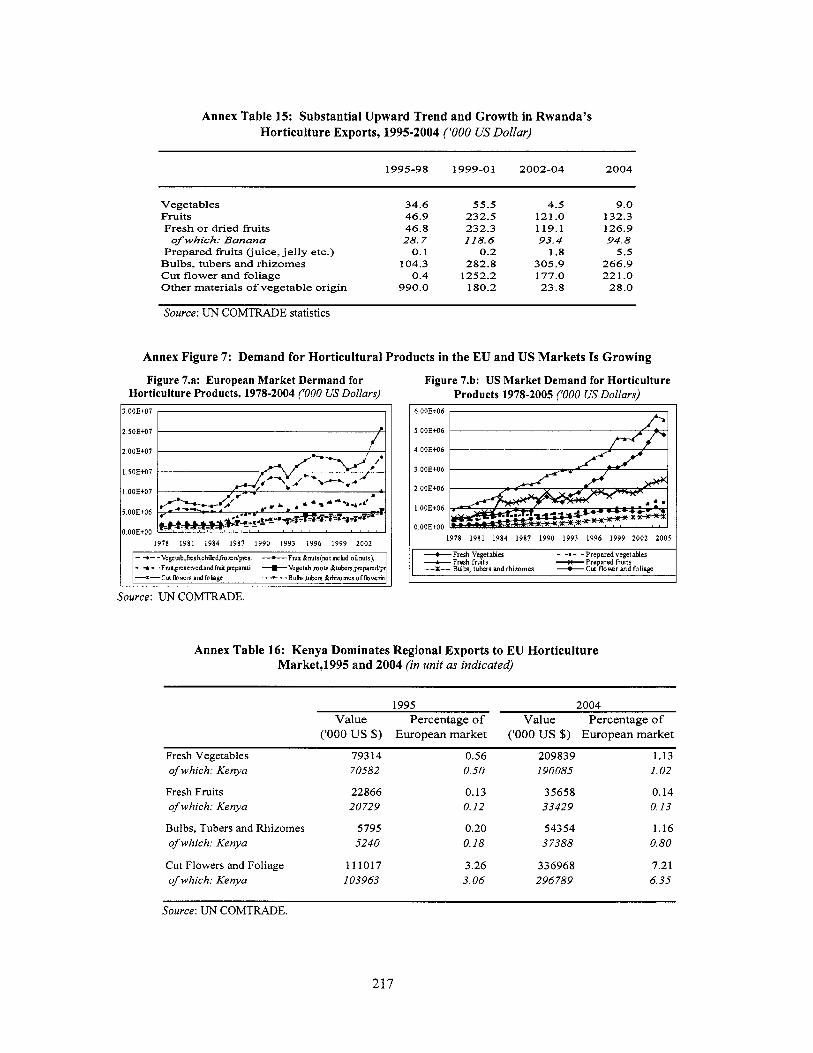
Annex Table 15: Substantial Upward Trend and Growth in Rwanda's Horticulture Exports, 1995-2004 ('000 US Dollar)
1995-98 1999-01 2002-04 2004
Vegetables Fruits Fresh or dried h i t s
of which: Banana Prepared frui ts (juice, jelly etc.)
Bulbs, tubers and rhizomes Cut flower and foliage Other materials o f vegetable origin
34.6 46.9 46.8 28.7
0.1 104.3
0.4 990.0
55.5 232.5 232.3 2 2 8 . 6
0.2 282.8
1252.2 180.2
4.5 121.0 119.1 93.4
1.8 305.9 177.0 23.8
9.0 132.3 126.9 94.8
5.5 266.9 22 1 .o
28.0
Source: UN COMTRADE statistics
Annex Figure 7: Demand for Horticultural Products in the EU and US Markets I s Growing
Figure 7.a: European Market Dermand for Horticulture Products, 1978-2004 ('000 US Dollars)
3.00EH7
2.50EH7
2.0OEtO7
1.50Effl7
1.00Et07
1978 1981 1984 1987 1990 1993 1996 1999 2002
- +- - Vcgetab.&shchikqfrordpm --r-F~~&nuts(notmcLdoPnutr), - -a - , F N t , p ~ s c r r e ~ a n d ~ i p n a r a t i +Vegetab.mots &tukn,prsparedip -x-Cuthxen atdfohage .( , ,*, , , , ,Bubs,tukn Blhaomei o f h n e h
Source: UN COMTRADE.
Figure 7.b: U S Market Demand for Horticulture Products 1978-2005 ('000 US Dollars)
6.00Et06
S.OOEffl6
4.00Effl6
3.00Effl6
2 00E+06
1.00Et06
0 00EH0 1978 1981 1984 1987 1990 1993 1996 1999 2002 2005
-Fresh Vegetables - -1- -Preparedvegetables --c- Fresh fndtr +Prepared frrnts --ic Bulk, tubers and rhizomes -Cut flowcr and foliage
Annex Table 16: Kenya Dominates Regional Exports to EU Horticulture MarketJ995 and 2004 (in unit as indicated)
1995 Value Percentage of Value Percentage o f
('000 U S $) European market ('000 U S $) European market
Fresh Vegetables 79314 0.56 209839 1.13 of which: Kenya 70582 0.50 190085 1.02
Fresh Fruits 22866 0.13 35658 0.14 of which: Kenya 20729 0.12 33429 0.13
Bulbs, Tubers and Rhizomes 5795 0.20 54354 1.16 of which: Kenya 5240 0.18 3 7388 0.80
Cut Flowers and Foliage 11 1017 3.26 336968 7.21 of which: Kenya I03963 3.06 296789 6.35
Source: UN COMTRADE.
217
REFERENCES
Aersten, George, Augustin Mutijima, Sylvain Mbarubugeye, March 2006. Rwanda Agricultural Policy Note, Background study # 1 : Prospects for achieving sustainable agricultural growth in Rwanda, Ministry o f Finance and Economic Planning, Republic o f Rwanda.
Afiica Mining Intelligence. 2004, As quoted in Thomas R. Yager “The Mineral Industry o f Rwanda” in U.S. Geological Surveys Minerals Yearbook - 2004, pp33.1.
Akitoby, Bernardin & Matthias Cinyabuguma. 2004. Sources o f Growth in the Democratic Republic o f the Congo: A Co-integration Approach. International Monetary Fund, WP/O4/114.
ATDT Banana Project - Rwanda” www.isar.ceiar.ordatdtiBanana/banana.htm.
Aureille, Yves G. & Serge Rwamasirabo. Spring 2006. Patterns o f Competitiveness and Comparative Advantage in Rwanda Agriculture.
Byakweli. 2004 (incomplete).
Chandra, Vandana, I. Osorio, M Desai, and Y. Li. 2006, Export diversification Rwanda too (Background paper for the Rwanda many export discoveries, too little scaling-up
Country Economic Memorandum).
Chandra, V. (ed.). 2006, Technology, Adaptation and Exports - how some developing countries got it right, The World Bank.
Coulibab, Kalarnogo and Tembo R. B. Maburuki. 2006, Cross-border trade in Rwanda (Background paper for the Rwanda Country Economic Memorandum).
Dabalen, Andrew, Stefan0 Paternostro and Gaelle Pierre. December 2004, The Returns to Participation in the Non-Farm Sector in Rural Rwanda, World Bank Policy Research Working Paper 3462.
Diao, Xinshen and Yu Bingxin, May 2006. Agricultural Growth and Poverty Reduction Options in Rwanda - Background Study #4 for Rwanda Agricultural Policy Note, International Food Policy Research Institute.
Diao, Xinshen and Yu Bingxin. August 2005, Growth and Poverty Reduction Options in Rwanda: An Economy wide, Multi-Market Model Analysis for 2004-20 15, Second Draft, Development Strategy and Governance Division, International Food Policy Research Institute.
Diamond, Jack and Poka Khemani, 2005. ‘Introducing Financial Management Information Systems in Developing Countries’. IMF Working Paper. International Monetary Fund, October.
Diop, Ndiame, Paul Brenton and Yakup Asarkaya. 2005, Trade Costs, Export Development and Poverty in Rwanda World Bank Policy Working Paper 3784. The World Bank.
218
Economist Intelligent Unit. 2006, Country Report, Rwanda, 2006.
Elbadawi, Ibrahim. 2002. “Real Exchange Rate Policy and Non-traditional Exports in Developing Countries,” in G.K. Helleiner (ed.), Non-Traditional Export Promotion in Africa: Experiences and Issues, Palgrave: New York.
Elbadawi, Ibrahim, L. Kaltani and R. Soto. 2006, “Real Exchange Rate Misalignment in SSA: How Serious, How Dangerous,’’ Unpublished World Bank Memo (forthcoming).
Electrogaz. 2004: Annual Report.
Ezemenari, Kene and Kalamogo Coulibaly. 2006A, Total factor productivity growth and economic reforms: Evidence from Rwanda (Background paper for the Rwanda Country Economic Memorandum), World Bank.
Ezemenari, Kene and Kalamogo Coulibaly. 2006B, Sources o f growth in Rwanda: Four different complementary approaches (Background paper for the Rwanda Country Economic Memorandum), World Bank.
Ezemenari, Kene and Ephraim Kebede. 2006, Rwanda’s growth Path and Binding Constraints (Background paper for the Rwanda Country Economic Memorandum).
Ezemenari, Kene, Kebede Ephraim and Rutayisire Musoni. 2006, Sources o f Inflation in Rwanda, (Background paper for the Rwanda Country Economic Memorandum) Unpublished, World Bank.
Ezemenari, Kene, Kebede Ephraim. 2006, The Impact o f Aid on Fiscal Policy in Rwanda Implications for Growth and Poverty Reduction. (Background paper for the Rwanda Country Economic Memorandum.
Ezemenari, Kene and Rui Wu. January 2005, Earnings Differences Between Men and Women in Rwanda, Africa Region Working Paper Series Number 81,32053, The World Bank.
FAO. 2006, “Consultation on Hides and Skins”, Arusha, Tanzania, February 1,2006.
FA OSTA T 2 005
FIAS. 2006a. Government o f Rwanda - Sources o f Informal Economic Activity. International Finance Company. November.
FIAS. 2006. Sector Study o f the Effective Tax Burden, Rwanda. Foreign Investment Advisory Service. A joint service o f the International Finance Corporation and the World Bank. January.
Goessens and Rwamasirabo 2006. (incomplete). Agriculture Policy Note Background Paper.
Ghura, Dhaneshwar and Benoit Mercereau. 2004. Political Instability and Growth: The Central African Republic, International Monetary Fund, WP/04/80
Government of Rwanda. 2006a. The National Accounts for Rwanda-Sources and Methods for GDP Estimates (base year 2001), National Institute o f Statistics. December.
219
Government of Rwanda. 2006b. Rwanda Demographic and Health Survey. National Inst i tute o f Statistics, July.
Government of Rwanda. 2005. Rwanda’s Coffee Industry-Current Situations and Proposal for Action, Report o f the Coffee Task Force, December.
Government of Rwanda. 2001. Rwanda Household Living Condition Survey (EICV).
Government of Rwanda. 2002. Population Census.
Haussman, Rodrick and Roberto Rigobon. 2002. An alternative interpretation o f the ‘Resources Curse’: Theory and policy implications, NBER Working Paper 9424
Haussman, Ricardo, Dani, Rodrik, and Andres Velasco, 2005, ”Growth Diagnostics,” John F. Kennedy School o f Government, Harvard University.
Imani Development Group. 2006. Support to Rwanda’s Accession to the East African Community: Volume 1, Economic Impact Report. May.
Imbs and Wacziarg. 2003 (Incomplete).
International Monetary Fund (IMF). 2006. http://www.friendscentre.net/home.html. International Financial Statistics database.
IMF, 2005. “The Macroeconomics o f Managing Increased Aid Inflows: Experiences o f Low- Income Countries and Policy Implications” Available at http://www.imf.org/external/np/pp/eng/2005/080805a.pdf. IMF, Staff reports, various years International Telecommunication Union.
Joseph, K.J. 2002. ‘Growth o f ICT and ICT for Development, Realities o f the Myths o f the Indian Experience’. Discussion Paper No. 2002178. World Inst i tute for Development Economics Research (WIDER). United Nations University. August.
J. E. Austin Associates, Inc. 2006, Rwanda: Export Competitiveness Desk Study (Background paper for the Rwanda Country Economic Memorandum).
Kanimba, Francois, Deepening the financial market in Rwanda. Power point presentation, September 2004.
Kassahun, Rahel. 2006, Development o f Tourism in Rwanda: Unleashing the Sector’s Potential to Drive Export Growth (Background paper for the Rwanda Country Economic Memorandum).
Kawai, Masahiro and Shinji Takagi, 2001. “Proposed strategy for a regional exchange rate arrangement in post-crisis East Asia,” manuscript, World Bank.
Kelly and Murekezi. 2000 (Incomplete.)
Klinger, B. and D. Ledermen. 2006. Diversification in the Search for Innovation and Export Booms. Draft Working Paper, World Bank.
Lall, S. 2001, ”Technology, Competitiveness and Skills,” Cheltenham, Edward Elgar.
220
Loveridge, S. 1989. (incomplete).
Lull, S. 200 1. “Technology, Competitiveness and Skills,” Cheltenham, Edward Edgar.
Lasbille, Gerard and Jee-Pan Tan. 2004, The returns to Education in Rwanda, Journal o f African
Linjouom, Mireille. 2006. The impact o f the higher o i l prices on Rwanda economic (Background
Economies, Vo1.14, 92-1 16.
paper for the Rwanda Country Economic Memorandum).
Madon S. and G. Kiran. 2002. Information Technology for Citizen-Government Interface: A study o f FRIENDS project in Kerala. World Bank Global Knowledge Sharing Program (GKSP).
Ministry of Finance and Economic Planning, National Accounts, Direction o f Statistics, Republic
Ministry of Finance and Economic Planning, Government Operations 1995-2005, Republic o f
o f Rwanda.
Rwanda
Ministry of Agriculture and Forestry. February 2006, Statistics series, Republic o f Rwanda.
Ministry of Agriculture and Forestry. 2004, Statistics series, Republic o f Rwanda.
Ministry of Agriculture, and Forestry and BM. May 2004. Utilisation et AccessibilitB des Engrais Inorganiques au Rwanda.
Minist2re des Finances et de la Plani3cation Economique. Novembre 2005. Impact de la crise de
National Bank of Rwanda (BNR), Republic o f Rwanda OCIR CafB. 2005, Republic o f Rwanda.
Nugawela, P, V. Bicali, and V. Ndagijimana. 2004 “Review and Assessment o f Micro- and Small-scale Enterprises in Rwanda, Background paper for the Country Economic Memorandum
Nkama, Arsene Honore Gideon. April 2005, Sources o f Growth and competitiveness in Rwanda,
Obidegwu, Chukwuma. 2003, “Rwanda: The Search for Post-Conflict Socio-Economic Change,
OCIR Tea. 2005, Republic o f Rwanda.
OECD. 2003a. ‘ICT and Economic Growth: Evidence from OECD Countries, Industries and
1’6nergie sur la croissance Bconomique au Rwanda, RBpublique du Rwanda
(Background paper for the Rwanda Country Economic Memorandum), World Bank.
1995-2001 .” Africa Region Working Papers Series, Number 59, World Bank.
Firms’. Organization for Economic Co-operation and Development.
OECD Development Centre (?). Providing Low-Cost Information Technology Access to Rural Communities in Developing Countries: What Works? What Pays? OECD Development Centre Working Paper No. 229.
On The FRONTIER, Rwanda National ICT Usage Survey, August 2003.
22 1
Peters, Marjolein and Huib Poot. November 2005, The role o f employment in Rwanda’s Poverty reduction strategy. Labour market, employment considerations, employment policy, ECORYS-NEI, Labour & Social Policy (Background paper for the Rwanda Country Economic Memorandum).
Recensement des activitks lucratives de la ville de Kigali, 2002 (incomplete).
Rutayisire, J. Musoni. Monetary Policy and demand for money in Rwanda: application o f co- integration techniques and the error-correction model (1980-2000), May 2004.
S. Eken, Abdourahmane Sarr, Jacques Bouhga-Hagbe and Jerome Vandenbussche, 2005. International Monetary Fund, Morocco Selected Issues, Country Report No. 05/419.
Scetauroute. 2002. Report on Roads. Prepared for the European Union. Paris.
Sekkat, Khalid and Aristomene Varoudakis. 1998. Exchange-rate management and manufactured exports in Sub-Saharan Africa, Working Paper No. 134, OECD Development Centre.
US. Census Bureau, Global Population Profile. 2002.
USAID. 2006, USAIDlRwanda Integrated Strategic Plan 2004-2009, Volume 1, January.
Tahari, Amor; Dhaneshwar Ghura; Bernardin Akitoby and Emmanuel Brou Aka. 2004 Sources o f Growth in Sub-Saharan Africa. International Monetary Fund WP/04/176.
Temesgen, Tilahun, Kene Ezemenari, Louis Munyakazi and Emmanuel Gatera “The Rwandan Industrial and Mining Survey (RIMS), 2005: Survey Report and Major Findings” The World Bank and National Institute o f Statistics o f Rwanda (NISR); October 2006.
TerraCom Communications: httdlwww.terracom.rwl.
The New Times, “Axis o f ICT Success’’ May 6,2006.
The Rwandan Industrial and Mining Survey (RIMS), 2005.
World Bank, 2002. World Bank Development Indicators V D I ) 2002, World Bank, Washington DC.
World Bank, 2003. Nigeria, Policy Options for Growth and Stability, By Douglas Addison, Report N0.262 15-NGA, Washington DC: The World Bank.
World Bank, 2004. Micro and Rural Finance in Ghana: Evolving Industry and Approaches to Regulation. Findings Newsletter number 234, January.
World Bank. 2005a. Rwanda Diagnostic Trade Integration Study, November
World Bank. 2005b, World Economic Indicators, World Bank: Washington, DC.
World Bank. 200.5~. Private Solutions for Inj?astructure in Rwanda, A country Framework Report, the Public-Private Infrastructure Advisory Facility and the World Bank Group.
World Bank. 2005. Study on Labor Market Policy in Rwanda Final report (Background paper for the Rwanda Country Economic Memorandum), November.
222
World Bank. 2006a. Rwanda Agricultural Policy Note, Rwanda Agricultural Markets Overview Background Study #2 March 3 1.
World Bank. 2006b. World Bank Development Indicators (WDg database, World Bank, Washington DC.
World Bank, 2007. Promoting Pro-Poor Agricultural Growth in Rwanda: Challenges and Opportunities. Report No. 39881 -R W. June. Sustainable Development (AFTS3), Country Department 2 (C2), Africa Region.
World Bank, Several Years. Doing Business Report, httd/www.doingbusiness.org.
WTO: Trade Policy Review Rwanda. Report by the Secretariat WT/TPR/S/129 13 April 2004.
Yongling, Zhong.2004. ‘Information Services in Rural China - Field Surveys and Findings’. Information Centre, Ministry o f Agriculture, People’s Republic o f China. RAP Publication 2004/03. Food and Agriculture Organization o f the United Nations Regional Office for Asia and the Pacific. Bangkok.
The African Growth and Opportunity Act: Achieving Success through the African Global Competitive Initiative”, June 2006, www.apoa.pov.
223

224

