experimental investigation on the seismic performance of steel-polypropylene hybrid fiber reinforced...
TRANSCRIPT

Construction and Building Materials 87 (2015) 16–27
Contents lists available at ScienceDirect
Construction and Building Materials
journal homepage: www.elsevier .com/locate /conbui ldmat
Experimental investigation on the seismic performanceof steel–polypropylene hybrid fiber reinforced concrete columns
http://dx.doi.org/10.1016/j.conbuildmat.2015.03.0730950-0618/� 2015 Elsevier Ltd. All rights reserved.
⇑ Corresponding author.
Le Huang a, Lihua Xu a,⇑, Yin Chi a, Haoran Xu b
a School of Civil Engineering, Wuhan University, 8 Dong Hu South Road, Wuhan 430072, Chinab No. 11 Bureau of China Railway Group Co., Ltd, Wuhan 430072, China
h i g h l i g h t s
� The effects of steel–polypropylene hybrid fiber on the seismic performance of reinforced concrete columns were investigated.� Favorable improvements in failure modes, bearing capacity and deformation capacity of HFRC specimens were observed.� Analytical predictions for evaluating the seismic bearing capacity of HFRC specimens were proposed.
a r t i c l e i n f o
Article history:Received 27 August 2014Received in revised form 16 February 2015Accepted 4 March 2015
Keywords:Seismic performanceSteel–polypropylene hybrid fiberReinforced concrete columnsFailure modeSynergetic effect
a b s t r a c t
Addition of fibers into cementitious composites has raised concern over decades, which enables con-siderable improvement in mechanical and dynamic properties of reinforced concrete (RC) members. Inthis paper, we present an experimental study on the seismic performance of steel–polypropylene hybridfiber reinforced concrete (HFRC) columns, which is of vital significance to postearthquake serviceabilityof structures. A total of 24 specimens subjected to combined constant axial load and cyclic lateral forcewere investigated. The main variables involve fiber type, shear span ratio, axial compression ratio, andreinforcement ratio (longitudinal and transverse). The failure modes, ultimate bearing capacity anddeformation capacity were analyzed. The experimental results showed that the presence of hybrid fibersin RC columns had positive influence on improving the seismic bearing capacity. The improvement ratiocould reach to 15–20% when a relative high axial compression was applied. Moreover, in comparison toRC columns, HFRC columns exhibited a notable synergetic effect in terms of ductility and energy dissipa-tion capacity, particularly for columns with a higher axial compression ratio. Subsequently, on the basisof principles of equilibrium and compatibility, analytical equations to estimate the seismic bendingmoment capacity and shearing force capacity were developed, which took into account the synergeticeffect of hybrid fibers. The analytical solutions were then validated by the test results, and the cor-relations were observed in reasonable accuracy.
� 2015 Elsevier Ltd. All rights reserved.
1. Introduction
Over the last few decades, numerous postearthquake inves-tigations [1,2] have confirmed that the goal of seismic-resistantdesign of reinforced concrete (RC) structures was not fully achievedin fact. In those earthquake stricken areas, most of the concrete col-umns were seriously damaged, and plastic hinges developed widelyat ends. This phenomenon was significantly associated with theinherent disadvantages of plain concrete material, i.e. the low ten-sile strength, toughness and its brittle nature [3,4].
To tackle this problem, the traditional method is to setclosely spaced transverse stirrups, which is able to improve the
confinement of concrete at those regions where plastic hingesmay possibly develop [5,6]. Well confined concrete can signifi-cantly restrain the opening and propagation of cracks, reducingthe strength degradation that consequently improve the seismicperformance of RC columns. However, a relatively large amountof transverse stirrups may result in congestion of reinforcement,as well as increase the difficulties in construction/manufacturing.This method not only raise the cost in both steel reinforcementmaterial and fabrication expense, but also requires additional closequality control thereupon.
To date, advances in concrete technology have led to thedevelopment of fiber reinforced concrete (FRC) materials, whichis commonly acknowledged as an alternative reinforcementsolution. FRC demonstrates excellent tensile strength, toughness,
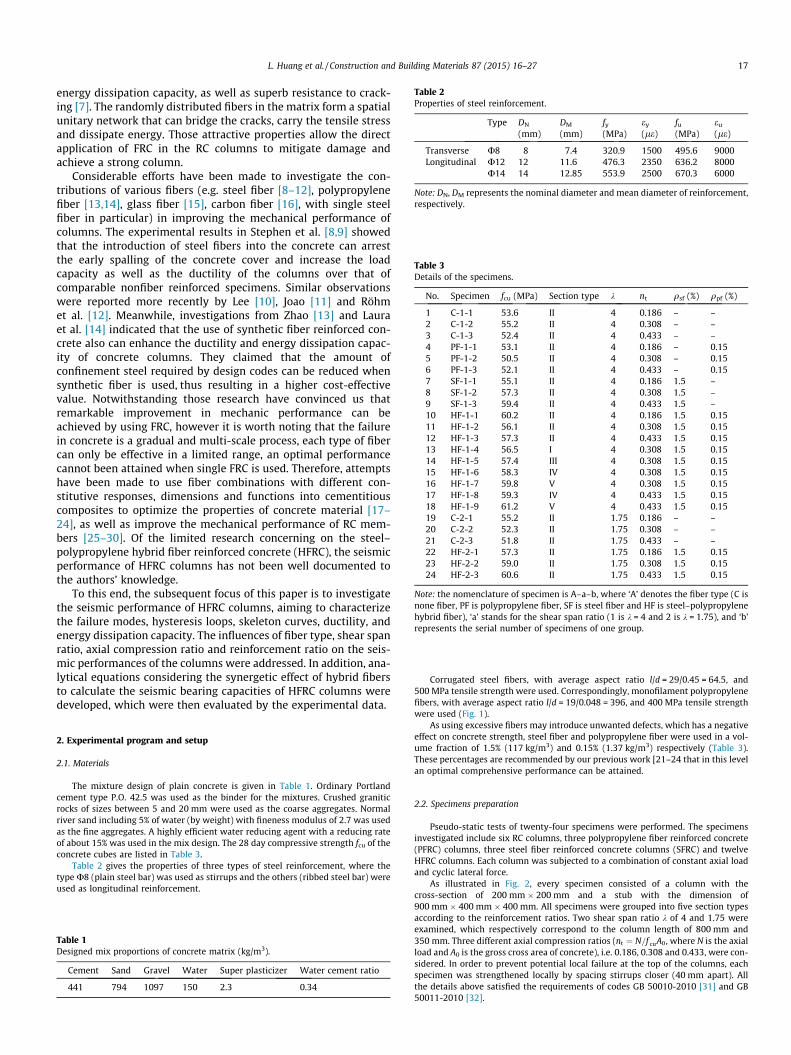
Table 2Properties of steel reinforcement.
Type DN
(mm)DM
(mm)fy
(MPa)ey
(le)fu
(MPa)eu
(le)
Transverse U8 8 7.4 320.9 1500 495.6 9000Longitudinal U12 12 11.6 476.3 2350 636.2 8000
U14 14 12.85 553.9 2500 670.3 6000
Note: DN, DM represents the nominal diameter and mean diameter of reinforcement,respectively.
Table 3Details of the specimens.
No. Specimen fcu (MPa) Section type k nt qsf (%) qpf (%)
1 C-1-1 53.6 II 4 0.186 – –2 C-1-2 55.2 II 4 0.308 – –3 C-1-3 52.4 II 4 0.433 – –4 PF-1-1 53.1 II 4 0.186 – 0.155 PF-1-2 50.5 II 4 0.308 – 0.156 PF-1-3 52.1 II 4 0.433 – 0.157 SF-1-1 55.1 II 4 0.186 1.5 –8 SF-1-2 57.3 II 4 0.308 1.5 –9 SF-1-3 59.4 II 4 0.433 1.5 –10 HF-1-1 60.2 II 4 0.186 1.5 0.1511 HF-1-2 56.1 II 4 0.308 1.5 0.1512 HF-1-3 57.3 II 4 0.433 1.5 0.1513 HF-1-4 56.5 I 4 0.308 1.5 0.1514 HF-1-5 57.4 III 4 0.308 1.5 0.1515 HF-1-6 58.3 IV 4 0.308 1.5 0.1516 HF-1-7 59.8 V 4 0.308 1.5 0.1517 HF-1-8 59.3 IV 4 0.433 1.5 0.1518 HF-1-9 61.2 V 4 0.433 1.5 0.1519 C-2-1 55.2 II 1.75 0.186 – –20 C-2-2 52.3 II 1.75 0.308 – –21 C-2-3 51.8 II 1.75 0.433 – –22 HF-2-1 57.3 II 1.75 0.186 1.5 0.1523 HF-2-2 59.0 II 1.75 0.308 1.5 0.1524 HF-2-3 60.6 II 1.75 0.433 1.5 0.15
Note: the nomenclature of specimen is A–a–b, where ‘A’ denotes the fiber type (C isnone fiber, PF is polypropylene fiber, SF is steel fiber and HF is steel–polypropylenehybrid fiber), ‘a’ stands for the shear span ratio (1 is k = 4 and 2 is k = 1.75), and ‘b’represents the serial number of specimens of one group.
L. Huang et al. / Construction and Building Materials 87 (2015) 16–27 17
energy dissipation capacity, as well as superb resistance to crack-ing [7]. The randomly distributed fibers in the matrix form a spatialunitary network that can bridge the cracks, carry the tensile stressand dissipate energy. Those attractive properties allow the directapplication of FRC in the RC columns to mitigate damage andachieve a strong column.
Considerable efforts have been made to investigate the con-tributions of various fibers (e.g. steel fiber [8–12], polypropylenefiber [13,14], glass fiber [15], carbon fiber [16], with single steelfiber in particular) in improving the mechanical performance ofcolumns. The experimental results in Stephen et al. [8,9] showedthat the introduction of steel fibers into the concrete can arrestthe early spalling of the concrete cover and increase the loadcapacity as well as the ductility of the columns over that ofcomparable nonfiber reinforced specimens. Similar observationswere reported more recently by Lee [10], Joao [11] and Röhmet al. [12]. Meanwhile, investigations from Zhao [13] and Lauraet al. [14] indicated that the use of synthetic fiber reinforced con-crete also can enhance the ductility and energy dissipation capac-ity of concrete columns. They claimed that the amount ofconfinement steel required by design codes can be reduced whensynthetic fiber is used, thus resulting in a higher cost-effectivevalue. Notwithstanding those research have convinced us thatremarkable improvement in mechanic performance can beachieved by using FRC, however it is worth noting that the failurein concrete is a gradual and multi-scale process, each type of fibercan only be effective in a limited range, an optimal performancecannot been attained when single FRC is used. Therefore, attemptshave been made to use fiber combinations with different con-stitutive responses, dimensions and functions into cementitiouscomposites to optimize the properties of concrete material [17–24], as well as improve the mechanical performance of RC mem-bers [25–30]. Of the limited research concerning on the steel–polypropylene hybrid fiber reinforced concrete (HFRC), the seismicperformance of HFRC columns has not been well documented tothe authors’ knowledge.
To this end, the subsequent focus of this paper is to investigatethe seismic performance of HFRC columns, aiming to characterizethe failure modes, hysteresis loops, skeleton curves, ductility, andenergy dissipation capacity. The influences of fiber type, shear spanratio, axial compression ratio and reinforcement ratio on the seis-mic performances of the columns were addressed. In addition, ana-lytical equations considering the synergetic effect of hybrid fibersto calculate the seismic bearing capacities of HFRC columns weredeveloped, which were then evaluated by the experimental data.
2. Experimental program and setup
2.1. Materials
The mixture design of plain concrete is given in Table 1. Ordinary Portlandcement type P.O. 42.5 was used as the binder for the mixtures. Crushed graniticrocks of sizes between 5 and 20 mm were used as the coarse aggregates. Normalriver sand including 5% of water (by weight) with fineness modulus of 2.7 was usedas the fine aggregates. A highly efficient water reducing agent with a reducing rateof about 15% was used in the mix design. The 28 day compressive strength fcu of theconcrete cubes are listed in Table 3.
Table 2 gives the properties of three types of steel reinforcement, where thetype U8 (plain steel bar) was used as stirrups and the others (ribbed steel bar) wereused as longitudinal reinforcement.
Table 1Designed mix proportions of concrete matrix (kg/m3).
Cement Sand Gravel Water Super plasticizer Water cement ratio
441 794 1097 150 2.3 0.34
Corrugated steel fibers, with average aspect ratio l/d = 29/0.45 = 64.5, and500 MPa tensile strength were used. Correspondingly, monofilament polypropylenefibers, with average aspect ratio l/d = 19/0.048 = 396, and 400 MPa tensile strengthwere used (Fig. 1).
As using excessive fibers may introduce unwanted defects, which has a negativeeffect on concrete strength, steel fiber and polypropylene fiber were used in a vol-ume fraction of 1.5% (117 kg/m3) and 0.15% (1.37 kg/m3) respectively (Table 3).These percentages are recommended by our previous work [21–24 that in this levelan optimal comprehensive performance can be attained.
2.2. Specimens preparation
Pseudo-static tests of twenty-four specimens were performed. The specimensinvestigated include six RC columns, three polypropylene fiber reinforced concrete(PFRC) columns, three steel fiber reinforced concrete columns (SFRC) and twelveHFRC columns. Each column was subjected to a combination of constant axial loadand cyclic lateral force.
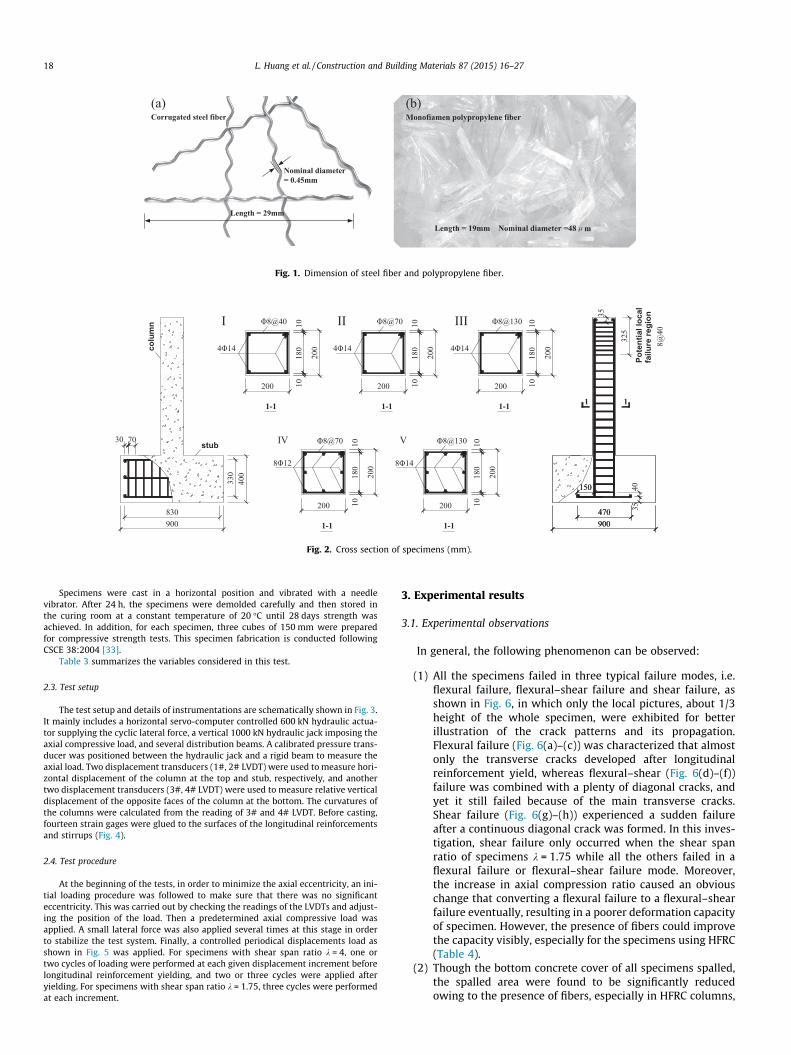
As illustrated in Fig. 2, every specimen consisted of a column with thecross-section of 200 mm � 200 mm and a stub with the dimension of900 mm � 400 mm � 400 mm. All specimens were grouped into five section typesaccording to the reinforcement ratios. Two shear span ratio k of 4 and 1.75 wereexamined, which respectively correspond to the column length of 800 mm and350 mm. Three different axial compression ratios (nt ¼ N=f cuA0, where N is the axialload and A0 is the gross cross area of concrete), i.e. 0.186, 0.308 and 0.433, were con-sidered. In order to prevent potential local failure at the top of the columns, eachspecimen was strengthened locally by spacing stirrups closer (40 mm apart). Allthe details above satisfied the requirements of codes GB 50010-2010 [31] and GB50011-2010 [32].
Length = 29mm
Nominal diameter= 0.45mm
(a)Corrugated steel fiber
(b)Monofiamen polypropylene fiber
Length = 19mm Nominal diameter =48
Fig. 1. Dimension of steel fiber and polypropylene fiber.
8@40
900830
400
330
30 70
900470
11
150
35
325
200
180
200
1010
4Φ14
200
180
200
1010
200
180
200
1010
200
180
200
1010
200
180
200
1010
900470
150
3540
Φ8@40
1-1
I II III
IV V
1-11-1
1-1 1-1
4Φ14
Φ8@70
4Φ14
Φ8@130
8Φ12
Φ8@70
8Φ14
Φ8@130
colu
mn
Pote
ntia
l loc
alfa
ilure
regi
on
stub
Fig. 2. Cross section of specimens (mm).
18 L. Huang et al. / Construction and Building Materials 87 (2015) 16–27
Specimens were cast in a horizontal position and vibrated with a needlevibrator. After 24 h, the specimens were demolded carefully and then stored inthe curing room at a constant temperature of 20 �C until 28 days strength wasachieved. In addition, for each specimen, three cubes of 150 mm were preparedfor compressive strength tests. This specimen fabrication is conducted followingCSCE 38:2004 [33].
Table 3 summarizes the variables considered in this test.
2.3. Test setup
The test setup and details of instrumentations are schematically shown in Fig. 3.It mainly includes a horizontal servo-computer controlled 600 kN hydraulic actua-tor supplying the cyclic lateral force, a vertical 1000 kN hydraulic jack imposing theaxial compressive load, and several distribution beams. A calibrated pressure trans-ducer was positioned between the hydraulic jack and a rigid beam to measure theaxial load. Two displacement transducers (1#, 2# LVDT) were used to measure hori-zontal displacement of the column at the top and stub, respectively, and anothertwo displacement transducers (3#, 4# LVDT) were used to measure relative verticaldisplacement of the opposite faces of the column at the bottom. The curvatures ofthe columns were calculated from the reading of 3# and 4# LVDT. Before casting,fourteen strain gages were glued to the surfaces of the longitudinal reinforcementsand stirrups (Fig. 4).
2.4. Test procedure
At the beginning of the tests, in order to minimize the axial eccentricity, an ini-tial loading procedure was followed to make sure that there was no significanteccentricity. This was carried out by checking the readings of the LVDTs and adjust-ing the position of the load. Then a predetermined axial compressive load wasapplied. A small lateral force was also applied several times at this stage in orderto stabilize the test system. Finally, a controlled periodical displacements load asshown in Fig. 5 was applied. For specimens with shear span ratio k = 4, one ortwo cycles of loading were performed at each given displacement increment beforelongitudinal reinforcement yielding, and two or three cycles were applied afteryielding. For specimens with shear span ratio k = 1.75, three cycles were performedat each increment.
3. Experimental results
3.1. Experimental observations
In general, the following phenomenon can be observed:
(1) All the specimens failed in three typical failure modes, i.e.flexural failure, flexural–shear failure and shear failure, asshown in Fig. 6, in which only the local pictures, about 1/3height of the whole specimen, were exhibited for betterillustration of the crack patterns and its propagation.Flexural failure (Fig. 6(a)–(c)) was characterized that almostonly the transverse cracks developed after longitudinalreinforcement yield, whereas flexural–shear (Fig. 6(d)–(f))failure was combined with a plenty of diagonal cracks, andyet it still failed because of the main transverse cracks.Shear failure (Fig. 6(g)–(h)) experienced a sudden failureafter a continuous diagonal crack was formed. In this inves-tigation, shear failure only occurred when the shear spanratio of specimens k = 1.75 while all the others failed in aflexural failure or flexural–shear failure mode. Moreover,the increase in axial compression ratio caused an obviouschange that converting a flexural failure to a flexural–shearfailure eventually, resulting in a poorer deformation capacityof specimen. However, the presence of fibers could improvethe capacity visibly, especially for the specimens using HFRC(Table 4).
(2) Though the bottom concrete cover of all specimens spalled,the spalled area were found to be significantly reducedowing to the presence of fibers, especially in HFRC columns,
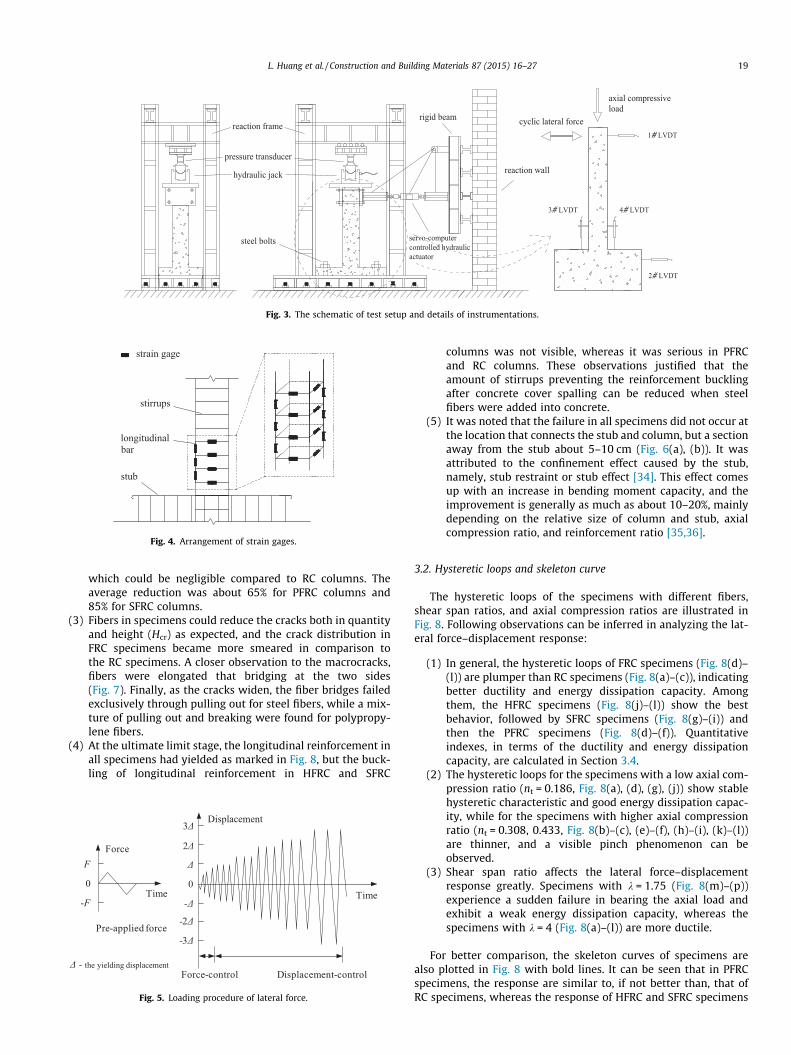
pressure transducer
hydraulic jack
rigid beam
servo-computercontrolled hydraulicactuator
1# LVDT
2# LVDT
3# LVDT 4# LVDT
cyclic lateral force
axial compressiveload
reaction wall
reaction frame
steel bolts
Fig. 3. The schematic of test setup and details of instrumentations.
strain gage
longitudinalbar
stirrups
stub
Fig. 4. Arrangement of strain gages.
L. Huang et al. / Construction and Building Materials 87 (2015) 16–27 19
which could be negligible compared to RC columns. Theaverage reduction was about 65% for PFRC columns and85% for SFRC columns.
(3) Fibers in specimens could reduce the cracks both in quantityand height (Hcr) as expected, and the crack distribution inFRC specimens became more smeared in comparison tothe RC specimens. A closer observation to the macrocracks,fibers were elongated that bridging at the two sides(Fig. 7). Finally, as the cracks widen, the fiber bridges failedexclusively through pulling out for steel fibers, while a mix-ture of pulling out and breaking were found for polypropy-lene fibers.
(4) At the ultimate limit stage, the longitudinal reinforcement inall specimens had yielded as marked in Fig. 8, but the buck-ling of longitudinal reinforcement in HFRC and SFRC
Displacement
Force
Pre-applied force
Force-control Displacement-control
Time Time
F
-F
Δ
2Δ
3Δ
-Δ
-2Δ
-3Δ
00
Δ - the yielding displacement
Fig. 5. Loading procedure of lateral force.
columns was not visible, whereas it was serious in PFRCand RC columns. These observations justified that theamount of stirrups preventing the reinforcement bucklingafter concrete cover spalling can be reduced when steelfibers were added into concrete.
(5) It was noted that the failure in all specimens did not occur atthe location that connects the stub and column, but a sectionaway from the stub about 5–10 cm (Fig. 6(a), (b)). It wasattributed to the confinement effect caused by the stub,namely, stub restraint or stub effect [34]. This effect comesup with an increase in bending moment capacity, and theimprovement is generally as much as about 10–20%, mainlydepending on the relative size of column and stub, axialcompression ratio, and reinforcement ratio [35,36].
3.2. Hysteretic loops and skeleton curve
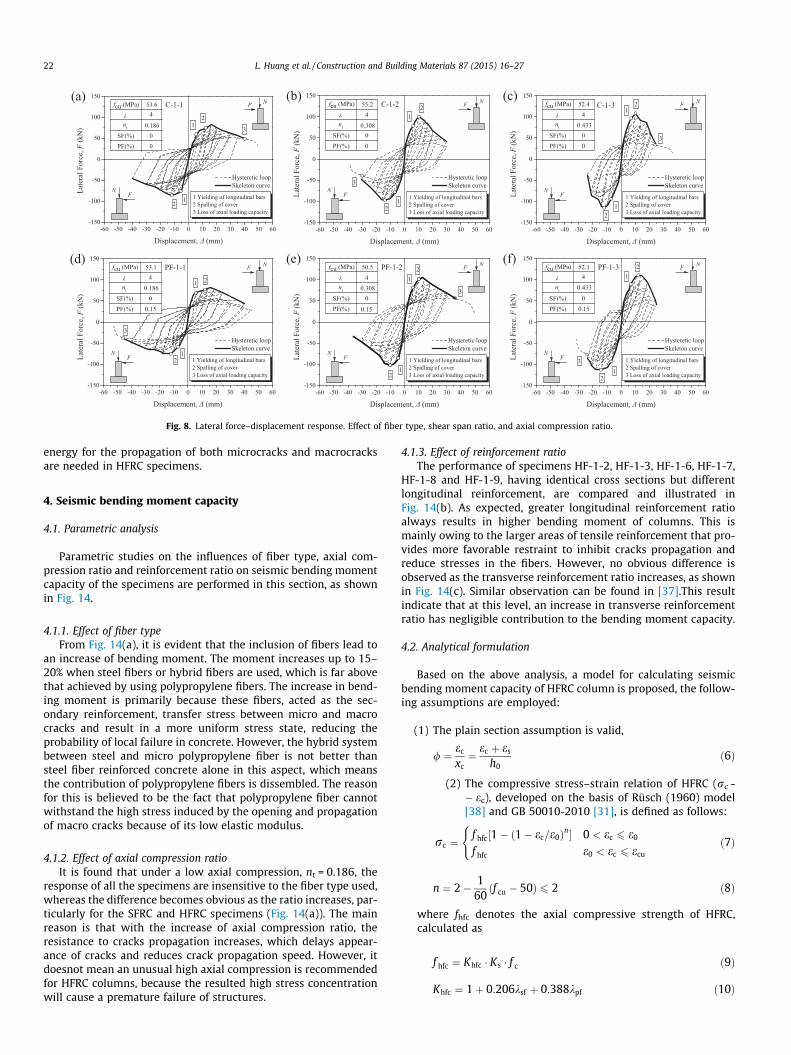
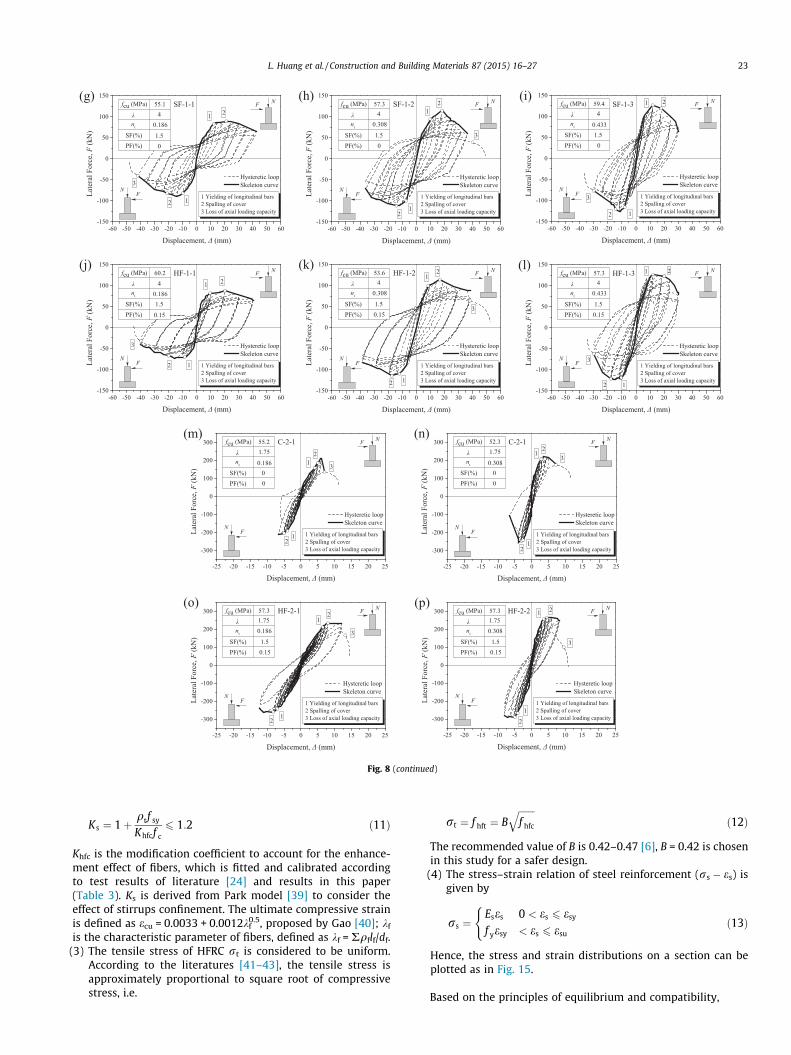
The hysteretic loops of the specimens with different fibers,shear span ratios, and axial compression ratios are illustrated inFig. 8. Following observations can be inferred in analyzing the lat-eral force–displacement response:
(1) In general, the hysteretic loops of FRC specimens (Fig. 8(d)–(l)) are plumper than RC specimens (Fig. 8(a)–(c)), indicatingbetter ductility and energy dissipation capacity. Amongthem, the HFRC specimens (Fig. 8(j)–(l)) show the bestbehavior, followed by SFRC specimens (Fig. 8(g)–(i)) andthen the PFRC specimens (Fig. 8(d)–(f)). Quantitativeindexes, in terms of the ductility and energy dissipationcapacity, are calculated in Section 3.4.
(2) The hysteretic loops for the specimens with a low axial com-pression ratio (nt = 0.186, Fig. 8(a), (d), (g), (j)) show stablehysteretic characteristic and good energy dissipation capac-ity, while for the specimens with higher axial compressionratio (nt = 0.308, 0.433, Fig. 8(b)–(c), (e)–(f), (h)–(i), (k)–(l))are thinner, and a visible pinch phenomenon can beobserved.
(3) Shear span ratio affects the lateral force–displacementresponse greatly. Specimens with k = 1.75 (Fig. 8(m)–(p))experience a sudden failure in bearing the axial load andexhibit a weak energy dissipation capacity, whereas thespecimens with k = 4 (Fig. 8(a)–(l)) are more ductile.
For better comparison, the skeleton curves of specimens arealso plotted in Fig. 8 with bold lines. It can be seen that in PFRCspecimens, the response are similar to, if not better than, that ofRC specimens, whereas the response of HFRC and SFRC specimens
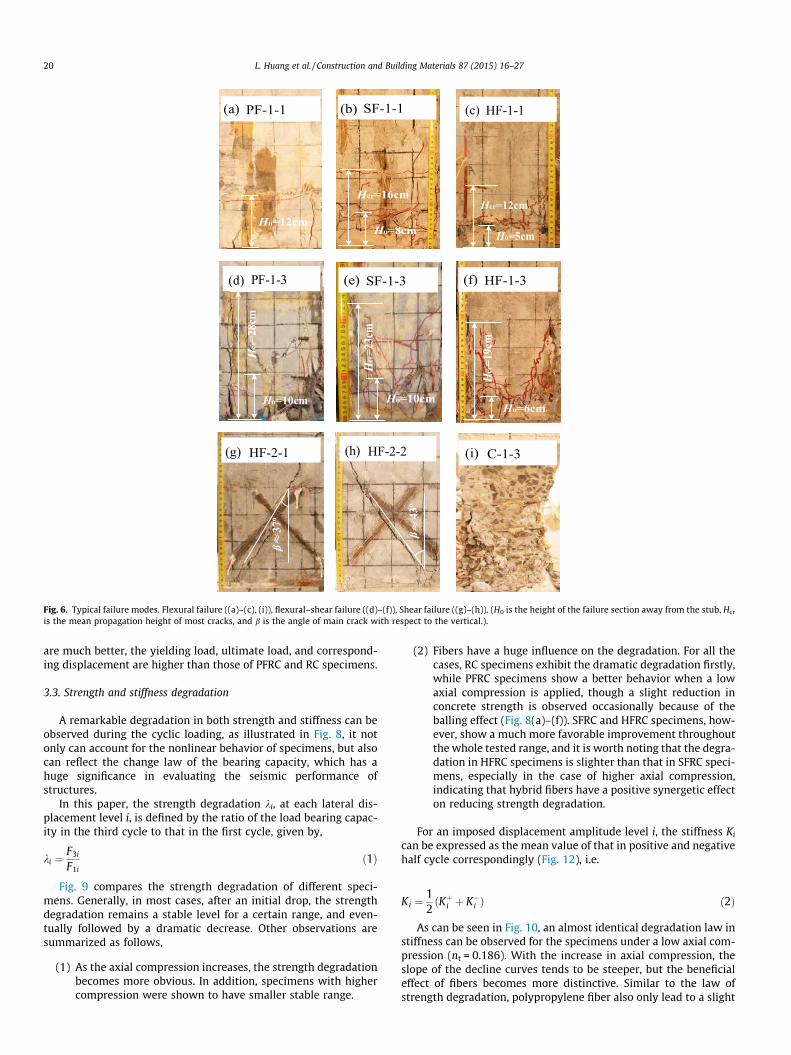
Fig. 6. Typical failure modes. Flexural failure ((a)–(c), (i)), flexural–shear failure ((d)–(f)), Shear failure ((g)–(h)). (H0 is the height of the failure section away from the stub, Hcr
is the mean propagation height of most cracks, and b is the angle of main crack with respect to the vertical.).
20 L. Huang et al. / Construction and Building Materials 87 (2015) 16–27
are much better, the yielding load, ultimate load, and correspond-ing displacement are higher than those of PFRC and RC specimens.
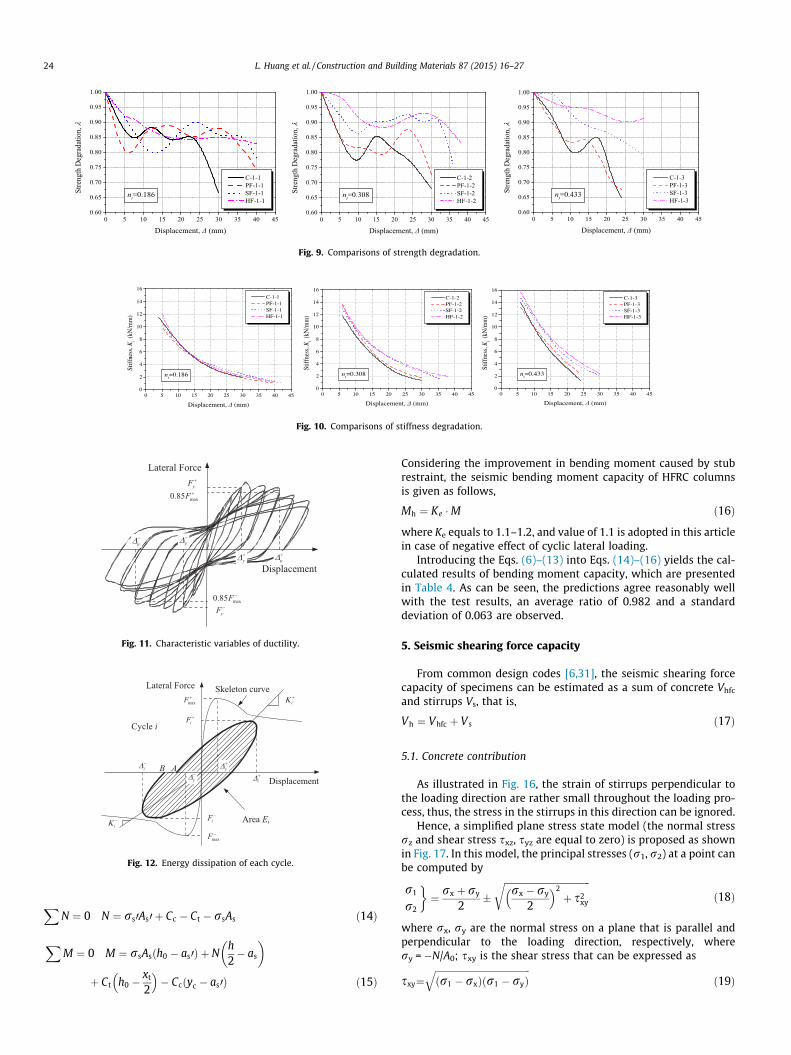
3.3. Strength and stiffness degradation
A remarkable degradation in both strength and stiffness can beobserved during the cyclic loading, as illustrated in Fig. 8, it notonly can account for the nonlinear behavior of specimens, but alsocan reflect the change law of the bearing capacity, which has ahuge significance in evaluating the seismic performance ofstructures.
In this paper, the strength degradation ki, at each lateral dis-placement level i, is defined by the ratio of the load bearing capac-ity in the third cycle to that in the first cycle, given by,
ki ¼F3i
F1ið1Þ
Fig. 9 compares the strength degradation of different speci-mens. Generally, in most cases, after an initial drop, the strengthdegradation remains a stable level for a certain range, and even-tually followed by a dramatic decrease. Other observations aresummarized as follows,
(1) As the axial compression increases, the strength degradationbecomes more obvious. In addition, specimens with highercompression were shown to have smaller stable range.
(2) Fibers have a huge influence on the degradation. For all thecases, RC specimens exhibit the dramatic degradation firstly,while PFRC specimens show a better behavior when a lowaxial compression is applied, though a slight reduction inconcrete strength is observed occasionally because of theballing effect (Fig. 8(a)–(f)). SFRC and HFRC specimens, how-ever, show a much more favorable improvement throughoutthe whole tested range, and it is worth noting that the degra-dation in HFRC specimens is slighter than that in SFRC speci-mens, especially in the case of higher axial compression,indicating that hybrid fibers have a positive synergetic effecton reducing strength degradation.
For an imposed displacement amplitude level i, the stiffness Ki
can be expressed as the mean value of that in positive and negativehalf cycle correspondingly (Fig. 12), i.e.
Ki ¼12ðKþi þ K�i Þ ð2Þ
As can be seen in Fig. 10, an almost identical degradation law instiffness can be observed for the specimens under a low axial com-pression (nt = 0.186). With the increase in axial compression, theslope of the decline curves tends to be steeper, but the beneficialeffect of fibers becomes more distinctive. Similar to the law ofstrength degradation, polypropylene fiber also only lead to a slight
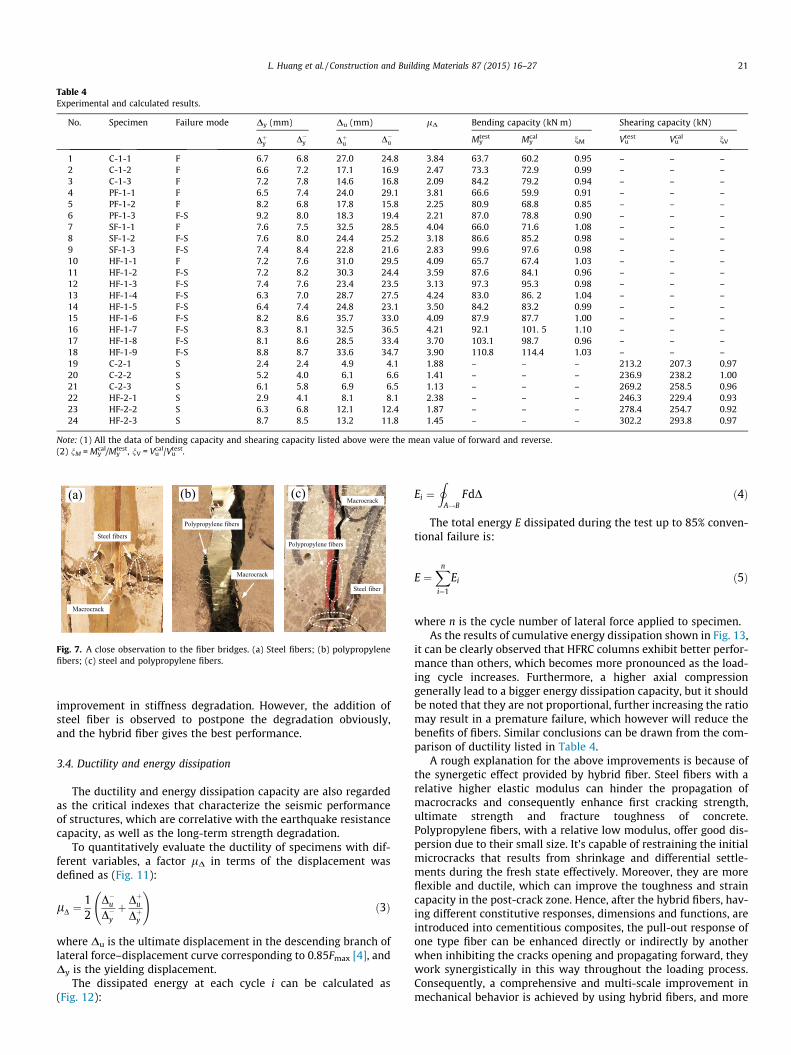
Table 4Experimental and calculated results.
No. Specimen Failure mode Dy (mm) Du (mm) lD Bending capacity (kN m) Shearing capacity (kN)
Dþy D�y Dþu D�u Mytest My
cal nM Vutest Vu
cal nV
1 C-1-1 F 6.7 6.8 27.0 24.8 3.84 63.7 60.2 0.95 – – –2 C-1-2 F 6.6 7.2 17.1 16.9 2.47 73.3 72.9 0.99 – – –3 C-1-3 F 7.2 7.8 14.6 16.8 2.09 84.2 79.2 0.94 – – –4 PF-1-1 F 6.5 7.4 24.0 29.1 3.81 66.6 59.9 0.91 – – –5 PF-1-2 F 8.2 6.8 17.8 15.8 2.25 80.9 68.8 0.85 – – –6 PF-1-3 F-S 9.2 8.0 18.3 19.4 2.21 87.0 78.8 0.90 – – –7 SF-1-1 F 7.6 7.5 32.5 28.5 4.04 66.0 71.6 1.08 – – –8 SF-1-2 F-S 7.6 8.0 24.4 25.2 3.18 86.6 85.2 0.98 – – –9 SF-1-3 F-S 7.4 8.4 22.8 21.6 2.83 99.6 97.6 0.98 – – –10 HF-1-1 F 7.2 7.6 31.0 29.5 4.09 65.7 67.4 1.03 – – –11 HF-1-2 F-S 7.2 8.2 30.3 24.4 3.59 87.6 84.1 0.96 – – –12 HF-1-3 F-S 7.4 7.6 23.4 23.5 3.13 97.3 95.3 0.98 – – –13 HF-1-4 F-S 6.3 7.0 28.7 27.5 4.24 83.0 86. 2 1.04 – – –14 HF-1-5 F-S 6.4 7.4 24.8 23.1 3.50 84.2 83.2 0.99 – – –15 HF-1-6 F-S 8.2 8.6 35.7 33.0 4.09 87.9 87.7 1.00 – – –16 HF-1-7 F-S 8.3 8.1 32.5 36.5 4.21 92.1 101. 5 1.10 – – –17 HF-1-8 F-S 8.1 8.6 28.5 33.4 3.70 103.1 98.7 0.96 – – –18 HF-1-9 F-S 8.8 8.7 33.6 34.7 3.90 110.8 114.4 1.03 – – –19 C-2-1 S 2.4 2.4 4.9 4.1 1.88 – – – 213.2 207.3 0.9720 C-2-2 S 5.2 4.0 6.1 6.6 1.41 – – – 236.9 238.2 1.0021 C-2-3 S 6.1 5.8 6.9 6.5 1.13 – – – 269.2 258.5 0.9622 HF-2-1 S 2.9 4.1 8.1 8.1 2.38 – – – 246.3 229.4 0.9323 HF-2-2 S 6.3 6.8 12.1 12.4 1.87 – – – 278.4 254.7 0.9224 HF-2-3 S 8.7 8.5 13.2 11.8 1.45 – – – 302.2 293.8 0.97
Note: (1) All the data of bending capacity and shearing capacity listed above were the mean value of forward and reverse.(2) nM = My
cal/Mytest, nV = Vu
cal/Vutest.
Steel fibers
Macrocrack
(a)
Polypropylene fibers
Macrocrack
(b)
Steel fiber
Polypropylene fibers
Macrocrack(c)
Fig. 7. A close observation to the fiber bridges. (a) Steel fibers; (b) polypropylenefibers; (c) steel and polypropylene fibers.
L. Huang et al. / Construction and Building Materials 87 (2015) 16–27 21
improvement in stiffness degradation. However, the addition ofsteel fiber is observed to postpone the degradation obviously,and the hybrid fiber gives the best performance.
3.4. Ductility and energy dissipation
The ductility and energy dissipation capacity are also regardedas the critical indexes that characterize the seismic performanceof structures, which are correlative with the earthquake resistancecapacity, as well as the long-term strength degradation.
To quantitatively evaluate the ductility of specimens with dif-ferent variables, a factor lD in terms of the displacement wasdefined as (Fig. 11):
lD ¼12
D�uD�yþ Dþu
Dþy
!ð3Þ
where Du is the ultimate displacement in the descending branch oflateral force–displacement curve corresponding to 0.85Fmax [4], andDy is the yielding displacement.
The dissipated energy at each cycle i can be calculated as(Fig. 12):
Ei ¼I
A!BFdD ð4Þ
The total energy E dissipated during the test up to 85% conven-tional failure is:
E ¼Xn
i¼1
Ei ð5Þ
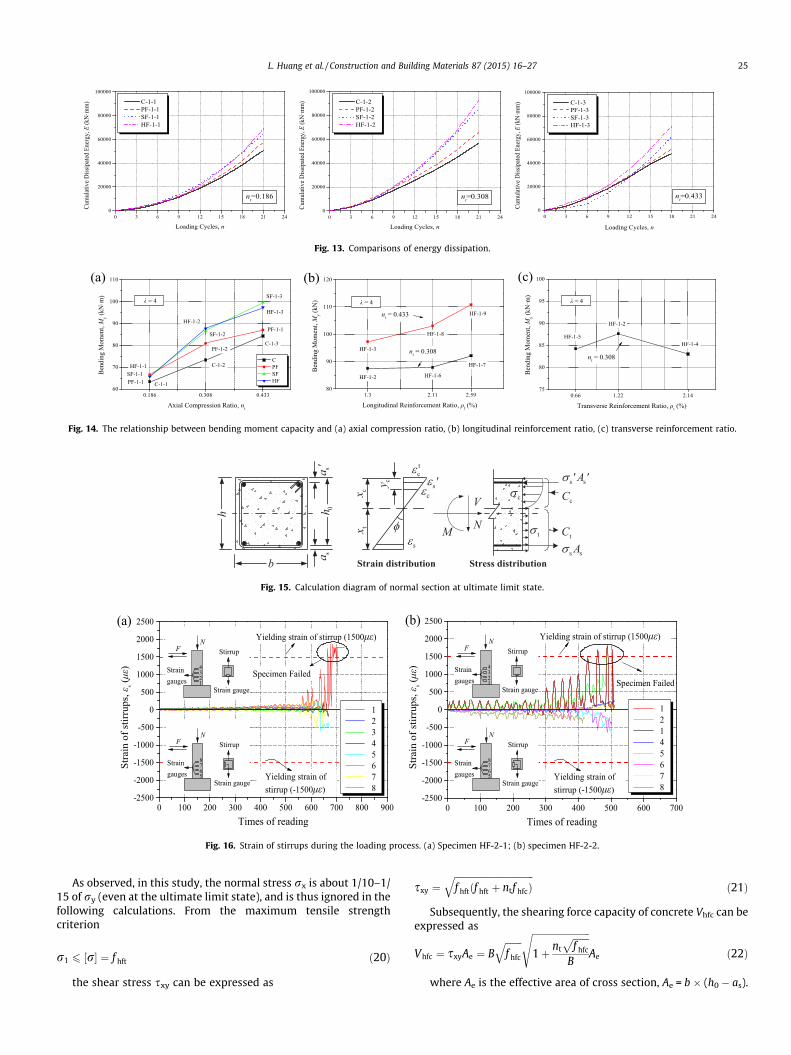
where n is the cycle number of lateral force applied to specimen.As the results of cumulative energy dissipation shown in Fig. 13,
it can be clearly observed that HFRC columns exhibit better perfor-mance than others, which becomes more pronounced as the load-ing cycle increases. Furthermore, a higher axial compressiongenerally lead to a bigger energy dissipation capacity, but it shouldbe noted that they are not proportional, further increasing the ratiomay result in a premature failure, which however will reduce thebenefits of fibers. Similar conclusions can be drawn from the com-parison of ductility listed in Table 4.
A rough explanation for the above improvements is because ofthe synergetic effect provided by hybrid fiber. Steel fibers with arelative higher elastic modulus can hinder the propagation ofmacrocracks and consequently enhance first cracking strength,ultimate strength and fracture toughness of concrete.Polypropylene fibers, with a relative low modulus, offer good dis-persion due to their small size. It’s capable of restraining the initialmicrocracks that results from shrinkage and differential settle-ments during the fresh state effectively. Moreover, they are moreflexible and ductile, which can improve the toughness and straincapacity in the post-crack zone. Hence, after the hybrid fibers, hav-ing different constitutive responses, dimensions and functions, areintroduced into cementitious composites, the pull-out response ofone type fiber can be enhanced directly or indirectly by anotherwhen inhibiting the cracks opening and propagating forward, theywork synergistically in this way throughout the loading process.Consequently, a comprehensive and multi-scale improvement inmechanical behavior is achieved by using hybrid fibers, and more
-60 -50 -40 -30 -20 -10 0 10 20 30 40 50 60-150
-100
-50
0
50
100
150C-1-1
F1
2
3
2
Late
ral F
orce
, F (k
N)
Displacement, Δ (mm)
Hysteretic loop Skeleton curve
1 Yielding of longitudinal bars2 Spalling of cover3 Loss of axial loading capacity
00
453.6
PF(%)
fcu (MPa)
λnt 0.186
SF(%)
1
N
F N(a)
-60 -50 -40 -30 -20 -10 0 10 20 30 40 50 60-150
-100
-50
0
50
100
150C-1-2
(b)
00
455.2
PF(%)
fcu (MPa)
λnt 0.308
SF(%)
F N
12
Hysteretic loop Skeleton curve
1 Yielding of longitudinal bars2 Spalling of cover3 Loss of axial loading capacity
12
3N
F
Displacement, Δ (mm)
Late
ral F
orce
, F (k
N)
-60 -50 -40 -30 -20 -10 0 10 20 30 40 50 60-150
-100
-50
0
50
100
150C-1-3
(c)
00
452.4
PF(%)
fcu (MPa)
λnt 0.433
SF(%)
F N1
2
3
Hysteretic loop Skeleton curve
1 Yielding of longitudinal bars2 Spalling of cover3 Loss of axial loading capacity
12
NF
Displacement, Δ (mm)
Late
ral F
orce
, F (k
N)
-60 -50 -40 -30 -20 -10 0 10 20 30 40 50 60-150
-100
-50
0
50
100
150PF-1-1
(d)
0.150
453.1
PF(%)
fcu (MPa)
λnt 0.186
SF(%)
F N
1 2
Hysteretic loop Skeleton curve
1 Yielding of longitudinal bars2 Spalling of cover3 Loss of axial loading capacity
12
3
NF
Displacement, Δ (mm)
Late
ral F
orce
, F (k
N)
-60 -50 -40 -30 -20 -10 0 10 20 30 40 50 60-150
-100
-50
0
50
100
150PF-1-2
(e)
0.15
0
450.5
PF(%)
fcu (MPa)
λnt 0.308
SF(%)
F N
12
3
Hysteretic loop Skeleton curve
1 Yielding of longitudinal bars2 Spalling of cover3 Loss of axial loading capacity
12
NF
Displacement, Δ (mm)
Late
ral F
orce
, F (k
N)
-60 -50 -40 -30 -20 -10 0 10 20 30 40 50 60-150
-100
-50
0
50
100
150PF-1-3
(f)
0.150
452.1
PF(%)
fcu (MPa)
λnt 0.433
SF(%)
F N
12
Hysteretic loop Skeleton curve
1 Yielding of longitudinal bars2 Spalling of cover3 Loss of axial loading capacity1
2
3N
F
Displacement, Δ (mm)
Late
ral F
orce
, F (k
N)
Fig. 8. Lateral force–displacement response. Effect of fiber type, shear span ratio, and axial compression ratio.
22 L. Huang et al. / Construction and Building Materials 87 (2015) 16–27
energy for the propagation of both microcracks and macrocracksare needed in HFRC specimens.
4. Seismic bending moment capacity
4.1. Parametric analysis
Parametric studies on the influences of fiber type, axial com-pression ratio and reinforcement ratio on seismic bending momentcapacity of the specimens are performed in this section, as shownin Fig. 14.
4.1.1. Effect of fiber typeFrom Fig. 14(a), it is evident that the inclusion of fibers lead to
an increase of bending moment. The moment increases up to 15–20% when steel fibers or hybrid fibers are used, which is far abovethat achieved by using polypropylene fibers. The increase in bend-ing moment is primarily because these fibers, acted as the sec-ondary reinforcement, transfer stress between micro and macrocracks and result in a more uniform stress state, reducing theprobability of local failure in concrete. However, the hybrid systembetween steel and micro polypropylene fiber is not better thansteel fiber reinforced concrete alone in this aspect, which meansthe contribution of polypropylene fibers is dissembled. The reasonfor this is believed to be the fact that polypropylene fiber cannotwithstand the high stress induced by the opening and propagationof macro cracks because of its low elastic modulus.
4.1.2. Effect of axial compression ratioIt is found that under a low axial compression, nt = 0.186, the
response of all the specimens are insensitive to the fiber type used,whereas the difference becomes obvious as the ratio increases, par-ticularly for the SFRC and HFRC specimens (Fig. 14(a)). The mainreason is that with the increase of axial compression ratio, theresistance to cracks propagation increases, which delays appear-ance of cracks and reduces crack propagation speed. However, itdoesnot mean an unusual high axial compression is recommendedfor HFRC columns, because the resulted high stress concentrationwill cause a premature failure of structures.
4.1.3. Effect of reinforcement ratioThe performance of specimens HF-1-2, HF-1-3, HF-1-6, HF-1-7,
HF-1-8 and HF-1-9, having identical cross sections but differentlongitudinal reinforcement, are compared and illustrated inFig. 14(b). As expected, greater longitudinal reinforcement ratioalways results in higher bending moment of columns. This ismainly owing to the larger areas of tensile reinforcement that pro-vides more favorable restraint to inhibit cracks propagation andreduce stresses in the fibers. However, no obvious difference isobserved as the transverse reinforcement ratio increases, as shownin Fig. 14(c). Similar observation can be found in [37].This resultindicate that at this level, an increase in transverse reinforcementratio has negligible contribution to the bending moment capacity.
4.2. Analytical formulation
Based on the above analysis, a model for calculating seismicbending moment capacity of HFRC column is proposed, the follow-ing assumptions are employed:
(1) The plain section assumption is valid,
/ ¼ ec
xc¼ ec þ es
h0ð6Þ
(2) The compressive stress–strain relation of HFRC (rc -� ec), developed on the basis of Rüsch (1960) model[38] and GB 50010-2010 [31], is defined as follows:
rc ¼f hfc½1� ð1� ec=e0Þn� 0 < ec 6 e0
f hfc e0 < ec 6 ecu
(ð7Þ
n ¼ 2� 160ðf cu � 50Þ 6 2 ð8Þ
where fhfc denotes the axial compressive strength of HFRC,calculated as
f hfc ¼ Khfc � Ks � f c ð9Þ
Khfc ¼ 1þ 0:206ksf þ 0:388kpf ð10Þ
-60 -50 -40 -30 -20 -10 0 10 20 30 40 50 60-150
-100
-50
0
50
100
150SF-1-1
(g)
01.5
455.1
PF(%)
fcu (MPa)
λnt 0.186
SF(%)
F N
1 2
Hysteretic loop Skeleton curve
1 Yielding of longitudinal bars2 Spalling of cover3 Loss of axial loading capacity
12
3N
F
Displacement, Δ (mm)
Late
ral F
orce
, F (k
N)
-60 -50 -40 -30 -20 -10 0 10 20 30 40 50 60-150
-100
-50
0
50
100
150SF-1-2
(h)
01.5
457.3
PF(%)
fcu (MPa)
λnt 0.308
SF(%)
F N
12
3
Hysteretic loop Skeleton curve
1 Yielding of longitudinal bars2 Spalling of cover3 Loss of axial loading capacity1
2
NF
Displacement, Δ (mm)
Late
ral F
orce
, F (k
N)
-60 -50 -40 -30 -20 -10 0 10 20 30 40 50 60-150
-100
-50
0
50
100
150SF-1-3
(i)
01.5
459.4
PF(%)
fcu (MPa)
λnt 0.433
SF(%)
F N1 2
Hysteretic loop Skeleton curve
1 Yielding of longitudinal bars2 Spalling of cover3 Loss of axial loading capacity12
3N
F
Displacement, Δ (mm)
Late
ral F
orce
, F (k
N)
-60 -50 -40 -30 -20 -10 0 10 20 30 40 50 60-150
-100
-50
0
50
100
150HF-1-1
(j)
0.15
1.5
460.2
PF(%)
fcu (MPa)
λnt 0.186
SF(%)
F N
1 2
Hysteretic loop Skeleton curve
1 Yielding of longitudinal bars2 Spalling of cover3 Loss of axial loading capacity
12
3
NF
Displacement, Δ (mm)
Late
ral F
orce
, F (k
N)
-60 -50 -40 -30 -20 -10 0 10 20 30 40 50 60-150
-100
-50
0
50
100
150HF-1-2
(k)
0.151.5
453.6
PF(%)
fcu (MPa)
λnt 0.308
SF(%)
F N1
2
3
Hysteretic loop Skeleton curve
1 Yielding of longitudinal bars2 Spalling of cover3 Loss of axial loading capacity12
NF
Displacement, Δ (mm)
Late
ral F
orce
, F (k
N)
-60 -50 -40 -30 -20 -10 0 10 20 30 40 50 60-150
-100
-50
0
50
100
150
0.151.5
457.3
PF(%)
fcu (MPa)
λnt 0.433
SF(%)
F N1 2
Hysteretic loop Skeleton curve
1 Yielding of longitudinal bars2 Spalling of cover3 Loss of axial loading capacity
12
3NF
Displacement, Δ (mm)
Late
ral F
orce
, F (k
N)
(l)HF-1-3
-25 -20 -15 -10 -5 0 5 10 15 20 25
-300
-200
-100
0
100
200
300 C-2-1(m)
00
1.7555.2
PF(%)
fcu (MPa)
λnt 0.186
SF(%)
Late
ral F
orce
, F (k
N)
Displacement, Δ (mm)
1 Yielding of longitudinal bars2 Spalling of cover3 Loss of axial loading capacity
21
12
3
F N
NF
Hysteretic loop Skeleton curve
-25 -20 -15 -10 -5 0 5 10 15 20 25
-300
-200
-100
0
100
200
300 C-2-1(n)
00
1.7552.3
PF(%)
fcu (MPa)
λnt 0.308
SF(%)
Late
ral F
orce
, F (k
N)
Displacement, Δ (mm)
1 Yielding of longitudinal bars2 Spalling of cover3 Loss of axial loading capacity
Hysteretic loop Skeleton curve
F N
21
12
3
NF
-25 -20 -15 -10 -5 0 5 10 15 20 25
-300
-200
-100
0
100
200
300 HF-2-1(o)
0.151.5
1.7557.3
PF(%)
fcu (MPa)
λnt 0.186
SF(%)
Late
ral F
orce
, F (k
N)
NF
Displacement, Δ (mm)
1 Yielding of longitudinal bars2 Spalling of cover3 Loss of axial loading capacity1
2
Hysteretic loop Skeleton curve
F N2
1
3
-25 -20 -15 -10 -5 0 5 10 15 20 25
-300
-200
-100
0
100
200
300 HF-2-2(p)
0.151.5
1.7557.3
PF(%)
fcu (MPa)
λnt 0.308
SF(%)
Late
ral F
orce
, F (k
N)
Displacement, Δ (mm)
FN
2
11 Yielding of longitudinal bars2 Spalling of cover3 Loss of axial loading capacity
Hysteretic loop Skeleton curve
1 2
3
F N
Fig. 8 (continued)
L. Huang et al. / Construction and Building Materials 87 (2015) 16–27 23
Ks ¼ 1þqtf sy
Khfcf c6 1:2 ð11Þ
Khfc is the modification coefficient to account for the enhance-ment effect of fibers, which is fitted and calibrated accordingto test results of literature [24] and results in this paper(Table 3). Ks is derived from Park model [39] to consider theeffect of stirrups confinement. The ultimate compressive strainis defined as ecu = 0.0033 + 0.0012kf
0.5, proposed by Gao [40]; kf
is the characteristic parameter of fibers, defined as kf = Rqflf/df.(3) The tensile stress of HFRC rt is considered to be uniform.
According to the literatures [41–43], the tensile stress isapproximately proportional to square root of compressivestress, i.e.
rt ¼ f hft ¼ Bffiffiffiffiffiffiffif hfc
qð12Þ
The recommended value of B is 0.42–0.47 [6], B = 0.42 is chosenin this study for a safer design.
(4) The stress–strain relation of steel reinforcement (rs � es) isgiven by
rs ¼Eses 0 < es 6 esy
f yesy < es 6 esu
(ð13Þ
Hence, the stress and strain distributions on a section can beplotted as in Fig. 15.
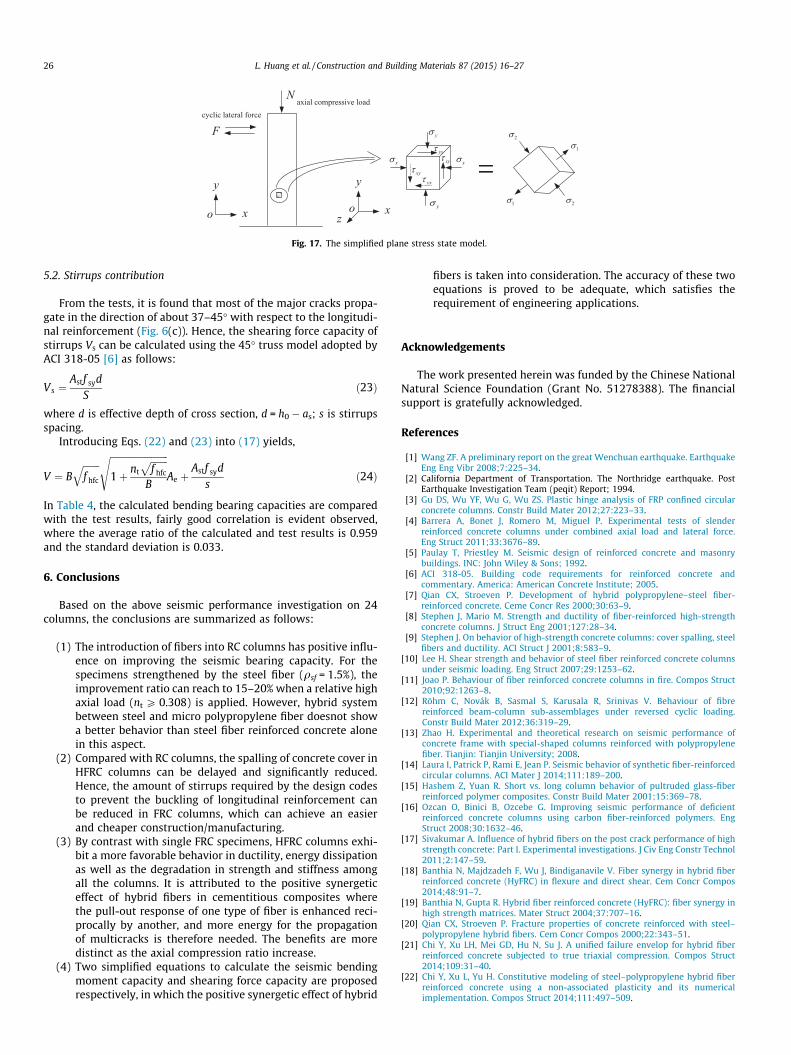
Based on the principles of equilibrium and compatibility,
0 5 10 15 20 25 30 35 40 450.60
0.65
0.70
0.75
0.80
0.85
0.90
0.95
1.00
Stre
ngth
Deg
rada
tion,
λ
Displacement, Δ (mm)
C-1-1 PF-1-1 SF-1-1 HF-1-1
nt=0.186
0 5 10 15 20 25 30 35 40 450.60
0.65
0.70
0.75
0.80
0.85
0.90
0.95
1.00
C-1-2 PF-1-2 SF-1-2 HF-1-2
nt=0.308Stre
ngth
Deg
rada
tion,
λ
Displacement, Δ (mm)0 5 10 15 20 25 30 35 40 45
0.60
0.65
0.70
0.75
0.80
0.85
0.90
0.95
1.00
C-1-3 PF-1-3 SF-1-3 HF-1-3
nt=0.433Stre
ngth
Deg
rada
tion,
λ
Displacement, Δ (mm)
Fig. 9. Comparisons of strength degradation.
0 5 10 15 20 25 30 35 40 450
2
4
6
8
10
12
14
16
Stif
fnes
s, K
i (kN
/mm
)
nt=0.186
C-1-1 PF-1-1 SF-1-1 HF-1-1
Displacement, Δ (mm)
0 5 10 15 20 25 30 35 40 450
2
4
6
8
10
12
14
16
Stiff
ness
, Ki (k
N/m
m)
Displacement, Δ (mm)
C-1-2 PF-1-2 SF-1-2 HF-1-2
nt=0.308
0 5 10 15 20 25 30 35 40 450
2
4
6
8
10
12
14
16
Stiff
ness
, Ki (k
N/m
m)
Displacement, Δ (mm)
C-1-3 PF-1-3 SF-1-3 HF-1-3
nt=0.433
Fig. 10. Comparisons of stiffness degradation.
B A
Lateral Force
Displacement
Cycle i
Area Ei
Skeleton curveiΚ +
iΚ − iF −
iF +
iΔ−
iΔ+
maxF +
maxF −
yΔ+
yΔ−
Fig. 12. Energy dissipation of each cycle.
Lateral Force
Displacement
yF +
max0.85F +
yF −max0.85F −
uΔ+
yΔ+
uΔ−
yΔ−
Fig. 11. Characteristic variables of ductility.
24 L. Huang et al. / Construction and Building Materials 87 (2015) 16–27
XN ¼ 0 N ¼ rs0As0 þ Cc � Ct � rsAs ð14Þ
XM ¼ 0 M ¼ rsAsðh0 � as0Þ þ N
h2� as
� �
þ Ct h0 �xt
2
� �� Ccðyc � as0Þ ð15Þ
Considering the improvement in bending moment caused by stubrestraint, the seismic bending moment capacity of HFRC columnsis given as follows,
Mh ¼ Ke �M ð16Þ
where Ke equals to 1.1–1.2, and value of 1.1 is adopted in this articlein case of negative effect of cyclic lateral loading.
Introducing the Eqs. (6)–(13) into Eqs. (14)–(16) yields the cal-culated results of bending moment capacity, which are presentedin Table 4. As can be seen, the predictions agree reasonably wellwith the test results, an average ratio of 0.982 and a standarddeviation of 0.063 are observed.
5. Seismic shearing force capacity
From common design codes [6,31], the seismic shearing forcecapacity of specimens can be estimated as a sum of concrete Vhfc
and stirrups Vs, that is,
Vh ¼ Vhfc þ V s ð17Þ
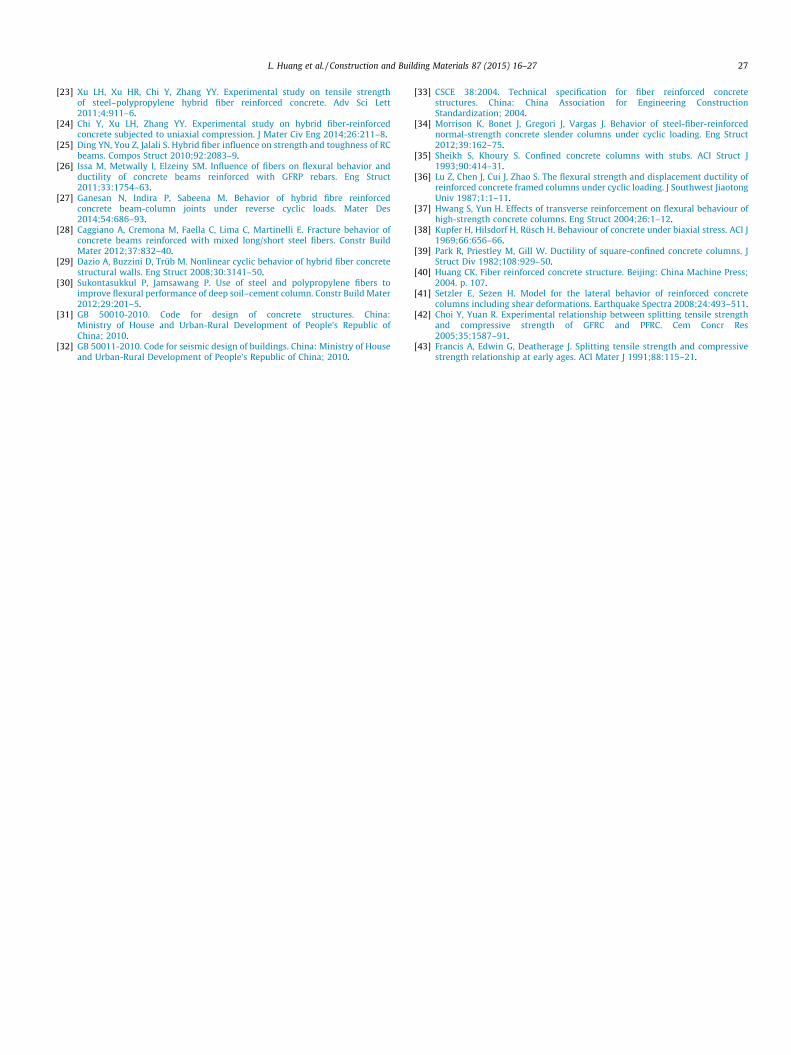
5.1. Concrete contribution
As illustrated in Fig. 16, the strain of stirrups perpendicular tothe loading direction are rather small throughout the loading pro-cess, thus, the stress in the stirrups in this direction can be ignored.
Hence, a simplified plane stress state model (the normal stressrz and shear stress sxz, syz are equal to zero) is proposed as shownin Fig. 17. In this model, the principal stresses (r1, r2) at a point canbe computed by
r1
r2
�¼ rx þ ry
2�
ffiffiffiffiffiffiffiffiffiffiffiffiffiffiffiffiffiffiffiffiffiffiffiffiffiffiffiffiffiffiffiffiffiffiffiffiffirx � ry
2
� �2þ s2
xy
rð18Þ
where rx, ry are the normal stress on a plane that is parallel andperpendicular to the loading direction, respectively, wherery = �N/A0; sxy is the shear stress that can be expressed as
sxy¼ffiffiffiffiffiffiffiffiffiffiffiffiffiffiffiffiffiffiffiffiffiffiffiffiffiffiffiffiffiffiffiffiffiffiffiffiffiffiffiffiffiðr1 � rxÞðr1 � ryÞ
qð19Þ
0 100 200 300 400 500 600 700 800 900-2500
-2000
-1500
-1000
-500
0
500
1000
1500
2000
2500
Yielding strain of stirrup (-1500με)
Yielding strain of stirrup (1500με)
Stra
in o
f stir
rups
, εs (
με)
Times of reading
12345678
NF
4321
Straingauges
Strain gauge
Stirrup
NF
8765
Straingauges
Strain gauge
Stirrup
Specimen Failed
(a)
0 100 200 300 400 500 600 700-2500
-2000
-1500
-1000
-500
0
500
1000
1500
2000
2500
Yielding strain of stirrup (1500με)NF
4321
Straingauges
Strain gauge
Stirrup
Specimen Failed
Yielding strain of stirrup (-1500με)
NF
8765
Straingauges
Strain gauge
Stirrup
Stra
in o
f stir
rups
, εs (
με)
(b)
Times of reading
12145678
Fig. 16. Strain of stirrups during the loading process. (a) Specimen HF-2-1; (b) specimen HF-2-2.
0 3 6 9 12 15 18 21 240
20000
40000
60000
80000
100000
C-1-1 PF-1-1 SF-1-1 HF-1-1
nt=0.186
Cum
ulat
ive D
issip
ated
Ene
rgy,
E (k
N·m
m)
Loading Cycles, n0 3 6 9 12 15 18 21 24
0
20000
40000
60000
80000
100000
Cum
ulat
ive D
issip
ated
Ene
rgy,
E (k
N·m
m)
Loading Cycles, n
C-1-2 PF-1-2 SF-1-2 HF-1-2
nt=0.308
0 3 6 9 12 15 18 21 240
20000
40000
60000
80000
100000
Cum
ulat
ive D
issip
ated
Ene
rgy,
E (k
N·m
m)
Loading Cycles, n
C-1-3 PF-1-3 SF-1-3 HF-1-3
nt=0.433
Fig. 13. Comparisons of energy dissipation.
0.186 0.308 0.43360
70
80
90
100
110
HF-1-3
HF-1-2
HF-1-1
SF-1-3
SF-1-2
SF-1-1
PF-1-1
PF-1-2
PF-1-1
C-1-3
C-1-2
Bend
ing
Mom
ent,
My (k
N·m
)
Axial Compression Ratio, nt
C PF SF HFC-1-1
λ = 4
(a)
1.3 2.11 2.5980
90
100
110
120
λ = 4
HF-1-7
HF-1-6HF-1-2
HF-1-9
HF-1-8
HF-1-3
Bend
ing
Mom
ent,
My (k
N)
Longitudinal Reinforcement Ratio, ρl (%)
nt = 0.308
nt = 0.433
(b)
0.66 1.22 2.1475
80
85
90
95
100
HF-1-4HF-1-5
HF-1-2
λ = 4
Bend
ing
Mom
ent,
My (k
N·m
)
Transverse Reinforcement Ratio, ρt (%)
nt = 0.308
(c)
Fig. 14. The relationship between bending moment capacity and (a) axial compression ratio, (b) longitudinal reinforcement ratio, (c) transverse reinforcement ratio.
h 0h
b
sεφ
sε ′cε
tcε
NM
cx
cy
s sσ A
s sσ ′ ′A
tCtx
cC
s′ asa
tσ
V
Strain distribution Stress distribution
cσ
Fig. 15. Calculation diagram of normal section at ultimate limit state.
L. Huang et al. / Construction and Building Materials 87 (2015) 16–27 25
As observed, in this study, the normal stress rx is about 1/10–1/15 of ry (even at the ultimate limit state), and is thus ignored in thefollowing calculations. From the maximum tensile strengthcriterion
r1 6 ½r� ¼ f hft ð20Þ
the shear stress sxy can be expressed as
sxy ¼ffiffiffiffiffiffiffiffiffiffiffiffiffiffiffiffiffiffiffiffiffiffiffiffiffiffiffiffiffiffiffiffiffiffif hftðf hft þ ntf hfcÞ
qð21Þ
Subsequently, the shearing force capacity of concrete Vhfc can beexpressed as
Vhfc ¼ sxyAe ¼ Bffiffiffiffiffiffiffif hfc
q ffiffiffiffiffiffiffiffiffiffiffiffiffiffiffiffiffiffiffiffiffiffiffiffiffi1þ nt
ffiffiffiffiffiffiffif hfc
pB
sAe ð22Þ
where Ae is the effective area of cross section, Ae = b � (h0 � as).
x
y
1σ
1σ 2σ
2σyσ
xσ
yσ
xσ xyτyxτ
yxτxyτ
zx
y
oo
=
axial compressive loadcyclic lateral force
F
N
Fig. 17. The simplified plane stress state model.
26 L. Huang et al. / Construction and Building Materials 87 (2015) 16–27
5.2. Stirrups contribution
From the tests, it is found that most of the major cracks propa-gate in the direction of about 37–45� with respect to the longitudi-nal reinforcement (Fig. 6(c)). Hence, the shearing force capacity ofstirrups Vs can be calculated using the 45� truss model adopted byACI 318-05 [6] as follows:
V s ¼Astf syd
Sð23Þ
where d is effective depth of cross section, d = h0 � as; s is stirrupsspacing.
Introducing Eqs. (22) and (23) into (17) yields,
V ¼ Bffiffiffiffiffiffiffif hfc
q ffiffiffiffiffiffiffiffiffiffiffiffiffiffiffiffiffiffiffiffiffiffiffiffiffi1þ nt
ffiffiffiffiffiffiffif hfc
pB
sAe þ
Astf syds
ð24Þ
In Table 4, the calculated bending bearing capacities are comparedwith the test results, fairly good correlation is evident observed,where the average ratio of the calculated and test results is 0.959and the standard deviation is 0.033.
6. Conclusions
Based on the above seismic performance investigation on 24columns, the conclusions are summarized as follows:
(1) The introduction of fibers into RC columns has positive influ-ence on improving the seismic bearing capacity. For thespecimens strengthened by the steel fiber (qsf = 1.5%), theimprovement ratio can reach to 15–20% when a relative highaxial load (nt P 0.308) is applied. However, hybrid systembetween steel and micro polypropylene fiber doesnot showa better behavior than steel fiber reinforced concrete alonein this aspect.
(2) Compared with RC columns, the spalling of concrete cover inHFRC columns can be delayed and significantly reduced.Hence, the amount of stirrups required by the design codesto prevent the buckling of longitudinal reinforcement canbe reduced in FRC columns, which can achieve an easierand cheaper construction/manufacturing.
(3) By contrast with single FRC specimens, HFRC columns exhi-bit a more favorable behavior in ductility, energy dissipationas well as the degradation in strength and stiffness amongall the columns. It is attributed to the positive synergeticeffect of hybrid fibers in cementitious composites wherethe pull-out response of one type of fiber is enhanced reci-procally by another, and more energy for the propagationof multicracks is therefore needed. The benefits are moredistinct as the axial compression ratio increase.
(4) Two simplified equations to calculate the seismic bendingmoment capacity and shearing force capacity are proposedrespectively, in which the positive synergetic effect of hybrid
fibers is taken into consideration. The accuracy of these twoequations is proved to be adequate, which satisfies therequirement of engineering applications.
Acknowledgements
The work presented herein was funded by the Chinese NationalNatural Science Foundation (Grant No. 51278388). The financialsupport is gratefully acknowledged.
References
[1] Wang ZF. A preliminary report on the great Wenchuan earthquake. EarthquakeEng Eng Vibr 2008;7:225–34.
[2] California Department of Transportation. The Northridge earthquake. PostEarthquake Investigation Team (peqit) Report; 1994.
[3] Gu DS, Wu YF, Wu G, Wu ZS. Plastic hinge analysis of FRP confined circularconcrete columns. Constr Build Mater 2012;27:223–33.
[4] Barrera A, Bonet J, Romero M, Miguel P. Experimental tests of slenderreinforced concrete columns under combined axial load and lateral force.Eng Struct 2011;33:3676–89.
[5] Paulay T, Priestley M. Seismic design of reinforced concrete and masonrybuildings. INC: John Wiley & Sons; 1992.
[6] ACI 318-05. Building code requirements for reinforced concrete andcommentary. America: American Concrete Institute; 2005.
[7] Qian CX, Stroeven P. Development of hybrid polypropylene–steel fiber-reinforced concrete. Ceme Concr Res 2000;30:63–9.
[8] Stephen J, Mario M. Strength and ductility of fiber-reinforced high-strengthconcrete columns. J Struct Eng 2001;127:28–34.
[9] Stephen J. On behavior of high-strength concrete columns: cover spalling, steelfibers and ductility. ACI Struct J 2001;8:583–9.
[10] Lee H. Shear strength and behavior of steel fiber reinforced concrete columnsunder seismic loading. Eng Struct 2007;29:1253–62.
[11] Joao P. Behaviour of fiber reinforced concrete columns in fire. Compos Struct2010;92:1263–8.
[12] Röhm C, Novák B, Sasmal S, Karusala R, Srinivas V. Behaviour of fibrereinforced beam-column sub-assemblages under reversed cyclic loading.Constr Build Mater 2012;36:319–29.
[13] Zhao H. Experimental and theoretical research on seismic performance ofconcrete frame with special-shaped columns reinforced with polypropylenefiber. Tianjin: Tianjin University; 2008.
[14] Laura I, Patrick P, Rami E, Jean P. Seismic behavior of synthetic fiber-reinforcedcircular columns. ACI Mater J 2014;111:189–200.
[15] Hashem Z, Yuan R. Short vs. long column behavior of pultruded glass-fiberreinforced polymer composites. Constr Build Mater 2001;15:369–78.
[16] Ozcan O, Binici B, Ozcebe G. Improving seismic performance of deficientreinforced concrete columns using carbon fiber-reinforced polymers. EngStruct 2008;30:1632–46.
[17] Sivakumar A. Influence of hybrid fibers on the post crack performance of highstrength concrete: Part I. Experimental investigations. J Civ Eng Constr Technol2011;2:147–59.
[18] Banthia N, Majdzadeh F, Wu J, Bindiganavile V. Fiber synergy in hybrid fiberreinforced concrete (HyFRC) in flexure and direct shear. Cem Concr Compos2014;48:91–7.
[19] Banthia N, Gupta R. Hybrid fiber reinforced concrete (HyFRC): fiber synergy inhigh strength matrices. Mater Struct 2004;37:707–16.
[20] Qian CX, Stroeven P. Fracture properties of concrete reinforced with steel–polypropylene hybrid fibers. Cem Concr Compos 2000;22:343–51.
[21] Chi Y, Xu LH, Mei GD, Hu N, Su J. A unified failure envelop for hybrid fiberreinforced concrete subjected to true triaxial compression. Compos Struct2014;109:31–40.
[22] Chi Y, Xu L, Yu H. Constitutive modeling of steel–polypropylene hybrid fiberreinforced concrete using a non-associated plasticity and its numericalimplementation. Compos Struct 2014;111:497–509.
L. Huang et al. / Construction and Building Materials 87 (2015) 16–27 27
[23] Xu LH, Xu HR, Chi Y, Zhang YY. Experimental study on tensile strengthof steel–polypropylene hybrid fiber reinforced concrete. Adv Sci Lett2011;4:911–6.
[24] Chi Y, Xu LH, Zhang YY. Experimental study on hybrid fiber-reinforcedconcrete subjected to uniaxial compression. J Mater Civ Eng 2014;26:211–8.
[25] Ding YN, You Z, Jalali S. Hybrid fiber influence on strength and toughness of RCbeams. Compos Struct 2010;92:2083–9.
[26] Issa M, Metwally I, Elzeiny SM. Influence of fibers on flexural behavior andductility of concrete beams reinforced with GFRP rebars. Eng Struct2011;33:1754–63.
[27] Ganesan N, Indira P, Sabeena M. Behavior of hybrid fibre reinforcedconcrete beam-column joints under reverse cyclic loads. Mater Des2014;54:686–93.
[28] Caggiano A, Cremona M, Faella C, Lima C, Martinelli E. Fracture behavior ofconcrete beams reinforced with mixed long/short steel fibers. Constr BuildMater 2012;37:832–40.
[29] Dazio A, Buzzini D, Trüb M. Nonlinear cyclic behavior of hybrid fiber concretestructural walls. Eng Struct 2008;30:3141–50.
[30] Sukontasukkul P, Jamsawang P. Use of steel and polypropylene fibers toimprove flexural performance of deep soil–cement column. Constr Build Mater2012;29:201–5.
[31] GB 50010-2010. Code for design of concrete structures. China:Ministry of House and Urban-Rural Development of People’s Republic ofChina; 2010.
[32] GB 50011-2010. Code for seismic design of buildings. China: Ministry of Houseand Urban-Rural Development of People’s Republic of China; 2010.
[33] CSCE 38:2004. Technical specification for fiber reinforced concretestructures. China: China Association for Engineering ConstructionStandardization; 2004.
[34] Morrison K, Bonet J, Gregori J, Vargas J. Behavior of steel-fiber-reinforcednormal-strength concrete slender columns under cyclic loading. Eng Struct2012;39:162–75.
[35] Sheikh S, Khoury S. Confined concrete columns with stubs. ACI Struct J1993;90:414–31.
[36] Lu Z, Chen J, Cui J, Zhao S. The flexural strength and displacement ductility ofreinforced concrete framed columns under cyclic loading. J Southwest JiaotongUniv 1987;1:1–11.
[37] Hwang S, Yun H. Effects of transverse reinforcement on flexural behaviour ofhigh-strength concrete columns. Eng Struct 2004;26:1–12.
[38] Kupfer H, Hilsdorf H, Rüsch H. Behaviour of concrete under biaxial stress. ACI J1969;66:656–66.
[39] Park R, Priestley M, Gill W. Ductility of square-confined concrete columns. JStruct Div 1982;108:929–50.
[40] Huang CK. Fiber reinforced concrete structure. Beijing: China Machine Press;2004. p. 107.
[41] Setzler E, Sezen H. Model for the lateral behavior of reinforced concretecolumns including shear deformations. Earthquake Spectra 2008;24:493–511.
[42] Choi Y, Yuan R. Experimental relationship between splitting tensile strengthand compressive strength of GFRC and PFRC. Cem Concr Res2005;35:1587–91.
[43] Francis A, Edwin G, Deatherage J. Splitting tensile strength and compressivestrength relationship at early ages. ACI Mater J 1991;88:115–21.